Peru, NY Map & Demographics
Peru Map
Peru Overview
$36,189
PER CAPITA INCOME
$89,479
AVG FAMILY INCOME
$70,556
AVG HOUSEHOLD INCOME
15.0%
WAGE / INCOME GAP [ % ]
85.0¢/ $1
WAGE / INCOME GAP [ $ ]
0.35
INEQUALITY / GINI INDEX
1,807
TOTAL POPULATION
768
MALE POPULATION
1,039
FEMALE POPULATION
73.92
MALES / 100 FEMALES
135.29
FEMALES / 100 MALES
39.4
MEDIAN AGE
2.9
AVG FAMILY SIZE
2.4
AVG HOUSEHOLD SIZE
947
LABOR FORCE [ PEOPLE ]
65.6%
PERCENT IN LABOR FORCE
1.9%
UNEMPLOYMENT RATE
Peru Zip Codes
Peru Area Codes
Income in Peru
Income Overview in Peru
Per Capita Income in Peru is $36,189, while median incomes of families and households are $89,479 and $70,556 respectively.
| Characteristic | Number | Measure |
| Per Capita Income | 1,807 | $36,189 |
| Median Family Income | 490 | $89,479 |
| Mean Family Income | 490 | $102,710 |
| Median Household Income | 686 | $70,556 |
| Mean Household Income | 686 | $89,262 |
| Income Deficit | 490 | $0 |
| Wage / Income Gap (%) | 1,807 | 15.04% |
| Wage / Income Gap ($) | 1,807 | 84.96¢ per $1 |
| Gini / Inequality Index | 1,807 | 0.35 |
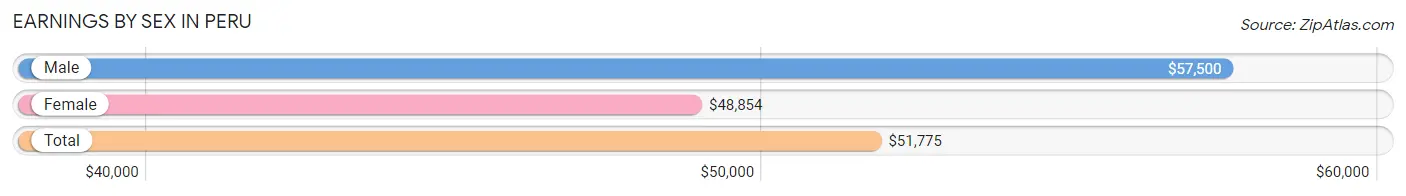
Earnings by Sex in Peru
Average Earnings in Peru are $51,775, $57,500 for men and $48,854 for women, a difference of 15.0%.
| Sex | Number | Average Earnings |
| Male | 518 (51.8%) | $57,500 |
| Female | 481 (48.1%) | $48,854 |
| Total | 999 (100.0%) | $51,775 |
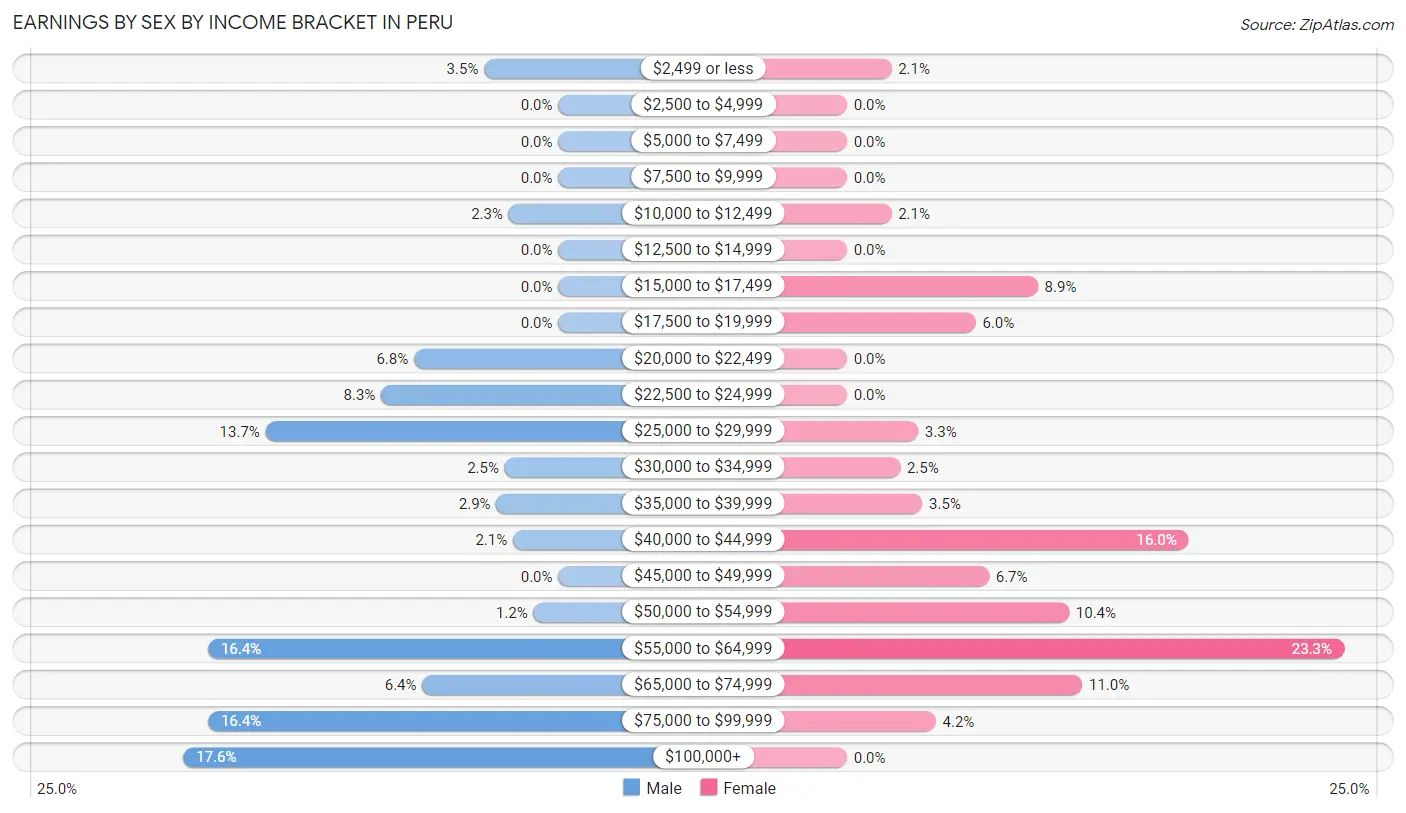
Earnings by Sex by Income Bracket in Peru
The most common earnings brackets in Peru are $100,000+ for men (91 | 17.6%) and $55,000 to $64,999 for women (112 | 23.3%).
| Income | Male | Female |
| $2,499 or less | 18 (3.5%) | 10 (2.1%) |
| $2,500 to $4,999 | 0 (0.0%) | 0 (0.0%) |
| $5,000 to $7,499 | 0 (0.0%) | 0 (0.0%) |
| $7,500 to $9,999 | 0 (0.0%) | 0 (0.0%) |
| $10,000 to $12,499 | 12 (2.3%) | 10 (2.1%) |
| $12,500 to $14,999 | 0 (0.0%) | 0 (0.0%) |
| $15,000 to $17,499 | 0 (0.0%) | 43 (8.9%) |
| $17,500 to $19,999 | 0 (0.0%) | 29 (6.0%) |
| $20,000 to $22,499 | 35 (6.8%) | 0 (0.0%) |
| $22,500 to $24,999 | 43 (8.3%) | 0 (0.0%) |
| $25,000 to $29,999 | 71 (13.7%) | 16 (3.3%) |
| $30,000 to $34,999 | 13 (2.5%) | 12 (2.5%) |
| $35,000 to $39,999 | 15 (2.9%) | 17 (3.5%) |
| $40,000 to $44,999 | 11 (2.1%) | 77 (16.0%) |
| $45,000 to $49,999 | 0 (0.0%) | 32 (6.7%) |
| $50,000 to $54,999 | 6 (1.2%) | 50 (10.4%) |
| $55,000 to $64,999 | 85 (16.4%) | 112 (23.3%) |
| $65,000 to $74,999 | 33 (6.4%) | 53 (11.0%) |
| $75,000 to $99,999 | 85 (16.4%) | 20 (4.2%) |
| $100,000+ | 91 (17.6%) | 0 (0.0%) |
| Total | 518 (100.0%) | 481 (100.0%) |
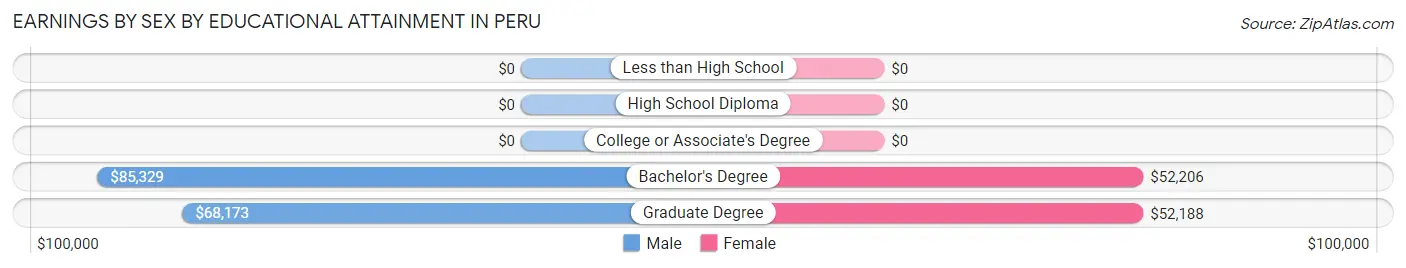
Earnings by Sex by Educational Attainment in Peru
Average earnings in Peru are $63,017 for men and $50,225 for women, a difference of 20.3%. Men with an educational attainment of bachelor's degree enjoy the highest average annual earnings of $85,329, while those with graduate degree education earn the least with $68,173. Women with an educational attainment of bachelor's degree earn the most with the average annual earnings of $52,206, while those with graduate degree education have the smallest earnings of $52,188.
| Educational Attainment | Male Income | Female Income |
| Less than High School | - | - |
| High School Diploma | - | - |
| College or Associate's Degree | - | - |
| Bachelor's Degree | $85,329 | $52,206 |
| Graduate Degree | $68,173 | $52,188 |
| Total | $63,017 | $50,225 |
Family Income in Peru
Family Income Brackets in Peru
According to the Peru family income data, there are 156 families falling into the $50,000 to $74,999 income range, which is the most common income bracket and makes up 31.8% of all families.
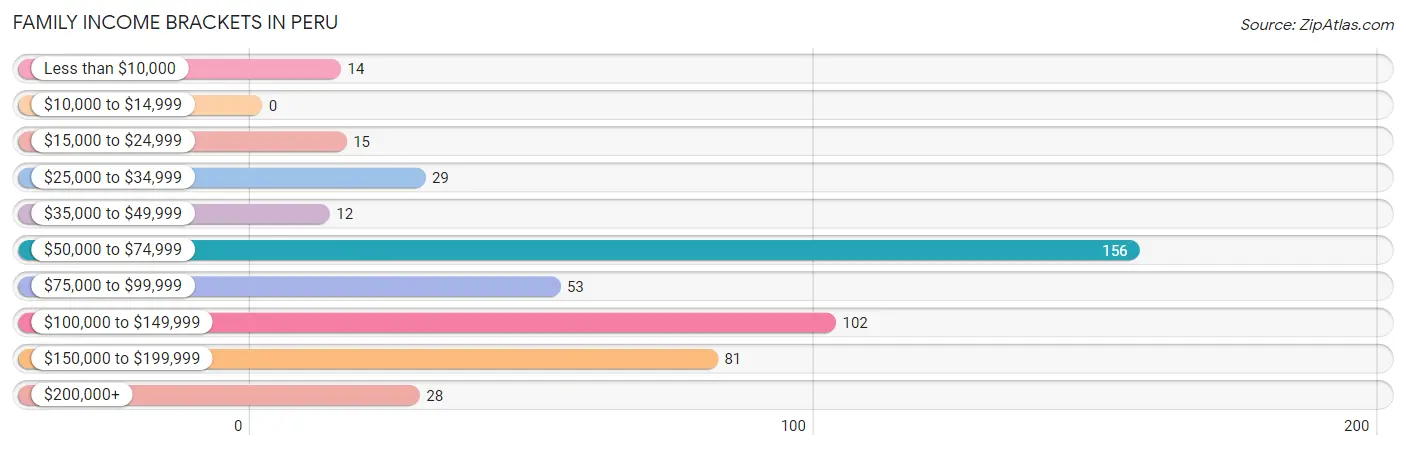
| Income Bracket | # Families | % Families |
| Less than $10,000 | 14 | 2.9% |
| $10,000 to $14,999 | 0 | 0.0% |
| $15,000 to $24,999 | 15 | 3.1% |
| $25,000 to $34,999 | 29 | 5.9% |
| $35,000 to $49,999 | 12 | 2.4% |
| $50,000 to $74,999 | 156 | 31.8% |
| $75,000 to $99,999 | 53 | 10.8% |
| $100,000 to $149,999 | 102 | 20.8% |
| $150,000 to $199,999 | 81 | 16.5% |
| $200,000+ | 28 | 5.7% |
Family Income by Famaliy Size in Peru
4-person families (88 | 18.0%) account for the highest median family income in Peru with $129,479 per family, while 2-person families (251 | 51.2%) have the highest median income of $32,747 per family member.
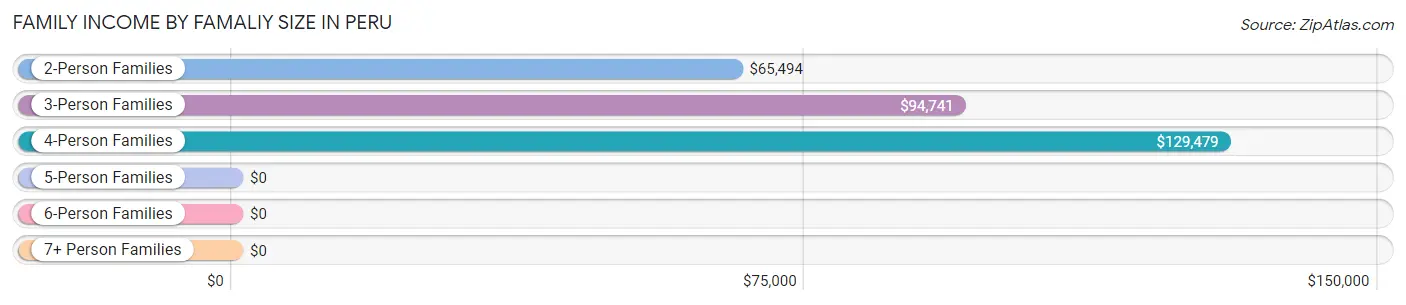
| Income Bracket | # Families | Median Income |
| 2-Person Families | 251 (51.2%) | $65,494 |
| 3-Person Families | 84 (17.1%) | $94,741 |
| 4-Person Families | 88 (18.0%) | $129,479 |
| 5-Person Families | 57 (11.6%) | $0 |
| 6-Person Families | 10 (2.0%) | $0 |
| 7+ Person Families | 0 (0.0%) | $0 |
| Total | 490 (100.0%) | $89,479 |
Family Income by Number of Earners in Peru
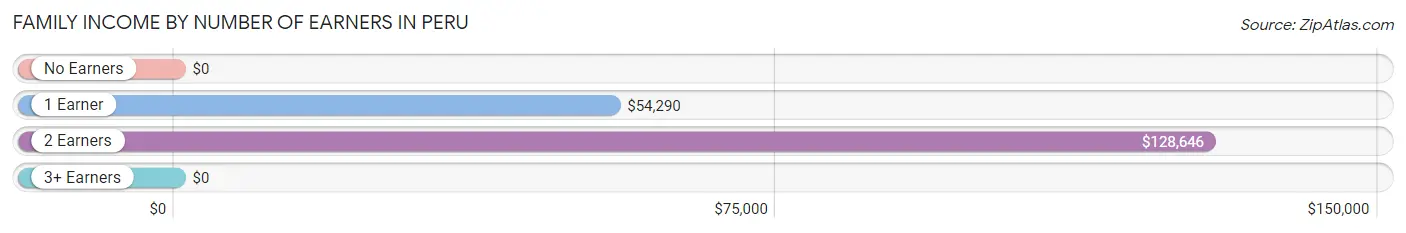
| Number of Earners | # Families | Median Income |
| No Earners | 95 (19.4%) | $0 |
| 1 Earner | 87 (17.8%) | $54,290 |
| 2 Earners | 284 (58.0%) | $128,646 |
| 3+ Earners | 24 (4.9%) | $0 |
| Total | 490 (100.0%) | $89,479 |
Household Income in Peru
Household Income Brackets in Peru
With 220 households falling in the category, the $50,000 to $74,999 income range is the most frequent in Peru, accounting for 32.1% of all households. In contrast, only 12 households (1.8%) fall into the $35,000 to $49,999 income bracket, making it the least populous group.
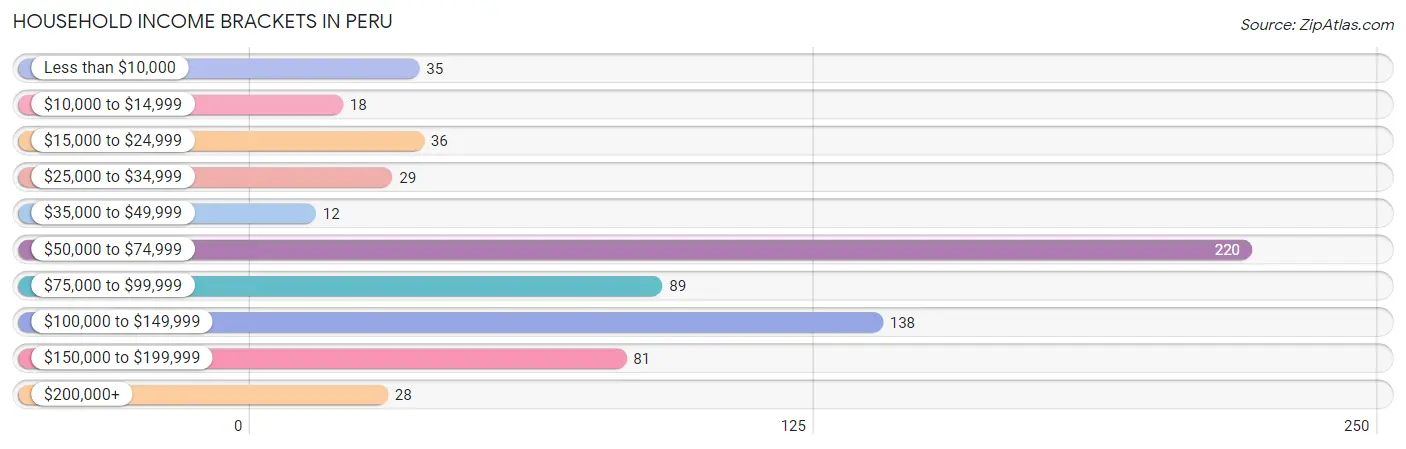
| Income Bracket | # Households | % Households |
| Less than $10,000 | 35 | 5.1% |
| $10,000 to $14,999 | 18 | 2.6% |
| $15,000 to $24,999 | 36 | 5.2% |
| $25,000 to $34,999 | 29 | 4.2% |
| $35,000 to $49,999 | 12 | 1.7% |
| $50,000 to $74,999 | 220 | 32.1% |
| $75,000 to $99,999 | 89 | 13.0% |
| $100,000 to $149,999 | 138 | 20.1% |
| $150,000 to $199,999 | 81 | 11.8% |
| $200,000+ | 28 | 4.1% |
Household Income by Householder Age in Peru
The median household income in Peru is $70,556, with the highest median household income of $130,956 found in the 45 to 64 years age bracket for the primary householder. A total of 185 households (27.0%) fall into this category.
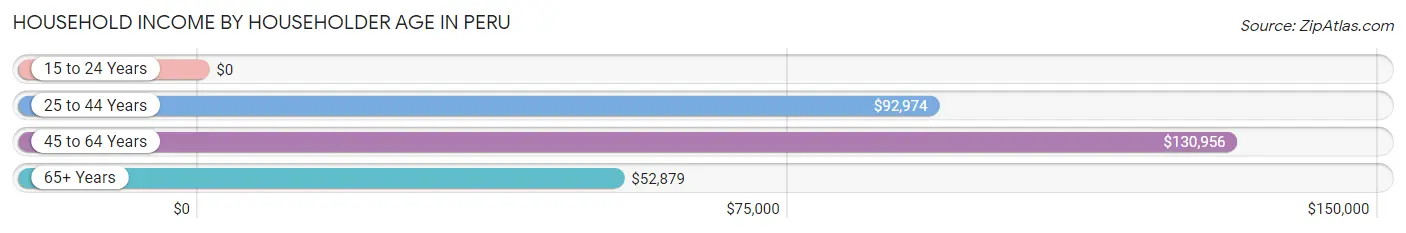
| Income Bracket | # Households | Median Income |
| 15 to 24 Years | 0 (0.0%) | $0 |
| 25 to 44 Years | 323 (47.1%) | $92,974 |
| 45 to 64 Years | 185 (27.0%) | $130,956 |
| 65+ Years | 178 (26.0%) | $52,879 |
| Total | 686 (100.0%) | $70,556 |
Poverty in Peru
Income Below Poverty by Sex and Age in Peru
With 7.5% poverty level for males and 7.4% for females among the residents of Peru, 16 and 17 year old males and 16 and 17 year old females are the most vulnerable to poverty, with 11 males (52.4%) and 11 females (52.4%) in their respective age groups living below the poverty level.
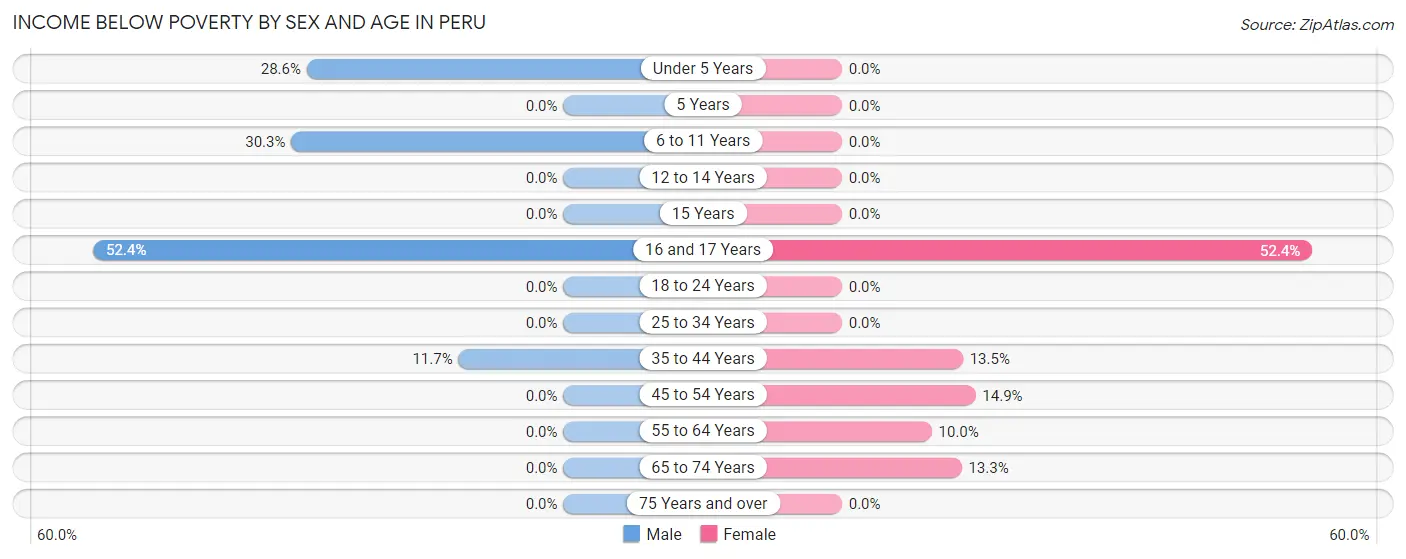
| Age Bracket | Male | Female |
| Under 5 Years | 12 (28.6%) | 0 (0.0%) |
| 5 Years | 0 (0.0%) | 0 (0.0%) |
| 6 to 11 Years | 10 (30.3%) | 0 (0.0%) |
| 12 to 14 Years | 0 (0.0%) | 0 (0.0%) |
| 15 Years | 0 (0.0%) | 0 (0.0%) |
| 16 and 17 Years | 11 (52.4%) | 11 (52.4%) |
| 18 to 24 Years | 0 (0.0%) | 0 (0.0%) |
| 25 to 34 Years | 0 (0.0%) | 0 (0.0%) |
| 35 to 44 Years | 25 (11.7%) | 26 (13.5%) |
| 45 to 54 Years | 0 (0.0%) | 18 (14.9%) |
| 55 to 64 Years | 0 (0.0%) | 7 (10.0%) |
| 65 to 74 Years | 0 (0.0%) | 14 (13.3%) |
| 75 Years and over | 0 (0.0%) | 0 (0.0%) |
| Total | 58 (7.5%) | 76 (7.4%) |
Income Above Poverty by Sex and Age in Peru
According to the poverty statistics in Peru, males aged 12 to 14 years and females aged under 5 years are the age groups that are most secure financially, with 100.0% of males and 100.0% of females in these age groups living above the poverty line.
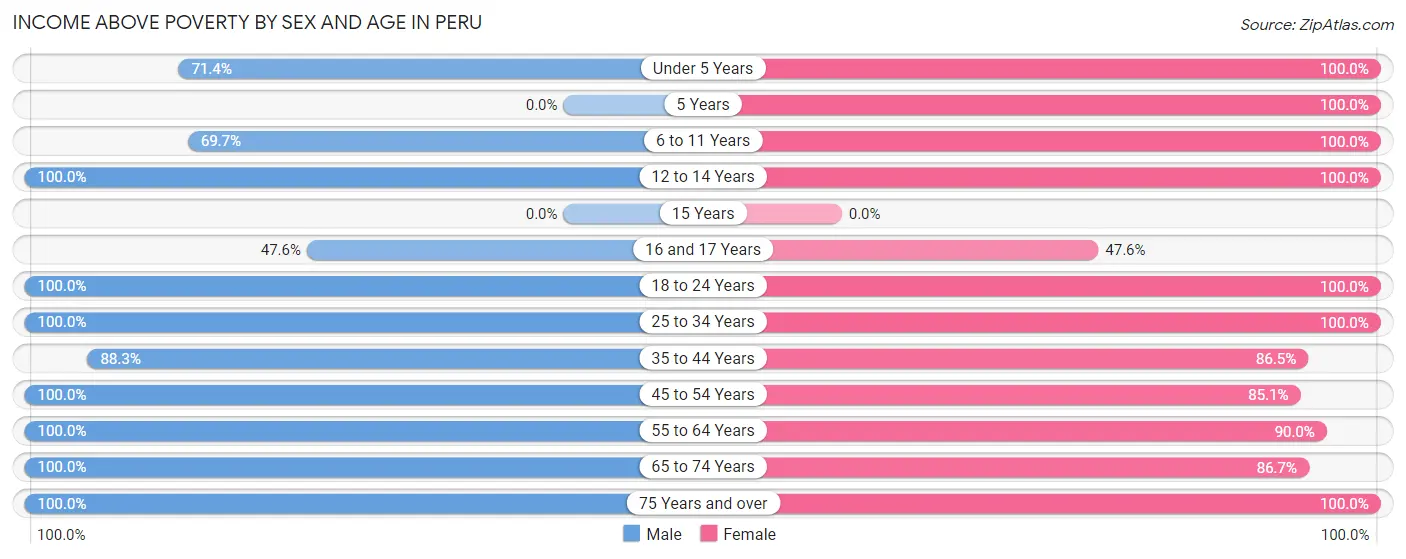
| Age Bracket | Male | Female |
| Under 5 Years | 30 (71.4%) | 128 (100.0%) |
| 5 Years | 0 (0.0%) | 15 (100.0%) |
| 6 to 11 Years | 23 (69.7%) | 73 (100.0%) |
| 12 to 14 Years | 9 (100.0%) | 64 (100.0%) |
| 15 Years | 0 (0.0%) | 0 (0.0%) |
| 16 and 17 Years | 10 (47.6%) | 10 (47.6%) |
| 18 to 24 Years | 73 (100.0%) | 10 (100.0%) |
| 25 to 34 Years | 97 (100.0%) | 141 (100.0%) |
| 35 to 44 Years | 189 (88.3%) | 167 (86.5%) |
| 45 to 54 Years | 94 (100.0%) | 103 (85.1%) |
| 55 to 64 Years | 84 (100.0%) | 63 (90.0%) |
| 65 to 74 Years | 36 (100.0%) | 91 (86.7%) |
| 75 Years and over | 65 (100.0%) | 87 (100.0%) |
| Total | 710 (92.4%) | 952 (92.6%) |
Income Below Poverty Among Married-Couple Families in Peru
The poverty statistics for married-couple families in Peru show that 2.9% or 12 of the total 415 families live below the poverty line. Families with 3 or 4 children have the highest poverty rate of 26.1%, comprising of 12 families. On the other hand, families with no children have the lowest poverty rate of 0.0%, which includes 0 families.
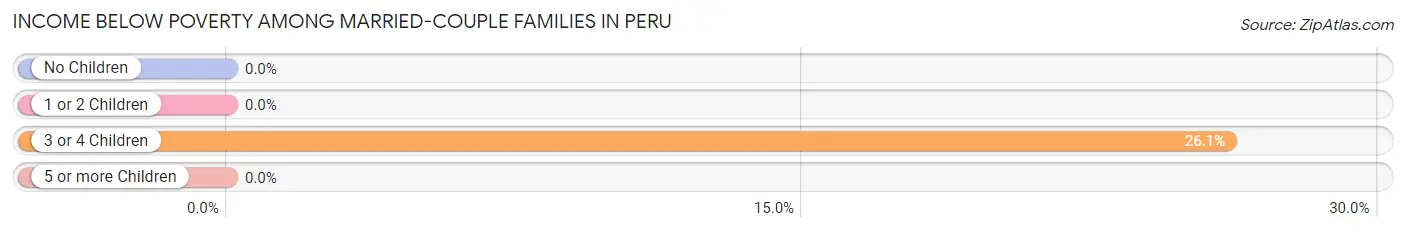
| Children | Above Poverty | Below Poverty |
| No Children | 225 (100.0%) | 0 (0.0%) |
| 1 or 2 Children | 144 (100.0%) | 0 (0.0%) |
| 3 or 4 Children | 34 (73.9%) | 12 (26.1%) |
| 5 or more Children | 0 (0.0%) | 0 (0.0%) |
| Total | 403 (97.1%) | 12 (2.9%) |
Income Below Poverty Among Single-Parent Households in Peru
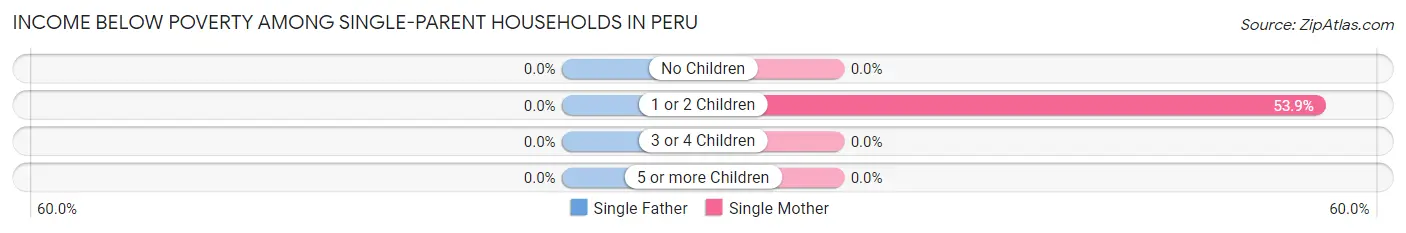
| Children | Single Father | Single Mother |
| No Children | 0 (0.0%) | 0 (0.0%) |
| 1 or 2 Children | 0 (0.0%) | 14 (53.8%) |
| 3 or 4 Children | 0 (0.0%) | 0 (0.0%) |
| 5 or more Children | 0 (0.0%) | 0 (0.0%) |
| Total | 0 (0.0%) | 14 (23.7%) |
Income Below Poverty Among Married-Couple vs Single-Parent Households in Peru
The poverty data for Peru shows that 12 of the married-couple family households (2.9%) and 14 of the single-parent households (18.7%) are living below the poverty level. Within the married-couple family households, those with 3 or 4 children have the highest poverty rate, with 12 households (26.1%) falling below the poverty line. Among the single-parent households, those with 1 or 2 children have the highest poverty rate, with 14 household (33.3%) living below poverty.
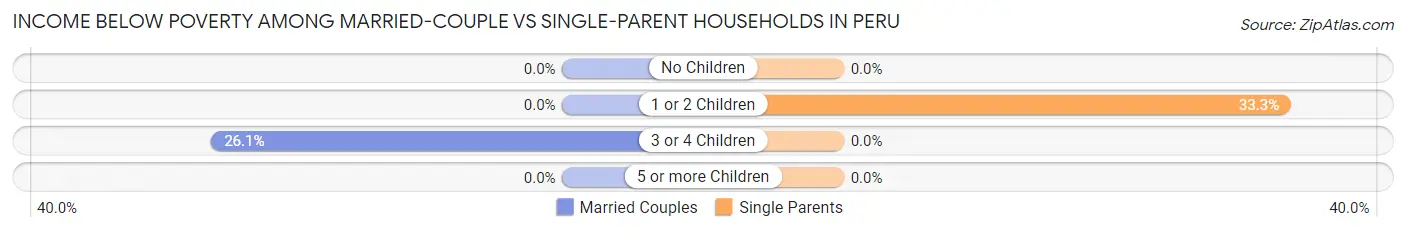
| Children | Married-Couple Families | Single-Parent Households |
| No Children | 0 (0.0%) | 0 (0.0%) |
| 1 or 2 Children | 0 (0.0%) | 14 (33.3%) |
| 3 or 4 Children | 12 (26.1%) | 0 (0.0%) |
| 5 or more Children | 0 (0.0%) | 0 (0.0%) |
| Total | 12 (2.9%) | 14 (18.7%) |
Race in Peru
The most populous races in Peru are White / Caucasian (1,694 | 93.8%), Hispanic or Latino (70 | 3.9%), and Some other Race (70 | 3.9%).
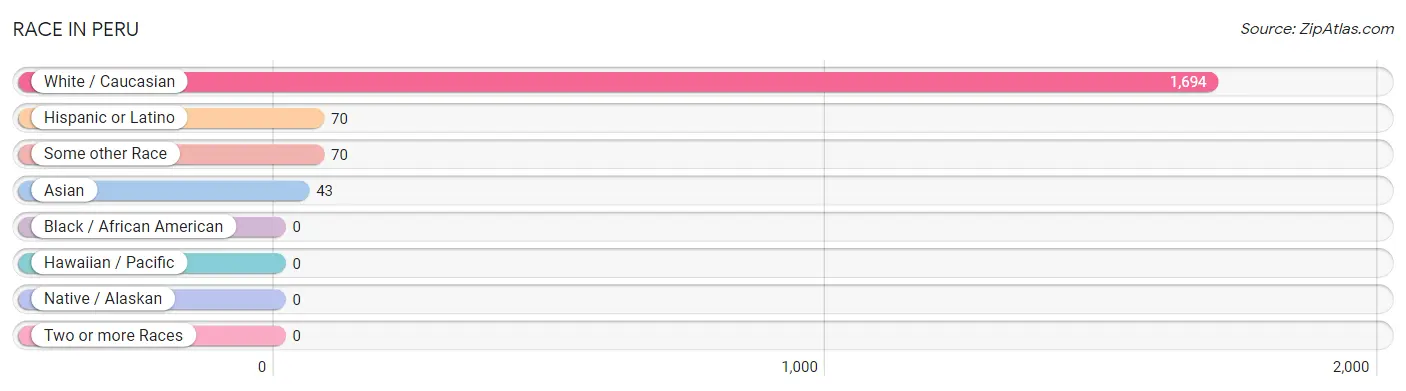
| Race | # Population | % Population |
| Asian | 43 | 2.4% |
| Black / African American | 0 | 0.0% |
| Hawaiian / Pacific | 0 | 0.0% |
| Hispanic or Latino | 70 | 3.9% |
| Native / Alaskan | 0 | 0.0% |
| White / Caucasian | 1,694 | 93.8% |
| Two or more Races | 0 | 0.0% |
| Some other Race | 70 | 3.9% |
| Total | 1,807 | 100.0% |
Ancestry in Peru
The most populous ancestries reported in Peru are Irish (244 | 13.5%), English (242 | 13.4%), Scottish (200 | 11.1%), French (199 | 11.0%), and Italian (117 | 6.5%), together accounting for 55.4% of all Peru residents.
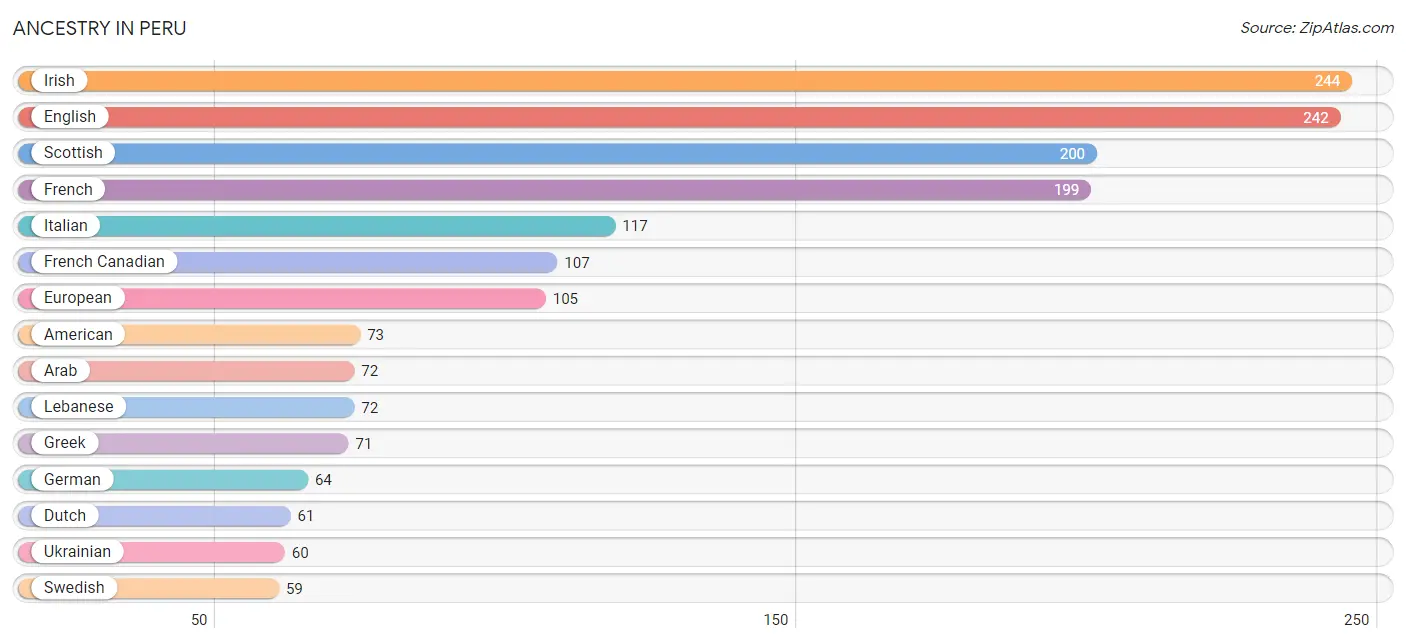
| Ancestry | # Population | % Population |
| American | 73 | 4.0% |
| Arab | 72 | 4.0% |
| Armenian | 13 | 0.7% |
| British | 36 | 2.0% |
| Burmese | 43 | 2.4% |
| Central American | 35 | 1.9% |
| Danish | 48 | 2.7% |
| Dutch | 61 | 3.4% |
| English | 242 | 13.4% |
| European | 105 | 5.8% |
| French | 199 | 11.0% |
| French Canadian | 107 | 5.9% |
| German | 64 | 3.5% |
| Greek | 71 | 3.9% |
| Hungarian | 53 | 2.9% |
| Irish | 244 | 13.5% |
| Italian | 117 | 6.5% |
| Lebanese | 72 | 4.0% |
| Lithuanian | 41 | 2.3% |
| Norwegian | 33 | 1.8% |
| Polish | 15 | 0.8% |
| Russian | 21 | 1.2% |
| Salvadoran | 35 | 1.9% |
| Scottish | 200 | 11.1% |
| Swedish | 59 | 3.3% |
| Swiss | 15 | 0.8% |
| Ukrainian | 60 | 3.3% |
| Welsh | 14 | 0.8% | View All 28 Rows |
Immigrants in Peru
The most numerous immigrant groups reported in Peru came from Europe (100 | 5.5%), Central America (70 | 3.9%), Latin America (70 | 3.9%), Northern Europe (67 | 3.7%), and Norway (59 | 3.3%), together accounting for 20.2% of all Peru residents.
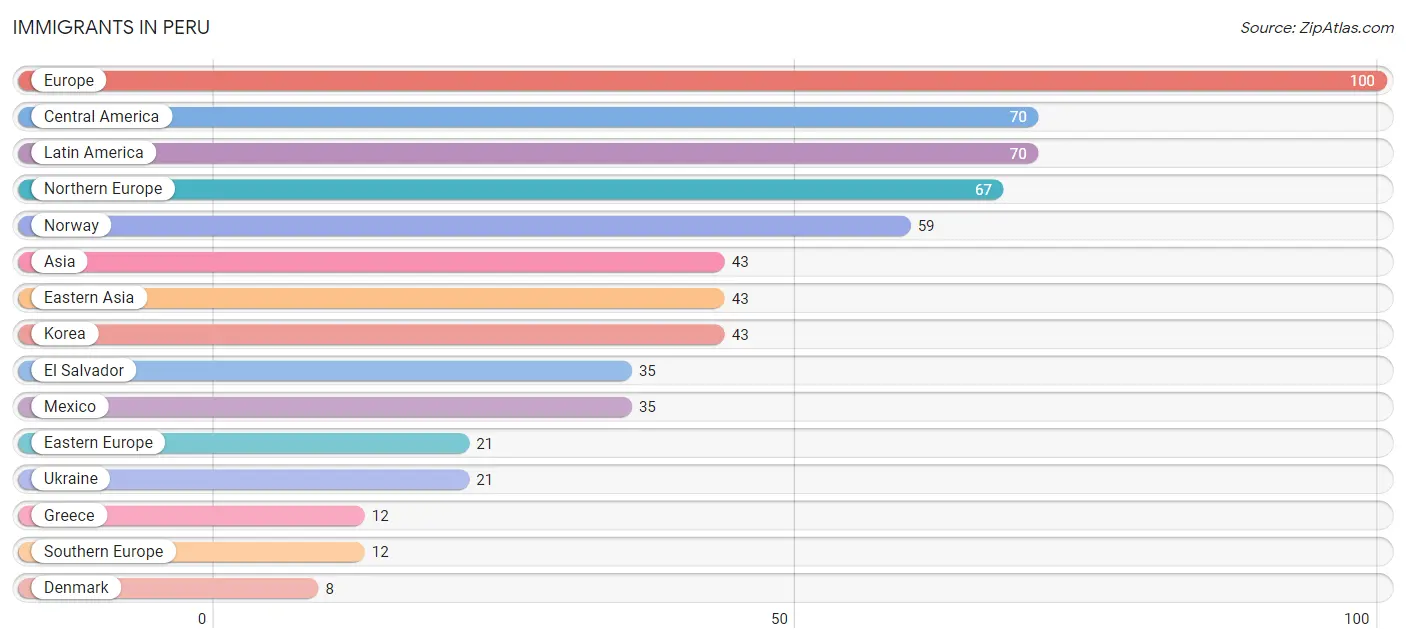
| Immigration Origin | # Population | % Population |
| Asia | 43 | 2.4% |
| Central America | 70 | 3.9% |
| Denmark | 8 | 0.4% |
| Eastern Asia | 43 | 2.4% |
| Eastern Europe | 21 | 1.2% |
| El Salvador | 35 | 1.9% |
| Europe | 100 | 5.5% |
| Greece | 12 | 0.7% |
| Korea | 43 | 2.4% |
| Latin America | 70 | 3.9% |
| Mexico | 35 | 1.9% |
| Northern Europe | 67 | 3.7% |
| Norway | 59 | 3.3% |
| Southern Europe | 12 | 0.7% |
| Ukraine | 21 | 1.2% | View All 15 Rows |
Sex and Age in Peru
Sex and Age in Peru
The most populous age groups in Peru are 40 to 44 Years (108 | 14.1%) for men and 35 to 39 Years (133 | 12.8%) for women.
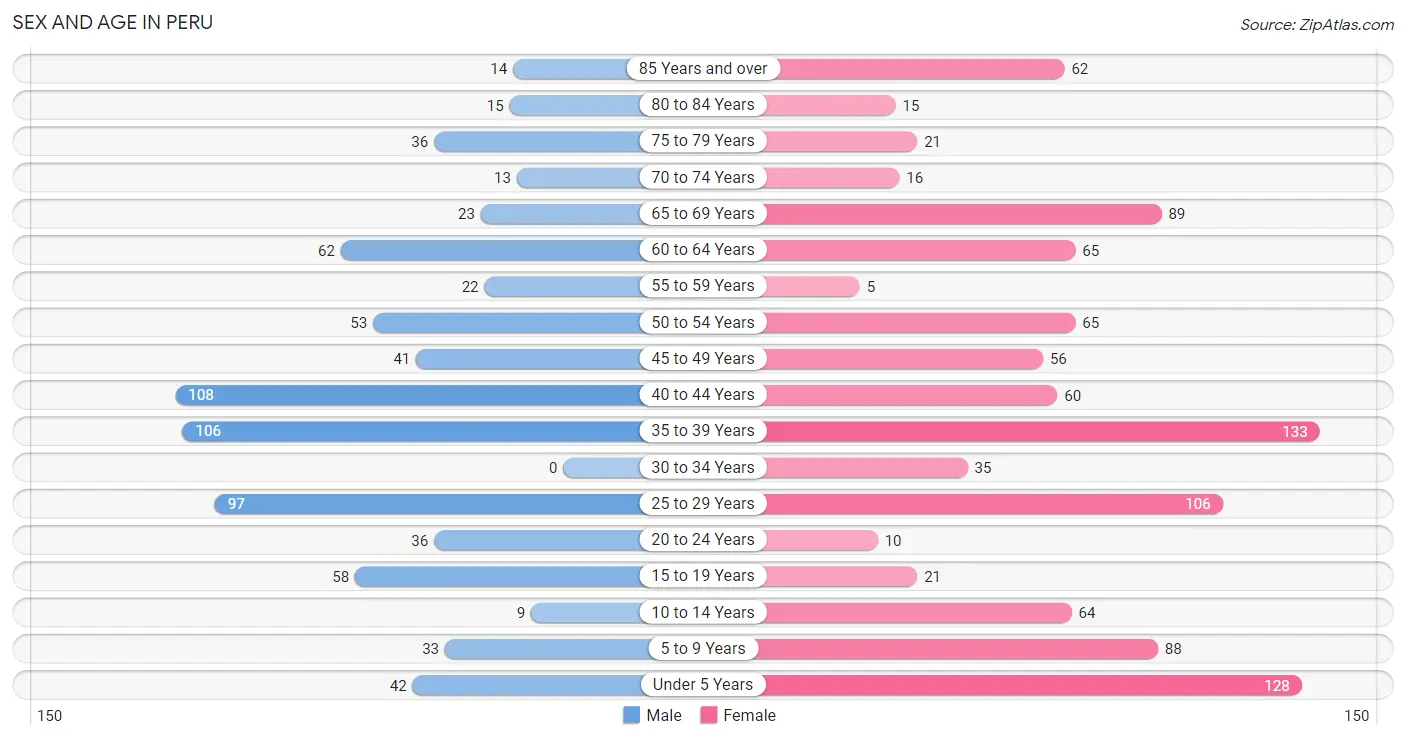
| Age Bracket | Male | Female |
| Under 5 Years | 42 (5.5%) | 128 (12.3%) |
| 5 to 9 Years | 33 (4.3%) | 88 (8.5%) |
| 10 to 14 Years | 9 (1.2%) | 64 (6.2%) |
| 15 to 19 Years | 58 (7.5%) | 21 (2.0%) |
| 20 to 24 Years | 36 (4.7%) | 10 (1.0%) |
| 25 to 29 Years | 97 (12.6%) | 106 (10.2%) |
| 30 to 34 Years | 0 (0.0%) | 35 (3.4%) |
| 35 to 39 Years | 106 (13.8%) | 133 (12.8%) |
| 40 to 44 Years | 108 (14.1%) | 60 (5.8%) |
| 45 to 49 Years | 41 (5.3%) | 56 (5.4%) |
| 50 to 54 Years | 53 (6.9%) | 65 (6.3%) |
| 55 to 59 Years | 22 (2.9%) | 5 (0.5%) |
| 60 to 64 Years | 62 (8.1%) | 65 (6.3%) |
| 65 to 69 Years | 23 (3.0%) | 89 (8.6%) |
| 70 to 74 Years | 13 (1.7%) | 16 (1.5%) |
| 75 to 79 Years | 36 (4.7%) | 21 (2.0%) |
| 80 to 84 Years | 15 (1.9%) | 15 (1.4%) |
| 85 Years and over | 14 (1.8%) | 62 (6.0%) |
| Total | 768 (100.0%) | 1,039 (100.0%) |
Families and Households in Peru
Median Family Size in Peru
The median family size in Peru is 2.88 persons per family, with married-couple families (415 | 84.7%) accounting for the largest median family size of 3.03 persons per family. On the other hand, single female/mother families (59 | 12.0%) represent the smallest median family size with 1.85 persons per family.
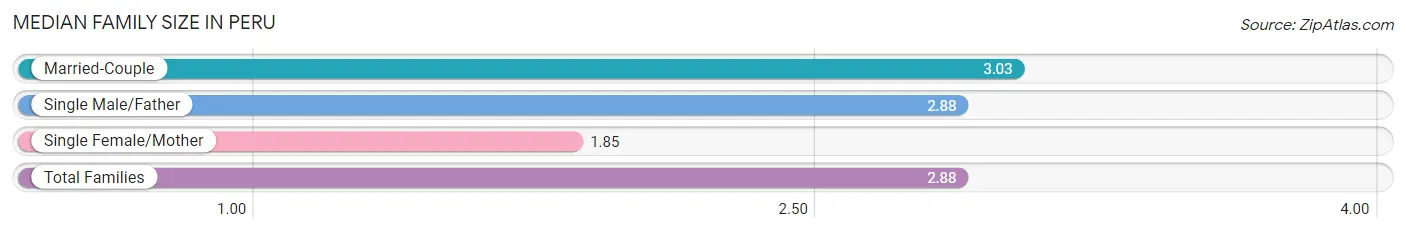
| Family Type | # Families | Family Size |
| Married-Couple | 415 (84.7%) | 3.03 |
| Single Male/Father | 16 (3.3%) | 2.88 |
| Single Female/Mother | 59 (12.0%) | 1.85 |
| Total Families | 490 (100.0%) | 2.88 |
Median Household Size in Peru
The median household size in Peru is 2.41 persons per household, with single male/father households (16 | 2.3%) accounting for the largest median household size of 3.69 persons per household. non-family households (196 | 28.6%) represent the smallest median household size with 1.11 persons per household.
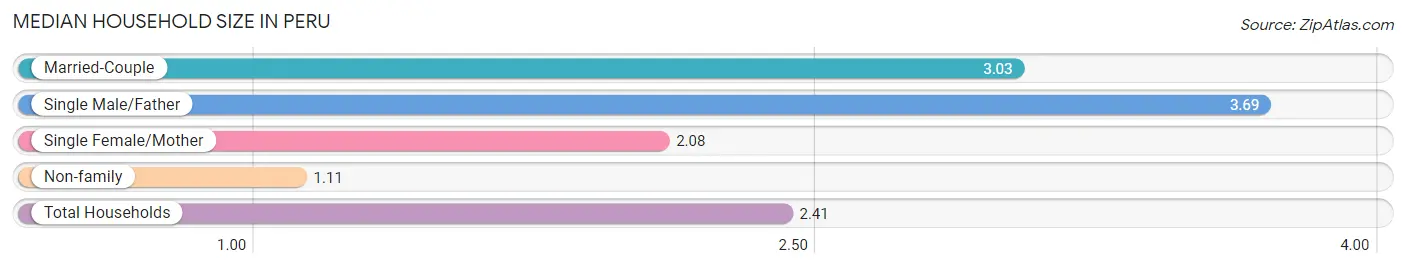
| Household Type | # Households | Household Size |
| Married-Couple | 415 (60.5%) | 3.03 |
| Single Male/Father | 16 (2.3%) | 3.69 |
| Single Female/Mother | 59 (8.6%) | 2.08 |
| Non-family | 196 (28.6%) | 1.11 |
| Total Households | 686 (100.0%) | 2.41 |
Household Size by Marriage Status in Peru
Out of a total of 686 households in Peru, 490 (71.4%) are family households, while 196 (28.6%) are nonfamily households. The most numerous type of family households are 2-person households, comprising 237, and the most common type of nonfamily households are 1-person households, comprising 176.
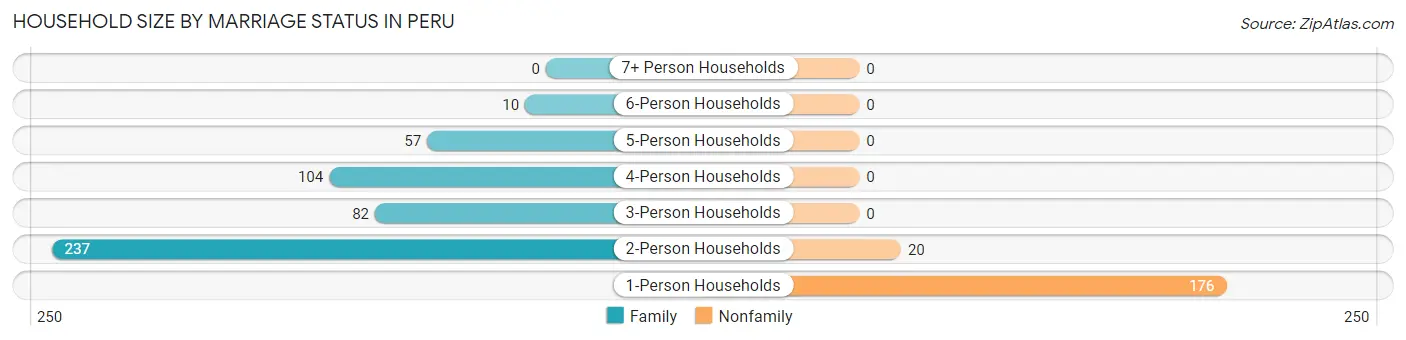
| Household Size | Family Households | Nonfamily Households |
| 1-Person Households | - | 176 (25.7%) |
| 2-Person Households | 237 (34.5%) | 20 (2.9%) |
| 3-Person Households | 82 (11.9%) | 0 (0.0%) |
| 4-Person Households | 104 (15.2%) | 0 (0.0%) |
| 5-Person Households | 57 (8.3%) | 0 (0.0%) |
| 6-Person Households | 10 (1.5%) | 0 (0.0%) |
| 7+ Person Households | 0 (0.0%) | 0 (0.0%) |
| Total | 490 (71.4%) | 196 (28.6%) |
Female Fertility in Peru
Fertility by Age in Peru
Average fertility rate in Peru is 40.0 births per 1,000 women. Women in the age bracket of 20 to 34 years have the highest fertility rate with 119.0 births per 1,000 women. Women in the age bracket of 20 to 34 years acount for 100.0% of all women with births.
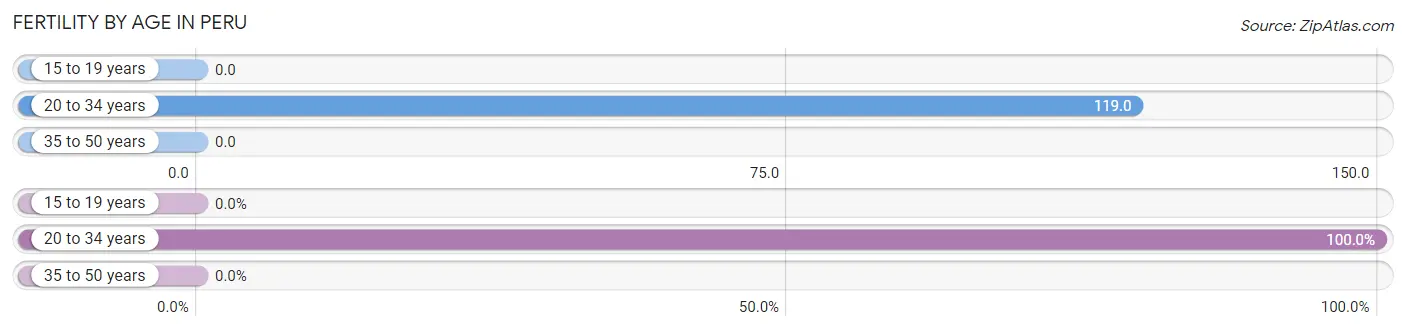
| Age Bracket | Women with Births | Births / 1,000 Women |
| 15 to 19 years | 0 (0.0%) | 0.0 |
| 20 to 34 years | 18 (100.0%) | 119.0 |
| 35 to 50 years | 0 (0.0%) | 0.0 |
| Total | 18 (100.0%) | 40.0 |
Fertility by Age by Marriage Status in Peru
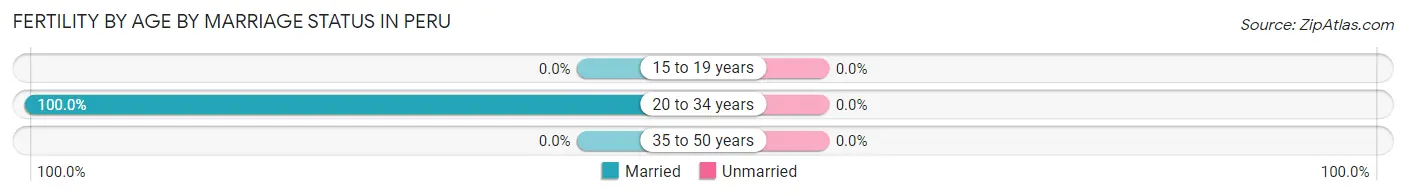
| Age Bracket | Married | Unmarried |
| 15 to 19 years | 0 (0.0%) | 0 (0.0%) |
| 20 to 34 years | 18 (100.0%) | 0 (0.0%) |
| 35 to 50 years | 0 (0.0%) | 0 (0.0%) |
| Total | 18 (100.0%) | 0 (0.0%) |
Fertility by Education in Peru
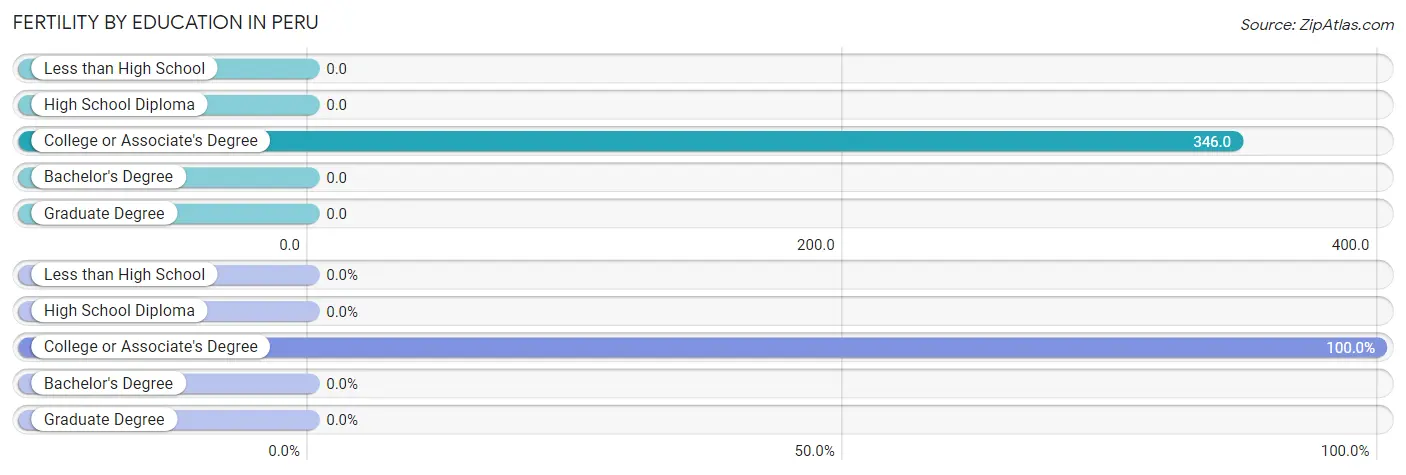
| Educational Attainment | Women with Births | Births / 1,000 Women |
| Less than High School | 0 (0.0%) | 0.0 |
| High School Diploma | 0 (0.0%) | 0.0 |
| College or Associate's Degree | 18 (100.0%) | 346.0 |
| Bachelor's Degree | 0 (0.0%) | 0.0 |
| Graduate Degree | 0 (0.0%) | 0.0 |
| Total | 18 (100.0%) | 40.0 |
Fertility by Education by Marriage Status in Peru
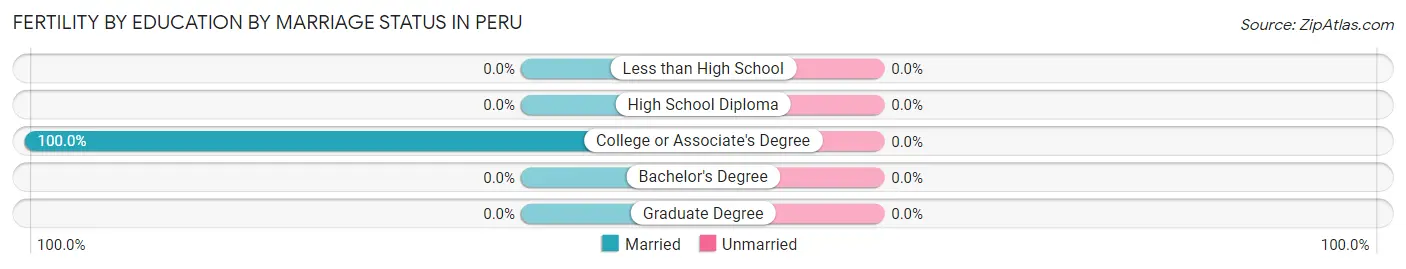
| Educational Attainment | Married | Unmarried |
| Less than High School | 0 (0.0%) | 0 (0.0%) |
| High School Diploma | 0 (0.0%) | 0 (0.0%) |
| College or Associate's Degree | 18 (100.0%) | 0 (0.0%) |
| Bachelor's Degree | 0 (0.0%) | 0 (0.0%) |
| Graduate Degree | 0 (0.0%) | 0 (0.0%) |
| Total | 18 (100.0%) | 0 (0.0%) |
Employment Characteristics in Peru
Employment by Class of Employer in Peru
Among the 888 employed individuals in Peru, private company employees (478 | 53.8%), not-for-profit organizations (157 | 17.7%), and state government employees (116 | 13.1%) make up the most common classes of employment.
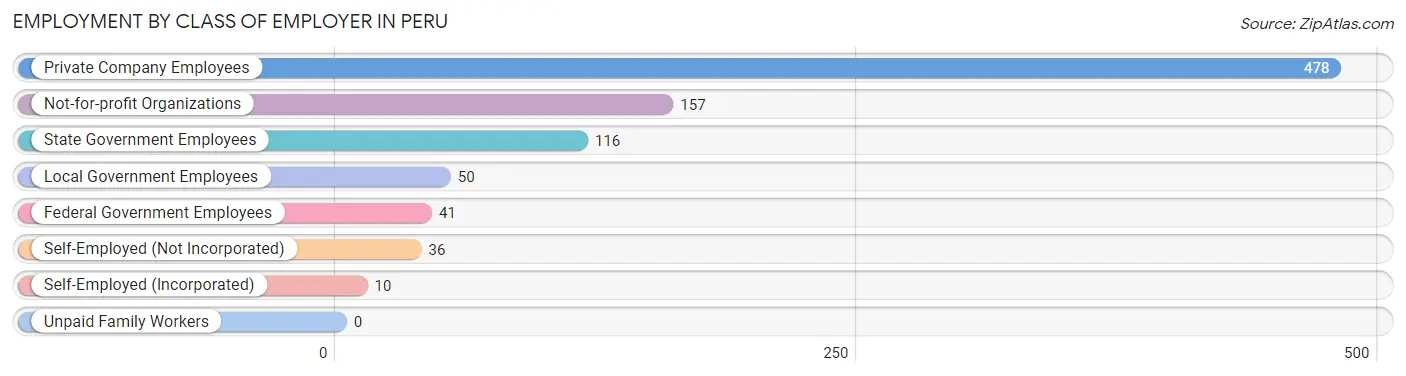
| Employer Class | # Employees | % Employees |
| Private Company Employees | 478 | 53.8% |
| Self-Employed (Incorporated) | 10 | 1.1% |
| Self-Employed (Not Incorporated) | 36 | 4.1% |
| Not-for-profit Organizations | 157 | 17.7% |
| Local Government Employees | 50 | 5.6% |
| State Government Employees | 116 | 13.1% |
| Federal Government Employees | 41 | 4.6% |
| Unpaid Family Workers | 0 | 0.0% |
| Total | 888 | 100.0% |
Employment Status by Age in Peru
According to the labor force statistics for Peru, out of the total population over 16 years of age (1,443), 65.6% or 947 individuals are in the labor force, with 1.9% or 18 of them unemployed. The age group with the highest labor force participation rate is 20 to 24 years, with 100.0% or 46 individuals in the labor force. Within the labor force, the 16 to 19 years age range has the highest percentage of unemployed individuals, with 100.0% or 18 of them being unemployed.
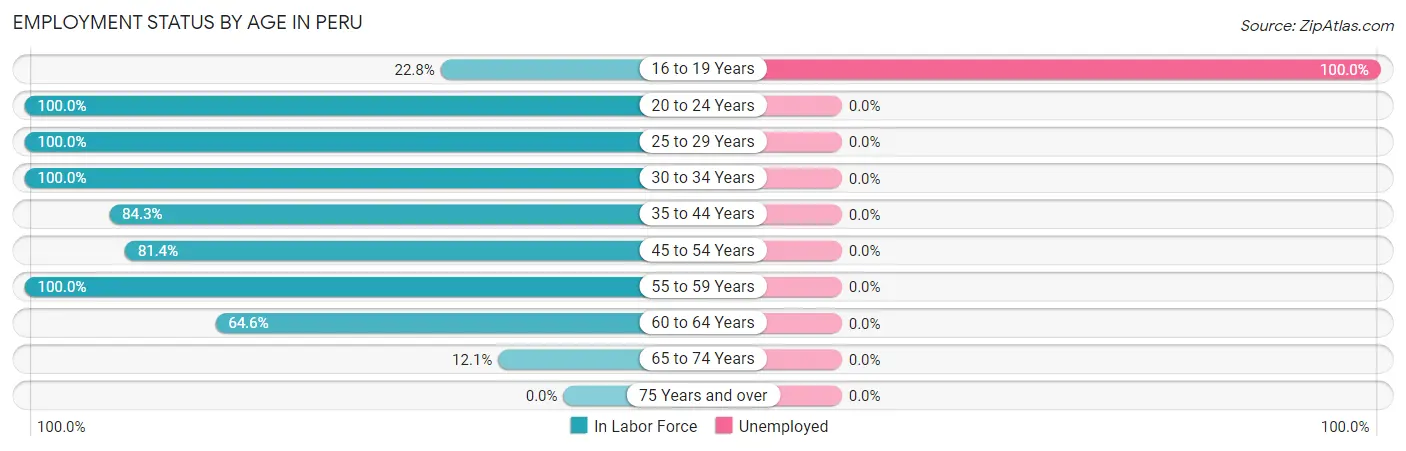
| Age Bracket | In Labor Force | Unemployed |
| 16 to 19 Years | 18 (22.8%) | 18 (100.0%) |
| 20 to 24 Years | 46 (100.0%) | 0 (0.0%) |
| 25 to 29 Years | 203 (100.0%) | 0 (0.0%) |
| 30 to 34 Years | 35 (100.0%) | 0 (0.0%) |
| 35 to 44 Years | 343 (84.3%) | 0 (0.0%) |
| 45 to 54 Years | 175 (81.4%) | 0 (0.0%) |
| 55 to 59 Years | 27 (100.0%) | 0 (0.0%) |
| 60 to 64 Years | 82 (64.6%) | 0 (0.0%) |
| 65 to 74 Years | 17 (12.1%) | 0 (0.0%) |
| 75 Years and over | 0 (0.0%) | 0 (0.0%) |
| Total | 947 (65.6%) | 18 (1.9%) |
Employment Status by Educational Attainment in Peru
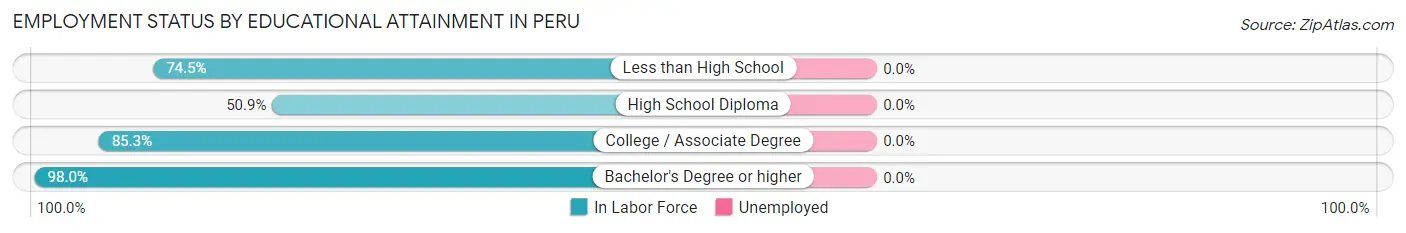
| Educational Attainment | In Labor Force | Unemployed |
| Less than High School | 35 (74.5%) | 0 (0.0%) |
| High School Diploma | 86 (50.9%) | 0 (0.0%) |
| College / Associate Degree | 255 (85.3%) | 0 (0.0%) |
| Bachelor's Degree or higher | 489 (98.0%) | 0 (0.0%) |
| Total | 865 (85.3%) | 0 (0.0%) |
Employment Occupations by Sex in Peru
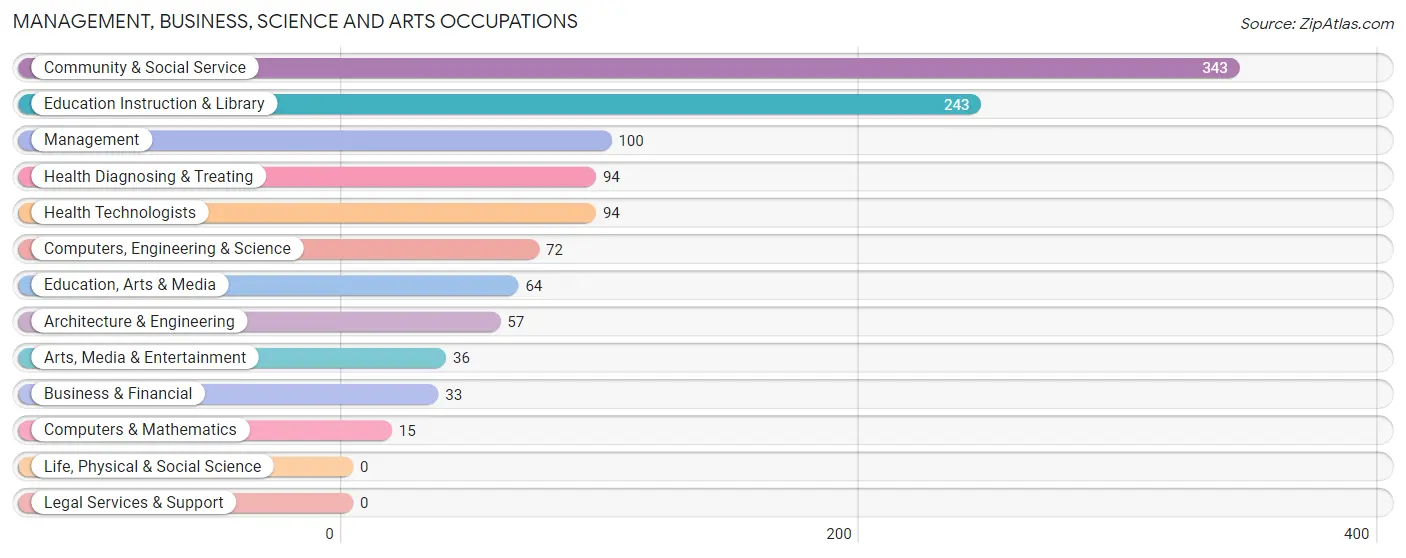
Management, Business, Science and Arts Occupations
The most common Management, Business, Science and Arts occupations in Peru are Community & Social Service (343 | 37.0%), Education Instruction & Library (243 | 26.2%), Management (100 | 10.8%), Health Diagnosing & Treating (94 | 10.1%), and Health Technologists (94 | 10.1%).
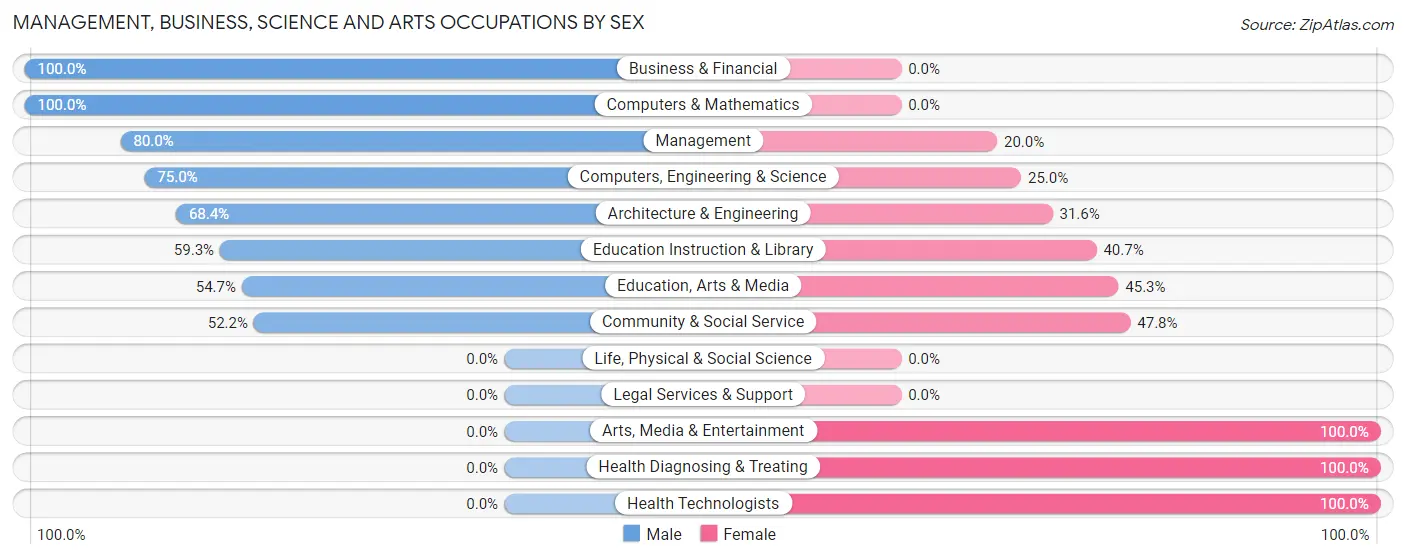
Management, Business, Science and Arts Occupations by Sex
Within the Management, Business, Science and Arts occupations in Peru, the most male-oriented occupations are Business & Financial (100.0%), Computers & Mathematics (100.0%), and Management (80.0%), while the most female-oriented occupations are Arts, Media & Entertainment (100.0%), Health Diagnosing & Treating (100.0%), and Health Technologists (100.0%).
| Occupation | Male | Female |
| Management | 80 (80.0%) | 20 (20.0%) |
| Business & Financial | 33 (100.0%) | 0 (0.0%) |
| Computers, Engineering & Science | 54 (75.0%) | 18 (25.0%) |
| Computers & Mathematics | 15 (100.0%) | 0 (0.0%) |
| Architecture & Engineering | 39 (68.4%) | 18 (31.6%) |
| Life, Physical & Social Science | 0 (0.0%) | 0 (0.0%) |
| Community & Social Service | 179 (52.2%) | 164 (47.8%) |
| Education, Arts & Media | 35 (54.7%) | 29 (45.3%) |
| Legal Services & Support | 0 (0.0%) | 0 (0.0%) |
| Education Instruction & Library | 144 (59.3%) | 99 (40.7%) |
| Arts, Media & Entertainment | 0 (0.0%) | 36 (100.0%) |
| Health Diagnosing & Treating | 0 (0.0%) | 94 (100.0%) |
| Health Technologists | 0 (0.0%) | 94 (100.0%) |
| Total (Category) | 346 (53.9%) | 296 (46.1%) |
| Total (Overall) | 500 (53.9%) | 428 (46.1%) |
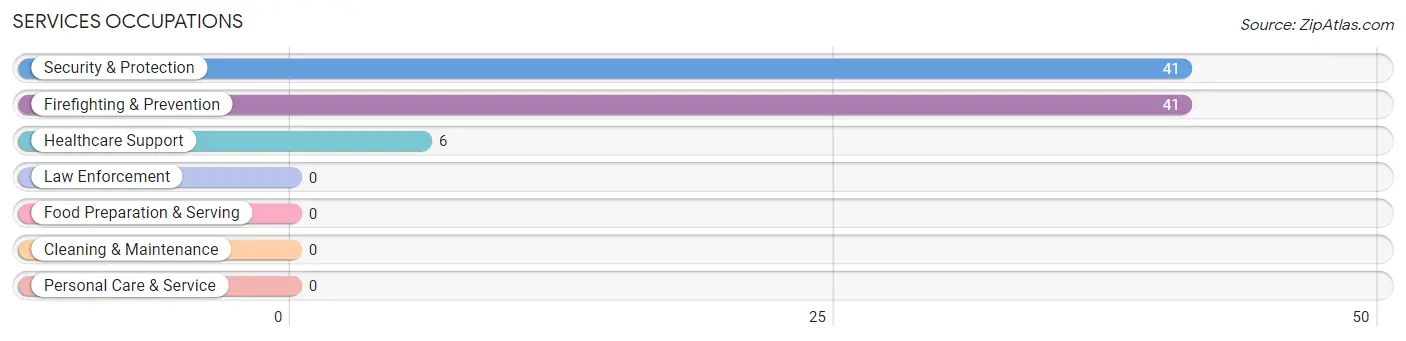
Services Occupations
The most common Services occupations in Peru are Security & Protection (41 | 4.4%), Firefighting & Prevention (41 | 4.4%), and Healthcare Support (6 | 0.6%).
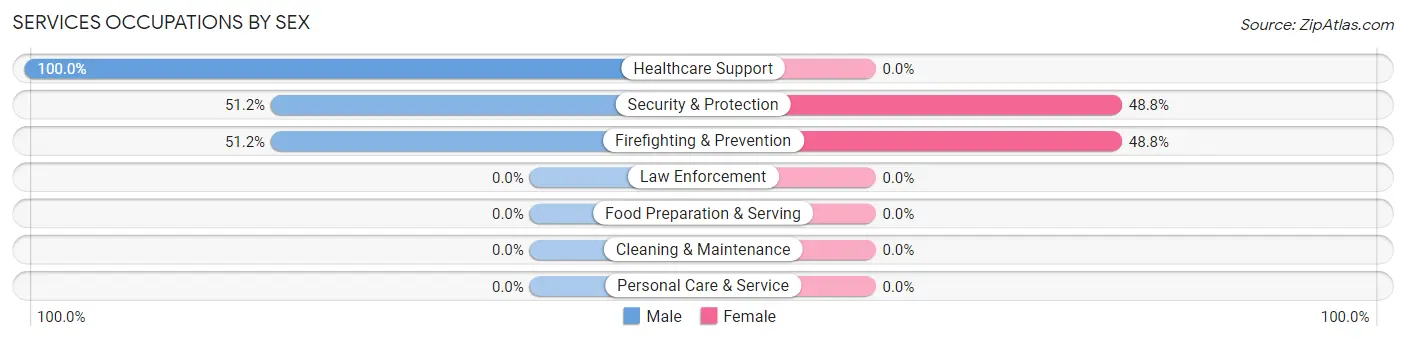
Services Occupations by Sex
Within the Services occupations in Peru, the most male-oriented occupations are Healthcare Support (100.0%), Security & Protection (51.2%), and Firefighting & Prevention (51.2%), while the most female-oriented occupations are Security & Protection (48.8%), and Firefighting & Prevention (48.8%).
| Occupation | Male | Female |
| Healthcare Support | 6 (100.0%) | 0 (0.0%) |
| Security & Protection | 21 (51.2%) | 20 (48.8%) |
| Firefighting & Prevention | 21 (51.2%) | 20 (48.8%) |
| Law Enforcement | 0 (0.0%) | 0 (0.0%) |
| Food Preparation & Serving | 0 (0.0%) | 0 (0.0%) |
| Cleaning & Maintenance | 0 (0.0%) | 0 (0.0%) |
| Personal Care & Service | 0 (0.0%) | 0 (0.0%) |
| Total (Category) | 27 (57.5%) | 20 (42.5%) |
| Total (Overall) | 500 (53.9%) | 428 (46.1%) |
Sales and Office Occupations
The most common Sales and Office occupations in Peru are Office & Administration (71 | 7.6%), and Sales & Related (66 | 7.1%).

Sales and Office Occupations by Sex

| Occupation | Male | Female |
| Sales & Related | 38 (57.6%) | 28 (42.4%) |
| Office & Administration | 0 (0.0%) | 71 (100.0%) |
| Total (Category) | 38 (27.7%) | 99 (72.3%) |
| Total (Overall) | 500 (53.9%) | 428 (46.1%) |
Natural Resources, Construction and Maintenance Occupations
The most common Natural Resources, Construction and Maintenance occupations in Peru are , and Construction & Extraction (35 | 3.8%).
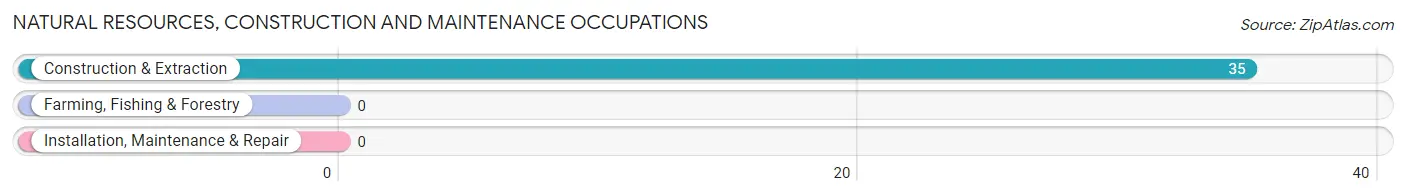
Natural Resources, Construction and Maintenance Occupations by Sex
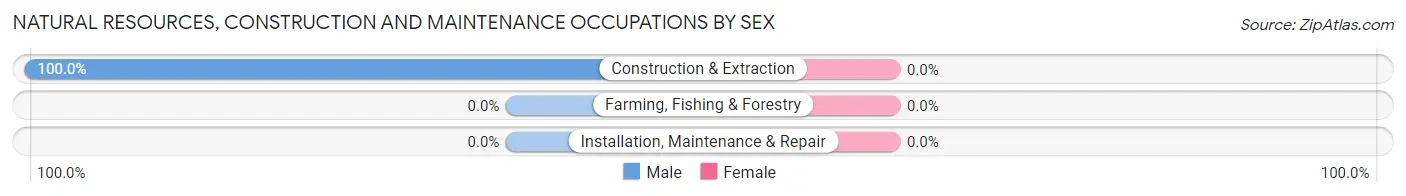
| Occupation | Male | Female |
| Farming, Fishing & Forestry | 0 (0.0%) | 0 (0.0%) |
| Construction & Extraction | 35 (100.0%) | 0 (0.0%) |
| Installation, Maintenance & Repair | 0 (0.0%) | 0 (0.0%) |
| Total (Category) | 35 (100.0%) | 0 (0.0%) |
| Total (Overall) | 500 (53.9%) | 428 (46.1%) |
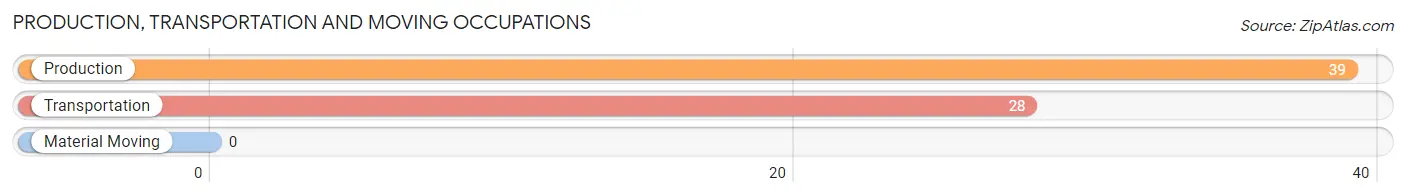
Production, Transportation and Moving Occupations
The most common Production, Transportation and Moving occupations in Peru are Production (39 | 4.2%), and Transportation (28 | 3.0%).
Production, Transportation and Moving Occupations by Sex
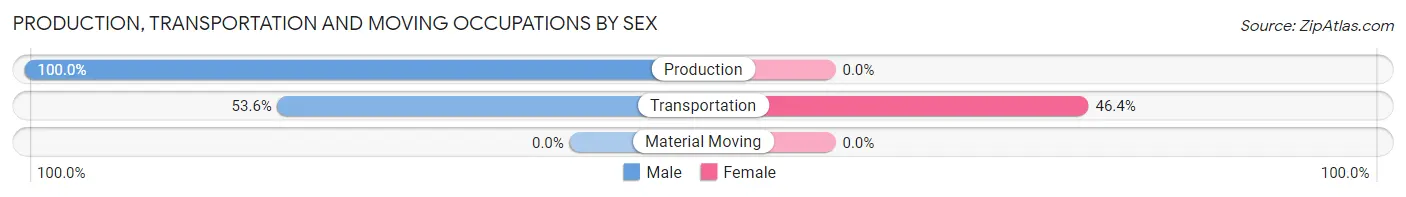
| Occupation | Male | Female |
| Production | 39 (100.0%) | 0 (0.0%) |
| Transportation | 15 (53.6%) | 13 (46.4%) |
| Material Moving | 0 (0.0%) | 0 (0.0%) |
| Total (Category) | 54 (80.6%) | 13 (19.4%) |
| Total (Overall) | 500 (53.9%) | 428 (46.1%) |
Employment Industries by Sex in Peru
Employment Industries in Peru
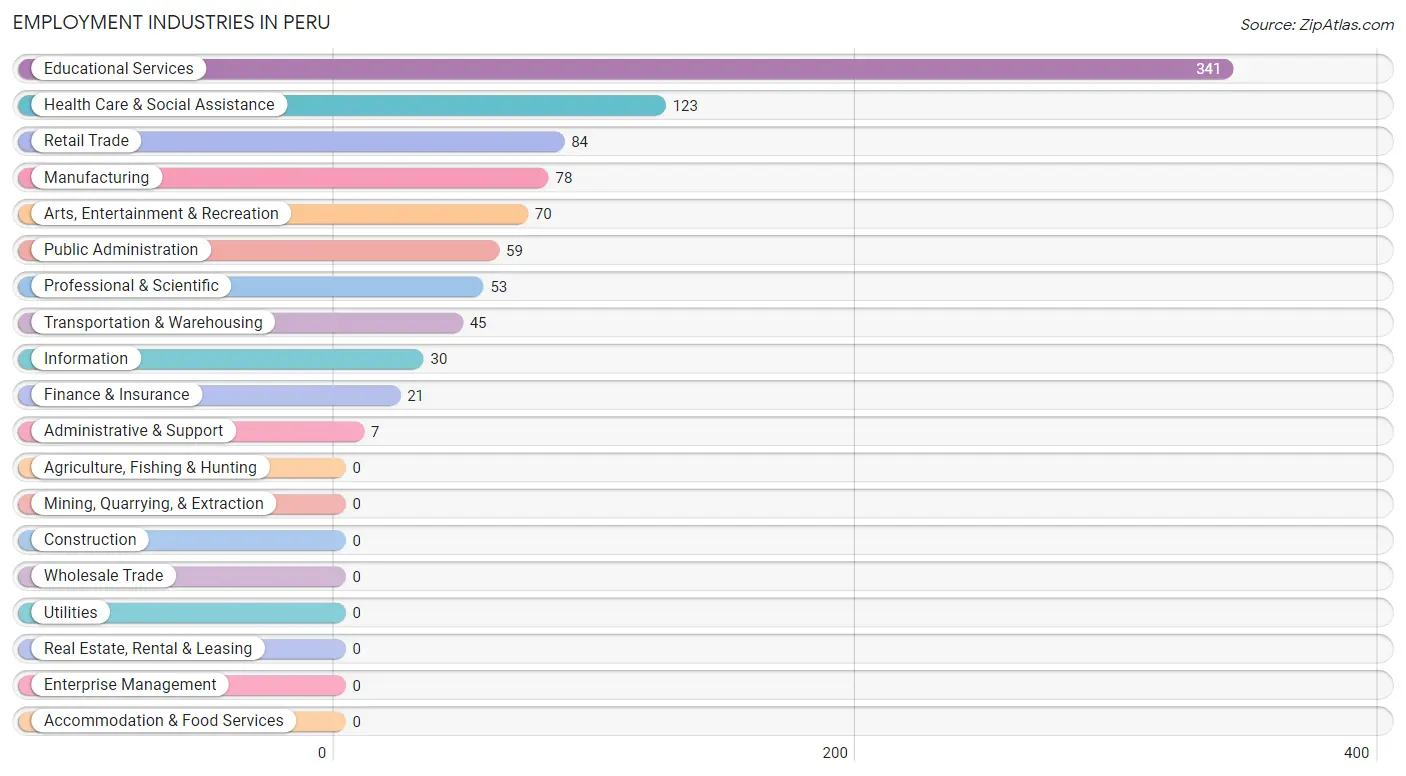
The major employment industries in Peru include Educational Services (341 | 36.7%), Health Care & Social Assistance (123 | 13.3%), Retail Trade (84 | 9.0%), Manufacturing (78 | 8.4%), and Arts, Entertainment & Recreation (70 | 7.5%).
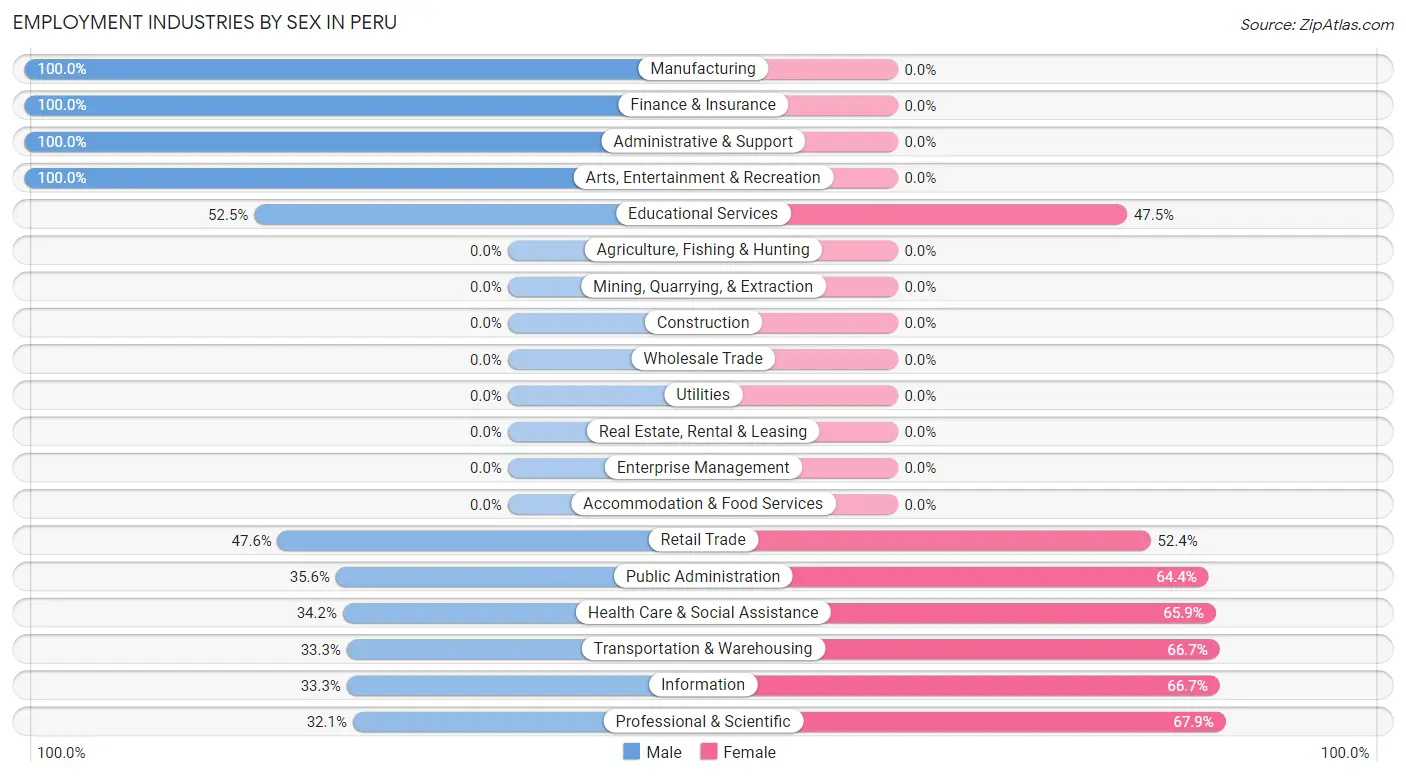
Employment Industries by Sex in Peru
The Peru industries that see more men than women are Manufacturing (100.0%), Finance & Insurance (100.0%), and Administrative & Support (100.0%), whereas the industries that tend to have a higher number of women are Professional & Scientific (67.9%), Transportation & Warehousing (66.7%), and Information (66.7%).
| Industry | Male | Female |
| Agriculture, Fishing & Hunting | 0 (0.0%) | 0 (0.0%) |
| Mining, Quarrying, & Extraction | 0 (0.0%) | 0 (0.0%) |
| Construction | 0 (0.0%) | 0 (0.0%) |
| Manufacturing | 78 (100.0%) | 0 (0.0%) |
| Wholesale Trade | 0 (0.0%) | 0 (0.0%) |
| Retail Trade | 40 (47.6%) | 44 (52.4%) |
| Transportation & Warehousing | 15 (33.3%) | 30 (66.7%) |
| Utilities | 0 (0.0%) | 0 (0.0%) |
| Information | 10 (33.3%) | 20 (66.7%) |
| Finance & Insurance | 21 (100.0%) | 0 (0.0%) |
| Real Estate, Rental & Leasing | 0 (0.0%) | 0 (0.0%) |
| Professional & Scientific | 17 (32.1%) | 36 (67.9%) |
| Enterprise Management | 0 (0.0%) | 0 (0.0%) |
| Administrative & Support | 7 (100.0%) | 0 (0.0%) |
| Educational Services | 179 (52.5%) | 162 (47.5%) |
| Health Care & Social Assistance | 42 (34.2%) | 81 (65.8%) |
| Arts, Entertainment & Recreation | 70 (100.0%) | 0 (0.0%) |
| Accommodation & Food Services | 0 (0.0%) | 0 (0.0%) |
| Public Administration | 21 (35.6%) | 38 (64.4%) |
| Total | 500 (53.9%) | 428 (46.1%) |
Education in Peru
School Enrollment in Peru
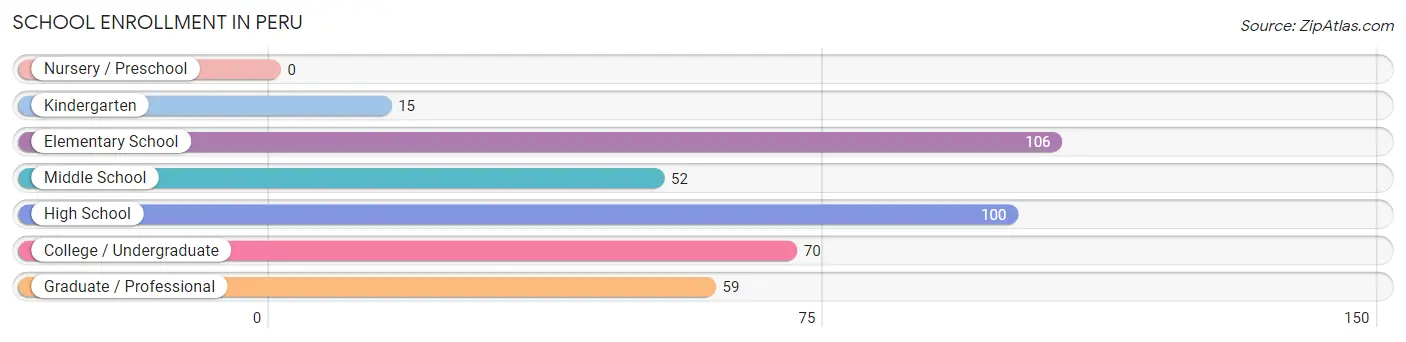
The most common levels of schooling among the 402 students in Peru are elementary school (106 | 26.4%), high school (100 | 24.9%), and college / undergraduate (70 | 17.4%).
| School Level | # Students | % Students |
| Nursery / Preschool | 0 | 0.0% |
| Kindergarten | 15 | 3.7% |
| Elementary School | 106 | 26.4% |
| Middle School | 52 | 12.9% |
| High School | 100 | 24.9% |
| College / Undergraduate | 70 | 17.4% |
| Graduate / Professional | 59 | 14.7% |
| Total | 402 | 100.0% |
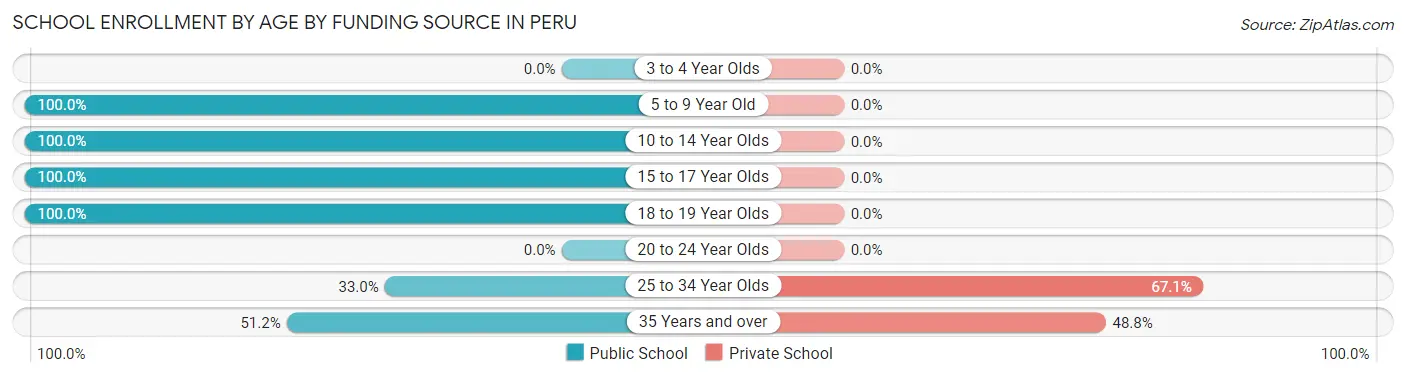
School Enrollment by Age by Funding Source in Peru
Out of a total of 402 students who are enrolled in schools in Peru, 79 (19.7%) attend a private institution, while the remaining 323 (80.3%) are enrolled in public schools. The age group of 25 to 34 year olds has the highest likelihood of being enrolled in private schools, with 59 (67.0% in the age bracket) enrolled. Conversely, the age group of 5 to 9 year old has the lowest likelihood of being enrolled in a private school, with 121 (100.0% in the age bracket) attending a public institution.
| Age Bracket | Public School | Private School |
| 3 to 4 Year Olds | 0 (0.0%) | 0 (0.0%) |
| 5 to 9 Year Old | 121 (100.0%) | 0 (0.0%) |
| 10 to 14 Year Olds | 73 (100.0%) | 0 (0.0%) |
| 15 to 17 Year Olds | 42 (100.0%) | 0 (0.0%) |
| 18 to 19 Year Olds | 37 (100.0%) | 0 (0.0%) |
| 20 to 24 Year Olds | 0 (0.0%) | 0 (0.0%) |
| 25 to 34 Year Olds | 29 (33.0%) | 59 (67.0%) |
| 35 Years and over | 21 (51.2%) | 20 (48.8%) |
| Total | 323 (80.3%) | 79 (19.7%) |
Educational Attainment by Field of Study in Peru
Education (106 | 16.8%), science & technology (87 | 13.8%), business (76 | 12.0%), visual & performing arts (58 | 9.2%), and communications (44 | 7.0%) are the most common fields of study among 631 individuals in Peru who have obtained a bachelor's degree or higher.
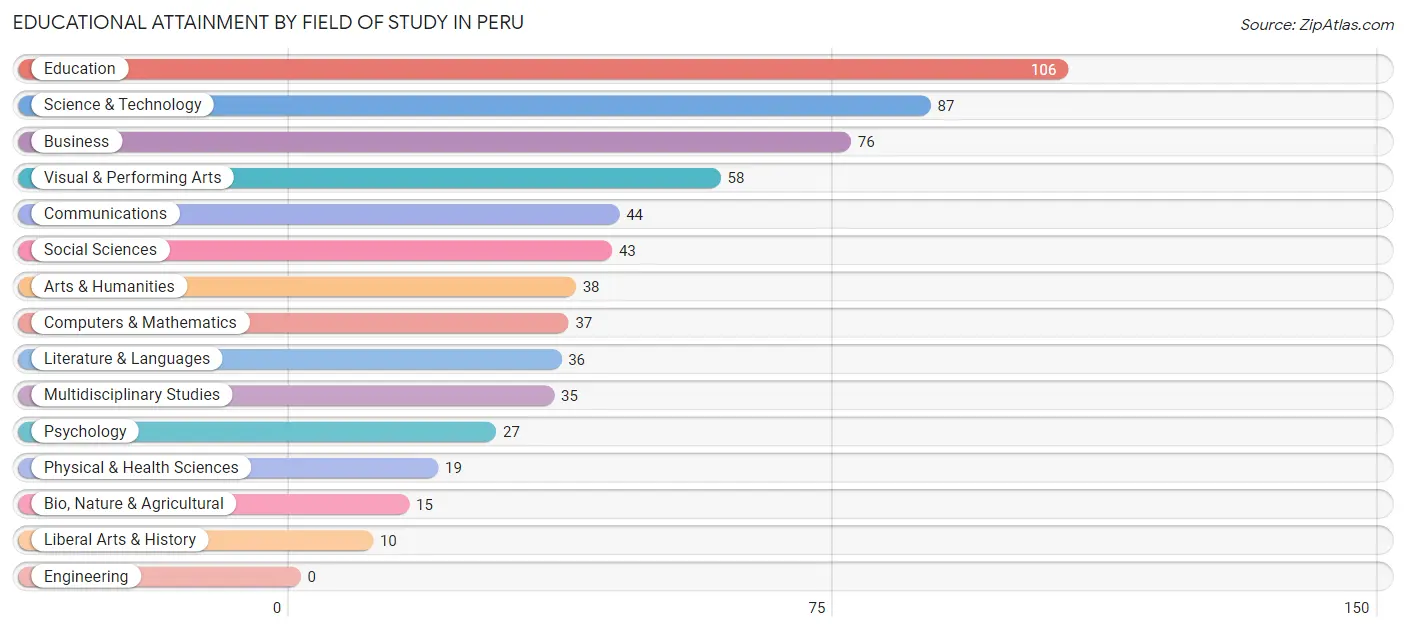
| Field of Study | # Graduates | % Graduates |
| Computers & Mathematics | 37 | 5.9% |
| Bio, Nature & Agricultural | 15 | 2.4% |
| Physical & Health Sciences | 19 | 3.0% |
| Psychology | 27 | 4.3% |
| Social Sciences | 43 | 6.8% |
| Engineering | 0 | 0.0% |
| Multidisciplinary Studies | 35 | 5.6% |
| Science & Technology | 87 | 13.8% |
| Business | 76 | 12.0% |
| Education | 106 | 16.8% |
| Literature & Languages | 36 | 5.7% |
| Liberal Arts & History | 10 | 1.6% |
| Visual & Performing Arts | 58 | 9.2% |
| Communications | 44 | 7.0% |
| Arts & Humanities | 38 | 6.0% |
| Total | 631 | 100.0% |
Transportation & Commute in Peru
Vehicle Availability by Sex in Peru
The most prevalent vehicle ownership categories in Peru are males with 2 vehicles (236, accounting for 67.8%) and females with 2 vehicles (226, making up 59.2%).
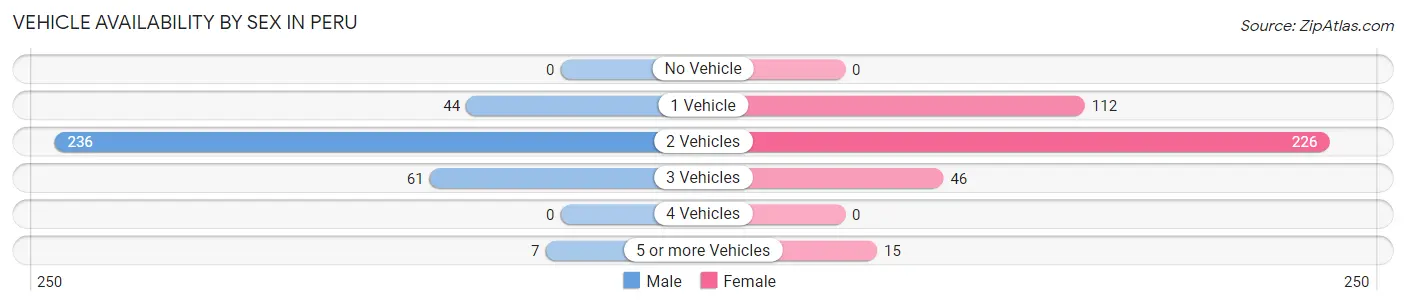
| Vehicles Available | Male | Female |
| No Vehicle | 0 (0.0%) | 0 (0.0%) |
| 1 Vehicle | 44 (12.6%) | 112 (28.1%) |
| 2 Vehicles | 236 (67.8%) | 226 (56.6%) |
| 3 Vehicles | 61 (17.5%) | 46 (11.5%) |
| 4 Vehicles | 0 (0.0%) | 0 (0.0%) |
| 5 or more Vehicles | 7 (2.0%) | 15 (3.8%) |
| Total | 348 (100.0%) | 399 (100.0%) |
Commute Time in Peru
The most frequently occuring commute durations in Peru are 15 to 19 minutes (239 commuters, 32.0%), 10 to 14 minutes (169 commuters, 22.7%), and 5 to 9 minutes (103 commuters, 13.8%).
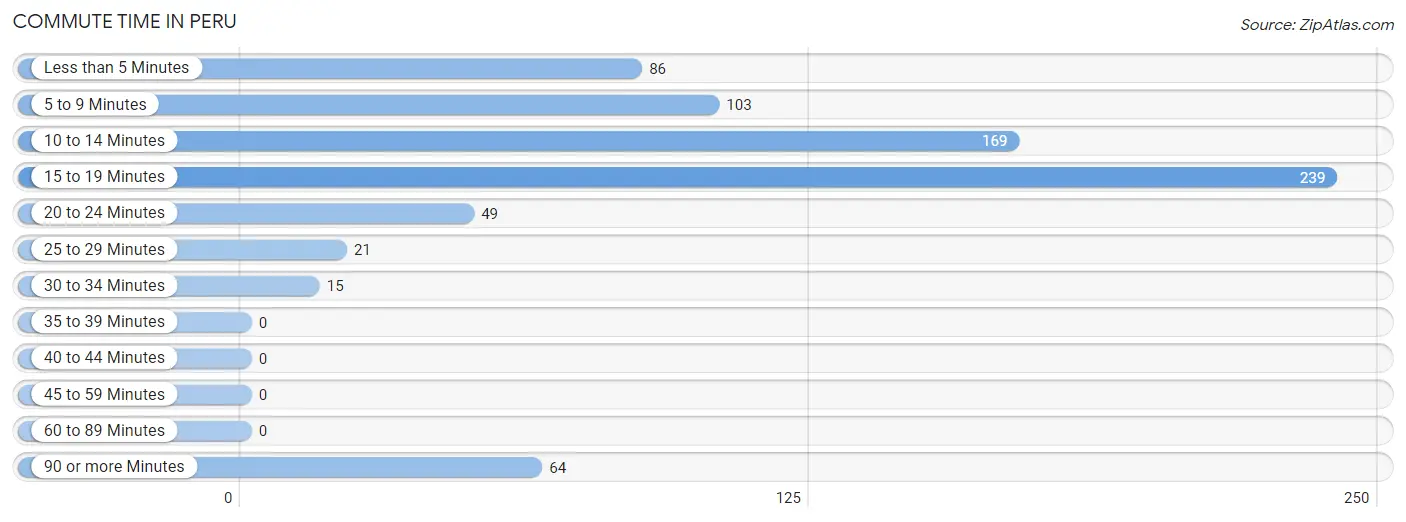
| Commute Time | # Commuters | % Commuters |
| Less than 5 Minutes | 86 | 11.5% |
| 5 to 9 Minutes | 103 | 13.8% |
| 10 to 14 Minutes | 169 | 22.7% |
| 15 to 19 Minutes | 239 | 32.0% |
| 20 to 24 Minutes | 49 | 6.6% |
| 25 to 29 Minutes | 21 | 2.8% |
| 30 to 34 Minutes | 15 | 2.0% |
| 35 to 39 Minutes | 0 | 0.0% |
| 40 to 44 Minutes | 0 | 0.0% |
| 45 to 59 Minutes | 0 | 0.0% |
| 60 to 89 Minutes | 0 | 0.0% |
| 90 or more Minutes | 64 | 8.6% |
Commute Time by Sex in Peru
The most common commute times in Peru are 15 to 19 minutes (130 commuters, 33.9%) for males and 15 to 19 minutes (109 commuters, 30.0%) for females.
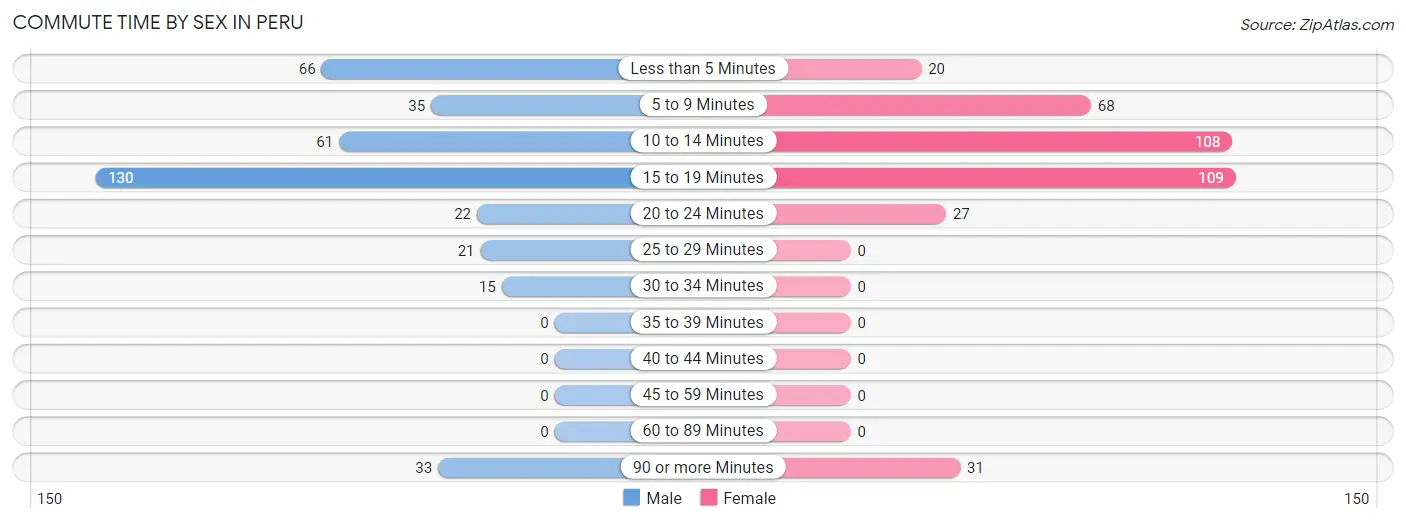
| Commute Time | Male | Female |
| Less than 5 Minutes | 66 (17.2%) | 20 (5.5%) |
| 5 to 9 Minutes | 35 (9.1%) | 68 (18.7%) |
| 10 to 14 Minutes | 61 (15.9%) | 108 (29.7%) |
| 15 to 19 Minutes | 130 (33.9%) | 109 (30.0%) |
| 20 to 24 Minutes | 22 (5.7%) | 27 (7.4%) |
| 25 to 29 Minutes | 21 (5.5%) | 0 (0.0%) |
| 30 to 34 Minutes | 15 (3.9%) | 0 (0.0%) |
| 35 to 39 Minutes | 0 (0.0%) | 0 (0.0%) |
| 40 to 44 Minutes | 0 (0.0%) | 0 (0.0%) |
| 45 to 59 Minutes | 0 (0.0%) | 0 (0.0%) |
| 60 to 89 Minutes | 0 (0.0%) | 0 (0.0%) |
| 90 or more Minutes | 33 (8.6%) | 31 (8.5%) |
Time of Departure to Work by Sex in Peru
The most frequent times of departure to work in Peru are 6:30 AM to 6:59 AM (107, 27.9%) for males and 6:00 AM to 6:29 AM (88, 24.2%) for females.
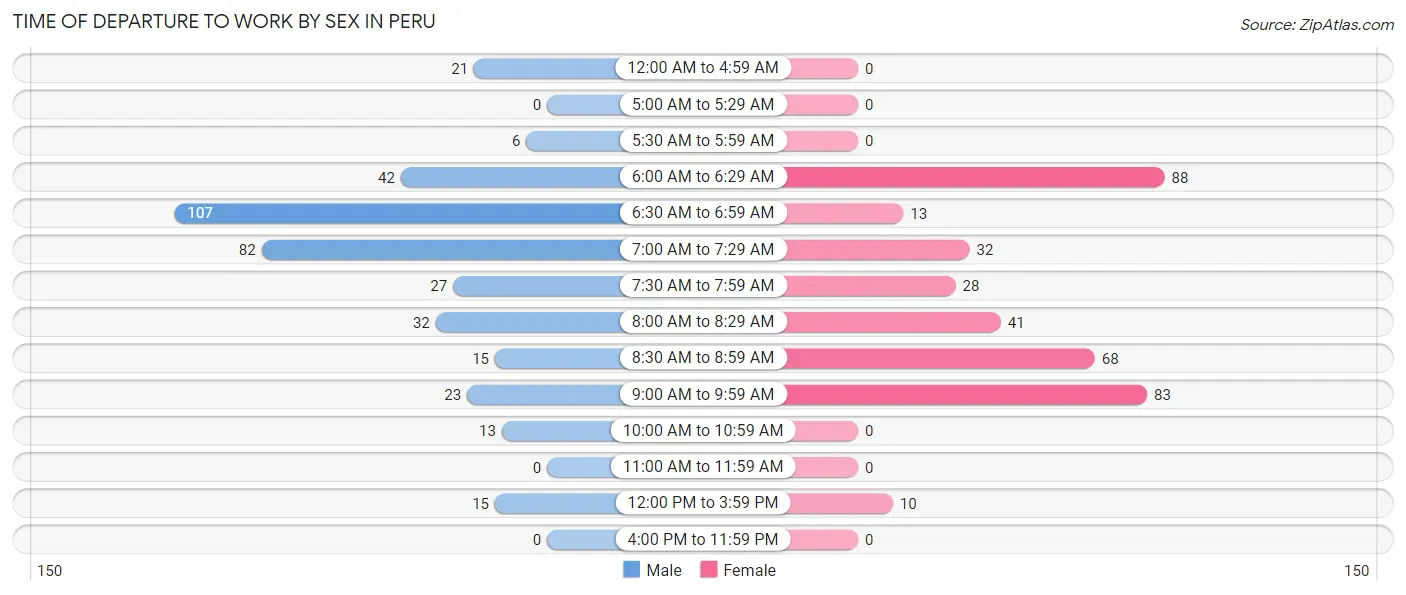
| Time of Departure | Male | Female |
| 12:00 AM to 4:59 AM | 21 (5.5%) | 0 (0.0%) |
| 5:00 AM to 5:29 AM | 0 (0.0%) | 0 (0.0%) |
| 5:30 AM to 5:59 AM | 6 (1.6%) | 0 (0.0%) |
| 6:00 AM to 6:29 AM | 42 (11.0%) | 88 (24.2%) |
| 6:30 AM to 6:59 AM | 107 (27.9%) | 13 (3.6%) |
| 7:00 AM to 7:29 AM | 82 (21.4%) | 32 (8.8%) |
| 7:30 AM to 7:59 AM | 27 (7.0%) | 28 (7.7%) |
| 8:00 AM to 8:29 AM | 32 (8.4%) | 41 (11.3%) |
| 8:30 AM to 8:59 AM | 15 (3.9%) | 68 (18.7%) |
| 9:00 AM to 9:59 AM | 23 (6.0%) | 83 (22.9%) |
| 10:00 AM to 10:59 AM | 13 (3.4%) | 0 (0.0%) |
| 11:00 AM to 11:59 AM | 0 (0.0%) | 0 (0.0%) |
| 12:00 PM to 3:59 PM | 15 (3.9%) | 10 (2.8%) |
| 4:00 PM to 11:59 PM | 0 (0.0%) | 0 (0.0%) |
| Total | 383 (100.0%) | 363 (100.0%) |
Housing Occupancy in Peru
Occupancy by Ownership in Peru
Of the total 686 dwellings in Peru, owner-occupied units account for 539 (78.6%), while renter-occupied units make up 147 (21.4%).
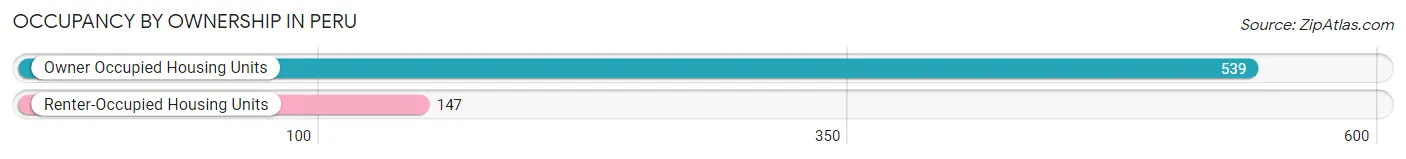
| Occupancy | # Housing Units | % Housing Units |
| Owner Occupied Housing Units | 539 | 78.6% |
| Renter-Occupied Housing Units | 147 | 21.4% |
| Total Occupied Housing Units | 686 | 100.0% |
Occupancy by Household Size in Peru
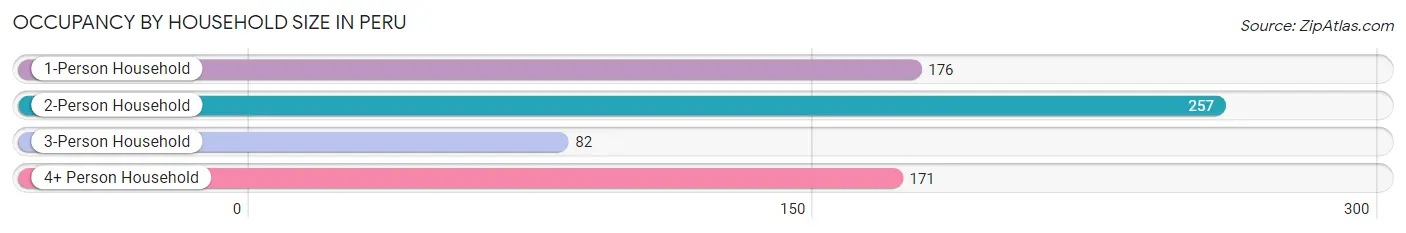
| Household Size | # Housing Units | % Housing Units |
| 1-Person Household | 176 | 25.7% |
| 2-Person Household | 257 | 37.5% |
| 3-Person Household | 82 | 11.9% |
| 4+ Person Household | 171 | 24.9% |
| Total Housing Units | 686 | 100.0% |
Occupancy by Ownership by Household Size in Peru
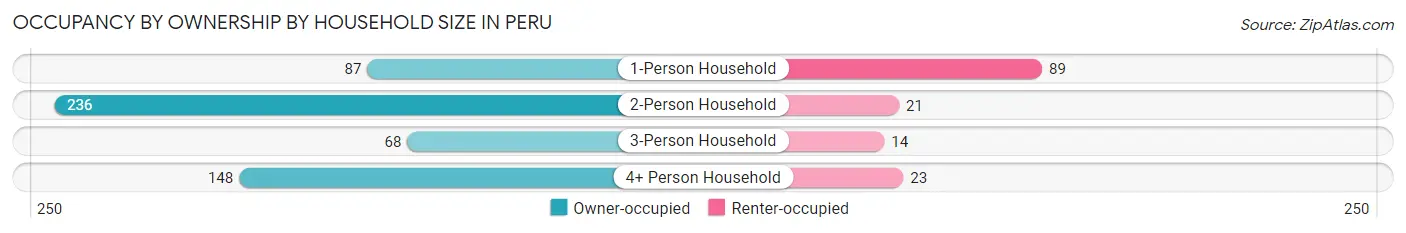
| Household Size | Owner-occupied | Renter-occupied |
| 1-Person Household | 87 (49.4%) | 89 (50.6%) |
| 2-Person Household | 236 (91.8%) | 21 (8.2%) |
| 3-Person Household | 68 (82.9%) | 14 (17.1%) |
| 4+ Person Household | 148 (86.6%) | 23 (13.5%) |
| Total Housing Units | 539 (78.6%) | 147 (21.4%) |
Occupancy by Educational Attainment in Peru
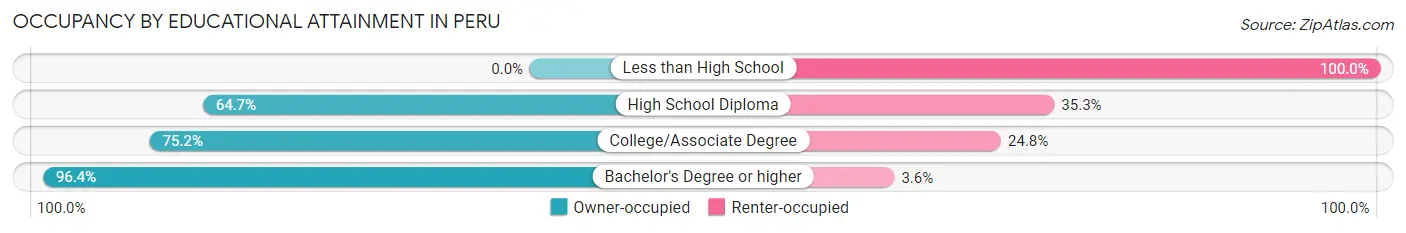
| Household Size | Owner-occupied | Renter-occupied |
| Less than High School | 0 (0.0%) | 36 (100.0%) |
| High School Diploma | 86 (64.7%) | 47 (35.3%) |
| College/Associate Degree | 161 (75.2%) | 53 (24.8%) |
| Bachelor's Degree or higher | 292 (96.4%) | 11 (3.6%) |
Occupancy by Age of Householder in Peru
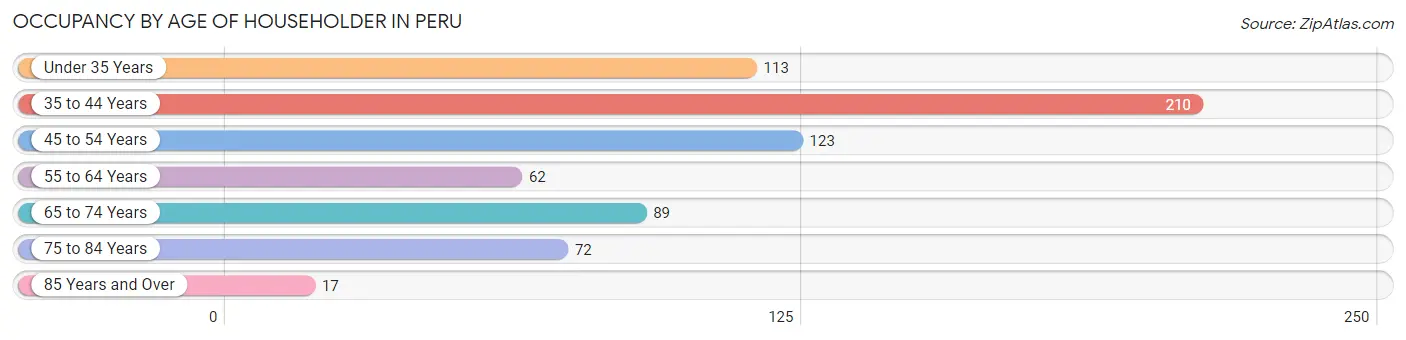
| Age Bracket | # Households | % Households |
| Under 35 Years | 113 | 16.5% |
| 35 to 44 Years | 210 | 30.6% |
| 45 to 54 Years | 123 | 17.9% |
| 55 to 64 Years | 62 | 9.0% |
| 65 to 74 Years | 89 | 13.0% |
| 75 to 84 Years | 72 | 10.5% |
| 85 Years and Over | 17 | 2.5% |
| Total | 686 | 100.0% |
Housing Finances in Peru
Median Income by Occupancy in Peru
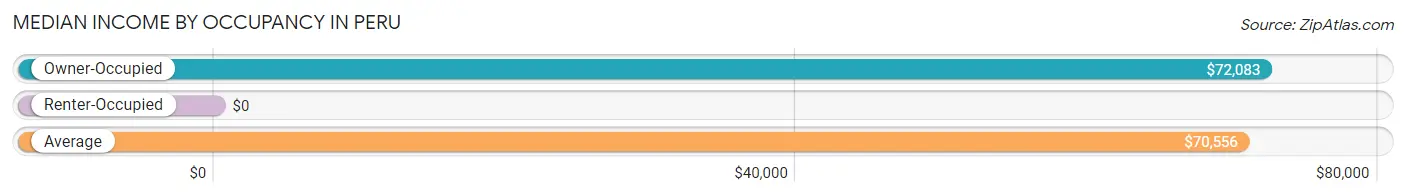
| Occupancy Type | # Households | Median Income |
| Owner-Occupied | 539 (78.6%) | $72,083 |
| Renter-Occupied | 147 (21.4%) | $0 |
| Average | 686 (100.0%) | $70,556 |
Occupancy by Householder Income Bracket in Peru
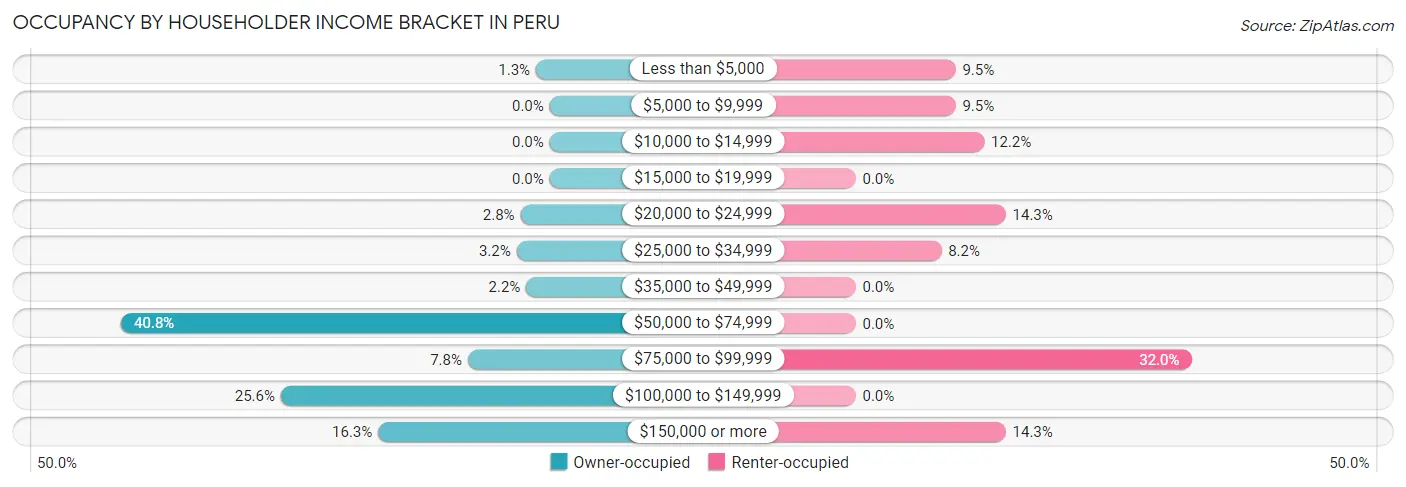
| Income Bracket | Owner-occupied | Renter-occupied |
| Less than $5,000 | 7 (1.3%) | 14 (9.5%) |
| $5,000 to $9,999 | 0 (0.0%) | 14 (9.5%) |
| $10,000 to $14,999 | 0 (0.0%) | 18 (12.2%) |
| $15,000 to $19,999 | 0 (0.0%) | 0 (0.0%) |
| $20,000 to $24,999 | 15 (2.8%) | 21 (14.3%) |
| $25,000 to $34,999 | 17 (3.2%) | 12 (8.2%) |
| $35,000 to $49,999 | 12 (2.2%) | 0 (0.0%) |
| $50,000 to $74,999 | 220 (40.8%) | 0 (0.0%) |
| $75,000 to $99,999 | 42 (7.8%) | 47 (32.0%) |
| $100,000 to $149,999 | 138 (25.6%) | 0 (0.0%) |
| $150,000 or more | 88 (16.3%) | 21 (14.3%) |
| Total | 539 (100.0%) | 147 (100.0%) |
Monthly Housing Cost Tiers in Peru
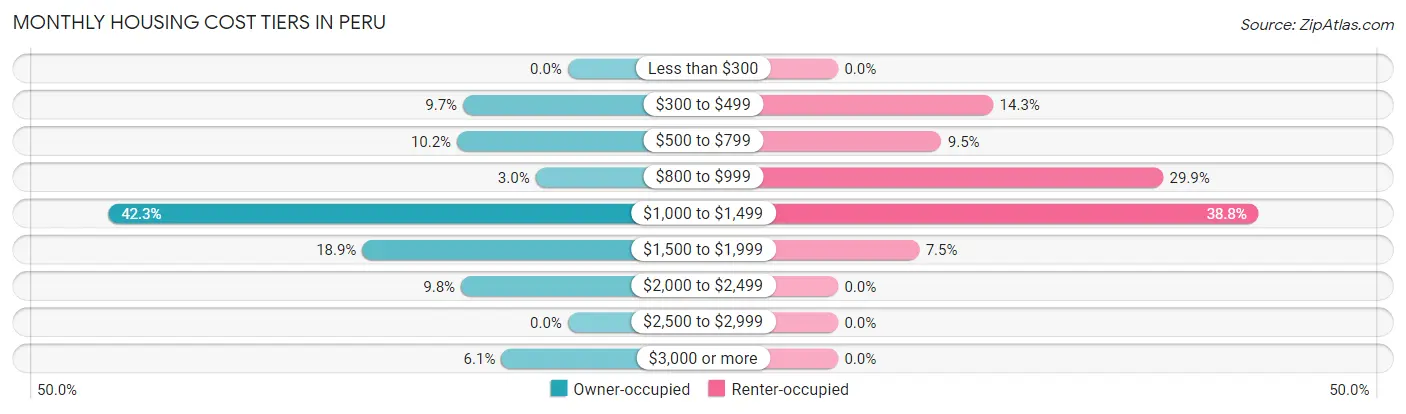
| Monthly Cost | Owner-occupied | Renter-occupied |
| Less than $300 | 0 (0.0%) | 0 (0.0%) |
| $300 to $499 | 52 (9.7%) | 21 (14.3%) |
| $500 to $799 | 55 (10.2%) | 14 (9.5%) |
| $800 to $999 | 16 (3.0%) | 44 (29.9%) |
| $1,000 to $1,499 | 228 (42.3%) | 57 (38.8%) |
| $1,500 to $1,999 | 102 (18.9%) | 11 (7.5%) |
| $2,000 to $2,499 | 53 (9.8%) | 0 (0.0%) |
| $2,500 to $2,999 | 0 (0.0%) | 0 (0.0%) |
| $3,000 or more | 33 (6.1%) | 0 (0.0%) |
| Total | 539 (100.0%) | 147 (100.0%) |
Physical Housing Characteristics in Peru
Housing Structures in Peru
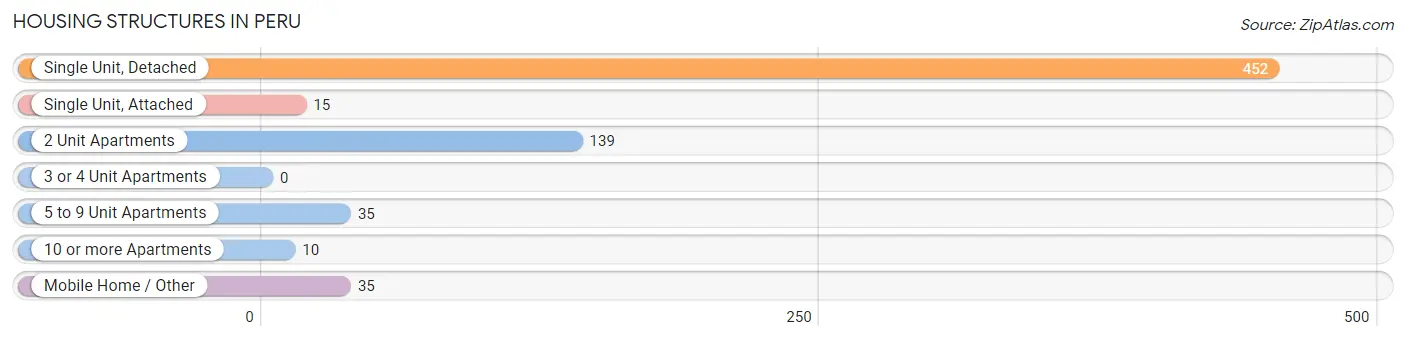
| Structure Type | # Housing Units | % Housing Units |
| Single Unit, Detached | 452 | 65.9% |
| Single Unit, Attached | 15 | 2.2% |
| 2 Unit Apartments | 139 | 20.3% |
| 3 or 4 Unit Apartments | 0 | 0.0% |
| 5 to 9 Unit Apartments | 35 | 5.1% |
| 10 or more Apartments | 10 | 1.5% |
| Mobile Home / Other | 35 | 5.1% |
| Total | 686 | 100.0% |
Housing Structures by Occupancy in Peru
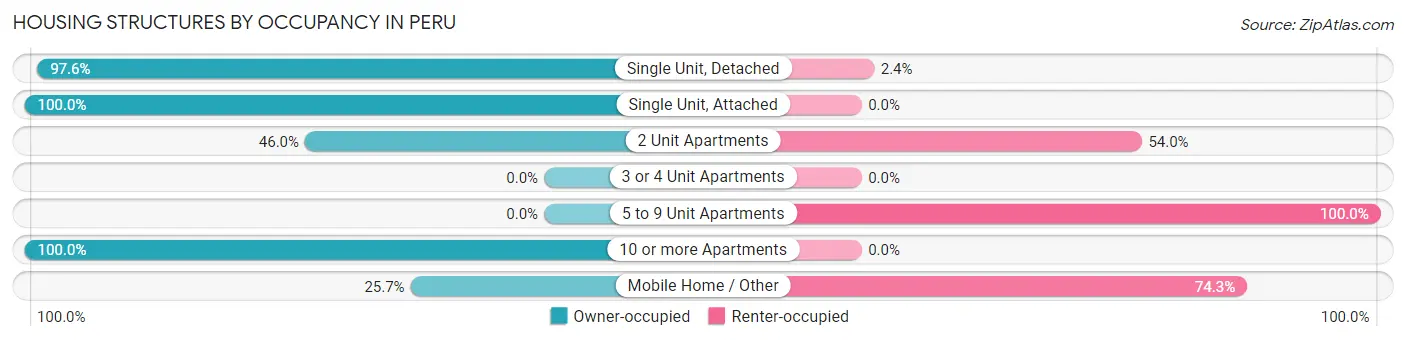
| Structure Type | Owner-occupied | Renter-occupied |
| Single Unit, Detached | 441 (97.6%) | 11 (2.4%) |
| Single Unit, Attached | 15 (100.0%) | 0 (0.0%) |
| 2 Unit Apartments | 64 (46.0%) | 75 (54.0%) |
| 3 or 4 Unit Apartments | 0 (0.0%) | 0 (0.0%) |
| 5 to 9 Unit Apartments | 0 (0.0%) | 35 (100.0%) |
| 10 or more Apartments | 10 (100.0%) | 0 (0.0%) |
| Mobile Home / Other | 9 (25.7%) | 26 (74.3%) |
| Total | 539 (78.6%) | 147 (21.4%) |
Housing Structures by Number of Rooms in Peru
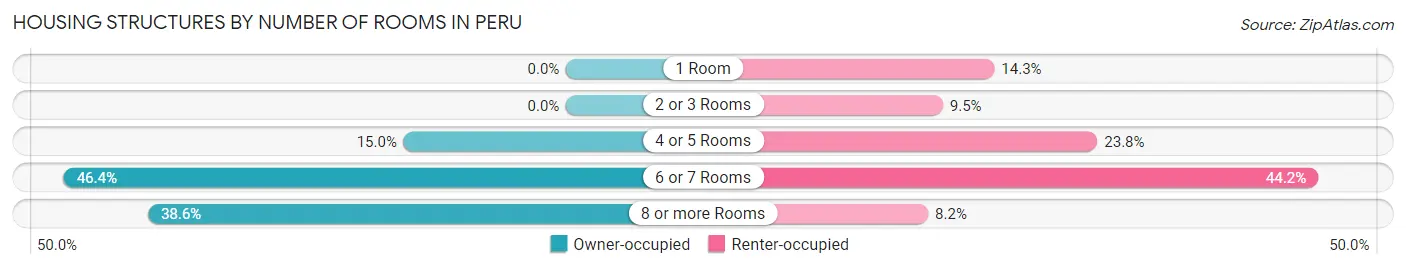
| Number of Rooms | Owner-occupied | Renter-occupied |
| 1 Room | 0 (0.0%) | 21 (14.3%) |
| 2 or 3 Rooms | 0 (0.0%) | 14 (9.5%) |
| 4 or 5 Rooms | 81 (15.0%) | 35 (23.8%) |
| 6 or 7 Rooms | 250 (46.4%) | 65 (44.2%) |
| 8 or more Rooms | 208 (38.6%) | 12 (8.2%) |
| Total | 539 (100.0%) | 147 (100.0%) |
Housing Structure by Heating Type in Peru
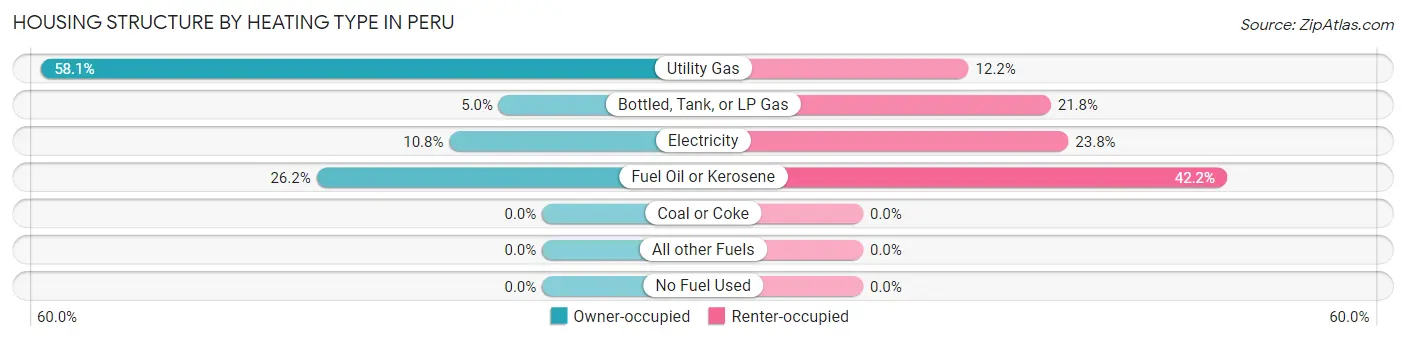
| Heating Type | Owner-occupied | Renter-occupied |
| Utility Gas | 313 (58.1%) | 18 (12.2%) |
| Bottled, Tank, or LP Gas | 27 (5.0%) | 32 (21.8%) |
| Electricity | 58 (10.8%) | 35 (23.8%) |
| Fuel Oil or Kerosene | 141 (26.2%) | 62 (42.2%) |
| Coal or Coke | 0 (0.0%) | 0 (0.0%) |
| All other Fuels | 0 (0.0%) | 0 (0.0%) |
| No Fuel Used | 0 (0.0%) | 0 (0.0%) |
| Total | 539 (100.0%) | 147 (100.0%) |
Household Vehicle Usage in Peru

| Vehicles per Household | Owner-occupied | Renter-occupied |
| No Vehicle | 0 (0.0%) | 32 (21.8%) |
| 1 Vehicle | 176 (32.7%) | 83 (56.5%) |
| 2 Vehicles | 279 (51.8%) | 32 (21.8%) |
| 3 or more Vehicles | 84 (15.6%) | 0 (0.0%) |
| Total | 539 (100.0%) | 147 (100.0%) |
Real Estate & Mortgages in Peru
Real Estate and Mortgage Overview in Peru
| Characteristic | Without Mortgage | With Mortgage |
| Housing Units | 167 | 372 |
| Median Property Value | $270,500 | $167,300 |
| Median Household Income | $65,096 | $55 |
| Monthly Housing Costs | $595 | $33 |
| Real Estate Taxes | $2,729 | $0 |
Property Value by Mortgage Status in Peru
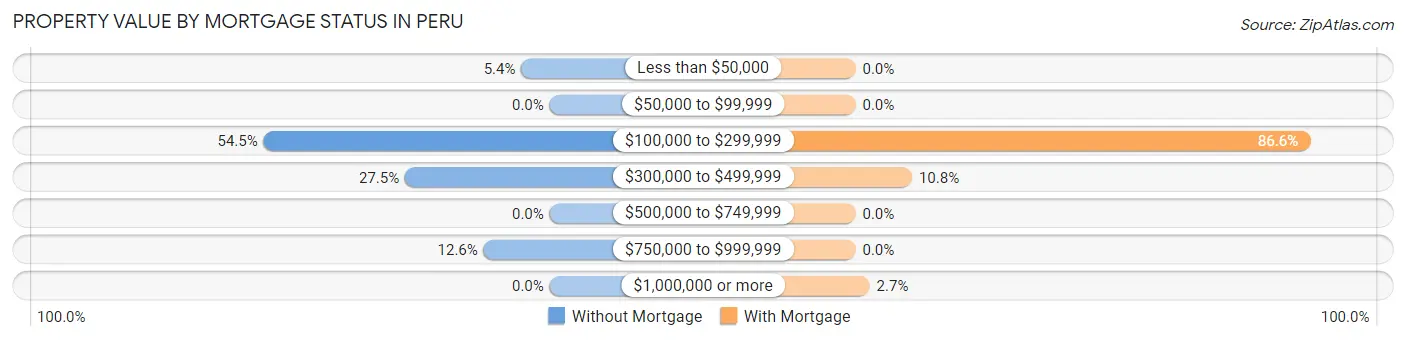
| Property Value | Without Mortgage | With Mortgage |
| Less than $50,000 | 9 (5.4%) | 0 (0.0%) |
| $50,000 to $99,999 | 0 (0.0%) | 0 (0.0%) |
| $100,000 to $299,999 | 91 (54.5%) | 322 (86.6%) |
| $300,000 to $499,999 | 46 (27.5%) | 40 (10.7%) |
| $500,000 to $749,999 | 0 (0.0%) | 0 (0.0%) |
| $750,000 to $999,999 | 21 (12.6%) | 0 (0.0%) |
| $1,000,000 or more | 0 (0.0%) | 10 (2.7%) |
| Total | 167 (100.0%) | 372 (100.0%) |
Household Income by Mortgage Status in Peru
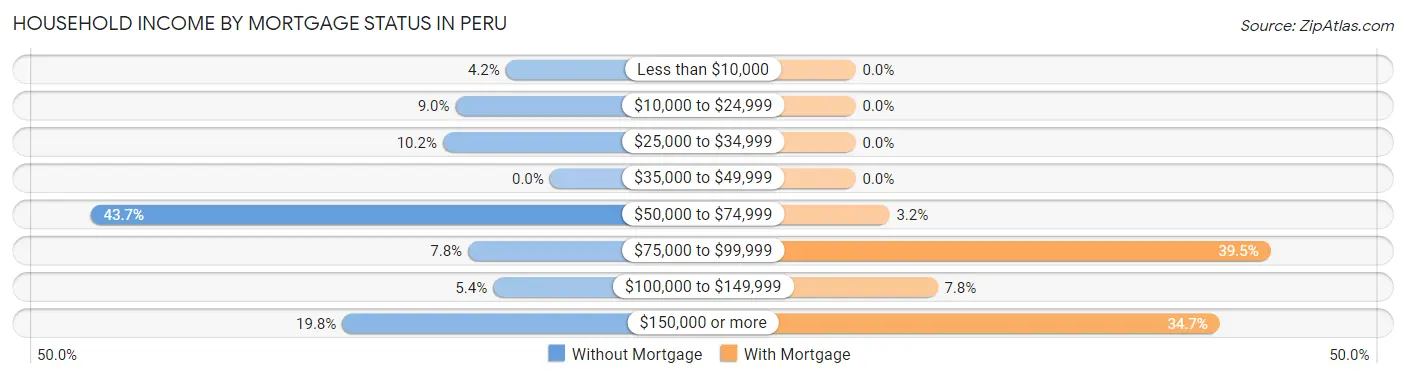
| Household Income | Without Mortgage | With Mortgage |
| Less than $10,000 | 7 (4.2%) | 0 (0.0%) |
| $10,000 to $24,999 | 15 (9.0%) | 0 (0.0%) |
| $25,000 to $34,999 | 17 (10.2%) | 0 (0.0%) |
| $35,000 to $49,999 | 0 (0.0%) | 0 (0.0%) |
| $50,000 to $74,999 | 73 (43.7%) | 12 (3.2%) |
| $75,000 to $99,999 | 13 (7.8%) | 147 (39.5%) |
| $100,000 to $149,999 | 9 (5.4%) | 29 (7.8%) |
| $150,000 or more | 33 (19.8%) | 129 (34.7%) |
| Total | 167 (100.0%) | 372 (100.0%) |
Property Value to Household Income Ratio in Peru
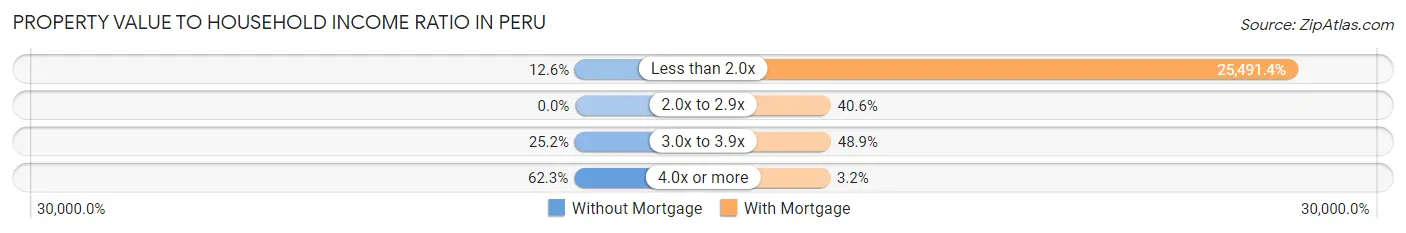
| Value-to-Income Ratio | Without Mortgage | With Mortgage |
| Less than 2.0x | 21 (12.6%) | 94,828 (25,491.4%) |
| 2.0x to 2.9x | 0 (0.0%) | 151 (40.6%) |
| 3.0x to 3.9x | 42 (25.2%) | 182 (48.9%) |
| 4.0x or more | 104 (62.3%) | 12 (3.2%) |
| Total | 167 (100.0%) | 372 (100.0%) |
Real Estate Taxes by Mortgage Status in Peru
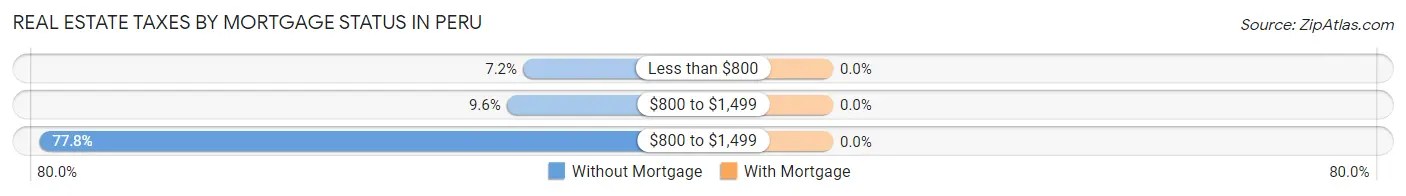
| Property Taxes | Without Mortgage | With Mortgage |
| Less than $800 | 12 (7.2%) | 0 (0.0%) |
| $800 to $1,499 | 16 (9.6%) | 0 (0.0%) |
| $800 to $1,499 | 130 (77.8%) | 0 (0.0%) |
| Total | 167 (100.0%) | 372 (100.0%) |
Health & Disability in Peru
Health Insurance Coverage by Age in Peru
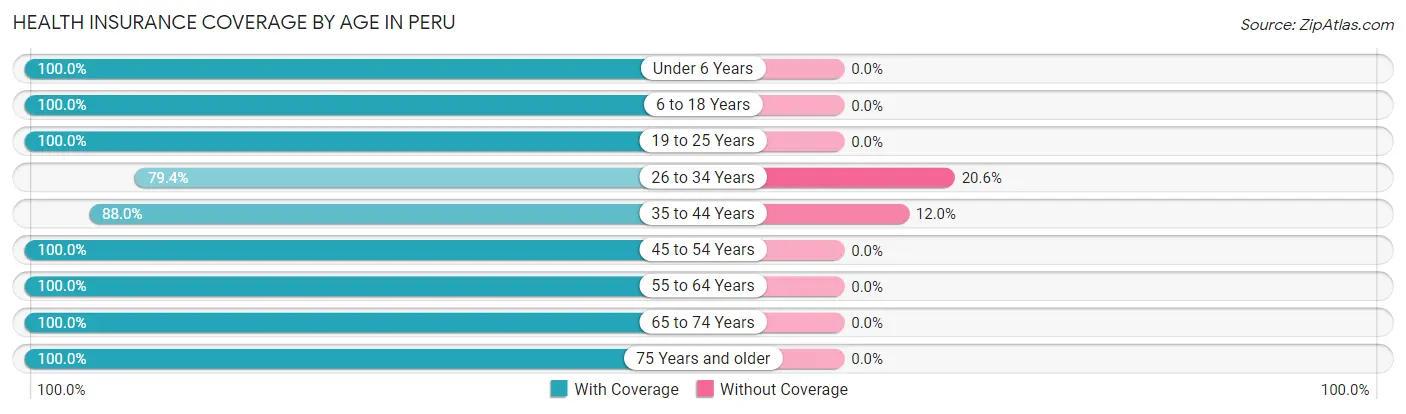
| Age Bracket | With Coverage | Without Coverage |
| Under 6 Years | 185 (100.0%) | 0 (0.0%) |
| 6 to 18 Years | 258 (100.0%) | 0 (0.0%) |
| 19 to 25 Years | 46 (100.0%) | 0 (0.0%) |
| 26 to 34 Years | 189 (79.4%) | 49 (20.6%) |
| 35 to 44 Years | 358 (88.0%) | 49 (12.0%) |
| 45 to 54 Years | 215 (100.0%) | 0 (0.0%) |
| 55 to 64 Years | 154 (100.0%) | 0 (0.0%) |
| 65 to 74 Years | 141 (100.0%) | 0 (0.0%) |
| 75 Years and older | 152 (100.0%) | 0 (0.0%) |
| Total | 1,698 (94.5%) | 98 (5.5%) |
Health Insurance Coverage by Citizenship Status in Peru

| Citizenship Status | With Coverage | Without Coverage |
| Native Born | 185 (100.0%) | 0 (0.0%) |
| Foreign Born, Citizen | 258 (100.0%) | 0 (0.0%) |
| Foreign Born, not a Citizen | 46 (100.0%) | 0 (0.0%) |
Health Insurance Coverage by Household Income in Peru
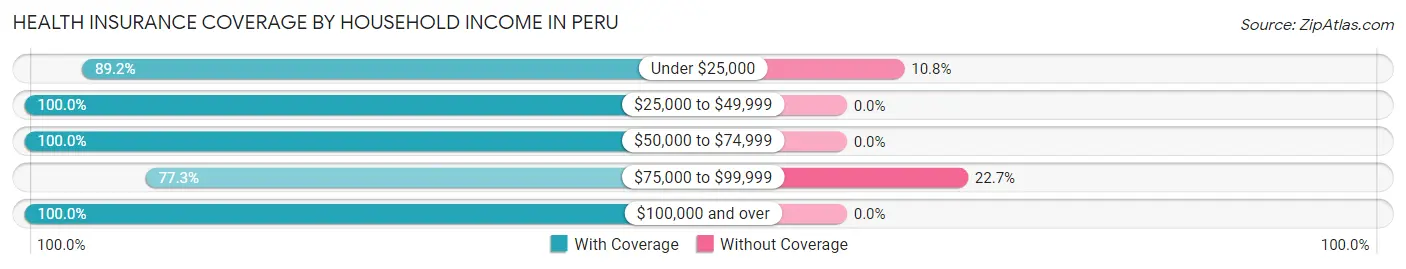
| Household Income | With Coverage | Without Coverage |
| Under $25,000 | 116 (89.2%) | 14 (10.8%) |
| $25,000 to $49,999 | 112 (100.0%) | 0 (0.0%) |
| $50,000 to $74,999 | 401 (100.0%) | 0 (0.0%) |
| $75,000 to $99,999 | 167 (77.3%) | 49 (22.7%) |
| $100,000 and over | 796 (100.0%) | 0 (0.0%) |
Public vs Private Health Insurance Coverage by Age in Peru
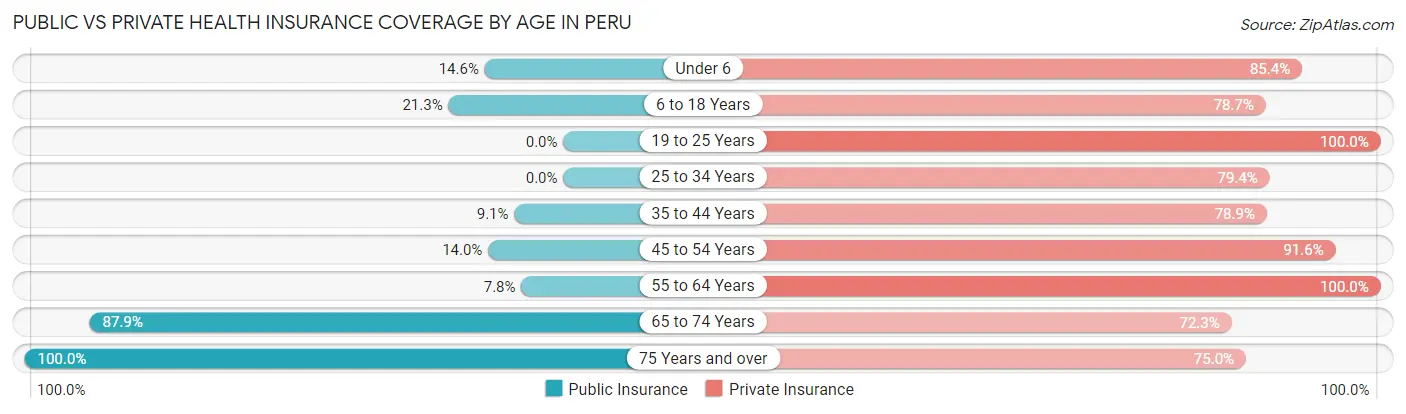
| Age Bracket | Public Insurance | Private Insurance |
| Under 6 | 27 (14.6%) | 158 (85.4%) |
| 6 to 18 Years | 55 (21.3%) | 203 (78.7%) |
| 19 to 25 Years | 0 (0.0%) | 46 (100.0%) |
| 25 to 34 Years | 0 (0.0%) | 189 (79.4%) |
| 35 to 44 Years | 37 (9.1%) | 321 (78.9%) |
| 45 to 54 Years | 30 (14.0%) | 197 (91.6%) |
| 55 to 64 Years | 12 (7.8%) | 154 (100.0%) |
| 65 to 74 Years | 124 (87.9%) | 102 (72.3%) |
| 75 Years and over | 152 (100.0%) | 114 (75.0%) |
| Total | 437 (24.3%) | 1,484 (82.6%) |
Disability Status by Sex by Age in Peru
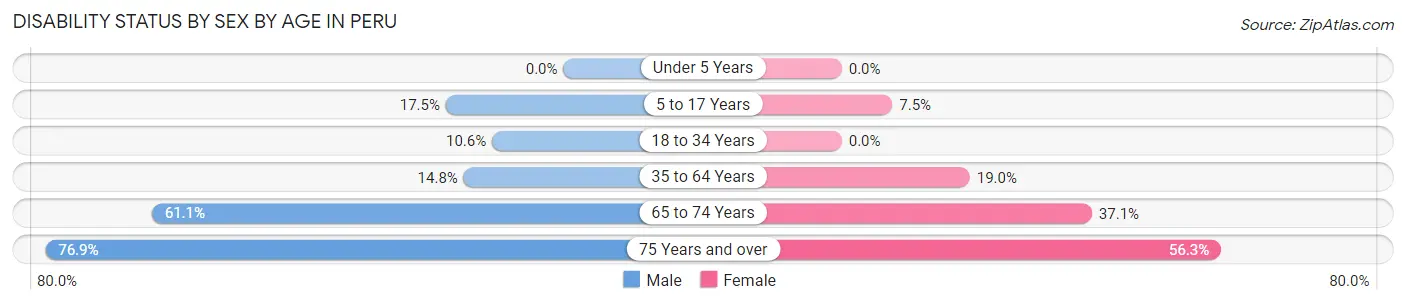
| Age Bracket | Male | Female |
| Under 5 Years | 0 (0.0%) | 0 (0.0%) |
| 5 to 17 Years | 11 (17.5%) | 13 (7.5%) |
| 18 to 34 Years | 18 (10.6%) | 0 (0.0%) |
| 35 to 64 Years | 58 (14.8%) | 73 (19.0%) |
| 65 to 74 Years | 22 (61.1%) | 39 (37.1%) |
| 75 Years and over | 50 (76.9%) | 49 (56.3%) |
Disability Class by Sex by Age in Peru
Disability Class: Hearing Difficulty
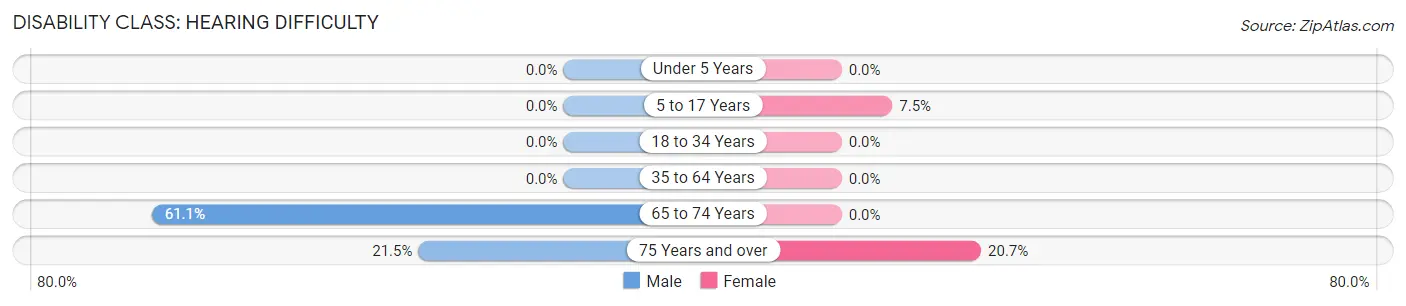
| Age Bracket | Male | Female |
| Under 5 Years | 0 (0.0%) | 0 (0.0%) |
| 5 to 17 Years | 0 (0.0%) | 13 (7.5%) |
| 18 to 34 Years | 0 (0.0%) | 0 (0.0%) |
| 35 to 64 Years | 0 (0.0%) | 0 (0.0%) |
| 65 to 74 Years | 22 (61.1%) | 0 (0.0%) |
| 75 Years and over | 14 (21.5%) | 18 (20.7%) |
Disability Class: Vision Difficulty
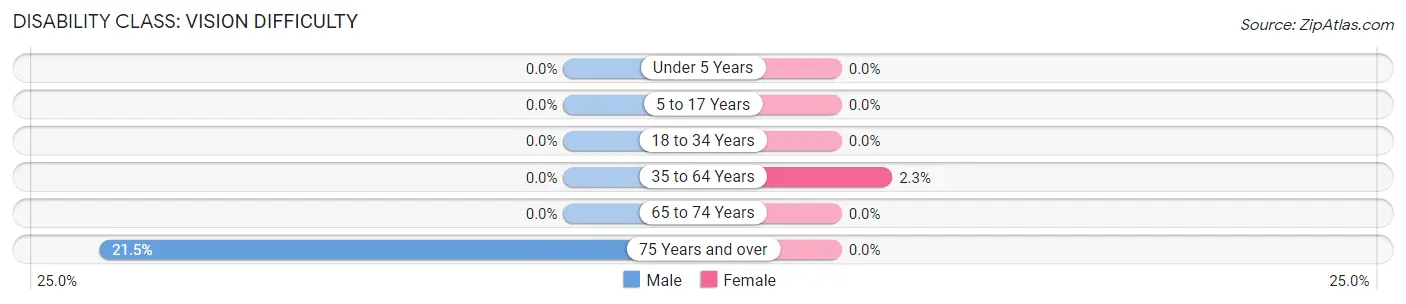
| Age Bracket | Male | Female |
| Under 5 Years | 0 (0.0%) | 0 (0.0%) |
| 5 to 17 Years | 0 (0.0%) | 0 (0.0%) |
| 18 to 34 Years | 0 (0.0%) | 0 (0.0%) |
| 35 to 64 Years | 0 (0.0%) | 9 (2.3%) |
| 65 to 74 Years | 0 (0.0%) | 0 (0.0%) |
| 75 Years and over | 14 (21.5%) | 0 (0.0%) |
Disability Class: Cognitive Difficulty
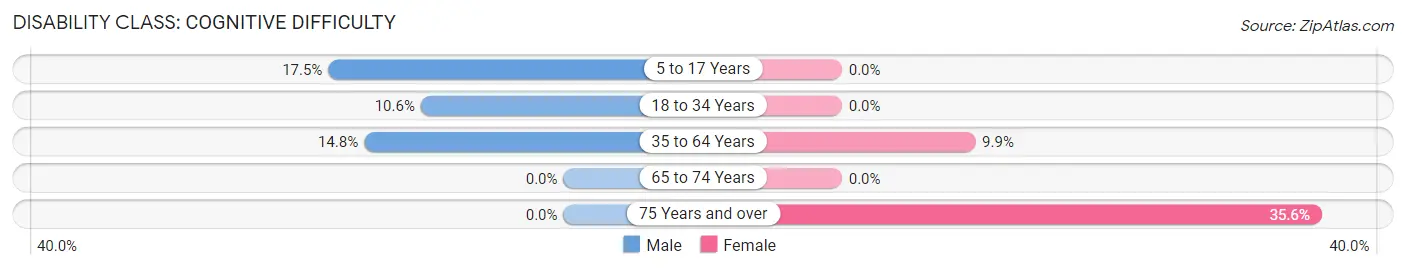
| Age Bracket | Male | Female |
| 5 to 17 Years | 11 (17.5%) | 0 (0.0%) |
| 18 to 34 Years | 18 (10.6%) | 0 (0.0%) |
| 35 to 64 Years | 58 (14.8%) | 38 (9.9%) |
| 65 to 74 Years | 0 (0.0%) | 0 (0.0%) |
| 75 Years and over | 0 (0.0%) | 31 (35.6%) |
Disability Class: Ambulatory Difficulty
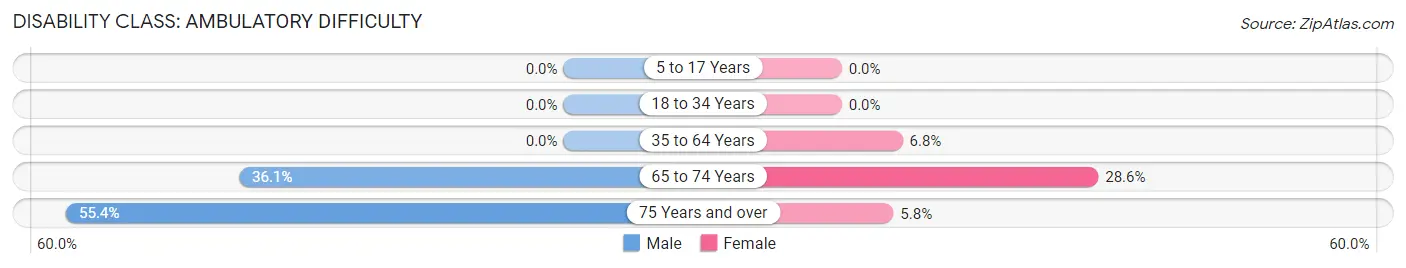
| Age Bracket | Male | Female |
| 5 to 17 Years | 0 (0.0%) | 0 (0.0%) |
| 18 to 34 Years | 0 (0.0%) | 0 (0.0%) |
| 35 to 64 Years | 0 (0.0%) | 26 (6.8%) |
| 65 to 74 Years | 13 (36.1%) | 30 (28.6%) |
| 75 Years and over | 36 (55.4%) | 5 (5.8%) |
Disability Class: Self-Care Difficulty
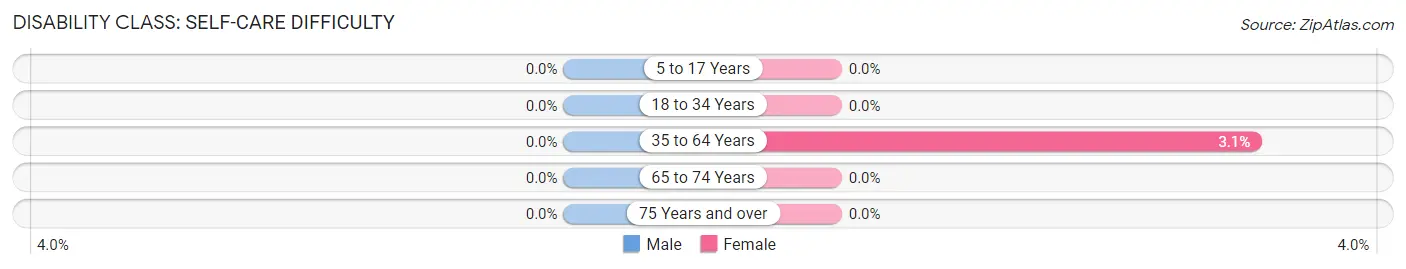
| Age Bracket | Male | Female |
| 5 to 17 Years | 0 (0.0%) | 0 (0.0%) |
| 18 to 34 Years | 0 (0.0%) | 0 (0.0%) |
| 35 to 64 Years | 0 (0.0%) | 12 (3.1%) |
| 65 to 74 Years | 0 (0.0%) | 0 (0.0%) |
| 75 Years and over | 0 (0.0%) | 0 (0.0%) |
Technology Access in Peru
Computing Device Access in Peru
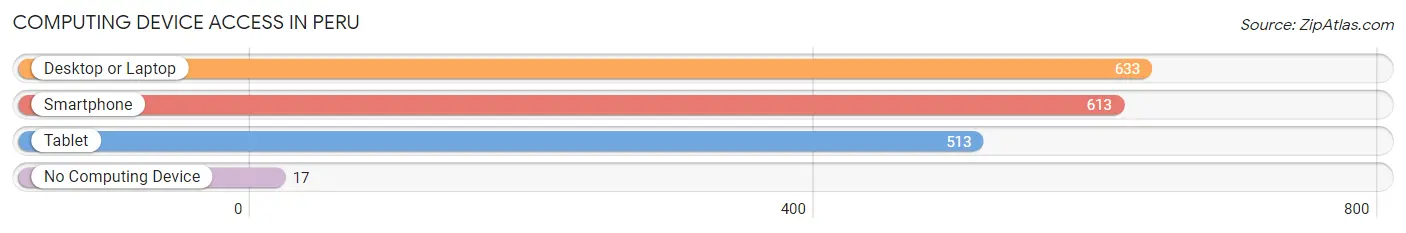
| Device Type | # Households | % Households |
| Desktop or Laptop | 633 | 92.3% |
| Smartphone | 613 | 89.4% |
| Tablet | 513 | 74.8% |
| No Computing Device | 17 | 2.5% |
| Total | 686 | 100.0% |
Internet Access in Peru
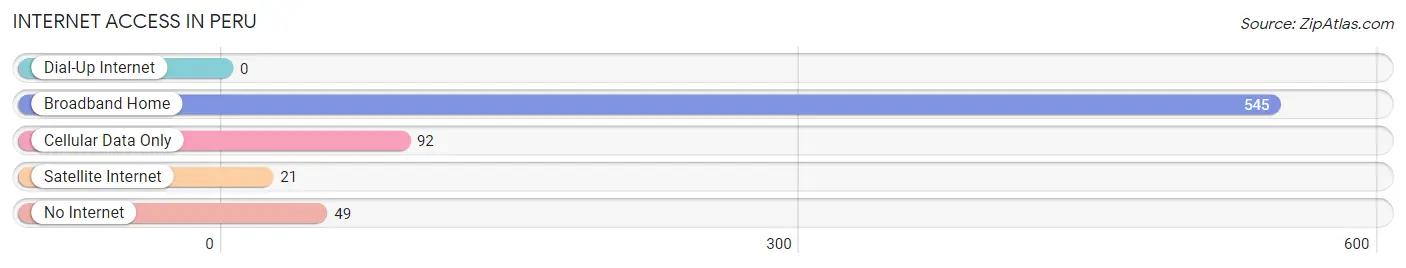
| Internet Type | # Households | % Households |
| Dial-Up Internet | 0 | 0.0% |
| Broadband Home | 545 | 79.4% |
| Cellular Data Only | 92 | 13.4% |
| Satellite Internet | 21 | 3.1% |
| No Internet | 49 | 7.1% |
| Total | 686 | 100.0% |
Peru Summary
Peru, New York is a small town located in Clinton County, in the northeastern part of the state. It is situated on the banks of the Ausable River, and is bordered by the towns of Plattsburgh, Schuyler Falls, and Beekmantown. The town has a population of approximately 3,000 people, and is home to a variety of businesses, including a number of small manufacturing companies.
History
The area that is now Peru was first settled in 1786 by a group of settlers from Connecticut. The town was originally known as “The Forks”, due to its location at the confluence of the Ausable and Saranac Rivers. In 1802, the town was officially incorporated as Peru, named after the South American country.
In the early 19th century, Peru was a thriving agricultural community, with a variety of crops being grown in the area. The town was also home to a number of small manufacturing companies, including a sawmill, a gristmill, and a tannery.
In the late 19th century, Peru began to experience a period of economic decline, as the area’s agricultural industry began to decline. The town’s population also began to decline, as many of its residents moved away in search of better economic opportunities.
Geography
Peru is located in the northeastern part of New York State, in Clinton County. It is situated on the banks of the Ausable River, and is bordered by the towns of Plattsburgh, Schuyler Falls, and Beekmantown. The town has a total area of 8.3 square miles, of which 8.2 square miles is land and 0.1 square miles is water.
The town is located in the Adirondack Mountains, and is home to a variety of natural features, including the Ausable River, the Saranac River, and several small lakes. The town is also home to a number of parks and recreational areas, including the Peru Town Park, the Peru Nature Center, and the Peru State Forest.
Economy
Peru’s economy is largely based on agriculture and manufacturing. The town is home to a number of small manufacturing companies, including a sawmill, a gristmill, and a tannery. The town is also home to a variety of small businesses, including restaurants, retail stores, and service providers.
The town is also home to a number of tourist attractions, including the Ausable Chasm, the Peru Town Park, and the Peru Nature Center. These attractions draw visitors from all over the region, and help to support the local economy.
Demographics
As of the 2010 census, the town of Peru had a population of 3,000 people. The racial makeup of the town was 97.3% White, 0.7% African American, 0.3% Native American, 0.3% Asian, and 1.3% from other races. The median household income in the town was $41,250, and the median family income was $50,000.
The town is home to a variety of religious denominations, including Catholic, Protestant, and Jewish. The town is also home to a number of educational institutions, including Peru Central School, Peru Free Library, and Peru State College.
Conclusion
Peru, New York is a small town located in Clinton County, in the northeastern part of the state. It is situated on the banks of the Ausable River, and is bordered by the towns of Plattsburgh, Schuyler Falls, and Beekmantown. The town has a population of approximately 3,000 people, and is home to a variety of businesses, including a number of small manufacturing companies. The town’s economy is largely based on agriculture and manufacturing, and it is also home to a number of tourist attractions. The town is home to a variety of religious denominations, and is also home to a number of educational institutions.
Common Questions
What is Per Capita Income in Peru?
Per Capita income in Peru is $36,189.
What is the Median Family Income in Peru?
Median Family Income in Peru is $89,479.
What is the Median Household income in Peru?
Median Household Income in Peru is $70,556.
What is Income or Wage Gap in Peru?
Income or Wage Gap in Peru is 15.0%.
Women in Peru earn 85.0 cents for every dollar earned by a man.
What is Inequality or Gini Index in Peru?
Inequality or Gini Index in Peru is 0.35.
What is the Total Population of Peru?
Total Population of Peru is 1,807.
What is the Total Male Population of Peru?
Total Male Population of Peru is 768.
What is the Total Female Population of Peru?
Total Female Population of Peru is 1,039.
What is the Ratio of Males per 100 Females in Peru?
There are 73.92 Males per 100 Females in Peru.
What is the Ratio of Females per 100 Males in Peru?
There are 135.29 Females per 100 Males in Peru.
What is the Median Population Age in Peru?
Median Population Age in Peru is 39.4 Years.
What is the Average Family Size in Peru
Average Family Size in Peru is 2.9 People.
What is the Average Household Size in Peru
Average Household Size in Peru is 2.4 People.
How Large is the Labor Force in Peru?
There are 947 People in the Labor Forcein in Peru.
What is the Percentage of People in the Labor Force in Peru?
65.6% of People are in the Labor Force in Peru.
What is the Unemployment Rate in Peru?
Unemployment Rate in Peru is 1.9%.