Pavilion, NY Map & Demographics
Pavilion Map
Pavilion Overview
$36,743
PER CAPITA INCOME
$125,395
AVG FAMILY INCOME
$87,500
AVG HOUSEHOLD INCOME
0.26
INEQUALITY / GINI INDEX
715
TOTAL POPULATION
323
MALE POPULATION
392
FEMALE POPULATION
82.40
MALES / 100 FEMALES
121.36
FEMALES / 100 MALES
43.4
MEDIAN AGE
2.8
AVG FAMILY SIZE
2.6
AVG HOUSEHOLD SIZE
452
LABOR FORCE [ PEOPLE ]
74.0%
PERCENT IN LABOR FORCE
10.2%
UNEMPLOYMENT RATE
Pavilion Zip Codes
Pavilion Area Codes
Income in Pavilion
Income Overview in Pavilion
Per Capita Income in Pavilion is $36,743, while median incomes of families and households are $125,395 and $87,500 respectively.
| Characteristic | Number | Measure |
| Per Capita Income | 715 | $36,743 |
| Median Family Income | 156 | $125,395 |
| Mean Family Income | 156 | $118,906 |
| Median Household Income | 274 | $87,500 |
| Mean Household Income | 274 | $97,364 |
| Income Deficit | 156 | $0 |
| Wage / Income Gap (%) | 715 | 0.00% |
| Wage / Income Gap ($) | 715 | 100.00¢ per $1 |
| Gini / Inequality Index | 715 | 0.26 |
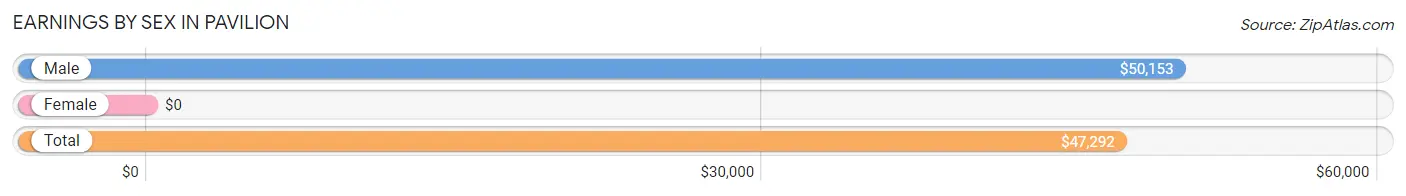
Earnings by Sex in Pavilion
| Sex | Number | Average Earnings |
| Male | 262 (58.4%) | $50,153 |
| Female | 187 (41.6%) | $0 |
| Total | 449 (100.0%) | $47,292 |
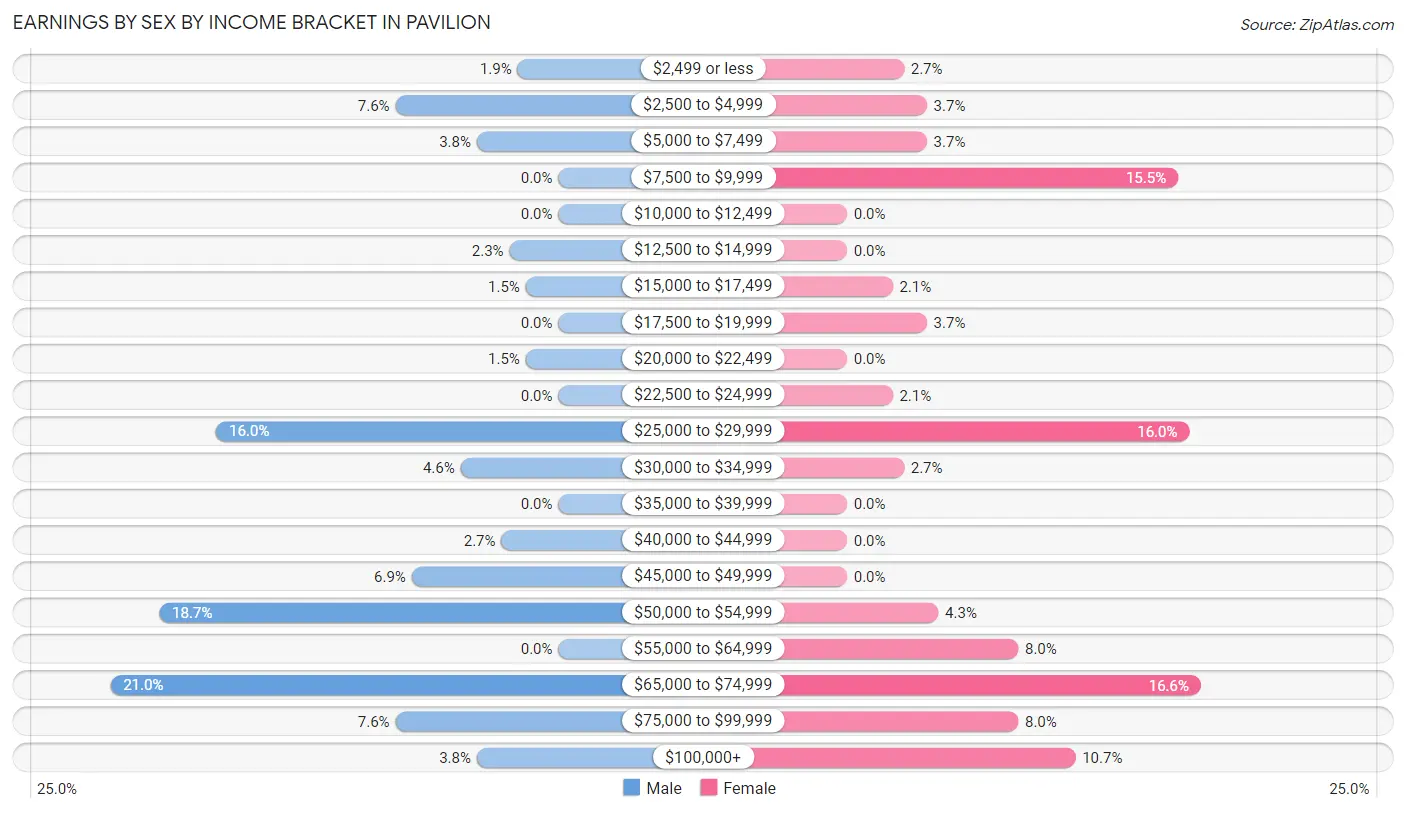
Earnings by Sex by Income Bracket in Pavilion
The most common earnings brackets in Pavilion are $65,000 to $74,999 for men (55 | 21.0%) and $65,000 to $74,999 for women (31 | 16.6%).
| Income | Male | Female |
| $2,499 or less | 5 (1.9%) | 5 (2.7%) |
| $2,500 to $4,999 | 20 (7.6%) | 7 (3.7%) |
| $5,000 to $7,499 | 10 (3.8%) | 7 (3.7%) |
| $7,500 to $9,999 | 0 (0.0%) | 29 (15.5%) |
| $10,000 to $12,499 | 0 (0.0%) | 0 (0.0%) |
| $12,500 to $14,999 | 6 (2.3%) | 0 (0.0%) |
| $15,000 to $17,499 | 4 (1.5%) | 4 (2.1%) |
| $17,500 to $19,999 | 0 (0.0%) | 7 (3.7%) |
| $20,000 to $22,499 | 4 (1.5%) | 0 (0.0%) |
| $22,500 to $24,999 | 0 (0.0%) | 4 (2.1%) |
| $25,000 to $29,999 | 42 (16.0%) | 30 (16.0%) |
| $30,000 to $34,999 | 12 (4.6%) | 5 (2.7%) |
| $35,000 to $39,999 | 0 (0.0%) | 0 (0.0%) |
| $40,000 to $44,999 | 7 (2.7%) | 0 (0.0%) |
| $45,000 to $49,999 | 18 (6.9%) | 0 (0.0%) |
| $50,000 to $54,999 | 49 (18.7%) | 8 (4.3%) |
| $55,000 to $64,999 | 0 (0.0%) | 15 (8.0%) |
| $65,000 to $74,999 | 55 (21.0%) | 31 (16.6%) |
| $75,000 to $99,999 | 20 (7.6%) | 15 (8.0%) |
| $100,000+ | 10 (3.8%) | 20 (10.7%) |
| Total | 262 (100.0%) | 187 (100.0%) |
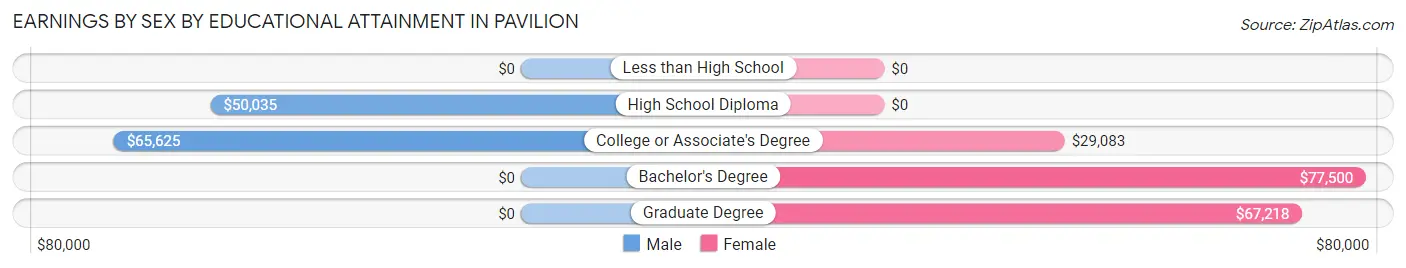
Earnings by Sex by Educational Attainment in Pavilion
Average earnings in Pavilion are $52,117 for men and $57,000 for women, a difference of 8.6%. Men with an educational attainment of college or associate's degree enjoy the highest average annual earnings of $65,625, while those with high school diploma education earn the least with $50,035. Women with an educational attainment of bachelor's degree earn the most with the average annual earnings of $77,500, while those with college or associate's degree education have the smallest earnings of $29,083.
| Educational Attainment | Male Income | Female Income |
| Less than High School | - | - |
| High School Diploma | $50,035 | $0 |
| College or Associate's Degree | $65,625 | $29,083 |
| Bachelor's Degree | - | - |
| Graduate Degree | - | - |
| Total | $52,117 | $57,000 |
Family Income in Pavilion
Family Income Brackets in Pavilion
According to the Pavilion family income data, there are 69 families falling into the $100,000 to $149,999 income range, which is the most common income bracket and makes up 44.2% of all families.
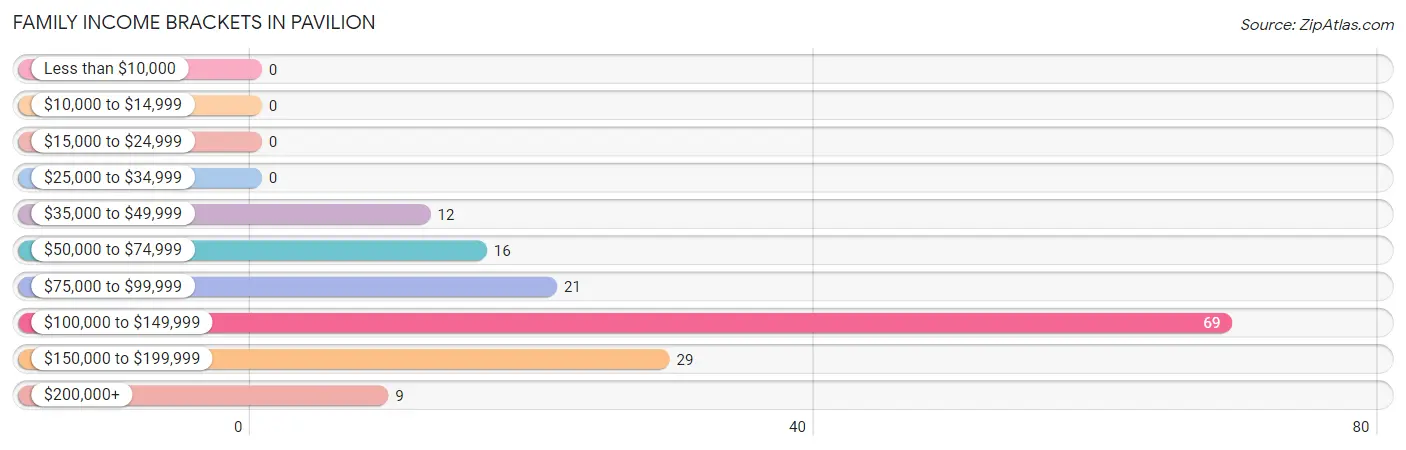
| Income Bracket | # Families | % Families |
| Less than $10,000 | 0 | 0.0% |
| $10,000 to $14,999 | 0 | 0.0% |
| $15,000 to $24,999 | 0 | 0.0% |
| $25,000 to $34,999 | 0 | 0.0% |
| $35,000 to $49,999 | 12 | 7.7% |
| $50,000 to $74,999 | 16 | 10.3% |
| $75,000 to $99,999 | 21 | 13.5% |
| $100,000 to $149,999 | 69 | 44.2% |
| $150,000 to $199,999 | 29 | 18.6% |
| $200,000+ | 9 | 5.8% |
Family Income by Famaliy Size in Pavilion
5-person families (15 | 9.6%) account for the highest median family income in Pavilion with $144,219 per family, while 2-person families (77 | 49.4%) have the highest median income of $62,615 per family member.
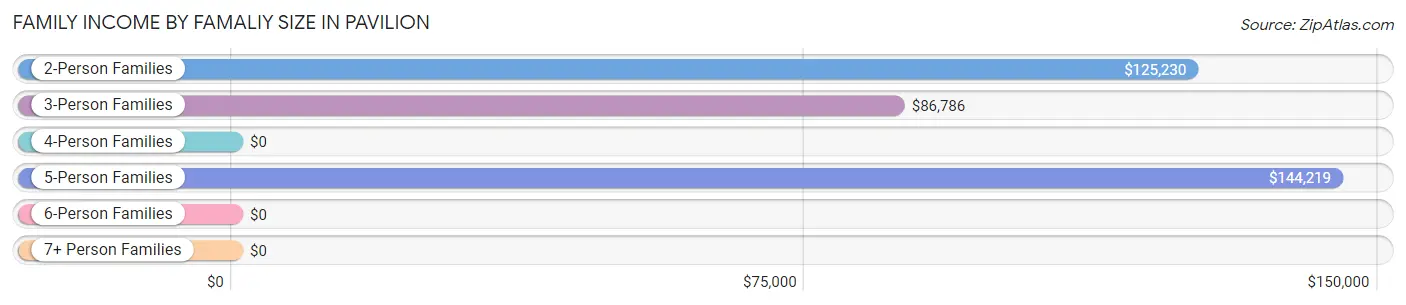
| Income Bracket | # Families | Median Income |
| 2-Person Families | 77 (49.4%) | $125,230 |
| 3-Person Families | 44 (28.2%) | $86,786 |
| 4-Person Families | 20 (12.8%) | $0 |
| 5-Person Families | 15 (9.6%) | $144,219 |
| 6-Person Families | 0 (0.0%) | $0 |
| 7+ Person Families | 0 (0.0%) | $0 |
| Total | 156 (100.0%) | $125,395 |
Family Income by Number of Earners in Pavilion
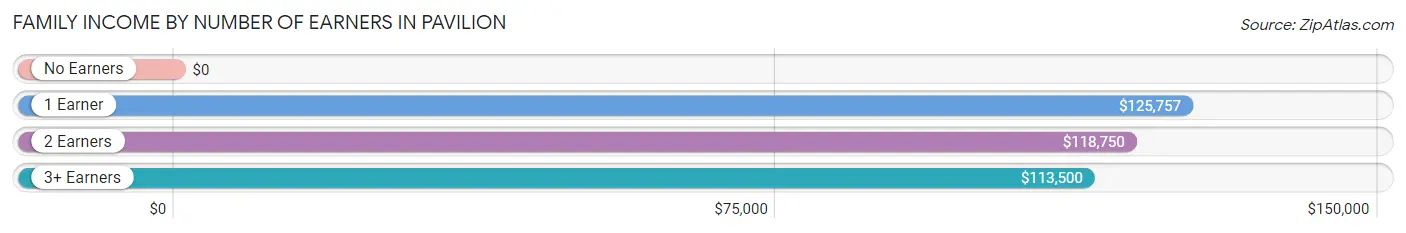
| Number of Earners | # Families | Median Income |
| No Earners | 2 (1.3%) | $0 |
| 1 Earner | 53 (34.0%) | $125,757 |
| 2 Earners | 55 (35.3%) | $118,750 |
| 3+ Earners | 46 (29.5%) | $113,500 |
| Total | 156 (100.0%) | $125,395 |
Household Income in Pavilion
Household Income Brackets in Pavilion
With 90 households falling in the category, the $100,000 to $149,999 income range is the most frequent in Pavilion, accounting for 32.9% of all households.
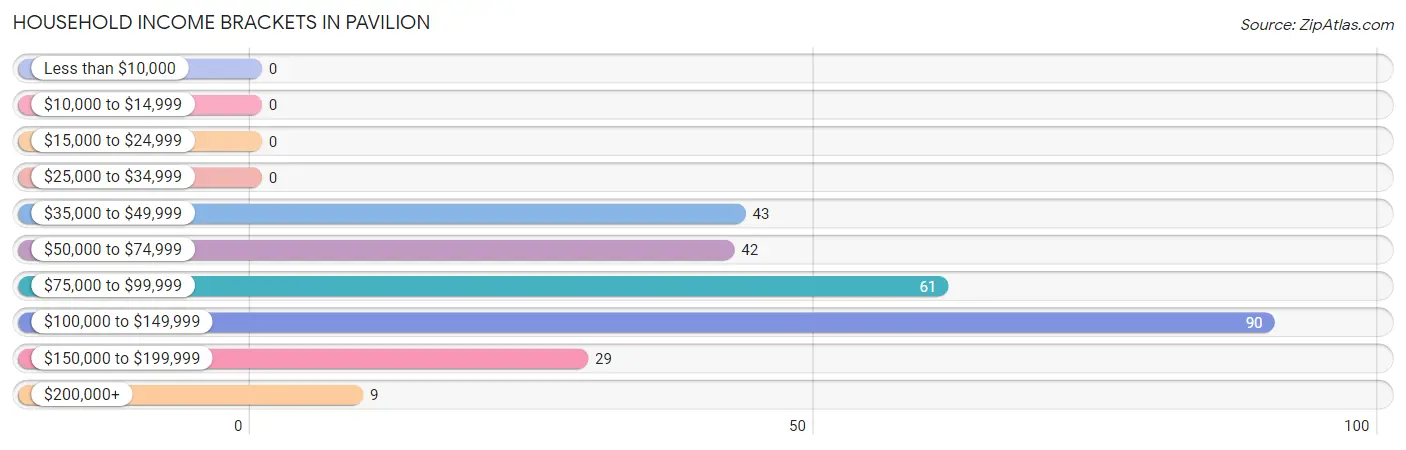
| Income Bracket | # Households | % Households |
| Less than $10,000 | 0 | 0.0% |
| $10,000 to $14,999 | 0 | 0.0% |
| $15,000 to $24,999 | 0 | 0.0% |
| $25,000 to $34,999 | 0 | 0.0% |
| $35,000 to $49,999 | 43 | 15.7% |
| $50,000 to $74,999 | 42 | 15.3% |
| $75,000 to $99,999 | 61 | 22.3% |
| $100,000 to $149,999 | 90 | 32.8% |
| $150,000 to $199,999 | 29 | 10.6% |
| $200,000+ | 9 | 3.3% |
Household Income by Householder Age in Pavilion
The median household income in Pavilion is $87,500, with the highest median household income of $113,571 found in the 25 to 44 years age bracket for the primary householder. A total of 64 households (23.4%) fall into this category. Meanwhile, the 15 to 24 years age bracket for the primary householder has the lowest median household income of $0, with 26 households (9.5%) in this group.
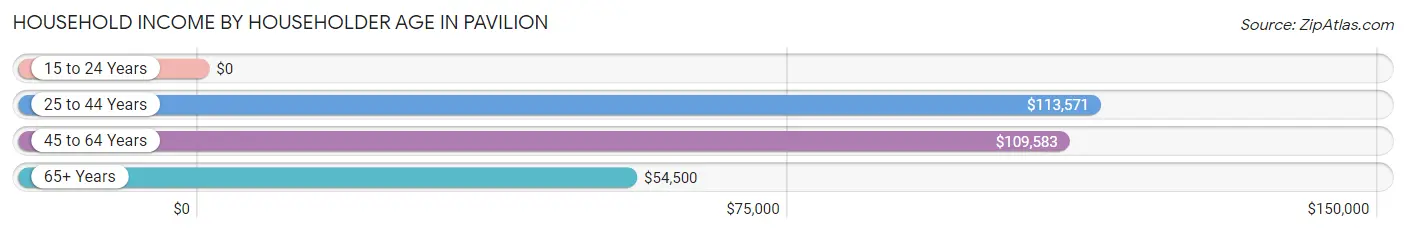
| Income Bracket | # Households | Median Income |
| 15 to 24 Years | 26 (9.5%) | $0 |
| 25 to 44 Years | 64 (23.4%) | $113,571 |
| 45 to 64 Years | 146 (53.3%) | $109,583 |
| 65+ Years | 38 (13.9%) | $54,500 |
| Total | 274 (100.0%) | $87,500 |
Poverty in Pavilion
Income Below Poverty by Sex and Age in Pavilion
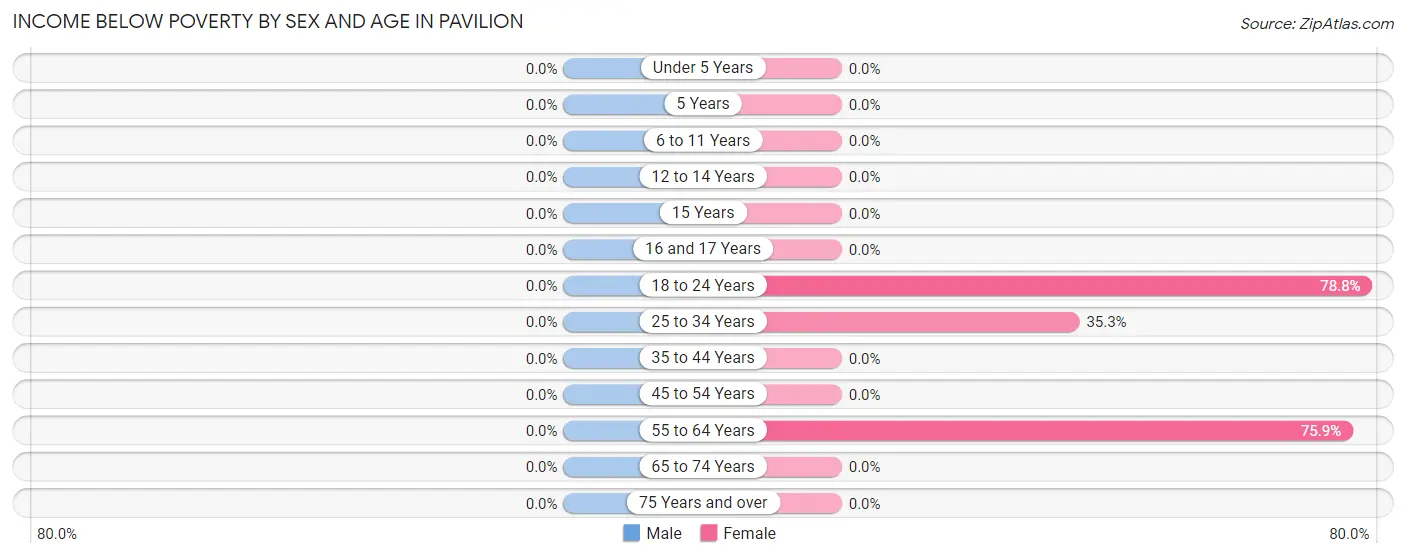
| Age Bracket | Male | Female |
| Under 5 Years | 0 (0.0%) | 0 (0.0%) |
| 5 Years | 0 (0.0%) | 0 (0.0%) |
| 6 to 11 Years | 0 (0.0%) | 0 (0.0%) |
| 12 to 14 Years | 0 (0.0%) | 0 (0.0%) |
| 15 Years | 0 (0.0%) | 0 (0.0%) |
| 16 and 17 Years | 0 (0.0%) | 0 (0.0%) |
| 18 to 24 Years | 0 (0.0%) | 26 (78.8%) |
| 25 to 34 Years | 0 (0.0%) | 6 (35.3%) |
| 35 to 44 Years | 0 (0.0%) | 0 (0.0%) |
| 45 to 54 Years | 0 (0.0%) | 0 (0.0%) |
| 55 to 64 Years | 0 (0.0%) | 63 (75.9%) |
| 65 to 74 Years | 0 (0.0%) | 0 (0.0%) |
| 75 Years and over | 0 (0.0%) | 0 (0.0%) |
| Total | 0 (0.0%) | 95 (27.0%) |
Income Above Poverty by Sex and Age in Pavilion
According to the poverty statistics in Pavilion, males aged under 5 years and females aged under 5 years are the age groups that are most secure financially, with 100.0% of males and 100.0% of females in these age groups living above the poverty line.
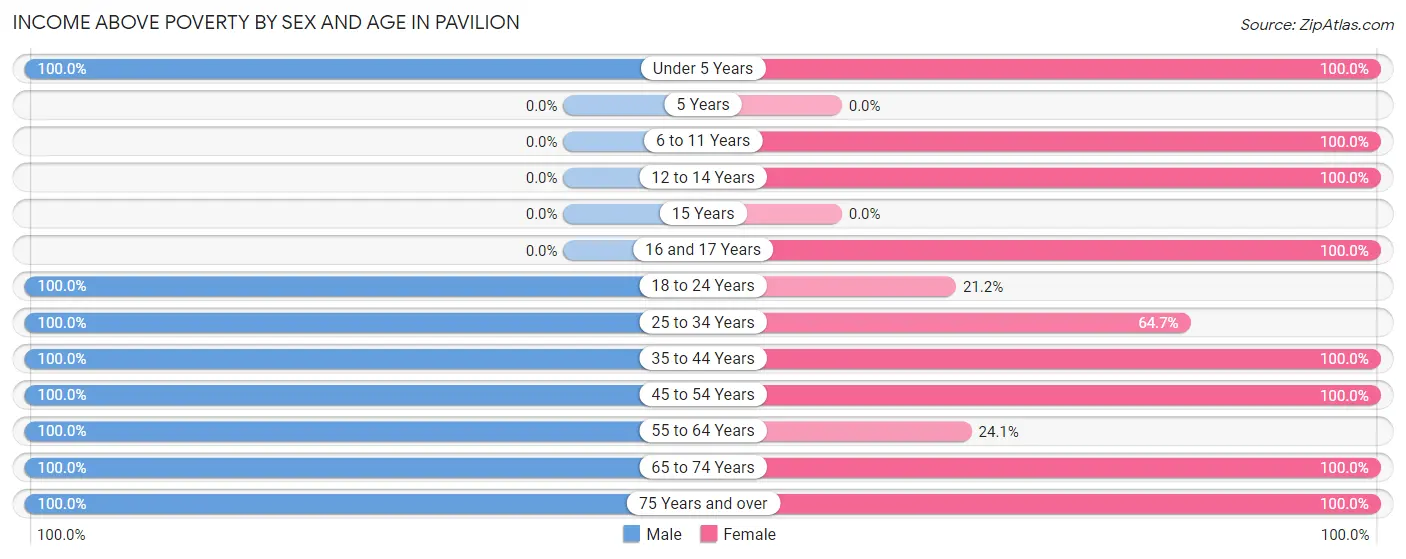
| Age Bracket | Male | Female |
| Under 5 Years | 17 (100.0%) | 27 (100.0%) |
| 5 Years | 0 (0.0%) | 0 (0.0%) |
| 6 to 11 Years | 0 (0.0%) | 7 (100.0%) |
| 12 to 14 Years | 0 (0.0%) | 13 (100.0%) |
| 15 Years | 0 (0.0%) | 0 (0.0%) |
| 16 and 17 Years | 0 (0.0%) | 8 (100.0%) |
| 18 to 24 Years | 77 (100.0%) | 7 (21.2%) |
| 25 to 34 Years | 39 (100.0%) | 11 (64.7%) |
| 35 to 44 Years | 36 (100.0%) | 77 (100.0%) |
| 45 to 54 Years | 36 (100.0%) | 36 (100.0%) |
| 55 to 64 Years | 108 (100.0%) | 20 (24.1%) |
| 65 to 74 Years | 5 (100.0%) | 38 (100.0%) |
| 75 Years and over | 5 (100.0%) | 13 (100.0%) |
| Total | 323 (100.0%) | 257 (73.0%) |
Income Below Poverty Among Married-Couple Families in Pavilion
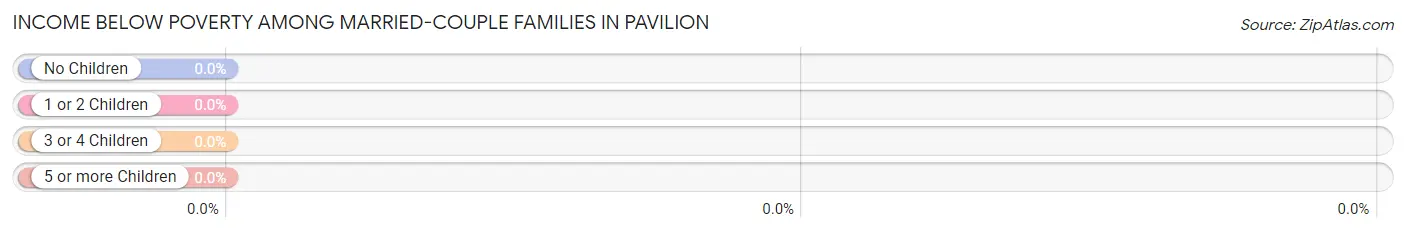
| Children | Above Poverty | Below Poverty |
| No Children | 93 (100.0%) | 0 (0.0%) |
| 1 or 2 Children | 27 (100.0%) | 0 (0.0%) |
| 3 or 4 Children | 0 (0.0%) | 0 (0.0%) |
| 5 or more Children | 0 (0.0%) | 0 (0.0%) |
| Total | 120 (100.0%) | 0 (0.0%) |
Income Below Poverty Among Single-Parent Households in Pavilion
| Children | Single Father | Single Mother |
| No Children | 0 (0.0%) | 0 (0.0%) |
| 1 or 2 Children | 0 (0.0%) | 0 (0.0%) |
| 3 or 4 Children | 0 (0.0%) | 0 (0.0%) |
| 5 or more Children | 0 (0.0%) | 0 (0.0%) |
| Total | 0 (0.0%) | 0 (0.0%) |
Income Below Poverty Among Married-Couple vs Single-Parent Households in Pavilion
| Children | Married-Couple Families | Single-Parent Households |
| No Children | 0 (0.0%) | 0 (0.0%) |
| 1 or 2 Children | 0 (0.0%) | 0 (0.0%) |
| 3 or 4 Children | 0 (0.0%) | 0 (0.0%) |
| 5 or more Children | 0 (0.0%) | 0 (0.0%) |
| Total | 0 (0.0%) | 0 (0.0%) |
Race in Pavilion
The most populous races in Pavilion are White / Caucasian (702 | 98.2%), and Black / African American (13 | 1.8%).
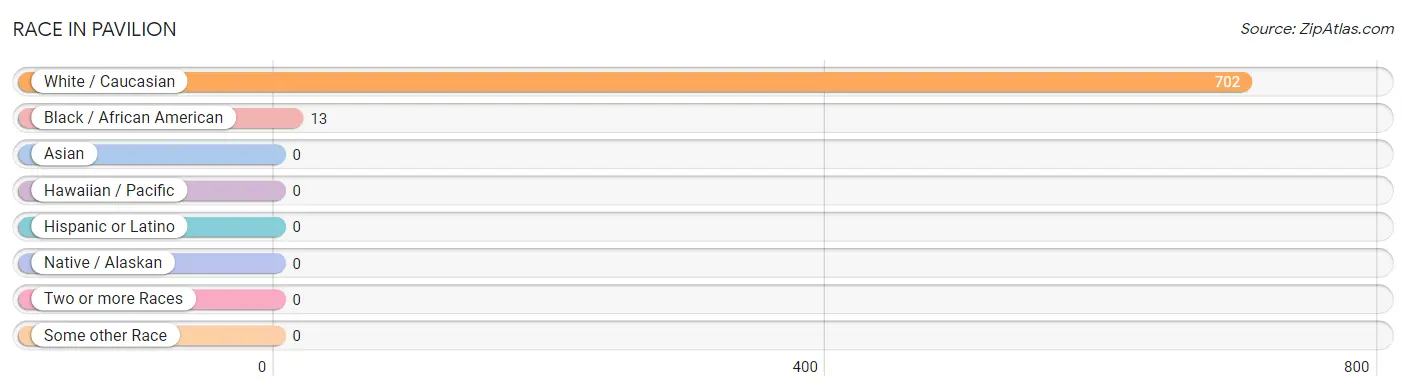
| Race | # Population | % Population |
| Asian | 0 | 0.0% |
| Black / African American | 13 | 1.8% |
| Hawaiian / Pacific | 0 | 0.0% |
| Hispanic or Latino | 0 | 0.0% |
| Native / Alaskan | 0 | 0.0% |
| White / Caucasian | 702 | 98.2% |
| Two or more Races | 0 | 0.0% |
| Some other Race | 0 | 0.0% |
| Total | 715 | 100.0% |
Ancestry in Pavilion
The most populous ancestries reported in Pavilion are German (219 | 30.6%), Irish (193 | 27.0%), English (190 | 26.6%), Italian (162 | 22.7%), and Polish (35 | 4.9%), together accounting for 111.7% of all Pavilion residents.
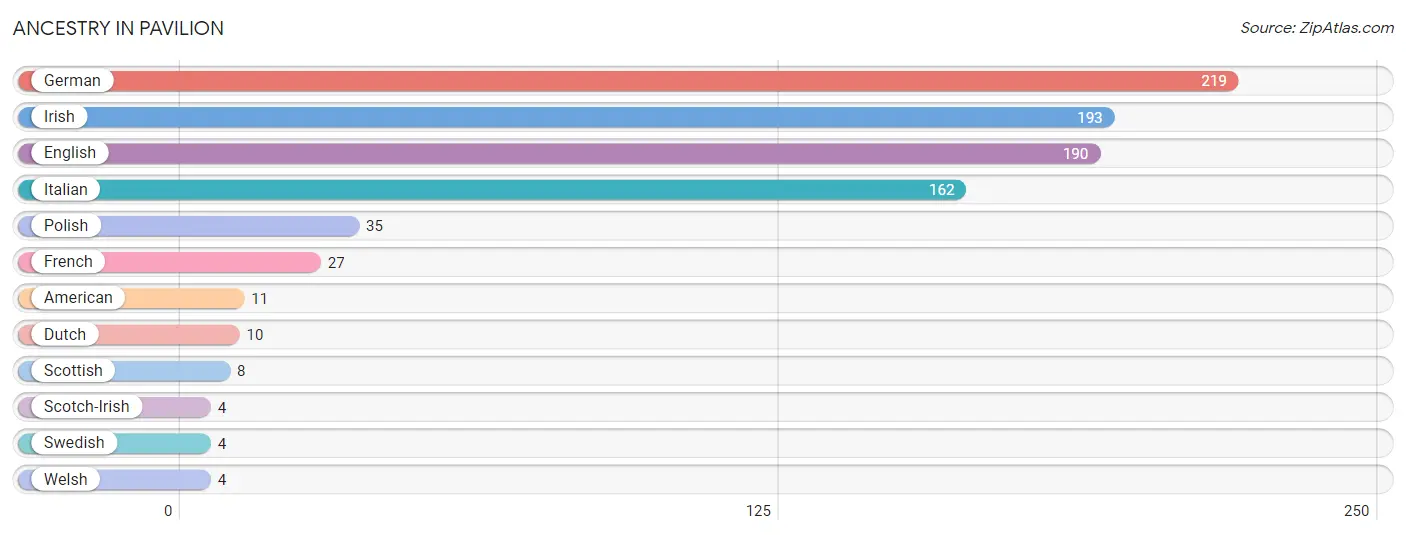
| Ancestry | # Population | % Population |
| American | 11 | 1.5% |
| Dutch | 10 | 1.4% |
| English | 190 | 26.6% |
| French | 27 | 3.8% |
| German | 219 | 30.6% |
| Irish | 193 | 27.0% |
| Italian | 162 | 22.7% |
| Polish | 35 | 4.9% |
| Scotch-Irish | 4 | 0.6% |
| Scottish | 8 | 1.1% |
| Swedish | 4 | 0.6% |
| Welsh | 4 | 0.6% | View All 12 Rows |
Immigrants in Pavilion
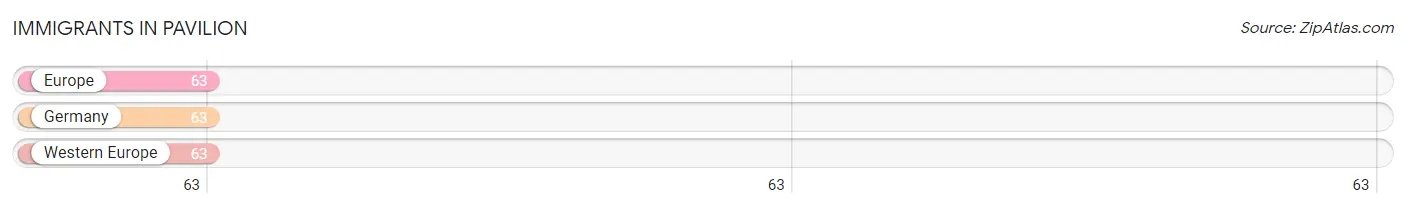
The most numerous immigrant groups reported in Pavilion came from Europe (63 | 8.8%), Germany (63 | 8.8%), and Western Europe (63 | 8.8%), together accounting for 26.4% of all Pavilion residents.
| Immigration Origin | # Population | % Population |
| Europe | 63 | 8.8% |
| Germany | 63 | 8.8% |
| Western Europe | 63 | 8.8% | View All 3 Rows |
Sex and Age in Pavilion
Sex and Age in Pavilion
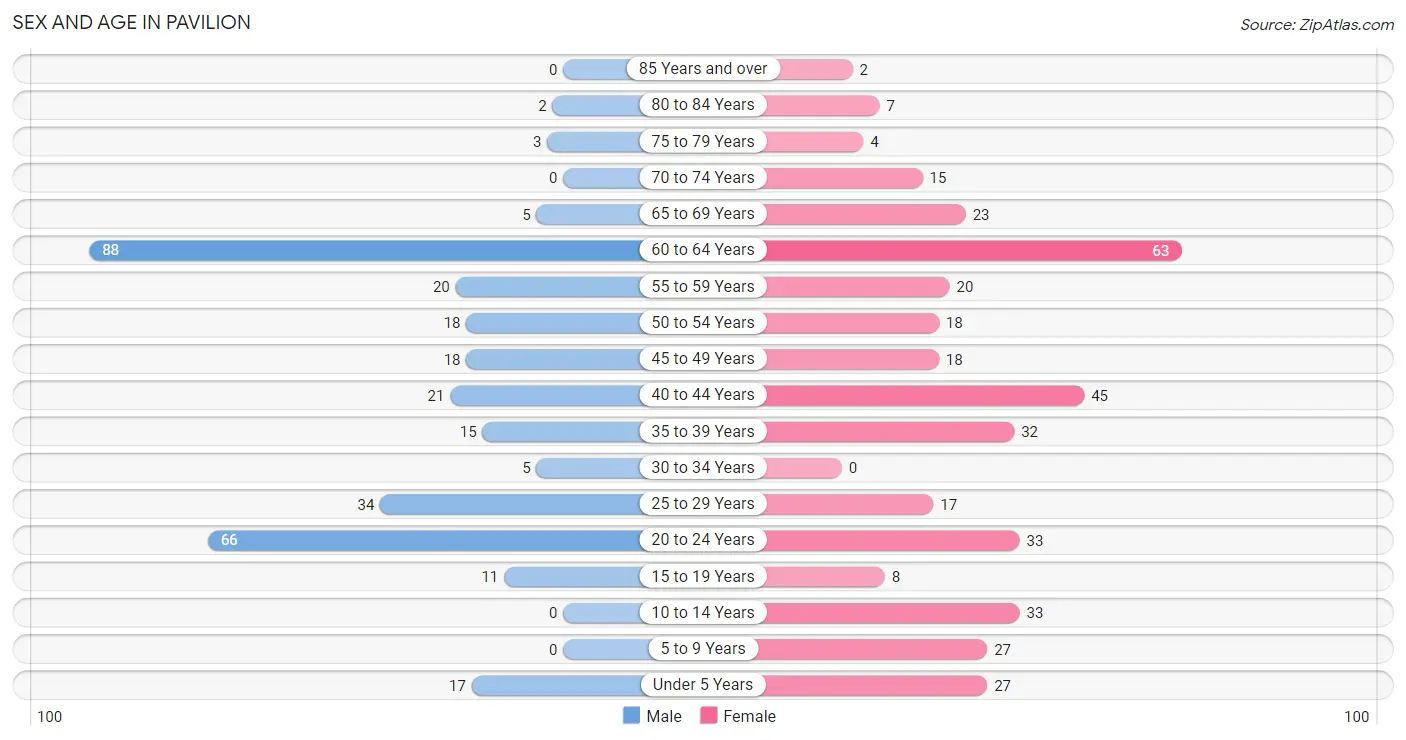
The most populous age groups in Pavilion are 60 to 64 Years (88 | 27.2%) for men and 60 to 64 Years (63 | 16.1%) for women.
| Age Bracket | Male | Female |
| Under 5 Years | 17 (5.3%) | 27 (6.9%) |
| 5 to 9 Years | 0 (0.0%) | 27 (6.9%) |
| 10 to 14 Years | 0 (0.0%) | 33 (8.4%) |
| 15 to 19 Years | 11 (3.4%) | 8 (2.0%) |
| 20 to 24 Years | 66 (20.4%) | 33 (8.4%) |
| 25 to 29 Years | 34 (10.5%) | 17 (4.3%) |
| 30 to 34 Years | 5 (1.5%) | 0 (0.0%) |
| 35 to 39 Years | 15 (4.6%) | 32 (8.2%) |
| 40 to 44 Years | 21 (6.5%) | 45 (11.5%) |
| 45 to 49 Years | 18 (5.6%) | 18 (4.6%) |
| 50 to 54 Years | 18 (5.6%) | 18 (4.6%) |
| 55 to 59 Years | 20 (6.2%) | 20 (5.1%) |
| 60 to 64 Years | 88 (27.2%) | 63 (16.1%) |
| 65 to 69 Years | 5 (1.5%) | 23 (5.9%) |
| 70 to 74 Years | 0 (0.0%) | 15 (3.8%) |
| 75 to 79 Years | 3 (0.9%) | 4 (1.0%) |
| 80 to 84 Years | 2 (0.6%) | 7 (1.8%) |
| 85 Years and over | 0 (0.0%) | 2 (0.5%) |
| Total | 323 (100.0%) | 392 (100.0%) |
Families and Households in Pavilion
Median Family Size in Pavilion
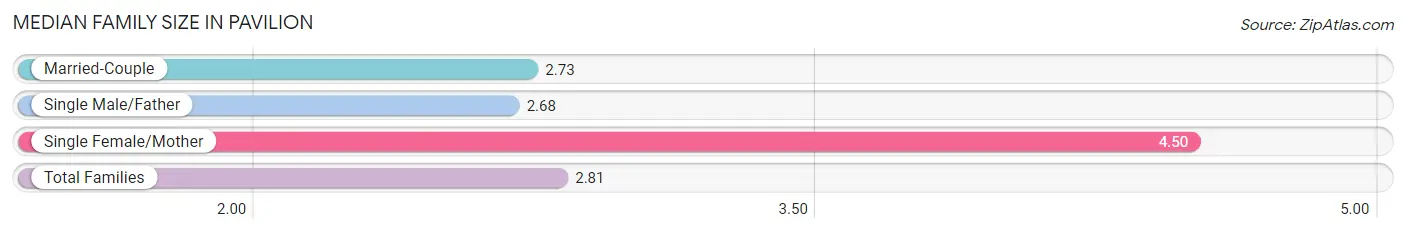
The median family size in Pavilion is 2.81 persons per family, with single female/mother families (8 | 5.1%) accounting for the largest median family size of 4.5 persons per family. On the other hand, single male/father families (28 | 17.9%) represent the smallest median family size with 2.68 persons per family.
| Family Type | # Families | Family Size |
| Married-Couple | 120 (76.9%) | 2.73 |
| Single Male/Father | 28 (17.9%) | 2.68 |
| Single Female/Mother | 8 (5.1%) | 4.50 |
| Total Families | 156 (100.0%) | 2.81 |
Median Household Size in Pavilion
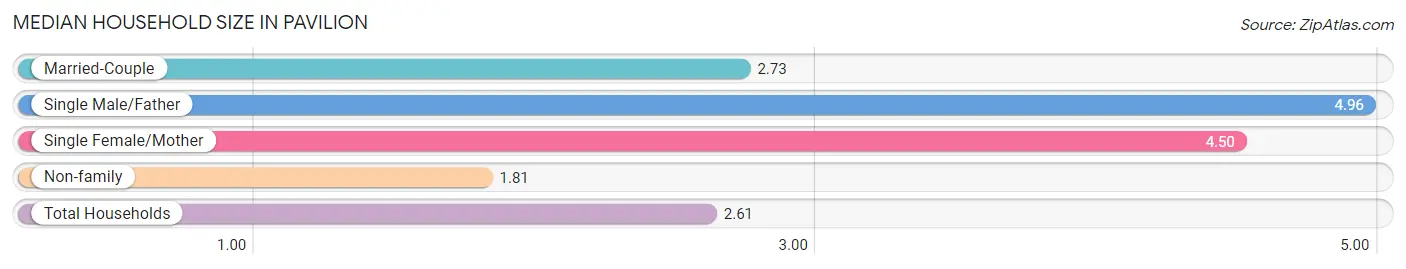
The median household size in Pavilion is 2.61 persons per household, with single male/father households (28 | 10.2%) accounting for the largest median household size of 4.96 persons per household. non-family households (118 | 43.1%) represent the smallest median household size with 1.81 persons per household.
| Household Type | # Households | Household Size |
| Married-Couple | 120 (43.8%) | 2.73 |
| Single Male/Father | 28 (10.2%) | 4.96 |
| Single Female/Mother | 8 (2.9%) | 4.50 |
| Non-family | 118 (43.1%) | 1.81 |
| Total Households | 274 (100.0%) | 2.61 |
Household Size by Marriage Status in Pavilion
Out of a total of 274 households in Pavilion, 156 (56.9%) are family households, while 118 (43.1%) are nonfamily households. The most numerous type of family households are 2-person households, comprising 70, and the most common type of nonfamily households are 2-person households, comprising 82.
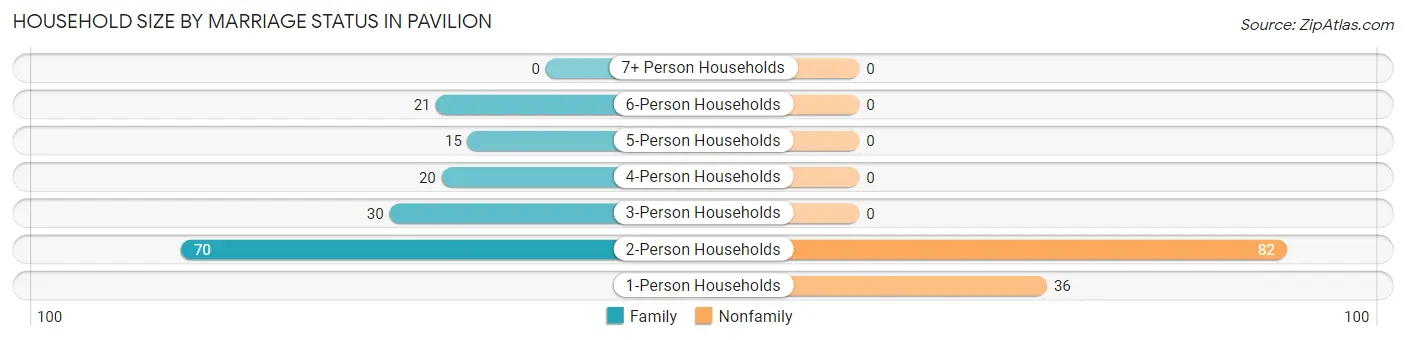
| Household Size | Family Households | Nonfamily Households |
| 1-Person Households | - | 36 (13.1%) |
| 2-Person Households | 70 (25.6%) | 82 (29.9%) |
| 3-Person Households | 30 (11.0%) | 0 (0.0%) |
| 4-Person Households | 20 (7.3%) | 0 (0.0%) |
| 5-Person Households | 15 (5.5%) | 0 (0.0%) |
| 6-Person Households | 21 (7.7%) | 0 (0.0%) |
| 7+ Person Households | 0 (0.0%) | 0 (0.0%) |
| Total | 156 (56.9%) | 118 (43.1%) |
Female Fertility in Pavilion
Fertility by Age in Pavilion
| Age Bracket | Women with Births | Births / 1,000 Women |
| 15 to 19 years | 0 (0.0%) | 0.0 |
| 20 to 34 years | 0 (0.0%) | 0.0 |
| 35 to 50 years | 0 (0.0%) | 0.0 |
| Total | 0 (0.0%) | 0.0 |
Fertility by Age by Marriage Status in Pavilion
| Age Bracket | Married | Unmarried |
| 15 to 19 years | 0 (0.0%) | 0 (0.0%) |
| 20 to 34 years | 0 (0.0%) | 0 (0.0%) |
| 35 to 50 years | 0 (0.0%) | 0 (0.0%) |
| Total | 0 (0.0%) | 0 (0.0%) |
Fertility by Education in Pavilion
| Educational Attainment | Women with Births | Births / 1,000 Women |
| Less than High School | 0 (0.0%) | 0.0 |
| High School Diploma | 0 (0.0%) | 0.0 |
| College or Associate's Degree | 0 (0.0%) | 0.0 |
| Bachelor's Degree | 0 (0.0%) | 0.0 |
| Graduate Degree | 0 (0.0%) | 0.0 |
| Total | 0 (0.0%) | 0.0 |
Fertility by Education by Marriage Status in Pavilion
| Educational Attainment | Married | Unmarried |
| Less than High School | 0 (0.0%) | 0 (0.0%) |
| High School Diploma | 0 (0.0%) | 0 (0.0%) |
| College or Associate's Degree | 0 (0.0%) | 0 (0.0%) |
| Bachelor's Degree | 0 (0.0%) | 0 (0.0%) |
| Graduate Degree | 0 (0.0%) | 0 (0.0%) |
| Total | 0 (0.0%) | 0 (0.0%) |
Employment Characteristics in Pavilion
Employment by Class of Employer in Pavilion
Among the 406 employed individuals in Pavilion, private company employees (248 | 61.1%), not-for-profit organizations (65 | 16.0%), and local government employees (52 | 12.8%) make up the most common classes of employment.
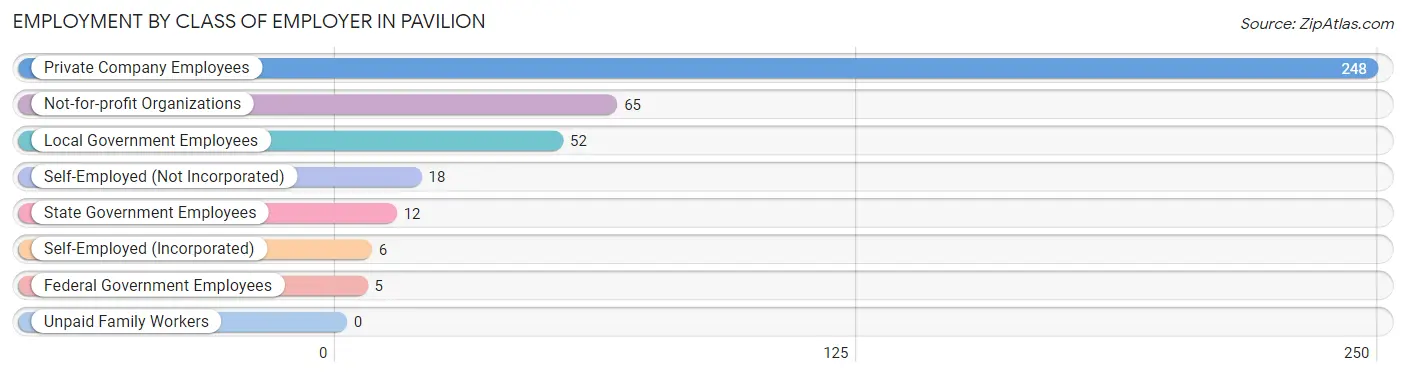
| Employer Class | # Employees | % Employees |
| Private Company Employees | 248 | 61.1% |
| Self-Employed (Incorporated) | 6 | 1.5% |
| Self-Employed (Not Incorporated) | 18 | 4.4% |
| Not-for-profit Organizations | 65 | 16.0% |
| Local Government Employees | 52 | 12.8% |
| State Government Employees | 12 | 3.0% |
| Federal Government Employees | 5 | 1.2% |
| Unpaid Family Workers | 0 | 0.0% |
| Total | 406 | 100.0% |
Employment Status by Age in Pavilion
According to the labor force statistics for Pavilion, out of the total population over 16 years of age (611), 74.0% or 452 individuals are in the labor force, with 10.2% or 46 of them unemployed. The age group with the highest labor force participation rate is 16 to 19 years, with 100.0% or 19 individuals in the labor force. Within the labor force, the 16 to 19 years age range has the highest percentage of unemployed individuals, with 42.1% or 8 of them being unemployed.
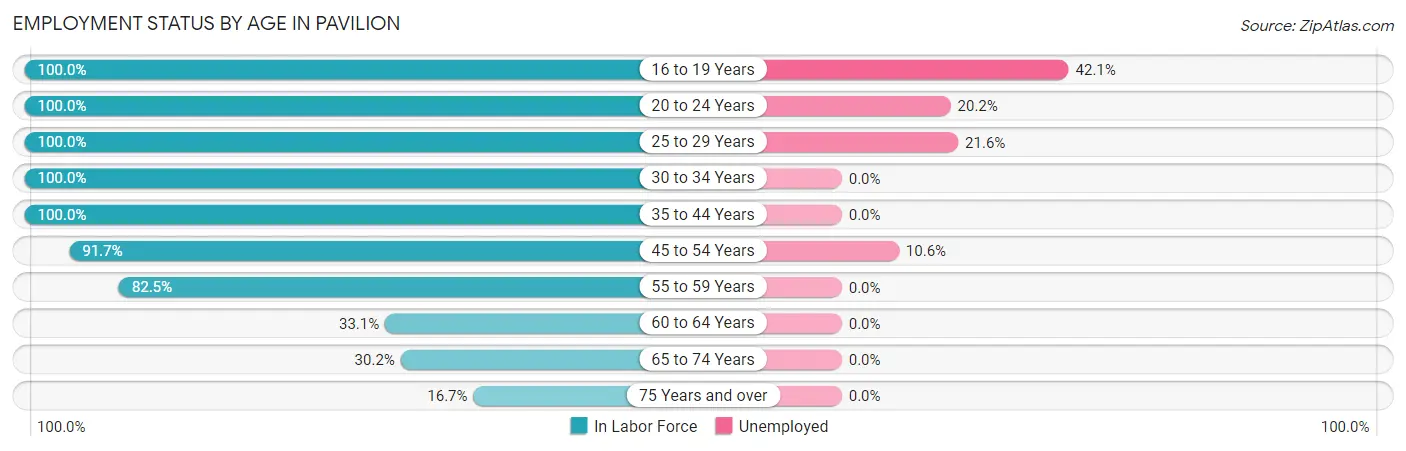
| Age Bracket | In Labor Force | Unemployed |
| 16 to 19 Years | 19 (100.0%) | 8 (42.1%) |
| 20 to 24 Years | 99 (100.0%) | 20 (20.2%) |
| 25 to 29 Years | 51 (100.0%) | 11 (21.6%) |
| 30 to 34 Years | 5 (100.0%) | 0 (0.0%) |
| 35 to 44 Years | 113 (100.0%) | 0 (0.0%) |
| 45 to 54 Years | 66 (91.7%) | 7 (10.6%) |
| 55 to 59 Years | 33 (82.5%) | 0 (0.0%) |
| 60 to 64 Years | 50 (33.1%) | 0 (0.0%) |
| 65 to 74 Years | 13 (30.2%) | 0 (0.0%) |
| 75 Years and over | 3 (16.7%) | 0 (0.0%) |
| Total | 452 (74.0%) | 46 (10.2%) |
Employment Status by Educational Attainment in Pavilion
According to labor force statistics for Pavilion, 73.6% of individuals (318) out of the total population between 25 and 64 years of age (432) are in the labor force, with 5.7% or 18 of them being unemployed. The group with the highest labor force participation rate are those with the educational attainment of bachelor's degree or higher, with 100.0% or 120 individuals in the labor force. Within the labor force, individuals with high school diploma education have the highest percentage of unemployment, with 10.6% or 11 of them being unemployed.
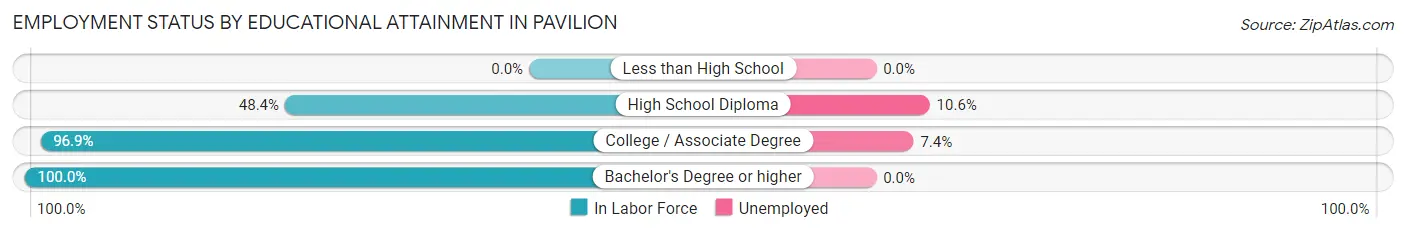
| Educational Attainment | In Labor Force | Unemployed |
| Less than High School | 0 (0.0%) | 0 (0.0%) |
| High School Diploma | 104 (48.4%) | 23 (10.6%) |
| College / Associate Degree | 94 (96.9%) | 7 (7.4%) |
| Bachelor's Degree or higher | 120 (100.0%) | 0 (0.0%) |
| Total | 318 (73.6%) | 25 (5.7%) |
Employment Occupations by Sex in Pavilion
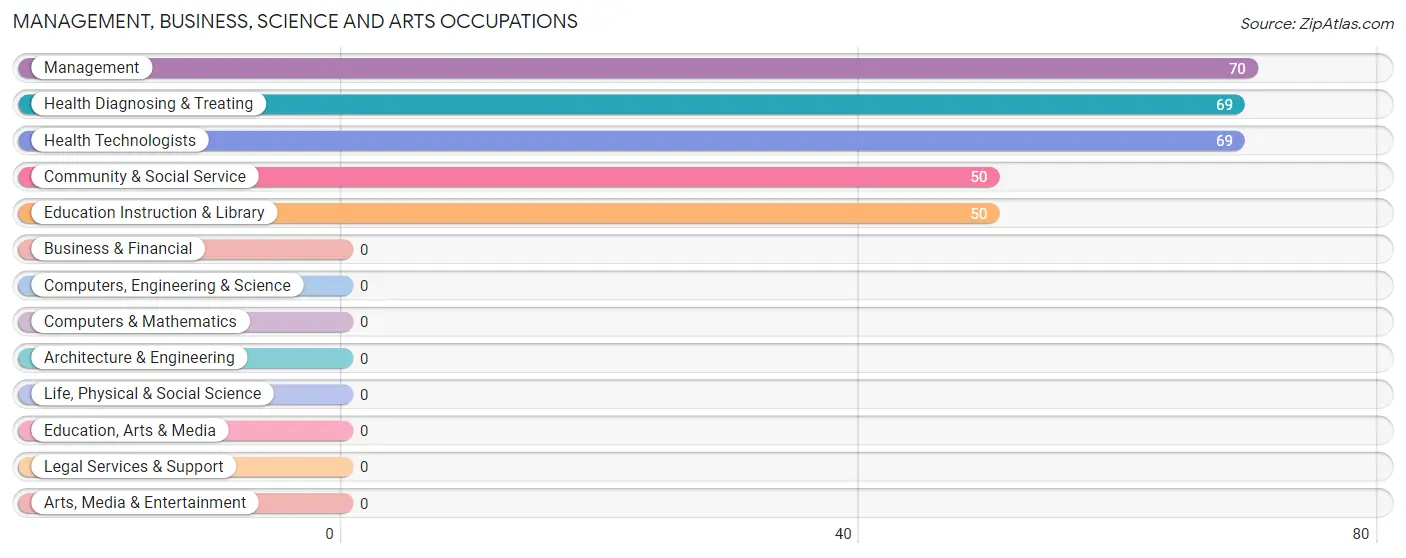
Management, Business, Science and Arts Occupations
The most common Management, Business, Science and Arts occupations in Pavilion are Management (70 | 17.2%), Health Diagnosing & Treating (69 | 17.0%), Health Technologists (69 | 17.0%), Community & Social Service (50 | 12.3%), and Education Instruction & Library (50 | 12.3%).
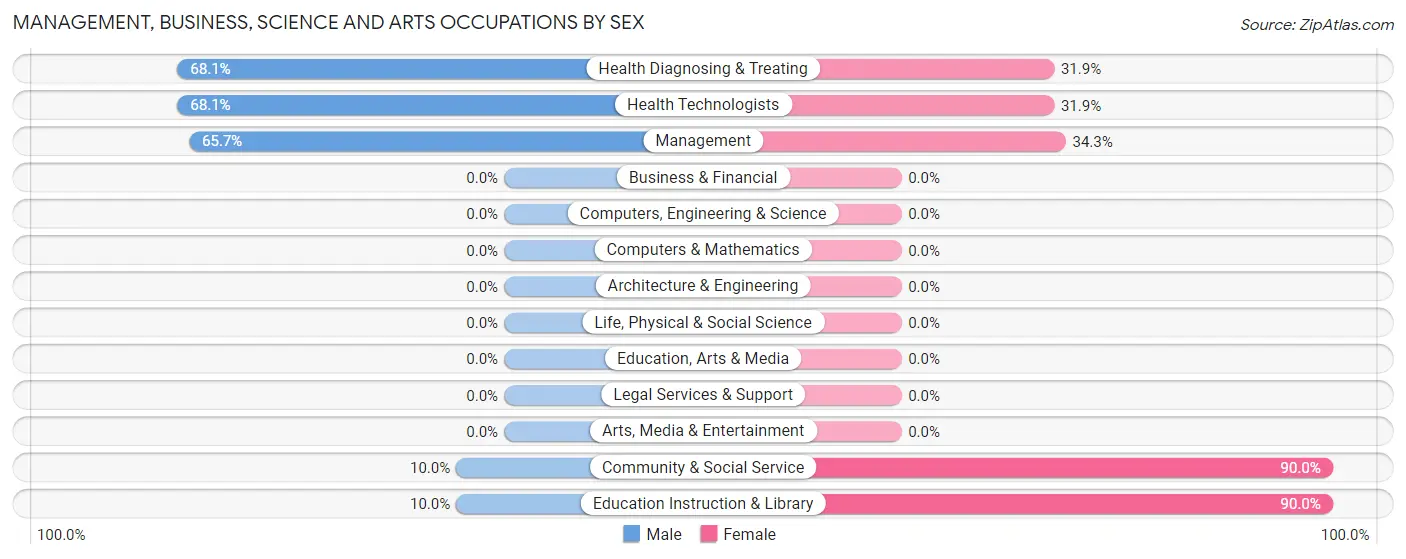
Management, Business, Science and Arts Occupations by Sex
Within the Management, Business, Science and Arts occupations in Pavilion, the most male-oriented occupations are Health Diagnosing & Treating (68.1%), Health Technologists (68.1%), and Management (65.7%), while the most female-oriented occupations are Community & Social Service (90.0%), Education Instruction & Library (90.0%), and Management (34.3%).
| Occupation | Male | Female |
| Management | 46 (65.7%) | 24 (34.3%) |
| Business & Financial | 0 (0.0%) | 0 (0.0%) |
| Computers, Engineering & Science | 0 (0.0%) | 0 (0.0%) |
| Computers & Mathematics | 0 (0.0%) | 0 (0.0%) |
| Architecture & Engineering | 0 (0.0%) | 0 (0.0%) |
| Life, Physical & Social Science | 0 (0.0%) | 0 (0.0%) |
| Community & Social Service | 5 (10.0%) | 45 (90.0%) |
| Education, Arts & Media | 0 (0.0%) | 0 (0.0%) |
| Legal Services & Support | 0 (0.0%) | 0 (0.0%) |
| Education Instruction & Library | 5 (10.0%) | 45 (90.0%) |
| Arts, Media & Entertainment | 0 (0.0%) | 0 (0.0%) |
| Health Diagnosing & Treating | 47 (68.1%) | 22 (31.9%) |
| Health Technologists | 47 (68.1%) | 22 (31.9%) |
| Total (Category) | 98 (51.8%) | 91 (48.1%) |
| Total (Overall) | 230 (56.7%) | 176 (43.3%) |
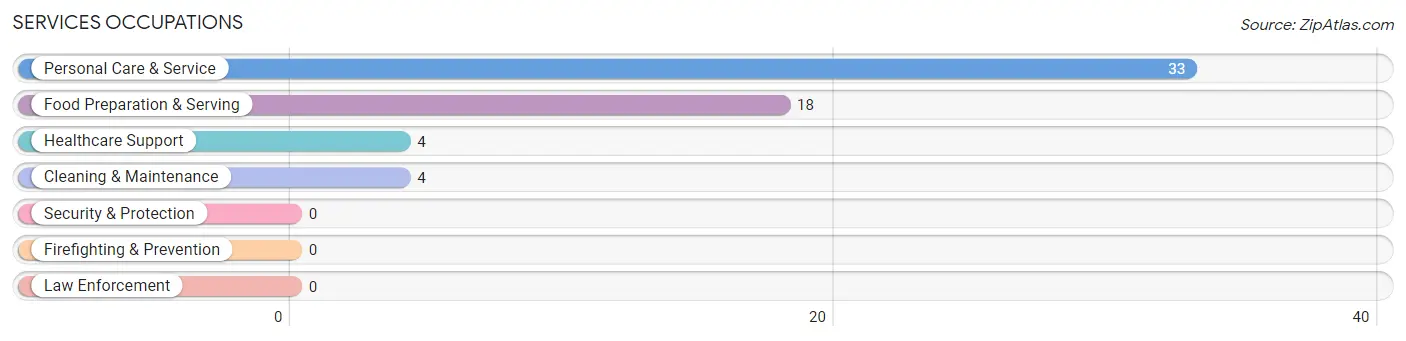
Services Occupations
The most common Services occupations in Pavilion are Personal Care & Service (33 | 8.1%), Food Preparation & Serving (18 | 4.4%), Healthcare Support (4 | 1.0%), and Cleaning & Maintenance (4 | 1.0%).
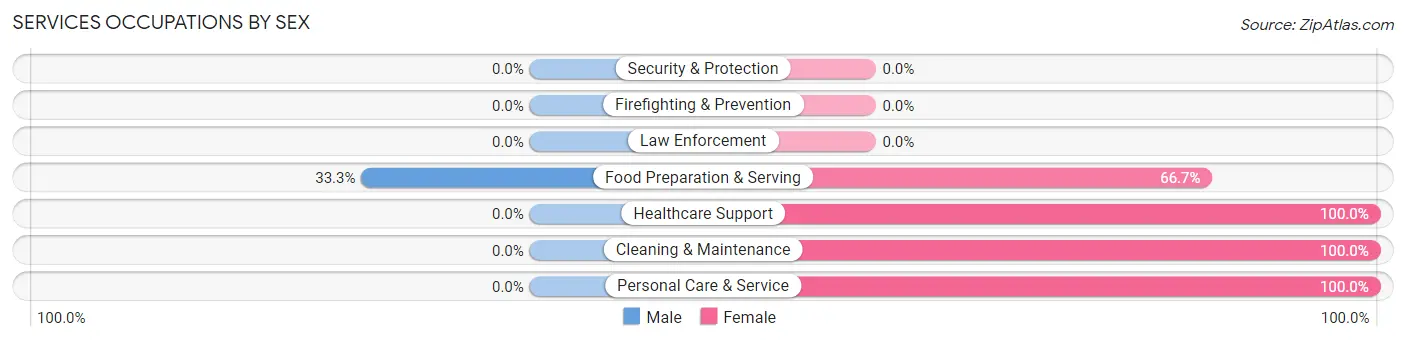
Services Occupations by Sex
| Occupation | Male | Female |
| Healthcare Support | 0 (0.0%) | 4 (100.0%) |
| Security & Protection | 0 (0.0%) | 0 (0.0%) |
| Firefighting & Prevention | 0 (0.0%) | 0 (0.0%) |
| Law Enforcement | 0 (0.0%) | 0 (0.0%) |
| Food Preparation & Serving | 6 (33.3%) | 12 (66.7%) |
| Cleaning & Maintenance | 0 (0.0%) | 4 (100.0%) |
| Personal Care & Service | 0 (0.0%) | 33 (100.0%) |
| Total (Category) | 6 (10.2%) | 53 (89.8%) |
| Total (Overall) | 230 (56.7%) | 176 (43.3%) |
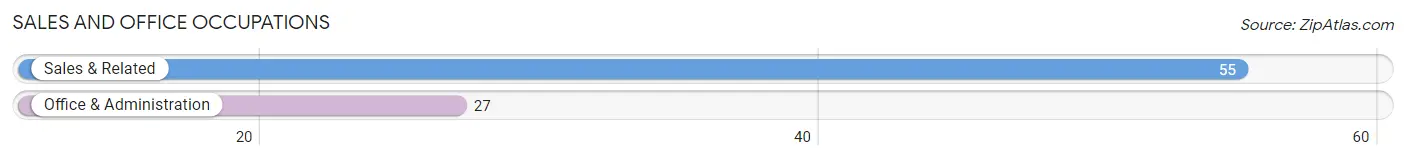
Sales and Office Occupations
The most common Sales and Office occupations in Pavilion are Sales & Related (55 | 13.6%), and Office & Administration (27 | 6.7%).
Sales and Office Occupations by Sex
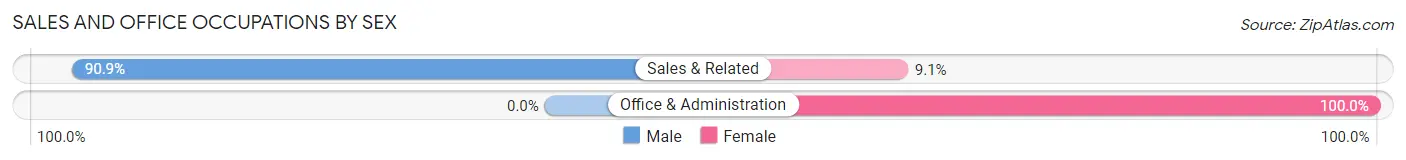
| Occupation | Male | Female |
| Sales & Related | 50 (90.9%) | 5 (9.1%) |
| Office & Administration | 0 (0.0%) | 27 (100.0%) |
| Total (Category) | 50 (61.0%) | 32 (39.0%) |
| Total (Overall) | 230 (56.7%) | 176 (43.3%) |
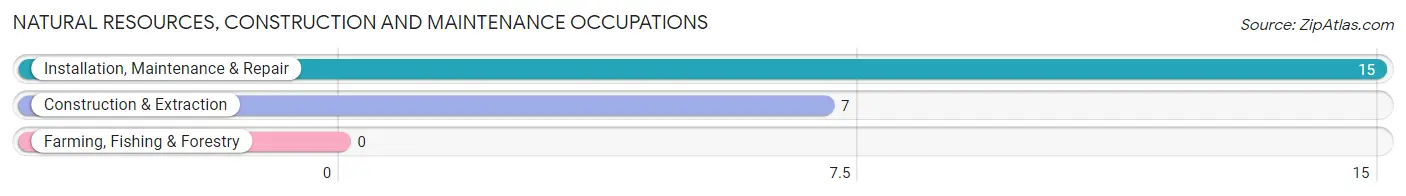
Natural Resources, Construction and Maintenance Occupations
The most common Natural Resources, Construction and Maintenance occupations in Pavilion are Installation, Maintenance & Repair (15 | 3.7%), and Construction & Extraction (7 | 1.7%).
Natural Resources, Construction and Maintenance Occupations by Sex
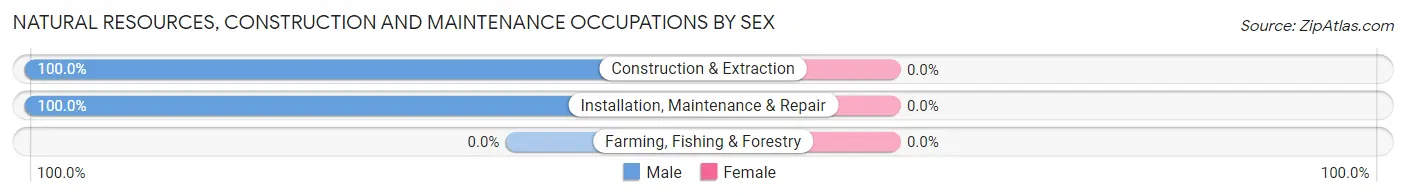
| Occupation | Male | Female |
| Farming, Fishing & Forestry | 0 (0.0%) | 0 (0.0%) |
| Construction & Extraction | 7 (100.0%) | 0 (0.0%) |
| Installation, Maintenance & Repair | 15 (100.0%) | 0 (0.0%) |
| Total (Category) | 22 (100.0%) | 0 (0.0%) |
| Total (Overall) | 230 (56.7%) | 176 (43.3%) |
Production, Transportation and Moving Occupations
The most common Production, Transportation and Moving occupations in Pavilion are Production (40 | 9.9%), Transportation (10 | 2.5%), and Material Moving (4 | 1.0%).
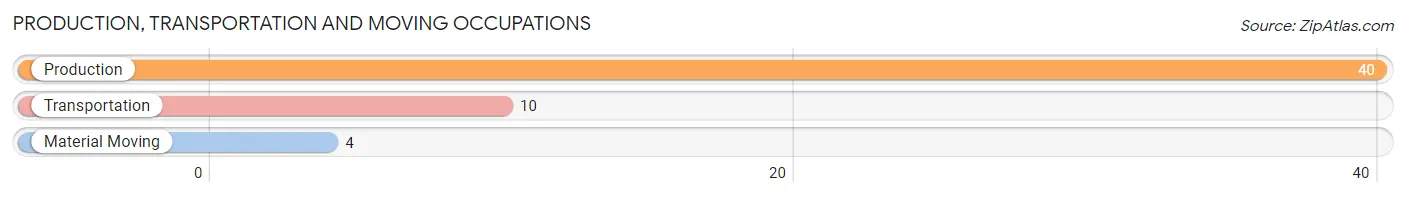
Production, Transportation and Moving Occupations by Sex
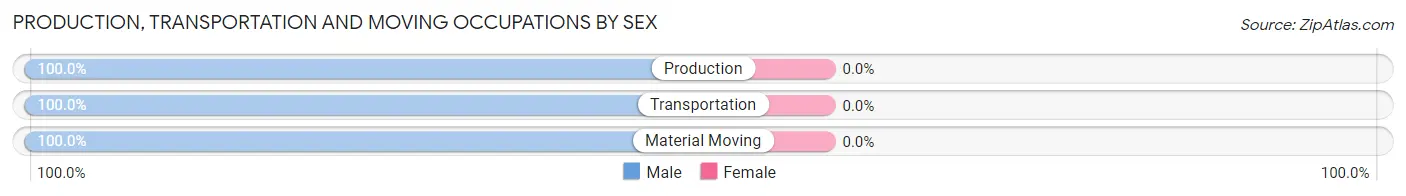
| Occupation | Male | Female |
| Production | 40 (100.0%) | 0 (0.0%) |
| Transportation | 10 (100.0%) | 0 (0.0%) |
| Material Moving | 4 (100.0%) | 0 (0.0%) |
| Total (Category) | 54 (100.0%) | 0 (0.0%) |
| Total (Overall) | 230 (56.7%) | 176 (43.3%) |
Employment Industries by Sex in Pavilion
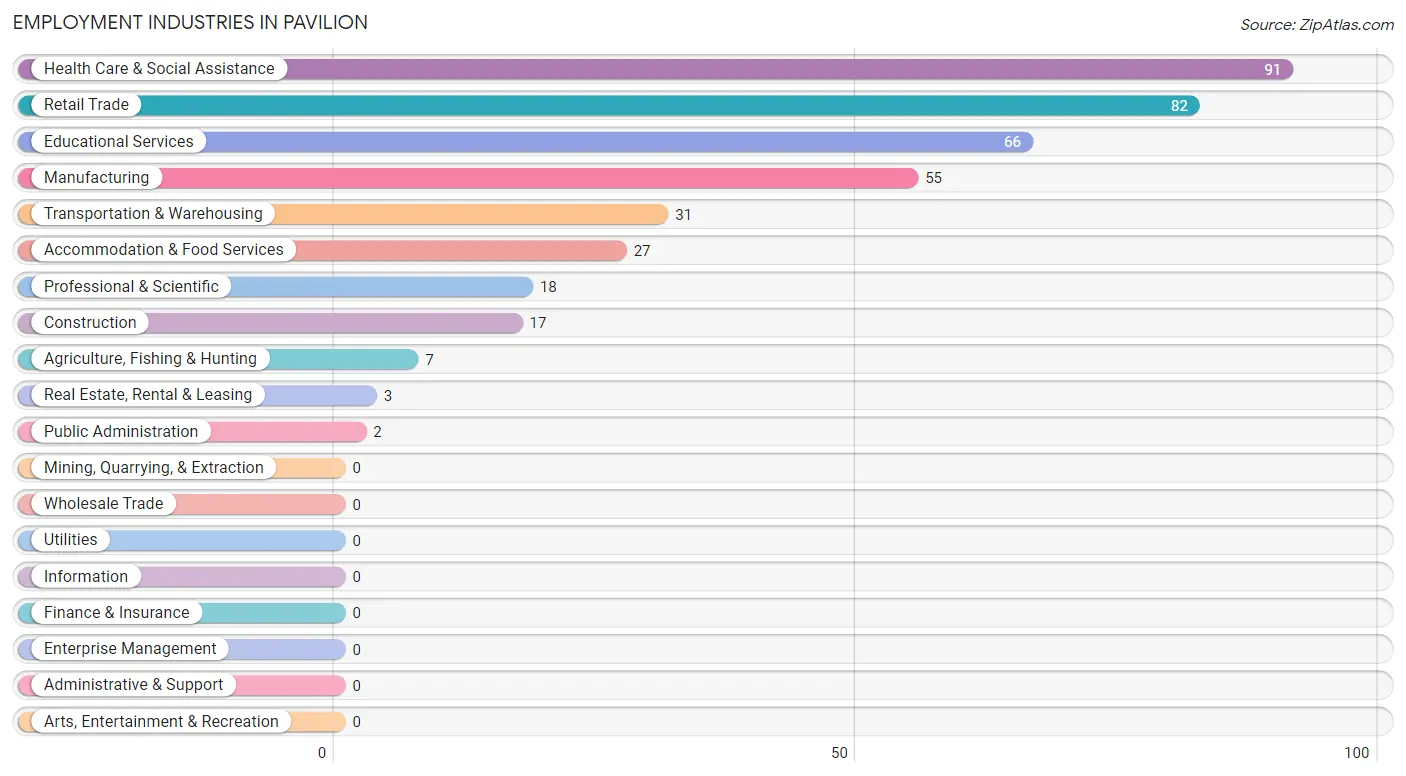
Employment Industries in Pavilion
The major employment industries in Pavilion include Health Care & Social Assistance (91 | 22.4%), Retail Trade (82 | 20.2%), Educational Services (66 | 16.3%), Manufacturing (55 | 13.6%), and Transportation & Warehousing (31 | 7.6%).
Employment Industries by Sex in Pavilion
The Pavilion industries that see more men than women are Agriculture, Fishing & Hunting (100.0%), Manufacturing (100.0%), and Real Estate, Rental & Leasing (100.0%), whereas the industries that tend to have a higher number of women are Professional & Scientific (100.0%), Public Administration (100.0%), and Educational Services (92.4%).
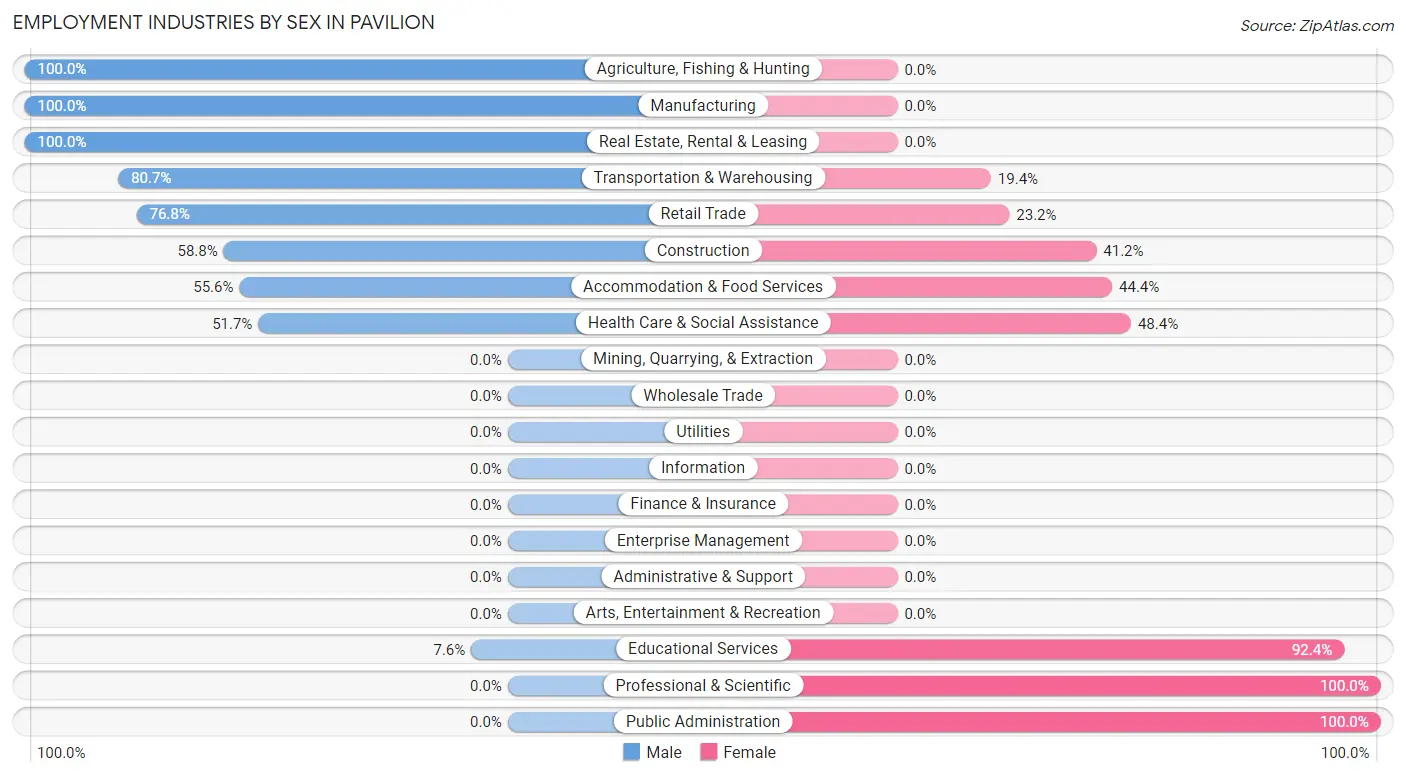
| Industry | Male | Female |
| Agriculture, Fishing & Hunting | 7 (100.0%) | 0 (0.0%) |
| Mining, Quarrying, & Extraction | 0 (0.0%) | 0 (0.0%) |
| Construction | 10 (58.8%) | 7 (41.2%) |
| Manufacturing | 55 (100.0%) | 0 (0.0%) |
| Wholesale Trade | 0 (0.0%) | 0 (0.0%) |
| Retail Trade | 63 (76.8%) | 19 (23.2%) |
| Transportation & Warehousing | 25 (80.6%) | 6 (19.4%) |
| Utilities | 0 (0.0%) | 0 (0.0%) |
| Information | 0 (0.0%) | 0 (0.0%) |
| Finance & Insurance | 0 (0.0%) | 0 (0.0%) |
| Real Estate, Rental & Leasing | 3 (100.0%) | 0 (0.0%) |
| Professional & Scientific | 0 (0.0%) | 18 (100.0%) |
| Enterprise Management | 0 (0.0%) | 0 (0.0%) |
| Administrative & Support | 0 (0.0%) | 0 (0.0%) |
| Educational Services | 5 (7.6%) | 61 (92.4%) |
| Health Care & Social Assistance | 47 (51.6%) | 44 (48.3%) |
| Arts, Entertainment & Recreation | 0 (0.0%) | 0 (0.0%) |
| Accommodation & Food Services | 15 (55.6%) | 12 (44.4%) |
| Public Administration | 0 (0.0%) | 2 (100.0%) |
| Total | 230 (56.7%) | 176 (43.3%) |
Education in Pavilion
School Enrollment in Pavilion
The most common levels of schooling among the 94 students in Pavilion are middle school (33 | 35.1%), elementary school (27 | 28.7%), and college / undergraduate (12 | 12.8%).
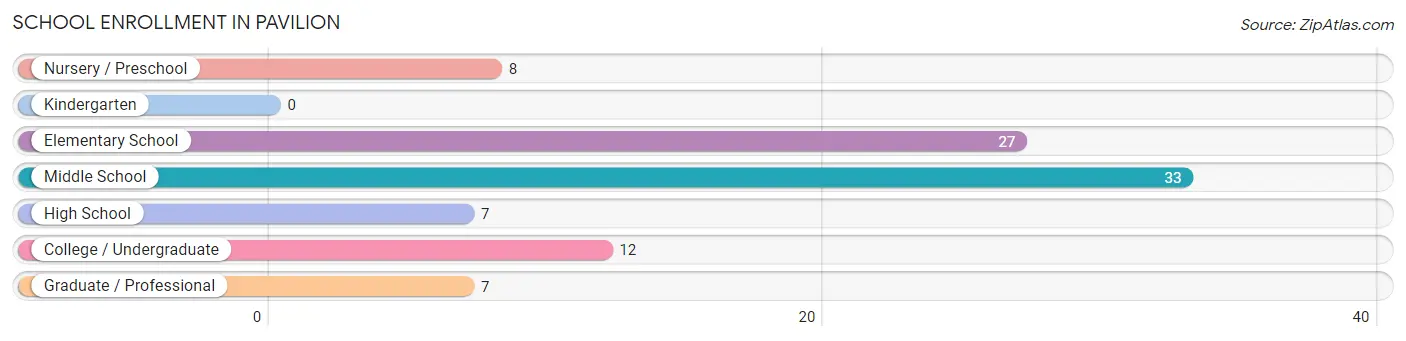
| School Level | # Students | % Students |
| Nursery / Preschool | 8 | 8.5% |
| Kindergarten | 0 | 0.0% |
| Elementary School | 27 | 28.7% |
| Middle School | 33 | 35.1% |
| High School | 7 | 7.4% |
| College / Undergraduate | 12 | 12.8% |
| Graduate / Professional | 7 | 7.4% |
| Total | 94 | 100.0% |
School Enrollment by Age by Funding Source in Pavilion
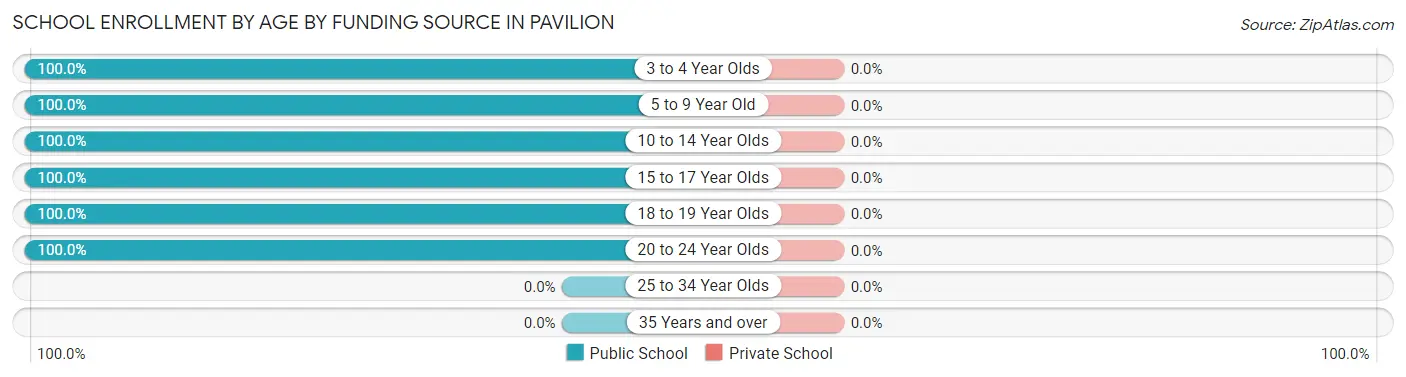
| Age Bracket | Public School | Private School |
| 3 to 4 Year Olds | 8 (100.0%) | 0 (0.0%) |
| 5 to 9 Year Old | 27 (100.0%) | 0 (0.0%) |
| 10 to 14 Year Olds | 33 (100.0%) | 0 (0.0%) |
| 15 to 17 Year Olds | 8 (100.0%) | 0 (0.0%) |
| 18 to 19 Year Olds | 7 (100.0%) | 0 (0.0%) |
| 20 to 24 Year Olds | 11 (100.0%) | 0 (0.0%) |
| 25 to 34 Year Olds | 0 (0.0%) | 0 (0.0%) |
| 35 Years and over | 0 (0.0%) | 0 (0.0%) |
| Total | 94 (100.0%) | 0 (0.0%) |
Educational Attainment by Field of Study in Pavilion
Education (61 | 40.4%), science & technology (55 | 36.4%), arts & humanities (14 | 9.3%), business (7 | 4.6%), and psychology (6 | 4.0%) are the most common fields of study among 151 individuals in Pavilion who have obtained a bachelor's degree or higher.
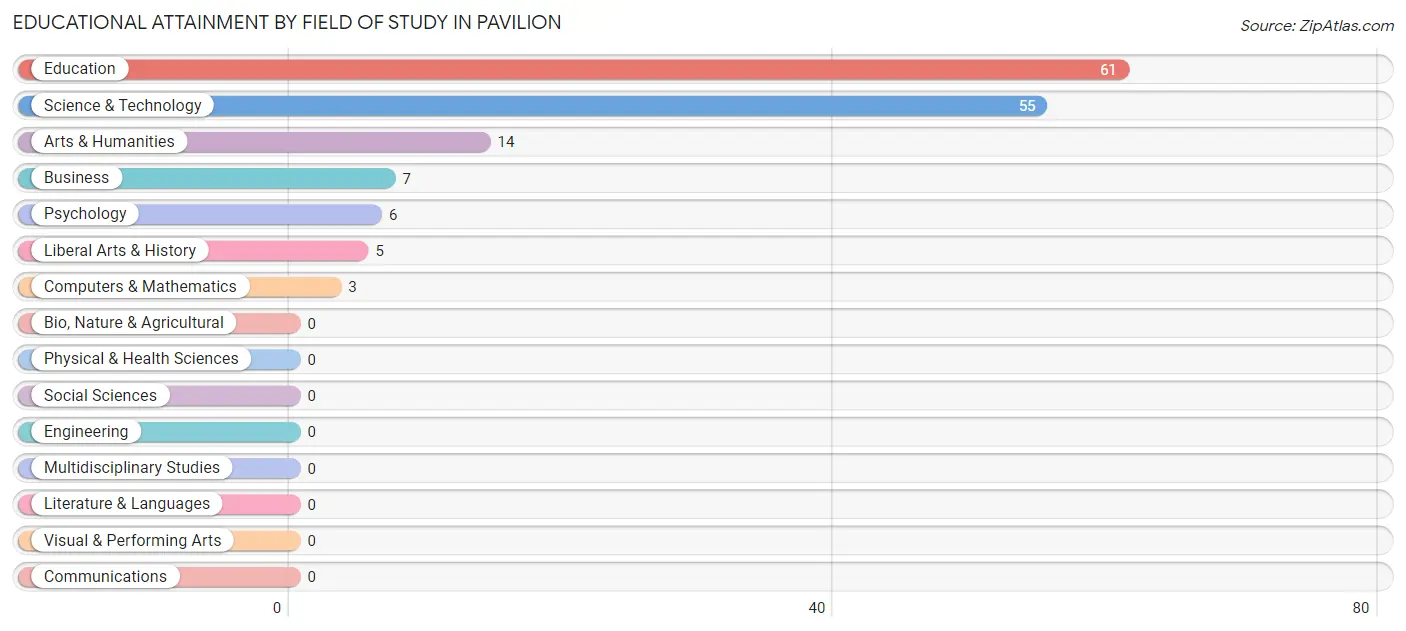
| Field of Study | # Graduates | % Graduates |
| Computers & Mathematics | 3 | 2.0% |
| Bio, Nature & Agricultural | 0 | 0.0% |
| Physical & Health Sciences | 0 | 0.0% |
| Psychology | 6 | 4.0% |
| Social Sciences | 0 | 0.0% |
| Engineering | 0 | 0.0% |
| Multidisciplinary Studies | 0 | 0.0% |
| Science & Technology | 55 | 36.4% |
| Business | 7 | 4.6% |
| Education | 61 | 40.4% |
| Literature & Languages | 0 | 0.0% |
| Liberal Arts & History | 5 | 3.3% |
| Visual & Performing Arts | 0 | 0.0% |
| Communications | 0 | 0.0% |
| Arts & Humanities | 14 | 9.3% |
| Total | 151 | 100.0% |
Transportation & Commute in Pavilion
Vehicle Availability by Sex in Pavilion
The most prevalent vehicle ownership categories in Pavilion are males with 2 vehicles (93, accounting for 40.4%) and females with 2 vehicles (78, making up 52.8%).
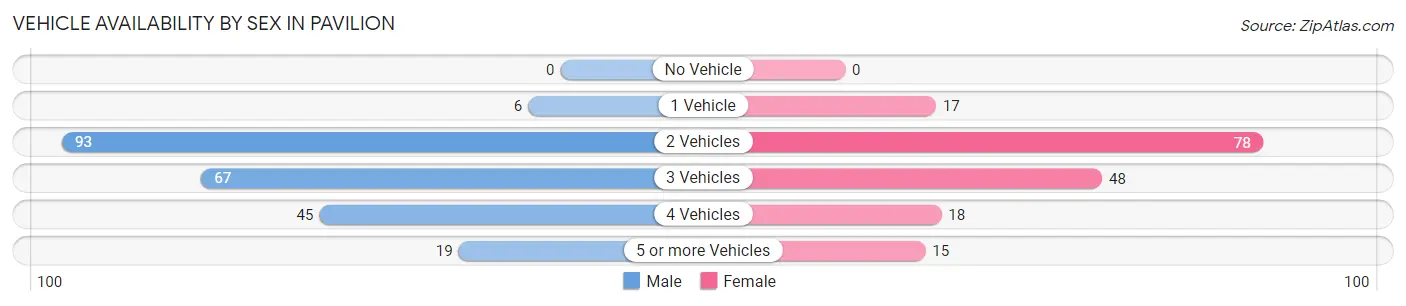
| Vehicles Available | Male | Female |
| No Vehicle | 0 (0.0%) | 0 (0.0%) |
| 1 Vehicle | 6 (2.6%) | 17 (9.7%) |
| 2 Vehicles | 93 (40.4%) | 78 (44.3%) |
| 3 Vehicles | 67 (29.1%) | 48 (27.3%) |
| 4 Vehicles | 45 (19.6%) | 18 (10.2%) |
| 5 or more Vehicles | 19 (8.3%) | 15 (8.5%) |
| Total | 230 (100.0%) | 176 (100.0%) |
Commute Time in Pavilion
The most frequently occuring commute durations in Pavilion are 20 to 24 minutes (95 commuters, 25.3%), 10 to 14 minutes (91 commuters, 24.3%), and 15 to 19 minutes (49 commuters, 13.1%).
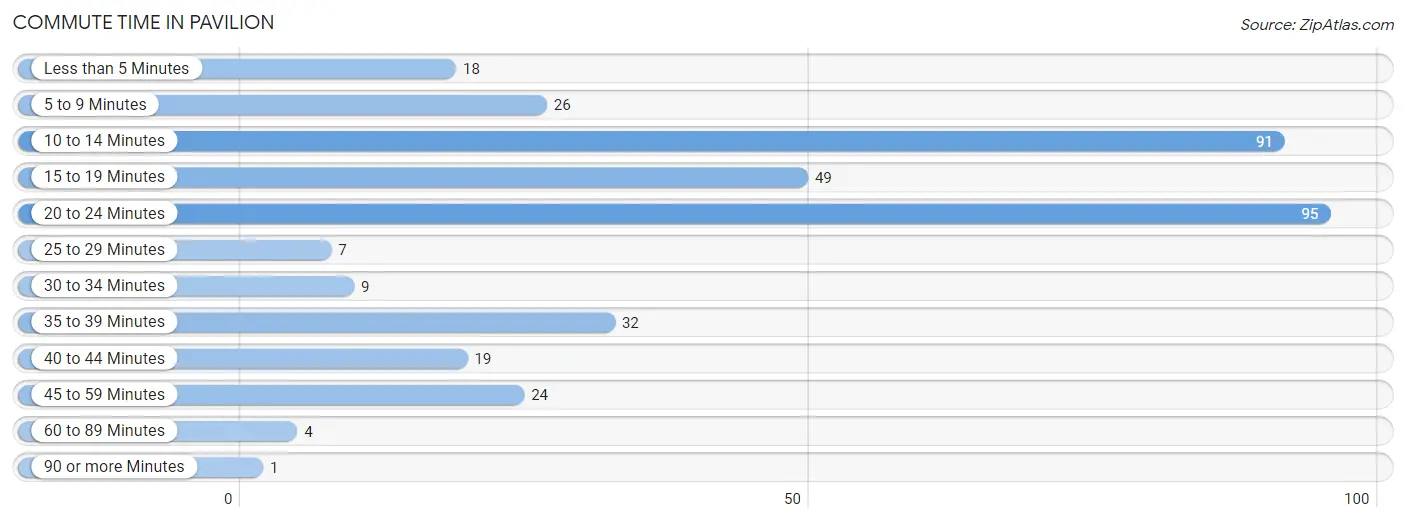
| Commute Time | # Commuters | % Commuters |
| Less than 5 Minutes | 18 | 4.8% |
| 5 to 9 Minutes | 26 | 6.9% |
| 10 to 14 Minutes | 91 | 24.3% |
| 15 to 19 Minutes | 49 | 13.1% |
| 20 to 24 Minutes | 95 | 25.3% |
| 25 to 29 Minutes | 7 | 1.9% |
| 30 to 34 Minutes | 9 | 2.4% |
| 35 to 39 Minutes | 32 | 8.5% |
| 40 to 44 Minutes | 19 | 5.1% |
| 45 to 59 Minutes | 24 | 6.4% |
| 60 to 89 Minutes | 4 | 1.1% |
| 90 or more Minutes | 1 | 0.3% |
Commute Time by Sex in Pavilion
The most common commute times in Pavilion are 20 to 24 minutes (75 commuters, 32.6%) for males and 10 to 14 minutes (40 commuters, 27.6%) for females.
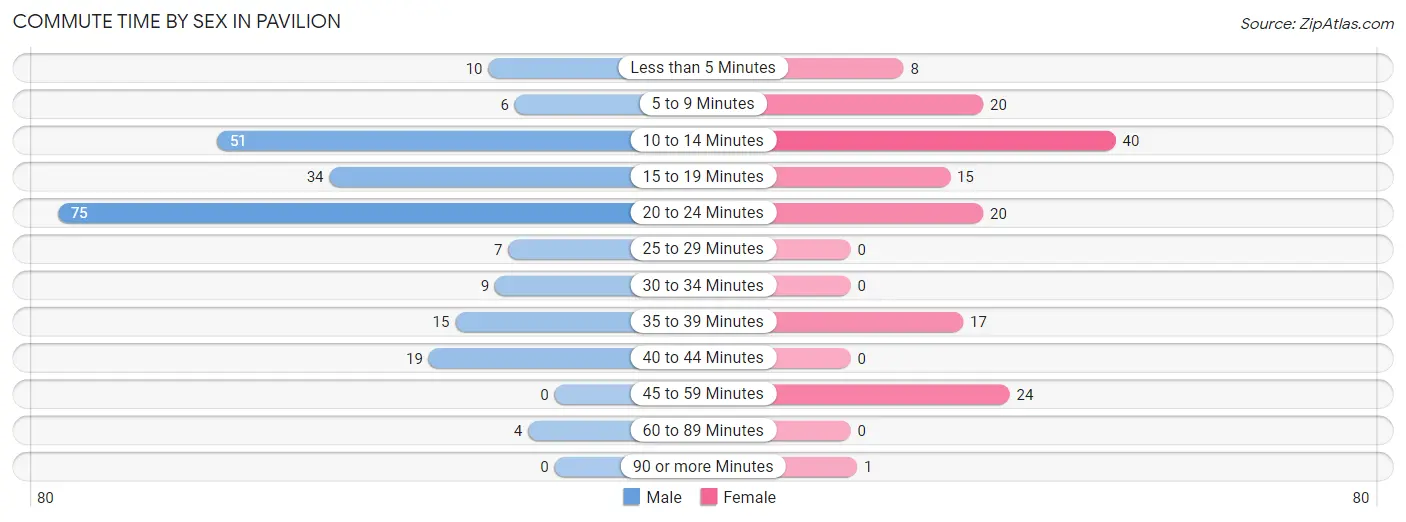
| Commute Time | Male | Female |
| Less than 5 Minutes | 10 (4.3%) | 8 (5.5%) |
| 5 to 9 Minutes | 6 (2.6%) | 20 (13.8%) |
| 10 to 14 Minutes | 51 (22.2%) | 40 (27.6%) |
| 15 to 19 Minutes | 34 (14.8%) | 15 (10.3%) |
| 20 to 24 Minutes | 75 (32.6%) | 20 (13.8%) |
| 25 to 29 Minutes | 7 (3.0%) | 0 (0.0%) |
| 30 to 34 Minutes | 9 (3.9%) | 0 (0.0%) |
| 35 to 39 Minutes | 15 (6.5%) | 17 (11.7%) |
| 40 to 44 Minutes | 19 (8.3%) | 0 (0.0%) |
| 45 to 59 Minutes | 0 (0.0%) | 24 (16.6%) |
| 60 to 89 Minutes | 4 (1.7%) | 0 (0.0%) |
| 90 or more Minutes | 0 (0.0%) | 1 (0.7%) |
Time of Departure to Work by Sex in Pavilion
The most frequent times of departure to work in Pavilion are 8:30 AM to 8:59 AM (91, 39.6%) for males and 6:30 AM to 6:59 AM (54, 37.2%) for females.
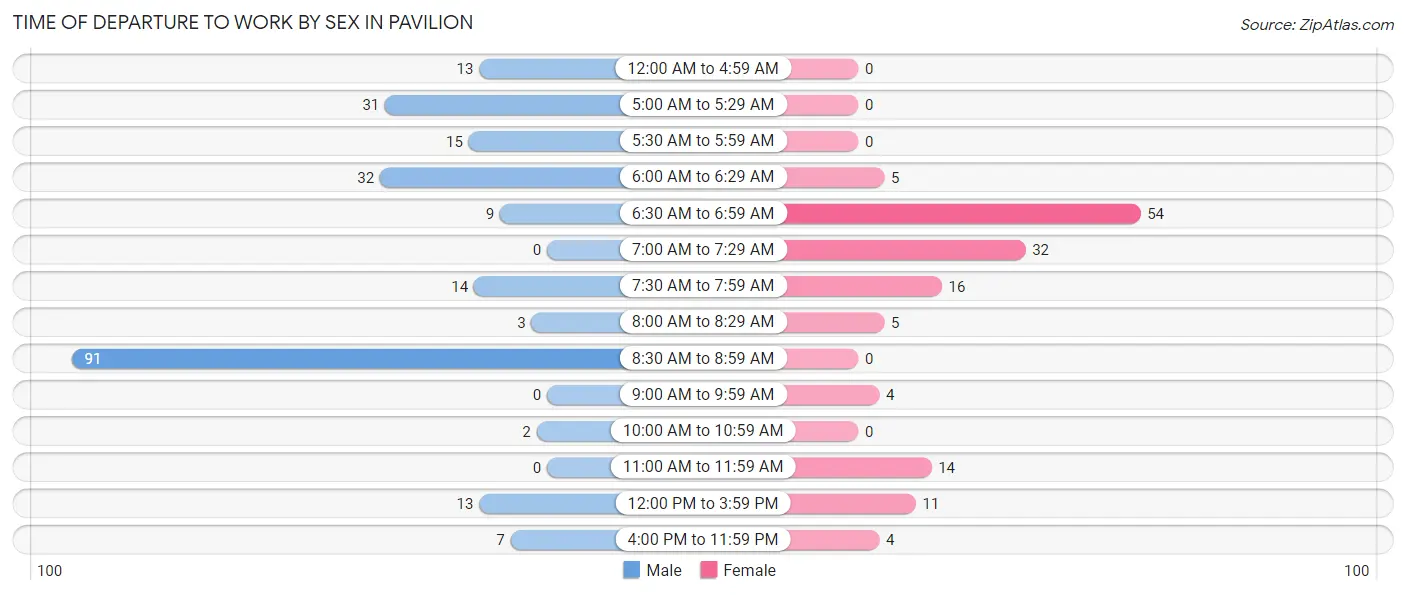
| Time of Departure | Male | Female |
| 12:00 AM to 4:59 AM | 13 (5.7%) | 0 (0.0%) |
| 5:00 AM to 5:29 AM | 31 (13.5%) | 0 (0.0%) |
| 5:30 AM to 5:59 AM | 15 (6.5%) | 0 (0.0%) |
| 6:00 AM to 6:29 AM | 32 (13.9%) | 5 (3.5%) |
| 6:30 AM to 6:59 AM | 9 (3.9%) | 54 (37.2%) |
| 7:00 AM to 7:29 AM | 0 (0.0%) | 32 (22.1%) |
| 7:30 AM to 7:59 AM | 14 (6.1%) | 16 (11.0%) |
| 8:00 AM to 8:29 AM | 3 (1.3%) | 5 (3.5%) |
| 8:30 AM to 8:59 AM | 91 (39.6%) | 0 (0.0%) |
| 9:00 AM to 9:59 AM | 0 (0.0%) | 4 (2.8%) |
| 10:00 AM to 10:59 AM | 2 (0.9%) | 0 (0.0%) |
| 11:00 AM to 11:59 AM | 0 (0.0%) | 14 (9.7%) |
| 12:00 PM to 3:59 PM | 13 (5.7%) | 11 (7.6%) |
| 4:00 PM to 11:59 PM | 7 (3.0%) | 4 (2.8%) |
| Total | 230 (100.0%) | 145 (100.0%) |
Housing Occupancy in Pavilion
Occupancy by Ownership in Pavilion
Of the total 274 dwellings in Pavilion, owner-occupied units account for 215 (78.5%), while renter-occupied units make up 59 (21.5%).
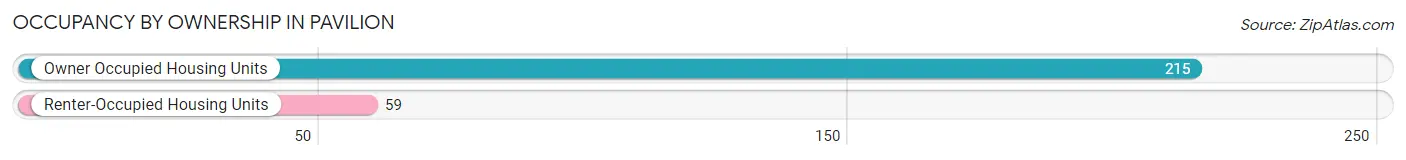
| Occupancy | # Housing Units | % Housing Units |
| Owner Occupied Housing Units | 215 | 78.5% |
| Renter-Occupied Housing Units | 59 | 21.5% |
| Total Occupied Housing Units | 274 | 100.0% |
Occupancy by Household Size in Pavilion
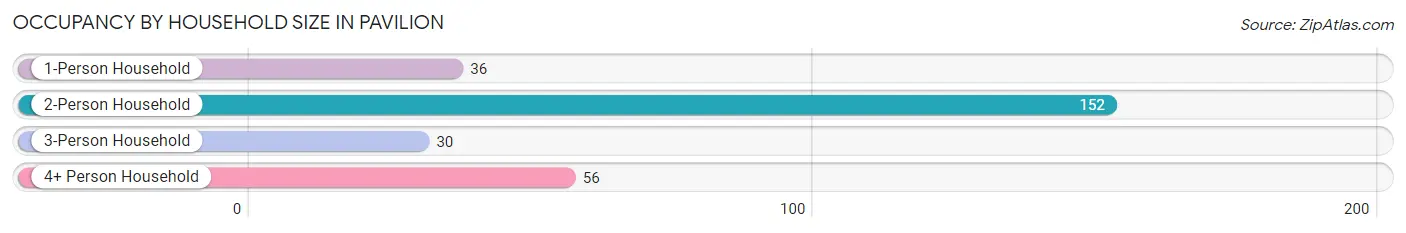
| Household Size | # Housing Units | % Housing Units |
| 1-Person Household | 36 | 13.1% |
| 2-Person Household | 152 | 55.5% |
| 3-Person Household | 30 | 11.0% |
| 4+ Person Household | 56 | 20.4% |
| Total Housing Units | 274 | 100.0% |
Occupancy by Ownership by Household Size in Pavilion
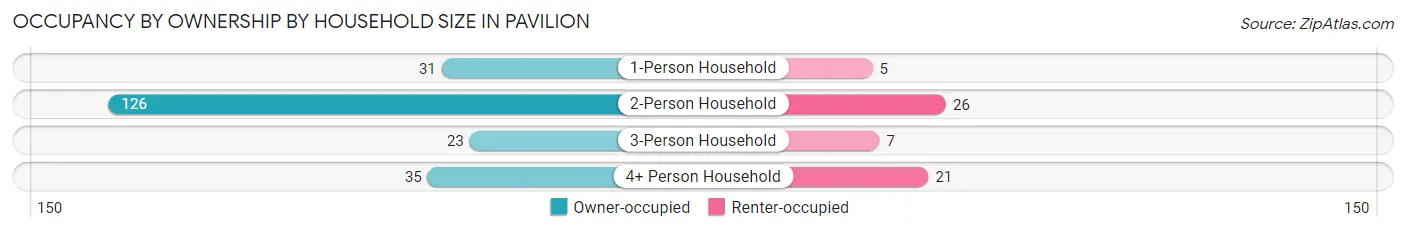
| Household Size | Owner-occupied | Renter-occupied |
| 1-Person Household | 31 (86.1%) | 5 (13.9%) |
| 2-Person Household | 126 (82.9%) | 26 (17.1%) |
| 3-Person Household | 23 (76.7%) | 7 (23.3%) |
| 4+ Person Household | 35 (62.5%) | 21 (37.5%) |
| Total Housing Units | 215 (78.5%) | 59 (21.5%) |
Occupancy by Educational Attainment in Pavilion
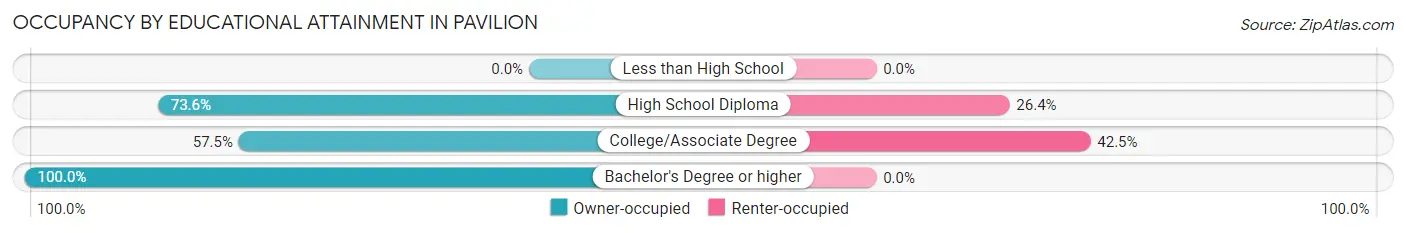
| Household Size | Owner-occupied | Renter-occupied |
| Less than High School | 0 (0.0%) | 0 (0.0%) |
| High School Diploma | 78 (73.6%) | 28 (26.4%) |
| College/Associate Degree | 42 (57.5%) | 31 (42.5%) |
| Bachelor's Degree or higher | 95 (100.0%) | 0 (0.0%) |
Occupancy by Age of Householder in Pavilion
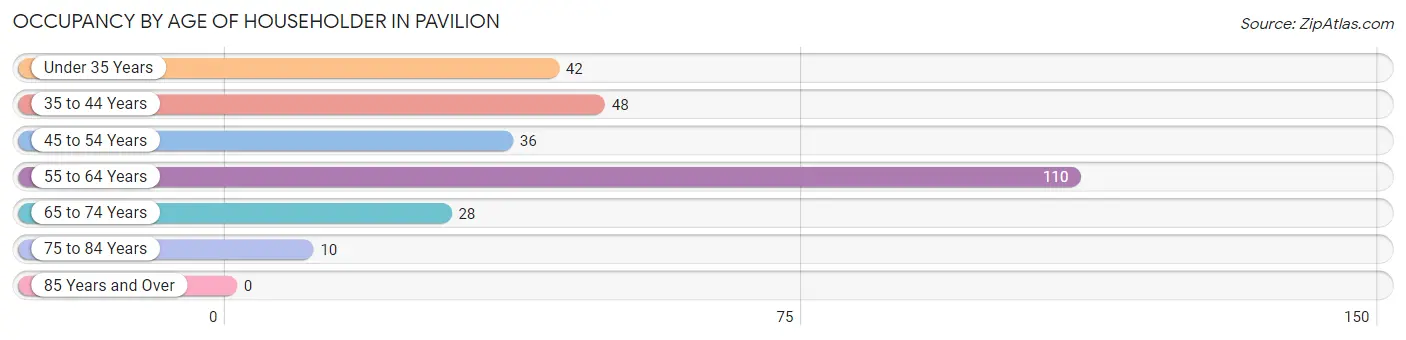
| Age Bracket | # Households | % Households |
| Under 35 Years | 42 | 15.3% |
| 35 to 44 Years | 48 | 17.5% |
| 45 to 54 Years | 36 | 13.1% |
| 55 to 64 Years | 110 | 40.2% |
| 65 to 74 Years | 28 | 10.2% |
| 75 to 84 Years | 10 | 3.6% |
| 85 Years and Over | 0 | 0.0% |
| Total | 274 | 100.0% |
Housing Finances in Pavilion
Median Income by Occupancy in Pavilion
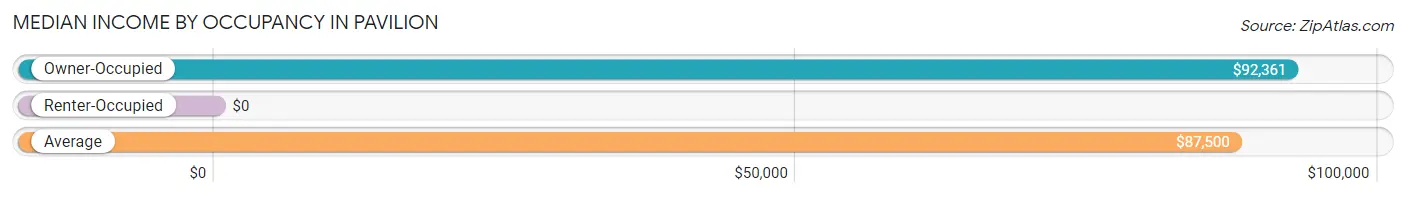
| Occupancy Type | # Households | Median Income |
| Owner-Occupied | 215 (78.5%) | $92,361 |
| Renter-Occupied | 59 (21.5%) | $0 |
| Average | 274 (100.0%) | $87,500 |
Occupancy by Householder Income Bracket in Pavilion
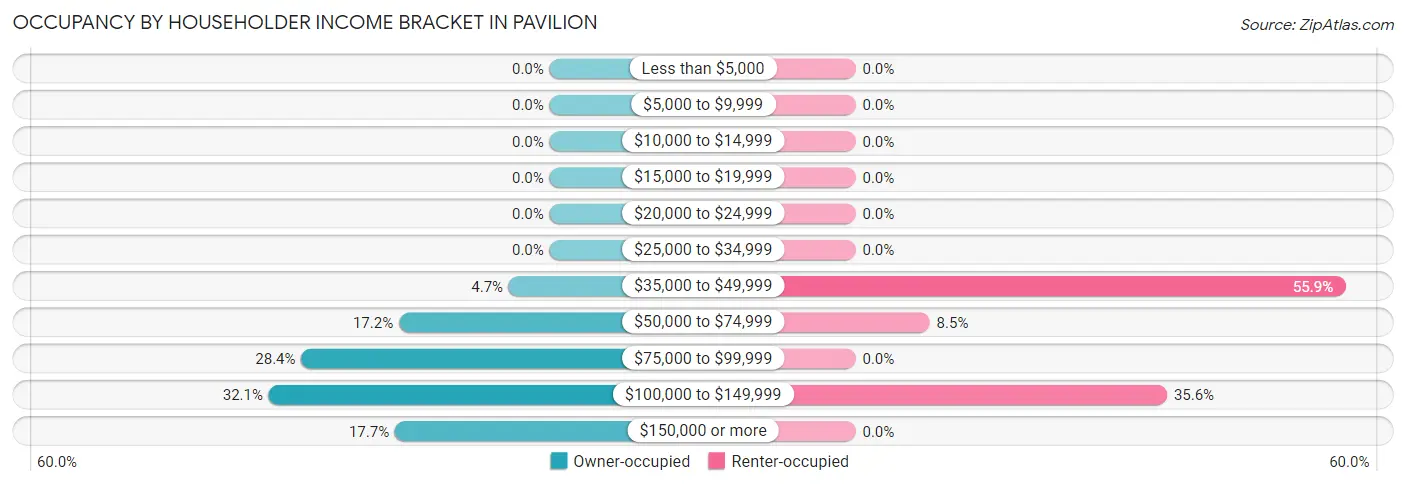
| Income Bracket | Owner-occupied | Renter-occupied |
| Less than $5,000 | 0 (0.0%) | 0 (0.0%) |
| $5,000 to $9,999 | 0 (0.0%) | 0 (0.0%) |
| $10,000 to $14,999 | 0 (0.0%) | 0 (0.0%) |
| $15,000 to $19,999 | 0 (0.0%) | 0 (0.0%) |
| $20,000 to $24,999 | 0 (0.0%) | 0 (0.0%) |
| $25,000 to $34,999 | 0 (0.0%) | 0 (0.0%) |
| $35,000 to $49,999 | 10 (4.6%) | 33 (55.9%) |
| $50,000 to $74,999 | 37 (17.2%) | 5 (8.5%) |
| $75,000 to $99,999 | 61 (28.4%) | 0 (0.0%) |
| $100,000 to $149,999 | 69 (32.1%) | 21 (35.6%) |
| $150,000 or more | 38 (17.7%) | 0 (0.0%) |
| Total | 215 (100.0%) | 59 (100.0%) |
Monthly Housing Cost Tiers in Pavilion
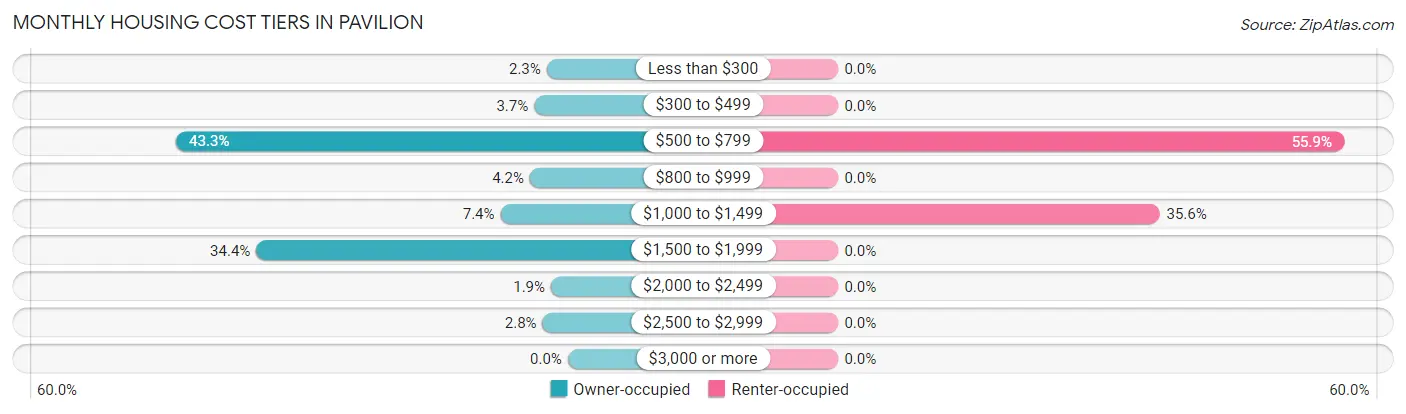
| Monthly Cost | Owner-occupied | Renter-occupied |
| Less than $300 | 5 (2.3%) | 0 (0.0%) |
| $300 to $499 | 8 (3.7%) | 0 (0.0%) |
| $500 to $799 | 93 (43.3%) | 33 (55.9%) |
| $800 to $999 | 9 (4.2%) | 0 (0.0%) |
| $1,000 to $1,499 | 16 (7.4%) | 21 (35.6%) |
| $1,500 to $1,999 | 74 (34.4%) | 0 (0.0%) |
| $2,000 to $2,499 | 4 (1.9%) | 0 (0.0%) |
| $2,500 to $2,999 | 6 (2.8%) | 0 (0.0%) |
| $3,000 or more | 0 (0.0%) | 0 (0.0%) |
| Total | 215 (100.0%) | 59 (100.0%) |
Physical Housing Characteristics in Pavilion
Housing Structures in Pavilion
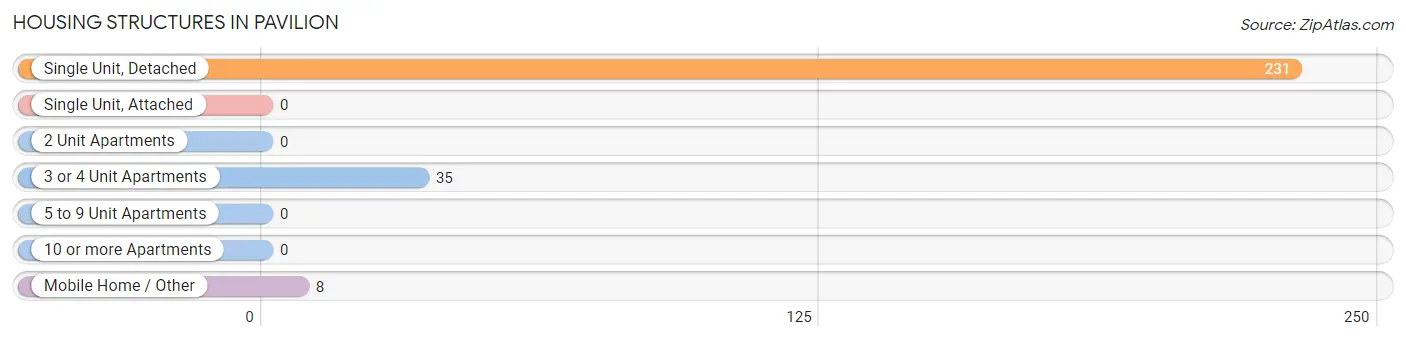
| Structure Type | # Housing Units | % Housing Units |
| Single Unit, Detached | 231 | 84.3% |
| Single Unit, Attached | 0 | 0.0% |
| 2 Unit Apartments | 0 | 0.0% |
| 3 or 4 Unit Apartments | 35 | 12.8% |
| 5 to 9 Unit Apartments | 0 | 0.0% |
| 10 or more Apartments | 0 | 0.0% |
| Mobile Home / Other | 8 | 2.9% |
| Total | 274 | 100.0% |
Housing Structures by Occupancy in Pavilion
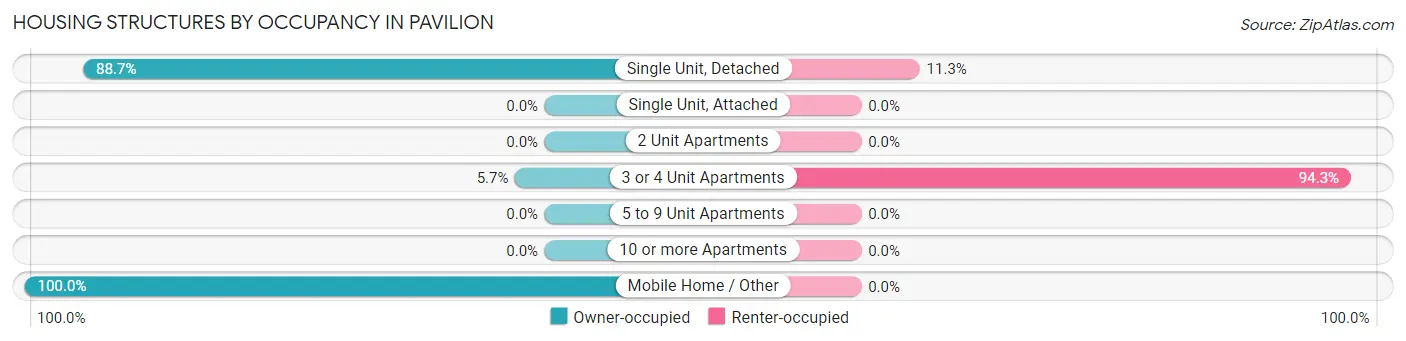
| Structure Type | Owner-occupied | Renter-occupied |
| Single Unit, Detached | 205 (88.7%) | 26 (11.3%) |
| Single Unit, Attached | 0 (0.0%) | 0 (0.0%) |
| 2 Unit Apartments | 0 (0.0%) | 0 (0.0%) |
| 3 or 4 Unit Apartments | 2 (5.7%) | 33 (94.3%) |
| 5 to 9 Unit Apartments | 0 (0.0%) | 0 (0.0%) |
| 10 or more Apartments | 0 (0.0%) | 0 (0.0%) |
| Mobile Home / Other | 8 (100.0%) | 0 (0.0%) |
| Total | 215 (78.5%) | 59 (21.5%) |
Housing Structures by Number of Rooms in Pavilion
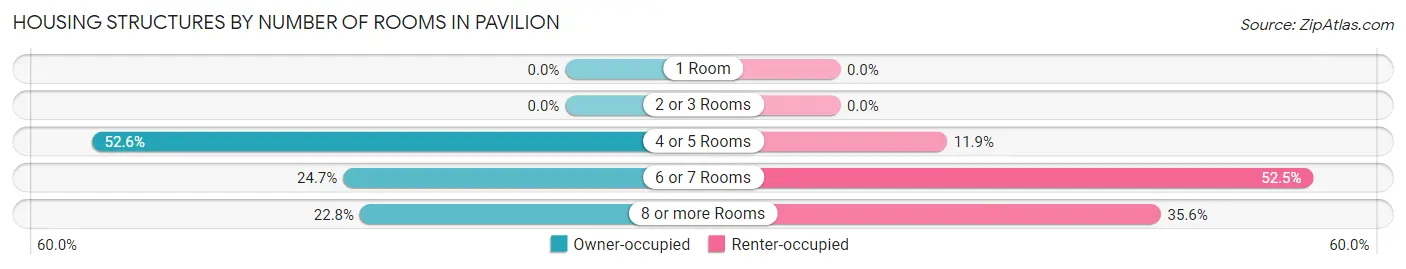
| Number of Rooms | Owner-occupied | Renter-occupied |
| 1 Room | 0 (0.0%) | 0 (0.0%) |
| 2 or 3 Rooms | 0 (0.0%) | 0 (0.0%) |
| 4 or 5 Rooms | 113 (52.6%) | 7 (11.9%) |
| 6 or 7 Rooms | 53 (24.6%) | 31 (52.5%) |
| 8 or more Rooms | 49 (22.8%) | 21 (35.6%) |
| Total | 215 (100.0%) | 59 (100.0%) |
Housing Structure by Heating Type in Pavilion
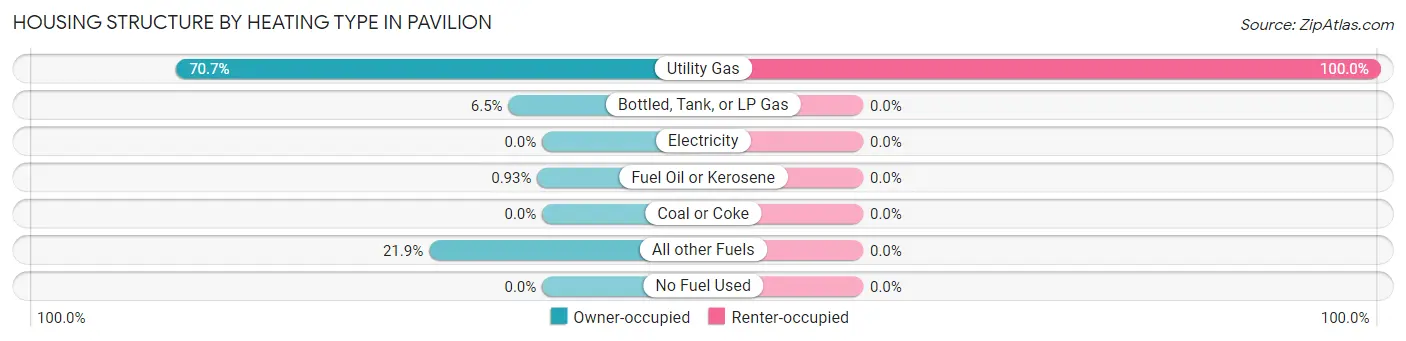
| Heating Type | Owner-occupied | Renter-occupied |
| Utility Gas | 152 (70.7%) | 59 (100.0%) |
| Bottled, Tank, or LP Gas | 14 (6.5%) | 0 (0.0%) |
| Electricity | 0 (0.0%) | 0 (0.0%) |
| Fuel Oil or Kerosene | 2 (0.9%) | 0 (0.0%) |
| Coal or Coke | 0 (0.0%) | 0 (0.0%) |
| All other Fuels | 47 (21.9%) | 0 (0.0%) |
| No Fuel Used | 0 (0.0%) | 0 (0.0%) |
| Total | 215 (100.0%) | 59 (100.0%) |
Household Vehicle Usage in Pavilion
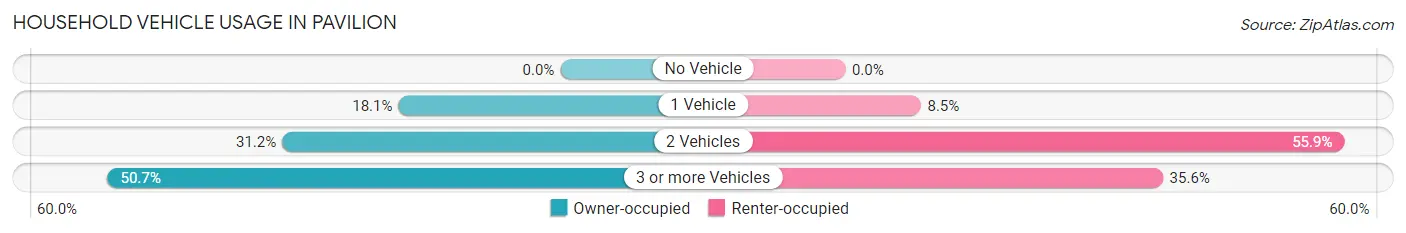
| Vehicles per Household | Owner-occupied | Renter-occupied |
| No Vehicle | 0 (0.0%) | 0 (0.0%) |
| 1 Vehicle | 39 (18.1%) | 5 (8.5%) |
| 2 Vehicles | 67 (31.2%) | 33 (55.9%) |
| 3 or more Vehicles | 109 (50.7%) | 21 (35.6%) |
| Total | 215 (100.0%) | 59 (100.0%) |
Real Estate & Mortgages in Pavilion
Real Estate and Mortgage Overview in Pavilion
| Characteristic | Without Mortgage | With Mortgage |
| Housing Units | 57 | 158 |
| Median Property Value | $118,500 | $142,900 |
| Median Household Income | $113,750 | $20 |
| Monthly Housing Costs | $617 | $0 |
| Real Estate Taxes | $3,079 | $0 |
Property Value by Mortgage Status in Pavilion
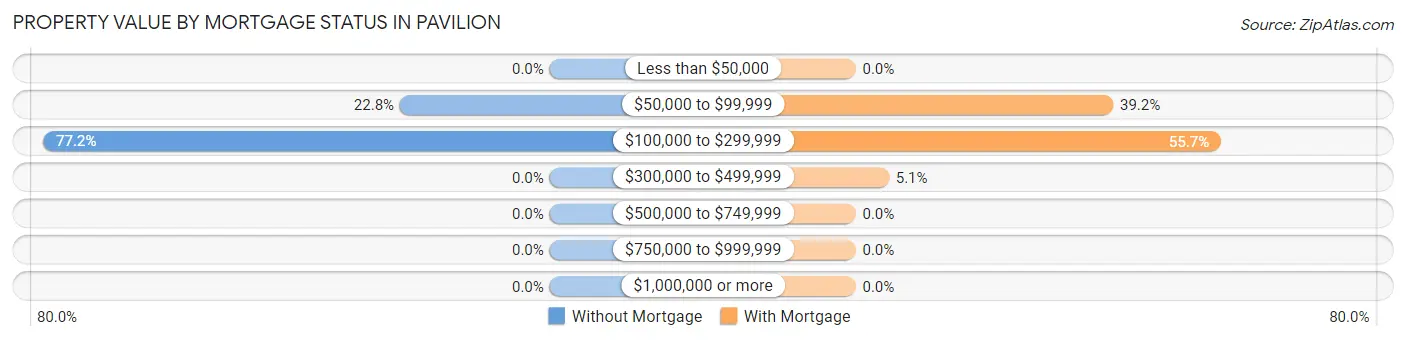
| Property Value | Without Mortgage | With Mortgage |
| Less than $50,000 | 0 (0.0%) | 0 (0.0%) |
| $50,000 to $99,999 | 13 (22.8%) | 62 (39.2%) |
| $100,000 to $299,999 | 44 (77.2%) | 88 (55.7%) |
| $300,000 to $499,999 | 0 (0.0%) | 8 (5.1%) |
| $500,000 to $749,999 | 0 (0.0%) | 0 (0.0%) |
| $750,000 to $999,999 | 0 (0.0%) | 0 (0.0%) |
| $1,000,000 or more | 0 (0.0%) | 0 (0.0%) |
| Total | 57 (100.0%) | 158 (100.0%) |
Household Income by Mortgage Status in Pavilion
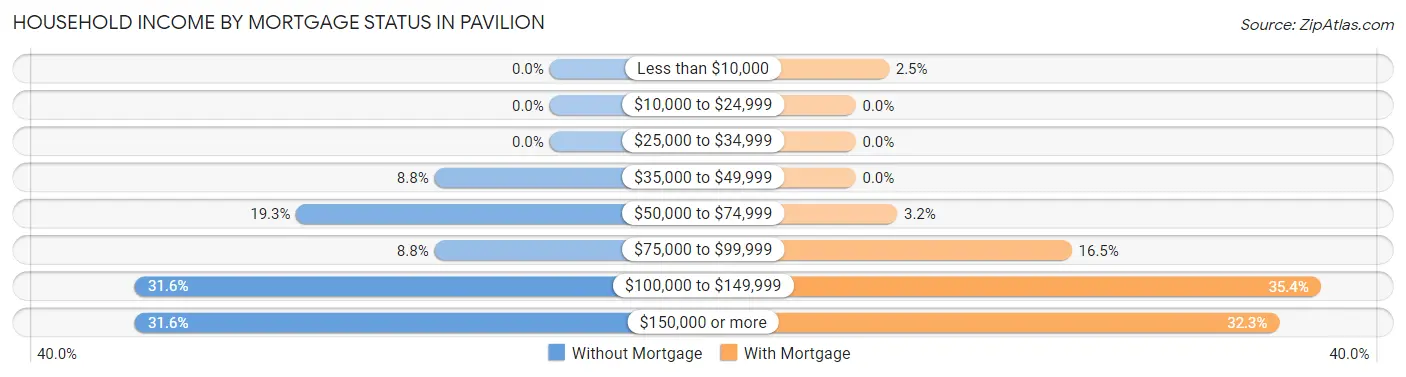
| Household Income | Without Mortgage | With Mortgage |
| Less than $10,000 | 0 (0.0%) | 4 (2.5%) |
| $10,000 to $24,999 | 0 (0.0%) | 0 (0.0%) |
| $25,000 to $34,999 | 0 (0.0%) | 0 (0.0%) |
| $35,000 to $49,999 | 5 (8.8%) | 0 (0.0%) |
| $50,000 to $74,999 | 11 (19.3%) | 5 (3.2%) |
| $75,000 to $99,999 | 5 (8.8%) | 26 (16.5%) |
| $100,000 to $149,999 | 18 (31.6%) | 56 (35.4%) |
| $150,000 or more | 18 (31.6%) | 51 (32.3%) |
| Total | 57 (100.0%) | 158 (100.0%) |
Property Value to Household Income Ratio in Pavilion
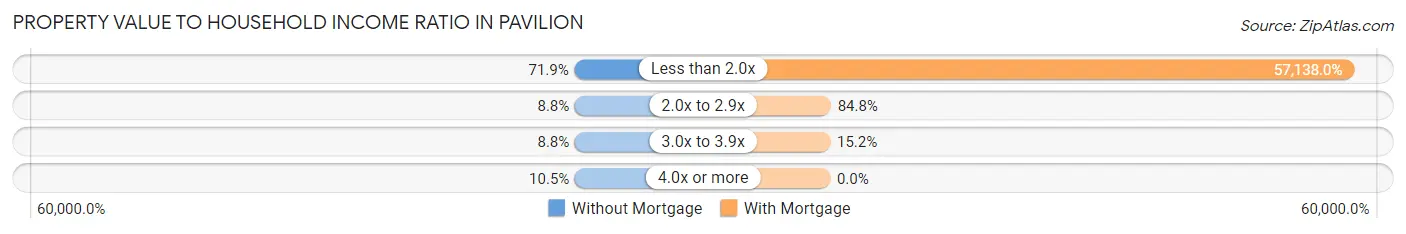
| Value-to-Income Ratio | Without Mortgage | With Mortgage |
| Less than 2.0x | 41 (71.9%) | 90,278 (57,138.0%) |
| 2.0x to 2.9x | 5 (8.8%) | 134 (84.8%) |
| 3.0x to 3.9x | 5 (8.8%) | 24 (15.2%) |
| 4.0x or more | 6 (10.5%) | 0 (0.0%) |
| Total | 57 (100.0%) | 158 (100.0%) |
Real Estate Taxes by Mortgage Status in Pavilion
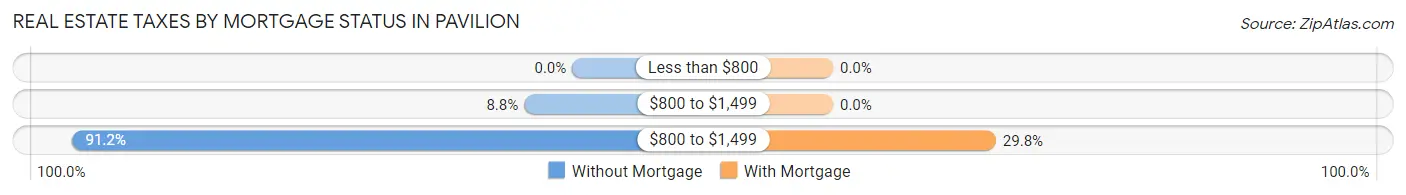
| Property Taxes | Without Mortgage | With Mortgage |
| Less than $800 | 0 (0.0%) | 0 (0.0%) |
| $800 to $1,499 | 5 (8.8%) | 0 (0.0%) |
| $800 to $1,499 | 52 (91.2%) | 47 (29.7%) |
| Total | 57 (100.0%) | 158 (100.0%) |
Health & Disability in Pavilion
Health Insurance Coverage by Age in Pavilion
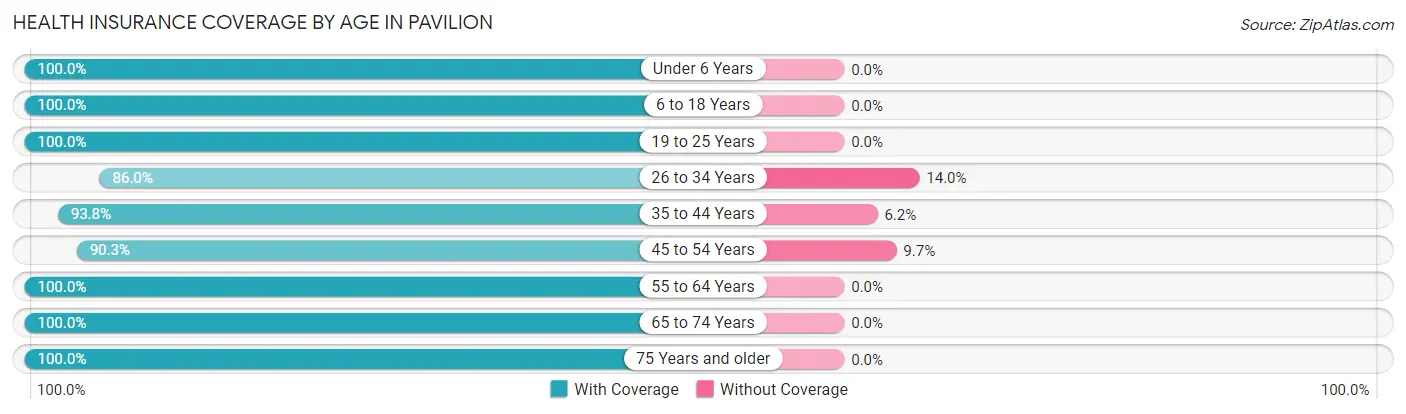
| Age Bracket | With Coverage | Without Coverage |
| Under 6 Years | 64 (100.0%) | 0 (0.0%) |
| 6 to 18 Years | 55 (100.0%) | 0 (0.0%) |
| 19 to 25 Years | 109 (100.0%) | 0 (0.0%) |
| 26 to 34 Years | 43 (86.0%) | 7 (14.0%) |
| 35 to 44 Years | 106 (93.8%) | 7 (6.2%) |
| 45 to 54 Years | 65 (90.3%) | 7 (9.7%) |
| 55 to 64 Years | 191 (100.0%) | 0 (0.0%) |
| 65 to 74 Years | 43 (100.0%) | 0 (0.0%) |
| 75 Years and older | 18 (100.0%) | 0 (0.0%) |
| Total | 694 (97.1%) | 21 (2.9%) |
Health Insurance Coverage by Citizenship Status in Pavilion
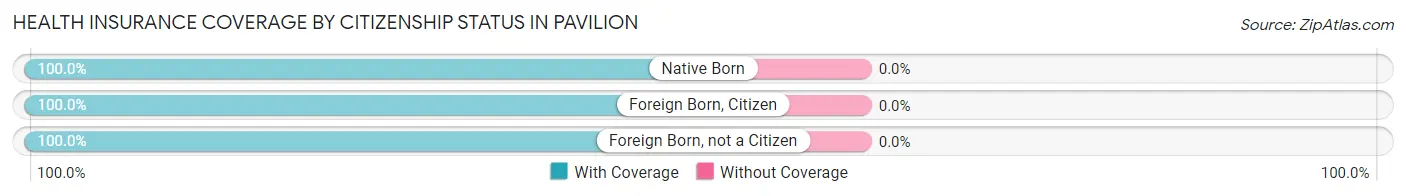
| Citizenship Status | With Coverage | Without Coverage |
| Native Born | 64 (100.0%) | 0 (0.0%) |
| Foreign Born, Citizen | 55 (100.0%) | 0 (0.0%) |
| Foreign Born, not a Citizen | 109 (100.0%) | 0 (0.0%) |
Health Insurance Coverage by Household Income in Pavilion
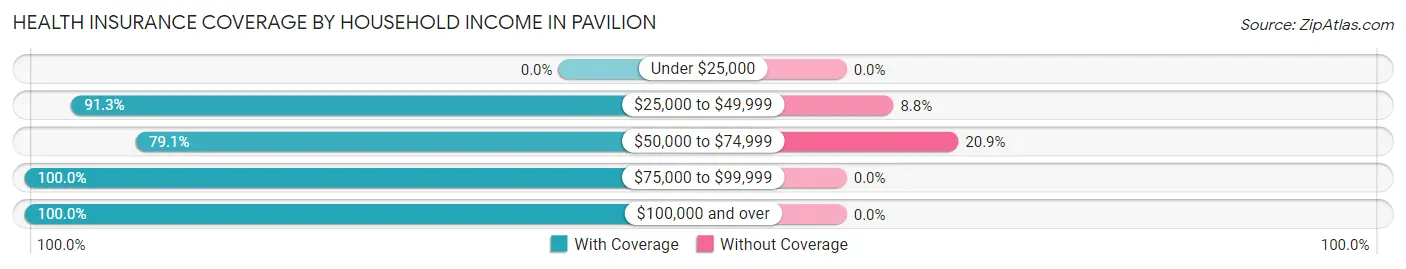
| Household Income | With Coverage | Without Coverage |
| Under $25,000 | 0 (0.0%) | 0 (0.0%) |
| $25,000 to $49,999 | 73 (91.2%) | 7 (8.7%) |
| $50,000 to $74,999 | 53 (79.1%) | 14 (20.9%) |
| $75,000 to $99,999 | 137 (100.0%) | 0 (0.0%) |
| $100,000 and over | 431 (100.0%) | 0 (0.0%) |
Public vs Private Health Insurance Coverage by Age in Pavilion
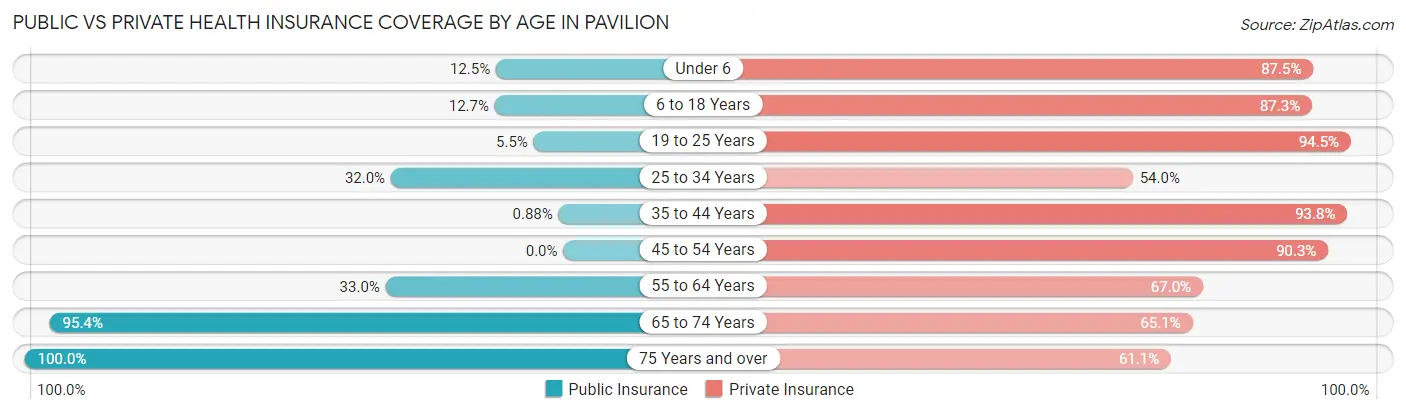
| Age Bracket | Public Insurance | Private Insurance |
| Under 6 | 8 (12.5%) | 56 (87.5%) |
| 6 to 18 Years | 7 (12.7%) | 48 (87.3%) |
| 19 to 25 Years | 6 (5.5%) | 103 (94.5%) |
| 25 to 34 Years | 16 (32.0%) | 27 (54.0%) |
| 35 to 44 Years | 1 (0.9%) | 106 (93.8%) |
| 45 to 54 Years | 0 (0.0%) | 65 (90.3%) |
| 55 to 64 Years | 63 (33.0%) | 128 (67.0%) |
| 65 to 74 Years | 41 (95.4%) | 28 (65.1%) |
| 75 Years and over | 18 (100.0%) | 11 (61.1%) |
| Total | 160 (22.4%) | 572 (80.0%) |
Disability Status by Sex by Age in Pavilion
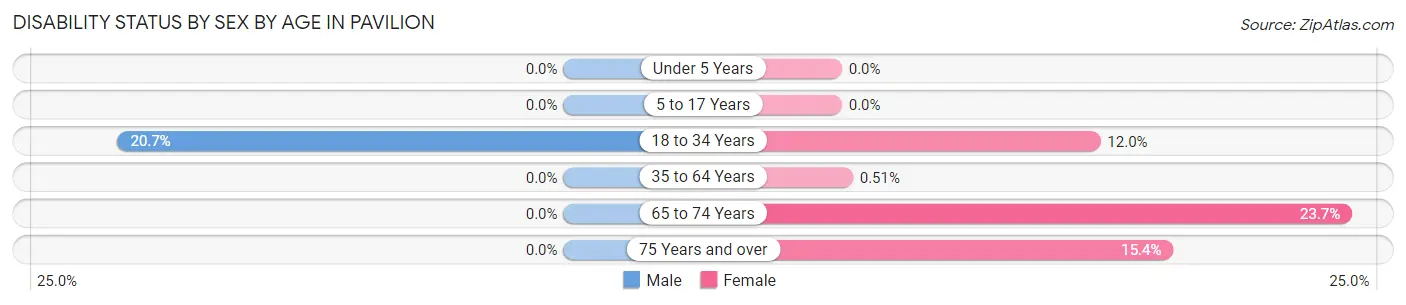
| Age Bracket | Male | Female |
| Under 5 Years | 0 (0.0%) | 0 (0.0%) |
| 5 to 17 Years | 0 (0.0%) | 0 (0.0%) |
| 18 to 34 Years | 24 (20.7%) | 6 (12.0%) |
| 35 to 64 Years | 0 (0.0%) | 1 (0.5%) |
| 65 to 74 Years | 0 (0.0%) | 9 (23.7%) |
| 75 Years and over | 0 (0.0%) | 2 (15.4%) |
Disability Class by Sex by Age in Pavilion
Disability Class: Hearing Difficulty
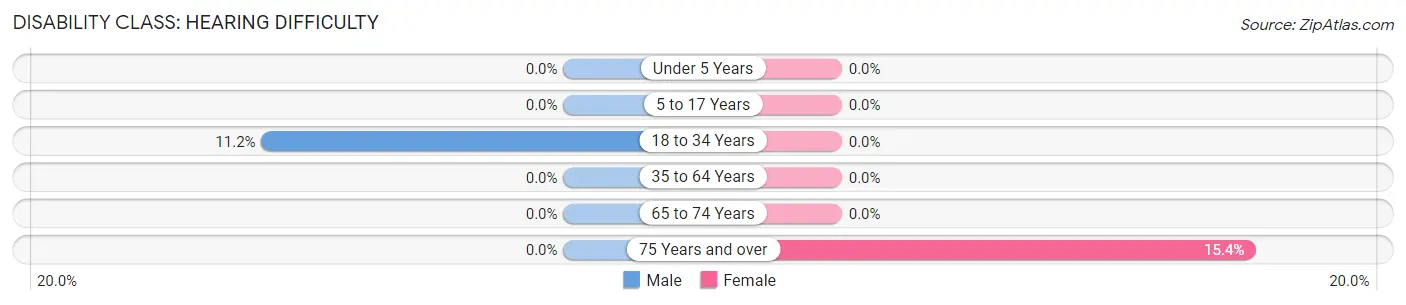
| Age Bracket | Male | Female |
| Under 5 Years | 0 (0.0%) | 0 (0.0%) |
| 5 to 17 Years | 0 (0.0%) | 0 (0.0%) |
| 18 to 34 Years | 13 (11.2%) | 0 (0.0%) |
| 35 to 64 Years | 0 (0.0%) | 0 (0.0%) |
| 65 to 74 Years | 0 (0.0%) | 0 (0.0%) |
| 75 Years and over | 0 (0.0%) | 2 (15.4%) |
Disability Class: Vision Difficulty
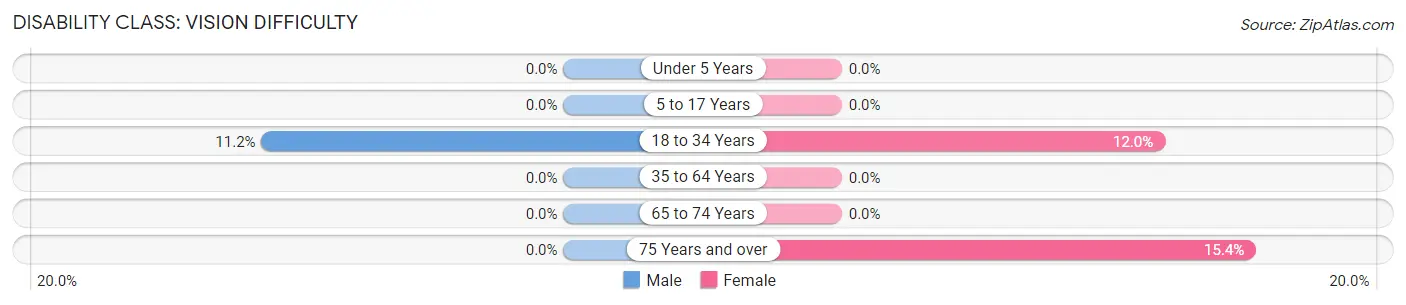
| Age Bracket | Male | Female |
| Under 5 Years | 0 (0.0%) | 0 (0.0%) |
| 5 to 17 Years | 0 (0.0%) | 0 (0.0%) |
| 18 to 34 Years | 13 (11.2%) | 6 (12.0%) |
| 35 to 64 Years | 0 (0.0%) | 0 (0.0%) |
| 65 to 74 Years | 0 (0.0%) | 0 (0.0%) |
| 75 Years and over | 0 (0.0%) | 2 (15.4%) |
Disability Class: Cognitive Difficulty
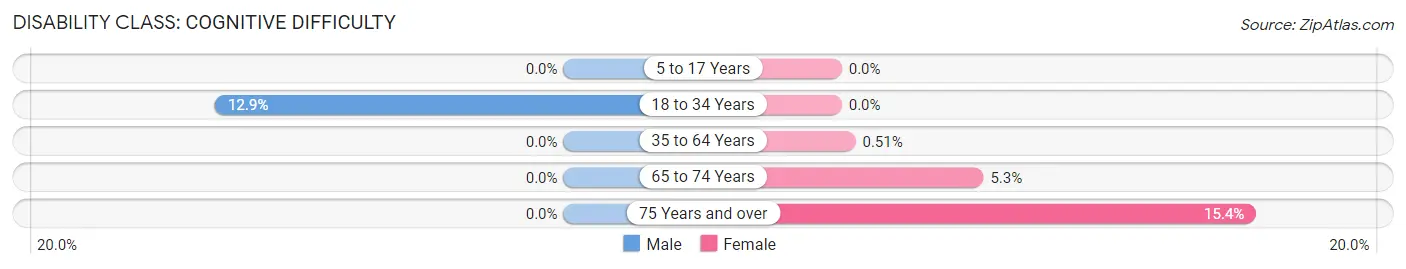
| Age Bracket | Male | Female |
| 5 to 17 Years | 0 (0.0%) | 0 (0.0%) |
| 18 to 34 Years | 15 (12.9%) | 0 (0.0%) |
| 35 to 64 Years | 0 (0.0%) | 1 (0.5%) |
| 65 to 74 Years | 0 (0.0%) | 2 (5.3%) |
| 75 Years and over | 0 (0.0%) | 2 (15.4%) |
Disability Class: Ambulatory Difficulty
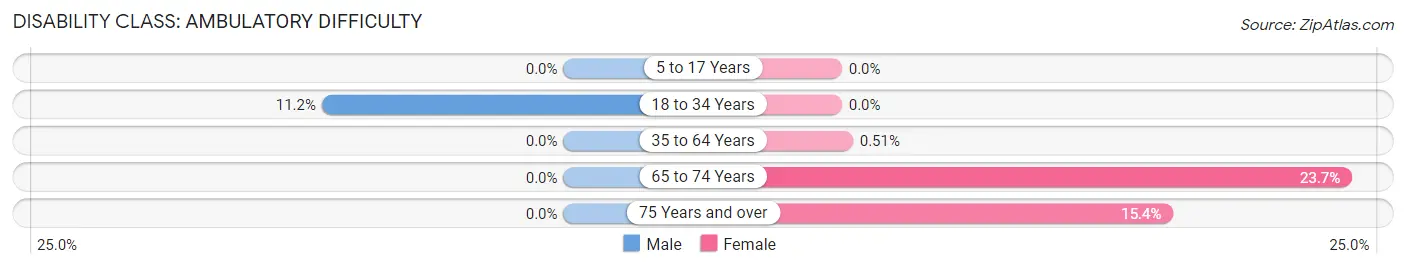
| Age Bracket | Male | Female |
| 5 to 17 Years | 0 (0.0%) | 0 (0.0%) |
| 18 to 34 Years | 13 (11.2%) | 0 (0.0%) |
| 35 to 64 Years | 0 (0.0%) | 1 (0.5%) |
| 65 to 74 Years | 0 (0.0%) | 9 (23.7%) |
| 75 Years and over | 0 (0.0%) | 2 (15.4%) |
Disability Class: Self-Care Difficulty
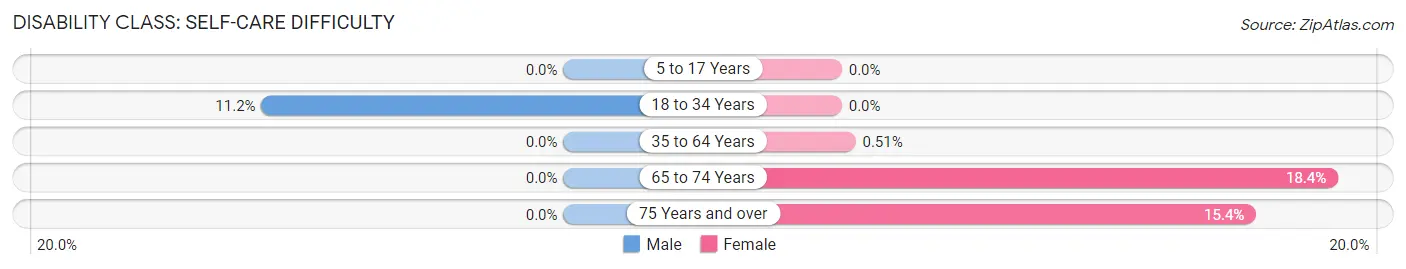
| Age Bracket | Male | Female |
| 5 to 17 Years | 0 (0.0%) | 0 (0.0%) |
| 18 to 34 Years | 13 (11.2%) | 0 (0.0%) |
| 35 to 64 Years | 0 (0.0%) | 1 (0.5%) |
| 65 to 74 Years | 0 (0.0%) | 7 (18.4%) |
| 75 Years and over | 0 (0.0%) | 2 (15.4%) |
Technology Access in Pavilion
Computing Device Access in Pavilion
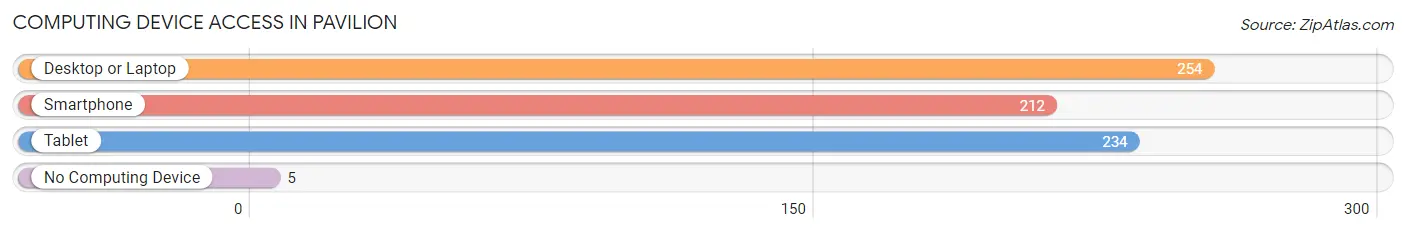
| Device Type | # Households | % Households |
| Desktop or Laptop | 254 | 92.7% |
| Smartphone | 212 | 77.4% |
| Tablet | 234 | 85.4% |
| No Computing Device | 5 | 1.8% |
| Total | 274 | 100.0% |
Internet Access in Pavilion
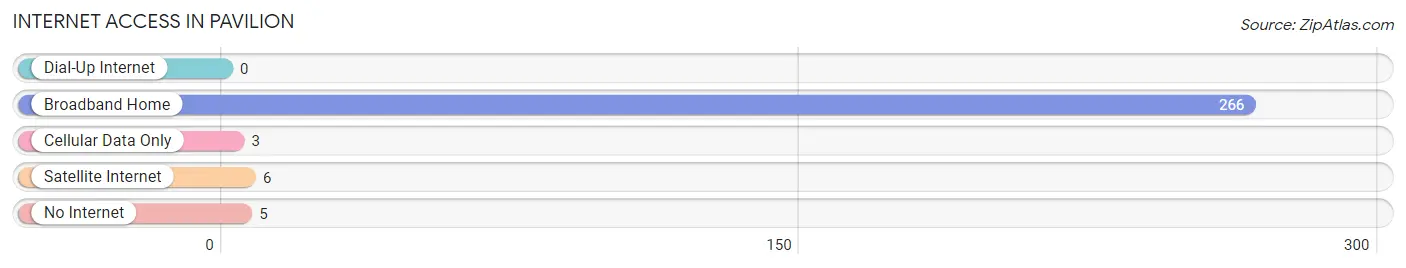
| Internet Type | # Households | % Households |
| Dial-Up Internet | 0 | 0.0% |
| Broadband Home | 266 | 97.1% |
| Cellular Data Only | 3 | 1.1% |
| Satellite Internet | 6 | 2.2% |
| No Internet | 5 | 1.8% |
| Total | 274 | 100.0% |
Pavilion Summary
Pavilion is a town located in Genesee County, New York, United States. The population was 2,845 at the 2010 census. The town is named after the Pavilion Hotel, which was built in 1825.
Geography
Pavilion is located in the northwest corner of Genesee County, bordered by Wyoming County to the north, Livingston County to the east, and the Town of Batavia to the south and west. According to the United States Census Bureau, the town has a total area of 36.2sqmi, of which 36.1sqmi is land and 0.1sqmi, or 0.25%, is water.
The Tonawanda Creek forms the northern boundary of the town. The Genesee River flows through the town, passing through the hamlet of Pavilion.
Demographics
As of the census of 2000, there were 2,845 people, 1,072 households, and 803 families residing in the town. The population density was 78.7 people per square mile (30.4/km^2). There were 1,150 housing units at an average density of 31.8 per square mile (12.3/km^2). The racial makeup of the town was 98.45% White, 0.21% African American, 0.14% Native American, 0.14% Asian, 0.14% from other races, and 0.93% from two or more races. Hispanic or Latino of any race were 0.53% of the population.
There were 1,072 households, out of which 33.7% had children under the age of 18 living with them, 62.2% were married couples living together, 7.7% had a female householder with no husband present, and 25.7% were non-families. 21.2% of all households were made up of individuals, and 9.2% had someone living alone who was 65 years of age or older. The average household size was 2.65 and the average family size was 3.08.
In the town, the population was spread out, with 26.2% under the age of 18, 6.7% from 18 to 24, 28.2% from 25 to 44, 25.2% from 45 to 64, and 13.7% who were 65 years of age or older. The median age was 39 years. For every 100 females, there were 100.2 males. For every 100 females age 18 and over, there were 97.2 males.
The median income for a household in the town was $45,938, and the median income for a family was $51,964. Males had a median income of $37,917 versus $25,938 for females. The per capita income for the town was $19,945. About 4.2% of families and 6.2% of the population were below the poverty line, including 8.2% of those under age 18 and 5.2% of those age 65 or over.
Economy
Pavilion is a rural town with a primarily agricultural economy. The town is home to several farms, including dairy farms, vegetable farms, and fruit farms. The town is also home to several small businesses, including a few restaurants, a hardware store, and a few convenience stores.
The town is also home to a few small manufacturing companies, including a plastics manufacturer and a metal fabrication company. The town is also home to a few small technology companies, including a software development company and a web design company.
The town is also home to a few small tourist attractions, including a winery, a golf course, and a few small museums.
Conclusion
Pavilion is a small town located in Genesee County, New York. The town has a population of 2,845 as of the 2010 census. The town is primarily rural, with a primarily agricultural economy. The town is home to several farms, small businesses, and a few small manufacturing and technology companies. The town is also home to a few small tourist attractions.
Common Questions
What is Per Capita Income in Pavilion?
Per Capita income in Pavilion is $36,743.
What is the Median Family Income in Pavilion?
Median Family Income in Pavilion is $125,395.
What is the Median Household income in Pavilion?
Median Household Income in Pavilion is $87,500.
What is Inequality or Gini Index in Pavilion?
Inequality or Gini Index in Pavilion is 0.26.
What is the Total Population of Pavilion?
Total Population of Pavilion is 715.
What is the Total Male Population of Pavilion?
Total Male Population of Pavilion is 323.
What is the Total Female Population of Pavilion?
Total Female Population of Pavilion is 392.
What is the Ratio of Males per 100 Females in Pavilion?
There are 82.40 Males per 100 Females in Pavilion.
What is the Ratio of Females per 100 Males in Pavilion?
There are 121.36 Females per 100 Males in Pavilion.
What is the Median Population Age in Pavilion?
Median Population Age in Pavilion is 43.4 Years.
What is the Average Family Size in Pavilion
Average Family Size in Pavilion is 2.8 People.
What is the Average Household Size in Pavilion
Average Household Size in Pavilion is 2.6 People.
How Large is the Labor Force in Pavilion?
There are 452 People in the Labor Forcein in Pavilion.
What is the Percentage of People in the Labor Force in Pavilion?
74.0% of People are in the Labor Force in Pavilion.
What is the Unemployment Rate in Pavilion?
Unemployment Rate in Pavilion is 10.2%.