Panama, NY Map & Demographics
Panama Map
Panama Overview
$28,558
PER CAPITA INCOME
$67,500
AVG FAMILY INCOME
$53,889
AVG HOUSEHOLD INCOME
4.5%
WAGE / INCOME GAP [ % ]
95.5¢/ $1
WAGE / INCOME GAP [ $ ]
0.39
INEQUALITY / GINI INDEX
484
TOTAL POPULATION
257
MALE POPULATION
227
FEMALE POPULATION
113.22
MALES / 100 FEMALES
88.33
FEMALES / 100 MALES
44.6
MEDIAN AGE
2.9
AVG FAMILY SIZE
2.2
AVG HOUSEHOLD SIZE
247
LABOR FORCE [ PEOPLE ]
59.1%
PERCENT IN LABOR FORCE
0.8%
UNEMPLOYMENT RATE
Panama Zip Codes
Panama Area Codes
Income in Panama
Income Overview in Panama
Per Capita Income in Panama is $28,558, while median incomes of families and households are $67,500 and $53,889 respectively.
| Characteristic | Number | Measure |
| Per Capita Income | 484 | $28,558 |
| Median Family Income | 126 | $67,500 |
| Mean Family Income | 126 | $79,810 |
| Median Household Income | 218 | $53,889 |
| Mean Household Income | 218 | $62,040 |
| Income Deficit | 126 | $0 |
| Wage / Income Gap (%) | 484 | 4.54% |
| Wage / Income Gap ($) | 484 | 95.46¢ per $1 |
| Gini / Inequality Index | 484 | 0.39 |
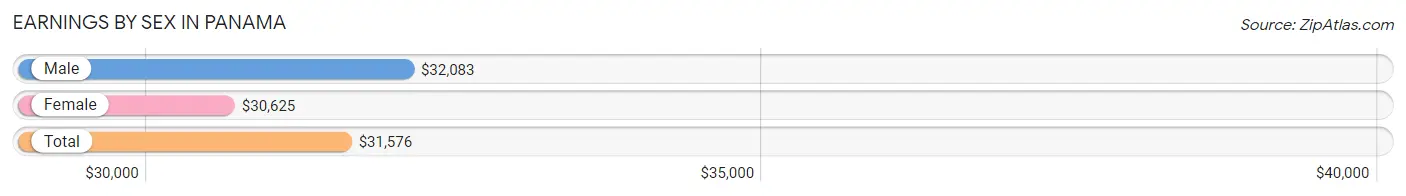
Earnings by Sex in Panama
Average Earnings in Panama are $31,576, $32,083 for men and $30,625 for women, a difference of 4.5%.
| Sex | Number | Average Earnings |
| Male | 147 (56.3%) | $32,083 |
| Female | 114 (43.7%) | $30,625 |
| Total | 261 (100.0%) | $31,576 |
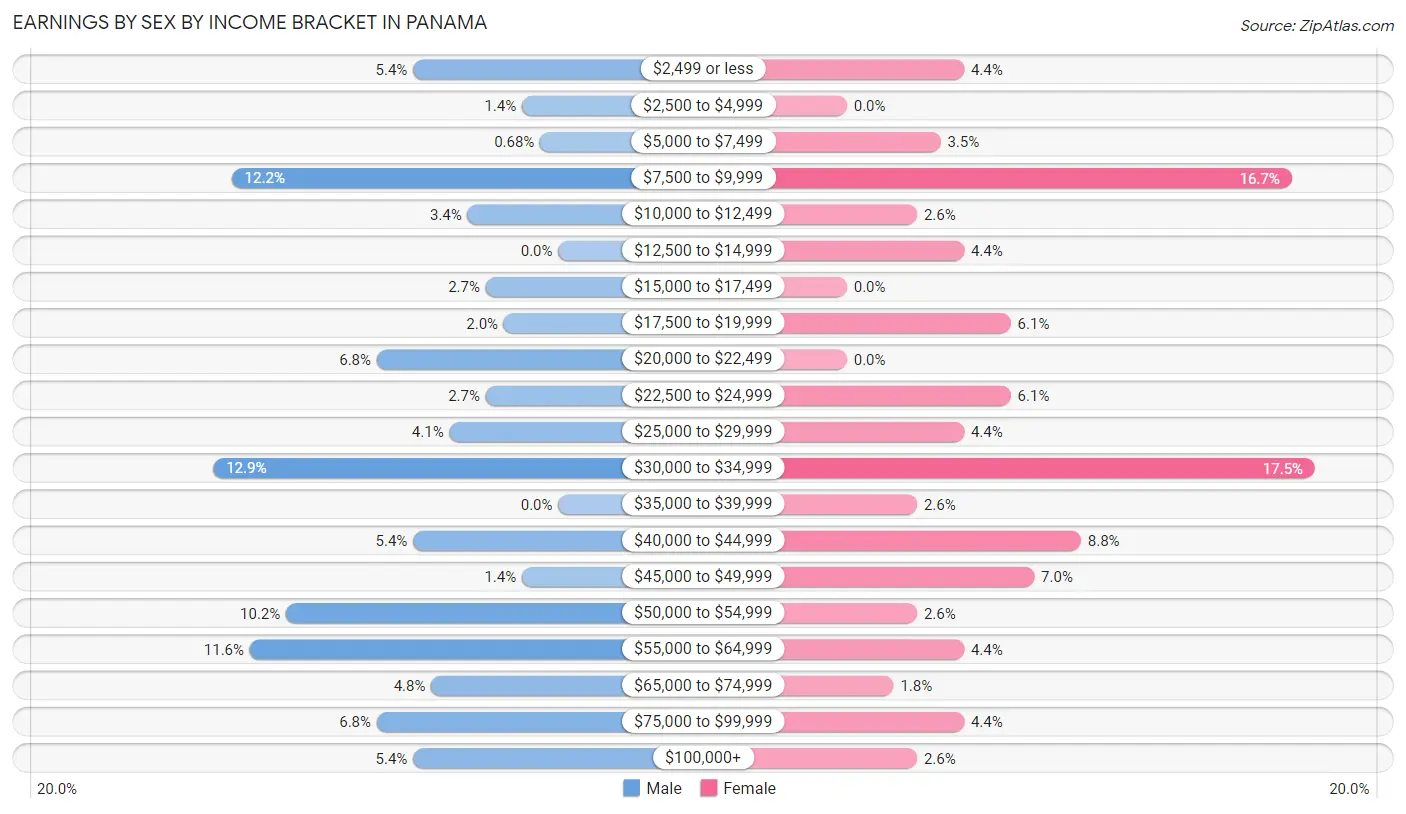
Earnings by Sex by Income Bracket in Panama
The most common earnings brackets in Panama are $30,000 to $34,999 for men (19 | 12.9%) and $30,000 to $34,999 for women (20 | 17.5%).
| Income | Male | Female |
| $2,499 or less | 8 (5.4%) | 5 (4.4%) |
| $2,500 to $4,999 | 2 (1.4%) | 0 (0.0%) |
| $5,000 to $7,499 | 1 (0.7%) | 4 (3.5%) |
| $7,500 to $9,999 | 18 (12.2%) | 19 (16.7%) |
| $10,000 to $12,499 | 5 (3.4%) | 3 (2.6%) |
| $12,500 to $14,999 | 0 (0.0%) | 5 (4.4%) |
| $15,000 to $17,499 | 4 (2.7%) | 0 (0.0%) |
| $17,500 to $19,999 | 3 (2.0%) | 7 (6.1%) |
| $20,000 to $22,499 | 10 (6.8%) | 0 (0.0%) |
| $22,500 to $24,999 | 4 (2.7%) | 7 (6.1%) |
| $25,000 to $29,999 | 6 (4.1%) | 5 (4.4%) |
| $30,000 to $34,999 | 19 (12.9%) | 20 (17.5%) |
| $35,000 to $39,999 | 0 (0.0%) | 3 (2.6%) |
| $40,000 to $44,999 | 8 (5.4%) | 10 (8.8%) |
| $45,000 to $49,999 | 2 (1.4%) | 8 (7.0%) |
| $50,000 to $54,999 | 15 (10.2%) | 3 (2.6%) |
| $55,000 to $64,999 | 17 (11.6%) | 5 (4.4%) |
| $65,000 to $74,999 | 7 (4.8%) | 2 (1.8%) |
| $75,000 to $99,999 | 10 (6.8%) | 5 (4.4%) |
| $100,000+ | 8 (5.4%) | 3 (2.6%) |
| Total | 147 (100.0%) | 114 (100.0%) |
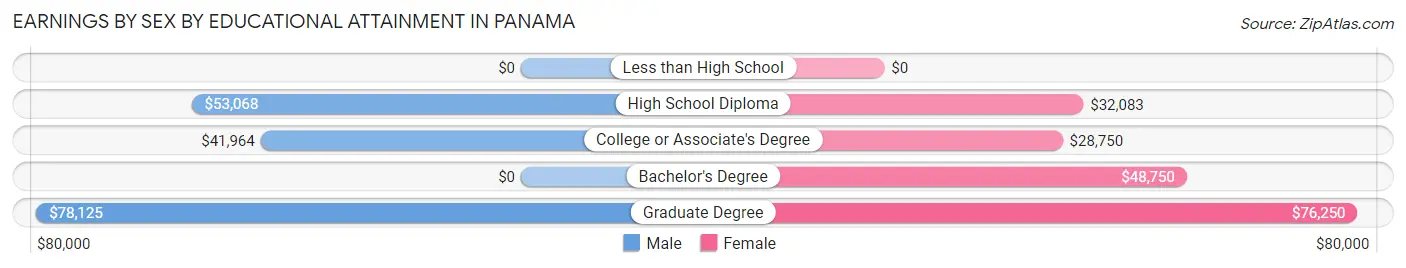
Earnings by Sex by Educational Attainment in Panama
Average earnings in Panama are $52,500 for men and $33,472 for women, a difference of 36.2%. Men with an educational attainment of graduate degree enjoy the highest average annual earnings of $78,125, while those with college or associate's degree education earn the least with $41,964. Women with an educational attainment of graduate degree earn the most with the average annual earnings of $76,250, while those with college or associate's degree education have the smallest earnings of $28,750.
| Educational Attainment | Male Income | Female Income |
| Less than High School | - | - |
| High School Diploma | $53,068 | $32,083 |
| College or Associate's Degree | $41,964 | $28,750 |
| Bachelor's Degree | - | - |
| Graduate Degree | $78,125 | $76,250 |
| Total | $52,500 | $33,472 |
Family Income in Panama
Family Income Brackets in Panama
According to the Panama family income data, there are 35 families falling into the $50,000 to $74,999 income range, which is the most common income bracket and makes up 27.8% of all families.
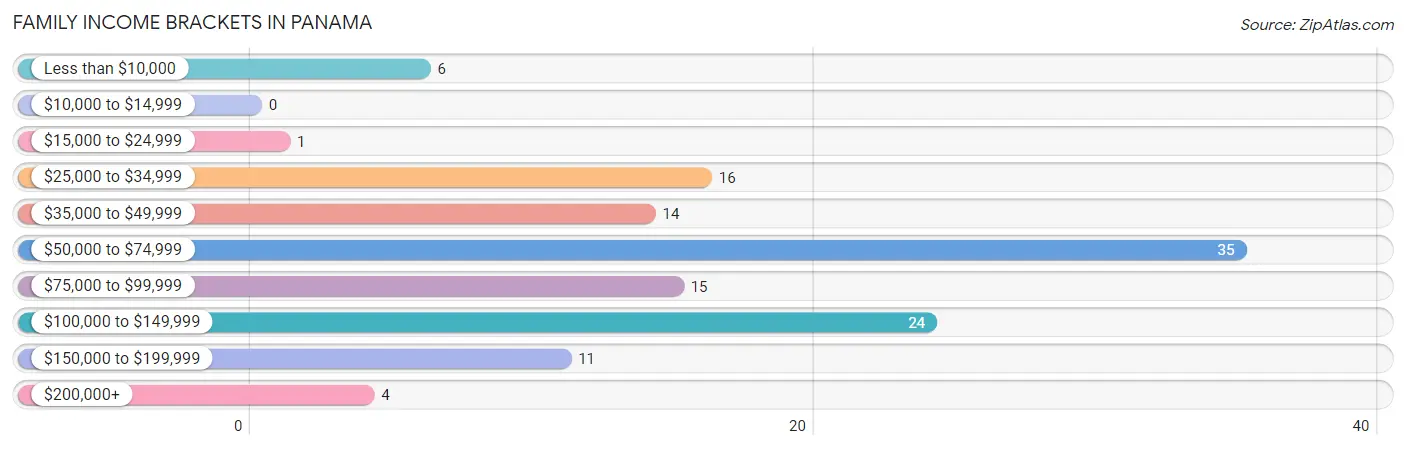
| Income Bracket | # Families | % Families |
| Less than $10,000 | 6 | 4.8% |
| $10,000 to $14,999 | 0 | 0.0% |
| $15,000 to $24,999 | 1 | 0.8% |
| $25,000 to $34,999 | 16 | 12.7% |
| $35,000 to $49,999 | 14 | 11.1% |
| $50,000 to $74,999 | 35 | 27.8% |
| $75,000 to $99,999 | 15 | 11.9% |
| $100,000 to $149,999 | 24 | 19.0% |
| $150,000 to $199,999 | 11 | 8.7% |
| $200,000+ | 4 | 3.2% |
Family Income by Famaliy Size in Panama
4-person families (17 | 13.5%) account for the highest median family income in Panama with $115,313 per family, while 2-person families (83 | 65.9%) have the highest median income of $31,562 per family member.
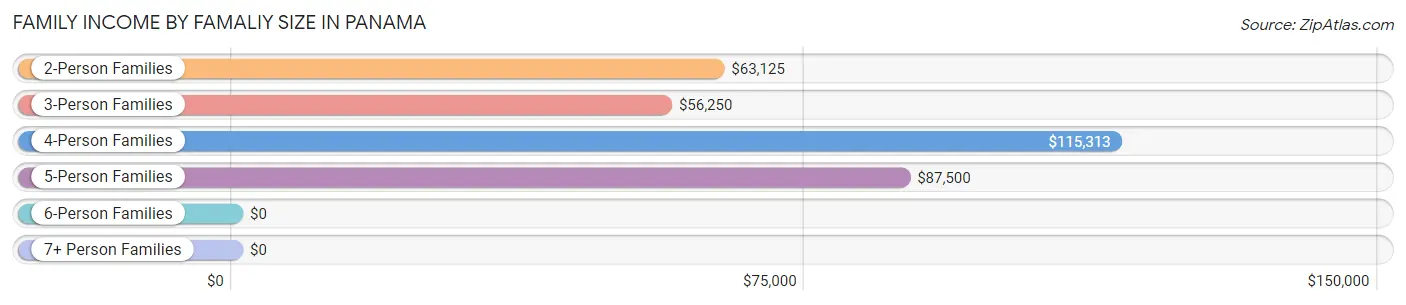
| Income Bracket | # Families | Median Income |
| 2-Person Families | 83 (65.9%) | $63,125 |
| 3-Person Families | 10 (7.9%) | $56,250 |
| 4-Person Families | 17 (13.5%) | $115,313 |
| 5-Person Families | 8 (6.4%) | $87,500 |
| 6-Person Families | 8 (6.4%) | $0 |
| 7+ Person Families | 0 (0.0%) | $0 |
| Total | 126 (100.0%) | $67,500 |
Family Income by Number of Earners in Panama
The median family income in Panama is $67,500, with families comprising 3+ earners (14) having the highest median family income of $127,500, while families with no earners (30) have the lowest median family income of $53,214, accounting for 11.1% and 23.8% of families, respectively.
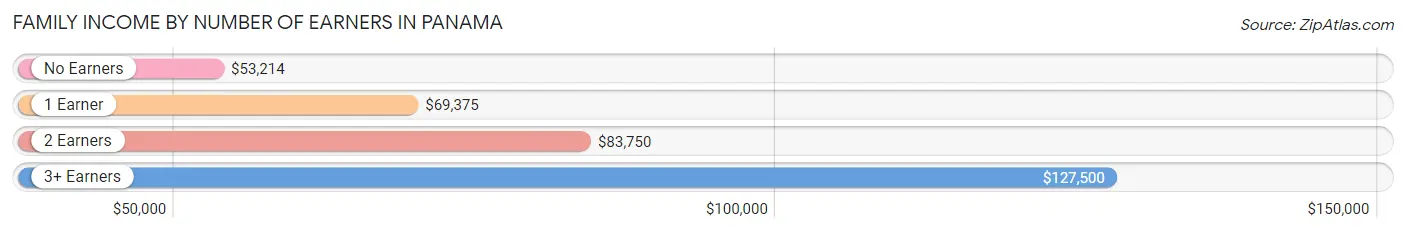
| Number of Earners | # Families | Median Income |
| No Earners | 30 (23.8%) | $53,214 |
| 1 Earner | 34 (27.0%) | $69,375 |
| 2 Earners | 48 (38.1%) | $83,750 |
| 3+ Earners | 14 (11.1%) | $127,500 |
| Total | 126 (100.0%) | $67,500 |
Household Income in Panama
Household Income Brackets in Panama
With 55 households falling in the category, the $50,000 to $74,999 income range is the most frequent in Panama, accounting for 25.2% of all households. In contrast, only 4 households (1.8%) fall into the $200,000+ income bracket, making it the least populous group.
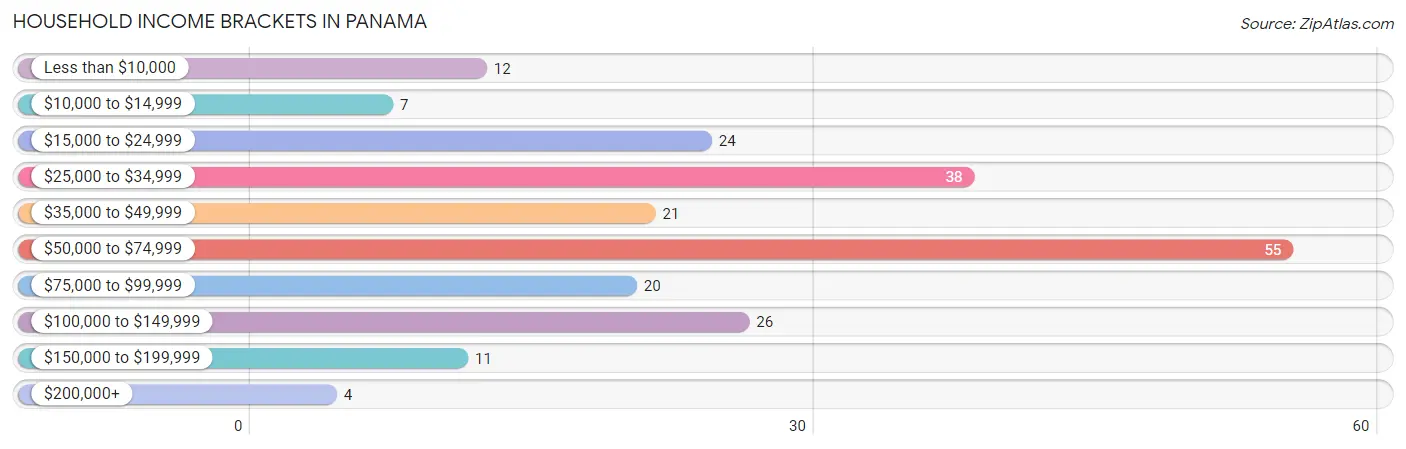
| Income Bracket | # Households | % Households |
| Less than $10,000 | 12 | 5.5% |
| $10,000 to $14,999 | 7 | 3.2% |
| $15,000 to $24,999 | 24 | 11.0% |
| $25,000 to $34,999 | 38 | 17.4% |
| $35,000 to $49,999 | 21 | 9.6% |
| $50,000 to $74,999 | 55 | 25.2% |
| $75,000 to $99,999 | 20 | 9.2% |
| $100,000 to $149,999 | 26 | 11.9% |
| $150,000 to $199,999 | 11 | 5.0% |
| $200,000+ | 4 | 1.8% |
Household Income by Householder Age in Panama
The median household income in Panama is $53,889, with the highest median household income of $75,417 found in the 45 to 64 years age bracket for the primary householder. A total of 78 households (35.8%) fall into this category. Meanwhile, the 15 to 24 years age bracket for the primary householder has the lowest median household income of $27,500, with 14 households (6.4%) in this group.
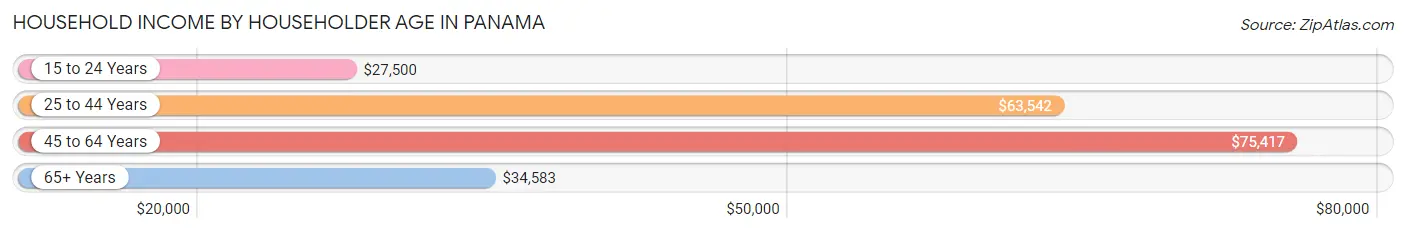
| Income Bracket | # Households | Median Income |
| 15 to 24 Years | 14 (6.4%) | $27,500 |
| 25 to 44 Years | 58 (26.6%) | $63,542 |
| 45 to 64 Years | 78 (35.8%) | $75,417 |
| 65+ Years | 68 (31.2%) | $34,583 |
| Total | 218 (100.0%) | $53,889 |
Poverty in Panama
Income Below Poverty by Sex and Age in Panama
With 5.4% poverty level for males and 17.6% for females among the residents of Panama, under 5 year old males and under 5 year old females are the most vulnerable to poverty, with 3 males (37.5%) and 5 females (62.5%) in their respective age groups living below the poverty level.
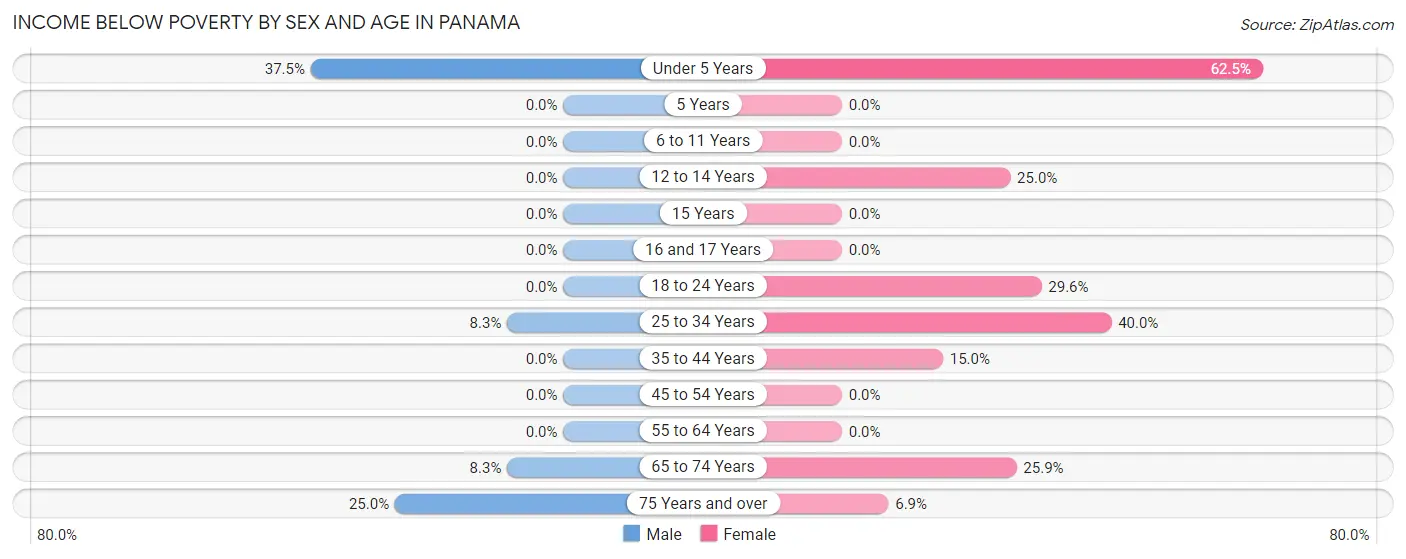
| Age Bracket | Male | Female |
| Under 5 Years | 3 (37.5%) | 5 (62.5%) |
| 5 Years | 0 (0.0%) | 0 (0.0%) |
| 6 to 11 Years | 0 (0.0%) | 0 (0.0%) |
| 12 to 14 Years | 0 (0.0%) | 3 (25.0%) |
| 15 Years | 0 (0.0%) | 0 (0.0%) |
| 16 and 17 Years | 0 (0.0%) | 0 (0.0%) |
| 18 to 24 Years | 0 (0.0%) | 8 (29.6%) |
| 25 to 34 Years | 2 (8.3%) | 12 (40.0%) |
| 35 to 44 Years | 0 (0.0%) | 3 (15.0%) |
| 45 to 54 Years | 0 (0.0%) | 0 (0.0%) |
| 55 to 64 Years | 0 (0.0%) | 0 (0.0%) |
| 65 to 74 Years | 2 (8.3%) | 7 (25.9%) |
| 75 Years and over | 7 (25.0%) | 2 (6.9%) |
| Total | 14 (5.4%) | 40 (17.6%) |
Income Above Poverty by Sex and Age in Panama
According to the poverty statistics in Panama, males aged 6 to 11 years and females aged 6 to 11 years are the age groups that are most secure financially, with 100.0% of males and 100.0% of females in these age groups living above the poverty line.
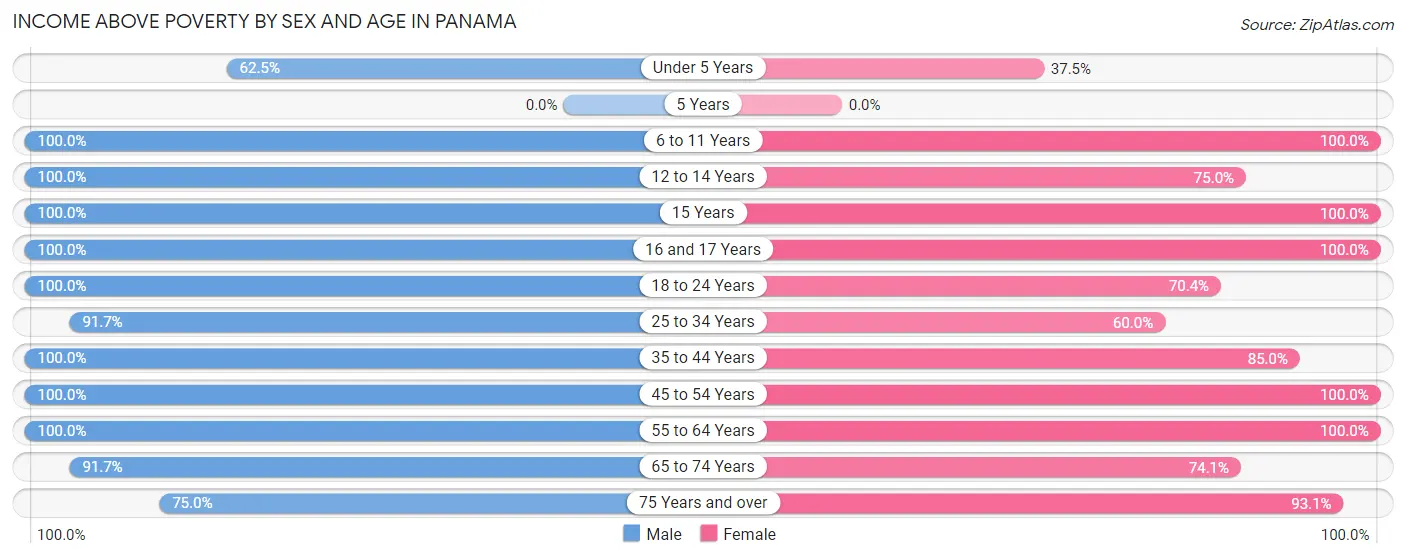
| Age Bracket | Male | Female |
| Under 5 Years | 5 (62.5%) | 3 (37.5%) |
| 5 Years | 0 (0.0%) | 0 (0.0%) |
| 6 to 11 Years | 9 (100.0%) | 9 (100.0%) |
| 12 to 14 Years | 10 (100.0%) | 9 (75.0%) |
| 15 Years | 5 (100.0%) | 5 (100.0%) |
| 16 and 17 Years | 8 (100.0%) | 4 (100.0%) |
| 18 to 24 Years | 39 (100.0%) | 19 (70.4%) |
| 25 to 34 Years | 22 (91.7%) | 18 (60.0%) |
| 35 to 44 Years | 26 (100.0%) | 17 (85.0%) |
| 45 to 54 Years | 36 (100.0%) | 23 (100.0%) |
| 55 to 64 Years | 40 (100.0%) | 33 (100.0%) |
| 65 to 74 Years | 22 (91.7%) | 20 (74.1%) |
| 75 Years and over | 21 (75.0%) | 27 (93.1%) |
| Total | 243 (94.6%) | 187 (82.4%) |
Income Below Poverty Among Married-Couple Families in Panama
The poverty statistics for married-couple families in Panama show that 2.0% or 2 of the total 100 families live below the poverty line. Families with no children have the highest poverty rate of 2.6%, comprising of 2 families. On the other hand, families with 1 or 2 children have the lowest poverty rate of 0.0%, which includes 0 families.
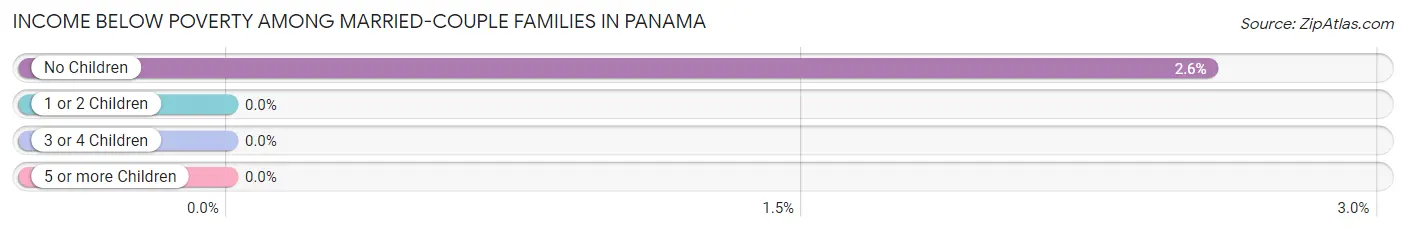
| Children | Above Poverty | Below Poverty |
| No Children | 76 (97.4%) | 2 (2.6%) |
| 1 or 2 Children | 13 (100.0%) | 0 (0.0%) |
| 3 or 4 Children | 9 (100.0%) | 0 (0.0%) |
| 5 or more Children | 0 (0.0%) | 0 (0.0%) |
| Total | 98 (98.0%) | 2 (2.0%) |
Income Below Poverty Among Single-Parent Households in Panama
According to the poverty data in Panama, 25.0% or 2 single-father households and 16.7% or 3 single-mother households are living below the poverty line. Among single-father households, those with 1 or 2 children have the highest poverty rate, with 2 households (50.0%) experiencing poverty. Likewise, among single-mother households, those with 3 or 4 children have the highest poverty rate, with 1 households (100.0%) falling below the poverty line.
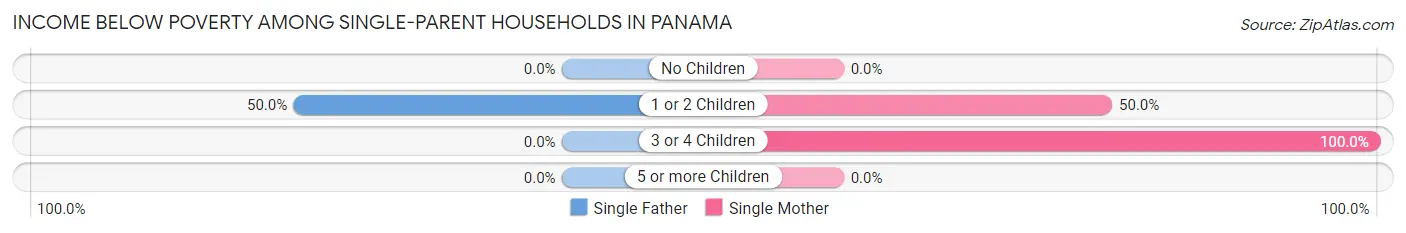
| Children | Single Father | Single Mother |
| No Children | 0 (0.0%) | 0 (0.0%) |
| 1 or 2 Children | 2 (50.0%) | 2 (50.0%) |
| 3 or 4 Children | 0 (0.0%) | 1 (100.0%) |
| 5 or more Children | 0 (0.0%) | 0 (0.0%) |
| Total | 2 (25.0%) | 3 (16.7%) |
Income Below Poverty Among Married-Couple vs Single-Parent Households in Panama
The poverty data for Panama shows that 2 of the married-couple family households (2.0%) and 5 of the single-parent households (19.2%) are living below the poverty level. Within the married-couple family households, those with no children have the highest poverty rate, with 2 households (2.6%) falling below the poverty line. Among the single-parent households, those with 1 or 2 children have the highest poverty rate, with 4 household (50.0%) living below poverty.
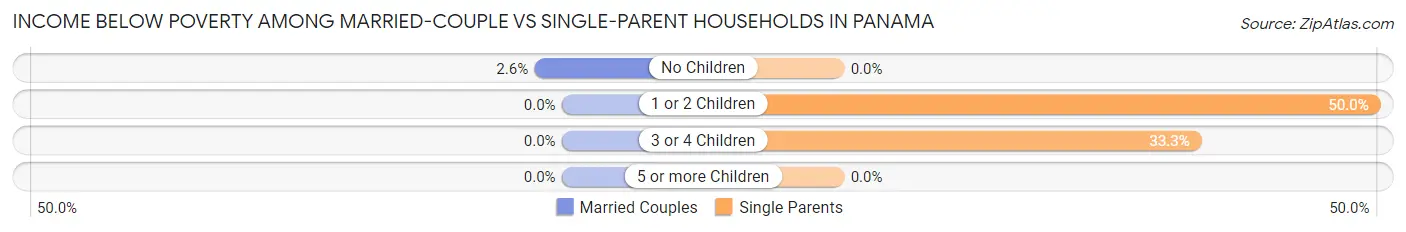
| Children | Married-Couple Families | Single-Parent Households |
| No Children | 2 (2.6%) | 0 (0.0%) |
| 1 or 2 Children | 0 (0.0%) | 4 (50.0%) |
| 3 or 4 Children | 0 (0.0%) | 1 (33.3%) |
| 5 or more Children | 0 (0.0%) | 0 (0.0%) |
| Total | 2 (2.0%) | 5 (19.2%) |
Race in Panama
The most populous races in Panama are White / Caucasian (475 | 98.1%), Two or more Races (6 | 1.2%), and Hispanic or Latino (4 | 0.8%).
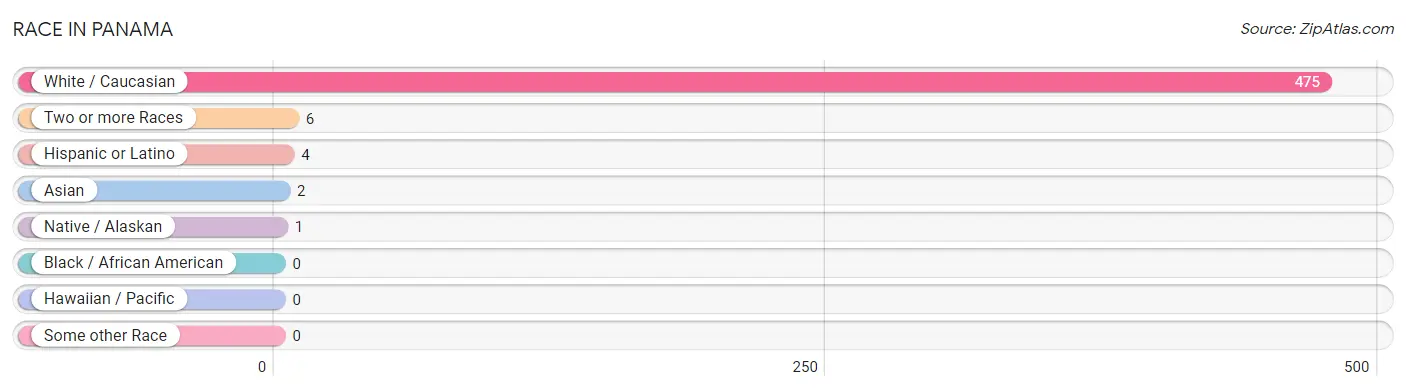
| Race | # Population | % Population |
| Asian | 2 | 0.4% |
| Black / African American | 0 | 0.0% |
| Hawaiian / Pacific | 0 | 0.0% |
| Hispanic or Latino | 4 | 0.8% |
| Native / Alaskan | 1 | 0.2% |
| White / Caucasian | 475 | 98.1% |
| Two or more Races | 6 | 1.2% |
| Some other Race | 0 | 0.0% |
| Total | 484 | 100.0% |
Ancestry in Panama
The most populous ancestries reported in Panama are English (108 | 22.3%), German (73 | 15.1%), Swedish (65 | 13.4%), Irish (61 | 12.6%), and Dutch (31 | 6.4%), together accounting for 69.8% of all Panama residents.
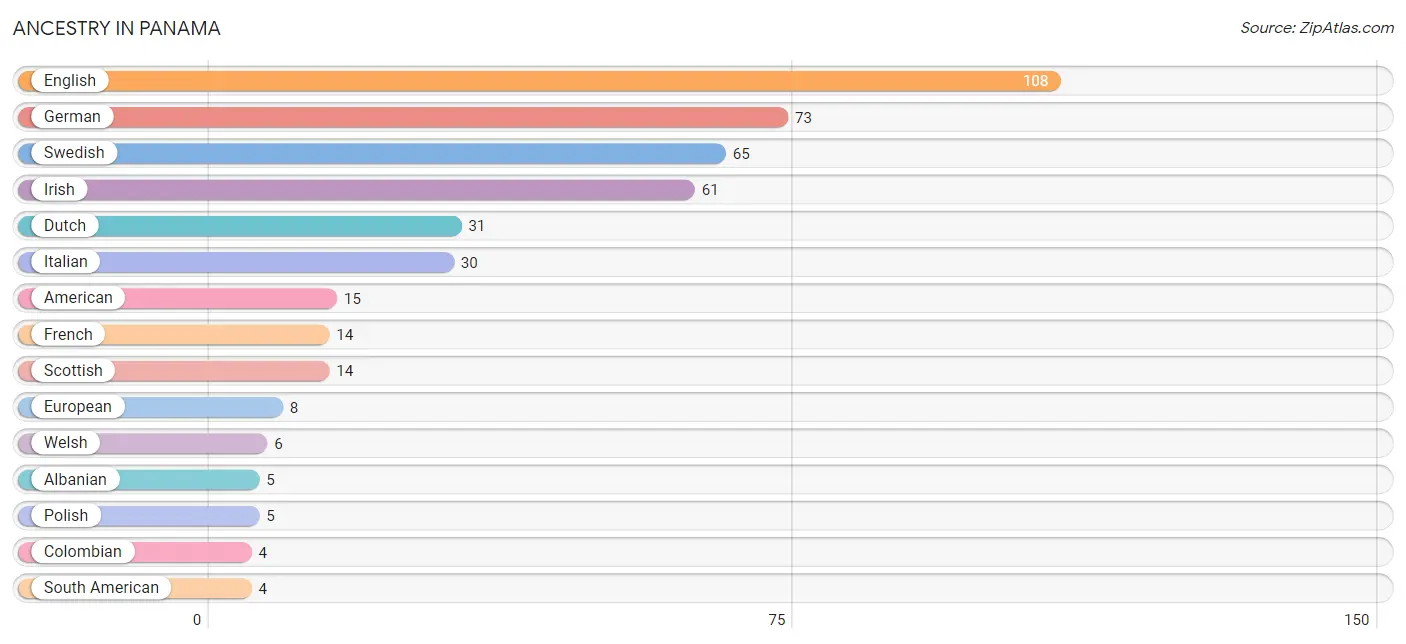
| Ancestry | # Population | % Population |
| Albanian | 5 | 1.0% |
| American | 15 | 3.1% |
| Belgian | 1 | 0.2% |
| Colombian | 4 | 0.8% |
| Czech | 1 | 0.2% |
| Danish | 2 | 0.4% |
| Dutch | 31 | 6.4% |
| English | 108 | 22.3% |
| European | 8 | 1.7% |
| French | 14 | 2.9% |
| French Canadian | 2 | 0.4% |
| German | 73 | 15.1% |
| Hungarian | 2 | 0.4% |
| Irish | 61 | 12.6% |
| Iroquois | 3 | 0.6% |
| Italian | 30 | 6.2% |
| Norwegian | 1 | 0.2% |
| Pakistani | 2 | 0.4% |
| Pennsylvania German | 2 | 0.4% |
| Polish | 5 | 1.0% |
| Scotch-Irish | 1 | 0.2% |
| Scottish | 14 | 2.9% |
| South American | 4 | 0.8% |
| Swedish | 65 | 13.4% |
| Ukrainian | 1 | 0.2% |
| Welsh | 6 | 1.2% | View All 26 Rows |
Immigrants in Panama
The most numerous immigrant groups reported in Panama came from Colombia (4 | 0.8%), Latin America (4 | 0.8%), South America (4 | 0.8%), Asia (2 | 0.4%), and South Eastern Asia (2 | 0.4%), together accounting for 3.3% of all Panama residents.
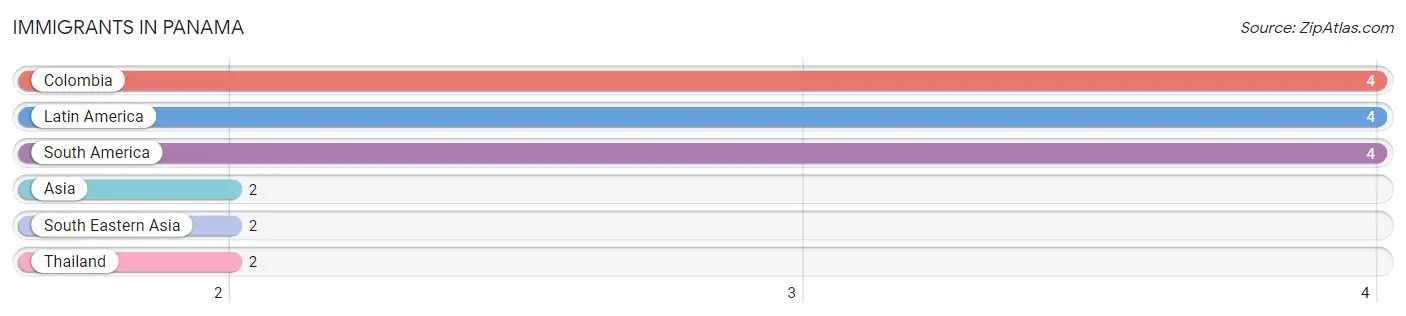
| Immigration Origin | # Population | % Population |
| Asia | 2 | 0.4% |
| Colombia | 4 | 0.8% |
| Latin America | 4 | 0.8% |
| South America | 4 | 0.8% |
| South Eastern Asia | 2 | 0.4% |
| Thailand | 2 | 0.4% | View All 6 Rows |
Sex and Age in Panama
Sex and Age in Panama
The most populous age groups in Panama are 20 to 24 Years (30 | 11.7%) for men and 25 to 29 Years (24 | 10.6%) for women.
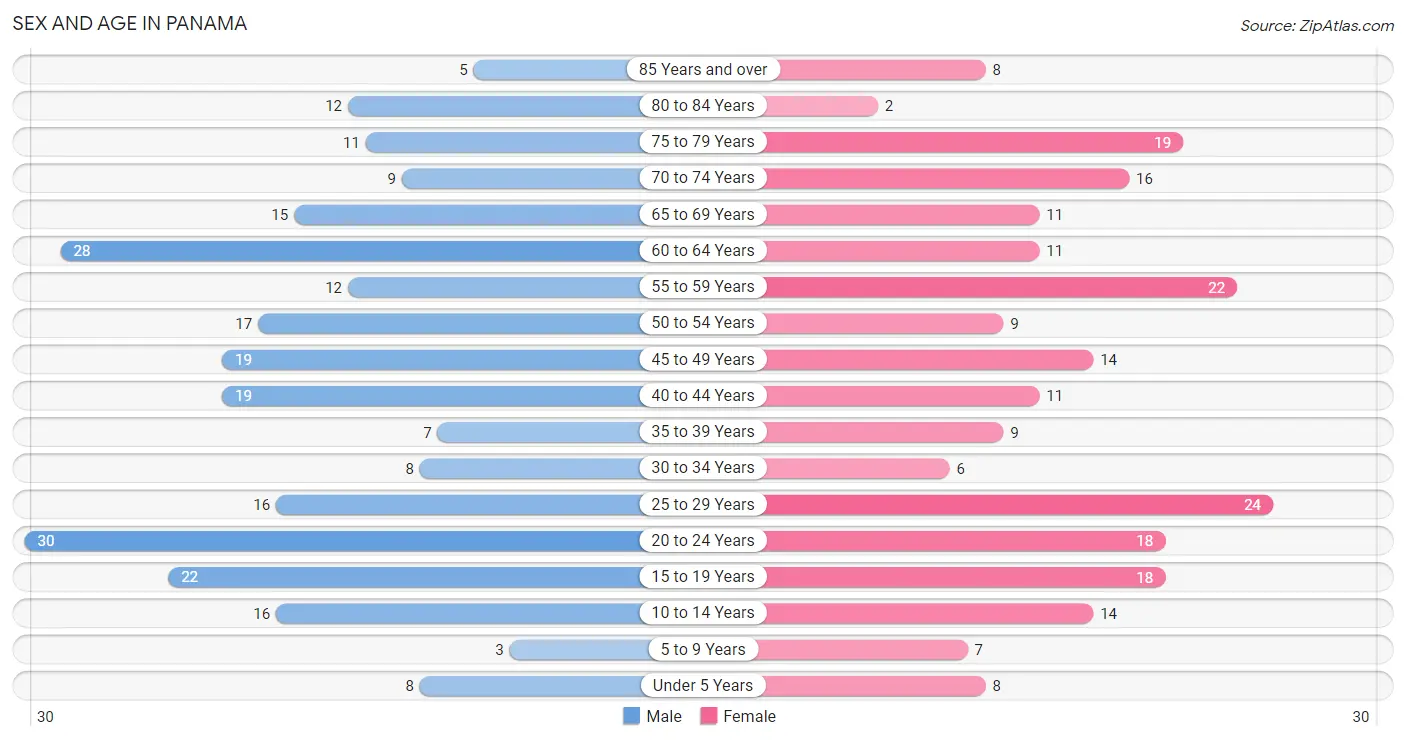
| Age Bracket | Male | Female |
| Under 5 Years | 8 (3.1%) | 8 (3.5%) |
| 5 to 9 Years | 3 (1.2%) | 7 (3.1%) |
| 10 to 14 Years | 16 (6.2%) | 14 (6.2%) |
| 15 to 19 Years | 22 (8.6%) | 18 (7.9%) |
| 20 to 24 Years | 30 (11.7%) | 18 (7.9%) |
| 25 to 29 Years | 16 (6.2%) | 24 (10.6%) |
| 30 to 34 Years | 8 (3.1%) | 6 (2.6%) |
| 35 to 39 Years | 7 (2.7%) | 9 (4.0%) |
| 40 to 44 Years | 19 (7.4%) | 11 (4.9%) |
| 45 to 49 Years | 19 (7.4%) | 14 (6.2%) |
| 50 to 54 Years | 17 (6.6%) | 9 (4.0%) |
| 55 to 59 Years | 12 (4.7%) | 22 (9.7%) |
| 60 to 64 Years | 28 (10.9%) | 11 (4.9%) |
| 65 to 69 Years | 15 (5.8%) | 11 (4.9%) |
| 70 to 74 Years | 9 (3.5%) | 16 (7.0%) |
| 75 to 79 Years | 11 (4.3%) | 19 (8.4%) |
| 80 to 84 Years | 12 (4.7%) | 2 (0.9%) |
| 85 Years and over | 5 (1.9%) | 8 (3.5%) |
| Total | 257 (100.0%) | 227 (100.0%) |
Families and Households in Panama
Median Family Size in Panama
The median family size in Panama is 2.89 persons per family, with single male/father families (8 | 6.4%) accounting for the largest median family size of 3.25 persons per family. On the other hand, single female/mother families (18 | 14.3%) represent the smallest median family size with 2.67 persons per family.
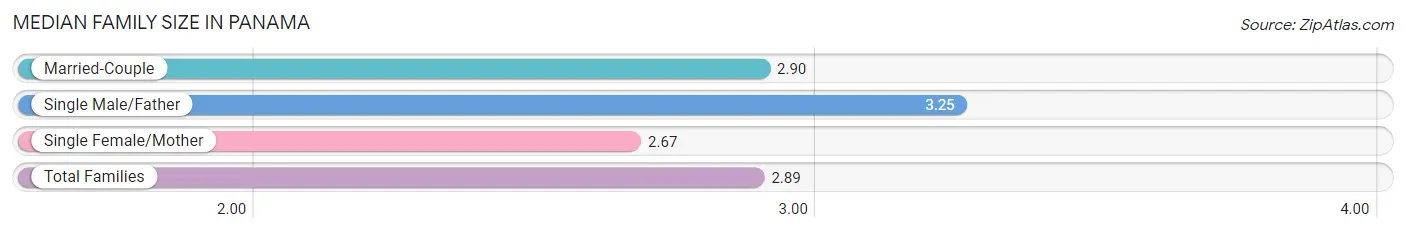
| Family Type | # Families | Family Size |
| Married-Couple | 100 (79.4%) | 2.90 |
| Single Male/Father | 8 (6.4%) | 3.25 |
| Single Female/Mother | 18 (14.3%) | 2.67 |
| Total Families | 126 (100.0%) | 2.89 |
Median Household Size in Panama
The median household size in Panama is 2.22 persons per household, with single male/father households (8 | 3.7%) accounting for the largest median household size of 3.63 persons per household. non-family households (92 | 42.2%) represent the smallest median household size with 1.23 persons per household.
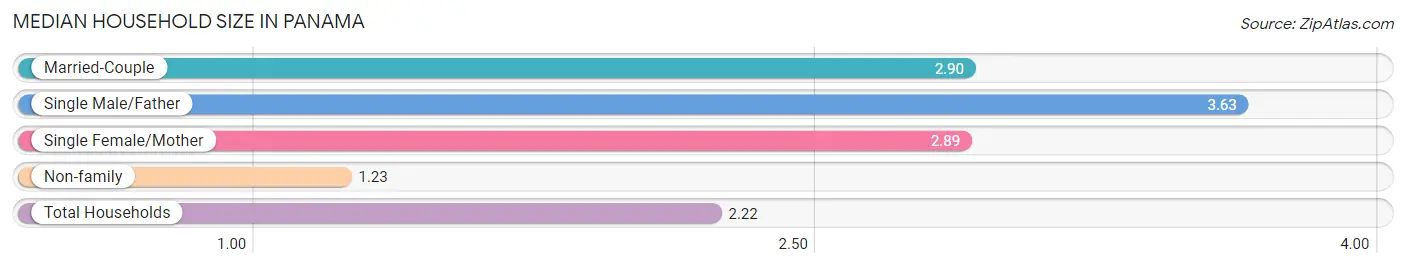
| Household Type | # Households | Household Size |
| Married-Couple | 100 (45.9%) | 2.90 |
| Single Male/Father | 8 (3.7%) | 3.63 |
| Single Female/Mother | 18 (8.3%) | 2.89 |
| Non-family | 92 (42.2%) | 1.23 |
| Total Households | 218 (100.0%) | 2.22 |
Household Size by Marriage Status in Panama
Out of a total of 218 households in Panama, 126 (57.8%) are family households, while 92 (42.2%) are nonfamily households. The most numerous type of family households are 2-person households, comprising 81, and the most common type of nonfamily households are 1-person households, comprising 69.
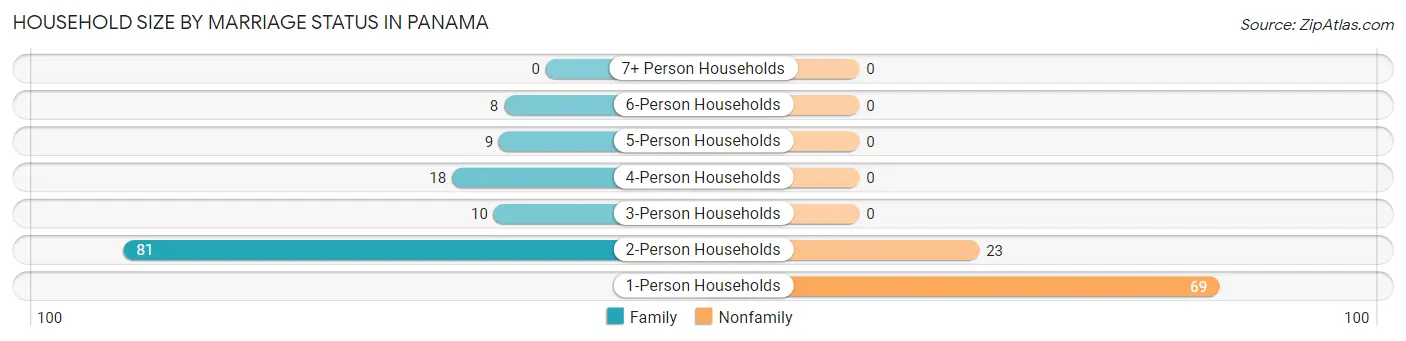
| Household Size | Family Households | Nonfamily Households |
| 1-Person Households | - | 69 (31.7%) |
| 2-Person Households | 81 (37.2%) | 23 (10.5%) |
| 3-Person Households | 10 (4.6%) | 0 (0.0%) |
| 4-Person Households | 18 (8.3%) | 0 (0.0%) |
| 5-Person Households | 9 (4.1%) | 0 (0.0%) |
| 6-Person Households | 8 (3.7%) | 0 (0.0%) |
| 7+ Person Households | 0 (0.0%) | 0 (0.0%) |
| Total | 126 (57.8%) | 92 (42.2%) |
Female Fertility in Panama
Fertility by Age in Panama
Average fertility rate in Panama is 69.0 births per 1,000 women. Women in the age bracket of 35 to 50 years have the highest fertility rate with 139.0 births per 1,000 women. Women in the age bracket of 35 to 50 years acount for 71.4% of all women with births.
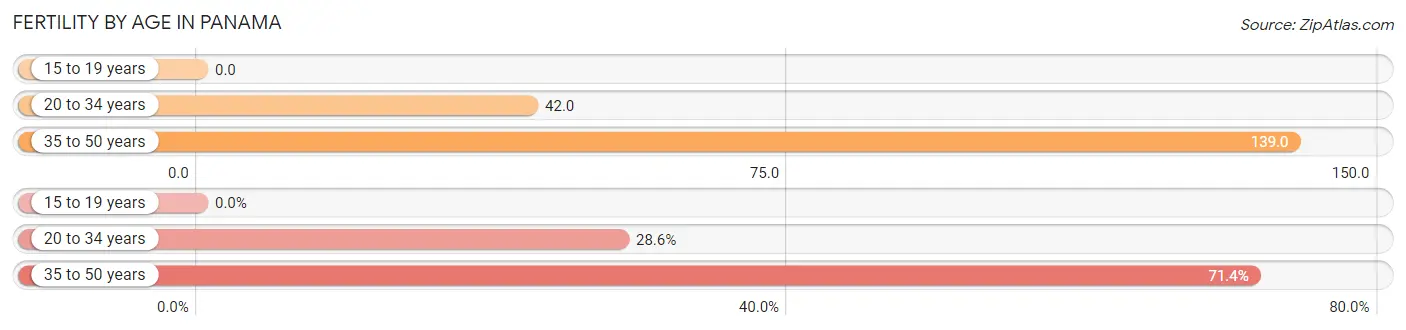
| Age Bracket | Women with Births | Births / 1,000 Women |
| 15 to 19 years | 0 (0.0%) | 0.0 |
| 20 to 34 years | 2 (28.6%) | 42.0 |
| 35 to 50 years | 5 (71.4%) | 139.0 |
| Total | 7 (100.0%) | 69.0 |
Fertility by Age by Marriage Status in Panama
71.4% of women with births (7) in Panama are married. The highest percentage of unmarried women with births falls into 20 to 34 years age bracket with 100.0% of them unmarried at the time of birth, while the lowest percentage of unmarried women with births belong to 35 to 50 years age bracket with 0.0% of them unmarried.
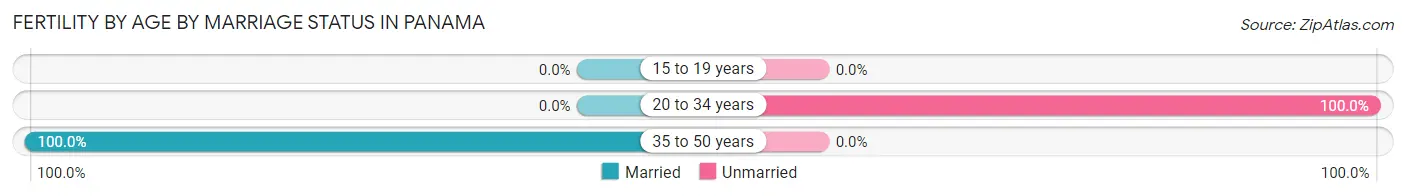
| Age Bracket | Married | Unmarried |
| 15 to 19 years | 0 (0.0%) | 0 (0.0%) |
| 20 to 34 years | 0 (0.0%) | 2 (100.0%) |
| 35 to 50 years | 5 (100.0%) | 0 (0.0%) |
| Total | 5 (71.4%) | 2 (28.6%) |
Fertility by Education in Panama
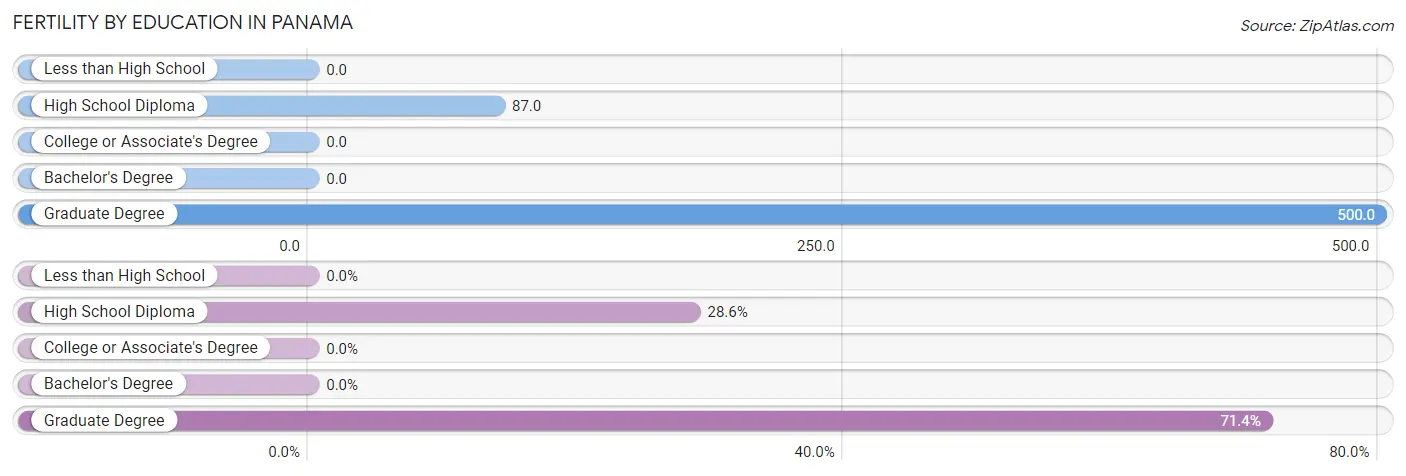
| Educational Attainment | Women with Births | Births / 1,000 Women |
| Less than High School | 0 (0.0%) | 0.0 |
| High School Diploma | 2 (28.6%) | 87.0 |
| College or Associate's Degree | 0 (0.0%) | 0.0 |
| Bachelor's Degree | 0 (0.0%) | 0.0 |
| Graduate Degree | 5 (71.4%) | 500.0 |
| Total | 7 (100.0%) | 69.0 |
Fertility by Education by Marriage Status in Panama
28.6% of women with births in Panama are unmarried. Women with the educational attainment of graduate degree are most likely to be married with 100.0% of them married at childbirth, while women with the educational attainment of high school diploma are least likely to be married with 100.0% of them unmarried at childbirth.
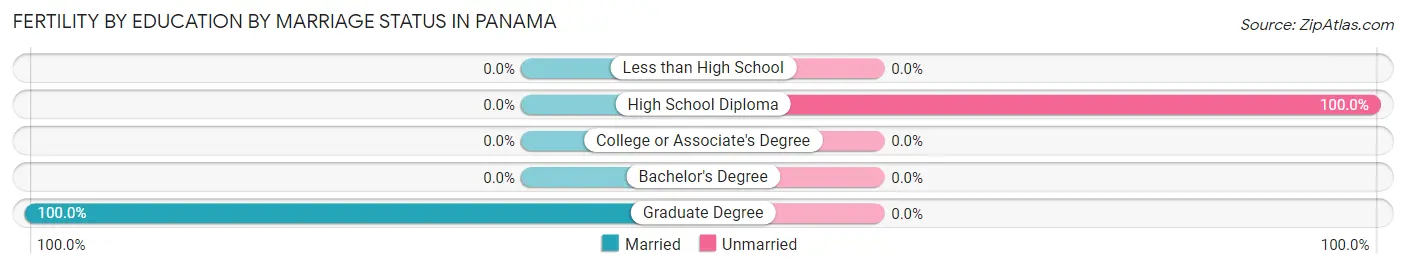
| Educational Attainment | Married | Unmarried |
| Less than High School | 0 (0.0%) | 0 (0.0%) |
| High School Diploma | 0 (0.0%) | 2 (100.0%) |
| College or Associate's Degree | 0 (0.0%) | 0 (0.0%) |
| Bachelor's Degree | 0 (0.0%) | 0 (0.0%) |
| Graduate Degree | 5 (100.0%) | 0 (0.0%) |
| Total | 5 (71.4%) | 2 (28.6%) |
Employment Characteristics in Panama
Employment by Class of Employer in Panama
Among the 236 employed individuals in Panama, private company employees (145 | 61.4%), self-employed (not incorporated) (34 | 14.4%), and local government employees (29 | 12.3%) make up the most common classes of employment.
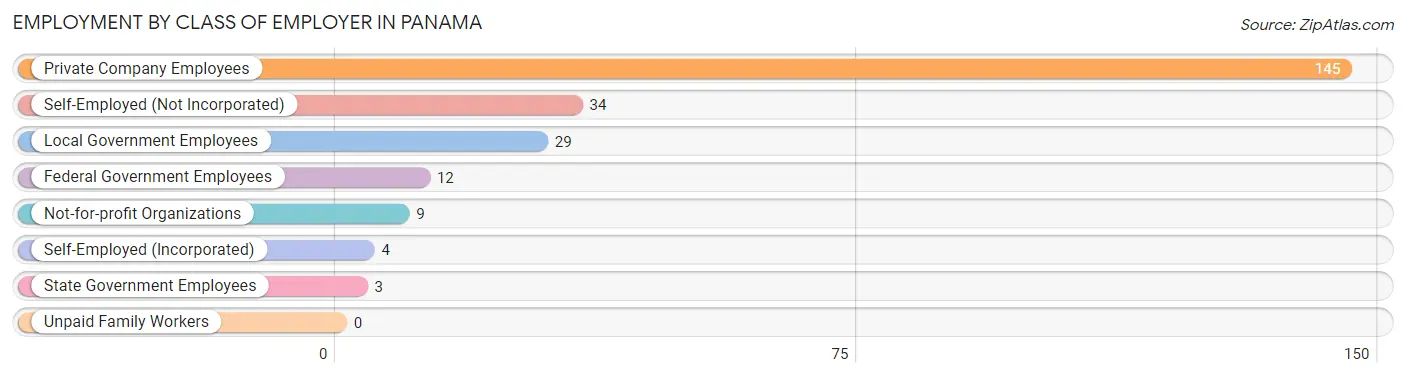
| Employer Class | # Employees | % Employees |
| Private Company Employees | 145 | 61.4% |
| Self-Employed (Incorporated) | 4 | 1.7% |
| Self-Employed (Not Incorporated) | 34 | 14.4% |
| Not-for-profit Organizations | 9 | 3.8% |
| Local Government Employees | 29 | 12.3% |
| State Government Employees | 3 | 1.3% |
| Federal Government Employees | 12 | 5.1% |
| Unpaid Family Workers | 0 | 0.0% |
| Total | 236 | 100.0% |
Employment Status by Age in Panama
According to the labor force statistics for Panama, out of the total population over 16 years of age (418), 59.1% or 247 individuals are in the labor force, with 0.8% or 2 of them unemployed. The age group with the highest labor force participation rate is 30 to 34 years, with 100.0% or 14 individuals in the labor force. Within the labor force, the 60 to 64 years age range has the highest percentage of unemployed individuals, with 16.7% or 2 of them being unemployed.
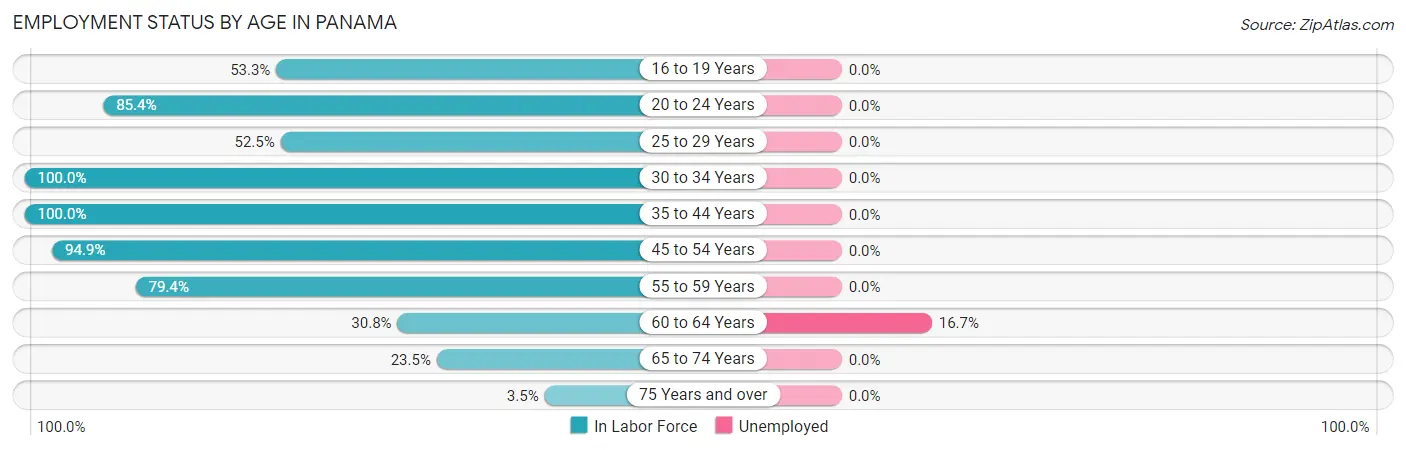
| Age Bracket | In Labor Force | Unemployed |
| 16 to 19 Years | 16 (53.3%) | 0 (0.0%) |
| 20 to 24 Years | 41 (85.4%) | 0 (0.0%) |
| 25 to 29 Years | 21 (52.5%) | 0 (0.0%) |
| 30 to 34 Years | 14 (100.0%) | 0 (0.0%) |
| 35 to 44 Years | 46 (100.0%) | 0 (0.0%) |
| 45 to 54 Years | 56 (94.9%) | 0 (0.0%) |
| 55 to 59 Years | 27 (79.4%) | 0 (0.0%) |
| 60 to 64 Years | 12 (30.8%) | 2 (16.7%) |
| 65 to 74 Years | 12 (23.5%) | 0 (0.0%) |
| 75 Years and over | 2 (3.5%) | 0 (0.0%) |
| Total | 247 (59.1%) | 2 (0.8%) |
Employment Status by Educational Attainment in Panama
According to labor force statistics for Panama, 75.9% of individuals (176) out of the total population between 25 and 64 years of age (232) are in the labor force, with 1.1% or 2 of them being unemployed. The group with the highest labor force participation rate are those with the educational attainment of college / associate degree, with 83.5% or 66 individuals in the labor force. Within the labor force, individuals with high school diploma education have the highest percentage of unemployment, with 3.0% or 2 of them being unemployed.
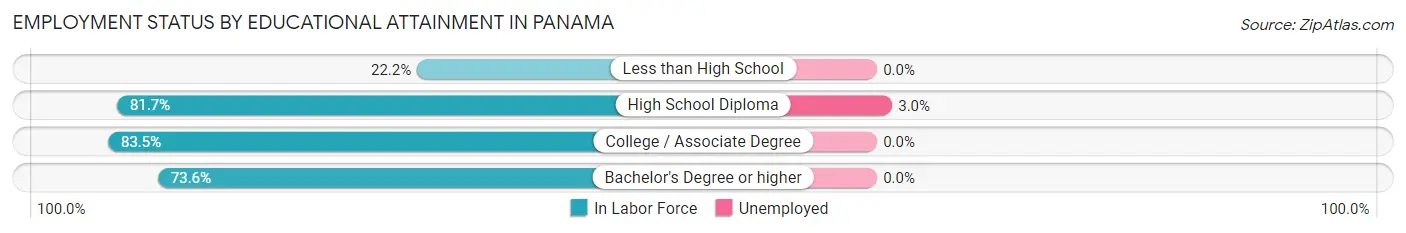
| Educational Attainment | In Labor Force | Unemployed |
| Less than High School | 4 (22.2%) | 0 (0.0%) |
| High School Diploma | 67 (81.7%) | 2 (3.0%) |
| College / Associate Degree | 66 (83.5%) | 0 (0.0%) |
| Bachelor's Degree or higher | 39 (73.6%) | 0 (0.0%) |
| Total | 176 (75.9%) | 3 (1.1%) |
Employment Occupations by Sex in Panama
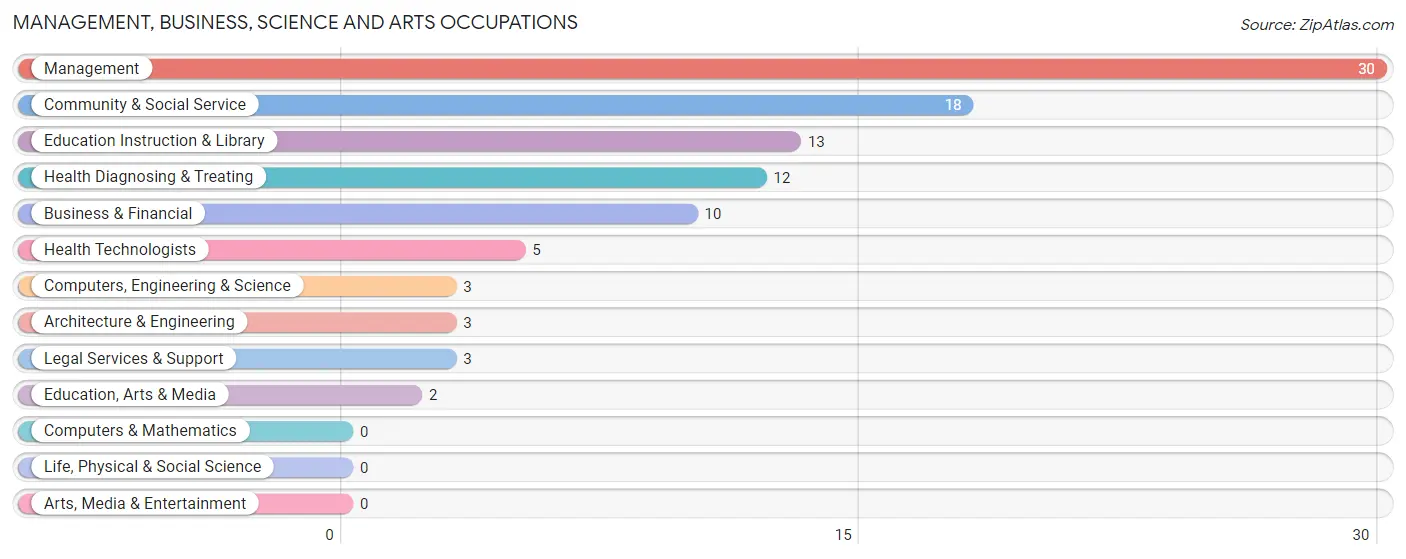
Management, Business, Science and Arts Occupations
The most common Management, Business, Science and Arts occupations in Panama are Management (30 | 12.2%), Community & Social Service (18 | 7.3%), Education Instruction & Library (13 | 5.3%), Health Diagnosing & Treating (12 | 4.9%), and Business & Financial (10 | 4.1%).
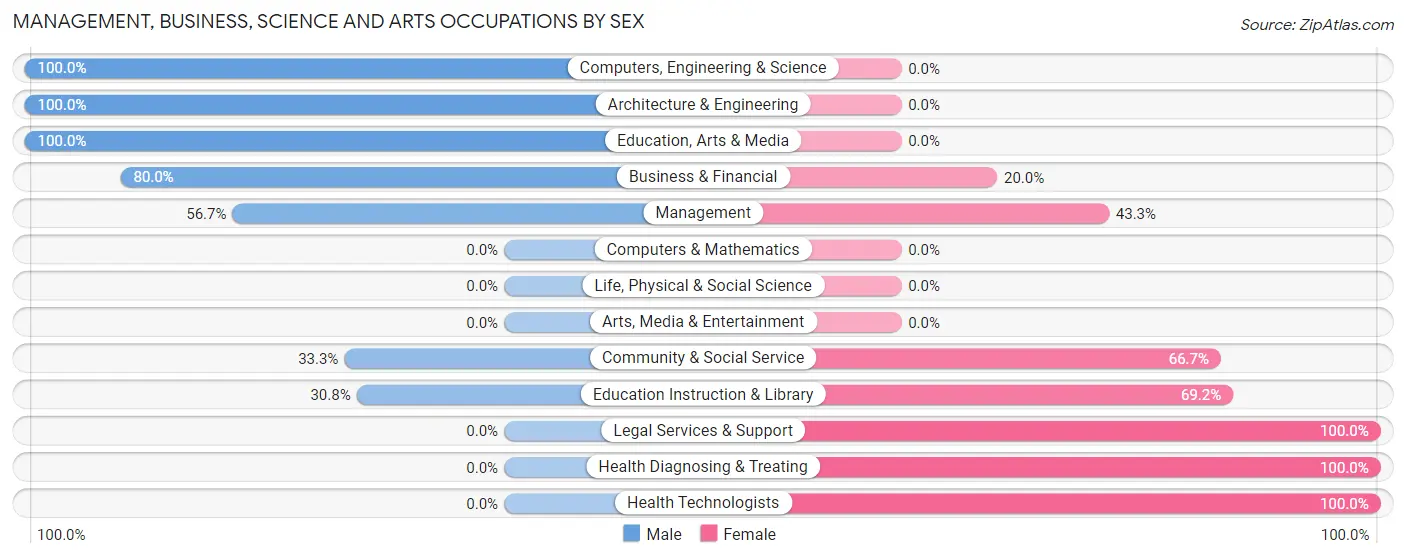
Management, Business, Science and Arts Occupations by Sex
Within the Management, Business, Science and Arts occupations in Panama, the most male-oriented occupations are Computers, Engineering & Science (100.0%), Architecture & Engineering (100.0%), and Education, Arts & Media (100.0%), while the most female-oriented occupations are Legal Services & Support (100.0%), Health Diagnosing & Treating (100.0%), and Health Technologists (100.0%).
| Occupation | Male | Female |
| Management | 17 (56.7%) | 13 (43.3%) |
| Business & Financial | 8 (80.0%) | 2 (20.0%) |
| Computers, Engineering & Science | 3 (100.0%) | 0 (0.0%) |
| Computers & Mathematics | 0 (0.0%) | 0 (0.0%) |
| Architecture & Engineering | 3 (100.0%) | 0 (0.0%) |
| Life, Physical & Social Science | 0 (0.0%) | 0 (0.0%) |
| Community & Social Service | 6 (33.3%) | 12 (66.7%) |
| Education, Arts & Media | 2 (100.0%) | 0 (0.0%) |
| Legal Services & Support | 0 (0.0%) | 3 (100.0%) |
| Education Instruction & Library | 4 (30.8%) | 9 (69.2%) |
| Arts, Media & Entertainment | 0 (0.0%) | 0 (0.0%) |
| Health Diagnosing & Treating | 0 (0.0%) | 12 (100.0%) |
| Health Technologists | 0 (0.0%) | 5 (100.0%) |
| Total (Category) | 34 (46.6%) | 39 (53.4%) |
| Total (Overall) | 136 (55.5%) | 109 (44.5%) |
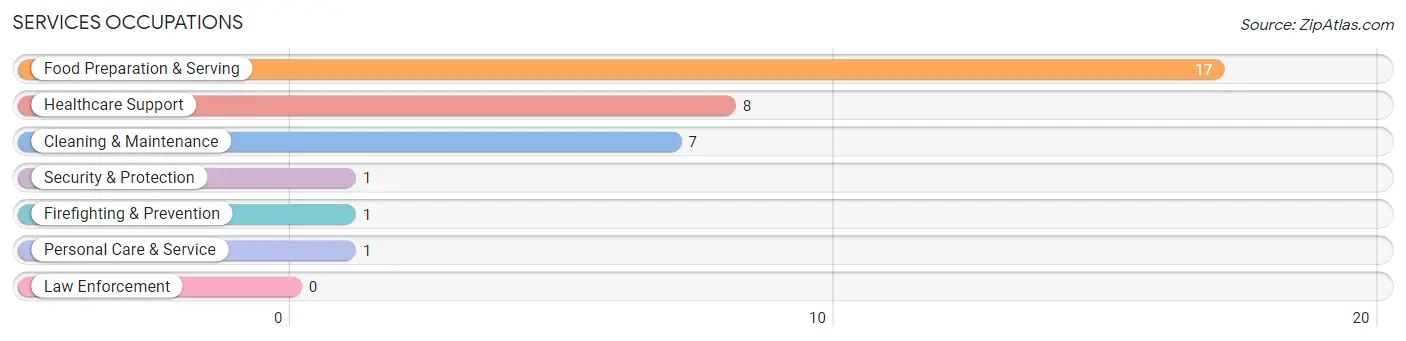
Services Occupations
The most common Services occupations in Panama are Food Preparation & Serving (17 | 6.9%), Healthcare Support (8 | 3.3%), Cleaning & Maintenance (7 | 2.9%), Security & Protection (1 | 0.4%), and Firefighting & Prevention (1 | 0.4%).
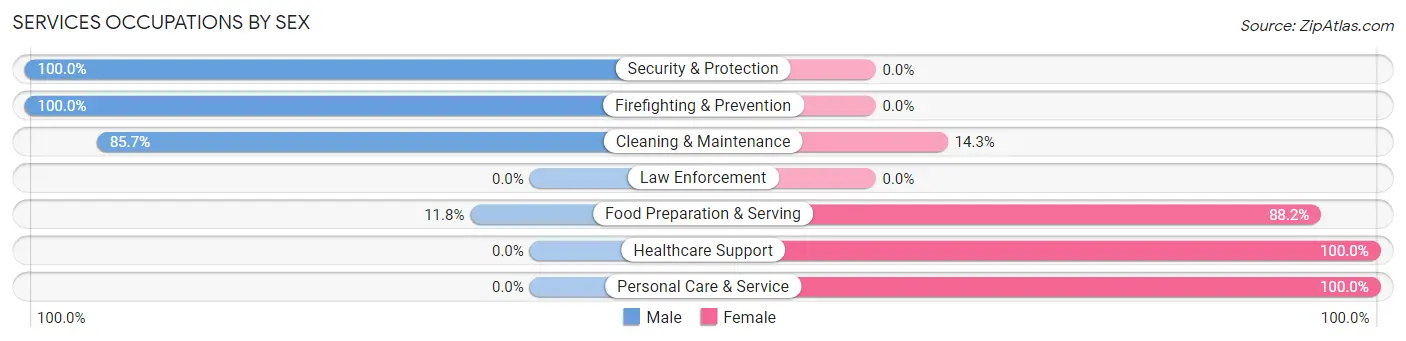
Services Occupations by Sex
Within the Services occupations in Panama, the most male-oriented occupations are Security & Protection (100.0%), Firefighting & Prevention (100.0%), and Cleaning & Maintenance (85.7%), while the most female-oriented occupations are Healthcare Support (100.0%), Personal Care & Service (100.0%), and Food Preparation & Serving (88.2%).
| Occupation | Male | Female |
| Healthcare Support | 0 (0.0%) | 8 (100.0%) |
| Security & Protection | 1 (100.0%) | 0 (0.0%) |
| Firefighting & Prevention | 1 (100.0%) | 0 (0.0%) |
| Law Enforcement | 0 (0.0%) | 0 (0.0%) |
| Food Preparation & Serving | 2 (11.8%) | 15 (88.2%) |
| Cleaning & Maintenance | 6 (85.7%) | 1 (14.3%) |
| Personal Care & Service | 0 (0.0%) | 1 (100.0%) |
| Total (Category) | 9 (26.5%) | 25 (73.5%) |
| Total (Overall) | 136 (55.5%) | 109 (44.5%) |
Sales and Office Occupations
The most common Sales and Office occupations in Panama are Office & Administration (28 | 11.4%), and Sales & Related (17 | 6.9%).
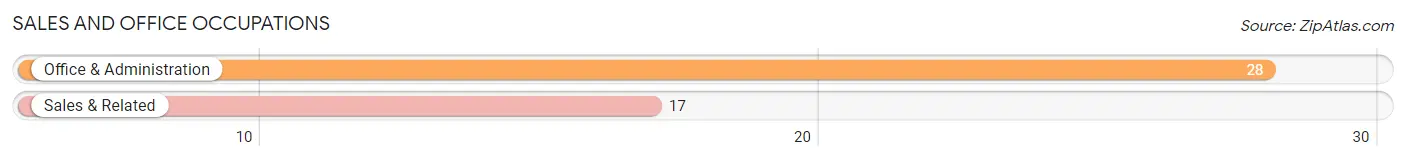
Sales and Office Occupations by Sex
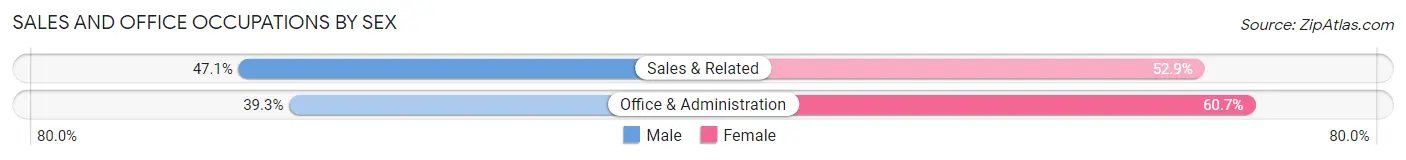
| Occupation | Male | Female |
| Sales & Related | 8 (47.1%) | 9 (52.9%) |
| Office & Administration | 11 (39.3%) | 17 (60.7%) |
| Total (Category) | 19 (42.2%) | 26 (57.8%) |
| Total (Overall) | 136 (55.5%) | 109 (44.5%) |
Natural Resources, Construction and Maintenance Occupations
The most common Natural Resources, Construction and Maintenance occupations in Panama are Construction & Extraction (27 | 11.0%), Installation, Maintenance & Repair (7 | 2.9%), and Farming, Fishing & Forestry (4 | 1.6%).
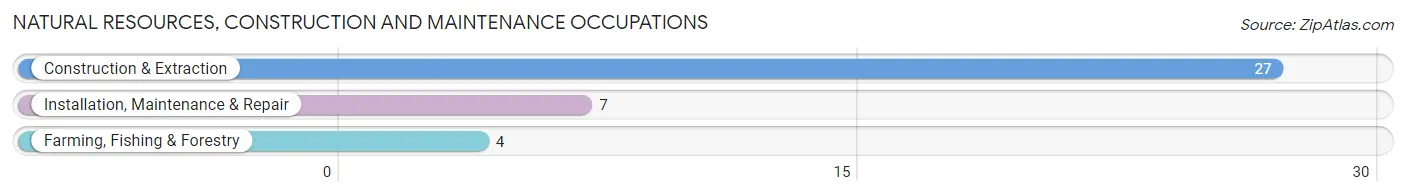
Natural Resources, Construction and Maintenance Occupations by Sex
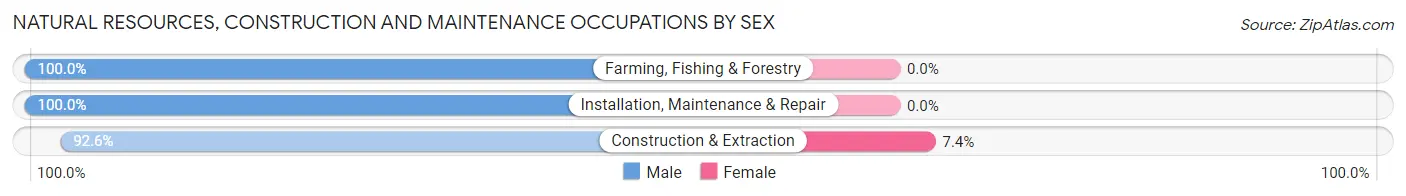
| Occupation | Male | Female |
| Farming, Fishing & Forestry | 4 (100.0%) | 0 (0.0%) |
| Construction & Extraction | 25 (92.6%) | 2 (7.4%) |
| Installation, Maintenance & Repair | 7 (100.0%) | 0 (0.0%) |
| Total (Category) | 36 (94.7%) | 2 (5.3%) |
| Total (Overall) | 136 (55.5%) | 109 (44.5%) |
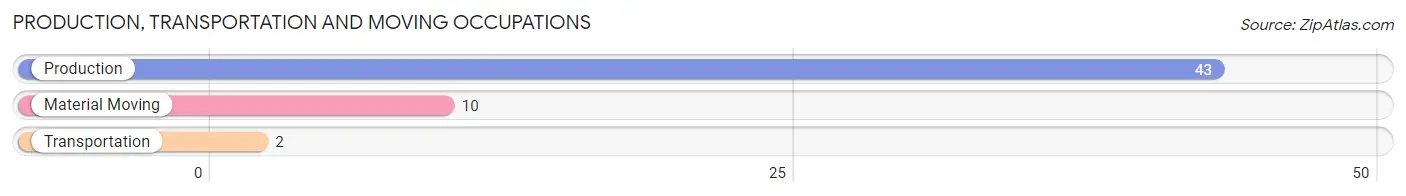
Production, Transportation and Moving Occupations
The most common Production, Transportation and Moving occupations in Panama are Production (43 | 17.5%), Material Moving (10 | 4.1%), and Transportation (2 | 0.8%).
Production, Transportation and Moving Occupations by Sex
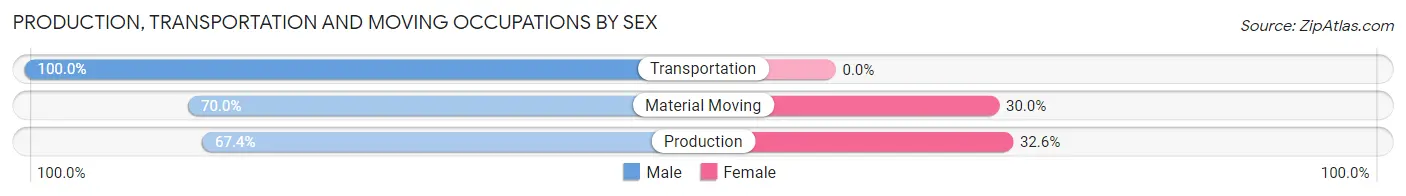
| Occupation | Male | Female |
| Production | 29 (67.4%) | 14 (32.6%) |
| Transportation | 2 (100.0%) | 0 (0.0%) |
| Material Moving | 7 (70.0%) | 3 (30.0%) |
| Total (Category) | 38 (69.1%) | 17 (30.9%) |
| Total (Overall) | 136 (55.5%) | 109 (44.5%) |
Employment Industries by Sex in Panama
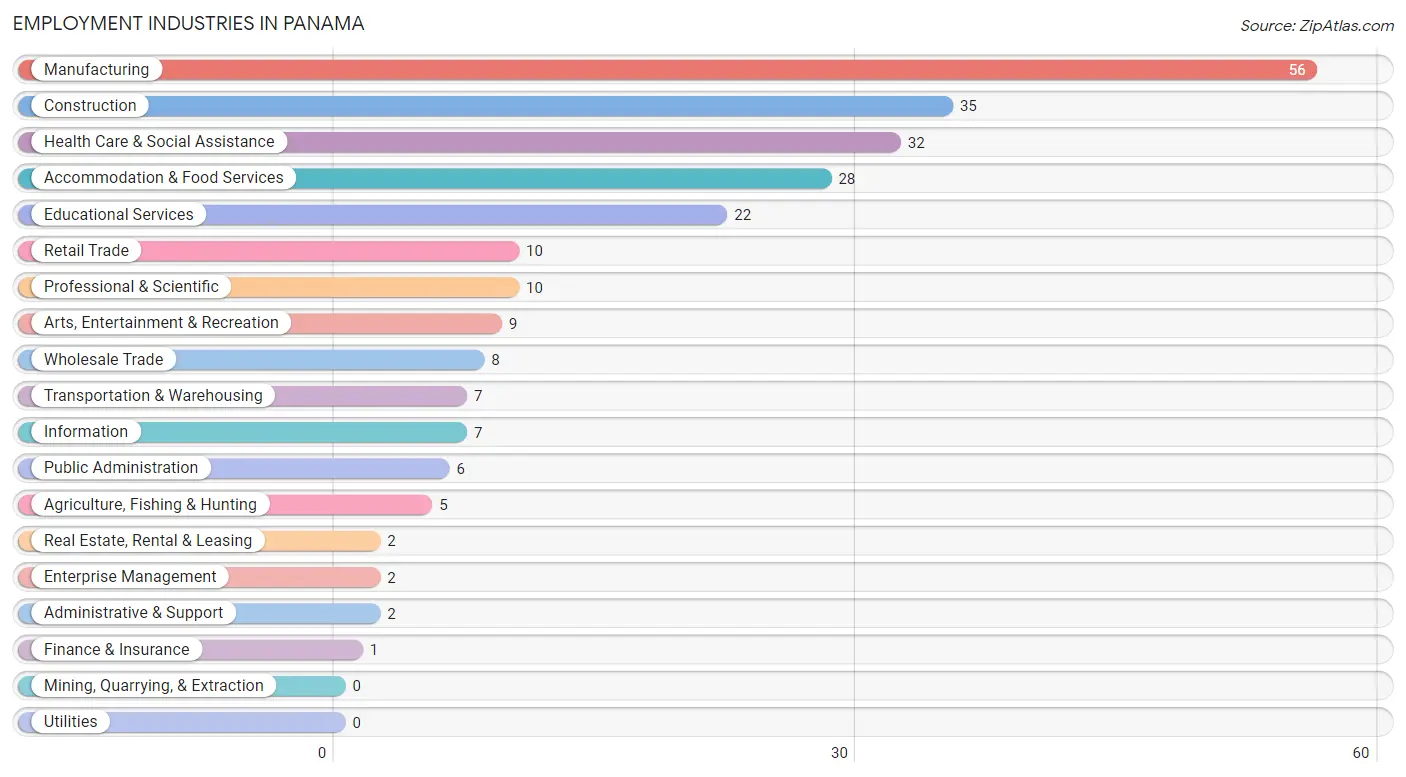
Employment Industries in Panama
The major employment industries in Panama include Manufacturing (56 | 22.9%), Construction (35 | 14.3%), Health Care & Social Assistance (32 | 13.1%), Accommodation & Food Services (28 | 11.4%), and Educational Services (22 | 9.0%).
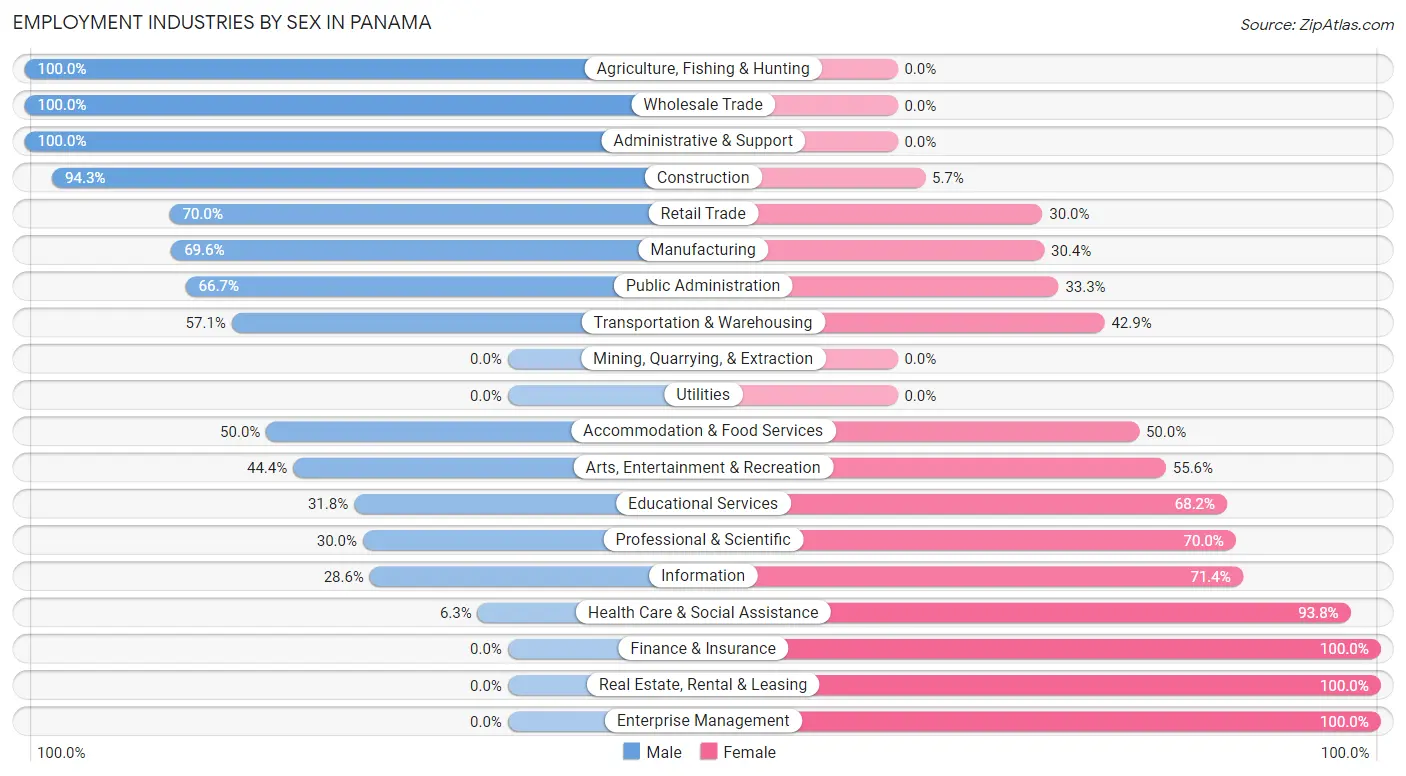
Employment Industries by Sex in Panama
The Panama industries that see more men than women are Agriculture, Fishing & Hunting (100.0%), Wholesale Trade (100.0%), and Administrative & Support (100.0%), whereas the industries that tend to have a higher number of women are Finance & Insurance (100.0%), Real Estate, Rental & Leasing (100.0%), and Enterprise Management (100.0%).
| Industry | Male | Female |
| Agriculture, Fishing & Hunting | 5 (100.0%) | 0 (0.0%) |
| Mining, Quarrying, & Extraction | 0 (0.0%) | 0 (0.0%) |
| Construction | 33 (94.3%) | 2 (5.7%) |
| Manufacturing | 39 (69.6%) | 17 (30.4%) |
| Wholesale Trade | 8 (100.0%) | 0 (0.0%) |
| Retail Trade | 7 (70.0%) | 3 (30.0%) |
| Transportation & Warehousing | 4 (57.1%) | 3 (42.9%) |
| Utilities | 0 (0.0%) | 0 (0.0%) |
| Information | 2 (28.6%) | 5 (71.4%) |
| Finance & Insurance | 0 (0.0%) | 1 (100.0%) |
| Real Estate, Rental & Leasing | 0 (0.0%) | 2 (100.0%) |
| Professional & Scientific | 3 (30.0%) | 7 (70.0%) |
| Enterprise Management | 0 (0.0%) | 2 (100.0%) |
| Administrative & Support | 2 (100.0%) | 0 (0.0%) |
| Educational Services | 7 (31.8%) | 15 (68.2%) |
| Health Care & Social Assistance | 2 (6.2%) | 30 (93.8%) |
| Arts, Entertainment & Recreation | 4 (44.4%) | 5 (55.6%) |
| Accommodation & Food Services | 14 (50.0%) | 14 (50.0%) |
| Public Administration | 4 (66.7%) | 2 (33.3%) |
| Total | 136 (55.5%) | 109 (44.5%) |
Education in Panama
School Enrollment in Panama
The most common levels of schooling among the 92 students in Panama are high school (32 | 34.8%), college / undergraduate (22 | 23.9%), and middle school (17 | 18.5%).
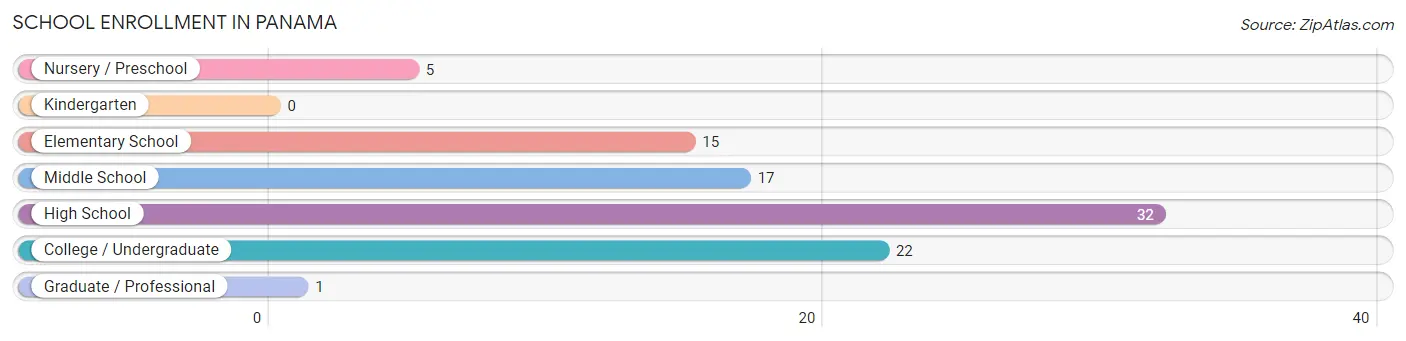
| School Level | # Students | % Students |
| Nursery / Preschool | 5 | 5.4% |
| Kindergarten | 0 | 0.0% |
| Elementary School | 15 | 16.3% |
| Middle School | 17 | 18.5% |
| High School | 32 | 34.8% |
| College / Undergraduate | 22 | 23.9% |
| Graduate / Professional | 1 | 1.1% |
| Total | 92 | 100.0% |
School Enrollment by Age by Funding Source in Panama
Out of a total of 92 students who are enrolled in schools in Panama, 7 (7.6%) attend a private institution, while the remaining 85 (92.4%) are enrolled in public schools. The age group of 10 to 14 year olds has the highest likelihood of being enrolled in private schools, with 5 (17.2% in the age bracket) enrolled. Conversely, the age group of 3 to 4 year olds has the lowest likelihood of being enrolled in a private school, with 5 (100.0% in the age bracket) attending a public institution.
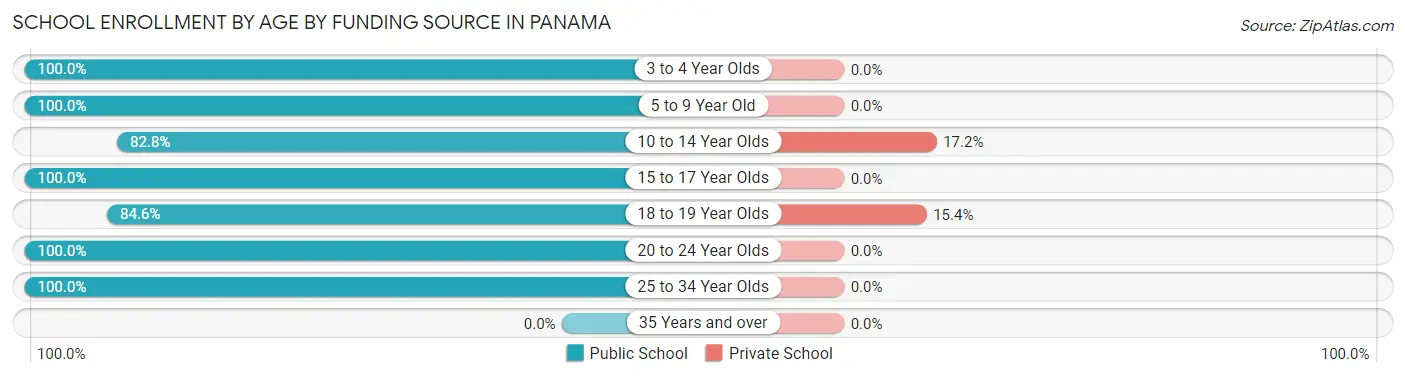
| Age Bracket | Public School | Private School |
| 3 to 4 Year Olds | 5 (100.0%) | 0 (0.0%) |
| 5 to 9 Year Old | 10 (100.0%) | 0 (0.0%) |
| 10 to 14 Year Olds | 24 (82.8%) | 5 (17.2%) |
| 15 to 17 Year Olds | 19 (100.0%) | 0 (0.0%) |
| 18 to 19 Year Olds | 11 (84.6%) | 2 (15.4%) |
| 20 to 24 Year Olds | 13 (100.0%) | 0 (0.0%) |
| 25 to 34 Year Olds | 3 (100.0%) | 0 (0.0%) |
| 35 Years and over | 0 (0.0%) | 0 (0.0%) |
| Total | 85 (92.4%) | 7 (7.6%) |
Educational Attainment by Field of Study in Panama
Business (18 | 26.9%), education (16 | 23.9%), liberal arts & history (10 | 14.9%), bio, nature & agricultural (6 | 9.0%), and physical & health sciences (4 | 6.0%) are the most common fields of study among 67 individuals in Panama who have obtained a bachelor's degree or higher.
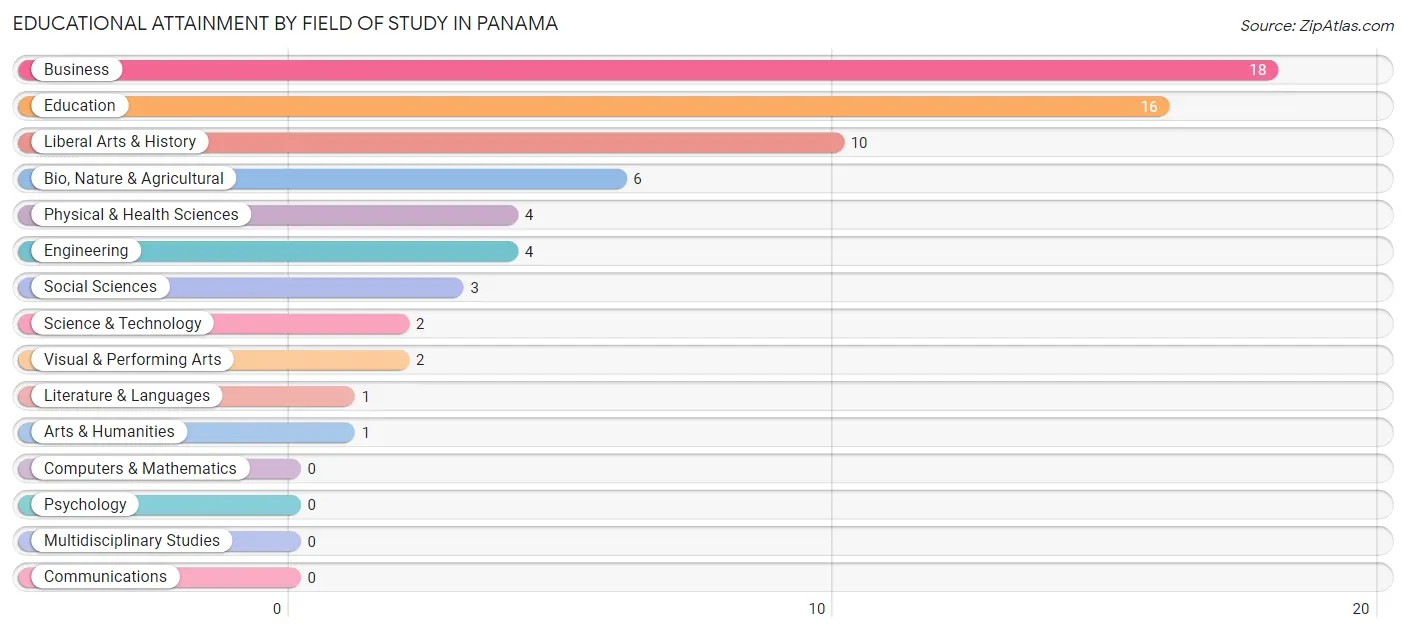
| Field of Study | # Graduates | % Graduates |
| Computers & Mathematics | 0 | 0.0% |
| Bio, Nature & Agricultural | 6 | 9.0% |
| Physical & Health Sciences | 4 | 6.0% |
| Psychology | 0 | 0.0% |
| Social Sciences | 3 | 4.5% |
| Engineering | 4 | 6.0% |
| Multidisciplinary Studies | 0 | 0.0% |
| Science & Technology | 2 | 3.0% |
| Business | 18 | 26.9% |
| Education | 16 | 23.9% |
| Literature & Languages | 1 | 1.5% |
| Liberal Arts & History | 10 | 14.9% |
| Visual & Performing Arts | 2 | 3.0% |
| Communications | 0 | 0.0% |
| Arts & Humanities | 1 | 1.5% |
| Total | 67 | 100.0% |
Transportation & Commute in Panama
Vehicle Availability by Sex in Panama
The most prevalent vehicle ownership categories in Panama are males with 2 vehicles (42, accounting for 31.3%) and females with 2 vehicles (49, making up 41.2%).
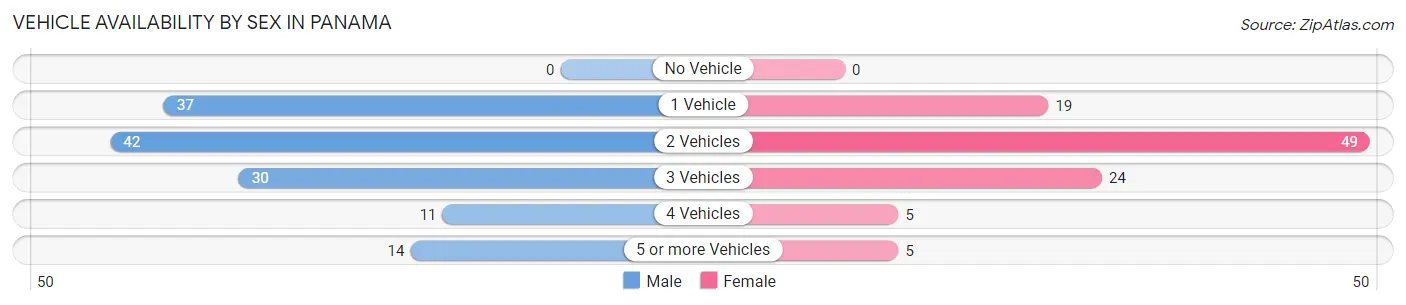
| Vehicles Available | Male | Female |
| No Vehicle | 0 (0.0%) | 0 (0.0%) |
| 1 Vehicle | 37 (27.6%) | 19 (18.6%) |
| 2 Vehicles | 42 (31.3%) | 49 (48.0%) |
| 3 Vehicles | 30 (22.4%) | 24 (23.5%) |
| 4 Vehicles | 11 (8.2%) | 5 (4.9%) |
| 5 or more Vehicles | 14 (10.4%) | 5 (4.9%) |
| Total | 134 (100.0%) | 102 (100.0%) |
Commute Time in Panama
The most frequently occuring commute durations in Panama are 20 to 24 minutes (47 commuters, 20.6%), 30 to 34 minutes (32 commuters, 14.0%), and 15 to 19 minutes (27 commuters, 11.8%).
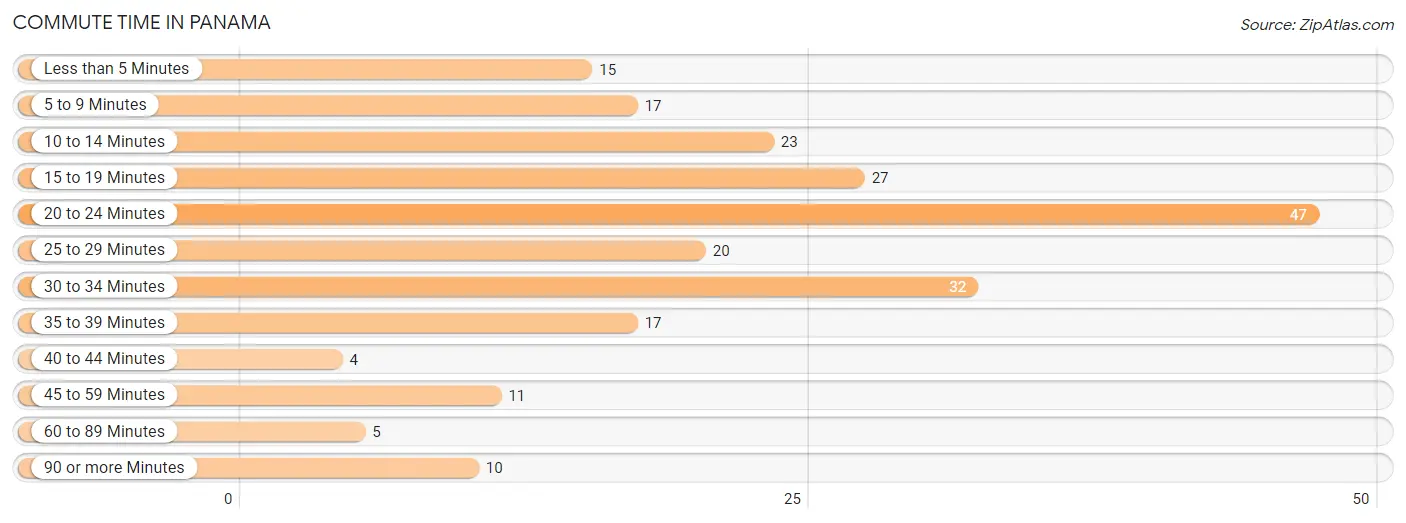
| Commute Time | # Commuters | % Commuters |
| Less than 5 Minutes | 15 | 6.6% |
| 5 to 9 Minutes | 17 | 7.5% |
| 10 to 14 Minutes | 23 | 10.1% |
| 15 to 19 Minutes | 27 | 11.8% |
| 20 to 24 Minutes | 47 | 20.6% |
| 25 to 29 Minutes | 20 | 8.8% |
| 30 to 34 Minutes | 32 | 14.0% |
| 35 to 39 Minutes | 17 | 7.5% |
| 40 to 44 Minutes | 4 | 1.8% |
| 45 to 59 Minutes | 11 | 4.8% |
| 60 to 89 Minutes | 5 | 2.2% |
| 90 or more Minutes | 10 | 4.4% |
Commute Time by Sex in Panama
The most common commute times in Panama are 20 to 24 minutes (25 commuters, 19.1%) for males and 20 to 24 minutes (22 commuters, 22.7%) for females.
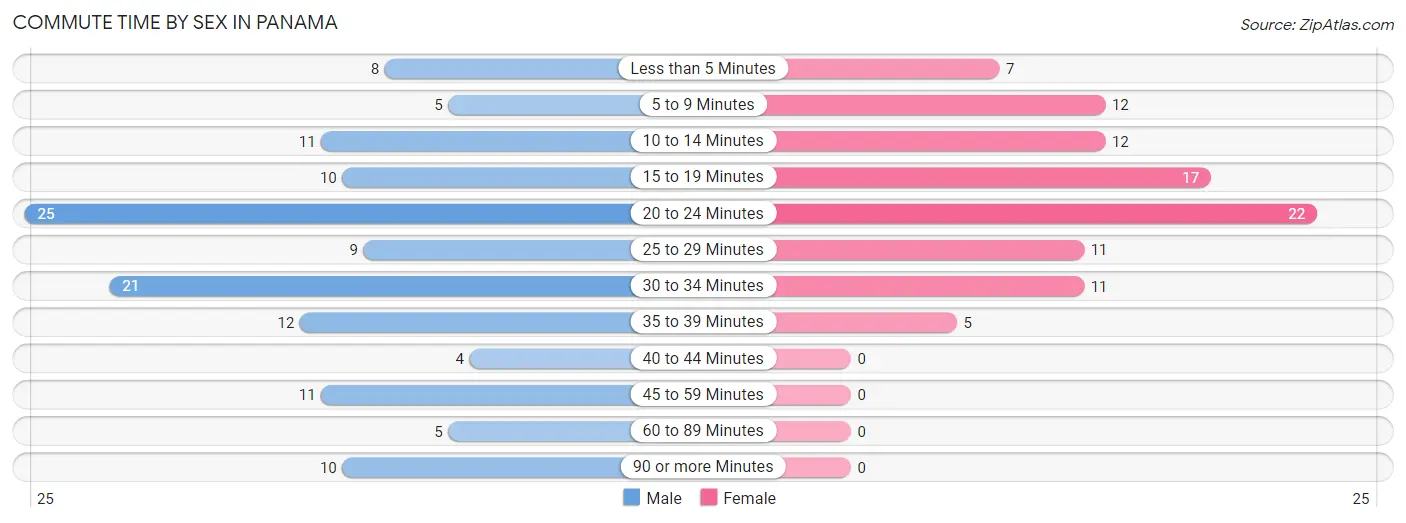
| Commute Time | Male | Female |
| Less than 5 Minutes | 8 (6.1%) | 7 (7.2%) |
| 5 to 9 Minutes | 5 (3.8%) | 12 (12.4%) |
| 10 to 14 Minutes | 11 (8.4%) | 12 (12.4%) |
| 15 to 19 Minutes | 10 (7.6%) | 17 (17.5%) |
| 20 to 24 Minutes | 25 (19.1%) | 22 (22.7%) |
| 25 to 29 Minutes | 9 (6.9%) | 11 (11.3%) |
| 30 to 34 Minutes | 21 (16.0%) | 11 (11.3%) |
| 35 to 39 Minutes | 12 (9.2%) | 5 (5.1%) |
| 40 to 44 Minutes | 4 (3.0%) | 0 (0.0%) |
| 45 to 59 Minutes | 11 (8.4%) | 0 (0.0%) |
| 60 to 89 Minutes | 5 (3.8%) | 0 (0.0%) |
| 90 or more Minutes | 10 (7.6%) | 0 (0.0%) |
Time of Departure to Work by Sex in Panama
The most frequent times of departure to work in Panama are 5:30 AM to 5:59 AM (17, 13.0%) for males and 8:00 AM to 8:29 AM (21, 21.6%) for females.
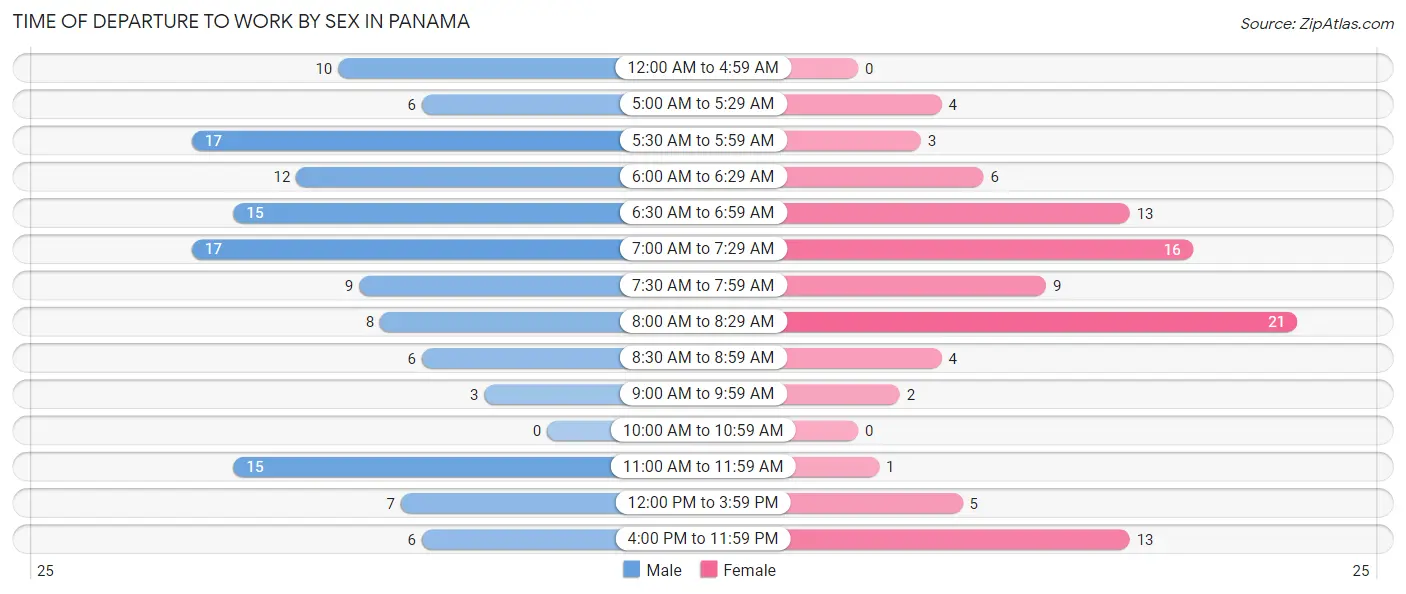
| Time of Departure | Male | Female |
| 12:00 AM to 4:59 AM | 10 (7.6%) | 0 (0.0%) |
| 5:00 AM to 5:29 AM | 6 (4.6%) | 4 (4.1%) |
| 5:30 AM to 5:59 AM | 17 (13.0%) | 3 (3.1%) |
| 6:00 AM to 6:29 AM | 12 (9.2%) | 6 (6.2%) |
| 6:30 AM to 6:59 AM | 15 (11.5%) | 13 (13.4%) |
| 7:00 AM to 7:29 AM | 17 (13.0%) | 16 (16.5%) |
| 7:30 AM to 7:59 AM | 9 (6.9%) | 9 (9.3%) |
| 8:00 AM to 8:29 AM | 8 (6.1%) | 21 (21.6%) |
| 8:30 AM to 8:59 AM | 6 (4.6%) | 4 (4.1%) |
| 9:00 AM to 9:59 AM | 3 (2.3%) | 2 (2.1%) |
| 10:00 AM to 10:59 AM | 0 (0.0%) | 0 (0.0%) |
| 11:00 AM to 11:59 AM | 15 (11.5%) | 1 (1.0%) |
| 12:00 PM to 3:59 PM | 7 (5.3%) | 5 (5.1%) |
| 4:00 PM to 11:59 PM | 6 (4.6%) | 13 (13.4%) |
| Total | 131 (100.0%) | 97 (100.0%) |
Housing Occupancy in Panama
Occupancy by Ownership in Panama
Of the total 218 dwellings in Panama, owner-occupied units account for 131 (60.1%), while renter-occupied units make up 87 (39.9%).
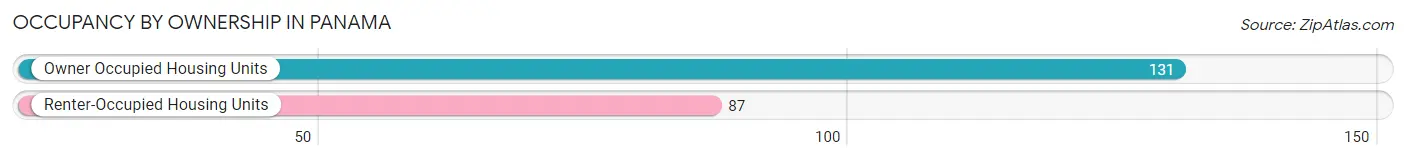
| Occupancy | # Housing Units | % Housing Units |
| Owner Occupied Housing Units | 131 | 60.1% |
| Renter-Occupied Housing Units | 87 | 39.9% |
| Total Occupied Housing Units | 218 | 100.0% |
Occupancy by Household Size in Panama
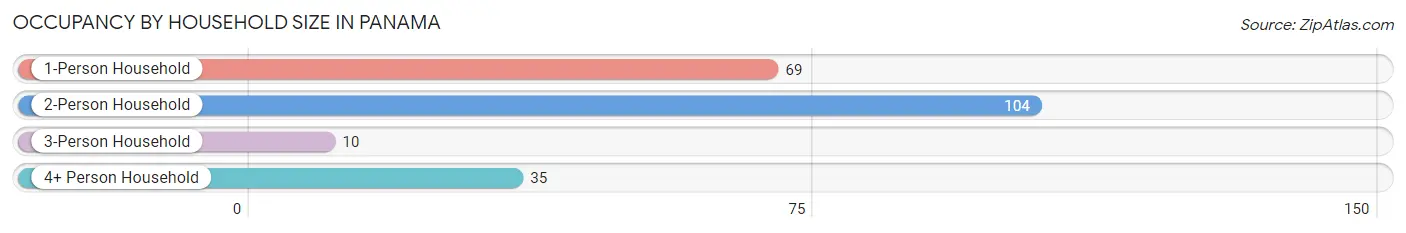
| Household Size | # Housing Units | % Housing Units |
| 1-Person Household | 69 | 31.7% |
| 2-Person Household | 104 | 47.7% |
| 3-Person Household | 10 | 4.6% |
| 4+ Person Household | 35 | 16.1% |
| Total Housing Units | 218 | 100.0% |
Occupancy by Ownership by Household Size in Panama
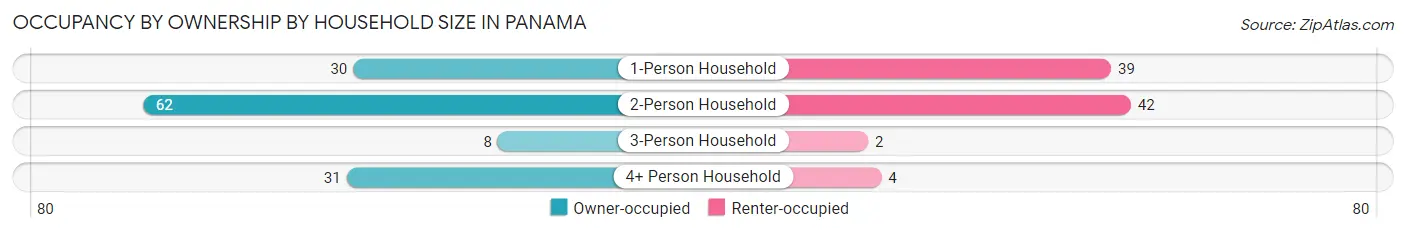
| Household Size | Owner-occupied | Renter-occupied |
| 1-Person Household | 30 (43.5%) | 39 (56.5%) |
| 2-Person Household | 62 (59.6%) | 42 (40.4%) |
| 3-Person Household | 8 (80.0%) | 2 (20.0%) |
| 4+ Person Household | 31 (88.6%) | 4 (11.4%) |
| Total Housing Units | 131 (60.1%) | 87 (39.9%) |
Occupancy by Educational Attainment in Panama
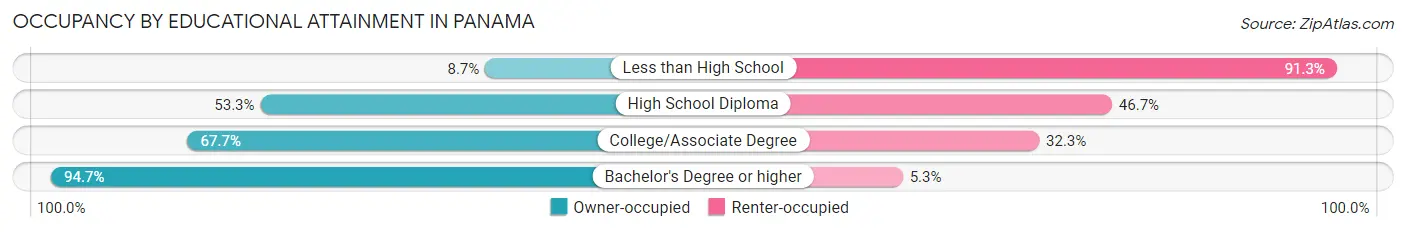
| Household Size | Owner-occupied | Renter-occupied |
| Less than High School | 2 (8.7%) | 21 (91.3%) |
| High School Diploma | 49 (53.3%) | 43 (46.7%) |
| College/Associate Degree | 44 (67.7%) | 21 (32.3%) |
| Bachelor's Degree or higher | 36 (94.7%) | 2 (5.3%) |
Occupancy by Age of Householder in Panama
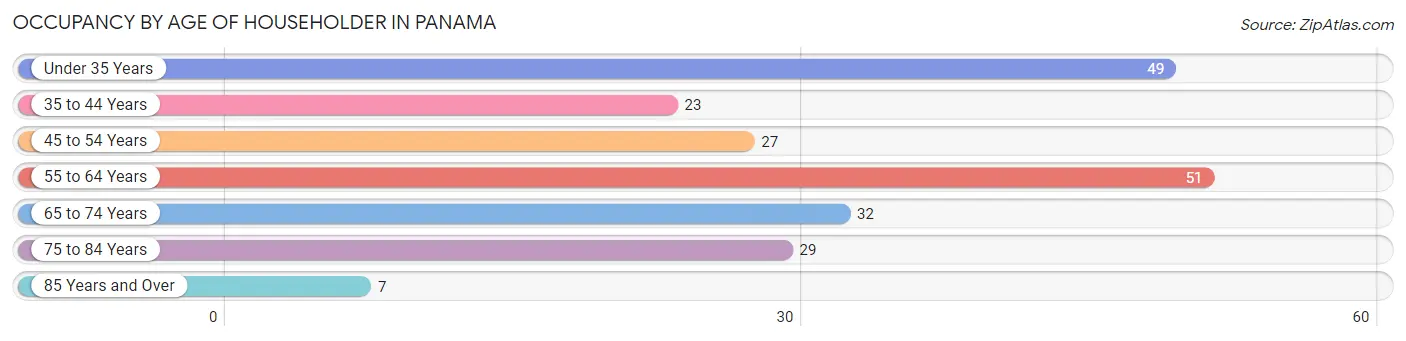
| Age Bracket | # Households | % Households |
| Under 35 Years | 49 | 22.5% |
| 35 to 44 Years | 23 | 10.5% |
| 45 to 54 Years | 27 | 12.4% |
| 55 to 64 Years | 51 | 23.4% |
| 65 to 74 Years | 32 | 14.7% |
| 75 to 84 Years | 29 | 13.3% |
| 85 Years and Over | 7 | 3.2% |
| Total | 218 | 100.0% |
Housing Finances in Panama
Median Income by Occupancy in Panama
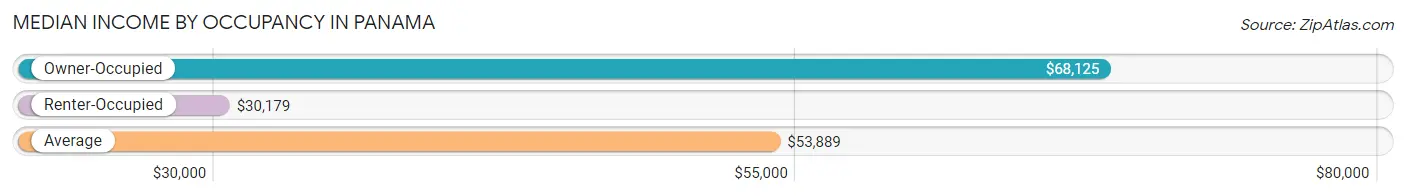
| Occupancy Type | # Households | Median Income |
| Owner-Occupied | 131 (60.1%) | $68,125 |
| Renter-Occupied | 87 (39.9%) | $30,179 |
| Average | 218 (100.0%) | $53,889 |
Occupancy by Householder Income Bracket in Panama
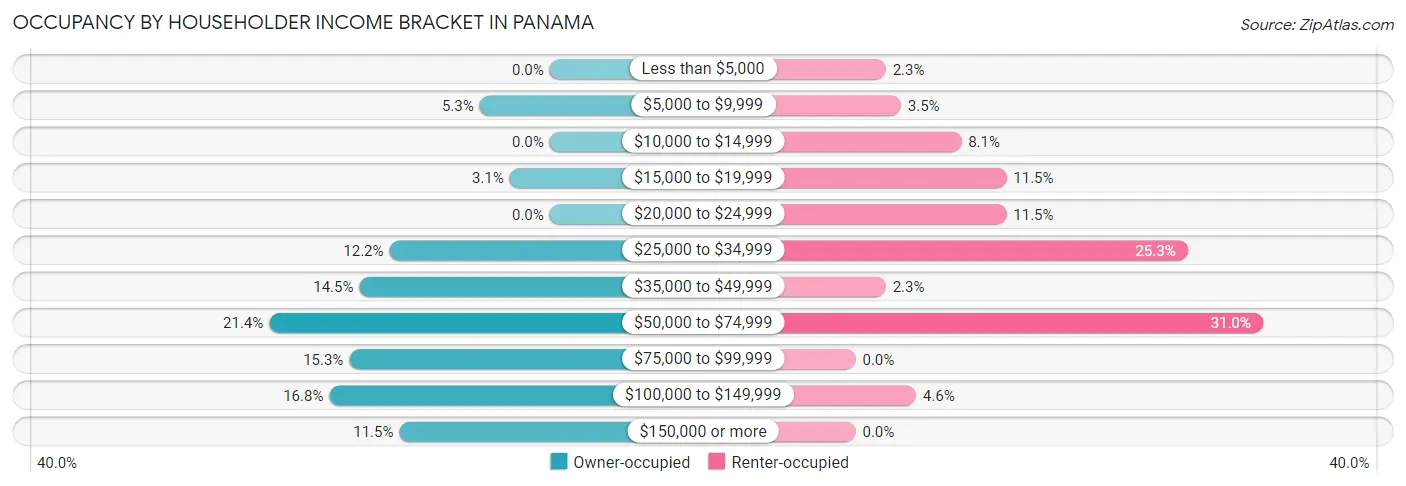
| Income Bracket | Owner-occupied | Renter-occupied |
| Less than $5,000 | 0 (0.0%) | 2 (2.3%) |
| $5,000 to $9,999 | 7 (5.3%) | 3 (3.5%) |
| $10,000 to $14,999 | 0 (0.0%) | 7 (8.1%) |
| $15,000 to $19,999 | 4 (3.0%) | 10 (11.5%) |
| $20,000 to $24,999 | 0 (0.0%) | 10 (11.5%) |
| $25,000 to $34,999 | 16 (12.2%) | 22 (25.3%) |
| $35,000 to $49,999 | 19 (14.5%) | 2 (2.3%) |
| $50,000 to $74,999 | 28 (21.4%) | 27 (31.0%) |
| $75,000 to $99,999 | 20 (15.3%) | 0 (0.0%) |
| $100,000 to $149,999 | 22 (16.8%) | 4 (4.6%) |
| $150,000 or more | 15 (11.5%) | 0 (0.0%) |
| Total | 131 (100.0%) | 87 (100.0%) |
Monthly Housing Cost Tiers in Panama
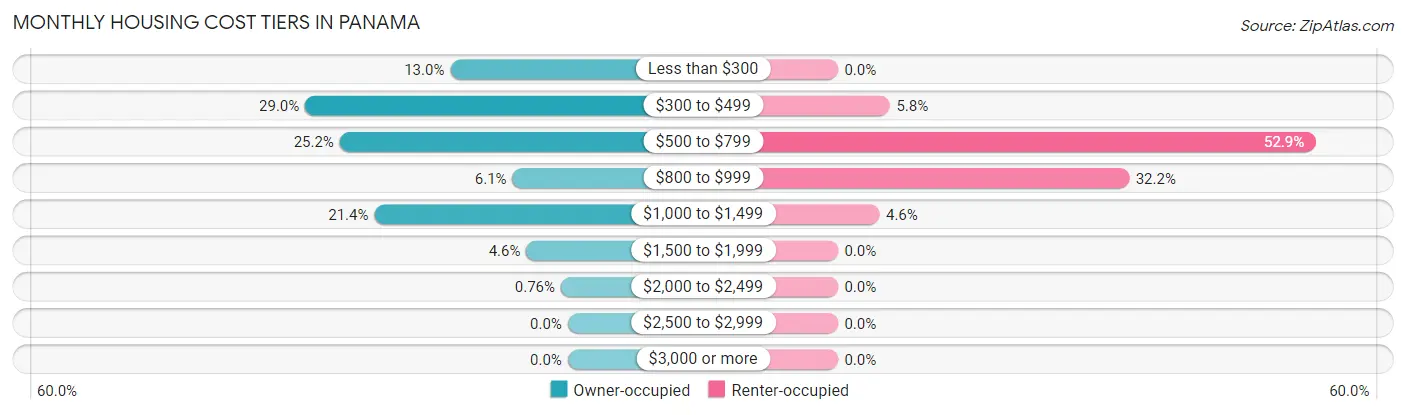
| Monthly Cost | Owner-occupied | Renter-occupied |
| Less than $300 | 17 (13.0%) | 0 (0.0%) |
| $300 to $499 | 38 (29.0%) | 5 (5.8%) |
| $500 to $799 | 33 (25.2%) | 46 (52.9%) |
| $800 to $999 | 8 (6.1%) | 28 (32.2%) |
| $1,000 to $1,499 | 28 (21.4%) | 4 (4.6%) |
| $1,500 to $1,999 | 6 (4.6%) | 0 (0.0%) |
| $2,000 to $2,499 | 1 (0.8%) | 0 (0.0%) |
| $2,500 to $2,999 | 0 (0.0%) | 0 (0.0%) |
| $3,000 or more | 0 (0.0%) | 0 (0.0%) |
| Total | 131 (100.0%) | 87 (100.0%) |
Physical Housing Characteristics in Panama
Housing Structures in Panama
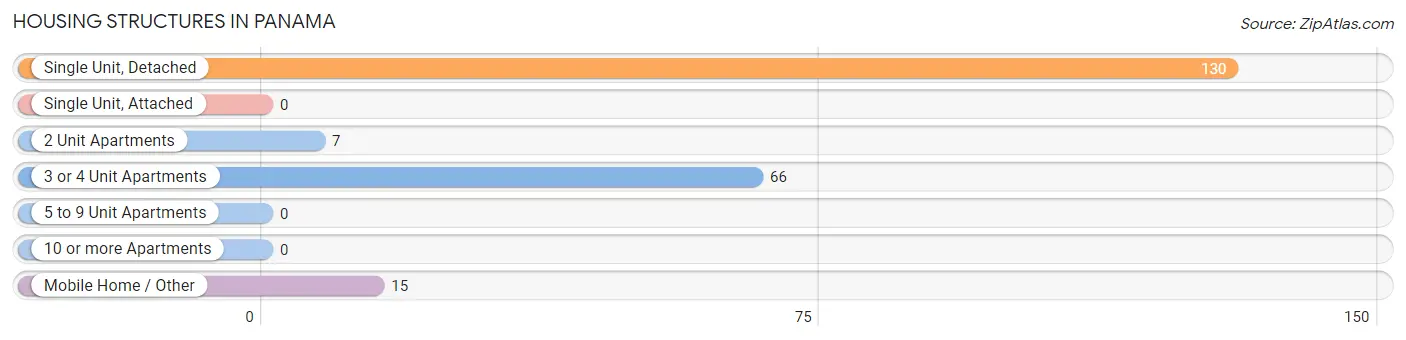
| Structure Type | # Housing Units | % Housing Units |
| Single Unit, Detached | 130 | 59.6% |
| Single Unit, Attached | 0 | 0.0% |
| 2 Unit Apartments | 7 | 3.2% |
| 3 or 4 Unit Apartments | 66 | 30.3% |
| 5 to 9 Unit Apartments | 0 | 0.0% |
| 10 or more Apartments | 0 | 0.0% |
| Mobile Home / Other | 15 | 6.9% |
| Total | 218 | 100.0% |
Housing Structures by Occupancy in Panama
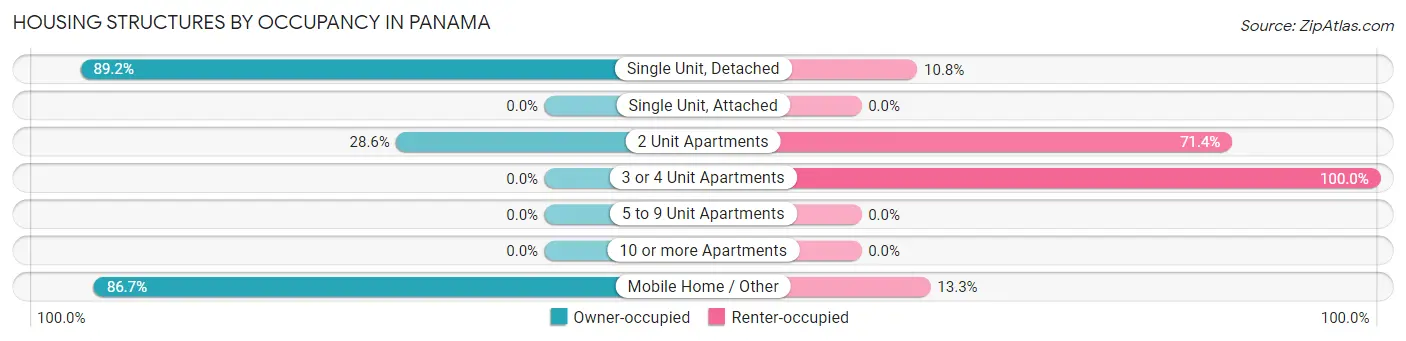
| Structure Type | Owner-occupied | Renter-occupied |
| Single Unit, Detached | 116 (89.2%) | 14 (10.8%) |
| Single Unit, Attached | 0 (0.0%) | 0 (0.0%) |
| 2 Unit Apartments | 2 (28.6%) | 5 (71.4%) |
| 3 or 4 Unit Apartments | 0 (0.0%) | 66 (100.0%) |
| 5 to 9 Unit Apartments | 0 (0.0%) | 0 (0.0%) |
| 10 or more Apartments | 0 (0.0%) | 0 (0.0%) |
| Mobile Home / Other | 13 (86.7%) | 2 (13.3%) |
| Total | 131 (60.1%) | 87 (39.9%) |
Housing Structures by Number of Rooms in Panama
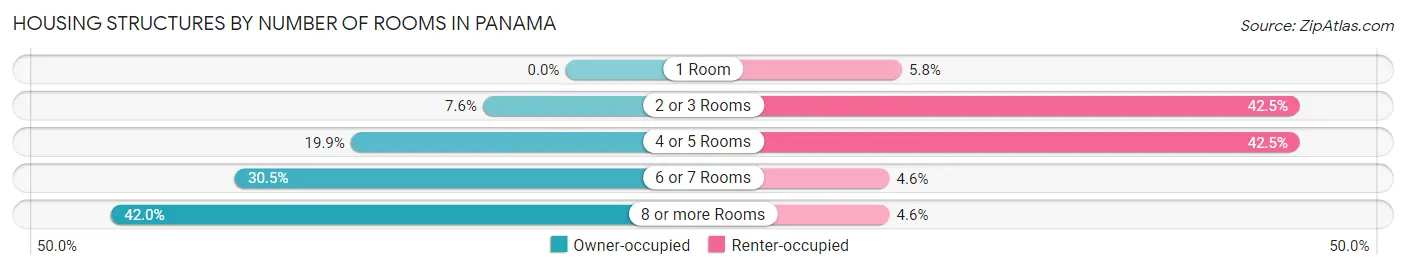
| Number of Rooms | Owner-occupied | Renter-occupied |
| 1 Room | 0 (0.0%) | 5 (5.8%) |
| 2 or 3 Rooms | 10 (7.6%) | 37 (42.5%) |
| 4 or 5 Rooms | 26 (19.9%) | 37 (42.5%) |
| 6 or 7 Rooms | 40 (30.5%) | 4 (4.6%) |
| 8 or more Rooms | 55 (42.0%) | 4 (4.6%) |
| Total | 131 (100.0%) | 87 (100.0%) |
Housing Structure by Heating Type in Panama
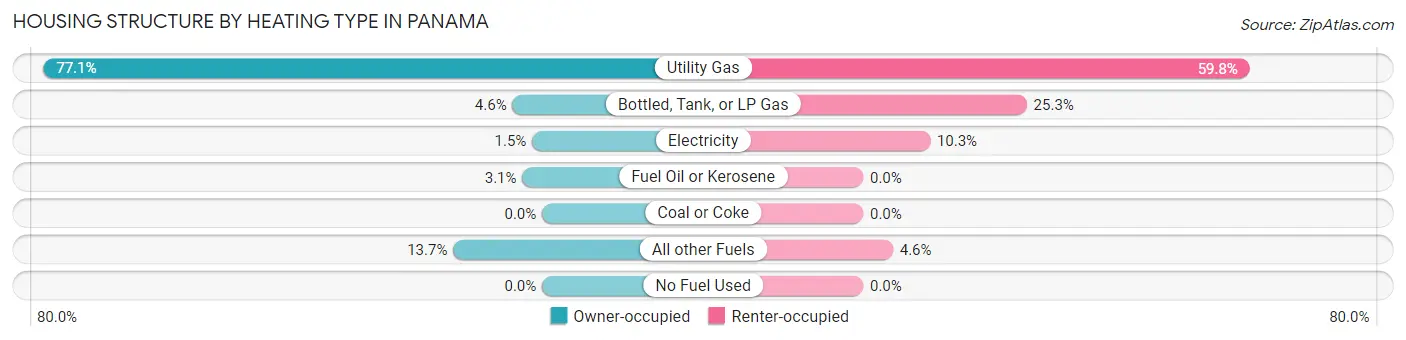
| Heating Type | Owner-occupied | Renter-occupied |
| Utility Gas | 101 (77.1%) | 52 (59.8%) |
| Bottled, Tank, or LP Gas | 6 (4.6%) | 22 (25.3%) |
| Electricity | 2 (1.5%) | 9 (10.3%) |
| Fuel Oil or Kerosene | 4 (3.0%) | 0 (0.0%) |
| Coal or Coke | 0 (0.0%) | 0 (0.0%) |
| All other Fuels | 18 (13.7%) | 4 (4.6%) |
| No Fuel Used | 0 (0.0%) | 0 (0.0%) |
| Total | 131 (100.0%) | 87 (100.0%) |
Household Vehicle Usage in Panama
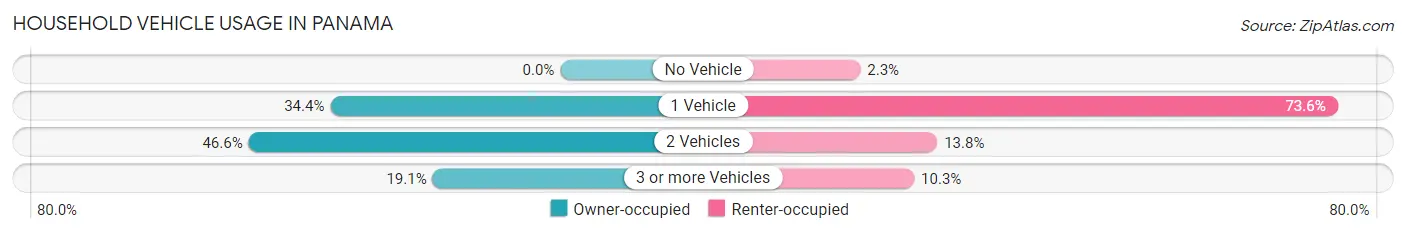
| Vehicles per Household | Owner-occupied | Renter-occupied |
| No Vehicle | 0 (0.0%) | 2 (2.3%) |
| 1 Vehicle | 45 (34.4%) | 64 (73.6%) |
| 2 Vehicles | 61 (46.6%) | 12 (13.8%) |
| 3 or more Vehicles | 25 (19.1%) | 9 (10.3%) |
| Total | 131 (100.0%) | 87 (100.0%) |
Real Estate & Mortgages in Panama
Real Estate and Mortgage Overview in Panama
| Characteristic | Without Mortgage | With Mortgage |
| Housing Units | 79 | 52 |
| Median Property Value | $93,800 | $92,500 |
| Median Household Income | $64,688 | $9 |
| Monthly Housing Costs | $398 | $0 |
| Real Estate Taxes | $2,125 | $0 |
Property Value by Mortgage Status in Panama
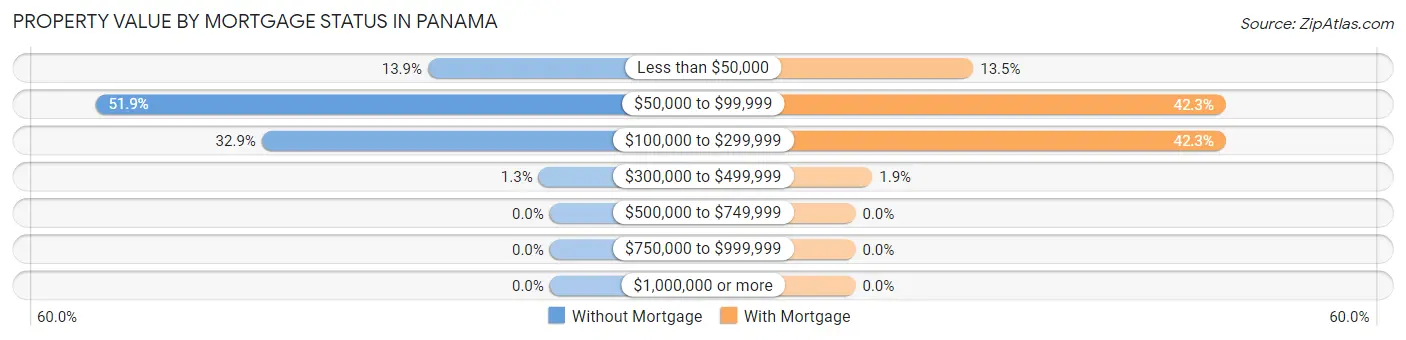
| Property Value | Without Mortgage | With Mortgage |
| Less than $50,000 | 11 (13.9%) | 7 (13.5%) |
| $50,000 to $99,999 | 41 (51.9%) | 22 (42.3%) |
| $100,000 to $299,999 | 26 (32.9%) | 22 (42.3%) |
| $300,000 to $499,999 | 1 (1.3%) | 1 (1.9%) |
| $500,000 to $749,999 | 0 (0.0%) | 0 (0.0%) |
| $750,000 to $999,999 | 0 (0.0%) | 0 (0.0%) |
| $1,000,000 or more | 0 (0.0%) | 0 (0.0%) |
| Total | 79 (100.0%) | 52 (100.0%) |
Household Income by Mortgage Status in Panama
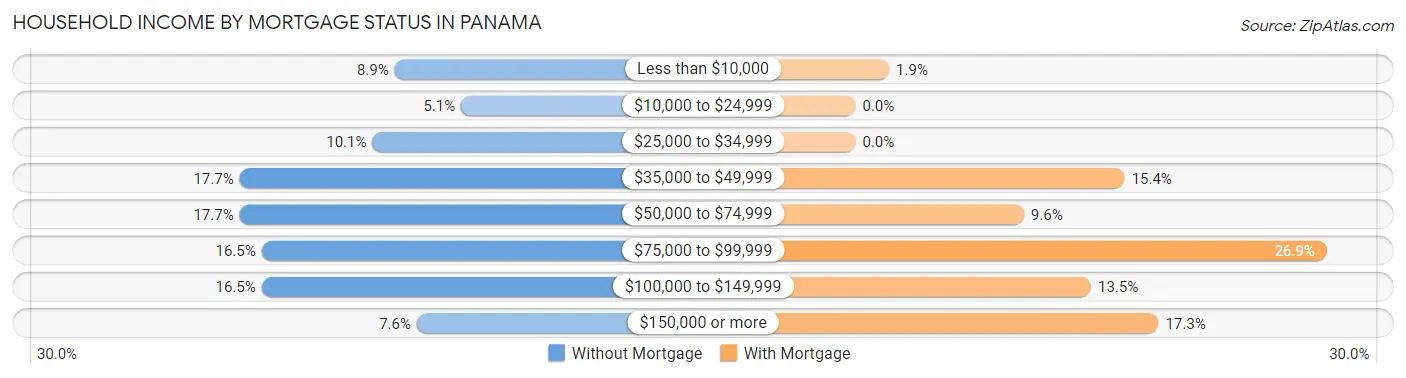
| Household Income | Without Mortgage | With Mortgage |
| Less than $10,000 | 7 (8.9%) | 1 (1.9%) |
| $10,000 to $24,999 | 4 (5.1%) | 0 (0.0%) |
| $25,000 to $34,999 | 8 (10.1%) | 0 (0.0%) |
| $35,000 to $49,999 | 14 (17.7%) | 8 (15.4%) |
| $50,000 to $74,999 | 14 (17.7%) | 5 (9.6%) |
| $75,000 to $99,999 | 13 (16.5%) | 14 (26.9%) |
| $100,000 to $149,999 | 13 (16.5%) | 7 (13.5%) |
| $150,000 or more | 6 (7.6%) | 9 (17.3%) |
| Total | 79 (100.0%) | 52 (100.0%) |
Property Value to Household Income Ratio in Panama
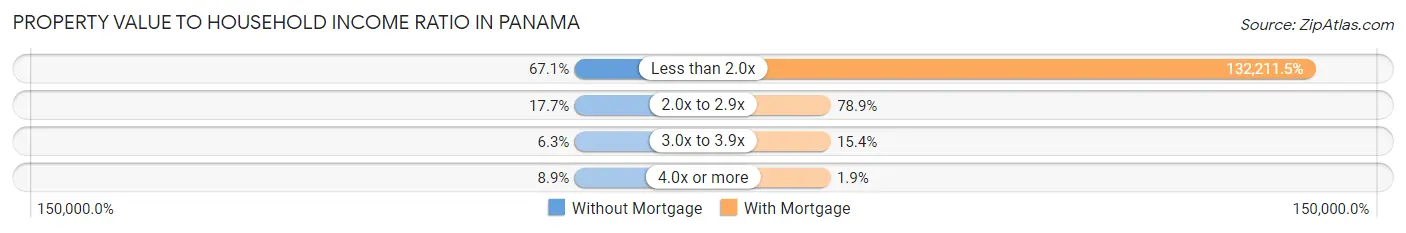
| Value-to-Income Ratio | Without Mortgage | With Mortgage |
| Less than 2.0x | 53 (67.1%) | 68,750 (132,211.5%) |
| 2.0x to 2.9x | 14 (17.7%) | 41 (78.8%) |
| 3.0x to 3.9x | 5 (6.3%) | 8 (15.4%) |
| 4.0x or more | 7 (8.9%) | 1 (1.9%) |
| Total | 79 (100.0%) | 52 (100.0%) |
Real Estate Taxes by Mortgage Status in Panama
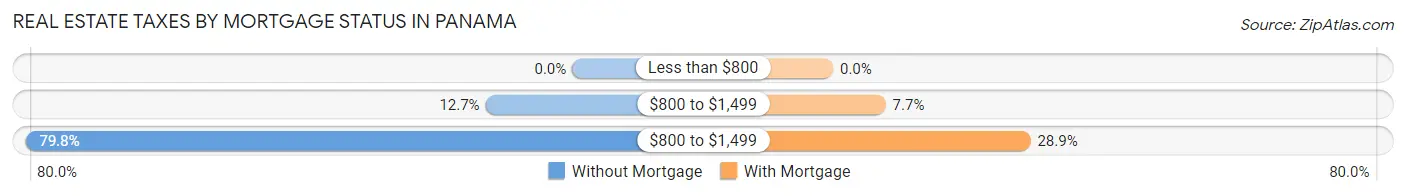
| Property Taxes | Without Mortgage | With Mortgage |
| Less than $800 | 0 (0.0%) | 0 (0.0%) |
| $800 to $1,499 | 10 (12.7%) | 4 (7.7%) |
| $800 to $1,499 | 63 (79.7%) | 15 (28.8%) |
| Total | 79 (100.0%) | 52 (100.0%) |
Health & Disability in Panama
Health Insurance Coverage by Age in Panama
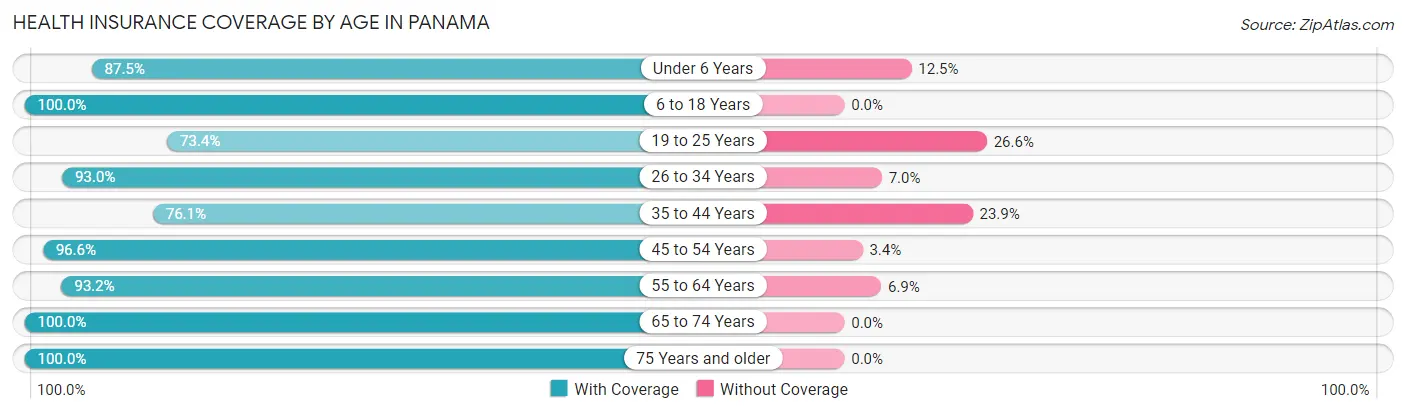
| Age Bracket | With Coverage | Without Coverage |
| Under 6 Years | 14 (87.5%) | 2 (12.5%) |
| 6 to 18 Years | 75 (100.0%) | 0 (0.0%) |
| 19 to 25 Years | 47 (73.4%) | 17 (26.6%) |
| 26 to 34 Years | 40 (93.0%) | 3 (7.0%) |
| 35 to 44 Years | 35 (76.1%) | 11 (23.9%) |
| 45 to 54 Years | 57 (96.6%) | 2 (3.4%) |
| 55 to 64 Years | 68 (93.1%) | 5 (6.9%) |
| 65 to 74 Years | 51 (100.0%) | 0 (0.0%) |
| 75 Years and older | 57 (100.0%) | 0 (0.0%) |
| Total | 444 (91.7%) | 40 (8.3%) |
Health Insurance Coverage by Citizenship Status in Panama
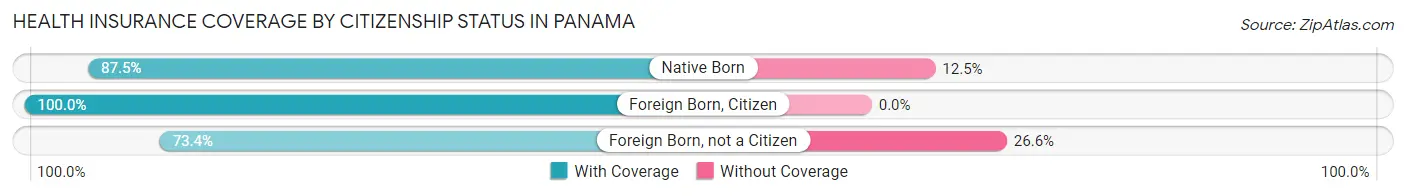
| Citizenship Status | With Coverage | Without Coverage |
| Native Born | 14 (87.5%) | 2 (12.5%) |
| Foreign Born, Citizen | 75 (100.0%) | 0 (0.0%) |
| Foreign Born, not a Citizen | 47 (73.4%) | 17 (26.6%) |
Health Insurance Coverage by Household Income in Panama
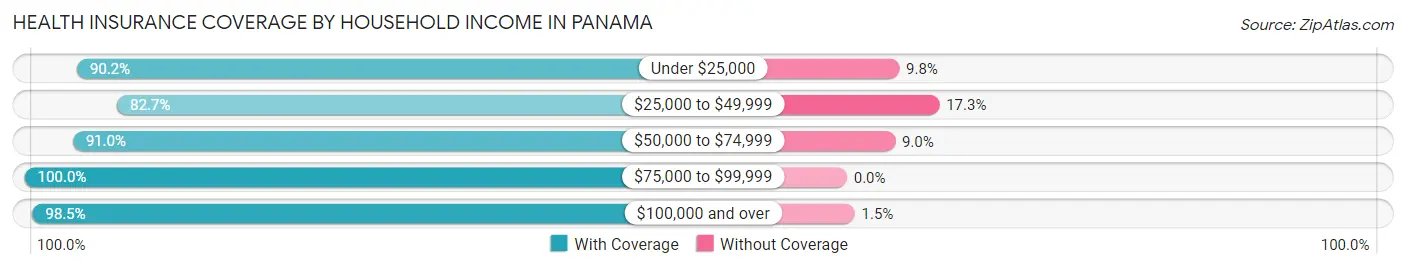
| Household Income | With Coverage | Without Coverage |
| Under $25,000 | 46 (90.2%) | 5 (9.8%) |
| $25,000 to $49,999 | 105 (82.7%) | 22 (17.3%) |
| $50,000 to $74,999 | 111 (91.0%) | 11 (9.0%) |
| $75,000 to $99,999 | 47 (100.0%) | 0 (0.0%) |
| $100,000 and over | 135 (98.5%) | 2 (1.5%) |
Public vs Private Health Insurance Coverage by Age in Panama
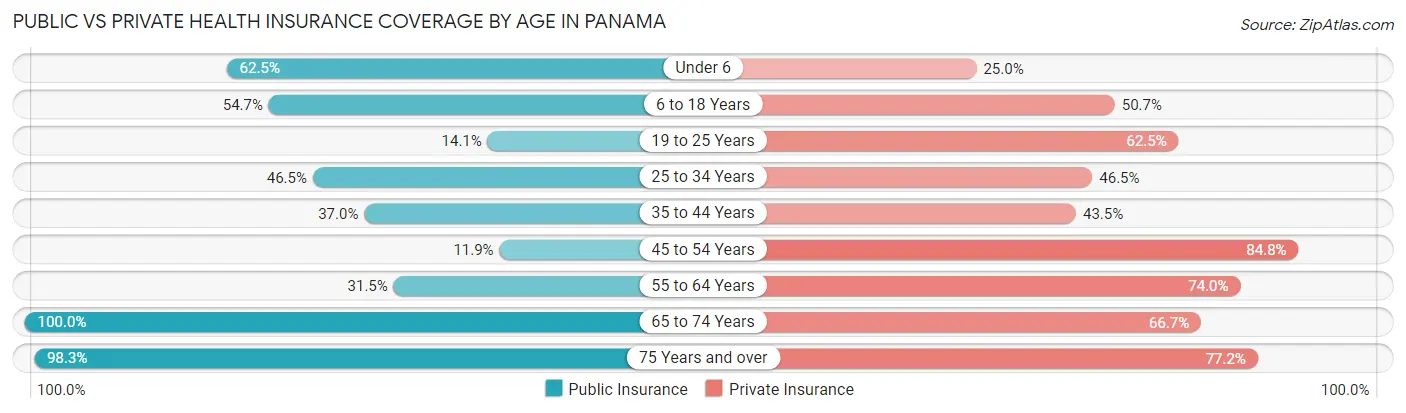
| Age Bracket | Public Insurance | Private Insurance |
| Under 6 | 10 (62.5%) | 4 (25.0%) |
| 6 to 18 Years | 41 (54.7%) | 38 (50.7%) |
| 19 to 25 Years | 9 (14.1%) | 40 (62.5%) |
| 25 to 34 Years | 20 (46.5%) | 20 (46.5%) |
| 35 to 44 Years | 17 (37.0%) | 20 (43.5%) |
| 45 to 54 Years | 7 (11.9%) | 50 (84.8%) |
| 55 to 64 Years | 23 (31.5%) | 54 (74.0%) |
| 65 to 74 Years | 51 (100.0%) | 34 (66.7%) |
| 75 Years and over | 56 (98.3%) | 44 (77.2%) |
| Total | 234 (48.3%) | 304 (62.8%) |
Disability Status by Sex by Age in Panama
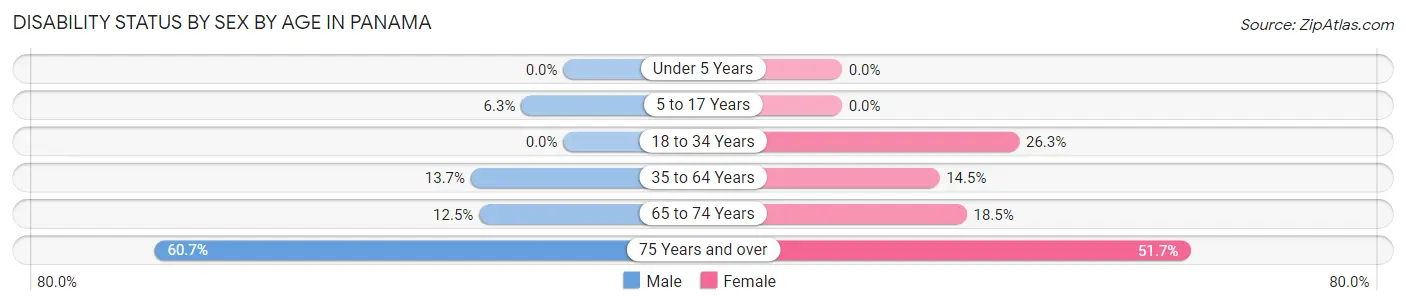
| Age Bracket | Male | Female |
| Under 5 Years | 0 (0.0%) | 0 (0.0%) |
| 5 to 17 Years | 2 (6.2%) | 0 (0.0%) |
| 18 to 34 Years | 0 (0.0%) | 15 (26.3%) |
| 35 to 64 Years | 14 (13.7%) | 11 (14.5%) |
| 65 to 74 Years | 3 (12.5%) | 5 (18.5%) |
| 75 Years and over | 17 (60.7%) | 15 (51.7%) |
Disability Class by Sex by Age in Panama
Disability Class: Hearing Difficulty
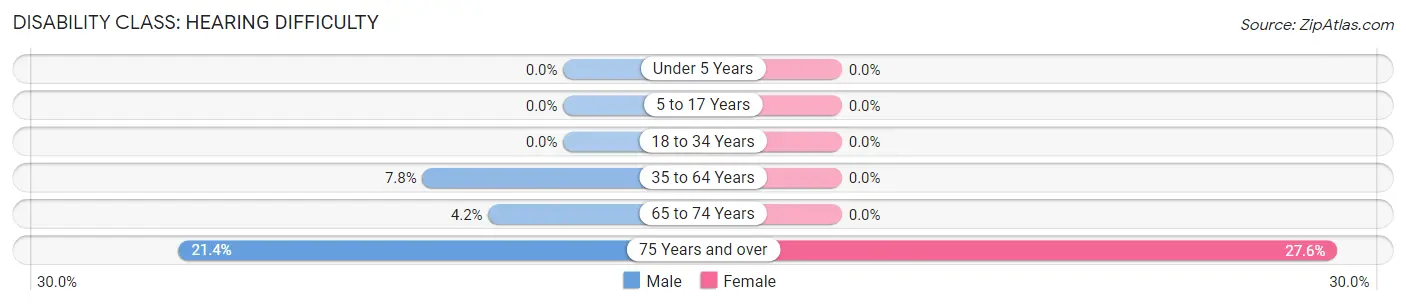
| Age Bracket | Male | Female |
| Under 5 Years | 0 (0.0%) | 0 (0.0%) |
| 5 to 17 Years | 0 (0.0%) | 0 (0.0%) |
| 18 to 34 Years | 0 (0.0%) | 0 (0.0%) |
| 35 to 64 Years | 8 (7.8%) | 0 (0.0%) |
| 65 to 74 Years | 1 (4.2%) | 0 (0.0%) |
| 75 Years and over | 6 (21.4%) | 8 (27.6%) |
Disability Class: Vision Difficulty
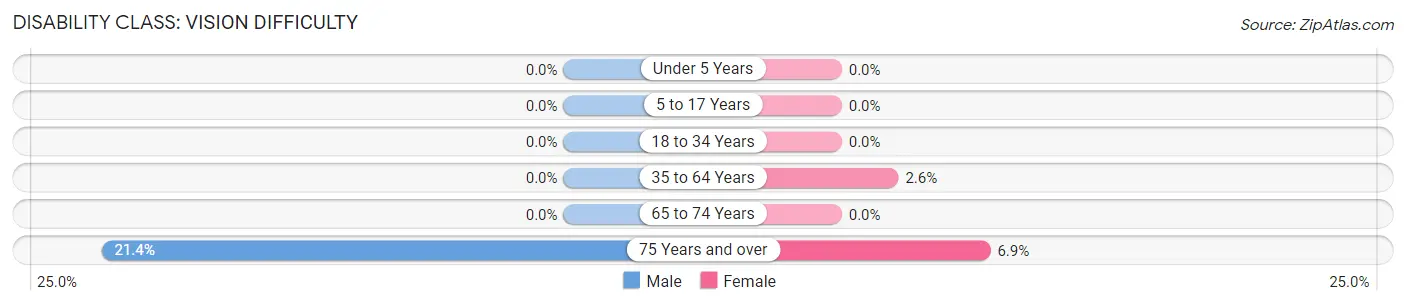
| Age Bracket | Male | Female |
| Under 5 Years | 0 (0.0%) | 0 (0.0%) |
| 5 to 17 Years | 0 (0.0%) | 0 (0.0%) |
| 18 to 34 Years | 0 (0.0%) | 0 (0.0%) |
| 35 to 64 Years | 0 (0.0%) | 2 (2.6%) |
| 65 to 74 Years | 0 (0.0%) | 0 (0.0%) |
| 75 Years and over | 6 (21.4%) | 2 (6.9%) |
Disability Class: Cognitive Difficulty
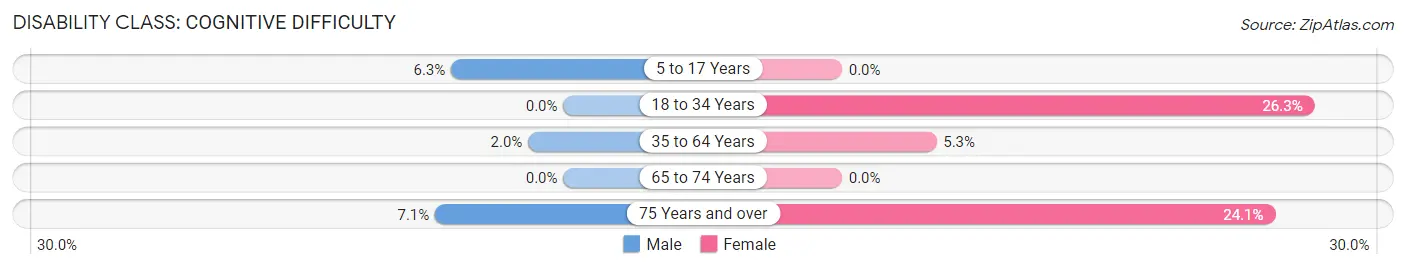
| Age Bracket | Male | Female |
| 5 to 17 Years | 2 (6.2%) | 0 (0.0%) |
| 18 to 34 Years | 0 (0.0%) | 15 (26.3%) |
| 35 to 64 Years | 2 (2.0%) | 4 (5.3%) |
| 65 to 74 Years | 0 (0.0%) | 0 (0.0%) |
| 75 Years and over | 2 (7.1%) | 7 (24.1%) |
Disability Class: Ambulatory Difficulty
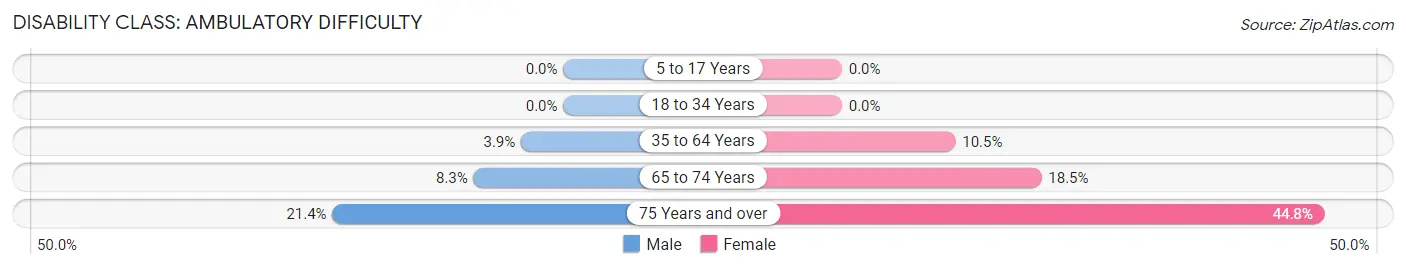
| Age Bracket | Male | Female |
| 5 to 17 Years | 0 (0.0%) | 0 (0.0%) |
| 18 to 34 Years | 0 (0.0%) | 0 (0.0%) |
| 35 to 64 Years | 4 (3.9%) | 8 (10.5%) |
| 65 to 74 Years | 2 (8.3%) | 5 (18.5%) |
| 75 Years and over | 6 (21.4%) | 13 (44.8%) |
Disability Class: Self-Care Difficulty
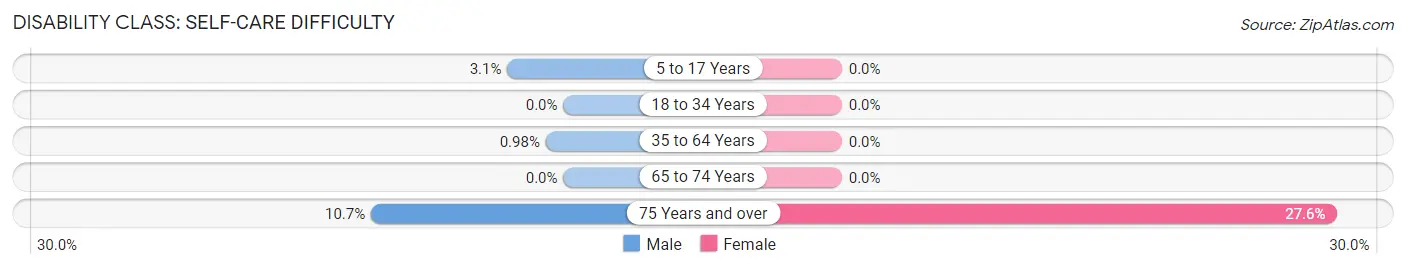
| Age Bracket | Male | Female |
| 5 to 17 Years | 1 (3.1%) | 0 (0.0%) |
| 18 to 34 Years | 0 (0.0%) | 0 (0.0%) |
| 35 to 64 Years | 1 (1.0%) | 0 (0.0%) |
| 65 to 74 Years | 0 (0.0%) | 0 (0.0%) |
| 75 Years and over | 3 (10.7%) | 8 (27.6%) |
Technology Access in Panama
Computing Device Access in Panama
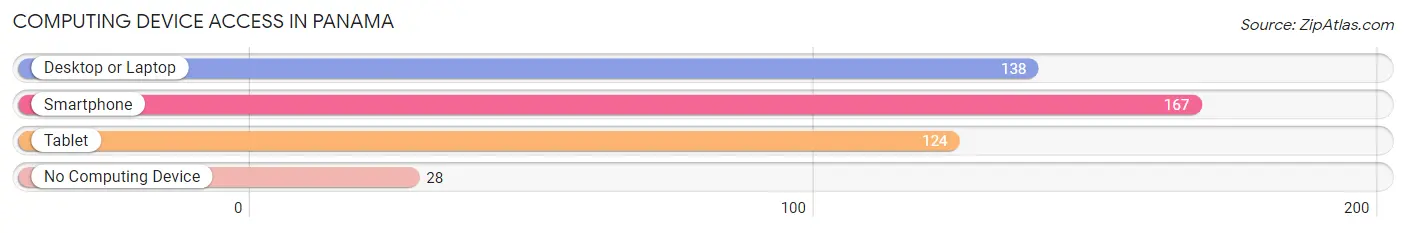
| Device Type | # Households | % Households |
| Desktop or Laptop | 138 | 63.3% |
| Smartphone | 167 | 76.6% |
| Tablet | 124 | 56.9% |
| No Computing Device | 28 | 12.8% |
| Total | 218 | 100.0% |
Internet Access in Panama
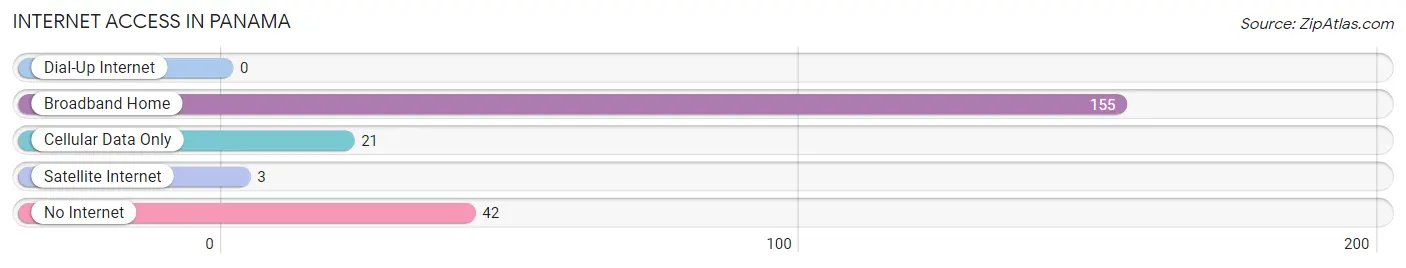
| Internet Type | # Households | % Households |
| Dial-Up Internet | 0 | 0.0% |
| Broadband Home | 155 | 71.1% |
| Cellular Data Only | 21 | 9.6% |
| Satellite Internet | 3 | 1.4% |
| No Internet | 42 | 19.3% |
| Total | 218 | 100.0% |
Panama Summary
Panama, New York is a small town located in Chautauqua County, New York. It is situated on the eastern shore of Chautauqua Lake, and is part of the Jamestown-Dunkirk-Fredonia metropolitan area. The town was founded in 1825 and has a population of approximately 1,500 people.
Geography
Panama is located in the southwestern corner of Chautauqua County, New York. It is situated on the eastern shore of Chautauqua Lake, and is part of the Jamestown-Dunkirk-Fredonia metropolitan area. The town is bordered by the towns of Harmony and Busti to the north, the town of Kiantone to the east, the town of Carroll to the south, and the town of Clymer to the west. The town is located approximately 30 miles south of Buffalo, New York, and approximately 50 miles east of Erie, Pennsylvania.
The terrain of Panama is generally flat, with some rolling hills in the northern part of the town. The highest point in the town is located in the northern part of the town, and is approximately 1,000 feet above sea level. The town is located in the Chautauqua Lake watershed, and is drained by several small creeks and streams, including the Panama Creek, which flows through the center of the town.
Economy
The economy of Panama is largely based on agriculture and tourism. The town is home to several small farms, which produce a variety of crops, including corn, soybeans, wheat, and hay. The town is also home to several wineries, which produce a variety of wines.
Tourism is an important part of the economy of Panama. The town is home to several popular attractions, including the Panama Rocks Scenic Park, which features a variety of rock formations and hiking trails. The town is also home to several popular fishing spots, including Chautauqua Lake, which is known for its walleye and bass fishing.
Demographics
As of the 2010 census, the population of Panama was 1,500 people. The racial makeup of the town was 97.3% White, 0.7% African American, 0.3% Native American, 0.3% Asian, and 1.3% from two or more races. The median household income in the town was $41,250, and the median family income was $50,000.
The town is served by the Panama Central School District, which consists of one elementary school, one middle school, and one high school. The town is also home to several churches, including the Panama United Methodist Church, the Panama Presbyterian Church, and the Panama Baptist Church.
Conclusion
Panama, New York is a small town located in Chautauqua County, New York. It is situated on the eastern shore of Chautauqua Lake, and is part of the Jamestown-Dunkirk-Fredonia metropolitan area. The town was founded in 1825 and has a population of approximately 1,500 people. The economy of Panama is largely based on agriculture and tourism, and the town is home to several popular attractions, including the Panama Rocks Scenic Park. The town is served by the Panama Central School District, and is home to several churches.
Common Questions
What is Per Capita Income in Panama?
Per Capita income in Panama is $28,558.
What is the Median Family Income in Panama?
Median Family Income in Panama is $67,500.
What is the Median Household income in Panama?
Median Household Income in Panama is $53,889.
What is Income or Wage Gap in Panama?
Income or Wage Gap in Panama is 4.5%.
Women in Panama earn 95.5 cents for every dollar earned by a man.
What is Inequality or Gini Index in Panama?
Inequality or Gini Index in Panama is 0.39.
What is the Total Population of Panama?
Total Population of Panama is 484.
What is the Total Male Population of Panama?
Total Male Population of Panama is 257.
What is the Total Female Population of Panama?
Total Female Population of Panama is 227.
What is the Ratio of Males per 100 Females in Panama?
There are 113.22 Males per 100 Females in Panama.
What is the Ratio of Females per 100 Males in Panama?
There are 88.33 Females per 100 Males in Panama.
What is the Median Population Age in Panama?
Median Population Age in Panama is 44.6 Years.
What is the Average Family Size in Panama
Average Family Size in Panama is 2.9 People.
What is the Average Household Size in Panama
Average Household Size in Panama is 2.2 People.
How Large is the Labor Force in Panama?
There are 247 People in the Labor Forcein in Panama.
What is the Percentage of People in the Labor Force in Panama?
59.1% of People are in the Labor Force in Panama.
What is the Unemployment Rate in Panama?
Unemployment Rate in Panama is 0.8%.