Orange Lake, NY Map & Demographics
Orange Lake Map
Orange Lake Overview
$43,667
PER CAPITA INCOME
$112,582
AVG FAMILY INCOME
$104,313
AVG HOUSEHOLD INCOME
38.4%
WAGE / INCOME GAP [ % ]
61.6¢/ $1
WAGE / INCOME GAP [ $ ]
0.38
INEQUALITY / GINI INDEX
10,060
TOTAL POPULATION
5,030
MALE POPULATION
5,030
FEMALE POPULATION
100.00
MALES / 100 FEMALES
100.00
FEMALES / 100 MALES
46.7
MEDIAN AGE
3.1
AVG FAMILY SIZE
2.7
AVG HOUSEHOLD SIZE
5,080
LABOR FORCE [ PEOPLE ]
57.5%
PERCENT IN LABOR FORCE
4.0%
UNEMPLOYMENT RATE
Income in Orange Lake
Income Overview in Orange Lake
Per Capita Income in Orange Lake is $43,667, while median incomes of families and households are $112,582 and $104,313 respectively.
| Characteristic | Number | Measure |
| Per Capita Income | 10,060 | $43,667 |
| Median Family Income | 2,753 | $112,582 |
| Mean Family Income | 2,753 | $127,583 |
| Median Household Income | 3,677 | $104,313 |
| Mean Household Income | 3,677 | $115,743 |
| Income Deficit | 2,753 | $0 |
| Wage / Income Gap (%) | 10,060 | 38.43% |
| Wage / Income Gap ($) | 10,060 | 61.57¢ per $1 |
| Gini / Inequality Index | 10,060 | 0.38 |
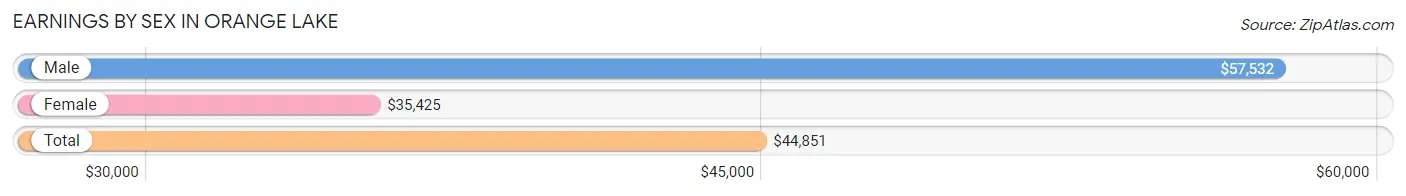
Earnings by Sex in Orange Lake
Average Earnings in Orange Lake are $44,851, $57,532 for men and $35,425 for women, a difference of 38.4%.
| Sex | Number | Average Earnings |
| Male | 2,922 (53.4%) | $57,532 |
| Female | 2,551 (46.6%) | $35,425 |
| Total | 5,473 (100.0%) | $44,851 |
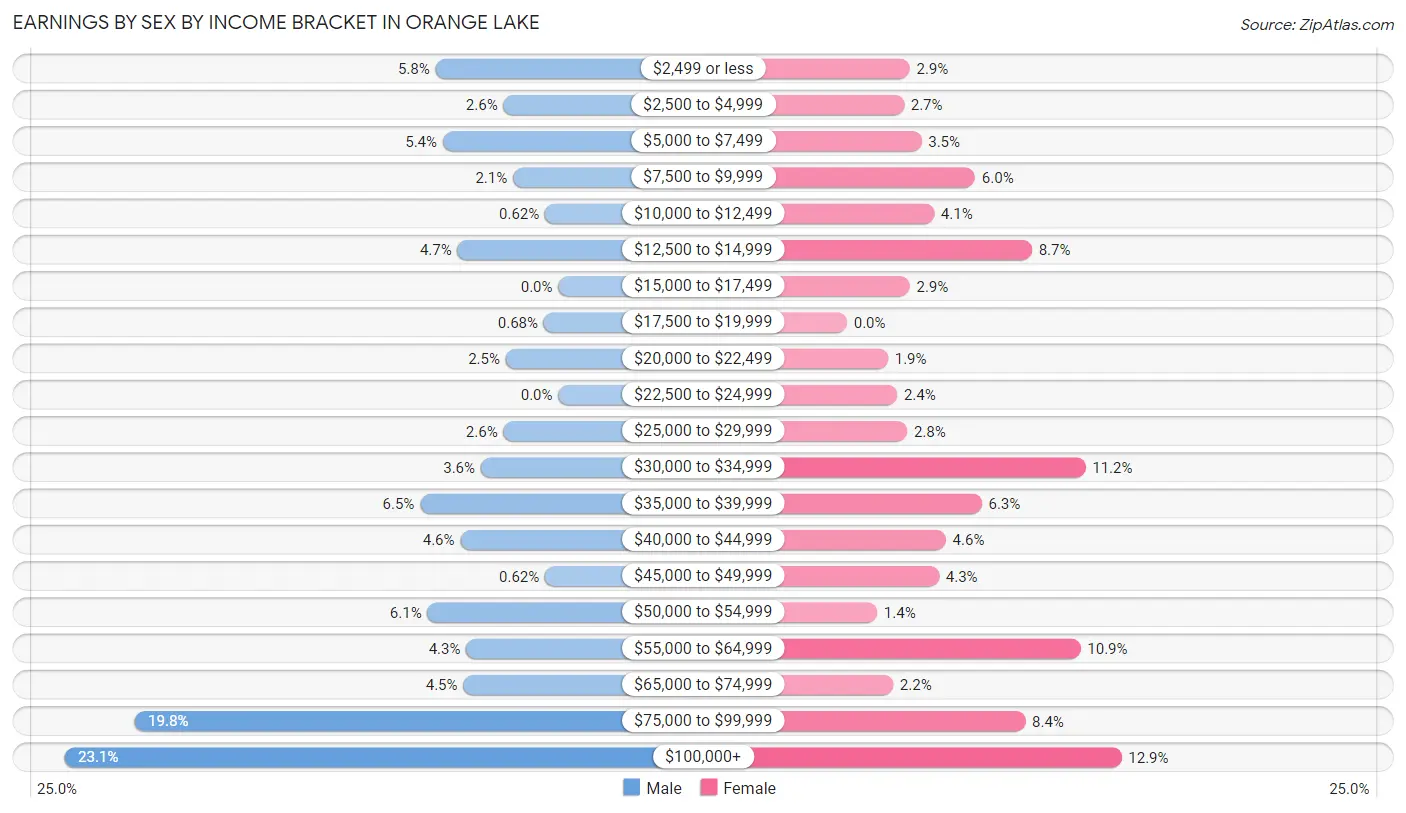
Earnings by Sex by Income Bracket in Orange Lake
The most common earnings brackets in Orange Lake are $100,000+ for men (675 | 23.1%) and $100,000+ for women (328 | 12.9%).
| Income | Male | Female |
| $2,499 or less | 168 (5.8%) | 75 (2.9%) |
| $2,500 to $4,999 | 75 (2.6%) | 68 (2.7%) |
| $5,000 to $7,499 | 158 (5.4%) | 89 (3.5%) |
| $7,500 to $9,999 | 62 (2.1%) | 153 (6.0%) |
| $10,000 to $12,499 | 18 (0.6%) | 104 (4.1%) |
| $12,500 to $14,999 | 138 (4.7%) | 221 (8.7%) |
| $15,000 to $17,499 | 0 (0.0%) | 75 (2.9%) |
| $17,500 to $19,999 | 20 (0.7%) | 0 (0.0%) |
| $20,000 to $22,499 | 72 (2.5%) | 49 (1.9%) |
| $22,500 to $24,999 | 0 (0.0%) | 60 (2.4%) |
| $25,000 to $29,999 | 75 (2.6%) | 72 (2.8%) |
| $30,000 to $34,999 | 106 (3.6%) | 285 (11.2%) |
| $35,000 to $39,999 | 189 (6.5%) | 161 (6.3%) |
| $40,000 to $44,999 | 134 (4.6%) | 118 (4.6%) |
| $45,000 to $49,999 | 18 (0.6%) | 110 (4.3%) |
| $50,000 to $54,999 | 179 (6.1%) | 36 (1.4%) |
| $55,000 to $64,999 | 126 (4.3%) | 279 (10.9%) |
| $65,000 to $74,999 | 130 (4.4%) | 55 (2.2%) |
| $75,000 to $99,999 | 579 (19.8%) | 213 (8.4%) |
| $100,000+ | 675 (23.1%) | 328 (12.9%) |
| Total | 2,922 (100.0%) | 2,551 (100.0%) |
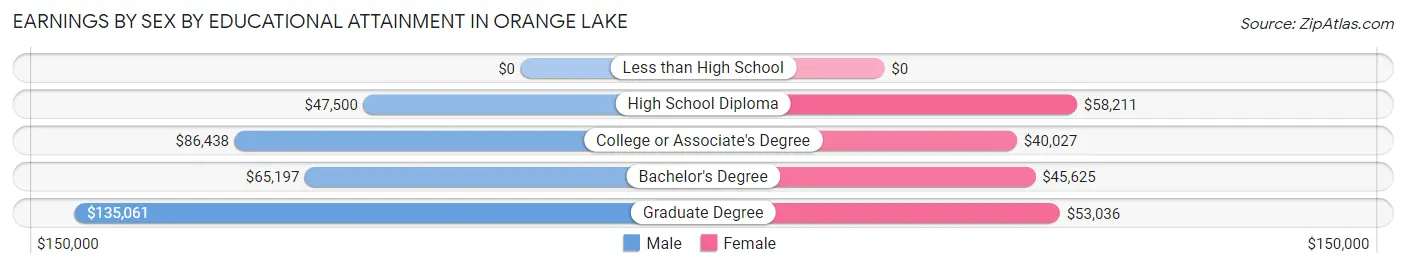
Earnings by Sex by Educational Attainment in Orange Lake
Average earnings in Orange Lake are $75,506 for men and $40,163 for women, a difference of 46.8%. Men with an educational attainment of graduate degree enjoy the highest average annual earnings of $135,061, while those with high school diploma education earn the least with $47,500. Women with an educational attainment of high school diploma earn the most with the average annual earnings of $58,211, while those with college or associate's degree education have the smallest earnings of $40,027.
| Educational Attainment | Male Income | Female Income |
| Less than High School | - | - |
| High School Diploma | $47,500 | $58,211 |
| College or Associate's Degree | $86,438 | $40,027 |
| Bachelor's Degree | $65,197 | $45,625 |
| Graduate Degree | $135,061 | $53,036 |
| Total | $75,506 | $40,163 |
Family Income in Orange Lake
Family Income Brackets in Orange Lake
According to the Orange Lake family income data, there are 914 families falling into the $100,000 to $149,999 income range, which is the most common income bracket and makes up 33.2% of all families. Conversely, the less than $10,000 income bracket is the least frequent group with only 30 families (1.1%) belonging to this category.
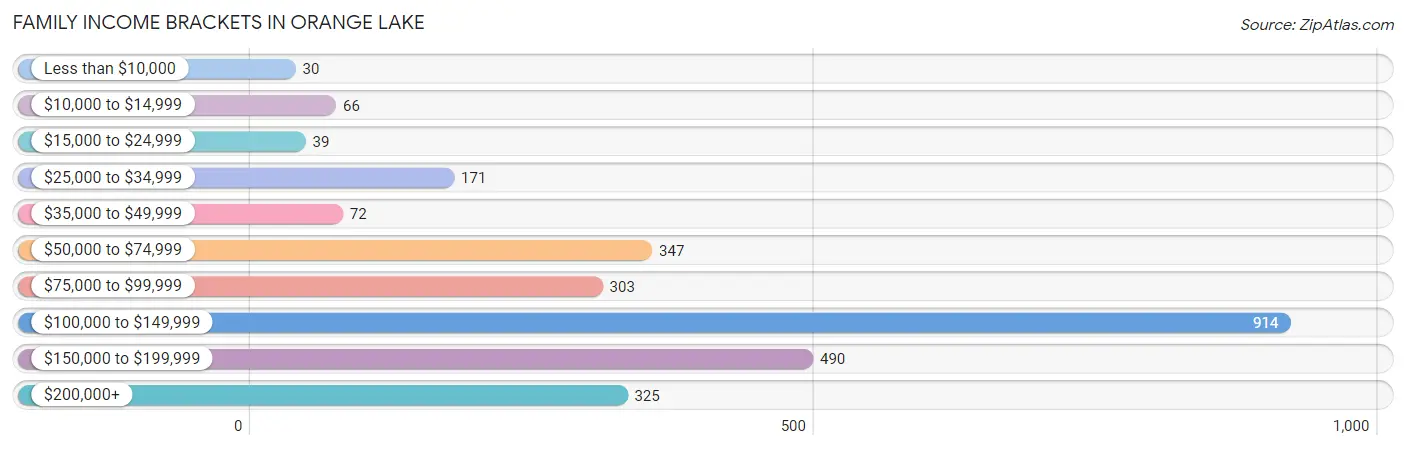
| Income Bracket | # Families | % Families |
| Less than $10,000 | 30 | 1.1% |
| $10,000 to $14,999 | 66 | 2.4% |
| $15,000 to $24,999 | 39 | 1.4% |
| $25,000 to $34,999 | 171 | 6.2% |
| $35,000 to $49,999 | 72 | 2.6% |
| $50,000 to $74,999 | 347 | 12.6% |
| $75,000 to $99,999 | 303 | 11.0% |
| $100,000 to $149,999 | 914 | 33.2% |
| $150,000 to $199,999 | 490 | 17.8% |
| $200,000+ | 325 | 11.8% |
Family Income by Famaliy Size in Orange Lake
5-person families (158 | 5.7%) account for the highest median family income in Orange Lake with $115,455 per family, while 2-person families (1,171 | 42.5%) have the highest median income of $54,946 per family member.
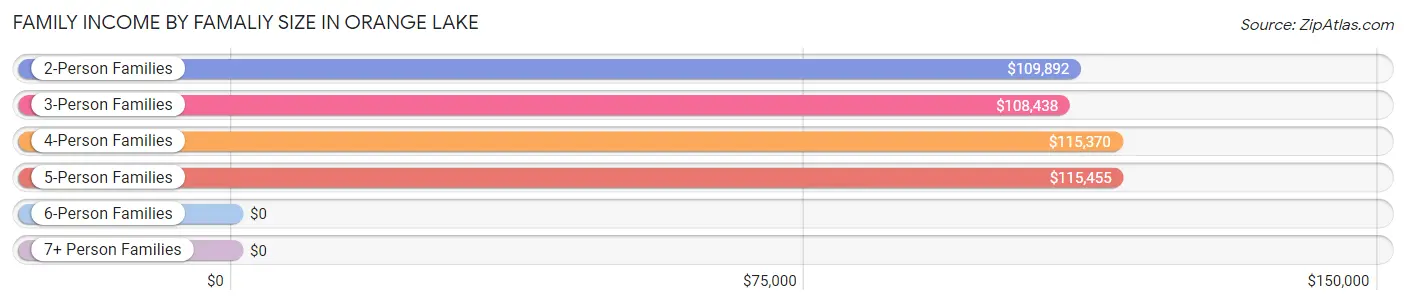
| Income Bracket | # Families | Median Income |
| 2-Person Families | 1,171 (42.5%) | $109,892 |
| 3-Person Families | 869 (31.6%) | $108,438 |
| 4-Person Families | 484 (17.6%) | $115,370 |
| 5-Person Families | 158 (5.7%) | $115,455 |
| 6-Person Families | 51 (1.8%) | $0 |
| 7+ Person Families | 20 (0.7%) | $0 |
| Total | 2,753 (100.0%) | $112,582 |
Family Income by Number of Earners in Orange Lake
The median family income in Orange Lake is $112,582, with families comprising 3+ earners (337) having the highest median family income of $162,902, while families with no earners (335) have the lowest median family income of $80,781, accounting for 12.2% and 12.2% of families, respectively.
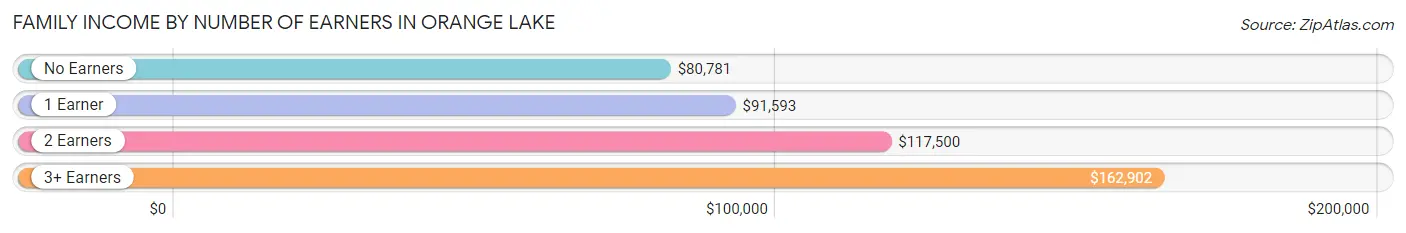
| Number of Earners | # Families | Median Income |
| No Earners | 335 (12.2%) | $80,781 |
| 1 Earner | 895 (32.5%) | $91,593 |
| 2 Earners | 1,186 (43.1%) | $117,500 |
| 3+ Earners | 337 (12.2%) | $162,902 |
| Total | 2,753 (100.0%) | $112,582 |
Household Income in Orange Lake
Household Income Brackets in Orange Lake
With 923 households falling in the category, the $100,000 to $149,999 income range is the most frequent in Orange Lake, accounting for 25.1% of all households. In contrast, only 63 households (1.7%) fall into the less than $10,000 income bracket, making it the least populous group.
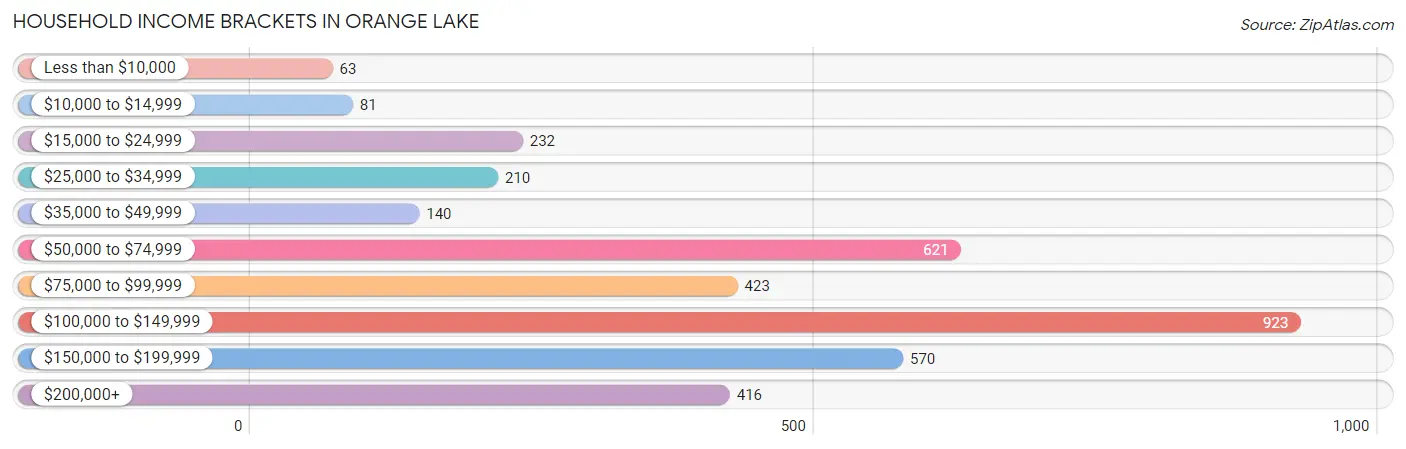
| Income Bracket | # Households | % Households |
| Less than $10,000 | 63 | 1.7% |
| $10,000 to $14,999 | 81 | 2.2% |
| $15,000 to $24,999 | 232 | 6.3% |
| $25,000 to $34,999 | 210 | 5.7% |
| $35,000 to $49,999 | 140 | 3.8% |
| $50,000 to $74,999 | 621 | 16.9% |
| $75,000 to $99,999 | 423 | 11.5% |
| $100,000 to $149,999 | 923 | 25.1% |
| $150,000 to $199,999 | 570 | 15.5% |
| $200,000+ | 416 | 11.3% |
Household Income by Householder Age in Orange Lake
The median household income in Orange Lake is $104,313, with the highest median household income of $109,542 found in the 45 to 64 years age bracket for the primary householder. A total of 1,727 households (47.0%) fall into this category. Meanwhile, the 15 to 24 years age bracket for the primary householder has the lowest median household income of $0, with 80 households (2.2%) in this group.
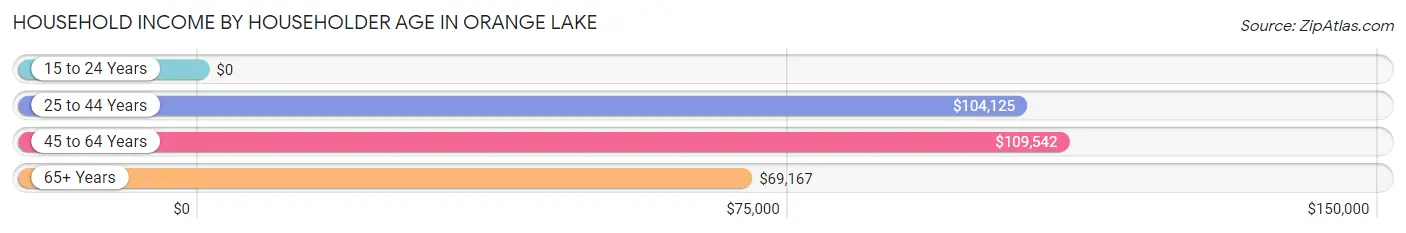
| Income Bracket | # Households | Median Income |
| 15 to 24 Years | 80 (2.2%) | $0 |
| 25 to 44 Years | 700 (19.0%) | $104,125 |
| 45 to 64 Years | 1,727 (47.0%) | $109,542 |
| 65+ Years | 1,170 (31.8%) | $69,167 |
| Total | 3,677 (100.0%) | $104,313 |
Poverty in Orange Lake
Income Below Poverty by Sex and Age in Orange Lake
With 7.3% poverty level for males and 4.5% for females among the residents of Orange Lake, 6 to 11 year old males and 5 year old females are the most vulnerable to poverty, with 37 males (21.9%) and 16 females (59.3%) in their respective age groups living below the poverty level.
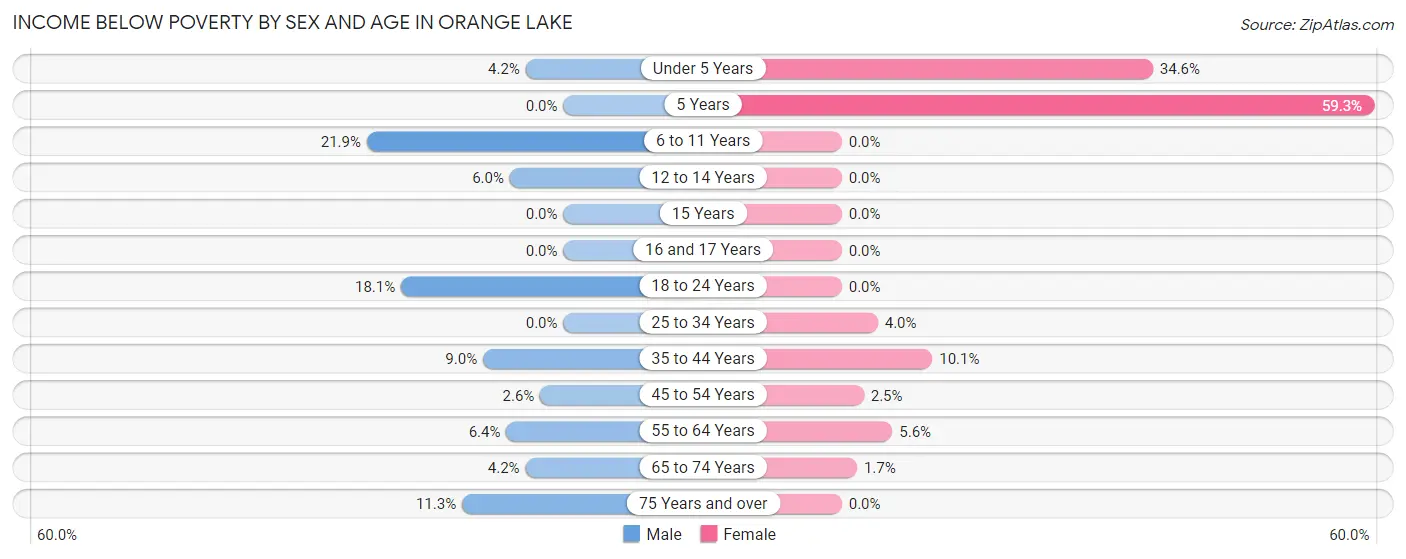
| Age Bracket | Male | Female |
| Under 5 Years | 10 (4.2%) | 53 (34.6%) |
| 5 Years | 0 (0.0%) | 16 (59.3%) |
| 6 to 11 Years | 37 (21.9%) | 0 (0.0%) |
| 12 to 14 Years | 17 (6.0%) | 0 (0.0%) |
| 15 Years | 0 (0.0%) | 0 (0.0%) |
| 16 and 17 Years | 0 (0.0%) | 0 (0.0%) |
| 18 to 24 Years | 100 (18.1%) | 0 (0.0%) |
| 25 to 34 Years | 0 (0.0%) | 20 (4.0%) |
| 35 to 44 Years | 51 (8.9%) | 49 (10.1%) |
| 45 to 54 Years | 21 (2.6%) | 18 (2.5%) |
| 55 to 64 Years | 43 (6.4%) | 56 (5.6%) |
| 65 to 74 Years | 14 (4.2%) | 10 (1.7%) |
| 75 Years and over | 69 (11.3%) | 0 (0.0%) |
| Total | 362 (7.3%) | 222 (4.5%) |
Income Above Poverty by Sex and Age in Orange Lake
According to the poverty statistics in Orange Lake, males aged 15 years and females aged 6 to 11 years are the age groups that are most secure financially, with 100.0% of males and 100.0% of females in these age groups living above the poverty line.
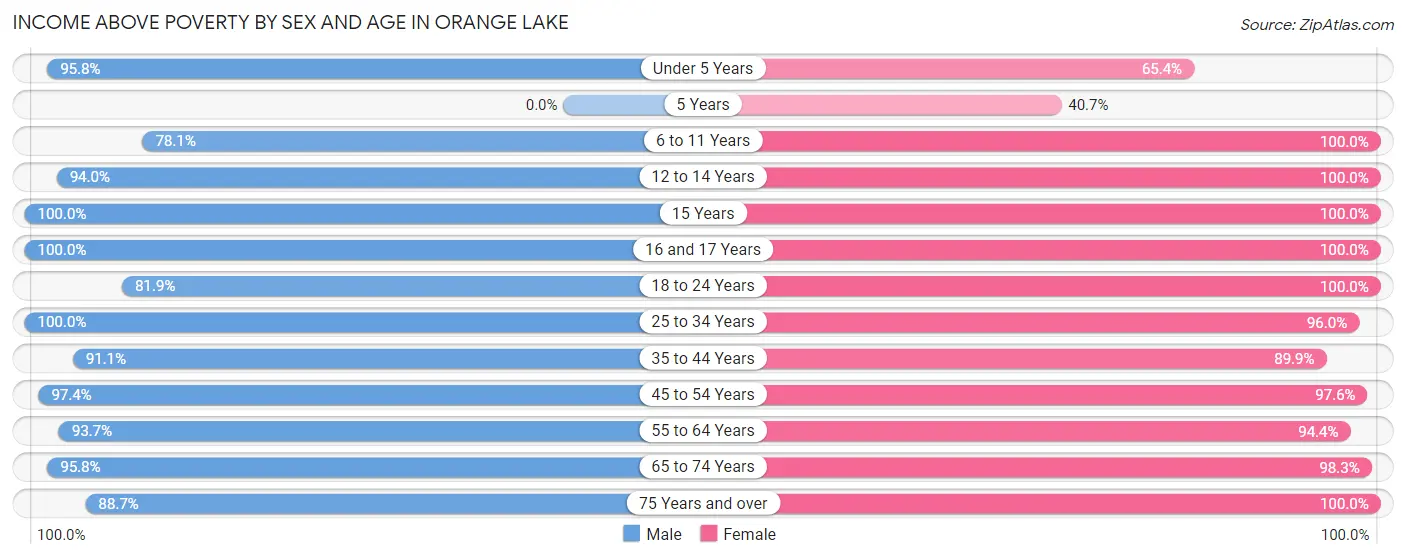
| Age Bracket | Male | Female |
| Under 5 Years | 228 (95.8%) | 100 (65.4%) |
| 5 Years | 0 (0.0%) | 11 (40.7%) |
| 6 to 11 Years | 132 (78.1%) | 91 (100.0%) |
| 12 to 14 Years | 268 (94.0%) | 113 (100.0%) |
| 15 Years | 38 (100.0%) | 111 (100.0%) |
| 16 and 17 Years | 106 (100.0%) | 98 (100.0%) |
| 18 to 24 Years | 453 (81.9%) | 677 (100.0%) |
| 25 to 34 Years | 571 (100.0%) | 479 (96.0%) |
| 35 to 44 Years | 519 (91.0%) | 437 (89.9%) |
| 45 to 54 Years | 793 (97.4%) | 717 (97.6%) |
| 55 to 64 Years | 634 (93.6%) | 939 (94.4%) |
| 65 to 74 Years | 318 (95.8%) | 582 (98.3%) |
| 75 Years and over | 542 (88.7%) | 362 (100.0%) |
| Total | 4,602 (92.7%) | 4,717 (95.5%) |
Income Below Poverty Among Married-Couple Families in Orange Lake
The poverty statistics for married-couple families in Orange Lake show that 3.0% or 58 of the total 1,956 families live below the poverty line. Families with no children have the highest poverty rate of 3.2%, comprising of 37 families. On the other hand, families with 3 or 4 children have the lowest poverty rate of 0.0%, which includes 0 families.
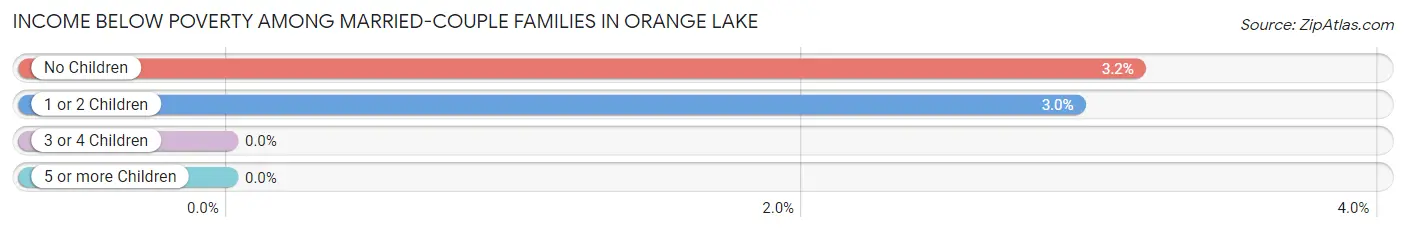
| Children | Above Poverty | Below Poverty |
| No Children | 1,135 (96.8%) | 37 (3.2%) |
| 1 or 2 Children | 692 (97.1%) | 21 (2.9%) |
| 3 or 4 Children | 71 (100.0%) | 0 (0.0%) |
| 5 or more Children | 0 (0.0%) | 0 (0.0%) |
| Total | 1,898 (97.0%) | 58 (3.0%) |
Income Below Poverty Among Single-Parent Households in Orange Lake
According to the poverty data in Orange Lake, 12.8% or 39 single-father households and 7.5% or 37 single-mother households are living below the poverty line. Among single-father households, those with 1 or 2 children have the highest poverty rate, with 39 households (45.4%) experiencing poverty. Likewise, among single-mother households, those with 1 or 2 children have the highest poverty rate, with 27 households (10.6%) falling below the poverty line.
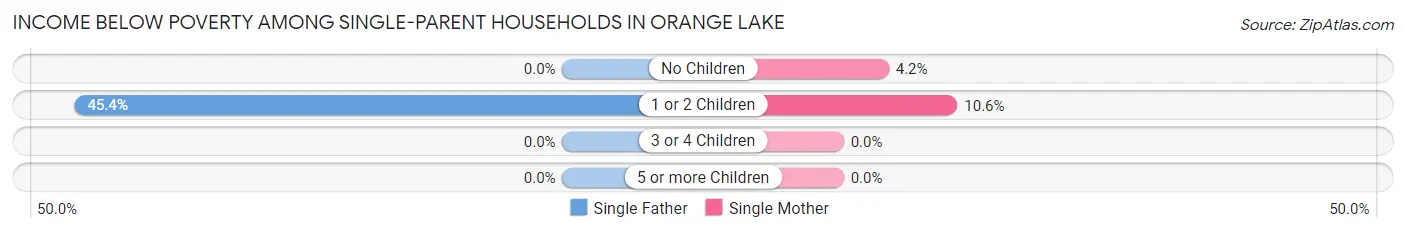
| Children | Single Father | Single Mother |
| No Children | 0 (0.0%) | 10 (4.2%) |
| 1 or 2 Children | 39 (45.4%) | 27 (10.6%) |
| 3 or 4 Children | 0 (0.0%) | 0 (0.0%) |
| 5 or more Children | 0 (0.0%) | 0 (0.0%) |
| Total | 39 (12.8%) | 37 (7.5%) |
Income Below Poverty Among Married-Couple vs Single-Parent Households in Orange Lake
The poverty data for Orange Lake shows that 58 of the married-couple family households (3.0%) and 76 of the single-parent households (9.5%) are living below the poverty level. Within the married-couple family households, those with no children have the highest poverty rate, with 37 households (3.2%) falling below the poverty line. Among the single-parent households, those with 1 or 2 children have the highest poverty rate, with 66 household (19.4%) living below poverty.
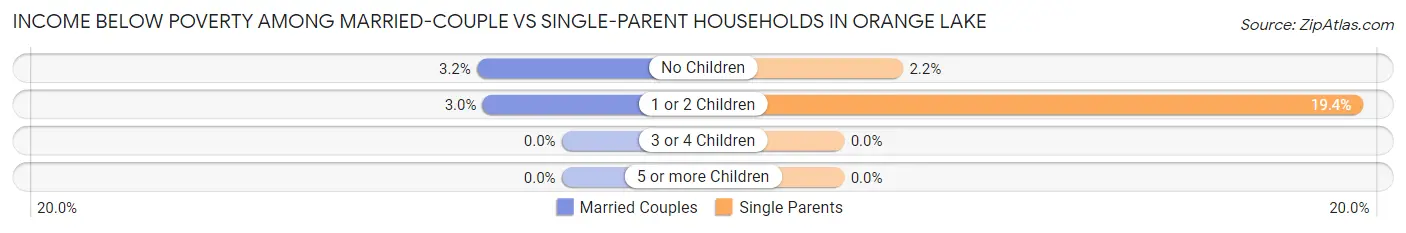
| Children | Married-Couple Families | Single-Parent Households |
| No Children | 37 (3.2%) | 10 (2.2%) |
| 1 or 2 Children | 21 (2.9%) | 66 (19.4%) |
| 3 or 4 Children | 0 (0.0%) | 0 (0.0%) |
| 5 or more Children | 0 (0.0%) | 0 (0.0%) |
| Total | 58 (3.0%) | 76 (9.5%) |
Race in Orange Lake
The most populous races in Orange Lake are White / Caucasian (5,889 | 58.5%), Hispanic or Latino (2,680 | 26.6%), and Black / African American (2,021 | 20.1%).
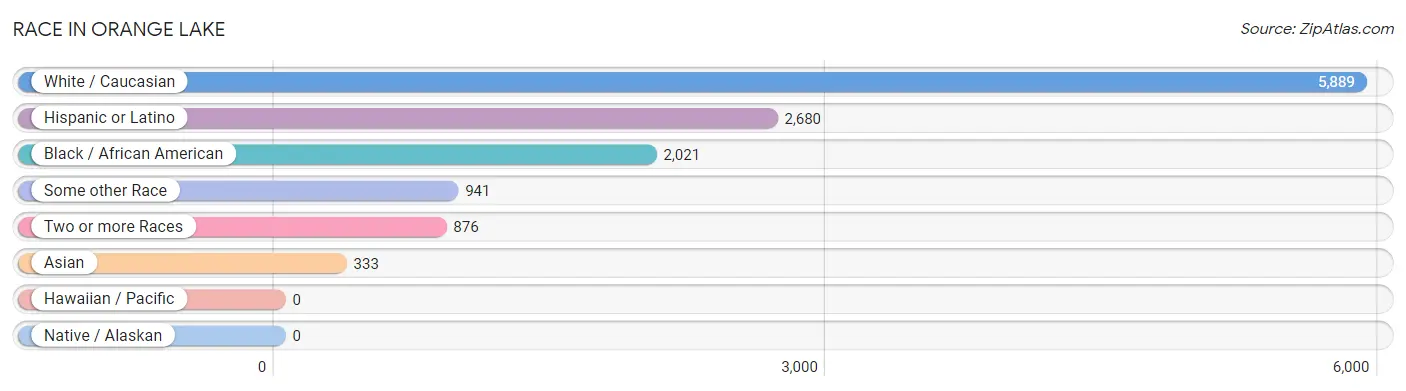
| Race | # Population | % Population |
| Asian | 333 | 3.3% |
| Black / African American | 2,021 | 20.1% |
| Hawaiian / Pacific | 0 | 0.0% |
| Hispanic or Latino | 2,680 | 26.6% |
| Native / Alaskan | 0 | 0.0% |
| White / Caucasian | 5,889 | 58.5% |
| Two or more Races | 876 | 8.7% |
| Some other Race | 941 | 9.3% |
| Total | 10,060 | 100.0% |
Ancestry in Orange Lake
The most populous ancestries reported in Orange Lake are Italian (1,357 | 13.5%), Puerto Rican (1,291 | 12.8%), Irish (1,230 | 12.2%), American (904 | 9.0%), and German (890 | 8.8%), together accounting for 56.4% of all Orange Lake residents.
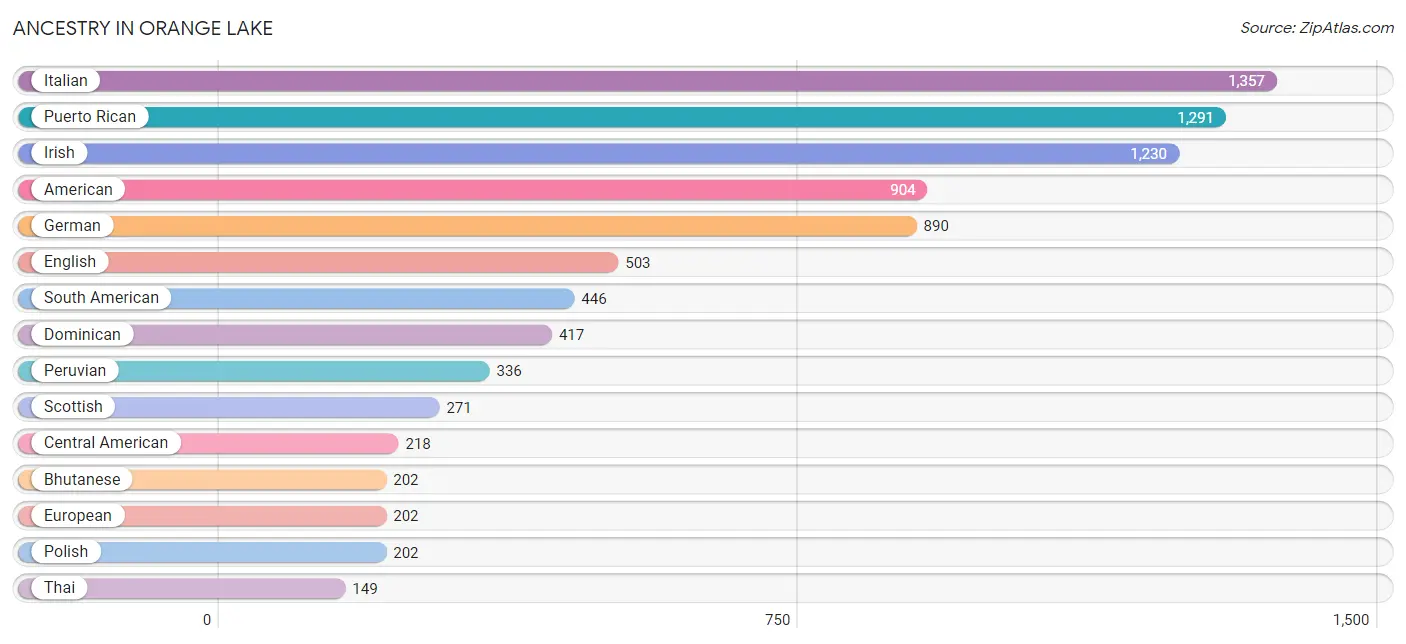
| Ancestry | # Population | % Population |
| African | 43 | 0.4% |
| American | 904 | 9.0% |
| Arab | 127 | 1.3% |
| Argentinean | 13 | 0.1% |
| Austrian | 61 | 0.6% |
| Barbadian | 11 | 0.1% |
| Belgian | 17 | 0.2% |
| Bhutanese | 202 | 2.0% |
| Brazilian | 19 | 0.2% |
| British | 27 | 0.3% |
| British West Indian | 65 | 0.6% |
| Central American | 218 | 2.2% |
| Costa Rican | 58 | 0.6% |
| Cuban | 8 | 0.1% |
| Czechoslovakian | 31 | 0.3% |
| Dominican | 417 | 4.2% |
| Dutch | 85 | 0.8% |
| Eastern European | 59 | 0.6% |
| Ecuadorian | 72 | 0.7% |
| English | 503 | 5.0% |
| European | 202 | 2.0% |
| French | 68 | 0.7% |
| French Canadian | 40 | 0.4% |
| German | 890 | 8.8% |
| Greek | 6 | 0.1% |
| Guatemalan | 34 | 0.3% |
| Guyanese | 100 | 1.0% |
| Haitian | 22 | 0.2% |
| Honduran | 56 | 0.6% |
| Hungarian | 60 | 0.6% |
| Indian (Asian) | 13 | 0.1% |
| Irish | 1,230 | 12.2% |
| Italian | 1,357 | 13.5% |
| Jamaican | 67 | 0.7% |
| Korean | 21 | 0.2% |
| Lebanese | 127 | 1.3% |
| Mexican | 47 | 0.5% |
| Nigerian | 17 | 0.2% |
| Northern European | 25 | 0.3% |
| Norwegian | 31 | 0.3% |
| Pakistani | 8 | 0.1% |
| Panamanian | 29 | 0.3% |
| Peruvian | 336 | 3.3% |
| Polish | 202 | 2.0% |
| Puerto Rican | 1,291 | 12.8% |
| Russian | 34 | 0.3% |
| Salvadoran | 41 | 0.4% |
| Scotch-Irish | 16 | 0.2% |
| Scottish | 271 | 2.7% |
| Slovak | 45 | 0.4% |
| South American | 446 | 4.4% |
| Spaniard | 45 | 0.4% |
| Subsaharan African | 60 | 0.6% |
| Swedish | 44 | 0.4% |
| Swiss | 16 | 0.2% |
| Thai | 149 | 1.5% |
| Trinidadian and Tobagonian | 29 | 0.3% |
| Ukrainian | 41 | 0.4% |
| Venezuelan | 25 | 0.3% |
| Welsh | 21 | 0.2% |
| West Indian | 9 | 0.1% | View All 61 Rows |
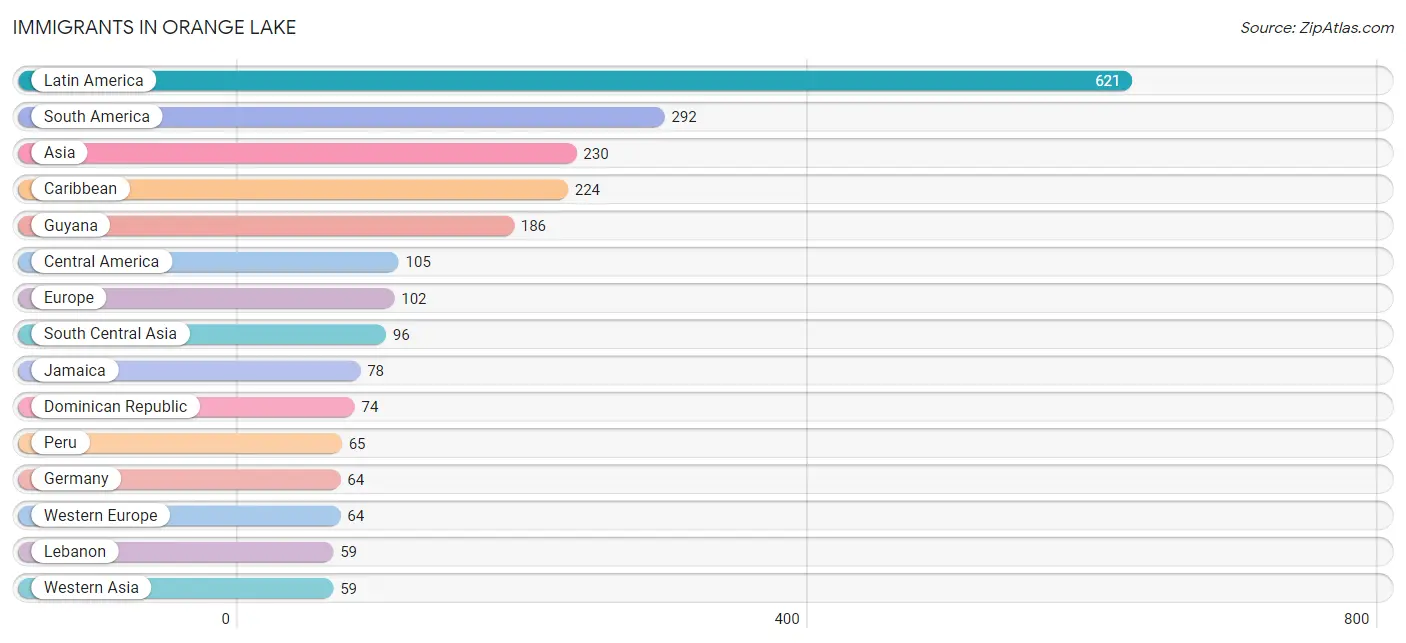
Immigrants in Orange Lake
The most numerous immigrant groups reported in Orange Lake came from Latin America (621 | 6.2%), South America (292 | 2.9%), Asia (230 | 2.3%), Caribbean (224 | 2.2%), and Guyana (186 | 1.8%), together accounting for 15.4% of all Orange Lake residents.
| Immigration Origin | # Population | % Population |
| Africa | 15 | 0.2% |
| Asia | 230 | 2.3% |
| Bangladesh | 39 | 0.4% |
| Brazil | 19 | 0.2% |
| Caribbean | 224 | 2.2% |
| Central America | 105 | 1.0% |
| China | 8 | 0.1% |
| Cuba | 7 | 0.1% |
| Dominican Republic | 74 | 0.7% |
| Eastern Asia | 54 | 0.5% |
| Ecuador | 9 | 0.1% |
| El Salvador | 29 | 0.3% |
| Europe | 102 | 1.0% |
| Germany | 64 | 0.6% |
| Guatemala | 24 | 0.2% |
| Guyana | 186 | 1.8% |
| Honduras | 23 | 0.2% |
| India | 57 | 0.6% |
| Italy | 36 | 0.4% |
| Jamaica | 78 | 0.8% |
| Japan | 46 | 0.5% |
| Latin America | 621 | 6.2% |
| Lebanon | 59 | 0.6% |
| Northern Africa | 15 | 0.2% |
| Panama | 29 | 0.3% |
| Peru | 65 | 0.6% |
| Philippines | 21 | 0.2% |
| South America | 292 | 2.9% |
| South Central Asia | 96 | 0.9% |
| South Eastern Asia | 21 | 0.2% |
| Southern Europe | 38 | 0.4% |
| Spain | 2 | 0.0% |
| Trinidad and Tobago | 54 | 0.5% |
| Venezuela | 13 | 0.1% |
| Western Asia | 59 | 0.6% |
| Western Europe | 64 | 0.6% | View All 36 Rows |
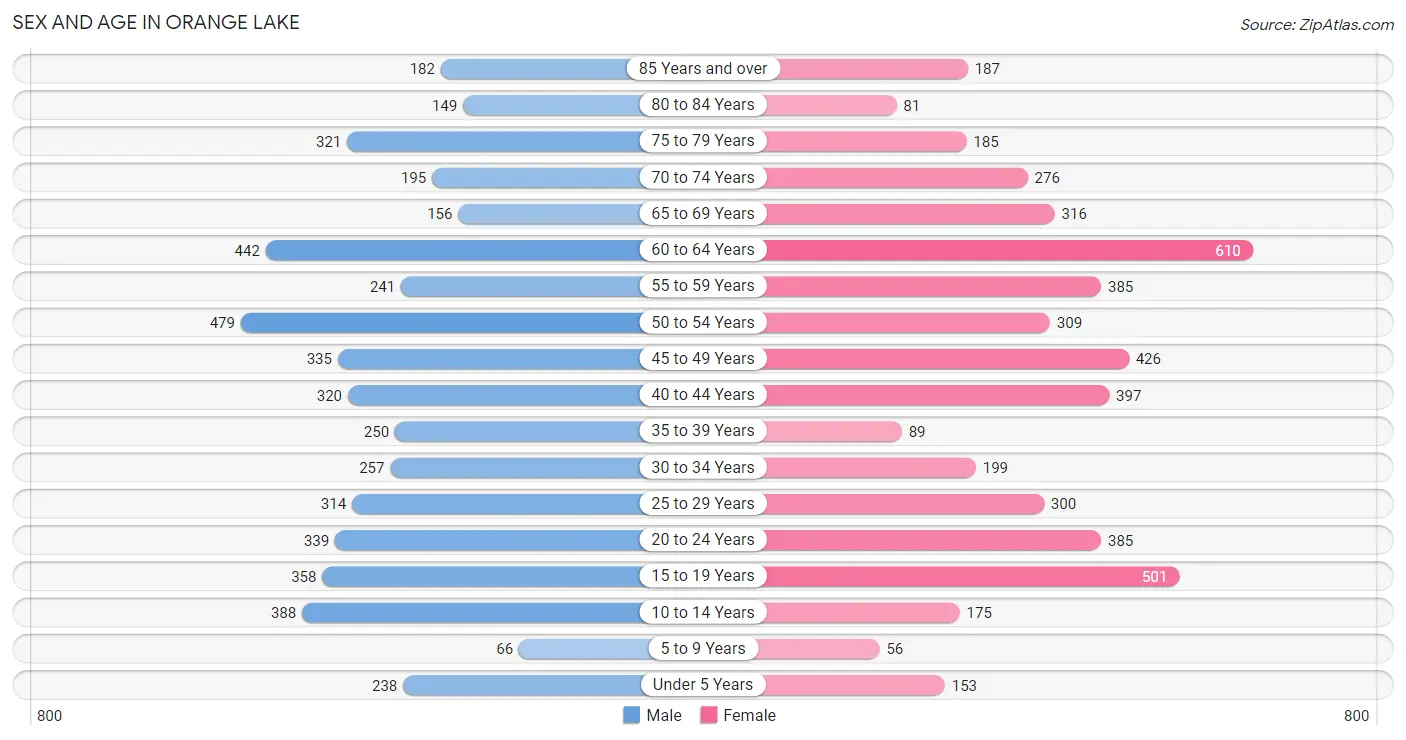
Sex and Age in Orange Lake
Sex and Age in Orange Lake
The most populous age groups in Orange Lake are 50 to 54 Years (479 | 9.5%) for men and 60 to 64 Years (610 | 12.1%) for women.
| Age Bracket | Male | Female |
| Under 5 Years | 238 (4.7%) | 153 (3.0%) |
| 5 to 9 Years | 66 (1.3%) | 56 (1.1%) |
| 10 to 14 Years | 388 (7.7%) | 175 (3.5%) |
| 15 to 19 Years | 358 (7.1%) | 501 (10.0%) |
| 20 to 24 Years | 339 (6.7%) | 385 (7.6%) |
| 25 to 29 Years | 314 (6.2%) | 300 (6.0%) |
| 30 to 34 Years | 257 (5.1%) | 199 (4.0%) |
| 35 to 39 Years | 250 (5.0%) | 89 (1.8%) |
| 40 to 44 Years | 320 (6.4%) | 397 (7.9%) |
| 45 to 49 Years | 335 (6.7%) | 426 (8.5%) |
| 50 to 54 Years | 479 (9.5%) | 309 (6.1%) |
| 55 to 59 Years | 241 (4.8%) | 385 (7.6%) |
| 60 to 64 Years | 442 (8.8%) | 610 (12.1%) |
| 65 to 69 Years | 156 (3.1%) | 316 (6.3%) |
| 70 to 74 Years | 195 (3.9%) | 276 (5.5%) |
| 75 to 79 Years | 321 (6.4%) | 185 (3.7%) |
| 80 to 84 Years | 149 (3.0%) | 81 (1.6%) |
| 85 Years and over | 182 (3.6%) | 187 (3.7%) |
| Total | 5,030 (100.0%) | 5,030 (100.0%) |
Families and Households in Orange Lake
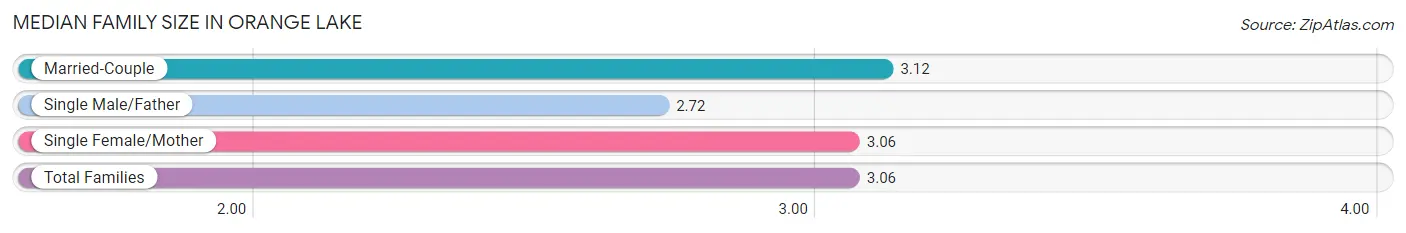
Median Family Size in Orange Lake
The median family size in Orange Lake is 3.06 persons per family, with married-couple families (1,956 | 71.1%) accounting for the largest median family size of 3.12 persons per family. On the other hand, single male/father families (304 | 11.0%) represent the smallest median family size with 2.72 persons per family.
| Family Type | # Families | Family Size |
| Married-Couple | 1,956 (71.1%) | 3.12 |
| Single Male/Father | 304 (11.0%) | 2.72 |
| Single Female/Mother | 493 (17.9%) | 3.06 |
| Total Families | 2,753 (100.0%) | 3.06 |
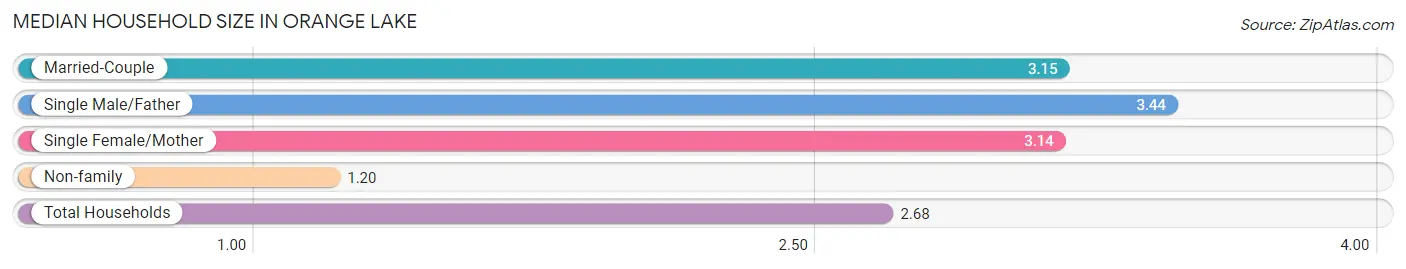
Median Household Size in Orange Lake
The median household size in Orange Lake is 2.68 persons per household, with single male/father households (304 | 8.3%) accounting for the largest median household size of 3.44 persons per household. non-family households (924 | 25.1%) represent the smallest median household size with 1.20 persons per household.
| Household Type | # Households | Household Size |
| Married-Couple | 1,956 (53.2%) | 3.15 |
| Single Male/Father | 304 (8.3%) | 3.44 |
| Single Female/Mother | 493 (13.4%) | 3.14 |
| Non-family | 924 (25.1%) | 1.20 |
| Total Households | 3,677 (100.0%) | 2.68 |
Household Size by Marriage Status in Orange Lake
Out of a total of 3,677 households in Orange Lake, 2,753 (74.9%) are family households, while 924 (25.1%) are nonfamily households. The most numerous type of family households are 3-person households, comprising 1,003, and the most common type of nonfamily households are 1-person households, comprising 753.
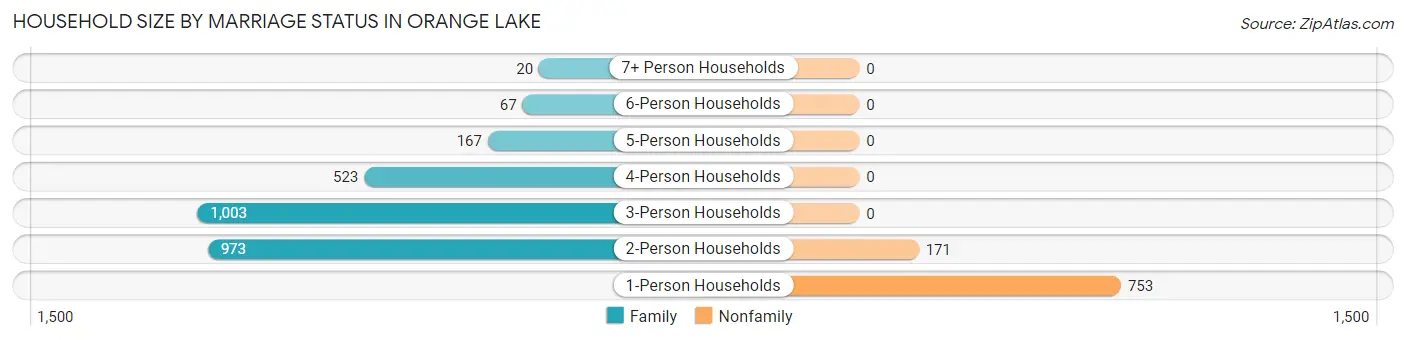
| Household Size | Family Households | Nonfamily Households |
| 1-Person Households | - | 753 (20.5%) |
| 2-Person Households | 973 (26.5%) | 171 (4.6%) |
| 3-Person Households | 1,003 (27.3%) | 0 (0.0%) |
| 4-Person Households | 523 (14.2%) | 0 (0.0%) |
| 5-Person Households | 167 (4.5%) | 0 (0.0%) |
| 6-Person Households | 67 (1.8%) | 0 (0.0%) |
| 7+ Person Households | 20 (0.5%) | 0 (0.0%) |
| Total | 2,753 (74.9%) | 924 (25.1%) |
Female Fertility in Orange Lake
Fertility by Age in Orange Lake
Average fertility rate in Orange Lake is 20.0 births per 1,000 women. Women in the age bracket of 20 to 34 years have the highest fertility rate with 54.0 births per 1,000 women. Women in the age bracket of 20 to 34 years acount for 100.0% of all women with births.
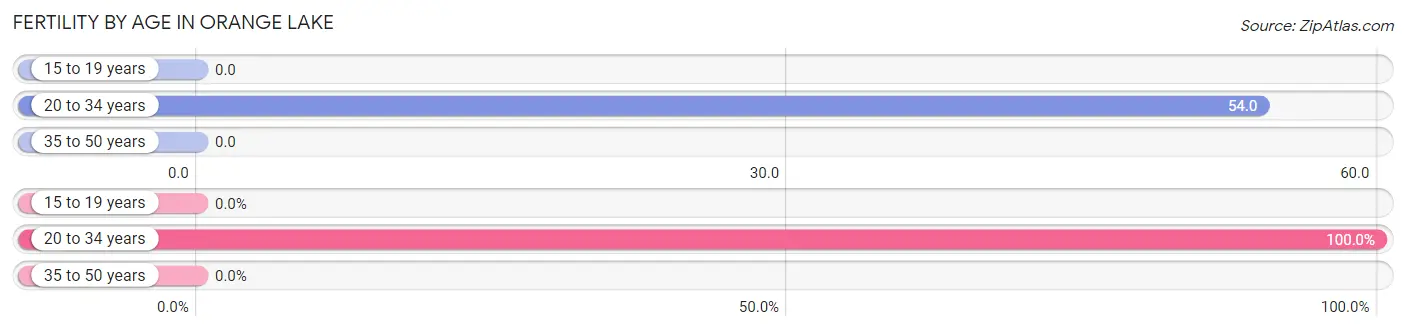
| Age Bracket | Women with Births | Births / 1,000 Women |
| 15 to 19 years | 0 (0.0%) | 0.0 |
| 20 to 34 years | 48 (100.0%) | 54.0 |
| 35 to 50 years | 0 (0.0%) | 0.0 |
| Total | 48 (100.0%) | 20.0 |
Fertility by Age by Marriage Status in Orange Lake
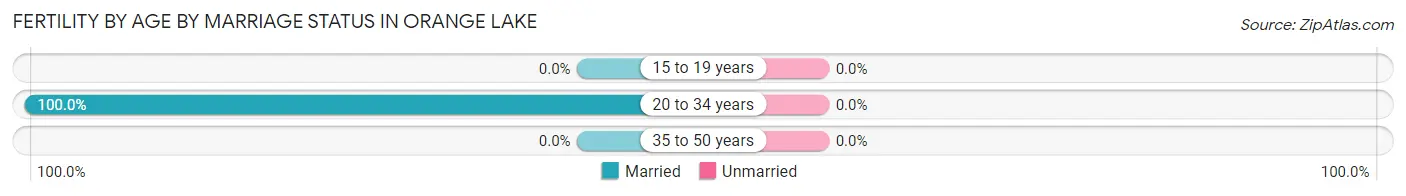
| Age Bracket | Married | Unmarried |
| 15 to 19 years | 0 (0.0%) | 0 (0.0%) |
| 20 to 34 years | 48 (100.0%) | 0 (0.0%) |
| 35 to 50 years | 0 (0.0%) | 0 (0.0%) |
| Total | 48 (100.0%) | 0 (0.0%) |
Fertility by Education in Orange Lake
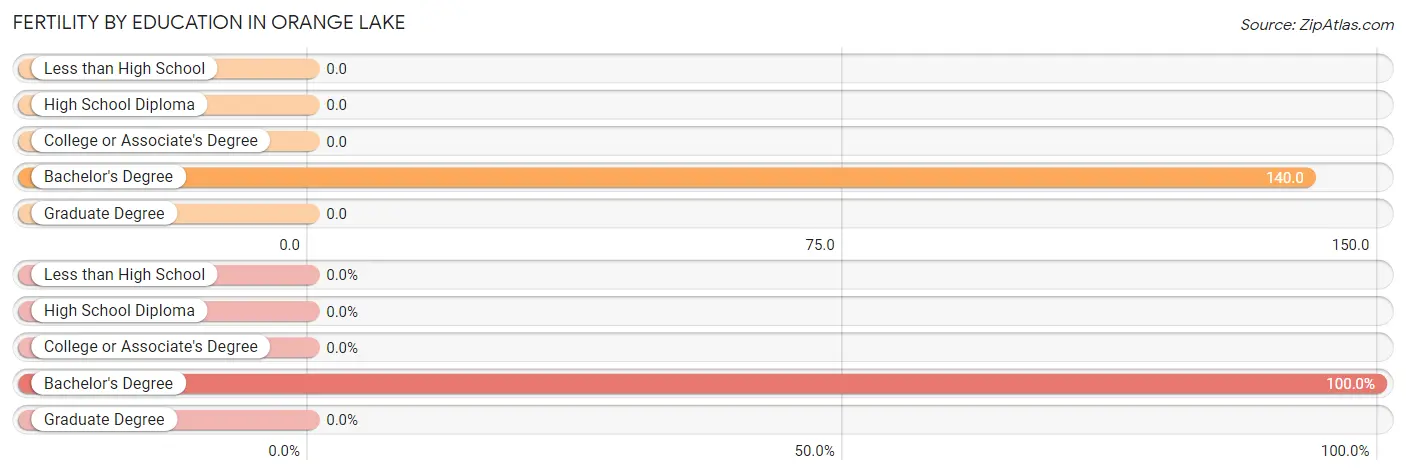
| Educational Attainment | Women with Births | Births / 1,000 Women |
| Less than High School | 0 (0.0%) | 0.0 |
| High School Diploma | 0 (0.0%) | 0.0 |
| College or Associate's Degree | 0 (0.0%) | 0.0 |
| Bachelor's Degree | 48 (100.0%) | 140.0 |
| Graduate Degree | 0 (0.0%) | 0.0 |
| Total | 48 (100.0%) | 20.0 |
Fertility by Education by Marriage Status in Orange Lake
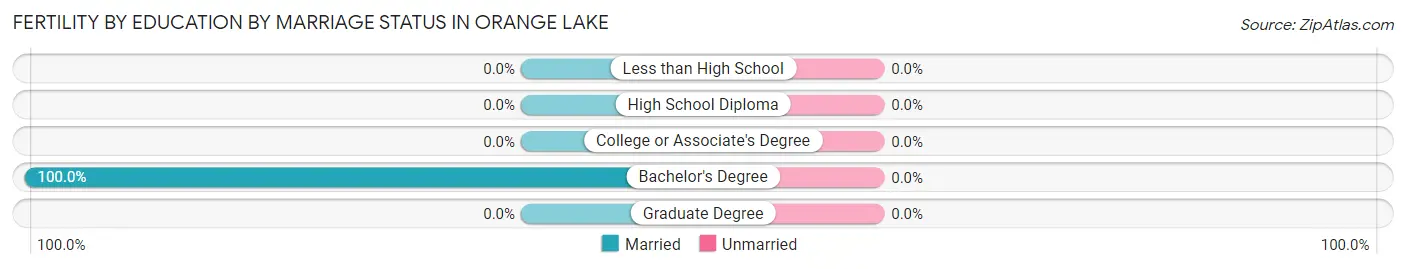
| Educational Attainment | Married | Unmarried |
| Less than High School | 0 (0.0%) | 0 (0.0%) |
| High School Diploma | 0 (0.0%) | 0 (0.0%) |
| College or Associate's Degree | 0 (0.0%) | 0 (0.0%) |
| Bachelor's Degree | 48 (100.0%) | 0 (0.0%) |
| Graduate Degree | 0 (0.0%) | 0 (0.0%) |
| Total | 48 (100.0%) | 0 (0.0%) |
Employment Characteristics in Orange Lake
Employment by Class of Employer in Orange Lake
Among the 4,796 employed individuals in Orange Lake, private company employees (3,008 | 62.7%), local government employees (678 | 14.1%), and not-for-profit organizations (333 | 6.9%) make up the most common classes of employment.
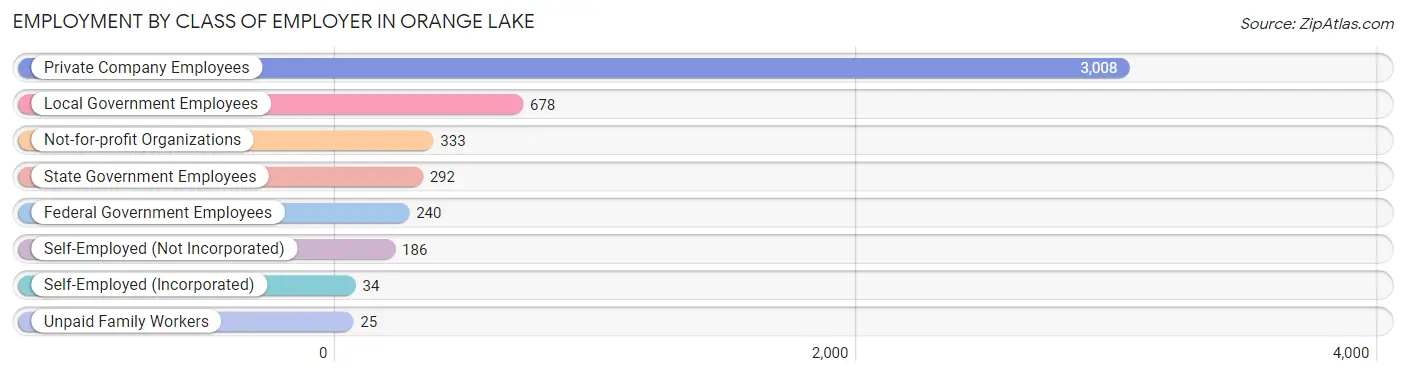
| Employer Class | # Employees | % Employees |
| Private Company Employees | 3,008 | 62.7% |
| Self-Employed (Incorporated) | 34 | 0.7% |
| Self-Employed (Not Incorporated) | 186 | 3.9% |
| Not-for-profit Organizations | 333 | 6.9% |
| Local Government Employees | 678 | 14.1% |
| State Government Employees | 292 | 6.1% |
| Federal Government Employees | 240 | 5.0% |
| Unpaid Family Workers | 25 | 0.5% |
| Total | 4,796 | 100.0% |
Employment Status by Age in Orange Lake
According to the labor force statistics for Orange Lake, out of the total population over 16 years of age (8,835), 57.5% or 5,080 individuals are in the labor force, with 4.0% or 203 of them unemployed. The age group with the highest labor force participation rate is 35 to 44 years, with 86.6% or 914 individuals in the labor force. Within the labor force, the 55 to 59 years age range has the highest percentage of unemployed individuals, with 9.1% or 30 of them being unemployed.
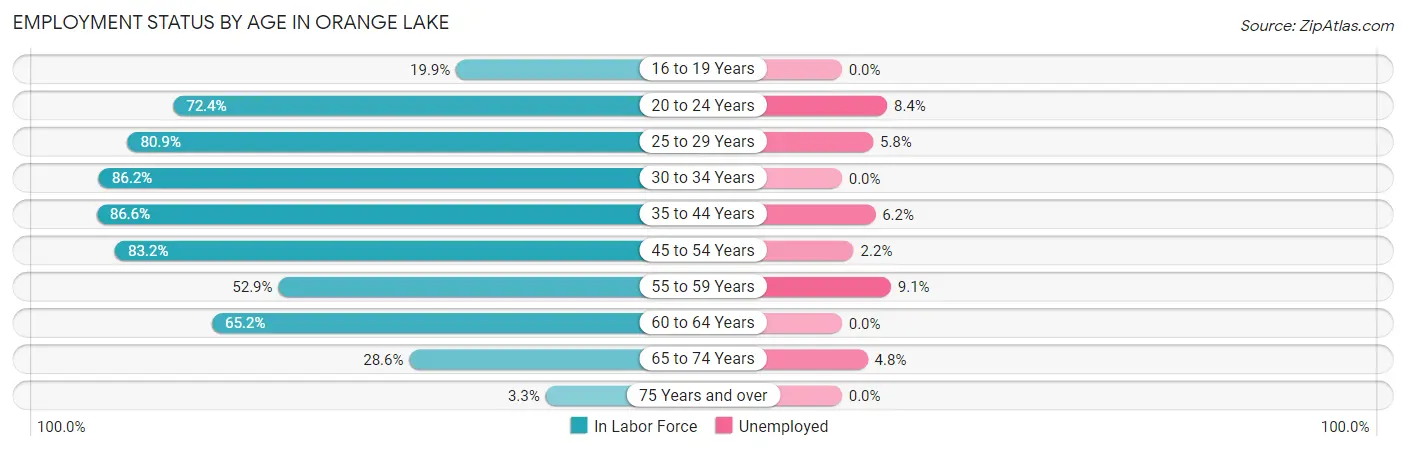
| Age Bracket | In Labor Force | Unemployed |
| 16 to 19 Years | 141 (19.9%) | 0 (0.0%) |
| 20 to 24 Years | 524 (72.4%) | 44 (8.4%) |
| 25 to 29 Years | 497 (80.9%) | 29 (5.8%) |
| 30 to 34 Years | 393 (86.2%) | 0 (0.0%) |
| 35 to 44 Years | 914 (86.6%) | 57 (6.2%) |
| 45 to 54 Years | 1,289 (83.2%) | 28 (2.2%) |
| 55 to 59 Years | 331 (52.9%) | 30 (9.1%) |
| 60 to 64 Years | 686 (65.2%) | 0 (0.0%) |
| 65 to 74 Years | 270 (28.6%) | 13 (4.8%) |
| 75 Years and over | 36 (3.3%) | 0 (0.0%) |
| Total | 5,080 (57.5%) | 203 (4.0%) |
Employment Status by Educational Attainment in Orange Lake
According to labor force statistics for Orange Lake, 76.8% of individuals (4,111) out of the total population between 25 and 64 years of age (5,353) are in the labor force, with 3.5% or 144 of them being unemployed. The group with the highest labor force participation rate are those with the educational attainment of bachelor's degree or higher, with 86.9% or 1,699 individuals in the labor force. Within the labor force, individuals with less than high school education have the highest percentage of unemployment, with 12.6% or 40 of them being unemployed.
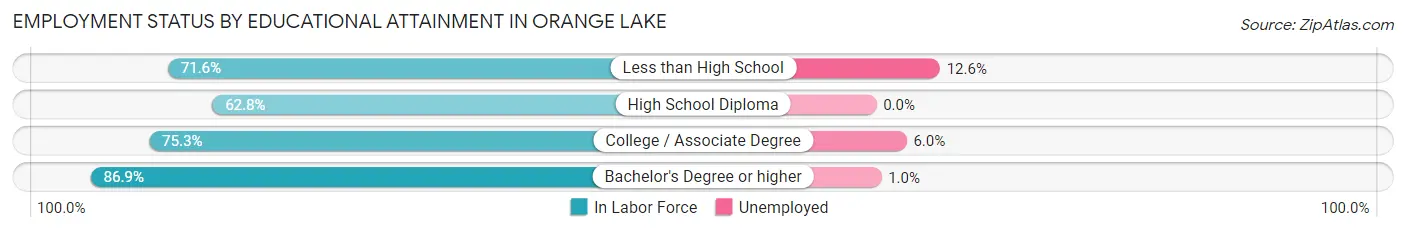
| Educational Attainment | In Labor Force | Unemployed |
| Less than High School | 317 (71.6%) | 56 (12.6%) |
| High School Diploma | 647 (62.8%) | 0 (0.0%) |
| College / Associate Degree | 1,449 (75.3%) | 115 (6.0%) |
| Bachelor's Degree or higher | 1,699 (86.9%) | 20 (1.0%) |
| Total | 4,111 (76.8%) | 187 (3.5%) |
Employment Occupations by Sex in Orange Lake
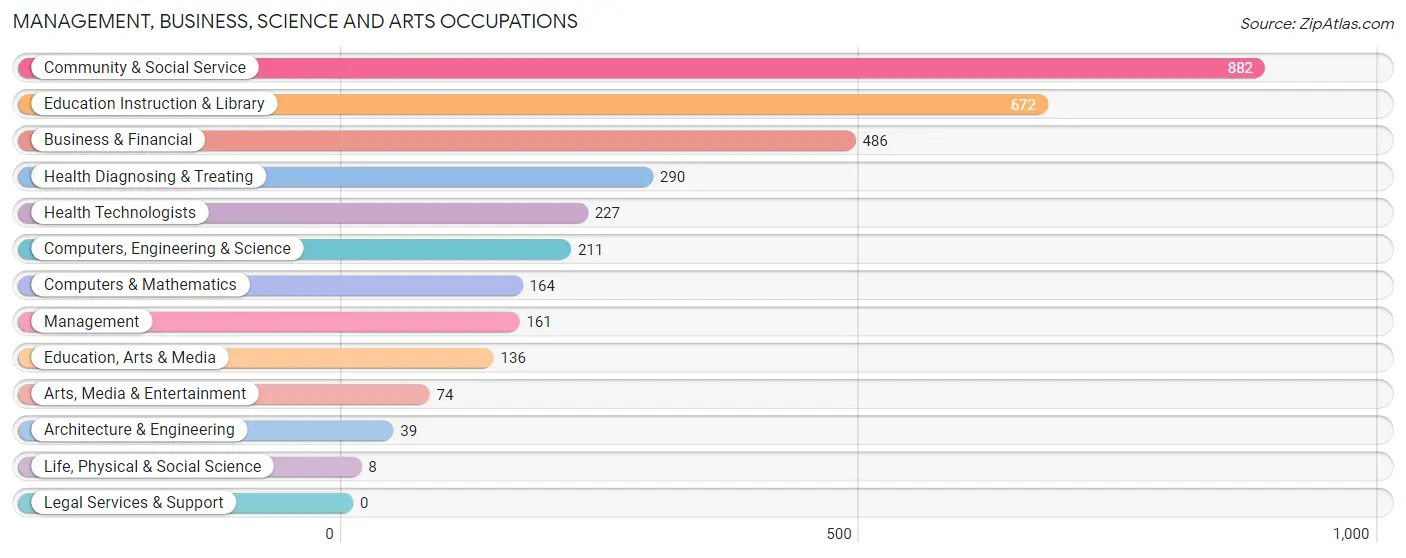
Management, Business, Science and Arts Occupations
The most common Management, Business, Science and Arts occupations in Orange Lake are Community & Social Service (882 | 18.1%), Education Instruction & Library (672 | 13.8%), Business & Financial (486 | 10.0%), Health Diagnosing & Treating (290 | 6.0%), and Health Technologists (227 | 4.7%).
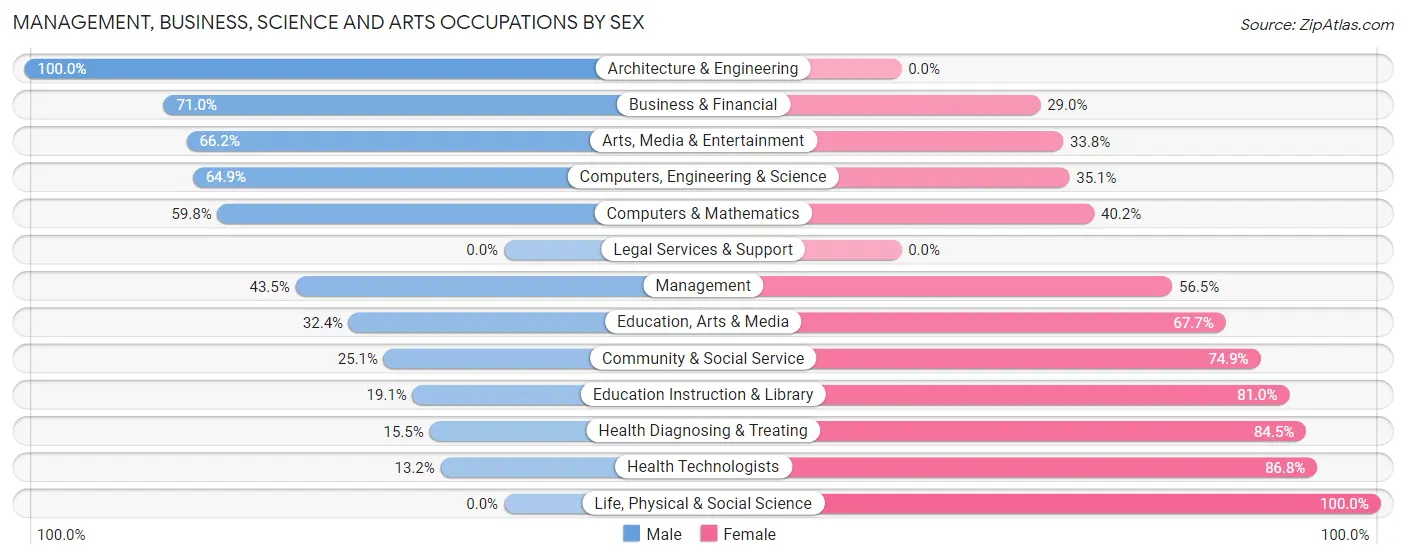
Management, Business, Science and Arts Occupations by Sex
Within the Management, Business, Science and Arts occupations in Orange Lake, the most male-oriented occupations are Architecture & Engineering (100.0%), Business & Financial (71.0%), and Arts, Media & Entertainment (66.2%), while the most female-oriented occupations are Life, Physical & Social Science (100.0%), Health Technologists (86.8%), and Health Diagnosing & Treating (84.5%).
| Occupation | Male | Female |
| Management | 70 (43.5%) | 91 (56.5%) |
| Business & Financial | 345 (71.0%) | 141 (29.0%) |
| Computers, Engineering & Science | 137 (64.9%) | 74 (35.1%) |
| Computers & Mathematics | 98 (59.8%) | 66 (40.2%) |
| Architecture & Engineering | 39 (100.0%) | 0 (0.0%) |
| Life, Physical & Social Science | 0 (0.0%) | 8 (100.0%) |
| Community & Social Service | 221 (25.1%) | 661 (74.9%) |
| Education, Arts & Media | 44 (32.4%) | 92 (67.6%) |
| Legal Services & Support | 0 (0.0%) | 0 (0.0%) |
| Education Instruction & Library | 128 (19.1%) | 544 (80.9%) |
| Arts, Media & Entertainment | 49 (66.2%) | 25 (33.8%) |
| Health Diagnosing & Treating | 45 (15.5%) | 245 (84.5%) |
| Health Technologists | 30 (13.2%) | 197 (86.8%) |
| Total (Category) | 818 (40.3%) | 1,212 (59.7%) |
| Total (Overall) | 2,585 (53.1%) | 2,284 (46.9%) |
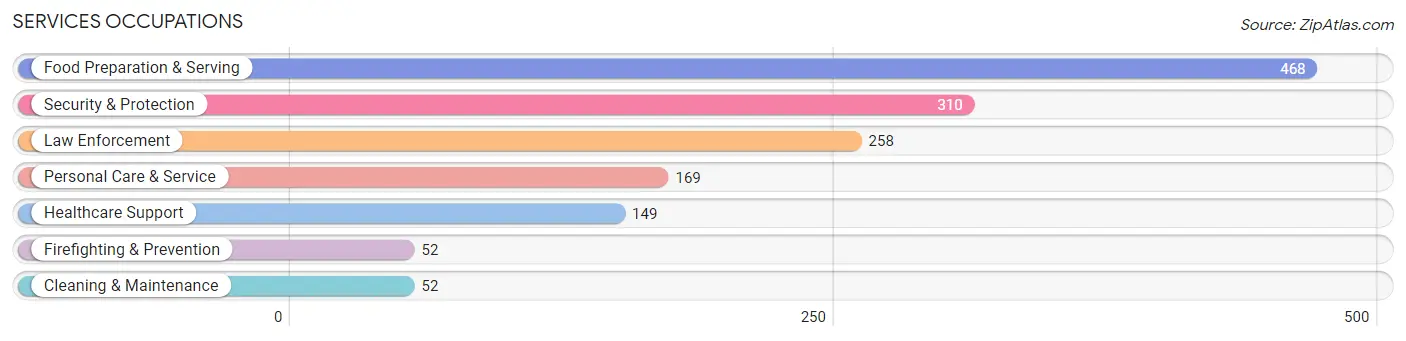
Services Occupations
The most common Services occupations in Orange Lake are Food Preparation & Serving (468 | 9.6%), Security & Protection (310 | 6.4%), Law Enforcement (258 | 5.3%), Personal Care & Service (169 | 3.5%), and Healthcare Support (149 | 3.1%).
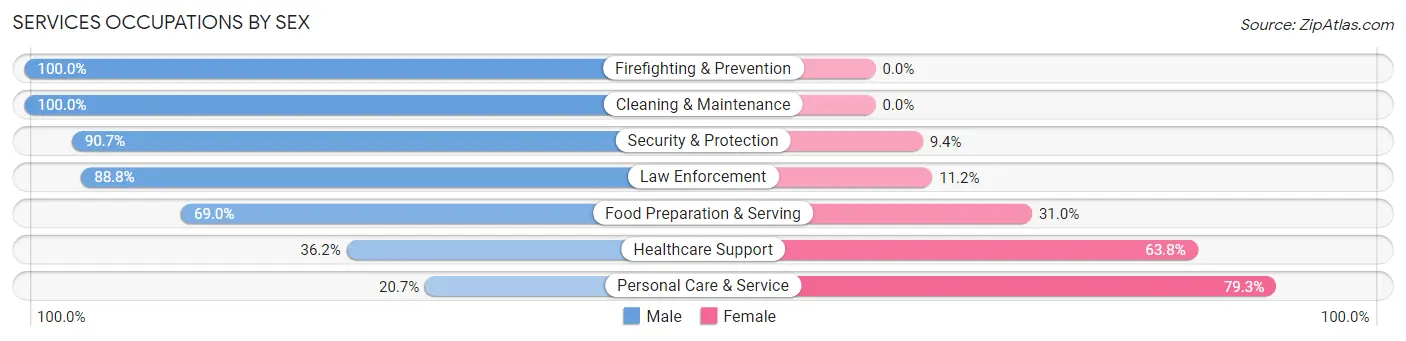
Services Occupations by Sex
Within the Services occupations in Orange Lake, the most male-oriented occupations are Firefighting & Prevention (100.0%), Cleaning & Maintenance (100.0%), and Security & Protection (90.6%), while the most female-oriented occupations are Personal Care & Service (79.3%), Healthcare Support (63.8%), and Food Preparation & Serving (31.0%).
| Occupation | Male | Female |
| Healthcare Support | 54 (36.2%) | 95 (63.8%) |
| Security & Protection | 281 (90.6%) | 29 (9.3%) |
| Firefighting & Prevention | 52 (100.0%) | 0 (0.0%) |
| Law Enforcement | 229 (88.8%) | 29 (11.2%) |
| Food Preparation & Serving | 323 (69.0%) | 145 (31.0%) |
| Cleaning & Maintenance | 52 (100.0%) | 0 (0.0%) |
| Personal Care & Service | 35 (20.7%) | 134 (79.3%) |
| Total (Category) | 745 (64.9%) | 403 (35.1%) |
| Total (Overall) | 2,585 (53.1%) | 2,284 (46.9%) |
Sales and Office Occupations
The most common Sales and Office occupations in Orange Lake are Sales & Related (403 | 8.3%), and Office & Administration (376 | 7.7%).
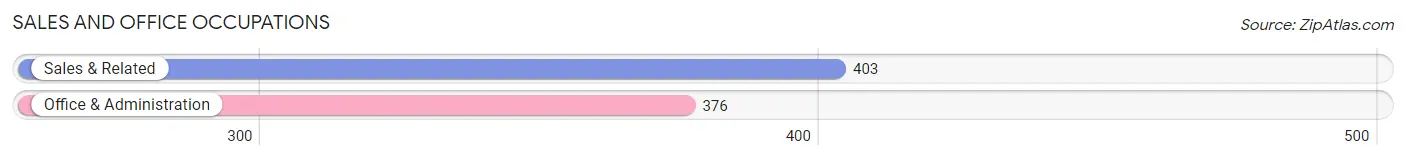
Sales and Office Occupations by Sex
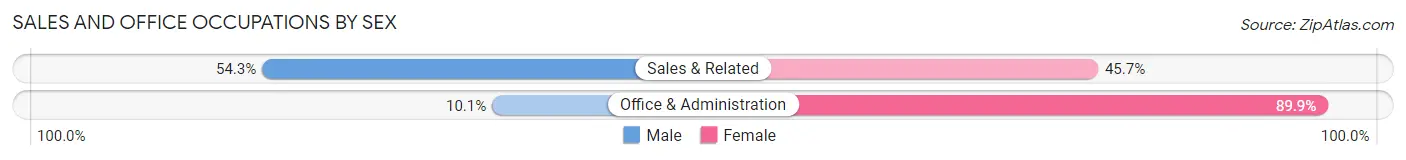
| Occupation | Male | Female |
| Sales & Related | 219 (54.3%) | 184 (45.7%) |
| Office & Administration | 38 (10.1%) | 338 (89.9%) |
| Total (Category) | 257 (33.0%) | 522 (67.0%) |
| Total (Overall) | 2,585 (53.1%) | 2,284 (46.9%) |
Natural Resources, Construction and Maintenance Occupations
The most common Natural Resources, Construction and Maintenance occupations in Orange Lake are Construction & Extraction (264 | 5.4%), and Installation, Maintenance & Repair (62 | 1.3%).
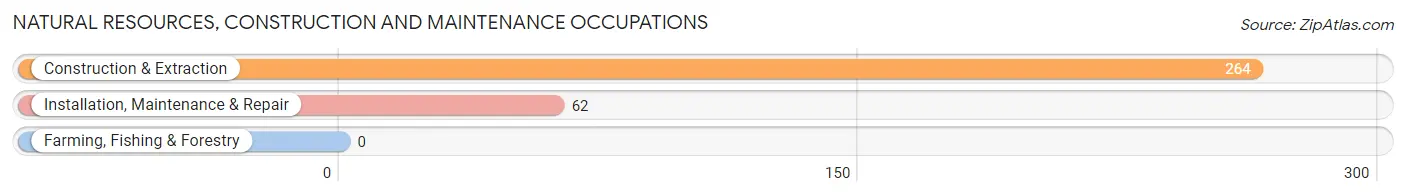
Natural Resources, Construction and Maintenance Occupations by Sex
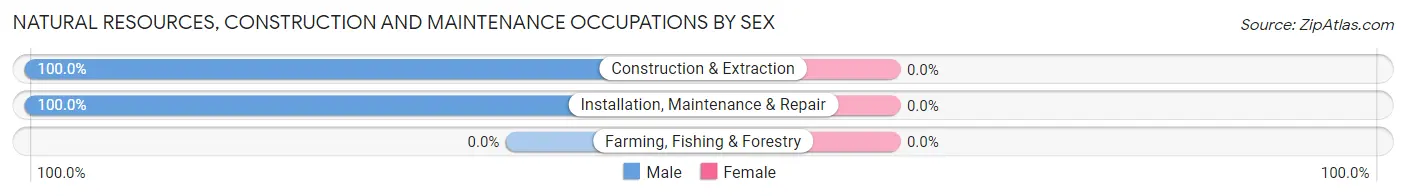
| Occupation | Male | Female |
| Farming, Fishing & Forestry | 0 (0.0%) | 0 (0.0%) |
| Construction & Extraction | 264 (100.0%) | 0 (0.0%) |
| Installation, Maintenance & Repair | 62 (100.0%) | 0 (0.0%) |
| Total (Category) | 326 (100.0%) | 0 (0.0%) |
| Total (Overall) | 2,585 (53.1%) | 2,284 (46.9%) |
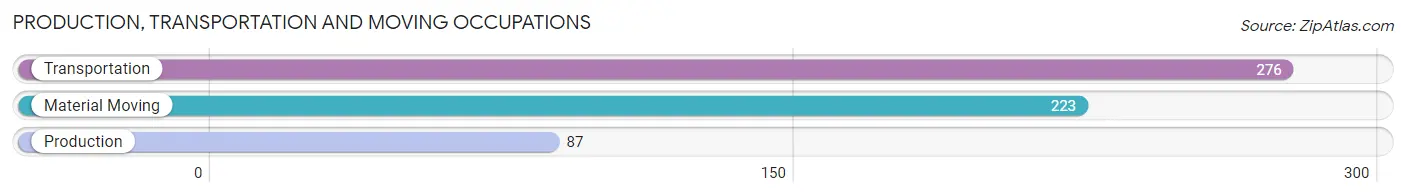
Production, Transportation and Moving Occupations
The most common Production, Transportation and Moving occupations in Orange Lake are Transportation (276 | 5.7%), Material Moving (223 | 4.6%), and Production (87 | 1.8%).
Production, Transportation and Moving Occupations by Sex
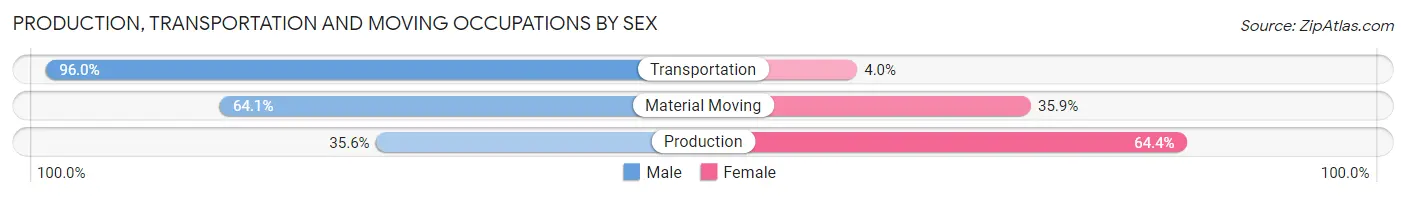
| Occupation | Male | Female |
| Production | 31 (35.6%) | 56 (64.4%) |
| Transportation | 265 (96.0%) | 11 (4.0%) |
| Material Moving | 143 (64.1%) | 80 (35.9%) |
| Total (Category) | 439 (74.9%) | 147 (25.1%) |
| Total (Overall) | 2,585 (53.1%) | 2,284 (46.9%) |
Employment Industries by Sex in Orange Lake
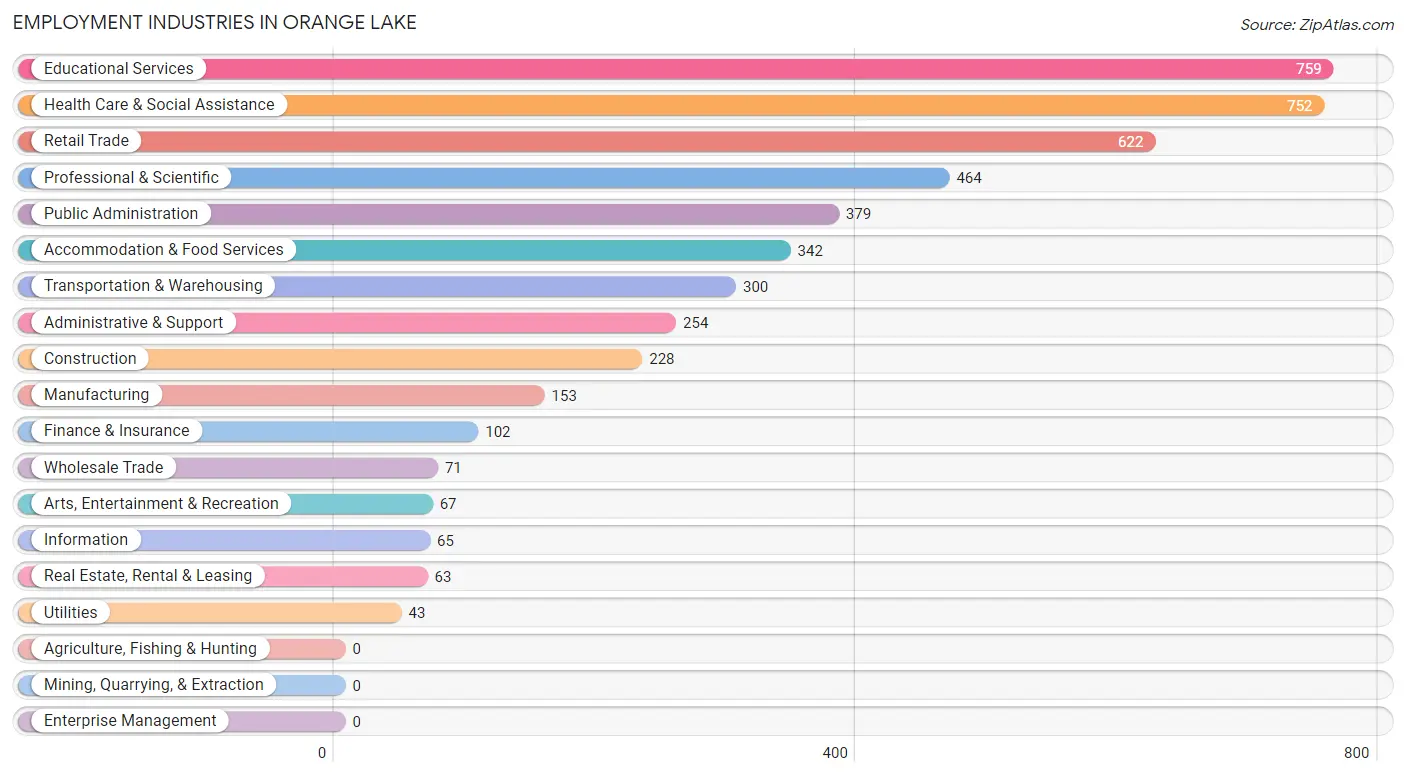
Employment Industries in Orange Lake
The major employment industries in Orange Lake include Educational Services (759 | 15.6%), Health Care & Social Assistance (752 | 15.4%), Retail Trade (622 | 12.8%), Professional & Scientific (464 | 9.5%), and Public Administration (379 | 7.8%).
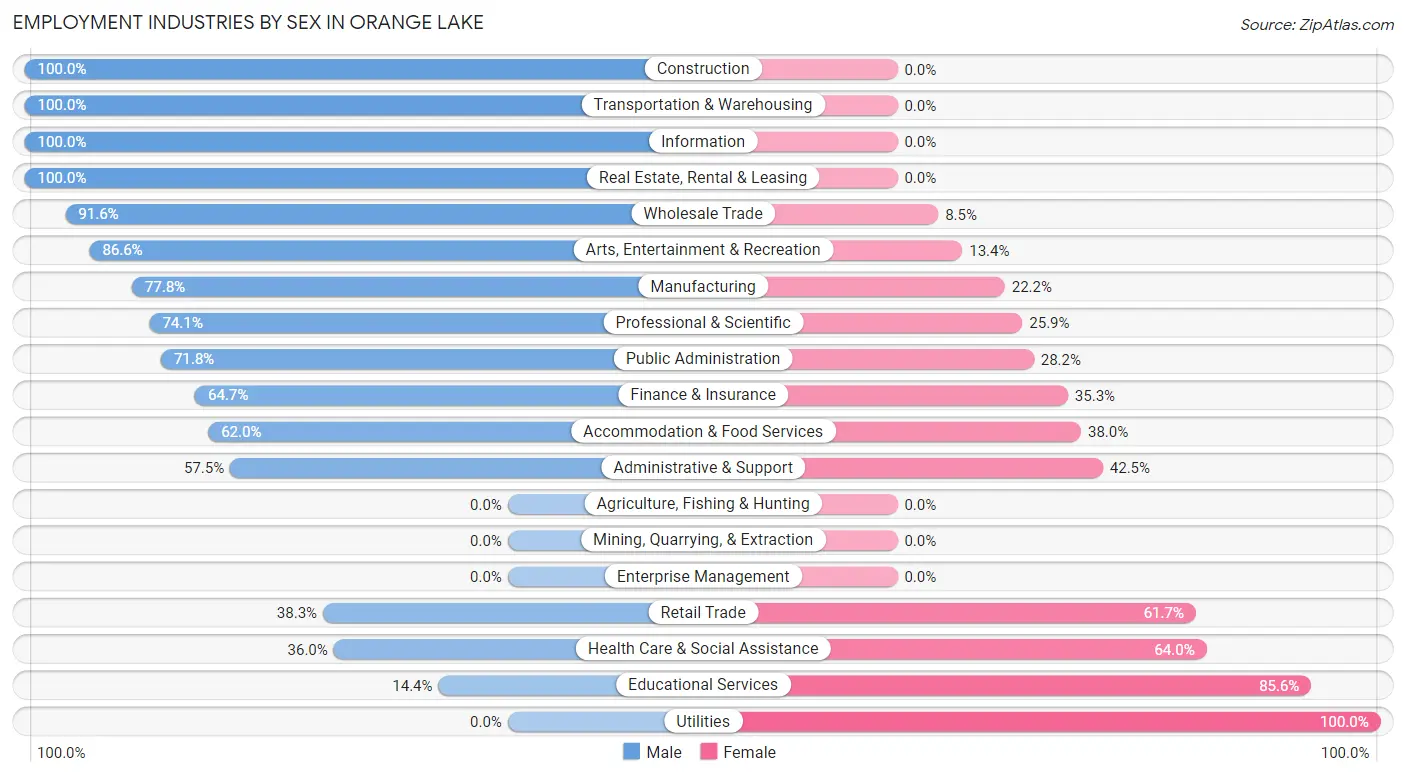
Employment Industries by Sex in Orange Lake
The Orange Lake industries that see more men than women are Construction (100.0%), Transportation & Warehousing (100.0%), and Information (100.0%), whereas the industries that tend to have a higher number of women are Utilities (100.0%), Educational Services (85.6%), and Health Care & Social Assistance (64.0%).
| Industry | Male | Female |
| Agriculture, Fishing & Hunting | 0 (0.0%) | 0 (0.0%) |
| Mining, Quarrying, & Extraction | 0 (0.0%) | 0 (0.0%) |
| Construction | 228 (100.0%) | 0 (0.0%) |
| Manufacturing | 119 (77.8%) | 34 (22.2%) |
| Wholesale Trade | 65 (91.5%) | 6 (8.5%) |
| Retail Trade | 238 (38.3%) | 384 (61.7%) |
| Transportation & Warehousing | 300 (100.0%) | 0 (0.0%) |
| Utilities | 0 (0.0%) | 43 (100.0%) |
| Information | 65 (100.0%) | 0 (0.0%) |
| Finance & Insurance | 66 (64.7%) | 36 (35.3%) |
| Real Estate, Rental & Leasing | 63 (100.0%) | 0 (0.0%) |
| Professional & Scientific | 344 (74.1%) | 120 (25.9%) |
| Enterprise Management | 0 (0.0%) | 0 (0.0%) |
| Administrative & Support | 146 (57.5%) | 108 (42.5%) |
| Educational Services | 109 (14.4%) | 650 (85.6%) |
| Health Care & Social Assistance | 271 (36.0%) | 481 (64.0%) |
| Arts, Entertainment & Recreation | 58 (86.6%) | 9 (13.4%) |
| Accommodation & Food Services | 212 (62.0%) | 130 (38.0%) |
| Public Administration | 272 (71.8%) | 107 (28.2%) |
| Total | 2,585 (53.1%) | 2,284 (46.9%) |
Education in Orange Lake
School Enrollment in Orange Lake
The most common levels of schooling among the 2,386 students in Orange Lake are college / undergraduate (913 | 38.3%), high school (543 | 22.8%), and middle school (437 | 18.3%).
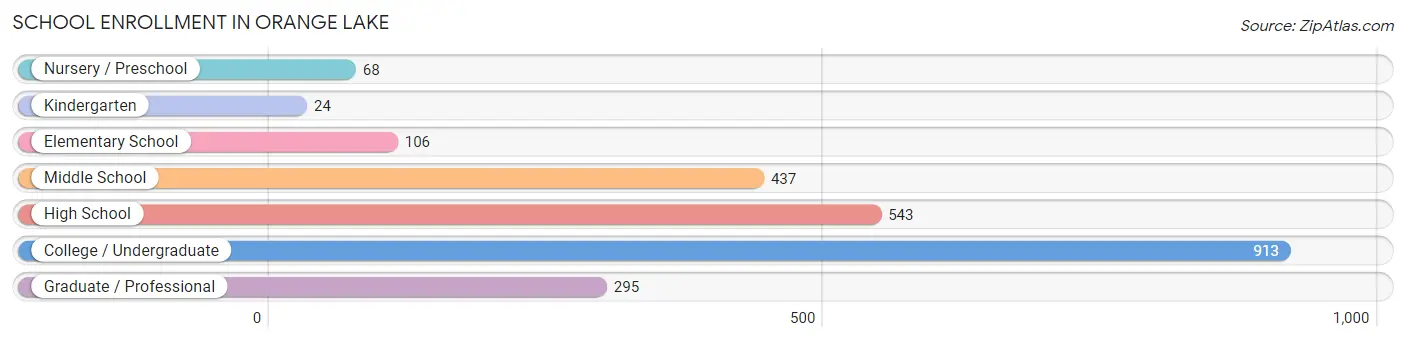
| School Level | # Students | % Students |
| Nursery / Preschool | 68 | 2.9% |
| Kindergarten | 24 | 1.0% |
| Elementary School | 106 | 4.4% |
| Middle School | 437 | 18.3% |
| High School | 543 | 22.8% |
| College / Undergraduate | 913 | 38.3% |
| Graduate / Professional | 295 | 12.4% |
| Total | 2,386 | 100.0% |
School Enrollment by Age by Funding Source in Orange Lake
Out of a total of 2,386 students who are enrolled in schools in Orange Lake, 530 (22.2%) attend a private institution, while the remaining 1,856 (77.8%) are enrolled in public schools. The age group of 35 years and over has the highest likelihood of being enrolled in private schools, with 176 (66.7% in the age bracket) enrolled. Conversely, the age group of 3 to 4 year olds has the lowest likelihood of being enrolled in a private school, with 57 (100.0% in the age bracket) attending a public institution.
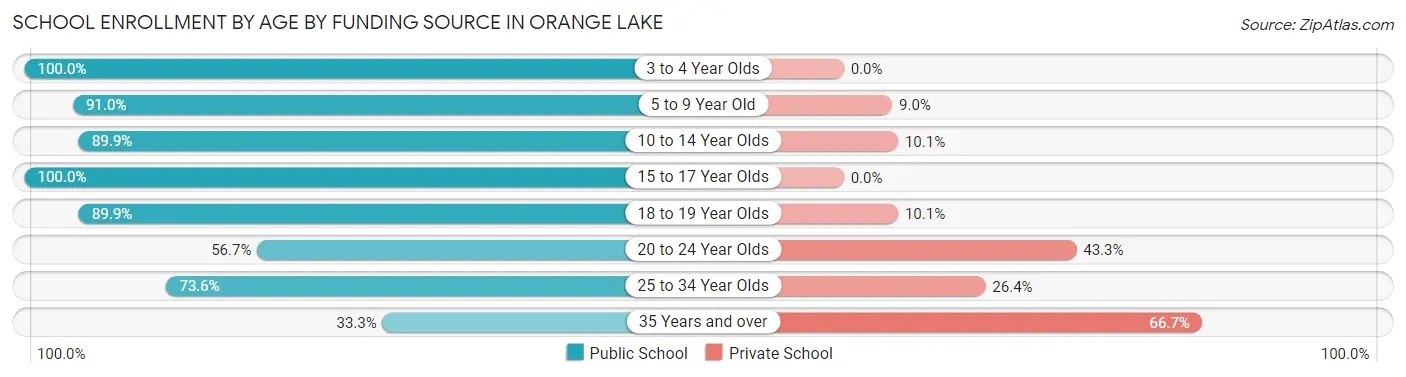
| Age Bracket | Public School | Private School |
| 3 to 4 Year Olds | 57 (100.0%) | 0 (0.0%) |
| 5 to 9 Year Old | 111 (91.0%) | 11 (9.0%) |
| 10 to 14 Year Olds | 506 (89.9%) | 57 (10.1%) |
| 15 to 17 Year Olds | 353 (100.0%) | 0 (0.0%) |
| 18 to 19 Year Olds | 373 (89.9%) | 42 (10.1%) |
| 20 to 24 Year Olds | 276 (56.7%) | 211 (43.3%) |
| 25 to 34 Year Olds | 92 (73.6%) | 33 (26.4%) |
| 35 Years and over | 88 (33.3%) | 176 (66.7%) |
| Total | 1,856 (77.8%) | 530 (22.2%) |
Educational Attainment by Field of Study in Orange Lake
Education (504 | 18.9%), science & technology (469 | 17.5%), business (444 | 16.6%), visual & performing arts (208 | 7.8%), and arts & humanities (208 | 7.8%) are the most common fields of study among 2,674 individuals in Orange Lake who have obtained a bachelor's degree or higher.
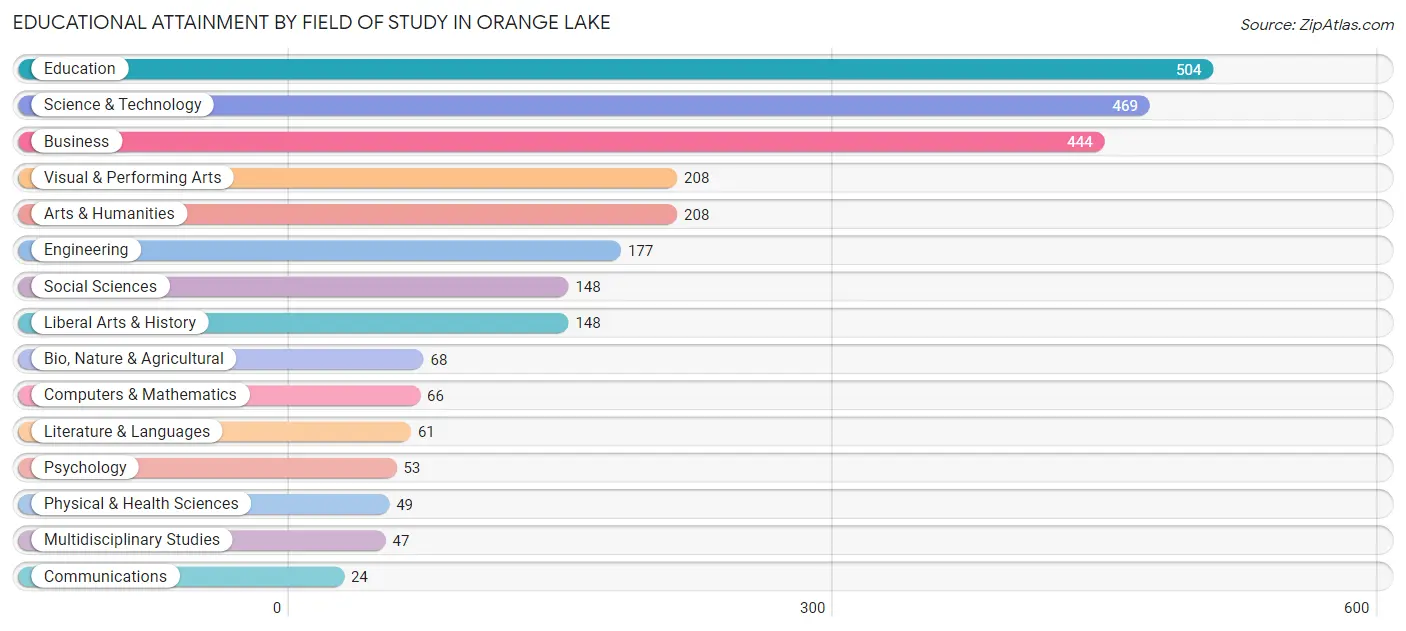
| Field of Study | # Graduates | % Graduates |
| Computers & Mathematics | 66 | 2.5% |
| Bio, Nature & Agricultural | 68 | 2.5% |
| Physical & Health Sciences | 49 | 1.8% |
| Psychology | 53 | 2.0% |
| Social Sciences | 148 | 5.5% |
| Engineering | 177 | 6.6% |
| Multidisciplinary Studies | 47 | 1.8% |
| Science & Technology | 469 | 17.5% |
| Business | 444 | 16.6% |
| Education | 504 | 18.9% |
| Literature & Languages | 61 | 2.3% |
| Liberal Arts & History | 148 | 5.5% |
| Visual & Performing Arts | 208 | 7.8% |
| Communications | 24 | 0.9% |
| Arts & Humanities | 208 | 7.8% |
| Total | 2,674 | 100.0% |
Transportation & Commute in Orange Lake
Vehicle Availability by Sex in Orange Lake
The most prevalent vehicle ownership categories in Orange Lake are males with 2 vehicles (1,172, accounting for 46.5%) and females with 2 vehicles (908, making up 51.5%).
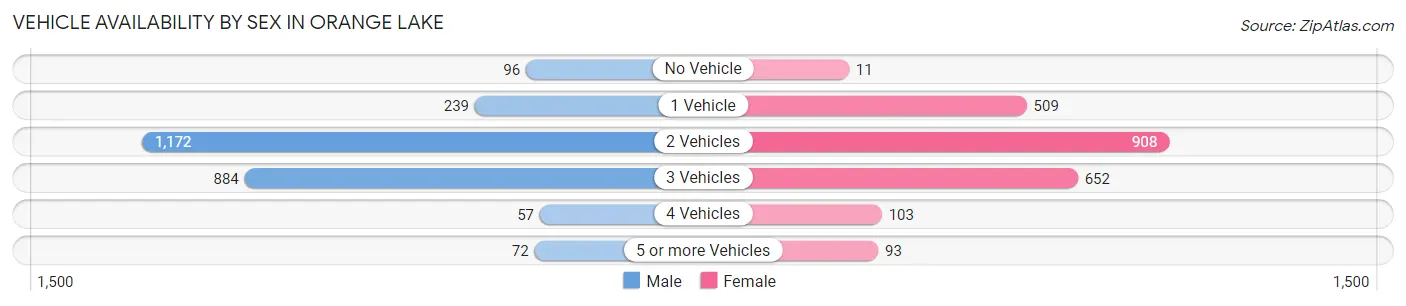
| Vehicles Available | Male | Female |
| No Vehicle | 96 (3.8%) | 11 (0.5%) |
| 1 Vehicle | 239 (9.5%) | 509 (22.4%) |
| 2 Vehicles | 1,172 (46.5%) | 908 (39.9%) |
| 3 Vehicles | 884 (35.1%) | 652 (28.6%) |
| 4 Vehicles | 57 (2.3%) | 103 (4.5%) |
| 5 or more Vehicles | 72 (2.9%) | 93 (4.1%) |
| Total | 2,520 (100.0%) | 2,276 (100.0%) |
Commute Time in Orange Lake
The most frequently occuring commute durations in Orange Lake are 10 to 14 minutes (803 commuters, 19.3%), 15 to 19 minutes (697 commuters, 16.8%), and 60 to 89 minutes (559 commuters, 13.5%).
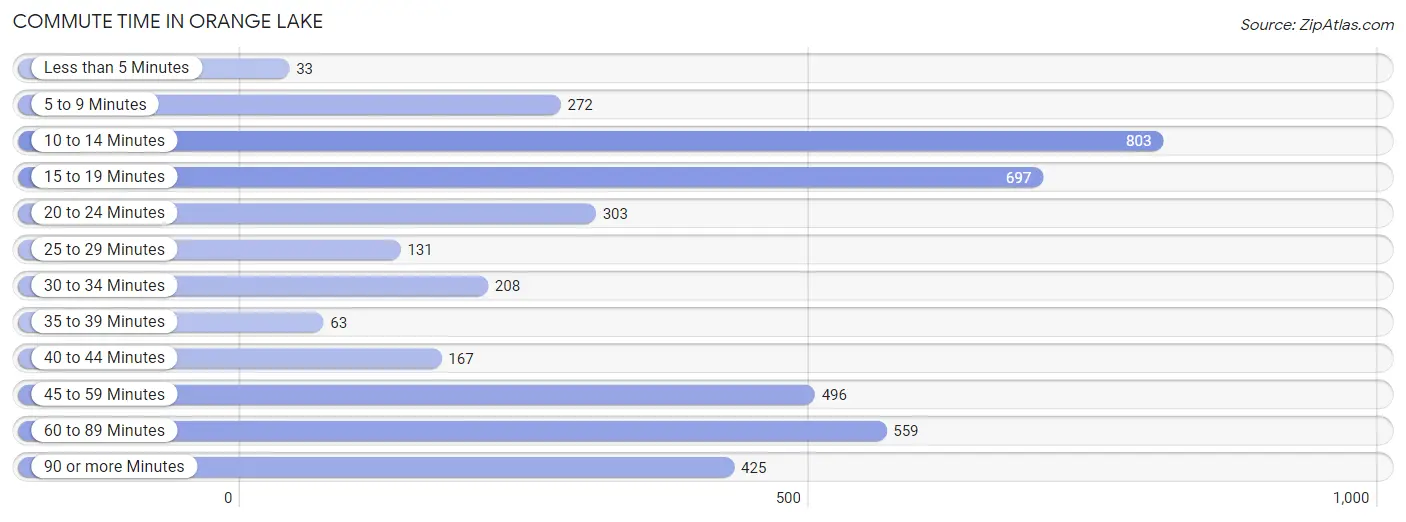
| Commute Time | # Commuters | % Commuters |
| Less than 5 Minutes | 33 | 0.8% |
| 5 to 9 Minutes | 272 | 6.5% |
| 10 to 14 Minutes | 803 | 19.3% |
| 15 to 19 Minutes | 697 | 16.8% |
| 20 to 24 Minutes | 303 | 7.3% |
| 25 to 29 Minutes | 131 | 3.2% |
| 30 to 34 Minutes | 208 | 5.0% |
| 35 to 39 Minutes | 63 | 1.5% |
| 40 to 44 Minutes | 167 | 4.0% |
| 45 to 59 Minutes | 496 | 11.9% |
| 60 to 89 Minutes | 559 | 13.5% |
| 90 or more Minutes | 425 | 10.2% |
Commute Time by Sex in Orange Lake
The most common commute times in Orange Lake are 60 to 89 minutes (385 commuters, 17.2%) for males and 10 to 14 minutes (471 commuters, 24.5%) for females.
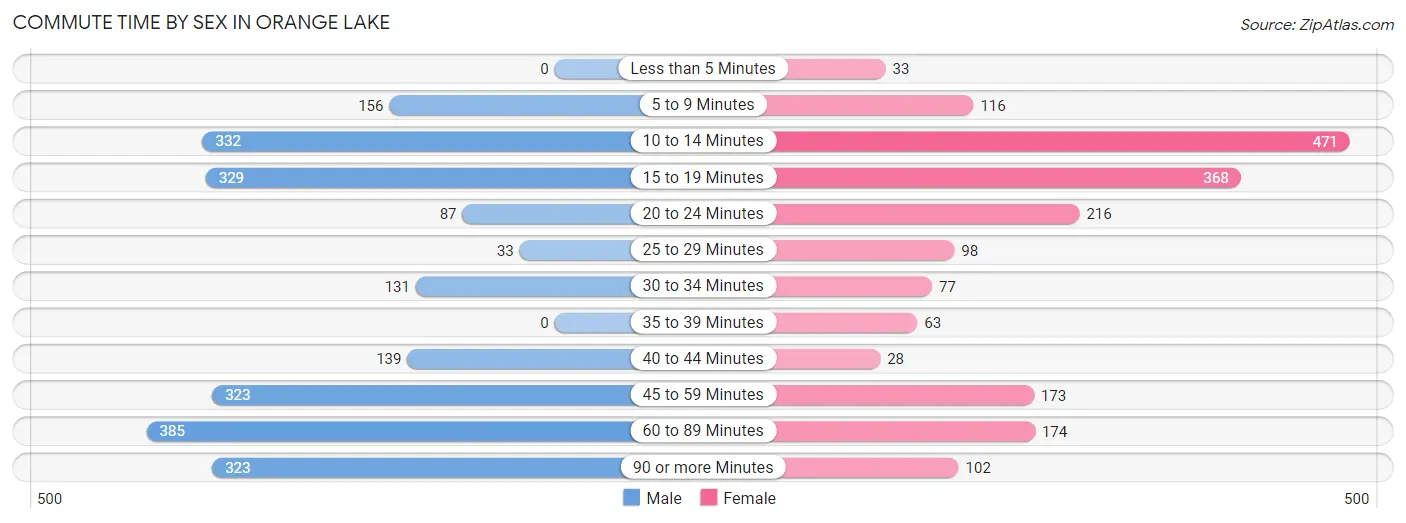
| Commute Time | Male | Female |
| Less than 5 Minutes | 0 (0.0%) | 33 (1.7%) |
| 5 to 9 Minutes | 156 (7.0%) | 116 (6.0%) |
| 10 to 14 Minutes | 332 (14.8%) | 471 (24.5%) |
| 15 to 19 Minutes | 329 (14.7%) | 368 (19.2%) |
| 20 to 24 Minutes | 87 (3.9%) | 216 (11.3%) |
| 25 to 29 Minutes | 33 (1.5%) | 98 (5.1%) |
| 30 to 34 Minutes | 131 (5.9%) | 77 (4.0%) |
| 35 to 39 Minutes | 0 (0.0%) | 63 (3.3%) |
| 40 to 44 Minutes | 139 (6.2%) | 28 (1.5%) |
| 45 to 59 Minutes | 323 (14.4%) | 173 (9.0%) |
| 60 to 89 Minutes | 385 (17.2%) | 174 (9.1%) |
| 90 or more Minutes | 323 (14.4%) | 102 (5.3%) |
Time of Departure to Work by Sex in Orange Lake
The most frequent times of departure to work in Orange Lake are 7:00 AM to 7:29 AM (400, 17.9%) for males and 7:00 AM to 7:29 AM (366, 19.1%) for females.
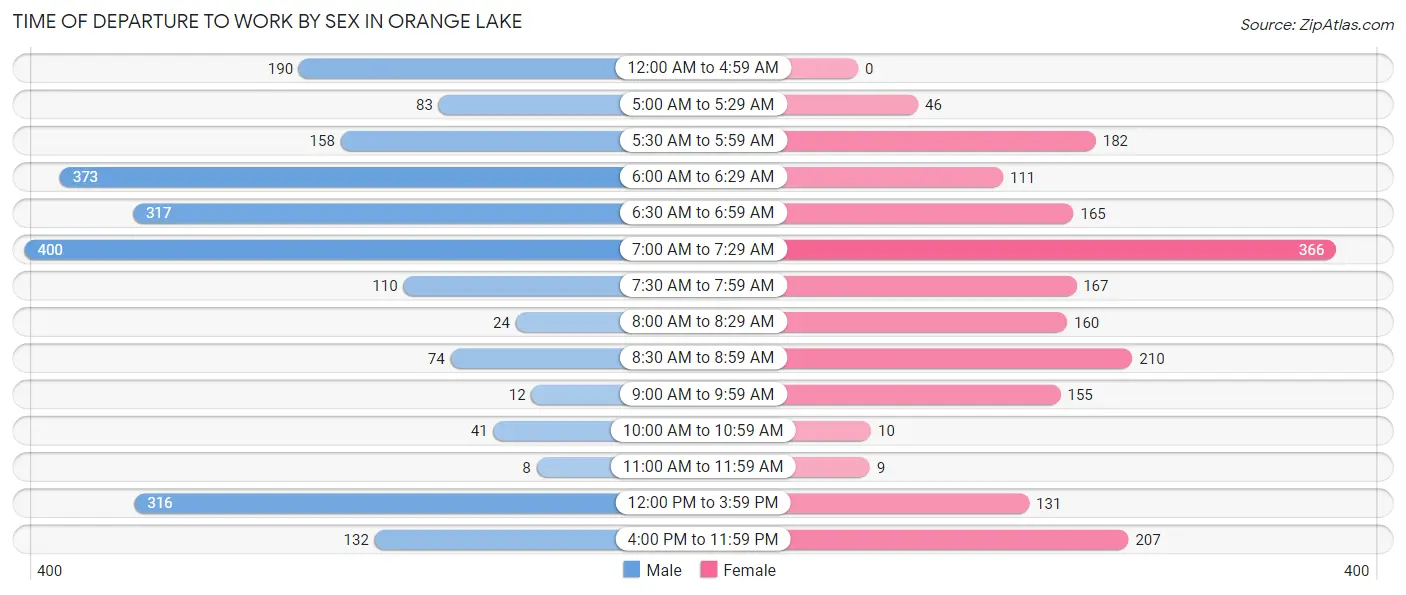
| Time of Departure | Male | Female |
| 12:00 AM to 4:59 AM | 190 (8.5%) | 0 (0.0%) |
| 5:00 AM to 5:29 AM | 83 (3.7%) | 46 (2.4%) |
| 5:30 AM to 5:59 AM | 158 (7.1%) | 182 (9.5%) |
| 6:00 AM to 6:29 AM | 373 (16.7%) | 111 (5.8%) |
| 6:30 AM to 6:59 AM | 317 (14.2%) | 165 (8.6%) |
| 7:00 AM to 7:29 AM | 400 (17.9%) | 366 (19.1%) |
| 7:30 AM to 7:59 AM | 110 (4.9%) | 167 (8.7%) |
| 8:00 AM to 8:29 AM | 24 (1.1%) | 160 (8.3%) |
| 8:30 AM to 8:59 AM | 74 (3.3%) | 210 (10.9%) |
| 9:00 AM to 9:59 AM | 12 (0.5%) | 155 (8.1%) |
| 10:00 AM to 10:59 AM | 41 (1.8%) | 10 (0.5%) |
| 11:00 AM to 11:59 AM | 8 (0.4%) | 9 (0.5%) |
| 12:00 PM to 3:59 PM | 316 (14.1%) | 131 (6.8%) |
| 4:00 PM to 11:59 PM | 132 (5.9%) | 207 (10.8%) |
| Total | 2,238 (100.0%) | 1,919 (100.0%) |
Housing Occupancy in Orange Lake
Occupancy by Ownership in Orange Lake
Of the total 3,677 dwellings in Orange Lake, owner-occupied units account for 3,327 (90.5%), while renter-occupied units make up 350 (9.5%).
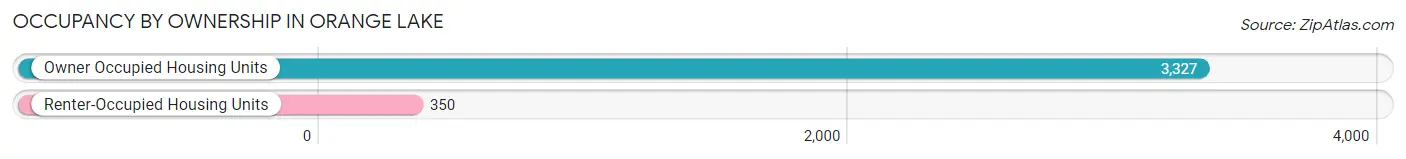
| Occupancy | # Housing Units | % Housing Units |
| Owner Occupied Housing Units | 3,327 | 90.5% |
| Renter-Occupied Housing Units | 350 | 9.5% |
| Total Occupied Housing Units | 3,677 | 100.0% |
Occupancy by Household Size in Orange Lake
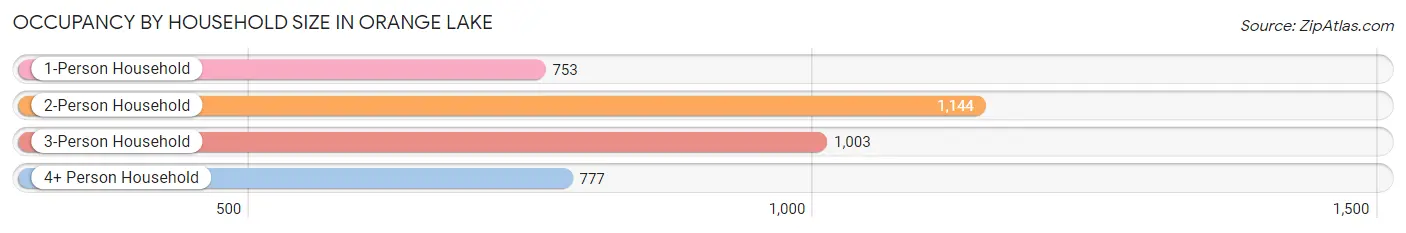
| Household Size | # Housing Units | % Housing Units |
| 1-Person Household | 753 | 20.5% |
| 2-Person Household | 1,144 | 31.1% |
| 3-Person Household | 1,003 | 27.3% |
| 4+ Person Household | 777 | 21.1% |
| Total Housing Units | 3,677 | 100.0% |
Occupancy by Ownership by Household Size in Orange Lake
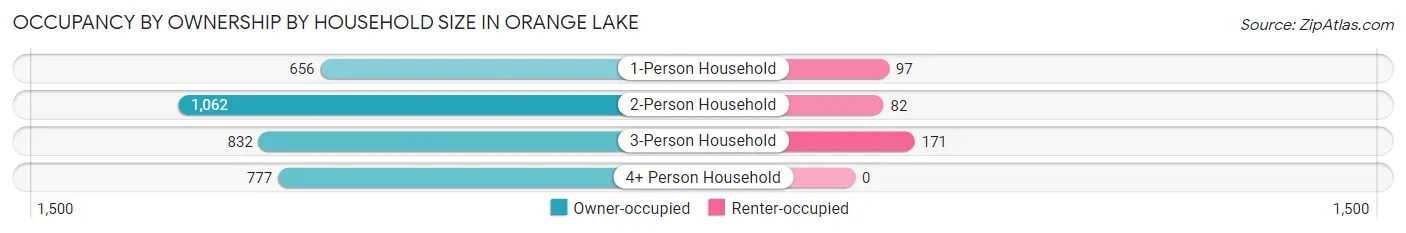
| Household Size | Owner-occupied | Renter-occupied |
| 1-Person Household | 656 (87.1%) | 97 (12.9%) |
| 2-Person Household | 1,062 (92.8%) | 82 (7.2%) |
| 3-Person Household | 832 (83.0%) | 171 (17.1%) |
| 4+ Person Household | 777 (100.0%) | 0 (0.0%) |
| Total Housing Units | 3,327 (90.5%) | 350 (9.5%) |
Occupancy by Educational Attainment in Orange Lake
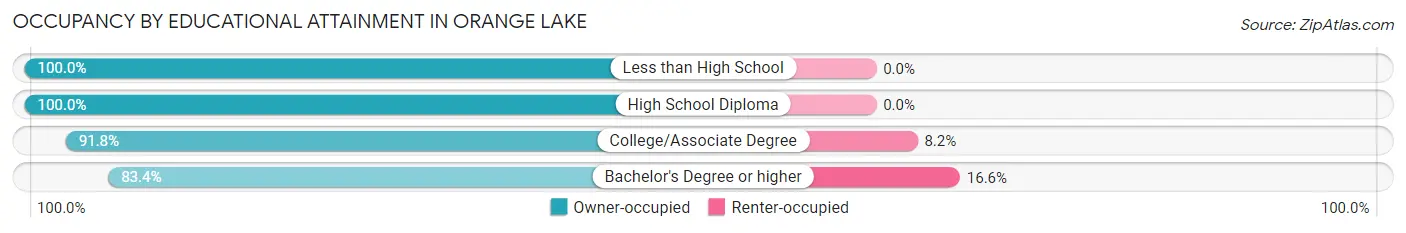
| Household Size | Owner-occupied | Renter-occupied |
| Less than High School | 201 (100.0%) | 0 (0.0%) |
| High School Diploma | 684 (100.0%) | 0 (0.0%) |
| College/Associate Degree | 1,235 (91.8%) | 110 (8.2%) |
| Bachelor's Degree or higher | 1,207 (83.4%) | 240 (16.6%) |
Occupancy by Age of Householder in Orange Lake
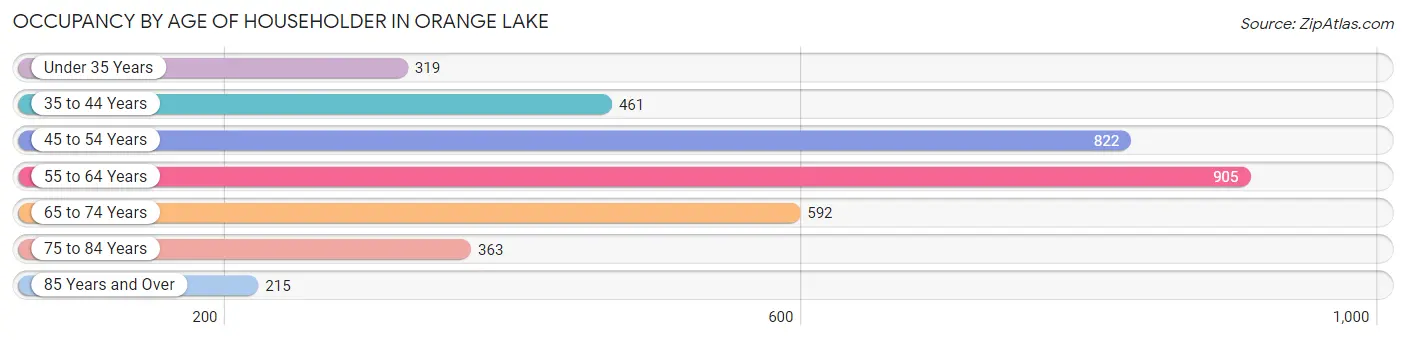
| Age Bracket | # Households | % Households |
| Under 35 Years | 319 | 8.7% |
| 35 to 44 Years | 461 | 12.5% |
| 45 to 54 Years | 822 | 22.4% |
| 55 to 64 Years | 905 | 24.6% |
| 65 to 74 Years | 592 | 16.1% |
| 75 to 84 Years | 363 | 9.9% |
| 85 Years and Over | 215 | 5.9% |
| Total | 3,677 | 100.0% |
Housing Finances in Orange Lake
Median Income by Occupancy in Orange Lake
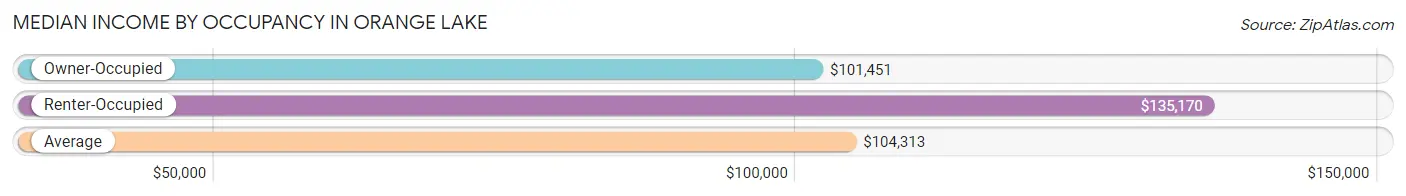
| Occupancy Type | # Households | Median Income |
| Owner-Occupied | 3,327 (90.5%) | $101,451 |
| Renter-Occupied | 350 (9.5%) | $135,170 |
| Average | 3,677 (100.0%) | $104,313 |
Occupancy by Householder Income Bracket in Orange Lake
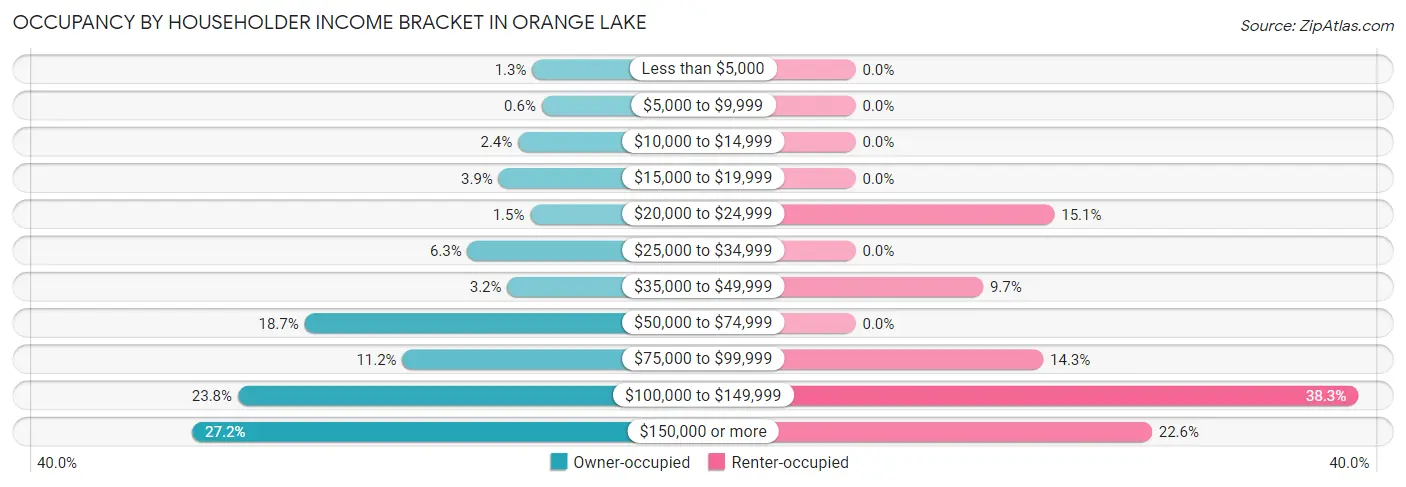
| Income Bracket | Owner-occupied | Renter-occupied |
| Less than $5,000 | 44 (1.3%) | 0 (0.0%) |
| $5,000 to $9,999 | 20 (0.6%) | 0 (0.0%) |
| $10,000 to $14,999 | 80 (2.4%) | 0 (0.0%) |
| $15,000 to $19,999 | 129 (3.9%) | 0 (0.0%) |
| $20,000 to $24,999 | 49 (1.5%) | 53 (15.1%) |
| $25,000 to $34,999 | 208 (6.2%) | 0 (0.0%) |
| $35,000 to $49,999 | 107 (3.2%) | 34 (9.7%) |
| $50,000 to $74,999 | 621 (18.7%) | 0 (0.0%) |
| $75,000 to $99,999 | 373 (11.2%) | 50 (14.3%) |
| $100,000 to $149,999 | 790 (23.7%) | 134 (38.3%) |
| $150,000 or more | 906 (27.2%) | 79 (22.6%) |
| Total | 3,327 (100.0%) | 350 (100.0%) |
Monthly Housing Cost Tiers in Orange Lake
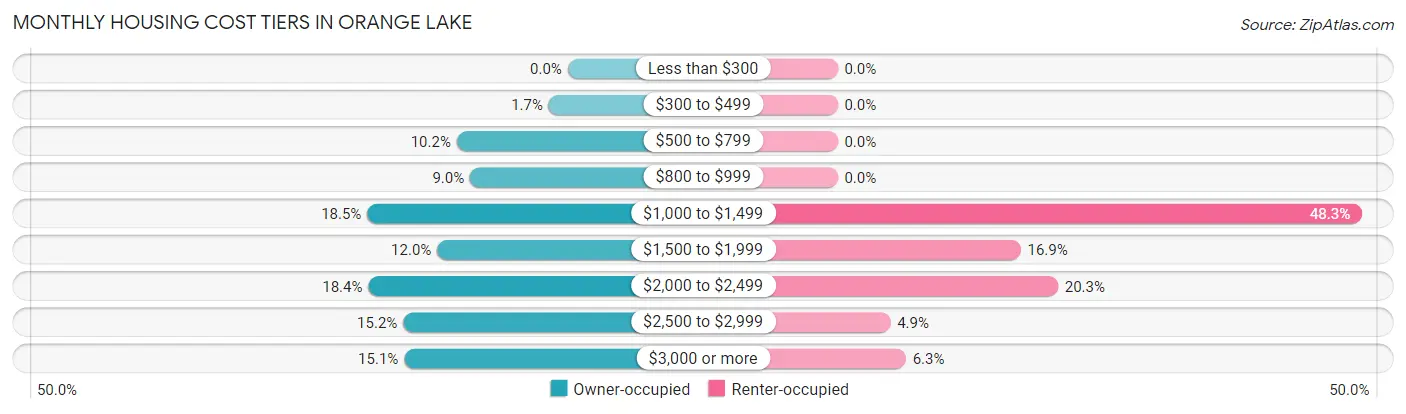
| Monthly Cost | Owner-occupied | Renter-occupied |
| Less than $300 | 0 (0.0%) | 0 (0.0%) |
| $300 to $499 | 58 (1.7%) | 0 (0.0%) |
| $500 to $799 | 340 (10.2%) | 0 (0.0%) |
| $800 to $999 | 299 (9.0%) | 0 (0.0%) |
| $1,000 to $1,499 | 614 (18.5%) | 169 (48.3%) |
| $1,500 to $1,999 | 400 (12.0%) | 59 (16.9%) |
| $2,000 to $2,499 | 611 (18.4%) | 71 (20.3%) |
| $2,500 to $2,999 | 504 (15.1%) | 17 (4.9%) |
| $3,000 or more | 501 (15.1%) | 22 (6.3%) |
| Total | 3,327 (100.0%) | 350 (100.0%) |
Physical Housing Characteristics in Orange Lake
Housing Structures in Orange Lake
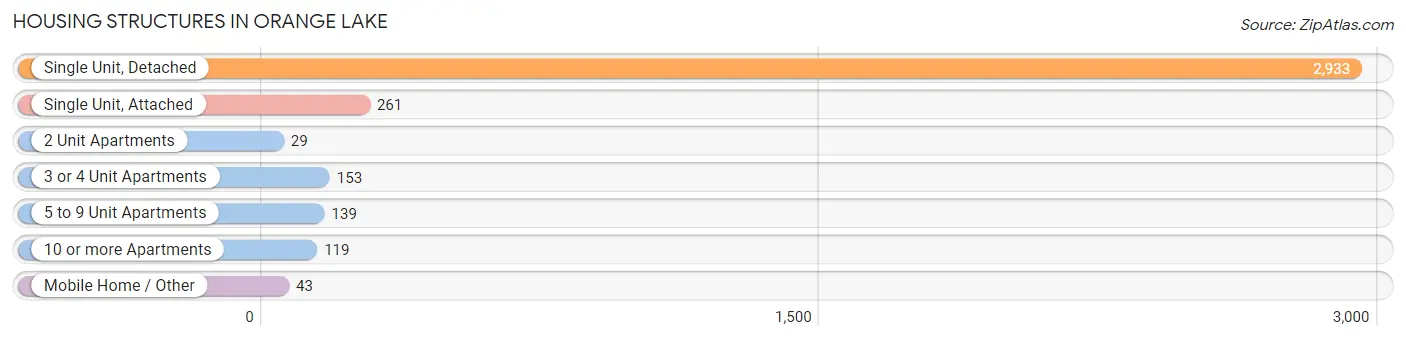
| Structure Type | # Housing Units | % Housing Units |
| Single Unit, Detached | 2,933 | 79.8% |
| Single Unit, Attached | 261 | 7.1% |
| 2 Unit Apartments | 29 | 0.8% |
| 3 or 4 Unit Apartments | 153 | 4.2% |
| 5 to 9 Unit Apartments | 139 | 3.8% |
| 10 or more Apartments | 119 | 3.2% |
| Mobile Home / Other | 43 | 1.2% |
| Total | 3,677 | 100.0% |
Housing Structures by Occupancy in Orange Lake
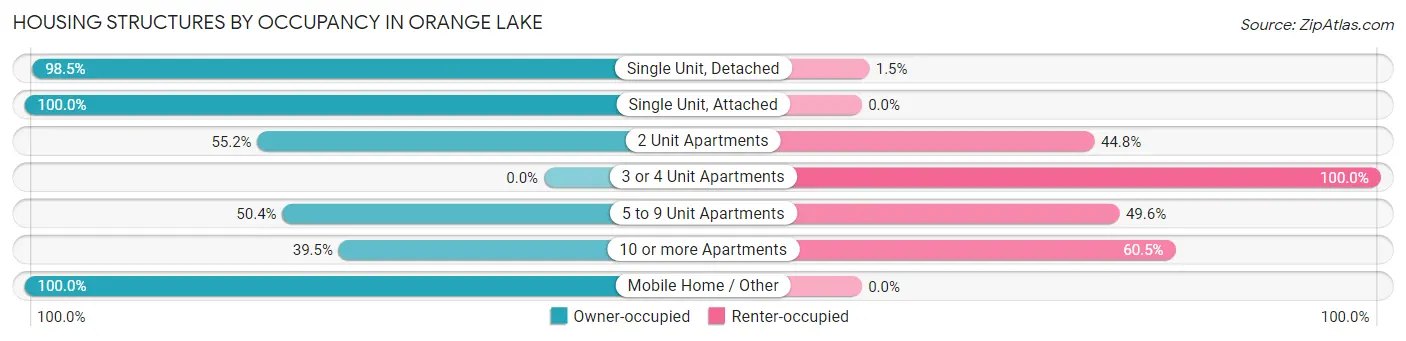
| Structure Type | Owner-occupied | Renter-occupied |
| Single Unit, Detached | 2,890 (98.5%) | 43 (1.5%) |
| Single Unit, Attached | 261 (100.0%) | 0 (0.0%) |
| 2 Unit Apartments | 16 (55.2%) | 13 (44.8%) |
| 3 or 4 Unit Apartments | 0 (0.0%) | 153 (100.0%) |
| 5 to 9 Unit Apartments | 70 (50.4%) | 69 (49.6%) |
| 10 or more Apartments | 47 (39.5%) | 72 (60.5%) |
| Mobile Home / Other | 43 (100.0%) | 0 (0.0%) |
| Total | 3,327 (90.5%) | 350 (9.5%) |
Housing Structures by Number of Rooms in Orange Lake
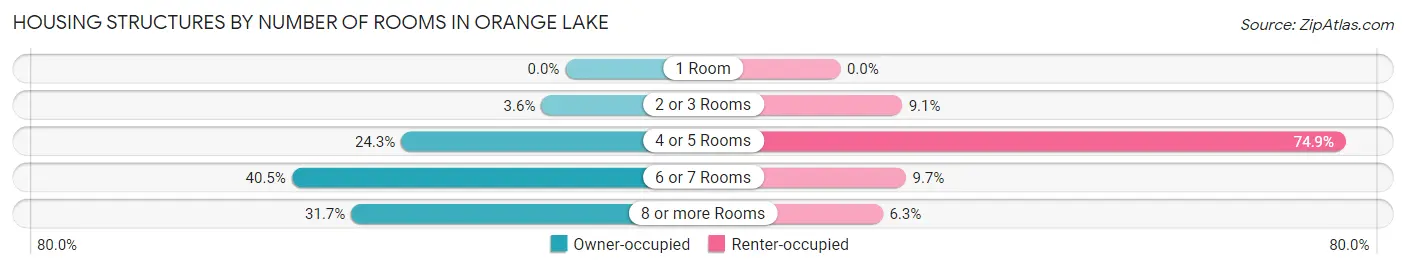
| Number of Rooms | Owner-occupied | Renter-occupied |
| 1 Room | 0 (0.0%) | 0 (0.0%) |
| 2 or 3 Rooms | 118 (3.5%) | 32 (9.1%) |
| 4 or 5 Rooms | 808 (24.3%) | 262 (74.9%) |
| 6 or 7 Rooms | 1,347 (40.5%) | 34 (9.7%) |
| 8 or more Rooms | 1,054 (31.7%) | 22 (6.3%) |
| Total | 3,327 (100.0%) | 350 (100.0%) |
Housing Structure by Heating Type in Orange Lake
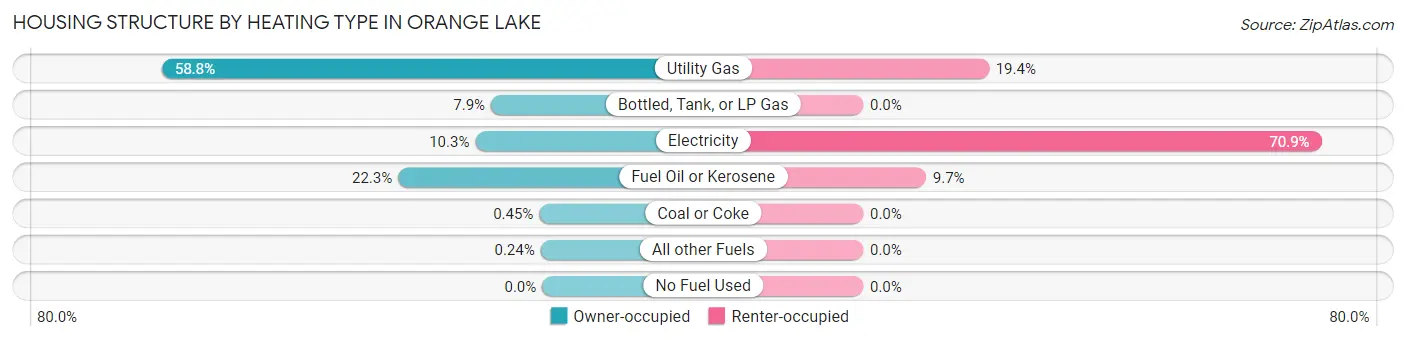
| Heating Type | Owner-occupied | Renter-occupied |
| Utility Gas | 1,956 (58.8%) | 68 (19.4%) |
| Bottled, Tank, or LP Gas | 263 (7.9%) | 0 (0.0%) |
| Electricity | 344 (10.3%) | 248 (70.9%) |
| Fuel Oil or Kerosene | 741 (22.3%) | 34 (9.7%) |
| Coal or Coke | 15 (0.4%) | 0 (0.0%) |
| All other Fuels | 8 (0.2%) | 0 (0.0%) |
| No Fuel Used | 0 (0.0%) | 0 (0.0%) |
| Total | 3,327 (100.0%) | 350 (100.0%) |
Household Vehicle Usage in Orange Lake
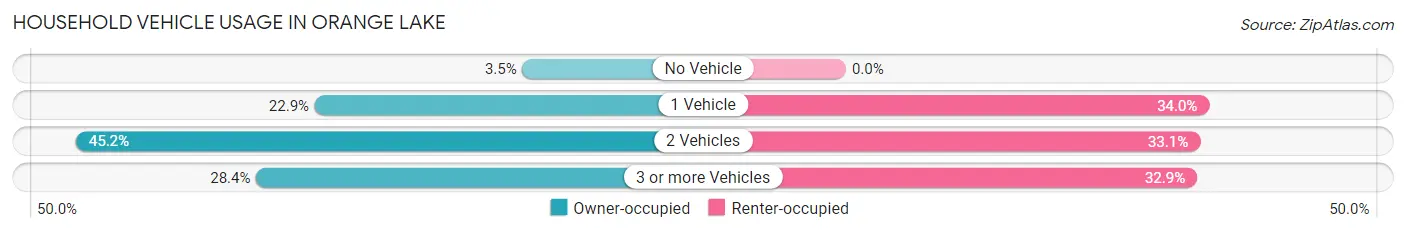
| Vehicles per Household | Owner-occupied | Renter-occupied |
| No Vehicle | 117 (3.5%) | 0 (0.0%) |
| 1 Vehicle | 762 (22.9%) | 119 (34.0%) |
| 2 Vehicles | 1,504 (45.2%) | 116 (33.1%) |
| 3 or more Vehicles | 944 (28.4%) | 115 (32.9%) |
| Total | 3,327 (100.0%) | 350 (100.0%) |
Real Estate & Mortgages in Orange Lake
Real Estate and Mortgage Overview in Orange Lake
| Characteristic | Without Mortgage | With Mortgage |
| Housing Units | 1,034 | 2,293 |
| Median Property Value | $270,200 | $331,500 |
| Median Household Income | $89,265 | $695 |
| Monthly Housing Costs | $906 | $501 |
| Real Estate Taxes | $5,100 | $31 |
Property Value by Mortgage Status in Orange Lake
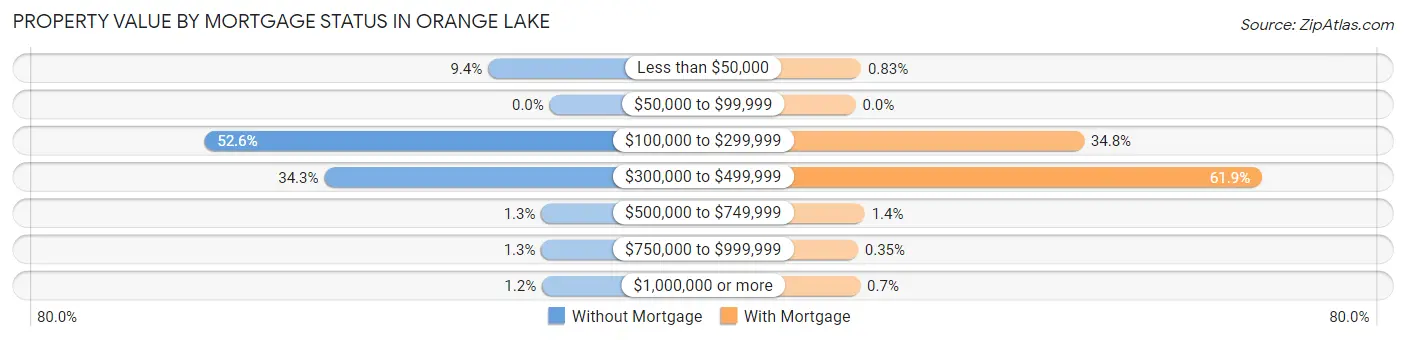
| Property Value | Without Mortgage | With Mortgage |
| Less than $50,000 | 97 (9.4%) | 19 (0.8%) |
| $50,000 to $99,999 | 0 (0.0%) | 0 (0.0%) |
| $100,000 to $299,999 | 544 (52.6%) | 798 (34.8%) |
| $300,000 to $499,999 | 355 (34.3%) | 1,420 (61.9%) |
| $500,000 to $749,999 | 13 (1.3%) | 32 (1.4%) |
| $750,000 to $999,999 | 13 (1.3%) | 8 (0.4%) |
| $1,000,000 or more | 12 (1.2%) | 16 (0.7%) |
| Total | 1,034 (100.0%) | 2,293 (100.0%) |
Household Income by Mortgage Status in Orange Lake
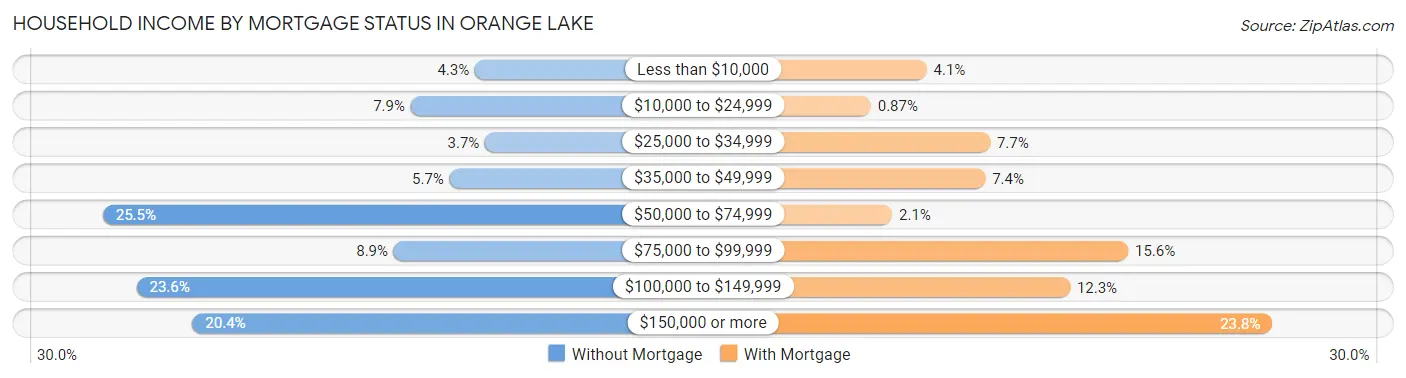
| Household Income | Without Mortgage | With Mortgage |
| Less than $10,000 | 44 (4.3%) | 93 (4.1%) |
| $10,000 to $24,999 | 82 (7.9%) | 20 (0.9%) |
| $25,000 to $34,999 | 38 (3.7%) | 176 (7.7%) |
| $35,000 to $49,999 | 59 (5.7%) | 170 (7.4%) |
| $50,000 to $74,999 | 264 (25.5%) | 48 (2.1%) |
| $75,000 to $99,999 | 92 (8.9%) | 357 (15.6%) |
| $100,000 to $149,999 | 244 (23.6%) | 281 (12.2%) |
| $150,000 or more | 211 (20.4%) | 546 (23.8%) |
| Total | 1,034 (100.0%) | 2,293 (100.0%) |
Property Value to Household Income Ratio in Orange Lake
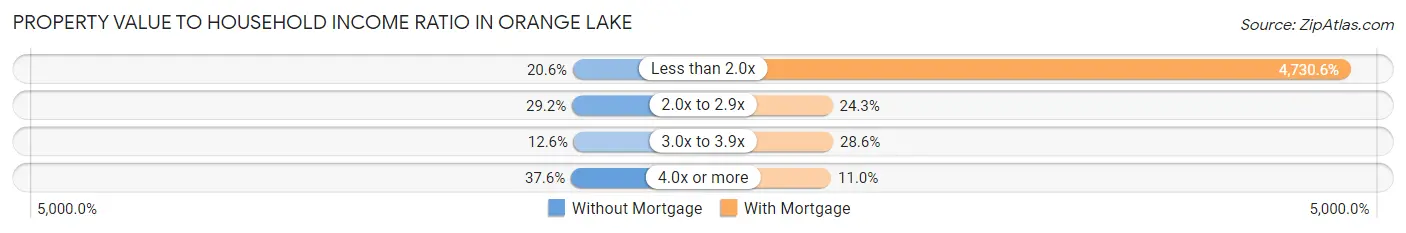
| Value-to-Income Ratio | Without Mortgage | With Mortgage |
| Less than 2.0x | 213 (20.6%) | 108,472 (4,730.6%) |
| 2.0x to 2.9x | 302 (29.2%) | 557 (24.3%) |
| 3.0x to 3.9x | 130 (12.6%) | 655 (28.6%) |
| 4.0x or more | 389 (37.6%) | 251 (11.0%) |
| Total | 1,034 (100.0%) | 2,293 (100.0%) |
Real Estate Taxes by Mortgage Status in Orange Lake
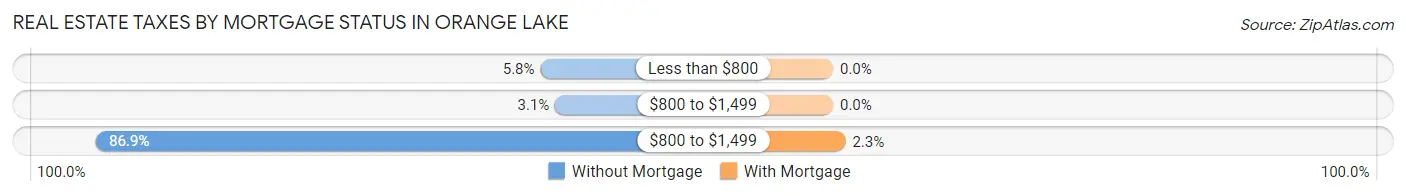
| Property Taxes | Without Mortgage | With Mortgage |
| Less than $800 | 60 (5.8%) | 0 (0.0%) |
| $800 to $1,499 | 32 (3.1%) | 0 (0.0%) |
| $800 to $1,499 | 899 (86.9%) | 52 (2.3%) |
| Total | 1,034 (100.0%) | 2,293 (100.0%) |
Health & Disability in Orange Lake
Health Insurance Coverage by Age in Orange Lake
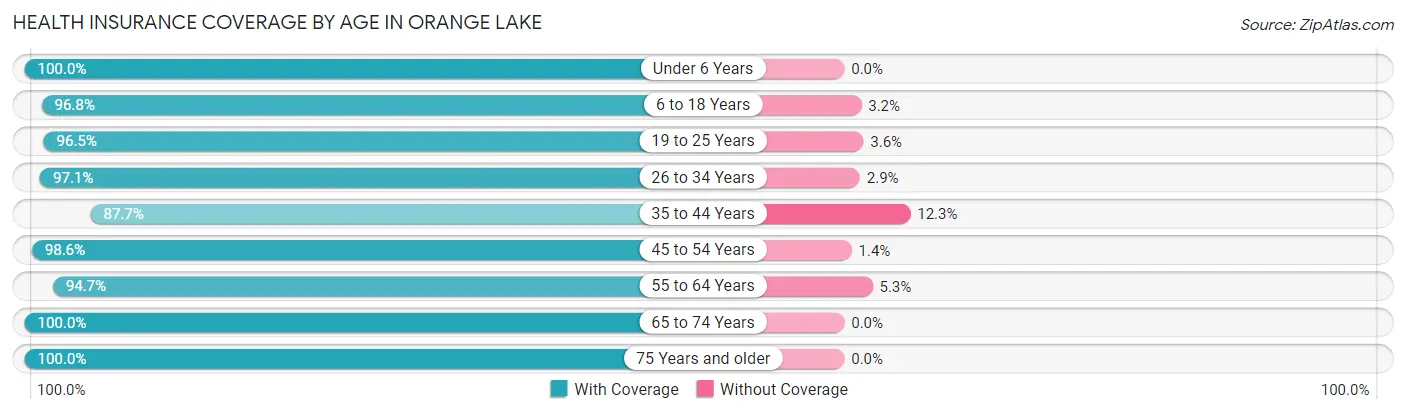
| Age Bracket | With Coverage | Without Coverage |
| Under 6 Years | 418 (100.0%) | 0 (0.0%) |
| 6 to 18 Years | 1,131 (96.8%) | 37 (3.2%) |
| 19 to 25 Years | 1,222 (96.5%) | 45 (3.5%) |
| 26 to 34 Years | 838 (97.1%) | 25 (2.9%) |
| 35 to 44 Years | 926 (87.7%) | 130 (12.3%) |
| 45 to 54 Years | 1,528 (98.6%) | 21 (1.4%) |
| 55 to 64 Years | 1,584 (94.7%) | 88 (5.3%) |
| 65 to 74 Years | 924 (100.0%) | 0 (0.0%) |
| 75 Years and older | 973 (100.0%) | 0 (0.0%) |
| Total | 9,544 (96.5%) | 346 (3.5%) |
Health Insurance Coverage by Citizenship Status in Orange Lake
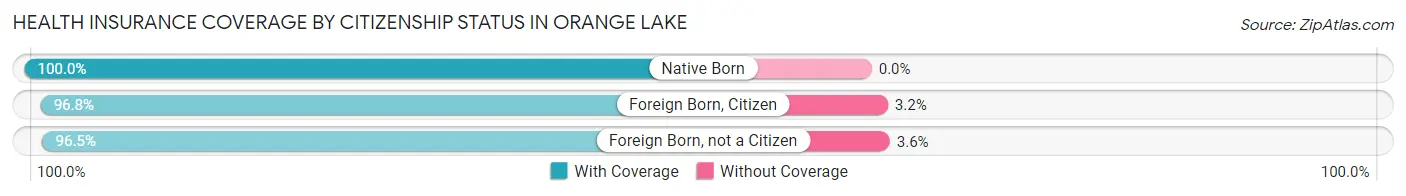
| Citizenship Status | With Coverage | Without Coverage |
| Native Born | 418 (100.0%) | 0 (0.0%) |
| Foreign Born, Citizen | 1,131 (96.8%) | 37 (3.2%) |
| Foreign Born, not a Citizen | 1,222 (96.5%) | 45 (3.5%) |
Health Insurance Coverage by Household Income in Orange Lake
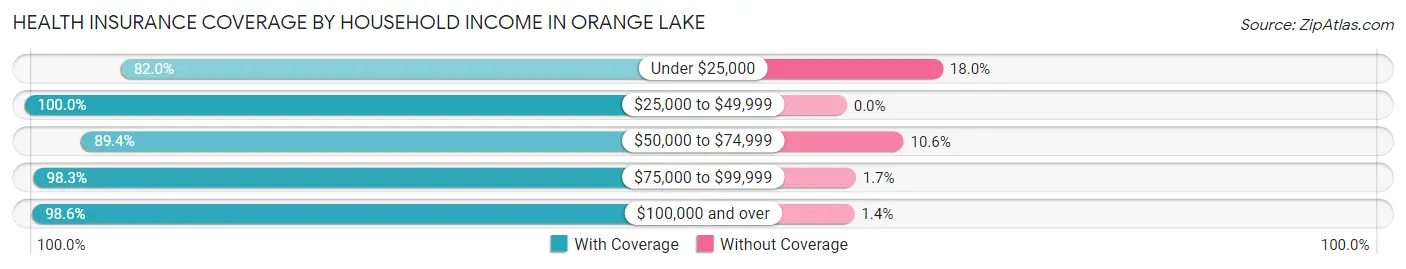
| Household Income | With Coverage | Without Coverage |
| Under $25,000 | 437 (82.0%) | 96 (18.0%) |
| $25,000 to $49,999 | 649 (100.0%) | 0 (0.0%) |
| $50,000 to $74,999 | 1,194 (89.4%) | 142 (10.6%) |
| $75,000 to $99,999 | 1,225 (98.3%) | 21 (1.7%) |
| $100,000 and over | 6,002 (98.6%) | 87 (1.4%) |
Public vs Private Health Insurance Coverage by Age in Orange Lake
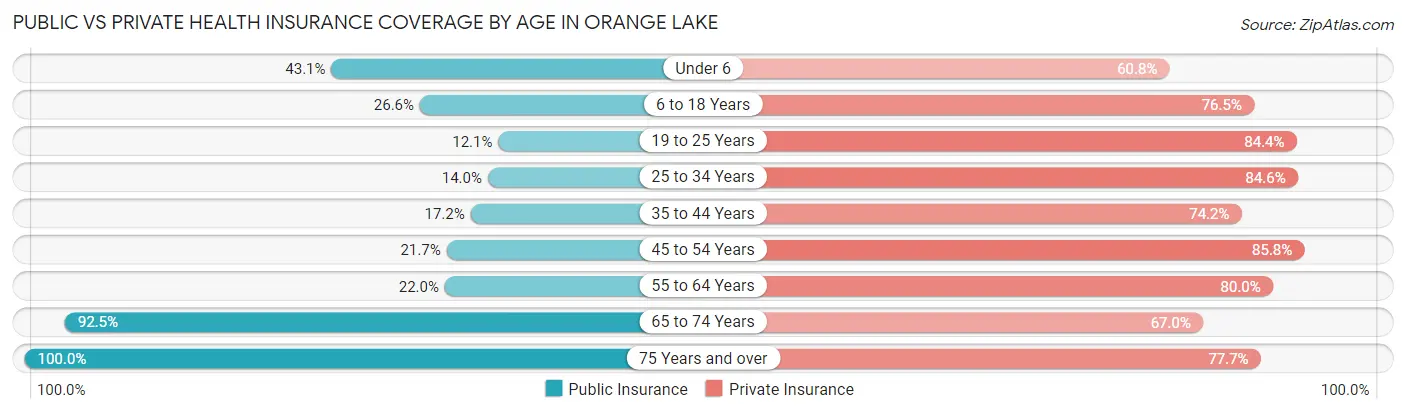
| Age Bracket | Public Insurance | Private Insurance |
| Under 6 | 180 (43.1%) | 254 (60.8%) |
| 6 to 18 Years | 311 (26.6%) | 893 (76.5%) |
| 19 to 25 Years | 153 (12.1%) | 1,069 (84.4%) |
| 25 to 34 Years | 121 (14.0%) | 730 (84.6%) |
| 35 to 44 Years | 182 (17.2%) | 783 (74.2%) |
| 45 to 54 Years | 336 (21.7%) | 1,329 (85.8%) |
| 55 to 64 Years | 368 (22.0%) | 1,337 (80.0%) |
| 65 to 74 Years | 855 (92.5%) | 619 (67.0%) |
| 75 Years and over | 973 (100.0%) | 756 (77.7%) |
| Total | 3,479 (35.2%) | 7,770 (78.6%) |
Disability Status by Sex by Age in Orange Lake
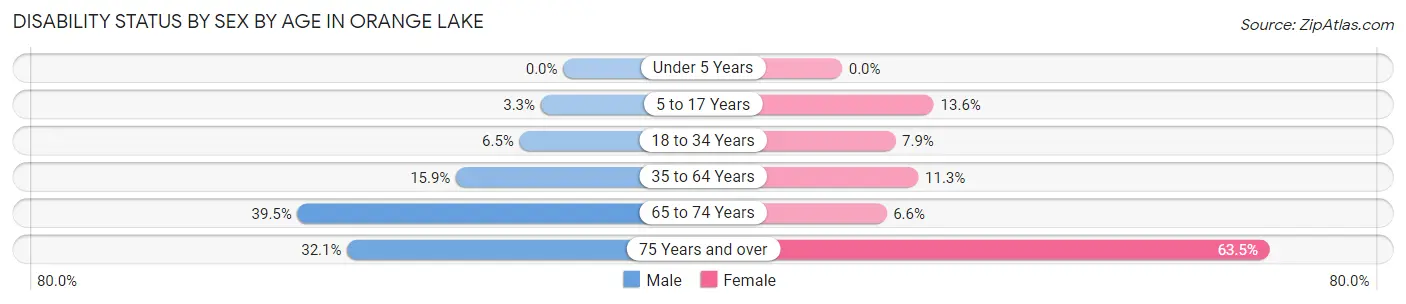
| Age Bracket | Male | Female |
| Under 5 Years | 0 (0.0%) | 0 (0.0%) |
| 5 to 17 Years | 20 (3.3%) | 60 (13.6%) |
| 18 to 34 Years | 72 (6.5%) | 93 (7.9%) |
| 35 to 64 Years | 328 (15.9%) | 251 (11.3%) |
| 65 to 74 Years | 131 (39.5%) | 39 (6.6%) |
| 75 Years and over | 196 (32.1%) | 230 (63.5%) |
Disability Class by Sex by Age in Orange Lake
Disability Class: Hearing Difficulty
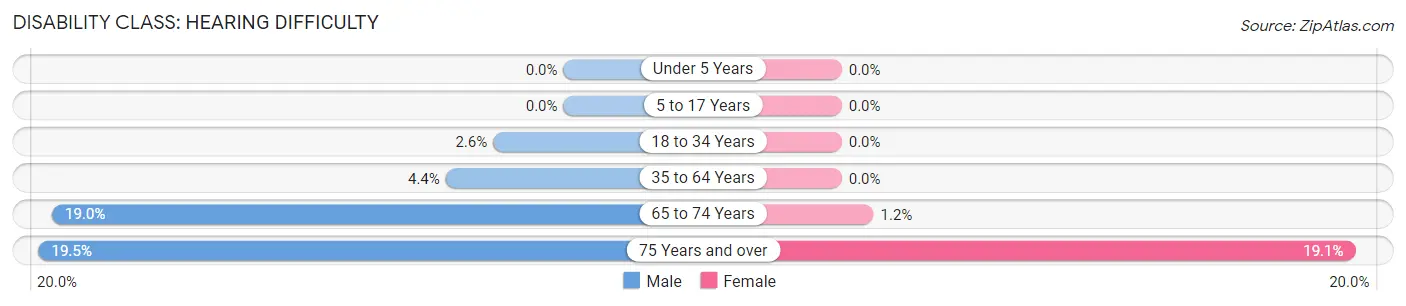
| Age Bracket | Male | Female |
| Under 5 Years | 0 (0.0%) | 0 (0.0%) |
| 5 to 17 Years | 0 (0.0%) | 0 (0.0%) |
| 18 to 34 Years | 29 (2.6%) | 0 (0.0%) |
| 35 to 64 Years | 90 (4.4%) | 0 (0.0%) |
| 65 to 74 Years | 63 (19.0%) | 7 (1.2%) |
| 75 Years and over | 119 (19.5%) | 69 (19.1%) |
Disability Class: Vision Difficulty
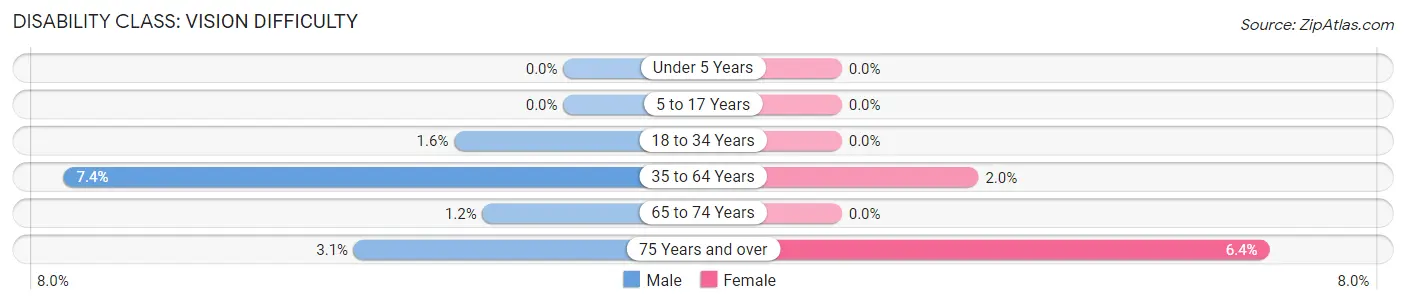
| Age Bracket | Male | Female |
| Under 5 Years | 0 (0.0%) | 0 (0.0%) |
| 5 to 17 Years | 0 (0.0%) | 0 (0.0%) |
| 18 to 34 Years | 18 (1.6%) | 0 (0.0%) |
| 35 to 64 Years | 153 (7.4%) | 45 (2.0%) |
| 65 to 74 Years | 4 (1.2%) | 0 (0.0%) |
| 75 Years and over | 19 (3.1%) | 23 (6.4%) |
Disability Class: Cognitive Difficulty
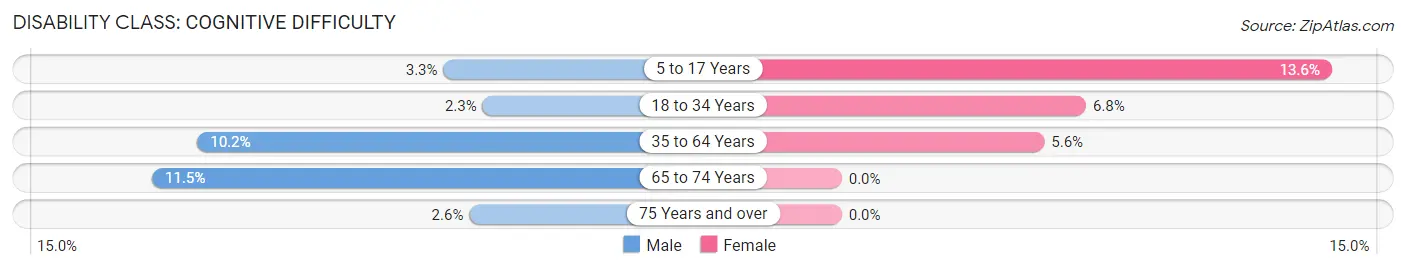
| Age Bracket | Male | Female |
| 5 to 17 Years | 20 (3.3%) | 60 (13.6%) |
| 18 to 34 Years | 25 (2.2%) | 80 (6.8%) |
| 35 to 64 Years | 210 (10.2%) | 125 (5.6%) |
| 65 to 74 Years | 38 (11.5%) | 0 (0.0%) |
| 75 Years and over | 16 (2.6%) | 0 (0.0%) |
Disability Class: Ambulatory Difficulty
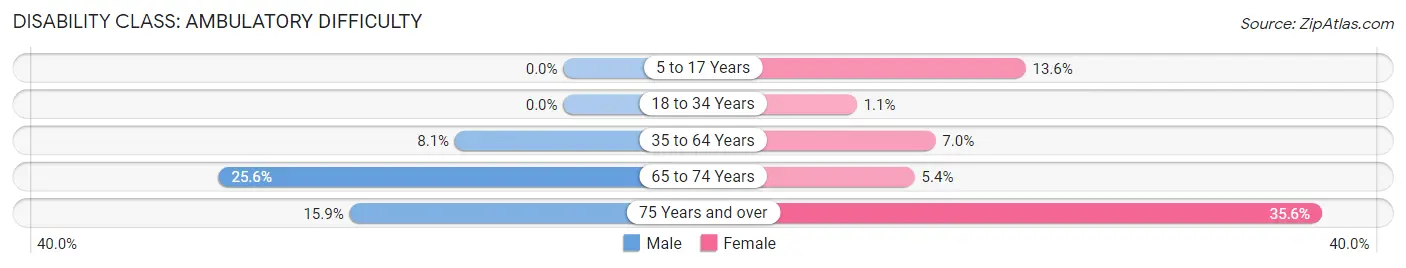
| Age Bracket | Male | Female |
| 5 to 17 Years | 0 (0.0%) | 60 (13.6%) |
| 18 to 34 Years | 0 (0.0%) | 13 (1.1%) |
| 35 to 64 Years | 166 (8.1%) | 154 (7.0%) |
| 65 to 74 Years | 85 (25.6%) | 32 (5.4%) |
| 75 Years and over | 97 (15.9%) | 129 (35.6%) |
Disability Class: Self-Care Difficulty

| Age Bracket | Male | Female |
| 5 to 17 Years | 0 (0.0%) | 60 (13.6%) |
| 18 to 34 Years | 43 (3.9%) | 0 (0.0%) |
| 35 to 64 Years | 127 (6.2%) | 82 (3.7%) |
| 65 to 74 Years | 66 (19.9%) | 0 (0.0%) |
| 75 Years and over | 61 (10.0%) | 67 (18.5%) |
Technology Access in Orange Lake
Computing Device Access in Orange Lake
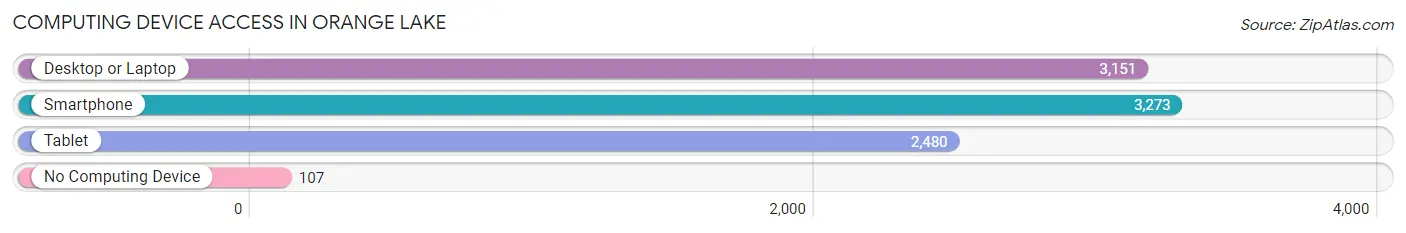
| Device Type | # Households | % Households |
| Desktop or Laptop | 3,151 | 85.7% |
| Smartphone | 3,273 | 89.0% |
| Tablet | 2,480 | 67.4% |
| No Computing Device | 107 | 2.9% |
| Total | 3,677 | 100.0% |
Internet Access in Orange Lake
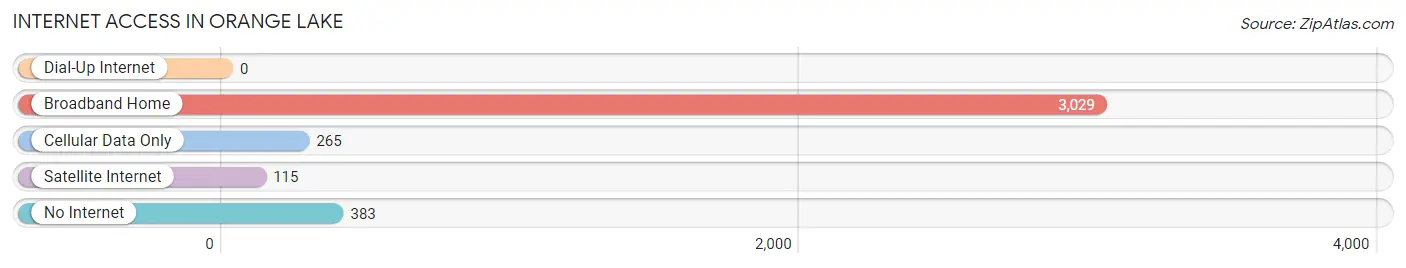
| Internet Type | # Households | % Households |
| Dial-Up Internet | 0 | 0.0% |
| Broadband Home | 3,029 | 82.4% |
| Cellular Data Only | 265 | 7.2% |
| Satellite Internet | 115 | 3.1% |
| No Internet | 383 | 10.4% |
| Total | 3,677 | 100.0% |
Orange Lake Summary
Orange Lake is a hamlet located in the town of Newburgh in Orange County, New York. It is situated on the east side of the Hudson River, about 60 miles north of New York City. The hamlet is bordered by the towns of New Windsor to the north, Cornwall to the east, and Montgomery to the south.
History
The area that is now Orange Lake was originally inhabited by the Munsee Indians, a branch of the Lenape people. The first European settlers arrived in the area in the late 17th century, and the hamlet was officially established in 1750. The hamlet was named after the nearby Orange Lake, which was named for the orange trees that grew along its banks.
In the 19th century, the hamlet was a popular summer resort destination, with many wealthy New Yorkers building summer homes in the area. The hamlet was also home to several large farms, which produced a variety of crops, including apples, peaches, and potatoes.
In the early 20th century, the hamlet began to decline in popularity as a summer resort destination, and many of the summer homes were abandoned. In the 1950s, the hamlet was revitalized when the New York State Thruway was built, providing easy access to New York City.
Geography
Orange Lake is located in the Hudson Valley region of New York State. The hamlet is situated on the east side of the Hudson River, about 60 miles north of New York City. The hamlet is bordered by the towns of New Windsor to the north, Cornwall to the east, and Montgomery to the south.
The hamlet is located in a rural area, with rolling hills and forests. The Orange Lake Reservoir is located just to the north of the hamlet, and is a popular spot for fishing and boating.
Economy
The economy of Orange Lake is largely based on tourism and agriculture. The hamlet is home to several small businesses, including restaurants, shops, and bed and breakfasts. The hamlet is also home to several farms, which produce a variety of crops, including apples, peaches, and potatoes.
Demographics
As of the 2010 census, the population of Orange Lake was 1,845. The median household income was $50,972, and the median home value was $219,000. The population is largely white (90.3%), with small percentages of African American (3.2%), Hispanic (2.7%), and Asian (1.7%) residents.
Conclusion
Orange Lake is a small hamlet located in the town of Newburgh in Orange County, New York. The hamlet has a long history, dating back to the late 17th century, and was once a popular summer resort destination. Today, the hamlet is largely rural, with a population of 1,845 and an economy based on tourism and agriculture.
Common Questions
What is Per Capita Income in Orange Lake?
Per Capita income in Orange Lake is $43,667.
What is the Median Family Income in Orange Lake?
Median Family Income in Orange Lake is $112,582.
What is the Median Household income in Orange Lake?
Median Household Income in Orange Lake is $104,313.
What is Income or Wage Gap in Orange Lake?
Income or Wage Gap in Orange Lake is 38.4%.
Women in Orange Lake earn 61.6 cents for every dollar earned by a man.
What is Inequality or Gini Index in Orange Lake?
Inequality or Gini Index in Orange Lake is 0.38.
What is the Total Population of Orange Lake?
Total Population of Orange Lake is 10,060.
What is the Total Male Population of Orange Lake?
Total Male Population of Orange Lake is 5,030.
What is the Total Female Population of Orange Lake?
Total Female Population of Orange Lake is 5,030.
What is the Ratio of Males per 100 Females in Orange Lake?
There are 100.00 Males per 100 Females in Orange Lake.
What is the Ratio of Females per 100 Males in Orange Lake?
There are 100.00 Females per 100 Males in Orange Lake.
What is the Median Population Age in Orange Lake?
Median Population Age in Orange Lake is 46.7 Years.
What is the Average Family Size in Orange Lake
Average Family Size in Orange Lake is 3.1 People.
What is the Average Household Size in Orange Lake
Average Household Size in Orange Lake is 2.7 People.
How Large is the Labor Force in Orange Lake?
There are 5,080 People in the Labor Forcein in Orange Lake.
What is the Percentage of People in the Labor Force in Orange Lake?
57.5% of People are in the Labor Force in Orange Lake.
What is the Unemployment Rate in Orange Lake?
Unemployment Rate in Orange Lake is 4.0%.