Oneida, NY Map & Demographics
Oneida Map
Oneida Overview
$35,259
PER CAPITA INCOME
$79,574
AVG FAMILY INCOME
$56,044
AVG HOUSEHOLD INCOME
15.8%
WAGE / INCOME GAP [ % ]
84.2¢/ $1
WAGE / INCOME GAP [ $ ]
$12,552
FAMILY INCOME DEFICIT
0.47
INEQUALITY / GINI INDEX
10,326
TOTAL POPULATION
4,888
MALE POPULATION
5,438
FEMALE POPULATION
89.89
MALES / 100 FEMALES
111.25
FEMALES / 100 MALES
46.0
MEDIAN AGE
3.1
AVG FAMILY SIZE
2.2
AVG HOUSEHOLD SIZE
5,223
LABOR FORCE [ PEOPLE ]
61.6%
PERCENT IN LABOR FORCE
3.0%
UNEMPLOYMENT RATE
Oneida Zip Codes
Oneida Area Codes
Income in Oneida
Income Overview in Oneida
Per Capita Income in Oneida is $35,259, while median incomes of families and households are $79,574 and $56,044 respectively.
| Characteristic | Number | Measure |
| Per Capita Income | 10,326 | $35,259 |
| Median Family Income | 2,347 | $79,574 |
| Mean Family Income | 2,347 | $104,289 |
| Median Household Income | 4,521 | $56,044 |
| Mean Household Income | 4,521 | $77,459 |
| Income Deficit | 2,347 | $12,552 |
| Wage / Income Gap (%) | 10,326 | 15.79% |
| Wage / Income Gap ($) | 10,326 | 84.21¢ per $1 |
| Gini / Inequality Index | 10,326 | 0.47 |
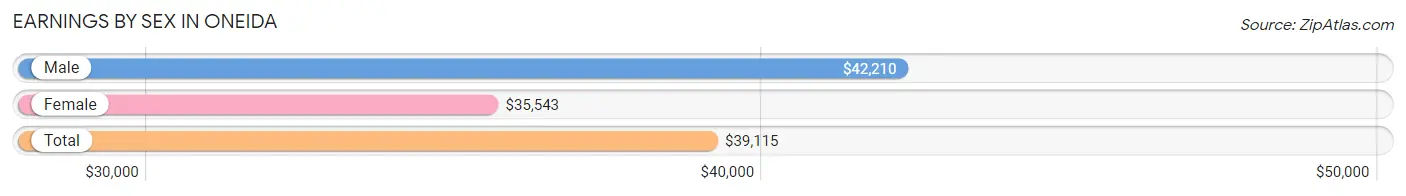
Earnings by Sex in Oneida
Average Earnings in Oneida are $39,115, $42,210 for men and $35,543 for women, a difference of 15.8%.
| Sex | Number | Average Earnings |
| Male | 2,691 (49.4%) | $42,210 |
| Female | 2,760 (50.6%) | $35,543 |
| Total | 5,451 (100.0%) | $39,115 |
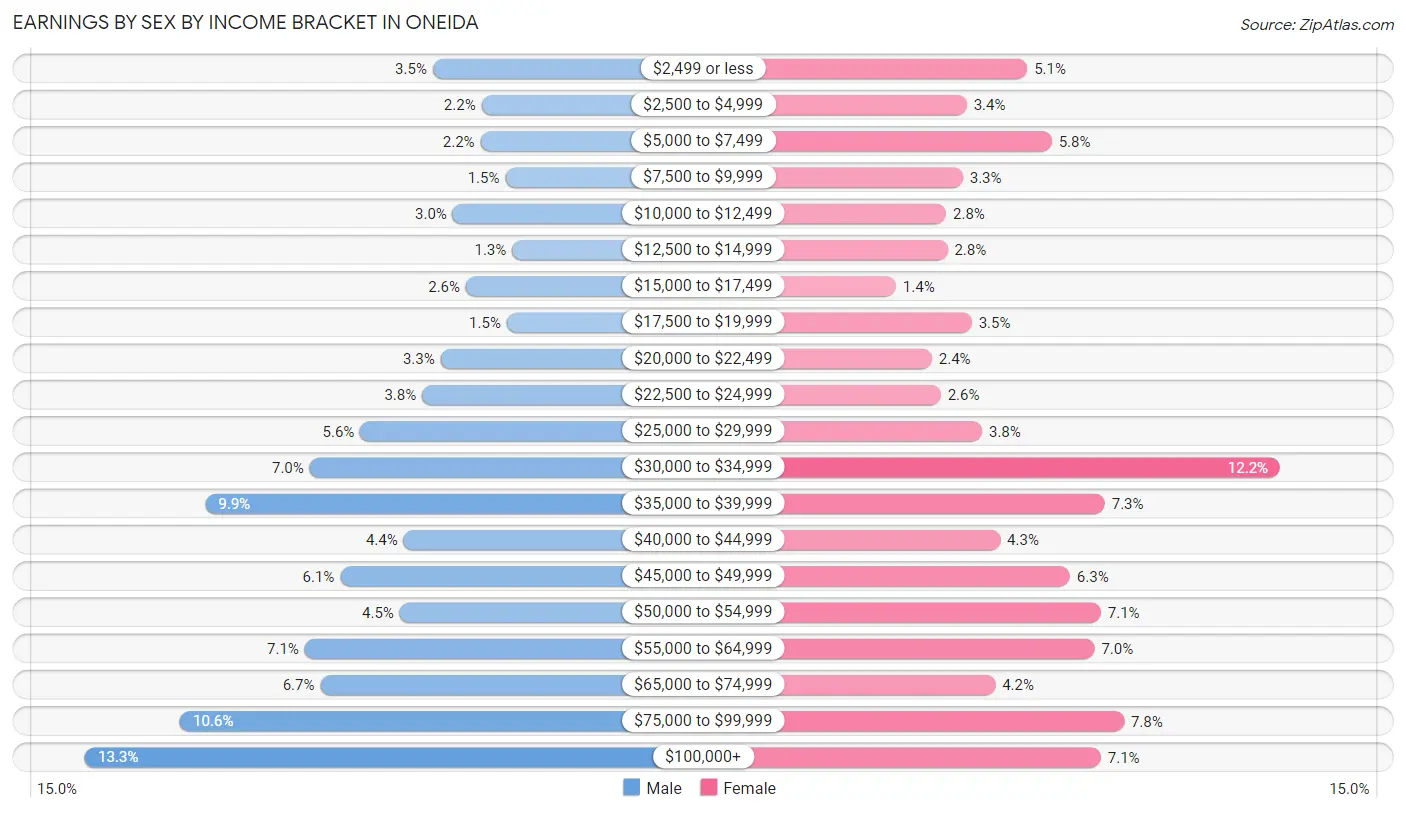
Earnings by Sex by Income Bracket in Oneida
The most common earnings brackets in Oneida are $100,000+ for men (358 | 13.3%) and $30,000 to $34,999 for women (336 | 12.2%).
| Income | Male | Female |
| $2,499 or less | 95 (3.5%) | 140 (5.1%) |
| $2,500 to $4,999 | 58 (2.2%) | 93 (3.4%) |
| $5,000 to $7,499 | 59 (2.2%) | 159 (5.8%) |
| $7,500 to $9,999 | 40 (1.5%) | 90 (3.3%) |
| $10,000 to $12,499 | 80 (3.0%) | 77 (2.8%) |
| $12,500 to $14,999 | 35 (1.3%) | 78 (2.8%) |
| $15,000 to $17,499 | 70 (2.6%) | 38 (1.4%) |
| $17,500 to $19,999 | 39 (1.5%) | 97 (3.5%) |
| $20,000 to $22,499 | 89 (3.3%) | 66 (2.4%) |
| $22,500 to $24,999 | 103 (3.8%) | 73 (2.6%) |
| $25,000 to $29,999 | 150 (5.6%) | 105 (3.8%) |
| $30,000 to $34,999 | 188 (7.0%) | 336 (12.2%) |
| $35,000 to $39,999 | 267 (9.9%) | 200 (7.2%) |
| $40,000 to $44,999 | 117 (4.3%) | 119 (4.3%) |
| $45,000 to $49,999 | 165 (6.1%) | 173 (6.3%) |
| $50,000 to $54,999 | 120 (4.5%) | 197 (7.1%) |
| $55,000 to $64,999 | 192 (7.1%) | 192 (7.0%) |
| $65,000 to $74,999 | 180 (6.7%) | 115 (4.2%) |
| $75,000 to $99,999 | 286 (10.6%) | 215 (7.8%) |
| $100,000+ | 358 (13.3%) | 197 (7.1%) |
| Total | 2,691 (100.0%) | 2,760 (100.0%) |
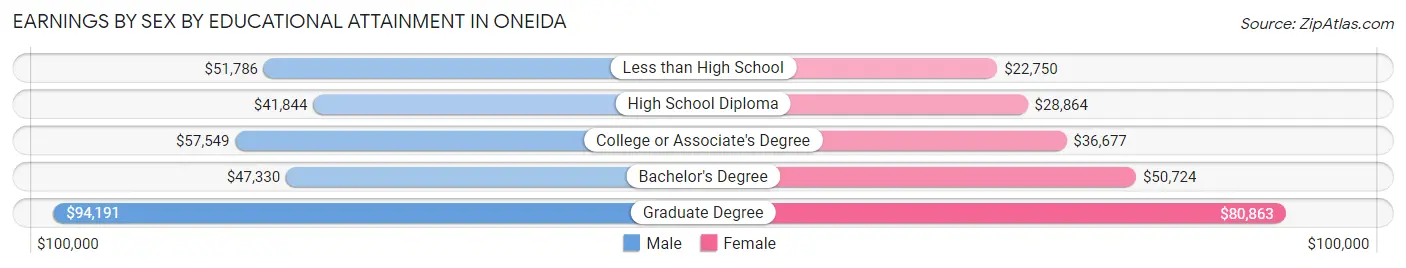
Earnings by Sex by Educational Attainment in Oneida
Average earnings in Oneida are $49,669 for men and $39,014 for women, a difference of 21.4%. Men with an educational attainment of graduate degree enjoy the highest average annual earnings of $94,191, while those with high school diploma education earn the least with $41,844. Women with an educational attainment of graduate degree earn the most with the average annual earnings of $80,863, while those with less than high school education have the smallest earnings of $22,750.
| Educational Attainment | Male Income | Female Income |
| Less than High School | $51,786 | $22,750 |
| High School Diploma | $41,844 | $28,864 |
| College or Associate's Degree | $57,549 | $36,677 |
| Bachelor's Degree | $47,330 | $50,724 |
| Graduate Degree | $94,191 | $80,863 |
| Total | $49,669 | $39,014 |
Family Income in Oneida
Family Income Brackets in Oneida
According to the Oneida family income data, there are 418 families falling into the $100,000 to $149,999 income range, which is the most common income bracket and makes up 17.8% of all families. Conversely, the $10,000 to $14,999 income bracket is the least frequent group with only 63 families (2.7%) belonging to this category.
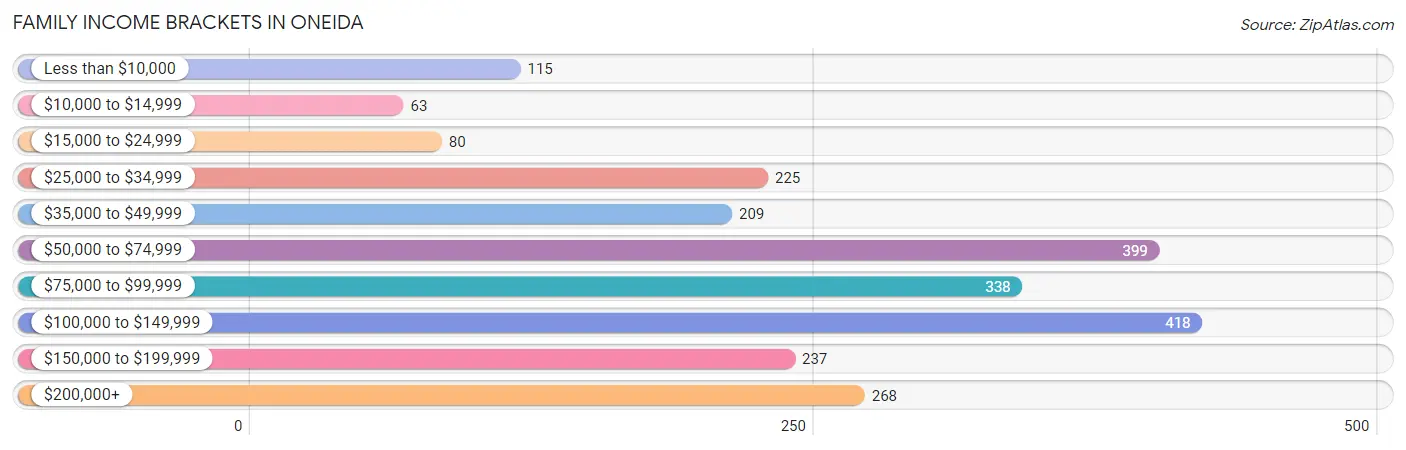
| Income Bracket | # Families | % Families |
| Less than $10,000 | 115 | 4.9% |
| $10,000 to $14,999 | 63 | 2.7% |
| $15,000 to $24,999 | 80 | 3.4% |
| $25,000 to $34,999 | 225 | 9.6% |
| $35,000 to $49,999 | 209 | 8.9% |
| $50,000 to $74,999 | 399 | 17.0% |
| $75,000 to $99,999 | 338 | 14.4% |
| $100,000 to $149,999 | 418 | 17.8% |
| $150,000 to $199,999 | 237 | 10.1% |
| $200,000+ | 268 | 11.4% |
Family Income by Famaliy Size in Oneida
5-person families (170 | 7.2%) account for the highest median family income in Oneida with $157,262 per family, while 2-person families (1,074 | 45.8%) have the highest median income of $34,209 per family member.
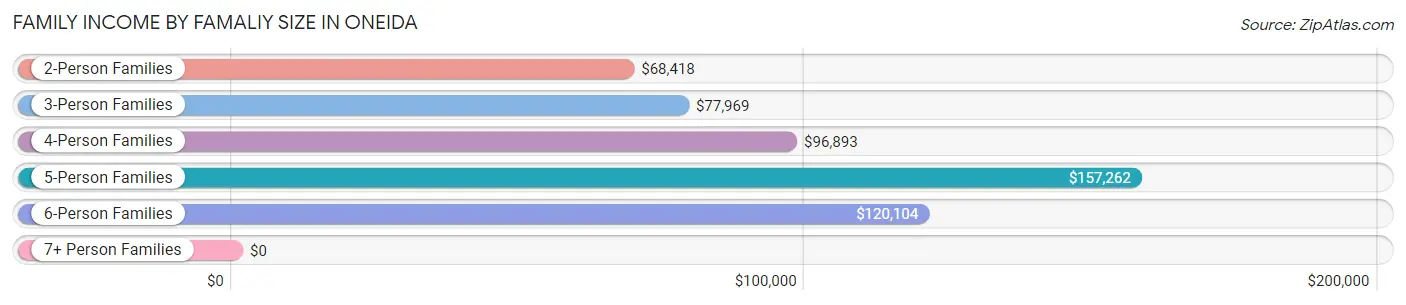
| Income Bracket | # Families | Median Income |
| 2-Person Families | 1,074 (45.8%) | $68,418 |
| 3-Person Families | 591 (25.2%) | $77,969 |
| 4-Person Families | 451 (19.2%) | $96,893 |
| 5-Person Families | 170 (7.2%) | $157,262 |
| 6-Person Families | 61 (2.6%) | $120,104 |
| 7+ Person Families | 0 (0.0%) | $0 |
| Total | 2,347 (100.0%) | $79,574 |
Family Income by Number of Earners in Oneida
The median family income in Oneida is $79,574, with families comprising 3+ earners (370) having the highest median family income of $149,898, while families with no earners (330) have the lowest median family income of $33,611, accounting for 15.8% and 14.1% of families, respectively.
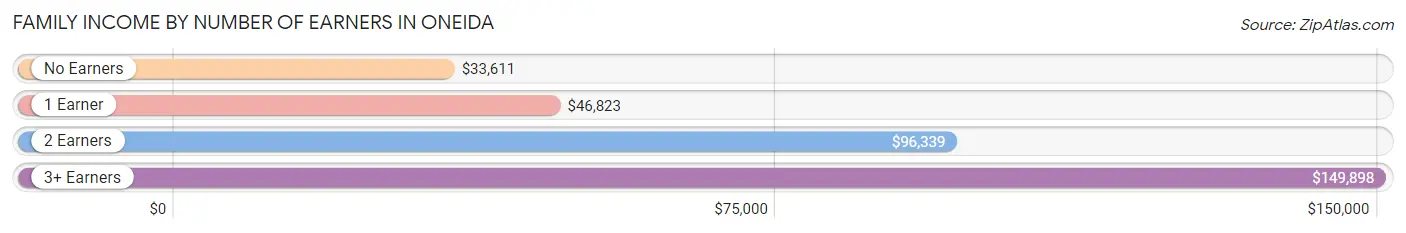
| Number of Earners | # Families | Median Income |
| No Earners | 330 (14.1%) | $33,611 |
| 1 Earner | 791 (33.7%) | $46,823 |
| 2 Earners | 856 (36.5%) | $96,339 |
| 3+ Earners | 370 (15.8%) | $149,898 |
| Total | 2,347 (100.0%) | $79,574 |
Household Income in Oneida
Household Income Brackets in Oneida
With 764 households falling in the category, the $50,000 to $74,999 income range is the most frequent in Oneida, accounting for 16.9% of all households. In contrast, only 226 households (5.0%) fall into the less than $10,000 income bracket, making it the least populous group.
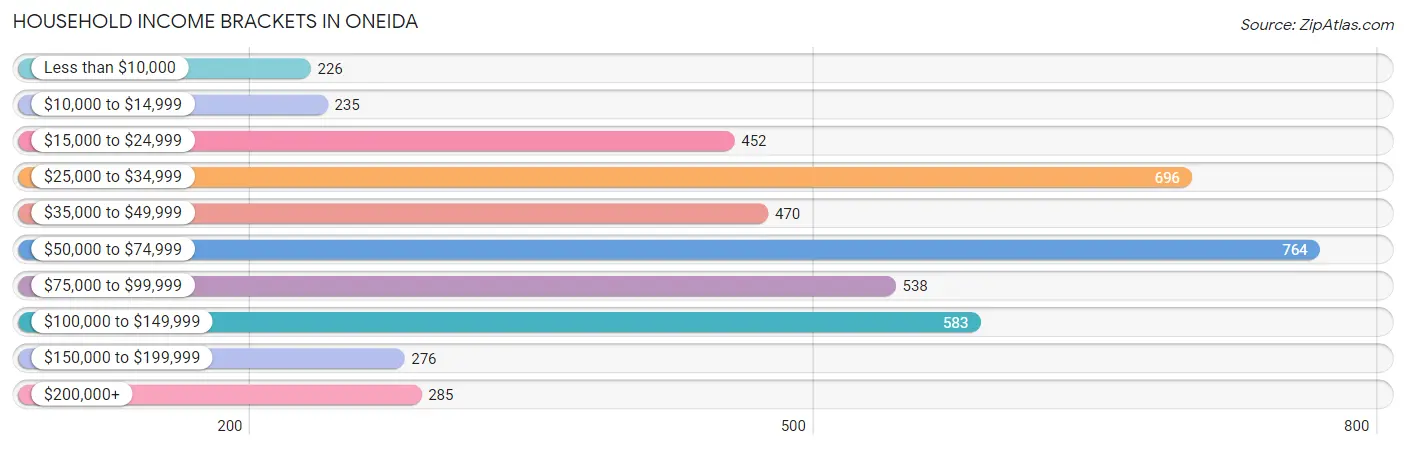
| Income Bracket | # Households | % Households |
| Less than $10,000 | 226 | 5.0% |
| $10,000 to $14,999 | 235 | 5.2% |
| $15,000 to $24,999 | 452 | 10.0% |
| $25,000 to $34,999 | 696 | 15.4% |
| $35,000 to $49,999 | 470 | 10.4% |
| $50,000 to $74,999 | 764 | 16.9% |
| $75,000 to $99,999 | 538 | 11.9% |
| $100,000 to $149,999 | 583 | 12.9% |
| $150,000 to $199,999 | 276 | 6.1% |
| $200,000+ | 285 | 6.3% |
Household Income by Householder Age in Oneida
The median household income in Oneida is $56,044, with the highest median household income of $74,250 found in the 45 to 64 years age bracket for the primary householder. A total of 1,747 households (38.6%) fall into this category. Meanwhile, the 65+ years age bracket for the primary householder has the lowest median household income of $34,043, with 1,476 households (32.7%) in this group.
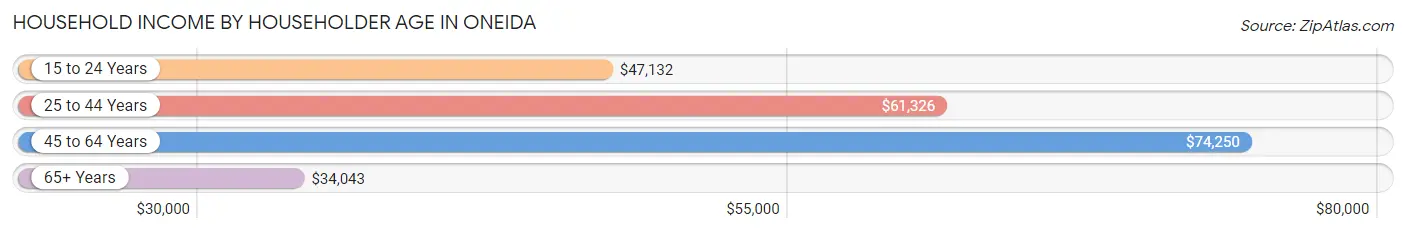
| Income Bracket | # Households | Median Income |
| 15 to 24 Years | 81 (1.8%) | $47,132 |
| 25 to 44 Years | 1,217 (26.9%) | $61,326 |
| 45 to 64 Years | 1,747 (38.6%) | $74,250 |
| 65+ Years | 1,476 (32.7%) | $34,043 |
| Total | 4,521 (100.0%) | $56,044 |
Poverty in Oneida
Income Below Poverty by Sex and Age in Oneida
With 11.3% poverty level for males and 13.4% for females among the residents of Oneida, 6 to 11 year old males and 5 year old females are the most vulnerable to poverty, with 89 males (25.4%) and 42 females (35.0%) in their respective age groups living below the poverty level.
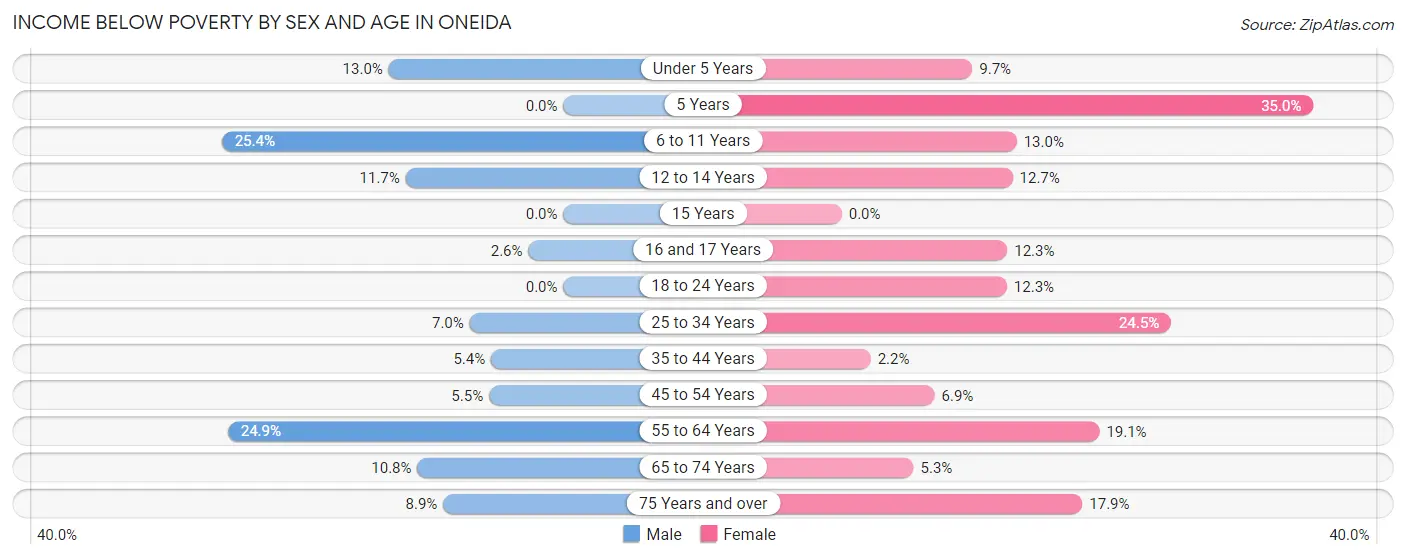
| Age Bracket | Male | Female |
| Under 5 Years | 41 (13.0%) | 28 (9.7%) |
| 5 Years | 0 (0.0%) | 42 (35.0%) |
| 6 to 11 Years | 89 (25.4%) | 40 (13.0%) |
| 12 to 14 Years | 13 (11.7%) | 26 (12.7%) |
| 15 Years | 0 (0.0%) | 0 (0.0%) |
| 16 and 17 Years | 2 (2.6%) | 22 (12.3%) |
| 18 to 24 Years | 0 (0.0%) | 38 (12.3%) |
| 25 to 34 Years | 35 (7.0%) | 157 (24.4%) |
| 35 to 44 Years | 30 (5.4%) | 10 (2.1%) |
| 45 to 54 Years | 40 (5.5%) | 49 (6.9%) |
| 55 to 64 Years | 211 (24.9%) | 171 (19.1%) |
| 65 to 74 Years | 62 (10.8%) | 33 (5.3%) |
| 75 Years and over | 24 (8.9%) | 105 (17.9%) |
| Total | 547 (11.3%) | 721 (13.4%) |
Income Above Poverty by Sex and Age in Oneida
According to the poverty statistics in Oneida, males aged 5 years and females aged 15 years are the age groups that are most secure financially, with 100.0% of males and 100.0% of females in these age groups living above the poverty line.
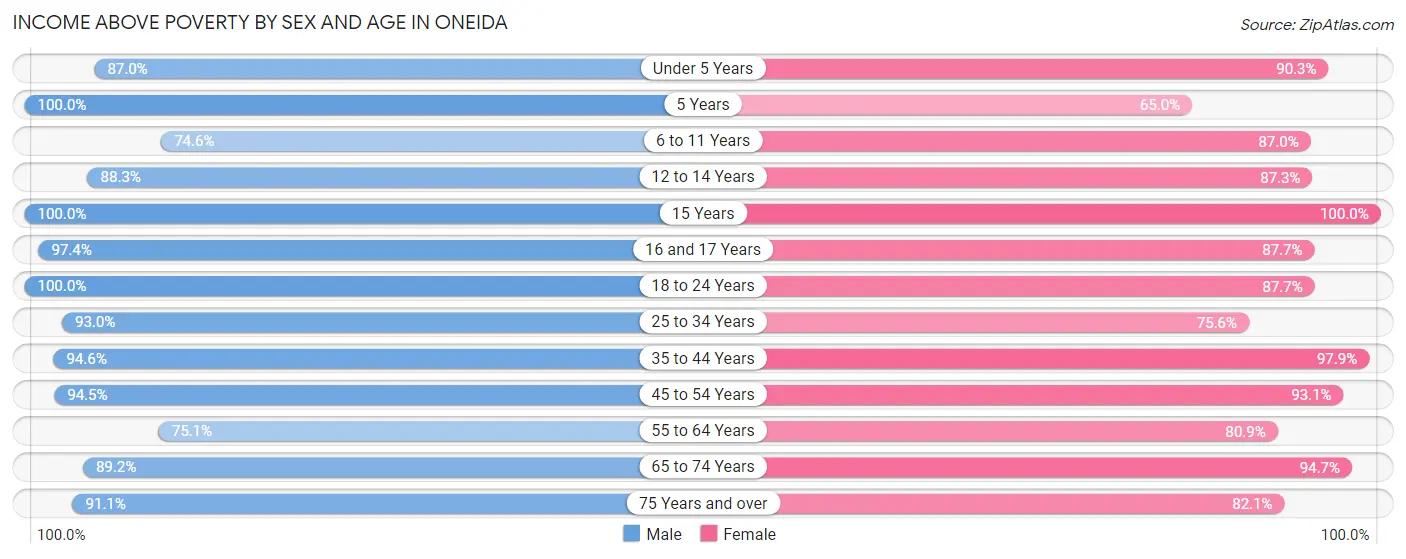
| Age Bracket | Male | Female |
| Under 5 Years | 275 (87.0%) | 261 (90.3%) |
| 5 Years | 57 (100.0%) | 78 (65.0%) |
| 6 to 11 Years | 262 (74.6%) | 268 (87.0%) |
| 12 to 14 Years | 98 (88.3%) | 179 (87.3%) |
| 15 Years | 13 (100.0%) | 52 (100.0%) |
| 16 and 17 Years | 75 (97.4%) | 157 (87.7%) |
| 18 to 24 Years | 427 (100.0%) | 272 (87.7%) |
| 25 to 34 Years | 468 (93.0%) | 485 (75.5%) |
| 35 to 44 Years | 529 (94.6%) | 455 (97.9%) |
| 45 to 54 Years | 685 (94.5%) | 662 (93.1%) |
| 55 to 64 Years | 636 (75.1%) | 723 (80.9%) |
| 65 to 74 Years | 510 (89.2%) | 586 (94.7%) |
| 75 Years and over | 245 (91.1%) | 483 (82.1%) |
| Total | 4,280 (88.7%) | 4,661 (86.6%) |
Income Below Poverty Among Married-Couple Families in Oneida
The poverty statistics for married-couple families in Oneida show that 3.9% or 66 of the total 1,712 families live below the poverty line. Families with no children have the highest poverty rate of 5.8%, comprising of 60 families. On the other hand, families with 3 or 4 children have the lowest poverty rate of 0.0%, which includes 0 families.
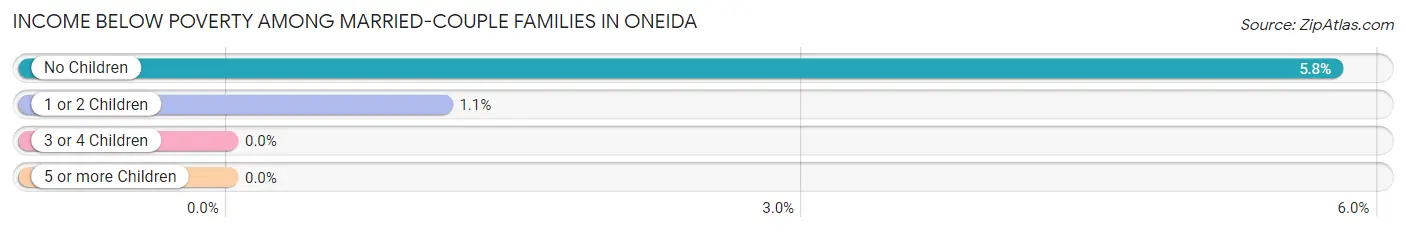
| Children | Above Poverty | Below Poverty |
| No Children | 980 (94.2%) | 60 (5.8%) |
| 1 or 2 Children | 532 (98.9%) | 6 (1.1%) |
| 3 or 4 Children | 134 (100.0%) | 0 (0.0%) |
| 5 or more Children | 0 (0.0%) | 0 (0.0%) |
| Total | 1,646 (96.1%) | 66 (3.9%) |
Income Below Poverty Among Single-Parent Households in Oneida
According to the poverty data in Oneida, 14.2% or 18 single-father households and 29.1% or 148 single-mother households are living below the poverty line. Among single-father households, those with 3 or 4 children have the highest poverty rate, with 8 households (100.0%) experiencing poverty. Likewise, among single-mother households, those with 3 or 4 children have the highest poverty rate, with 69 households (89.6%) falling below the poverty line.
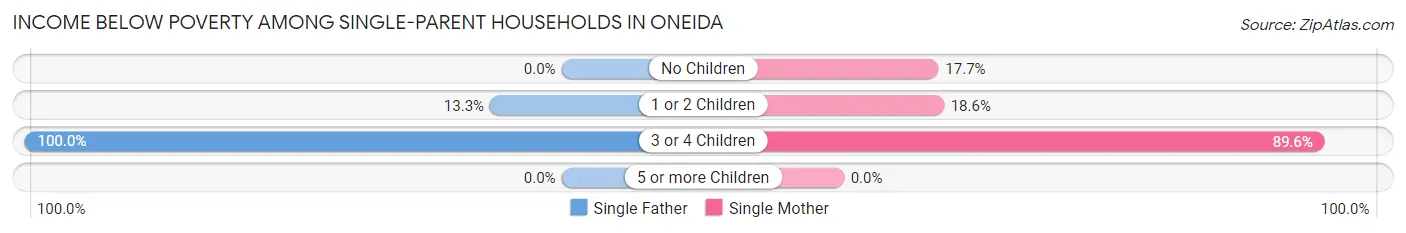
| Children | Single Father | Single Mother |
| No Children | 0 (0.0%) | 24 (17.6%) |
| 1 or 2 Children | 10 (13.3%) | 55 (18.6%) |
| 3 or 4 Children | 8 (100.0%) | 69 (89.6%) |
| 5 or more Children | 0 (0.0%) | 0 (0.0%) |
| Total | 18 (14.2%) | 148 (29.1%) |
Income Below Poverty Among Married-Couple vs Single-Parent Households in Oneida
The poverty data for Oneida shows that 66 of the married-couple family households (3.9%) and 166 of the single-parent households (26.1%) are living below the poverty level. Within the married-couple family households, those with no children have the highest poverty rate, with 60 households (5.8%) falling below the poverty line. Among the single-parent households, those with 3 or 4 children have the highest poverty rate, with 77 household (90.6%) living below poverty.
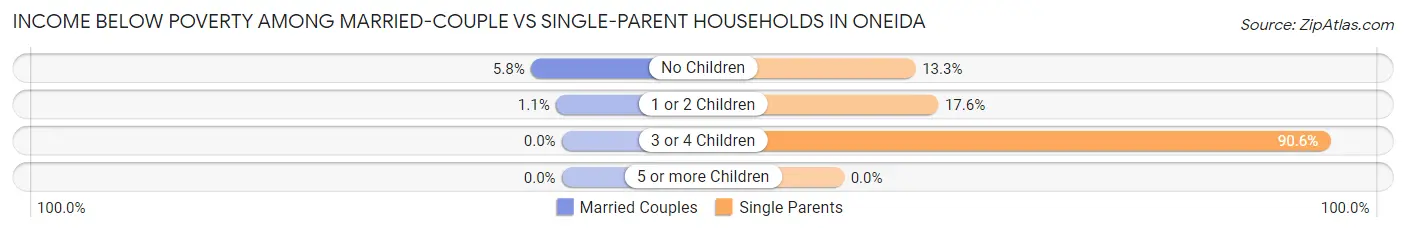
| Children | Married-Couple Families | Single-Parent Households |
| No Children | 60 (5.8%) | 24 (13.3%) |
| 1 or 2 Children | 6 (1.1%) | 65 (17.6%) |
| 3 or 4 Children | 0 (0.0%) | 77 (90.6%) |
| 5 or more Children | 0 (0.0%) | 0 (0.0%) |
| Total | 66 (3.9%) | 166 (26.1%) |
Race in Oneida
The most populous races in Oneida are White / Caucasian (9,522 | 92.2%), Two or more Races (357 | 3.5%), and Hispanic or Latino (268 | 2.6%).
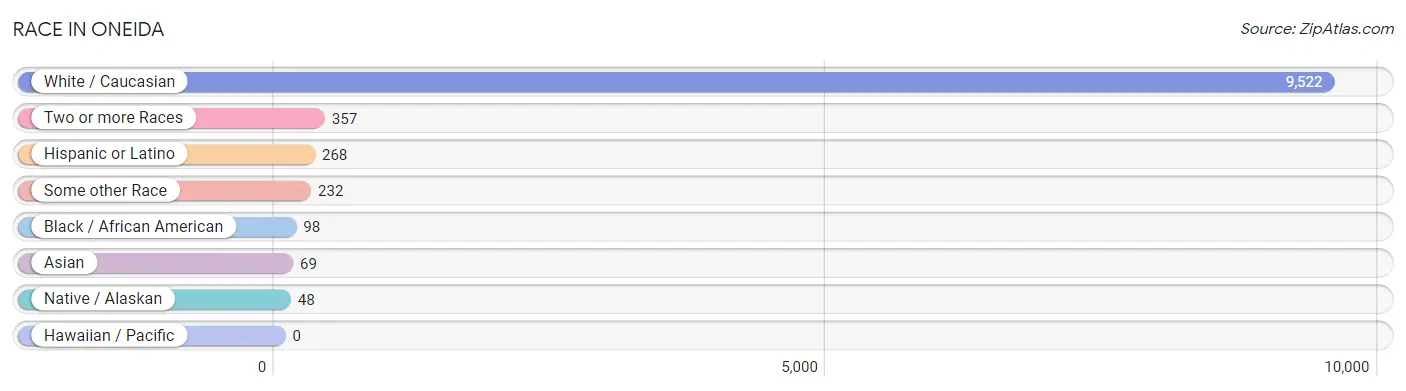
| Race | # Population | % Population |
| Asian | 69 | 0.7% |
| Black / African American | 98 | 0.9% |
| Hawaiian / Pacific | 0 | 0.0% |
| Hispanic or Latino | 268 | 2.6% |
| Native / Alaskan | 48 | 0.5% |
| White / Caucasian | 9,522 | 92.2% |
| Two or more Races | 357 | 3.5% |
| Some other Race | 232 | 2.2% |
| Total | 10,326 | 100.0% |
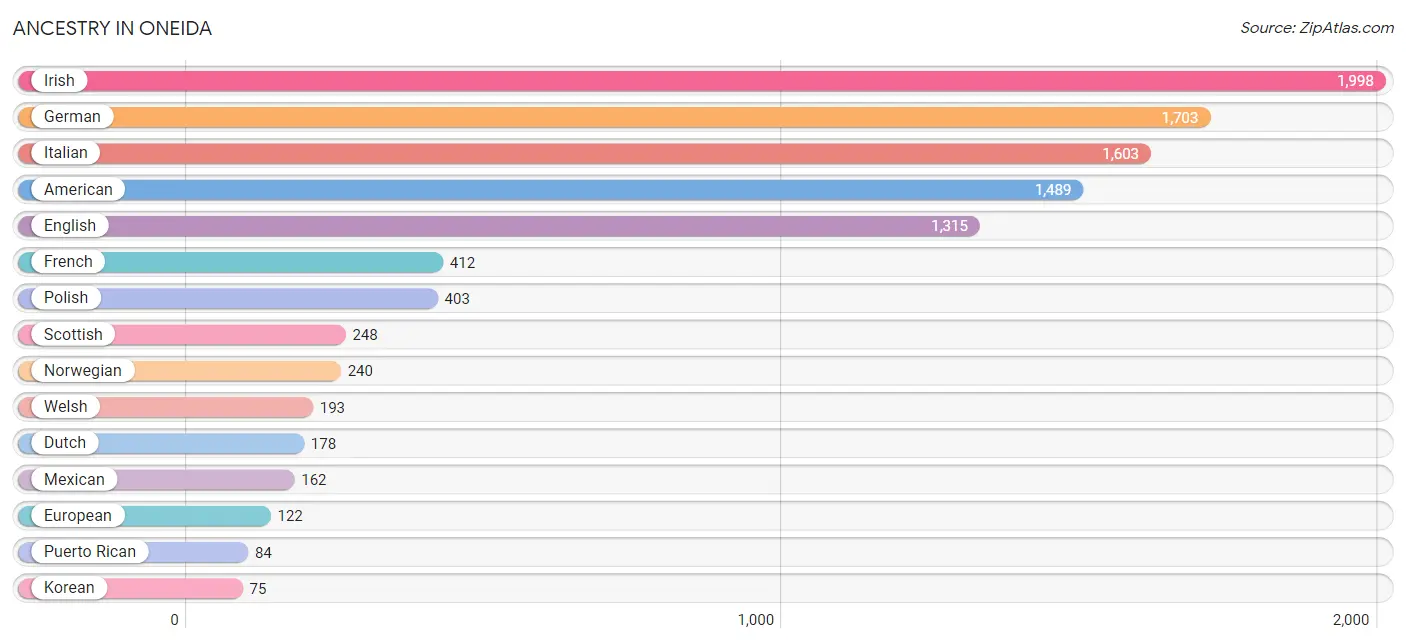
Ancestry in Oneida
The most populous ancestries reported in Oneida are Irish (1,998 | 19.4%), German (1,703 | 16.5%), Italian (1,603 | 15.5%), American (1,489 | 14.4%), and English (1,315 | 12.7%), together accounting for 78.5% of all Oneida residents.
| Ancestry | # Population | % Population |
| American | 1,489 | 14.4% |
| Arab | 25 | 0.2% |
| Armenian | 8 | 0.1% |
| Austrian | 4 | 0.0% |
| Belgian | 7 | 0.1% |
| British | 41 | 0.4% |
| Canadian | 21 | 0.2% |
| Central American | 1 | 0.0% |
| Cree | 9 | 0.1% |
| Czech | 19 | 0.2% |
| Danish | 55 | 0.5% |
| Dominican | 5 | 0.1% |
| Dutch | 178 | 1.7% |
| Eastern European | 9 | 0.1% |
| English | 1,315 | 12.7% |
| European | 122 | 1.2% |
| Finnish | 4 | 0.0% |
| French | 412 | 4.0% |
| French Canadian | 68 | 0.7% |
| German | 1,703 | 16.5% |
| Greek | 20 | 0.2% |
| Haitian | 33 | 0.3% |
| Honduran | 1 | 0.0% |
| Hungarian | 71 | 0.7% |
| Indian (Asian) | 42 | 0.4% |
| Irish | 1,998 | 19.4% |
| Iroquois | 45 | 0.4% |
| Italian | 1,603 | 15.5% |
| Jamaican | 24 | 0.2% |
| Korean | 75 | 0.7% |
| Lebanese | 9 | 0.1% |
| Mexican | 162 | 1.6% |
| Nigerian | 8 | 0.1% |
| Norwegian | 240 | 2.3% |
| Paiute | 2 | 0.0% |
| Pakistani | 12 | 0.1% |
| Polish | 403 | 3.9% |
| Pueblo | 6 | 0.1% |
| Puerto Rican | 84 | 0.8% |
| Romanian | 21 | 0.2% |
| Russian | 72 | 0.7% |
| Scandinavian | 13 | 0.1% |
| Scotch-Irish | 11 | 0.1% |
| Scottish | 248 | 2.4% |
| South American | 13 | 0.1% |
| Sri Lankan | 10 | 0.1% |
| Subsaharan African | 8 | 0.1% |
| Swedish | 29 | 0.3% |
| Swiss | 39 | 0.4% |
| Syrian | 4 | 0.0% |
| Ukrainian | 7 | 0.1% |
| Venezuelan | 13 | 0.1% |
| Welsh | 193 | 1.9% |
| Yugoslavian | 7 | 0.1% | View All 54 Rows |
Immigrants in Oneida
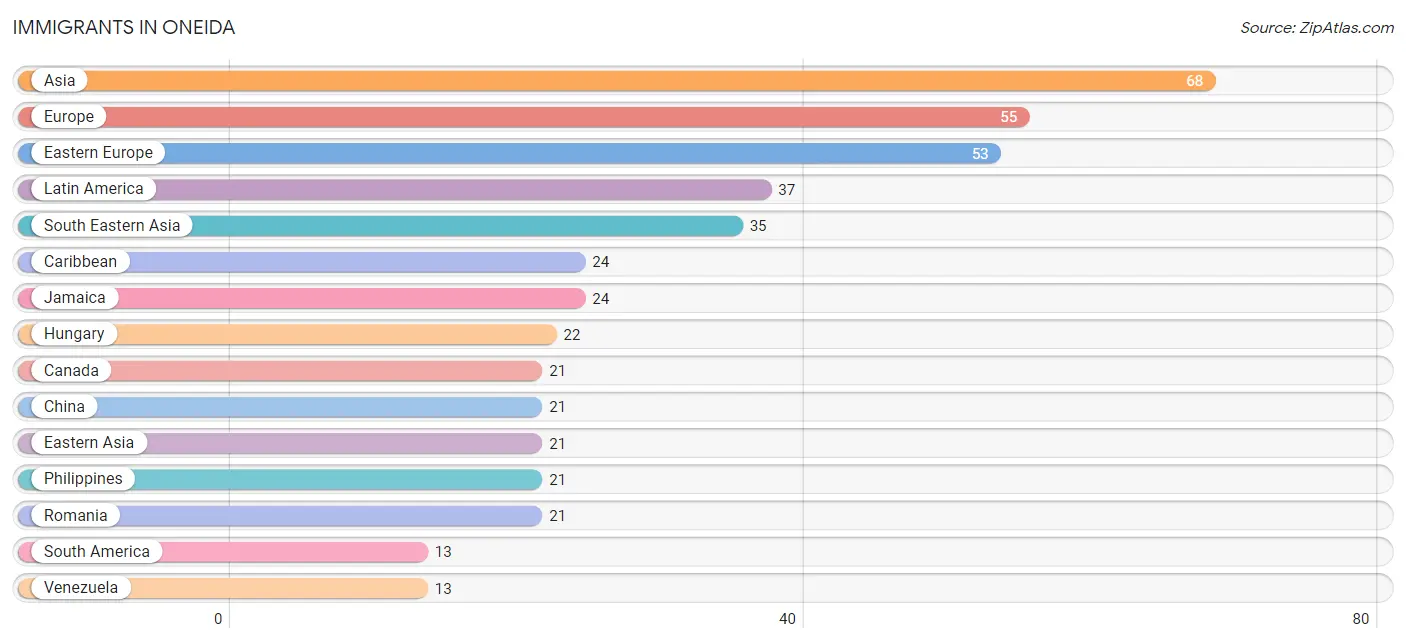
The most numerous immigrant groups reported in Oneida came from Asia (68 | 0.7%), Europe (55 | 0.5%), Eastern Europe (53 | 0.5%), Latin America (37 | 0.4%), and South Eastern Asia (35 | 0.3%), together accounting for 2.4% of all Oneida residents.
| Immigration Origin | # Population | % Population |
| Asia | 68 | 0.7% |
| Bosnia and Herzegovina | 7 | 0.1% |
| Canada | 21 | 0.2% |
| Caribbean | 24 | 0.2% |
| China | 21 | 0.2% |
| Eastern Asia | 21 | 0.2% |
| Eastern Europe | 53 | 0.5% |
| Europe | 55 | 0.5% |
| Germany | 2 | 0.0% |
| Hong Kong | 9 | 0.1% |
| Hungary | 22 | 0.2% |
| Indonesia | 4 | 0.0% |
| Jamaica | 24 | 0.2% |
| Jordan | 12 | 0.1% |
| Latin America | 37 | 0.4% |
| Philippines | 21 | 0.2% |
| Poland | 3 | 0.0% |
| Romania | 21 | 0.2% |
| South America | 13 | 0.1% |
| South Eastern Asia | 35 | 0.3% |
| Venezuela | 13 | 0.1% |
| Vietnam | 10 | 0.1% |
| Western Asia | 12 | 0.1% |
| Western Europe | 2 | 0.0% | View All 24 Rows |
Sex and Age in Oneida
Sex and Age in Oneida
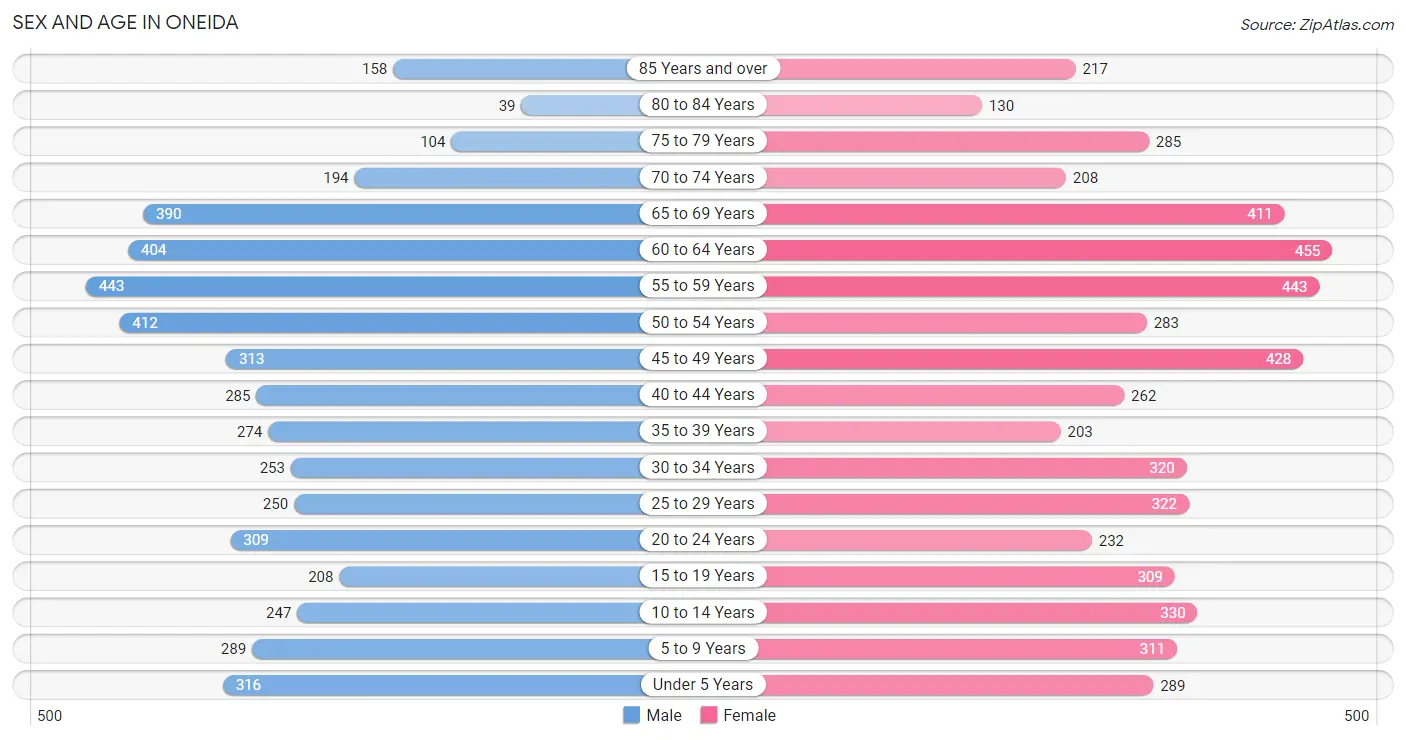
The most populous age groups in Oneida are 55 to 59 Years (443 | 9.1%) for men and 60 to 64 Years (455 | 8.4%) for women.
| Age Bracket | Male | Female |
| Under 5 Years | 316 (6.5%) | 289 (5.3%) |
| 5 to 9 Years | 289 (5.9%) | 311 (5.7%) |
| 10 to 14 Years | 247 (5.1%) | 330 (6.1%) |
| 15 to 19 Years | 208 (4.3%) | 309 (5.7%) |
| 20 to 24 Years | 309 (6.3%) | 232 (4.3%) |
| 25 to 29 Years | 250 (5.1%) | 322 (5.9%) |
| 30 to 34 Years | 253 (5.2%) | 320 (5.9%) |
| 35 to 39 Years | 274 (5.6%) | 203 (3.7%) |
| 40 to 44 Years | 285 (5.8%) | 262 (4.8%) |
| 45 to 49 Years | 313 (6.4%) | 428 (7.9%) |
| 50 to 54 Years | 412 (8.4%) | 283 (5.2%) |
| 55 to 59 Years | 443 (9.1%) | 443 (8.2%) |
| 60 to 64 Years | 404 (8.3%) | 455 (8.4%) |
| 65 to 69 Years | 390 (8.0%) | 411 (7.6%) |
| 70 to 74 Years | 194 (4.0%) | 208 (3.8%) |
| 75 to 79 Years | 104 (2.1%) | 285 (5.2%) |
| 80 to 84 Years | 39 (0.8%) | 130 (2.4%) |
| 85 Years and over | 158 (3.2%) | 217 (4.0%) |
| Total | 4,888 (100.0%) | 5,438 (100.0%) |
Families and Households in Oneida
Median Family Size in Oneida
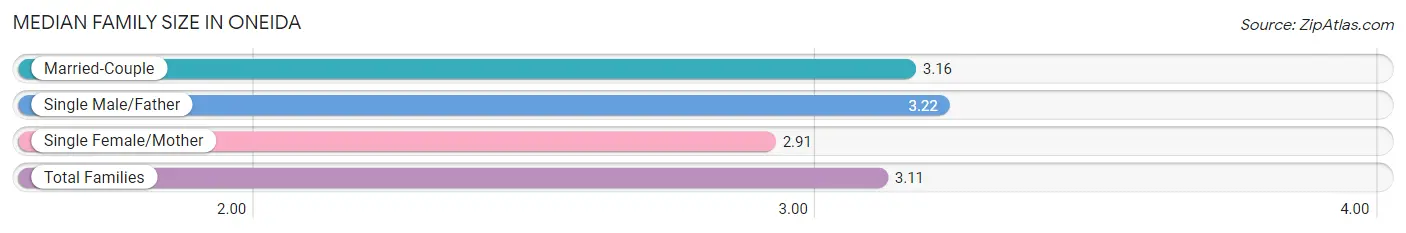
The median family size in Oneida is 3.11 persons per family, with single male/father families (127 | 5.4%) accounting for the largest median family size of 3.22 persons per family. On the other hand, single female/mother families (508 | 21.6%) represent the smallest median family size with 2.91 persons per family.
| Family Type | # Families | Family Size |
| Married-Couple | 1,712 (72.9%) | 3.16 |
| Single Male/Father | 127 (5.4%) | 3.22 |
| Single Female/Mother | 508 (21.6%) | 2.91 |
| Total Families | 2,347 (100.0%) | 3.11 |
Median Household Size in Oneida
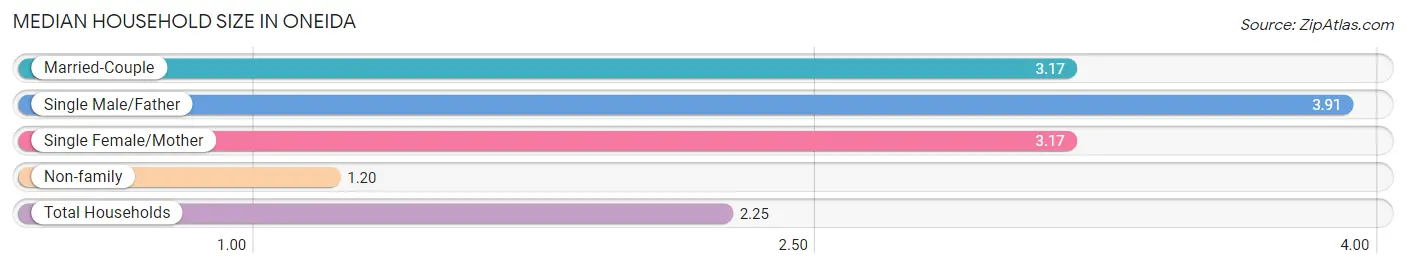
The median household size in Oneida is 2.25 persons per household, with single male/father households (127 | 2.8%) accounting for the largest median household size of 3.91 persons per household. non-family households (2,174 | 48.1%) represent the smallest median household size with 1.20 persons per household.
| Household Type | # Households | Household Size |
| Married-Couple | 1,712 (37.9%) | 3.17 |
| Single Male/Father | 127 (2.8%) | 3.91 |
| Single Female/Mother | 508 (11.2%) | 3.17 |
| Non-family | 2,174 (48.1%) | 1.20 |
| Total Households | 4,521 (100.0%) | 2.25 |
Household Size by Marriage Status in Oneida
Out of a total of 4,521 households in Oneida, 2,347 (51.9%) are family households, while 2,174 (48.1%) are nonfamily households. The most numerous type of family households are 2-person households, comprising 1,012, and the most common type of nonfamily households are 1-person households, comprising 1,813.
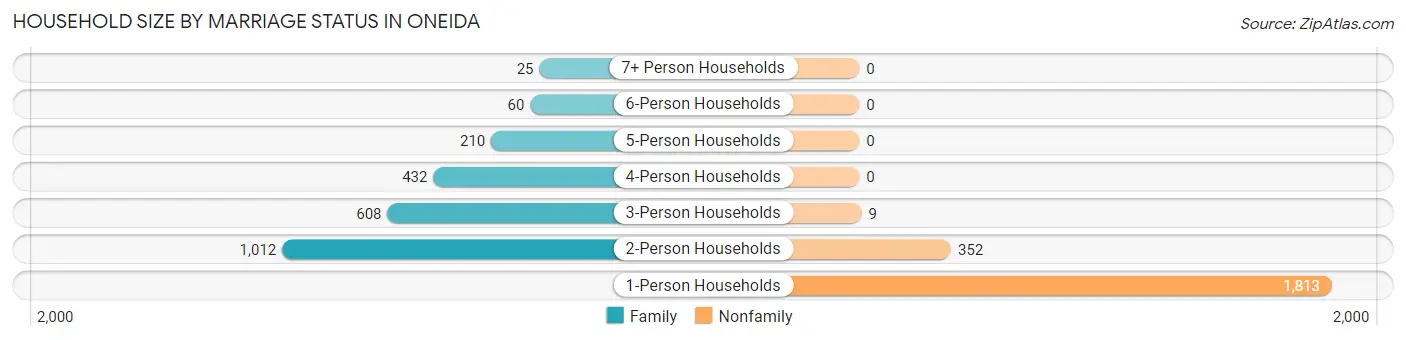
| Household Size | Family Households | Nonfamily Households |
| 1-Person Households | - | 1,813 (40.1%) |
| 2-Person Households | 1,012 (22.4%) | 352 (7.8%) |
| 3-Person Households | 608 (13.5%) | 9 (0.2%) |
| 4-Person Households | 432 (9.6%) | 0 (0.0%) |
| 5-Person Households | 210 (4.6%) | 0 (0.0%) |
| 6-Person Households | 60 (1.3%) | 0 (0.0%) |
| 7+ Person Households | 25 (0.5%) | 0 (0.0%) |
| Total | 2,347 (51.9%) | 2,174 (48.1%) |
Female Fertility in Oneida
Fertility by Age in Oneida
Average fertility rate in Oneida is 70.0 births per 1,000 women. Women in the age bracket of 35 to 50 years have the highest fertility rate with 97.0 births per 1,000 women. Women in the age bracket of 35 to 50 years acount for 62.2% of all women with births.
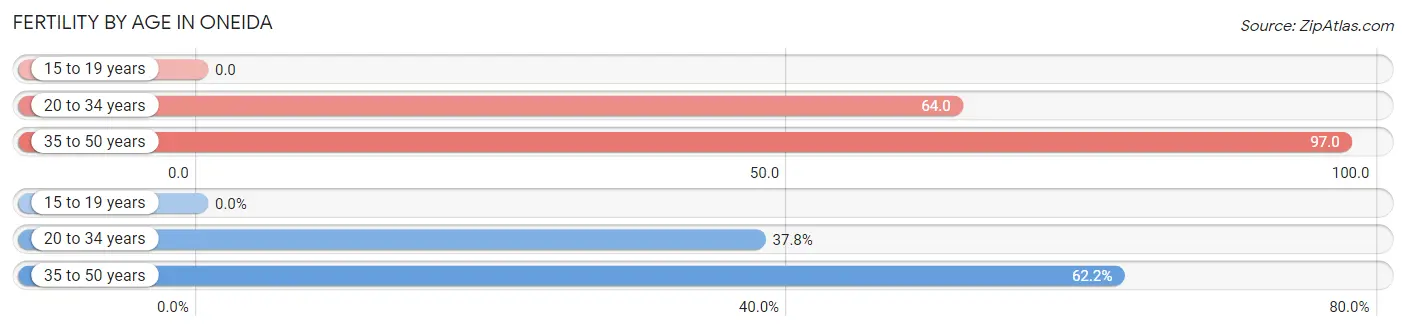
| Age Bracket | Women with Births | Births / 1,000 Women |
| 15 to 19 years | 0 (0.0%) | 0.0 |
| 20 to 34 years | 56 (37.8%) | 64.0 |
| 35 to 50 years | 92 (62.2%) | 97.0 |
| Total | 148 (100.0%) | 70.0 |
Fertility by Age by Marriage Status in Oneida
68.9% of women with births (148) in Oneida are married. The highest percentage of unmarried women with births falls into 35 to 50 years age bracket with 31.5% of them unmarried at the time of birth, while the lowest percentage of unmarried women with births belong to 20 to 34 years age bracket with 30.4% of them unmarried.
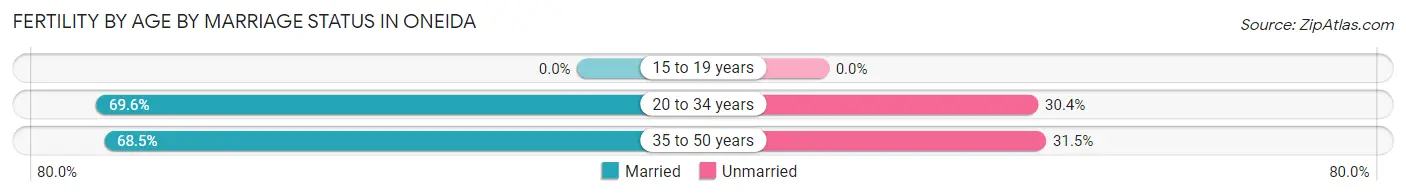
| Age Bracket | Married | Unmarried |
| 15 to 19 years | 0 (0.0%) | 0 (0.0%) |
| 20 to 34 years | 39 (69.6%) | 17 (30.4%) |
| 35 to 50 years | 63 (68.5%) | 29 (31.5%) |
| Total | 102 (68.9%) | 46 (31.1%) |
Fertility by Education in Oneida
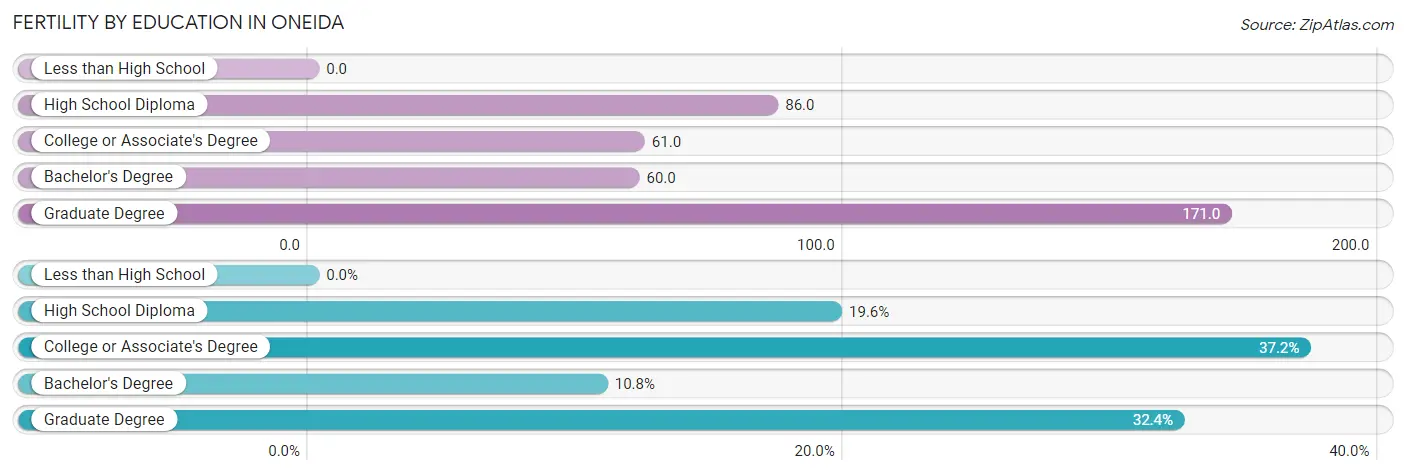
| Educational Attainment | Women with Births | Births / 1,000 Women |
| Less than High School | 0 (0.0%) | 0.0 |
| High School Diploma | 29 (19.6%) | 86.0 |
| College or Associate's Degree | 55 (37.2%) | 61.0 |
| Bachelor's Degree | 16 (10.8%) | 60.0 |
| Graduate Degree | 48 (32.4%) | 171.0 |
| Total | 148 (100.0%) | 70.0 |
Fertility by Education by Marriage Status in Oneida
31.1% of women with births in Oneida are unmarried. Women with the educational attainment of bachelor's degree are most likely to be married with 100.0% of them married at childbirth, while women with the educational attainment of high school diploma are least likely to be married with 100.0% of them unmarried at childbirth.
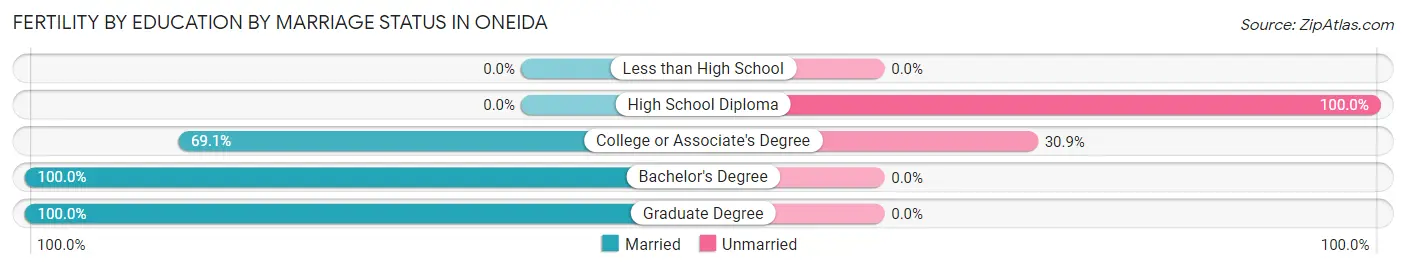
| Educational Attainment | Married | Unmarried |
| Less than High School | 0 (0.0%) | 0 (0.0%) |
| High School Diploma | 0 (0.0%) | 29 (100.0%) |
| College or Associate's Degree | 38 (69.1%) | 17 (30.9%) |
| Bachelor's Degree | 16 (100.0%) | 0 (0.0%) |
| Graduate Degree | 48 (100.0%) | 0 (0.0%) |
| Total | 102 (68.9%) | 46 (31.1%) |
Employment Characteristics in Oneida
Employment by Class of Employer in Oneida
Among the 4,967 employed individuals in Oneida, private company employees (3,033 | 61.1%), not-for-profit organizations (786 | 15.8%), and local government employees (417 | 8.4%) make up the most common classes of employment.
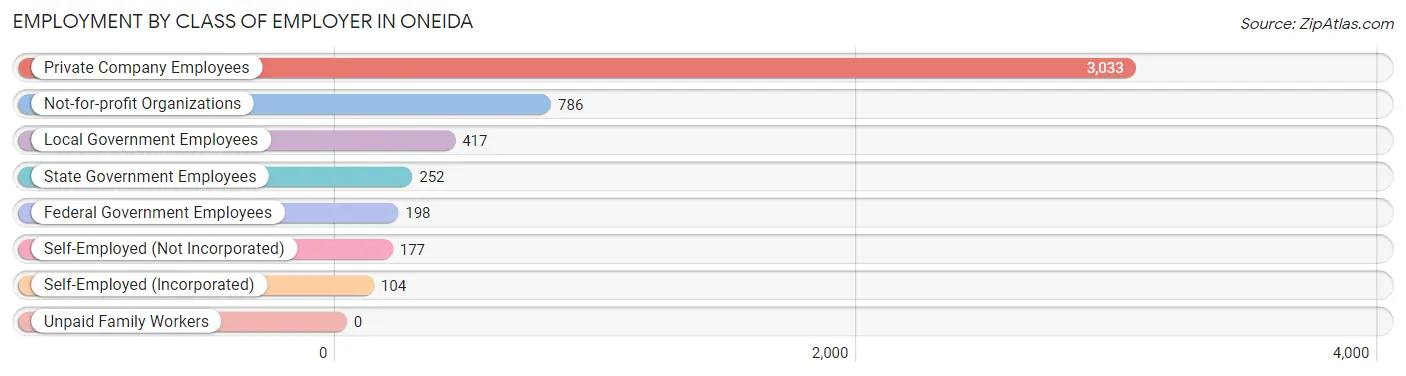
| Employer Class | # Employees | % Employees |
| Private Company Employees | 3,033 | 61.1% |
| Self-Employed (Incorporated) | 104 | 2.1% |
| Self-Employed (Not Incorporated) | 177 | 3.6% |
| Not-for-profit Organizations | 786 | 15.8% |
| Local Government Employees | 417 | 8.4% |
| State Government Employees | 252 | 5.1% |
| Federal Government Employees | 198 | 4.0% |
| Unpaid Family Workers | 0 | 0.0% |
| Total | 4,967 | 100.0% |
Employment Status by Age in Oneida
According to the labor force statistics for Oneida, out of the total population over 16 years of age (8,479), 61.6% or 5,223 individuals are in the labor force, with 3.0% or 157 of them unemployed. The age group with the highest labor force participation rate is 25 to 29 years, with 96.7% or 553 individuals in the labor force. Within the labor force, the 45 to 54 years age range has the highest percentage of unemployed individuals, with 7.1% or 86 of them being unemployed.
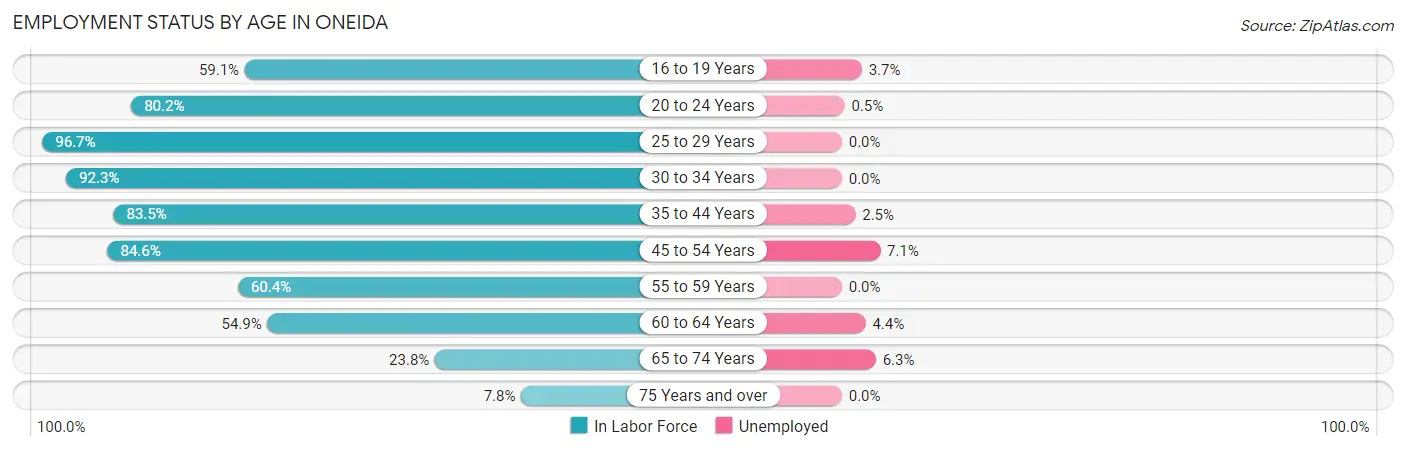
| Age Bracket | In Labor Force | Unemployed |
| 16 to 19 Years | 267 (59.1%) | 10 (3.7%) |
| 20 to 24 Years | 434 (80.2%) | 2 (0.5%) |
| 25 to 29 Years | 553 (96.7%) | 0 (0.0%) |
| 30 to 34 Years | 529 (92.3%) | 0 (0.0%) |
| 35 to 44 Years | 855 (83.5%) | 21 (2.5%) |
| 45 to 54 Years | 1,215 (84.6%) | 86 (7.1%) |
| 55 to 59 Years | 535 (60.4%) | 0 (0.0%) |
| 60 to 64 Years | 472 (54.9%) | 21 (4.4%) |
| 65 to 74 Years | 286 (23.8%) | 18 (6.3%) |
| 75 Years and over | 73 (7.8%) | 0 (0.0%) |
| Total | 5,223 (61.6%) | 157 (3.0%) |
Employment Status by Educational Attainment in Oneida
According to labor force statistics for Oneida, 77.7% of individuals (4,157) out of the total population between 25 and 64 years of age (5,350) are in the labor force, with 3.1% or 129 of them being unemployed. The group with the highest labor force participation rate are those with the educational attainment of bachelor's degree or higher, with 85.2% or 1,195 individuals in the labor force. Within the labor force, individuals with less than high school education have the highest percentage of unemployment, with 21.1% or 48 of them being unemployed.
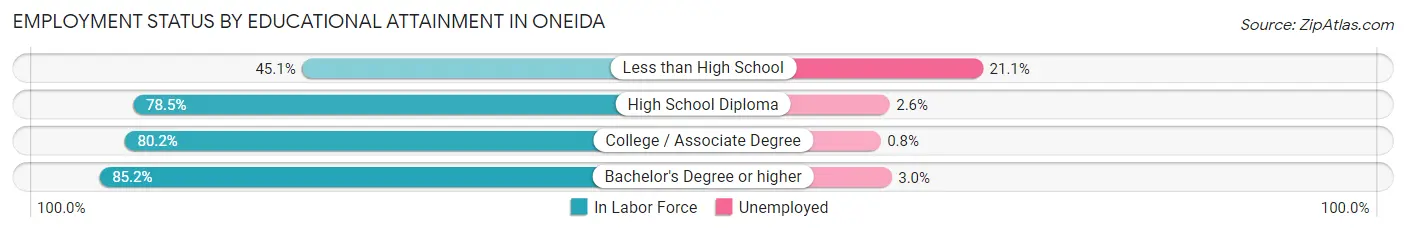
| Educational Attainment | In Labor Force | Unemployed |
| Less than High School | 227 (45.1%) | 106 (21.1%) |
| High School Diploma | 1,236 (78.5%) | 41 (2.6%) |
| College / Associate Degree | 1,501 (80.2%) | 15 (0.8%) |
| Bachelor's Degree or higher | 1,195 (85.2%) | 42 (3.0%) |
| Total | 4,157 (77.7%) | 166 (3.1%) |
Employment Occupations by Sex in Oneida
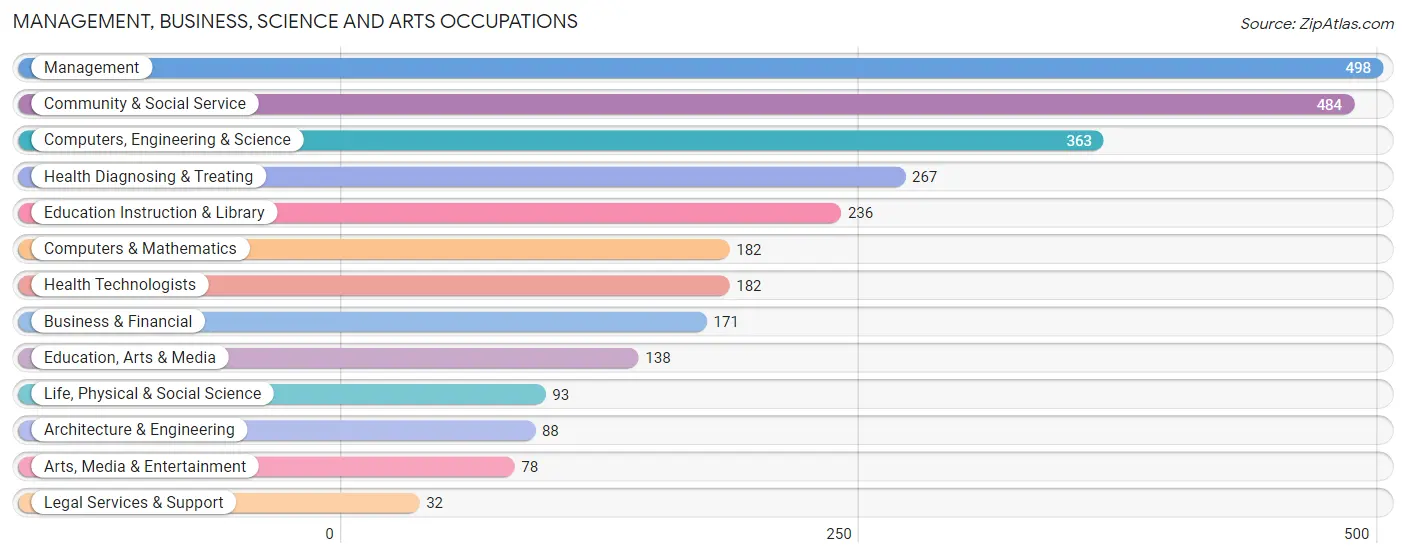
Management, Business, Science and Arts Occupations
The most common Management, Business, Science and Arts occupations in Oneida are Management (498 | 9.9%), Community & Social Service (484 | 9.6%), Computers, Engineering & Science (363 | 7.2%), Health Diagnosing & Treating (267 | 5.3%), and Education Instruction & Library (236 | 4.7%).
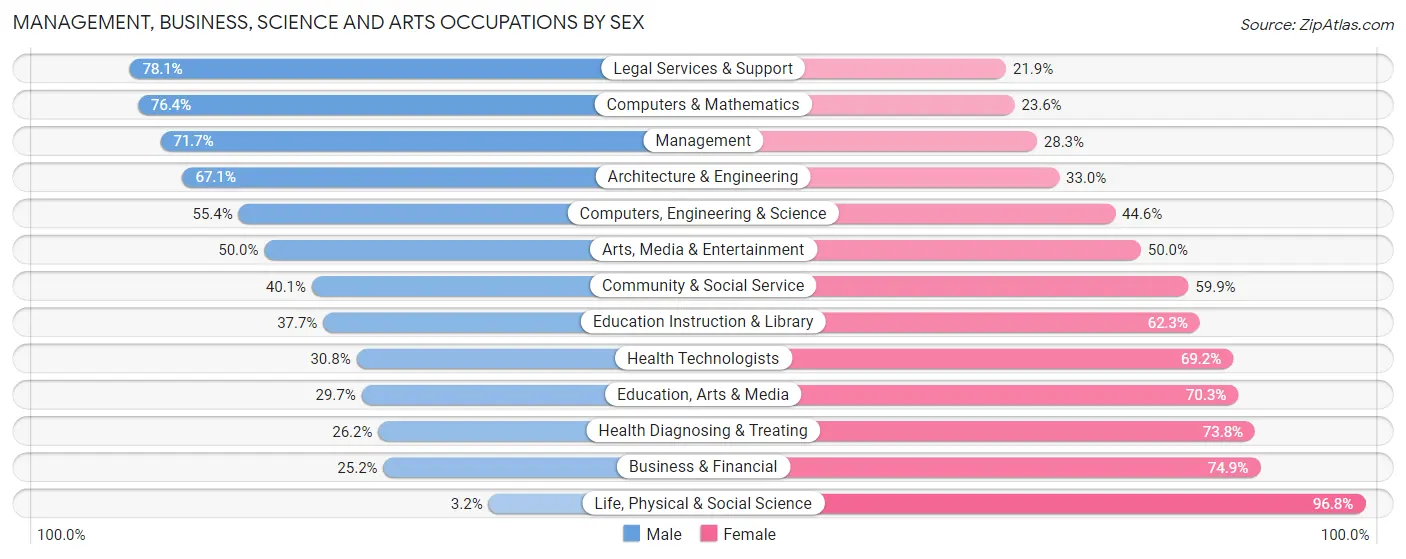
Management, Business, Science and Arts Occupations by Sex
Within the Management, Business, Science and Arts occupations in Oneida, the most male-oriented occupations are Legal Services & Support (78.1%), Computers & Mathematics (76.4%), and Management (71.7%), while the most female-oriented occupations are Life, Physical & Social Science (96.8%), Business & Financial (74.9%), and Health Diagnosing & Treating (73.8%).
| Occupation | Male | Female |
| Management | 357 (71.7%) | 141 (28.3%) |
| Business & Financial | 43 (25.2%) | 128 (74.9%) |
| Computers, Engineering & Science | 201 (55.4%) | 162 (44.6%) |
| Computers & Mathematics | 139 (76.4%) | 43 (23.6%) |
| Architecture & Engineering | 59 (67.0%) | 29 (33.0%) |
| Life, Physical & Social Science | 3 (3.2%) | 90 (96.8%) |
| Community & Social Service | 194 (40.1%) | 290 (59.9%) |
| Education, Arts & Media | 41 (29.7%) | 97 (70.3%) |
| Legal Services & Support | 25 (78.1%) | 7 (21.9%) |
| Education Instruction & Library | 89 (37.7%) | 147 (62.3%) |
| Arts, Media & Entertainment | 39 (50.0%) | 39 (50.0%) |
| Health Diagnosing & Treating | 70 (26.2%) | 197 (73.8%) |
| Health Technologists | 56 (30.8%) | 126 (69.2%) |
| Total (Category) | 865 (48.5%) | 918 (51.5%) |
| Total (Overall) | 2,452 (48.6%) | 2,592 (51.4%) |
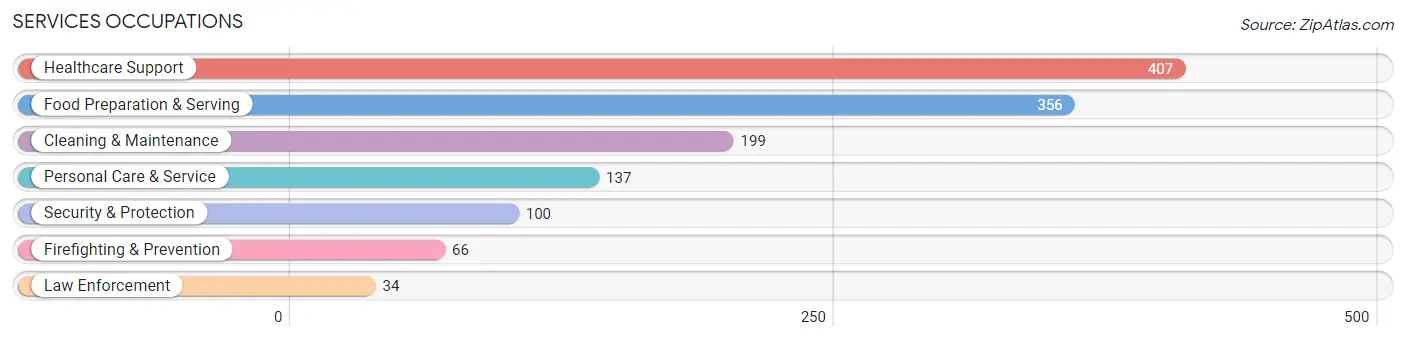
Services Occupations
The most common Services occupations in Oneida are Healthcare Support (407 | 8.1%), Food Preparation & Serving (356 | 7.1%), Cleaning & Maintenance (199 | 4.0%), Personal Care & Service (137 | 2.7%), and Security & Protection (100 | 2.0%).
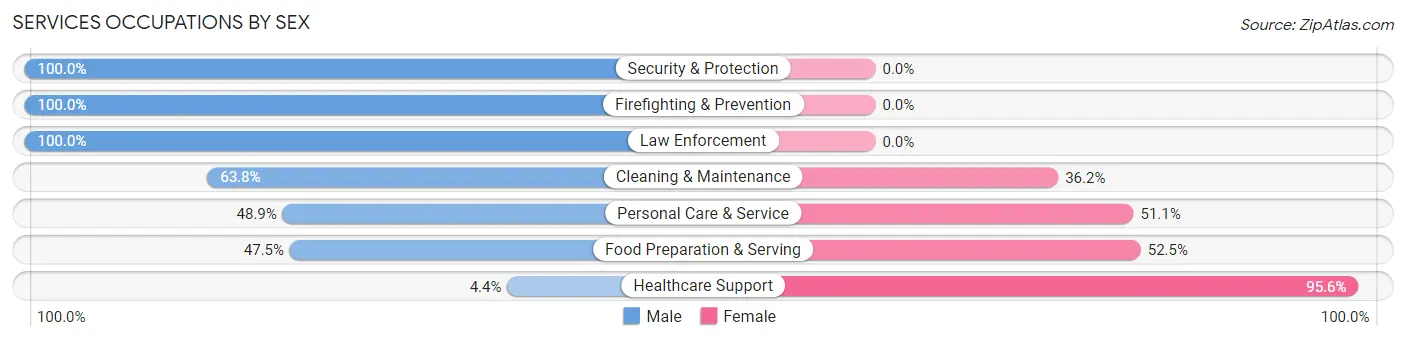
Services Occupations by Sex
Within the Services occupations in Oneida, the most male-oriented occupations are Security & Protection (100.0%), Firefighting & Prevention (100.0%), and Law Enforcement (100.0%), while the most female-oriented occupations are Healthcare Support (95.6%), Food Preparation & Serving (52.5%), and Personal Care & Service (51.1%).
| Occupation | Male | Female |
| Healthcare Support | 18 (4.4%) | 389 (95.6%) |
| Security & Protection | 100 (100.0%) | 0 (0.0%) |
| Firefighting & Prevention | 66 (100.0%) | 0 (0.0%) |
| Law Enforcement | 34 (100.0%) | 0 (0.0%) |
| Food Preparation & Serving | 169 (47.5%) | 187 (52.5%) |
| Cleaning & Maintenance | 127 (63.8%) | 72 (36.2%) |
| Personal Care & Service | 67 (48.9%) | 70 (51.1%) |
| Total (Category) | 481 (40.1%) | 718 (59.9%) |
| Total (Overall) | 2,452 (48.6%) | 2,592 (51.4%) |
Sales and Office Occupations
The most common Sales and Office occupations in Oneida are Office & Administration (524 | 10.4%), and Sales & Related (519 | 10.3%).
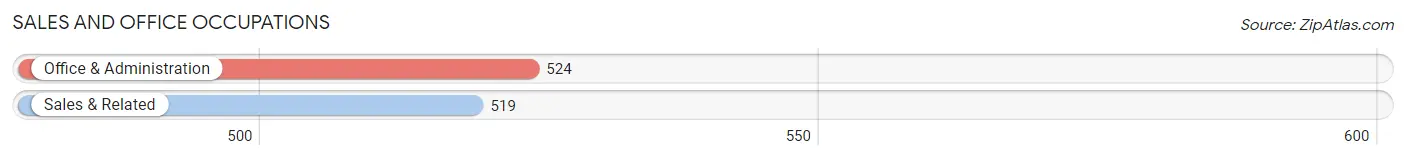
Sales and Office Occupations by Sex
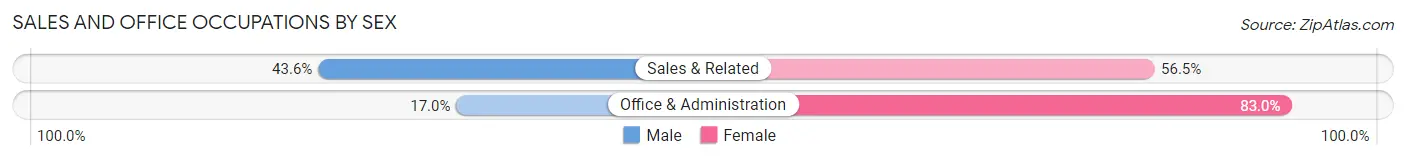
| Occupation | Male | Female |
| Sales & Related | 226 (43.5%) | 293 (56.5%) |
| Office & Administration | 89 (17.0%) | 435 (83.0%) |
| Total (Category) | 315 (30.2%) | 728 (69.8%) |
| Total (Overall) | 2,452 (48.6%) | 2,592 (51.4%) |
Natural Resources, Construction and Maintenance Occupations
The most common Natural Resources, Construction and Maintenance occupations in Oneida are Installation, Maintenance & Repair (175 | 3.5%), Construction & Extraction (172 | 3.4%), and Farming, Fishing & Forestry (48 | 0.9%).
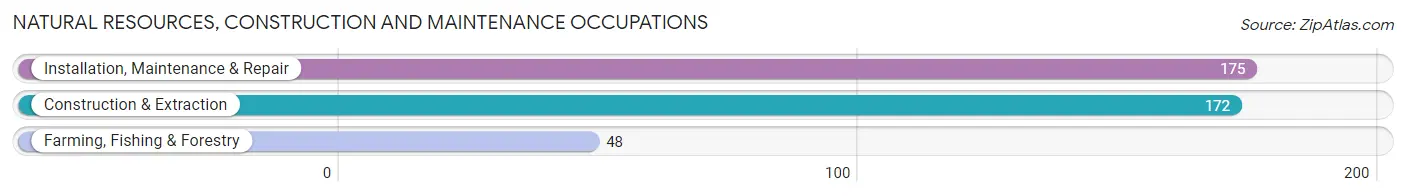
Natural Resources, Construction and Maintenance Occupations by Sex
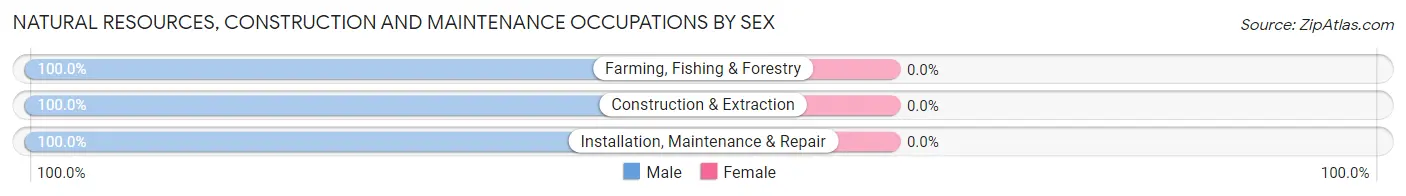
| Occupation | Male | Female |
| Farming, Fishing & Forestry | 48 (100.0%) | 0 (0.0%) |
| Construction & Extraction | 172 (100.0%) | 0 (0.0%) |
| Installation, Maintenance & Repair | 175 (100.0%) | 0 (0.0%) |
| Total (Category) | 395 (100.0%) | 0 (0.0%) |
| Total (Overall) | 2,452 (48.6%) | 2,592 (51.4%) |
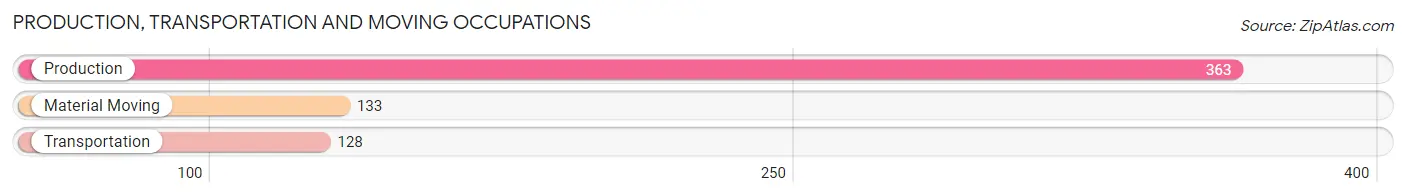
Production, Transportation and Moving Occupations
The most common Production, Transportation and Moving occupations in Oneida are Production (363 | 7.2%), Material Moving (133 | 2.6%), and Transportation (128 | 2.5%).
Production, Transportation and Moving Occupations by Sex
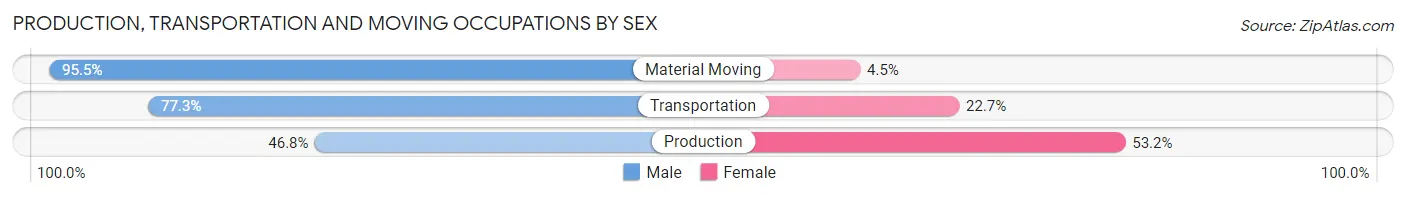
| Occupation | Male | Female |
| Production | 170 (46.8%) | 193 (53.2%) |
| Transportation | 99 (77.3%) | 29 (22.7%) |
| Material Moving | 127 (95.5%) | 6 (4.5%) |
| Total (Category) | 396 (63.5%) | 228 (36.5%) |
| Total (Overall) | 2,452 (48.6%) | 2,592 (51.4%) |
Employment Industries by Sex in Oneida
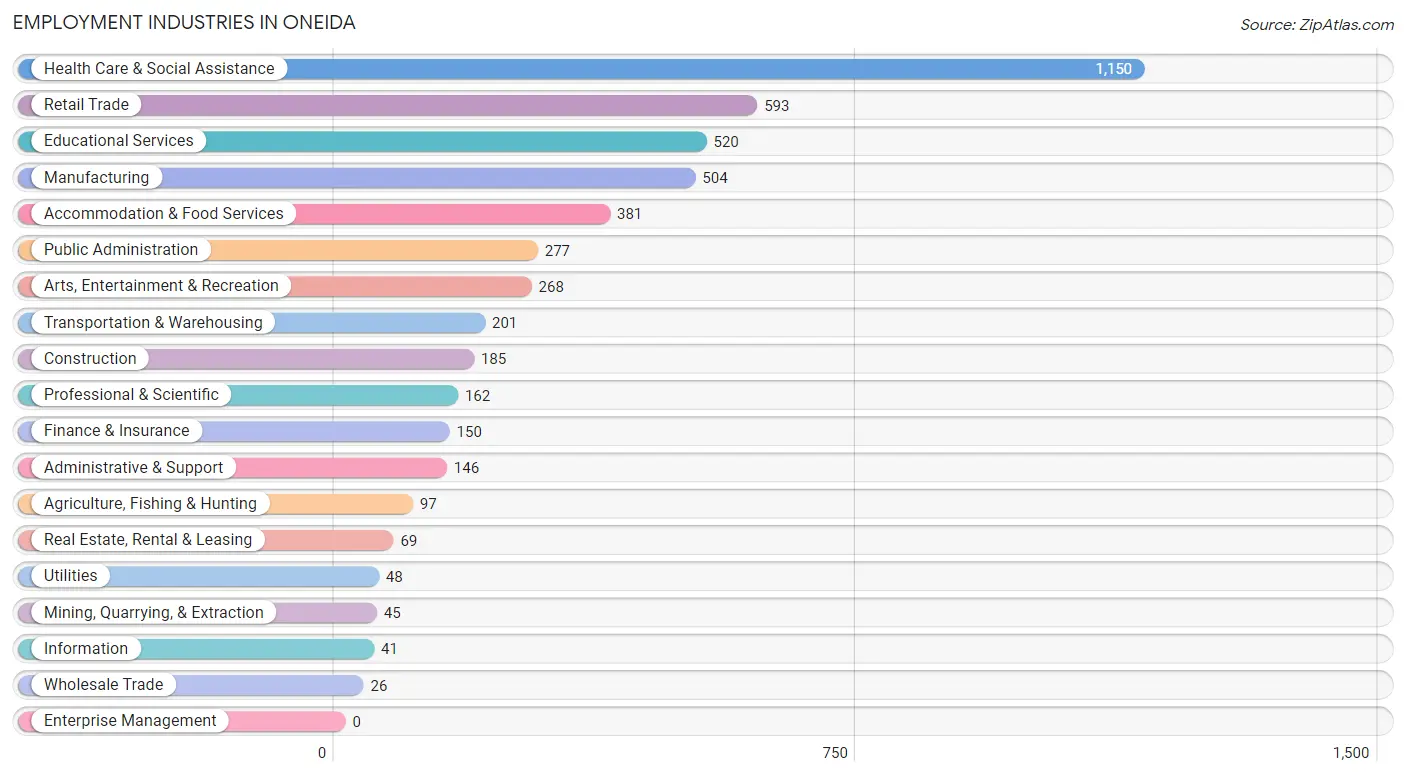
Employment Industries in Oneida
The major employment industries in Oneida include Health Care & Social Assistance (1,150 | 22.8%), Retail Trade (593 | 11.8%), Educational Services (520 | 10.3%), Manufacturing (504 | 10.0%), and Accommodation & Food Services (381 | 7.5%).
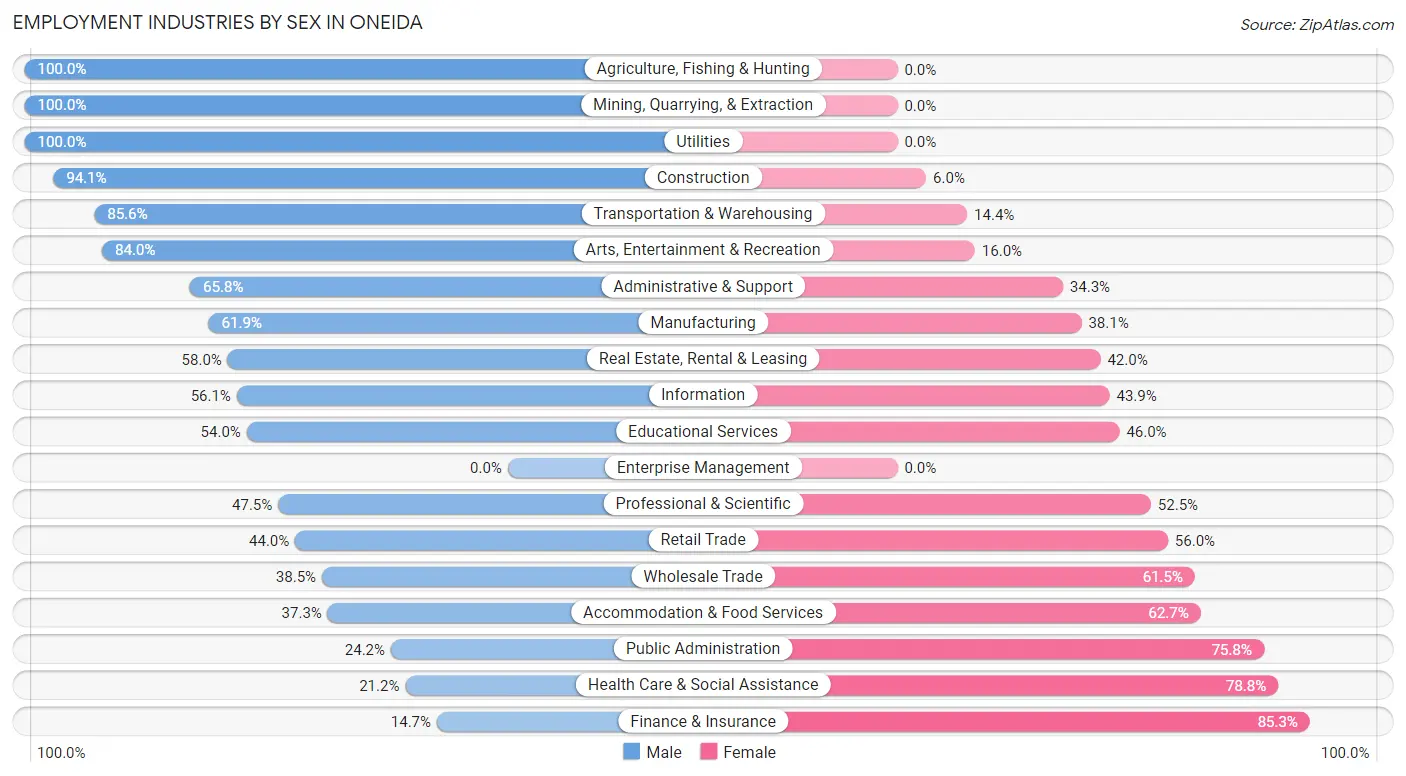
Employment Industries by Sex in Oneida
The Oneida industries that see more men than women are Agriculture, Fishing & Hunting (100.0%), Mining, Quarrying, & Extraction (100.0%), and Utilities (100.0%), whereas the industries that tend to have a higher number of women are Finance & Insurance (85.3%), Health Care & Social Assistance (78.8%), and Public Administration (75.8%).
| Industry | Male | Female |
| Agriculture, Fishing & Hunting | 97 (100.0%) | 0 (0.0%) |
| Mining, Quarrying, & Extraction | 45 (100.0%) | 0 (0.0%) |
| Construction | 174 (94.1%) | 11 (5.9%) |
| Manufacturing | 312 (61.9%) | 192 (38.1%) |
| Wholesale Trade | 10 (38.5%) | 16 (61.5%) |
| Retail Trade | 261 (44.0%) | 332 (56.0%) |
| Transportation & Warehousing | 172 (85.6%) | 29 (14.4%) |
| Utilities | 48 (100.0%) | 0 (0.0%) |
| Information | 23 (56.1%) | 18 (43.9%) |
| Finance & Insurance | 22 (14.7%) | 128 (85.3%) |
| Real Estate, Rental & Leasing | 40 (58.0%) | 29 (42.0%) |
| Professional & Scientific | 77 (47.5%) | 85 (52.5%) |
| Enterprise Management | 0 (0.0%) | 0 (0.0%) |
| Administrative & Support | 96 (65.7%) | 50 (34.3%) |
| Educational Services | 281 (54.0%) | 239 (46.0%) |
| Health Care & Social Assistance | 244 (21.2%) | 906 (78.8%) |
| Arts, Entertainment & Recreation | 225 (84.0%) | 43 (16.0%) |
| Accommodation & Food Services | 142 (37.3%) | 239 (62.7%) |
| Public Administration | 67 (24.2%) | 210 (75.8%) |
| Total | 2,452 (48.6%) | 2,592 (51.4%) |
Education in Oneida
School Enrollment in Oneida
The most common levels of schooling among the 2,128 students in Oneida are college / undergraduate (473 | 22.2%), middle school (407 | 19.1%), and high school (401 | 18.8%).
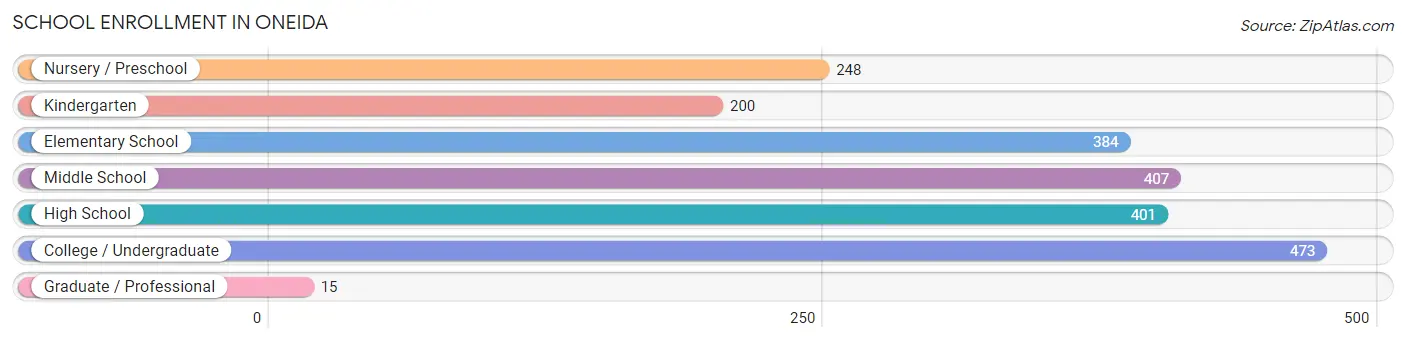
| School Level | # Students | % Students |
| Nursery / Preschool | 248 | 11.7% |
| Kindergarten | 200 | 9.4% |
| Elementary School | 384 | 18.0% |
| Middle School | 407 | 19.1% |
| High School | 401 | 18.8% |
| College / Undergraduate | 473 | 22.2% |
| Graduate / Professional | 15 | 0.7% |
| Total | 2,128 | 100.0% |
School Enrollment by Age by Funding Source in Oneida
Out of a total of 2,128 students who are enrolled in schools in Oneida, 202 (9.5%) attend a private institution, while the remaining 1,926 (90.5%) are enrolled in public schools. The age group of 18 to 19 year olds has the highest likelihood of being enrolled in private schools, with 43 (36.7% in the age bracket) enrolled. Conversely, the age group of 10 to 14 year olds has the lowest likelihood of being enrolled in a private school, with 517 (99.6% in the age bracket) attending a public institution.
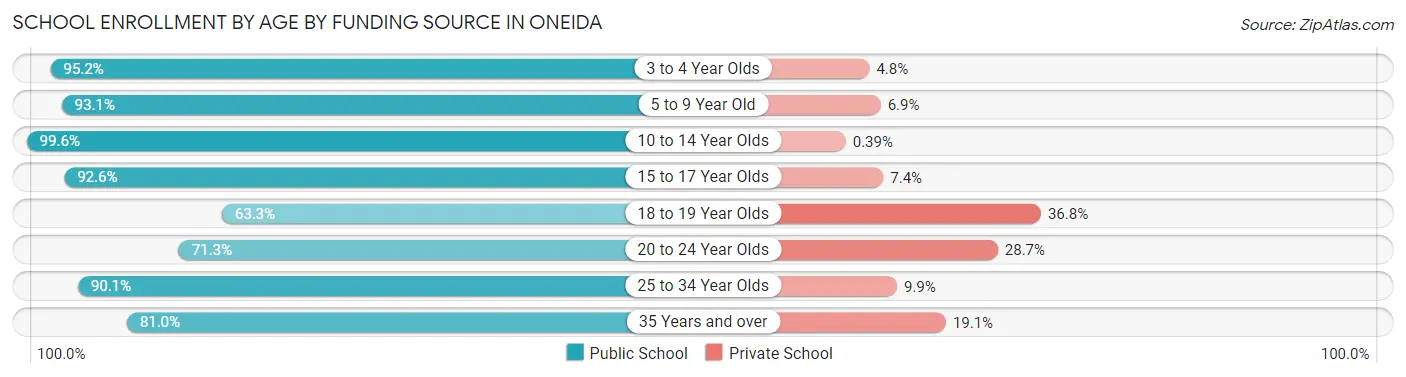
| Age Bracket | Public School | Private School |
| 3 to 4 Year Olds | 198 (95.2%) | 10 (4.8%) |
| 5 to 9 Year Old | 540 (93.1%) | 40 (6.9%) |
| 10 to 14 Year Olds | 517 (99.6%) | 2 (0.4%) |
| 15 to 17 Year Olds | 263 (92.6%) | 21 (7.4%) |
| 18 to 19 Year Olds | 74 (63.2%) | 43 (36.7%) |
| 20 to 24 Year Olds | 139 (71.3%) | 56 (28.7%) |
| 25 to 34 Year Olds | 127 (90.1%) | 14 (9.9%) |
| 35 Years and over | 68 (80.9%) | 16 (19.1%) |
| Total | 1,926 (90.5%) | 202 (9.5%) |
Educational Attainment by Field of Study in Oneida
Education (330 | 15.9%), science & technology (255 | 12.3%), visual & performing arts (250 | 12.1%), psychology (208 | 10.1%), and business (206 | 10.0%) are the most common fields of study among 2,070 individuals in Oneida who have obtained a bachelor's degree or higher.
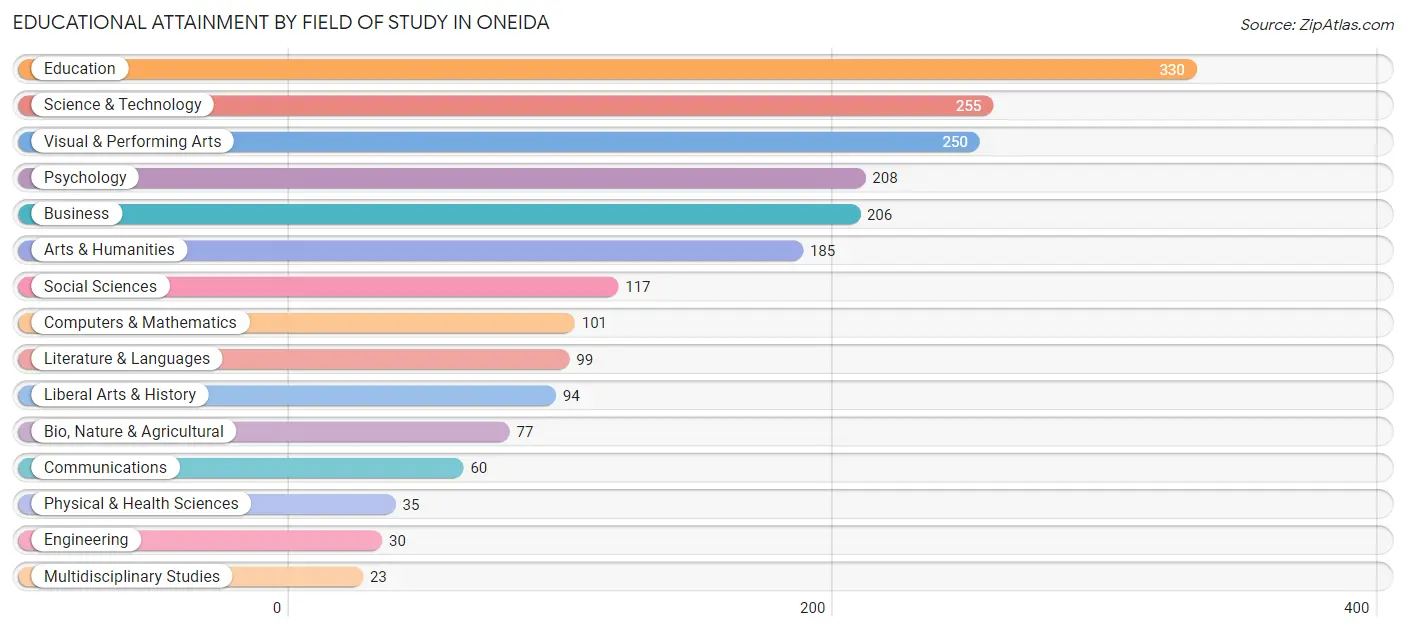
| Field of Study | # Graduates | % Graduates |
| Computers & Mathematics | 101 | 4.9% |
| Bio, Nature & Agricultural | 77 | 3.7% |
| Physical & Health Sciences | 35 | 1.7% |
| Psychology | 208 | 10.1% |
| Social Sciences | 117 | 5.7% |
| Engineering | 30 | 1.5% |
| Multidisciplinary Studies | 23 | 1.1% |
| Science & Technology | 255 | 12.3% |
| Business | 206 | 10.0% |
| Education | 330 | 15.9% |
| Literature & Languages | 99 | 4.8% |
| Liberal Arts & History | 94 | 4.5% |
| Visual & Performing Arts | 250 | 12.1% |
| Communications | 60 | 2.9% |
| Arts & Humanities | 185 | 8.9% |
| Total | 2,070 | 100.0% |
Transportation & Commute in Oneida
Vehicle Availability by Sex in Oneida
The most prevalent vehicle ownership categories in Oneida are males with 2 vehicles (1,106, accounting for 45.2%) and females with 2 vehicles (1,047, making up 44.0%).
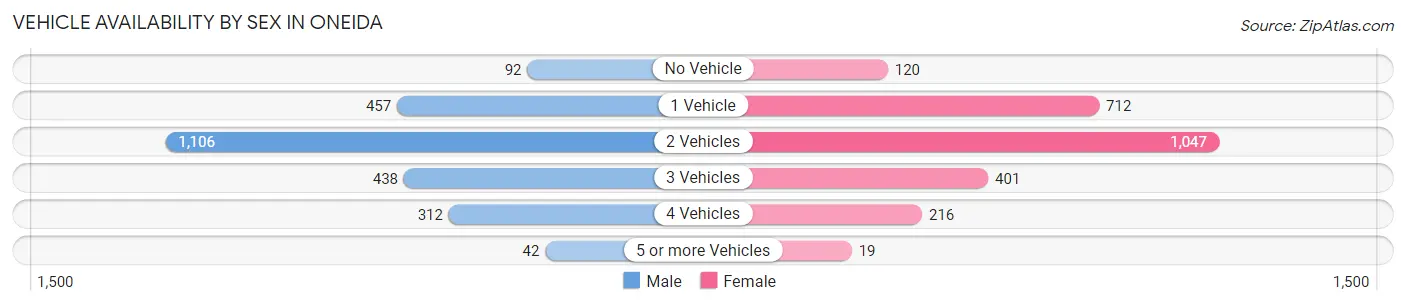
| Vehicles Available | Male | Female |
| No Vehicle | 92 (3.8%) | 120 (4.8%) |
| 1 Vehicle | 457 (18.7%) | 712 (28.3%) |
| 2 Vehicles | 1,106 (45.2%) | 1,047 (41.6%) |
| 3 Vehicles | 438 (17.9%) | 401 (15.9%) |
| 4 Vehicles | 312 (12.8%) | 216 (8.6%) |
| 5 or more Vehicles | 42 (1.7%) | 19 (0.8%) |
| Total | 2,447 (100.0%) | 2,515 (100.0%) |
Commute Time in Oneida
The most frequently occuring commute durations in Oneida are 10 to 14 minutes (917 commuters, 19.2%), 5 to 9 minutes (911 commuters, 19.1%), and 30 to 34 minutes (593 commuters, 12.4%).
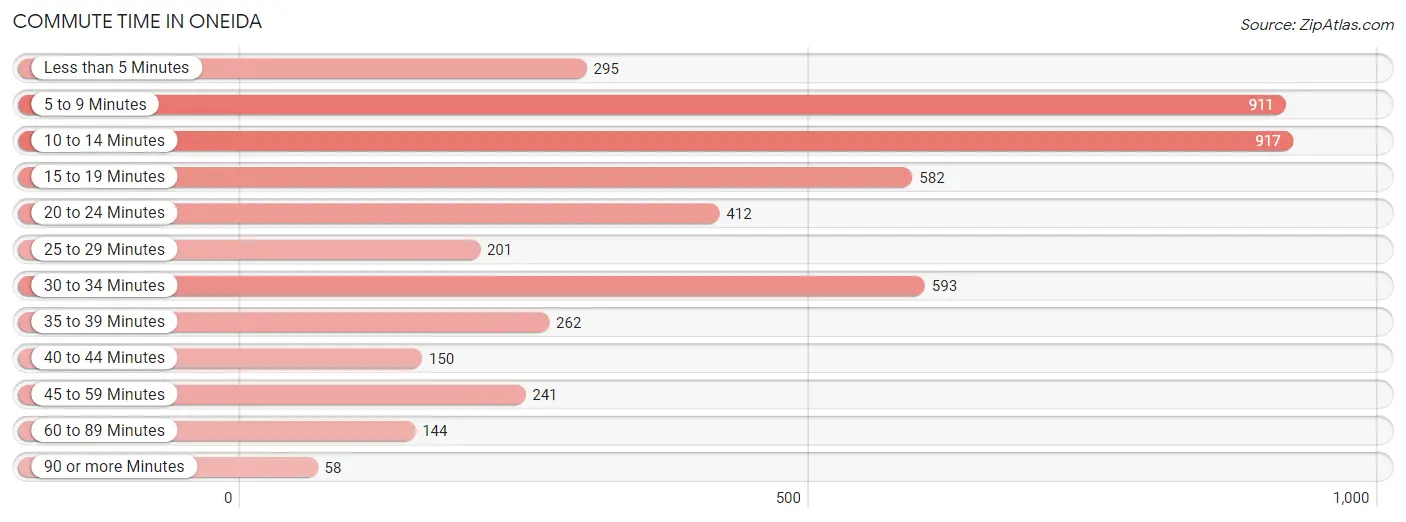
| Commute Time | # Commuters | % Commuters |
| Less than 5 Minutes | 295 | 6.2% |
| 5 to 9 Minutes | 911 | 19.1% |
| 10 to 14 Minutes | 917 | 19.2% |
| 15 to 19 Minutes | 582 | 12.2% |
| 20 to 24 Minutes | 412 | 8.6% |
| 25 to 29 Minutes | 201 | 4.2% |
| 30 to 34 Minutes | 593 | 12.4% |
| 35 to 39 Minutes | 262 | 5.5% |
| 40 to 44 Minutes | 150 | 3.2% |
| 45 to 59 Minutes | 241 | 5.1% |
| 60 to 89 Minutes | 144 | 3.0% |
| 90 or more Minutes | 58 | 1.2% |
Commute Time by Sex in Oneida
The most common commute times in Oneida are 5 to 9 minutes (369 commuters, 15.5%) for males and 10 to 14 minutes (605 commuters, 25.3%) for females.
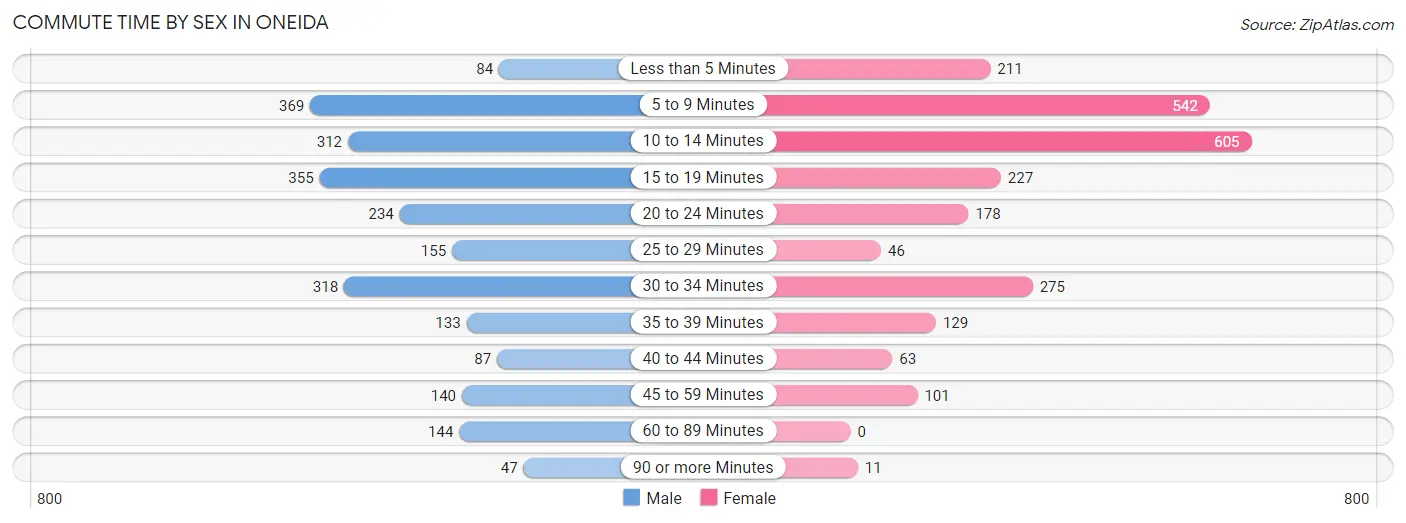
| Commute Time | Male | Female |
| Less than 5 Minutes | 84 (3.5%) | 211 (8.8%) |
| 5 to 9 Minutes | 369 (15.5%) | 542 (22.7%) |
| 10 to 14 Minutes | 312 (13.1%) | 605 (25.3%) |
| 15 to 19 Minutes | 355 (14.9%) | 227 (9.5%) |
| 20 to 24 Minutes | 234 (9.8%) | 178 (7.4%) |
| 25 to 29 Minutes | 155 (6.5%) | 46 (1.9%) |
| 30 to 34 Minutes | 318 (13.4%) | 275 (11.5%) |
| 35 to 39 Minutes | 133 (5.6%) | 129 (5.4%) |
| 40 to 44 Minutes | 87 (3.7%) | 63 (2.6%) |
| 45 to 59 Minutes | 140 (5.9%) | 101 (4.2%) |
| 60 to 89 Minutes | 144 (6.1%) | 0 (0.0%) |
| 90 or more Minutes | 47 (2.0%) | 11 (0.5%) |
Time of Departure to Work by Sex in Oneida
The most frequent times of departure to work in Oneida are 7:30 AM to 7:59 AM (342, 14.4%) for males and 7:30 AM to 7:59 AM (491, 20.6%) for females.
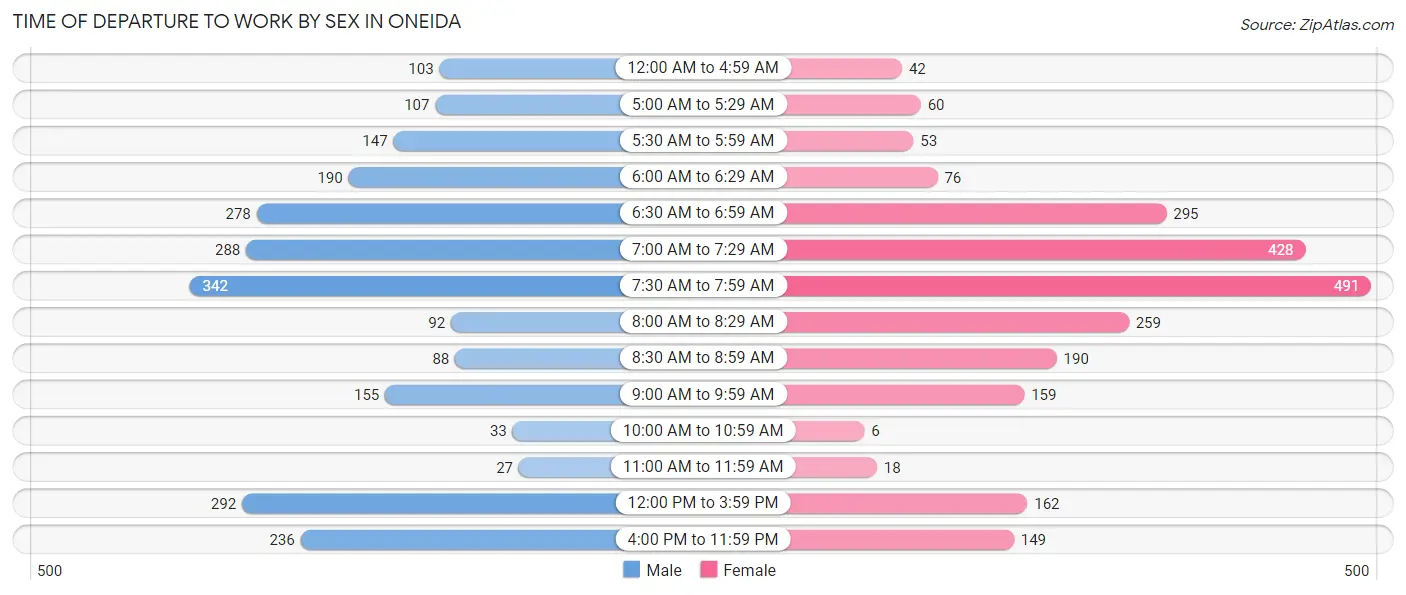
| Time of Departure | Male | Female |
| 12:00 AM to 4:59 AM | 103 (4.3%) | 42 (1.8%) |
| 5:00 AM to 5:29 AM | 107 (4.5%) | 60 (2.5%) |
| 5:30 AM to 5:59 AM | 147 (6.2%) | 53 (2.2%) |
| 6:00 AM to 6:29 AM | 190 (8.0%) | 76 (3.2%) |
| 6:30 AM to 6:59 AM | 278 (11.7%) | 295 (12.3%) |
| 7:00 AM to 7:29 AM | 288 (12.1%) | 428 (17.9%) |
| 7:30 AM to 7:59 AM | 342 (14.4%) | 491 (20.6%) |
| 8:00 AM to 8:29 AM | 92 (3.9%) | 259 (10.8%) |
| 8:30 AM to 8:59 AM | 88 (3.7%) | 190 (8.0%) |
| 9:00 AM to 9:59 AM | 155 (6.5%) | 159 (6.7%) |
| 10:00 AM to 10:59 AM | 33 (1.4%) | 6 (0.3%) |
| 11:00 AM to 11:59 AM | 27 (1.1%) | 18 (0.7%) |
| 12:00 PM to 3:59 PM | 292 (12.3%) | 162 (6.8%) |
| 4:00 PM to 11:59 PM | 236 (9.9%) | 149 (6.2%) |
| Total | 2,378 (100.0%) | 2,388 (100.0%) |
Housing Occupancy in Oneida
Occupancy by Ownership in Oneida
Of the total 4,521 dwellings in Oneida, owner-occupied units account for 2,786 (61.6%), while renter-occupied units make up 1,735 (38.4%).
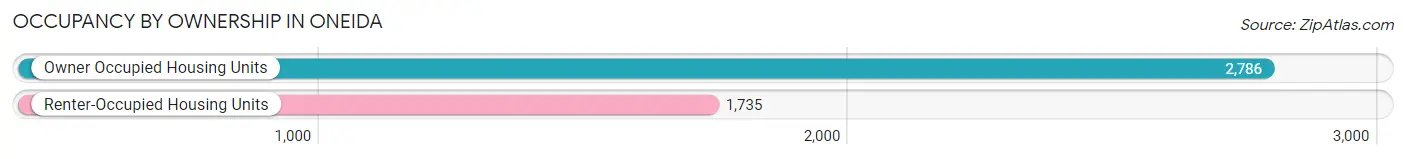
| Occupancy | # Housing Units | % Housing Units |
| Owner Occupied Housing Units | 2,786 | 61.6% |
| Renter-Occupied Housing Units | 1,735 | 38.4% |
| Total Occupied Housing Units | 4,521 | 100.0% |
Occupancy by Household Size in Oneida
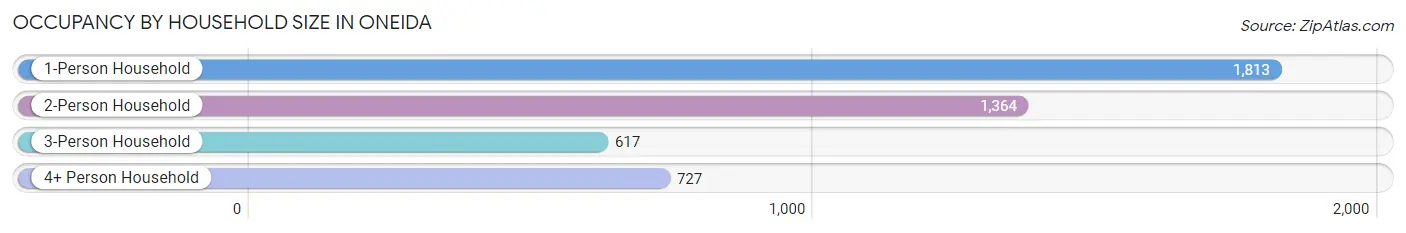
| Household Size | # Housing Units | % Housing Units |
| 1-Person Household | 1,813 | 40.1% |
| 2-Person Household | 1,364 | 30.2% |
| 3-Person Household | 617 | 13.7% |
| 4+ Person Household | 727 | 16.1% |
| Total Housing Units | 4,521 | 100.0% |
Occupancy by Ownership by Household Size in Oneida
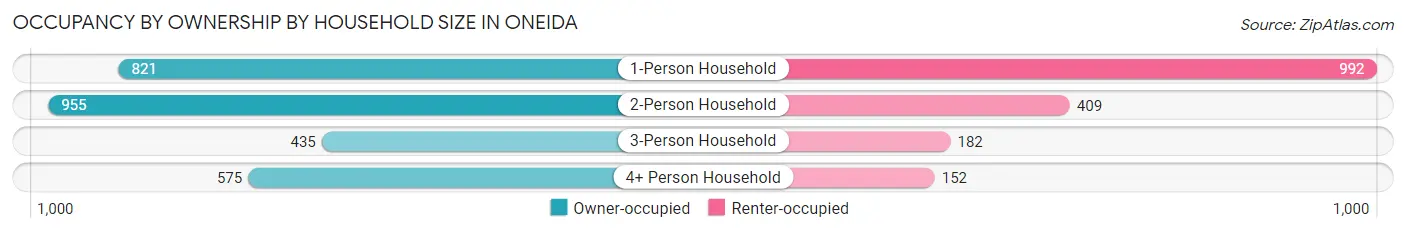
| Household Size | Owner-occupied | Renter-occupied |
| 1-Person Household | 821 (45.3%) | 992 (54.7%) |
| 2-Person Household | 955 (70.0%) | 409 (30.0%) |
| 3-Person Household | 435 (70.5%) | 182 (29.5%) |
| 4+ Person Household | 575 (79.1%) | 152 (20.9%) |
| Total Housing Units | 2,786 (61.6%) | 1,735 (38.4%) |
Occupancy by Educational Attainment in Oneida
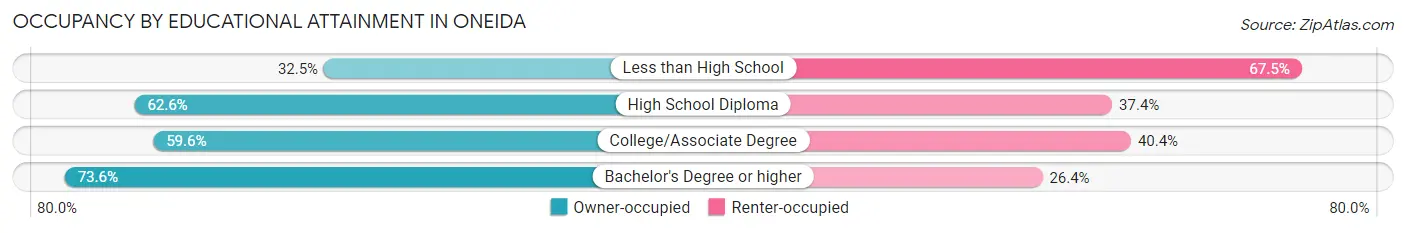
| Household Size | Owner-occupied | Renter-occupied |
| Less than High School | 133 (32.5%) | 276 (67.5%) |
| High School Diploma | 866 (62.6%) | 518 (37.4%) |
| College/Associate Degree | 941 (59.6%) | 638 (40.4%) |
| Bachelor's Degree or higher | 846 (73.6%) | 303 (26.4%) |
Occupancy by Age of Householder in Oneida
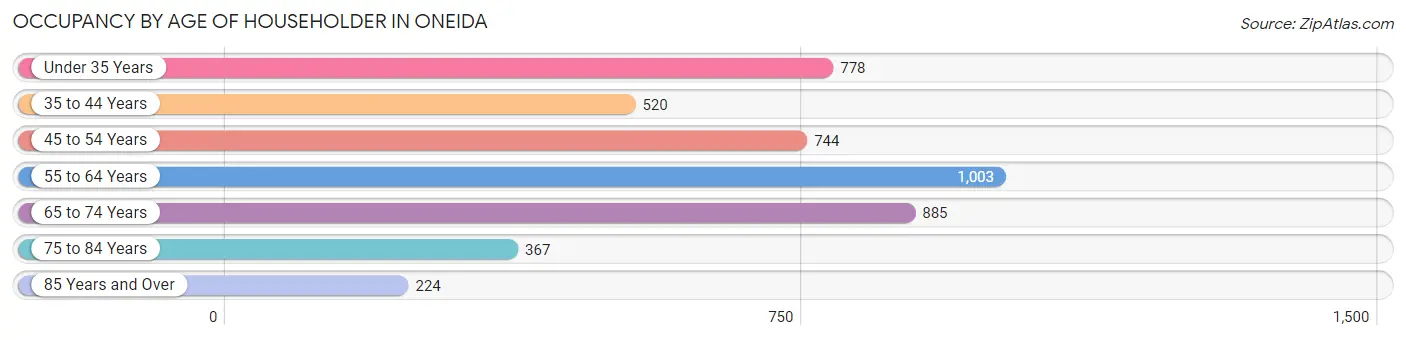
| Age Bracket | # Households | % Households |
| Under 35 Years | 778 | 17.2% |
| 35 to 44 Years | 520 | 11.5% |
| 45 to 54 Years | 744 | 16.5% |
| 55 to 64 Years | 1,003 | 22.2% |
| 65 to 74 Years | 885 | 19.6% |
| 75 to 84 Years | 367 | 8.1% |
| 85 Years and Over | 224 | 5.0% |
| Total | 4,521 | 100.0% |
Housing Finances in Oneida
Median Income by Occupancy in Oneida
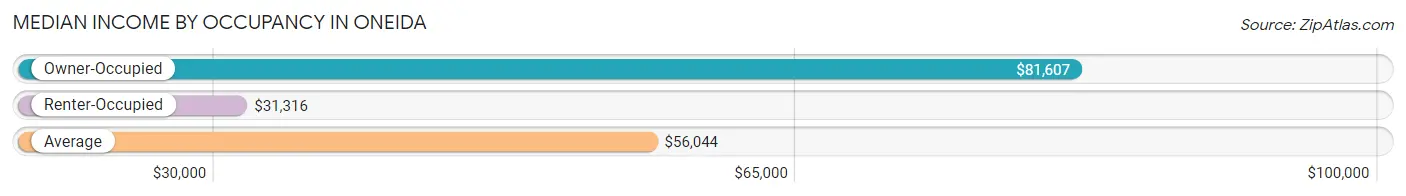
| Occupancy Type | # Households | Median Income |
| Owner-Occupied | 2,786 (61.6%) | $81,607 |
| Renter-Occupied | 1,735 (38.4%) | $31,316 |
| Average | 4,521 (100.0%) | $56,044 |
Occupancy by Householder Income Bracket in Oneida
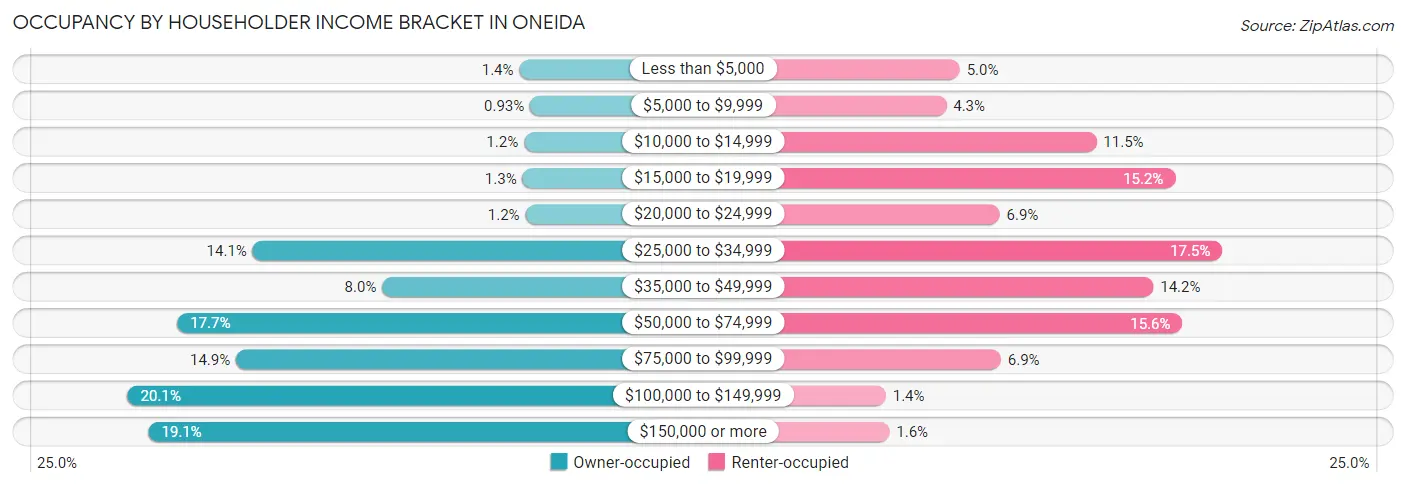
| Income Bracket | Owner-occupied | Renter-occupied |
| Less than $5,000 | 40 (1.4%) | 86 (5.0%) |
| $5,000 to $9,999 | 26 (0.9%) | 75 (4.3%) |
| $10,000 to $14,999 | 34 (1.2%) | 199 (11.5%) |
| $15,000 to $19,999 | 36 (1.3%) | 264 (15.2%) |
| $20,000 to $24,999 | 32 (1.1%) | 119 (6.9%) |
| $25,000 to $34,999 | 394 (14.1%) | 303 (17.5%) |
| $35,000 to $49,999 | 222 (8.0%) | 246 (14.2%) |
| $50,000 to $74,999 | 494 (17.7%) | 270 (15.6%) |
| $75,000 to $99,999 | 416 (14.9%) | 120 (6.9%) |
| $100,000 to $149,999 | 560 (20.1%) | 25 (1.4%) |
| $150,000 or more | 532 (19.1%) | 28 (1.6%) |
| Total | 2,786 (100.0%) | 1,735 (100.0%) |
Monthly Housing Cost Tiers in Oneida
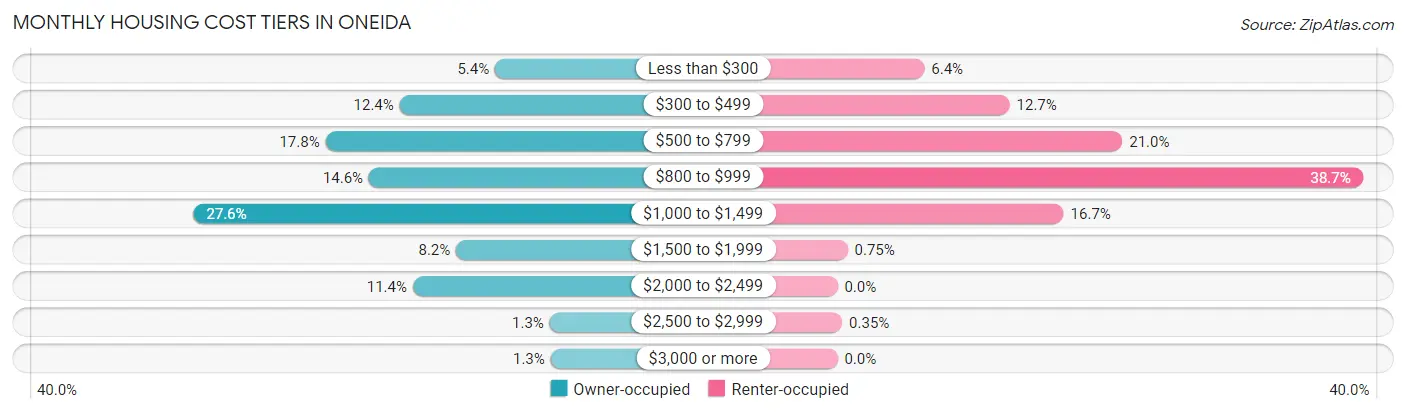
| Monthly Cost | Owner-occupied | Renter-occupied |
| Less than $300 | 149 (5.3%) | 111 (6.4%) |
| $300 to $499 | 345 (12.4%) | 220 (12.7%) |
| $500 to $799 | 497 (17.8%) | 364 (21.0%) |
| $800 to $999 | 408 (14.6%) | 671 (38.7%) |
| $1,000 to $1,499 | 768 (27.6%) | 289 (16.7%) |
| $1,500 to $1,999 | 229 (8.2%) | 13 (0.7%) |
| $2,000 to $2,499 | 318 (11.4%) | 0 (0.0%) |
| $2,500 to $2,999 | 37 (1.3%) | 6 (0.4%) |
| $3,000 or more | 35 (1.3%) | 0 (0.0%) |
| Total | 2,786 (100.0%) | 1,735 (100.0%) |
Physical Housing Characteristics in Oneida
Housing Structures in Oneida
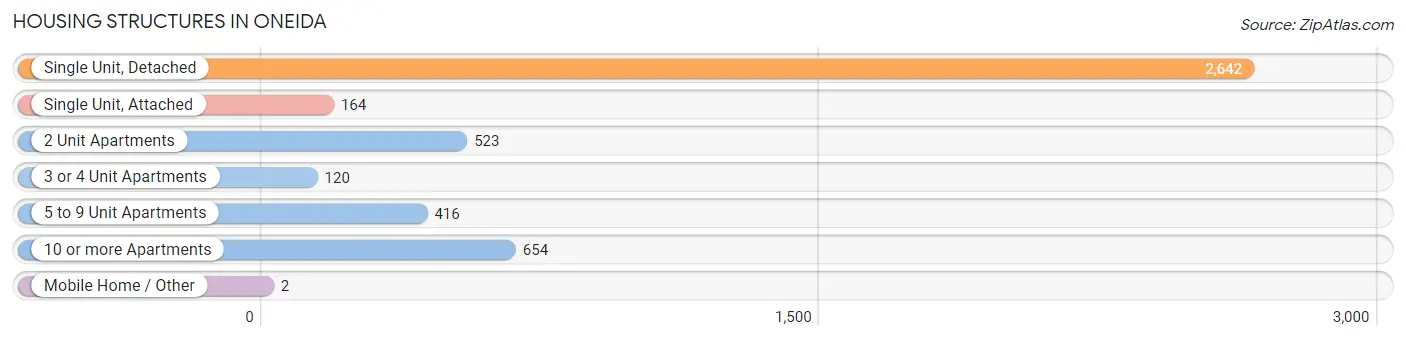
| Structure Type | # Housing Units | % Housing Units |
| Single Unit, Detached | 2,642 | 58.4% |
| Single Unit, Attached | 164 | 3.6% |
| 2 Unit Apartments | 523 | 11.6% |
| 3 or 4 Unit Apartments | 120 | 2.6% |
| 5 to 9 Unit Apartments | 416 | 9.2% |
| 10 or more Apartments | 654 | 14.5% |
| Mobile Home / Other | 2 | 0.0% |
| Total | 4,521 | 100.0% |
Housing Structures by Occupancy in Oneida
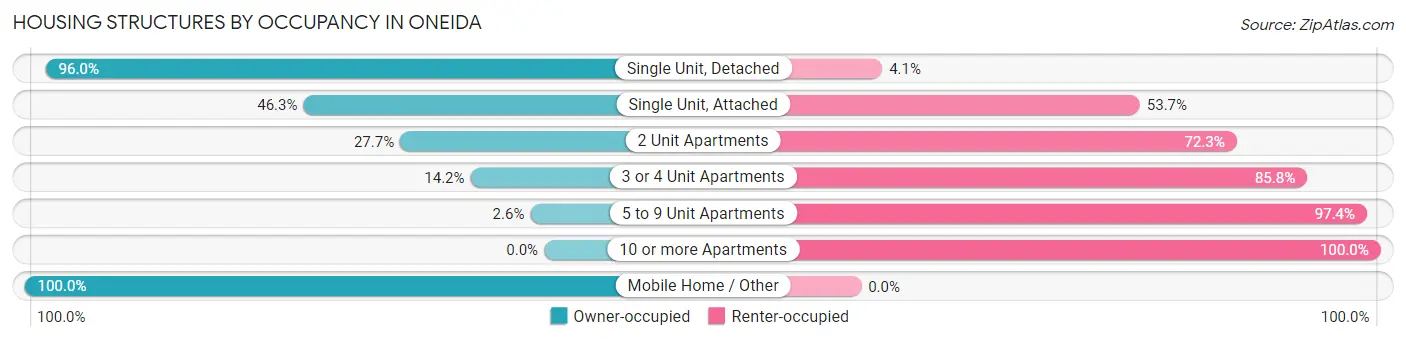
| Structure Type | Owner-occupied | Renter-occupied |
| Single Unit, Detached | 2,535 (96.0%) | 107 (4.1%) |
| Single Unit, Attached | 76 (46.3%) | 88 (53.7%) |
| 2 Unit Apartments | 145 (27.7%) | 378 (72.3%) |
| 3 or 4 Unit Apartments | 17 (14.2%) | 103 (85.8%) |
| 5 to 9 Unit Apartments | 11 (2.6%) | 405 (97.4%) |
| 10 or more Apartments | 0 (0.0%) | 654 (100.0%) |
| Mobile Home / Other | 2 (100.0%) | 0 (0.0%) |
| Total | 2,786 (61.6%) | 1,735 (38.4%) |
Housing Structures by Number of Rooms in Oneida
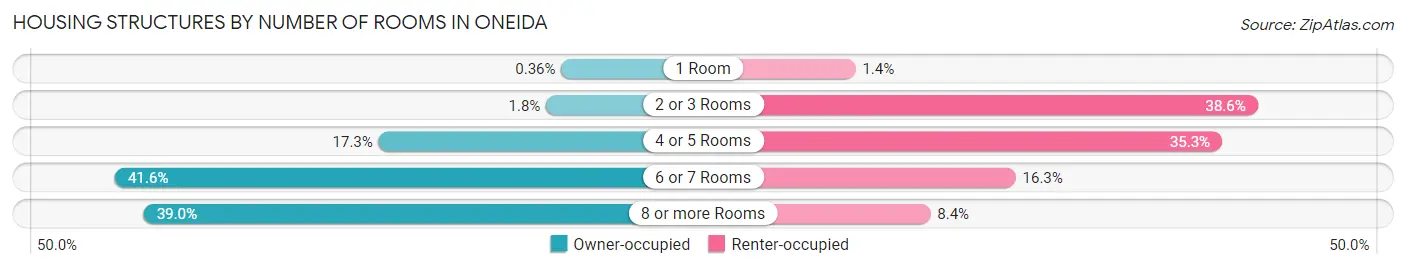
| Number of Rooms | Owner-occupied | Renter-occupied |
| 1 Room | 10 (0.4%) | 25 (1.4%) |
| 2 or 3 Rooms | 49 (1.8%) | 670 (38.6%) |
| 4 or 5 Rooms | 481 (17.3%) | 613 (35.3%) |
| 6 or 7 Rooms | 1,160 (41.6%) | 282 (16.3%) |
| 8 or more Rooms | 1,086 (39.0%) | 145 (8.4%) |
| Total | 2,786 (100.0%) | 1,735 (100.0%) |
Housing Structure by Heating Type in Oneida
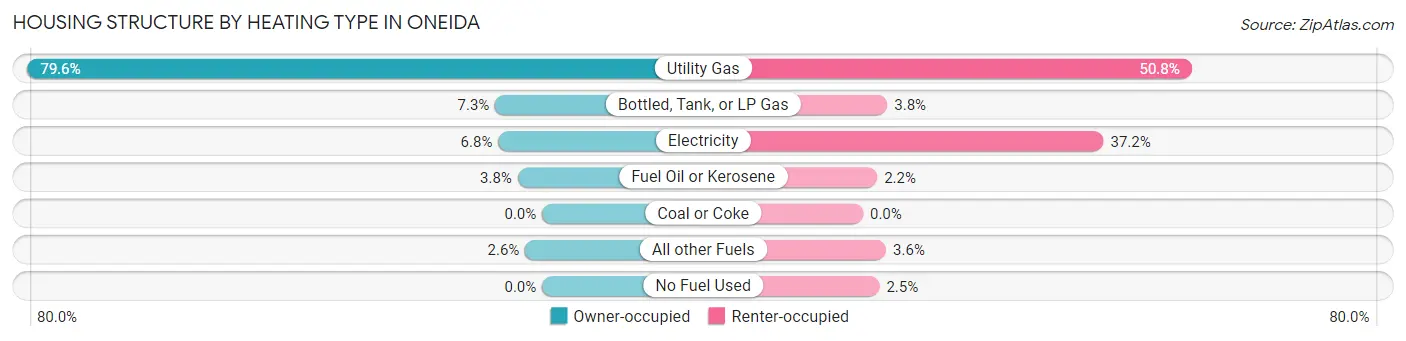
| Heating Type | Owner-occupied | Renter-occupied |
| Utility Gas | 2,217 (79.6%) | 881 (50.8%) |
| Bottled, Tank, or LP Gas | 202 (7.2%) | 65 (3.7%) |
| Electricity | 189 (6.8%) | 645 (37.2%) |
| Fuel Oil or Kerosene | 105 (3.8%) | 38 (2.2%) |
| Coal or Coke | 0 (0.0%) | 0 (0.0%) |
| All other Fuels | 73 (2.6%) | 62 (3.6%) |
| No Fuel Used | 0 (0.0%) | 44 (2.5%) |
| Total | 2,786 (100.0%) | 1,735 (100.0%) |
Household Vehicle Usage in Oneida
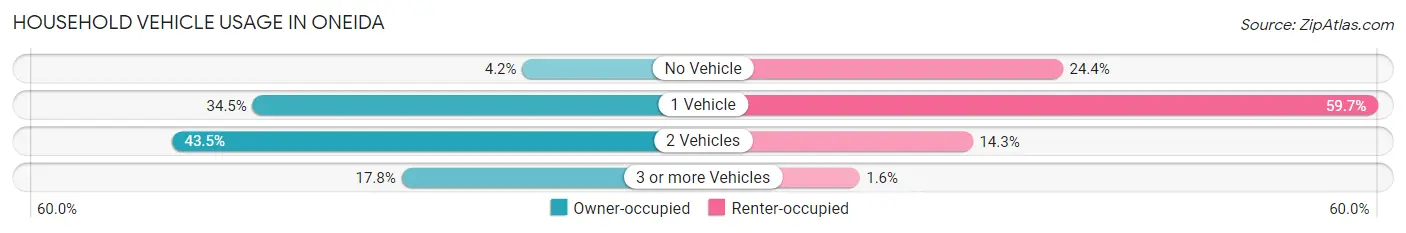
| Vehicles per Household | Owner-occupied | Renter-occupied |
| No Vehicle | 118 (4.2%) | 423 (24.4%) |
| 1 Vehicle | 960 (34.5%) | 1,036 (59.7%) |
| 2 Vehicles | 1,213 (43.5%) | 248 (14.3%) |
| 3 or more Vehicles | 495 (17.8%) | 28 (1.6%) |
| Total | 2,786 (100.0%) | 1,735 (100.0%) |
Real Estate & Mortgages in Oneida
Real Estate and Mortgage Overview in Oneida
| Characteristic | Without Mortgage | With Mortgage |
| Housing Units | 1,198 | 1,588 |
| Median Property Value | $119,700 | $144,100 |
| Median Household Income | $56,532 | $396 |
| Monthly Housing Costs | $572 | $35 |
| Real Estate Taxes | $2,810 | $21 |
Property Value by Mortgage Status in Oneida
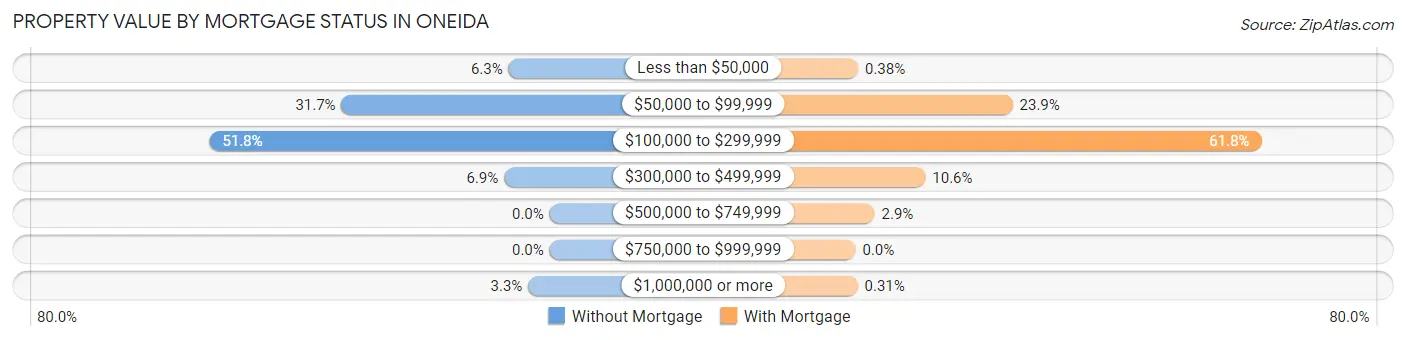
| Property Value | Without Mortgage | With Mortgage |
| Less than $50,000 | 75 (6.3%) | 6 (0.4%) |
| $50,000 to $99,999 | 380 (31.7%) | 380 (23.9%) |
| $100,000 to $299,999 | 621 (51.8%) | 982 (61.8%) |
| $300,000 to $499,999 | 83 (6.9%) | 169 (10.6%) |
| $500,000 to $749,999 | 0 (0.0%) | 46 (2.9%) |
| $750,000 to $999,999 | 0 (0.0%) | 0 (0.0%) |
| $1,000,000 or more | 39 (3.3%) | 5 (0.3%) |
| Total | 1,198 (100.0%) | 1,588 (100.0%) |
Household Income by Mortgage Status in Oneida
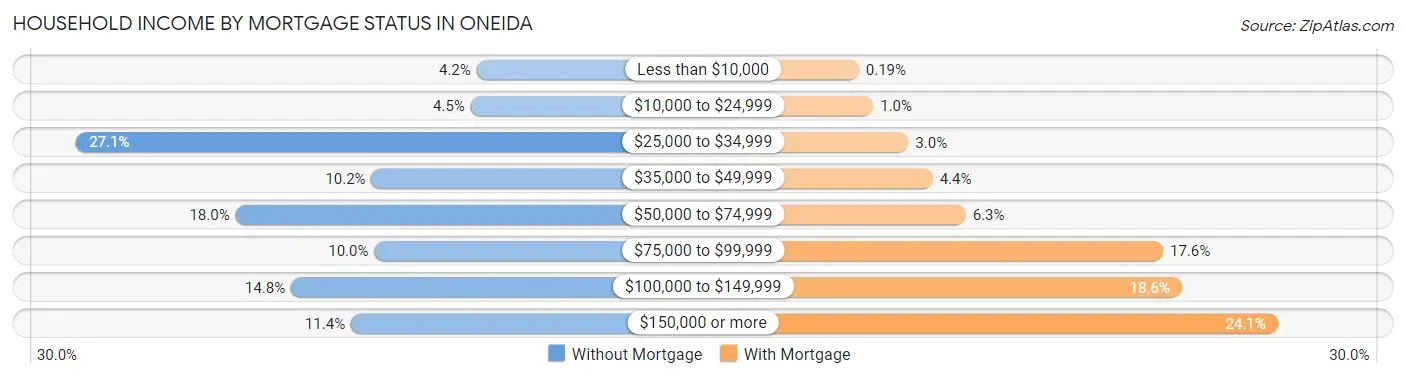
| Household Income | Without Mortgage | With Mortgage |
| Less than $10,000 | 50 (4.2%) | 3 (0.2%) |
| $10,000 to $24,999 | 54 (4.5%) | 16 (1.0%) |
| $25,000 to $34,999 | 324 (27.1%) | 48 (3.0%) |
| $35,000 to $49,999 | 122 (10.2%) | 70 (4.4%) |
| $50,000 to $74,999 | 215 (17.9%) | 100 (6.3%) |
| $75,000 to $99,999 | 120 (10.0%) | 279 (17.6%) |
| $100,000 to $149,999 | 177 (14.8%) | 296 (18.6%) |
| $150,000 or more | 136 (11.4%) | 383 (24.1%) |
| Total | 1,198 (100.0%) | 1,588 (100.0%) |
Property Value to Household Income Ratio in Oneida
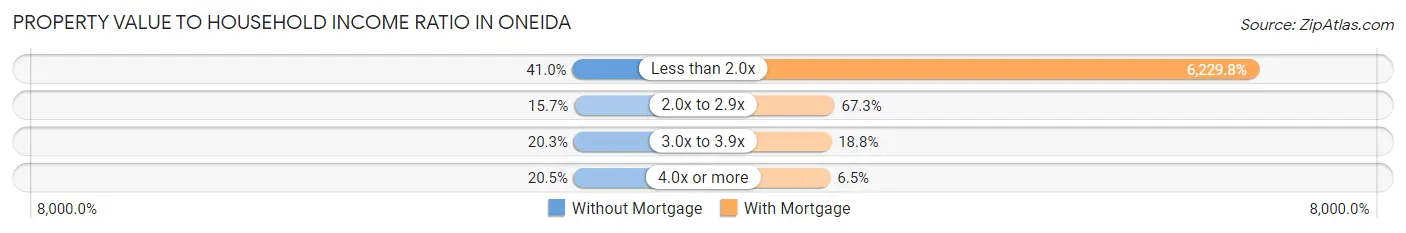
| Value-to-Income Ratio | Without Mortgage | With Mortgage |
| Less than 2.0x | 491 (41.0%) | 98,929 (6,229.8%) |
| 2.0x to 2.9x | 188 (15.7%) | 1,069 (67.3%) |
| 3.0x to 3.9x | 243 (20.3%) | 299 (18.8%) |
| 4.0x or more | 246 (20.5%) | 103 (6.5%) |
| Total | 1,198 (100.0%) | 1,588 (100.0%) |
Real Estate Taxes by Mortgage Status in Oneida
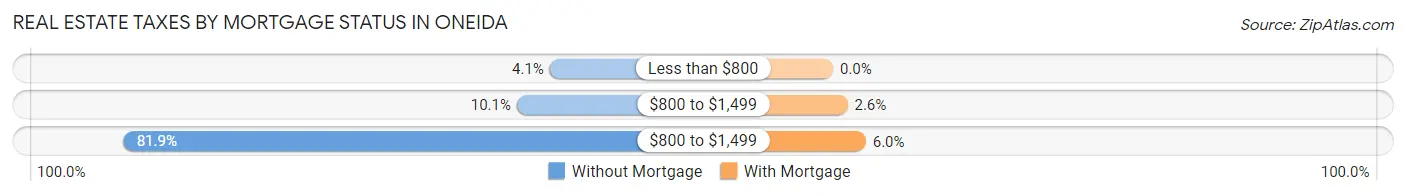
| Property Taxes | Without Mortgage | With Mortgage |
| Less than $800 | 49 (4.1%) | 0 (0.0%) |
| $800 to $1,499 | 121 (10.1%) | 42 (2.6%) |
| $800 to $1,499 | 981 (81.9%) | 95 (6.0%) |
| Total | 1,198 (100.0%) | 1,588 (100.0%) |
Health & Disability in Oneida
Health Insurance Coverage by Age in Oneida
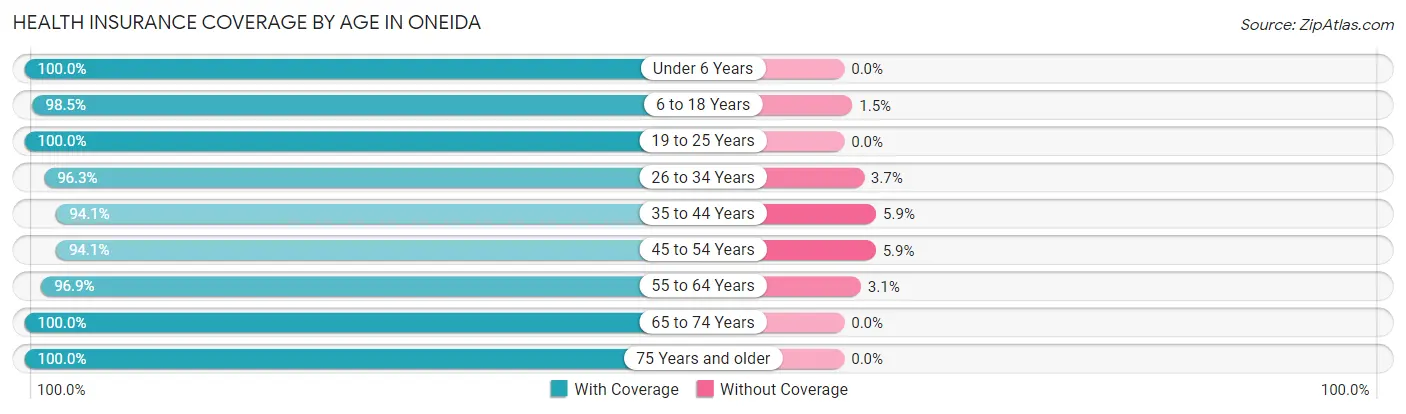
| Age Bracket | With Coverage | Without Coverage |
| Under 6 Years | 796 (100.0%) | 0 (0.0%) |
| 6 to 18 Years | 1,382 (98.5%) | 21 (1.5%) |
| 19 to 25 Years | 748 (100.0%) | 0 (0.0%) |
| 26 to 34 Years | 1,000 (96.3%) | 38 (3.7%) |
| 35 to 44 Years | 950 (94.1%) | 60 (5.9%) |
| 45 to 54 Years | 1,349 (94.1%) | 84 (5.9%) |
| 55 to 64 Years | 1,687 (96.9%) | 54 (3.1%) |
| 65 to 74 Years | 1,191 (100.0%) | 0 (0.0%) |
| 75 Years and older | 857 (100.0%) | 0 (0.0%) |
| Total | 9,960 (97.5%) | 257 (2.5%) |
Health Insurance Coverage by Citizenship Status in Oneida
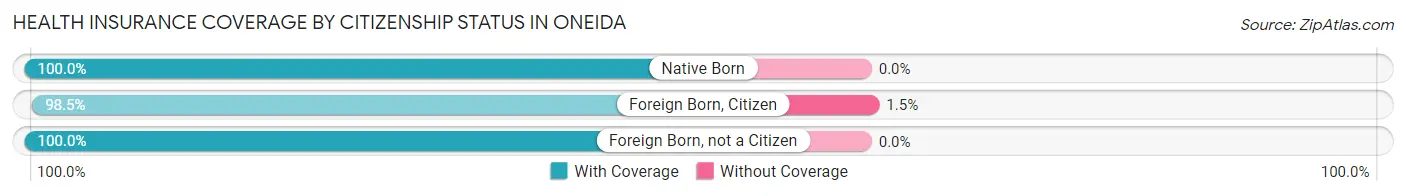
| Citizenship Status | With Coverage | Without Coverage |
| Native Born | 796 (100.0%) | 0 (0.0%) |
| Foreign Born, Citizen | 1,382 (98.5%) | 21 (1.5%) |
| Foreign Born, not a Citizen | 748 (100.0%) | 0 (0.0%) |
Health Insurance Coverage by Household Income in Oneida
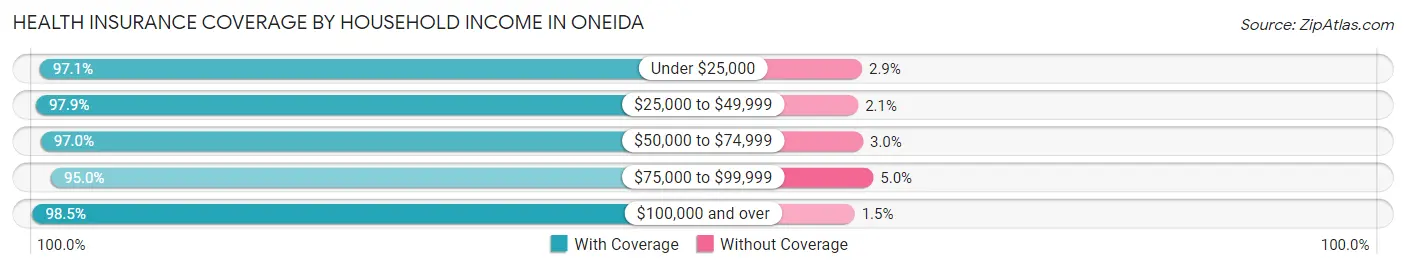
| Household Income | With Coverage | Without Coverage |
| Under $25,000 | 1,258 (97.1%) | 37 (2.9%) |
| $25,000 to $49,999 | 1,967 (97.9%) | 43 (2.1%) |
| $50,000 to $74,999 | 1,561 (97.0%) | 49 (3.0%) |
| $75,000 to $99,999 | 1,356 (95.0%) | 71 (5.0%) |
| $100,000 and over | 3,735 (98.5%) | 56 (1.5%) |
Public vs Private Health Insurance Coverage by Age in Oneida
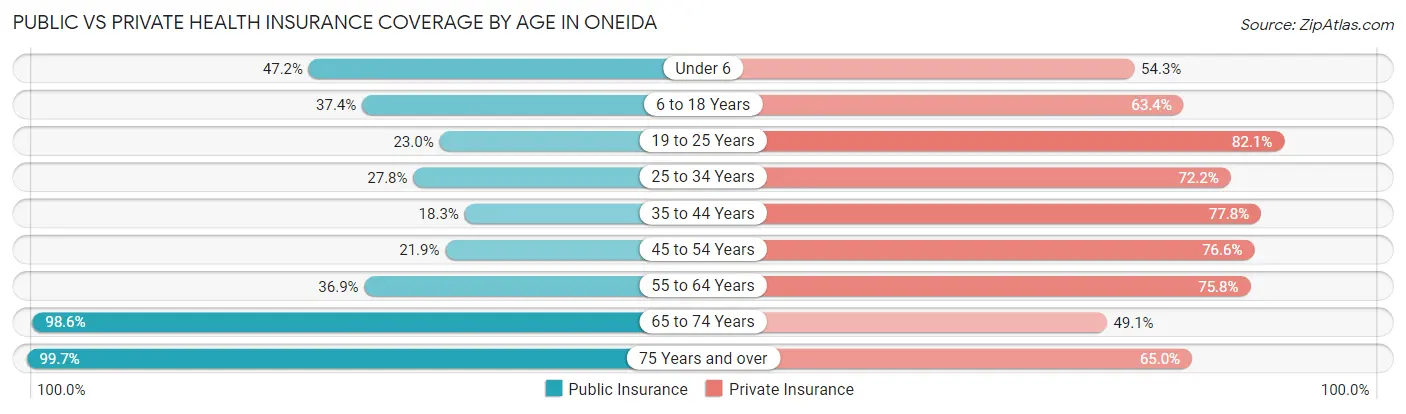
| Age Bracket | Public Insurance | Private Insurance |
| Under 6 | 376 (47.2%) | 432 (54.3%) |
| 6 to 18 Years | 524 (37.3%) | 890 (63.4%) |
| 19 to 25 Years | 172 (23.0%) | 614 (82.1%) |
| 25 to 34 Years | 289 (27.8%) | 749 (72.2%) |
| 35 to 44 Years | 185 (18.3%) | 786 (77.8%) |
| 45 to 54 Years | 314 (21.9%) | 1,097 (76.5%) |
| 55 to 64 Years | 643 (36.9%) | 1,320 (75.8%) |
| 65 to 74 Years | 1,174 (98.6%) | 585 (49.1%) |
| 75 Years and over | 854 (99.7%) | 557 (65.0%) |
| Total | 4,531 (44.4%) | 7,030 (68.8%) |
Disability Status by Sex by Age in Oneida
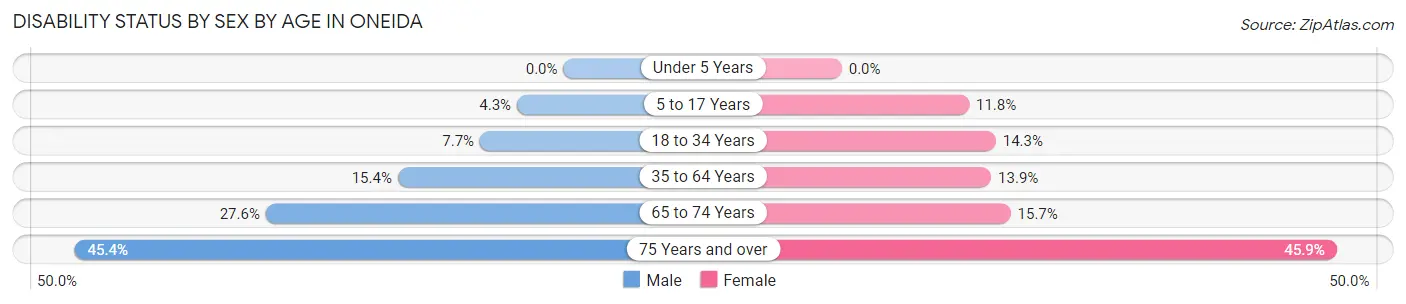
| Age Bracket | Male | Female |
| Under 5 Years | 0 (0.0%) | 0 (0.0%) |
| 5 to 17 Years | 27 (4.3%) | 103 (11.8%) |
| 18 to 34 Years | 72 (7.7%) | 136 (14.3%) |
| 35 to 64 Years | 325 (15.4%) | 287 (13.9%) |
| 65 to 74 Years | 158 (27.6%) | 97 (15.7%) |
| 75 Years and over | 122 (45.4%) | 270 (45.9%) |
Disability Class by Sex by Age in Oneida
Disability Class: Hearing Difficulty
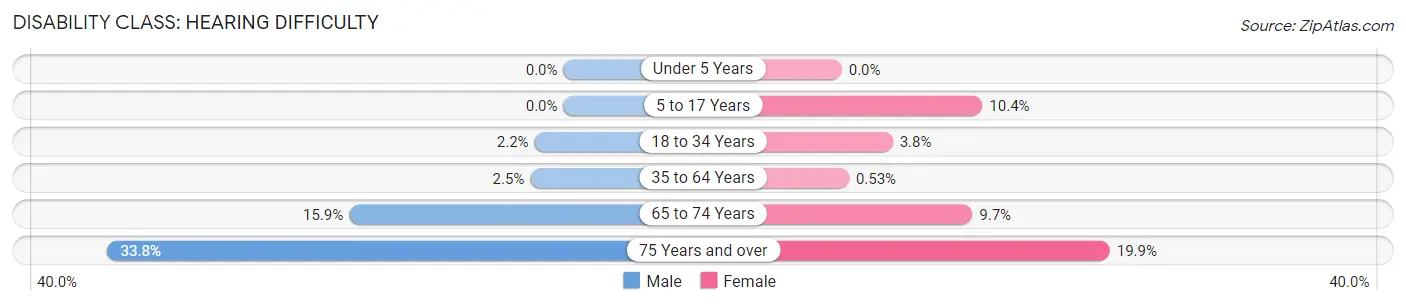
| Age Bracket | Male | Female |
| Under 5 Years | 0 (0.0%) | 0 (0.0%) |
| 5 to 17 Years | 0 (0.0%) | 91 (10.4%) |
| 18 to 34 Years | 20 (2.1%) | 36 (3.8%) |
| 35 to 64 Years | 52 (2.5%) | 11 (0.5%) |
| 65 to 74 Years | 91 (15.9%) | 60 (9.7%) |
| 75 Years and over | 91 (33.8%) | 117 (19.9%) |
Disability Class: Vision Difficulty
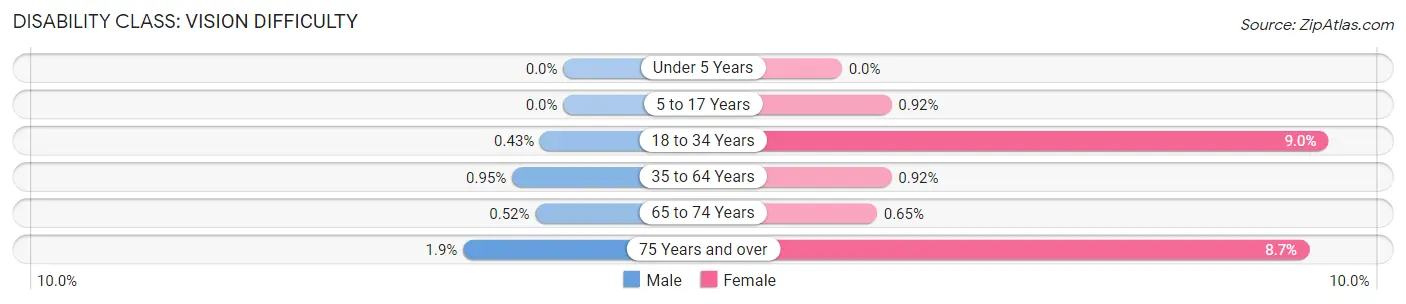
| Age Bracket | Male | Female |
| Under 5 Years | 0 (0.0%) | 0 (0.0%) |
| 5 to 17 Years | 0 (0.0%) | 8 (0.9%) |
| 18 to 34 Years | 4 (0.4%) | 86 (9.0%) |
| 35 to 64 Years | 20 (0.9%) | 19 (0.9%) |
| 65 to 74 Years | 3 (0.5%) | 4 (0.6%) |
| 75 Years and over | 5 (1.9%) | 51 (8.7%) |
Disability Class: Cognitive Difficulty
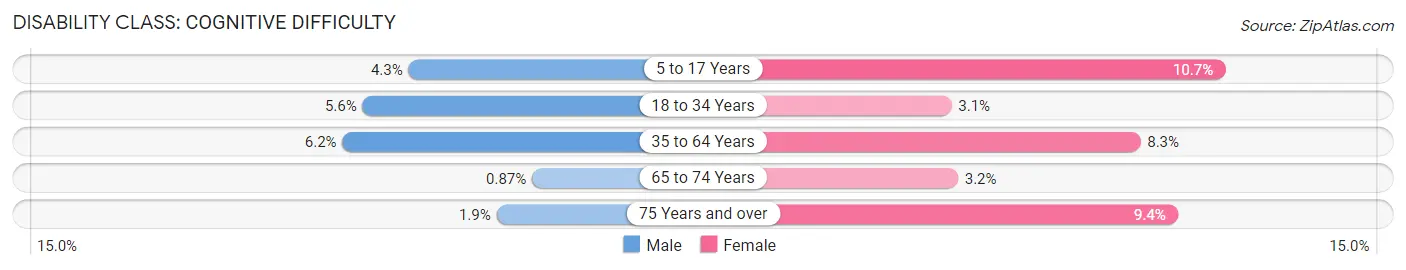
| Age Bracket | Male | Female |
| 5 to 17 Years | 27 (4.3%) | 93 (10.7%) |
| 18 to 34 Years | 52 (5.6%) | 29 (3.0%) |
| 35 to 64 Years | 130 (6.1%) | 172 (8.3%) |
| 65 to 74 Years | 5 (0.9%) | 20 (3.2%) |
| 75 Years and over | 5 (1.9%) | 55 (9.3%) |
Disability Class: Ambulatory Difficulty
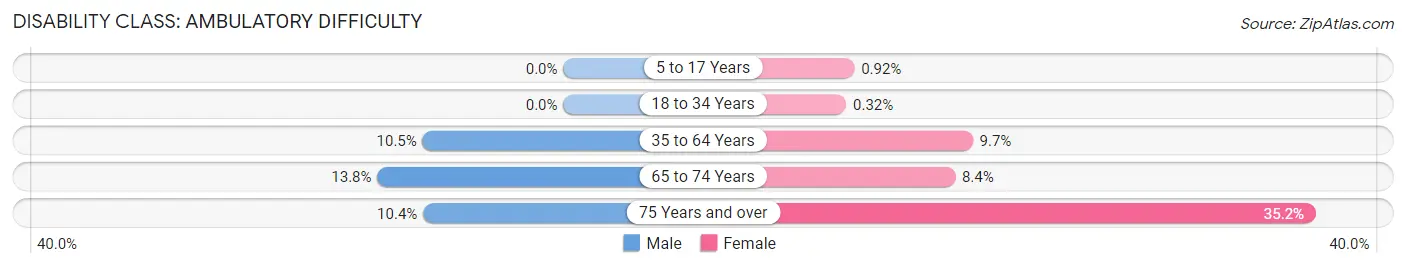
| Age Bracket | Male | Female |
| 5 to 17 Years | 0 (0.0%) | 8 (0.9%) |
| 18 to 34 Years | 0 (0.0%) | 3 (0.3%) |
| 35 to 64 Years | 221 (10.4%) | 201 (9.7%) |
| 65 to 74 Years | 79 (13.8%) | 52 (8.4%) |
| 75 Years and over | 28 (10.4%) | 207 (35.2%) |
Disability Class: Self-Care Difficulty
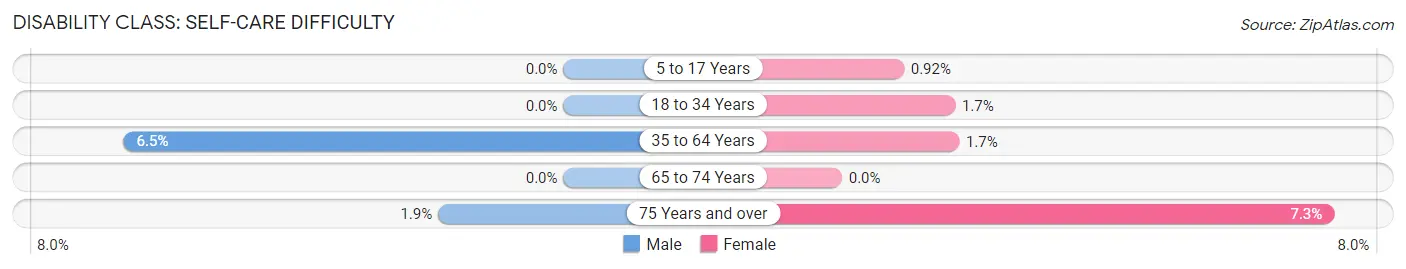
| Age Bracket | Male | Female |
| 5 to 17 Years | 0 (0.0%) | 8 (0.9%) |
| 18 to 34 Years | 0 (0.0%) | 16 (1.7%) |
| 35 to 64 Years | 138 (6.5%) | 36 (1.7%) |
| 65 to 74 Years | 0 (0.0%) | 0 (0.0%) |
| 75 Years and over | 5 (1.9%) | 43 (7.3%) |
Technology Access in Oneida
Computing Device Access in Oneida
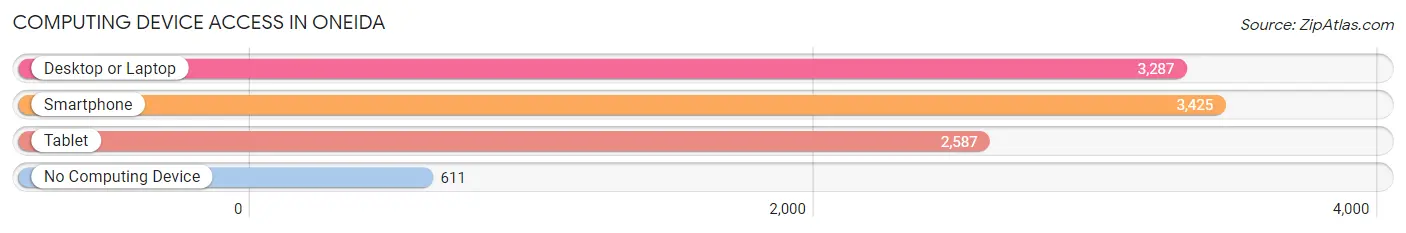
| Device Type | # Households | % Households |
| Desktop or Laptop | 3,287 | 72.7% |
| Smartphone | 3,425 | 75.8% |
| Tablet | 2,587 | 57.2% |
| No Computing Device | 611 | 13.5% |
| Total | 4,521 | 100.0% |
Internet Access in Oneida
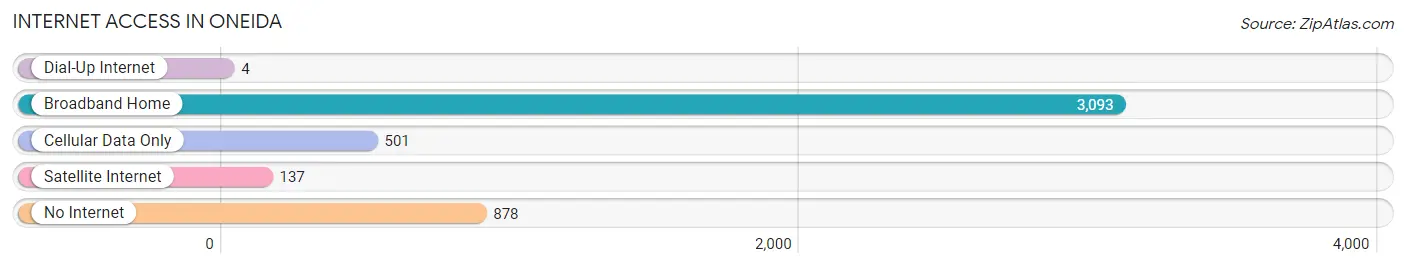
| Internet Type | # Households | % Households |
| Dial-Up Internet | 4 | 0.1% |
| Broadband Home | 3,093 | 68.4% |
| Cellular Data Only | 501 | 11.1% |
| Satellite Internet | 137 | 3.0% |
| No Internet | 878 | 19.4% |
| Total | 4,521 | 100.0% |
Oneida Summary
Oneida, NY is a small city located in Madison County, New York. It is situated on the Oneida River, which is a tributary of the Mohawk River. The city is part of the Syracuse Metropolitan Statistical Area and is located about 15 miles east of Syracuse. As of the 2010 census, the city had a population of 11,390.
History
The area that is now Oneida was originally inhabited by the Oneida people, a member of the Iroquois Confederacy. The Oneida people had a long history in the area, and the city of Oneida was named after them. The first European settlers arrived in the area in the late 1700s, and the city was officially incorporated in 1848.
In the 19th century, Oneida was an important industrial center. It was home to several factories, including the Oneida Community, which produced silverware and other products. The city was also home to several mills, including the Oneida Cotton Mill, which was the largest cotton mill in the United States at the time.
Geography
Oneida is located at 43°7'N 75°45'W (43.1167, -75.7500). According to the United States Census Bureau, the city has a total area of 4.2 square miles (10.8 km2), all of it land.
The city is located in the Central New York region, and is part of the Mohawk Valley. The city is situated on the Oneida River, which is a tributary of the Mohawk River. The city is located about 15 miles east of Syracuse.
Economy
Oneida is a small city with a diverse economy. The city is home to several manufacturing companies, including the Oneida Community, which produces silverware and other products. The city is also home to several mills, including the Oneida Cotton Mill, which was the largest cotton mill in the United States at the time.
The city is also home to several retail stores, restaurants, and other businesses. The city is also home to several educational institutions, including the State University of New York at Oneida.
Demographics
As of the 2010 census, the city had a population of 11,390. The racial makeup of the city was 92.2% White, 4.2% African American, 0.4% Native American, 0.7% Asian, 0.1% Pacific Islander, 0.9% from other races, and 1.5% from two or more races. Hispanic or Latino of any race were 2.7% of the population.
The median income for a household in the city was $37,941, and the median income for a family was $45,941. The per capita income for the city was $19,945. About 11.2% of families and 14.2% of the population were below the poverty line, including 20.2% of those under age 18 and 8.2% of those age 65 or over.
Oneida is a small city with a diverse population and economy. The city is home to several manufacturing companies, retail stores, restaurants, and other businesses. The city is also home to several educational institutions, including the State University of New York at Oneida. The city has a population of 11,390, and the median income for a household is $37,941.
Common Questions
What is Per Capita Income in Oneida?
Per Capita income in Oneida is $35,259.
What is the Median Family Income in Oneida?
Median Family Income in Oneida is $79,574.
What is the Median Household income in Oneida?
Median Household Income in Oneida is $56,044.
What is Income or Wage Gap in Oneida?
Income or Wage Gap in Oneida is 15.8%.
Women in Oneida earn 84.2 cents for every dollar earned by a man.
What is Family Income Deficit in Oneida?
Family Income Deficit in Oneida is $12,552.
Families that are below poverty line in Oneida earn $12,552 less on average than the poverty threshold level.
What is Inequality or Gini Index in Oneida?
Inequality or Gini Index in Oneida is 0.47.
What is the Total Population of Oneida?
Total Population of Oneida is 10,326.
What is the Total Male Population of Oneida?
Total Male Population of Oneida is 4,888.
What is the Total Female Population of Oneida?
Total Female Population of Oneida is 5,438.
What is the Ratio of Males per 100 Females in Oneida?
There are 89.89 Males per 100 Females in Oneida.
What is the Ratio of Females per 100 Males in Oneida?
There are 111.25 Females per 100 Males in Oneida.
What is the Median Population Age in Oneida?
Median Population Age in Oneida is 46.0 Years.
What is the Average Family Size in Oneida
Average Family Size in Oneida is 3.1 People.
What is the Average Household Size in Oneida
Average Household Size in Oneida is 2.2 People.
How Large is the Labor Force in Oneida?
There are 5,223 People in the Labor Forcein in Oneida.
What is the Percentage of People in the Labor Force in Oneida?
61.6% of People are in the Labor Force in Oneida.
What is the Unemployment Rate in Oneida?
Unemployment Rate in Oneida is 3.0%.