North Rose, NY Map & Demographics
North Rose Map
North Rose Overview
$31,011
PER CAPITA INCOME
$81,696
AVG FAMILY INCOME
$70,104
AVG HOUSEHOLD INCOME
48.9%
WAGE / INCOME GAP [ % ]
51.1¢/ $1
WAGE / INCOME GAP [ $ ]
0.31
INEQUALITY / GINI INDEX
588
TOTAL POPULATION
296
MALE POPULATION
292
FEMALE POPULATION
101.37
MALES / 100 FEMALES
98.65
FEMALES / 100 MALES
38.7
MEDIAN AGE
2.8
AVG FAMILY SIZE
2.4
AVG HOUSEHOLD SIZE
287
LABOR FORCE [ PEOPLE ]
62.4%
PERCENT IN LABOR FORCE
7.3%
UNEMPLOYMENT RATE
North Rose Zip Codes
North Rose Area Codes
Income in North Rose
Income Overview in North Rose
Per Capita Income in North Rose is $31,011, while median incomes of families and households are $81,696 and $70,104 respectively.
| Characteristic | Number | Measure |
| Per Capita Income | 588 | $31,011 |
| Median Family Income | 157 | $81,696 |
| Mean Family Income | 157 | $84,889 |
| Median Household Income | 249 | $70,104 |
| Mean Household Income | 249 | $72,560 |
| Income Deficit | 157 | $0 |
| Wage / Income Gap (%) | 588 | 48.87% |
| Wage / Income Gap ($) | 588 | 51.13¢ per $1 |
| Gini / Inequality Index | 588 | 0.31 |
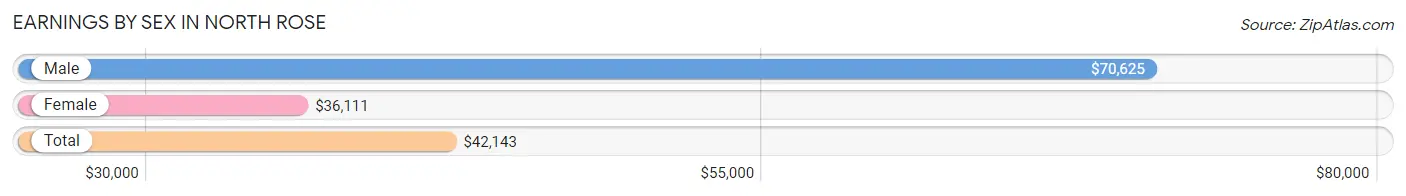
Earnings by Sex in North Rose
Average Earnings in North Rose are $42,143, $70,625 for men and $36,111 for women, a difference of 48.9%.
| Sex | Number | Average Earnings |
| Male | 128 (48.1%) | $70,625 |
| Female | 138 (51.9%) | $36,111 |
| Total | 266 (100.0%) | $42,143 |
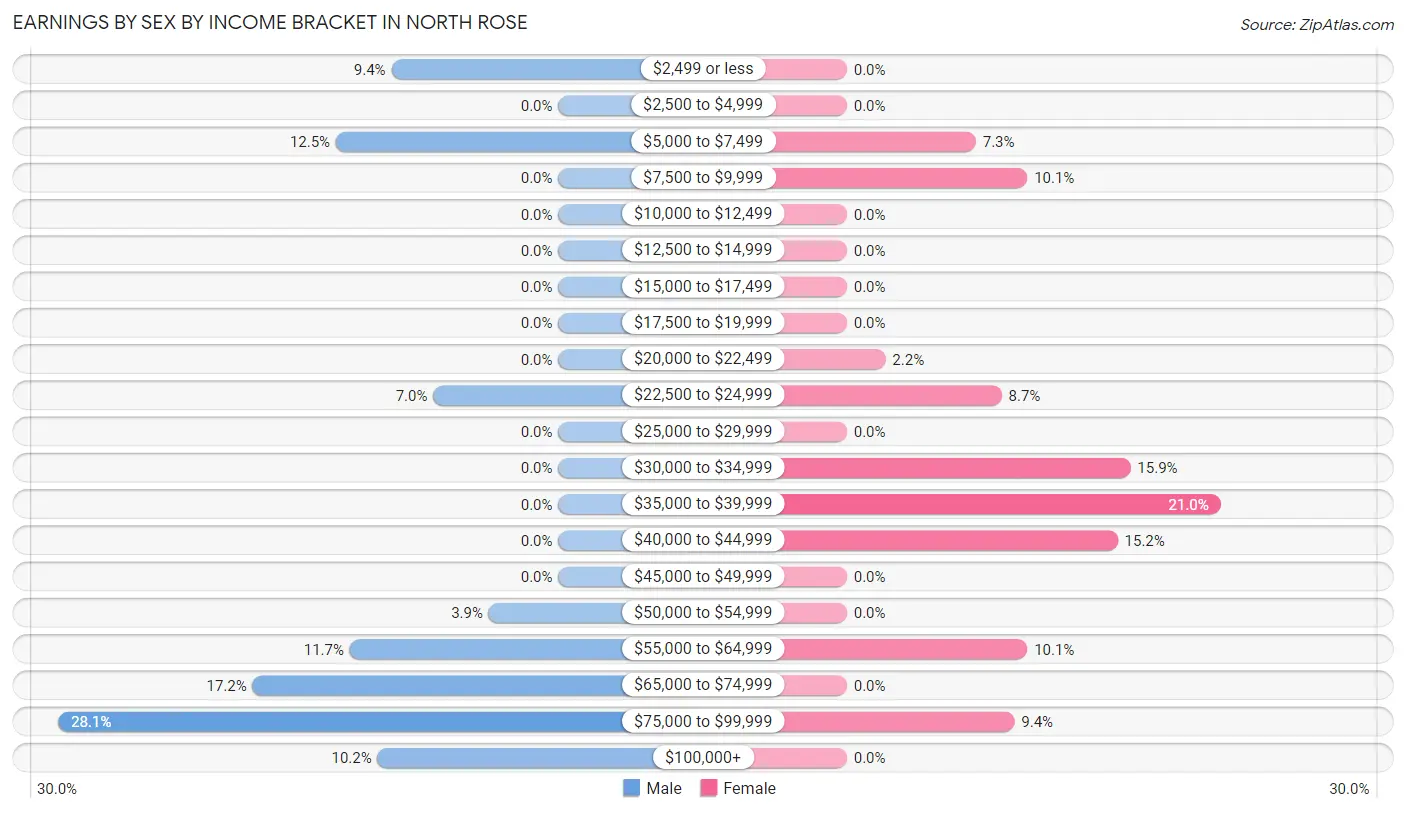
Earnings by Sex by Income Bracket in North Rose
The most common earnings brackets in North Rose are $75,000 to $99,999 for men (36 | 28.1%) and $35,000 to $39,999 for women (29 | 21.0%).
| Income | Male | Female |
| $2,499 or less | 12 (9.4%) | 0 (0.0%) |
| $2,500 to $4,999 | 0 (0.0%) | 0 (0.0%) |
| $5,000 to $7,499 | 16 (12.5%) | 10 (7.2%) |
| $7,500 to $9,999 | 0 (0.0%) | 14 (10.1%) |
| $10,000 to $12,499 | 0 (0.0%) | 0 (0.0%) |
| $12,500 to $14,999 | 0 (0.0%) | 0 (0.0%) |
| $15,000 to $17,499 | 0 (0.0%) | 0 (0.0%) |
| $17,500 to $19,999 | 0 (0.0%) | 0 (0.0%) |
| $20,000 to $22,499 | 0 (0.0%) | 3 (2.2%) |
| $22,500 to $24,999 | 9 (7.0%) | 12 (8.7%) |
| $25,000 to $29,999 | 0 (0.0%) | 0 (0.0%) |
| $30,000 to $34,999 | 0 (0.0%) | 22 (15.9%) |
| $35,000 to $39,999 | 0 (0.0%) | 29 (21.0%) |
| $40,000 to $44,999 | 0 (0.0%) | 21 (15.2%) |
| $45,000 to $49,999 | 0 (0.0%) | 0 (0.0%) |
| $50,000 to $54,999 | 5 (3.9%) | 0 (0.0%) |
| $55,000 to $64,999 | 15 (11.7%) | 14 (10.1%) |
| $65,000 to $74,999 | 22 (17.2%) | 0 (0.0%) |
| $75,000 to $99,999 | 36 (28.1%) | 13 (9.4%) |
| $100,000+ | 13 (10.2%) | 0 (0.0%) |
| Total | 128 (100.0%) | 138 (100.0%) |
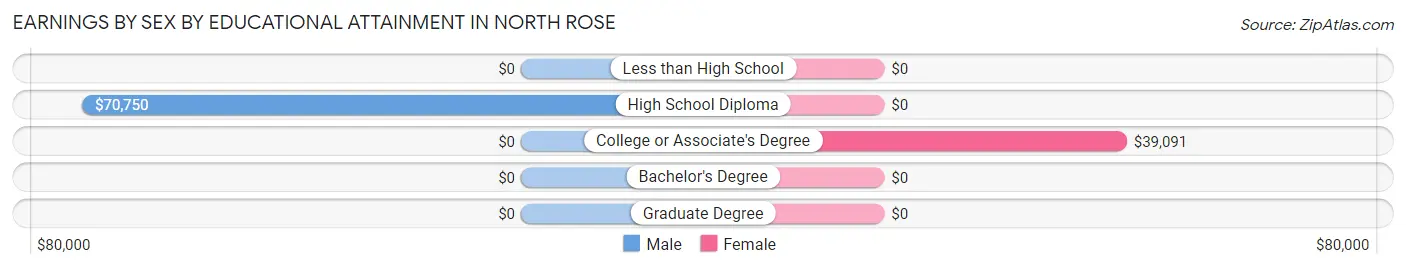
Earnings by Sex by Educational Attainment in North Rose
Average earnings in North Rose are $61,250 for men and $37,727 for women, a difference of 38.4%. Men with an educational attainment of high school diploma enjoy the highest average annual earnings of $70,750, while those with high school diploma education earn the least with $70,750. Women with an educational attainment of college or associate's degree earn the most with the average annual earnings of $39,091, while those with college or associate's degree education have the smallest earnings of $39,091.
| Educational Attainment | Male Income | Female Income |
| Less than High School | - | - |
| High School Diploma | $70,750 | $0 |
| College or Associate's Degree | - | - |
| Bachelor's Degree | - | - |
| Graduate Degree | - | - |
| Total | $61,250 | $37,727 |
Family Income in North Rose
Family Income Brackets in North Rose
According to the North Rose family income data, there are 53 families falling into the $100,000 to $149,999 income range, which is the most common income bracket and makes up 33.8% of all families.
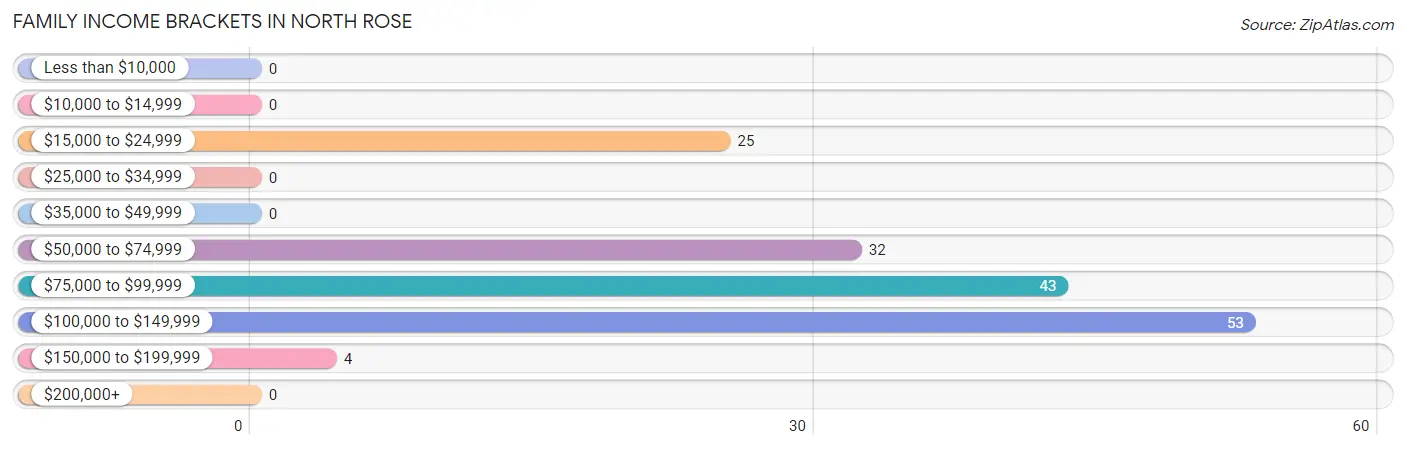
| Income Bracket | # Families | % Families |
| Less than $10,000 | 0 | 0.0% |
| $10,000 to $14,999 | 0 | 0.0% |
| $15,000 to $24,999 | 25 | 15.9% |
| $25,000 to $34,999 | 0 | 0.0% |
| $35,000 to $49,999 | 0 | 0.0% |
| $50,000 to $74,999 | 32 | 20.4% |
| $75,000 to $99,999 | 43 | 27.4% |
| $100,000 to $149,999 | 53 | 33.8% |
| $150,000 to $199,999 | 4 | 2.5% |
| $200,000+ | 0 | 0.0% |
Family Income by Famaliy Size in North Rose
3-person families (43 | 27.4%) account for the highest median family income in North Rose with $140,511 per family, while 3-person families (43 | 27.4%) have the highest median income of $46,837 per family member.
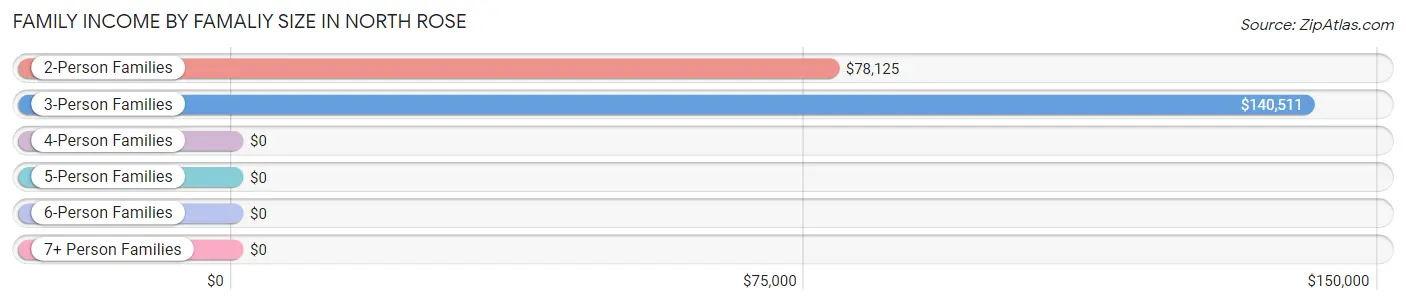
| Income Bracket | # Families | Median Income |
| 2-Person Families | 96 (61.2%) | $78,125 |
| 3-Person Families | 43 (27.4%) | $140,511 |
| 4-Person Families | 0 (0.0%) | $0 |
| 5-Person Families | 18 (11.5%) | $0 |
| 6-Person Families | 0 (0.0%) | $0 |
| 7+ Person Families | 0 (0.0%) | $0 |
| Total | 157 (100.0%) | $81,696 |
Family Income by Number of Earners in North Rose
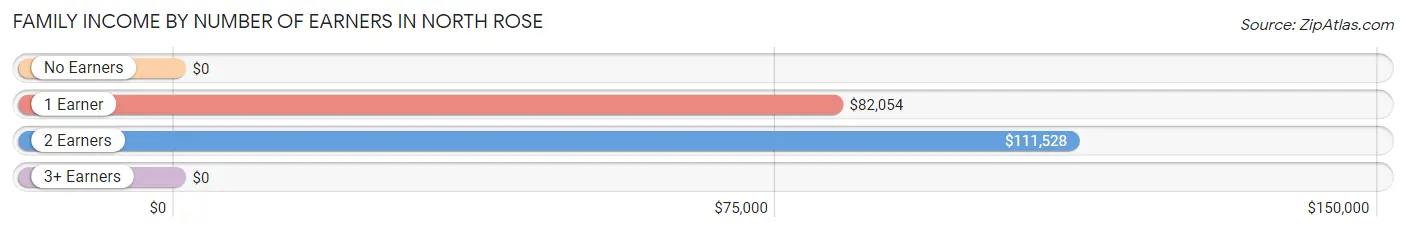
| Number of Earners | # Families | Median Income |
| No Earners | 34 (21.7%) | $0 |
| 1 Earner | 53 (33.8%) | $82,054 |
| 2 Earners | 58 (36.9%) | $111,528 |
| 3+ Earners | 12 (7.6%) | $0 |
| Total | 157 (100.0%) | $81,696 |
Household Income in North Rose
Household Income Brackets in North Rose
With 78 households falling in the category, the $100,000 to $149,999 income range is the most frequent in North Rose, accounting for 31.3% of all households.
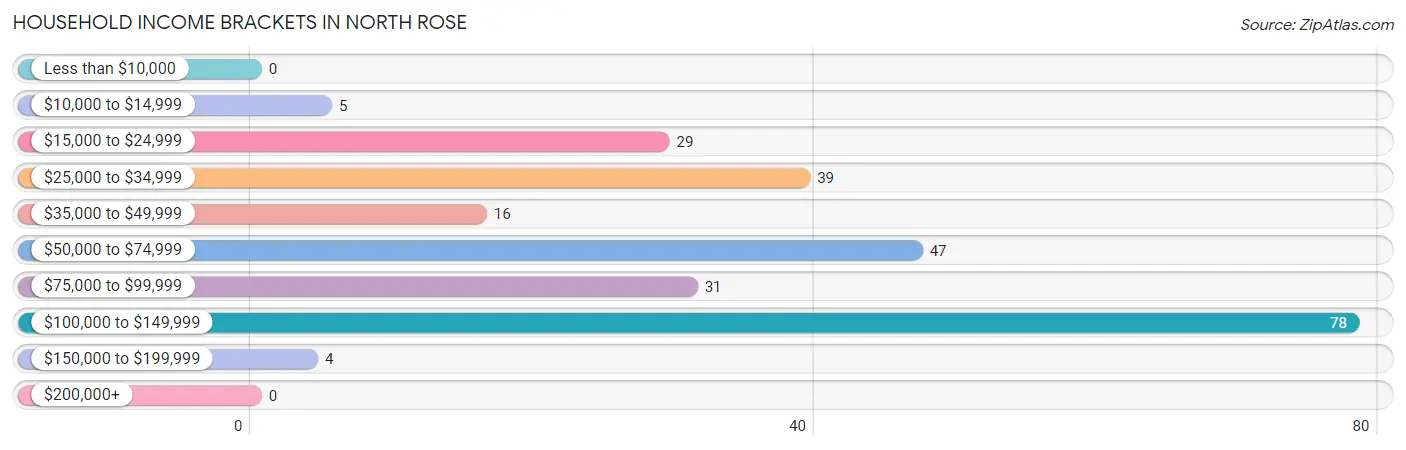
| Income Bracket | # Households | % Households |
| Less than $10,000 | 0 | 0.0% |
| $10,000 to $14,999 | 5 | 2.0% |
| $15,000 to $24,999 | 29 | 11.6% |
| $25,000 to $34,999 | 39 | 15.7% |
| $35,000 to $49,999 | 16 | 6.4% |
| $50,000 to $74,999 | 47 | 18.9% |
| $75,000 to $99,999 | 31 | 12.4% |
| $100,000 to $149,999 | 78 | 31.3% |
| $150,000 to $199,999 | 4 | 1.6% |
| $200,000+ | 0 | 0.0% |
Household Income by Householder Age in North Rose
The median household income in North Rose is $70,104, with the highest median household income of $78,854 found in the 45 to 64 years age bracket for the primary householder. A total of 91 households (36.5%) fall into this category. Meanwhile, the 15 to 24 years age bracket for the primary householder has the lowest median household income of $0, with 22 households (8.8%) in this group.
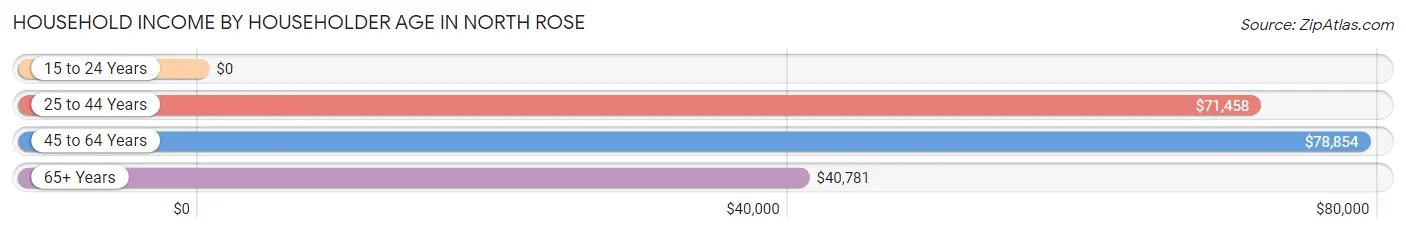
| Income Bracket | # Households | Median Income |
| 15 to 24 Years | 22 (8.8%) | $0 |
| 25 to 44 Years | 56 (22.5%) | $71,458 |
| 45 to 64 Years | 91 (36.5%) | $78,854 |
| 65+ Years | 80 (32.1%) | $40,781 |
| Total | 249 (100.0%) | $70,104 |
Poverty in North Rose
Income Below Poverty by Sex and Age in North Rose
With 4.7% poverty level for males and 18.1% for females among the residents of North Rose, 15 year old males and 35 to 44 year old females are the most vulnerable to poverty, with 14 males (100.0%) and 14 females (77.8%) in their respective age groups living below the poverty level.
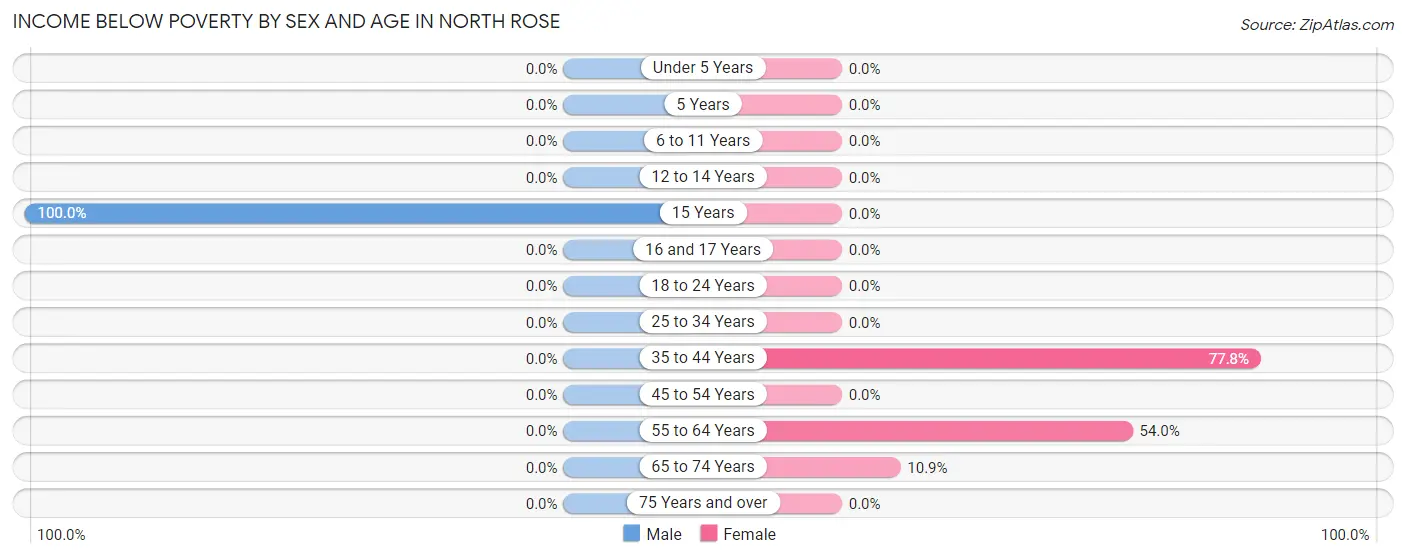
| Age Bracket | Male | Female |
| Under 5 Years | 0 (0.0%) | 0 (0.0%) |
| 5 Years | 0 (0.0%) | 0 (0.0%) |
| 6 to 11 Years | 0 (0.0%) | 0 (0.0%) |
| 12 to 14 Years | 0 (0.0%) | 0 (0.0%) |
| 15 Years | 14 (100.0%) | 0 (0.0%) |
| 16 and 17 Years | 0 (0.0%) | 0 (0.0%) |
| 18 to 24 Years | 0 (0.0%) | 0 (0.0%) |
| 25 to 34 Years | 0 (0.0%) | 0 (0.0%) |
| 35 to 44 Years | 0 (0.0%) | 14 (77.8%) |
| 45 to 54 Years | 0 (0.0%) | 0 (0.0%) |
| 55 to 64 Years | 0 (0.0%) | 34 (54.0%) |
| 65 to 74 Years | 0 (0.0%) | 5 (10.9%) |
| 75 Years and over | 0 (0.0%) | 0 (0.0%) |
| Total | 14 (4.7%) | 53 (18.1%) |
Income Above Poverty by Sex and Age in North Rose
According to the poverty statistics in North Rose, males aged under 5 years and females aged 6 to 11 years are the age groups that are most secure financially, with 100.0% of males and 100.0% of females in these age groups living above the poverty line.
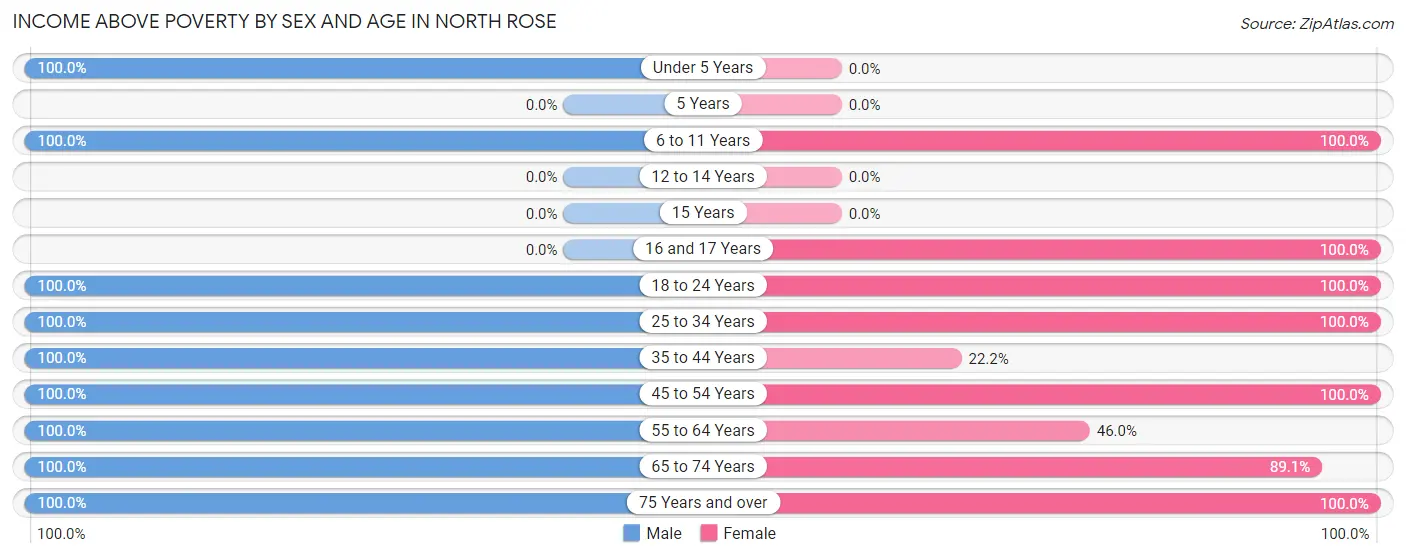
| Age Bracket | Male | Female |
| Under 5 Years | 55 (100.0%) | 0 (0.0%) |
| 5 Years | 0 (0.0%) | 0 (0.0%) |
| 6 to 11 Years | 33 (100.0%) | 26 (100.0%) |
| 12 to 14 Years | 0 (0.0%) | 0 (0.0%) |
| 15 Years | 0 (0.0%) | 0 (0.0%) |
| 16 and 17 Years | 0 (0.0%) | 18 (100.0%) |
| 18 to 24 Years | 32 (100.0%) | 22 (100.0%) |
| 25 to 34 Years | 25 (100.0%) | 48 (100.0%) |
| 35 to 44 Years | 20 (100.0%) | 4 (22.2%) |
| 45 to 54 Years | 38 (100.0%) | 30 (100.0%) |
| 55 to 64 Years | 10 (100.0%) | 29 (46.0%) |
| 65 to 74 Years | 38 (100.0%) | 41 (89.1%) |
| 75 Years and over | 31 (100.0%) | 21 (100.0%) |
| Total | 282 (95.3%) | 239 (81.9%) |
Income Below Poverty Among Married-Couple Families in North Rose
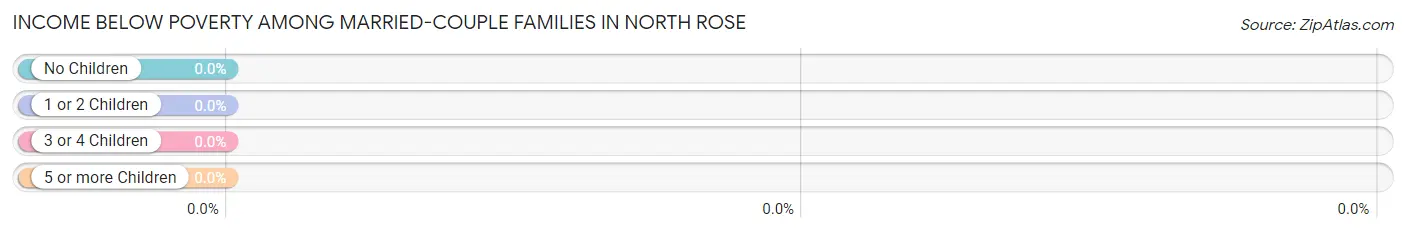
| Children | Above Poverty | Below Poverty |
| No Children | 47 (100.0%) | 0 (0.0%) |
| 1 or 2 Children | 27 (100.0%) | 0 (0.0%) |
| 3 or 4 Children | 18 (100.0%) | 0 (0.0%) |
| 5 or more Children | 0 (0.0%) | 0 (0.0%) |
| Total | 92 (100.0%) | 0 (0.0%) |
Income Below Poverty Among Single-Parent Households in North Rose
| Children | Single Father | Single Mother |
| No Children | 0 (0.0%) | 0 (0.0%) |
| 1 or 2 Children | 0 (0.0%) | 0 (0.0%) |
| 3 or 4 Children | 0 (0.0%) | 0 (0.0%) |
| 5 or more Children | 0 (0.0%) | 0 (0.0%) |
| Total | 0 (0.0%) | 0 (0.0%) |
Income Below Poverty Among Married-Couple vs Single-Parent Households in North Rose
| Children | Married-Couple Families | Single-Parent Households |
| No Children | 0 (0.0%) | 0 (0.0%) |
| 1 or 2 Children | 0 (0.0%) | 0 (0.0%) |
| 3 or 4 Children | 0 (0.0%) | 0 (0.0%) |
| 5 or more Children | 0 (0.0%) | 0 (0.0%) |
| Total | 0 (0.0%) | 0 (0.0%) |
Race in North Rose
The most populous races in North Rose are White / Caucasian (584 | 99.3%), and Two or more Races (4 | 0.7%).
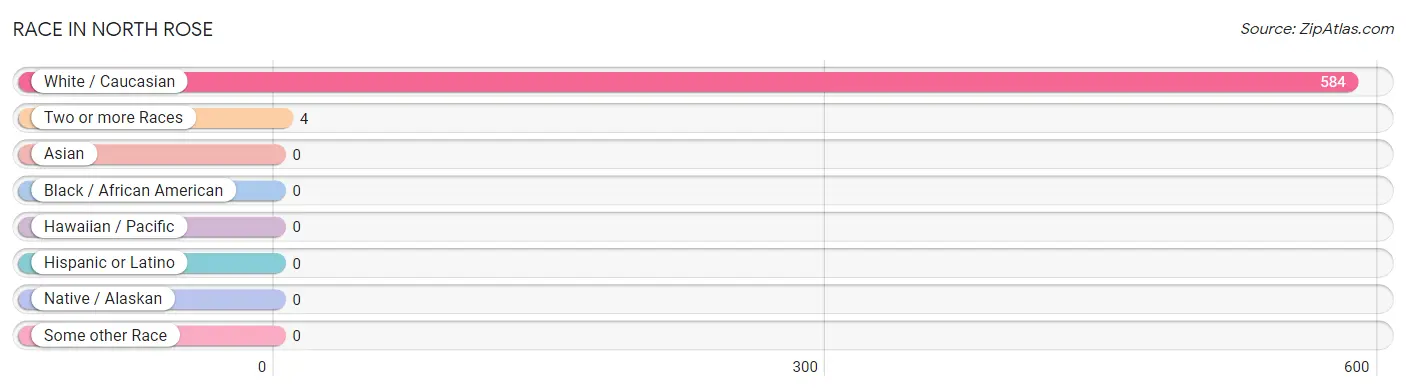
| Race | # Population | % Population |
| Asian | 0 | 0.0% |
| Black / African American | 0 | 0.0% |
| Hawaiian / Pacific | 0 | 0.0% |
| Hispanic or Latino | 0 | 0.0% |
| Native / Alaskan | 0 | 0.0% |
| White / Caucasian | 584 | 99.3% |
| Two or more Races | 4 | 0.7% |
| Some other Race | 0 | 0.0% |
| Total | 588 | 100.0% |
Ancestry in North Rose
The most populous ancestries reported in North Rose are German (114 | 19.4%), Irish (113 | 19.2%), Italian (86 | 14.6%), English (78 | 13.3%), and American (75 | 12.8%), together accounting for 79.3% of all North Rose residents.
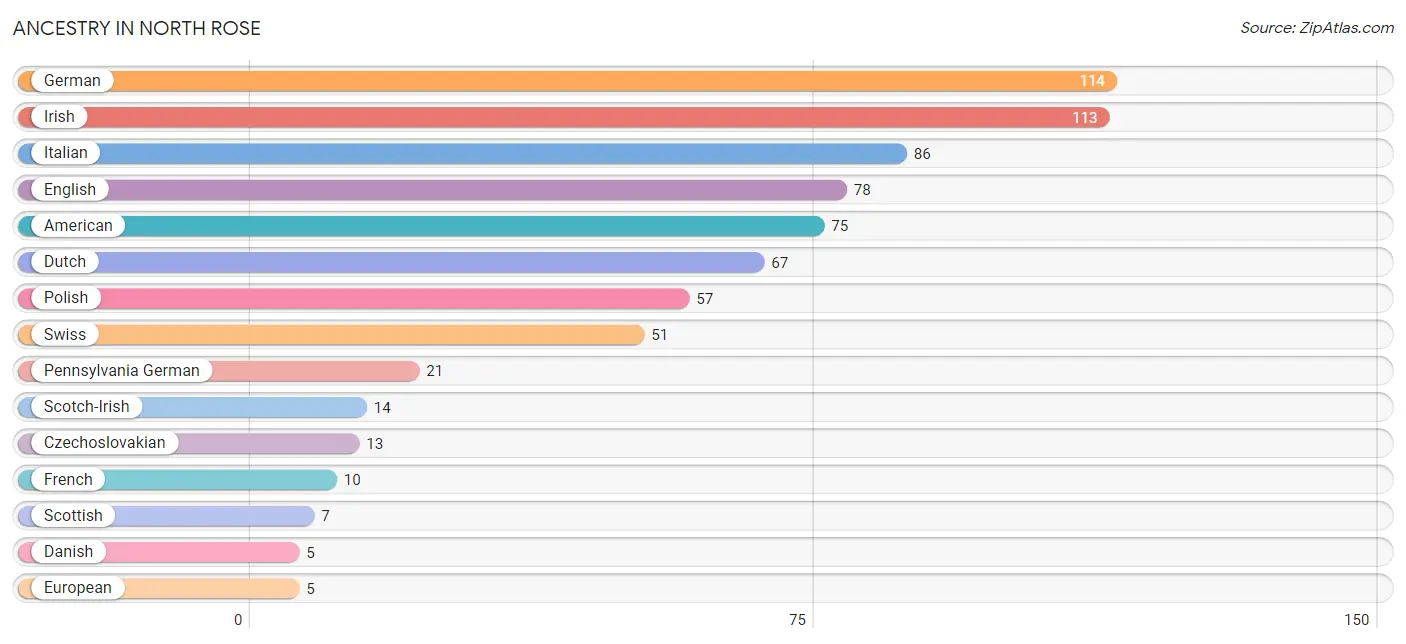
| Ancestry | # Population | % Population |
| American | 75 | 12.8% |
| Czechoslovakian | 13 | 2.2% |
| Danish | 5 | 0.9% |
| Dutch | 67 | 11.4% |
| English | 78 | 13.3% |
| European | 5 | 0.9% |
| French | 10 | 1.7% |
| French Canadian | 4 | 0.7% |
| German | 114 | 19.4% |
| Irish | 113 | 19.2% |
| Italian | 86 | 14.6% |
| Pennsylvania German | 21 | 3.6% |
| Polish | 57 | 9.7% |
| Scotch-Irish | 14 | 2.4% |
| Scottish | 7 | 1.2% |
| Swiss | 51 | 8.7% | View All 16 Rows |
Immigrants in North Rose

| Immigration Origin | # Population | % Population | View All 0 Rows |
Sex and Age in North Rose
Sex and Age in North Rose
The most populous age groups in North Rose are Under 5 Years (55 | 18.6%) for men and 55 to 59 Years (44 | 15.1%) for women.
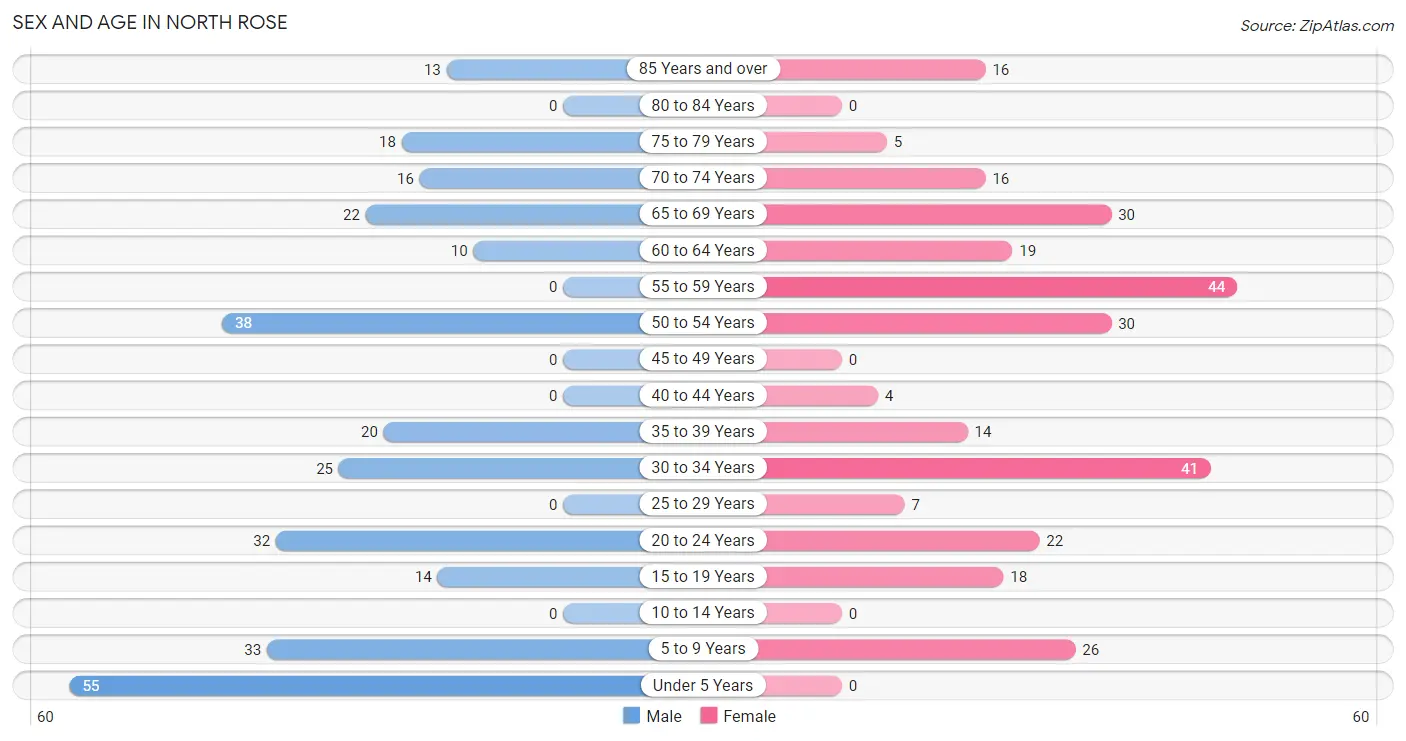
| Age Bracket | Male | Female |
| Under 5 Years | 55 (18.6%) | 0 (0.0%) |
| 5 to 9 Years | 33 (11.2%) | 26 (8.9%) |
| 10 to 14 Years | 0 (0.0%) | 0 (0.0%) |
| 15 to 19 Years | 14 (4.7%) | 18 (6.2%) |
| 20 to 24 Years | 32 (10.8%) | 22 (7.5%) |
| 25 to 29 Years | 0 (0.0%) | 7 (2.4%) |
| 30 to 34 Years | 25 (8.5%) | 41 (14.0%) |
| 35 to 39 Years | 20 (6.8%) | 14 (4.8%) |
| 40 to 44 Years | 0 (0.0%) | 4 (1.4%) |
| 45 to 49 Years | 0 (0.0%) | 0 (0.0%) |
| 50 to 54 Years | 38 (12.8%) | 30 (10.3%) |
| 55 to 59 Years | 0 (0.0%) | 44 (15.1%) |
| 60 to 64 Years | 10 (3.4%) | 19 (6.5%) |
| 65 to 69 Years | 22 (7.4%) | 30 (10.3%) |
| 70 to 74 Years | 16 (5.4%) | 16 (5.5%) |
| 75 to 79 Years | 18 (6.1%) | 5 (1.7%) |
| 80 to 84 Years | 0 (0.0%) | 0 (0.0%) |
| 85 Years and over | 13 (4.4%) | 16 (5.5%) |
| Total | 296 (100.0%) | 292 (100.0%) |
Families and Households in North Rose
Median Family Size in North Rose
The median family size in North Rose is 2.81 persons per family, with single male/father families (27 | 17.2%) accounting for the largest median family size of 3 persons per family. On the other hand, single female/mother families (38 | 24.2%) represent the smallest median family size with 2.34 persons per family.
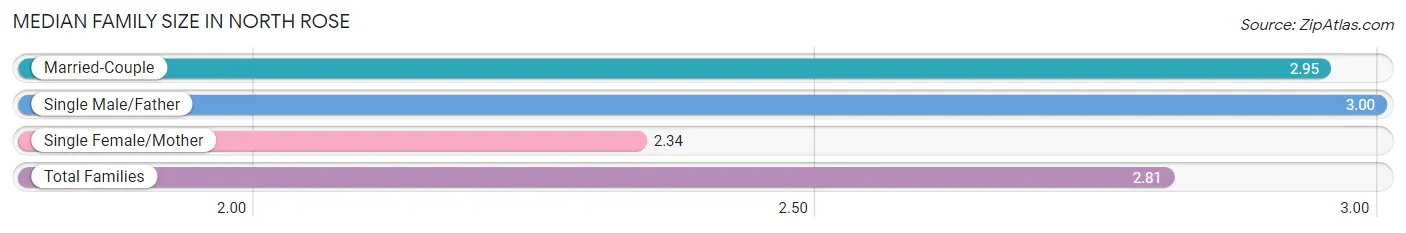
| Family Type | # Families | Family Size |
| Married-Couple | 92 (58.6%) | 2.95 |
| Single Male/Father | 27 (17.2%) | 3.00 |
| Single Female/Mother | 38 (24.2%) | 2.34 |
| Total Families | 157 (100.0%) | 2.81 |
Median Household Size in North Rose
The median household size in North Rose is 2.36 persons per household, with single male/father households (27 | 10.8%) accounting for the largest median household size of 4.37 persons per household. non-family households (92 | 36.9%) represent the smallest median household size with 1.20 persons per household.
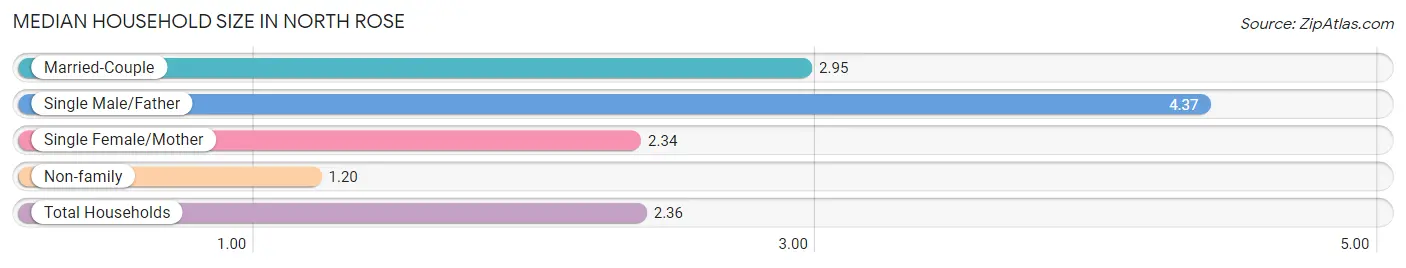
| Household Type | # Households | Household Size |
| Married-Couple | 92 (36.9%) | 2.95 |
| Single Male/Father | 27 (10.8%) | 4.37 |
| Single Female/Mother | 38 (15.3%) | 2.34 |
| Non-family | 92 (36.9%) | 1.20 |
| Total Households | 249 (100.0%) | 2.36 |
Household Size by Marriage Status in North Rose
Out of a total of 249 households in North Rose, 157 (63.0%) are family households, while 92 (36.9%) are nonfamily households. The most numerous type of family households are 2-person households, comprising 84, and the most common type of nonfamily households are 1-person households, comprising 58.
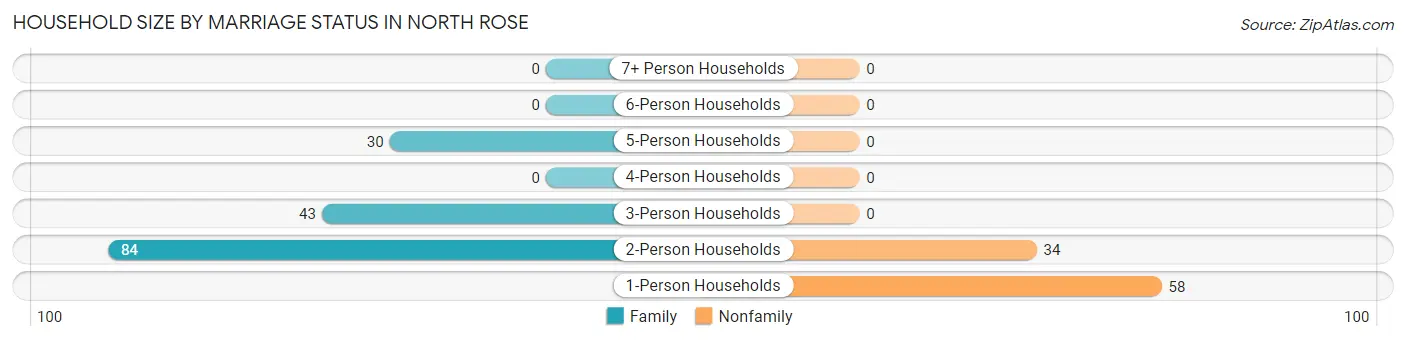
| Household Size | Family Households | Nonfamily Households |
| 1-Person Households | - | 58 (23.3%) |
| 2-Person Households | 84 (33.7%) | 34 (13.7%) |
| 3-Person Households | 43 (17.3%) | 0 (0.0%) |
| 4-Person Households | 0 (0.0%) | 0 (0.0%) |
| 5-Person Households | 30 (12.0%) | 0 (0.0%) |
| 6-Person Households | 0 (0.0%) | 0 (0.0%) |
| 7+ Person Households | 0 (0.0%) | 0 (0.0%) |
| Total | 157 (63.0%) | 92 (36.9%) |
Female Fertility in North Rose
Fertility by Age in North Rose
| Age Bracket | Women with Births | Births / 1,000 Women |
| 15 to 19 years | 0 (0.0%) | 0.0 |
| 20 to 34 years | 0 (0.0%) | 0.0 |
| 35 to 50 years | 0 (0.0%) | 0.0 |
| Total | 0 (0.0%) | 0.0 |
Fertility by Age by Marriage Status in North Rose
| Age Bracket | Married | Unmarried |
| 15 to 19 years | 0 (0.0%) | 0 (0.0%) |
| 20 to 34 years | 0 (0.0%) | 0 (0.0%) |
| 35 to 50 years | 0 (0.0%) | 0 (0.0%) |
| Total | 0 (0.0%) | 0 (0.0%) |
Fertility by Education in North Rose
| Educational Attainment | Women with Births | Births / 1,000 Women |
| Less than High School | 0 (0.0%) | 0.0 |
| High School Diploma | 0 (0.0%) | 0.0 |
| College or Associate's Degree | 0 (0.0%) | 0.0 |
| Bachelor's Degree | 0 (0.0%) | 0.0 |
| Graduate Degree | 0 (0.0%) | 0.0 |
| Total | 0 (0.0%) | 0.0 |
Fertility by Education by Marriage Status in North Rose
| Educational Attainment | Married | Unmarried |
| Less than High School | 0 (0.0%) | 0 (0.0%) |
| High School Diploma | 0 (0.0%) | 0 (0.0%) |
| College or Associate's Degree | 0 (0.0%) | 0 (0.0%) |
| Bachelor's Degree | 0 (0.0%) | 0 (0.0%) |
| Graduate Degree | 0 (0.0%) | 0 (0.0%) |
| Total | 0 (0.0%) | 0 (0.0%) |
Employment Characteristics in North Rose
Employment by Class of Employer in North Rose
Among the 266 employed individuals in North Rose, private company employees (185 | 69.6%), self-employed (not incorporated) (27 | 10.2%), and local government employees (26 | 9.8%) make up the most common classes of employment.
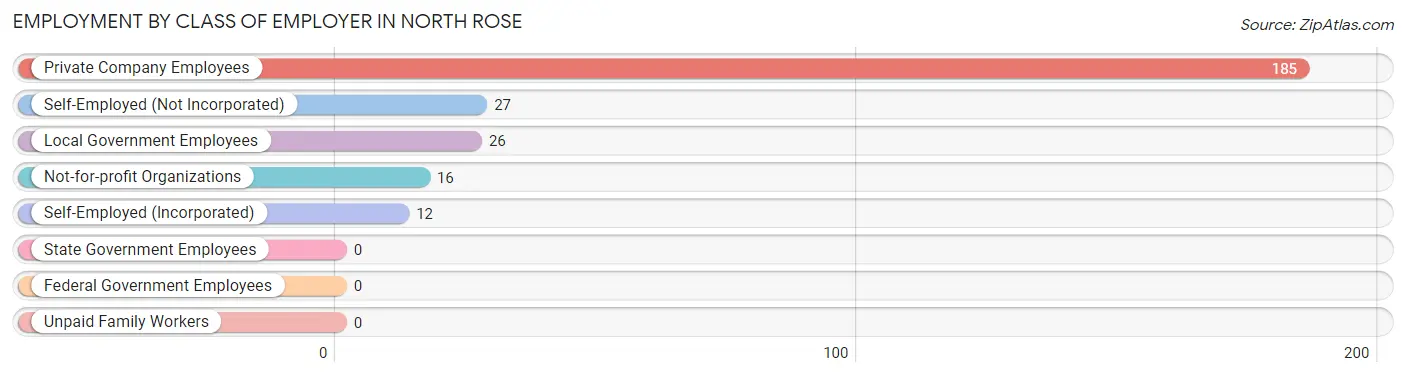
| Employer Class | # Employees | % Employees |
| Private Company Employees | 185 | 69.6% |
| Self-Employed (Incorporated) | 12 | 4.5% |
| Self-Employed (Not Incorporated) | 27 | 10.2% |
| Not-for-profit Organizations | 16 | 6.0% |
| Local Government Employees | 26 | 9.8% |
| State Government Employees | 0 | 0.0% |
| Federal Government Employees | 0 | 0.0% |
| Unpaid Family Workers | 0 | 0.0% |
| Total | 266 | 100.0% |
Employment Status by Age in North Rose
According to the labor force statistics for North Rose, out of the total population over 16 years of age (460), 62.4% or 287 individuals are in the labor force, with 7.3% or 21 of them unemployed. The age group with the highest labor force participation rate is 16 to 19 years, with 100.0% or 18 individuals in the labor force. Within the labor force, the 16 to 19 years age range has the highest percentage of unemployed individuals, with 100.0% or 18 of them being unemployed.
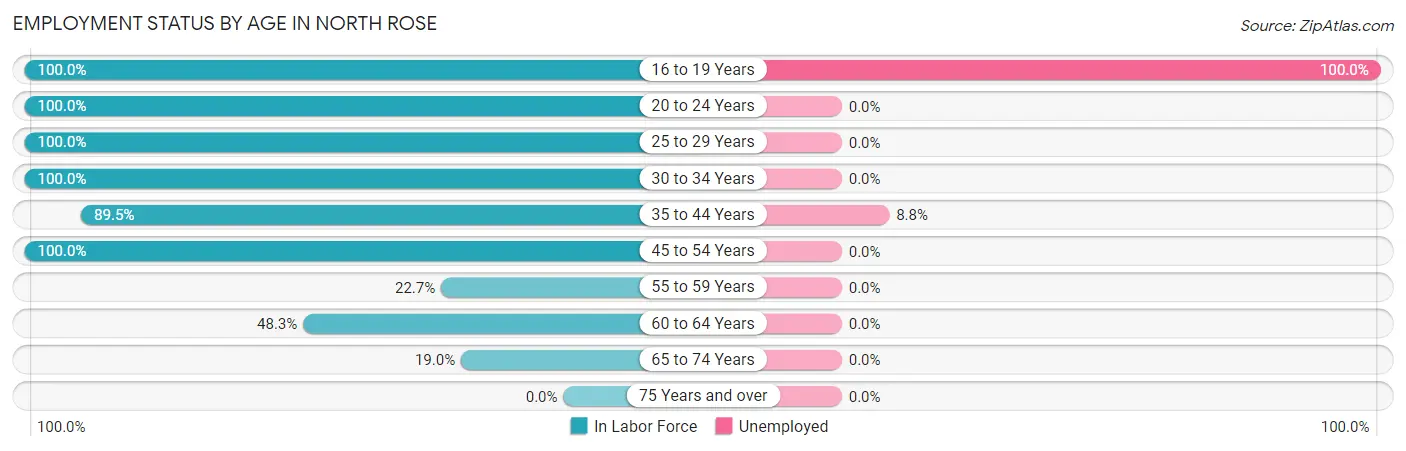
| Age Bracket | In Labor Force | Unemployed |
| 16 to 19 Years | 18 (100.0%) | 18 (100.0%) |
| 20 to 24 Years | 54 (100.0%) | 0 (0.0%) |
| 25 to 29 Years | 7 (100.0%) | 0 (0.0%) |
| 30 to 34 Years | 66 (100.0%) | 0 (0.0%) |
| 35 to 44 Years | 34 (89.5%) | 3 (8.8%) |
| 45 to 54 Years | 68 (100.0%) | 0 (0.0%) |
| 55 to 59 Years | 10 (22.7%) | 0 (0.0%) |
| 60 to 64 Years | 14 (48.3%) | 0 (0.0%) |
| 65 to 74 Years | 16 (19.0%) | 0 (0.0%) |
| 75 Years and over | 0 (0.0%) | 0 (0.0%) |
| Total | 287 (62.4%) | 21 (7.3%) |
Employment Status by Educational Attainment in North Rose
According to labor force statistics for North Rose, 79.0% of individuals (199) out of the total population between 25 and 64 years of age (252) are in the labor force, with 1.5% or 3 of them being unemployed. The group with the highest labor force participation rate are those with the educational attainment of bachelor's degree or higher, with 100.0% or 34 individuals in the labor force. Within the labor force, individuals with bachelor's degree or higher education have the highest percentage of unemployment, with 8.8% or 3 of them being unemployed.
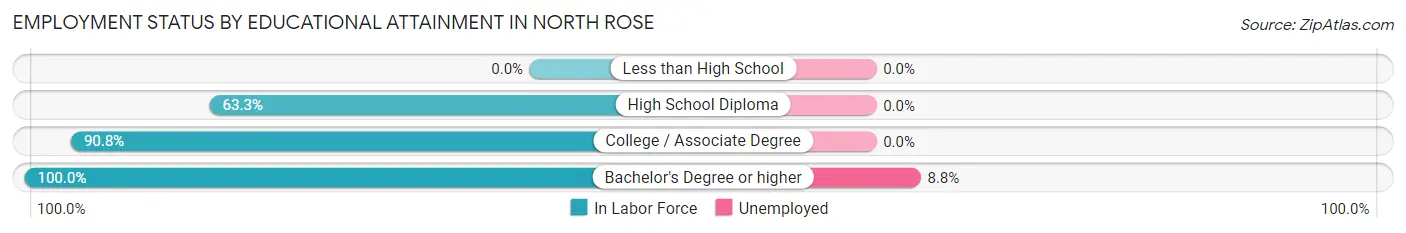
| Educational Attainment | In Labor Force | Unemployed |
| Less than High School | 0 (0.0%) | 0 (0.0%) |
| High School Diploma | 76 (63.3%) | 0 (0.0%) |
| College / Associate Degree | 89 (90.8%) | 0 (0.0%) |
| Bachelor's Degree or higher | 34 (100.0%) | 3 (8.8%) |
| Total | 199 (79.0%) | 4 (1.5%) |
Employment Occupations by Sex in North Rose
Management, Business, Science and Arts Occupations
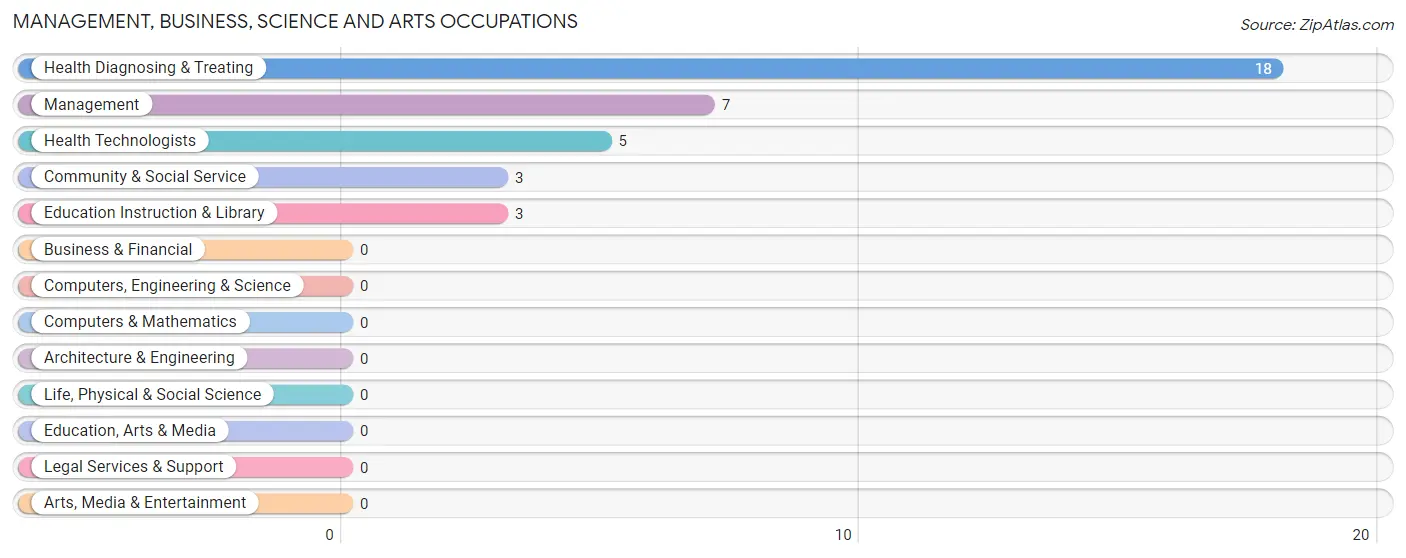
The most common Management, Business, Science and Arts occupations in North Rose are Health Diagnosing & Treating (18 | 6.8%), Management (7 | 2.6%), Health Technologists (5 | 1.9%), Community & Social Service (3 | 1.1%), and Education Instruction & Library (3 | 1.1%).
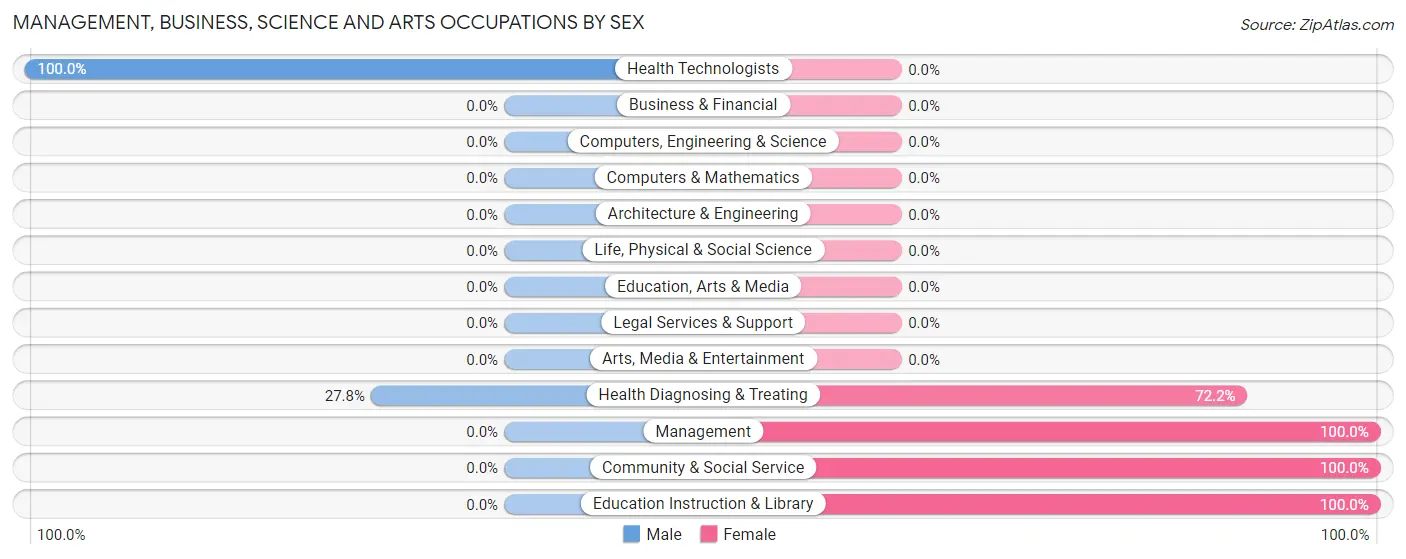
Management, Business, Science and Arts Occupations by Sex
Within the Management, Business, Science and Arts occupations in North Rose, the most male-oriented occupations are Health Technologists (100.0%), and Health Diagnosing & Treating (27.8%), while the most female-oriented occupations are Management (100.0%), Community & Social Service (100.0%), and Education Instruction & Library (100.0%).
| Occupation | Male | Female |
| Management | 0 (0.0%) | 7 (100.0%) |
| Business & Financial | 0 (0.0%) | 0 (0.0%) |
| Computers, Engineering & Science | 0 (0.0%) | 0 (0.0%) |
| Computers & Mathematics | 0 (0.0%) | 0 (0.0%) |
| Architecture & Engineering | 0 (0.0%) | 0 (0.0%) |
| Life, Physical & Social Science | 0 (0.0%) | 0 (0.0%) |
| Community & Social Service | 0 (0.0%) | 3 (100.0%) |
| Education, Arts & Media | 0 (0.0%) | 0 (0.0%) |
| Legal Services & Support | 0 (0.0%) | 0 (0.0%) |
| Education Instruction & Library | 0 (0.0%) | 3 (100.0%) |
| Arts, Media & Entertainment | 0 (0.0%) | 0 (0.0%) |
| Health Diagnosing & Treating | 5 (27.8%) | 13 (72.2%) |
| Health Technologists | 5 (100.0%) | 0 (0.0%) |
| Total (Category) | 5 (17.9%) | 23 (82.1%) |
| Total (Overall) | 128 (48.1%) | 138 (51.9%) |
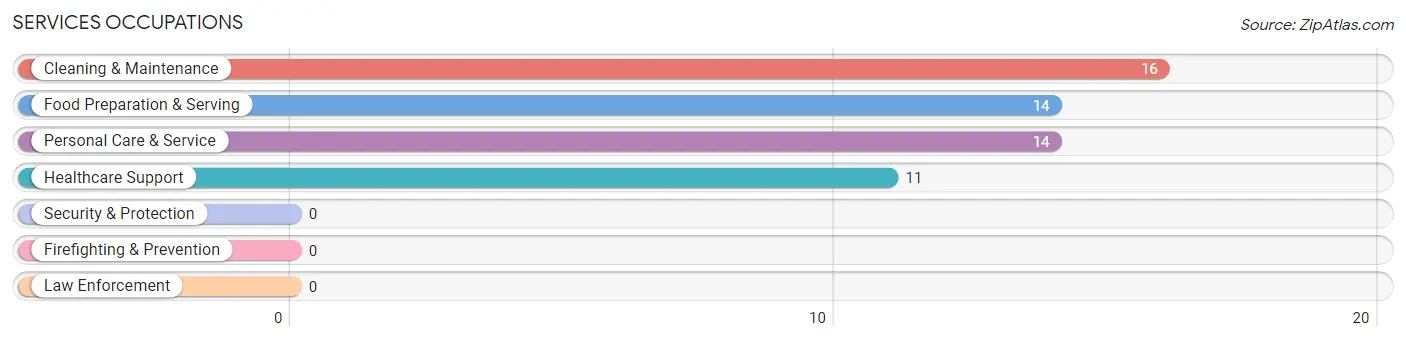
Services Occupations
The most common Services occupations in North Rose are Cleaning & Maintenance (16 | 6.0%), Food Preparation & Serving (14 | 5.3%), Personal Care & Service (14 | 5.3%), and Healthcare Support (11 | 4.1%).
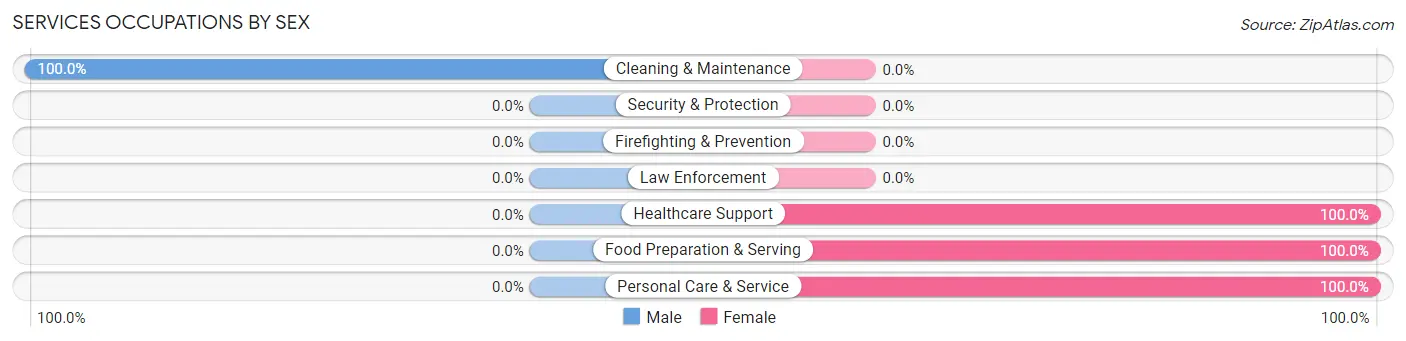
Services Occupations by Sex
| Occupation | Male | Female |
| Healthcare Support | 0 (0.0%) | 11 (100.0%) |
| Security & Protection | 0 (0.0%) | 0 (0.0%) |
| Firefighting & Prevention | 0 (0.0%) | 0 (0.0%) |
| Law Enforcement | 0 (0.0%) | 0 (0.0%) |
| Food Preparation & Serving | 0 (0.0%) | 14 (100.0%) |
| Cleaning & Maintenance | 16 (100.0%) | 0 (0.0%) |
| Personal Care & Service | 0 (0.0%) | 14 (100.0%) |
| Total (Category) | 16 (29.1%) | 39 (70.9%) |
| Total (Overall) | 128 (48.1%) | 138 (51.9%) |
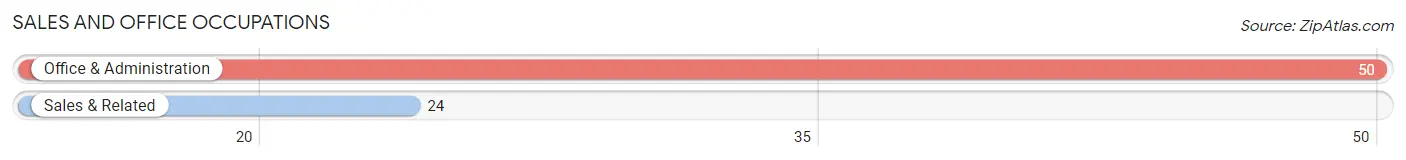
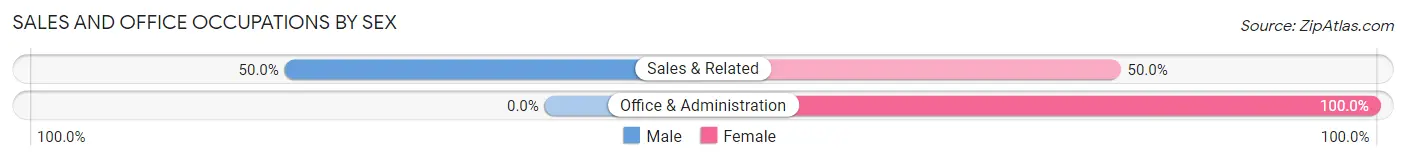
Sales and Office Occupations
The most common Sales and Office occupations in North Rose are Office & Administration (50 | 18.8%), and Sales & Related (24 | 9.0%).
Sales and Office Occupations by Sex
| Occupation | Male | Female |
| Sales & Related | 12 (50.0%) | 12 (50.0%) |
| Office & Administration | 0 (0.0%) | 50 (100.0%) |
| Total (Category) | 12 (16.2%) | 62 (83.8%) |
| Total (Overall) | 128 (48.1%) | 138 (51.9%) |
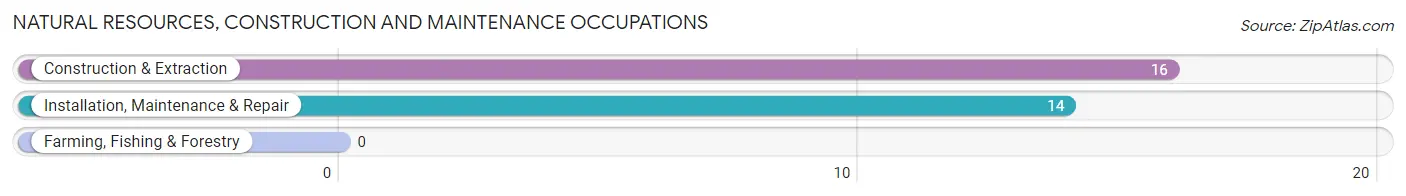
Natural Resources, Construction and Maintenance Occupations
The most common Natural Resources, Construction and Maintenance occupations in North Rose are Construction & Extraction (16 | 6.0%), and Installation, Maintenance & Repair (14 | 5.3%).
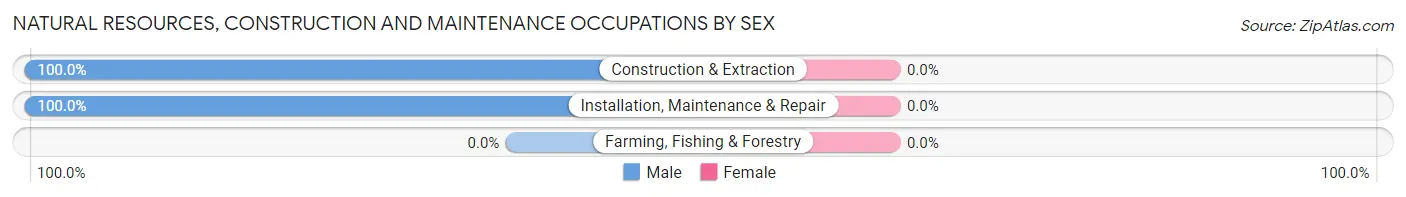
Natural Resources, Construction and Maintenance Occupations by Sex
| Occupation | Male | Female |
| Farming, Fishing & Forestry | 0 (0.0%) | 0 (0.0%) |
| Construction & Extraction | 16 (100.0%) | 0 (0.0%) |
| Installation, Maintenance & Repair | 14 (100.0%) | 0 (0.0%) |
| Total (Category) | 30 (100.0%) | 0 (0.0%) |
| Total (Overall) | 128 (48.1%) | 138 (51.9%) |
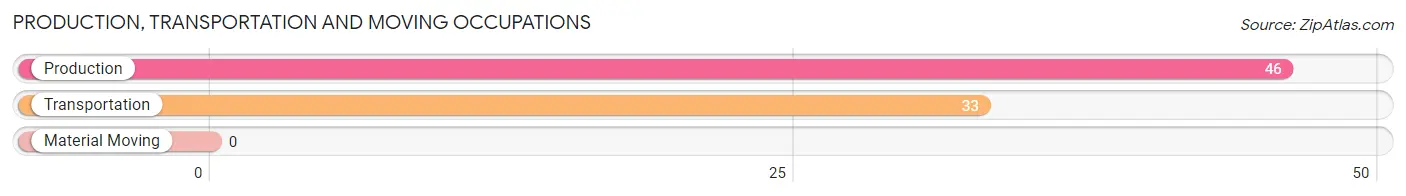
Production, Transportation and Moving Occupations
The most common Production, Transportation and Moving occupations in North Rose are Production (46 | 17.3%), and Transportation (33 | 12.4%).
Production, Transportation and Moving Occupations by Sex
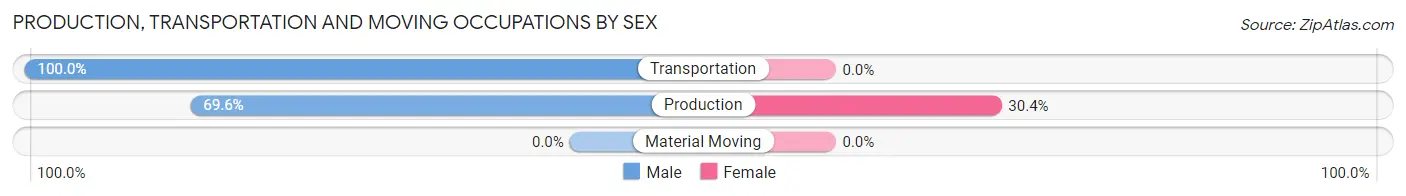
| Occupation | Male | Female |
| Production | 32 (69.6%) | 14 (30.4%) |
| Transportation | 33 (100.0%) | 0 (0.0%) |
| Material Moving | 0 (0.0%) | 0 (0.0%) |
| Total (Category) | 65 (82.3%) | 14 (17.7%) |
| Total (Overall) | 128 (48.1%) | 138 (51.9%) |
Employment Industries by Sex in North Rose
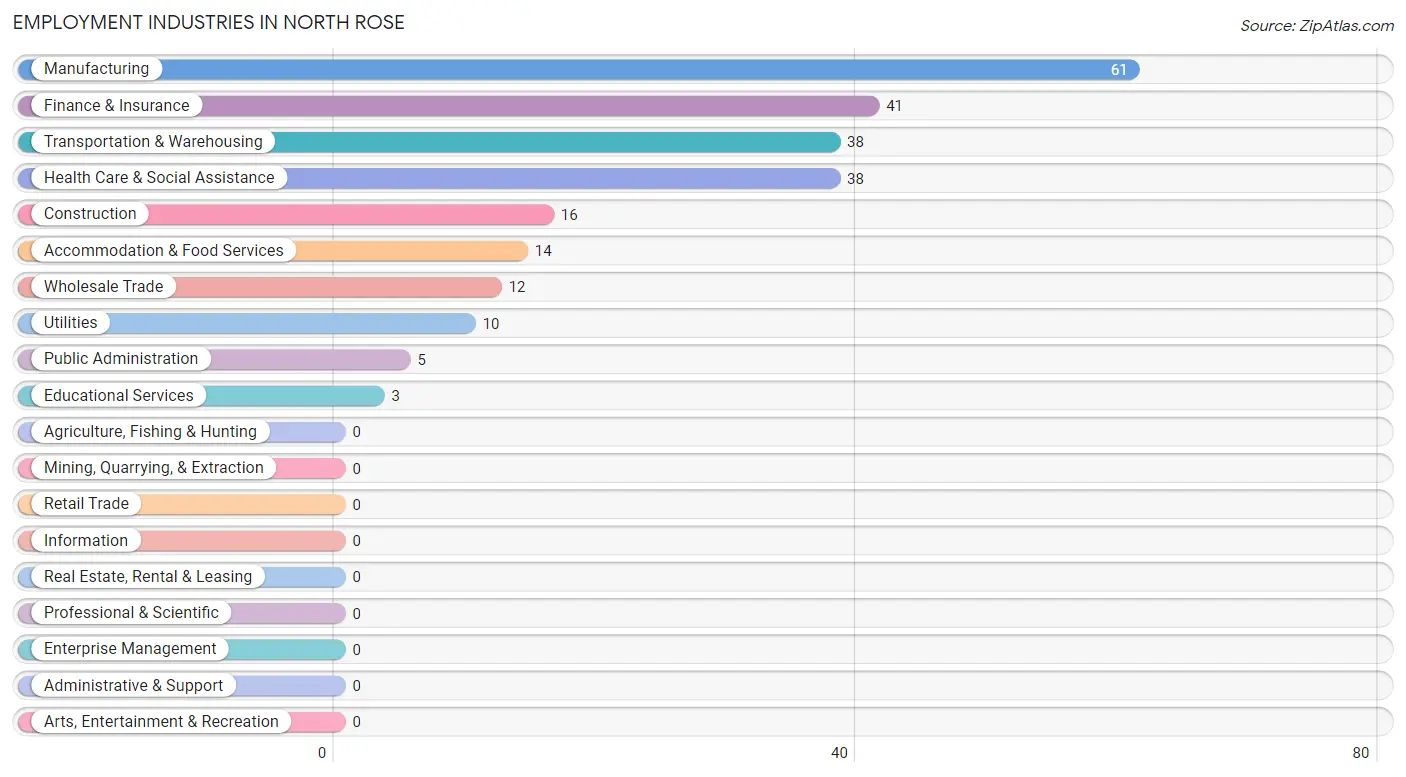
Employment Industries in North Rose
The major employment industries in North Rose include Manufacturing (61 | 22.9%), Finance & Insurance (41 | 15.4%), Transportation & Warehousing (38 | 14.3%), Health Care & Social Assistance (38 | 14.3%), and Construction (16 | 6.0%).
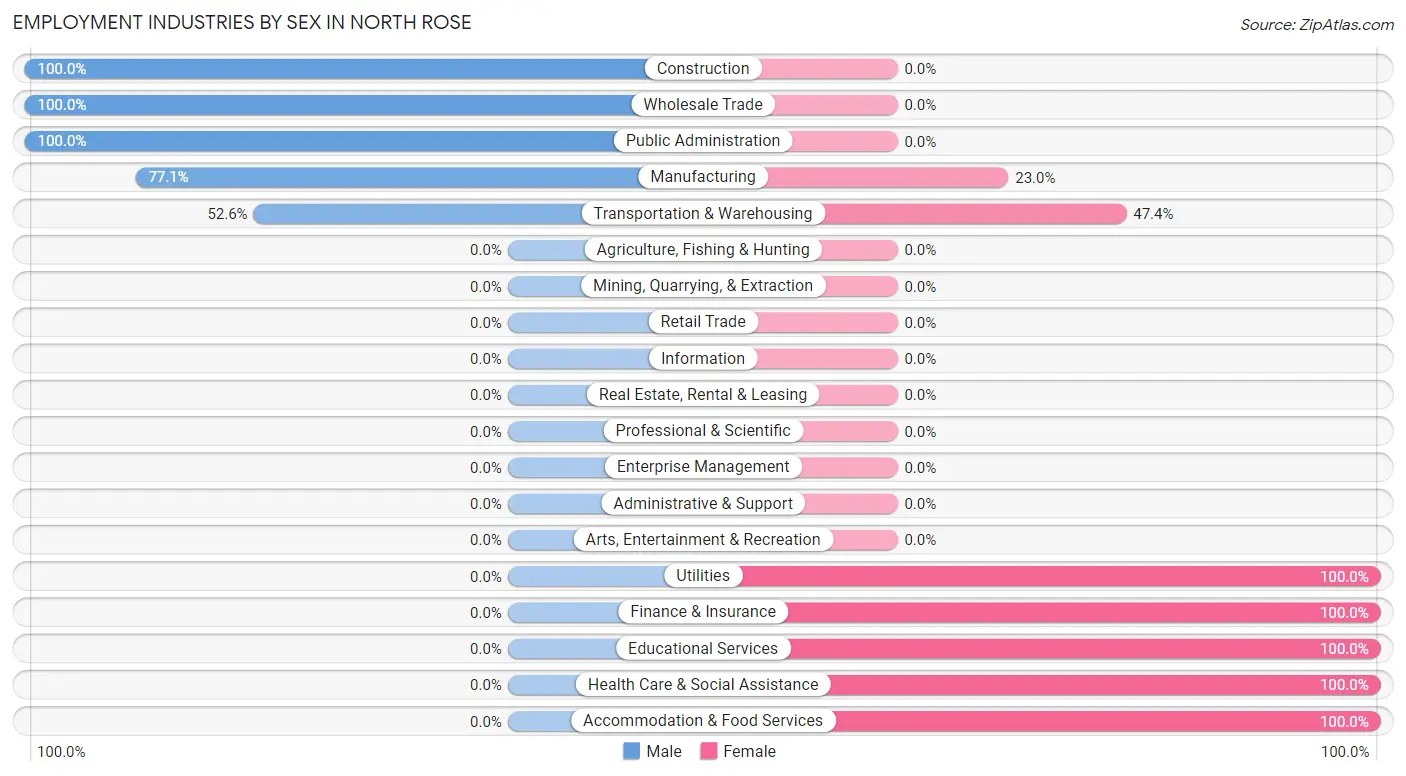
Employment Industries by Sex in North Rose
The North Rose industries that see more men than women are Construction (100.0%), Wholesale Trade (100.0%), and Public Administration (100.0%), whereas the industries that tend to have a higher number of women are Utilities (100.0%), Finance & Insurance (100.0%), and Educational Services (100.0%).
| Industry | Male | Female |
| Agriculture, Fishing & Hunting | 0 (0.0%) | 0 (0.0%) |
| Mining, Quarrying, & Extraction | 0 (0.0%) | 0 (0.0%) |
| Construction | 16 (100.0%) | 0 (0.0%) |
| Manufacturing | 47 (77.0%) | 14 (23.0%) |
| Wholesale Trade | 12 (100.0%) | 0 (0.0%) |
| Retail Trade | 0 (0.0%) | 0 (0.0%) |
| Transportation & Warehousing | 20 (52.6%) | 18 (47.4%) |
| Utilities | 0 (0.0%) | 10 (100.0%) |
| Information | 0 (0.0%) | 0 (0.0%) |
| Finance & Insurance | 0 (0.0%) | 41 (100.0%) |
| Real Estate, Rental & Leasing | 0 (0.0%) | 0 (0.0%) |
| Professional & Scientific | 0 (0.0%) | 0 (0.0%) |
| Enterprise Management | 0 (0.0%) | 0 (0.0%) |
| Administrative & Support | 0 (0.0%) | 0 (0.0%) |
| Educational Services | 0 (0.0%) | 3 (100.0%) |
| Health Care & Social Assistance | 0 (0.0%) | 38 (100.0%) |
| Arts, Entertainment & Recreation | 0 (0.0%) | 0 (0.0%) |
| Accommodation & Food Services | 0 (0.0%) | 14 (100.0%) |
| Public Administration | 5 (100.0%) | 0 (0.0%) |
| Total | 128 (48.1%) | 138 (51.9%) |
Education in North Rose
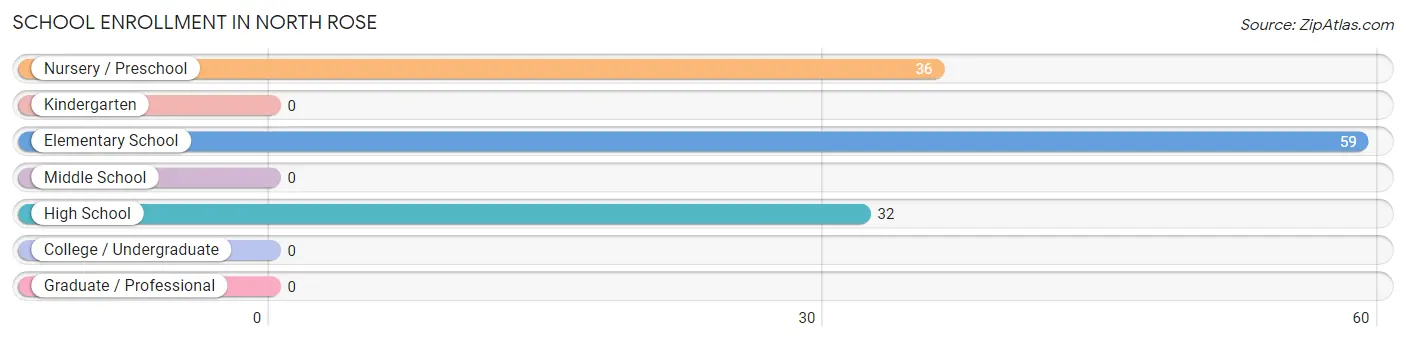
School Enrollment in North Rose
The most common levels of schooling among the 127 students in North Rose are elementary school (59 | 46.5%), nursery / preschool (36 | 28.3%), and high school (32 | 25.2%).
| School Level | # Students | % Students |
| Nursery / Preschool | 36 | 28.3% |
| Kindergarten | 0 | 0.0% |
| Elementary School | 59 | 46.5% |
| Middle School | 0 | 0.0% |
| High School | 32 | 25.2% |
| College / Undergraduate | 0 | 0.0% |
| Graduate / Professional | 0 | 0.0% |
| Total | 127 | 100.0% |
School Enrollment by Age by Funding Source in North Rose
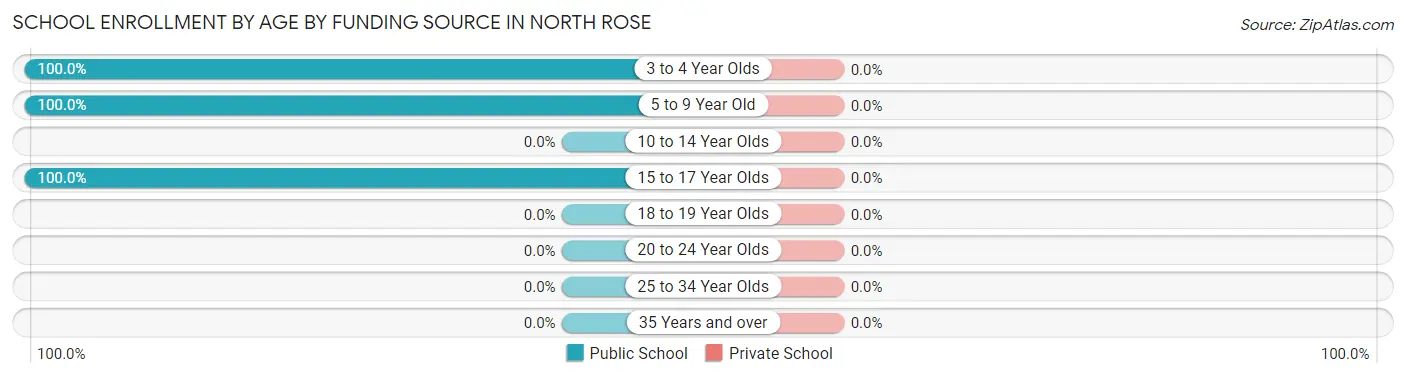
| Age Bracket | Public School | Private School |
| 3 to 4 Year Olds | 36 (100.0%) | 0 (0.0%) |
| 5 to 9 Year Old | 59 (100.0%) | 0 (0.0%) |
| 10 to 14 Year Olds | 0 (0.0%) | 0 (0.0%) |
| 15 to 17 Year Olds | 32 (100.0%) | 0 (0.0%) |
| 18 to 19 Year Olds | 0 (0.0%) | 0 (0.0%) |
| 20 to 24 Year Olds | 0 (0.0%) | 0 (0.0%) |
| 25 to 34 Year Olds | 0 (0.0%) | 0 (0.0%) |
| 35 Years and over | 0 (0.0%) | 0 (0.0%) |
| Total | 127 (100.0%) | 0 (0.0%) |
Educational Attainment by Field of Study in North Rose
Arts & humanities (26 | 37.7%), psychology (14 | 20.3%), bio, nature & agricultural (13 | 18.8%), education (8 | 11.6%), and science & technology (5 | 7.2%) are the most common fields of study among 69 individuals in North Rose who have obtained a bachelor's degree or higher.
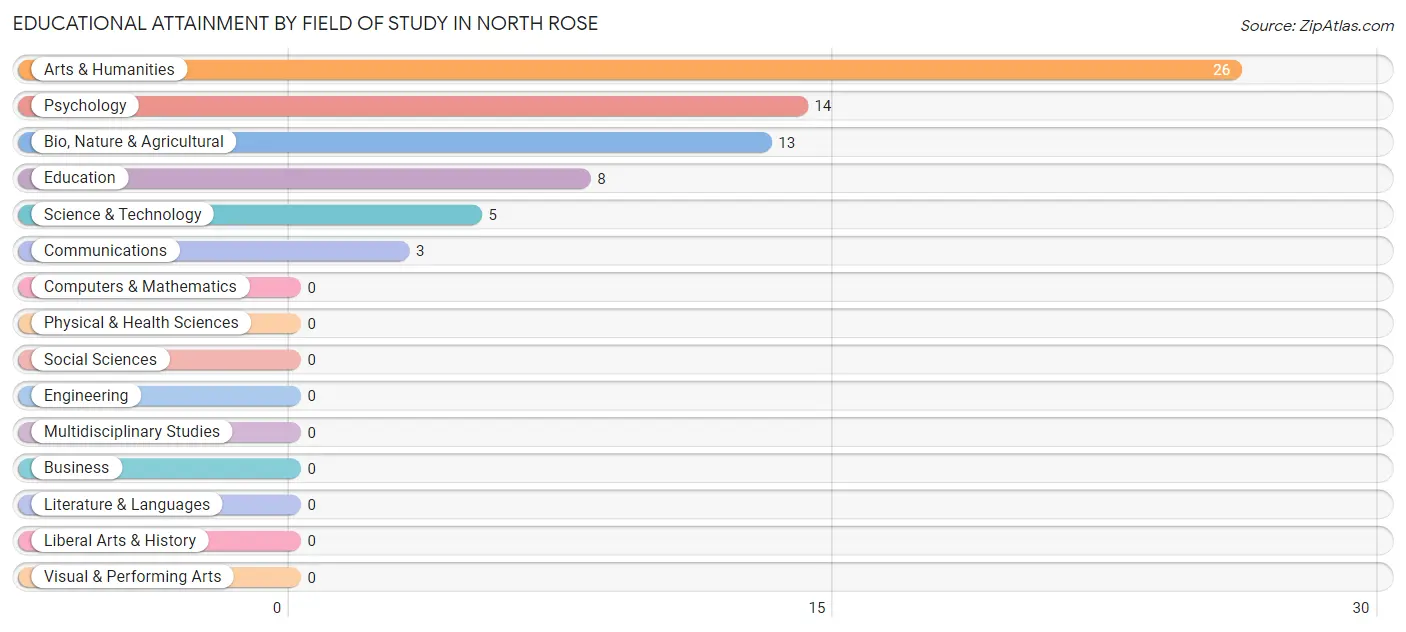
| Field of Study | # Graduates | % Graduates |
| Computers & Mathematics | 0 | 0.0% |
| Bio, Nature & Agricultural | 13 | 18.8% |
| Physical & Health Sciences | 0 | 0.0% |
| Psychology | 14 | 20.3% |
| Social Sciences | 0 | 0.0% |
| Engineering | 0 | 0.0% |
| Multidisciplinary Studies | 0 | 0.0% |
| Science & Technology | 5 | 7.2% |
| Business | 0 | 0.0% |
| Education | 8 | 11.6% |
| Literature & Languages | 0 | 0.0% |
| Liberal Arts & History | 0 | 0.0% |
| Visual & Performing Arts | 0 | 0.0% |
| Communications | 3 | 4.3% |
| Arts & Humanities | 26 | 37.7% |
| Total | 69 | 100.0% |
Transportation & Commute in North Rose
Vehicle Availability by Sex in North Rose
The most prevalent vehicle ownership categories in North Rose are males with 2 vehicles (110, accounting for 85.9%) and females with 2 vehicles (91, making up 79.7%).
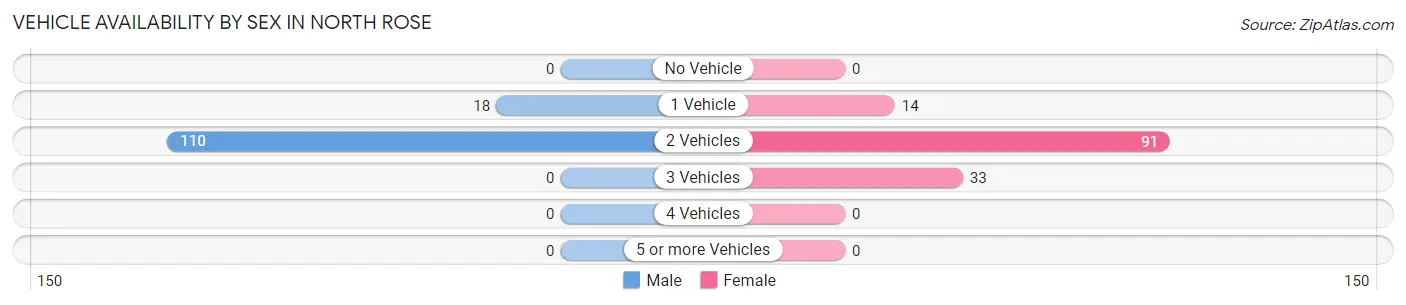
| Vehicles Available | Male | Female |
| No Vehicle | 0 (0.0%) | 0 (0.0%) |
| 1 Vehicle | 18 (14.1%) | 14 (10.1%) |
| 2 Vehicles | 110 (85.9%) | 91 (65.9%) |
| 3 Vehicles | 0 (0.0%) | 33 (23.9%) |
| 4 Vehicles | 0 (0.0%) | 0 (0.0%) |
| 5 or more Vehicles | 0 (0.0%) | 0 (0.0%) |
| Total | 128 (100.0%) | 138 (100.0%) |
Commute Time in North Rose
The most frequently occuring commute durations in North Rose are 5 to 9 minutes (60 commuters, 23.8%), 10 to 14 minutes (47 commuters, 18.6%), and 25 to 29 minutes (46 commuters, 18.2%).
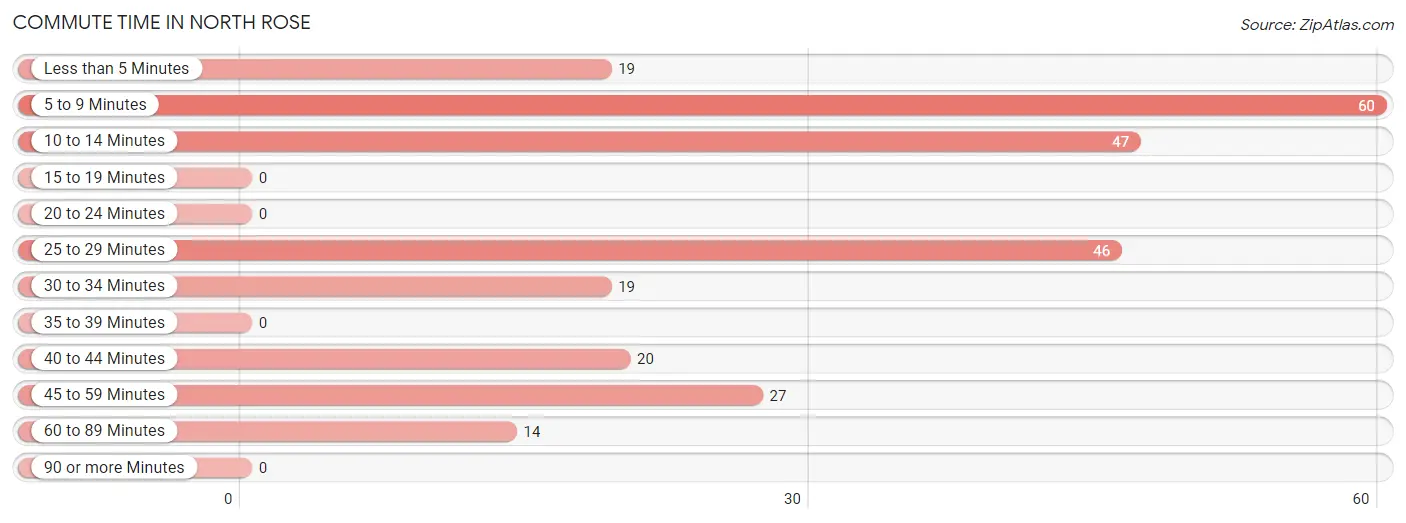
| Commute Time | # Commuters | % Commuters |
| Less than 5 Minutes | 19 | 7.5% |
| 5 to 9 Minutes | 60 | 23.8% |
| 10 to 14 Minutes | 47 | 18.6% |
| 15 to 19 Minutes | 0 | 0.0% |
| 20 to 24 Minutes | 0 | 0.0% |
| 25 to 29 Minutes | 46 | 18.2% |
| 30 to 34 Minutes | 19 | 7.5% |
| 35 to 39 Minutes | 0 | 0.0% |
| 40 to 44 Minutes | 20 | 7.9% |
| 45 to 59 Minutes | 27 | 10.7% |
| 60 to 89 Minutes | 14 | 5.6% |
| 90 or more Minutes | 0 | 0.0% |
Commute Time by Sex in North Rose
The most common commute times in North Rose are 25 to 29 minutes (35 commuters, 27.3%) for males and 5 to 9 minutes (40 commuters, 32.3%) for females.
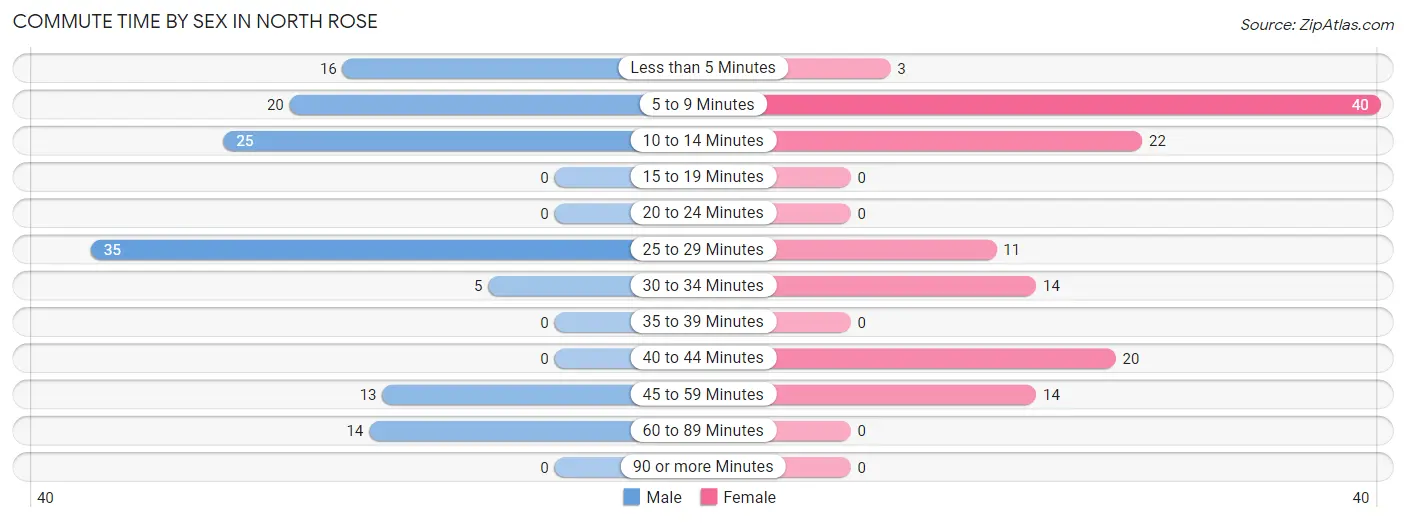
| Commute Time | Male | Female |
| Less than 5 Minutes | 16 (12.5%) | 3 (2.4%) |
| 5 to 9 Minutes | 20 (15.6%) | 40 (32.3%) |
| 10 to 14 Minutes | 25 (19.5%) | 22 (17.7%) |
| 15 to 19 Minutes | 0 (0.0%) | 0 (0.0%) |
| 20 to 24 Minutes | 0 (0.0%) | 0 (0.0%) |
| 25 to 29 Minutes | 35 (27.3%) | 11 (8.9%) |
| 30 to 34 Minutes | 5 (3.9%) | 14 (11.3%) |
| 35 to 39 Minutes | 0 (0.0%) | 0 (0.0%) |
| 40 to 44 Minutes | 0 (0.0%) | 20 (16.1%) |
| 45 to 59 Minutes | 13 (10.2%) | 14 (11.3%) |
| 60 to 89 Minutes | 14 (10.9%) | 0 (0.0%) |
| 90 or more Minutes | 0 (0.0%) | 0 (0.0%) |
Time of Departure to Work by Sex in North Rose
The most frequent times of departure to work in North Rose are 4:00 PM to 11:59 PM (43, 33.6%) for males and 7:00 AM to 7:29 AM (35, 28.2%) for females.
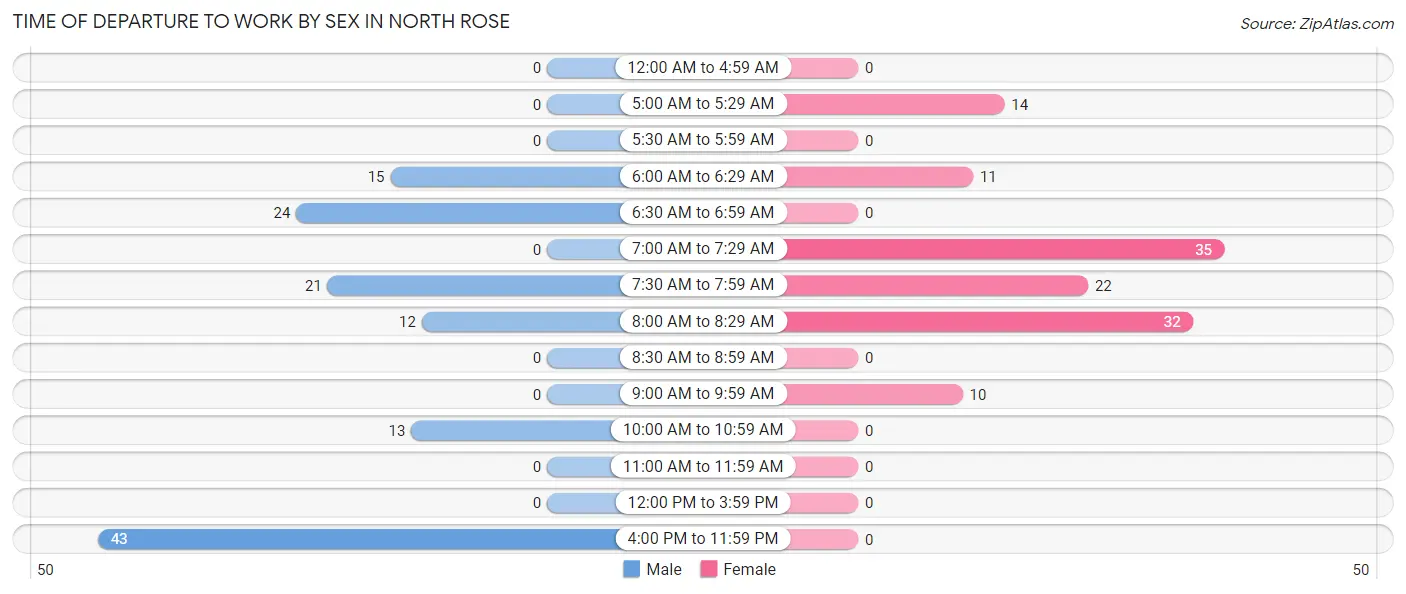
| Time of Departure | Male | Female |
| 12:00 AM to 4:59 AM | 0 (0.0%) | 0 (0.0%) |
| 5:00 AM to 5:29 AM | 0 (0.0%) | 14 (11.3%) |
| 5:30 AM to 5:59 AM | 0 (0.0%) | 0 (0.0%) |
| 6:00 AM to 6:29 AM | 15 (11.7%) | 11 (8.9%) |
| 6:30 AM to 6:59 AM | 24 (18.8%) | 0 (0.0%) |
| 7:00 AM to 7:29 AM | 0 (0.0%) | 35 (28.2%) |
| 7:30 AM to 7:59 AM | 21 (16.4%) | 22 (17.7%) |
| 8:00 AM to 8:29 AM | 12 (9.4%) | 32 (25.8%) |
| 8:30 AM to 8:59 AM | 0 (0.0%) | 0 (0.0%) |
| 9:00 AM to 9:59 AM | 0 (0.0%) | 10 (8.1%) |
| 10:00 AM to 10:59 AM | 13 (10.2%) | 0 (0.0%) |
| 11:00 AM to 11:59 AM | 0 (0.0%) | 0 (0.0%) |
| 12:00 PM to 3:59 PM | 0 (0.0%) | 0 (0.0%) |
| 4:00 PM to 11:59 PM | 43 (33.6%) | 0 (0.0%) |
| Total | 128 (100.0%) | 124 (100.0%) |
Housing Occupancy in North Rose
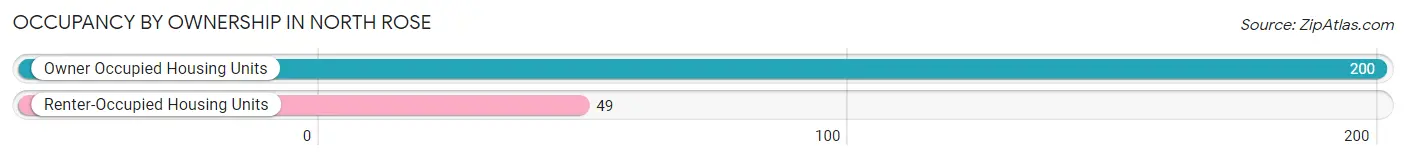
Occupancy by Ownership in North Rose
Of the total 249 dwellings in North Rose, owner-occupied units account for 200 (80.3%), while renter-occupied units make up 49 (19.7%).
| Occupancy | # Housing Units | % Housing Units |
| Owner Occupied Housing Units | 200 | 80.3% |
| Renter-Occupied Housing Units | 49 | 19.7% |
| Total Occupied Housing Units | 249 | 100.0% |
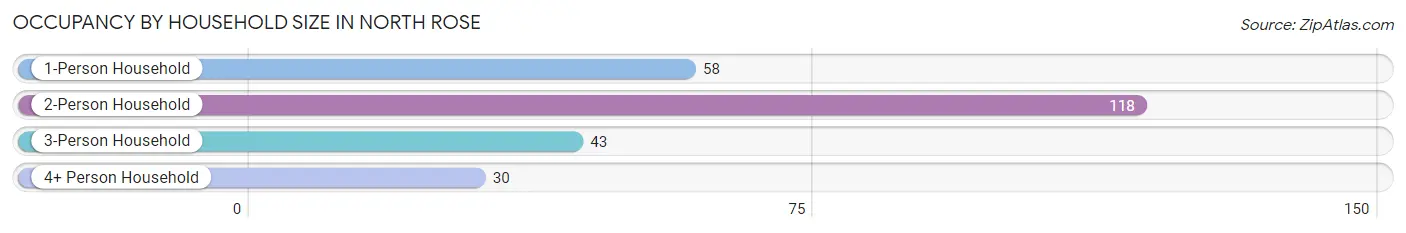
Occupancy by Household Size in North Rose
| Household Size | # Housing Units | % Housing Units |
| 1-Person Household | 58 | 23.3% |
| 2-Person Household | 118 | 47.4% |
| 3-Person Household | 43 | 17.3% |
| 4+ Person Household | 30 | 12.0% |
| Total Housing Units | 249 | 100.0% |
Occupancy by Ownership by Household Size in North Rose
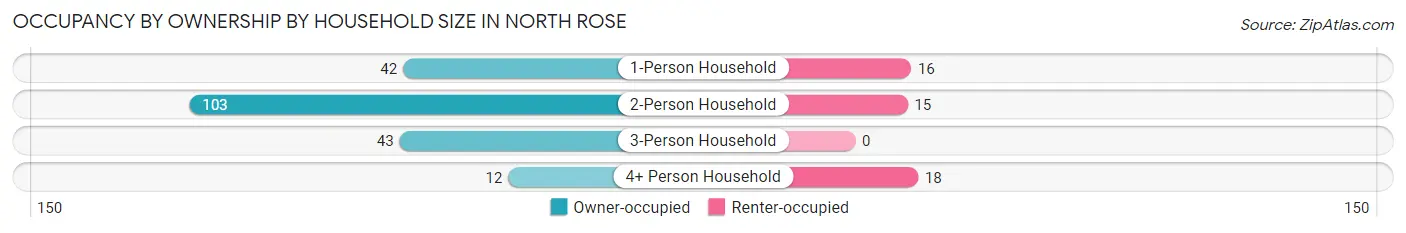
| Household Size | Owner-occupied | Renter-occupied |
| 1-Person Household | 42 (72.4%) | 16 (27.6%) |
| 2-Person Household | 103 (87.3%) | 15 (12.7%) |
| 3-Person Household | 43 (100.0%) | 0 (0.0%) |
| 4+ Person Household | 12 (40.0%) | 18 (60.0%) |
| Total Housing Units | 200 (80.3%) | 49 (19.7%) |
Occupancy by Educational Attainment in North Rose
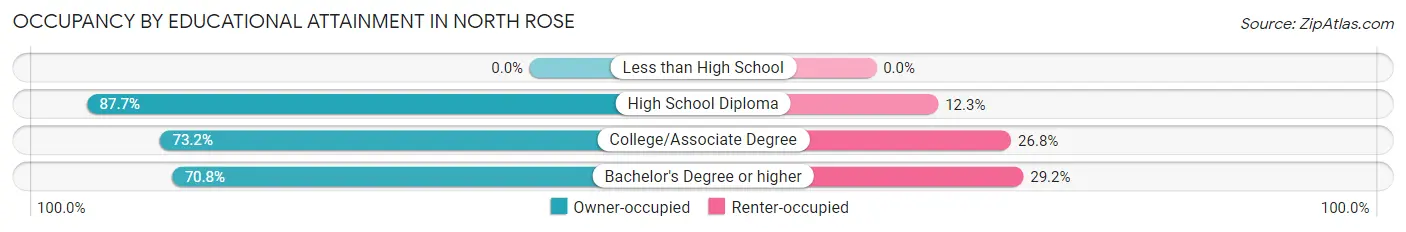
| Household Size | Owner-occupied | Renter-occupied |
| Less than High School | 0 (0.0%) | 0 (0.0%) |
| High School Diploma | 114 (87.7%) | 16 (12.3%) |
| College/Associate Degree | 52 (73.2%) | 19 (26.8%) |
| Bachelor's Degree or higher | 34 (70.8%) | 14 (29.2%) |
Occupancy by Age of Householder in North Rose
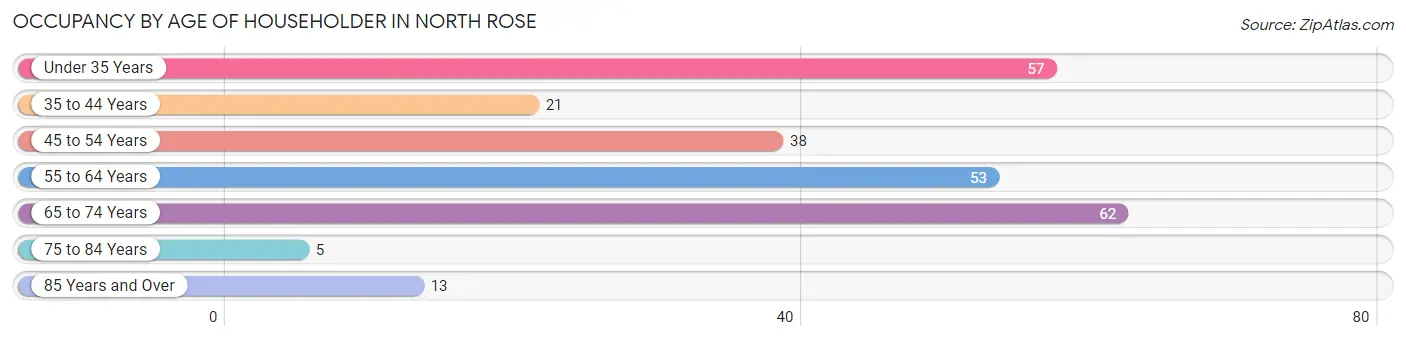
| Age Bracket | # Households | % Households |
| Under 35 Years | 57 | 22.9% |
| 35 to 44 Years | 21 | 8.4% |
| 45 to 54 Years | 38 | 15.3% |
| 55 to 64 Years | 53 | 21.3% |
| 65 to 74 Years | 62 | 24.9% |
| 75 to 84 Years | 5 | 2.0% |
| 85 Years and Over | 13 | 5.2% |
| Total | 249 | 100.0% |
Housing Finances in North Rose
Median Income by Occupancy in North Rose
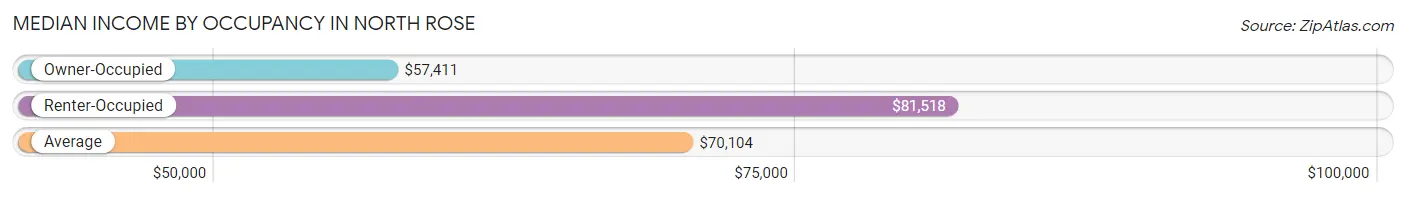
| Occupancy Type | # Households | Median Income |
| Owner-Occupied | 200 (80.3%) | $57,411 |
| Renter-Occupied | 49 (19.7%) | $81,518 |
| Average | 249 (100.0%) | $70,104 |
Occupancy by Householder Income Bracket in North Rose
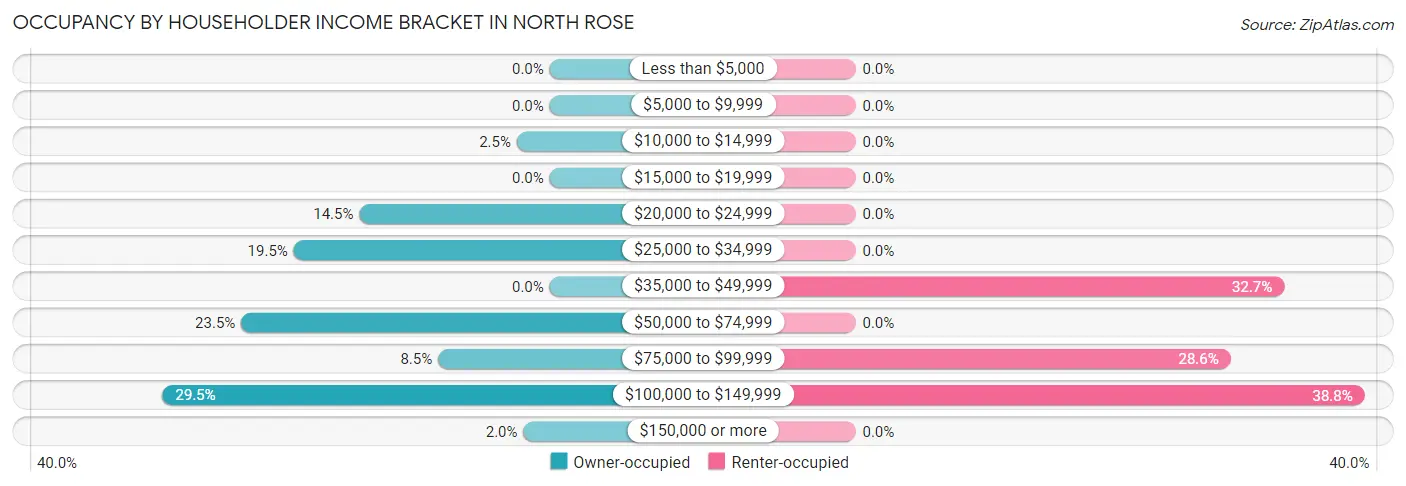
| Income Bracket | Owner-occupied | Renter-occupied |
| Less than $5,000 | 0 (0.0%) | 0 (0.0%) |
| $5,000 to $9,999 | 0 (0.0%) | 0 (0.0%) |
| $10,000 to $14,999 | 5 (2.5%) | 0 (0.0%) |
| $15,000 to $19,999 | 0 (0.0%) | 0 (0.0%) |
| $20,000 to $24,999 | 29 (14.5%) | 0 (0.0%) |
| $25,000 to $34,999 | 39 (19.5%) | 0 (0.0%) |
| $35,000 to $49,999 | 0 (0.0%) | 16 (32.7%) |
| $50,000 to $74,999 | 47 (23.5%) | 0 (0.0%) |
| $75,000 to $99,999 | 17 (8.5%) | 14 (28.6%) |
| $100,000 to $149,999 | 59 (29.5%) | 19 (38.8%) |
| $150,000 or more | 4 (2.0%) | 0 (0.0%) |
| Total | 200 (100.0%) | 49 (100.0%) |
Monthly Housing Cost Tiers in North Rose
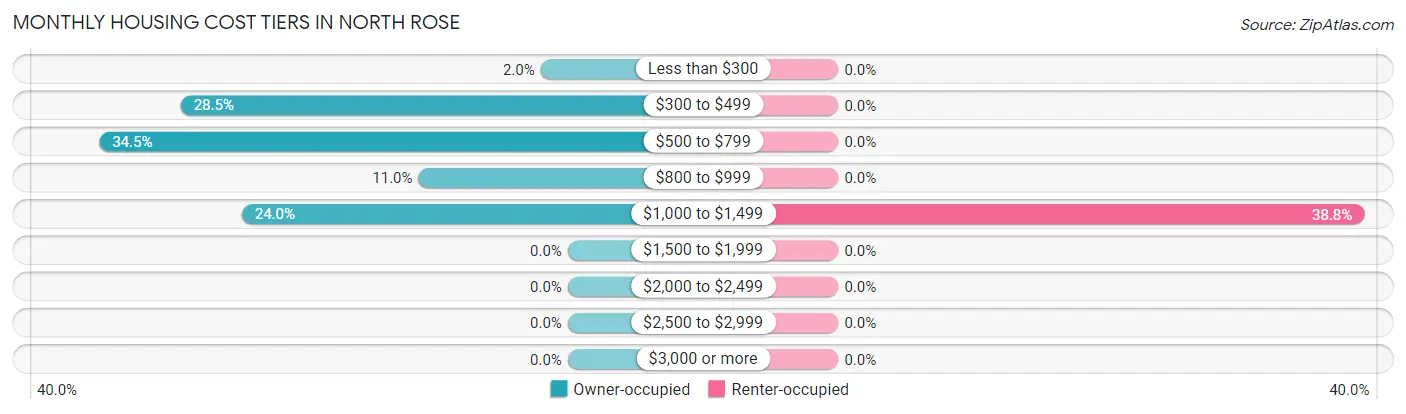
| Monthly Cost | Owner-occupied | Renter-occupied |
| Less than $300 | 4 (2.0%) | 0 (0.0%) |
| $300 to $499 | 57 (28.5%) | 0 (0.0%) |
| $500 to $799 | 69 (34.5%) | 0 (0.0%) |
| $800 to $999 | 22 (11.0%) | 0 (0.0%) |
| $1,000 to $1,499 | 48 (24.0%) | 19 (38.8%) |
| $1,500 to $1,999 | 0 (0.0%) | 0 (0.0%) |
| $2,000 to $2,499 | 0 (0.0%) | 0 (0.0%) |
| $2,500 to $2,999 | 0 (0.0%) | 0 (0.0%) |
| $3,000 or more | 0 (0.0%) | 0 (0.0%) |
| Total | 200 (100.0%) | 49 (100.0%) |
Physical Housing Characteristics in North Rose
Housing Structures in North Rose
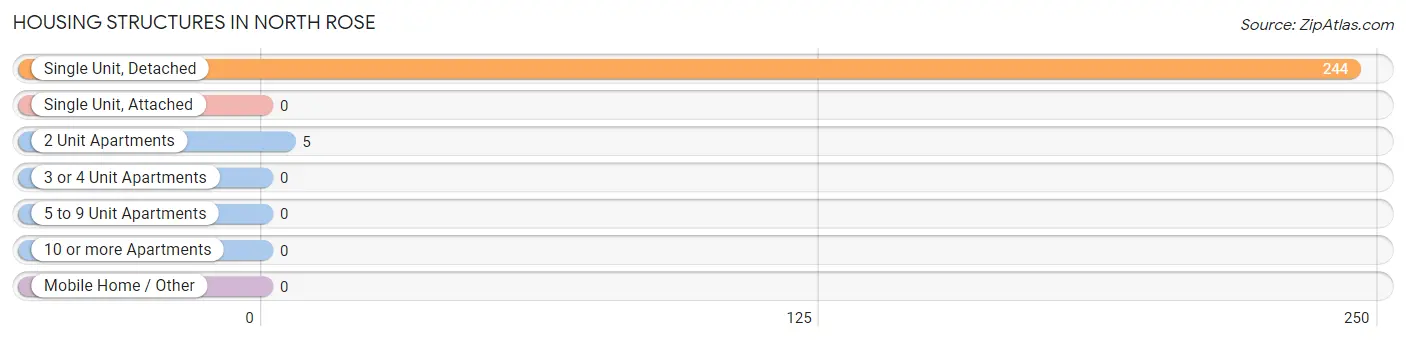
| Structure Type | # Housing Units | % Housing Units |
| Single Unit, Detached | 244 | 98.0% |
| Single Unit, Attached | 0 | 0.0% |
| 2 Unit Apartments | 5 | 2.0% |
| 3 or 4 Unit Apartments | 0 | 0.0% |
| 5 to 9 Unit Apartments | 0 | 0.0% |
| 10 or more Apartments | 0 | 0.0% |
| Mobile Home / Other | 0 | 0.0% |
| Total | 249 | 100.0% |
Housing Structures by Occupancy in North Rose
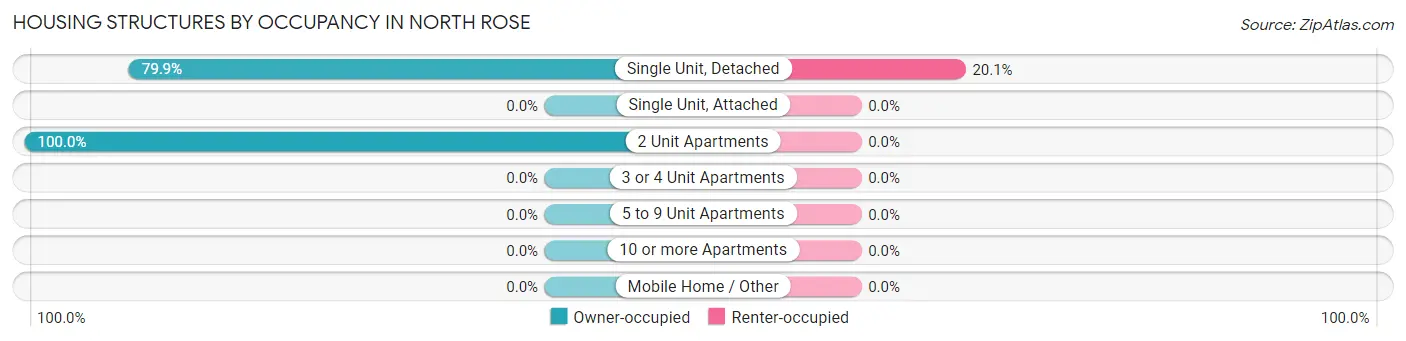
| Structure Type | Owner-occupied | Renter-occupied |
| Single Unit, Detached | 195 (79.9%) | 49 (20.1%) |
| Single Unit, Attached | 0 (0.0%) | 0 (0.0%) |
| 2 Unit Apartments | 5 (100.0%) | 0 (0.0%) |
| 3 or 4 Unit Apartments | 0 (0.0%) | 0 (0.0%) |
| 5 to 9 Unit Apartments | 0 (0.0%) | 0 (0.0%) |
| 10 or more Apartments | 0 (0.0%) | 0 (0.0%) |
| Mobile Home / Other | 0 (0.0%) | 0 (0.0%) |
| Total | 200 (80.3%) | 49 (19.7%) |
Housing Structures by Number of Rooms in North Rose
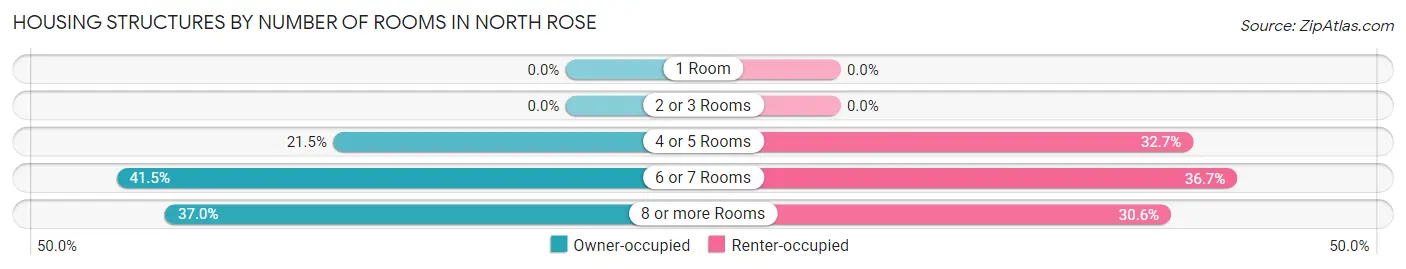
| Number of Rooms | Owner-occupied | Renter-occupied |
| 1 Room | 0 (0.0%) | 0 (0.0%) |
| 2 or 3 Rooms | 0 (0.0%) | 0 (0.0%) |
| 4 or 5 Rooms | 43 (21.5%) | 16 (32.7%) |
| 6 or 7 Rooms | 83 (41.5%) | 18 (36.7%) |
| 8 or more Rooms | 74 (37.0%) | 15 (30.6%) |
| Total | 200 (100.0%) | 49 (100.0%) |
Housing Structure by Heating Type in North Rose
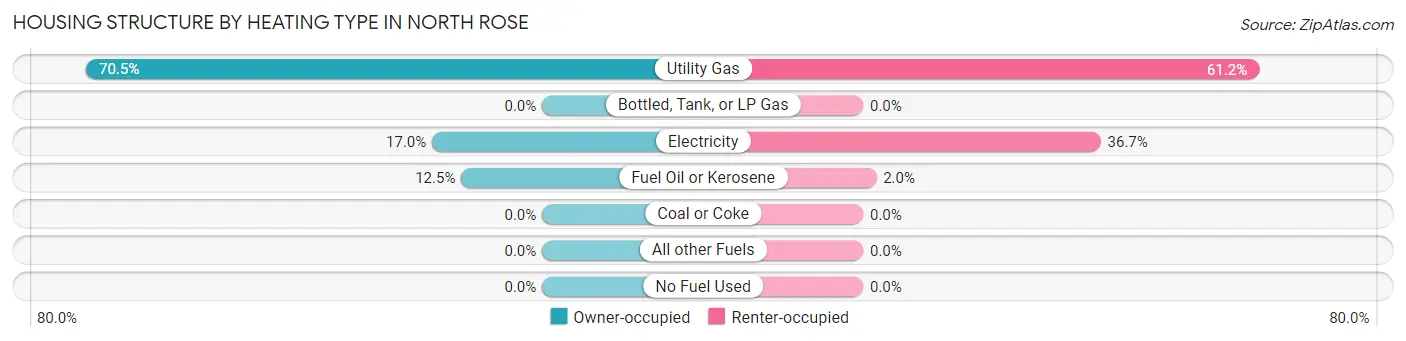
| Heating Type | Owner-occupied | Renter-occupied |
| Utility Gas | 141 (70.5%) | 30 (61.2%) |
| Bottled, Tank, or LP Gas | 0 (0.0%) | 0 (0.0%) |
| Electricity | 34 (17.0%) | 18 (36.7%) |
| Fuel Oil or Kerosene | 25 (12.5%) | 1 (2.0%) |
| Coal or Coke | 0 (0.0%) | 0 (0.0%) |
| All other Fuels | 0 (0.0%) | 0 (0.0%) |
| No Fuel Used | 0 (0.0%) | 0 (0.0%) |
| Total | 200 (100.0%) | 49 (100.0%) |
Household Vehicle Usage in North Rose
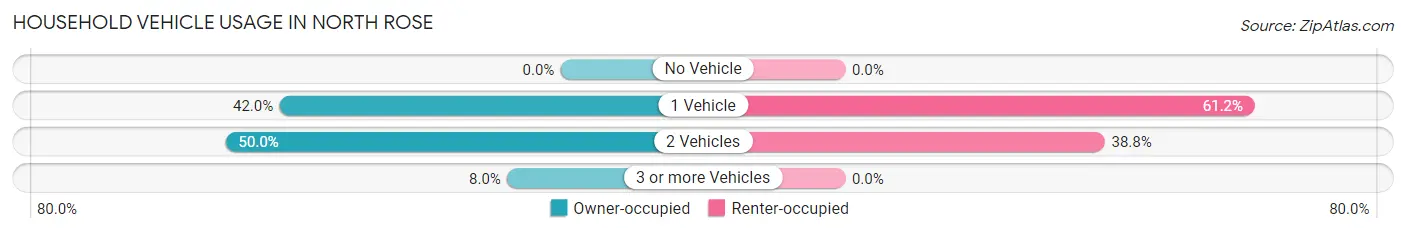
| Vehicles per Household | Owner-occupied | Renter-occupied |
| No Vehicle | 0 (0.0%) | 0 (0.0%) |
| 1 Vehicle | 84 (42.0%) | 30 (61.2%) |
| 2 Vehicles | 100 (50.0%) | 19 (38.8%) |
| 3 or more Vehicles | 16 (8.0%) | 0 (0.0%) |
| Total | 200 (100.0%) | 49 (100.0%) |
Real Estate & Mortgages in North Rose
Real Estate and Mortgage Overview in North Rose
| Characteristic | Without Mortgage | With Mortgage |
| Housing Units | 121 | 79 |
| Median Property Value | $94,300 | $107,300 |
| Median Household Income | $34,375 | $4 |
| Monthly Housing Costs | $496 | $0 |
| Real Estate Taxes | $2,160 | $0 |
Property Value by Mortgage Status in North Rose
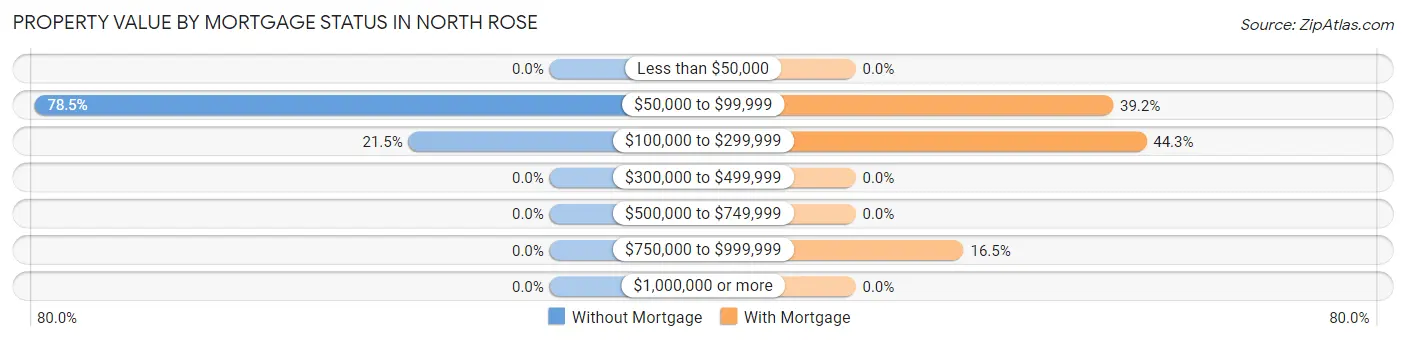
| Property Value | Without Mortgage | With Mortgage |
| Less than $50,000 | 0 (0.0%) | 0 (0.0%) |
| $50,000 to $99,999 | 95 (78.5%) | 31 (39.2%) |
| $100,000 to $299,999 | 26 (21.5%) | 35 (44.3%) |
| $300,000 to $499,999 | 0 (0.0%) | 0 (0.0%) |
| $500,000 to $749,999 | 0 (0.0%) | 0 (0.0%) |
| $750,000 to $999,999 | 0 (0.0%) | 13 (16.5%) |
| $1,000,000 or more | 0 (0.0%) | 0 (0.0%) |
| Total | 121 (100.0%) | 79 (100.0%) |
Household Income by Mortgage Status in North Rose
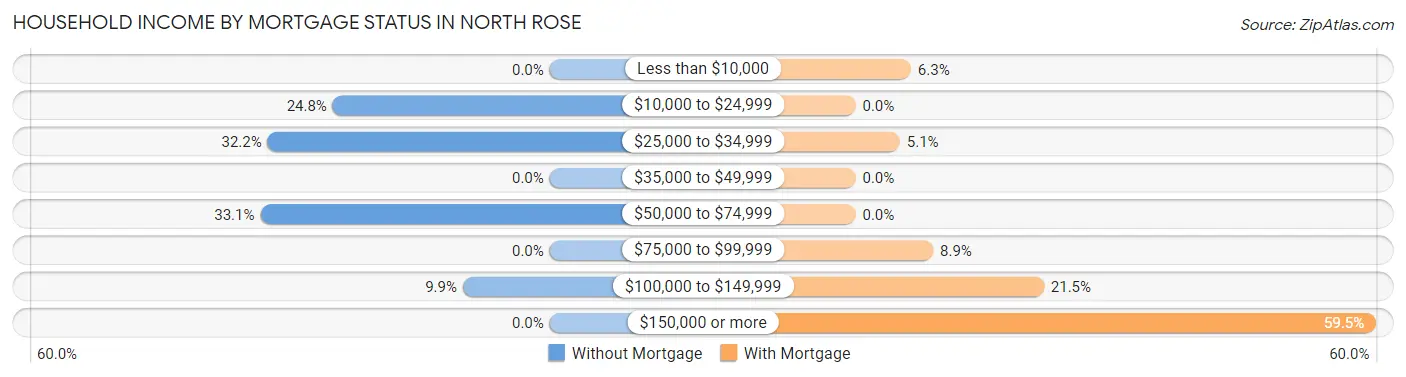
| Household Income | Without Mortgage | With Mortgage |
| Less than $10,000 | 0 (0.0%) | 5 (6.3%) |
| $10,000 to $24,999 | 30 (24.8%) | 0 (0.0%) |
| $25,000 to $34,999 | 39 (32.2%) | 4 (5.1%) |
| $35,000 to $49,999 | 0 (0.0%) | 0 (0.0%) |
| $50,000 to $74,999 | 40 (33.1%) | 0 (0.0%) |
| $75,000 to $99,999 | 0 (0.0%) | 7 (8.9%) |
| $100,000 to $149,999 | 12 (9.9%) | 17 (21.5%) |
| $150,000 or more | 0 (0.0%) | 47 (59.5%) |
| Total | 121 (100.0%) | 79 (100.0%) |
Property Value to Household Income Ratio in North Rose
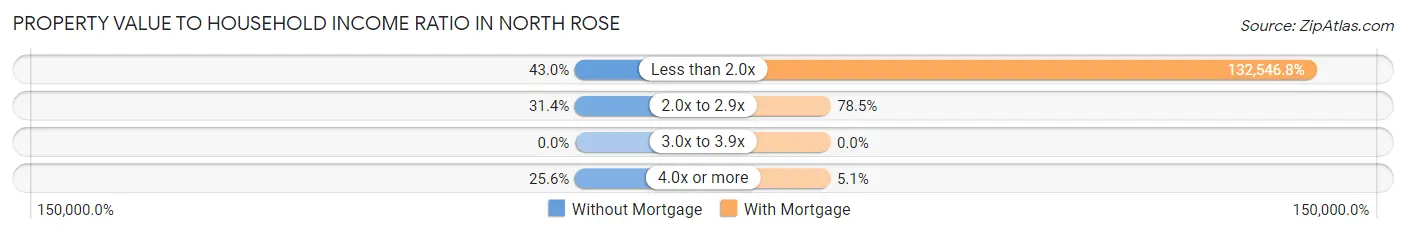
| Value-to-Income Ratio | Without Mortgage | With Mortgage |
| Less than 2.0x | 52 (43.0%) | 104,712 (132,546.8%) |
| 2.0x to 2.9x | 38 (31.4%) | 62 (78.5%) |
| 3.0x to 3.9x | 0 (0.0%) | 0 (0.0%) |
| 4.0x or more | 31 (25.6%) | 4 (5.1%) |
| Total | 121 (100.0%) | 79 (100.0%) |
Real Estate Taxes by Mortgage Status in North Rose
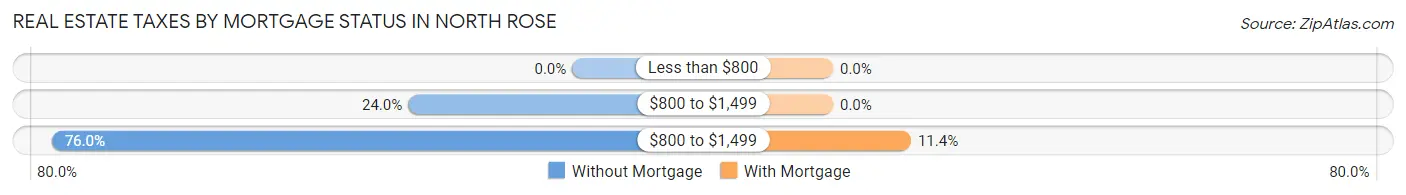
| Property Taxes | Without Mortgage | With Mortgage |
| Less than $800 | 0 (0.0%) | 0 (0.0%) |
| $800 to $1,499 | 29 (24.0%) | 0 (0.0%) |
| $800 to $1,499 | 92 (76.0%) | 9 (11.4%) |
| Total | 121 (100.0%) | 79 (100.0%) |
Health & Disability in North Rose
Health Insurance Coverage by Age in North Rose
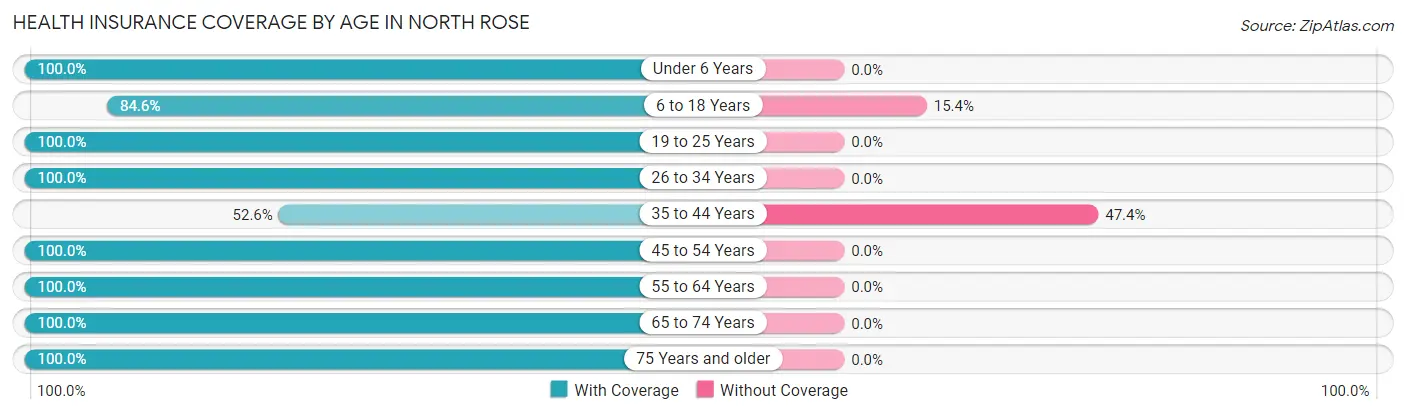
| Age Bracket | With Coverage | Without Coverage |
| Under 6 Years | 55 (100.0%) | 0 (0.0%) |
| 6 to 18 Years | 77 (84.6%) | 14 (15.4%) |
| 19 to 25 Years | 54 (100.0%) | 0 (0.0%) |
| 26 to 34 Years | 73 (100.0%) | 0 (0.0%) |
| 35 to 44 Years | 20 (52.6%) | 18 (47.4%) |
| 45 to 54 Years | 68 (100.0%) | 0 (0.0%) |
| 55 to 64 Years | 73 (100.0%) | 0 (0.0%) |
| 65 to 74 Years | 84 (100.0%) | 0 (0.0%) |
| 75 Years and older | 52 (100.0%) | 0 (0.0%) |
| Total | 556 (94.6%) | 32 (5.4%) |
Health Insurance Coverage by Citizenship Status in North Rose
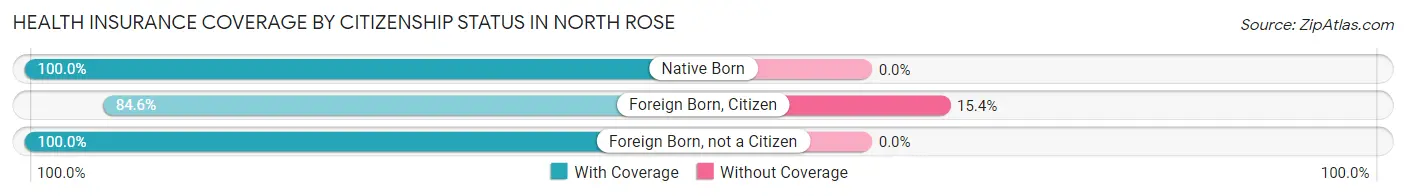
| Citizenship Status | With Coverage | Without Coverage |
| Native Born | 55 (100.0%) | 0 (0.0%) |
| Foreign Born, Citizen | 77 (84.6%) | 14 (15.4%) |
| Foreign Born, not a Citizen | 54 (100.0%) | 0 (0.0%) |
Health Insurance Coverage by Household Income in North Rose
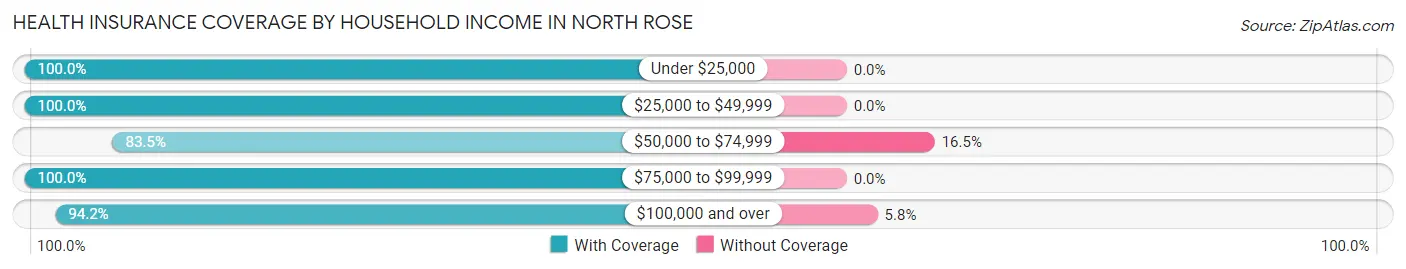
| Household Income | With Coverage | Without Coverage |
| Under $25,000 | 57 (100.0%) | 0 (0.0%) |
| $25,000 to $49,999 | 73 (100.0%) | 0 (0.0%) |
| $50,000 to $74,999 | 76 (83.5%) | 15 (16.5%) |
| $75,000 to $99,999 | 73 (100.0%) | 0 (0.0%) |
| $100,000 and over | 277 (94.2%) | 17 (5.8%) |
Public vs Private Health Insurance Coverage by Age in North Rose
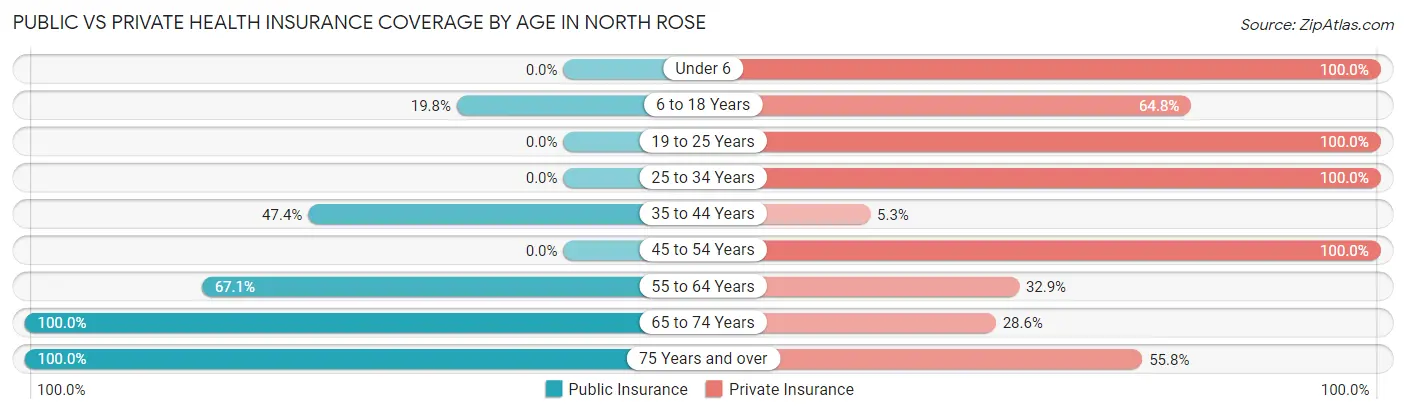
| Age Bracket | Public Insurance | Private Insurance |
| Under 6 | 0 (0.0%) | 55 (100.0%) |
| 6 to 18 Years | 18 (19.8%) | 59 (64.8%) |
| 19 to 25 Years | 0 (0.0%) | 54 (100.0%) |
| 25 to 34 Years | 0 (0.0%) | 73 (100.0%) |
| 35 to 44 Years | 18 (47.4%) | 2 (5.3%) |
| 45 to 54 Years | 0 (0.0%) | 68 (100.0%) |
| 55 to 64 Years | 49 (67.1%) | 24 (32.9%) |
| 65 to 74 Years | 84 (100.0%) | 24 (28.6%) |
| 75 Years and over | 52 (100.0%) | 29 (55.8%) |
| Total | 221 (37.6%) | 388 (66.0%) |
Disability Status by Sex by Age in North Rose
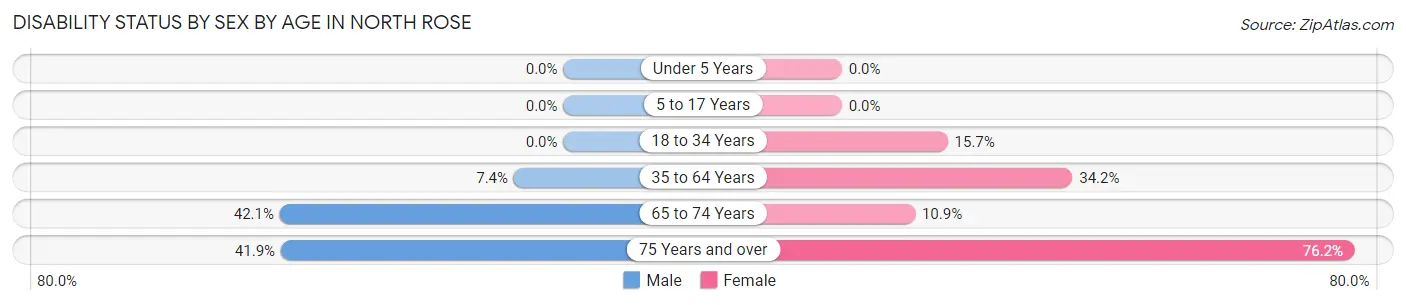
| Age Bracket | Male | Female |
| Under 5 Years | 0 (0.0%) | 0 (0.0%) |
| 5 to 17 Years | 0 (0.0%) | 0 (0.0%) |
| 18 to 34 Years | 0 (0.0%) | 11 (15.7%) |
| 35 to 64 Years | 5 (7.3%) | 38 (34.2%) |
| 65 to 74 Years | 16 (42.1%) | 5 (10.9%) |
| 75 Years and over | 13 (41.9%) | 16 (76.2%) |
Disability Class by Sex by Age in North Rose
Disability Class: Hearing Difficulty
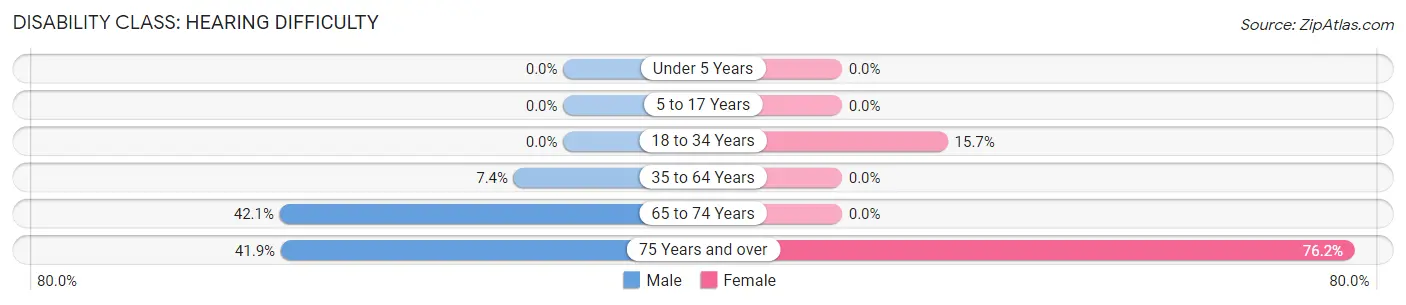
| Age Bracket | Male | Female |
| Under 5 Years | 0 (0.0%) | 0 (0.0%) |
| 5 to 17 Years | 0 (0.0%) | 0 (0.0%) |
| 18 to 34 Years | 0 (0.0%) | 11 (15.7%) |
| 35 to 64 Years | 5 (7.3%) | 0 (0.0%) |
| 65 to 74 Years | 16 (42.1%) | 0 (0.0%) |
| 75 Years and over | 13 (41.9%) | 16 (76.2%) |
Disability Class: Vision Difficulty
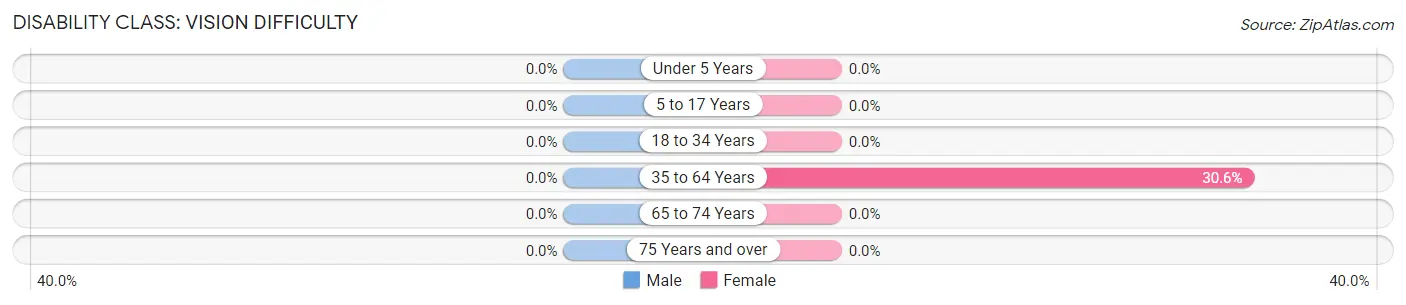
| Age Bracket | Male | Female |
| Under 5 Years | 0 (0.0%) | 0 (0.0%) |
| 5 to 17 Years | 0 (0.0%) | 0 (0.0%) |
| 18 to 34 Years | 0 (0.0%) | 0 (0.0%) |
| 35 to 64 Years | 0 (0.0%) | 34 (30.6%) |
| 65 to 74 Years | 0 (0.0%) | 0 (0.0%) |
| 75 Years and over | 0 (0.0%) | 0 (0.0%) |
Disability Class: Cognitive Difficulty
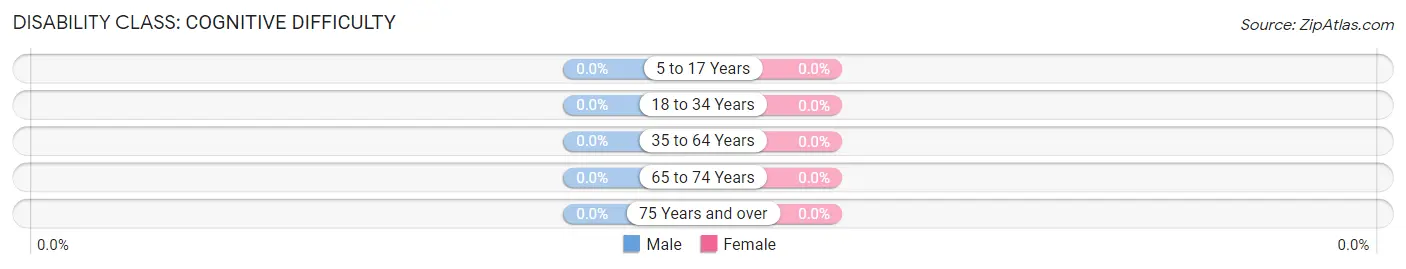
| Age Bracket | Male | Female |
| 5 to 17 Years | 0 (0.0%) | 0 (0.0%) |
| 18 to 34 Years | 0 (0.0%) | 0 (0.0%) |
| 35 to 64 Years | 0 (0.0%) | 0 (0.0%) |
| 65 to 74 Years | 0 (0.0%) | 0 (0.0%) |
| 75 Years and over | 0 (0.0%) | 0 (0.0%) |
Disability Class: Ambulatory Difficulty
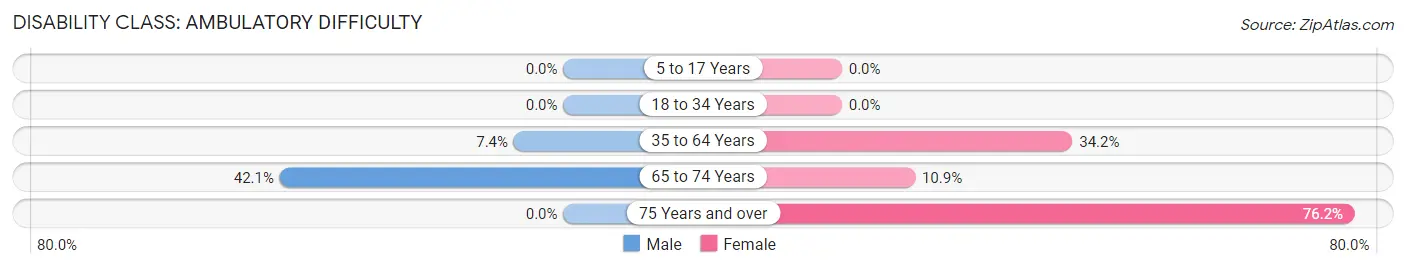
| Age Bracket | Male | Female |
| 5 to 17 Years | 0 (0.0%) | 0 (0.0%) |
| 18 to 34 Years | 0 (0.0%) | 0 (0.0%) |
| 35 to 64 Years | 5 (7.3%) | 38 (34.2%) |
| 65 to 74 Years | 16 (42.1%) | 5 (10.9%) |
| 75 Years and over | 0 (0.0%) | 16 (76.2%) |
Disability Class: Self-Care Difficulty
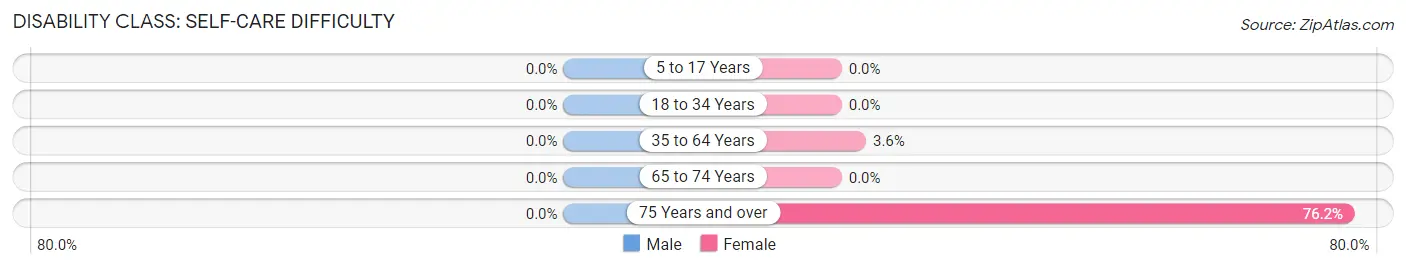
| Age Bracket | Male | Female |
| 5 to 17 Years | 0 (0.0%) | 0 (0.0%) |
| 18 to 34 Years | 0 (0.0%) | 0 (0.0%) |
| 35 to 64 Years | 0 (0.0%) | 4 (3.6%) |
| 65 to 74 Years | 0 (0.0%) | 0 (0.0%) |
| 75 Years and over | 0 (0.0%) | 16 (76.2%) |
Technology Access in North Rose
Computing Device Access in North Rose
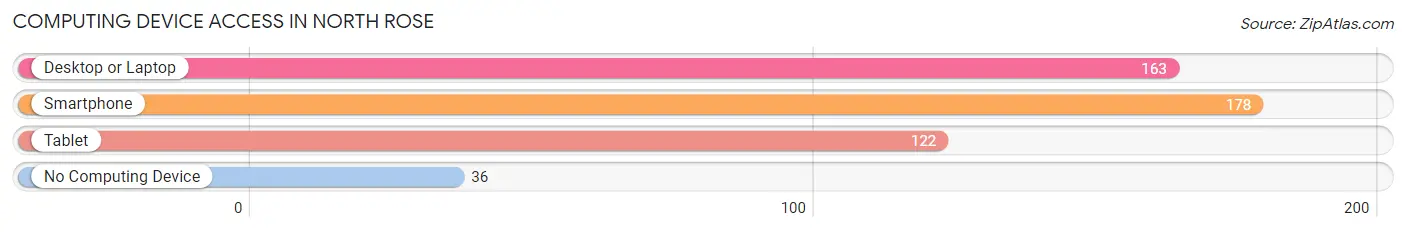
| Device Type | # Households | % Households |
| Desktop or Laptop | 163 | 65.5% |
| Smartphone | 178 | 71.5% |
| Tablet | 122 | 49.0% |
| No Computing Device | 36 | 14.5% |
| Total | 249 | 100.0% |
Internet Access in North Rose
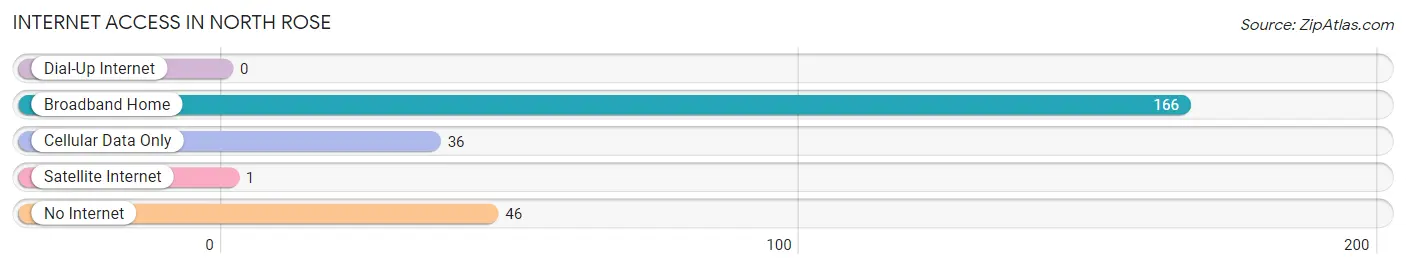
| Internet Type | # Households | % Households |
| Dial-Up Internet | 0 | 0.0% |
| Broadband Home | 166 | 66.7% |
| Cellular Data Only | 36 | 14.5% |
| Satellite Internet | 1 | 0.4% |
| No Internet | 46 | 18.5% |
| Total | 249 | 100.0% |
North Rose Summary
Rose, NY is a small town located in the northern part of the state of New York. It is situated in the Finger Lakes region of the state, and is part of the larger Wayne County. The town is bordered by the towns of Huron, Lyons, and Sodus. Rose is a rural community with a population of just over 1,000 people.
History
The area that is now Rose was first settled in the late 1700s by settlers from New England. The town was originally known as “Rose’s Corners”, named after the first settler, John Rose. The town was officially incorporated in 1817.
In the early 19th century, the town was a major center for the production of woolen goods. The town was also home to several mills, including a grist mill, a saw mill, and a paper mill. The town was also home to a number of small businesses, including a blacksmith shop, a tannery, and a general store.
Geography
Rose is located in the Finger Lakes region of New York. The town is situated in the northern part of Wayne County, and is bordered by the towns of Huron, Lyons, and Sodus. The town is located on the western shore of Lake Ontario, and is approximately 25 miles north of the city of Rochester.
The town is mostly rural, with a few small villages scattered throughout. The largest village in the town is Rose, which is located on the western shore of Lake Ontario. The village is home to a number of small businesses, including a grocery store, a post office, and a few restaurants.
Economy
The economy of Rose is largely based on agriculture. The town is home to several farms, which produce a variety of crops, including corn, soybeans, and hay. The town is also home to a number of small businesses, including a grocery store, a post office, and a few restaurants.
Demographics
As of the 2010 census, the population of Rose was 1,072. The racial makeup of the town was 97.3% White, 0.7% African American, 0.2% Native American, 0.2% Asian, 0.1% Pacific Islander, and 1.5% from two or more races. The median household income in the town was $45,000, and the median family income was $50,000.
Conclusion
Rose, NY is a small rural town located in the Finger Lakes region of New York. The town has a population of just over 1,000 people, and is largely based on agriculture. The town is home to several small businesses, and is a popular destination for tourists looking to explore the Finger Lakes region.
Common Questions
What is Per Capita Income in North Rose?
Per Capita income in North Rose is $31,011.
What is the Median Family Income in North Rose?
Median Family Income in North Rose is $81,696.
What is the Median Household income in North Rose?
Median Household Income in North Rose is $70,104.
What is Income or Wage Gap in North Rose?
Income or Wage Gap in North Rose is 48.9%.
Women in North Rose earn 51.1 cents for every dollar earned by a man.
What is Inequality or Gini Index in North Rose?
Inequality or Gini Index in North Rose is 0.31.
What is the Total Population of North Rose?
Total Population of North Rose is 588.
What is the Total Male Population of North Rose?
Total Male Population of North Rose is 296.
What is the Total Female Population of North Rose?
Total Female Population of North Rose is 292.
What is the Ratio of Males per 100 Females in North Rose?
There are 101.37 Males per 100 Females in North Rose.
What is the Ratio of Females per 100 Males in North Rose?
There are 98.65 Females per 100 Males in North Rose.
What is the Median Population Age in North Rose?
Median Population Age in North Rose is 38.7 Years.
What is the Average Family Size in North Rose
Average Family Size in North Rose is 2.8 People.
What is the Average Household Size in North Rose
Average Household Size in North Rose is 2.4 People.
How Large is the Labor Force in North Rose?
There are 287 People in the Labor Forcein in North Rose.
What is the Percentage of People in the Labor Force in North Rose?
62.4% of People are in the Labor Force in North Rose.
What is the Unemployment Rate in North Rose?
Unemployment Rate in North Rose is 7.3%.