Mount Morris, NY Map & Demographics
Mount Morris Map
Mount Morris Overview
$34,994
PER CAPITA INCOME
$73,929
AVG FAMILY INCOME
$59,211
AVG HOUSEHOLD INCOME
0.9%
WAGE / INCOME GAP [ % ]
99.1¢/ $1
WAGE / INCOME GAP [ $ ]
0.52
INEQUALITY / GINI INDEX
3,347
TOTAL POPULATION
1,716
MALE POPULATION
1,631
FEMALE POPULATION
105.21
MALES / 100 FEMALES
95.05
FEMALES / 100 MALES
36.7
MEDIAN AGE
3.3
AVG FAMILY SIZE
2.4
AVG HOUSEHOLD SIZE
1,454
LABOR FORCE [ PEOPLE ]
56.5%
PERCENT IN LABOR FORCE
3.1%
UNEMPLOYMENT RATE
Mount Morris Zip Codes
Mount Morris Area Codes
Income in Mount Morris
Income Overview in Mount Morris
Per Capita Income in Mount Morris is $34,994, while median incomes of families and households are $73,929 and $59,211 respectively.
| Characteristic | Number | Measure |
| Per Capita Income | 3,347 | $34,994 |
| Median Family Income | 768 | $73,929 |
| Mean Family Income | 768 | $82,094 |
| Median Household Income | 1,418 | $59,211 |
| Mean Household Income | 1,418 | $80,887 |
| Income Deficit | 768 | $0 |
| Wage / Income Gap (%) | 3,347 | 0.90% |
| Wage / Income Gap ($) | 3,347 | 99.10¢ per $1 |
| Gini / Inequality Index | 3,347 | 0.52 |
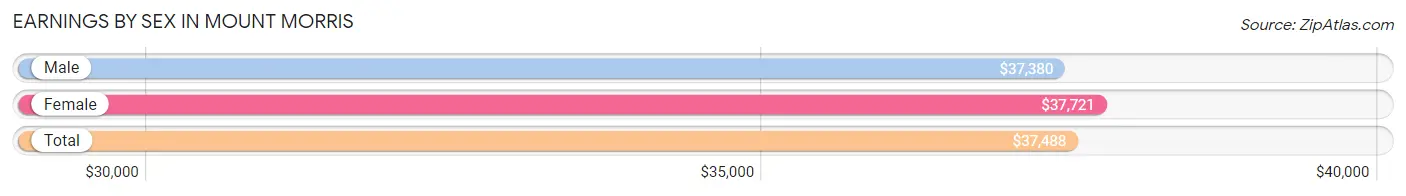
Earnings by Sex in Mount Morris
Average Earnings in Mount Morris are $37,488, $37,380 for men and $37,721 for women, a difference of 0.9%.
| Sex | Number | Average Earnings |
| Male | 795 (51.6%) | $37,380 |
| Female | 746 (48.4%) | $37,721 |
| Total | 1,541 (100.0%) | $37,488 |
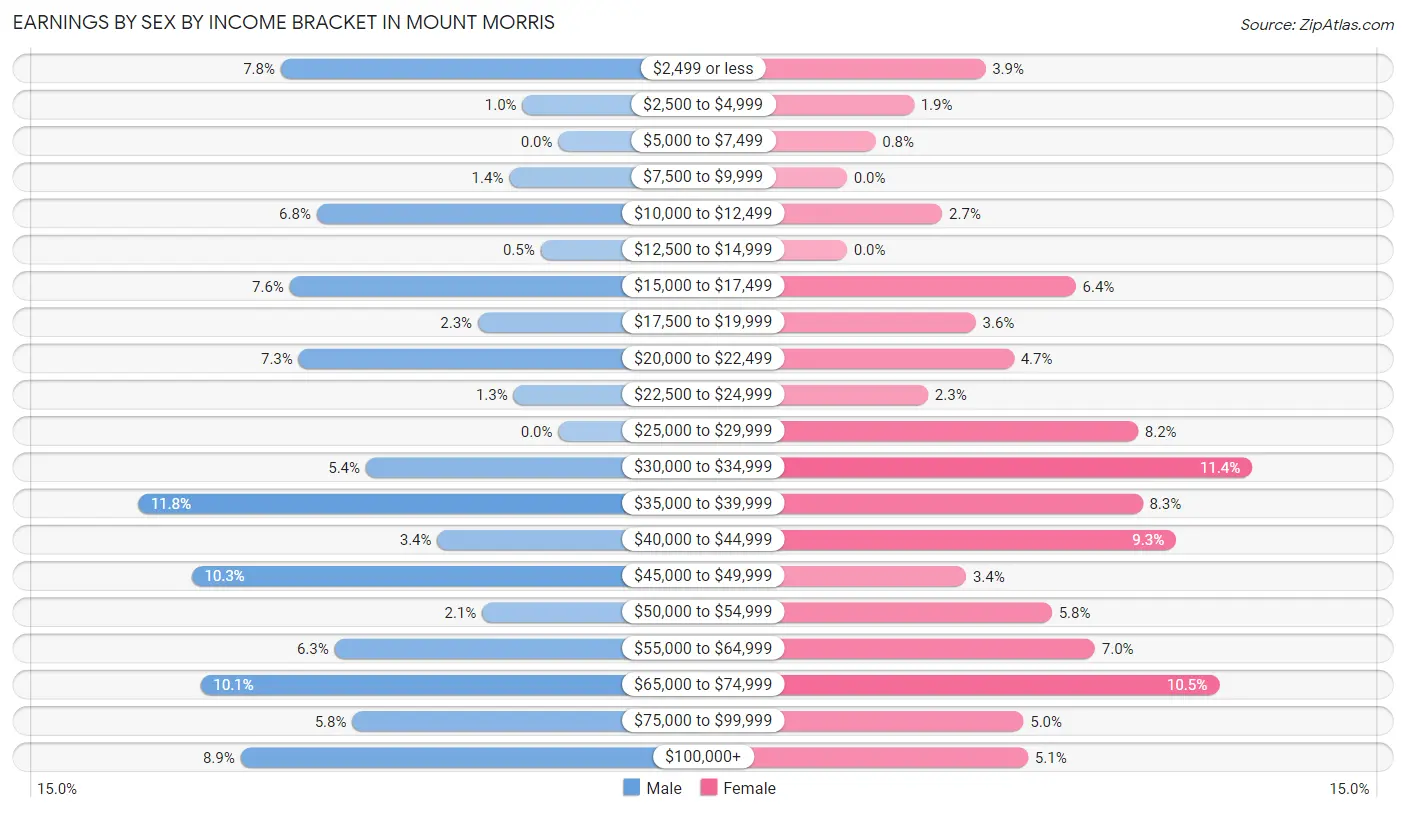
Earnings by Sex by Income Bracket in Mount Morris
The most common earnings brackets in Mount Morris are $35,000 to $39,999 for men (94 | 11.8%) and $30,000 to $34,999 for women (85 | 11.4%).
| Income | Male | Female |
| $2,499 or less | 62 (7.8%) | 29 (3.9%) |
| $2,500 to $4,999 | 8 (1.0%) | 14 (1.9%) |
| $5,000 to $7,499 | 0 (0.0%) | 6 (0.8%) |
| $7,500 to $9,999 | 11 (1.4%) | 0 (0.0%) |
| $10,000 to $12,499 | 54 (6.8%) | 20 (2.7%) |
| $12,500 to $14,999 | 4 (0.5%) | 0 (0.0%) |
| $15,000 to $17,499 | 60 (7.5%) | 48 (6.4%) |
| $17,500 to $19,999 | 18 (2.3%) | 27 (3.6%) |
| $20,000 to $22,499 | 58 (7.3%) | 35 (4.7%) |
| $22,500 to $24,999 | 10 (1.3%) | 17 (2.3%) |
| $25,000 to $29,999 | 0 (0.0%) | 61 (8.2%) |
| $30,000 to $34,999 | 43 (5.4%) | 85 (11.4%) |
| $35,000 to $39,999 | 94 (11.8%) | 62 (8.3%) |
| $40,000 to $44,999 | 27 (3.4%) | 69 (9.2%) |
| $45,000 to $49,999 | 82 (10.3%) | 25 (3.4%) |
| $50,000 to $54,999 | 17 (2.1%) | 43 (5.8%) |
| $55,000 to $64,999 | 50 (6.3%) | 52 (7.0%) |
| $65,000 to $74,999 | 80 (10.1%) | 78 (10.5%) |
| $75,000 to $99,999 | 46 (5.8%) | 37 (5.0%) |
| $100,000+ | 71 (8.9%) | 38 (5.1%) |
| Total | 795 (100.0%) | 746 (100.0%) |
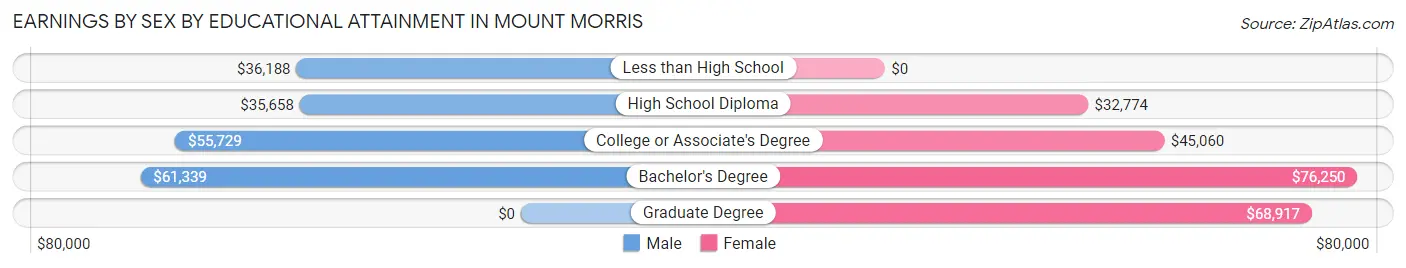
Earnings by Sex by Educational Attainment in Mount Morris
Average earnings in Mount Morris are $43,194 for men and $40,714 for women, a difference of 5.7%. Men with an educational attainment of bachelor's degree enjoy the highest average annual earnings of $61,339, while those with high school diploma education earn the least with $35,658. Women with an educational attainment of bachelor's degree earn the most with the average annual earnings of $76,250, while those with high school diploma education have the smallest earnings of $32,774.
| Educational Attainment | Male Income | Female Income |
| Less than High School | $36,188 | $0 |
| High School Diploma | $35,658 | $32,774 |
| College or Associate's Degree | $55,729 | $45,060 |
| Bachelor's Degree | $61,339 | $76,250 |
| Graduate Degree | - | - |
| Total | $43,194 | $40,714 |
Family Income in Mount Morris
Family Income Brackets in Mount Morris
According to the Mount Morris family income data, there are 175 families falling into the $50,000 to $74,999 income range, which is the most common income bracket and makes up 22.8% of all families. Conversely, the $10,000 to $14,999 income bracket is the least frequent group with only 11 families (1.4%) belonging to this category.
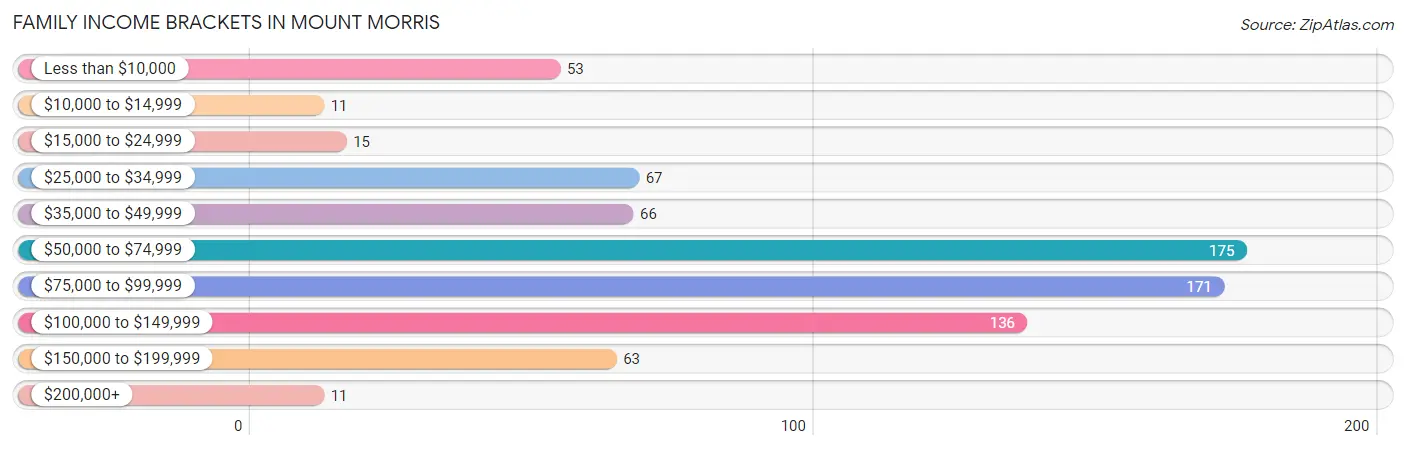
| Income Bracket | # Families | % Families |
| Less than $10,000 | 53 | 6.9% |
| $10,000 to $14,999 | 11 | 1.4% |
| $15,000 to $24,999 | 15 | 2.0% |
| $25,000 to $34,999 | 67 | 8.7% |
| $35,000 to $49,999 | 66 | 8.6% |
| $50,000 to $74,999 | 175 | 22.8% |
| $75,000 to $99,999 | 171 | 22.3% |
| $100,000 to $149,999 | 136 | 17.7% |
| $150,000 to $199,999 | 63 | 8.2% |
| $200,000+ | 11 | 1.4% |
Family Income by Famaliy Size in Mount Morris
2-person families (361 | 47.0%) account for the highest median family income in Mount Morris with $75,036 per family, while 2-person families (361 | 47.0%) have the highest median income of $37,518 per family member.
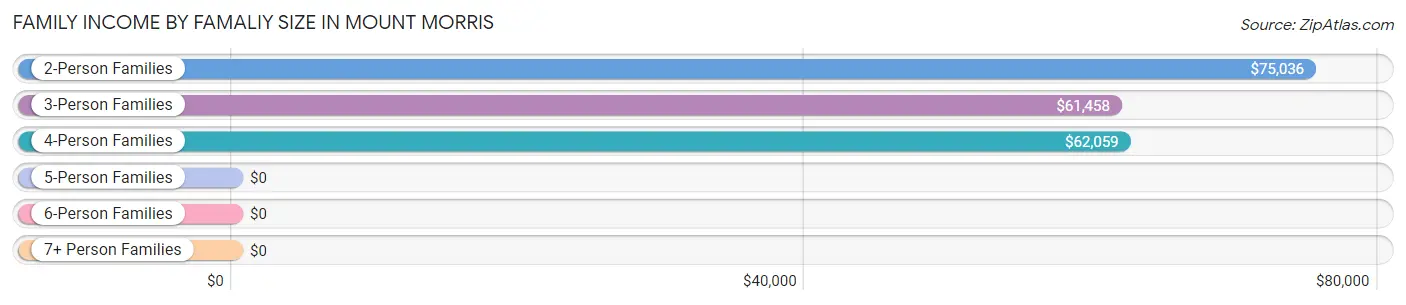
| Income Bracket | # Families | Median Income |
| 2-Person Families | 361 (47.0%) | $75,036 |
| 3-Person Families | 151 (19.7%) | $61,458 |
| 4-Person Families | 178 (23.2%) | $62,059 |
| 5-Person Families | 38 (5.0%) | $0 |
| 6-Person Families | 13 (1.7%) | $0 |
| 7+ Person Families | 27 (3.5%) | $0 |
| Total | 768 (100.0%) | $73,929 |
Family Income by Number of Earners in Mount Morris
The median family income in Mount Morris is $73,929, with families comprising 3+ earners (60) having the highest median family income of $97,222, while families with no earners (188) have the lowest median family income of $42,596, accounting for 7.8% and 24.5% of families, respectively.
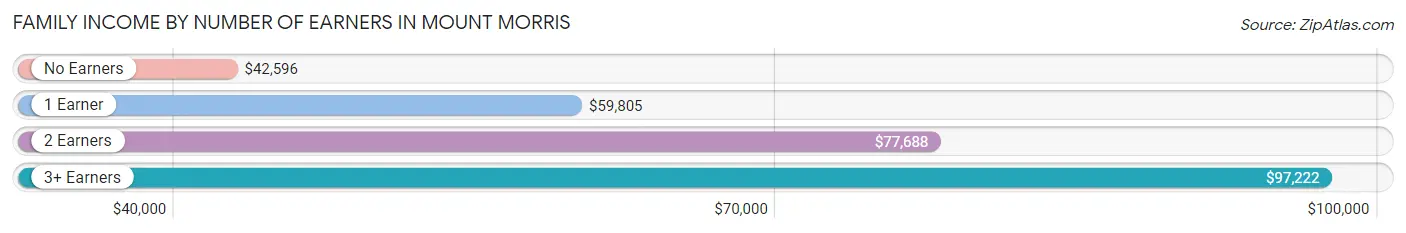
| Number of Earners | # Families | Median Income |
| No Earners | 188 (24.5%) | $42,596 |
| 1 Earner | 187 (24.3%) | $59,805 |
| 2 Earners | 333 (43.4%) | $77,688 |
| 3+ Earners | 60 (7.8%) | $97,222 |
| Total | 768 (100.0%) | $73,929 |
Household Income in Mount Morris
Household Income Brackets in Mount Morris
With 242 households falling in the category, the $35,000 to $49,999 income range is the most frequent in Mount Morris, accounting for 17.1% of all households. In contrast, only 45 households (3.2%) fall into the $200,000+ income bracket, making it the least populous group.
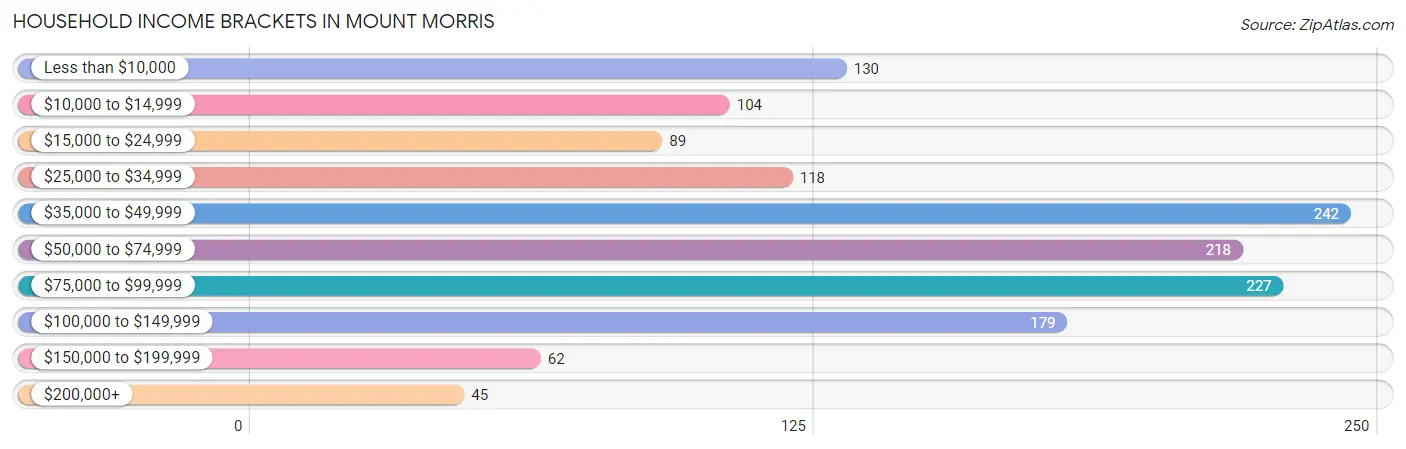
| Income Bracket | # Households | % Households |
| Less than $10,000 | 130 | 9.2% |
| $10,000 to $14,999 | 104 | 7.3% |
| $15,000 to $24,999 | 89 | 6.3% |
| $25,000 to $34,999 | 118 | 8.3% |
| $35,000 to $49,999 | 242 | 17.1% |
| $50,000 to $74,999 | 218 | 15.4% |
| $75,000 to $99,999 | 227 | 16.0% |
| $100,000 to $149,999 | 179 | 12.6% |
| $150,000 to $199,999 | 62 | 4.4% |
| $200,000+ | 45 | 3.2% |
Household Income by Householder Age in Mount Morris
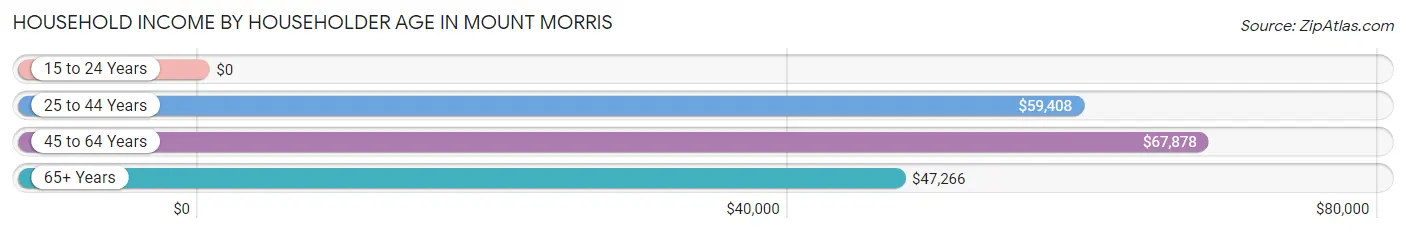
The median household income in Mount Morris is $59,211, with the highest median household income of $67,878 found in the 45 to 64 years age bracket for the primary householder. A total of 547 households (38.6%) fall into this category. Meanwhile, the 15 to 24 years age bracket for the primary householder has the lowest median household income of $0, with 38 households (2.7%) in this group.
| Income Bracket | # Households | Median Income |
| 15 to 24 Years | 38 (2.7%) | $0 |
| 25 to 44 Years | 531 (37.4%) | $59,408 |
| 45 to 64 Years | 547 (38.6%) | $67,878 |
| 65+ Years | 302 (21.3%) | $47,266 |
| Total | 1,418 (100.0%) | $59,211 |
Poverty in Mount Morris
Income Below Poverty by Sex and Age in Mount Morris
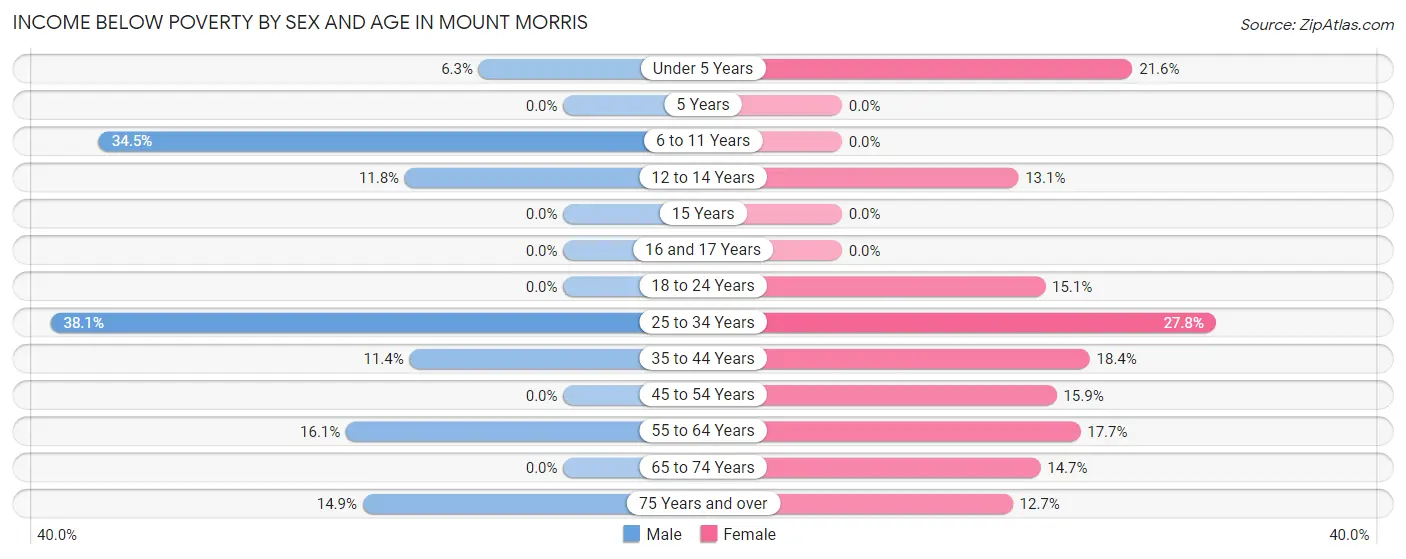
With 13.2% poverty level for males and 16.3% for females among the residents of Mount Morris, 25 to 34 year old males and 25 to 34 year old females are the most vulnerable to poverty, with 75 males (38.1%) and 73 females (27.8%) in their respective age groups living below the poverty level.
| Age Bracket | Male | Female |
| Under 5 Years | 12 (6.3%) | 11 (21.6%) |
| 5 Years | 0 (0.0%) | 0 (0.0%) |
| 6 to 11 Years | 50 (34.5%) | 0 (0.0%) |
| 12 to 14 Years | 12 (11.8%) | 11 (13.1%) |
| 15 Years | 0 (0.0%) | 0 (0.0%) |
| 16 and 17 Years | 0 (0.0%) | 0 (0.0%) |
| 18 to 24 Years | 0 (0.0%) | 16 (15.1%) |
| 25 to 34 Years | 75 (38.1%) | 73 (27.8%) |
| 35 to 44 Years | 33 (11.4%) | 30 (18.4%) |
| 45 to 54 Years | 0 (0.0%) | 33 (15.9%) |
| 55 to 64 Years | 30 (16.1%) | 51 (17.7%) |
| 65 to 74 Years | 0 (0.0%) | 23 (14.7%) |
| 75 Years and over | 14 (14.9%) | 18 (12.7%) |
| Total | 226 (13.2%) | 266 (16.3%) |
Income Above Poverty by Sex and Age in Mount Morris
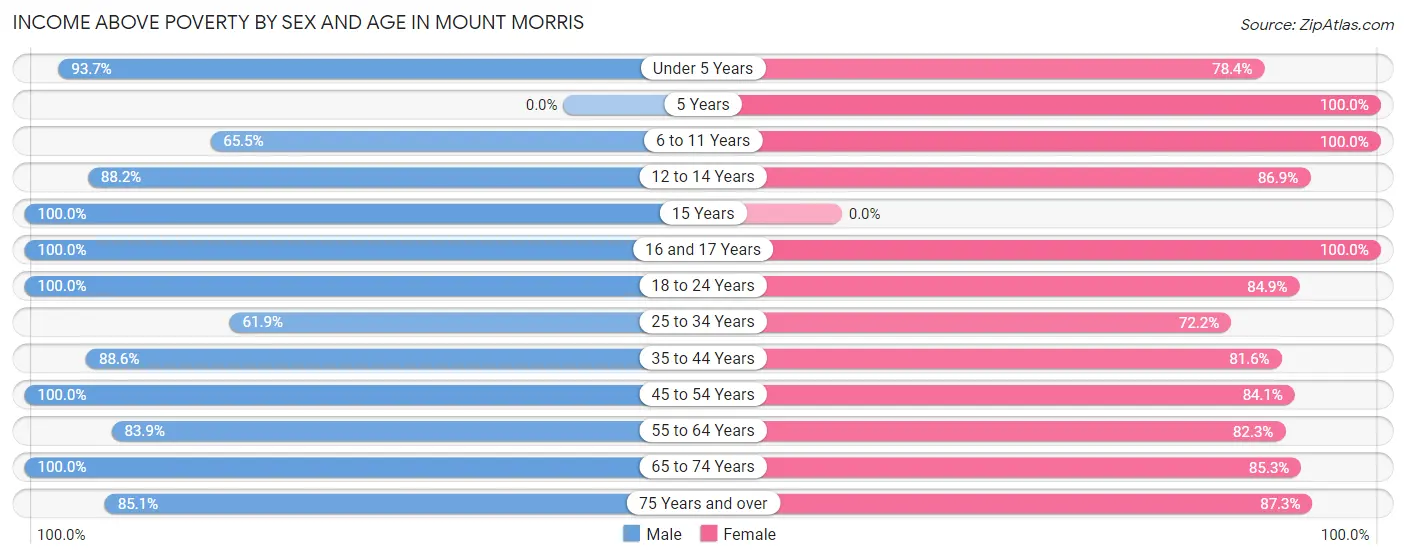
According to the poverty statistics in Mount Morris, males aged 15 years and females aged 5 years are the age groups that are most secure financially, with 100.0% of males and 100.0% of females in these age groups living above the poverty line.
| Age Bracket | Male | Female |
| Under 5 Years | 179 (93.7%) | 40 (78.4%) |
| 5 Years | 0 (0.0%) | 29 (100.0%) |
| 6 to 11 Years | 95 (65.5%) | 121 (100.0%) |
| 12 to 14 Years | 90 (88.2%) | 73 (86.9%) |
| 15 Years | 51 (100.0%) | 0 (0.0%) |
| 16 and 17 Years | 9 (100.0%) | 21 (100.0%) |
| 18 to 24 Years | 198 (100.0%) | 90 (84.9%) |
| 25 to 34 Years | 122 (61.9%) | 190 (72.2%) |
| 35 to 44 Years | 256 (88.6%) | 133 (81.6%) |
| 45 to 54 Years | 141 (100.0%) | 174 (84.1%) |
| 55 to 64 Years | 156 (83.9%) | 237 (82.3%) |
| 65 to 74 Years | 113 (100.0%) | 133 (85.3%) |
| 75 Years and over | 80 (85.1%) | 124 (87.3%) |
| Total | 1,490 (86.8%) | 1,365 (83.7%) |
Income Below Poverty Among Married-Couple Families in Mount Morris
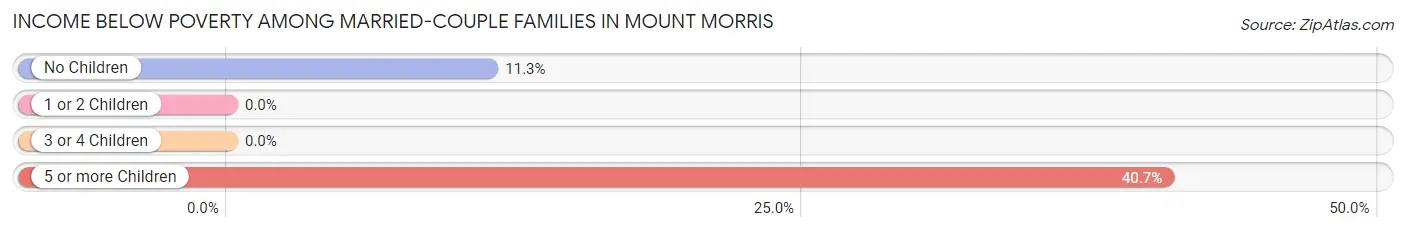
The poverty statistics for married-couple families in Mount Morris show that 8.7% or 46 of the total 529 families live below the poverty line. Families with 5 or more children have the highest poverty rate of 40.7%, comprising of 11 families. On the other hand, families with 1 or 2 children have the lowest poverty rate of 0.0%, which includes 0 families.
| Children | Above Poverty | Below Poverty |
| No Children | 274 (88.7%) | 35 (11.3%) |
| 1 or 2 Children | 155 (100.0%) | 0 (0.0%) |
| 3 or 4 Children | 38 (100.0%) | 0 (0.0%) |
| 5 or more Children | 16 (59.3%) | 11 (40.7%) |
| Total | 483 (91.3%) | 46 (8.7%) |
Income Below Poverty Among Single-Parent Households in Mount Morris
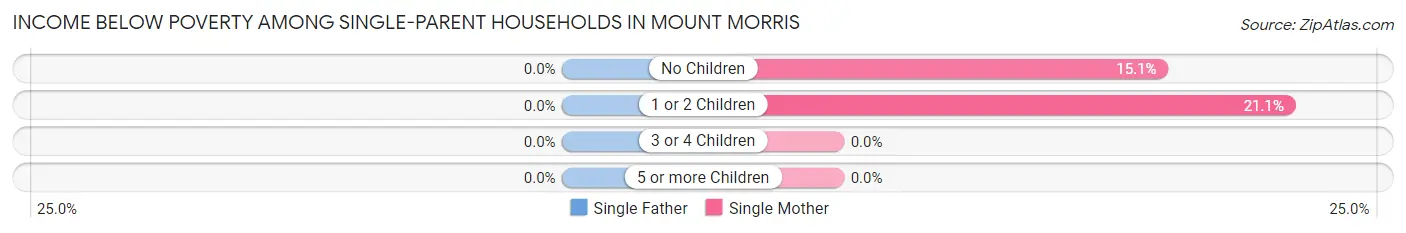
| Children | Single Father | Single Mother |
| No Children | 0 (0.0%) | 13 (15.1%) |
| 1 or 2 Children | 0 (0.0%) | 20 (21.0%) |
| 3 or 4 Children | 0 (0.0%) | 0 (0.0%) |
| 5 or more Children | 0 (0.0%) | 0 (0.0%) |
| Total | 0 (0.0%) | 33 (15.8%) |
Income Below Poverty Among Married-Couple vs Single-Parent Households in Mount Morris
The poverty data for Mount Morris shows that 46 of the married-couple family households (8.7%) and 33 of the single-parent households (13.8%) are living below the poverty level. Within the married-couple family households, those with 5 or more children have the highest poverty rate, with 11 households (40.7%) falling below the poverty line. Among the single-parent households, those with 1 or 2 children have the highest poverty rate, with 20 household (21.0%) living below poverty.
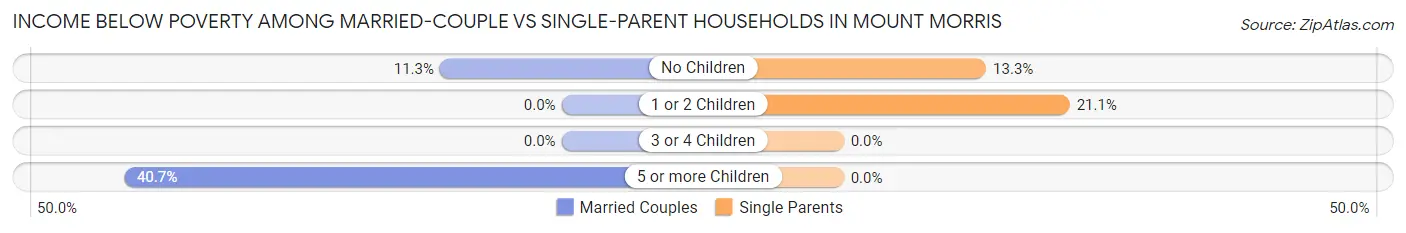
| Children | Married-Couple Families | Single-Parent Households |
| No Children | 35 (11.3%) | 13 (13.3%) |
| 1 or 2 Children | 0 (0.0%) | 20 (21.0%) |
| 3 or 4 Children | 0 (0.0%) | 0 (0.0%) |
| 5 or more Children | 11 (40.7%) | 0 (0.0%) |
| Total | 46 (8.7%) | 33 (13.8%) |
Race in Mount Morris
The most populous races in Mount Morris are White / Caucasian (2,882 | 86.1%), Hispanic or Latino (431 | 12.9%), and Two or more Races (203 | 6.1%).
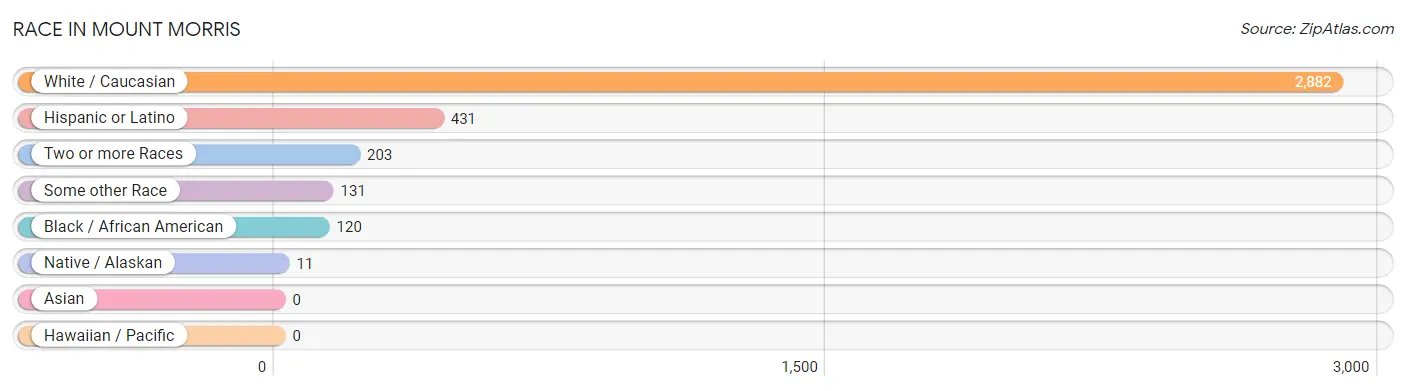
| Race | # Population | % Population |
| Asian | 0 | 0.0% |
| Black / African American | 120 | 3.6% |
| Hawaiian / Pacific | 0 | 0.0% |
| Hispanic or Latino | 431 | 12.9% |
| Native / Alaskan | 11 | 0.3% |
| White / Caucasian | 2,882 | 86.1% |
| Two or more Races | 203 | 6.1% |
| Some other Race | 131 | 3.9% |
| Total | 3,347 | 100.0% |
Ancestry in Mount Morris
The most populous ancestries reported in Mount Morris are Italian (585 | 17.5%), German (376 | 11.2%), English (366 | 10.9%), Puerto Rican (339 | 10.1%), and Irish (185 | 5.5%), together accounting for 55.3% of all Mount Morris residents.
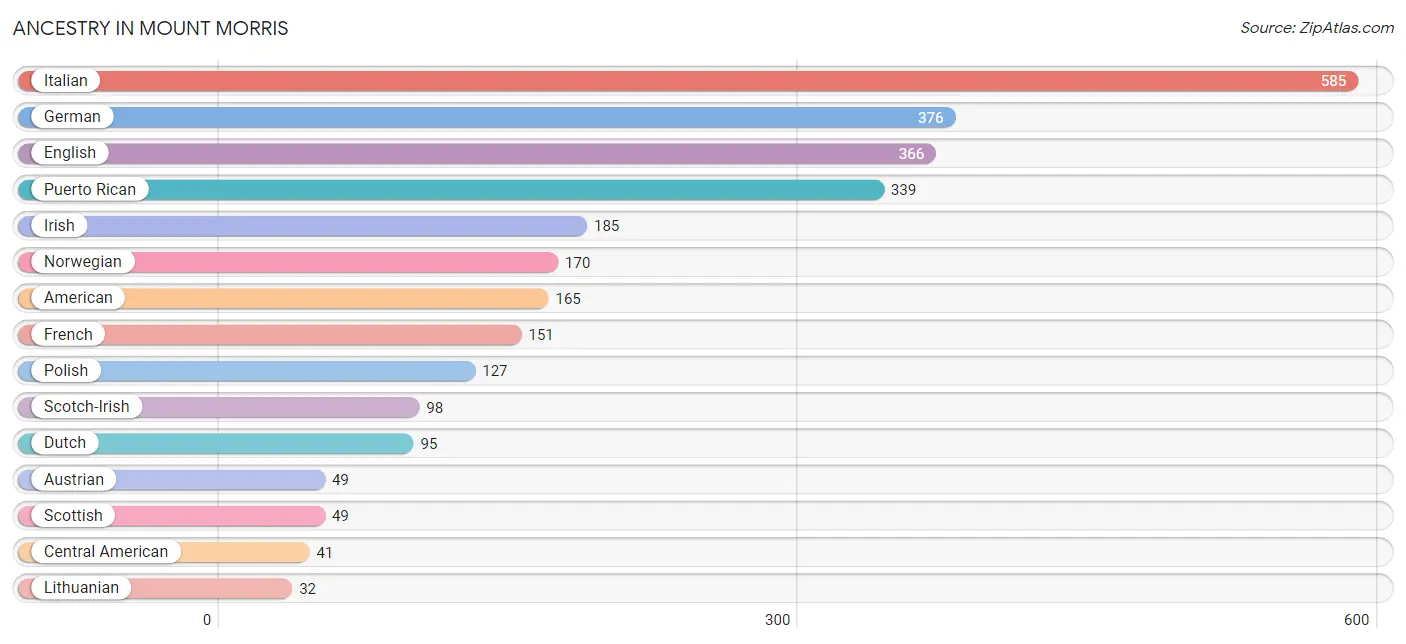
| Ancestry | # Population | % Population |
| American | 165 | 4.9% |
| Austrian | 49 | 1.5% |
| Brazilian | 1 | 0.0% |
| British | 31 | 0.9% |
| Central American | 41 | 1.2% |
| Dutch | 95 | 2.8% |
| English | 366 | 10.9% |
| European | 15 | 0.4% |
| French | 151 | 4.5% |
| German | 376 | 11.2% |
| Guatemalan | 21 | 0.6% |
| Hopi | 15 | 0.4% |
| Hungarian | 24 | 0.7% |
| Irish | 185 | 5.5% |
| Italian | 585 | 17.5% |
| Lithuanian | 32 | 1.0% |
| Northern European | 18 | 0.5% |
| Norwegian | 170 | 5.1% |
| Polish | 127 | 3.8% |
| Puerto Rican | 339 | 10.1% |
| Salvadoran | 20 | 0.6% |
| Scotch-Irish | 98 | 2.9% |
| Scottish | 49 | 1.5% |
| Spaniard | 28 | 0.8% |
| Welsh | 23 | 0.7% |
| West Indian | 4 | 0.1% | View All 26 Rows |
Immigrants in Mount Morris
The most numerous immigrant groups reported in Mount Morris came from Central America (40 | 1.2%), Latin America (40 | 1.2%), El Salvador (20 | 0.6%), Guatemala (20 | 0.6%), and England (11 | 0.3%), together accounting for 3.9% of all Mount Morris residents.
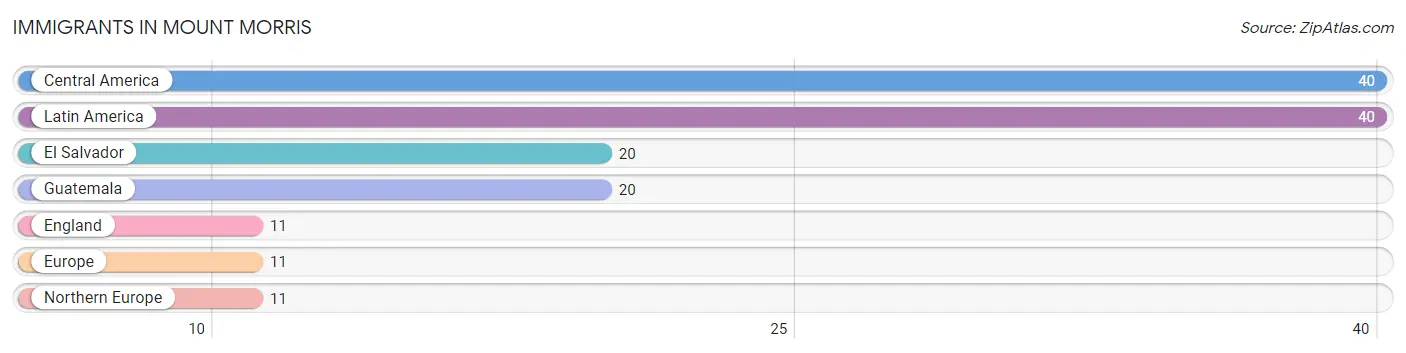
| Immigration Origin | # Population | % Population |
| Central America | 40 | 1.2% |
| El Salvador | 20 | 0.6% |
| England | 11 | 0.3% |
| Europe | 11 | 0.3% |
| Guatemala | 20 | 0.6% |
| Latin America | 40 | 1.2% |
| Northern Europe | 11 | 0.3% | View All 7 Rows |
Sex and Age in Mount Morris
Sex and Age in Mount Morris
The most populous age groups in Mount Morris are Under 5 Years (191 | 11.1%) for men and 55 to 59 Years (164 | 10.1%) for women.
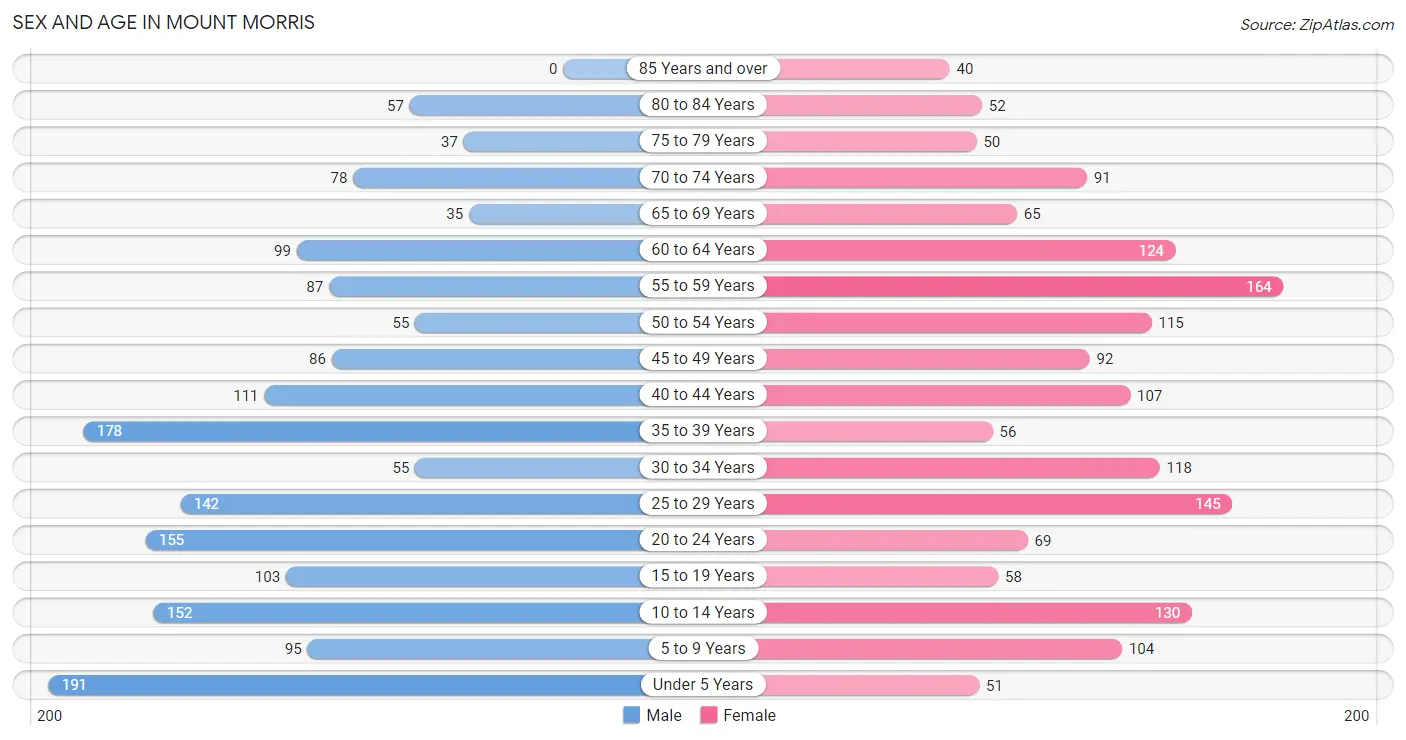
| Age Bracket | Male | Female |
| Under 5 Years | 191 (11.1%) | 51 (3.1%) |
| 5 to 9 Years | 95 (5.5%) | 104 (6.4%) |
| 10 to 14 Years | 152 (8.9%) | 130 (8.0%) |
| 15 to 19 Years | 103 (6.0%) | 58 (3.6%) |
| 20 to 24 Years | 155 (9.0%) | 69 (4.2%) |
| 25 to 29 Years | 142 (8.3%) | 145 (8.9%) |
| 30 to 34 Years | 55 (3.2%) | 118 (7.2%) |
| 35 to 39 Years | 178 (10.4%) | 56 (3.4%) |
| 40 to 44 Years | 111 (6.5%) | 107 (6.6%) |
| 45 to 49 Years | 86 (5.0%) | 92 (5.6%) |
| 50 to 54 Years | 55 (3.2%) | 115 (7.0%) |
| 55 to 59 Years | 87 (5.1%) | 164 (10.1%) |
| 60 to 64 Years | 99 (5.8%) | 124 (7.6%) |
| 65 to 69 Years | 35 (2.0%) | 65 (4.0%) |
| 70 to 74 Years | 78 (4.5%) | 91 (5.6%) |
| 75 to 79 Years | 37 (2.2%) | 50 (3.1%) |
| 80 to 84 Years | 57 (3.3%) | 52 (3.2%) |
| 85 Years and over | 0 (0.0%) | 40 (2.5%) |
| Total | 1,716 (100.0%) | 1,631 (100.0%) |
Families and Households in Mount Morris
Median Family Size in Mount Morris
The median family size in Mount Morris is 3.26 persons per family, with single male/father families (30 | 3.9%) accounting for the largest median family size of 3.73 persons per family. On the other hand, married-couple families (529 | 68.9%) represent the smallest median family size with 3.21 persons per family.
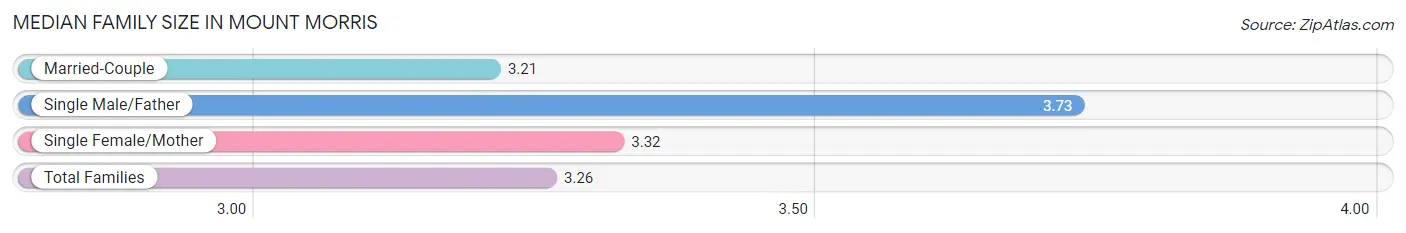
| Family Type | # Families | Family Size |
| Married-Couple | 529 (68.9%) | 3.21 |
| Single Male/Father | 30 (3.9%) | 3.73 |
| Single Female/Mother | 209 (27.2%) | 3.32 |
| Total Families | 768 (100.0%) | 3.26 |
Median Household Size in Mount Morris
The median household size in Mount Morris is 2.35 persons per household, with single male/father households (30 | 2.1%) accounting for the largest median household size of 4.53 persons per household. non-family households (650 | 45.8%) represent the smallest median household size with 1.09 persons per household.
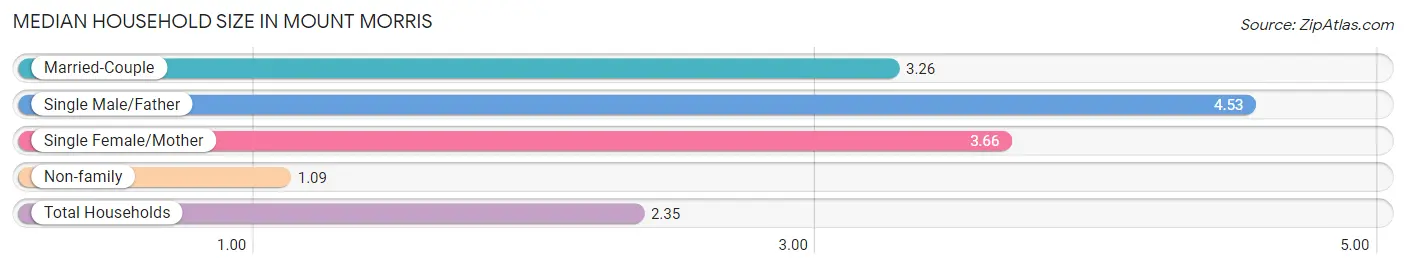
| Household Type | # Households | Household Size |
| Married-Couple | 529 (37.3%) | 3.26 |
| Single Male/Father | 30 (2.1%) | 4.53 |
| Single Female/Mother | 209 (14.7%) | 3.66 |
| Non-family | 650 (45.8%) | 1.09 |
| Total Households | 1,418 (100.0%) | 2.35 |
Household Size by Marriage Status in Mount Morris
Out of a total of 1,418 households in Mount Morris, 768 (54.2%) are family households, while 650 (45.8%) are nonfamily households. The most numerous type of family households are 2-person households, comprising 316, and the most common type of nonfamily households are 1-person households, comprising 585.
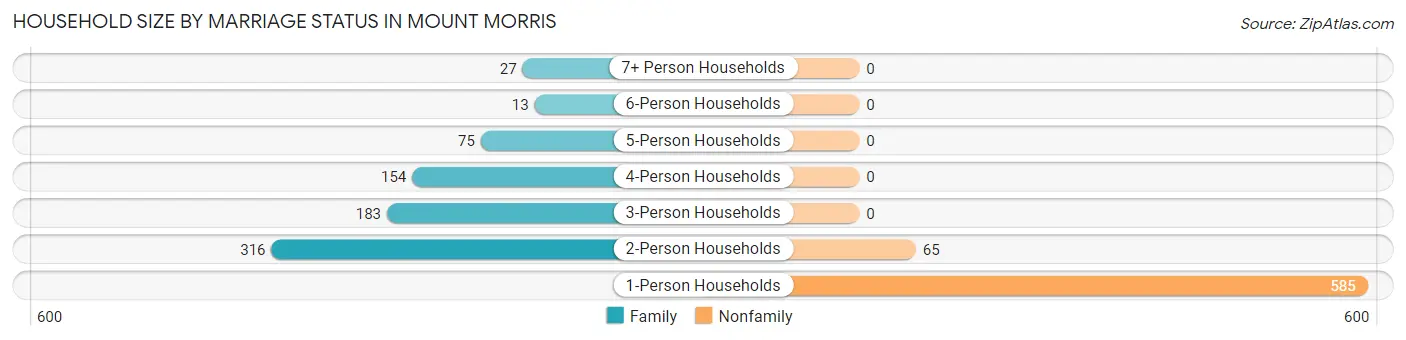
| Household Size | Family Households | Nonfamily Households |
| 1-Person Households | - | 585 (41.3%) |
| 2-Person Households | 316 (22.3%) | 65 (4.6%) |
| 3-Person Households | 183 (12.9%) | 0 (0.0%) |
| 4-Person Households | 154 (10.9%) | 0 (0.0%) |
| 5-Person Households | 75 (5.3%) | 0 (0.0%) |
| 6-Person Households | 13 (0.9%) | 0 (0.0%) |
| 7+ Person Households | 27 (1.9%) | 0 (0.0%) |
| Total | 768 (54.2%) | 650 (45.8%) |
Female Fertility in Mount Morris
Fertility by Age in Mount Morris
Average fertility rate in Mount Morris is 88.0 births per 1,000 women. Women in the age bracket of 20 to 34 years have the highest fertility rate with 190.0 births per 1,000 women. Women in the age bracket of 20 to 34 years acount for 100.0% of all women with births.
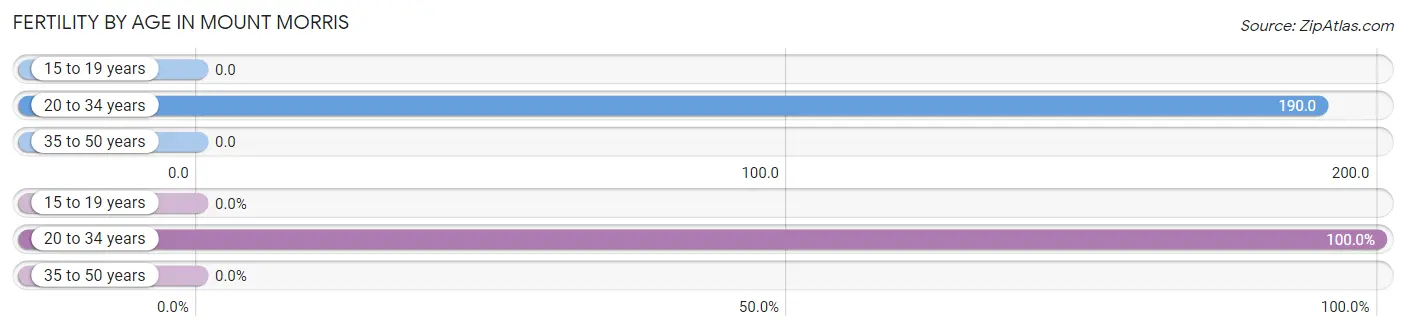
| Age Bracket | Women with Births | Births / 1,000 Women |
| 15 to 19 years | 0 (0.0%) | 0.0 |
| 20 to 34 years | 63 (100.0%) | 190.0 |
| 35 to 50 years | 0 (0.0%) | 0.0 |
| Total | 63 (100.0%) | 88.0 |
Fertility by Age by Marriage Status in Mount Morris
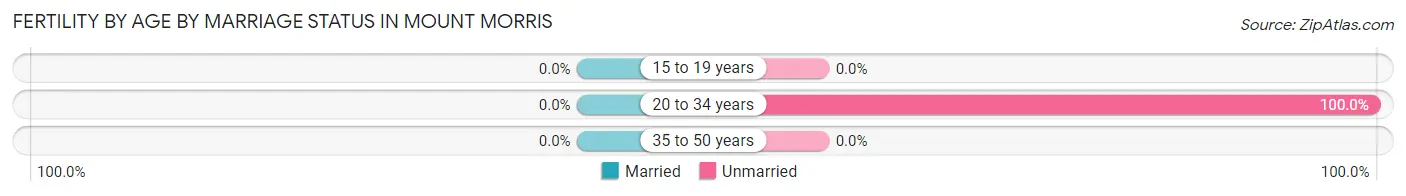
| Age Bracket | Married | Unmarried |
| 15 to 19 years | 0 (0.0%) | 0 (0.0%) |
| 20 to 34 years | 0 (0.0%) | 63 (100.0%) |
| 35 to 50 years | 0 (0.0%) | 0 (0.0%) |
| Total | 0 (0.0%) | 63 (100.0%) |
Fertility by Education in Mount Morris
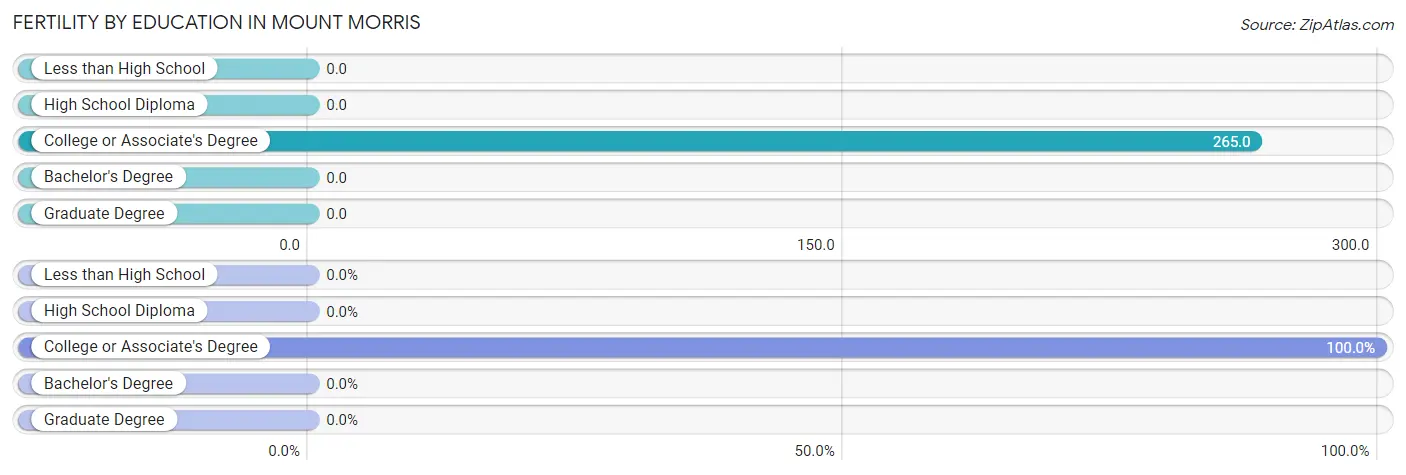
| Educational Attainment | Women with Births | Births / 1,000 Women |
| Less than High School | 0 (0.0%) | 0.0 |
| High School Diploma | 0 (0.0%) | 0.0 |
| College or Associate's Degree | 63 (100.0%) | 265.0 |
| Bachelor's Degree | 0 (0.0%) | 0.0 |
| Graduate Degree | 0 (0.0%) | 0.0 |
| Total | 63 (100.0%) | 88.0 |
Fertility by Education by Marriage Status in Mount Morris
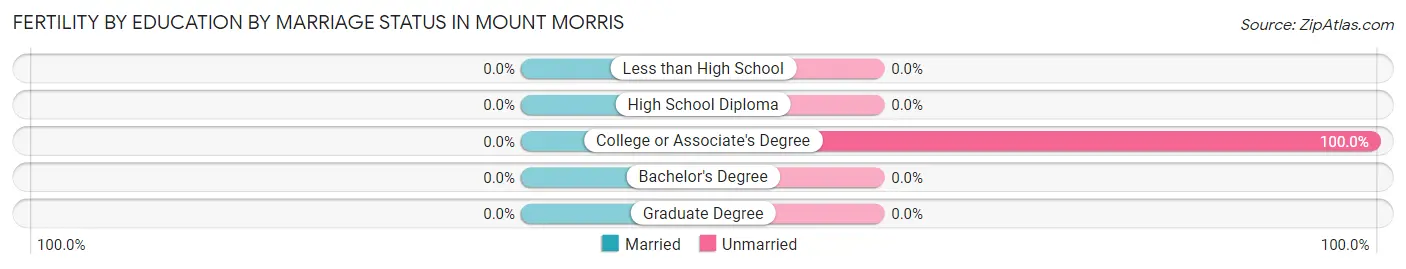
| Educational Attainment | Married | Unmarried |
| Less than High School | 0 (0.0%) | 0 (0.0%) |
| High School Diploma | 0 (0.0%) | 0 (0.0%) |
| College or Associate's Degree | 0 (0.0%) | 63 (100.0%) |
| Bachelor's Degree | 0 (0.0%) | 0 (0.0%) |
| Graduate Degree | 0 (0.0%) | 0 (0.0%) |
| Total | 0 (0.0%) | 63 (100.0%) |
Employment Characteristics in Mount Morris
Employment by Class of Employer in Mount Morris
Among the 1,410 employed individuals in Mount Morris, private company employees (805 | 57.1%), local government employees (172 | 12.2%), and not-for-profit organizations (150 | 10.6%) make up the most common classes of employment.
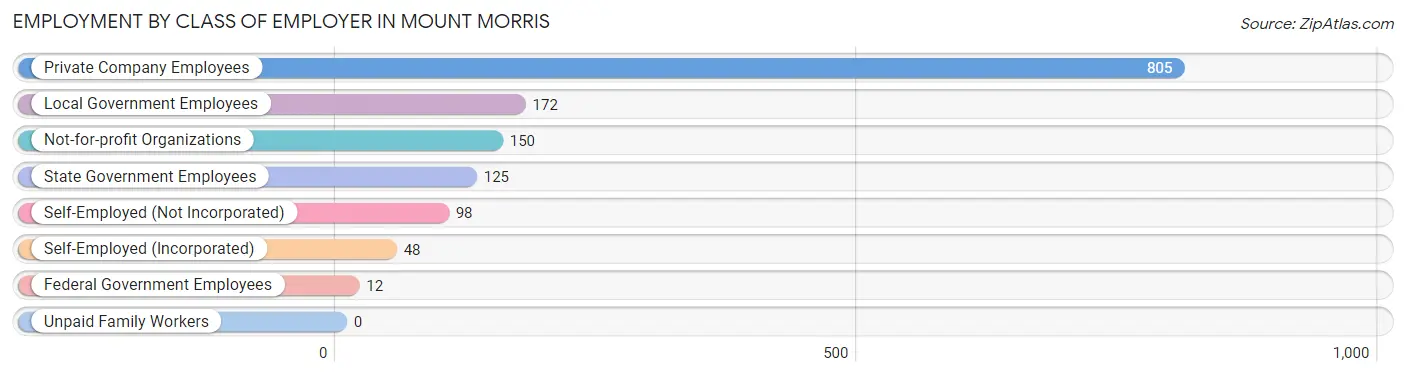
| Employer Class | # Employees | % Employees |
| Private Company Employees | 805 | 57.1% |
| Self-Employed (Incorporated) | 48 | 3.4% |
| Self-Employed (Not Incorporated) | 98 | 7.0% |
| Not-for-profit Organizations | 150 | 10.6% |
| Local Government Employees | 172 | 12.2% |
| State Government Employees | 125 | 8.9% |
| Federal Government Employees | 12 | 0.9% |
| Unpaid Family Workers | 0 | 0.0% |
| Total | 1,410 | 100.0% |
Employment Status by Age in Mount Morris
According to the labor force statistics for Mount Morris, out of the total population over 16 years of age (2,573), 56.5% or 1,454 individuals are in the labor force, with 3.1% or 45 of them unemployed. The age group with the highest labor force participation rate is 45 to 54 years, with 83.0% or 289 individuals in the labor force. Within the labor force, the 30 to 34 years age range has the highest percentage of unemployed individuals, with 13.4% or 19 of them being unemployed.
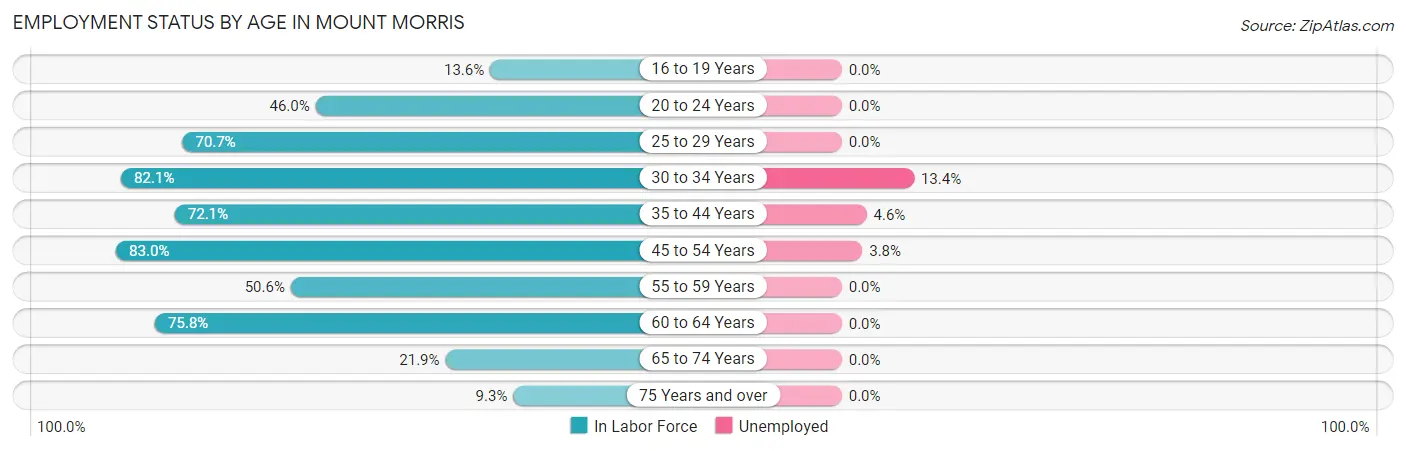
| Age Bracket | In Labor Force | Unemployed |
| 16 to 19 Years | 15 (13.6%) | 0 (0.0%) |
| 20 to 24 Years | 103 (46.0%) | 0 (0.0%) |
| 25 to 29 Years | 203 (70.7%) | 0 (0.0%) |
| 30 to 34 Years | 142 (82.1%) | 19 (13.4%) |
| 35 to 44 Years | 326 (72.1%) | 15 (4.6%) |
| 45 to 54 Years | 289 (83.0%) | 11 (3.8%) |
| 55 to 59 Years | 127 (50.6%) | 0 (0.0%) |
| 60 to 64 Years | 169 (75.8%) | 0 (0.0%) |
| 65 to 74 Years | 59 (21.9%) | 0 (0.0%) |
| 75 Years and over | 22 (9.3%) | 0 (0.0%) |
| Total | 1,454 (56.5%) | 45 (3.1%) |
Employment Status by Educational Attainment in Mount Morris
According to labor force statistics for Mount Morris, 72.4% of individuals (1,255) out of the total population between 25 and 64 years of age (1,734) are in the labor force, with 3.6% or 45 of them being unemployed. The group with the highest labor force participation rate are those with the educational attainment of bachelor's degree or higher, with 84.8% or 262 individuals in the labor force. Within the labor force, individuals with college / associate degree education have the highest percentage of unemployment, with 4.9% or 20 of them being unemployed.
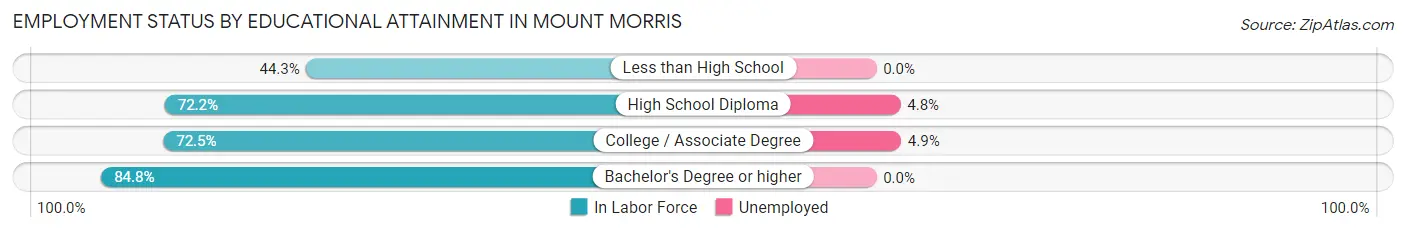
| Educational Attainment | In Labor Force | Unemployed |
| Less than High School | 58 (44.3%) | 0 (0.0%) |
| High School Diploma | 538 (72.2%) | 36 (4.8%) |
| College / Associate Degree | 398 (72.5%) | 27 (4.9%) |
| Bachelor's Degree or higher | 262 (84.8%) | 0 (0.0%) |
| Total | 1,255 (72.4%) | 62 (3.6%) |
Employment Occupations by Sex in Mount Morris
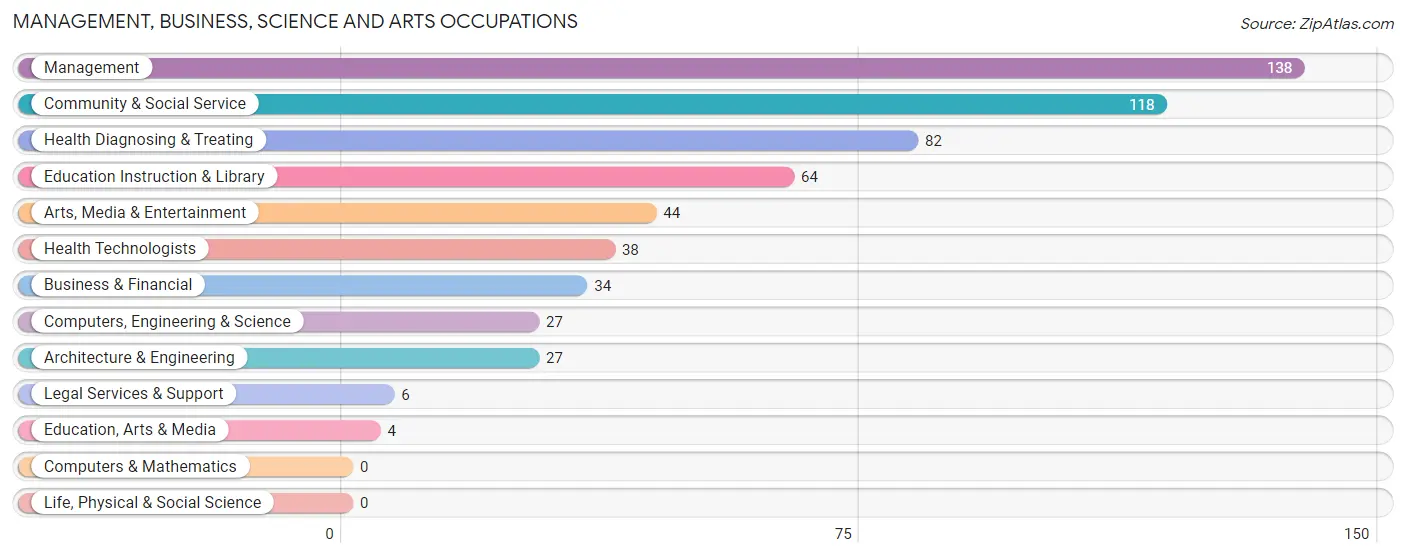
Management, Business, Science and Arts Occupations
The most common Management, Business, Science and Arts occupations in Mount Morris are Management (138 | 9.9%), Community & Social Service (118 | 8.4%), Health Diagnosing & Treating (82 | 5.9%), Education Instruction & Library (64 | 4.6%), and Arts, Media & Entertainment (44 | 3.2%).
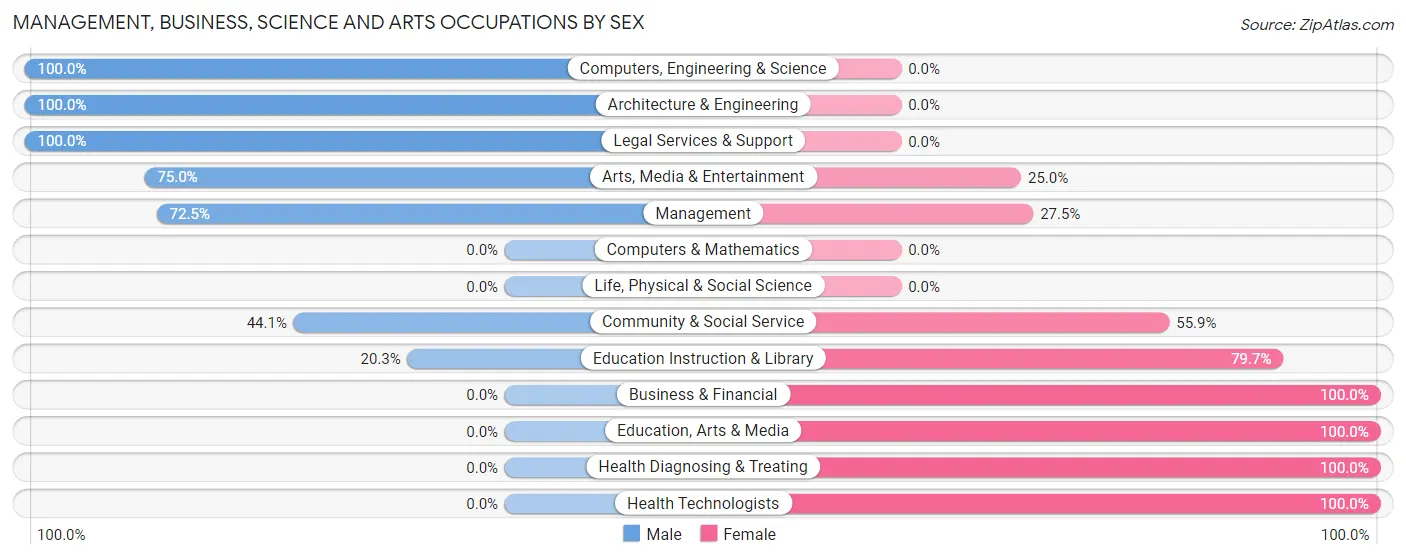
Management, Business, Science and Arts Occupations by Sex
Within the Management, Business, Science and Arts occupations in Mount Morris, the most male-oriented occupations are Computers, Engineering & Science (100.0%), Architecture & Engineering (100.0%), and Legal Services & Support (100.0%), while the most female-oriented occupations are Business & Financial (100.0%), Education, Arts & Media (100.0%), and Health Diagnosing & Treating (100.0%).
| Occupation | Male | Female |
| Management | 100 (72.5%) | 38 (27.5%) |
| Business & Financial | 0 (0.0%) | 34 (100.0%) |
| Computers, Engineering & Science | 27 (100.0%) | 0 (0.0%) |
| Computers & Mathematics | 0 (0.0%) | 0 (0.0%) |
| Architecture & Engineering | 27 (100.0%) | 0 (0.0%) |
| Life, Physical & Social Science | 0 (0.0%) | 0 (0.0%) |
| Community & Social Service | 52 (44.1%) | 66 (55.9%) |
| Education, Arts & Media | 0 (0.0%) | 4 (100.0%) |
| Legal Services & Support | 6 (100.0%) | 0 (0.0%) |
| Education Instruction & Library | 13 (20.3%) | 51 (79.7%) |
| Arts, Media & Entertainment | 33 (75.0%) | 11 (25.0%) |
| Health Diagnosing & Treating | 0 (0.0%) | 82 (100.0%) |
| Health Technologists | 0 (0.0%) | 38 (100.0%) |
| Total (Category) | 179 (44.9%) | 220 (55.1%) |
| Total (Overall) | 740 (52.9%) | 658 (47.1%) |
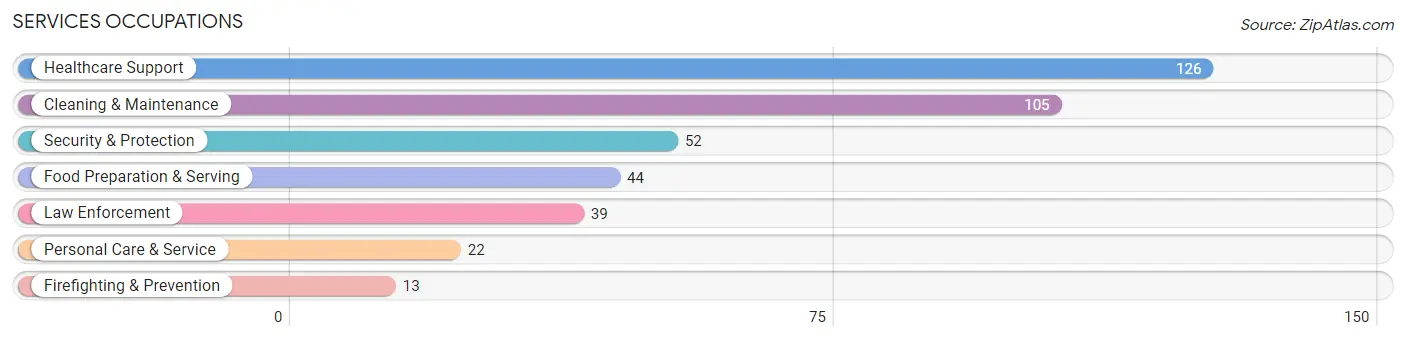
Services Occupations
The most common Services occupations in Mount Morris are Healthcare Support (126 | 9.0%), Cleaning & Maintenance (105 | 7.5%), Security & Protection (52 | 3.7%), Food Preparation & Serving (44 | 3.2%), and Law Enforcement (39 | 2.8%).
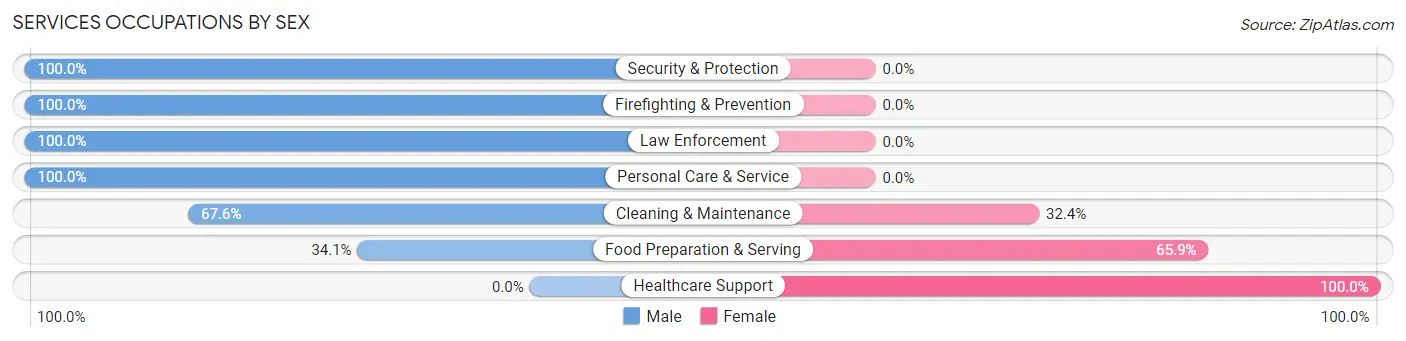
Services Occupations by Sex
Within the Services occupations in Mount Morris, the most male-oriented occupations are Security & Protection (100.0%), Firefighting & Prevention (100.0%), and Law Enforcement (100.0%), while the most female-oriented occupations are Healthcare Support (100.0%), Food Preparation & Serving (65.9%), and Cleaning & Maintenance (32.4%).
| Occupation | Male | Female |
| Healthcare Support | 0 (0.0%) | 126 (100.0%) |
| Security & Protection | 52 (100.0%) | 0 (0.0%) |
| Firefighting & Prevention | 13 (100.0%) | 0 (0.0%) |
| Law Enforcement | 39 (100.0%) | 0 (0.0%) |
| Food Preparation & Serving | 15 (34.1%) | 29 (65.9%) |
| Cleaning & Maintenance | 71 (67.6%) | 34 (32.4%) |
| Personal Care & Service | 22 (100.0%) | 0 (0.0%) |
| Total (Category) | 160 (45.9%) | 189 (54.1%) |
| Total (Overall) | 740 (52.9%) | 658 (47.1%) |
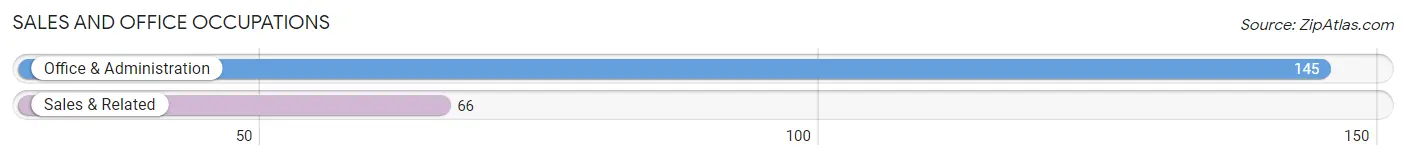
Sales and Office Occupations
The most common Sales and Office occupations in Mount Morris are Office & Administration (145 | 10.4%), and Sales & Related (66 | 4.7%).
Sales and Office Occupations by Sex
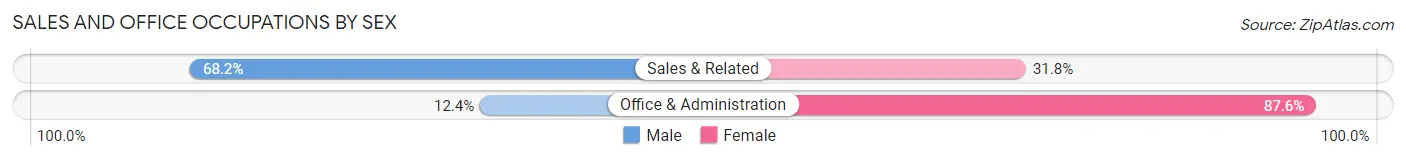
| Occupation | Male | Female |
| Sales & Related | 45 (68.2%) | 21 (31.8%) |
| Office & Administration | 18 (12.4%) | 127 (87.6%) |
| Total (Category) | 63 (29.9%) | 148 (70.1%) |
| Total (Overall) | 740 (52.9%) | 658 (47.1%) |
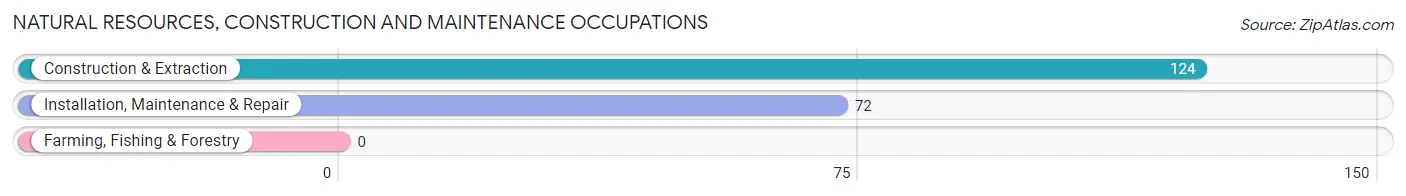
Natural Resources, Construction and Maintenance Occupations
The most common Natural Resources, Construction and Maintenance occupations in Mount Morris are Construction & Extraction (124 | 8.9%), and Installation, Maintenance & Repair (72 | 5.1%).
Natural Resources, Construction and Maintenance Occupations by Sex
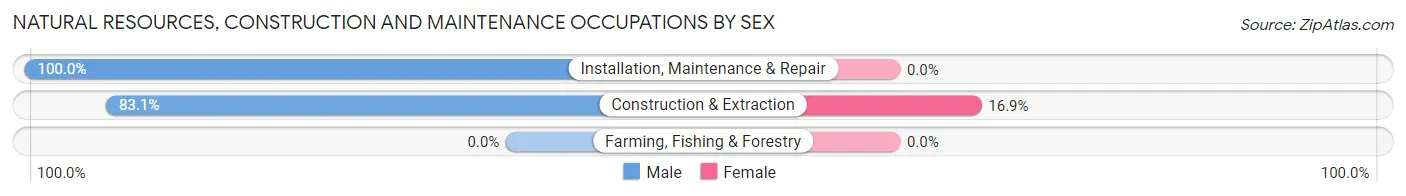
| Occupation | Male | Female |
| Farming, Fishing & Forestry | 0 (0.0%) | 0 (0.0%) |
| Construction & Extraction | 103 (83.1%) | 21 (16.9%) |
| Installation, Maintenance & Repair | 72 (100.0%) | 0 (0.0%) |
| Total (Category) | 175 (89.3%) | 21 (10.7%) |
| Total (Overall) | 740 (52.9%) | 658 (47.1%) |
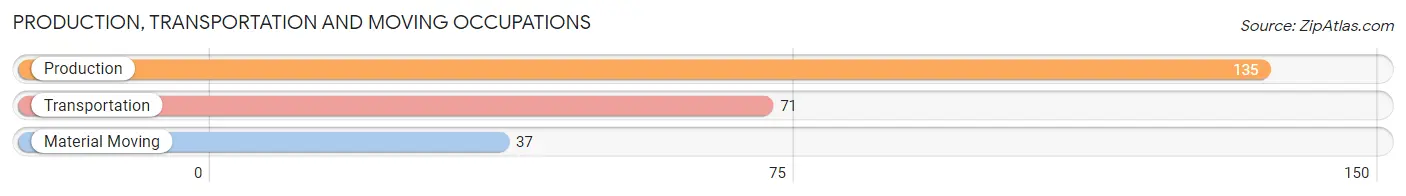
Production, Transportation and Moving Occupations
The most common Production, Transportation and Moving occupations in Mount Morris are Production (135 | 9.7%), Transportation (71 | 5.1%), and Material Moving (37 | 2.6%).
Production, Transportation and Moving Occupations by Sex
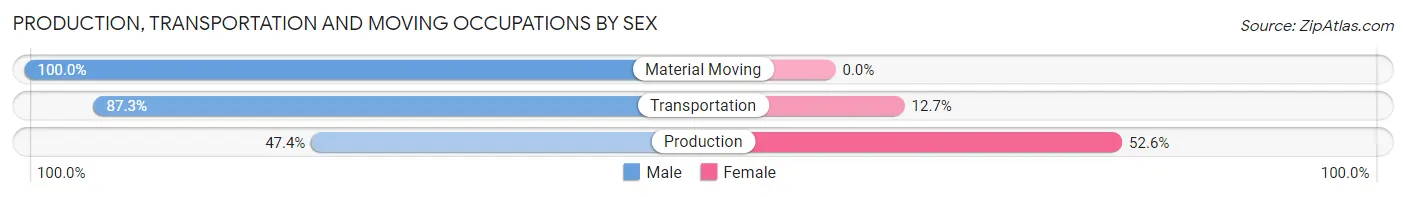
| Occupation | Male | Female |
| Production | 64 (47.4%) | 71 (52.6%) |
| Transportation | 62 (87.3%) | 9 (12.7%) |
| Material Moving | 37 (100.0%) | 0 (0.0%) |
| Total (Category) | 163 (67.1%) | 80 (32.9%) |
| Total (Overall) | 740 (52.9%) | 658 (47.1%) |
Employment Industries by Sex in Mount Morris
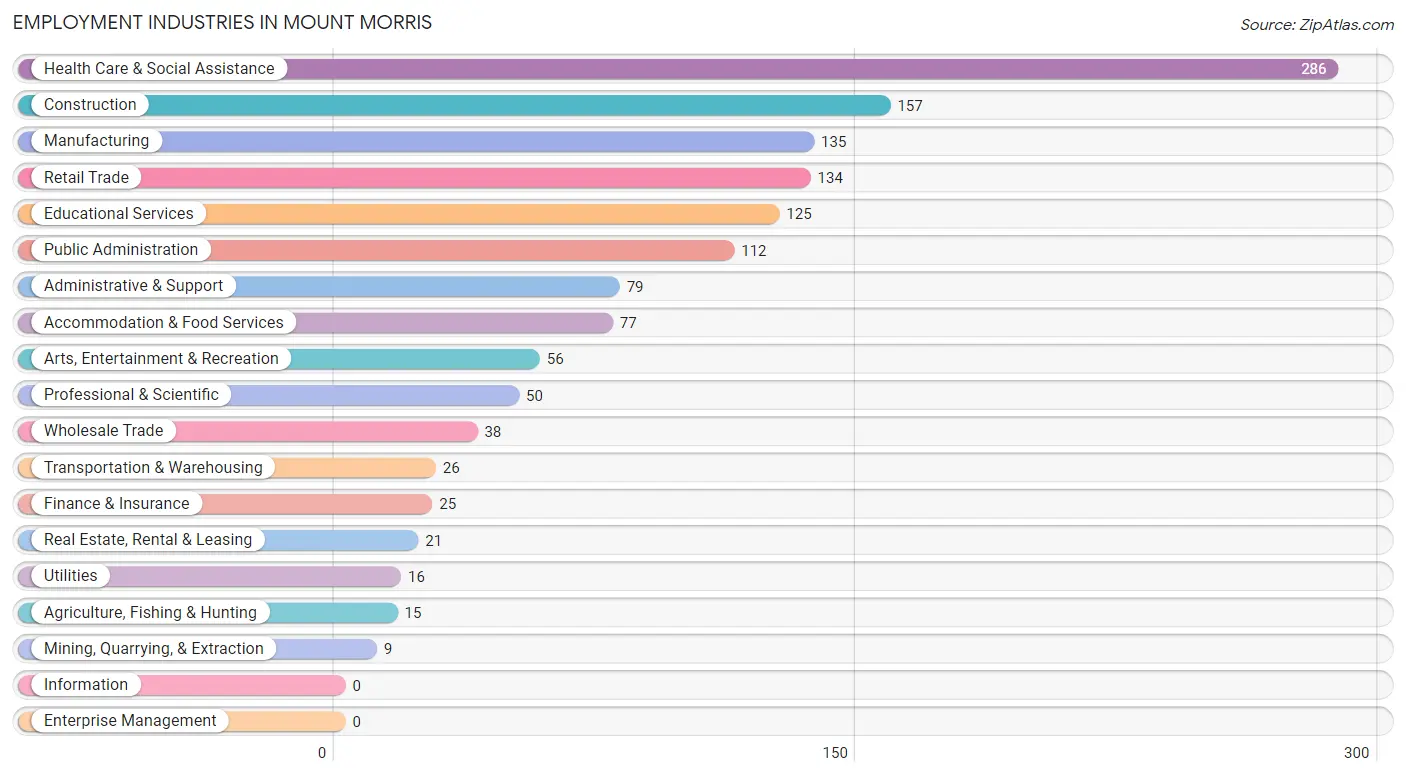
Employment Industries in Mount Morris
The major employment industries in Mount Morris include Health Care & Social Assistance (286 | 20.5%), Construction (157 | 11.2%), Manufacturing (135 | 9.7%), Retail Trade (134 | 9.6%), and Educational Services (125 | 8.9%).
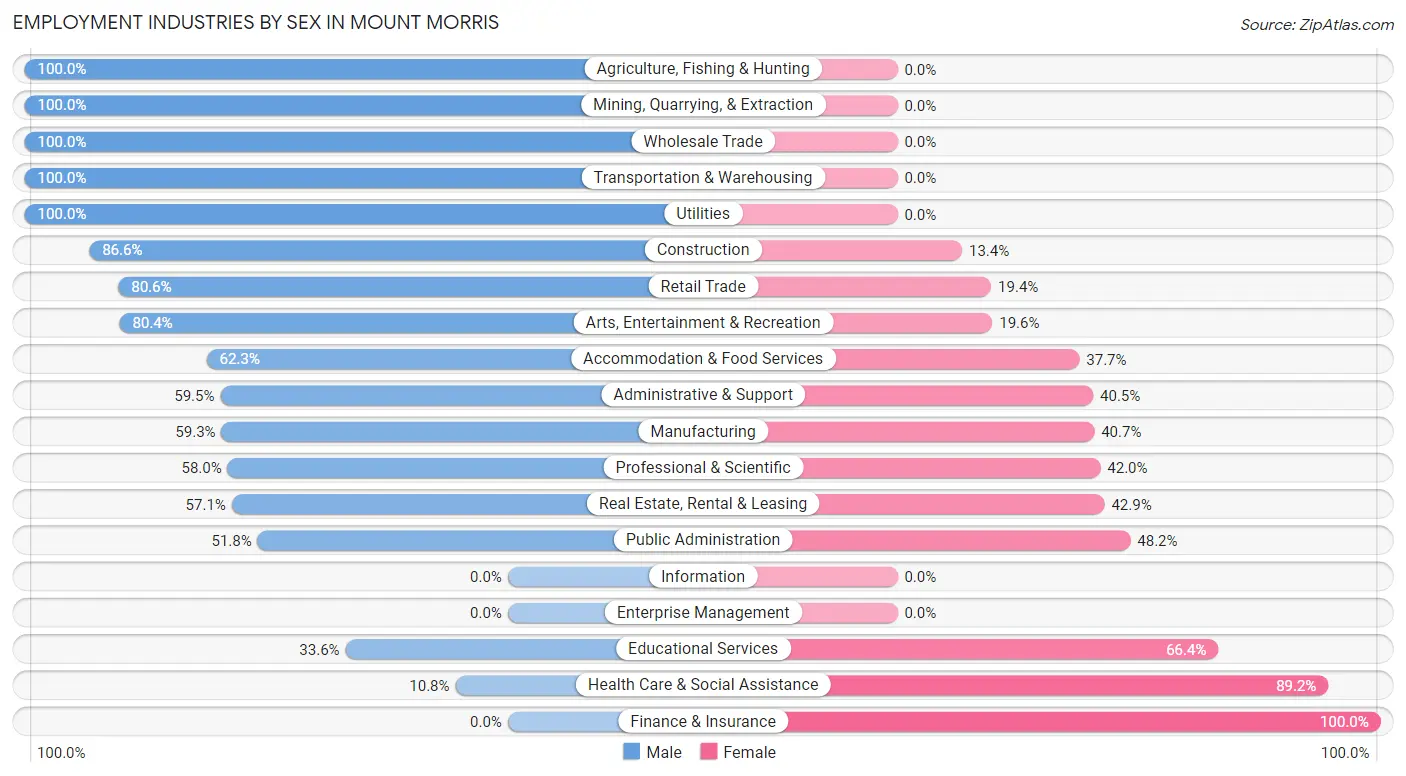
Employment Industries by Sex in Mount Morris
The Mount Morris industries that see more men than women are Agriculture, Fishing & Hunting (100.0%), Mining, Quarrying, & Extraction (100.0%), and Wholesale Trade (100.0%), whereas the industries that tend to have a higher number of women are Finance & Insurance (100.0%), Health Care & Social Assistance (89.2%), and Educational Services (66.4%).
| Industry | Male | Female |
| Agriculture, Fishing & Hunting | 15 (100.0%) | 0 (0.0%) |
| Mining, Quarrying, & Extraction | 9 (100.0%) | 0 (0.0%) |
| Construction | 136 (86.6%) | 21 (13.4%) |
| Manufacturing | 80 (59.3%) | 55 (40.7%) |
| Wholesale Trade | 38 (100.0%) | 0 (0.0%) |
| Retail Trade | 108 (80.6%) | 26 (19.4%) |
| Transportation & Warehousing | 26 (100.0%) | 0 (0.0%) |
| Utilities | 16 (100.0%) | 0 (0.0%) |
| Information | 0 (0.0%) | 0 (0.0%) |
| Finance & Insurance | 0 (0.0%) | 25 (100.0%) |
| Real Estate, Rental & Leasing | 12 (57.1%) | 9 (42.9%) |
| Professional & Scientific | 29 (58.0%) | 21 (42.0%) |
| Enterprise Management | 0 (0.0%) | 0 (0.0%) |
| Administrative & Support | 47 (59.5%) | 32 (40.5%) |
| Educational Services | 42 (33.6%) | 83 (66.4%) |
| Health Care & Social Assistance | 31 (10.8%) | 255 (89.2%) |
| Arts, Entertainment & Recreation | 45 (80.4%) | 11 (19.6%) |
| Accommodation & Food Services | 48 (62.3%) | 29 (37.7%) |
| Public Administration | 58 (51.8%) | 54 (48.2%) |
| Total | 740 (52.9%) | 658 (47.1%) |
Education in Mount Morris
School Enrollment in Mount Morris
The most common levels of schooling among the 673 students in Mount Morris are elementary school (237 | 35.2%), middle school (181 | 26.9%), and high school (151 | 22.4%).
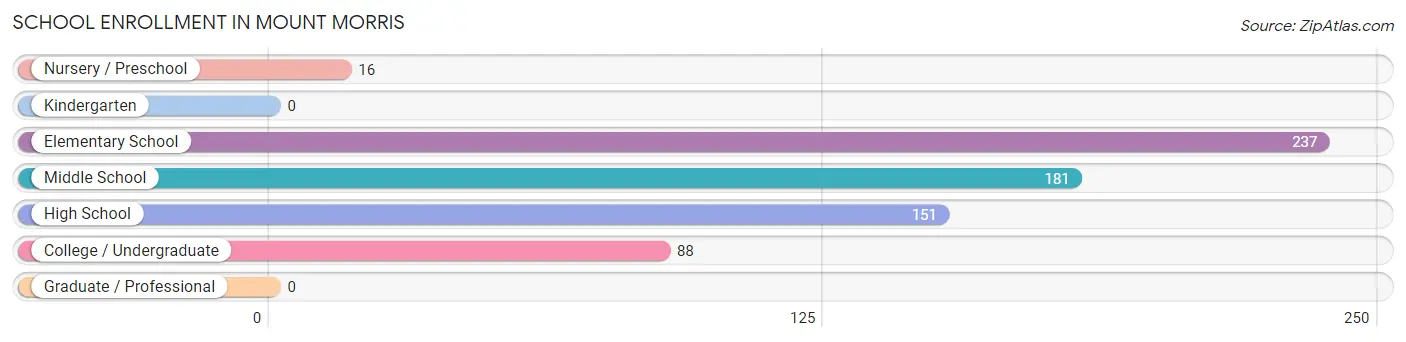
| School Level | # Students | % Students |
| Nursery / Preschool | 16 | 2.4% |
| Kindergarten | 0 | 0.0% |
| Elementary School | 237 | 35.2% |
| Middle School | 181 | 26.9% |
| High School | 151 | 22.4% |
| College / Undergraduate | 88 | 13.1% |
| Graduate / Professional | 0 | 0.0% |
| Total | 673 | 100.0% |
School Enrollment by Age by Funding Source in Mount Morris
Out of a total of 673 students who are enrolled in schools in Mount Morris, 30 (4.5%) attend a private institution, while the remaining 643 (95.5%) are enrolled in public schools. The age group of 3 to 4 year olds has the highest likelihood of being enrolled in private schools, with 16 (100.0% in the age bracket) enrolled. Conversely, the age group of 10 to 14 year olds has the lowest likelihood of being enrolled in a private school, with 282 (100.0% in the age bracket) attending a public institution.
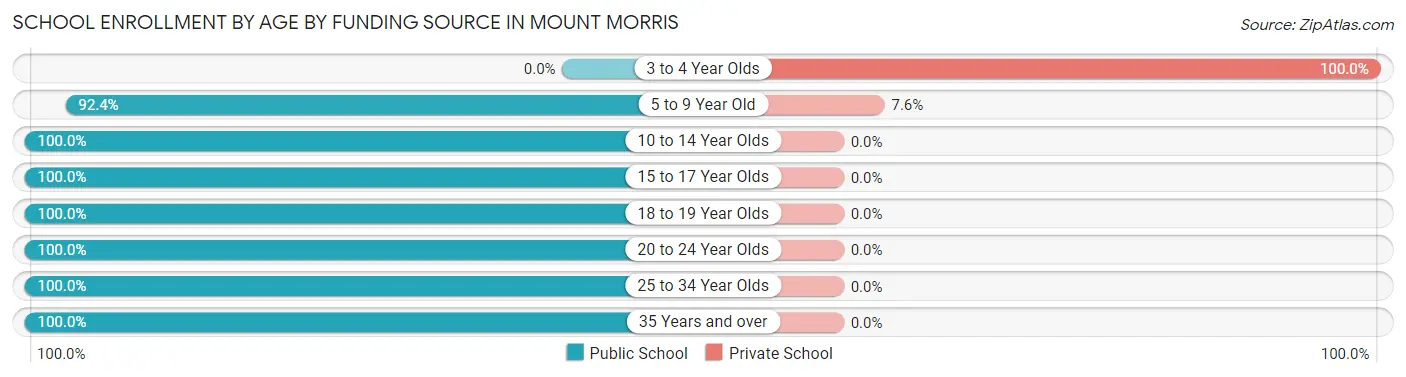
| Age Bracket | Public School | Private School |
| 3 to 4 Year Olds | 0 (0.0%) | 16 (100.0%) |
| 5 to 9 Year Old | 170 (92.4%) | 14 (7.6%) |
| 10 to 14 Year Olds | 282 (100.0%) | 0 (0.0%) |
| 15 to 17 Year Olds | 81 (100.0%) | 0 (0.0%) |
| 18 to 19 Year Olds | 22 (100.0%) | 0 (0.0%) |
| 20 to 24 Year Olds | 36 (100.0%) | 0 (0.0%) |
| 25 to 34 Year Olds | 20 (100.0%) | 0 (0.0%) |
| 35 Years and over | 32 (100.0%) | 0 (0.0%) |
| Total | 643 (95.5%) | 30 (4.5%) |
Educational Attainment by Field of Study in Mount Morris
Education (103 | 21.7%), business (67 | 14.1%), communications (65 | 13.7%), social sciences (64 | 13.5%), and liberal arts & history (43 | 9.0%) are the most common fields of study among 475 individuals in Mount Morris who have obtained a bachelor's degree or higher.
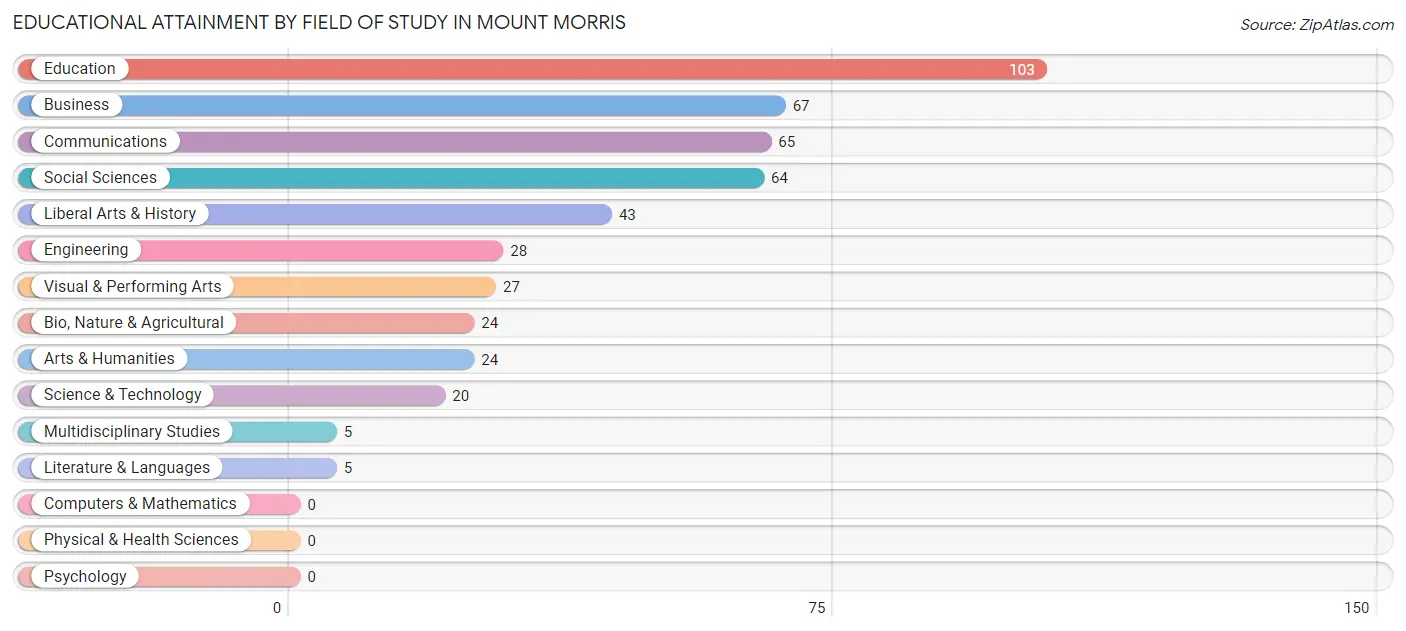
| Field of Study | # Graduates | % Graduates |
| Computers & Mathematics | 0 | 0.0% |
| Bio, Nature & Agricultural | 24 | 5.1% |
| Physical & Health Sciences | 0 | 0.0% |
| Psychology | 0 | 0.0% |
| Social Sciences | 64 | 13.5% |
| Engineering | 28 | 5.9% |
| Multidisciplinary Studies | 5 | 1.1% |
| Science & Technology | 20 | 4.2% |
| Business | 67 | 14.1% |
| Education | 103 | 21.7% |
| Literature & Languages | 5 | 1.1% |
| Liberal Arts & History | 43 | 9.0% |
| Visual & Performing Arts | 27 | 5.7% |
| Communications | 65 | 13.7% |
| Arts & Humanities | 24 | 5.1% |
| Total | 475 | 100.0% |
Transportation & Commute in Mount Morris
Vehicle Availability by Sex in Mount Morris
The most prevalent vehicle ownership categories in Mount Morris are males with 2 vehicles (349, accounting for 46.4%) and females with 2 vehicles (280, making up 53.0%).
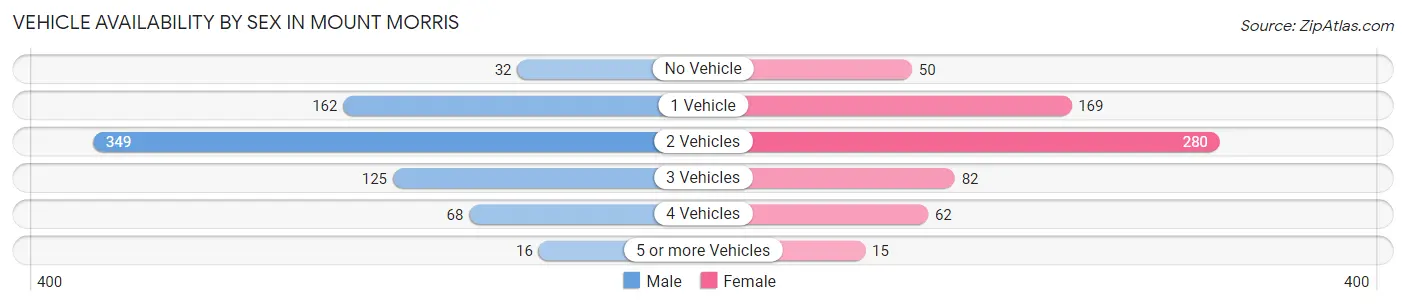
| Vehicles Available | Male | Female |
| No Vehicle | 32 (4.3%) | 50 (7.6%) |
| 1 Vehicle | 162 (21.5%) | 169 (25.7%) |
| 2 Vehicles | 349 (46.4%) | 280 (42.5%) |
| 3 Vehicles | 125 (16.6%) | 82 (12.5%) |
| 4 Vehicles | 68 (9.0%) | 62 (9.4%) |
| 5 or more Vehicles | 16 (2.1%) | 15 (2.3%) |
| Total | 752 (100.0%) | 658 (100.0%) |
Commute Time in Mount Morris
The most frequently occuring commute durations in Mount Morris are 5 to 9 minutes (273 commuters, 20.5%), 15 to 19 minutes (226 commuters, 16.9%), and 30 to 34 minutes (157 commuters, 11.8%).
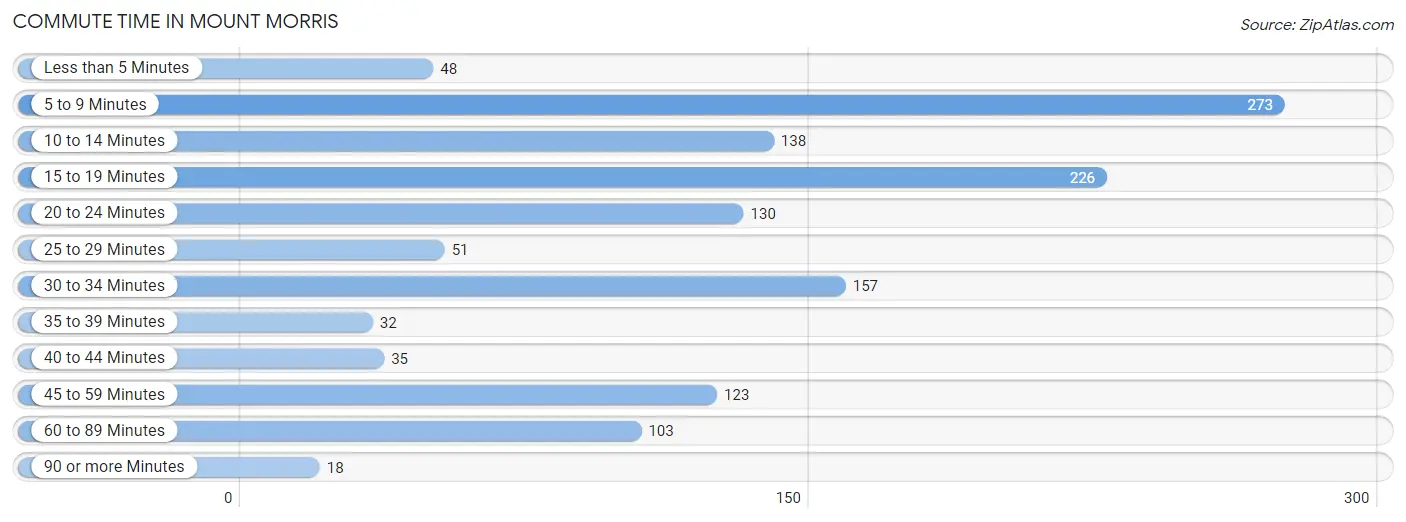
| Commute Time | # Commuters | % Commuters |
| Less than 5 Minutes | 48 | 3.6% |
| 5 to 9 Minutes | 273 | 20.5% |
| 10 to 14 Minutes | 138 | 10.3% |
| 15 to 19 Minutes | 226 | 16.9% |
| 20 to 24 Minutes | 130 | 9.8% |
| 25 to 29 Minutes | 51 | 3.8% |
| 30 to 34 Minutes | 157 | 11.8% |
| 35 to 39 Minutes | 32 | 2.4% |
| 40 to 44 Minutes | 35 | 2.6% |
| 45 to 59 Minutes | 123 | 9.2% |
| 60 to 89 Minutes | 103 | 7.7% |
| 90 or more Minutes | 18 | 1.3% |
Commute Time by Sex in Mount Morris
The most common commute times in Mount Morris are 15 to 19 minutes (137 commuters, 19.5%) for males and 5 to 9 minutes (174 commuters, 27.6%) for females.
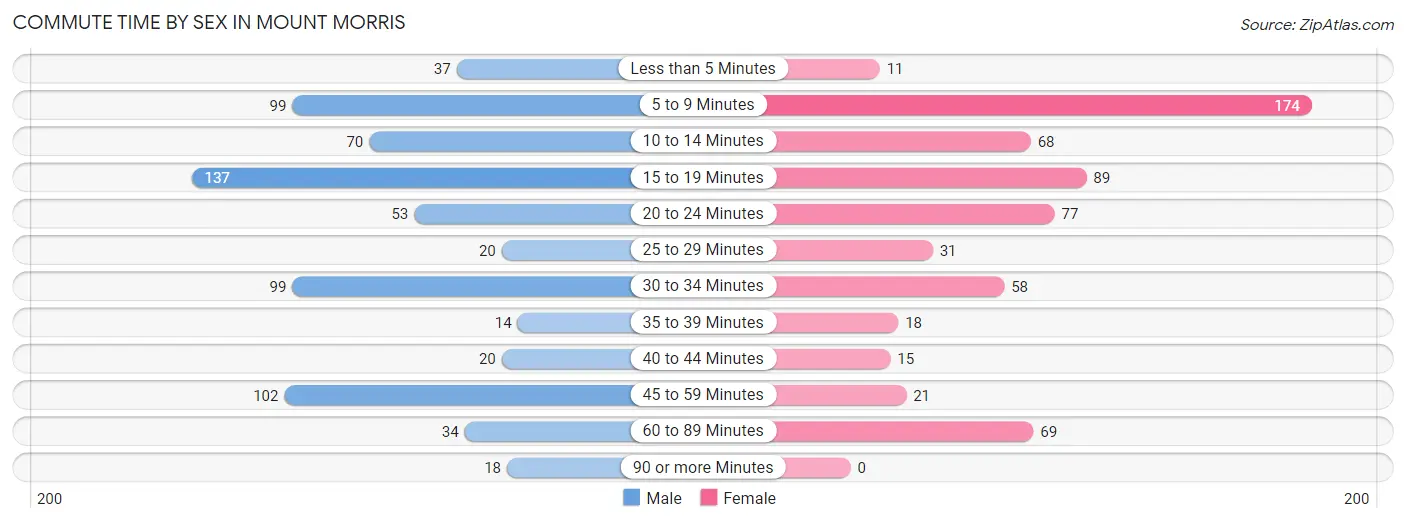
| Commute Time | Male | Female |
| Less than 5 Minutes | 37 (5.3%) | 11 (1.7%) |
| 5 to 9 Minutes | 99 (14.1%) | 174 (27.6%) |
| 10 to 14 Minutes | 70 (10.0%) | 68 (10.8%) |
| 15 to 19 Minutes | 137 (19.5%) | 89 (14.1%) |
| 20 to 24 Minutes | 53 (7.5%) | 77 (12.2%) |
| 25 to 29 Minutes | 20 (2.8%) | 31 (4.9%) |
| 30 to 34 Minutes | 99 (14.1%) | 58 (9.2%) |
| 35 to 39 Minutes | 14 (2.0%) | 18 (2.9%) |
| 40 to 44 Minutes | 20 (2.8%) | 15 (2.4%) |
| 45 to 59 Minutes | 102 (14.5%) | 21 (3.3%) |
| 60 to 89 Minutes | 34 (4.8%) | 69 (10.9%) |
| 90 or more Minutes | 18 (2.6%) | 0 (0.0%) |
Time of Departure to Work by Sex in Mount Morris
The most frequent times of departure to work in Mount Morris are 6:00 AM to 6:29 AM (117, 16.6%) for males and 7:00 AM to 7:29 AM (138, 21.9%) for females.
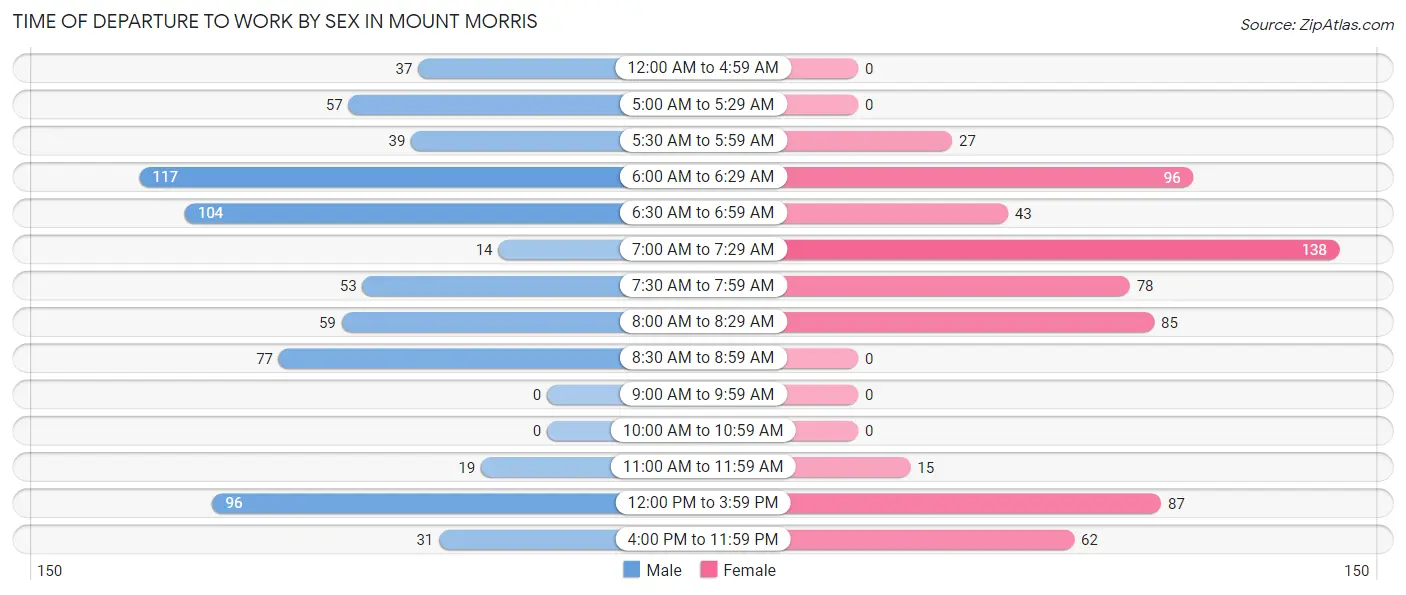
| Time of Departure | Male | Female |
| 12:00 AM to 4:59 AM | 37 (5.3%) | 0 (0.0%) |
| 5:00 AM to 5:29 AM | 57 (8.1%) | 0 (0.0%) |
| 5:30 AM to 5:59 AM | 39 (5.6%) | 27 (4.3%) |
| 6:00 AM to 6:29 AM | 117 (16.6%) | 96 (15.2%) |
| 6:30 AM to 6:59 AM | 104 (14.8%) | 43 (6.8%) |
| 7:00 AM to 7:29 AM | 14 (2.0%) | 138 (21.9%) |
| 7:30 AM to 7:59 AM | 53 (7.5%) | 78 (12.4%) |
| 8:00 AM to 8:29 AM | 59 (8.4%) | 85 (13.5%) |
| 8:30 AM to 8:59 AM | 77 (11.0%) | 0 (0.0%) |
| 9:00 AM to 9:59 AM | 0 (0.0%) | 0 (0.0%) |
| 10:00 AM to 10:59 AM | 0 (0.0%) | 0 (0.0%) |
| 11:00 AM to 11:59 AM | 19 (2.7%) | 15 (2.4%) |
| 12:00 PM to 3:59 PM | 96 (13.7%) | 87 (13.8%) |
| 4:00 PM to 11:59 PM | 31 (4.4%) | 62 (9.8%) |
| Total | 703 (100.0%) | 631 (100.0%) |
Housing Occupancy in Mount Morris
Occupancy by Ownership in Mount Morris
Of the total 1,418 dwellings in Mount Morris, owner-occupied units account for 1,046 (73.8%), while renter-occupied units make up 372 (26.2%).
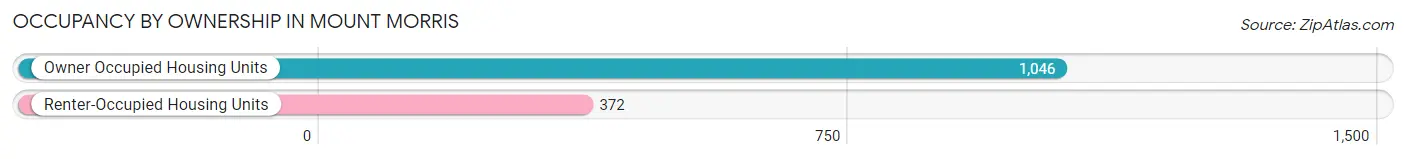
| Occupancy | # Housing Units | % Housing Units |
| Owner Occupied Housing Units | 1,046 | 73.8% |
| Renter-Occupied Housing Units | 372 | 26.2% |
| Total Occupied Housing Units | 1,418 | 100.0% |
Occupancy by Household Size in Mount Morris
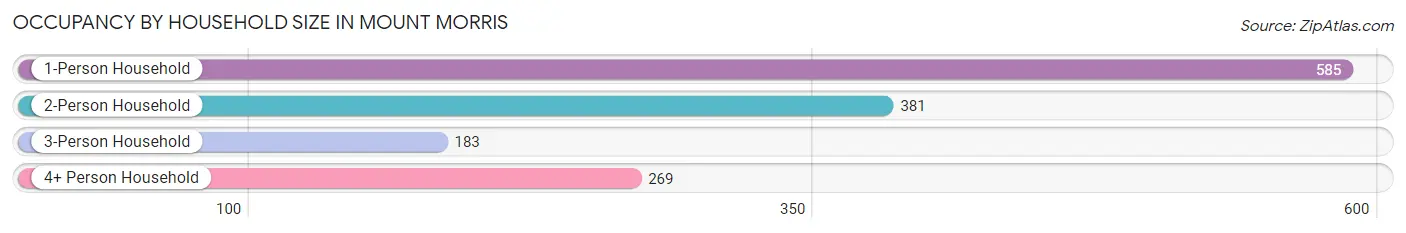
| Household Size | # Housing Units | % Housing Units |
| 1-Person Household | 585 | 41.3% |
| 2-Person Household | 381 | 26.9% |
| 3-Person Household | 183 | 12.9% |
| 4+ Person Household | 269 | 19.0% |
| Total Housing Units | 1,418 | 100.0% |
Occupancy by Ownership by Household Size in Mount Morris
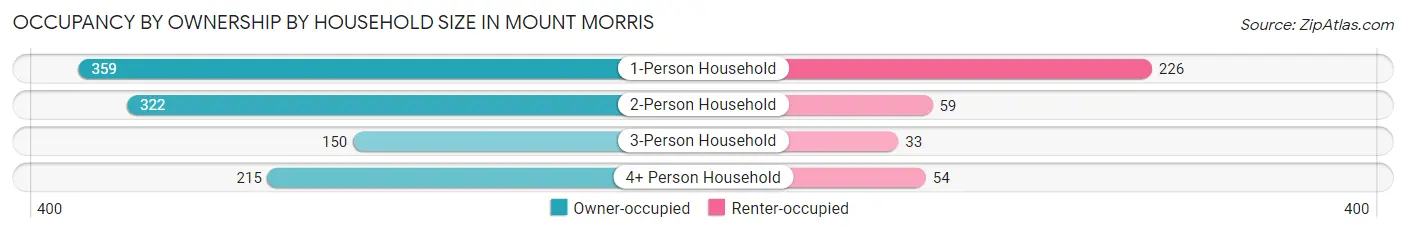
| Household Size | Owner-occupied | Renter-occupied |
| 1-Person Household | 359 (61.4%) | 226 (38.6%) |
| 2-Person Household | 322 (84.5%) | 59 (15.5%) |
| 3-Person Household | 150 (82.0%) | 33 (18.0%) |
| 4+ Person Household | 215 (79.9%) | 54 (20.1%) |
| Total Housing Units | 1,046 (73.8%) | 372 (26.2%) |
Occupancy by Educational Attainment in Mount Morris
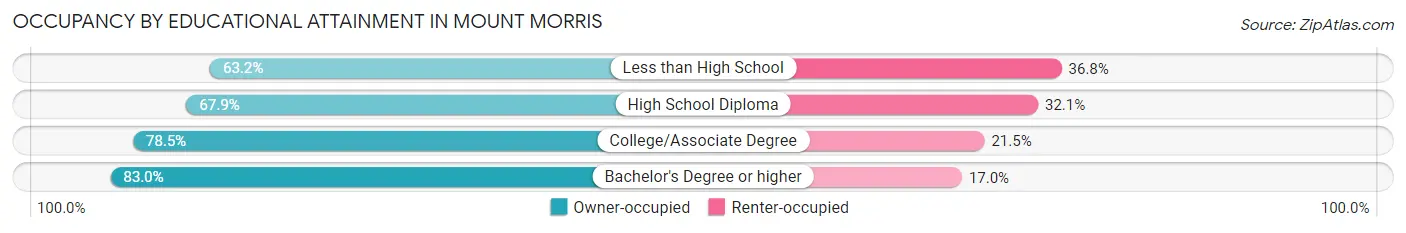
| Household Size | Owner-occupied | Renter-occupied |
| Less than High School | 98 (63.2%) | 57 (36.8%) |
| High School Diploma | 364 (67.9%) | 172 (32.1%) |
| College/Associate Degree | 340 (78.5%) | 93 (21.5%) |
| Bachelor's Degree or higher | 244 (83.0%) | 50 (17.0%) |
Occupancy by Age of Householder in Mount Morris
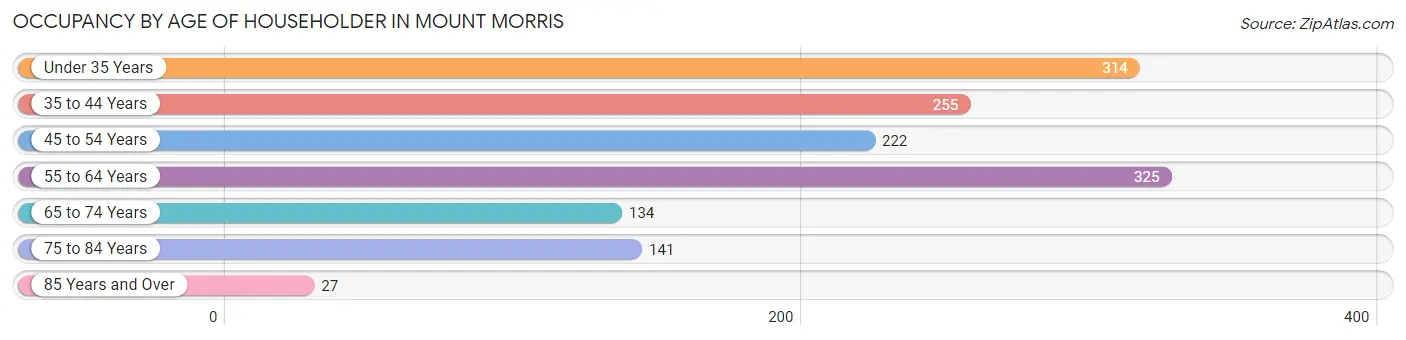
| Age Bracket | # Households | % Households |
| Under 35 Years | 314 | 22.1% |
| 35 to 44 Years | 255 | 18.0% |
| 45 to 54 Years | 222 | 15.7% |
| 55 to 64 Years | 325 | 22.9% |
| 65 to 74 Years | 134 | 9.5% |
| 75 to 84 Years | 141 | 9.9% |
| 85 Years and Over | 27 | 1.9% |
| Total | 1,418 | 100.0% |
Housing Finances in Mount Morris
Median Income by Occupancy in Mount Morris
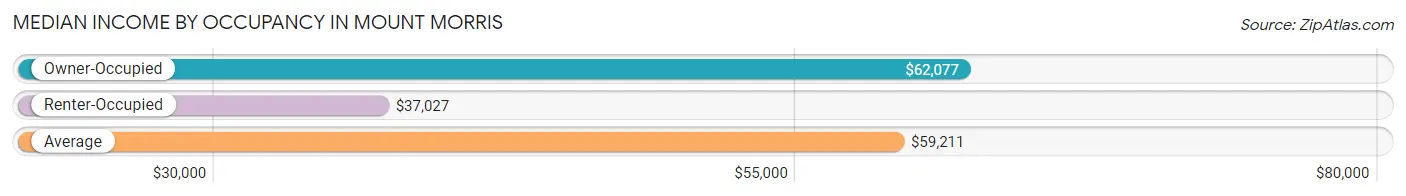
| Occupancy Type | # Households | Median Income |
| Owner-Occupied | 1,046 (73.8%) | $62,077 |
| Renter-Occupied | 372 (26.2%) | $37,027 |
| Average | 1,418 (100.0%) | $59,211 |
Occupancy by Householder Income Bracket in Mount Morris
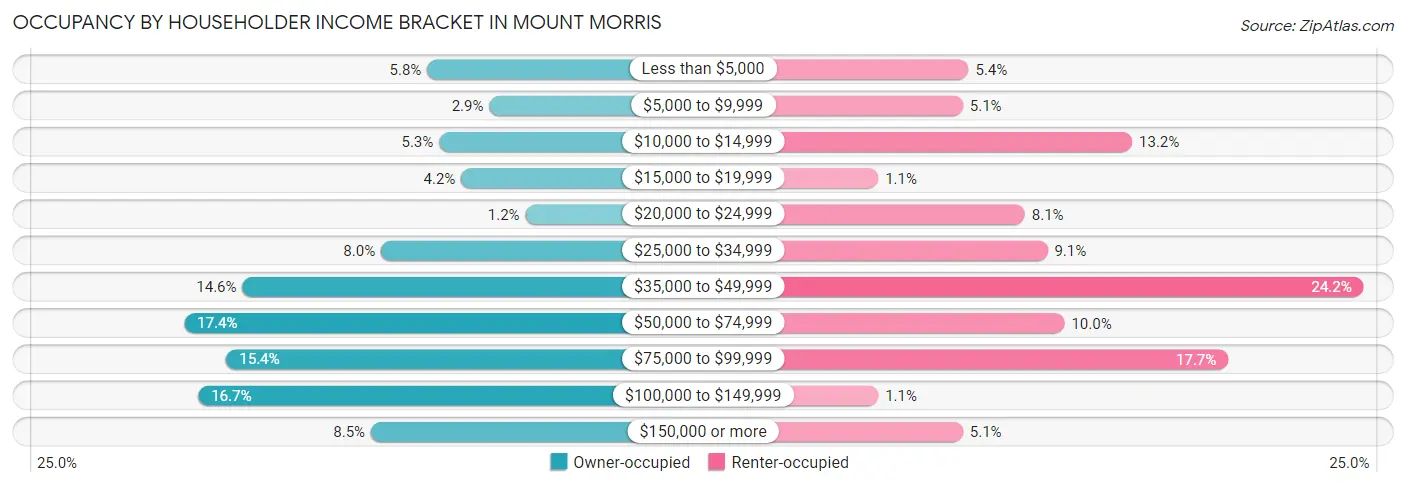
| Income Bracket | Owner-occupied | Renter-occupied |
| Less than $5,000 | 61 (5.8%) | 20 (5.4%) |
| $5,000 to $9,999 | 30 (2.9%) | 19 (5.1%) |
| $10,000 to $14,999 | 55 (5.3%) | 49 (13.2%) |
| $15,000 to $19,999 | 44 (4.2%) | 4 (1.1%) |
| $20,000 to $24,999 | 12 (1.1%) | 30 (8.1%) |
| $25,000 to $34,999 | 84 (8.0%) | 34 (9.1%) |
| $35,000 to $49,999 | 153 (14.6%) | 90 (24.2%) |
| $50,000 to $74,999 | 182 (17.4%) | 37 (10.0%) |
| $75,000 to $99,999 | 161 (15.4%) | 66 (17.7%) |
| $100,000 to $149,999 | 175 (16.7%) | 4 (1.1%) |
| $150,000 or more | 89 (8.5%) | 19 (5.1%) |
| Total | 1,046 (100.0%) | 372 (100.0%) |
Monthly Housing Cost Tiers in Mount Morris
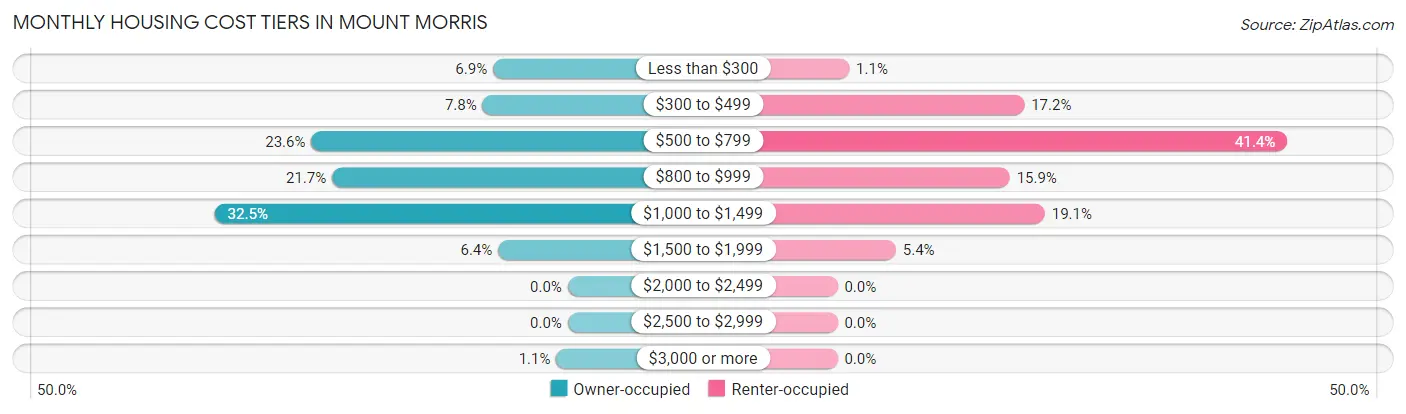
| Monthly Cost | Owner-occupied | Renter-occupied |
| Less than $300 | 72 (6.9%) | 4 (1.1%) |
| $300 to $499 | 82 (7.8%) | 64 (17.2%) |
| $500 to $799 | 247 (23.6%) | 154 (41.4%) |
| $800 to $999 | 227 (21.7%) | 59 (15.9%) |
| $1,000 to $1,499 | 340 (32.5%) | 71 (19.1%) |
| $1,500 to $1,999 | 67 (6.4%) | 20 (5.4%) |
| $2,000 to $2,499 | 0 (0.0%) | 0 (0.0%) |
| $2,500 to $2,999 | 0 (0.0%) | 0 (0.0%) |
| $3,000 or more | 11 (1.1%) | 0 (0.0%) |
| Total | 1,046 (100.0%) | 372 (100.0%) |
Physical Housing Characteristics in Mount Morris
Housing Structures in Mount Morris
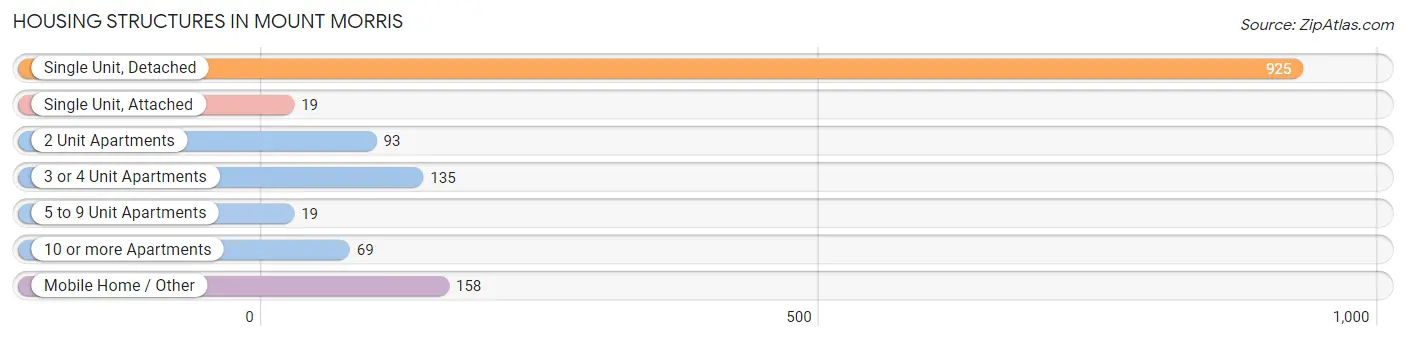
| Structure Type | # Housing Units | % Housing Units |
| Single Unit, Detached | 925 | 65.2% |
| Single Unit, Attached | 19 | 1.3% |
| 2 Unit Apartments | 93 | 6.6% |
| 3 or 4 Unit Apartments | 135 | 9.5% |
| 5 to 9 Unit Apartments | 19 | 1.3% |
| 10 or more Apartments | 69 | 4.9% |
| Mobile Home / Other | 158 | 11.1% |
| Total | 1,418 | 100.0% |
Housing Structures by Occupancy in Mount Morris
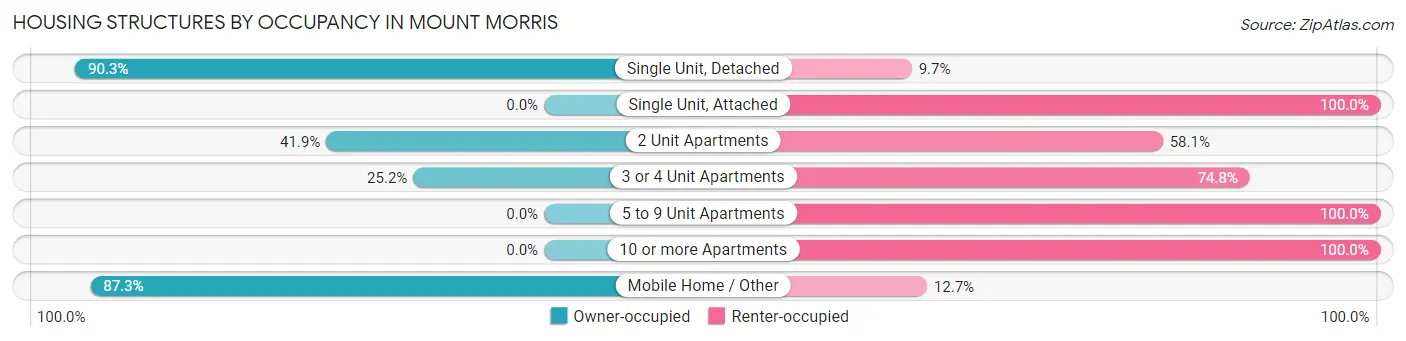
| Structure Type | Owner-occupied | Renter-occupied |
| Single Unit, Detached | 835 (90.3%) | 90 (9.7%) |
| Single Unit, Attached | 0 (0.0%) | 19 (100.0%) |
| 2 Unit Apartments | 39 (41.9%) | 54 (58.1%) |
| 3 or 4 Unit Apartments | 34 (25.2%) | 101 (74.8%) |
| 5 to 9 Unit Apartments | 0 (0.0%) | 19 (100.0%) |
| 10 or more Apartments | 0 (0.0%) | 69 (100.0%) |
| Mobile Home / Other | 138 (87.3%) | 20 (12.7%) |
| Total | 1,046 (73.8%) | 372 (26.2%) |
Housing Structures by Number of Rooms in Mount Morris
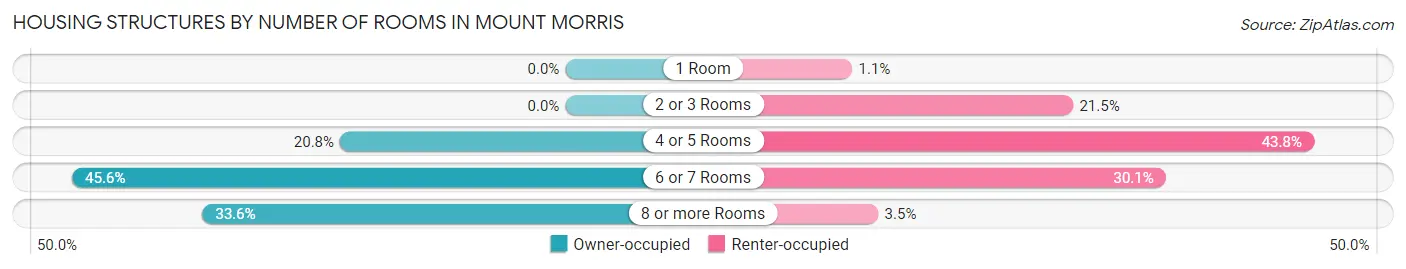
| Number of Rooms | Owner-occupied | Renter-occupied |
| 1 Room | 0 (0.0%) | 4 (1.1%) |
| 2 or 3 Rooms | 0 (0.0%) | 80 (21.5%) |
| 4 or 5 Rooms | 218 (20.8%) | 163 (43.8%) |
| 6 or 7 Rooms | 477 (45.6%) | 112 (30.1%) |
| 8 or more Rooms | 351 (33.6%) | 13 (3.5%) |
| Total | 1,046 (100.0%) | 372 (100.0%) |
Housing Structure by Heating Type in Mount Morris
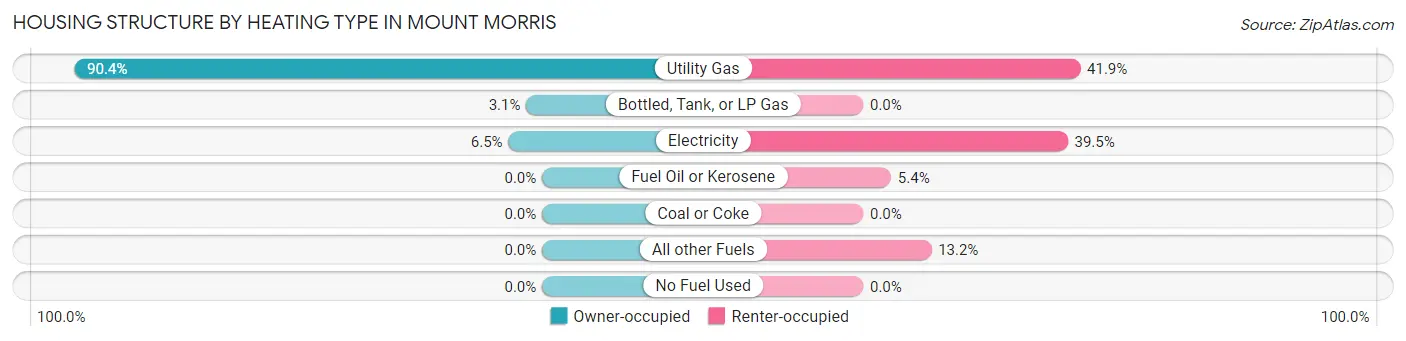
| Heating Type | Owner-occupied | Renter-occupied |
| Utility Gas | 946 (90.4%) | 156 (41.9%) |
| Bottled, Tank, or LP Gas | 32 (3.1%) | 0 (0.0%) |
| Electricity | 68 (6.5%) | 147 (39.5%) |
| Fuel Oil or Kerosene | 0 (0.0%) | 20 (5.4%) |
| Coal or Coke | 0 (0.0%) | 0 (0.0%) |
| All other Fuels | 0 (0.0%) | 49 (13.2%) |
| No Fuel Used | 0 (0.0%) | 0 (0.0%) |
| Total | 1,046 (100.0%) | 372 (100.0%) |
Household Vehicle Usage in Mount Morris
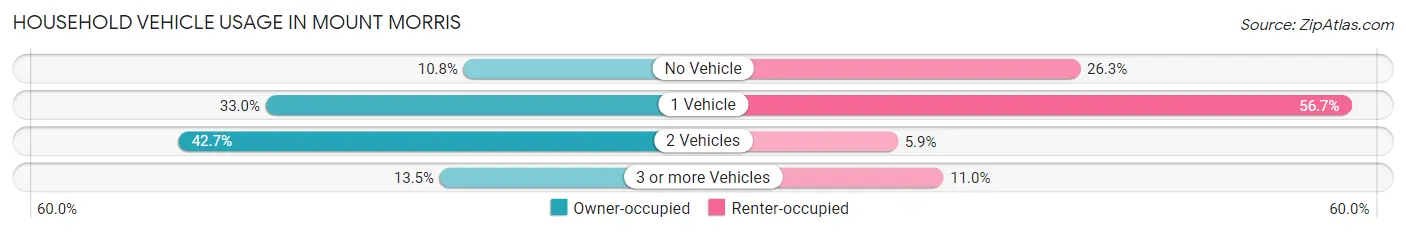
| Vehicles per Household | Owner-occupied | Renter-occupied |
| No Vehicle | 113 (10.8%) | 98 (26.3%) |
| 1 Vehicle | 345 (33.0%) | 211 (56.7%) |
| 2 Vehicles | 447 (42.7%) | 22 (5.9%) |
| 3 or more Vehicles | 141 (13.5%) | 41 (11.0%) |
| Total | 1,046 (100.0%) | 372 (100.0%) |
Real Estate & Mortgages in Mount Morris
Real Estate and Mortgage Overview in Mount Morris
| Characteristic | Without Mortgage | With Mortgage |
| Housing Units | 453 | 593 |
| Median Property Value | $87,500 | $85,800 |
| Median Household Income | $39,875 | $77 |
| Monthly Housing Costs | $558 | $11 |
| Real Estate Taxes | $2,722 | $19 |
Property Value by Mortgage Status in Mount Morris
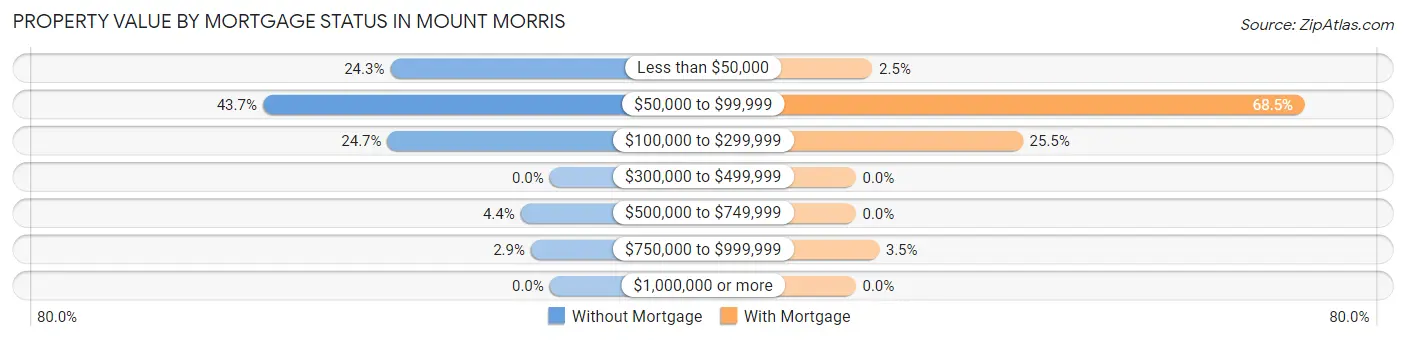
| Property Value | Without Mortgage | With Mortgage |
| Less than $50,000 | 110 (24.3%) | 15 (2.5%) |
| $50,000 to $99,999 | 198 (43.7%) | 406 (68.5%) |
| $100,000 to $299,999 | 112 (24.7%) | 151 (25.5%) |
| $300,000 to $499,999 | 0 (0.0%) | 0 (0.0%) |
| $500,000 to $749,999 | 20 (4.4%) | 0 (0.0%) |
| $750,000 to $999,999 | 13 (2.9%) | 21 (3.5%) |
| $1,000,000 or more | 0 (0.0%) | 0 (0.0%) |
| Total | 453 (100.0%) | 593 (100.0%) |
Household Income by Mortgage Status in Mount Morris
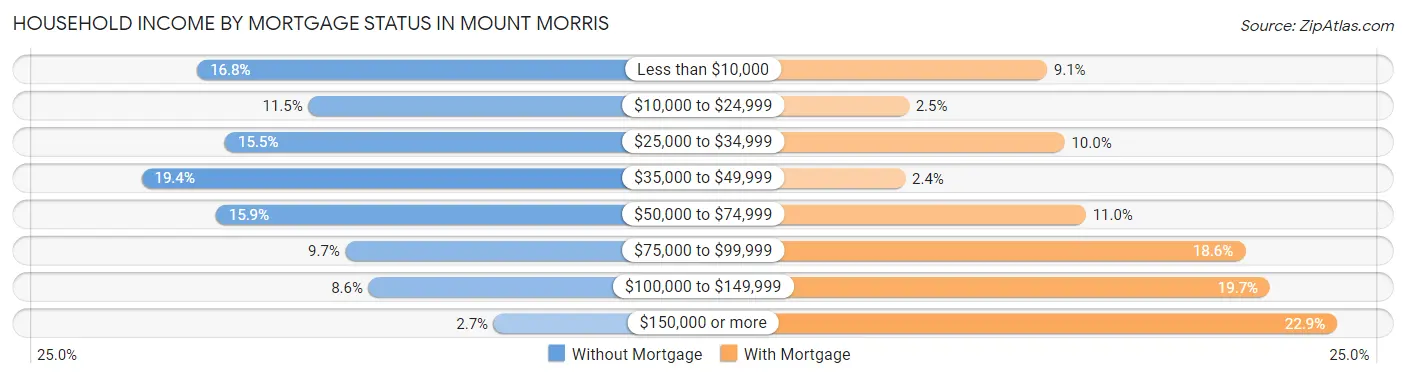
| Household Income | Without Mortgage | With Mortgage |
| Less than $10,000 | 76 (16.8%) | 54 (9.1%) |
| $10,000 to $24,999 | 52 (11.5%) | 15 (2.5%) |
| $25,000 to $34,999 | 70 (15.4%) | 59 (10.0%) |
| $35,000 to $49,999 | 88 (19.4%) | 14 (2.4%) |
| $50,000 to $74,999 | 72 (15.9%) | 65 (11.0%) |
| $75,000 to $99,999 | 44 (9.7%) | 110 (18.5%) |
| $100,000 to $149,999 | 39 (8.6%) | 117 (19.7%) |
| $150,000 or more | 12 (2.6%) | 136 (22.9%) |
| Total | 453 (100.0%) | 593 (100.0%) |
Property Value to Household Income Ratio in Mount Morris
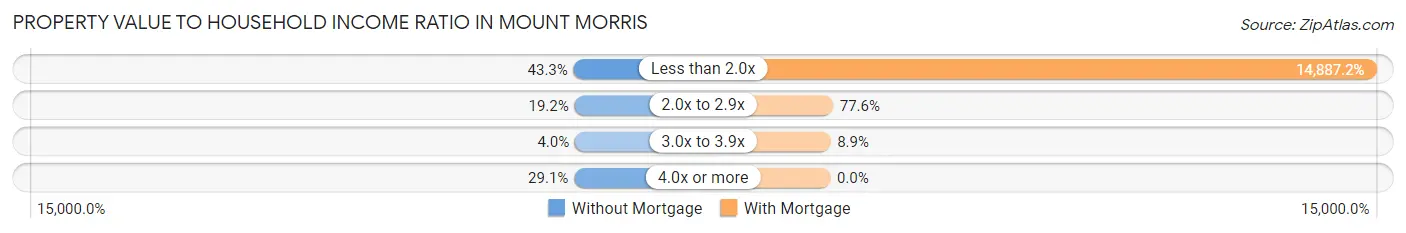
| Value-to-Income Ratio | Without Mortgage | With Mortgage |
| Less than 2.0x | 196 (43.3%) | 88,281 (14,887.2%) |
| 2.0x to 2.9x | 87 (19.2%) | 460 (77.6%) |
| 3.0x to 3.9x | 18 (4.0%) | 53 (8.9%) |
| 4.0x or more | 132 (29.1%) | 0 (0.0%) |
| Total | 453 (100.0%) | 593 (100.0%) |
Real Estate Taxes by Mortgage Status in Mount Morris
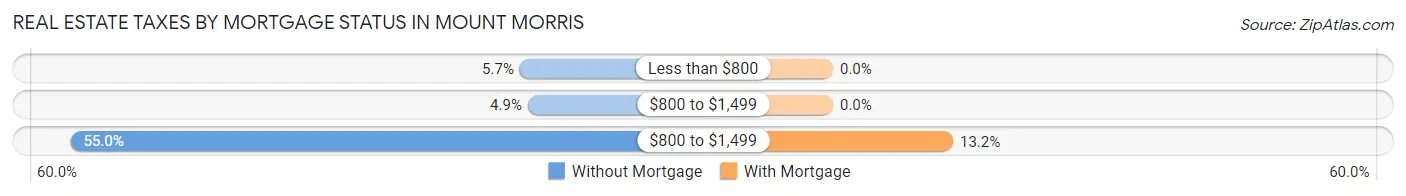
| Property Taxes | Without Mortgage | With Mortgage |
| Less than $800 | 26 (5.7%) | 0 (0.0%) |
| $800 to $1,499 | 22 (4.9%) | 0 (0.0%) |
| $800 to $1,499 | 249 (55.0%) | 78 (13.2%) |
| Total | 453 (100.0%) | 593 (100.0%) |
Health & Disability in Mount Morris
Health Insurance Coverage by Age in Mount Morris
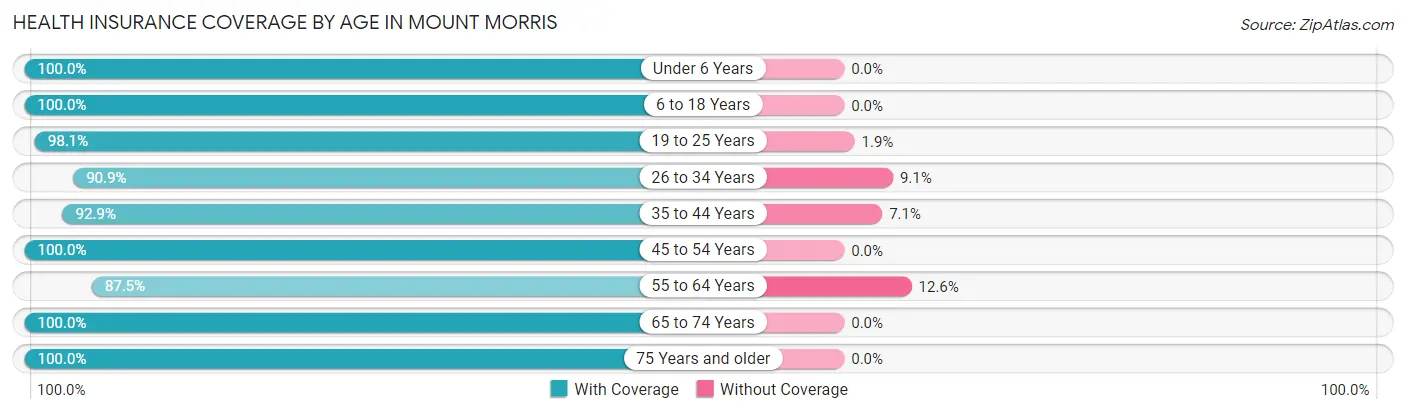
| Age Bracket | With Coverage | Without Coverage |
| Under 6 Years | 271 (100.0%) | 0 (0.0%) |
| 6 to 18 Years | 584 (100.0%) | 0 (0.0%) |
| 19 to 25 Years | 256 (98.1%) | 5 (1.9%) |
| 26 to 34 Years | 411 (90.9%) | 41 (9.1%) |
| 35 to 44 Years | 420 (92.9%) | 32 (7.1%) |
| 45 to 54 Years | 348 (100.0%) | 0 (0.0%) |
| 55 to 64 Years | 404 (87.5%) | 58 (12.6%) |
| 65 to 74 Years | 269 (100.0%) | 0 (0.0%) |
| 75 Years and older | 236 (100.0%) | 0 (0.0%) |
| Total | 3,199 (95.9%) | 136 (4.1%) |
Health Insurance Coverage by Citizenship Status in Mount Morris
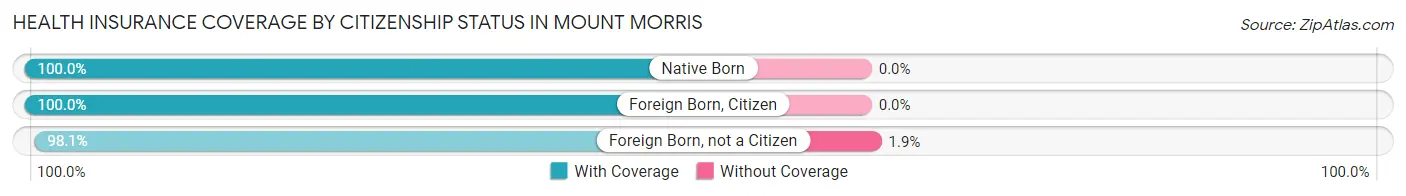
| Citizenship Status | With Coverage | Without Coverage |
| Native Born | 271 (100.0%) | 0 (0.0%) |
| Foreign Born, Citizen | 584 (100.0%) | 0 (0.0%) |
| Foreign Born, not a Citizen | 256 (98.1%) | 5 (1.9%) |
Health Insurance Coverage by Household Income in Mount Morris
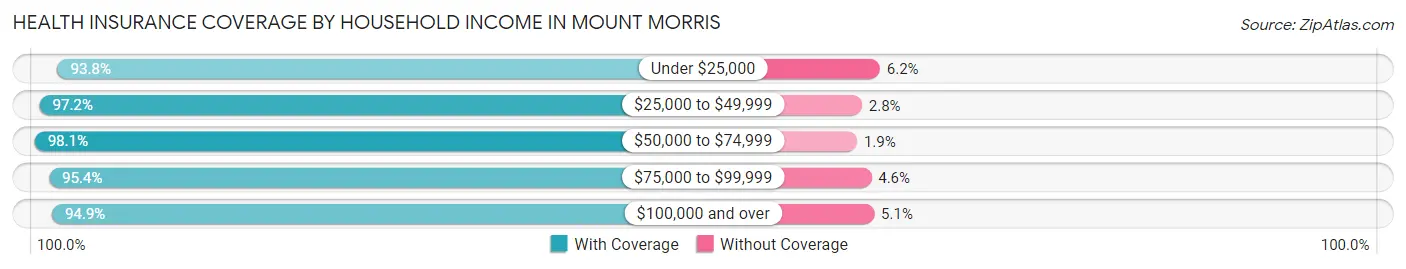
| Household Income | With Coverage | Without Coverage |
| Under $25,000 | 455 (93.8%) | 30 (6.2%) |
| $25,000 to $49,999 | 725 (97.2%) | 21 (2.8%) |
| $50,000 to $74,999 | 564 (98.1%) | 11 (1.9%) |
| $75,000 to $99,999 | 645 (95.4%) | 31 (4.6%) |
| $100,000 and over | 795 (94.9%) | 43 (5.1%) |
Public vs Private Health Insurance Coverage by Age in Mount Morris
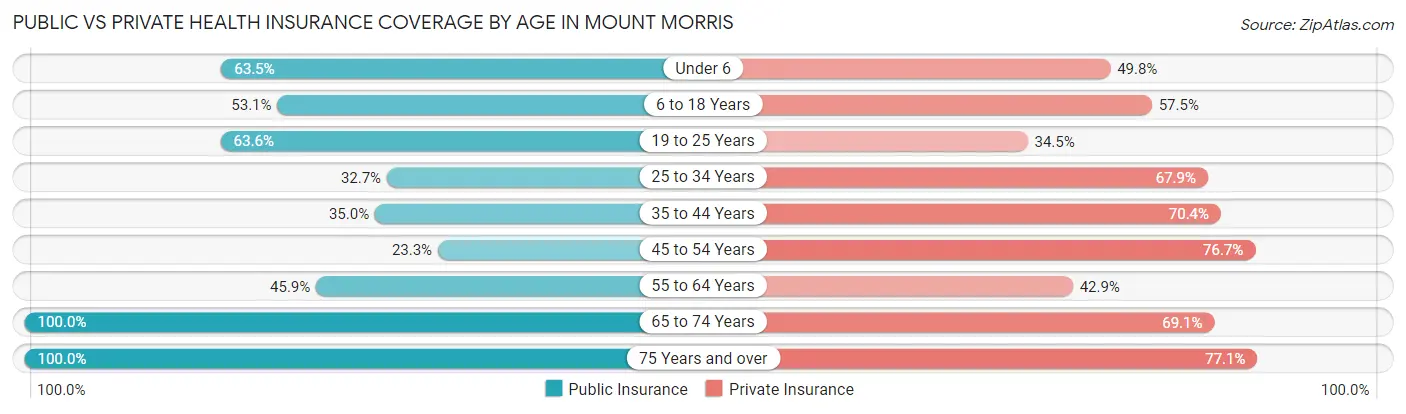
| Age Bracket | Public Insurance | Private Insurance |
| Under 6 | 172 (63.5%) | 135 (49.8%) |
| 6 to 18 Years | 310 (53.1%) | 336 (57.5%) |
| 19 to 25 Years | 166 (63.6%) | 90 (34.5%) |
| 25 to 34 Years | 148 (32.7%) | 307 (67.9%) |
| 35 to 44 Years | 158 (35.0%) | 318 (70.4%) |
| 45 to 54 Years | 81 (23.3%) | 267 (76.7%) |
| 55 to 64 Years | 212 (45.9%) | 198 (42.9%) |
| 65 to 74 Years | 269 (100.0%) | 186 (69.1%) |
| 75 Years and over | 236 (100.0%) | 182 (77.1%) |
| Total | 1,752 (52.5%) | 2,019 (60.5%) |
Disability Status by Sex by Age in Mount Morris
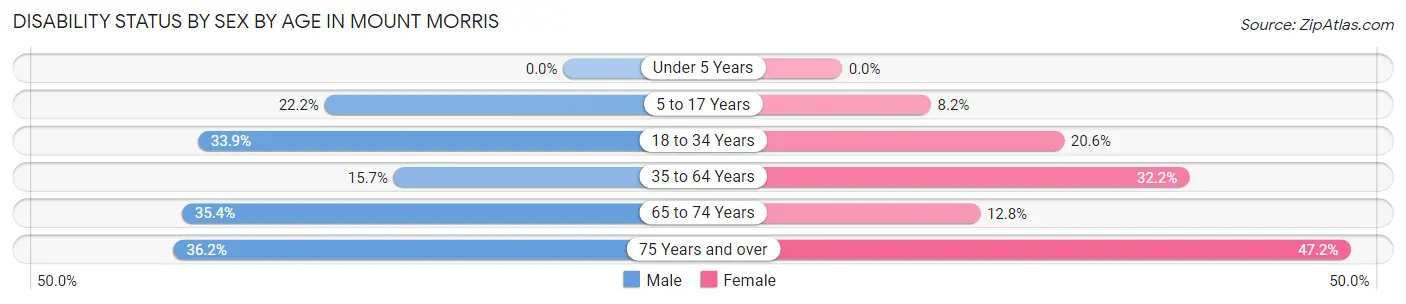
| Age Bracket | Male | Female |
| Under 5 Years | 0 (0.0%) | 0 (0.0%) |
| 5 to 17 Years | 68 (22.2%) | 21 (8.2%) |
| 18 to 34 Years | 134 (33.9%) | 76 (20.6%) |
| 35 to 64 Years | 95 (15.7%) | 212 (32.2%) |
| 65 to 74 Years | 40 (35.4%) | 20 (12.8%) |
| 75 Years and over | 34 (36.2%) | 67 (47.2%) |
Disability Class by Sex by Age in Mount Morris
Disability Class: Hearing Difficulty
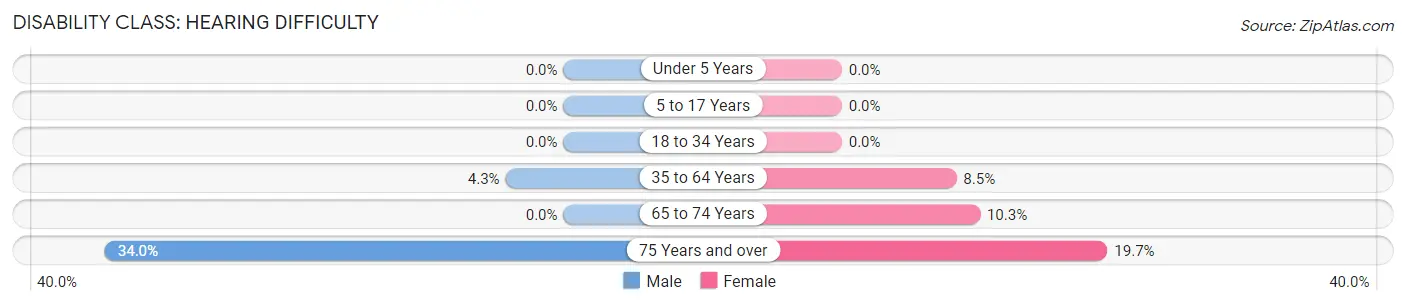
| Age Bracket | Male | Female |
| Under 5 Years | 0 (0.0%) | 0 (0.0%) |
| 5 to 17 Years | 0 (0.0%) | 0 (0.0%) |
| 18 to 34 Years | 0 (0.0%) | 0 (0.0%) |
| 35 to 64 Years | 26 (4.3%) | 56 (8.5%) |
| 65 to 74 Years | 0 (0.0%) | 16 (10.3%) |
| 75 Years and over | 32 (34.0%) | 28 (19.7%) |
Disability Class: Vision Difficulty
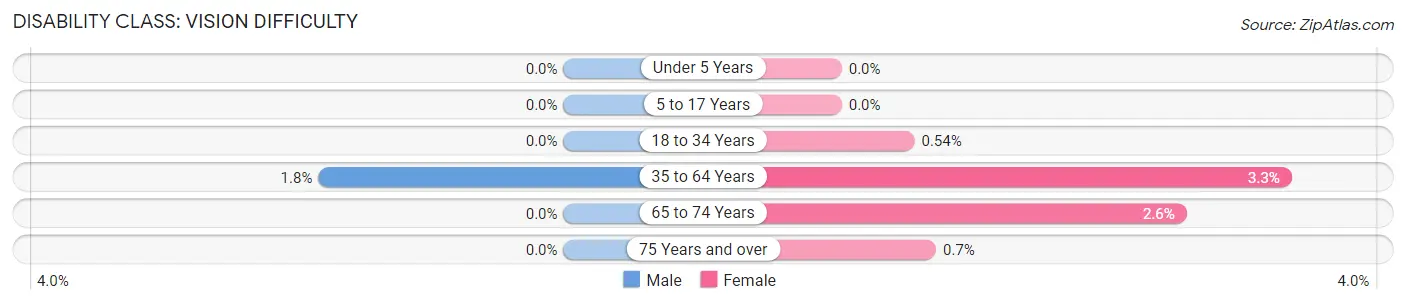
| Age Bracket | Male | Female |
| Under 5 Years | 0 (0.0%) | 0 (0.0%) |
| 5 to 17 Years | 0 (0.0%) | 0 (0.0%) |
| 18 to 34 Years | 0 (0.0%) | 2 (0.5%) |
| 35 to 64 Years | 11 (1.8%) | 22 (3.3%) |
| 65 to 74 Years | 0 (0.0%) | 4 (2.6%) |
| 75 Years and over | 0 (0.0%) | 1 (0.7%) |
Disability Class: Cognitive Difficulty
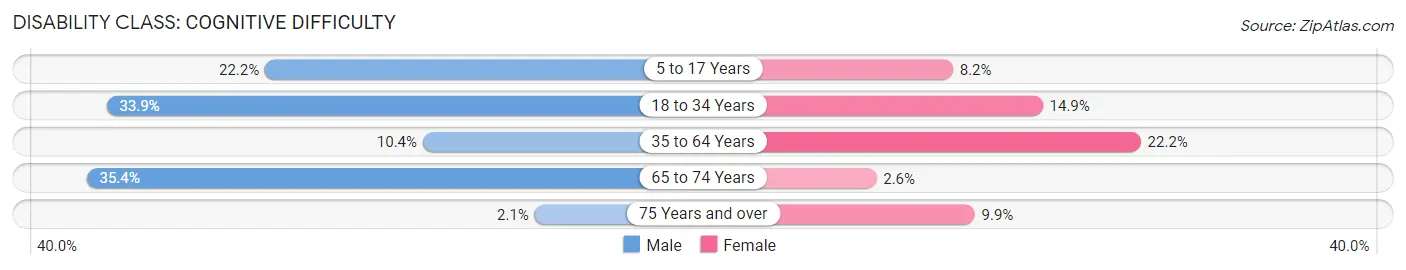
| Age Bracket | Male | Female |
| 5 to 17 Years | 68 (22.2%) | 21 (8.2%) |
| 18 to 34 Years | 134 (33.9%) | 55 (14.9%) |
| 35 to 64 Years | 63 (10.4%) | 146 (22.2%) |
| 65 to 74 Years | 40 (35.4%) | 4 (2.6%) |
| 75 Years and over | 2 (2.1%) | 14 (9.9%) |
Disability Class: Ambulatory Difficulty
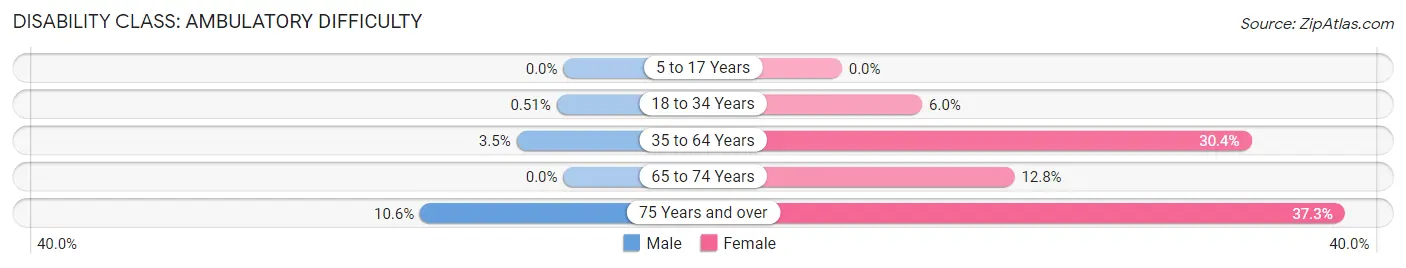
| Age Bracket | Male | Female |
| 5 to 17 Years | 0 (0.0%) | 0 (0.0%) |
| 18 to 34 Years | 2 (0.5%) | 22 (6.0%) |
| 35 to 64 Years | 21 (3.5%) | 200 (30.4%) |
| 65 to 74 Years | 0 (0.0%) | 20 (12.8%) |
| 75 Years and over | 10 (10.6%) | 53 (37.3%) |
Disability Class: Self-Care Difficulty
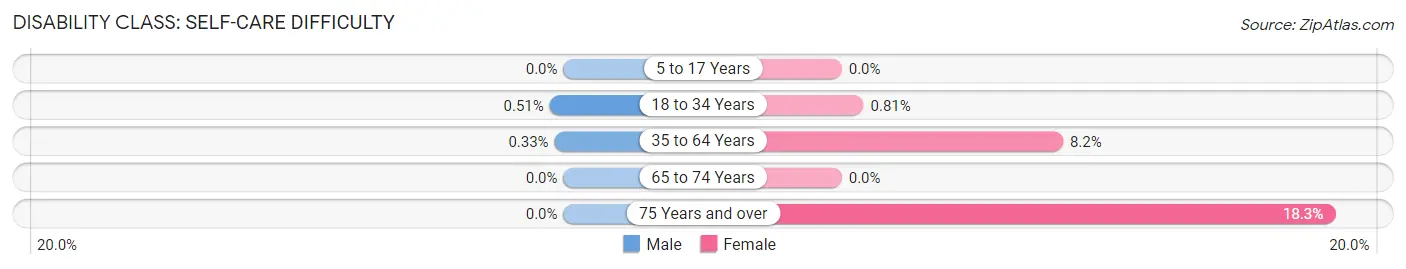
| Age Bracket | Male | Female |
| 5 to 17 Years | 0 (0.0%) | 0 (0.0%) |
| 18 to 34 Years | 2 (0.5%) | 3 (0.8%) |
| 35 to 64 Years | 2 (0.3%) | 54 (8.2%) |
| 65 to 74 Years | 0 (0.0%) | 0 (0.0%) |
| 75 Years and over | 0 (0.0%) | 26 (18.3%) |
Technology Access in Mount Morris
Computing Device Access in Mount Morris
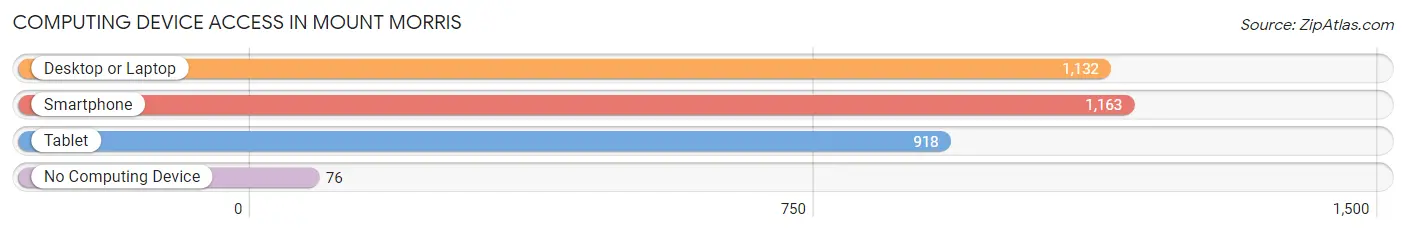
| Device Type | # Households | % Households |
| Desktop or Laptop | 1,132 | 79.8% |
| Smartphone | 1,163 | 82.0% |
| Tablet | 918 | 64.7% |
| No Computing Device | 76 | 5.4% |
| Total | 1,418 | 100.0% |
Internet Access in Mount Morris
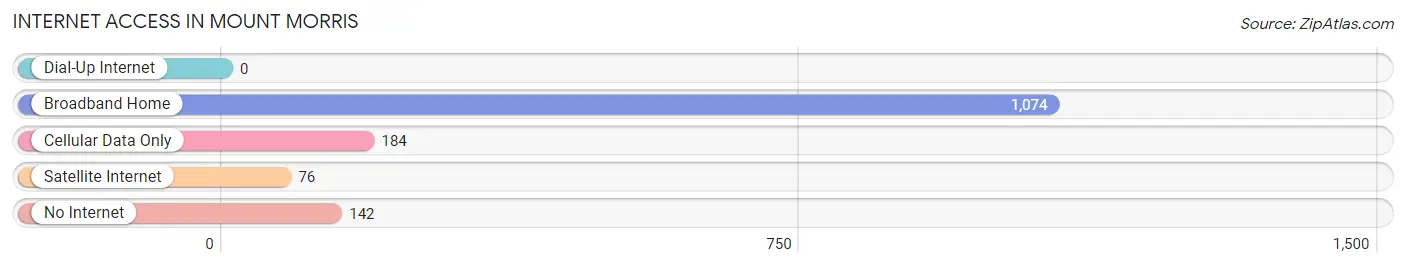
| Internet Type | # Households | % Households |
| Dial-Up Internet | 0 | 0.0% |
| Broadband Home | 1,074 | 75.7% |
| Cellular Data Only | 184 | 13.0% |
| Satellite Internet | 76 | 5.4% |
| No Internet | 142 | 10.0% |
| Total | 1,418 | 100.0% |
Mount Morris Summary
History
Mount Morris is a small town located in Livingston County, New York. It was first settled in 1790 by a group of settlers from Connecticut. The town was originally known as "The Flats" due to its flat terrain. The town was officially incorporated in 1812 and was named after Robert Morris, a signer of the Declaration of Independence.
The town of Mount Morris was an important stop on the Underground Railroad. It was a safe haven for escaped slaves and a place of refuge for those seeking freedom. The town was also home to a number of abolitionists, including the Reverend John Rankin, who was a prominent figure in the anti-slavery movement.
The town of Mount Morris was also an important stop on the Erie Canal. The canal was completed in 1825 and provided a direct route from the Great Lakes to the Hudson River. The canal was a major factor in the growth of the town and the surrounding area.
Geography
Mount Morris is located in the Finger Lakes region of New York. It is situated in the western part of Livingston County, near the Genesee River. The town is bordered by the towns of Leicester, Nunda, and Portage.
The town of Mount Morris has a total area of 33.2 square miles, of which 32.9 square miles is land and 0.3 square miles is water. The terrain is mostly flat, with some rolling hills in the northern part of the town. The highest point in the town is 1,400 feet above sea level.
Economy
The economy of Mount Morris is largely based on agriculture. The town is home to several farms, which produce a variety of crops, including corn, soybeans, wheat, and hay. The town also has a number of small businesses, including restaurants, retail stores, and service providers.
The town is also home to a number of manufacturing companies, including a paper mill, a plastics factory, and a metal fabrication plant. The town is also home to a number of tourist attractions, including the Genesee Valley Greenway, a scenic trail that runs through the town.
Demographics
As of the 2010 census, the town of Mount Morris had a population of 2,845. The population density was 86.2 people per square mile. The racial makeup of the town was 97.2% White, 0.7% African American, 0.3% Native American, 0.3% Asian, 0.1% Pacific Islander, 0.3% from other races, and 1.2% from two or more races. Hispanic or Latino of any race were 1.7% of the population.
The median income for a household in the town was $45,938, and the median income for a family was $51,250. The per capita income for the town was $20,945. About 8.3% of families and 10.2% of the population were below the poverty line, including 14.2% of those under age 18 and 5.2% of those age 65 or over.
Common Questions
What is Per Capita Income in Mount Morris?
Per Capita income in Mount Morris is $34,994.
What is the Median Family Income in Mount Morris?
Median Family Income in Mount Morris is $73,929.
What is the Median Household income in Mount Morris?
Median Household Income in Mount Morris is $59,211.
What is Income or Wage Gap in Mount Morris?
Income or Wage Gap in Mount Morris is 0.9%.
Women in Mount Morris earn 99.1 cents for every dollar earned by a man.
What is Inequality or Gini Index in Mount Morris?
Inequality or Gini Index in Mount Morris is 0.52.
What is the Total Population of Mount Morris?
Total Population of Mount Morris is 3,347.
What is the Total Male Population of Mount Morris?
Total Male Population of Mount Morris is 1,716.
What is the Total Female Population of Mount Morris?
Total Female Population of Mount Morris is 1,631.
What is the Ratio of Males per 100 Females in Mount Morris?
There are 105.21 Males per 100 Females in Mount Morris.
What is the Ratio of Females per 100 Males in Mount Morris?
There are 95.05 Females per 100 Males in Mount Morris.
What is the Median Population Age in Mount Morris?
Median Population Age in Mount Morris is 36.7 Years.
What is the Average Family Size in Mount Morris
Average Family Size in Mount Morris is 3.3 People.
What is the Average Household Size in Mount Morris
Average Household Size in Mount Morris is 2.4 People.
How Large is the Labor Force in Mount Morris?
There are 1,454 People in the Labor Forcein in Mount Morris.
What is the Percentage of People in the Labor Force in Mount Morris?
56.5% of People are in the Labor Force in Mount Morris.
What is the Unemployment Rate in Mount Morris?
Unemployment Rate in Mount Morris is 3.1%.