Melrose Park, NY Map & Demographics
Melrose Park Map
Melrose Park Overview
$60,630
PER CAPITA INCOME
$131,875
AVG FAMILY INCOME
$123,476
AVG HOUSEHOLD INCOME
26.8%
WAGE / INCOME GAP [ % ]
73.2¢/ $1
WAGE / INCOME GAP [ $ ]
0.41
INEQUALITY / GINI INDEX
1,997
TOTAL POPULATION
921
MALE POPULATION
1,076
FEMALE POPULATION
85.59
MALES / 100 FEMALES
116.83
FEMALES / 100 MALES
43.2
MEDIAN AGE
2.8
AVG FAMILY SIZE
2.4
AVG HOUSEHOLD SIZE
1,145
LABOR FORCE [ PEOPLE ]
71.1%
PERCENT IN LABOR FORCE
2.4%
UNEMPLOYMENT RATE
Income in Melrose Park
Income Overview in Melrose Park
Per Capita Income in Melrose Park is $60,630, while median incomes of families and households are $131,875 and $123,476 respectively.
| Characteristic | Number | Measure |
| Per Capita Income | 1,997 | $60,630 |
| Median Family Income | 580 | $131,875 |
| Mean Family Income | 580 | $178,001 |
| Median Household Income | 830 | $123,476 |
| Mean Household Income | 830 | $149,584 |
| Income Deficit | 580 | $0 |
| Wage / Income Gap (%) | 1,997 | 26.79% |
| Wage / Income Gap ($) | 1,997 | 73.21¢ per $1 |
| Gini / Inequality Index | 1,997 | 0.41 |
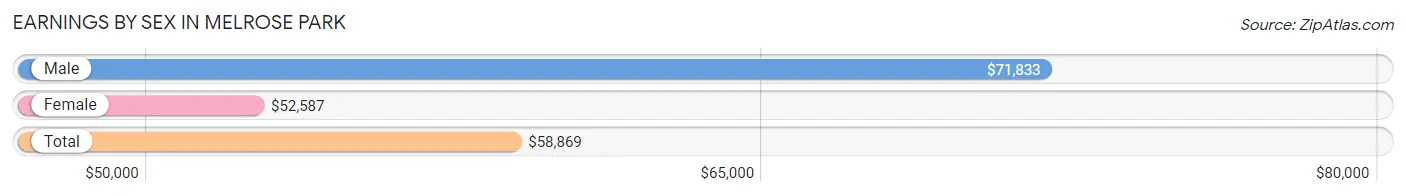
Earnings by Sex in Melrose Park
Average Earnings in Melrose Park are $58,869, $71,833 for men and $52,587 for women, a difference of 26.8%.
| Sex | Number | Average Earnings |
| Male | 570 (47.8%) | $71,833 |
| Female | 623 (52.2%) | $52,587 |
| Total | 1,193 (100.0%) | $58,869 |
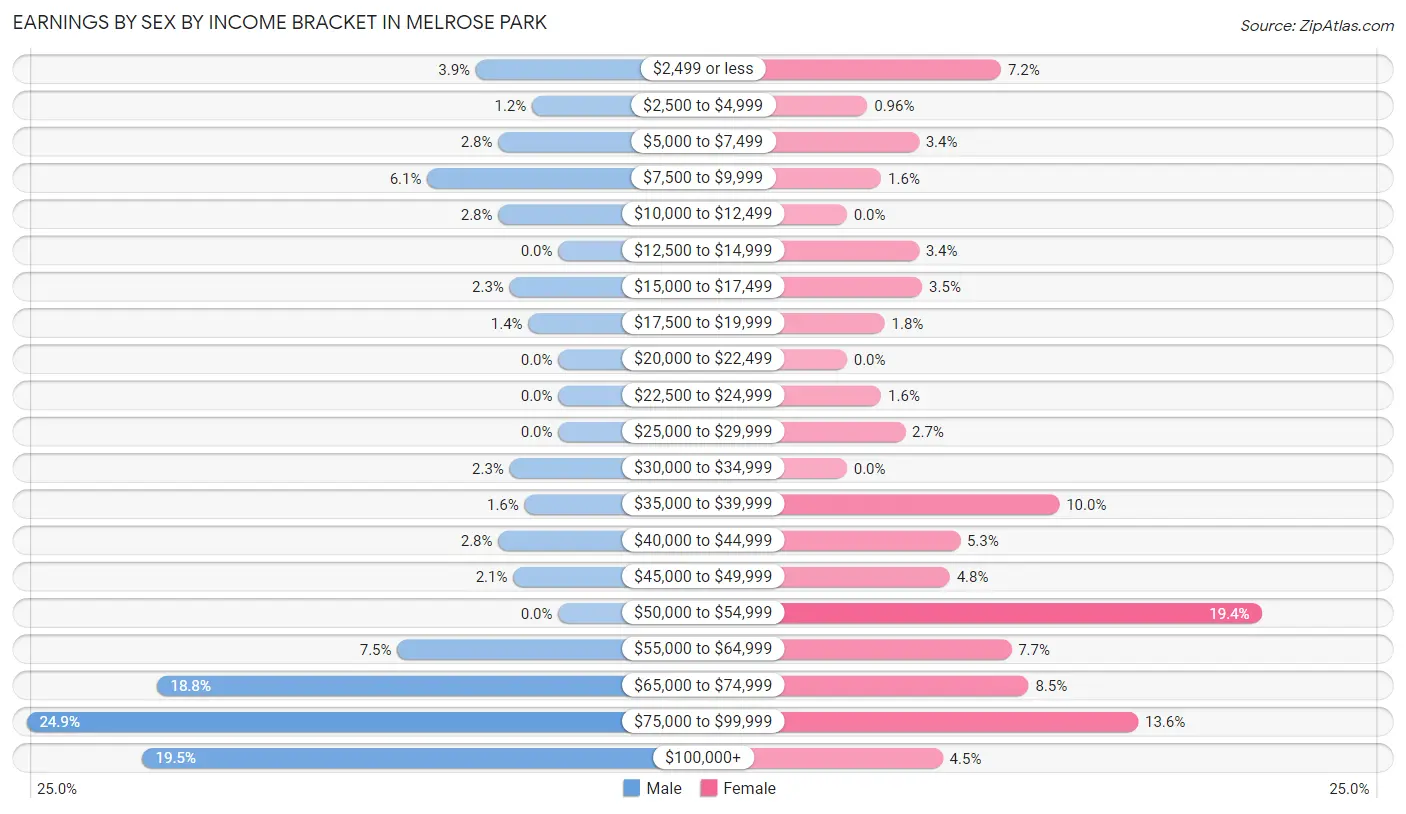
Earnings by Sex by Income Bracket in Melrose Park
The most common earnings brackets in Melrose Park are $75,000 to $99,999 for men (142 | 24.9%) and $50,000 to $54,999 for women (121 | 19.4%).
| Income | Male | Female |
| $2,499 or less | 22 (3.9%) | 45 (7.2%) |
| $2,500 to $4,999 | 7 (1.2%) | 6 (1.0%) |
| $5,000 to $7,499 | 16 (2.8%) | 21 (3.4%) |
| $7,500 to $9,999 | 35 (6.1%) | 10 (1.6%) |
| $10,000 to $12,499 | 16 (2.8%) | 0 (0.0%) |
| $12,500 to $14,999 | 0 (0.0%) | 21 (3.4%) |
| $15,000 to $17,499 | 13 (2.3%) | 22 (3.5%) |
| $17,500 to $19,999 | 8 (1.4%) | 11 (1.8%) |
| $20,000 to $22,499 | 0 (0.0%) | 0 (0.0%) |
| $22,500 to $24,999 | 0 (0.0%) | 10 (1.6%) |
| $25,000 to $29,999 | 0 (0.0%) | 17 (2.7%) |
| $30,000 to $34,999 | 13 (2.3%) | 0 (0.0%) |
| $35,000 to $39,999 | 9 (1.6%) | 62 (10.0%) |
| $40,000 to $44,999 | 16 (2.8%) | 33 (5.3%) |
| $45,000 to $49,999 | 12 (2.1%) | 30 (4.8%) |
| $50,000 to $54,999 | 0 (0.0%) | 121 (19.4%) |
| $55,000 to $64,999 | 43 (7.5%) | 48 (7.7%) |
| $65,000 to $74,999 | 107 (18.8%) | 53 (8.5%) |
| $75,000 to $99,999 | 142 (24.9%) | 85 (13.6%) |
| $100,000+ | 111 (19.5%) | 28 (4.5%) |
| Total | 570 (100.0%) | 623 (100.0%) |
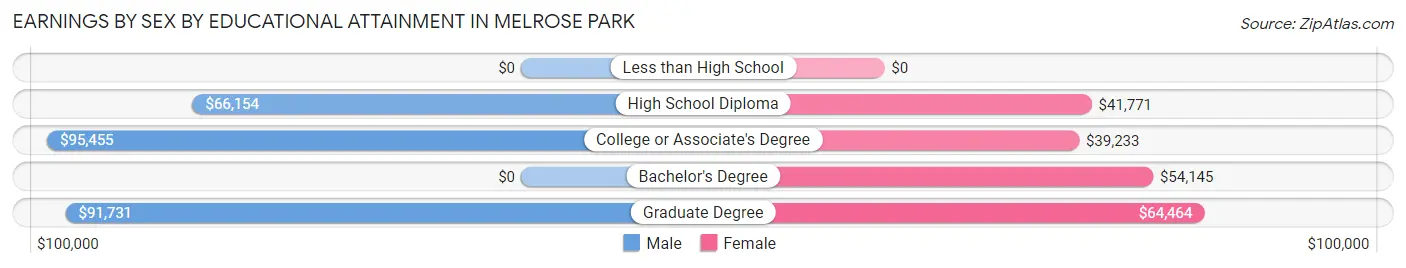
Earnings by Sex by Educational Attainment in Melrose Park
Average earnings in Melrose Park are $74,866 for men and $53,453 for women, a difference of 28.6%. Men with an educational attainment of college or associate's degree enjoy the highest average annual earnings of $95,455, while those with high school diploma education earn the least with $66,154. Women with an educational attainment of graduate degree earn the most with the average annual earnings of $64,464, while those with college or associate's degree education have the smallest earnings of $39,233.
| Educational Attainment | Male Income | Female Income |
| Less than High School | - | - |
| High School Diploma | $66,154 | $41,771 |
| College or Associate's Degree | $95,455 | $39,233 |
| Bachelor's Degree | - | - |
| Graduate Degree | $91,731 | $64,464 |
| Total | $74,866 | $53,453 |
Family Income in Melrose Park
Family Income Brackets in Melrose Park
According to the Melrose Park family income data, there are 201 families falling into the $100,000 to $149,999 income range, which is the most common income bracket and makes up 34.7% of all families.
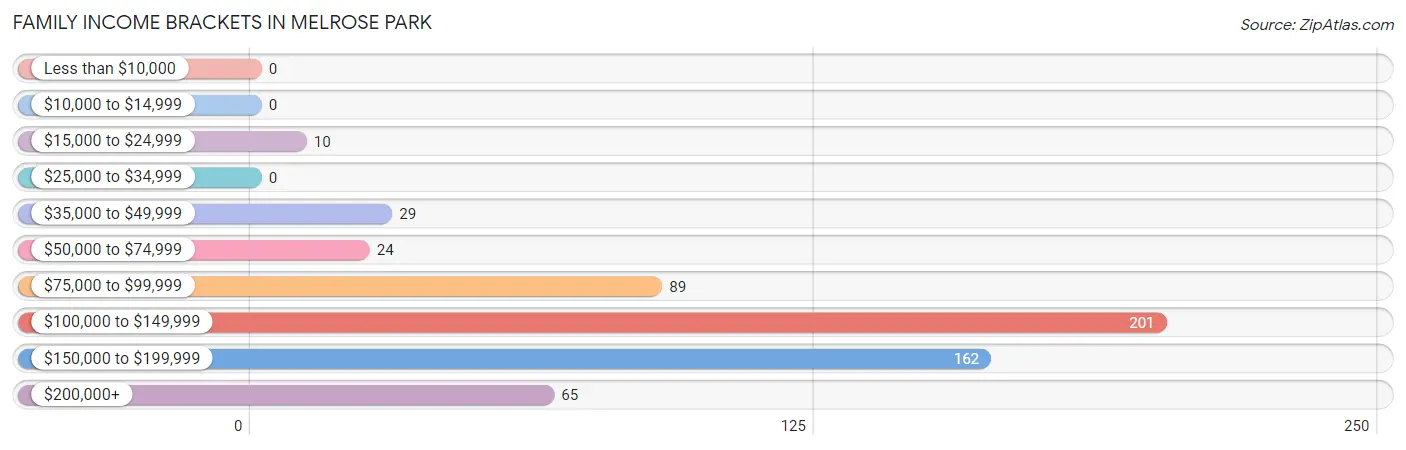
| Income Bracket | # Families | % Families |
| Less than $10,000 | 0 | 0.0% |
| $10,000 to $14,999 | 0 | 0.0% |
| $15,000 to $24,999 | 10 | 1.7% |
| $25,000 to $34,999 | 0 | 0.0% |
| $35,000 to $49,999 | 29 | 5.0% |
| $50,000 to $74,999 | 24 | 4.1% |
| $75,000 to $99,999 | 89 | 15.3% |
| $100,000 to $149,999 | 201 | 34.7% |
| $150,000 to $199,999 | 162 | 27.9% |
| $200,000+ | 65 | 11.2% |
Family Income by Famaliy Size in Melrose Park
5-person families (56 | 9.7%) account for the highest median family income in Melrose Park with $176,848 per family, while 2-person families (276 | 47.6%) have the highest median income of $53,393 per family member.
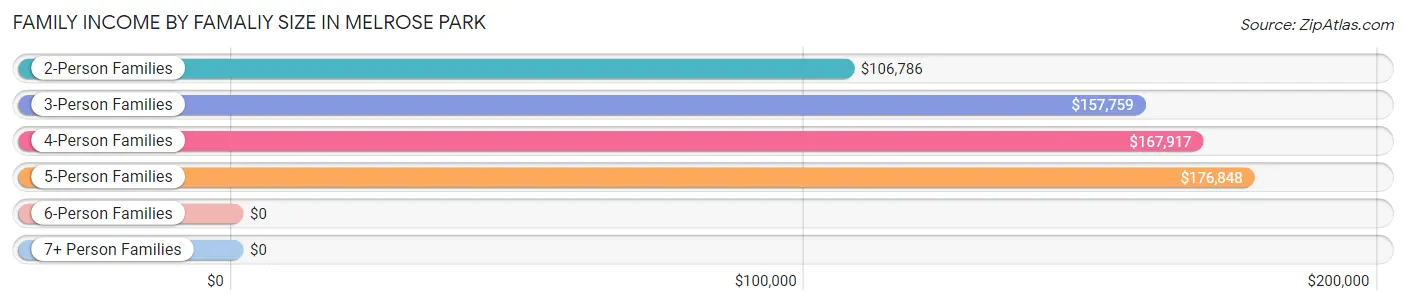
| Income Bracket | # Families | Median Income |
| 2-Person Families | 276 (47.6%) | $106,786 |
| 3-Person Families | 132 (22.8%) | $157,759 |
| 4-Person Families | 105 (18.1%) | $167,917 |
| 5-Person Families | 56 (9.7%) | $176,848 |
| 6-Person Families | 11 (1.9%) | $0 |
| 7+ Person Families | 0 (0.0%) | $0 |
| Total | 580 (100.0%) | $131,875 |
Family Income by Number of Earners in Melrose Park
The median family income in Melrose Park is $131,875, with families comprising 3+ earners (83) having the highest median family income of $201,875, while families with no earners (73) have the lowest median family income of $95,875, accounting for 14.3% and 12.6% of families, respectively.
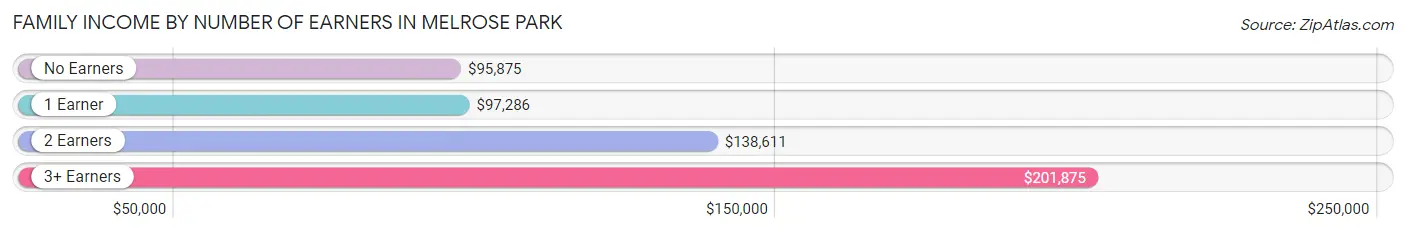
| Number of Earners | # Families | Median Income |
| No Earners | 73 (12.6%) | $95,875 |
| 1 Earner | 98 (16.9%) | $97,286 |
| 2 Earners | 326 (56.2%) | $138,611 |
| 3+ Earners | 83 (14.3%) | $201,875 |
| Total | 580 (100.0%) | $131,875 |
Household Income in Melrose Park
Household Income Brackets in Melrose Park
With 244 households falling in the category, the $100,000 to $149,999 income range is the most frequent in Melrose Park, accounting for 29.4% of all households. In contrast, only 8 households (1.0%) fall into the less than $10,000 income bracket, making it the least populous group.
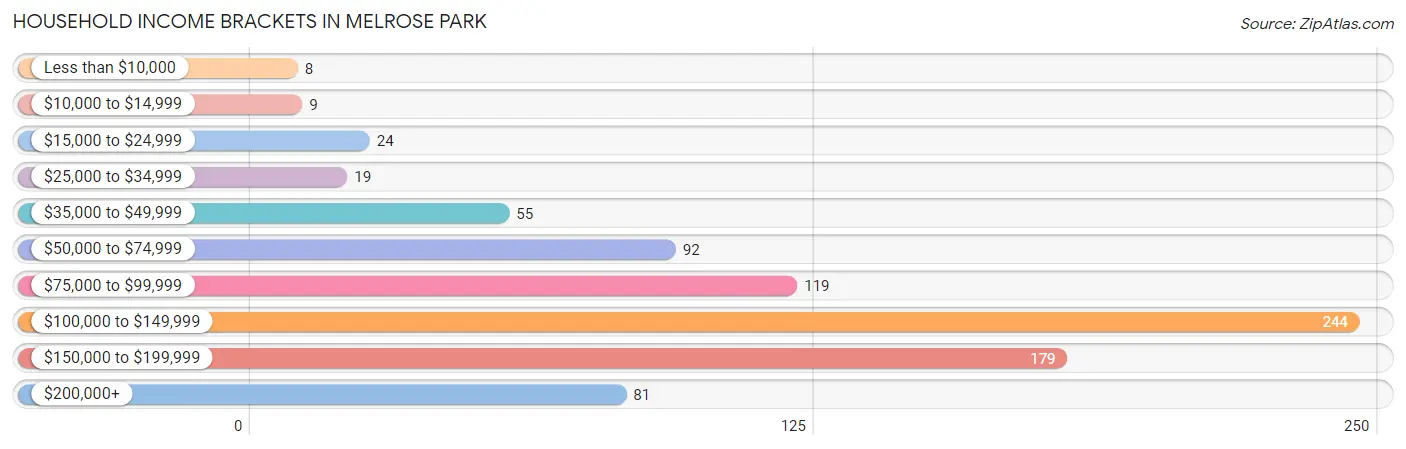
| Income Bracket | # Households | % Households |
| Less than $10,000 | 8 | 1.0% |
| $10,000 to $14,999 | 9 | 1.1% |
| $15,000 to $24,999 | 24 | 2.9% |
| $25,000 to $34,999 | 19 | 2.3% |
| $35,000 to $49,999 | 55 | 6.6% |
| $50,000 to $74,999 | 92 | 11.1% |
| $75,000 to $99,999 | 119 | 14.3% |
| $100,000 to $149,999 | 244 | 29.4% |
| $150,000 to $199,999 | 179 | 21.6% |
| $200,000+ | 81 | 9.8% |
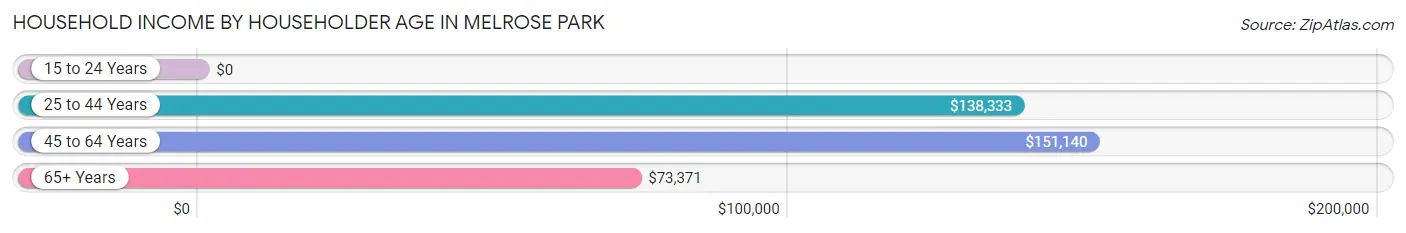
Household Income by Householder Age in Melrose Park
The median household income in Melrose Park is $123,476, with the highest median household income of $151,140 found in the 45 to 64 years age bracket for the primary householder. A total of 363 households (43.7%) fall into this category. Meanwhile, the 15 to 24 years age bracket for the primary householder has the lowest median household income of $0, with 28 households (3.4%) in this group.
| Income Bracket | # Households | Median Income |
| 15 to 24 Years | 28 (3.4%) | $0 |
| 25 to 44 Years | 200 (24.1%) | $138,333 |
| 45 to 64 Years | 363 (43.7%) | $151,140 |
| 65+ Years | 239 (28.8%) | $73,371 |
| Total | 830 (100.0%) | $123,476 |
Poverty in Melrose Park
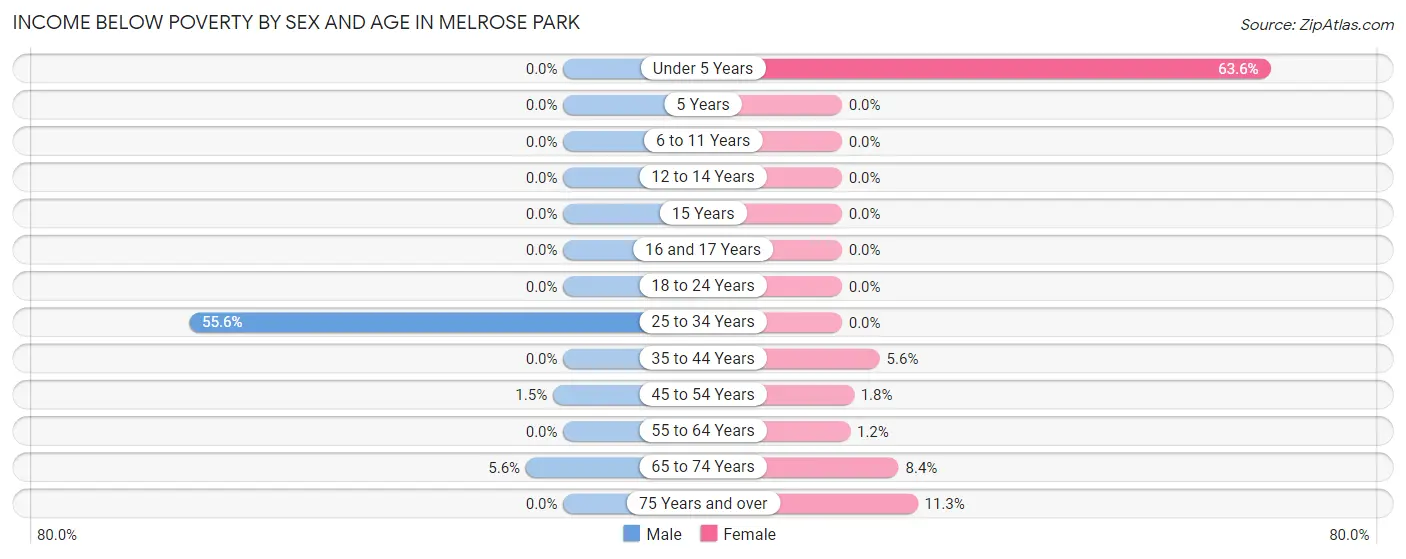
Income Below Poverty by Sex and Age in Melrose Park
With 3.3% poverty level for males and 4.1% for females among the residents of Melrose Park, 25 to 34 year old males and under 5 year old females are the most vulnerable to poverty, with 20 males (55.6%) and 14 females (63.6%) in their respective age groups living below the poverty level.
| Age Bracket | Male | Female |
| Under 5 Years | 0 (0.0%) | 14 (63.6%) |
| 5 Years | 0 (0.0%) | 0 (0.0%) |
| 6 to 11 Years | 0 (0.0%) | 0 (0.0%) |
| 12 to 14 Years | 0 (0.0%) | 0 (0.0%) |
| 15 Years | 0 (0.0%) | 0 (0.0%) |
| 16 and 17 Years | 0 (0.0%) | 0 (0.0%) |
| 18 to 24 Years | 0 (0.0%) | 0 (0.0%) |
| 25 to 34 Years | 20 (55.6%) | 0 (0.0%) |
| 35 to 44 Years | 0 (0.0%) | 10 (5.6%) |
| 45 to 54 Years | 2 (1.5%) | 2 (1.8%) |
| 55 to 64 Years | 0 (0.0%) | 2 (1.2%) |
| 65 to 74 Years | 8 (5.6%) | 7 (8.4%) |
| 75 Years and over | 0 (0.0%) | 9 (11.3%) |
| Total | 30 (3.3%) | 44 (4.1%) |
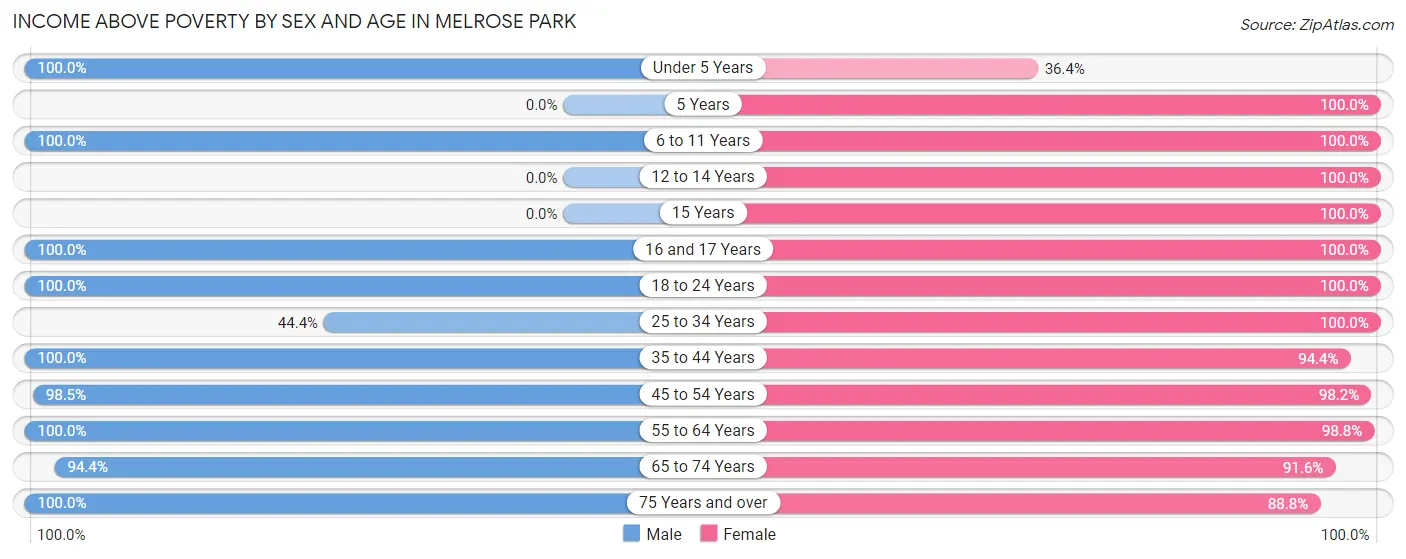
Income Above Poverty by Sex and Age in Melrose Park
According to the poverty statistics in Melrose Park, males aged under 5 years and females aged 5 years are the age groups that are most secure financially, with 100.0% of males and 100.0% of females in these age groups living above the poverty line.
| Age Bracket | Male | Female |
| Under 5 Years | 30 (100.0%) | 8 (36.4%) |
| 5 Years | 0 (0.0%) | 60 (100.0%) |
| 6 to 11 Years | 109 (100.0%) | 30 (100.0%) |
| 12 to 14 Years | 0 (0.0%) | 105 (100.0%) |
| 15 Years | 0 (0.0%) | 31 (100.0%) |
| 16 and 17 Years | 30 (100.0%) | 19 (100.0%) |
| 18 to 24 Years | 59 (100.0%) | 51 (100.0%) |
| 25 to 34 Years | 16 (44.4%) | 140 (100.0%) |
| 35 to 44 Years | 150 (100.0%) | 168 (94.4%) |
| 45 to 54 Years | 128 (98.5%) | 111 (98.2%) |
| 55 to 64 Years | 161 (100.0%) | 162 (98.8%) |
| 65 to 74 Years | 136 (94.4%) | 76 (91.6%) |
| 75 Years and over | 72 (100.0%) | 71 (88.7%) |
| Total | 891 (96.7%) | 1,032 (95.9%) |
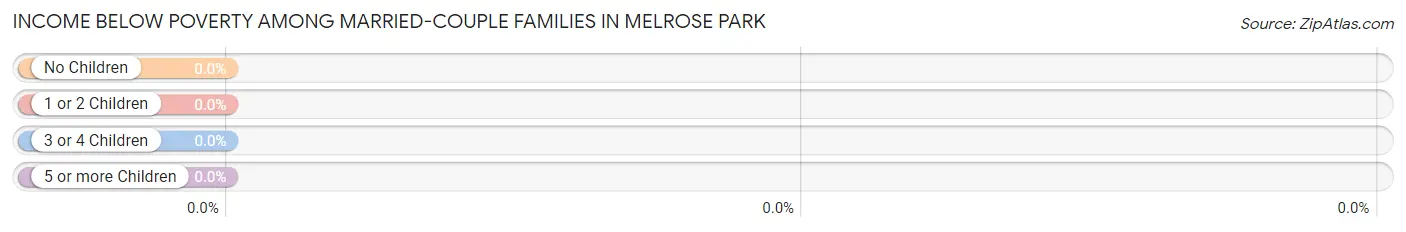
Income Below Poverty Among Married-Couple Families in Melrose Park
| Children | Above Poverty | Below Poverty |
| No Children | 276 (100.0%) | 0 (0.0%) |
| 1 or 2 Children | 205 (100.0%) | 0 (0.0%) |
| 3 or 4 Children | 22 (100.0%) | 0 (0.0%) |
| 5 or more Children | 0 (0.0%) | 0 (0.0%) |
| Total | 503 (100.0%) | 0 (0.0%) |
Income Below Poverty Among Single-Parent Households in Melrose Park
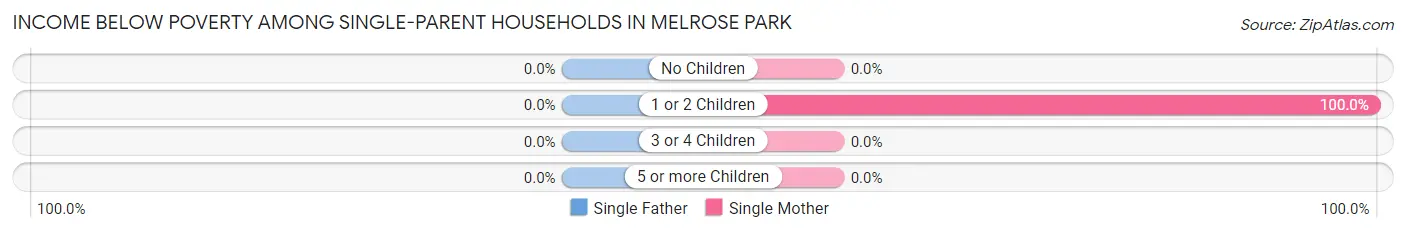
| Children | Single Father | Single Mother |
| No Children | 0 (0.0%) | 0 (0.0%) |
| 1 or 2 Children | 0 (0.0%) | 10 (100.0%) |
| 3 or 4 Children | 0 (0.0%) | 0 (0.0%) |
| 5 or more Children | 0 (0.0%) | 0 (0.0%) |
| Total | 0 (0.0%) | 10 (22.2%) |
Income Below Poverty Among Married-Couple vs Single-Parent Households in Melrose Park
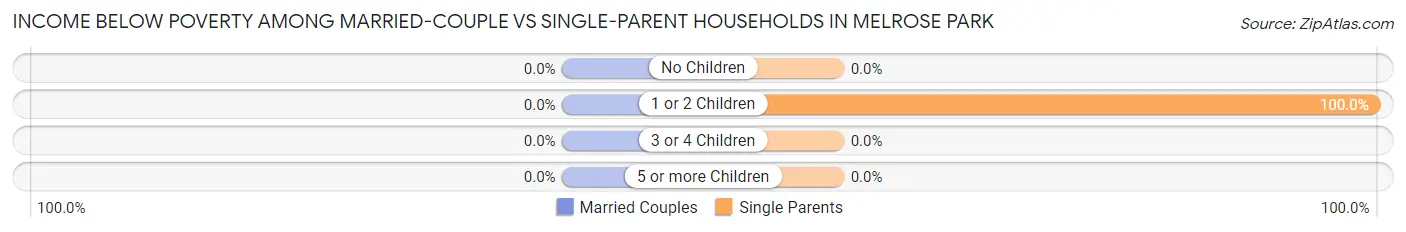
| Children | Married-Couple Families | Single-Parent Households |
| No Children | 0 (0.0%) | 0 (0.0%) |
| 1 or 2 Children | 0 (0.0%) | 10 (100.0%) |
| 3 or 4 Children | 0 (0.0%) | 0 (0.0%) |
| 5 or more Children | 0 (0.0%) | 0 (0.0%) |
| Total | 0 (0.0%) | 10 (13.0%) |
Race in Melrose Park
The most populous races in Melrose Park are White / Caucasian (1,944 | 97.4%), Hispanic or Latino (41 | 2.1%), and Some other Race (38 | 1.9%).
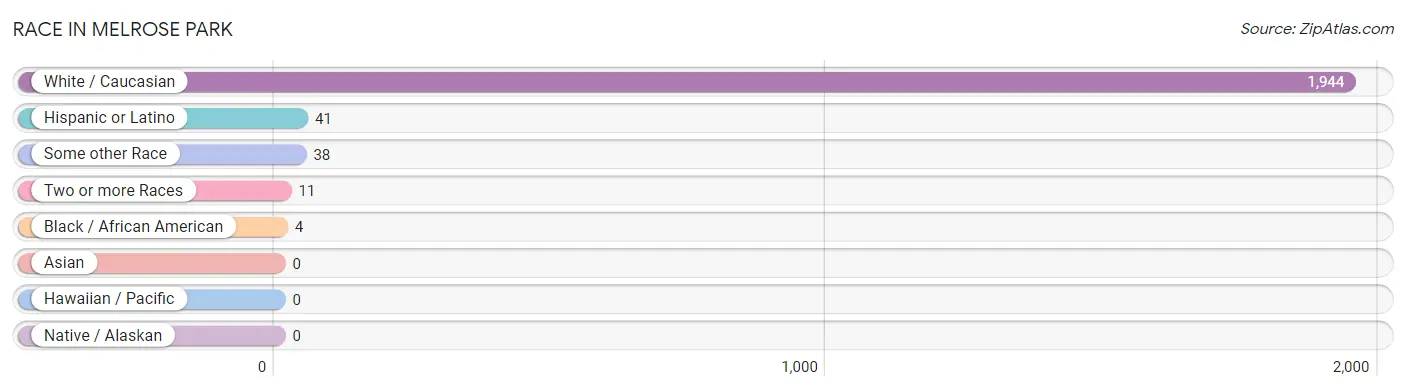
| Race | # Population | % Population |
| Asian | 0 | 0.0% |
| Black / African American | 4 | 0.2% |
| Hawaiian / Pacific | 0 | 0.0% |
| Hispanic or Latino | 41 | 2.1% |
| Native / Alaskan | 0 | 0.0% |
| White / Caucasian | 1,944 | 97.4% |
| Two or more Races | 11 | 0.5% |
| Some other Race | 38 | 1.9% |
| Total | 1,997 | 100.0% |
Ancestry in Melrose Park
The most populous ancestries reported in Melrose Park are Italian (735 | 36.8%), Irish (677 | 33.9%), English (342 | 17.1%), German (141 | 7.1%), and Ukrainian (88 | 4.4%), together accounting for 99.3% of all Melrose Park residents.
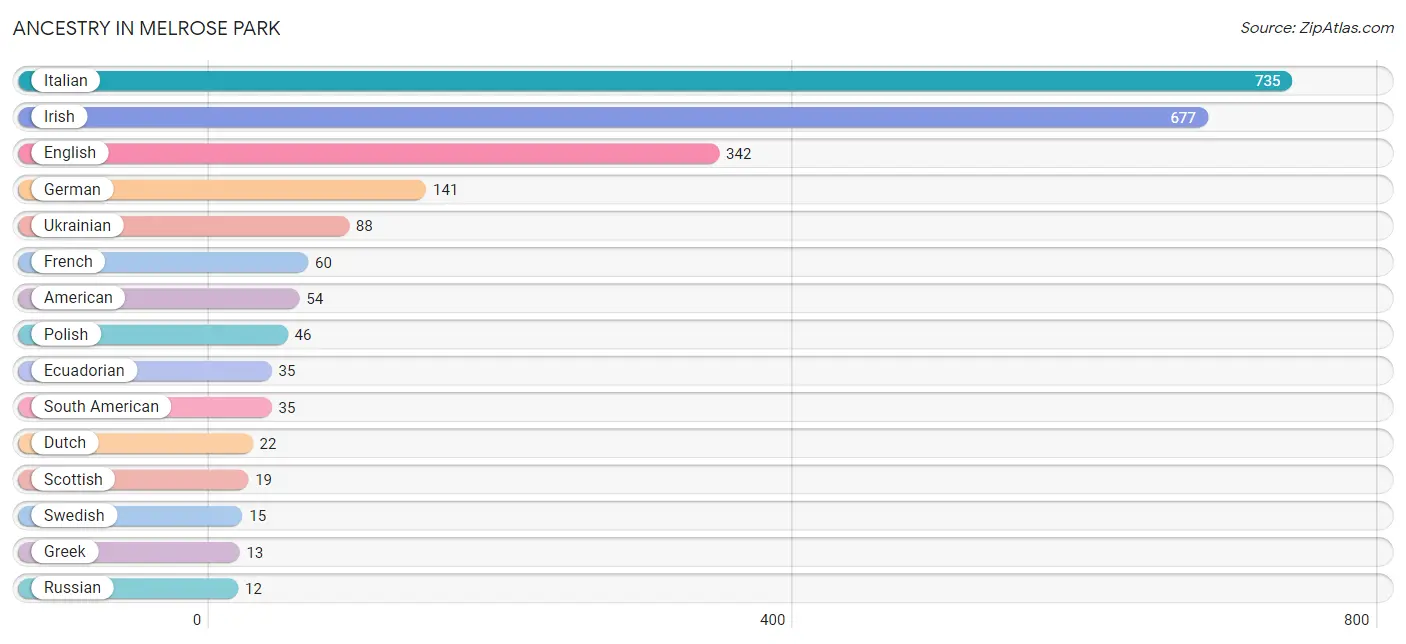
| Ancestry | # Population | % Population |
| American | 54 | 2.7% |
| Dutch | 22 | 1.1% |
| Eastern European | 3 | 0.2% |
| Ecuadorian | 35 | 1.8% |
| English | 342 | 17.1% |
| French | 60 | 3.0% |
| German | 141 | 7.1% |
| Greek | 13 | 0.6% |
| Irish | 677 | 33.9% |
| Italian | 735 | 36.8% |
| Norwegian | 9 | 0.4% |
| Polish | 46 | 2.3% |
| Portuguese | 9 | 0.4% |
| Puerto Rican | 6 | 0.3% |
| Russian | 12 | 0.6% |
| Scotch-Irish | 9 | 0.4% |
| Scottish | 19 | 0.9% |
| Slavic | 10 | 0.5% |
| South American | 35 | 1.8% |
| Swedish | 15 | 0.7% |
| Swiss | 11 | 0.5% |
| Ukrainian | 88 | 4.4% |
| Welsh | 9 | 0.4% | View All 23 Rows |
Immigrants in Melrose Park
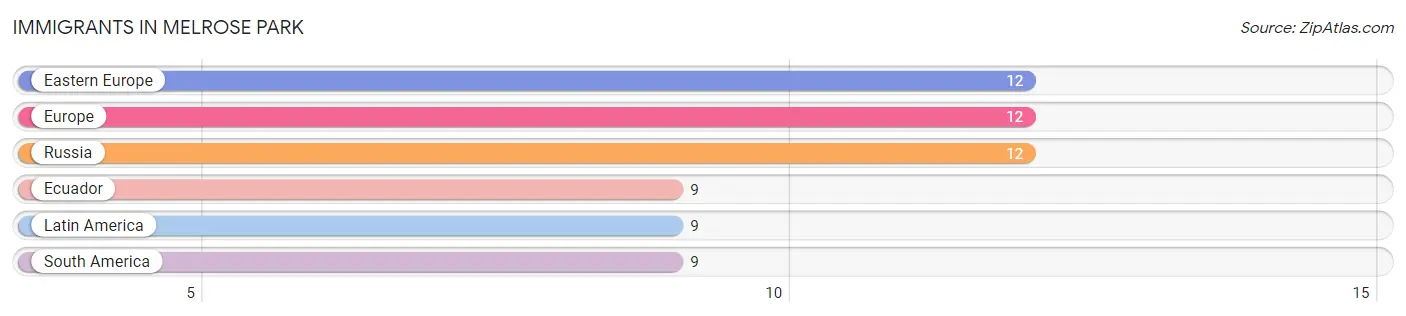
The most numerous immigrant groups reported in Melrose Park came from Eastern Europe (12 | 0.6%), Europe (12 | 0.6%), Russia (12 | 0.6%), Ecuador (9 | 0.4%), and Latin America (9 | 0.4%), together accounting for 2.7% of all Melrose Park residents.
| Immigration Origin | # Population | % Population |
| Eastern Europe | 12 | 0.6% |
| Ecuador | 9 | 0.4% |
| Europe | 12 | 0.6% |
| Latin America | 9 | 0.4% |
| Russia | 12 | 0.6% |
| South America | 9 | 0.4% | View All 6 Rows |
Sex and Age in Melrose Park
Sex and Age in Melrose Park
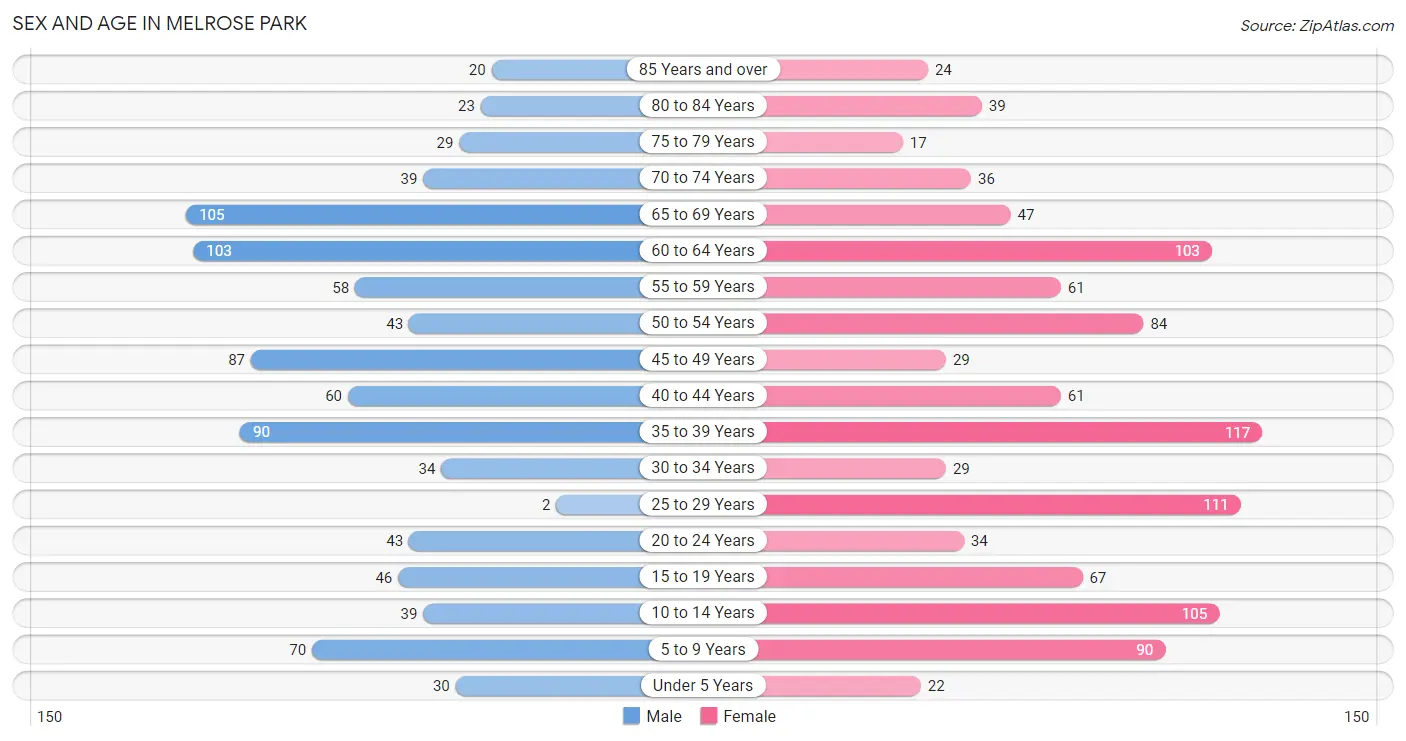
The most populous age groups in Melrose Park are 65 to 69 Years (105 | 11.4%) for men and 35 to 39 Years (117 | 10.9%) for women.
| Age Bracket | Male | Female |
| Under 5 Years | 30 (3.3%) | 22 (2.0%) |
| 5 to 9 Years | 70 (7.6%) | 90 (8.4%) |
| 10 to 14 Years | 39 (4.2%) | 105 (9.8%) |
| 15 to 19 Years | 46 (5.0%) | 67 (6.2%) |
| 20 to 24 Years | 43 (4.7%) | 34 (3.2%) |
| 25 to 29 Years | 2 (0.2%) | 111 (10.3%) |
| 30 to 34 Years | 34 (3.7%) | 29 (2.7%) |
| 35 to 39 Years | 90 (9.8%) | 117 (10.9%) |
| 40 to 44 Years | 60 (6.5%) | 61 (5.7%) |
| 45 to 49 Years | 87 (9.5%) | 29 (2.7%) |
| 50 to 54 Years | 43 (4.7%) | 84 (7.8%) |
| 55 to 59 Years | 58 (6.3%) | 61 (5.7%) |
| 60 to 64 Years | 103 (11.2%) | 103 (9.6%) |
| 65 to 69 Years | 105 (11.4%) | 47 (4.4%) |
| 70 to 74 Years | 39 (4.2%) | 36 (3.4%) |
| 75 to 79 Years | 29 (3.2%) | 17 (1.6%) |
| 80 to 84 Years | 23 (2.5%) | 39 (3.6%) |
| 85 Years and over | 20 (2.2%) | 24 (2.2%) |
| Total | 921 (100.0%) | 1,076 (100.0%) |
Families and Households in Melrose Park
Median Family Size in Melrose Park
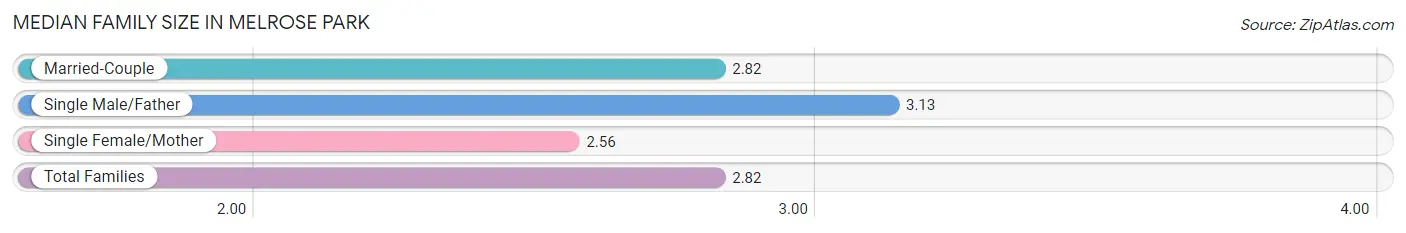
The median family size in Melrose Park is 2.82 persons per family, with single male/father families (32 | 5.5%) accounting for the largest median family size of 3.13 persons per family. On the other hand, single female/mother families (45 | 7.8%) represent the smallest median family size with 2.56 persons per family.
| Family Type | # Families | Family Size |
| Married-Couple | 503 (86.7%) | 2.82 |
| Single Male/Father | 32 (5.5%) | 3.13 |
| Single Female/Mother | 45 (7.8%) | 2.56 |
| Total Families | 580 (100.0%) | 2.82 |
Median Household Size in Melrose Park
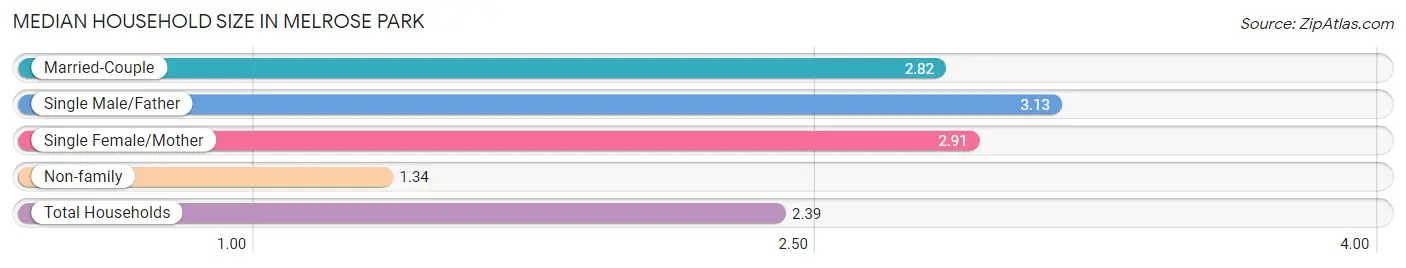
The median household size in Melrose Park is 2.39 persons per household, with single male/father households (32 | 3.9%) accounting for the largest median household size of 3.13 persons per household. non-family households (250 | 30.1%) represent the smallest median household size with 1.34 persons per household.
| Household Type | # Households | Household Size |
| Married-Couple | 503 (60.6%) | 2.82 |
| Single Male/Father | 32 (3.9%) | 3.13 |
| Single Female/Mother | 45 (5.4%) | 2.91 |
| Non-family | 250 (30.1%) | 1.34 |
| Total Households | 830 (100.0%) | 2.39 |
Household Size by Marriage Status in Melrose Park
Out of a total of 830 households in Melrose Park, 580 (69.9%) are family households, while 250 (30.1%) are nonfamily households. The most numerous type of family households are 2-person households, comprising 256, and the most common type of nonfamily households are 1-person households, comprising 175.
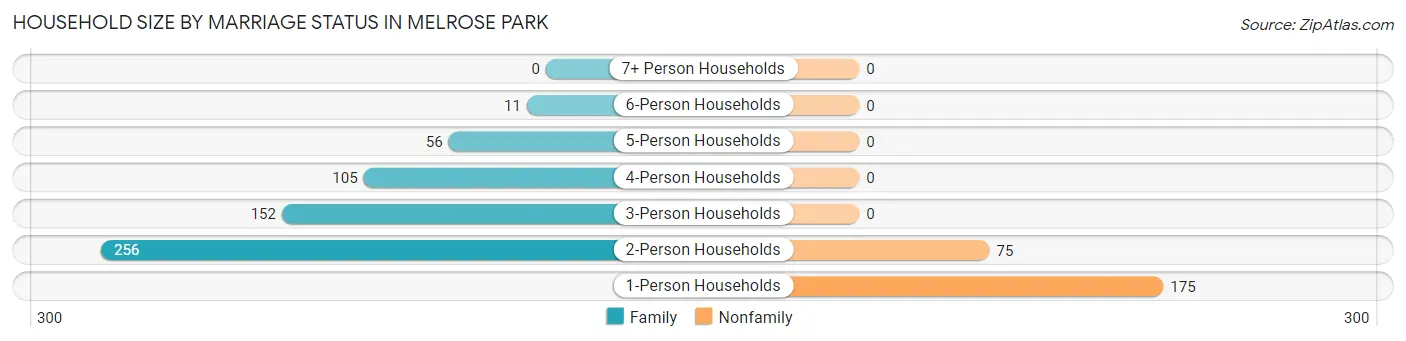
| Household Size | Family Households | Nonfamily Households |
| 1-Person Households | - | 175 (21.1%) |
| 2-Person Households | 256 (30.8%) | 75 (9.0%) |
| 3-Person Households | 152 (18.3%) | 0 (0.0%) |
| 4-Person Households | 105 (12.7%) | 0 (0.0%) |
| 5-Person Households | 56 (6.8%) | 0 (0.0%) |
| 6-Person Households | 11 (1.3%) | 0 (0.0%) |
| 7+ Person Households | 0 (0.0%) | 0 (0.0%) |
| Total | 580 (69.9%) | 250 (30.1%) |
Female Fertility in Melrose Park
Fertility by Age in Melrose Park
Average fertility rate in Melrose Park is 23.0 births per 1,000 women. Women in the age bracket of 35 to 50 years have the highest fertility rate with 46.0 births per 1,000 women. Women in the age bracket of 35 to 50 years acount for 100.0% of all women with births.
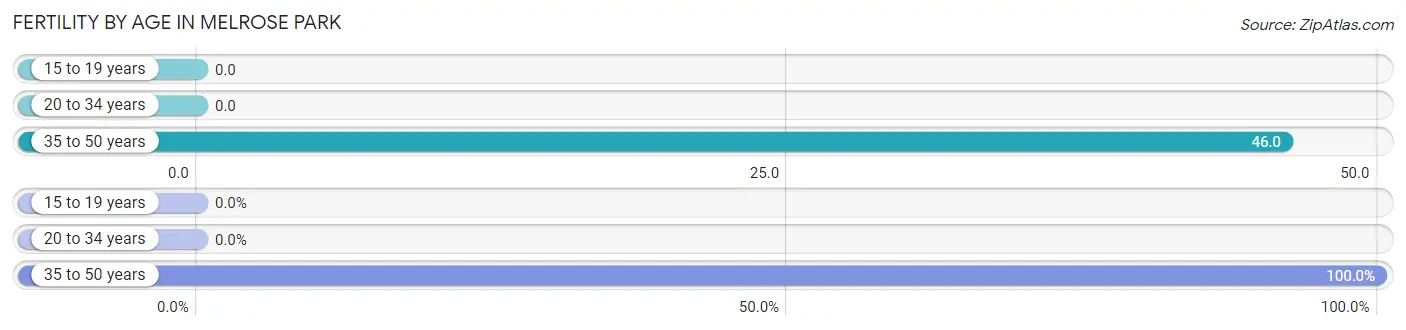
| Age Bracket | Women with Births | Births / 1,000 Women |
| 15 to 19 years | 0 (0.0%) | 0.0 |
| 20 to 34 years | 0 (0.0%) | 0.0 |
| 35 to 50 years | 11 (100.0%) | 46.0 |
| Total | 11 (100.0%) | 23.0 |
Fertility by Age by Marriage Status in Melrose Park
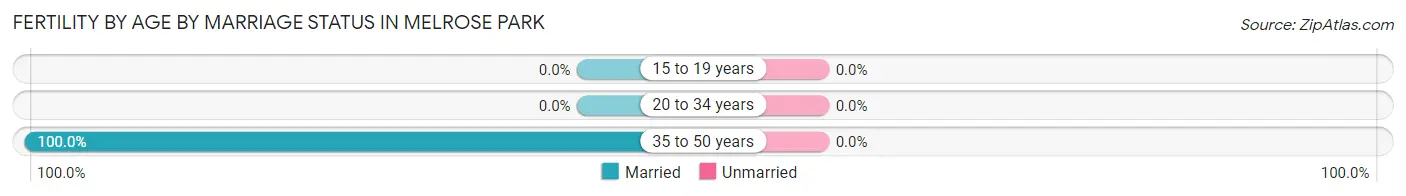
| Age Bracket | Married | Unmarried |
| 15 to 19 years | 0 (0.0%) | 0 (0.0%) |
| 20 to 34 years | 0 (0.0%) | 0 (0.0%) |
| 35 to 50 years | 11 (100.0%) | 0 (0.0%) |
| Total | 11 (100.0%) | 0 (0.0%) |
Fertility by Education in Melrose Park
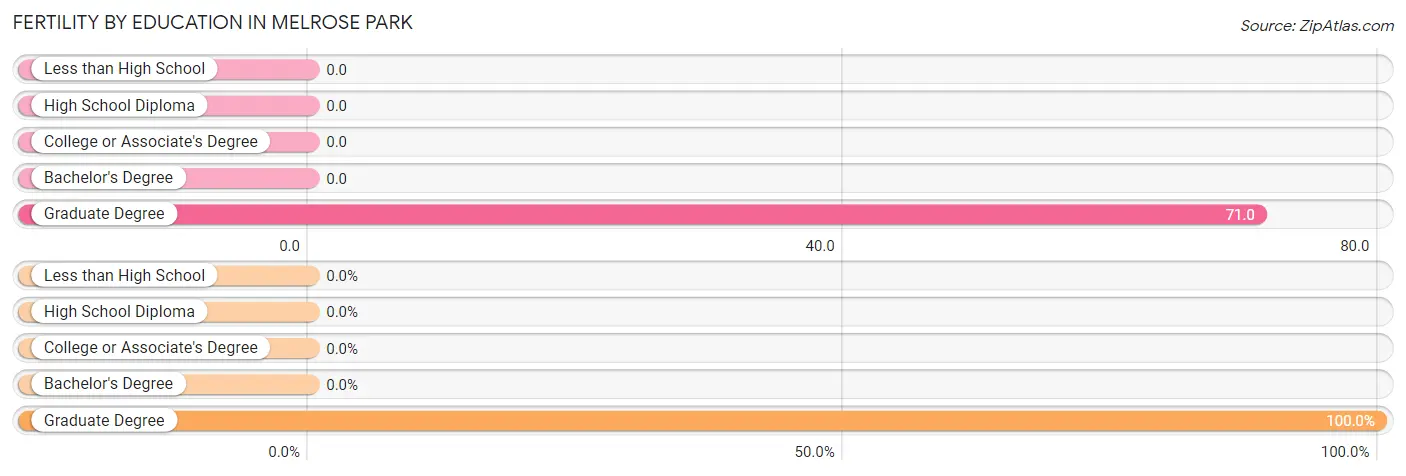
| Educational Attainment | Women with Births | Births / 1,000 Women |
| Less than High School | 0 (0.0%) | 0.0 |
| High School Diploma | 0 (0.0%) | 0.0 |
| College or Associate's Degree | 0 (0.0%) | 0.0 |
| Bachelor's Degree | 0 (0.0%) | 0.0 |
| Graduate Degree | 11 (100.0%) | 71.0 |
| Total | 11 (100.0%) | 23.0 |
Fertility by Education by Marriage Status in Melrose Park
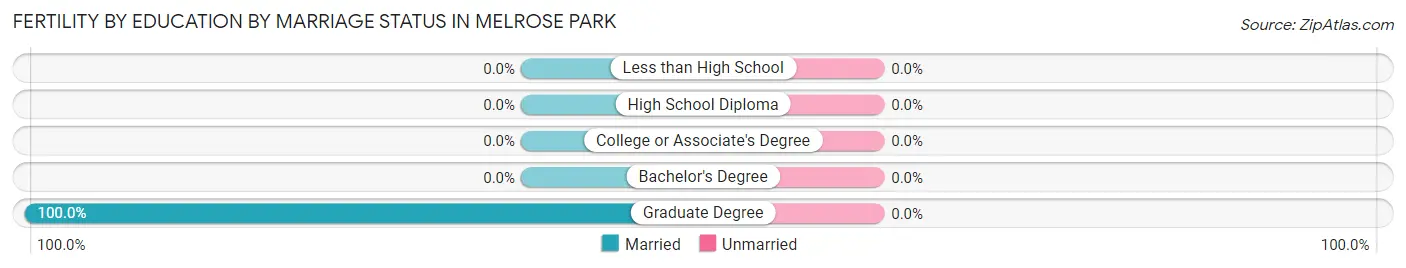
| Educational Attainment | Married | Unmarried |
| Less than High School | 0 (0.0%) | 0 (0.0%) |
| High School Diploma | 0 (0.0%) | 0 (0.0%) |
| College or Associate's Degree | 0 (0.0%) | 0 (0.0%) |
| Bachelor's Degree | 0 (0.0%) | 0 (0.0%) |
| Graduate Degree | 11 (100.0%) | 0 (0.0%) |
| Total | 11 (100.0%) | 0 (0.0%) |
Employment Characteristics in Melrose Park
Employment by Class of Employer in Melrose Park
Among the 1,106 employed individuals in Melrose Park, private company employees (577 | 52.2%), local government employees (306 | 27.7%), and state government employees (80 | 7.2%) make up the most common classes of employment.
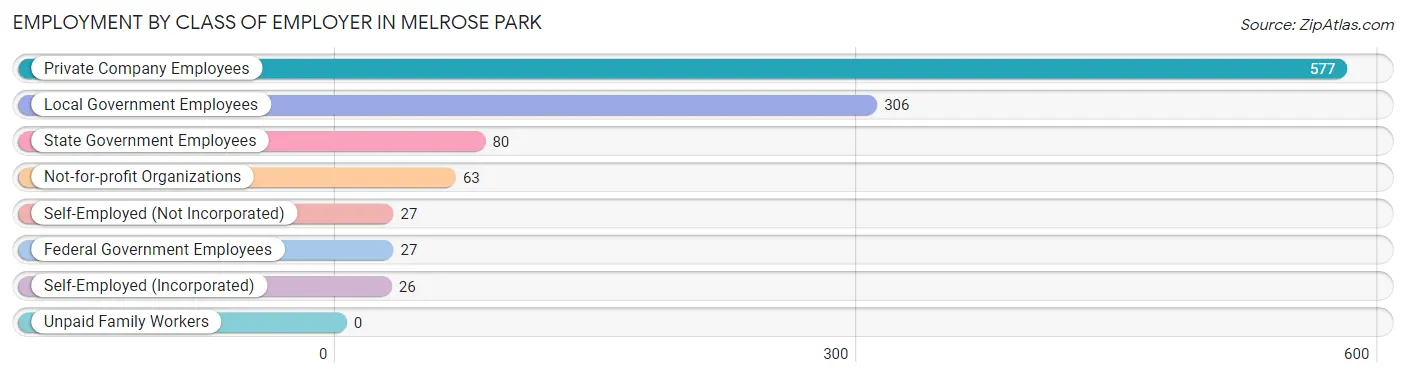
| Employer Class | # Employees | % Employees |
| Private Company Employees | 577 | 52.2% |
| Self-Employed (Incorporated) | 26 | 2.4% |
| Self-Employed (Not Incorporated) | 27 | 2.4% |
| Not-for-profit Organizations | 63 | 5.7% |
| Local Government Employees | 306 | 27.7% |
| State Government Employees | 80 | 7.2% |
| Federal Government Employees | 27 | 2.4% |
| Unpaid Family Workers | 0 | 0.0% |
| Total | 1,106 | 100.0% |
Employment Status by Age in Melrose Park
According to the labor force statistics for Melrose Park, out of the total population over 16 years of age (1,610), 71.1% or 1,145 individuals are in the labor force, with 2.4% or 27 of them unemployed. The age group with the highest labor force participation rate is 20 to 24 years, with 100.0% or 77 individuals in the labor force. Within the labor force, the 20 to 24 years age range has the highest percentage of unemployed individuals, with 27.3% or 21 of them being unemployed.
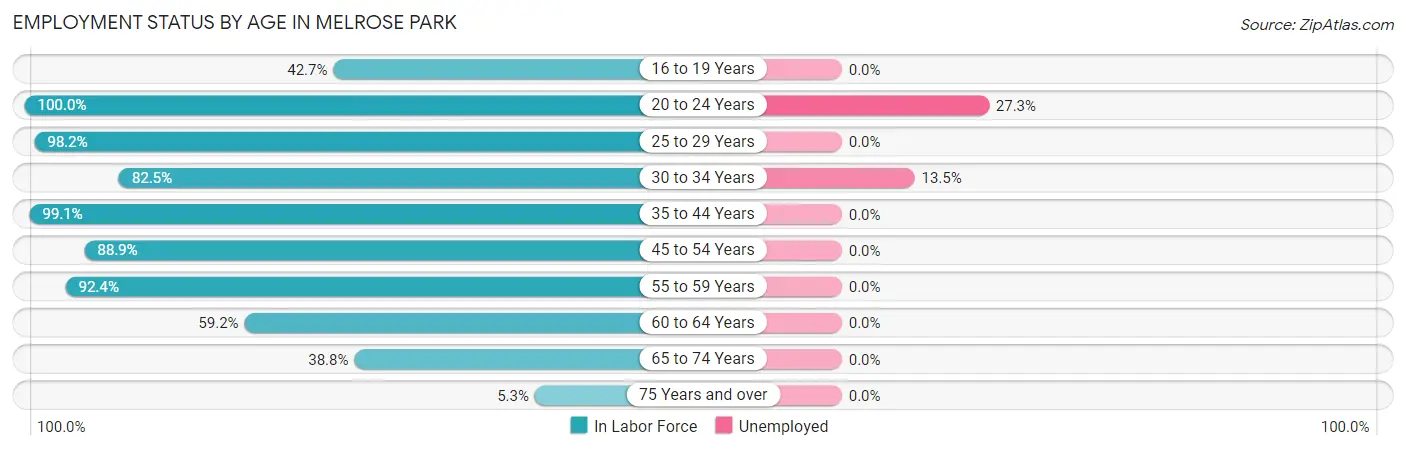
| Age Bracket | In Labor Force | Unemployed |
| 16 to 19 Years | 35 (42.7%) | 0 (0.0%) |
| 20 to 24 Years | 77 (100.0%) | 21 (27.3%) |
| 25 to 29 Years | 111 (98.2%) | 0 (0.0%) |
| 30 to 34 Years | 52 (82.5%) | 7 (13.5%) |
| 35 to 44 Years | 325 (99.1%) | 0 (0.0%) |
| 45 to 54 Years | 216 (88.9%) | 0 (0.0%) |
| 55 to 59 Years | 110 (92.4%) | 0 (0.0%) |
| 60 to 64 Years | 122 (59.2%) | 0 (0.0%) |
| 65 to 74 Years | 88 (38.8%) | 0 (0.0%) |
| 75 Years and over | 8 (5.3%) | 0 (0.0%) |
| Total | 1,145 (71.1%) | 27 (2.4%) |
Employment Status by Educational Attainment in Melrose Park
According to labor force statistics for Melrose Park, 87.3% of individuals (936) out of the total population between 25 and 64 years of age (1,072) are in the labor force, with 0.7% or 7 of them being unemployed. The group with the highest labor force participation rate are those with the educational attainment of high school diploma, with 100.0% or 66 individuals in the labor force. Within the labor force, individuals with bachelor's degree or higher education have the highest percentage of unemployment, with 1.4% or 7 of them being unemployed.
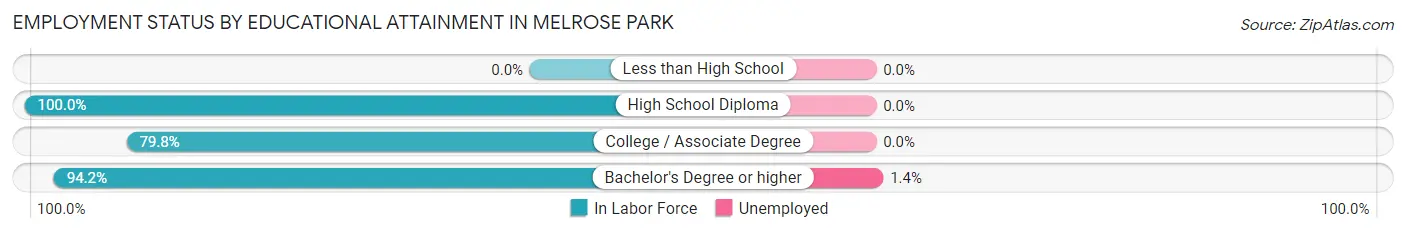
| Educational Attainment | In Labor Force | Unemployed |
| Less than High School | 0 (0.0%) | 0 (0.0%) |
| High School Diploma | 66 (100.0%) | 0 (0.0%) |
| College / Associate Degree | 379 (79.8%) | 0 (0.0%) |
| Bachelor's Degree or higher | 491 (94.2%) | 7 (1.4%) |
| Total | 936 (87.3%) | 8 (0.7%) |
Employment Occupations by Sex in Melrose Park
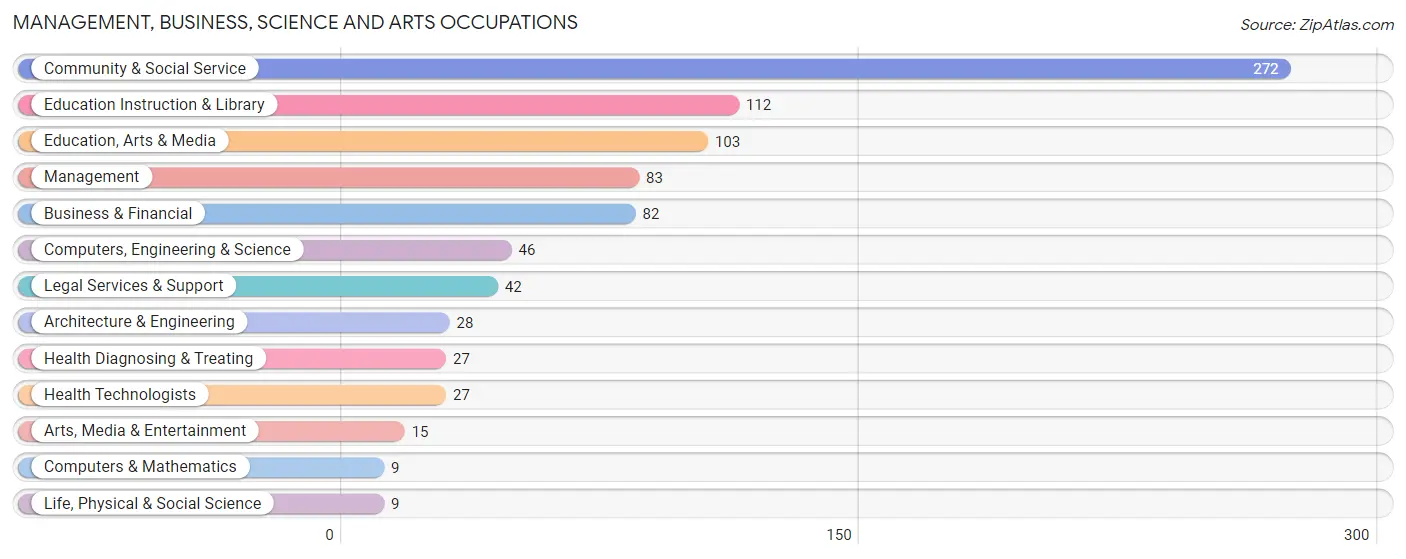
Management, Business, Science and Arts Occupations
The most common Management, Business, Science and Arts occupations in Melrose Park are Community & Social Service (272 | 24.4%), Education Instruction & Library (112 | 10.0%), Education, Arts & Media (103 | 9.2%), Management (83 | 7.4%), and Business & Financial (82 | 7.3%).
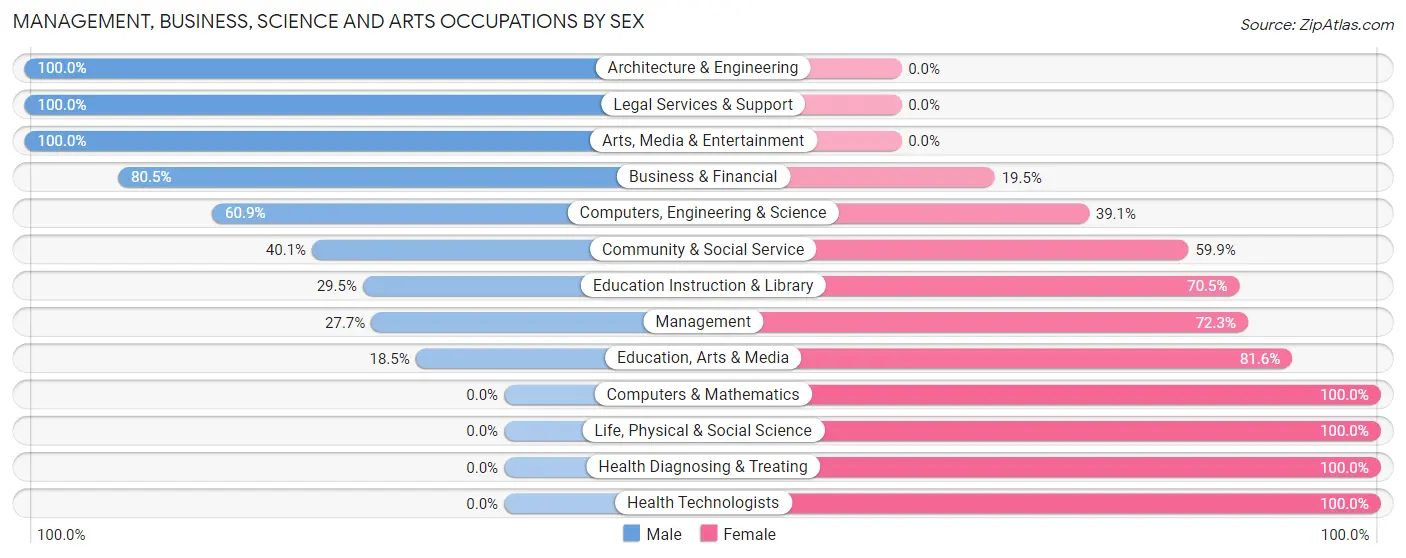
Management, Business, Science and Arts Occupations by Sex
Within the Management, Business, Science and Arts occupations in Melrose Park, the most male-oriented occupations are Architecture & Engineering (100.0%), Legal Services & Support (100.0%), and Arts, Media & Entertainment (100.0%), while the most female-oriented occupations are Computers & Mathematics (100.0%), Life, Physical & Social Science (100.0%), and Health Diagnosing & Treating (100.0%).
| Occupation | Male | Female |
| Management | 23 (27.7%) | 60 (72.3%) |
| Business & Financial | 66 (80.5%) | 16 (19.5%) |
| Computers, Engineering & Science | 28 (60.9%) | 18 (39.1%) |
| Computers & Mathematics | 0 (0.0%) | 9 (100.0%) |
| Architecture & Engineering | 28 (100.0%) | 0 (0.0%) |
| Life, Physical & Social Science | 0 (0.0%) | 9 (100.0%) |
| Community & Social Service | 109 (40.1%) | 163 (59.9%) |
| Education, Arts & Media | 19 (18.4%) | 84 (81.6%) |
| Legal Services & Support | 42 (100.0%) | 0 (0.0%) |
| Education Instruction & Library | 33 (29.5%) | 79 (70.5%) |
| Arts, Media & Entertainment | 15 (100.0%) | 0 (0.0%) |
| Health Diagnosing & Treating | 0 (0.0%) | 27 (100.0%) |
| Health Technologists | 0 (0.0%) | 27 (100.0%) |
| Total (Category) | 226 (44.3%) | 284 (55.7%) |
| Total (Overall) | 550 (49.3%) | 566 (50.7%) |
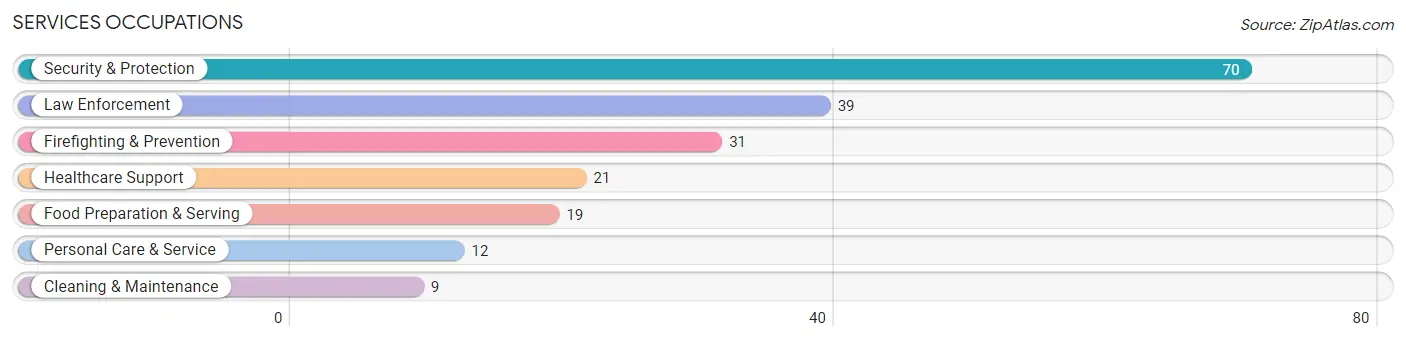
Services Occupations
The most common Services occupations in Melrose Park are Security & Protection (70 | 6.3%), Law Enforcement (39 | 3.5%), Firefighting & Prevention (31 | 2.8%), Healthcare Support (21 | 1.9%), and Food Preparation & Serving (19 | 1.7%).
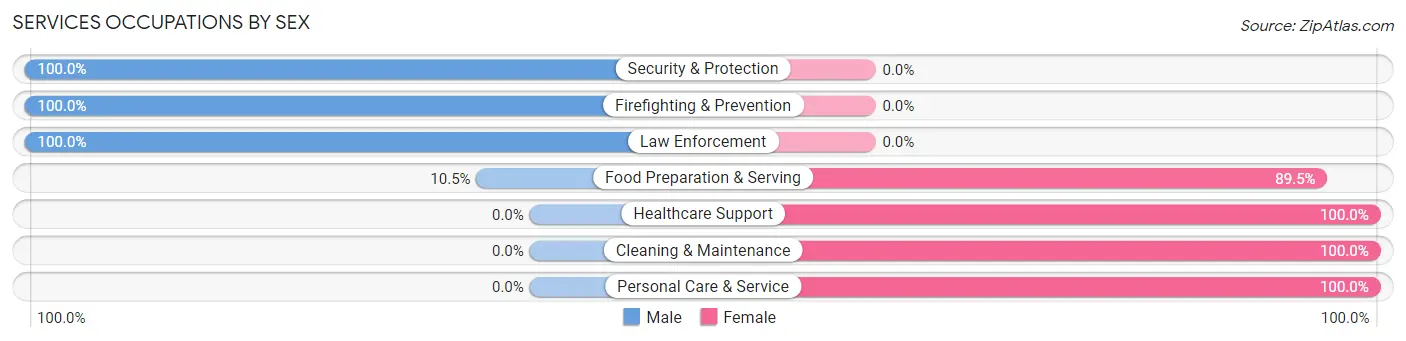
Services Occupations by Sex
Within the Services occupations in Melrose Park, the most male-oriented occupations are Security & Protection (100.0%), Firefighting & Prevention (100.0%), and Law Enforcement (100.0%), while the most female-oriented occupations are Healthcare Support (100.0%), Cleaning & Maintenance (100.0%), and Personal Care & Service (100.0%).
| Occupation | Male | Female |
| Healthcare Support | 0 (0.0%) | 21 (100.0%) |
| Security & Protection | 70 (100.0%) | 0 (0.0%) |
| Firefighting & Prevention | 31 (100.0%) | 0 (0.0%) |
| Law Enforcement | 39 (100.0%) | 0 (0.0%) |
| Food Preparation & Serving | 2 (10.5%) | 17 (89.5%) |
| Cleaning & Maintenance | 0 (0.0%) | 9 (100.0%) |
| Personal Care & Service | 0 (0.0%) | 12 (100.0%) |
| Total (Category) | 72 (55.0%) | 59 (45.0%) |
| Total (Overall) | 550 (49.3%) | 566 (50.7%) |
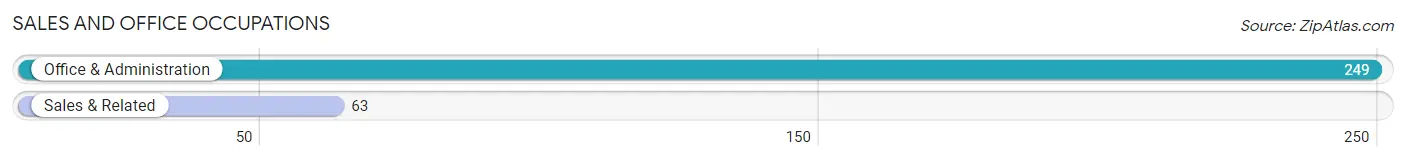
Sales and Office Occupations
The most common Sales and Office occupations in Melrose Park are Office & Administration (249 | 22.3%), and Sales & Related (63 | 5.7%).
Sales and Office Occupations by Sex
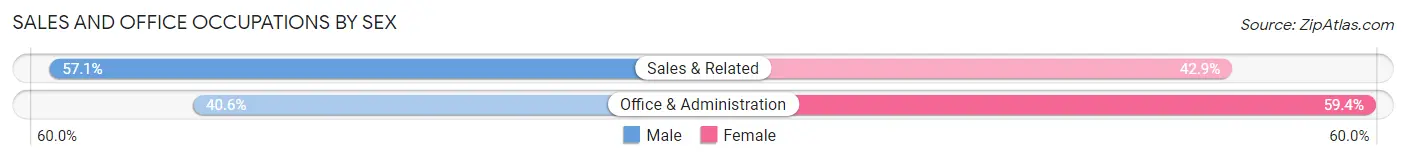
| Occupation | Male | Female |
| Sales & Related | 36 (57.1%) | 27 (42.9%) |
| Office & Administration | 101 (40.6%) | 148 (59.4%) |
| Total (Category) | 137 (43.9%) | 175 (56.1%) |
| Total (Overall) | 550 (49.3%) | 566 (50.7%) |
Natural Resources, Construction and Maintenance Occupations
The most common Natural Resources, Construction and Maintenance occupations in Melrose Park are Construction & Extraction (9 | 0.8%), and Installation, Maintenance & Repair (7 | 0.6%).

Natural Resources, Construction and Maintenance Occupations by Sex

| Occupation | Male | Female |
| Farming, Fishing & Forestry | 0 (0.0%) | 0 (0.0%) |
| Construction & Extraction | 9 (100.0%) | 0 (0.0%) |
| Installation, Maintenance & Repair | 7 (100.0%) | 0 (0.0%) |
| Total (Category) | 16 (100.0%) | 0 (0.0%) |
| Total (Overall) | 550 (49.3%) | 566 (50.7%) |
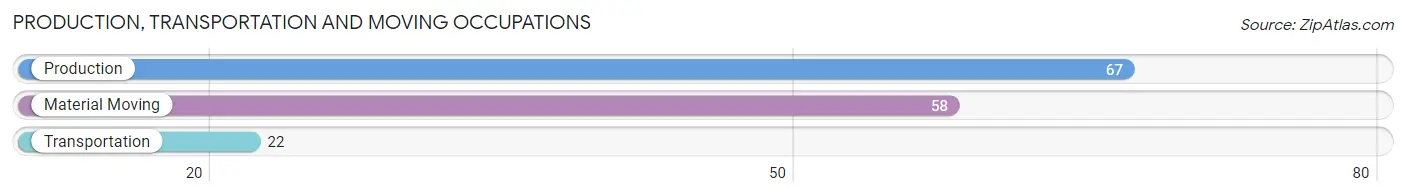
Production, Transportation and Moving Occupations
The most common Production, Transportation and Moving occupations in Melrose Park are Production (67 | 6.0%), Material Moving (58 | 5.2%), and Transportation (22 | 2.0%).
Production, Transportation and Moving Occupations by Sex
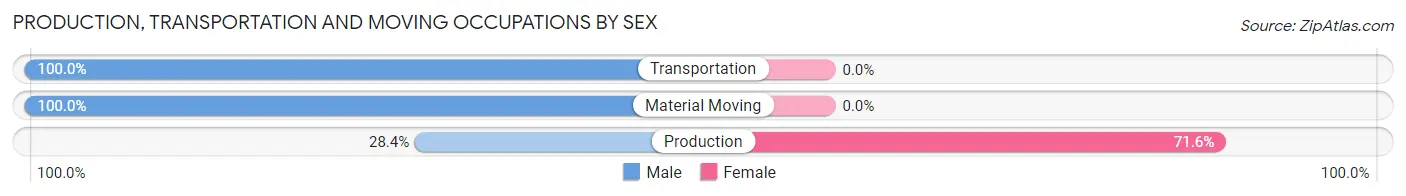
| Occupation | Male | Female |
| Production | 19 (28.4%) | 48 (71.6%) |
| Transportation | 22 (100.0%) | 0 (0.0%) |
| Material Moving | 58 (100.0%) | 0 (0.0%) |
| Total (Category) | 99 (67.3%) | 48 (32.7%) |
| Total (Overall) | 550 (49.3%) | 566 (50.7%) |
Employment Industries by Sex in Melrose Park
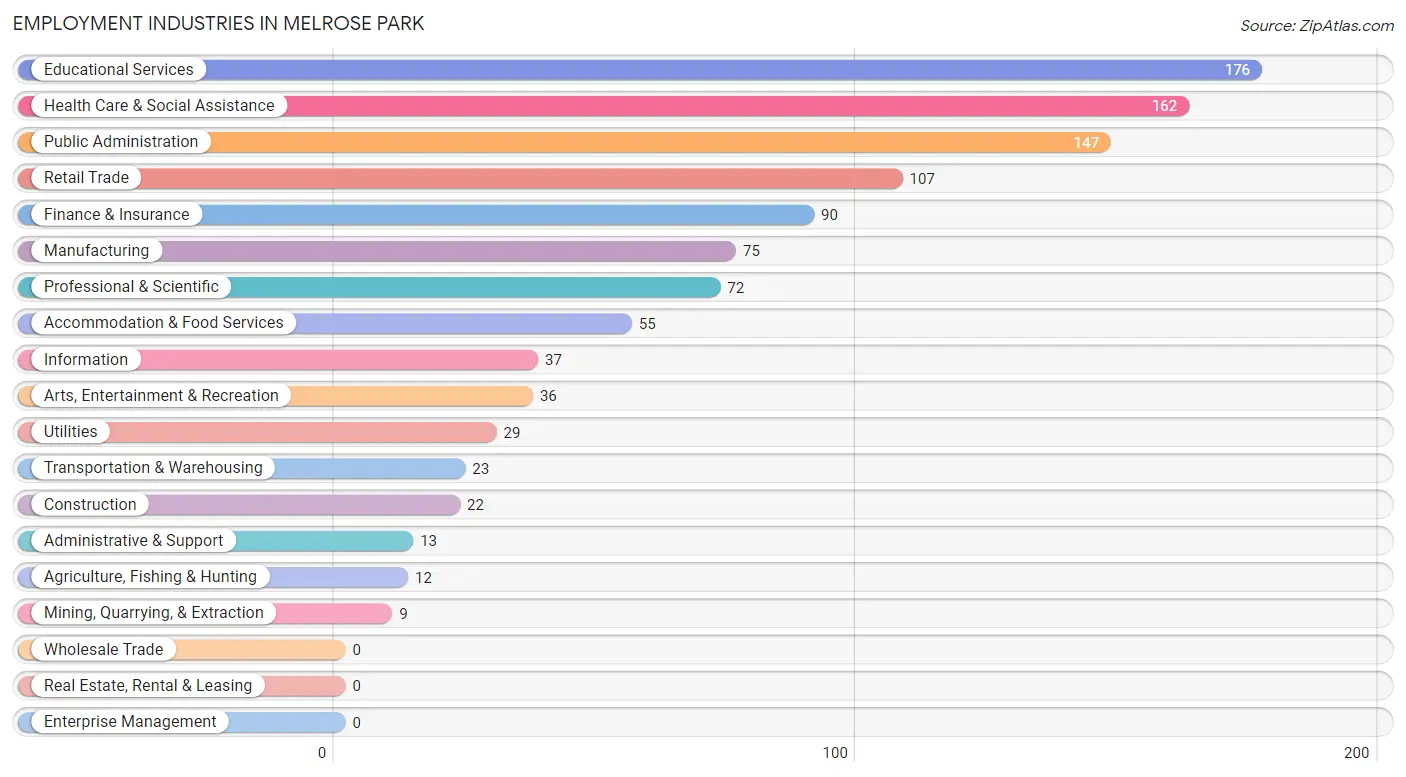
Employment Industries in Melrose Park
The major employment industries in Melrose Park include Educational Services (176 | 15.8%), Health Care & Social Assistance (162 | 14.5%), Public Administration (147 | 13.2%), Retail Trade (107 | 9.6%), and Finance & Insurance (90 | 8.1%).
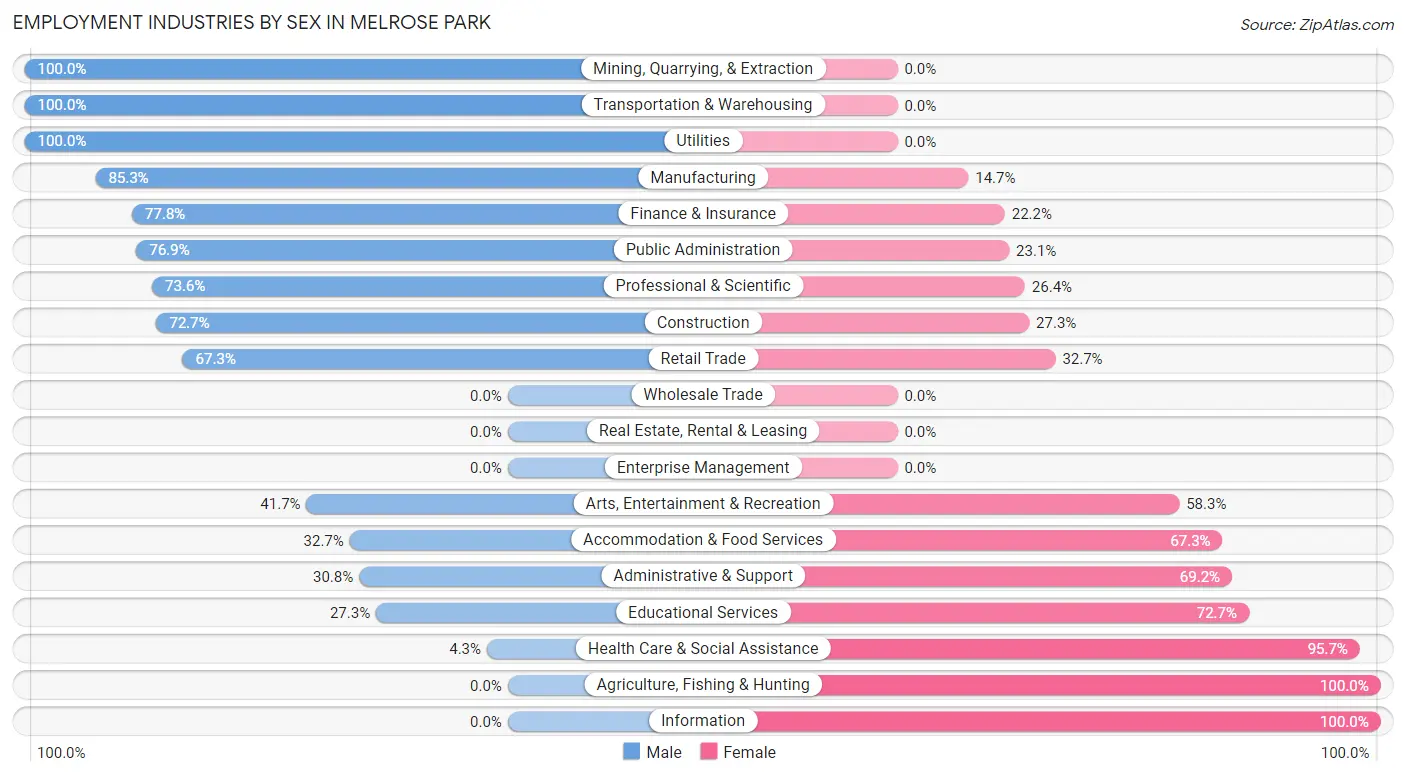
Employment Industries by Sex in Melrose Park
The Melrose Park industries that see more men than women are Mining, Quarrying, & Extraction (100.0%), Transportation & Warehousing (100.0%), and Utilities (100.0%), whereas the industries that tend to have a higher number of women are Agriculture, Fishing & Hunting (100.0%), Information (100.0%), and Health Care & Social Assistance (95.7%).
| Industry | Male | Female |
| Agriculture, Fishing & Hunting | 0 (0.0%) | 12 (100.0%) |
| Mining, Quarrying, & Extraction | 9 (100.0%) | 0 (0.0%) |
| Construction | 16 (72.7%) | 6 (27.3%) |
| Manufacturing | 64 (85.3%) | 11 (14.7%) |
| Wholesale Trade | 0 (0.0%) | 0 (0.0%) |
| Retail Trade | 72 (67.3%) | 35 (32.7%) |
| Transportation & Warehousing | 23 (100.0%) | 0 (0.0%) |
| Utilities | 29 (100.0%) | 0 (0.0%) |
| Information | 0 (0.0%) | 37 (100.0%) |
| Finance & Insurance | 70 (77.8%) | 20 (22.2%) |
| Real Estate, Rental & Leasing | 0 (0.0%) | 0 (0.0%) |
| Professional & Scientific | 53 (73.6%) | 19 (26.4%) |
| Enterprise Management | 0 (0.0%) | 0 (0.0%) |
| Administrative & Support | 4 (30.8%) | 9 (69.2%) |
| Educational Services | 48 (27.3%) | 128 (72.7%) |
| Health Care & Social Assistance | 7 (4.3%) | 155 (95.7%) |
| Arts, Entertainment & Recreation | 15 (41.7%) | 21 (58.3%) |
| Accommodation & Food Services | 18 (32.7%) | 37 (67.3%) |
| Public Administration | 113 (76.9%) | 34 (23.1%) |
| Total | 550 (49.3%) | 566 (50.7%) |
Education in Melrose Park
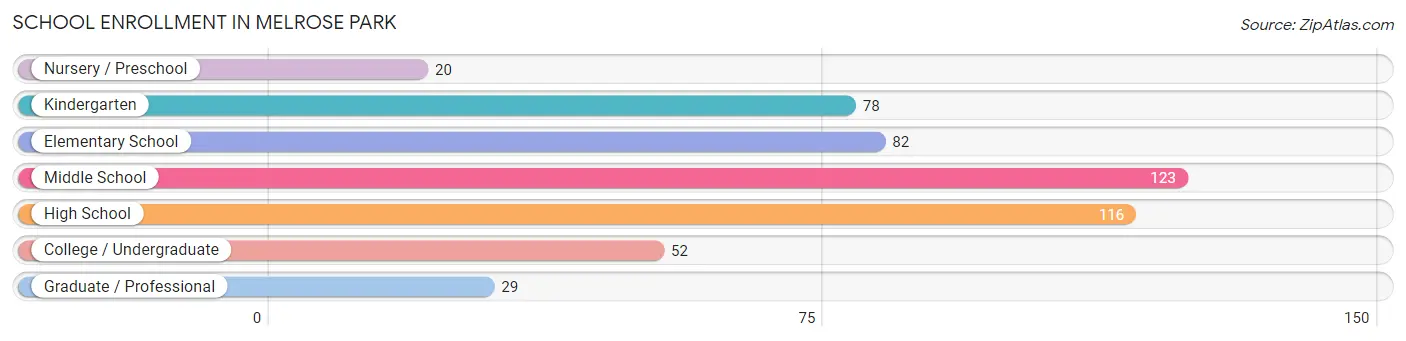
School Enrollment in Melrose Park
The most common levels of schooling among the 500 students in Melrose Park are middle school (123 | 24.6%), high school (116 | 23.2%), and elementary school (82 | 16.4%).
| School Level | # Students | % Students |
| Nursery / Preschool | 20 | 4.0% |
| Kindergarten | 78 | 15.6% |
| Elementary School | 82 | 16.4% |
| Middle School | 123 | 24.6% |
| High School | 116 | 23.2% |
| College / Undergraduate | 52 | 10.4% |
| Graduate / Professional | 29 | 5.8% |
| Total | 500 | 100.0% |
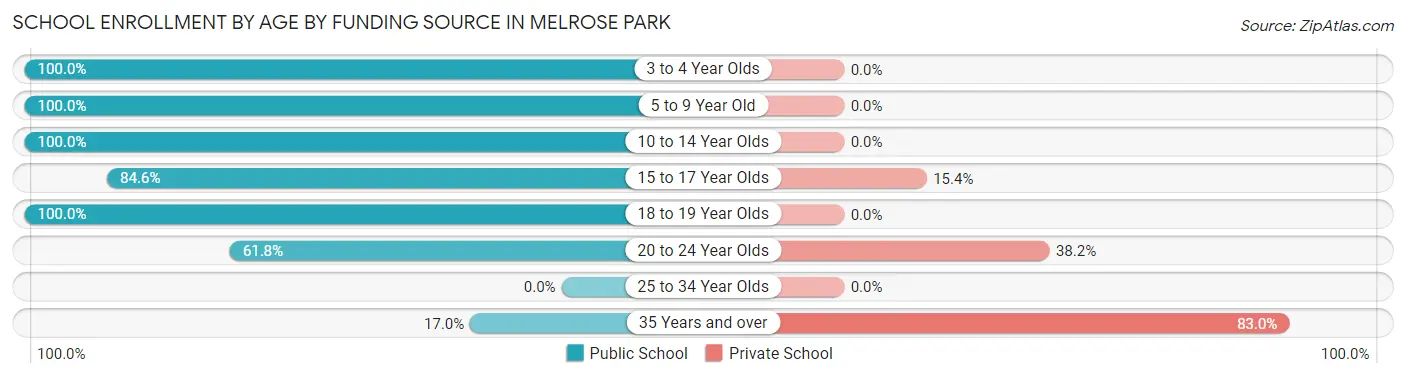
School Enrollment by Age by Funding Source in Melrose Park
Out of a total of 500 students who are enrolled in schools in Melrose Park, 64 (12.8%) attend a private institution, while the remaining 436 (87.2%) are enrolled in public schools. The age group of 35 years and over has the highest likelihood of being enrolled in private schools, with 39 (83.0% in the age bracket) enrolled. Conversely, the age group of 3 to 4 year olds has the lowest likelihood of being enrolled in a private school, with 20 (100.0% in the age bracket) attending a public institution.
| Age Bracket | Public School | Private School |
| 3 to 4 Year Olds | 20 (100.0%) | 0 (0.0%) |
| 5 to 9 Year Old | 160 (100.0%) | 0 (0.0%) |
| 10 to 14 Year Olds | 144 (100.0%) | 0 (0.0%) |
| 15 to 17 Year Olds | 66 (84.6%) | 12 (15.4%) |
| 18 to 19 Year Olds | 17 (100.0%) | 0 (0.0%) |
| 20 to 24 Year Olds | 21 (61.8%) | 13 (38.2%) |
| 25 to 34 Year Olds | 0 (0.0%) | 0 (0.0%) |
| 35 Years and over | 8 (17.0%) | 39 (83.0%) |
| Total | 436 (87.2%) | 64 (12.8%) |
Educational Attainment by Field of Study in Melrose Park
Education (183 | 24.1%), business (124 | 16.4%), psychology (86 | 11.4%), communications (79 | 10.4%), and science & technology (67 | 8.8%) are the most common fields of study among 758 individuals in Melrose Park who have obtained a bachelor's degree or higher.
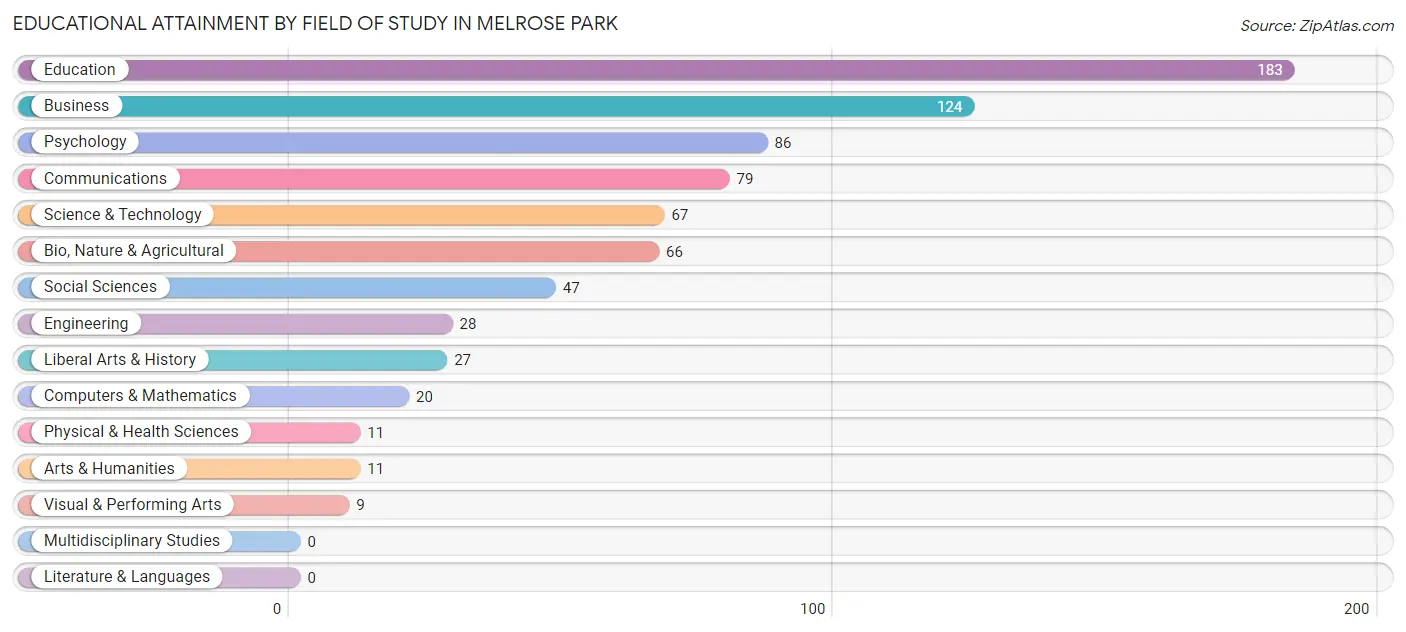
| Field of Study | # Graduates | % Graduates |
| Computers & Mathematics | 20 | 2.6% |
| Bio, Nature & Agricultural | 66 | 8.7% |
| Physical & Health Sciences | 11 | 1.5% |
| Psychology | 86 | 11.4% |
| Social Sciences | 47 | 6.2% |
| Engineering | 28 | 3.7% |
| Multidisciplinary Studies | 0 | 0.0% |
| Science & Technology | 67 | 8.8% |
| Business | 124 | 16.4% |
| Education | 183 | 24.1% |
| Literature & Languages | 0 | 0.0% |
| Liberal Arts & History | 27 | 3.6% |
| Visual & Performing Arts | 9 | 1.2% |
| Communications | 79 | 10.4% |
| Arts & Humanities | 11 | 1.5% |
| Total | 758 | 100.0% |
Transportation & Commute in Melrose Park
Vehicle Availability by Sex in Melrose Park
The most prevalent vehicle ownership categories in Melrose Park are males with 2 vehicles (365, accounting for 66.4%) and females with 2 vehicles (371, making up 65.6%).
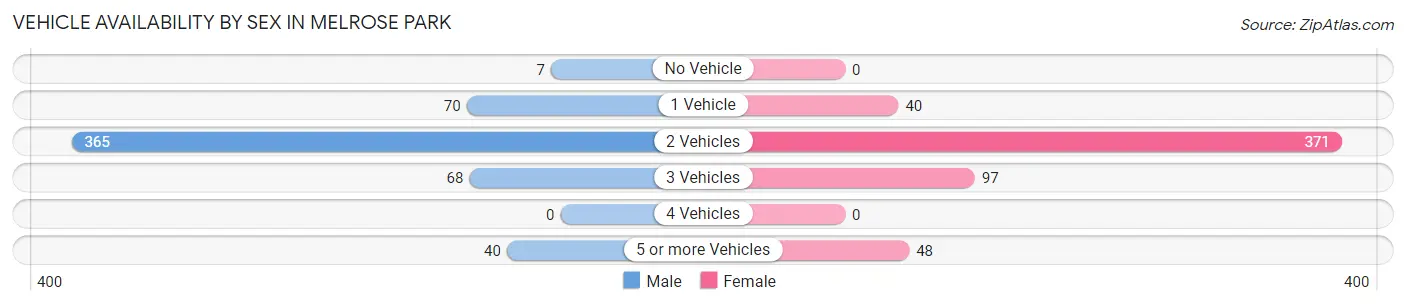
| Vehicles Available | Male | Female |
| No Vehicle | 7 (1.3%) | 0 (0.0%) |
| 1 Vehicle | 70 (12.7%) | 40 (7.2%) |
| 2 Vehicles | 365 (66.4%) | 371 (66.7%) |
| 3 Vehicles | 68 (12.4%) | 97 (17.4%) |
| 4 Vehicles | 0 (0.0%) | 0 (0.0%) |
| 5 or more Vehicles | 40 (7.3%) | 48 (8.6%) |
| Total | 550 (100.0%) | 556 (100.0%) |
Commute Time in Melrose Park
The most frequently occuring commute durations in Melrose Park are 10 to 14 minutes (330 commuters, 32.0%), 15 to 19 minutes (200 commuters, 19.4%), and 5 to 9 minutes (158 commuters, 15.3%).
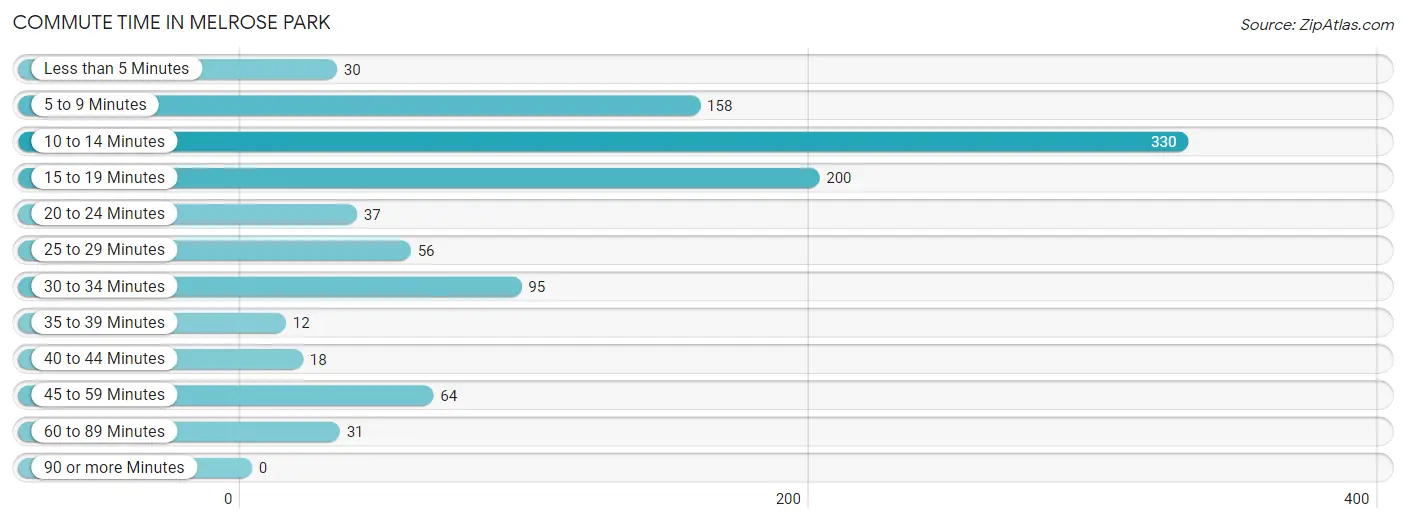
| Commute Time | # Commuters | % Commuters |
| Less than 5 Minutes | 30 | 2.9% |
| 5 to 9 Minutes | 158 | 15.3% |
| 10 to 14 Minutes | 330 | 32.0% |
| 15 to 19 Minutes | 200 | 19.4% |
| 20 to 24 Minutes | 37 | 3.6% |
| 25 to 29 Minutes | 56 | 5.4% |
| 30 to 34 Minutes | 95 | 9.2% |
| 35 to 39 Minutes | 12 | 1.2% |
| 40 to 44 Minutes | 18 | 1.8% |
| 45 to 59 Minutes | 64 | 6.2% |
| 60 to 89 Minutes | 31 | 3.0% |
| 90 or more Minutes | 0 | 0.0% |
Commute Time by Sex in Melrose Park
The most common commute times in Melrose Park are 10 to 14 minutes (164 commuters, 31.1%) for males and 10 to 14 minutes (166 commuters, 33.0%) for females.
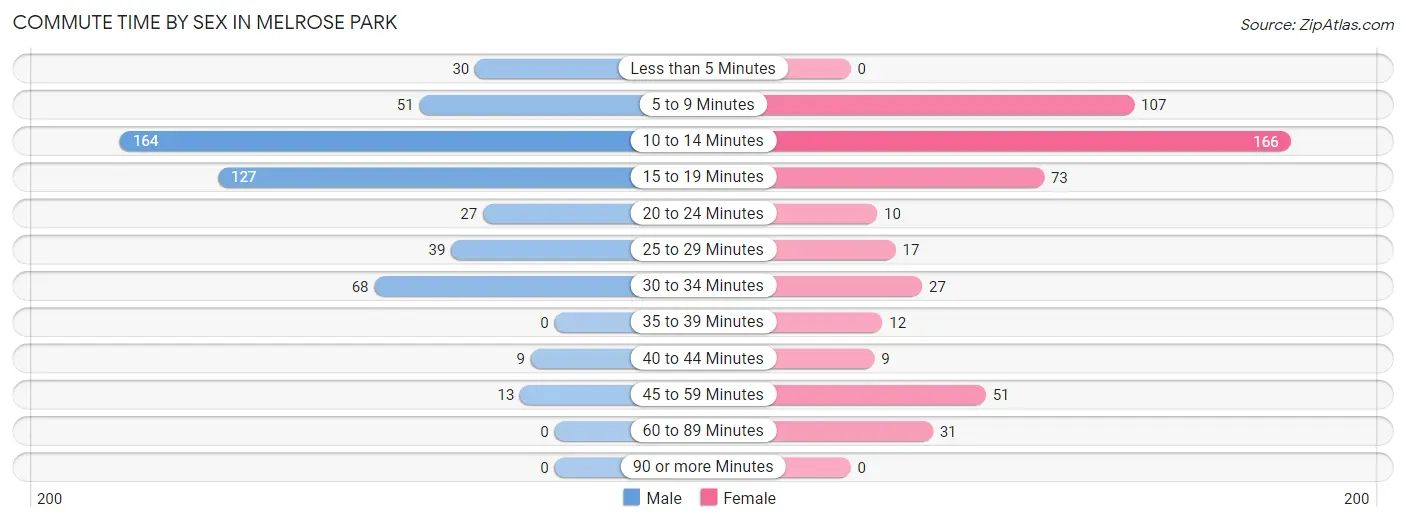
| Commute Time | Male | Female |
| Less than 5 Minutes | 30 (5.7%) | 0 (0.0%) |
| 5 to 9 Minutes | 51 (9.7%) | 107 (21.3%) |
| 10 to 14 Minutes | 164 (31.1%) | 166 (33.0%) |
| 15 to 19 Minutes | 127 (24.0%) | 73 (14.5%) |
| 20 to 24 Minutes | 27 (5.1%) | 10 (2.0%) |
| 25 to 29 Minutes | 39 (7.4%) | 17 (3.4%) |
| 30 to 34 Minutes | 68 (12.9%) | 27 (5.4%) |
| 35 to 39 Minutes | 0 (0.0%) | 12 (2.4%) |
| 40 to 44 Minutes | 9 (1.7%) | 9 (1.8%) |
| 45 to 59 Minutes | 13 (2.5%) | 51 (10.1%) |
| 60 to 89 Minutes | 0 (0.0%) | 31 (6.2%) |
| 90 or more Minutes | 0 (0.0%) | 0 (0.0%) |
Time of Departure to Work by Sex in Melrose Park
The most frequent times of departure to work in Melrose Park are 7:30 AM to 7:59 AM (131, 24.8%) for males and 7:00 AM to 7:29 AM (97, 19.3%) for females.
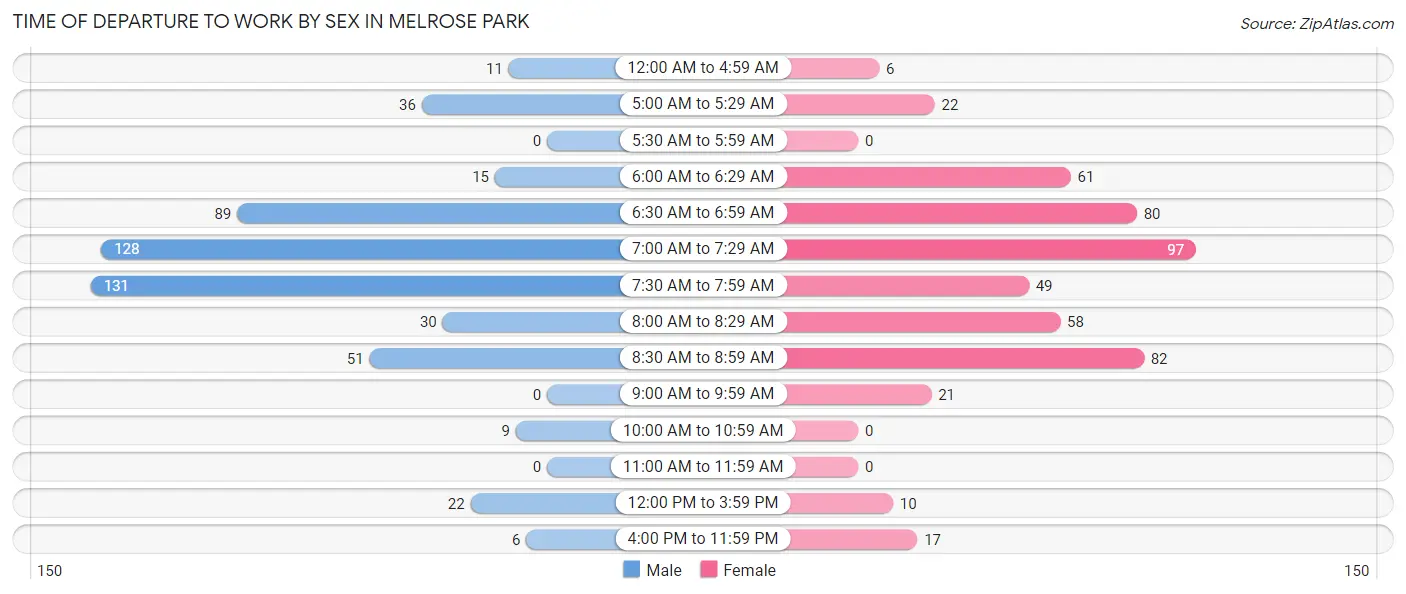
| Time of Departure | Male | Female |
| 12:00 AM to 4:59 AM | 11 (2.1%) | 6 (1.2%) |
| 5:00 AM to 5:29 AM | 36 (6.8%) | 22 (4.4%) |
| 5:30 AM to 5:59 AM | 0 (0.0%) | 0 (0.0%) |
| 6:00 AM to 6:29 AM | 15 (2.8%) | 61 (12.1%) |
| 6:30 AM to 6:59 AM | 89 (16.9%) | 80 (15.9%) |
| 7:00 AM to 7:29 AM | 128 (24.2%) | 97 (19.3%) |
| 7:30 AM to 7:59 AM | 131 (24.8%) | 49 (9.7%) |
| 8:00 AM to 8:29 AM | 30 (5.7%) | 58 (11.5%) |
| 8:30 AM to 8:59 AM | 51 (9.7%) | 82 (16.3%) |
| 9:00 AM to 9:59 AM | 0 (0.0%) | 21 (4.2%) |
| 10:00 AM to 10:59 AM | 9 (1.7%) | 0 (0.0%) |
| 11:00 AM to 11:59 AM | 0 (0.0%) | 0 (0.0%) |
| 12:00 PM to 3:59 PM | 22 (4.2%) | 10 (2.0%) |
| 4:00 PM to 11:59 PM | 6 (1.1%) | 17 (3.4%) |
| Total | 528 (100.0%) | 503 (100.0%) |
Housing Occupancy in Melrose Park
Occupancy by Ownership in Melrose Park
Of the total 830 dwellings in Melrose Park, owner-occupied units account for 811 (97.7%), while renter-occupied units make up 19 (2.3%).
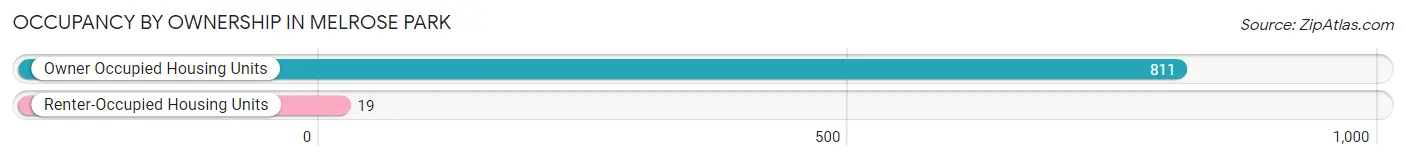
| Occupancy | # Housing Units | % Housing Units |
| Owner Occupied Housing Units | 811 | 97.7% |
| Renter-Occupied Housing Units | 19 | 2.3% |
| Total Occupied Housing Units | 830 | 100.0% |
Occupancy by Household Size in Melrose Park
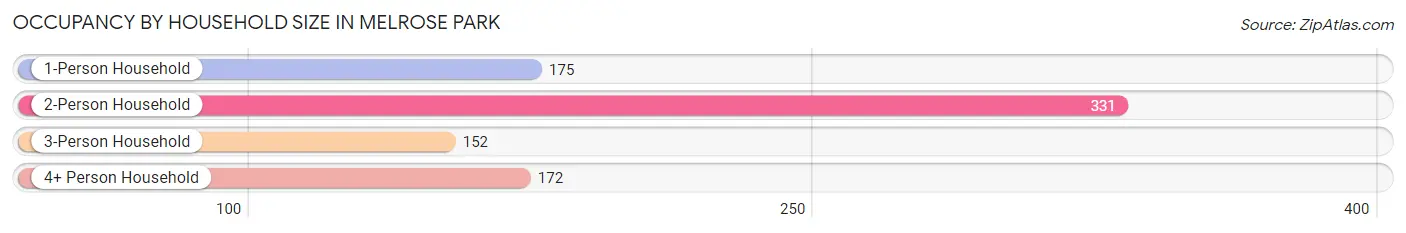
| Household Size | # Housing Units | % Housing Units |
| 1-Person Household | 175 | 21.1% |
| 2-Person Household | 331 | 39.9% |
| 3-Person Household | 152 | 18.3% |
| 4+ Person Household | 172 | 20.7% |
| Total Housing Units | 830 | 100.0% |
Occupancy by Ownership by Household Size in Melrose Park
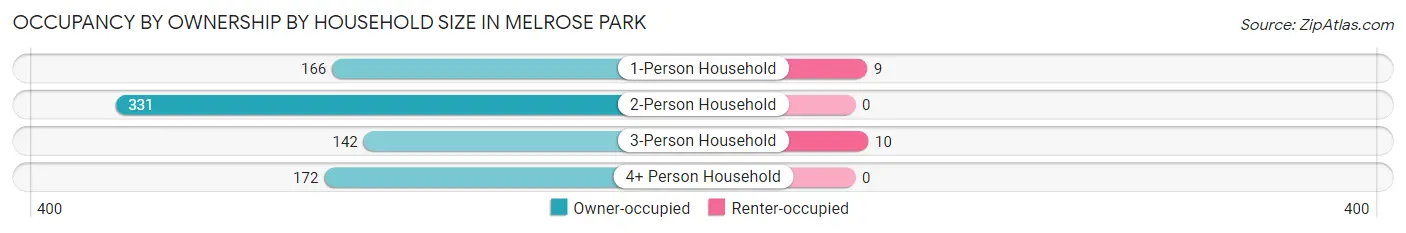
| Household Size | Owner-occupied | Renter-occupied |
| 1-Person Household | 166 (94.9%) | 9 (5.1%) |
| 2-Person Household | 331 (100.0%) | 0 (0.0%) |
| 3-Person Household | 142 (93.4%) | 10 (6.6%) |
| 4+ Person Household | 172 (100.0%) | 0 (0.0%) |
| Total Housing Units | 811 (97.7%) | 19 (2.3%) |
Occupancy by Educational Attainment in Melrose Park
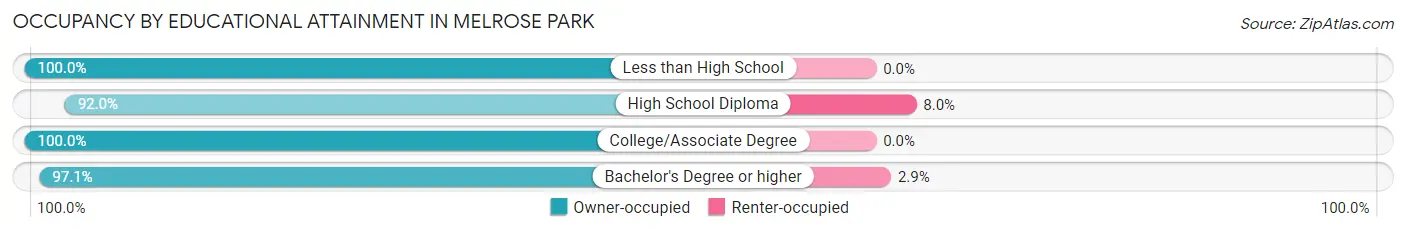
| Household Size | Owner-occupied | Renter-occupied |
| Less than High School | 9 (100.0%) | 0 (0.0%) |
| High School Diploma | 104 (92.0%) | 9 (8.0%) |
| College/Associate Degree | 368 (100.0%) | 0 (0.0%) |
| Bachelor's Degree or higher | 330 (97.1%) | 10 (2.9%) |
Occupancy by Age of Householder in Melrose Park
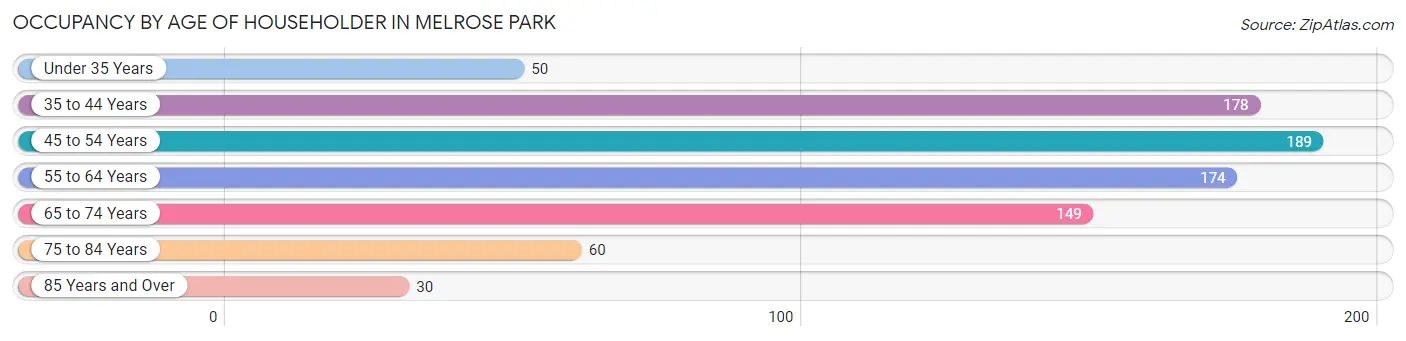
| Age Bracket | # Households | % Households |
| Under 35 Years | 50 | 6.0% |
| 35 to 44 Years | 178 | 21.4% |
| 45 to 54 Years | 189 | 22.8% |
| 55 to 64 Years | 174 | 21.0% |
| 65 to 74 Years | 149 | 17.9% |
| 75 to 84 Years | 60 | 7.2% |
| 85 Years and Over | 30 | 3.6% |
| Total | 830 | 100.0% |
Housing Finances in Melrose Park
Median Income by Occupancy in Melrose Park
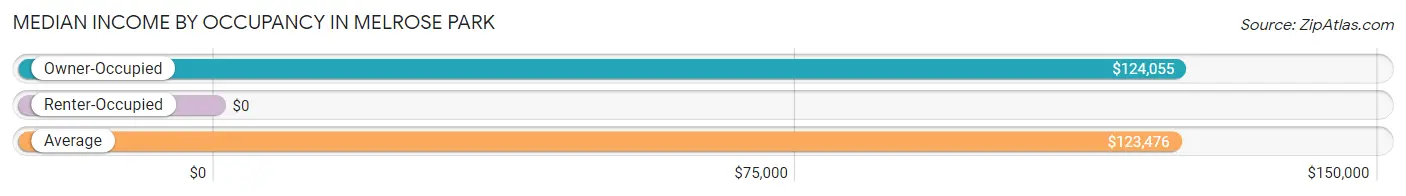
| Occupancy Type | # Households | Median Income |
| Owner-Occupied | 811 (97.7%) | $124,055 |
| Renter-Occupied | 19 (2.3%) | $0 |
| Average | 830 (100.0%) | $123,476 |
Occupancy by Householder Income Bracket in Melrose Park
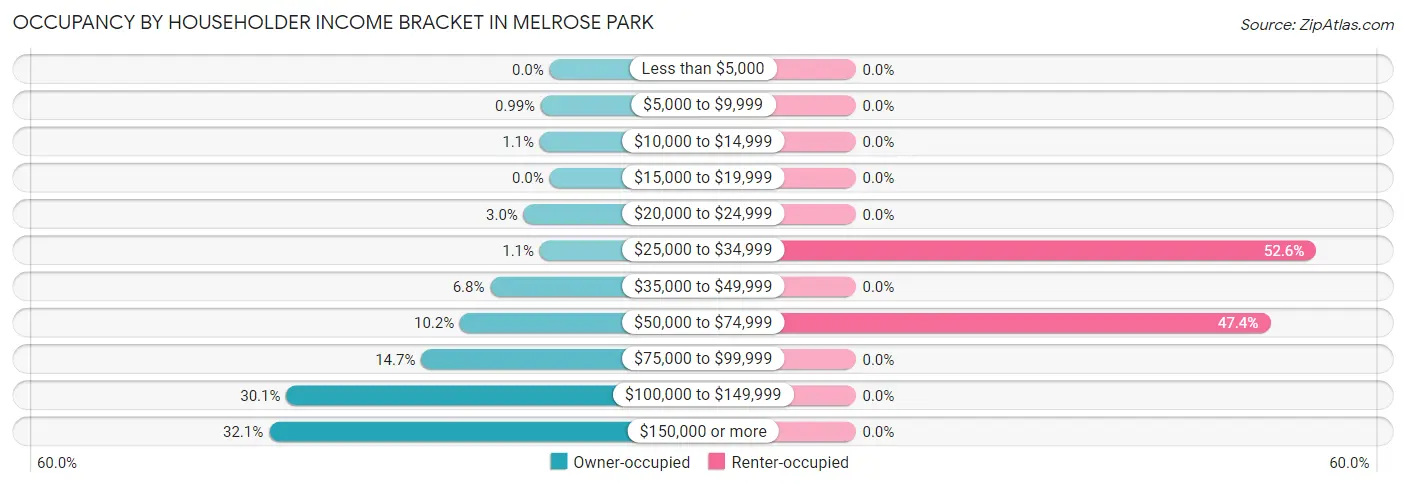
| Income Bracket | Owner-occupied | Renter-occupied |
| Less than $5,000 | 0 (0.0%) | 0 (0.0%) |
| $5,000 to $9,999 | 8 (1.0%) | 0 (0.0%) |
| $10,000 to $14,999 | 9 (1.1%) | 0 (0.0%) |
| $15,000 to $19,999 | 0 (0.0%) | 0 (0.0%) |
| $20,000 to $24,999 | 24 (3.0%) | 0 (0.0%) |
| $25,000 to $34,999 | 9 (1.1%) | 10 (52.6%) |
| $35,000 to $49,999 | 55 (6.8%) | 0 (0.0%) |
| $50,000 to $74,999 | 83 (10.2%) | 9 (47.4%) |
| $75,000 to $99,999 | 119 (14.7%) | 0 (0.0%) |
| $100,000 to $149,999 | 244 (30.1%) | 0 (0.0%) |
| $150,000 or more | 260 (32.1%) | 0 (0.0%) |
| Total | 811 (100.0%) | 19 (100.0%) |
Monthly Housing Cost Tiers in Melrose Park
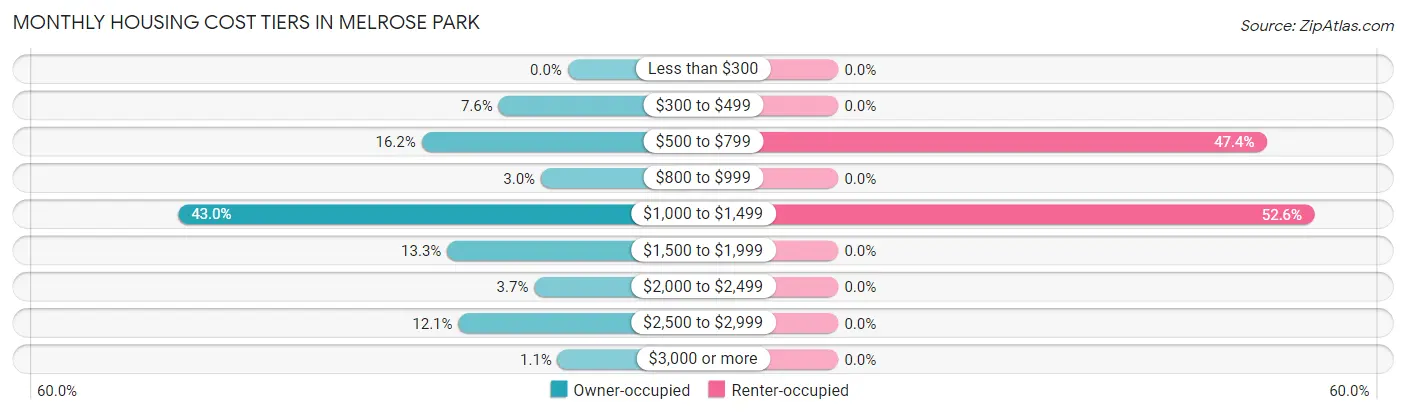
| Monthly Cost | Owner-occupied | Renter-occupied |
| Less than $300 | 0 (0.0%) | 0 (0.0%) |
| $300 to $499 | 62 (7.6%) | 0 (0.0%) |
| $500 to $799 | 131 (16.2%) | 9 (47.4%) |
| $800 to $999 | 24 (3.0%) | 0 (0.0%) |
| $1,000 to $1,499 | 349 (43.0%) | 10 (52.6%) |
| $1,500 to $1,999 | 108 (13.3%) | 0 (0.0%) |
| $2,000 to $2,499 | 30 (3.7%) | 0 (0.0%) |
| $2,500 to $2,999 | 98 (12.1%) | 0 (0.0%) |
| $3,000 or more | 9 (1.1%) | 0 (0.0%) |
| Total | 811 (100.0%) | 19 (100.0%) |
Physical Housing Characteristics in Melrose Park
Housing Structures in Melrose Park
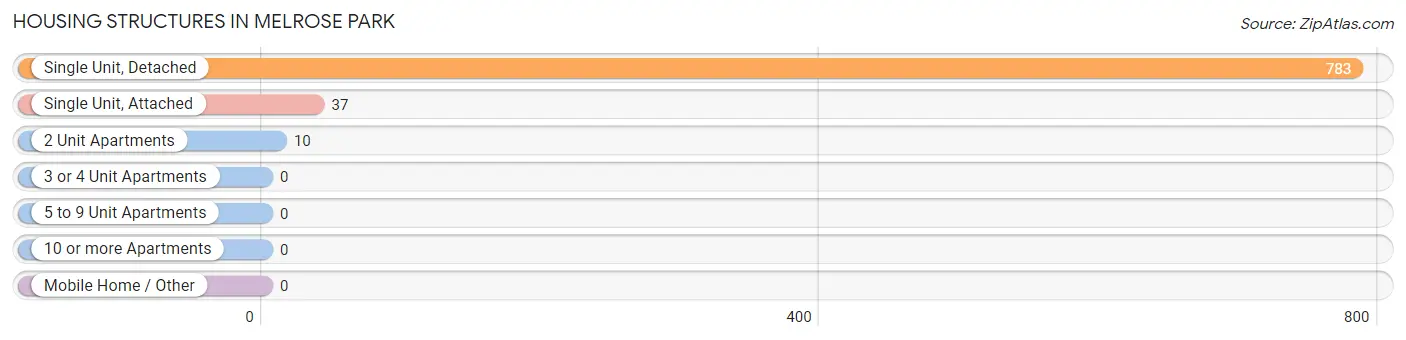
| Structure Type | # Housing Units | % Housing Units |
| Single Unit, Detached | 783 | 94.3% |
| Single Unit, Attached | 37 | 4.5% |
| 2 Unit Apartments | 10 | 1.2% |
| 3 or 4 Unit Apartments | 0 | 0.0% |
| 5 to 9 Unit Apartments | 0 | 0.0% |
| 10 or more Apartments | 0 | 0.0% |
| Mobile Home / Other | 0 | 0.0% |
| Total | 830 | 100.0% |
Housing Structures by Occupancy in Melrose Park
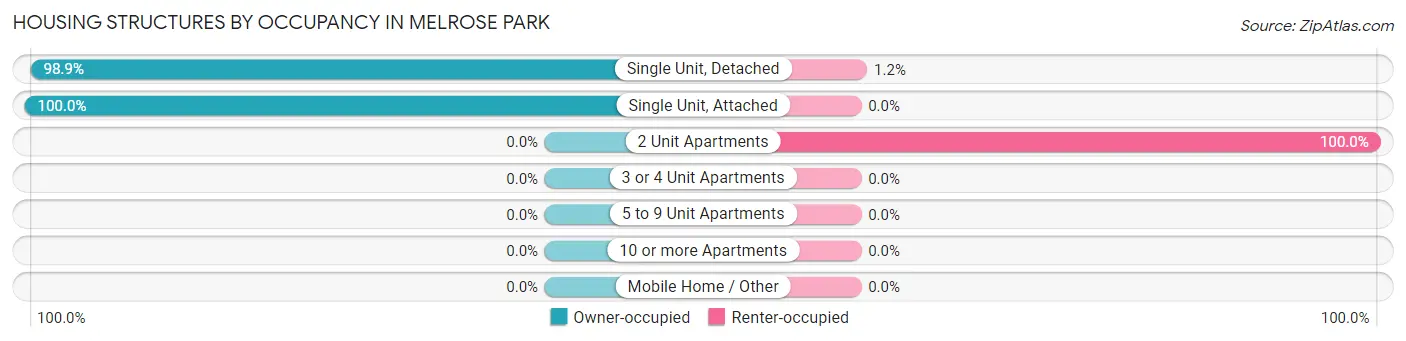
| Structure Type | Owner-occupied | Renter-occupied |
| Single Unit, Detached | 774 (98.9%) | 9 (1.1%) |
| Single Unit, Attached | 37 (100.0%) | 0 (0.0%) |
| 2 Unit Apartments | 0 (0.0%) | 10 (100.0%) |
| 3 or 4 Unit Apartments | 0 (0.0%) | 0 (0.0%) |
| 5 to 9 Unit Apartments | 0 (0.0%) | 0 (0.0%) |
| 10 or more Apartments | 0 (0.0%) | 0 (0.0%) |
| Mobile Home / Other | 0 (0.0%) | 0 (0.0%) |
| Total | 811 (97.7%) | 19 (2.3%) |
Housing Structures by Number of Rooms in Melrose Park
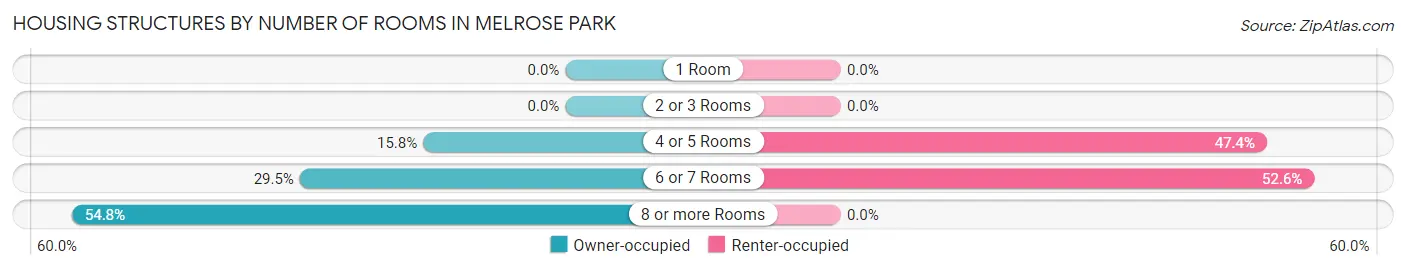
| Number of Rooms | Owner-occupied | Renter-occupied |
| 1 Room | 0 (0.0%) | 0 (0.0%) |
| 2 or 3 Rooms | 0 (0.0%) | 0 (0.0%) |
| 4 or 5 Rooms | 128 (15.8%) | 9 (47.4%) |
| 6 or 7 Rooms | 239 (29.5%) | 10 (52.6%) |
| 8 or more Rooms | 444 (54.7%) | 0 (0.0%) |
| Total | 811 (100.0%) | 19 (100.0%) |
Housing Structure by Heating Type in Melrose Park
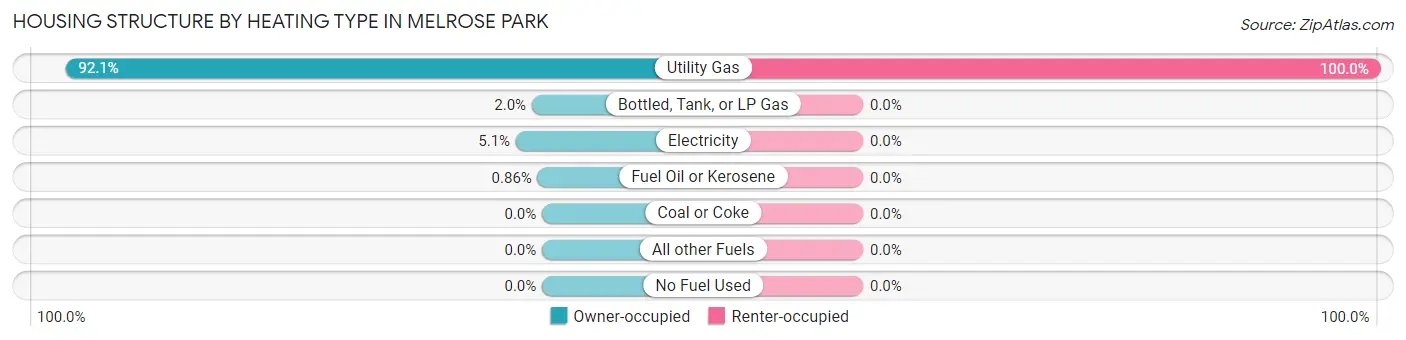
| Heating Type | Owner-occupied | Renter-occupied |
| Utility Gas | 747 (92.1%) | 19 (100.0%) |
| Bottled, Tank, or LP Gas | 16 (2.0%) | 0 (0.0%) |
| Electricity | 41 (5.1%) | 0 (0.0%) |
| Fuel Oil or Kerosene | 7 (0.9%) | 0 (0.0%) |
| Coal or Coke | 0 (0.0%) | 0 (0.0%) |
| All other Fuels | 0 (0.0%) | 0 (0.0%) |
| No Fuel Used | 0 (0.0%) | 0 (0.0%) |
| Total | 811 (100.0%) | 19 (100.0%) |
Household Vehicle Usage in Melrose Park
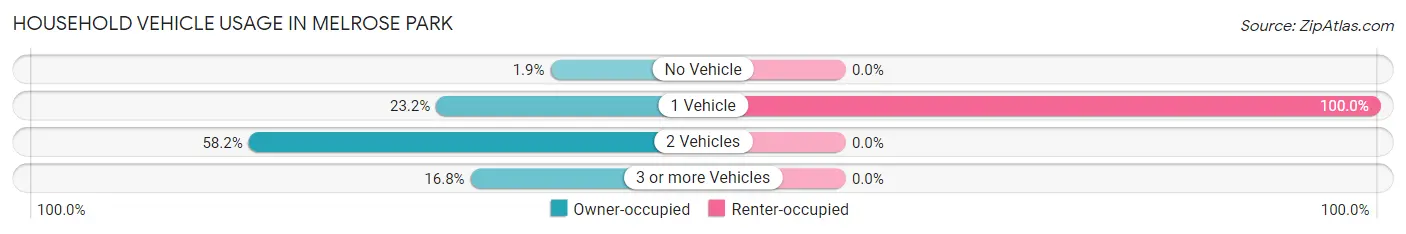
| Vehicles per Household | Owner-occupied | Renter-occupied |
| No Vehicle | 15 (1.8%) | 0 (0.0%) |
| 1 Vehicle | 188 (23.2%) | 19 (100.0%) |
| 2 Vehicles | 472 (58.2%) | 0 (0.0%) |
| 3 or more Vehicles | 136 (16.8%) | 0 (0.0%) |
| Total | 811 (100.0%) | 19 (100.0%) |
Real Estate & Mortgages in Melrose Park
Real Estate and Mortgage Overview in Melrose Park
| Characteristic | Without Mortgage | With Mortgage |
| Housing Units | 355 | 456 |
| Median Property Value | $210,100 | $205,200 |
| Median Household Income | $96,683 | $157 |
| Monthly Housing Costs | $789 | $9 |
| Real Estate Taxes | $4,764 | $17 |
Property Value by Mortgage Status in Melrose Park
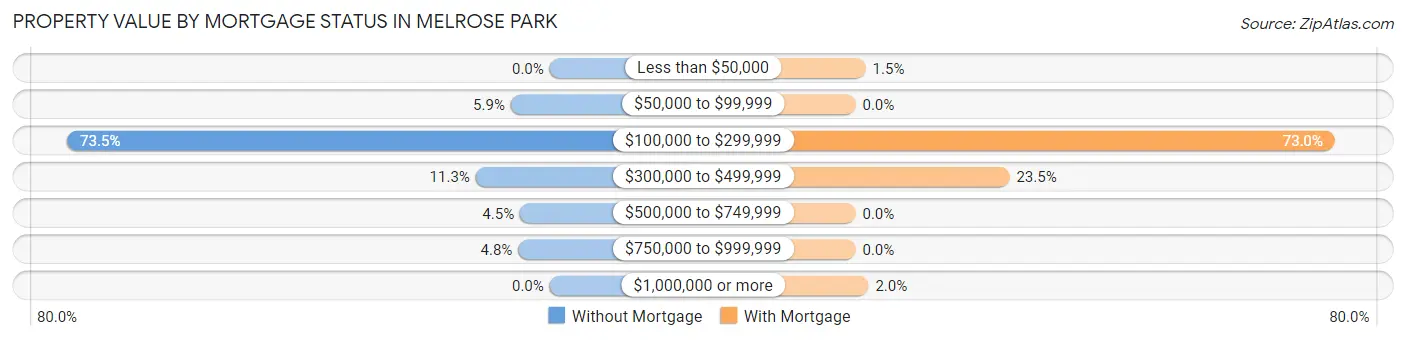
| Property Value | Without Mortgage | With Mortgage |
| Less than $50,000 | 0 (0.0%) | 7 (1.5%) |
| $50,000 to $99,999 | 21 (5.9%) | 0 (0.0%) |
| $100,000 to $299,999 | 261 (73.5%) | 333 (73.0%) |
| $300,000 to $499,999 | 40 (11.3%) | 107 (23.5%) |
| $500,000 to $749,999 | 16 (4.5%) | 0 (0.0%) |
| $750,000 to $999,999 | 17 (4.8%) | 0 (0.0%) |
| $1,000,000 or more | 0 (0.0%) | 9 (2.0%) |
| Total | 355 (100.0%) | 456 (100.0%) |
Household Income by Mortgage Status in Melrose Park
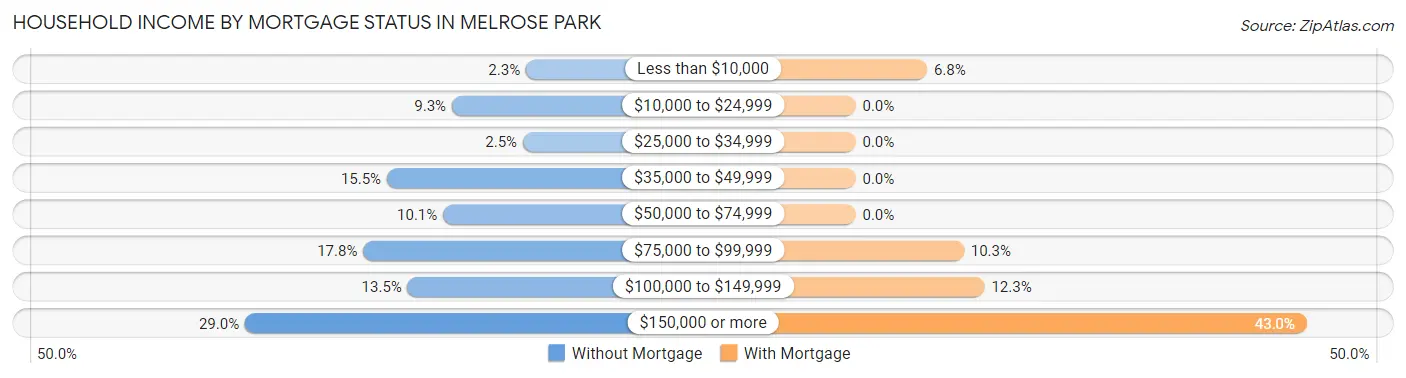
| Household Income | Without Mortgage | With Mortgage |
| Less than $10,000 | 8 (2.2%) | 31 (6.8%) |
| $10,000 to $24,999 | 33 (9.3%) | 0 (0.0%) |
| $25,000 to $34,999 | 9 (2.5%) | 0 (0.0%) |
| $35,000 to $49,999 | 55 (15.5%) | 0 (0.0%) |
| $50,000 to $74,999 | 36 (10.1%) | 0 (0.0%) |
| $75,000 to $99,999 | 63 (17.7%) | 47 (10.3%) |
| $100,000 to $149,999 | 48 (13.5%) | 56 (12.3%) |
| $150,000 or more | 103 (29.0%) | 196 (43.0%) |
| Total | 355 (100.0%) | 456 (100.0%) |
Property Value to Household Income Ratio in Melrose Park
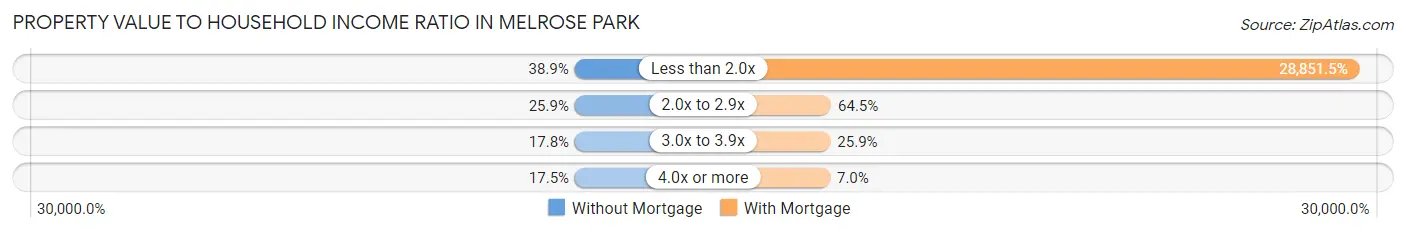
| Value-to-Income Ratio | Without Mortgage | With Mortgage |
| Less than 2.0x | 138 (38.9%) | 131,563 (28,851.5%) |
| 2.0x to 2.9x | 92 (25.9%) | 294 (64.5%) |
| 3.0x to 3.9x | 63 (17.7%) | 118 (25.9%) |
| 4.0x or more | 62 (17.5%) | 32 (7.0%) |
| Total | 355 (100.0%) | 456 (100.0%) |
Real Estate Taxes by Mortgage Status in Melrose Park
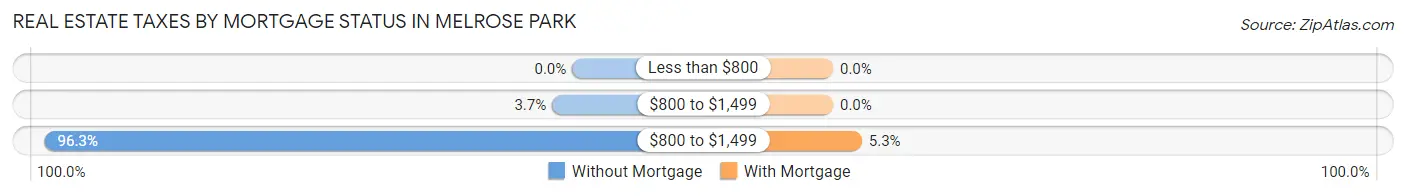
| Property Taxes | Without Mortgage | With Mortgage |
| Less than $800 | 0 (0.0%) | 0 (0.0%) |
| $800 to $1,499 | 13 (3.7%) | 0 (0.0%) |
| $800 to $1,499 | 342 (96.3%) | 24 (5.3%) |
| Total | 355 (100.0%) | 456 (100.0%) |
Health & Disability in Melrose Park
Health Insurance Coverage by Age in Melrose Park
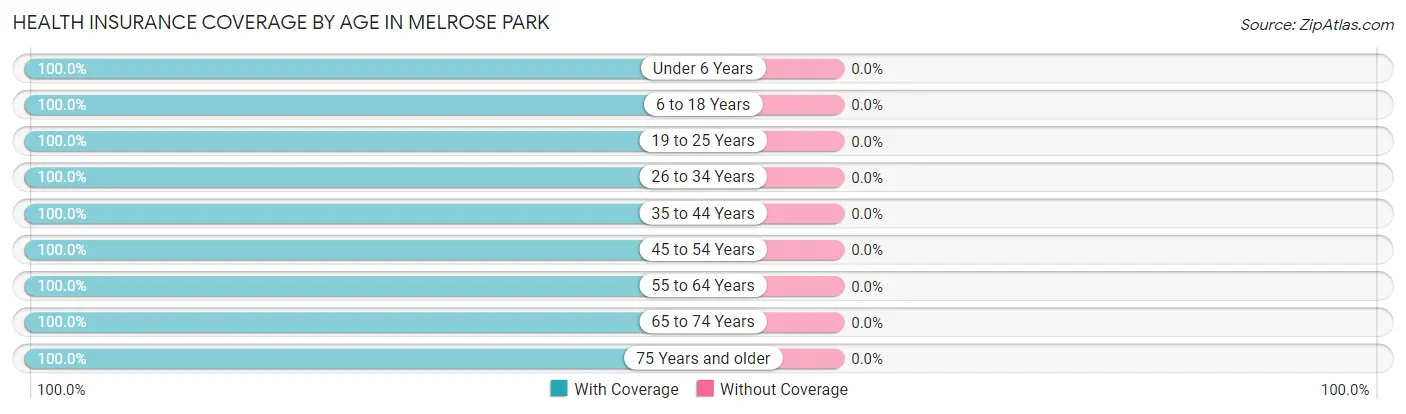
| Age Bracket | With Coverage | Without Coverage |
| Under 6 Years | 112 (100.0%) | 0 (0.0%) |
| 6 to 18 Years | 357 (100.0%) | 0 (0.0%) |
| 19 to 25 Years | 126 (100.0%) | 0 (0.0%) |
| 26 to 34 Years | 127 (100.0%) | 0 (0.0%) |
| 35 to 44 Years | 328 (100.0%) | 0 (0.0%) |
| 45 to 54 Years | 243 (100.0%) | 0 (0.0%) |
| 55 to 64 Years | 325 (100.0%) | 0 (0.0%) |
| 65 to 74 Years | 227 (100.0%) | 0 (0.0%) |
| 75 Years and older | 152 (100.0%) | 0 (0.0%) |
| Total | 1,997 (100.0%) | 0 (0.0%) |
Health Insurance Coverage by Citizenship Status in Melrose Park

| Citizenship Status | With Coverage | Without Coverage |
| Native Born | 112 (100.0%) | 0 (0.0%) |
| Foreign Born, Citizen | 357 (100.0%) | 0 (0.0%) |
| Foreign Born, not a Citizen | 126 (100.0%) | 0 (0.0%) |
Health Insurance Coverage by Household Income in Melrose Park
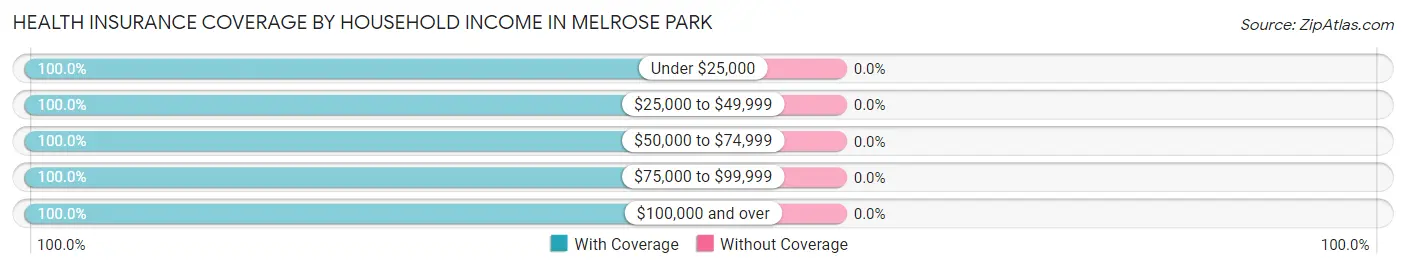
| Household Income | With Coverage | Without Coverage |
| Under $25,000 | 48 (100.0%) | 0 (0.0%) |
| $25,000 to $49,999 | 119 (100.0%) | 0 (0.0%) |
| $50,000 to $74,999 | 127 (100.0%) | 0 (0.0%) |
| $75,000 to $99,999 | 249 (100.0%) | 0 (0.0%) |
| $100,000 and over | 1,441 (100.0%) | 0 (0.0%) |
Public vs Private Health Insurance Coverage by Age in Melrose Park
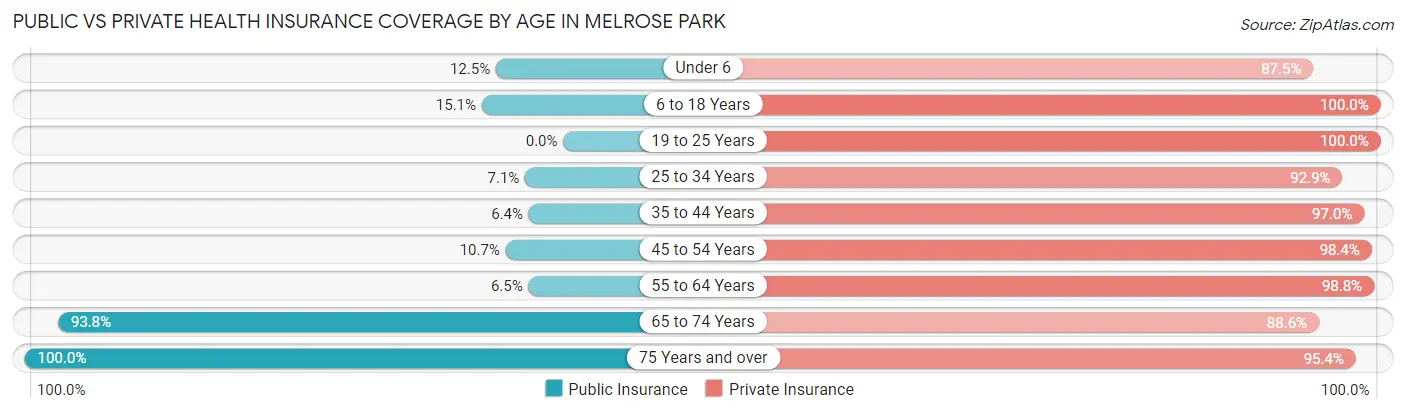
| Age Bracket | Public Insurance | Private Insurance |
| Under 6 | 14 (12.5%) | 98 (87.5%) |
| 6 to 18 Years | 54 (15.1%) | 357 (100.0%) |
| 19 to 25 Years | 0 (0.0%) | 126 (100.0%) |
| 25 to 34 Years | 9 (7.1%) | 118 (92.9%) |
| 35 to 44 Years | 21 (6.4%) | 318 (97.0%) |
| 45 to 54 Years | 26 (10.7%) | 239 (98.4%) |
| 55 to 64 Years | 21 (6.5%) | 321 (98.8%) |
| 65 to 74 Years | 213 (93.8%) | 201 (88.5%) |
| 75 Years and over | 152 (100.0%) | 145 (95.4%) |
| Total | 510 (25.5%) | 1,923 (96.3%) |
Disability Status by Sex by Age in Melrose Park
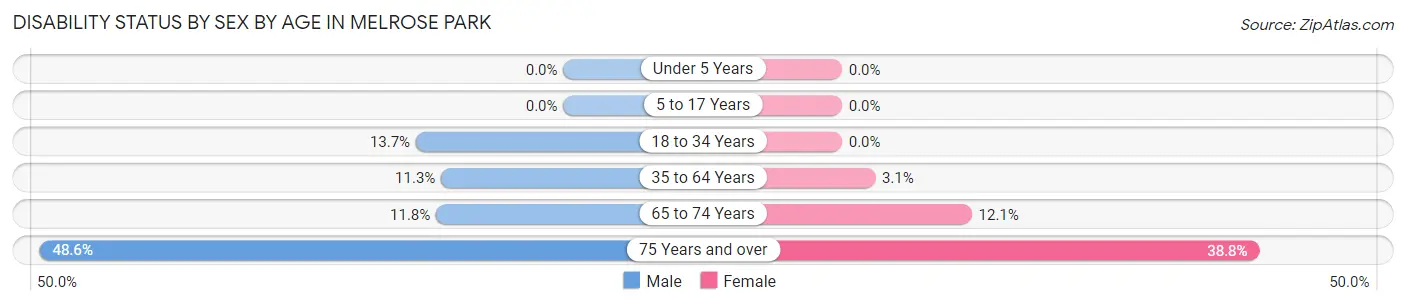
| Age Bracket | Male | Female |
| Under 5 Years | 0 (0.0%) | 0 (0.0%) |
| 5 to 17 Years | 0 (0.0%) | 0 (0.0%) |
| 18 to 34 Years | 13 (13.7%) | 0 (0.0%) |
| 35 to 64 Years | 50 (11.3%) | 14 (3.1%) |
| 65 to 74 Years | 17 (11.8%) | 10 (12.0%) |
| 75 Years and over | 35 (48.6%) | 31 (38.8%) |
Disability Class by Sex by Age in Melrose Park
Disability Class: Hearing Difficulty
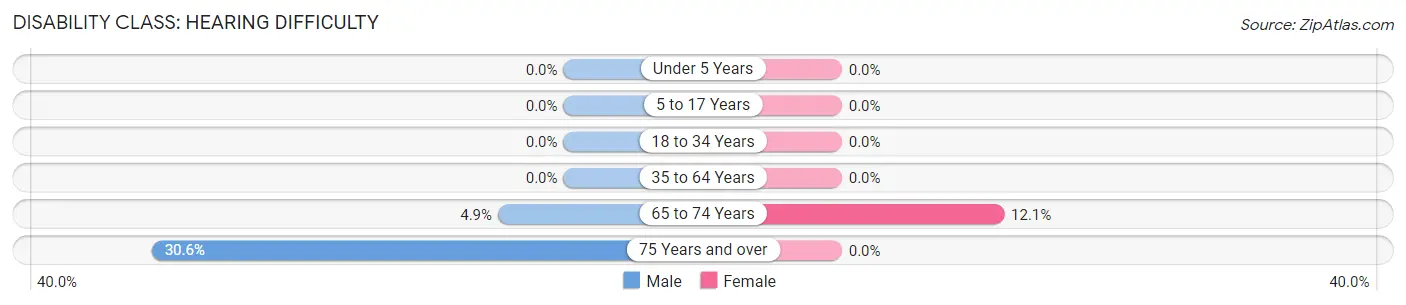
| Age Bracket | Male | Female |
| Under 5 Years | 0 (0.0%) | 0 (0.0%) |
| 5 to 17 Years | 0 (0.0%) | 0 (0.0%) |
| 18 to 34 Years | 0 (0.0%) | 0 (0.0%) |
| 35 to 64 Years | 0 (0.0%) | 0 (0.0%) |
| 65 to 74 Years | 7 (4.9%) | 10 (12.0%) |
| 75 Years and over | 22 (30.6%) | 0 (0.0%) |
Disability Class: Vision Difficulty
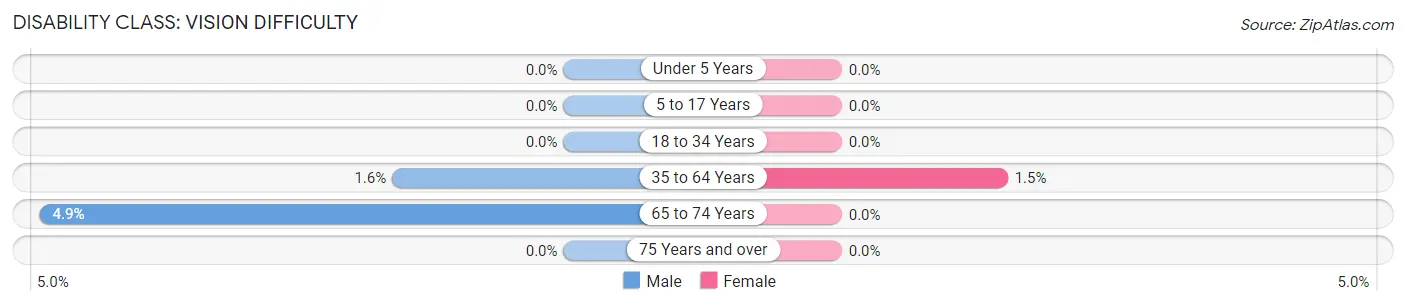
| Age Bracket | Male | Female |
| Under 5 Years | 0 (0.0%) | 0 (0.0%) |
| 5 to 17 Years | 0 (0.0%) | 0 (0.0%) |
| 18 to 34 Years | 0 (0.0%) | 0 (0.0%) |
| 35 to 64 Years | 7 (1.6%) | 7 (1.5%) |
| 65 to 74 Years | 7 (4.9%) | 0 (0.0%) |
| 75 Years and over | 0 (0.0%) | 0 (0.0%) |
Disability Class: Cognitive Difficulty
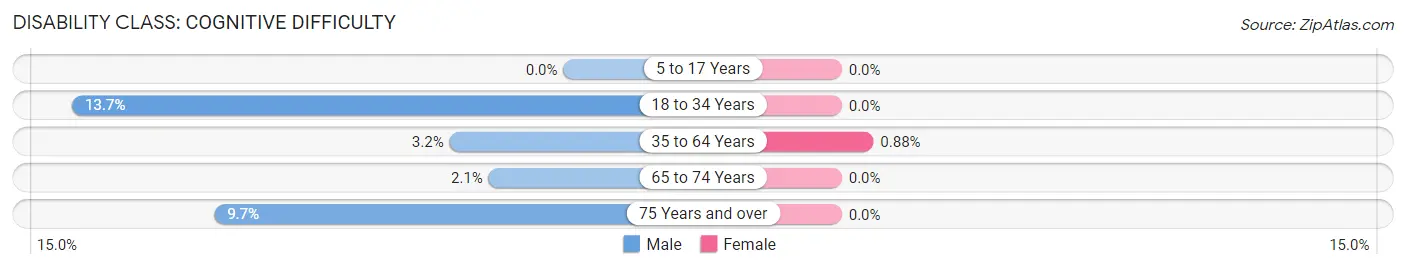
| Age Bracket | Male | Female |
| 5 to 17 Years | 0 (0.0%) | 0 (0.0%) |
| 18 to 34 Years | 13 (13.7%) | 0 (0.0%) |
| 35 to 64 Years | 14 (3.2%) | 4 (0.9%) |
| 65 to 74 Years | 3 (2.1%) | 0 (0.0%) |
| 75 Years and over | 7 (9.7%) | 0 (0.0%) |
Disability Class: Ambulatory Difficulty
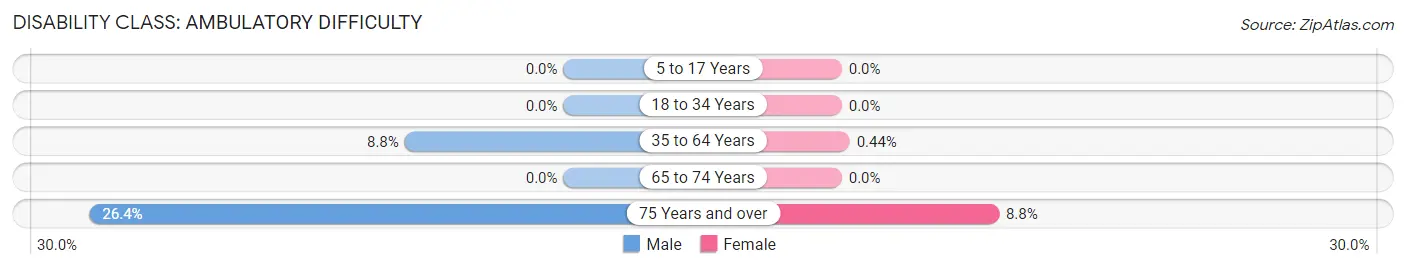
| Age Bracket | Male | Female |
| 5 to 17 Years | 0 (0.0%) | 0 (0.0%) |
| 18 to 34 Years | 0 (0.0%) | 0 (0.0%) |
| 35 to 64 Years | 39 (8.8%) | 2 (0.4%) |
| 65 to 74 Years | 0 (0.0%) | 0 (0.0%) |
| 75 Years and over | 19 (26.4%) | 7 (8.7%) |
Disability Class: Self-Care Difficulty

| Age Bracket | Male | Female |
| 5 to 17 Years | 0 (0.0%) | 0 (0.0%) |
| 18 to 34 Years | 2 (2.1%) | 0 (0.0%) |
| 35 to 64 Years | 4 (0.9%) | 4 (0.9%) |
| 65 to 74 Years | 0 (0.0%) | 0 (0.0%) |
| 75 Years and over | 7 (9.7%) | 0 (0.0%) |
Technology Access in Melrose Park
Computing Device Access in Melrose Park
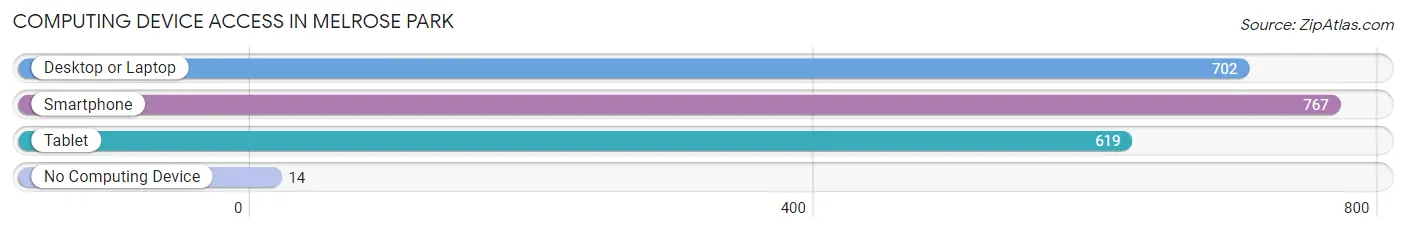
| Device Type | # Households | % Households |
| Desktop or Laptop | 702 | 84.6% |
| Smartphone | 767 | 92.4% |
| Tablet | 619 | 74.6% |
| No Computing Device | 14 | 1.7% |
| Total | 830 | 100.0% |
Internet Access in Melrose Park
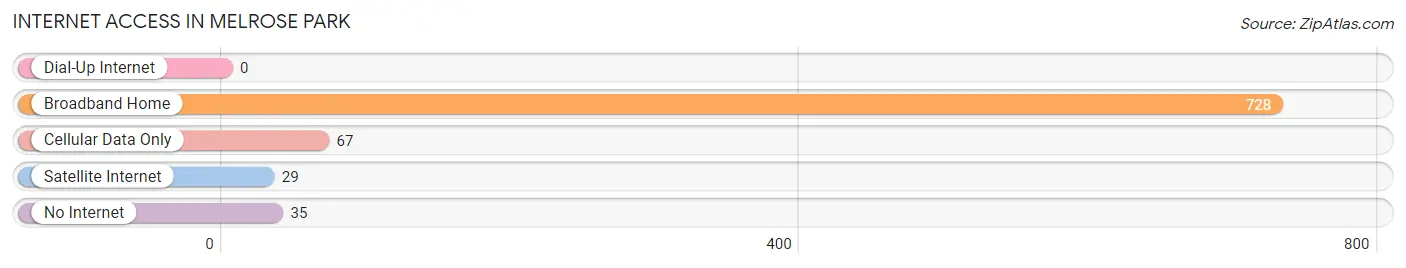
| Internet Type | # Households | % Households |
| Dial-Up Internet | 0 | 0.0% |
| Broadband Home | 728 | 87.7% |
| Cellular Data Only | 67 | 8.1% |
| Satellite Internet | 29 | 3.5% |
| No Internet | 35 | 4.2% |
| Total | 830 | 100.0% |
Melrose Park Summary
Melrose Park is a village located in Cook County, Illinois, United States. It is a suburb of Chicago, located approximately 13 miles west of the city's downtown. The population was estimated to be 25,945 in 2019.
History
The area that is now Melrose Park was first settled in the 1830s by German and Irish immigrants. The village was originally known as "Grossdale" and was incorporated in 1882. The name was changed to Melrose Park in 1887, after the Melrose House, a hotel built by the village's first mayor, John R. Gross.
The village experienced rapid growth in the early 20th century, due in part to the construction of the Chicago, Milwaukee, St. Paul and Pacific Railroad (now the Union Pacific Railroad) in 1906. The railroad provided easy access to Chicago and helped to attract new businesses and residents to the area.
In the 1920s, Melrose Park was home to a large Italian-American population. The village was also home to a large number of factories, including the Western Electric Company, which employed many of the village's residents.
Geography
Melrose Park is located in northeastern Illinois, approximately 13 miles west of downtown Chicago. It is bordered by the villages of River Grove to the north, Franklin Park to the east, Northlake to the south, and Stone Park to the west. The village covers an area of 4.2 square miles and is located in Cook County.
The village is situated on the Des Plaines River, which flows through the center of the village. The river is a major source of recreation for the village, with several parks and trails located along its banks.
Economy
Melrose Park is home to a diverse economy, with a variety of businesses and industries located in the village. The largest employers in the village are the Western Electric Company, the United Parcel Service, and the Melrose Park Post Office.
The village is also home to a number of retail stores, restaurants, and other businesses. The village is home to the Northlake Mall, which is one of the largest shopping centers in the Chicago area.
Demographics
As of the 2010 census, the population of Melrose Park was 25,411. The racial makeup of the village was 64.3% White, 19.2% African American, 0.4% Native American, 4.2% Asian, and 11.9% from other races. Hispanic or Latino of any race were 33.2% of the population.
The median household income in Melrose Park was $45,945 in 2019, and the median home value was $179,000. The village has a poverty rate of 16.3%, and the unemployment rate was 5.2% in 2019.
Conclusion
Melrose Park is a village located in Cook County, Illinois, approximately 13 miles west of downtown Chicago. The village has a population of 25,945 and is home to a diverse economy, with a variety of businesses and industries located in the village. The village is also home to a large Italian-American population, and the median household income in Melrose Park was $45,945 in 2019. The village has a poverty rate of 16.3%, and the unemployment rate was 5.2% in 2019.
Common Questions
What is Per Capita Income in Melrose Park?
Per Capita income in Melrose Park is $60,630.
What is the Median Family Income in Melrose Park?
Median Family Income in Melrose Park is $131,875.
What is the Median Household income in Melrose Park?
Median Household Income in Melrose Park is $123,476.
What is Income or Wage Gap in Melrose Park?
Income or Wage Gap in Melrose Park is 26.8%.
Women in Melrose Park earn 73.2 cents for every dollar earned by a man.
What is Inequality or Gini Index in Melrose Park?
Inequality or Gini Index in Melrose Park is 0.41.
What is the Total Population of Melrose Park?
Total Population of Melrose Park is 1,997.
What is the Total Male Population of Melrose Park?
Total Male Population of Melrose Park is 921.
What is the Total Female Population of Melrose Park?
Total Female Population of Melrose Park is 1,076.
What is the Ratio of Males per 100 Females in Melrose Park?
There are 85.59 Males per 100 Females in Melrose Park.
What is the Ratio of Females per 100 Males in Melrose Park?
There are 116.83 Females per 100 Males in Melrose Park.
What is the Median Population Age in Melrose Park?
Median Population Age in Melrose Park is 43.2 Years.
What is the Average Family Size in Melrose Park
Average Family Size in Melrose Park is 2.8 People.
What is the Average Household Size in Melrose Park
Average Household Size in Melrose Park is 2.4 People.
How Large is the Labor Force in Melrose Park?
There are 1,145 People in the Labor Forcein in Melrose Park.
What is the Percentage of People in the Labor Force in Melrose Park?
71.1% of People are in the Labor Force in Melrose Park.
What is the Unemployment Rate in Melrose Park?
Unemployment Rate in Melrose Park is 2.4%.