Mayville, NY Map & Demographics
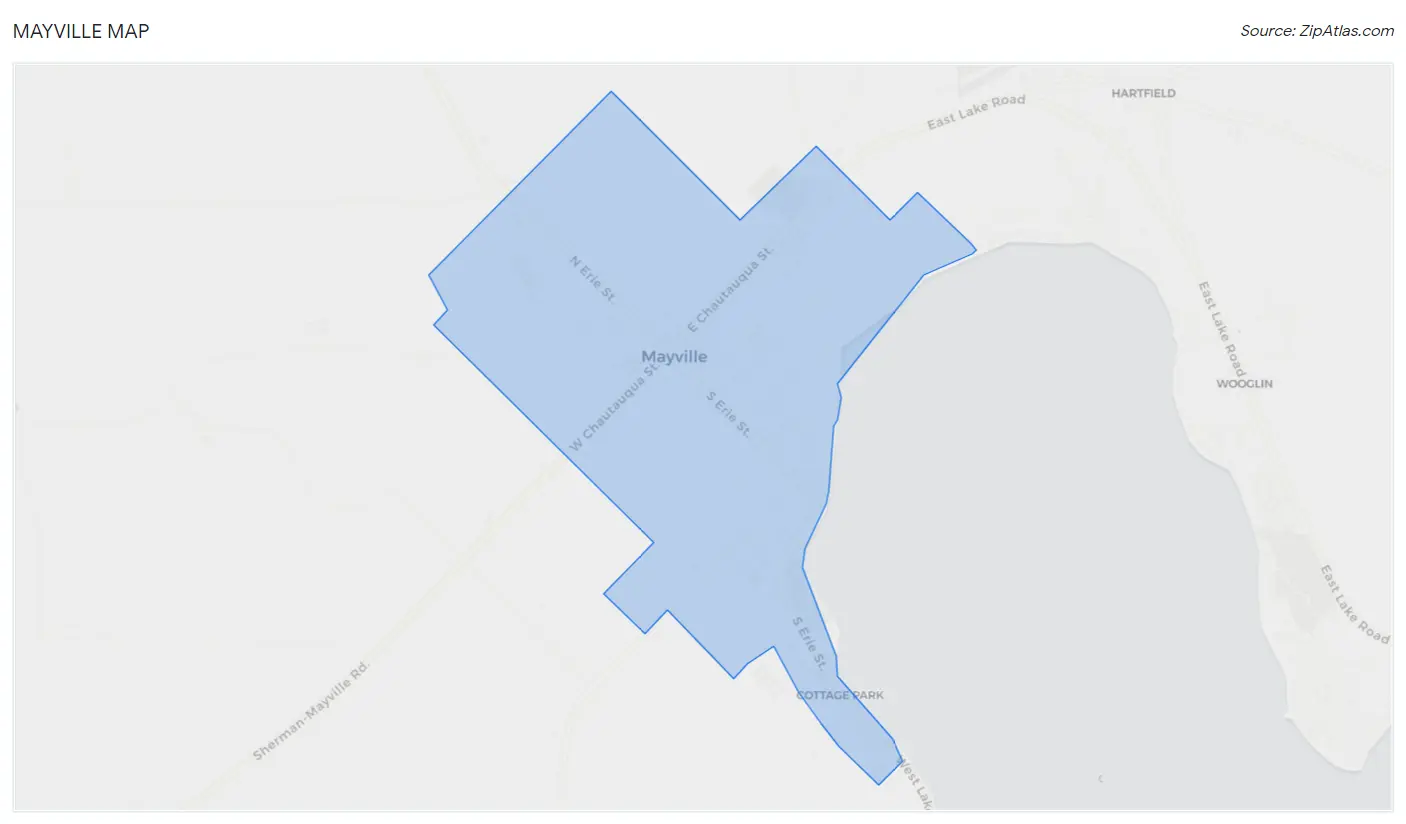
Mayville Map
Mayville Overview
$33,605
PER CAPITA INCOME
$95,726
AVG FAMILY INCOME
$70,250
AVG HOUSEHOLD INCOME
63.2%
WAGE / INCOME GAP [ % ]
36.8¢/ $1
WAGE / INCOME GAP [ $ ]
0.41
INEQUALITY / GINI INDEX
1,355
TOTAL POPULATION
725
MALE POPULATION
630
FEMALE POPULATION
115.08
MALES / 100 FEMALES
86.90
FEMALES / 100 MALES
48.7
MEDIAN AGE
2.5
AVG FAMILY SIZE
2.0
AVG HOUSEHOLD SIZE
521
LABOR FORCE [ PEOPLE ]
44.1%
PERCENT IN LABOR FORCE
7.7%
UNEMPLOYMENT RATE
Mayville Zip Codes
Mayville Area Codes
Income in Mayville
Income Overview in Mayville
Per Capita Income in Mayville is $33,605, while median incomes of families and households are $95,726 and $70,250 respectively.
| Characteristic | Number | Measure |
| Per Capita Income | 1,355 | $33,605 |
| Median Family Income | 367 | $95,726 |
| Mean Family Income | 367 | $97,682 |
| Median Household Income | 583 | $70,250 |
| Mean Household Income | 583 | $76,608 |
| Income Deficit | 367 | $0 |
| Wage / Income Gap (%) | 1,355 | 63.24% |
| Wage / Income Gap ($) | 1,355 | 36.76¢ per $1 |
| Gini / Inequality Index | 1,355 | 0.41 |
Earnings by Sex in Mayville
Average Earnings in Mayville are $33,100, $53,269 for men and $19,583 for women, a difference of 63.2%.
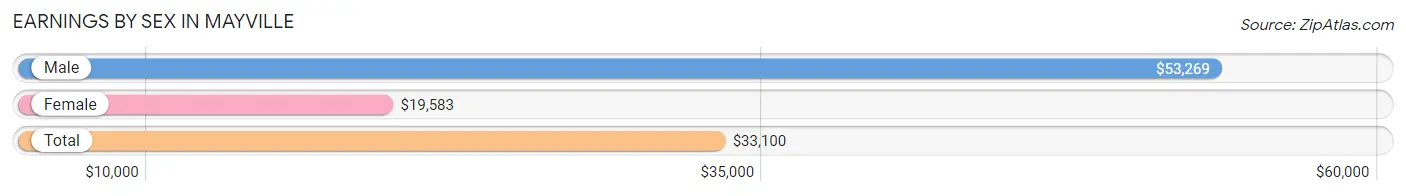
| Sex | Number | Average Earnings |
| Male | 386 (58.0%) | $53,269 |
| Female | 280 (42.0%) | $19,583 |
| Total | 666 (100.0%) | $33,100 |
Earnings by Sex by Income Bracket in Mayville
The most common earnings brackets in Mayville are $75,000 to $99,999 for men (90 | 23.3%) and $2,499 or less for women (68 | 24.3%).
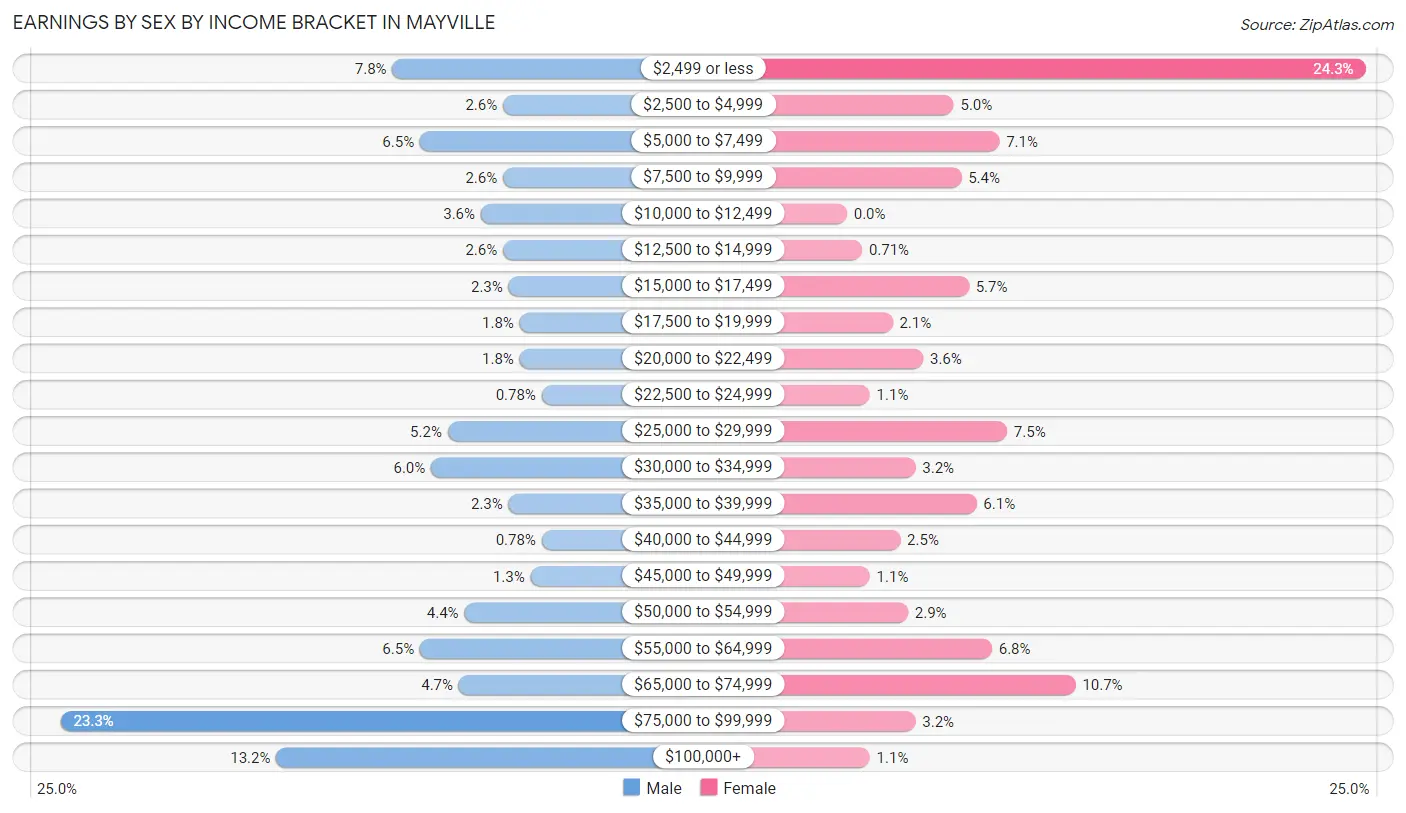
| Income | Male | Female |
| $2,499 or less | 30 (7.8%) | 68 (24.3%) |
| $2,500 to $4,999 | 10 (2.6%) | 14 (5.0%) |
| $5,000 to $7,499 | 25 (6.5%) | 20 (7.1%) |
| $7,500 to $9,999 | 10 (2.6%) | 15 (5.4%) |
| $10,000 to $12,499 | 14 (3.6%) | 0 (0.0%) |
| $12,500 to $14,999 | 10 (2.6%) | 2 (0.7%) |
| $15,000 to $17,499 | 9 (2.3%) | 16 (5.7%) |
| $17,500 to $19,999 | 7 (1.8%) | 6 (2.1%) |
| $20,000 to $22,499 | 7 (1.8%) | 10 (3.6%) |
| $22,500 to $24,999 | 3 (0.8%) | 3 (1.1%) |
| $25,000 to $29,999 | 20 (5.2%) | 21 (7.5%) |
| $30,000 to $34,999 | 23 (6.0%) | 9 (3.2%) |
| $35,000 to $39,999 | 9 (2.3%) | 17 (6.1%) |
| $40,000 to $44,999 | 3 (0.8%) | 7 (2.5%) |
| $45,000 to $49,999 | 5 (1.3%) | 3 (1.1%) |
| $50,000 to $54,999 | 17 (4.4%) | 8 (2.9%) |
| $55,000 to $64,999 | 25 (6.5%) | 19 (6.8%) |
| $65,000 to $74,999 | 18 (4.7%) | 30 (10.7%) |
| $75,000 to $99,999 | 90 (23.3%) | 9 (3.2%) |
| $100,000+ | 51 (13.2%) | 3 (1.1%) |
| Total | 386 (100.0%) | 280 (100.0%) |
Earnings by Sex by Educational Attainment in Mayville
Average earnings in Mayville are $57,417 for men and $24,583 for women, a difference of 57.2%. Men with an educational attainment of bachelor's degree enjoy the highest average annual earnings of $86,018, while those with less than high school education earn the least with $28,295. Women with an educational attainment of graduate degree earn the most with the average annual earnings of $56,875, while those with high school diploma education have the smallest earnings of $21,750.
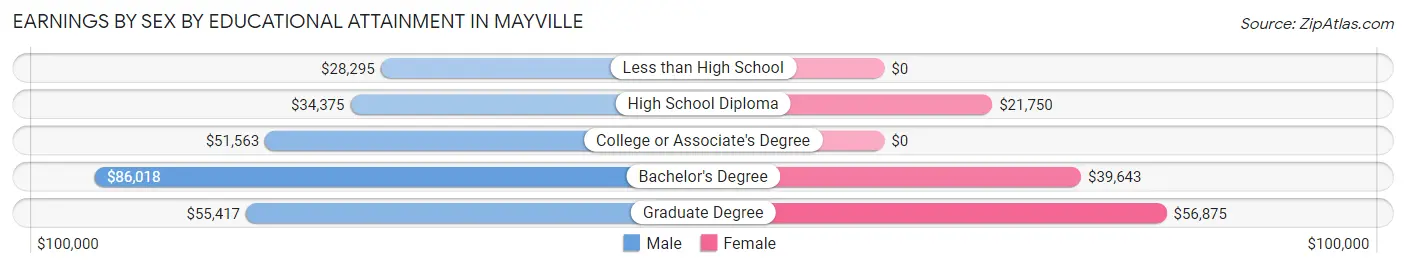
| Educational Attainment | Male Income | Female Income |
| Less than High School | $28,295 | $0 |
| High School Diploma | $34,375 | $21,750 |
| College or Associate's Degree | $51,563 | $0 |
| Bachelor's Degree | $86,018 | $39,643 |
| Graduate Degree | $55,417 | $56,875 |
| Total | $57,417 | $24,583 |
Family Income in Mayville
Family Income Brackets in Mayville
According to the Mayville family income data, there are 108 families falling into the $75,000 to $99,999 income range, which is the most common income bracket and makes up 29.4% of all families.
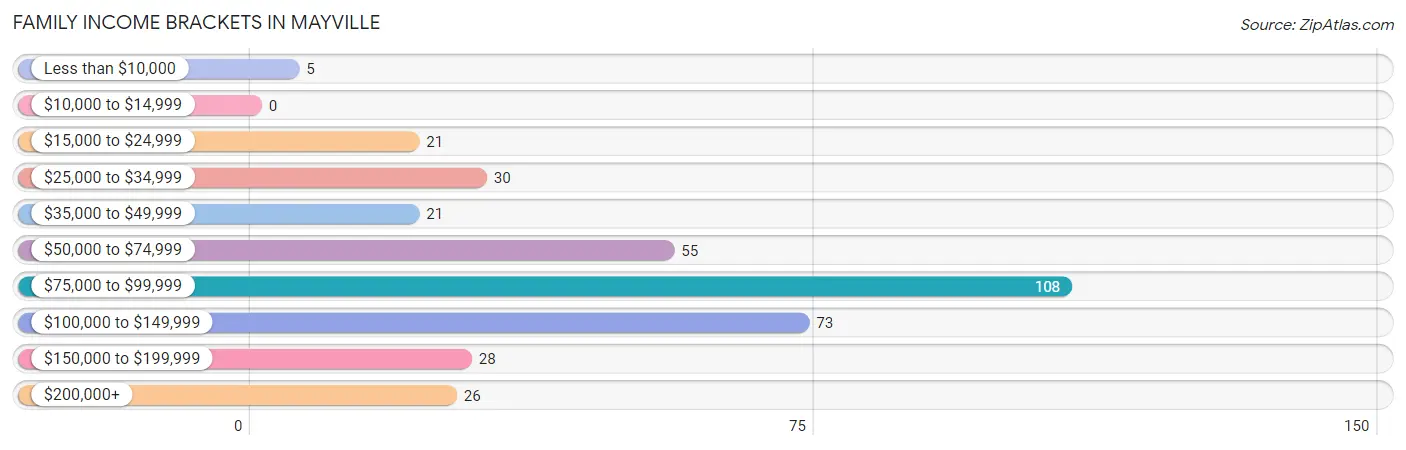
| Income Bracket | # Families | % Families |
| Less than $10,000 | 5 | 1.4% |
| $10,000 to $14,999 | 0 | 0.0% |
| $15,000 to $24,999 | 21 | 5.7% |
| $25,000 to $34,999 | 30 | 8.2% |
| $35,000 to $49,999 | 21 | 5.7% |
| $50,000 to $74,999 | 55 | 15.0% |
| $75,000 to $99,999 | 108 | 29.4% |
| $100,000 to $149,999 | 73 | 19.9% |
| $150,000 to $199,999 | 28 | 7.6% |
| $200,000+ | 26 | 7.1% |
Family Income by Famaliy Size in Mayville
5-person families (12 | 3.3%) account for the highest median family income in Mayville with $135,833 per family, while 2-person families (245 | 66.8%) have the highest median income of $48,190 per family member.
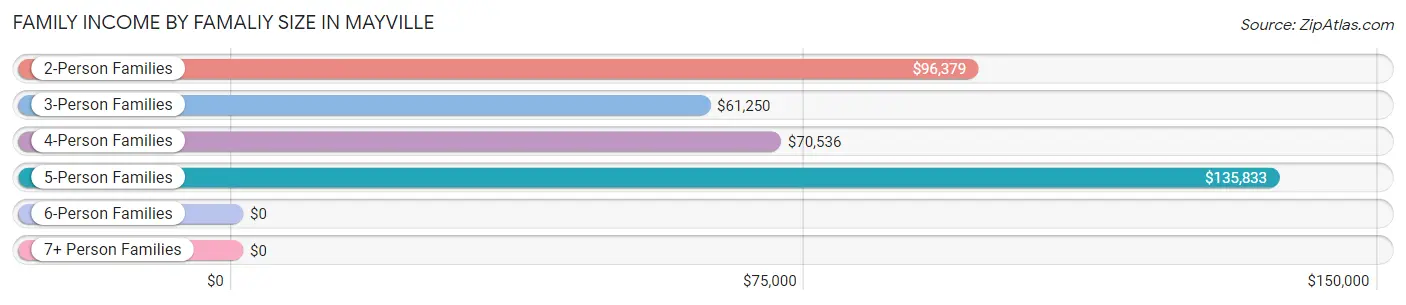
| Income Bracket | # Families | Median Income |
| 2-Person Families | 245 (66.8%) | $96,379 |
| 3-Person Families | 58 (15.8%) | $61,250 |
| 4-Person Families | 52 (14.2%) | $70,536 |
| 5-Person Families | 12 (3.3%) | $135,833 |
| 6-Person Families | 0 (0.0%) | $0 |
| 7+ Person Families | 0 (0.0%) | $0 |
| Total | 367 (100.0%) | $95,726 |
Family Income by Number of Earners in Mayville
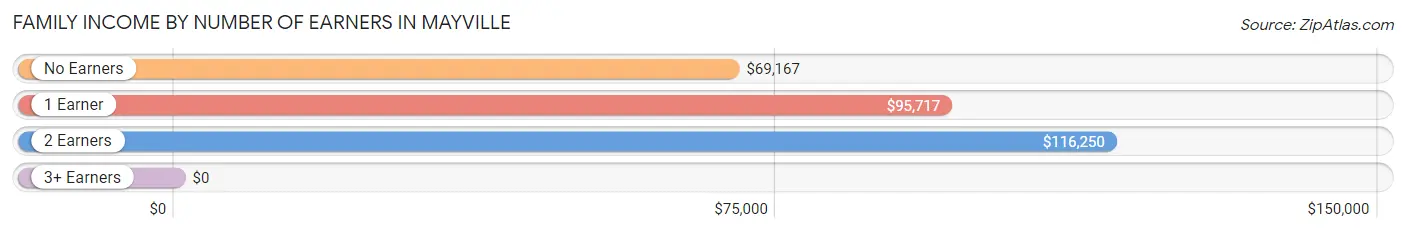
| Number of Earners | # Families | Median Income |
| No Earners | 82 (22.3%) | $69,167 |
| 1 Earner | 153 (41.7%) | $95,717 |
| 2 Earners | 113 (30.8%) | $116,250 |
| 3+ Earners | 19 (5.2%) | $0 |
| Total | 367 (100.0%) | $95,726 |
Household Income in Mayville
Household Income Brackets in Mayville
With 138 households falling in the category, the $75,000 to $99,999 income range is the most frequent in Mayville, accounting for 23.7% of all households. In contrast, only 28 households (4.8%) fall into the $150,000 to $199,999 income bracket, making it the least populous group.
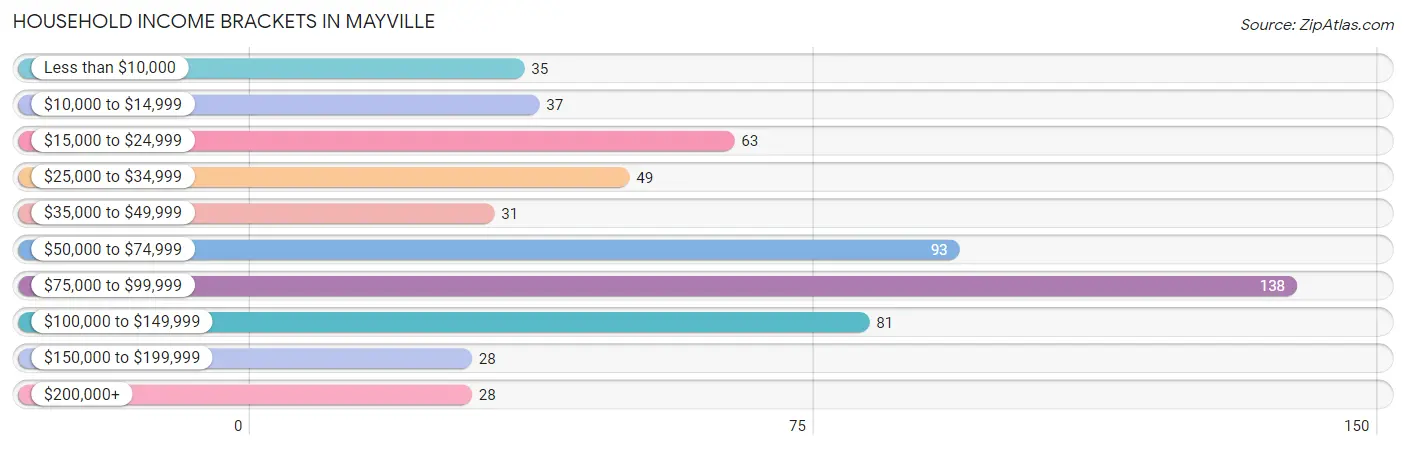
| Income Bracket | # Households | % Households |
| Less than $10,000 | 35 | 6.0% |
| $10,000 to $14,999 | 37 | 6.3% |
| $15,000 to $24,999 | 63 | 10.8% |
| $25,000 to $34,999 | 49 | 8.4% |
| $35,000 to $49,999 | 31 | 5.3% |
| $50,000 to $74,999 | 93 | 16.0% |
| $75,000 to $99,999 | 138 | 23.7% |
| $100,000 to $149,999 | 81 | 13.9% |
| $150,000 to $199,999 | 28 | 4.8% |
| $200,000+ | 28 | 4.8% |
Household Income by Householder Age in Mayville
The median household income in Mayville is $70,250, with the highest median household income of $85,694 found in the 45 to 64 years age bracket for the primary householder. A total of 277 households (47.5%) fall into this category.
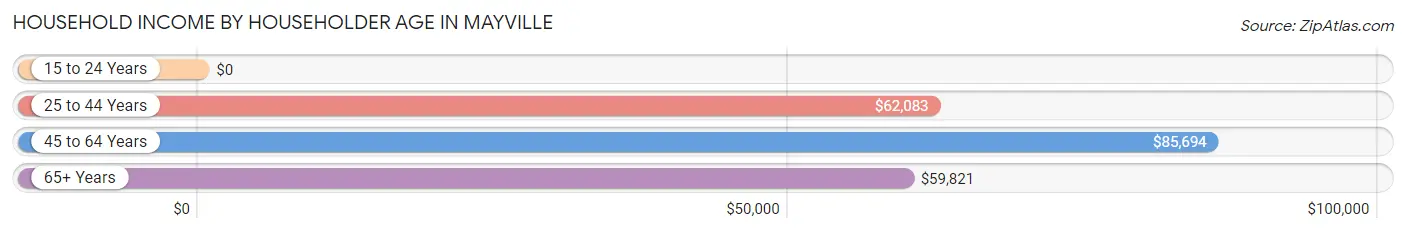
| Income Bracket | # Households | Median Income |
| 15 to 24 Years | 0 (0.0%) | $0 |
| 25 to 44 Years | 103 (17.7%) | $62,083 |
| 45 to 64 Years | 277 (47.5%) | $85,694 |
| 65+ Years | 203 (34.8%) | $59,821 |
| Total | 583 (100.0%) | $70,250 |
Poverty in Mayville
Income Below Poverty by Sex and Age in Mayville
With 8.9% poverty level for males and 12.9% for females among the residents of Mayville, 18 to 24 year old males and 15 year old females are the most vulnerable to poverty, with 8 males (27.6%) and 3 females (37.5%) in their respective age groups living below the poverty level.
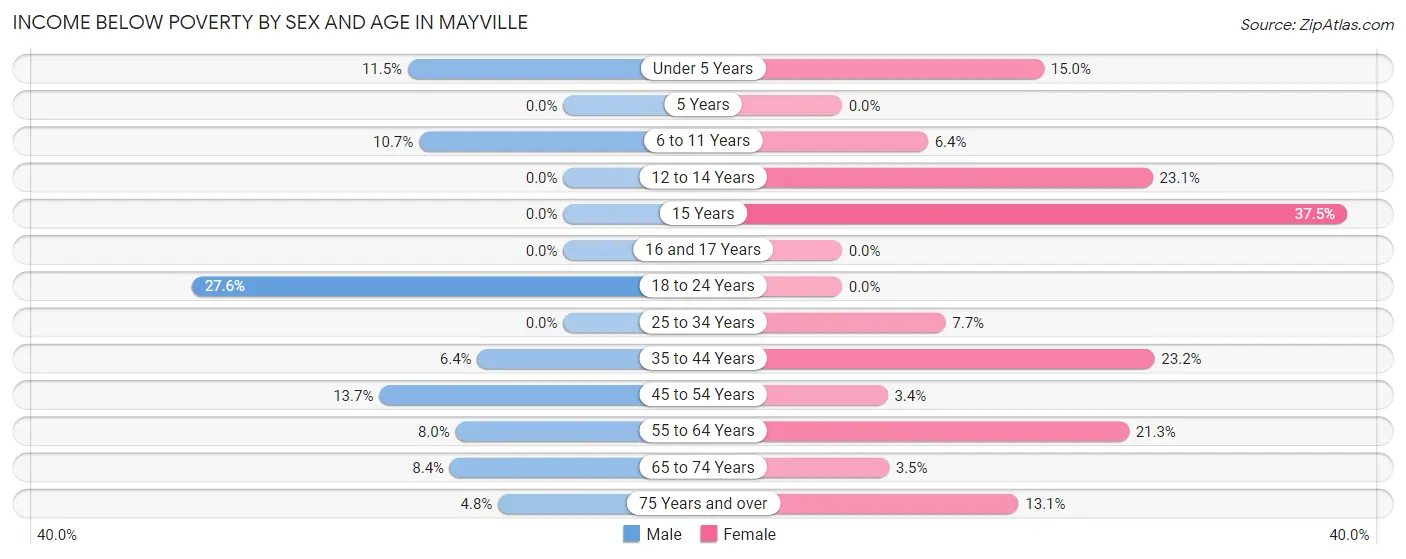
| Age Bracket | Male | Female |
| Under 5 Years | 3 (11.5%) | 3 (15.0%) |
| 5 Years | 0 (0.0%) | 0 (0.0%) |
| 6 to 11 Years | 3 (10.7%) | 3 (6.4%) |
| 12 to 14 Years | 0 (0.0%) | 3 (23.1%) |
| 15 Years | 0 (0.0%) | 3 (37.5%) |
| 16 and 17 Years | 0 (0.0%) | 0 (0.0%) |
| 18 to 24 Years | 8 (27.6%) | 0 (0.0%) |
| 25 to 34 Years | 0 (0.0%) | 2 (7.7%) |
| 35 to 44 Years | 3 (6.4%) | 13 (23.2%) |
| 45 to 54 Years | 19 (13.7%) | 2 (3.4%) |
| 55 to 64 Years | 6 (8.0%) | 36 (21.3%) |
| 65 to 74 Years | 8 (8.4%) | 3 (3.5%) |
| 75 Years and over | 3 (4.8%) | 8 (13.1%) |
| Total | 53 (8.9%) | 76 (12.9%) |
Income Above Poverty by Sex and Age in Mayville
According to the poverty statistics in Mayville, males aged 5 years and females aged 5 years are the age groups that are most secure financially, with 100.0% of males and 100.0% of females in these age groups living above the poverty line.
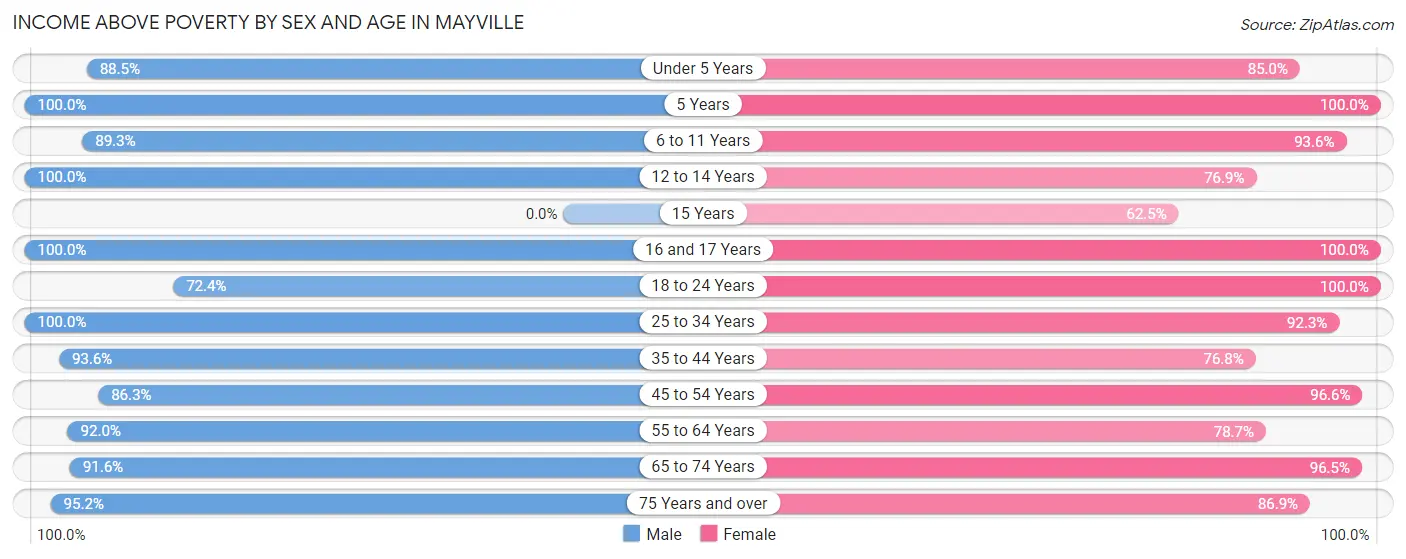
| Age Bracket | Male | Female |
| Under 5 Years | 23 (88.5%) | 17 (85.0%) |
| 5 Years | 3 (100.0%) | 3 (100.0%) |
| 6 to 11 Years | 25 (89.3%) | 44 (93.6%) |
| 12 to 14 Years | 21 (100.0%) | 10 (76.9%) |
| 15 Years | 0 (0.0%) | 5 (62.5%) |
| 16 and 17 Years | 30 (100.0%) | 3 (100.0%) |
| 18 to 24 Years | 21 (72.4%) | 38 (100.0%) |
| 25 to 34 Years | 41 (100.0%) | 24 (92.3%) |
| 35 to 44 Years | 44 (93.6%) | 43 (76.8%) |
| 45 to 54 Years | 120 (86.3%) | 57 (96.6%) |
| 55 to 64 Years | 69 (92.0%) | 133 (78.7%) |
| 65 to 74 Years | 87 (91.6%) | 83 (96.5%) |
| 75 Years and over | 59 (95.2%) | 53 (86.9%) |
| Total | 543 (91.1%) | 513 (87.1%) |
Income Below Poverty Among Married-Couple Families in Mayville
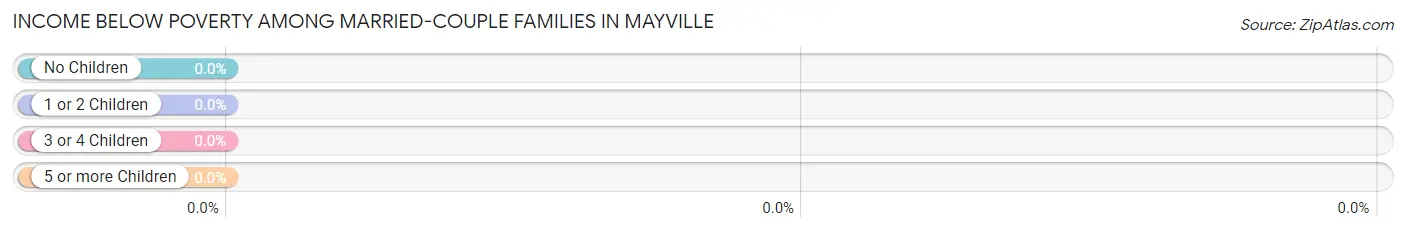
| Children | Above Poverty | Below Poverty |
| No Children | 229 (100.0%) | 0 (0.0%) |
| 1 or 2 Children | 52 (100.0%) | 0 (0.0%) |
| 3 or 4 Children | 3 (100.0%) | 0 (0.0%) |
| 5 or more Children | 0 (0.0%) | 0 (0.0%) |
| Total | 284 (100.0%) | 0 (0.0%) |
Income Below Poverty Among Single-Parent Households in Mayville
According to the poverty data in Mayville, 10.0% or 3 single-father households and 9.4% or 5 single-mother households are living below the poverty line. Among single-father households, those with 1 or 2 children have the highest poverty rate, with 3 households (20.0%) experiencing poverty. Likewise, among single-mother households, those with 3 or 4 children have the highest poverty rate, with 2 households (100.0%) falling below the poverty line.
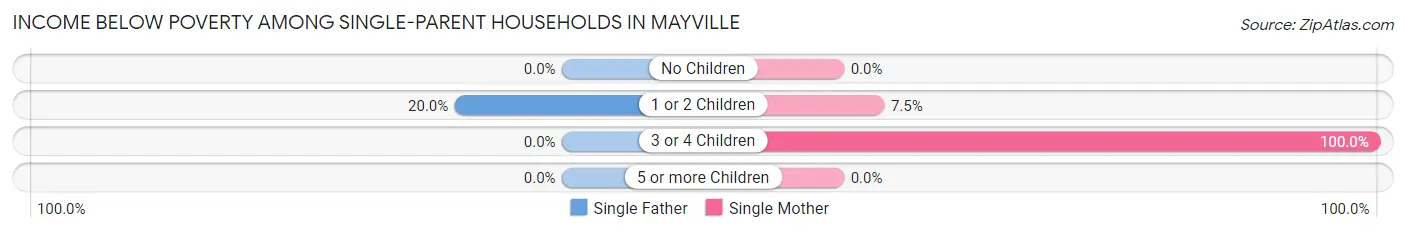
| Children | Single Father | Single Mother |
| No Children | 0 (0.0%) | 0 (0.0%) |
| 1 or 2 Children | 3 (20.0%) | 3 (7.5%) |
| 3 or 4 Children | 0 (0.0%) | 2 (100.0%) |
| 5 or more Children | 0 (0.0%) | 0 (0.0%) |
| Total | 3 (10.0%) | 5 (9.4%) |
Income Below Poverty Among Married-Couple vs Single-Parent Households in Mayville
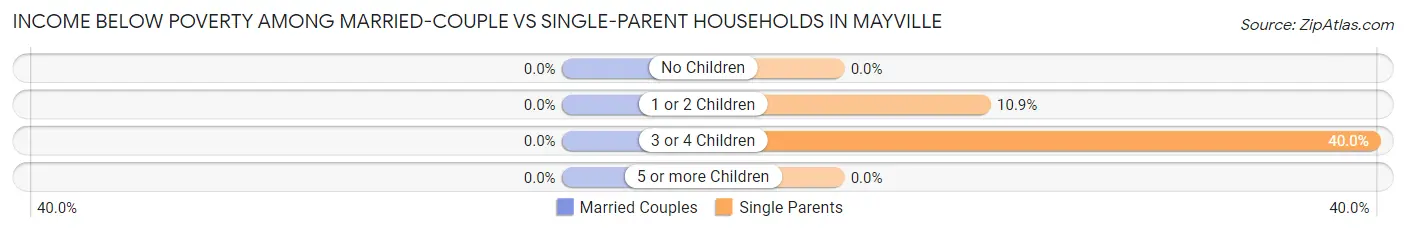
| Children | Married-Couple Families | Single-Parent Households |
| No Children | 0 (0.0%) | 0 (0.0%) |
| 1 or 2 Children | 0 (0.0%) | 6 (10.9%) |
| 3 or 4 Children | 0 (0.0%) | 2 (40.0%) |
| 5 or more Children | 0 (0.0%) | 0 (0.0%) |
| Total | 0 (0.0%) | 8 (9.6%) |
Race in Mayville
The most populous races in Mayville are White / Caucasian (1,189 | 87.7%), Two or more Races (77 | 5.7%), and Hispanic or Latino (75 | 5.5%).
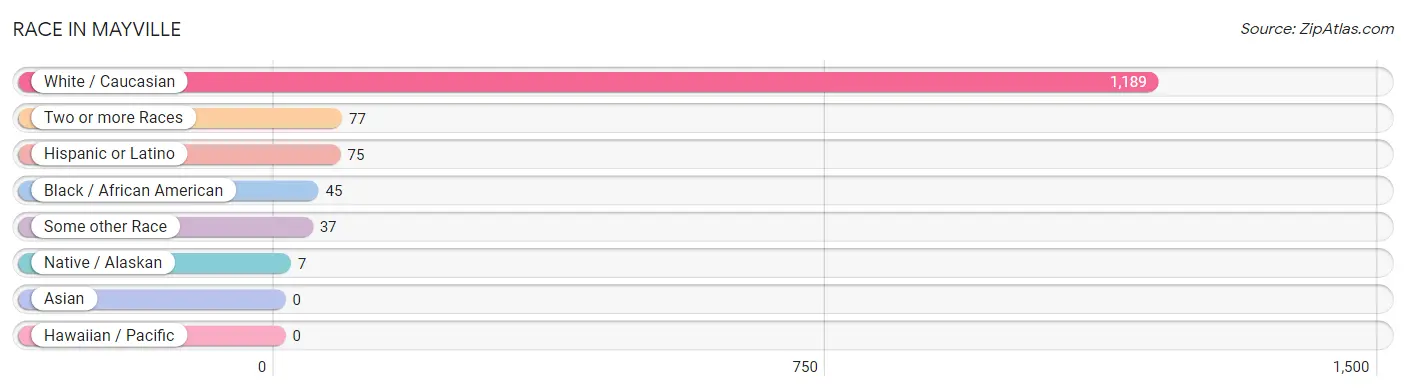
| Race | # Population | % Population |
| Asian | 0 | 0.0% |
| Black / African American | 45 | 3.3% |
| Hawaiian / Pacific | 0 | 0.0% |
| Hispanic or Latino | 75 | 5.5% |
| Native / Alaskan | 7 | 0.5% |
| White / Caucasian | 1,189 | 87.7% |
| Two or more Races | 77 | 5.7% |
| Some other Race | 37 | 2.7% |
| Total | 1,355 | 100.0% |
Ancestry in Mayville
The most populous ancestries reported in Mayville are English (398 | 29.4%), German (262 | 19.3%), Irish (185 | 13.7%), Swedish (121 | 8.9%), and Italian (79 | 5.8%), together accounting for 77.1% of all Mayville residents.
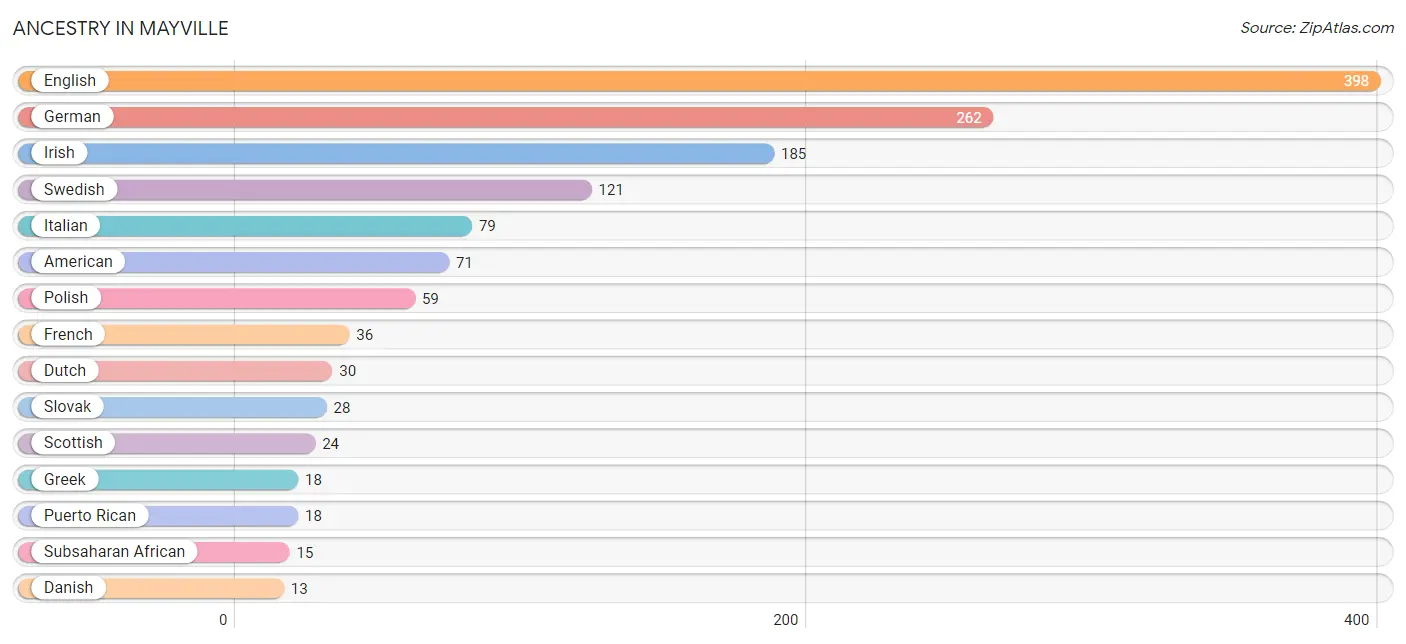
| Ancestry | # Population | % Population |
| American | 71 | 5.2% |
| Arab | 5 | 0.4% |
| Austrian | 8 | 0.6% |
| Belizean | 6 | 0.4% |
| Blackfeet | 2 | 0.2% |
| Brazilian | 3 | 0.2% |
| British | 2 | 0.2% |
| Canadian | 3 | 0.2% |
| Central American | 9 | 0.7% |
| Chippewa | 1 | 0.1% |
| Cuban | 4 | 0.3% |
| Czech | 8 | 0.6% |
| Danish | 13 | 1.0% |
| Dominican | 4 | 0.3% |
| Dutch | 30 | 2.2% |
| Eastern European | 1 | 0.1% |
| Ecuadorian | 12 | 0.9% |
| English | 398 | 29.4% |
| Ethiopian | 6 | 0.4% |
| European | 6 | 0.4% |
| Finnish | 2 | 0.2% |
| French | 36 | 2.7% |
| French Canadian | 10 | 0.7% |
| German | 262 | 19.3% |
| Greek | 18 | 1.3% |
| Hungarian | 6 | 0.4% |
| Irish | 185 | 13.7% |
| Iroquois | 3 | 0.2% |
| Italian | 79 | 5.8% |
| Lithuanian | 8 | 0.6% |
| Mexican | 10 | 0.7% |
| Native Hawaiian | 3 | 0.2% |
| Norwegian | 7 | 0.5% |
| Palestinian | 5 | 0.4% |
| Polish | 59 | 4.3% |
| Puerto Rican | 18 | 1.3% |
| Russian | 5 | 0.4% |
| Salvadoran | 9 | 0.7% |
| Scandinavian | 12 | 0.9% |
| Scotch-Irish | 10 | 0.7% |
| Scottish | 24 | 1.8% |
| Slovak | 28 | 2.1% |
| South African | 9 | 0.7% |
| South American | 12 | 0.9% |
| Spaniard | 11 | 0.8% |
| Subsaharan African | 15 | 1.1% |
| Swedish | 121 | 8.9% |
| Ukrainian | 3 | 0.2% |
| Welsh | 11 | 0.8% | View All 49 Rows |
Immigrants in Mayville
The most numerous immigrant groups reported in Mayville came from Canada (7 | 0.5%), Eastern Europe (6 | 0.4%), Europe (6 | 0.4%), Hungary (6 | 0.4%), and Brazil (3 | 0.2%), together accounting for 2.1% of all Mayville residents.
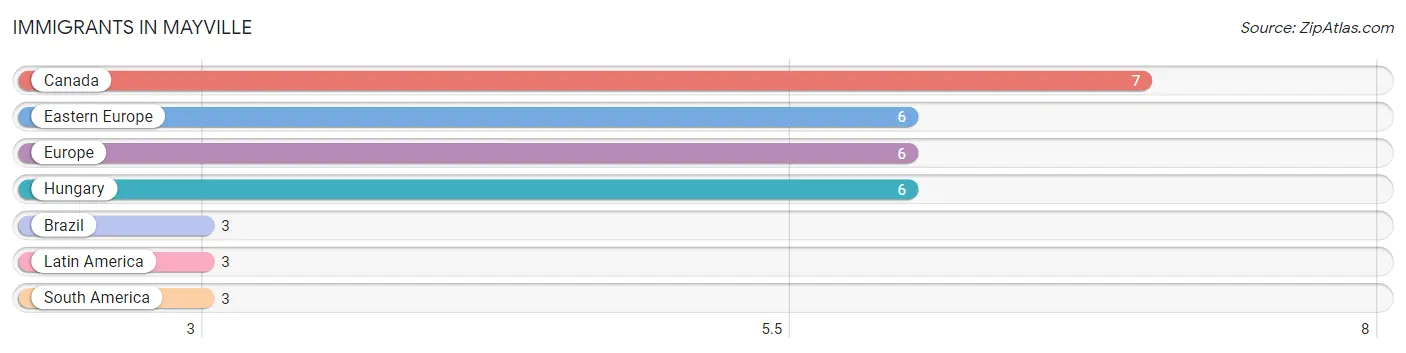
| Immigration Origin | # Population | % Population |
| Brazil | 3 | 0.2% |
| Canada | 7 | 0.5% |
| Eastern Europe | 6 | 0.4% |
| Europe | 6 | 0.4% |
| Hungary | 6 | 0.4% |
| Latin America | 3 | 0.2% |
| South America | 3 | 0.2% | View All 7 Rows |
Sex and Age in Mayville
Sex and Age in Mayville
The most populous age groups in Mayville are 50 to 54 Years (92 | 12.7%) for men and 55 to 59 Years (94 | 14.9%) for women.
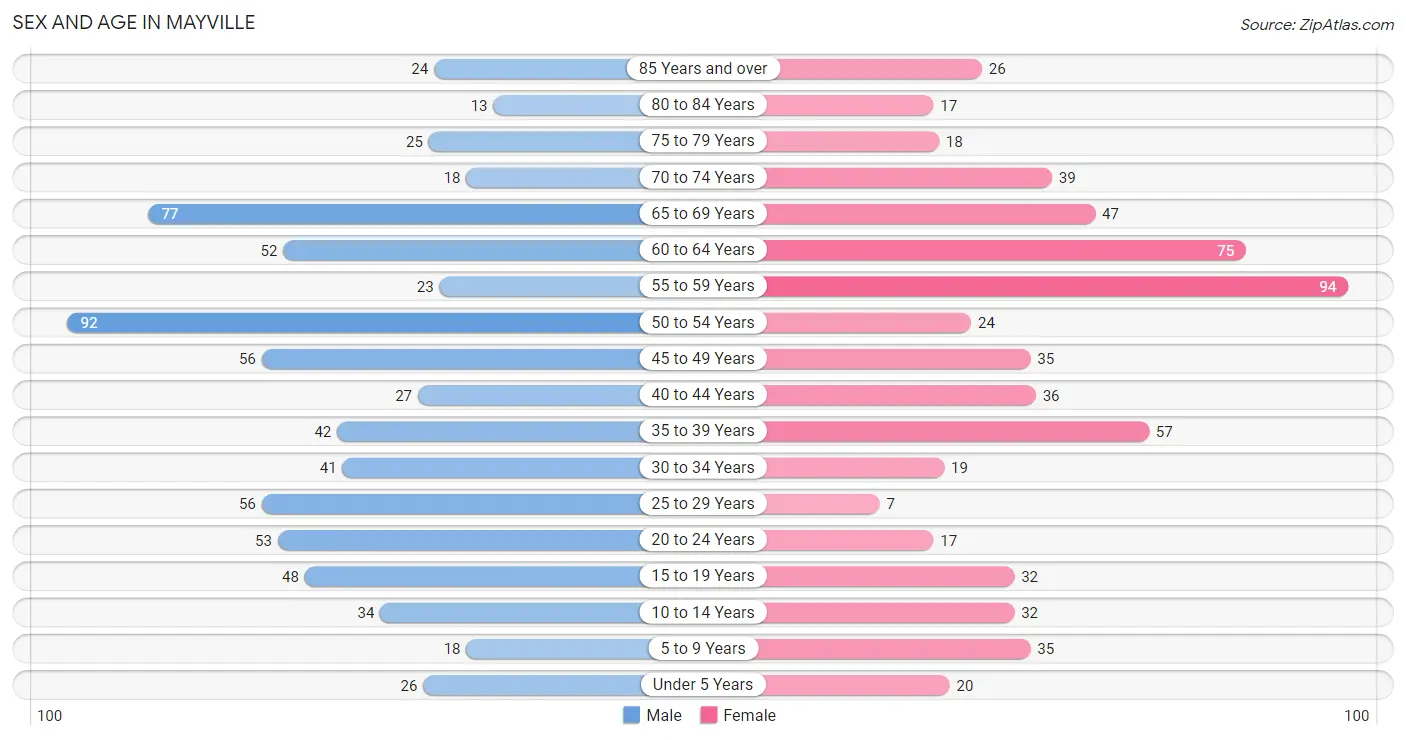
| Age Bracket | Male | Female |
| Under 5 Years | 26 (3.6%) | 20 (3.2%) |
| 5 to 9 Years | 18 (2.5%) | 35 (5.6%) |
| 10 to 14 Years | 34 (4.7%) | 32 (5.1%) |
| 15 to 19 Years | 48 (6.6%) | 32 (5.1%) |
| 20 to 24 Years | 53 (7.3%) | 17 (2.7%) |
| 25 to 29 Years | 56 (7.7%) | 7 (1.1%) |
| 30 to 34 Years | 41 (5.7%) | 19 (3.0%) |
| 35 to 39 Years | 42 (5.8%) | 57 (9.0%) |
| 40 to 44 Years | 27 (3.7%) | 36 (5.7%) |
| 45 to 49 Years | 56 (7.7%) | 35 (5.6%) |
| 50 to 54 Years | 92 (12.7%) | 24 (3.8%) |
| 55 to 59 Years | 23 (3.2%) | 94 (14.9%) |
| 60 to 64 Years | 52 (7.2%) | 75 (11.9%) |
| 65 to 69 Years | 77 (10.6%) | 47 (7.5%) |
| 70 to 74 Years | 18 (2.5%) | 39 (6.2%) |
| 75 to 79 Years | 25 (3.5%) | 18 (2.9%) |
| 80 to 84 Years | 13 (1.8%) | 17 (2.7%) |
| 85 Years and over | 24 (3.3%) | 26 (4.1%) |
| Total | 725 (100.0%) | 630 (100.0%) |
Families and Households in Mayville
Median Family Size in Mayville
The median family size in Mayville is 2.50 persons per family, with single female/mother families (53 | 14.4%) accounting for the largest median family size of 3.4 persons per family. On the other hand, single male/father families (30 | 8.2%) represent the smallest median family size with 2.23 persons per family.
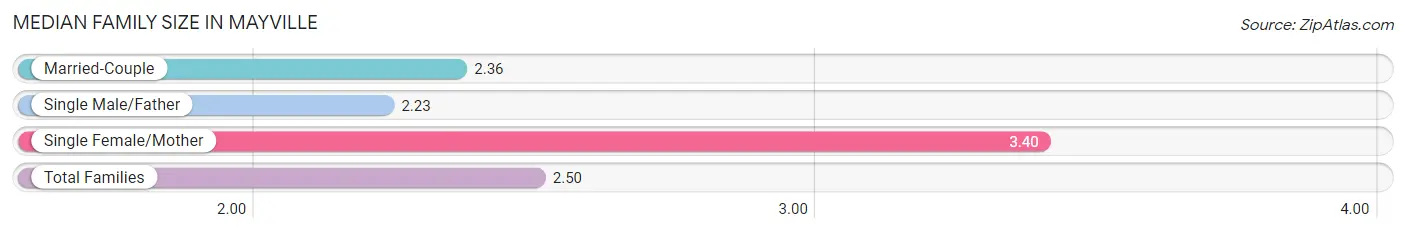
| Family Type | # Families | Family Size |
| Married-Couple | 284 (77.4%) | 2.36 |
| Single Male/Father | 30 (8.2%) | 2.23 |
| Single Female/Mother | 53 (14.4%) | 3.40 |
| Total Families | 367 (100.0%) | 2.50 |
Median Household Size in Mayville
The median household size in Mayville is 2.04 persons per household, with single female/mother households (53 | 9.1%) accounting for the largest median household size of 3.92 persons per household. non-family households (216 | 37.0%) represent the smallest median household size with 1.12 persons per household.
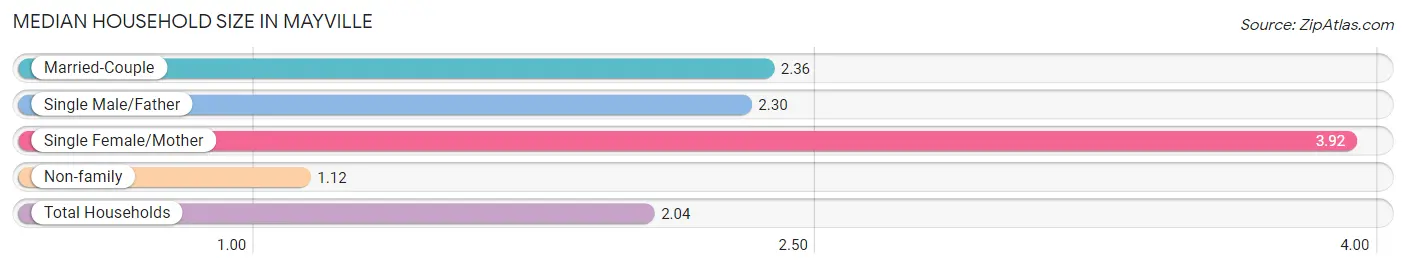
| Household Type | # Households | Household Size |
| Married-Couple | 284 (48.7%) | 2.36 |
| Single Male/Father | 30 (5.1%) | 2.30 |
| Single Female/Mother | 53 (9.1%) | 3.92 |
| Non-family | 216 (37.0%) | 1.12 |
| Total Households | 583 (100.0%) | 2.04 |
Household Size by Marriage Status in Mayville
Out of a total of 583 households in Mayville, 367 (62.9%) are family households, while 216 (37.0%) are nonfamily households. The most numerous type of family households are 2-person households, comprising 239, and the most common type of nonfamily households are 1-person households, comprising 194.
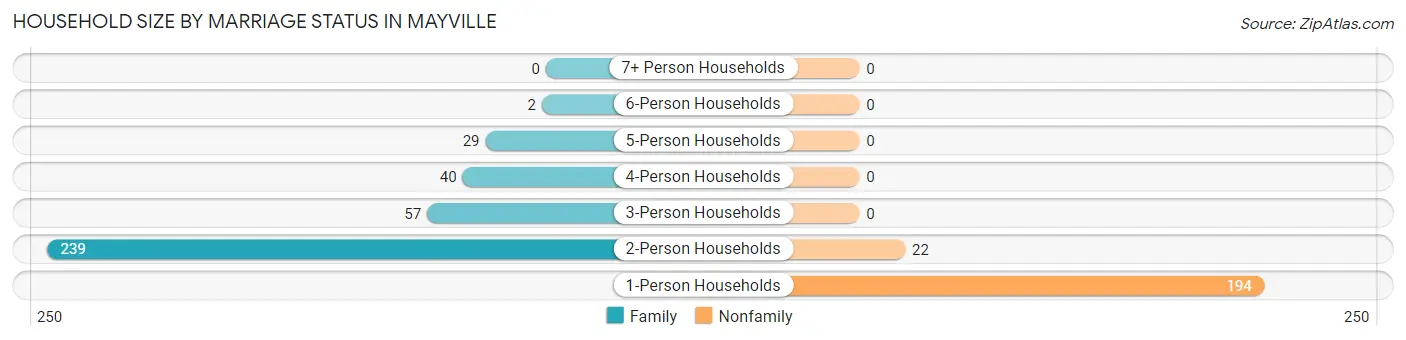
| Household Size | Family Households | Nonfamily Households |
| 1-Person Households | - | 194 (33.3%) |
| 2-Person Households | 239 (41.0%) | 22 (3.8%) |
| 3-Person Households | 57 (9.8%) | 0 (0.0%) |
| 4-Person Households | 40 (6.9%) | 0 (0.0%) |
| 5-Person Households | 29 (5.0%) | 0 (0.0%) |
| 6-Person Households | 2 (0.3%) | 0 (0.0%) |
| 7+ Person Households | 0 (0.0%) | 0 (0.0%) |
| Total | 367 (62.9%) | 216 (37.0%) |
Female Fertility in Mayville
Fertility by Age in Mayville
Average fertility rate in Mayville is 96.0 births per 1,000 women. Women in the age bracket of 20 to 34 years have the highest fertility rate with 465.0 births per 1,000 women. Women in the age bracket of 20 to 34 years acount for 100.0% of all women with births.
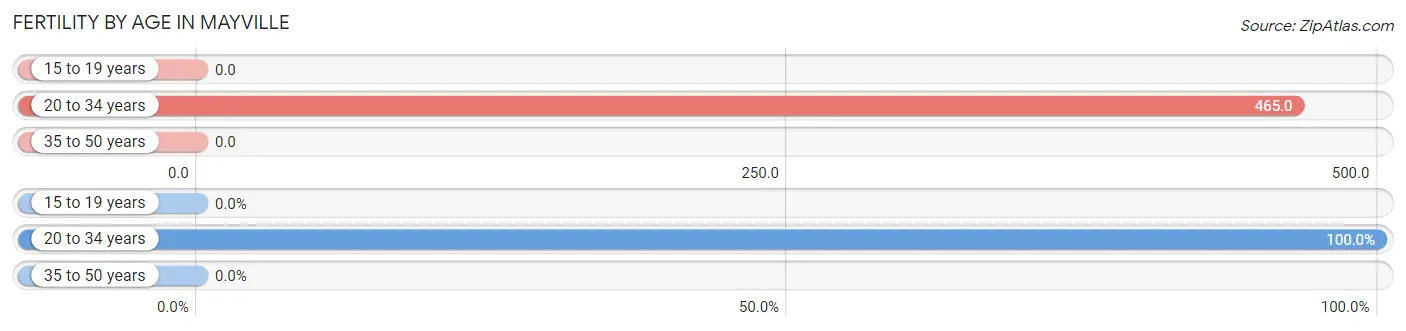
| Age Bracket | Women with Births | Births / 1,000 Women |
| 15 to 19 years | 0 (0.0%) | 0.0 |
| 20 to 34 years | 20 (100.0%) | 465.0 |
| 35 to 50 years | 0 (0.0%) | 0.0 |
| Total | 20 (100.0%) | 96.0 |
Fertility by Age by Marriage Status in Mayville
15.0% of women with births (20) in Mayville are married. The highest percentage of unmarried women with births falls into 20 to 34 years age bracket with 85.0% of them unmarried at the time of birth, while the lowest percentage of unmarried women with births belong to 20 to 34 years age bracket with 85.0% of them unmarried.
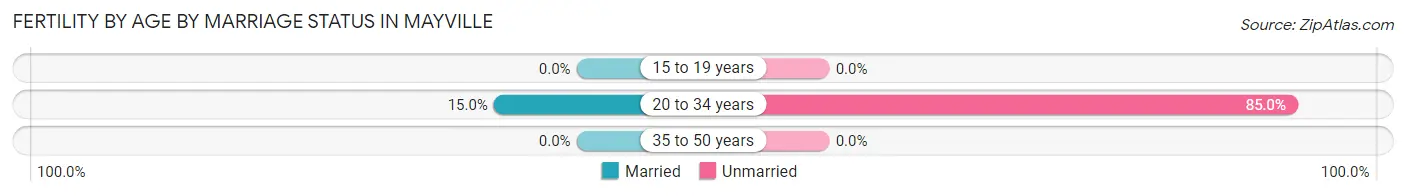
| Age Bracket | Married | Unmarried |
| 15 to 19 years | 0 (0.0%) | 0 (0.0%) |
| 20 to 34 years | 3 (15.0%) | 17 (85.0%) |
| 35 to 50 years | 0 (0.0%) | 0 (0.0%) |
| Total | 3 (15.0%) | 17 (85.0%) |
Fertility by Education in Mayville
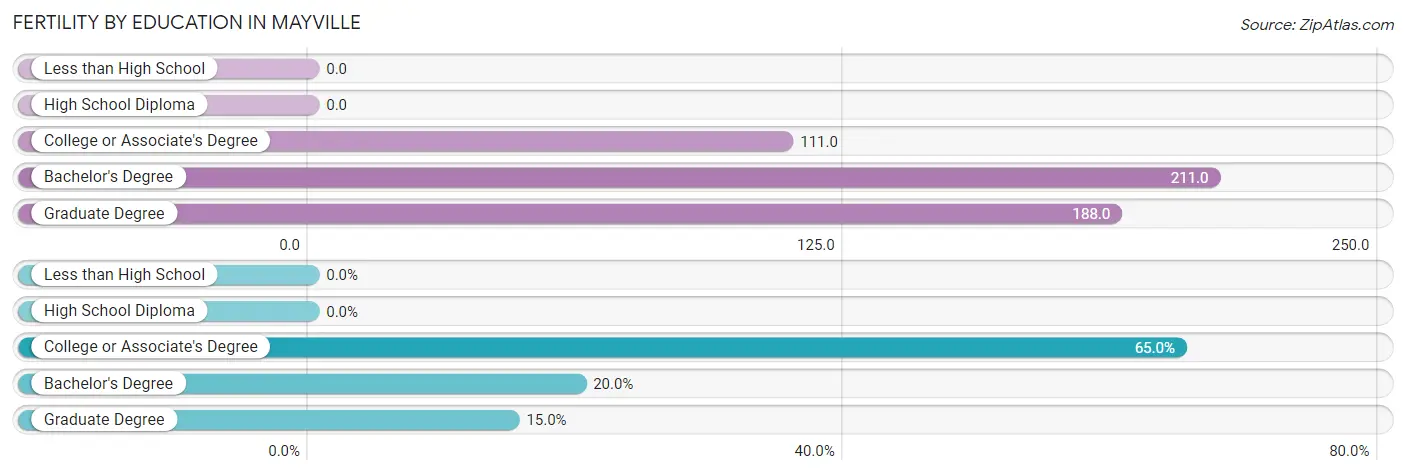
| Educational Attainment | Women with Births | Births / 1,000 Women |
| Less than High School | 0 (0.0%) | 0.0 |
| High School Diploma | 0 (0.0%) | 0.0 |
| College or Associate's Degree | 13 (65.0%) | 111.0 |
| Bachelor's Degree | 4 (20.0%) | 211.0 |
| Graduate Degree | 3 (15.0%) | 188.0 |
| Total | 20 (100.0%) | 96.0 |
Fertility by Education by Marriage Status in Mayville
85.0% of women with births in Mayville are unmarried. Women with the educational attainment of graduate degree are most likely to be married with 100.0% of them married at childbirth, while women with the educational attainment of college or associate's degree are least likely to be married with 100.0% of them unmarried at childbirth.
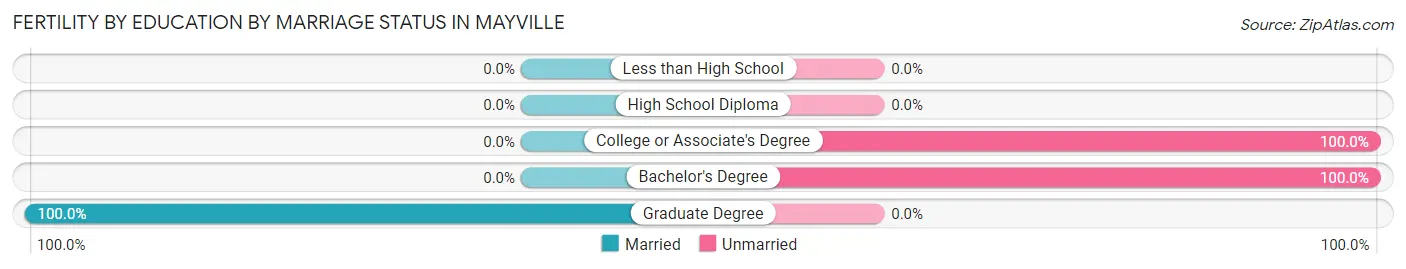
| Educational Attainment | Married | Unmarried |
| Less than High School | 0 (0.0%) | 0 (0.0%) |
| High School Diploma | 0 (0.0%) | 0 (0.0%) |
| College or Associate's Degree | 0 (0.0%) | 13 (100.0%) |
| Bachelor's Degree | 0 (0.0%) | 4 (100.0%) |
| Graduate Degree | 3 (100.0%) | 0 (0.0%) |
| Total | 3 (15.0%) | 17 (85.0%) |
Employment Characteristics in Mayville
Employment by Class of Employer in Mayville
Among the 481 employed individuals in Mayville, private company employees (294 | 61.1%), local government employees (92 | 19.1%), and not-for-profit organizations (48 | 10.0%) make up the most common classes of employment.
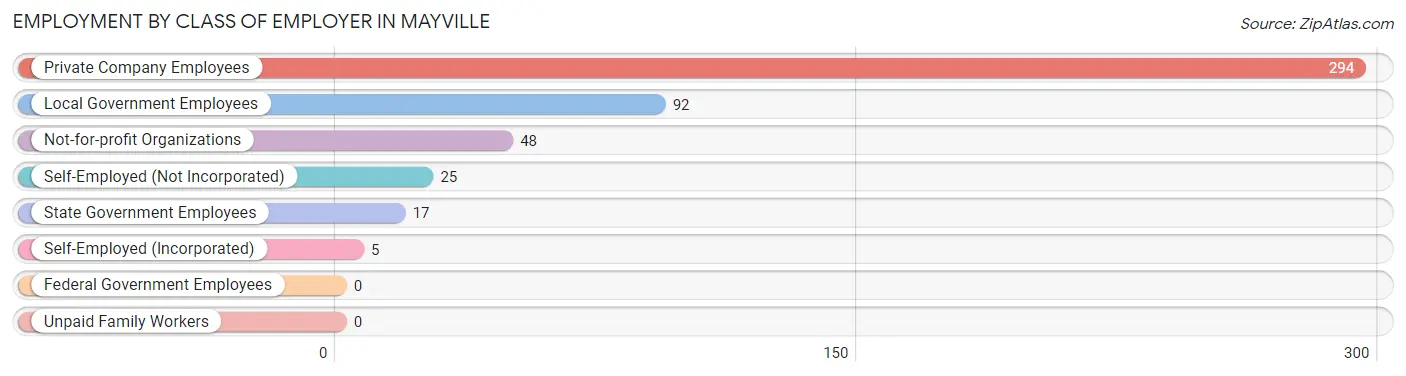
| Employer Class | # Employees | % Employees |
| Private Company Employees | 294 | 61.1% |
| Self-Employed (Incorporated) | 5 | 1.0% |
| Self-Employed (Not Incorporated) | 25 | 5.2% |
| Not-for-profit Organizations | 48 | 10.0% |
| Local Government Employees | 92 | 19.1% |
| State Government Employees | 17 | 3.5% |
| Federal Government Employees | 0 | 0.0% |
| Unpaid Family Workers | 0 | 0.0% |
| Total | 481 | 100.0% |
Employment Status by Age in Mayville
According to the labor force statistics for Mayville, out of the total population over 16 years of age (1,182), 44.1% or 521 individuals are in the labor force, with 7.7% or 40 of them unemployed. The age group with the highest labor force participation rate is 45 to 54 years, with 81.6% or 169 individuals in the labor force. Within the labor force, the 20 to 24 years age range has the highest percentage of unemployed individuals, with 14.8% or 4 of them being unemployed.
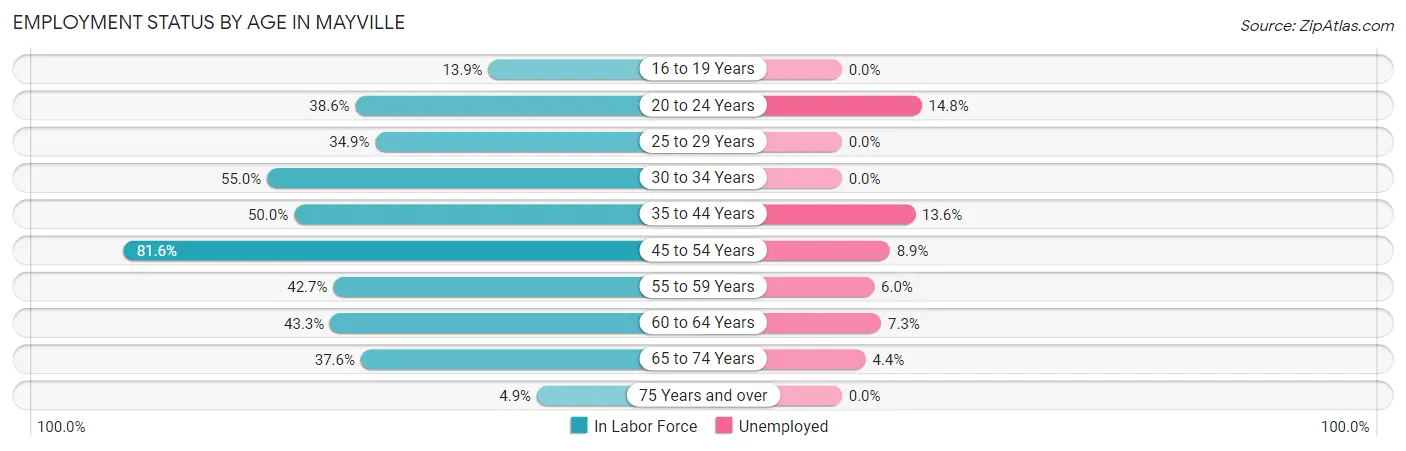
| Age Bracket | In Labor Force | Unemployed |
| 16 to 19 Years | 10 (13.9%) | 0 (0.0%) |
| 20 to 24 Years | 27 (38.6%) | 4 (14.8%) |
| 25 to 29 Years | 22 (34.9%) | 0 (0.0%) |
| 30 to 34 Years | 33 (55.0%) | 0 (0.0%) |
| 35 to 44 Years | 81 (50.0%) | 11 (13.6%) |
| 45 to 54 Years | 169 (81.6%) | 15 (8.9%) |
| 55 to 59 Years | 50 (42.7%) | 3 (6.0%) |
| 60 to 64 Years | 55 (43.3%) | 4 (7.3%) |
| 65 to 74 Years | 68 (37.6%) | 3 (4.4%) |
| 75 Years and over | 6 (4.9%) | 0 (0.0%) |
| Total | 521 (44.1%) | 40 (7.7%) |
Employment Status by Educational Attainment in Mayville
According to labor force statistics for Mayville, 55.7% of individuals (410) out of the total population between 25 and 64 years of age (736) are in the labor force, with 8.0% or 33 of them being unemployed. The group with the highest labor force participation rate are those with the educational attainment of bachelor's degree or higher, with 69.6% or 167 individuals in the labor force. Within the labor force, individuals with less than high school education have the highest percentage of unemployment, with 60.0% or 3 of them being unemployed.
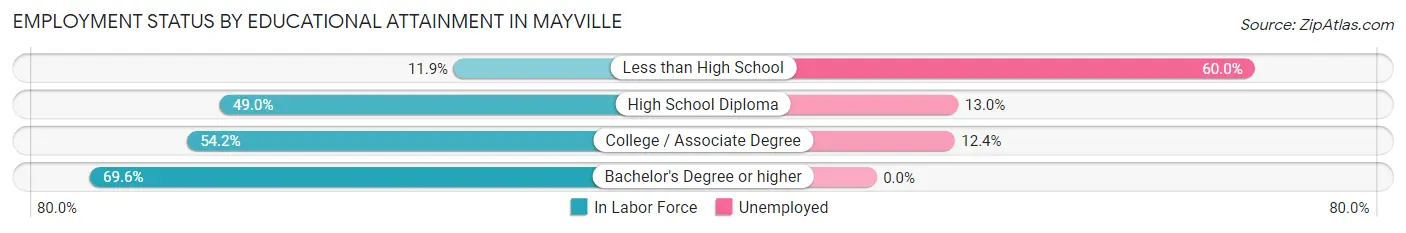
| Educational Attainment | In Labor Force | Unemployed |
| Less than High School | 5 (11.9%) | 25 (60.0%) |
| High School Diploma | 77 (49.0%) | 20 (13.0%) |
| College / Associate Degree | 161 (54.2%) | 37 (12.4%) |
| Bachelor's Degree or higher | 167 (69.6%) | 0 (0.0%) |
| Total | 410 (55.7%) | 59 (8.0%) |
Employment Occupations by Sex in Mayville
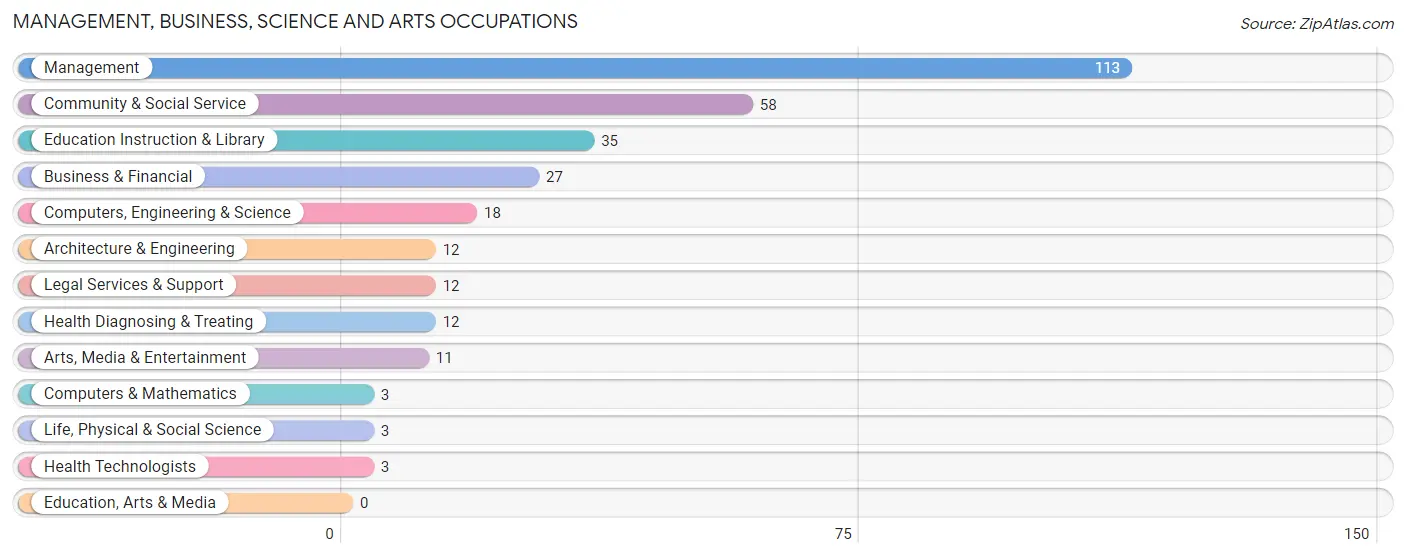
Management, Business, Science and Arts Occupations
The most common Management, Business, Science and Arts occupations in Mayville are Management (113 | 23.5%), Community & Social Service (58 | 12.1%), Education Instruction & Library (35 | 7.3%), Business & Financial (27 | 5.6%), and Computers, Engineering & Science (18 | 3.7%).
Management, Business, Science and Arts Occupations by Sex
Within the Management, Business, Science and Arts occupations in Mayville, the most male-oriented occupations are Life, Physical & Social Science (100.0%), Management (86.7%), and Architecture & Engineering (58.3%), while the most female-oriented occupations are Computers & Mathematics (100.0%), Health Diagnosing & Treating (100.0%), and Health Technologists (100.0%).
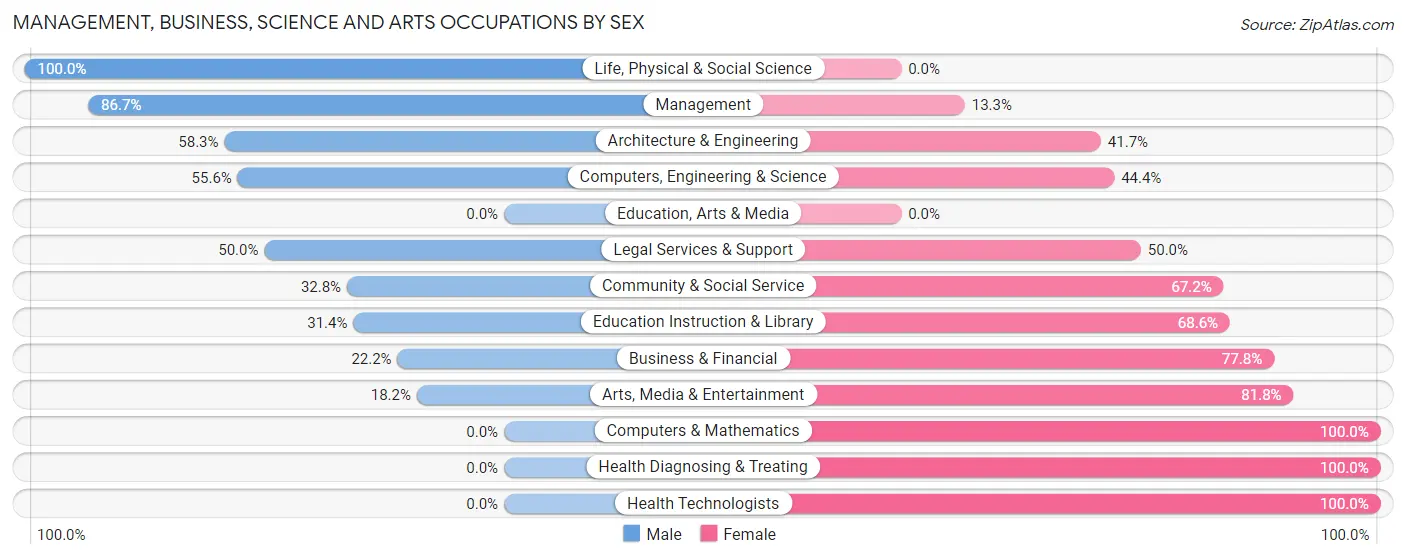
| Occupation | Male | Female |
| Management | 98 (86.7%) | 15 (13.3%) |
| Business & Financial | 6 (22.2%) | 21 (77.8%) |
| Computers, Engineering & Science | 10 (55.6%) | 8 (44.4%) |
| Computers & Mathematics | 0 (0.0%) | 3 (100.0%) |
| Architecture & Engineering | 7 (58.3%) | 5 (41.7%) |
| Life, Physical & Social Science | 3 (100.0%) | 0 (0.0%) |
| Community & Social Service | 19 (32.8%) | 39 (67.2%) |
| Education, Arts & Media | 0 (0.0%) | 0 (0.0%) |
| Legal Services & Support | 6 (50.0%) | 6 (50.0%) |
| Education Instruction & Library | 11 (31.4%) | 24 (68.6%) |
| Arts, Media & Entertainment | 2 (18.2%) | 9 (81.8%) |
| Health Diagnosing & Treating | 0 (0.0%) | 12 (100.0%) |
| Health Technologists | 0 (0.0%) | 3 (100.0%) |
| Total (Category) | 133 (58.3%) | 95 (41.7%) |
| Total (Overall) | 286 (59.5%) | 195 (40.5%) |
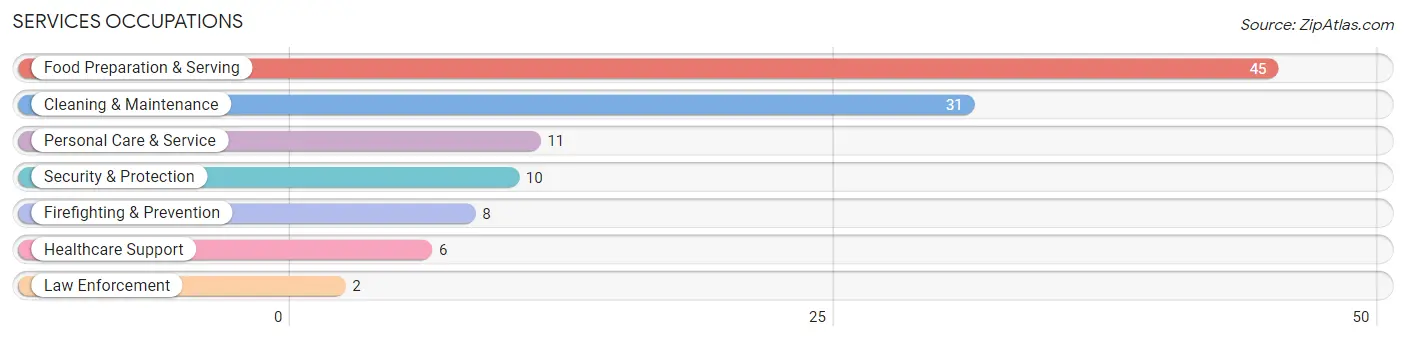
Services Occupations
The most common Services occupations in Mayville are Food Preparation & Serving (45 | 9.4%), Cleaning & Maintenance (31 | 6.4%), Personal Care & Service (11 | 2.3%), Security & Protection (10 | 2.1%), and Firefighting & Prevention (8 | 1.7%).
Services Occupations by Sex
Within the Services occupations in Mayville, the most male-oriented occupations are Healthcare Support (100.0%), Security & Protection (100.0%), and Firefighting & Prevention (100.0%), while the most female-oriented occupations are Personal Care & Service (54.5%), Food Preparation & Serving (48.9%), and Cleaning & Maintenance (32.3%).
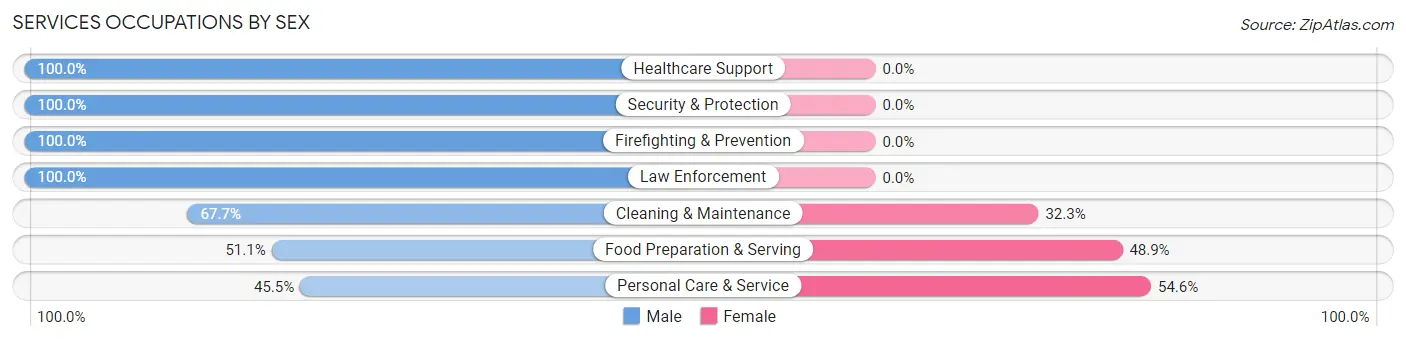
| Occupation | Male | Female |
| Healthcare Support | 6 (100.0%) | 0 (0.0%) |
| Security & Protection | 10 (100.0%) | 0 (0.0%) |
| Firefighting & Prevention | 8 (100.0%) | 0 (0.0%) |
| Law Enforcement | 2 (100.0%) | 0 (0.0%) |
| Food Preparation & Serving | 23 (51.1%) | 22 (48.9%) |
| Cleaning & Maintenance | 21 (67.7%) | 10 (32.3%) |
| Personal Care & Service | 5 (45.5%) | 6 (54.5%) |
| Total (Category) | 65 (63.1%) | 38 (36.9%) |
| Total (Overall) | 286 (59.5%) | 195 (40.5%) |
Sales and Office Occupations
The most common Sales and Office occupations in Mayville are Sales & Related (44 | 9.1%), and Office & Administration (43 | 8.9%).

Sales and Office Occupations by Sex
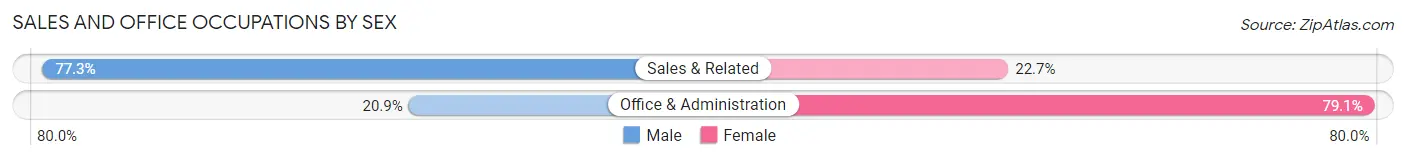
| Occupation | Male | Female |
| Sales & Related | 34 (77.3%) | 10 (22.7%) |
| Office & Administration | 9 (20.9%) | 34 (79.1%) |
| Total (Category) | 43 (49.4%) | 44 (50.6%) |
| Total (Overall) | 286 (59.5%) | 195 (40.5%) |
Natural Resources, Construction and Maintenance Occupations
The most common Natural Resources, Construction and Maintenance occupations in Mayville are Construction & Extraction (19 | 4.0%), and Installation, Maintenance & Repair (17 | 3.5%).
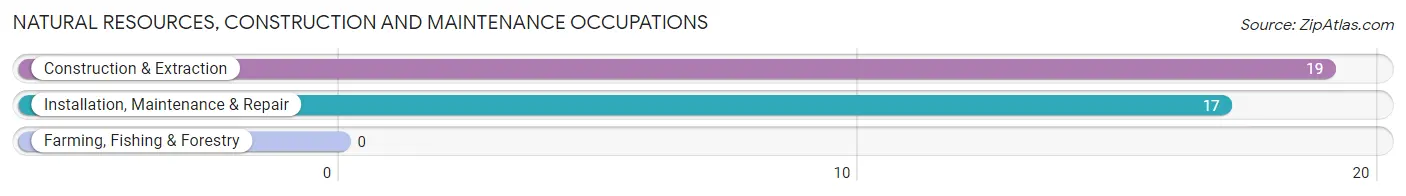
Natural Resources, Construction and Maintenance Occupations by Sex

| Occupation | Male | Female |
| Farming, Fishing & Forestry | 0 (0.0%) | 0 (0.0%) |
| Construction & Extraction | 11 (57.9%) | 8 (42.1%) |
| Installation, Maintenance & Repair | 17 (100.0%) | 0 (0.0%) |
| Total (Category) | 28 (77.8%) | 8 (22.2%) |
| Total (Overall) | 286 (59.5%) | 195 (40.5%) |
Production, Transportation and Moving Occupations
The most common Production, Transportation and Moving occupations in Mayville are Production (17 | 3.5%), Material Moving (6 | 1.3%), and Transportation (4 | 0.8%).
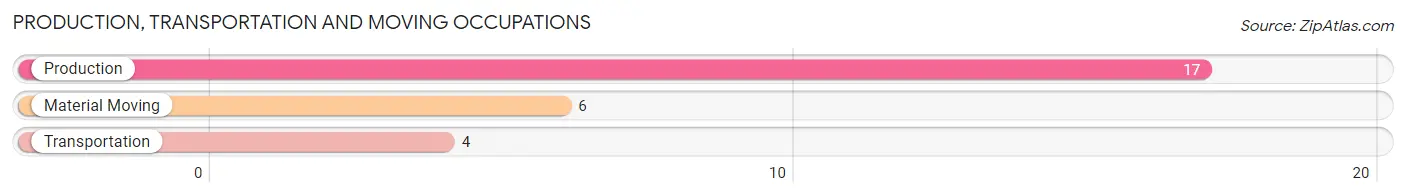
Production, Transportation and Moving Occupations by Sex
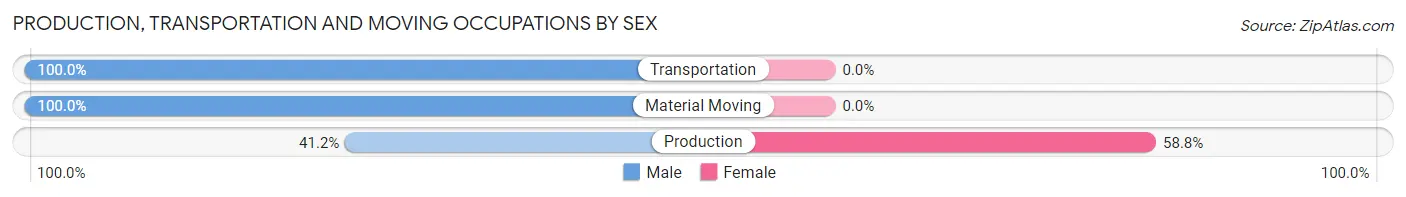
| Occupation | Male | Female |
| Production | 7 (41.2%) | 10 (58.8%) |
| Transportation | 4 (100.0%) | 0 (0.0%) |
| Material Moving | 6 (100.0%) | 0 (0.0%) |
| Total (Category) | 17 (63.0%) | 10 (37.0%) |
| Total (Overall) | 286 (59.5%) | 195 (40.5%) |
Employment Industries by Sex in Mayville
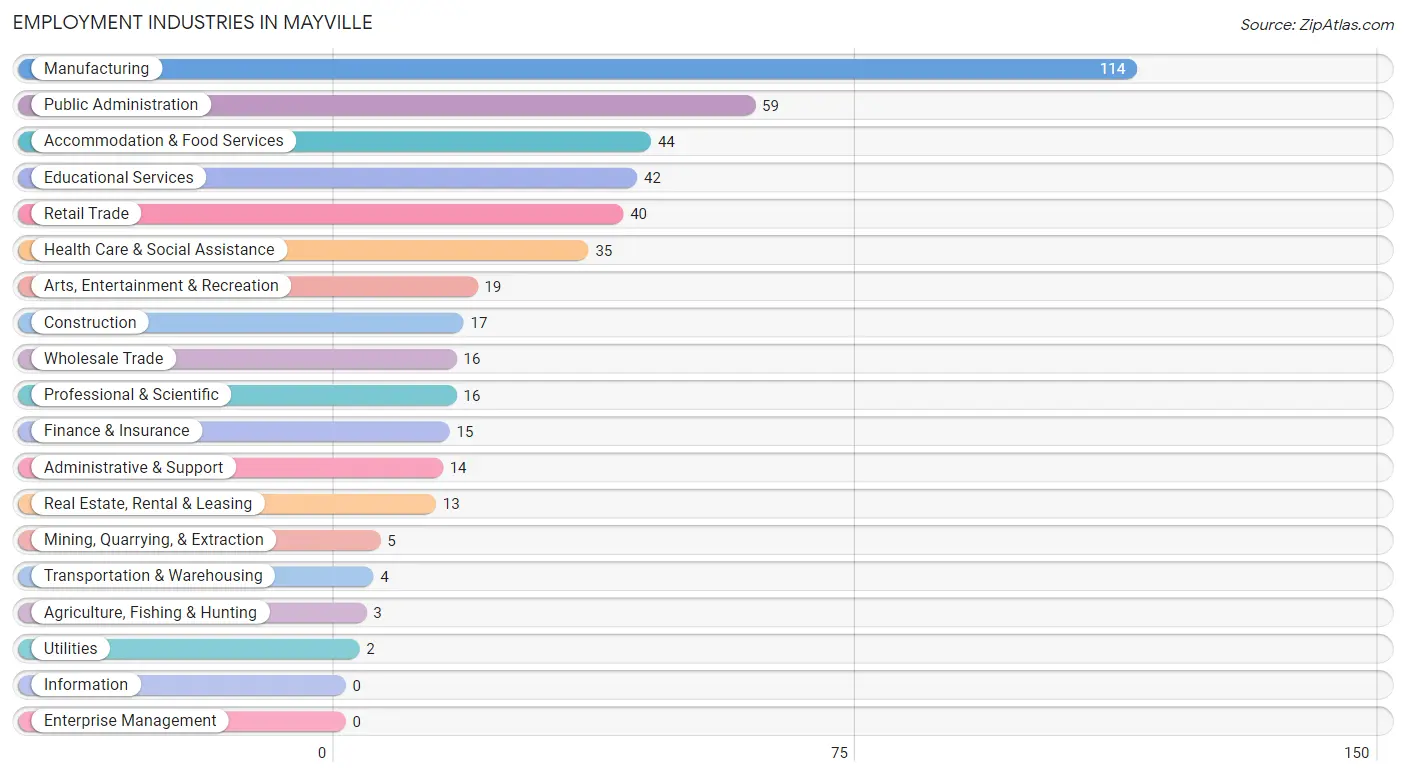
Employment Industries in Mayville
The major employment industries in Mayville include Manufacturing (114 | 23.7%), Public Administration (59 | 12.3%), Accommodation & Food Services (44 | 9.1%), Educational Services (42 | 8.7%), and Retail Trade (40 | 8.3%).
Employment Industries by Sex in Mayville
The Mayville industries that see more men than women are Agriculture, Fishing & Hunting (100.0%), Mining, Quarrying, & Extraction (100.0%), and Construction (100.0%), whereas the industries that tend to have a higher number of women are Health Care & Social Assistance (85.7%), Professional & Scientific (81.2%), and Arts, Entertainment & Recreation (78.9%).
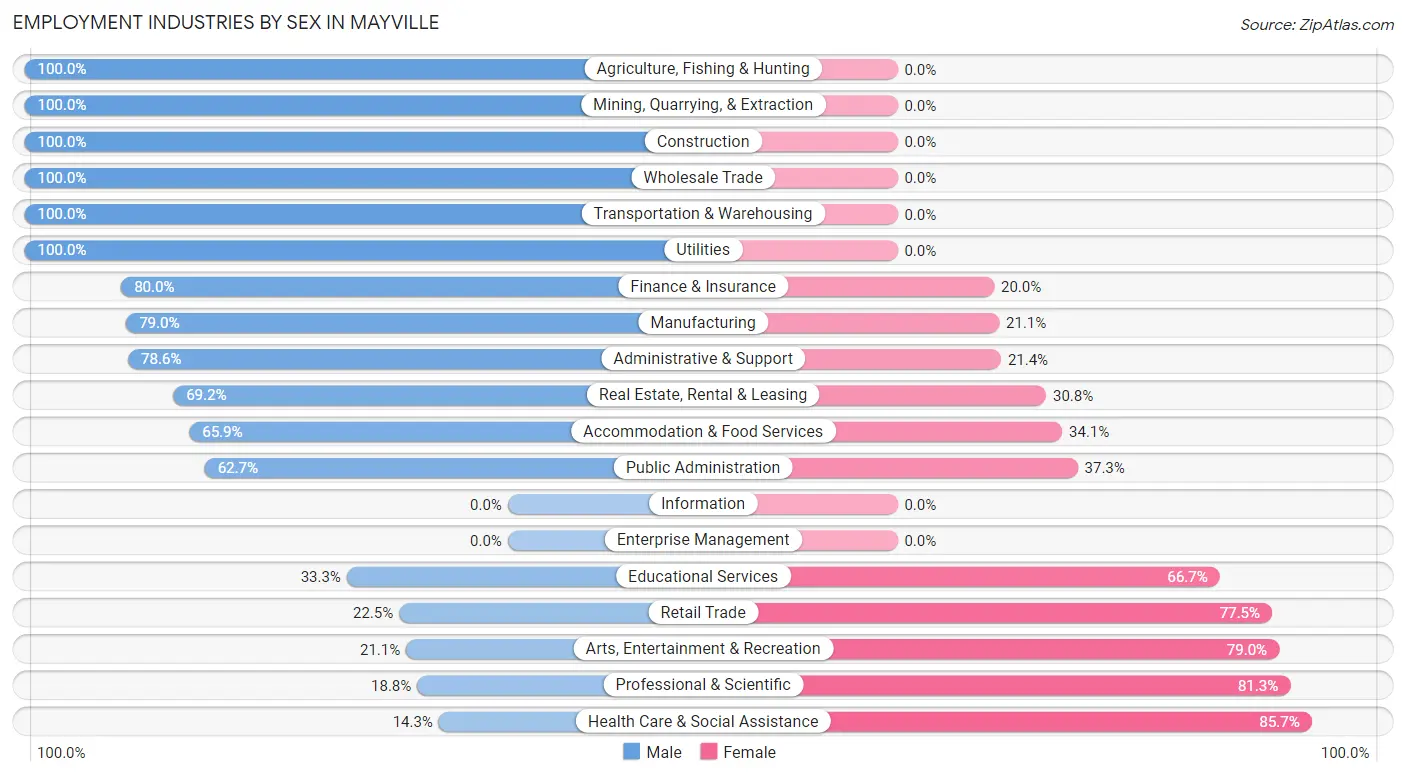
| Industry | Male | Female |
| Agriculture, Fishing & Hunting | 3 (100.0%) | 0 (0.0%) |
| Mining, Quarrying, & Extraction | 5 (100.0%) | 0 (0.0%) |
| Construction | 17 (100.0%) | 0 (0.0%) |
| Manufacturing | 90 (78.9%) | 24 (21.0%) |
| Wholesale Trade | 16 (100.0%) | 0 (0.0%) |
| Retail Trade | 9 (22.5%) | 31 (77.5%) |
| Transportation & Warehousing | 4 (100.0%) | 0 (0.0%) |
| Utilities | 2 (100.0%) | 0 (0.0%) |
| Information | 0 (0.0%) | 0 (0.0%) |
| Finance & Insurance | 12 (80.0%) | 3 (20.0%) |
| Real Estate, Rental & Leasing | 9 (69.2%) | 4 (30.8%) |
| Professional & Scientific | 3 (18.8%) | 13 (81.2%) |
| Enterprise Management | 0 (0.0%) | 0 (0.0%) |
| Administrative & Support | 11 (78.6%) | 3 (21.4%) |
| Educational Services | 14 (33.3%) | 28 (66.7%) |
| Health Care & Social Assistance | 5 (14.3%) | 30 (85.7%) |
| Arts, Entertainment & Recreation | 4 (21.0%) | 15 (78.9%) |
| Accommodation & Food Services | 29 (65.9%) | 15 (34.1%) |
| Public Administration | 37 (62.7%) | 22 (37.3%) |
| Total | 286 (59.5%) | 195 (40.5%) |
Education in Mayville
School Enrollment in Mayville
The most common levels of schooling among the 271 students in Mayville are high school (89 | 32.8%), middle school (56 | 20.7%), and elementary school (44 | 16.2%).
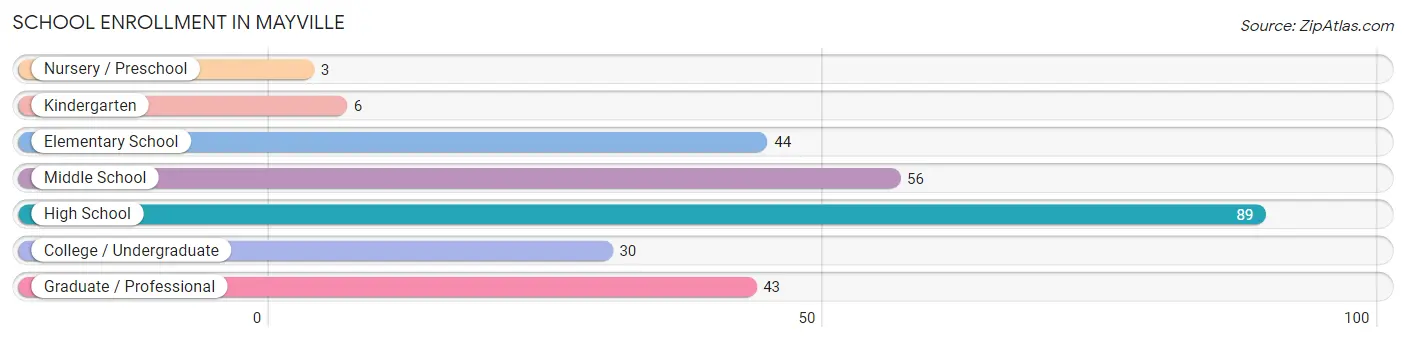
| School Level | # Students | % Students |
| Nursery / Preschool | 3 | 1.1% |
| Kindergarten | 6 | 2.2% |
| Elementary School | 44 | 16.2% |
| Middle School | 56 | 20.7% |
| High School | 89 | 32.8% |
| College / Undergraduate | 30 | 11.1% |
| Graduate / Professional | 43 | 15.9% |
| Total | 271 | 100.0% |
School Enrollment by Age by Funding Source in Mayville
Out of a total of 271 students who are enrolled in schools in Mayville, 45 (16.6%) attend a private institution, while the remaining 226 (83.4%) are enrolled in public schools. The age group of 35 years and over has the highest likelihood of being enrolled in private schools, with 40 (100.0% in the age bracket) enrolled. Conversely, the age group of 5 to 9 year old has the lowest likelihood of being enrolled in a private school, with 53 (100.0% in the age bracket) attending a public institution.
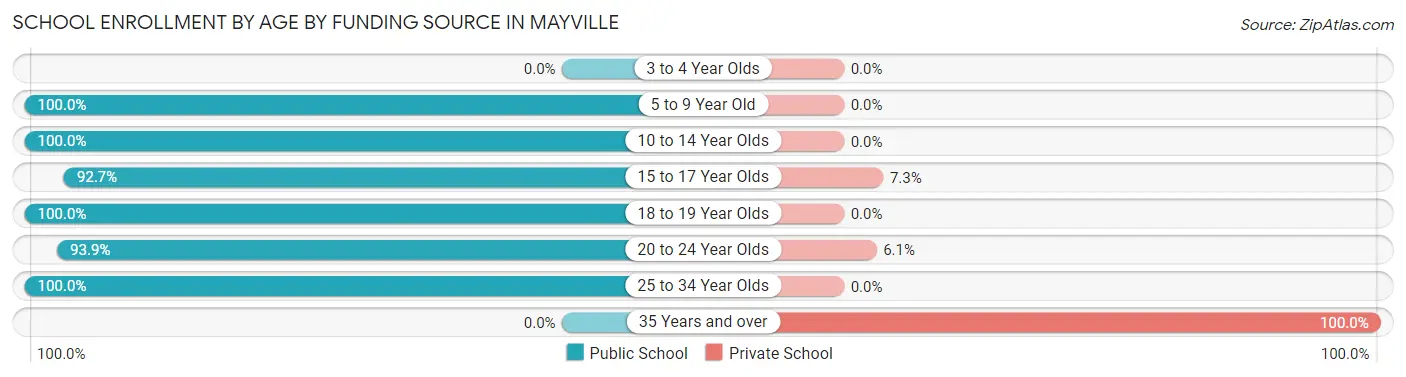
| Age Bracket | Public School | Private School |
| 3 to 4 Year Olds | 0 (0.0%) | 0 (0.0%) |
| 5 to 9 Year Old | 53 (100.0%) | 0 (0.0%) |
| 10 to 14 Year Olds | 66 (100.0%) | 0 (0.0%) |
| 15 to 17 Year Olds | 38 (92.7%) | 3 (7.3%) |
| 18 to 19 Year Olds | 35 (100.0%) | 0 (0.0%) |
| 20 to 24 Year Olds | 31 (93.9%) | 2 (6.1%) |
| 25 to 34 Year Olds | 3 (100.0%) | 0 (0.0%) |
| 35 Years and over | 0 (0.0%) | 40 (100.0%) |
| Total | 226 (83.4%) | 45 (16.6%) |
Educational Attainment by Field of Study in Mayville
Education (79 | 23.2%), bio, nature & agricultural (61 | 17.9%), literature & languages (49 | 14.4%), social sciences (35 | 10.3%), and business (28 | 8.2%) are the most common fields of study among 341 individuals in Mayville who have obtained a bachelor's degree or higher.
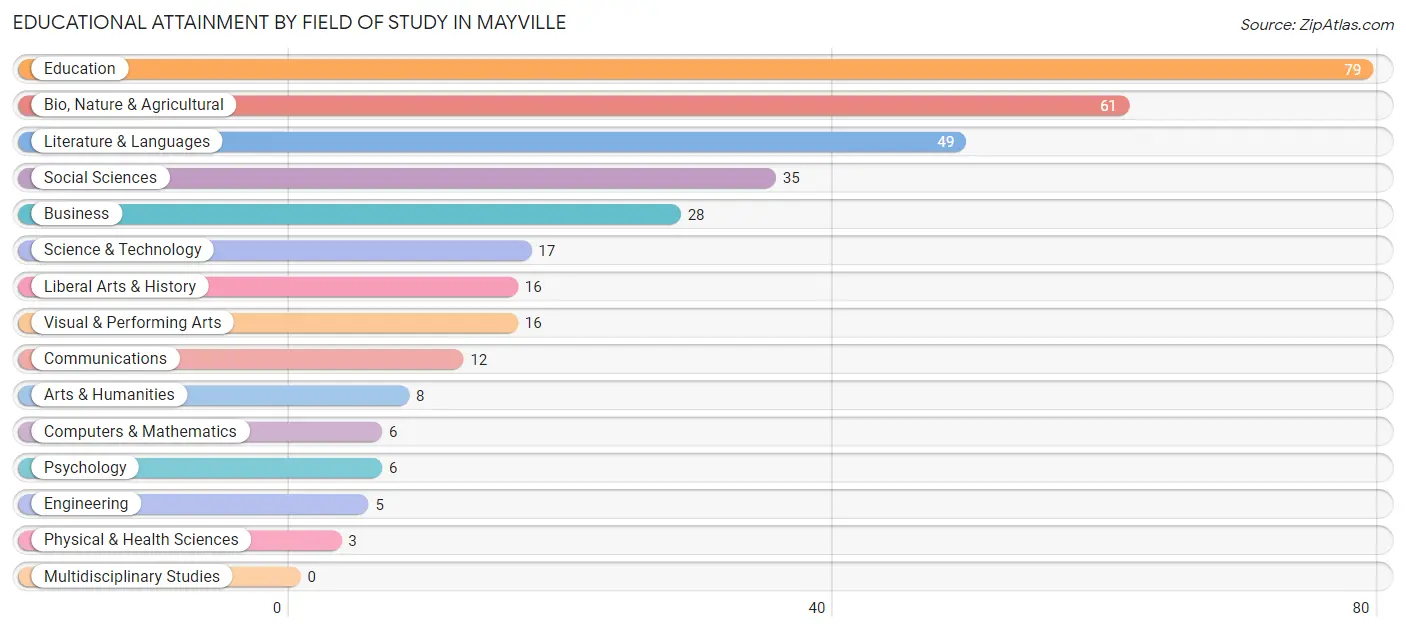
| Field of Study | # Graduates | % Graduates |
| Computers & Mathematics | 6 | 1.8% |
| Bio, Nature & Agricultural | 61 | 17.9% |
| Physical & Health Sciences | 3 | 0.9% |
| Psychology | 6 | 1.8% |
| Social Sciences | 35 | 10.3% |
| Engineering | 5 | 1.5% |
| Multidisciplinary Studies | 0 | 0.0% |
| Science & Technology | 17 | 5.0% |
| Business | 28 | 8.2% |
| Education | 79 | 23.2% |
| Literature & Languages | 49 | 14.4% |
| Liberal Arts & History | 16 | 4.7% |
| Visual & Performing Arts | 16 | 4.7% |
| Communications | 12 | 3.5% |
| Arts & Humanities | 8 | 2.4% |
| Total | 341 | 100.0% |
Transportation & Commute in Mayville
Vehicle Availability by Sex in Mayville
The most prevalent vehicle ownership categories in Mayville are males with 2 vehicles (115, accounting for 40.2%) and females with 2 vehicles (81, making up 59.0%).
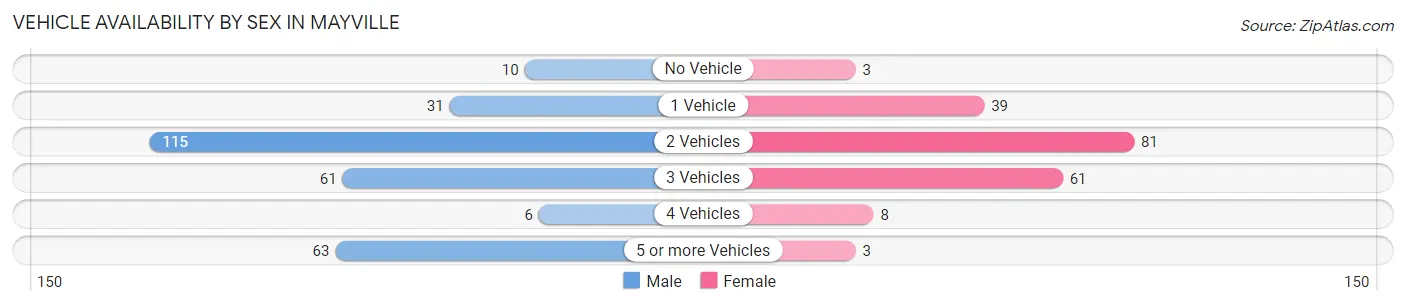
| Vehicles Available | Male | Female |
| No Vehicle | 10 (3.5%) | 3 (1.5%) |
| 1 Vehicle | 31 (10.8%) | 39 (20.0%) |
| 2 Vehicles | 115 (40.2%) | 81 (41.5%) |
| 3 Vehicles | 61 (21.3%) | 61 (31.3%) |
| 4 Vehicles | 6 (2.1%) | 8 (4.1%) |
| 5 or more Vehicles | 63 (22.0%) | 3 (1.5%) |
| Total | 286 (100.0%) | 195 (100.0%) |
Commute Time in Mayville
The most frequently occuring commute durations in Mayville are 5 to 9 minutes (132 commuters, 28.6%), 30 to 34 minutes (80 commuters, 17.3%), and less than 5 minutes (65 commuters, 14.1%).
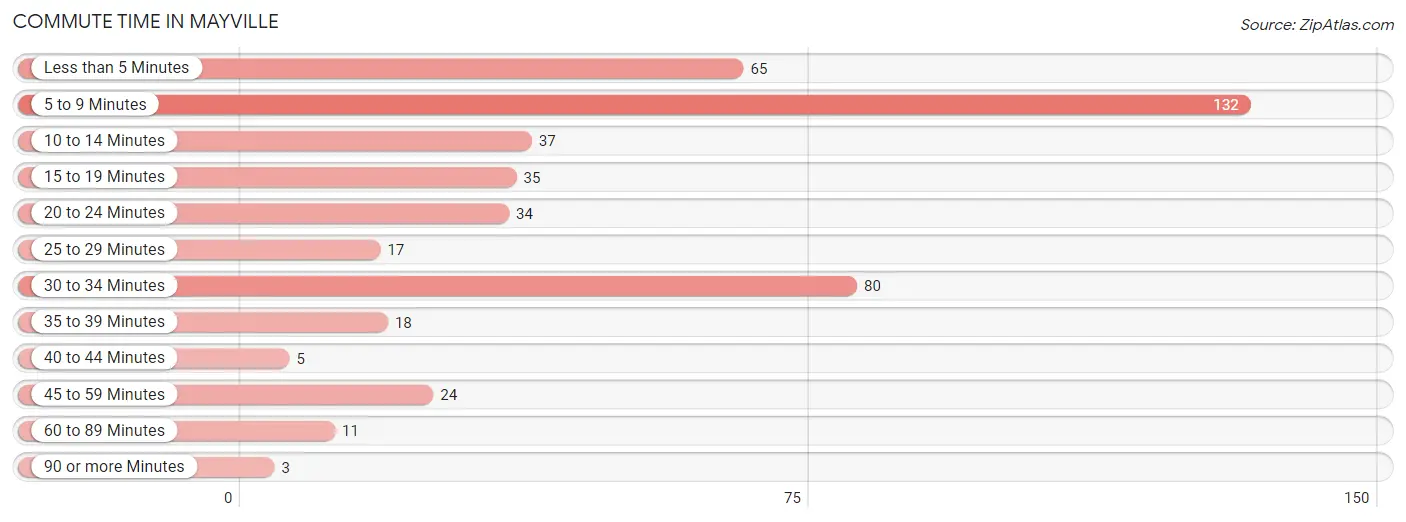
| Commute Time | # Commuters | % Commuters |
| Less than 5 Minutes | 65 | 14.1% |
| 5 to 9 Minutes | 132 | 28.6% |
| 10 to 14 Minutes | 37 | 8.0% |
| 15 to 19 Minutes | 35 | 7.6% |
| 20 to 24 Minutes | 34 | 7.4% |
| 25 to 29 Minutes | 17 | 3.7% |
| 30 to 34 Minutes | 80 | 17.3% |
| 35 to 39 Minutes | 18 | 3.9% |
| 40 to 44 Minutes | 5 | 1.1% |
| 45 to 59 Minutes | 24 | 5.2% |
| 60 to 89 Minutes | 11 | 2.4% |
| 90 or more Minutes | 3 | 0.6% |
Commute Time by Sex in Mayville
The most common commute times in Mayville are 5 to 9 minutes (97 commuters, 34.6%) for males and 5 to 9 minutes (35 commuters, 19.3%) for females.
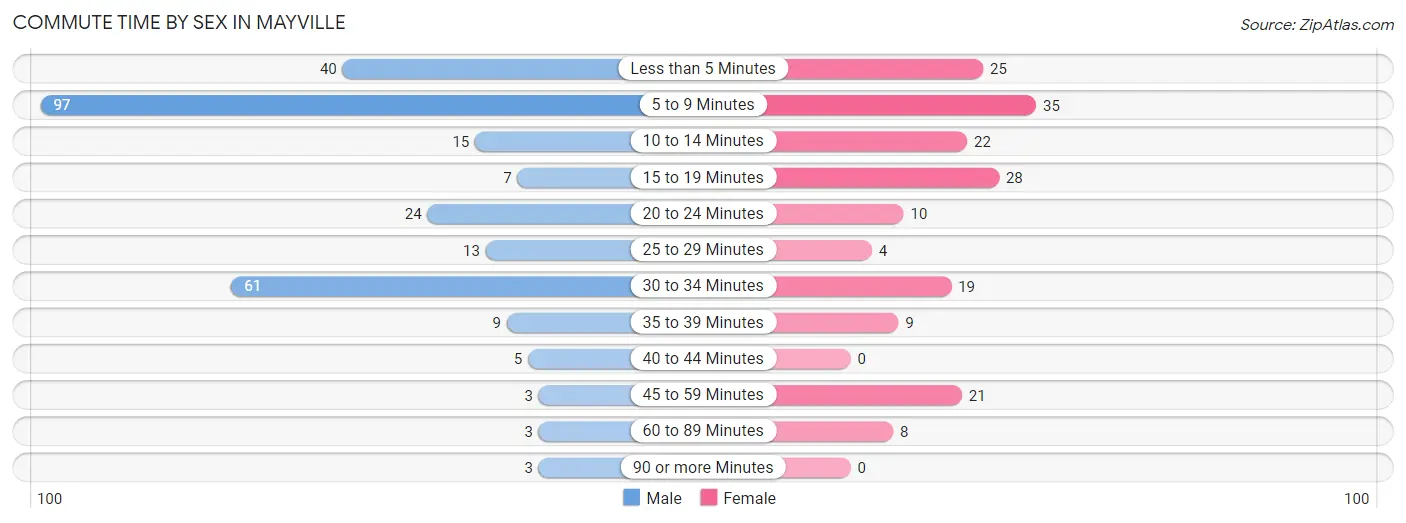
| Commute Time | Male | Female |
| Less than 5 Minutes | 40 (14.3%) | 25 (13.8%) |
| 5 to 9 Minutes | 97 (34.6%) | 35 (19.3%) |
| 10 to 14 Minutes | 15 (5.4%) | 22 (12.1%) |
| 15 to 19 Minutes | 7 (2.5%) | 28 (15.5%) |
| 20 to 24 Minutes | 24 (8.6%) | 10 (5.5%) |
| 25 to 29 Minutes | 13 (4.6%) | 4 (2.2%) |
| 30 to 34 Minutes | 61 (21.8%) | 19 (10.5%) |
| 35 to 39 Minutes | 9 (3.2%) | 9 (5.0%) |
| 40 to 44 Minutes | 5 (1.8%) | 0 (0.0%) |
| 45 to 59 Minutes | 3 (1.1%) | 21 (11.6%) |
| 60 to 89 Minutes | 3 (1.1%) | 8 (4.4%) |
| 90 or more Minutes | 3 (1.1%) | 0 (0.0%) |
Time of Departure to Work by Sex in Mayville
The most frequent times of departure to work in Mayville are 12:00 AM to 4:59 AM (69, 24.6%) for males and 7:00 AM to 7:29 AM (46, 25.4%) for females.
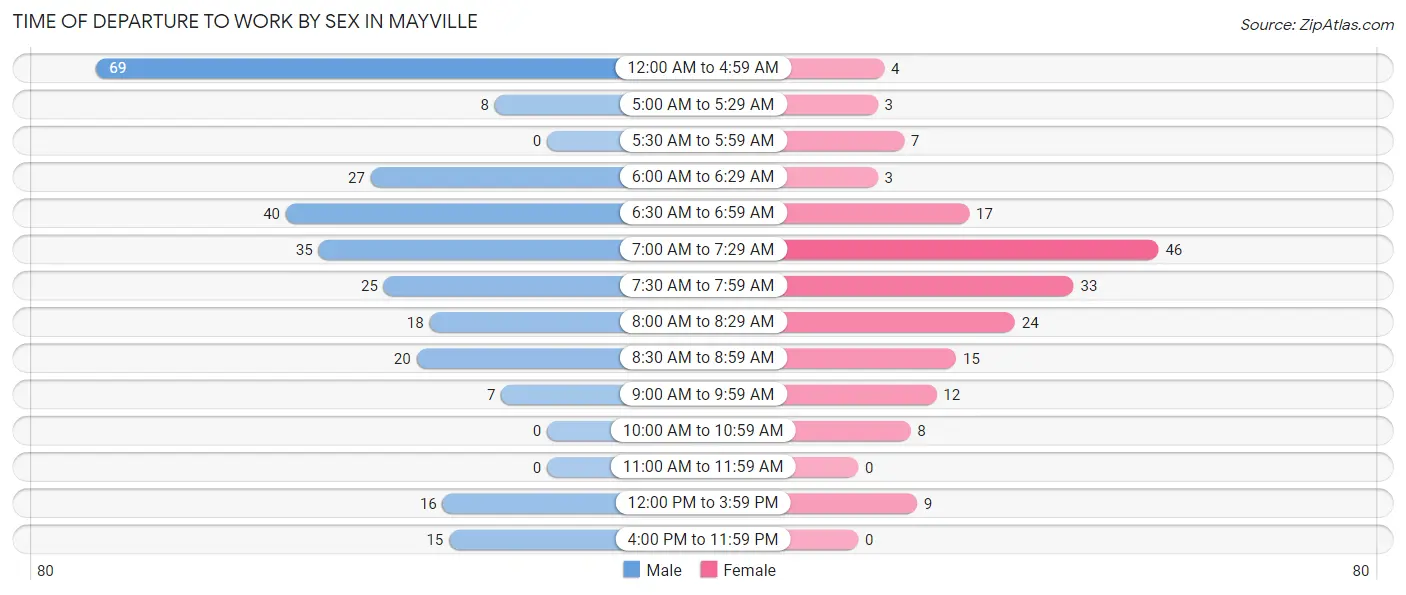
| Time of Departure | Male | Female |
| 12:00 AM to 4:59 AM | 69 (24.6%) | 4 (2.2%) |
| 5:00 AM to 5:29 AM | 8 (2.9%) | 3 (1.7%) |
| 5:30 AM to 5:59 AM | 0 (0.0%) | 7 (3.9%) |
| 6:00 AM to 6:29 AM | 27 (9.6%) | 3 (1.7%) |
| 6:30 AM to 6:59 AM | 40 (14.3%) | 17 (9.4%) |
| 7:00 AM to 7:29 AM | 35 (12.5%) | 46 (25.4%) |
| 7:30 AM to 7:59 AM | 25 (8.9%) | 33 (18.2%) |
| 8:00 AM to 8:29 AM | 18 (6.4%) | 24 (13.3%) |
| 8:30 AM to 8:59 AM | 20 (7.1%) | 15 (8.3%) |
| 9:00 AM to 9:59 AM | 7 (2.5%) | 12 (6.6%) |
| 10:00 AM to 10:59 AM | 0 (0.0%) | 8 (4.4%) |
| 11:00 AM to 11:59 AM | 0 (0.0%) | 0 (0.0%) |
| 12:00 PM to 3:59 PM | 16 (5.7%) | 9 (5.0%) |
| 4:00 PM to 11:59 PM | 15 (5.4%) | 0 (0.0%) |
| Total | 280 (100.0%) | 181 (100.0%) |
Housing Occupancy in Mayville
Occupancy by Ownership in Mayville
Of the total 583 dwellings in Mayville, owner-occupied units account for 422 (72.4%), while renter-occupied units make up 161 (27.6%).
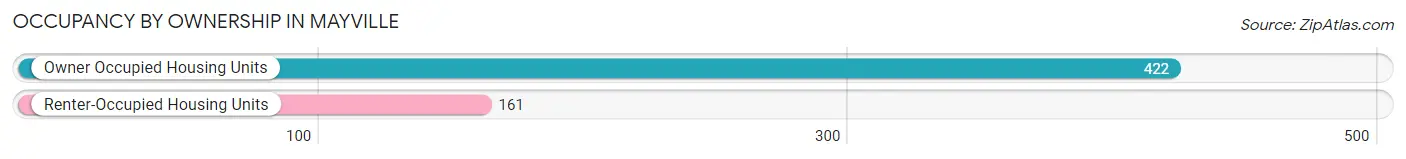
| Occupancy | # Housing Units | % Housing Units |
| Owner Occupied Housing Units | 422 | 72.4% |
| Renter-Occupied Housing Units | 161 | 27.6% |
| Total Occupied Housing Units | 583 | 100.0% |
Occupancy by Household Size in Mayville
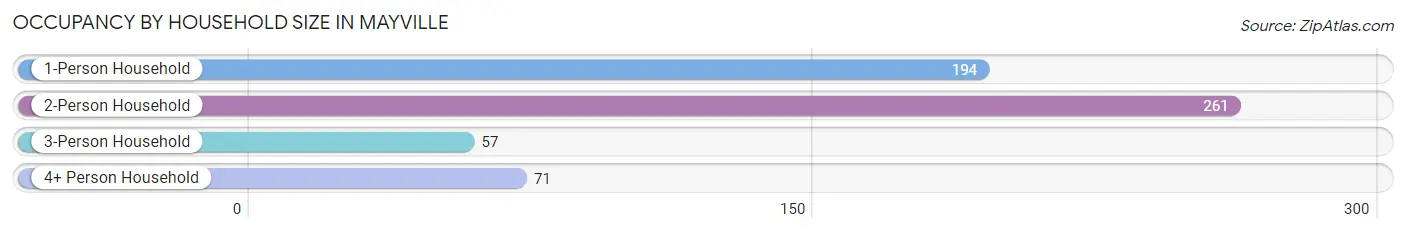
| Household Size | # Housing Units | % Housing Units |
| 1-Person Household | 194 | 33.3% |
| 2-Person Household | 261 | 44.8% |
| 3-Person Household | 57 | 9.8% |
| 4+ Person Household | 71 | 12.2% |
| Total Housing Units | 583 | 100.0% |
Occupancy by Ownership by Household Size in Mayville
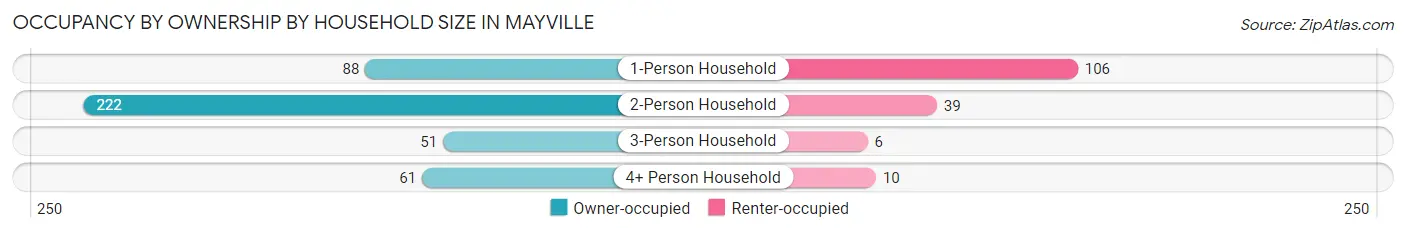
| Household Size | Owner-occupied | Renter-occupied |
| 1-Person Household | 88 (45.4%) | 106 (54.6%) |
| 2-Person Household | 222 (85.1%) | 39 (14.9%) |
| 3-Person Household | 51 (89.5%) | 6 (10.5%) |
| 4+ Person Household | 61 (85.9%) | 10 (14.1%) |
| Total Housing Units | 422 (72.4%) | 161 (27.6%) |
Occupancy by Educational Attainment in Mayville
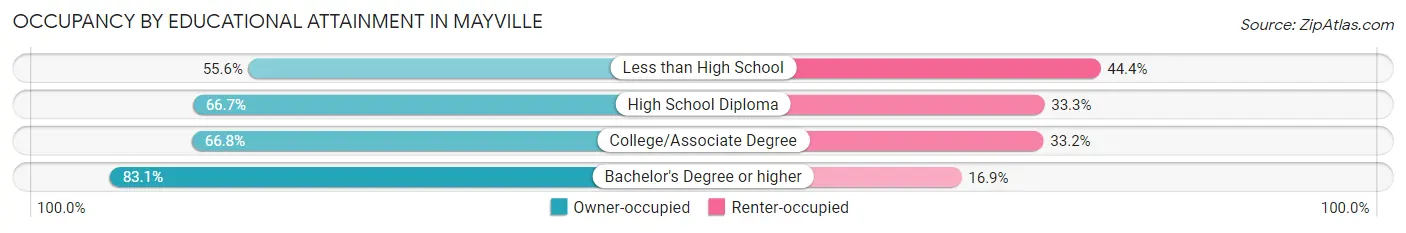
| Household Size | Owner-occupied | Renter-occupied |
| Less than High School | 15 (55.6%) | 12 (44.4%) |
| High School Diploma | 98 (66.7%) | 49 (33.3%) |
| College/Associate Degree | 127 (66.8%) | 63 (33.2%) |
| Bachelor's Degree or higher | 182 (83.1%) | 37 (16.9%) |
Occupancy by Age of Householder in Mayville
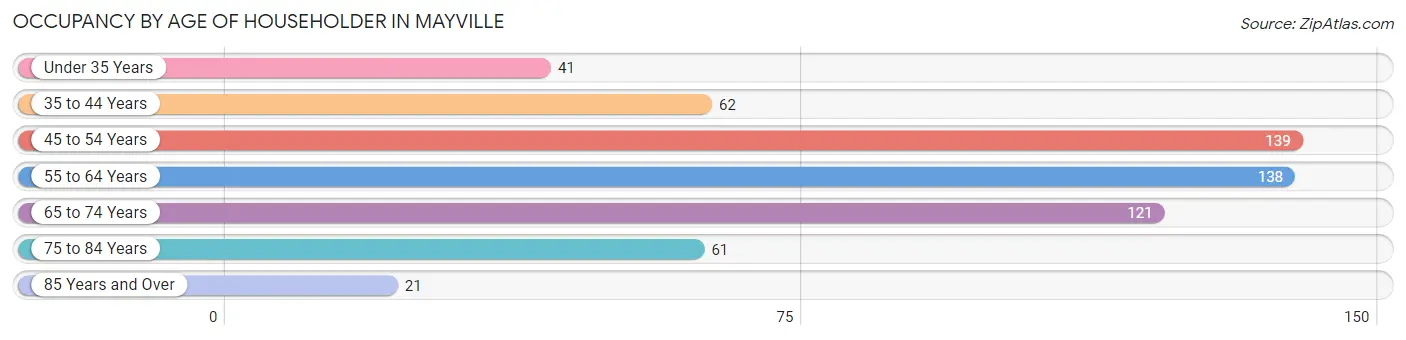
| Age Bracket | # Households | % Households |
| Under 35 Years | 41 | 7.0% |
| 35 to 44 Years | 62 | 10.6% |
| 45 to 54 Years | 139 | 23.8% |
| 55 to 64 Years | 138 | 23.7% |
| 65 to 74 Years | 121 | 20.7% |
| 75 to 84 Years | 61 | 10.5% |
| 85 Years and Over | 21 | 3.6% |
| Total | 583 | 100.0% |
Housing Finances in Mayville
Median Income by Occupancy in Mayville
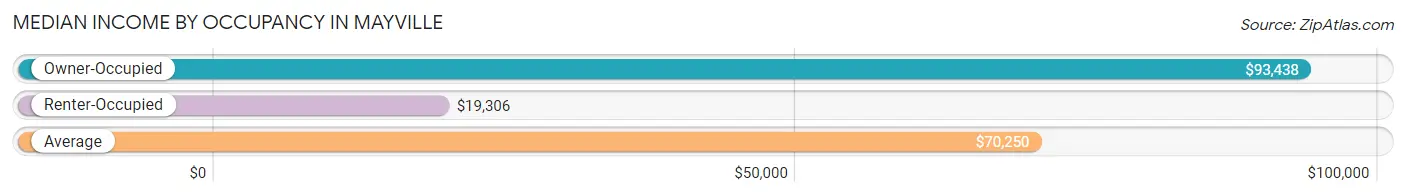
| Occupancy Type | # Households | Median Income |
| Owner-Occupied | 422 (72.4%) | $93,438 |
| Renter-Occupied | 161 (27.6%) | $19,306 |
| Average | 583 (100.0%) | $70,250 |
Occupancy by Householder Income Bracket in Mayville
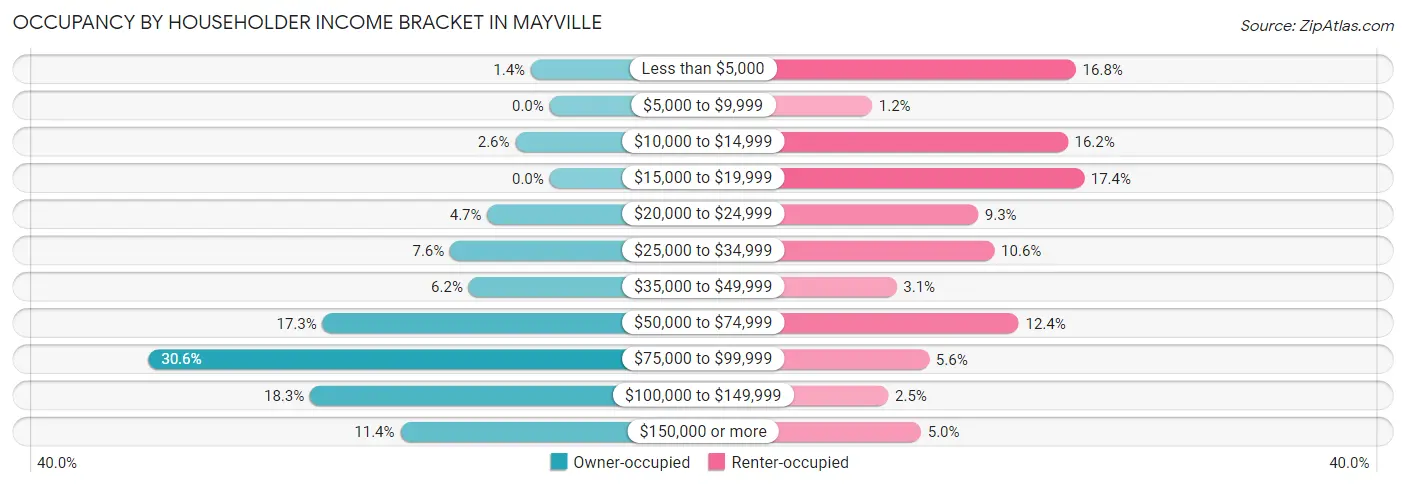
| Income Bracket | Owner-occupied | Renter-occupied |
| Less than $5,000 | 6 (1.4%) | 27 (16.8%) |
| $5,000 to $9,999 | 0 (0.0%) | 2 (1.2%) |
| $10,000 to $14,999 | 11 (2.6%) | 26 (16.2%) |
| $15,000 to $19,999 | 0 (0.0%) | 28 (17.4%) |
| $20,000 to $24,999 | 20 (4.7%) | 15 (9.3%) |
| $25,000 to $34,999 | 32 (7.6%) | 17 (10.6%) |
| $35,000 to $49,999 | 26 (6.2%) | 5 (3.1%) |
| $50,000 to $74,999 | 73 (17.3%) | 20 (12.4%) |
| $75,000 to $99,999 | 129 (30.6%) | 9 (5.6%) |
| $100,000 to $149,999 | 77 (18.2%) | 4 (2.5%) |
| $150,000 or more | 48 (11.4%) | 8 (5.0%) |
| Total | 422 (100.0%) | 161 (100.0%) |
Monthly Housing Cost Tiers in Mayville
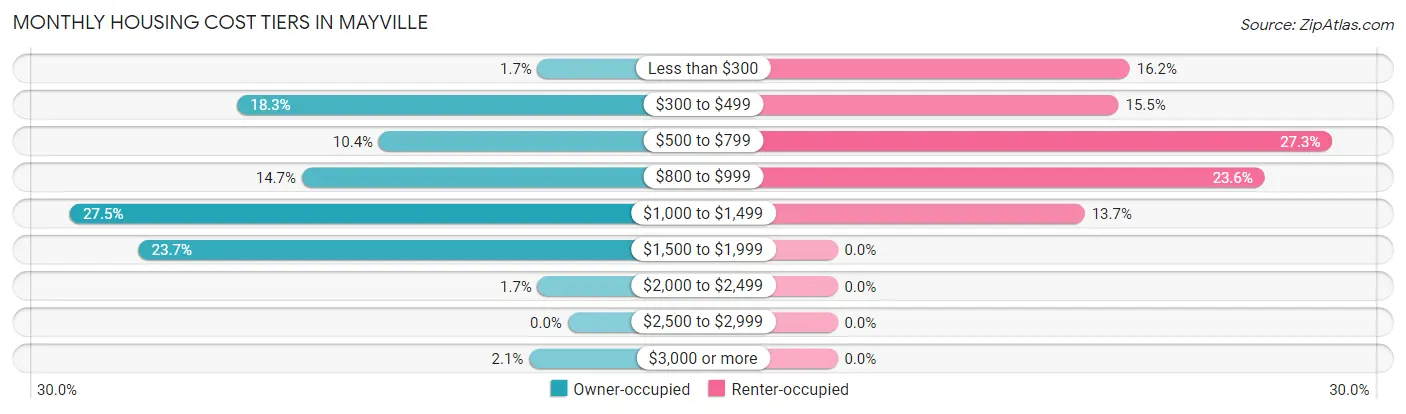
| Monthly Cost | Owner-occupied | Renter-occupied |
| Less than $300 | 7 (1.7%) | 26 (16.2%) |
| $300 to $499 | 77 (18.2%) | 25 (15.5%) |
| $500 to $799 | 44 (10.4%) | 44 (27.3%) |
| $800 to $999 | 62 (14.7%) | 38 (23.6%) |
| $1,000 to $1,499 | 116 (27.5%) | 22 (13.7%) |
| $1,500 to $1,999 | 100 (23.7%) | 0 (0.0%) |
| $2,000 to $2,499 | 7 (1.7%) | 0 (0.0%) |
| $2,500 to $2,999 | 0 (0.0%) | 0 (0.0%) |
| $3,000 or more | 9 (2.1%) | 0 (0.0%) |
| Total | 422 (100.0%) | 161 (100.0%) |
Physical Housing Characteristics in Mayville
Housing Structures in Mayville
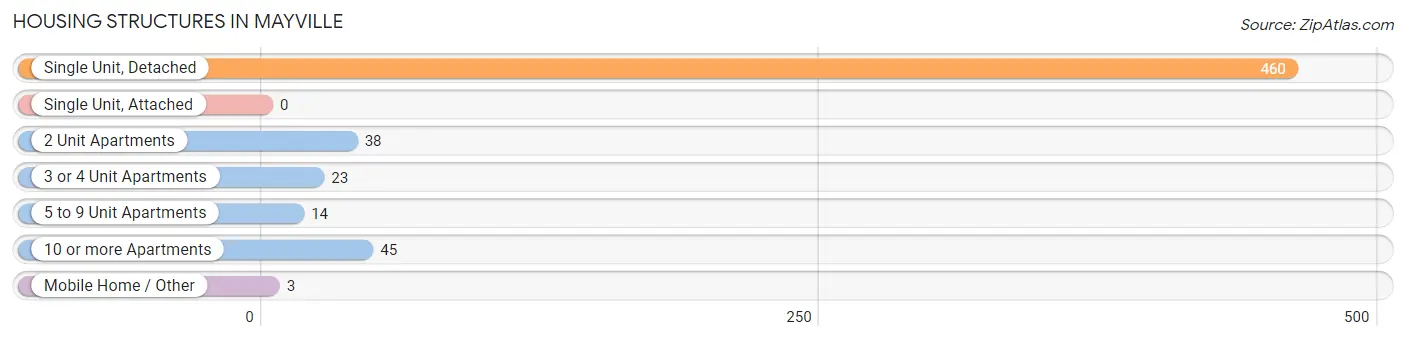
| Structure Type | # Housing Units | % Housing Units |
| Single Unit, Detached | 460 | 78.9% |
| Single Unit, Attached | 0 | 0.0% |
| 2 Unit Apartments | 38 | 6.5% |
| 3 or 4 Unit Apartments | 23 | 4.0% |
| 5 to 9 Unit Apartments | 14 | 2.4% |
| 10 or more Apartments | 45 | 7.7% |
| Mobile Home / Other | 3 | 0.5% |
| Total | 583 | 100.0% |
Housing Structures by Occupancy in Mayville
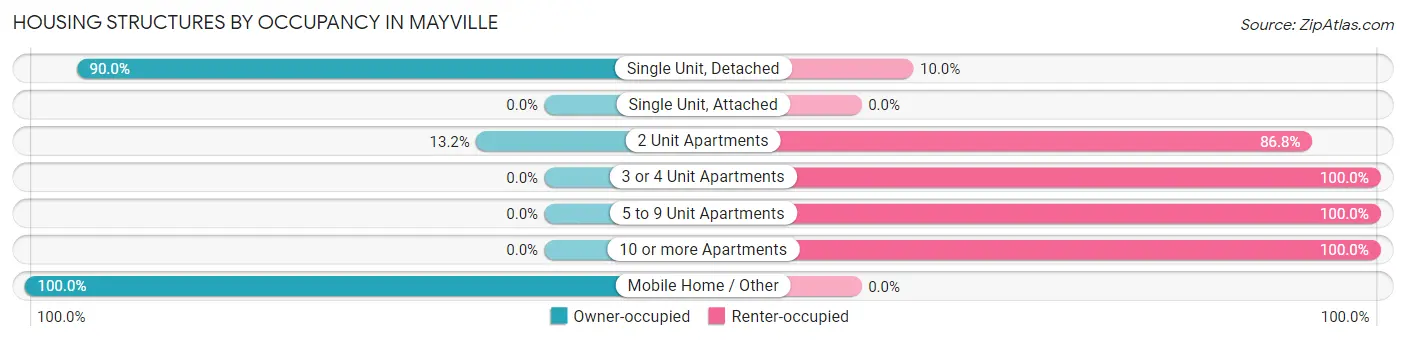
| Structure Type | Owner-occupied | Renter-occupied |
| Single Unit, Detached | 414 (90.0%) | 46 (10.0%) |
| Single Unit, Attached | 0 (0.0%) | 0 (0.0%) |
| 2 Unit Apartments | 5 (13.2%) | 33 (86.8%) |
| 3 or 4 Unit Apartments | 0 (0.0%) | 23 (100.0%) |
| 5 to 9 Unit Apartments | 0 (0.0%) | 14 (100.0%) |
| 10 or more Apartments | 0 (0.0%) | 45 (100.0%) |
| Mobile Home / Other | 3 (100.0%) | 0 (0.0%) |
| Total | 422 (72.4%) | 161 (27.6%) |
Housing Structures by Number of Rooms in Mayville
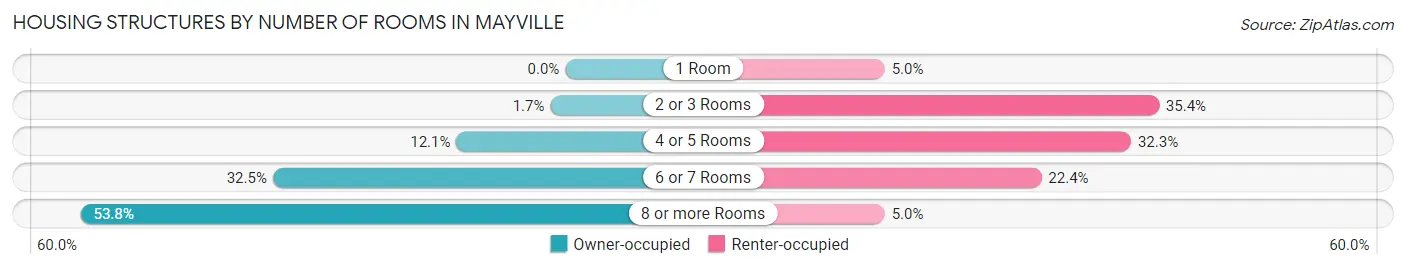
| Number of Rooms | Owner-occupied | Renter-occupied |
| 1 Room | 0 (0.0%) | 8 (5.0%) |
| 2 or 3 Rooms | 7 (1.7%) | 57 (35.4%) |
| 4 or 5 Rooms | 51 (12.1%) | 52 (32.3%) |
| 6 or 7 Rooms | 137 (32.5%) | 36 (22.4%) |
| 8 or more Rooms | 227 (53.8%) | 8 (5.0%) |
| Total | 422 (100.0%) | 161 (100.0%) |
Housing Structure by Heating Type in Mayville
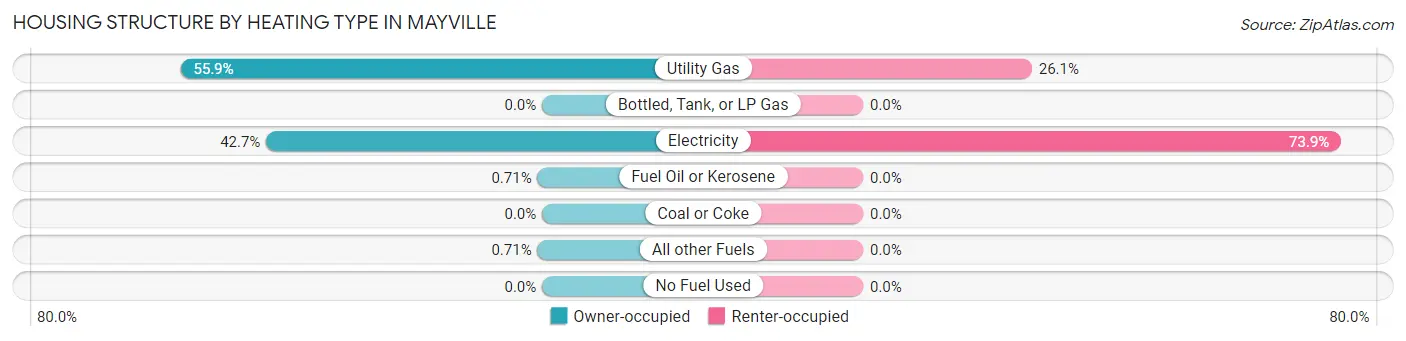
| Heating Type | Owner-occupied | Renter-occupied |
| Utility Gas | 236 (55.9%) | 42 (26.1%) |
| Bottled, Tank, or LP Gas | 0 (0.0%) | 0 (0.0%) |
| Electricity | 180 (42.6%) | 119 (73.9%) |
| Fuel Oil or Kerosene | 3 (0.7%) | 0 (0.0%) |
| Coal or Coke | 0 (0.0%) | 0 (0.0%) |
| All other Fuels | 3 (0.7%) | 0 (0.0%) |
| No Fuel Used | 0 (0.0%) | 0 (0.0%) |
| Total | 422 (100.0%) | 161 (100.0%) |
Household Vehicle Usage in Mayville
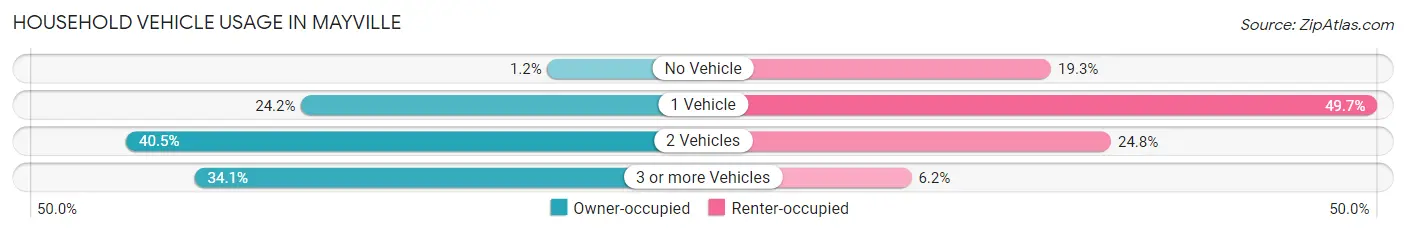
| Vehicles per Household | Owner-occupied | Renter-occupied |
| No Vehicle | 5 (1.2%) | 31 (19.3%) |
| 1 Vehicle | 102 (24.2%) | 80 (49.7%) |
| 2 Vehicles | 171 (40.5%) | 40 (24.8%) |
| 3 or more Vehicles | 144 (34.1%) | 10 (6.2%) |
| Total | 422 (100.0%) | 161 (100.0%) |
Real Estate & Mortgages in Mayville
Real Estate and Mortgage Overview in Mayville
| Characteristic | Without Mortgage | With Mortgage |
| Housing Units | 140 | 282 |
| Median Property Value | $139,100 | $151,700 |
| Median Household Income | $47,188 | $42 |
| Monthly Housing Costs | $485 | $9 |
| Real Estate Taxes | $2,824 | $8 |
Property Value by Mortgage Status in Mayville
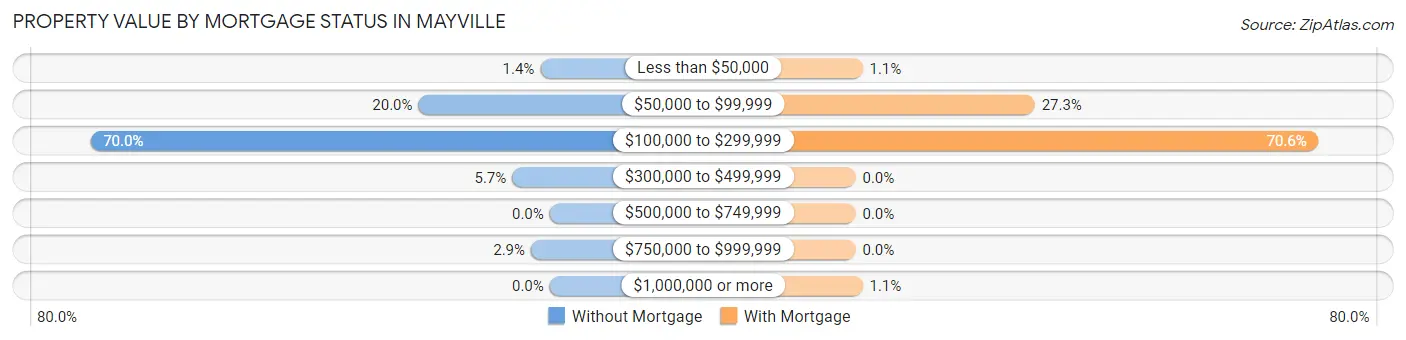
| Property Value | Without Mortgage | With Mortgage |
| Less than $50,000 | 2 (1.4%) | 3 (1.1%) |
| $50,000 to $99,999 | 28 (20.0%) | 77 (27.3%) |
| $100,000 to $299,999 | 98 (70.0%) | 199 (70.6%) |
| $300,000 to $499,999 | 8 (5.7%) | 0 (0.0%) |
| $500,000 to $749,999 | 0 (0.0%) | 0 (0.0%) |
| $750,000 to $999,999 | 4 (2.9%) | 0 (0.0%) |
| $1,000,000 or more | 0 (0.0%) | 3 (1.1%) |
| Total | 140 (100.0%) | 282 (100.0%) |
Household Income by Mortgage Status in Mayville
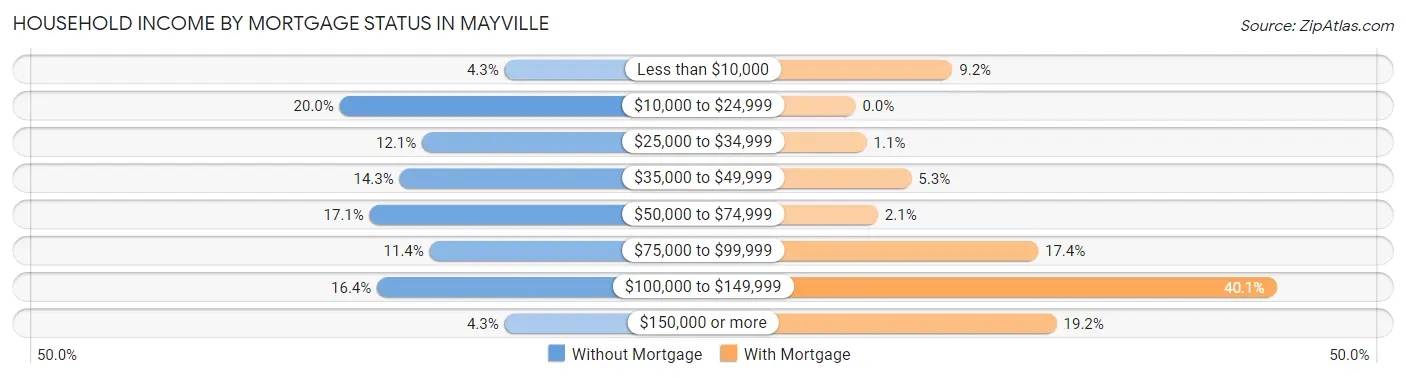
| Household Income | Without Mortgage | With Mortgage |
| Less than $10,000 | 6 (4.3%) | 26 (9.2%) |
| $10,000 to $24,999 | 28 (20.0%) | 0 (0.0%) |
| $25,000 to $34,999 | 17 (12.1%) | 3 (1.1%) |
| $35,000 to $49,999 | 20 (14.3%) | 15 (5.3%) |
| $50,000 to $74,999 | 24 (17.1%) | 6 (2.1%) |
| $75,000 to $99,999 | 16 (11.4%) | 49 (17.4%) |
| $100,000 to $149,999 | 23 (16.4%) | 113 (40.1%) |
| $150,000 or more | 6 (4.3%) | 54 (19.2%) |
| Total | 140 (100.0%) | 282 (100.0%) |
Property Value to Household Income Ratio in Mayville
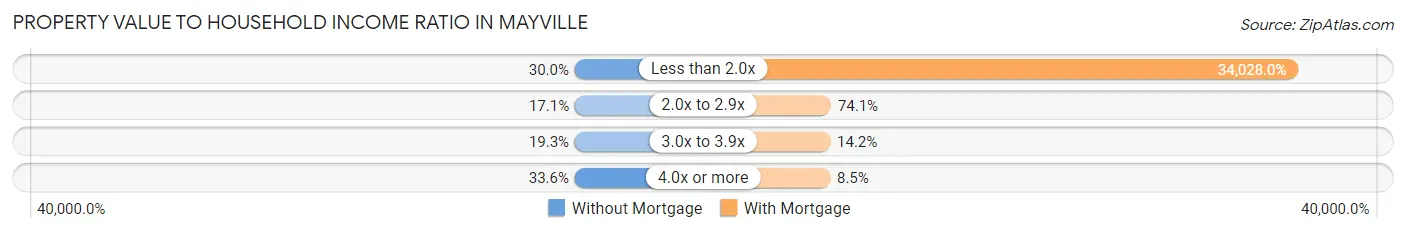
| Value-to-Income Ratio | Without Mortgage | With Mortgage |
| Less than 2.0x | 42 (30.0%) | 95,959 (34,028.0%) |
| 2.0x to 2.9x | 24 (17.1%) | 209 (74.1%) |
| 3.0x to 3.9x | 27 (19.3%) | 40 (14.2%) |
| 4.0x or more | 47 (33.6%) | 24 (8.5%) |
| Total | 140 (100.0%) | 282 (100.0%) |
Real Estate Taxes by Mortgage Status in Mayville
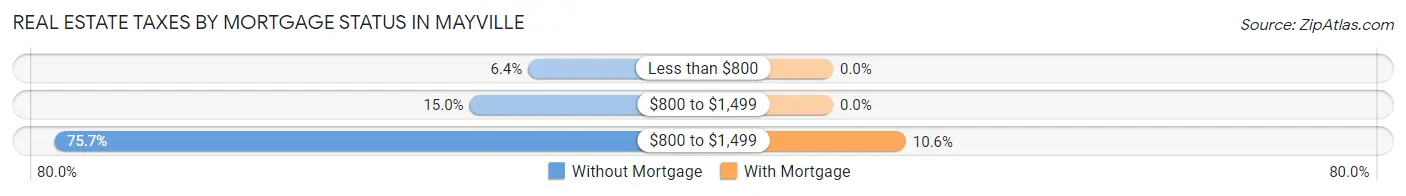
| Property Taxes | Without Mortgage | With Mortgage |
| Less than $800 | 9 (6.4%) | 0 (0.0%) |
| $800 to $1,499 | 21 (15.0%) | 0 (0.0%) |
| $800 to $1,499 | 106 (75.7%) | 30 (10.6%) |
| Total | 140 (100.0%) | 282 (100.0%) |
Health & Disability in Mayville
Health Insurance Coverage by Age in Mayville
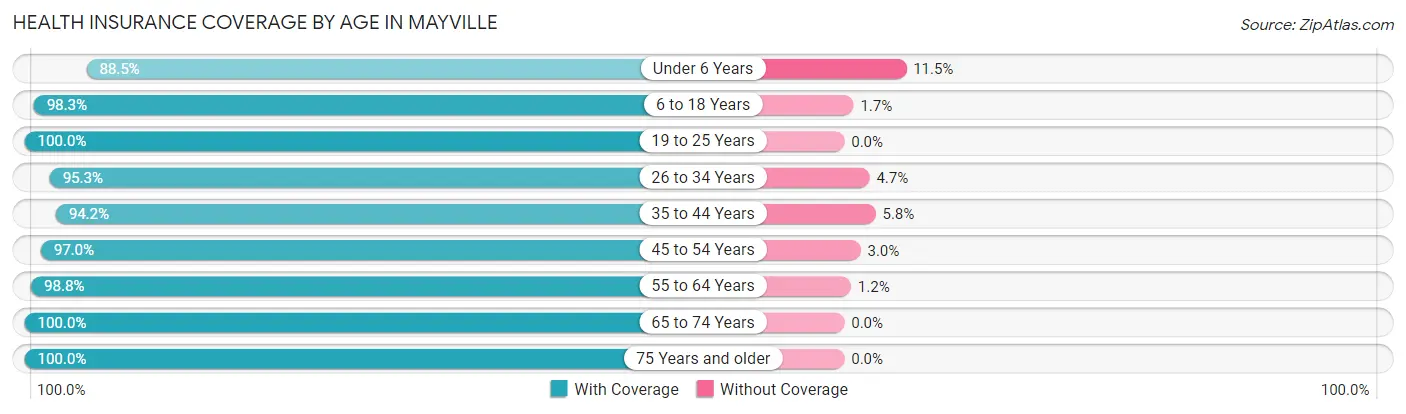
| Age Bracket | With Coverage | Without Coverage |
| Under 6 Years | 46 (88.5%) | 6 (11.5%) |
| 6 to 18 Years | 172 (98.3%) | 3 (1.7%) |
| 19 to 25 Years | 49 (100.0%) | 0 (0.0%) |
| 26 to 34 Years | 61 (95.3%) | 3 (4.7%) |
| 35 to 44 Years | 97 (94.2%) | 6 (5.8%) |
| 45 to 54 Years | 192 (97.0%) | 6 (3.0%) |
| 55 to 64 Years | 241 (98.8%) | 3 (1.2%) |
| 65 to 74 Years | 181 (100.0%) | 0 (0.0%) |
| 75 Years and older | 123 (100.0%) | 0 (0.0%) |
| Total | 1,162 (97.7%) | 27 (2.3%) |
Health Insurance Coverage by Citizenship Status in Mayville
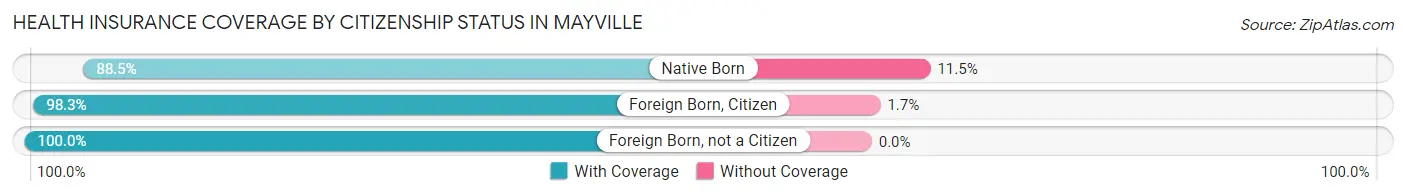
| Citizenship Status | With Coverage | Without Coverage |
| Native Born | 46 (88.5%) | 6 (11.5%) |
| Foreign Born, Citizen | 172 (98.3%) | 3 (1.7%) |
| Foreign Born, not a Citizen | 49 (100.0%) | 0 (0.0%) |
Health Insurance Coverage by Household Income in Mayville
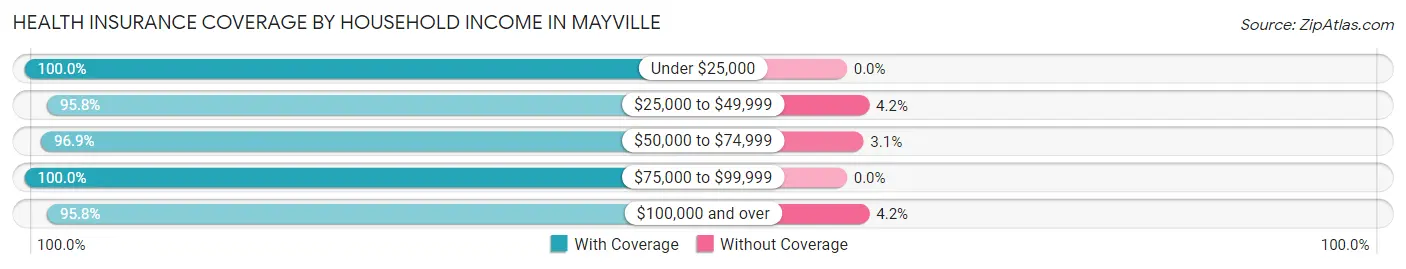
| Household Income | With Coverage | Without Coverage |
| Under $25,000 | 177 (100.0%) | 0 (0.0%) |
| $25,000 to $49,999 | 160 (95.8%) | 7 (4.2%) |
| $50,000 to $74,999 | 187 (96.9%) | 6 (3.1%) |
| $75,000 to $99,999 | 320 (100.0%) | 0 (0.0%) |
| $100,000 and over | 318 (95.8%) | 14 (4.2%) |
Public vs Private Health Insurance Coverage by Age in Mayville
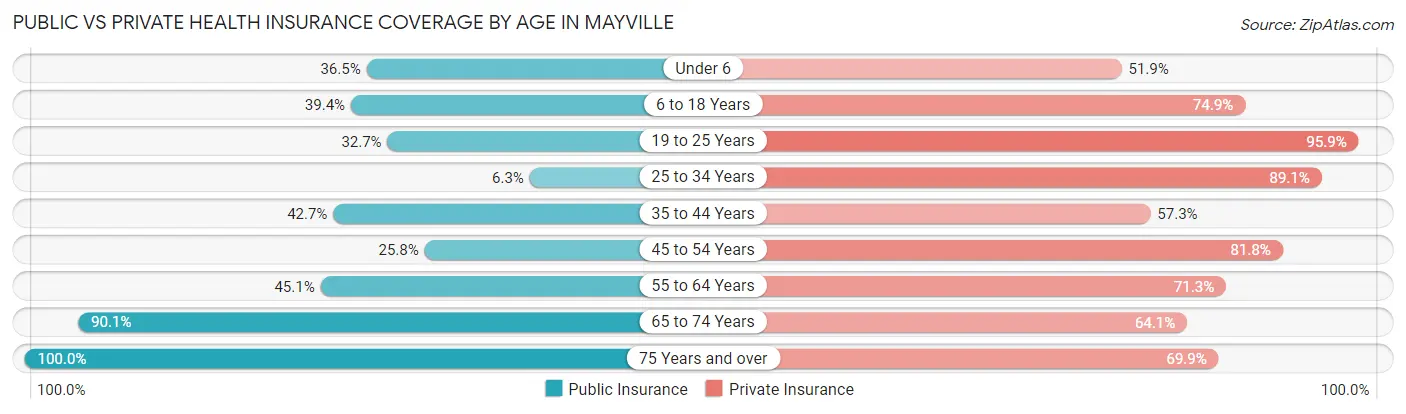
| Age Bracket | Public Insurance | Private Insurance |
| Under 6 | 19 (36.5%) | 27 (51.9%) |
| 6 to 18 Years | 69 (39.4%) | 131 (74.9%) |
| 19 to 25 Years | 16 (32.7%) | 47 (95.9%) |
| 25 to 34 Years | 4 (6.2%) | 57 (89.1%) |
| 35 to 44 Years | 44 (42.7%) | 59 (57.3%) |
| 45 to 54 Years | 51 (25.8%) | 162 (81.8%) |
| 55 to 64 Years | 110 (45.1%) | 174 (71.3%) |
| 65 to 74 Years | 163 (90.1%) | 116 (64.1%) |
| 75 Years and over | 123 (100.0%) | 86 (69.9%) |
| Total | 599 (50.4%) | 859 (72.3%) |
Disability Status by Sex by Age in Mayville
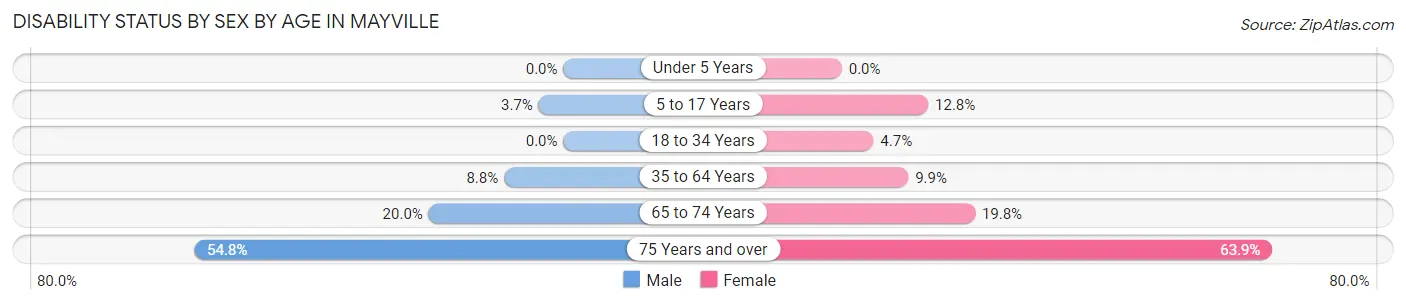
| Age Bracket | Male | Female |
| Under 5 Years | 0 (0.0%) | 0 (0.0%) |
| 5 to 17 Years | 3 (3.7%) | 10 (12.8%) |
| 18 to 34 Years | 0 (0.0%) | 3 (4.7%) |
| 35 to 64 Years | 23 (8.8%) | 28 (9.9%) |
| 65 to 74 Years | 19 (20.0%) | 17 (19.8%) |
| 75 Years and over | 34 (54.8%) | 39 (63.9%) |
Disability Class by Sex by Age in Mayville
Disability Class: Hearing Difficulty
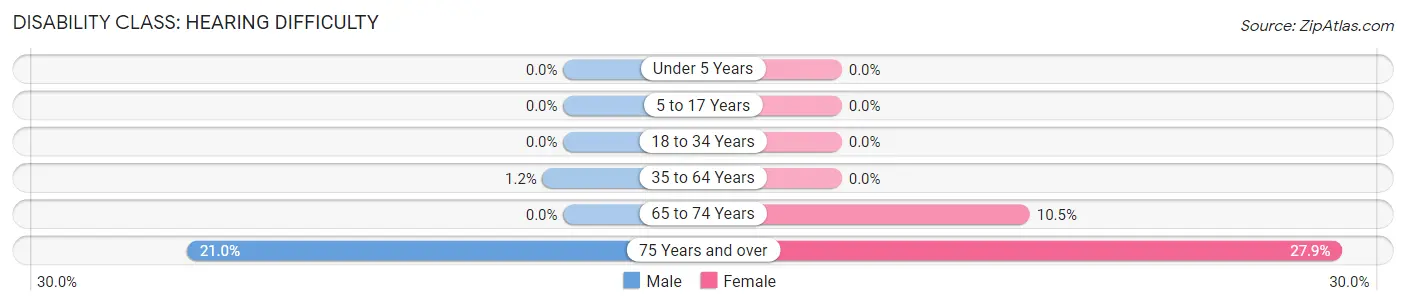
| Age Bracket | Male | Female |
| Under 5 Years | 0 (0.0%) | 0 (0.0%) |
| 5 to 17 Years | 0 (0.0%) | 0 (0.0%) |
| 18 to 34 Years | 0 (0.0%) | 0 (0.0%) |
| 35 to 64 Years | 3 (1.1%) | 0 (0.0%) |
| 65 to 74 Years | 0 (0.0%) | 9 (10.5%) |
| 75 Years and over | 13 (21.0%) | 17 (27.9%) |
Disability Class: Vision Difficulty
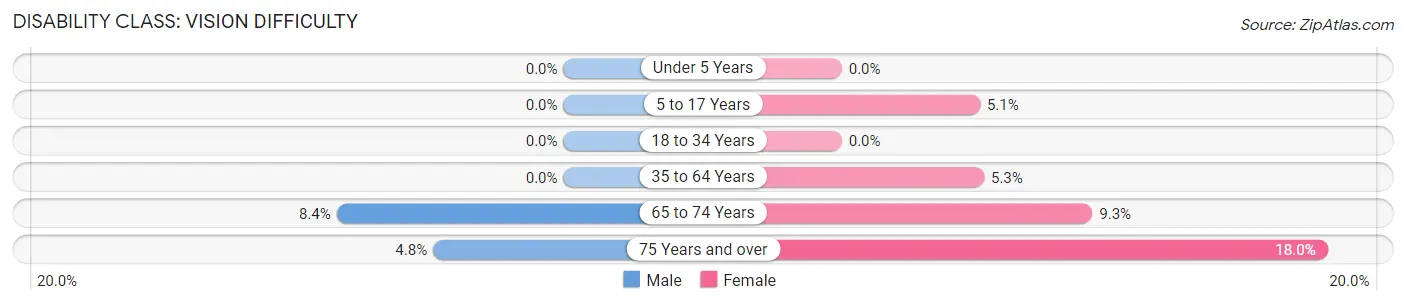
| Age Bracket | Male | Female |
| Under 5 Years | 0 (0.0%) | 0 (0.0%) |
| 5 to 17 Years | 0 (0.0%) | 4 (5.1%) |
| 18 to 34 Years | 0 (0.0%) | 0 (0.0%) |
| 35 to 64 Years | 0 (0.0%) | 15 (5.3%) |
| 65 to 74 Years | 8 (8.4%) | 8 (9.3%) |
| 75 Years and over | 3 (4.8%) | 11 (18.0%) |
Disability Class: Cognitive Difficulty
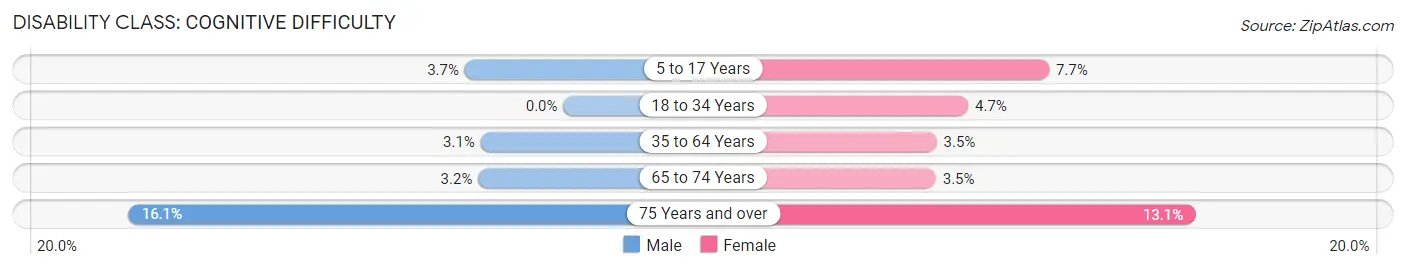
| Age Bracket | Male | Female |
| 5 to 17 Years | 3 (3.7%) | 6 (7.7%) |
| 18 to 34 Years | 0 (0.0%) | 3 (4.7%) |
| 35 to 64 Years | 8 (3.1%) | 10 (3.5%) |
| 65 to 74 Years | 3 (3.2%) | 3 (3.5%) |
| 75 Years and over | 10 (16.1%) | 8 (13.1%) |
Disability Class: Ambulatory Difficulty
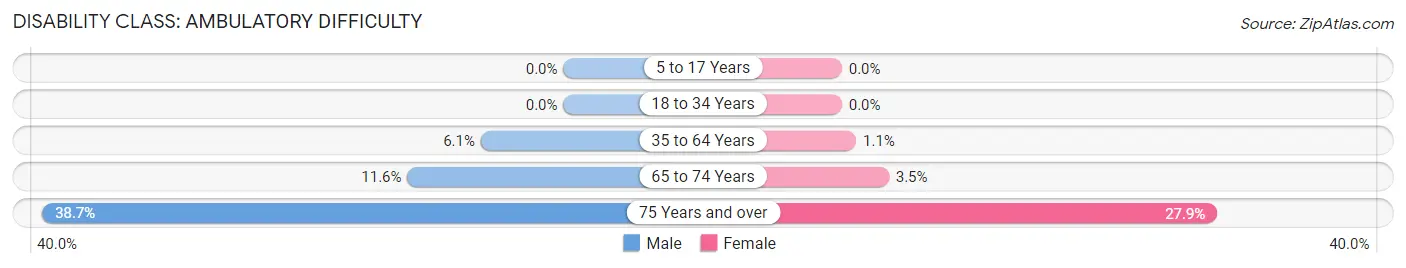
| Age Bracket | Male | Female |
| 5 to 17 Years | 0 (0.0%) | 0 (0.0%) |
| 18 to 34 Years | 0 (0.0%) | 0 (0.0%) |
| 35 to 64 Years | 16 (6.1%) | 3 (1.1%) |
| 65 to 74 Years | 11 (11.6%) | 3 (3.5%) |
| 75 Years and over | 24 (38.7%) | 17 (27.9%) |
Disability Class: Self-Care Difficulty
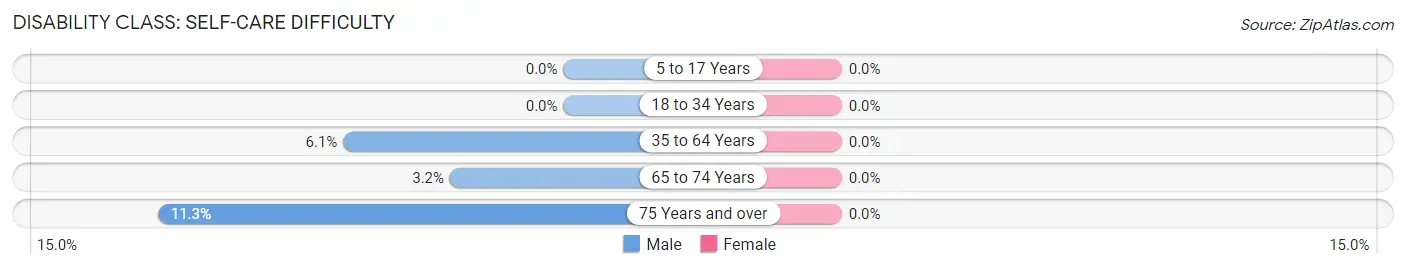
| Age Bracket | Male | Female |
| 5 to 17 Years | 0 (0.0%) | 0 (0.0%) |
| 18 to 34 Years | 0 (0.0%) | 0 (0.0%) |
| 35 to 64 Years | 16 (6.1%) | 0 (0.0%) |
| 65 to 74 Years | 3 (3.2%) | 0 (0.0%) |
| 75 Years and over | 7 (11.3%) | 0 (0.0%) |
Technology Access in Mayville
Computing Device Access in Mayville
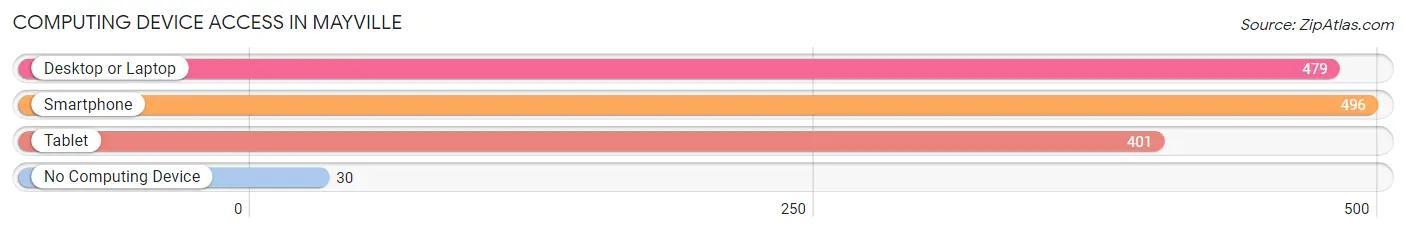
| Device Type | # Households | % Households |
| Desktop or Laptop | 479 | 82.2% |
| Smartphone | 496 | 85.1% |
| Tablet | 401 | 68.8% |
| No Computing Device | 30 | 5.1% |
| Total | 583 | 100.0% |
Internet Access in Mayville
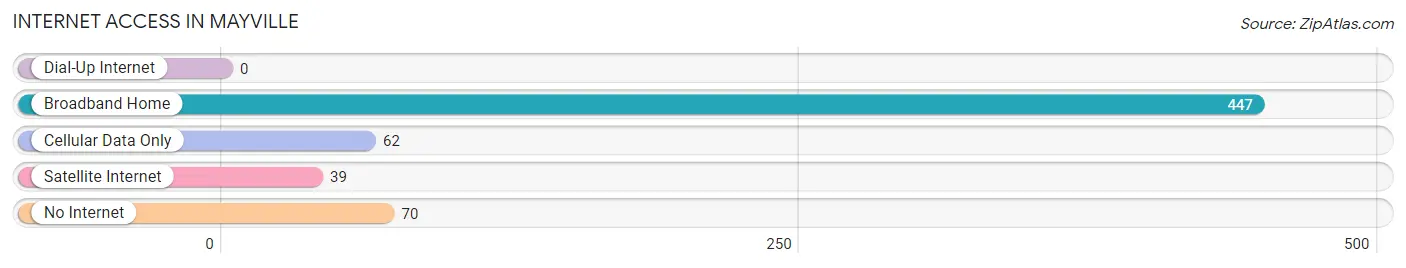
| Internet Type | # Households | % Households |
| Dial-Up Internet | 0 | 0.0% |
| Broadband Home | 447 | 76.7% |
| Cellular Data Only | 62 | 10.6% |
| Satellite Internet | 39 | 6.7% |
| No Internet | 70 | 12.0% |
| Total | 583 | 100.0% |
Mayville Summary
Mayville, NY is a small village located in Chautauqua County, New York. It is situated on the eastern shore of Chautauqua Lake, and is part of the Jamestown-Dunkirk-Fredonia metropolitan area. The village has a population of approximately 1,500 people, and is the county seat of Chautauqua County.
History
Mayville was first settled in 1808 by a group of settlers from Connecticut. The village was originally known as “New Connecticut”, and was later renamed Mayville in 1812. The village was incorporated in 1848, and was named after the May family, who were among the first settlers.
The village was an important port on Chautauqua Lake, and was a major stop on the Underground Railroad. During the Civil War, the village was a major supplier of food and supplies to the Union Army.
Geography
Mayville is located in the southwestern corner of Chautauqua County, and is situated on the eastern shore of Chautauqua Lake. The village is bordered by the towns of Chautauqua, Ellery, and North Harmony. The village is located approximately 30 miles south of Buffalo, and is approximately 60 miles northwest of Erie, Pennsylvania.
The village is situated in a hilly region, and is surrounded by forests and farmland. The village is located at an elevation of 1,100 feet above sea level.
Economy
The economy of Mayville is largely based on tourism and agriculture. The village is a popular destination for fishing, boating, and other outdoor activities. The village is also home to several wineries, and is a popular destination for wine tasting.
Agriculture is also an important part of the local economy. The village is home to several farms, and produces a variety of crops, including corn, soybeans, and hay.
Demographics
As of the 2010 census, the population of Mayville was 1,521. The racial makeup of the village was 97.2% White, 0.7% African American, 0.3% Native American, 0.3% Asian, 0.1% Pacific Islander, 0.3% from other races, and 1.2% from two or more races. Hispanic or Latino of any race were 1.2% of the population.
The median household income in Mayville was $41,250, and the median family income was $50,000. The per capita income for the village was $20,845. About 11.2% of families and 14.2% of the population were below the poverty line, including 18.2% of those under age 18 and 8.2% of those age 65 or over.
Common Questions
What is Per Capita Income in Mayville?
Per Capita income in Mayville is $33,605.
What is the Median Family Income in Mayville?
Median Family Income in Mayville is $95,726.
What is the Median Household income in Mayville?
Median Household Income in Mayville is $70,250.
What is Income or Wage Gap in Mayville?
Income or Wage Gap in Mayville is 63.2%.
Women in Mayville earn 36.8 cents for every dollar earned by a man.
What is Inequality or Gini Index in Mayville?
Inequality or Gini Index in Mayville is 0.41.
What is the Total Population of Mayville?
Total Population of Mayville is 1,355.
What is the Total Male Population of Mayville?
Total Male Population of Mayville is 725.
What is the Total Female Population of Mayville?
Total Female Population of Mayville is 630.
What is the Ratio of Males per 100 Females in Mayville?
There are 115.08 Males per 100 Females in Mayville.
What is the Ratio of Females per 100 Males in Mayville?
There are 86.90 Females per 100 Males in Mayville.
What is the Median Population Age in Mayville?
Median Population Age in Mayville is 48.7 Years.
What is the Average Family Size in Mayville
Average Family Size in Mayville is 2.5 People.
What is the Average Household Size in Mayville
Average Household Size in Mayville is 2.0 People.
How Large is the Labor Force in Mayville?
There are 521 People in the Labor Forcein in Mayville.
What is the Percentage of People in the Labor Force in Mayville?
44.1% of People are in the Labor Force in Mayville.
What is the Unemployment Rate in Mayville?
Unemployment Rate in Mayville is 7.7%.