Marathon, NY Map & Demographics
Marathon Map
Marathon Overview
$24,073
PER CAPITA INCOME
$78,500
AVG FAMILY INCOME
$54,000
AVG HOUSEHOLD INCOME
9.8%
WAGE / INCOME GAP [ % ]
90.2¢/ $1
WAGE / INCOME GAP [ $ ]
0.33
INEQUALITY / GINI INDEX
1,036
TOTAL POPULATION
501
MALE POPULATION
535
FEMALE POPULATION
93.64
MALES / 100 FEMALES
106.79
FEMALES / 100 MALES
29.1
MEDIAN AGE
3.4
AVG FAMILY SIZE
2.9
AVG HOUSEHOLD SIZE
515
LABOR FORCE [ PEOPLE ]
68.7%
PERCENT IN LABOR FORCE
7.0%
UNEMPLOYMENT RATE
Marathon Zip Codes
Marathon Area Codes
Income in Marathon
Income Overview in Marathon
Per Capita Income in Marathon is $24,073, while median incomes of families and households are $78,500 and $54,000 respectively.
| Characteristic | Number | Measure |
| Per Capita Income | 1,036 | $24,073 |
| Median Family Income | 260 | $78,500 |
| Mean Family Income | 260 | $80,654 |
| Median Household Income | 358 | $54,000 |
| Mean Household Income | 358 | $73,168 |
| Income Deficit | 260 | $0 |
| Wage / Income Gap (%) | 1,036 | 9.80% |
| Wage / Income Gap ($) | 1,036 | 90.20¢ per $1 |
| Gini / Inequality Index | 1,036 | 0.33 |
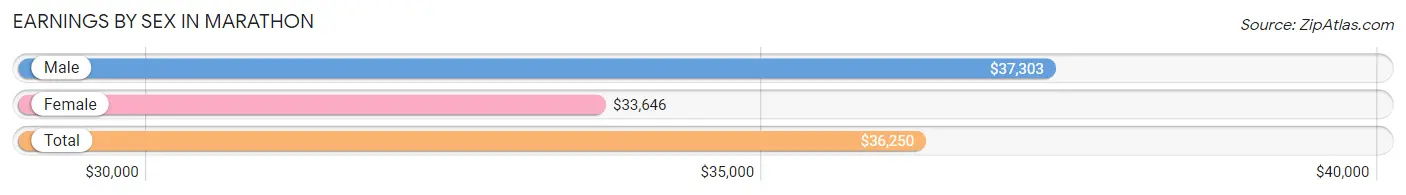
Earnings by Sex in Marathon
Average Earnings in Marathon are $36,250, $37,303 for men and $33,646 for women, a difference of 9.8%.
| Sex | Number | Average Earnings |
| Male | 271 (51.3%) | $37,303 |
| Female | 257 (48.7%) | $33,646 |
| Total | 528 (100.0%) | $36,250 |
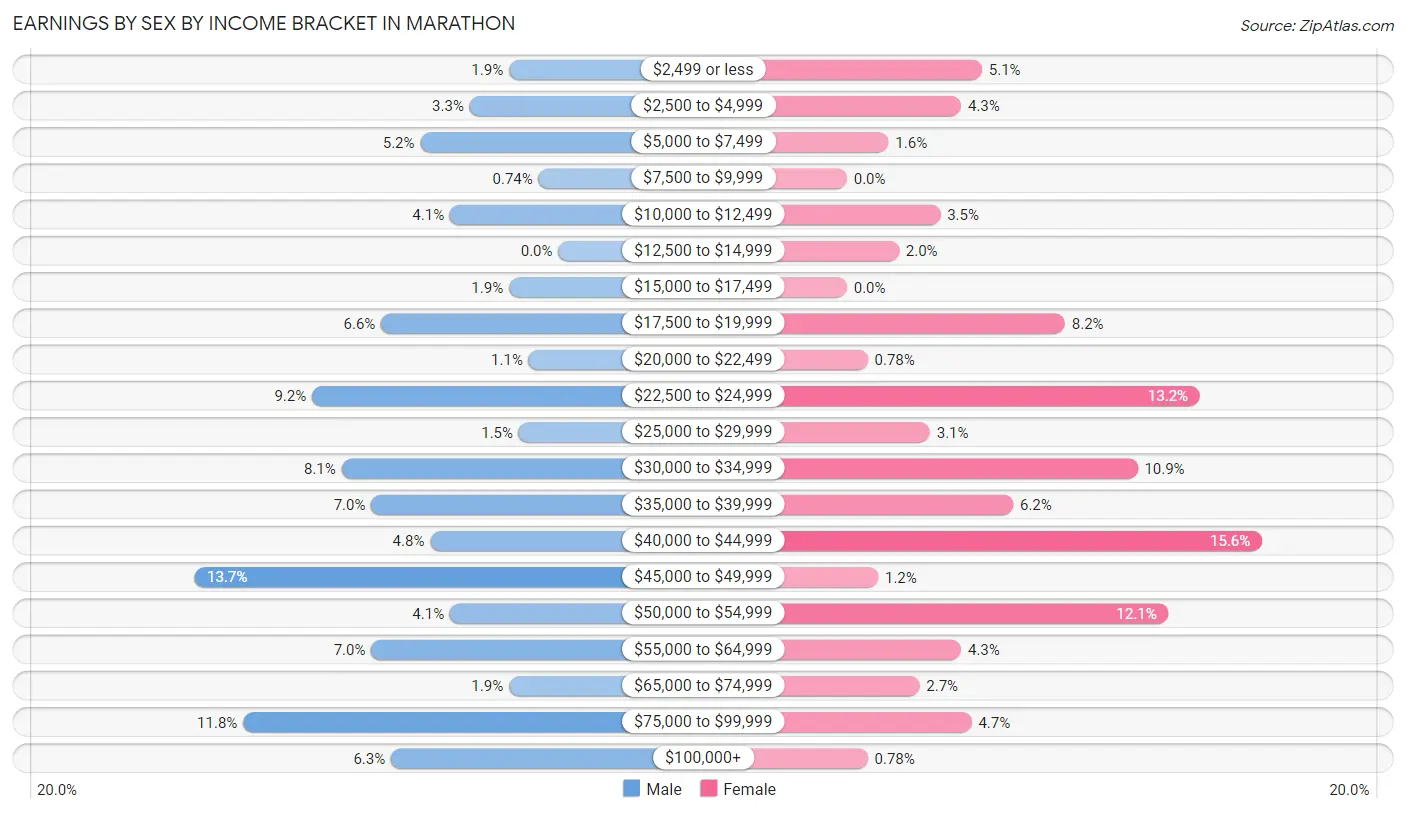
Earnings by Sex by Income Bracket in Marathon
The most common earnings brackets in Marathon are $45,000 to $49,999 for men (37 | 13.7%) and $40,000 to $44,999 for women (40 | 15.6%).
| Income | Male | Female |
| $2,499 or less | 5 (1.8%) | 13 (5.1%) |
| $2,500 to $4,999 | 9 (3.3%) | 11 (4.3%) |
| $5,000 to $7,499 | 14 (5.2%) | 4 (1.6%) |
| $7,500 to $9,999 | 2 (0.7%) | 0 (0.0%) |
| $10,000 to $12,499 | 11 (4.1%) | 9 (3.5%) |
| $12,500 to $14,999 | 0 (0.0%) | 5 (1.9%) |
| $15,000 to $17,499 | 5 (1.8%) | 0 (0.0%) |
| $17,500 to $19,999 | 18 (6.6%) | 21 (8.2%) |
| $20,000 to $22,499 | 3 (1.1%) | 2 (0.8%) |
| $22,500 to $24,999 | 25 (9.2%) | 34 (13.2%) |
| $25,000 to $29,999 | 4 (1.5%) | 8 (3.1%) |
| $30,000 to $34,999 | 22 (8.1%) | 28 (10.9%) |
| $35,000 to $39,999 | 19 (7.0%) | 16 (6.2%) |
| $40,000 to $44,999 | 13 (4.8%) | 40 (15.6%) |
| $45,000 to $49,999 | 37 (13.7%) | 3 (1.2%) |
| $50,000 to $54,999 | 11 (4.1%) | 31 (12.1%) |
| $55,000 to $64,999 | 19 (7.0%) | 11 (4.3%) |
| $65,000 to $74,999 | 5 (1.8%) | 7 (2.7%) |
| $75,000 to $99,999 | 32 (11.8%) | 12 (4.7%) |
| $100,000+ | 17 (6.3%) | 2 (0.8%) |
| Total | 271 (100.0%) | 257 (100.0%) |
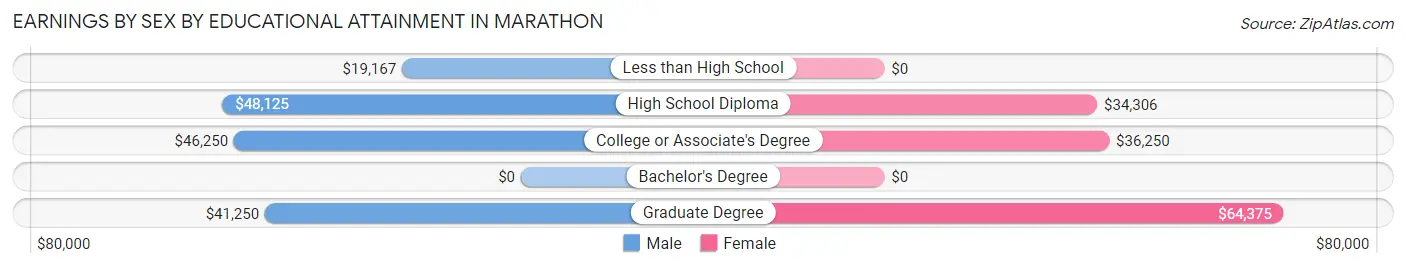
Earnings by Sex by Educational Attainment in Marathon
Average earnings in Marathon are $44,063 for men and $39,038 for women, a difference of 11.4%. Men with an educational attainment of high school diploma enjoy the highest average annual earnings of $48,125, while those with less than high school education earn the least with $19,167. Women with an educational attainment of graduate degree earn the most with the average annual earnings of $64,375, while those with high school diploma education have the smallest earnings of $34,306.
| Educational Attainment | Male Income | Female Income |
| Less than High School | $19,167 | $0 |
| High School Diploma | $48,125 | $34,306 |
| College or Associate's Degree | $46,250 | $36,250 |
| Bachelor's Degree | - | - |
| Graduate Degree | $41,250 | $64,375 |
| Total | $44,063 | $39,038 |
Family Income in Marathon
Family Income Brackets in Marathon
According to the Marathon family income data, there are 73 families falling into the $35,000 to $49,999 income range, which is the most common income bracket and makes up 28.1% of all families.
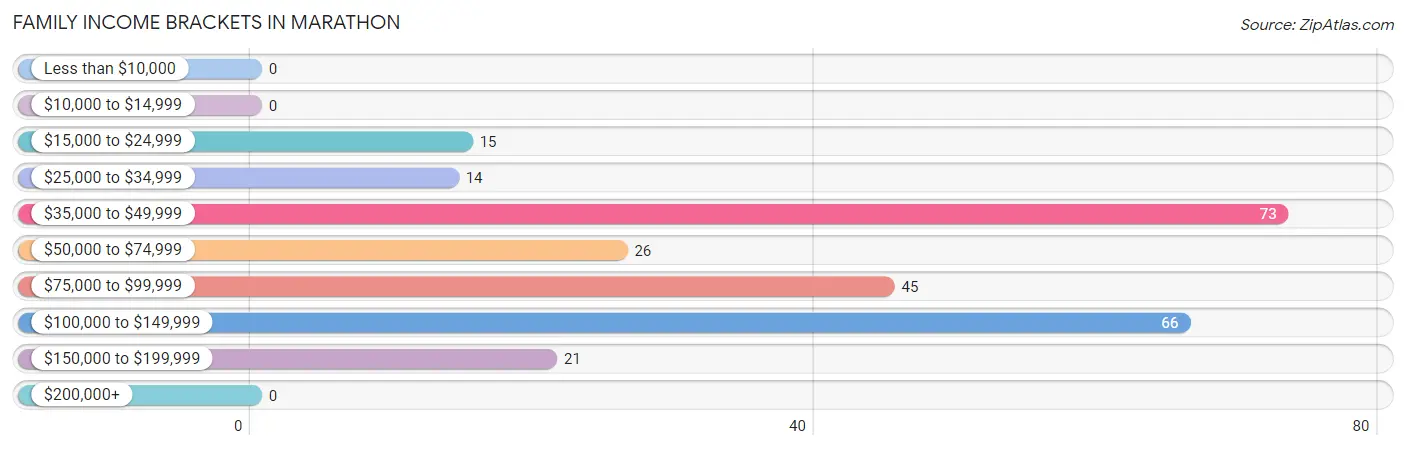
| Income Bracket | # Families | % Families |
| Less than $10,000 | 0 | 0.0% |
| $10,000 to $14,999 | 0 | 0.0% |
| $15,000 to $24,999 | 15 | 5.8% |
| $25,000 to $34,999 | 14 | 5.4% |
| $35,000 to $49,999 | 73 | 28.1% |
| $50,000 to $74,999 | 26 | 10.0% |
| $75,000 to $99,999 | 45 | 17.3% |
| $100,000 to $149,999 | 66 | 25.4% |
| $150,000 to $199,999 | 21 | 8.1% |
| $200,000+ | 0 | 0.0% |
Family Income by Famaliy Size in Marathon
7+ person families (34 | 13.1%) account for the highest median family income in Marathon with $111,250 per family, while 2-person families (90 | 34.6%) have the highest median income of $39,375 per family member.
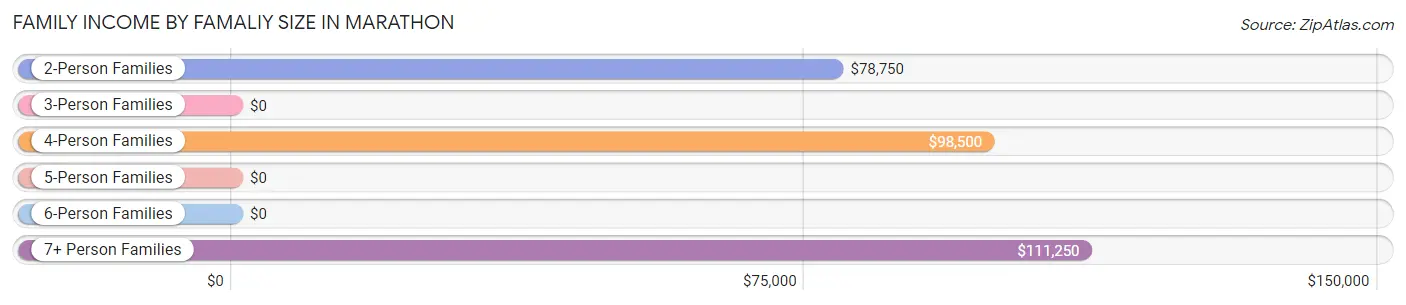
| Income Bracket | # Families | Median Income |
| 2-Person Families | 90 (34.6%) | $78,750 |
| 3-Person Families | 64 (24.6%) | $0 |
| 4-Person Families | 36 (13.9%) | $98,500 |
| 5-Person Families | 32 (12.3%) | $0 |
| 6-Person Families | 4 (1.5%) | $0 |
| 7+ Person Families | 34 (13.1%) | $111,250 |
| Total | 260 (100.0%) | $78,500 |
Family Income by Number of Earners in Marathon
The median family income in Marathon is $78,500, with families comprising 3+ earners (38) having the highest median family income of $122,206, while families with no earners (18) have the lowest median family income of $39,583, accounting for 14.6% and 6.9% of families, respectively.
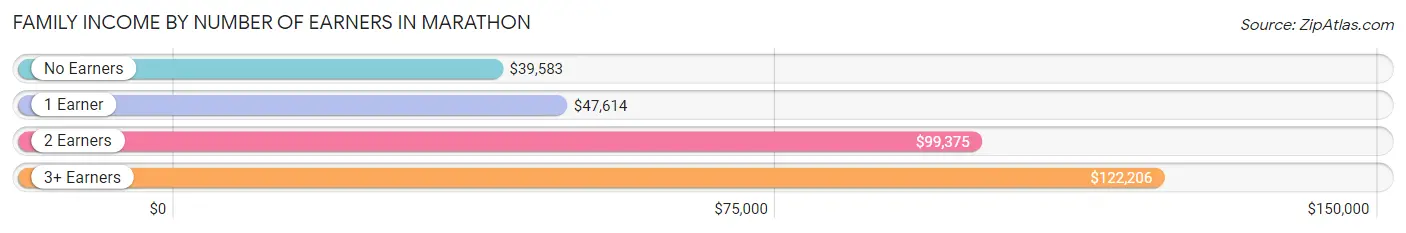
| Number of Earners | # Families | Median Income |
| No Earners | 18 (6.9%) | $39,583 |
| 1 Earner | 118 (45.4%) | $47,614 |
| 2 Earners | 86 (33.1%) | $99,375 |
| 3+ Earners | 38 (14.6%) | $122,206 |
| Total | 260 (100.0%) | $78,500 |
Household Income in Marathon
Household Income Brackets in Marathon
With 97 households falling in the category, the $35,000 to $49,999 income range is the most frequent in Marathon, accounting for 27.1% of all households.
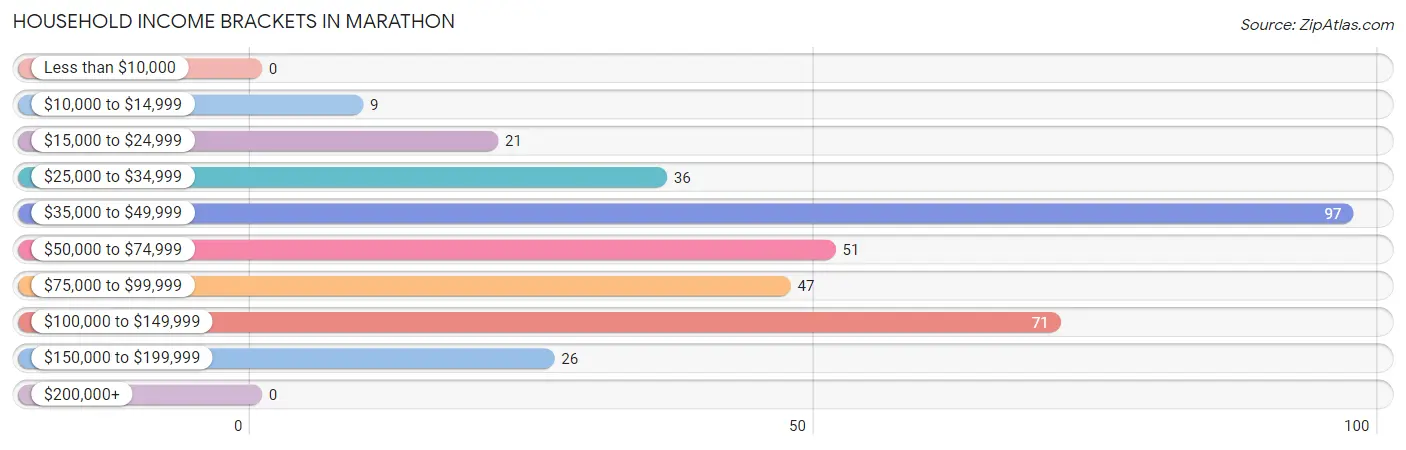
| Income Bracket | # Households | % Households |
| Less than $10,000 | 0 | 0.0% |
| $10,000 to $14,999 | 9 | 2.5% |
| $15,000 to $24,999 | 21 | 5.9% |
| $25,000 to $34,999 | 36 | 10.1% |
| $35,000 to $49,999 | 97 | 27.1% |
| $50,000 to $74,999 | 51 | 14.2% |
| $75,000 to $99,999 | 47 | 13.1% |
| $100,000 to $149,999 | 71 | 19.8% |
| $150,000 to $199,999 | 26 | 7.3% |
| $200,000+ | 0 | 0.0% |
Household Income by Householder Age in Marathon
The median household income in Marathon is $54,000, with the highest median household income of $105,625 found in the 45 to 64 years age bracket for the primary householder. A total of 68 households (19.0%) fall into this category. Meanwhile, the 65+ years age bracket for the primary householder has the lowest median household income of $44,643, with 78 households (21.8%) in this group.
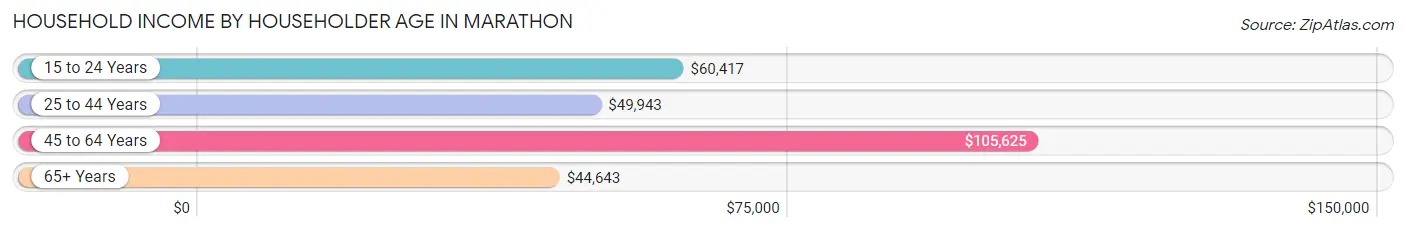
| Income Bracket | # Households | Median Income |
| 15 to 24 Years | 49 (13.7%) | $60,417 |
| 25 to 44 Years | 163 (45.5%) | $49,943 |
| 45 to 64 Years | 68 (19.0%) | $105,625 |
| 65+ Years | 78 (21.8%) | $44,643 |
| Total | 358 (100.0%) | $54,000 |
Poverty in Marathon
Income Below Poverty by Sex and Age in Marathon
With 9.2% poverty level for males and 6.7% for females among the residents of Marathon, under 5 year old males and under 5 year old females are the most vulnerable to poverty, with 31 males (36.9%) and 7 females (24.1%) in their respective age groups living below the poverty level.
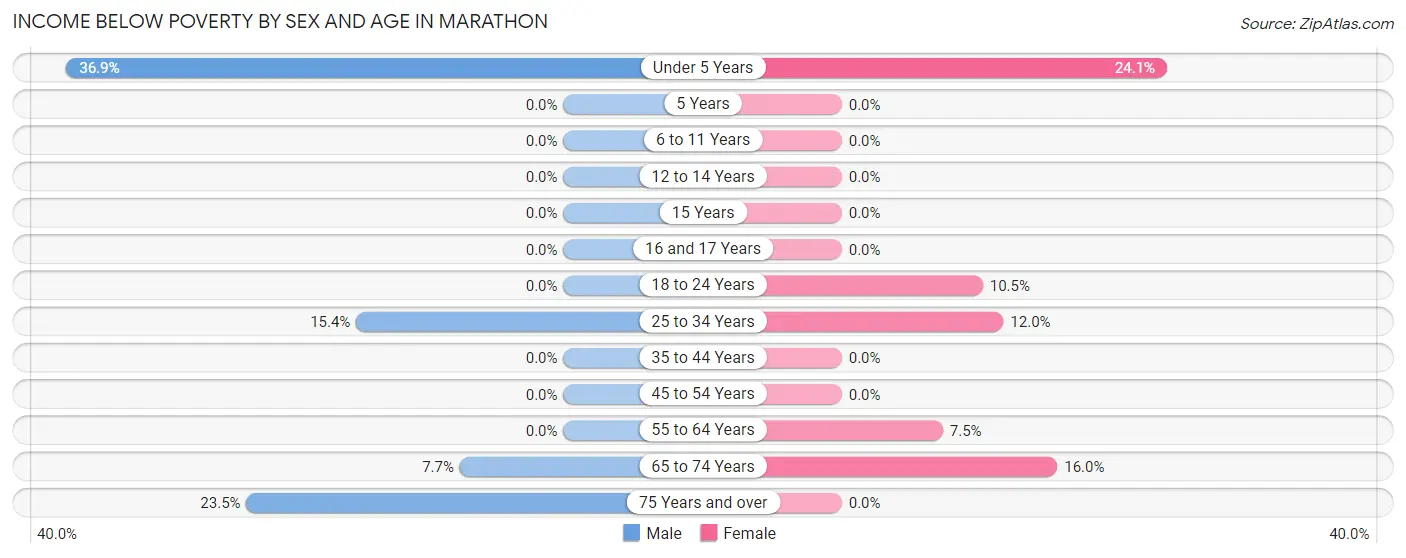
| Age Bracket | Male | Female |
| Under 5 Years | 31 (36.9%) | 7 (24.1%) |
| 5 Years | 0 (0.0%) | 0 (0.0%) |
| 6 to 11 Years | 0 (0.0%) | 0 (0.0%) |
| 12 to 14 Years | 0 (0.0%) | 0 (0.0%) |
| 15 Years | 0 (0.0%) | 0 (0.0%) |
| 16 and 17 Years | 0 (0.0%) | 0 (0.0%) |
| 18 to 24 Years | 0 (0.0%) | 9 (10.5%) |
| 25 to 34 Years | 8 (15.4%) | 9 (12.0%) |
| 35 to 44 Years | 0 (0.0%) | 0 (0.0%) |
| 45 to 54 Years | 0 (0.0%) | 0 (0.0%) |
| 55 to 64 Years | 0 (0.0%) | 3 (7.5%) |
| 65 to 74 Years | 3 (7.7%) | 8 (16.0%) |
| 75 Years and over | 4 (23.5%) | 0 (0.0%) |
| Total | 46 (9.2%) | 36 (6.7%) |
Income Above Poverty by Sex and Age in Marathon
According to the poverty statistics in Marathon, males aged 5 years and females aged 5 years are the age groups that are most secure financially, with 100.0% of males and 100.0% of females in these age groups living above the poverty line.
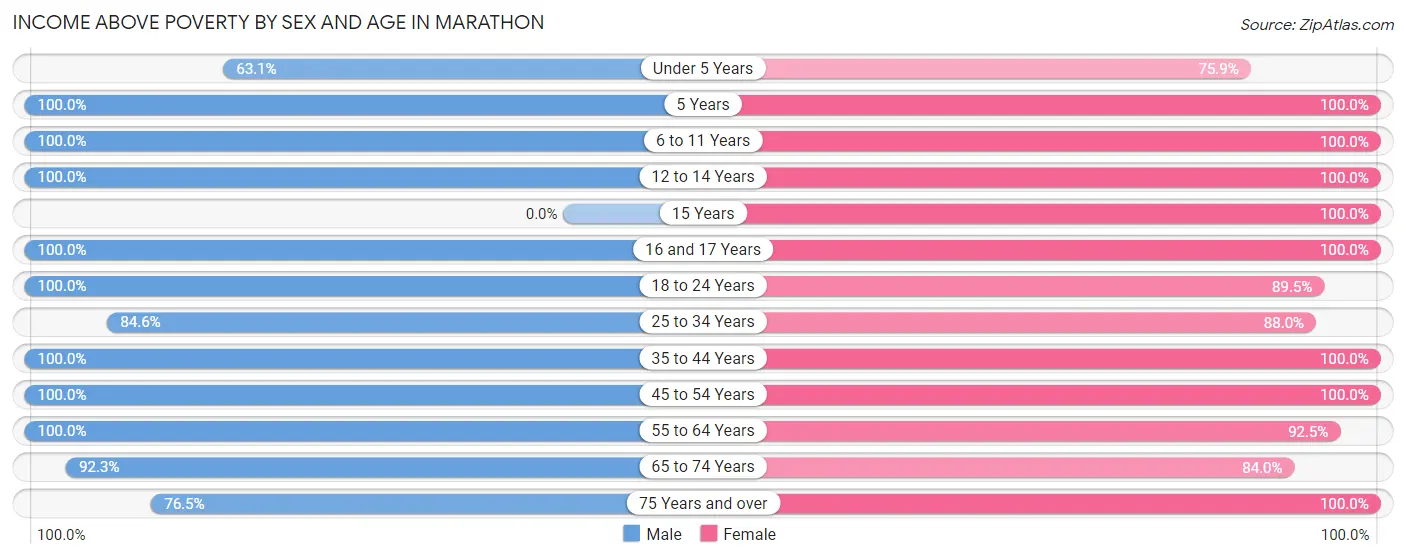
| Age Bracket | Male | Female |
| Under 5 Years | 53 (63.1%) | 22 (75.9%) |
| 5 Years | 19 (100.0%) | 4 (100.0%) |
| 6 to 11 Years | 44 (100.0%) | 43 (100.0%) |
| 12 to 14 Years | 34 (100.0%) | 27 (100.0%) |
| 15 Years | 0 (0.0%) | 2 (100.0%) |
| 16 and 17 Years | 2 (100.0%) | 28 (100.0%) |
| 18 to 24 Years | 42 (100.0%) | 77 (89.5%) |
| 25 to 34 Years | 44 (84.6%) | 66 (88.0%) |
| 35 to 44 Years | 96 (100.0%) | 95 (100.0%) |
| 45 to 54 Years | 32 (100.0%) | 39 (100.0%) |
| 55 to 64 Years | 40 (100.0%) | 37 (92.5%) |
| 65 to 74 Years | 36 (92.3%) | 42 (84.0%) |
| 75 Years and over | 13 (76.5%) | 17 (100.0%) |
| Total | 455 (90.8%) | 499 (93.3%) |
Income Below Poverty Among Married-Couple Families in Marathon
The poverty statistics for married-couple families in Marathon show that 5.1% or 11 of the total 214 families live below the poverty line. Families with 5 or more children have the highest poverty rate of 34.6%, comprising of 9 families. On the other hand, families with 1 or 2 children have the lowest poverty rate of 0.0%, which includes 0 families.
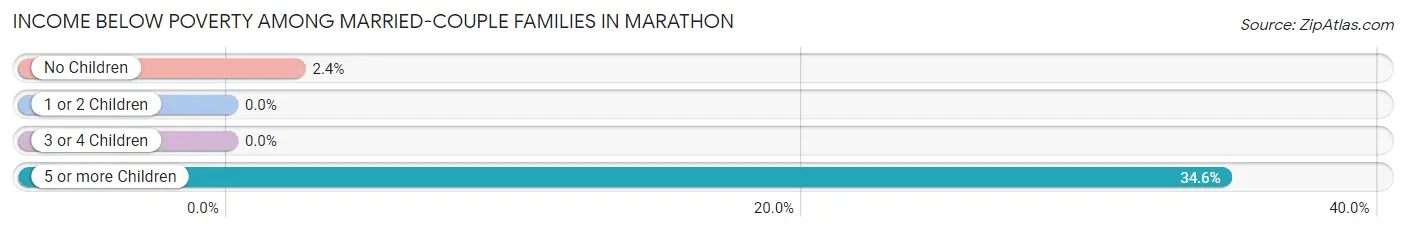
| Children | Above Poverty | Below Poverty |
| No Children | 83 (97.7%) | 2 (2.4%) |
| 1 or 2 Children | 78 (100.0%) | 0 (0.0%) |
| 3 or 4 Children | 25 (100.0%) | 0 (0.0%) |
| 5 or more Children | 17 (65.4%) | 9 (34.6%) |
| Total | 203 (94.9%) | 11 (5.1%) |
Income Below Poverty Among Single-Parent Households in Marathon
| Children | Single Father | Single Mother |
| No Children | 0 (0.0%) | 0 (0.0%) |
| 1 or 2 Children | 0 (0.0%) | 0 (0.0%) |
| 3 or 4 Children | 0 (0.0%) | 0 (0.0%) |
| 5 or more Children | 0 (0.0%) | 0 (0.0%) |
| Total | 0 (0.0%) | 0 (0.0%) |
Income Below Poverty Among Married-Couple vs Single-Parent Households in Marathon
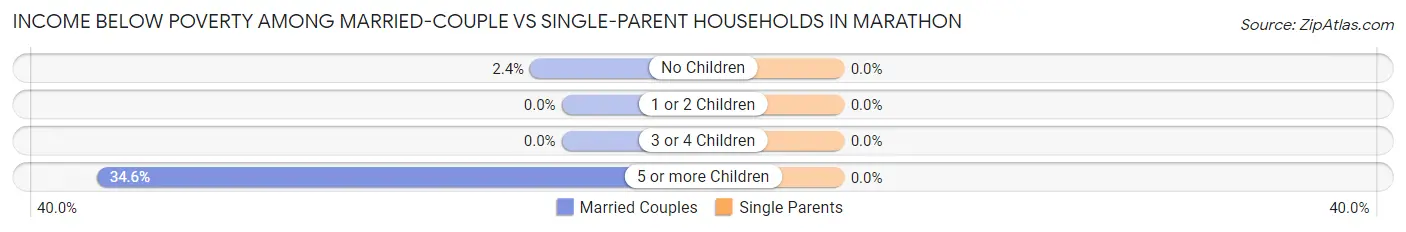
| Children | Married-Couple Families | Single-Parent Households |
| No Children | 2 (2.4%) | 0 (0.0%) |
| 1 or 2 Children | 0 (0.0%) | 0 (0.0%) |
| 3 or 4 Children | 0 (0.0%) | 0 (0.0%) |
| 5 or more Children | 9 (34.6%) | 0 (0.0%) |
| Total | 11 (5.1%) | 0 (0.0%) |
Race in Marathon
The most populous races in Marathon are White / Caucasian (1,016 | 98.1%), Two or more Races (13 | 1.3%), and Black / African American (5 | 0.5%).
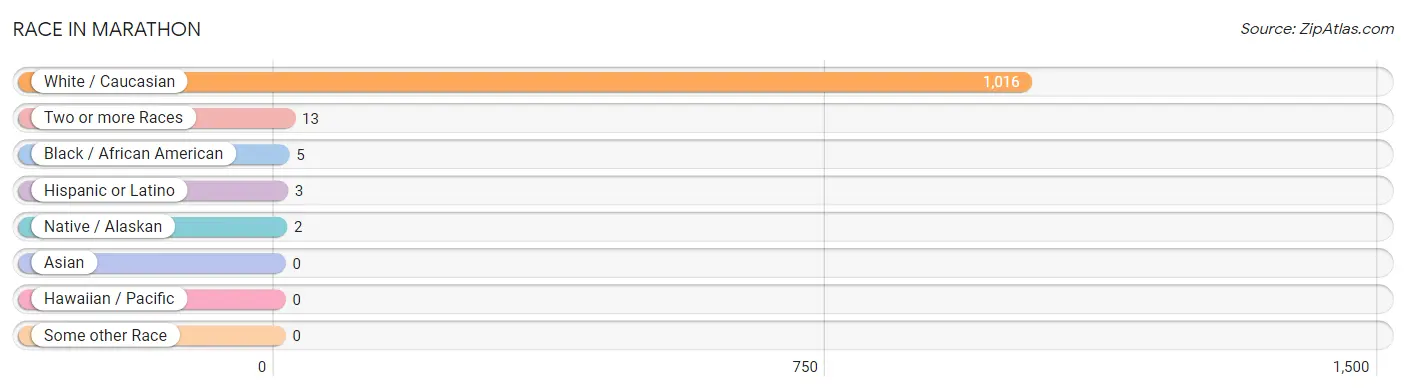
| Race | # Population | % Population |
| Asian | 0 | 0.0% |
| Black / African American | 5 | 0.5% |
| Hawaiian / Pacific | 0 | 0.0% |
| Hispanic or Latino | 3 | 0.3% |
| Native / Alaskan | 2 | 0.2% |
| White / Caucasian | 1,016 | 98.1% |
| Two or more Races | 13 | 1.3% |
| Some other Race | 0 | 0.0% |
| Total | 1,036 | 100.0% |
Ancestry in Marathon
The most populous ancestries reported in Marathon are German (188 | 18.1%), American (158 | 15.2%), English (127 | 12.3%), Irish (98 | 9.5%), and Italian (97 | 9.4%), together accounting for 64.5% of all Marathon residents.
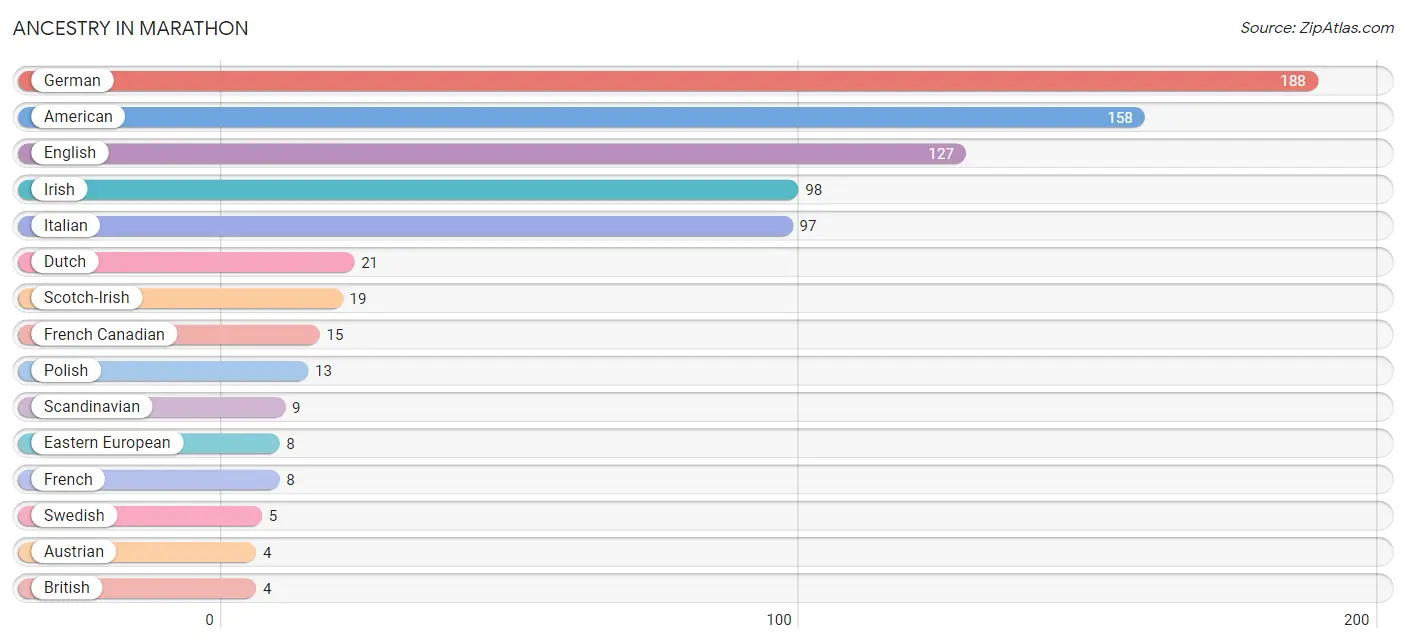
| Ancestry | # Population | % Population |
| American | 158 | 15.2% |
| Austrian | 4 | 0.4% |
| British | 4 | 0.4% |
| Canadian | 4 | 0.4% |
| Cape Verdean | 2 | 0.2% |
| Cuban | 3 | 0.3% |
| Dutch | 21 | 2.0% |
| Eastern European | 8 | 0.8% |
| English | 127 | 12.3% |
| European | 4 | 0.4% |
| French | 8 | 0.8% |
| French Canadian | 15 | 1.5% |
| German | 188 | 18.1% |
| Greek | 4 | 0.4% |
| Irish | 98 | 9.5% |
| Italian | 97 | 9.4% |
| Lithuanian | 3 | 0.3% |
| Pennsylvania German | 2 | 0.2% |
| Polish | 13 | 1.3% |
| Russian | 3 | 0.3% |
| Scandinavian | 9 | 0.9% |
| Scotch-Irish | 19 | 1.8% |
| Subsaharan African | 2 | 0.2% |
| Swedish | 5 | 0.5% |
| Swiss | 2 | 0.2% |
| Welsh | 4 | 0.4% | View All 26 Rows |
Immigrants in Marathon
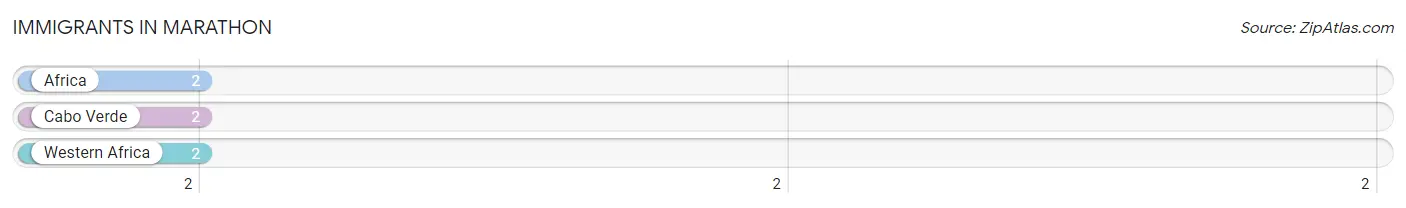
The most numerous immigrant groups reported in Marathon came from Africa (2 | 0.2%), Cabo Verde (2 | 0.2%), and Western Africa (2 | 0.2%), together accounting for 0.6% of all Marathon residents.
| Immigration Origin | # Population | % Population |
| Africa | 2 | 0.2% |
| Cabo Verde | 2 | 0.2% |
| Western Africa | 2 | 0.2% | View All 3 Rows |
Sex and Age in Marathon
Sex and Age in Marathon
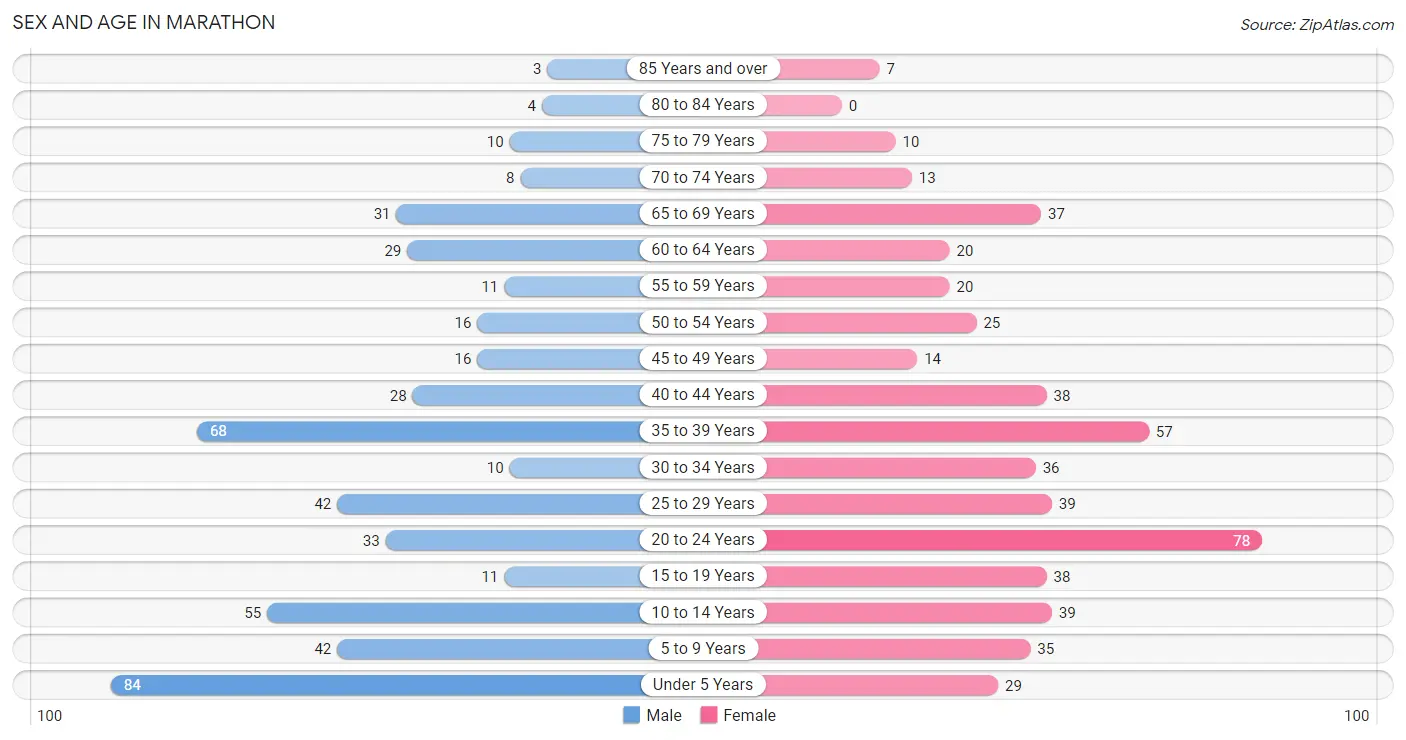
The most populous age groups in Marathon are Under 5 Years (84 | 16.8%) for men and 20 to 24 Years (78 | 14.6%) for women.
| Age Bracket | Male | Female |
| Under 5 Years | 84 (16.8%) | 29 (5.4%) |
| 5 to 9 Years | 42 (8.4%) | 35 (6.5%) |
| 10 to 14 Years | 55 (11.0%) | 39 (7.3%) |
| 15 to 19 Years | 11 (2.2%) | 38 (7.1%) |
| 20 to 24 Years | 33 (6.6%) | 78 (14.6%) |
| 25 to 29 Years | 42 (8.4%) | 39 (7.3%) |
| 30 to 34 Years | 10 (2.0%) | 36 (6.7%) |
| 35 to 39 Years | 68 (13.6%) | 57 (10.6%) |
| 40 to 44 Years | 28 (5.6%) | 38 (7.1%) |
| 45 to 49 Years | 16 (3.2%) | 14 (2.6%) |
| 50 to 54 Years | 16 (3.2%) | 25 (4.7%) |
| 55 to 59 Years | 11 (2.2%) | 20 (3.7%) |
| 60 to 64 Years | 29 (5.8%) | 20 (3.7%) |
| 65 to 69 Years | 31 (6.2%) | 37 (6.9%) |
| 70 to 74 Years | 8 (1.6%) | 13 (2.4%) |
| 75 to 79 Years | 10 (2.0%) | 10 (1.9%) |
| 80 to 84 Years | 4 (0.8%) | 0 (0.0%) |
| 85 Years and over | 3 (0.6%) | 7 (1.3%) |
| Total | 501 (100.0%) | 535 (100.0%) |
Families and Households in Marathon
Median Family Size in Marathon
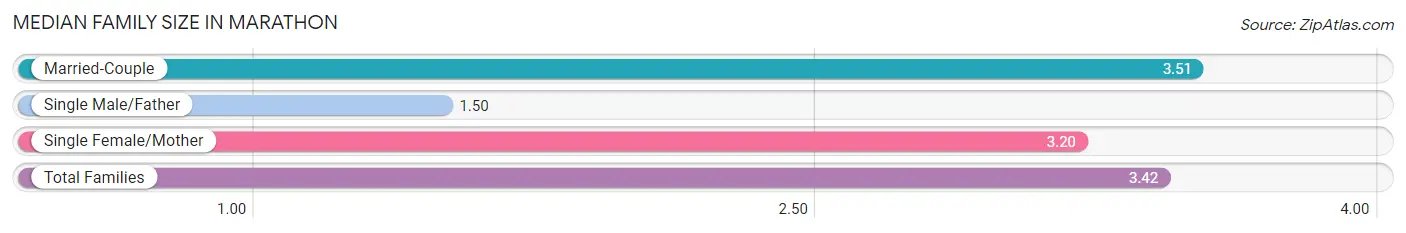
The median family size in Marathon is 3.42 persons per family, with married-couple families (214 | 82.3%) accounting for the largest median family size of 3.51 persons per family. On the other hand, single male/father families (6 | 2.3%) represent the smallest median family size with 1.50 persons per family.
| Family Type | # Families | Family Size |
| Married-Couple | 214 (82.3%) | 3.51 |
| Single Male/Father | 6 (2.3%) | 1.50 |
| Single Female/Mother | 40 (15.4%) | 3.20 |
| Total Families | 260 (100.0%) | 3.42 |
Median Household Size in Marathon
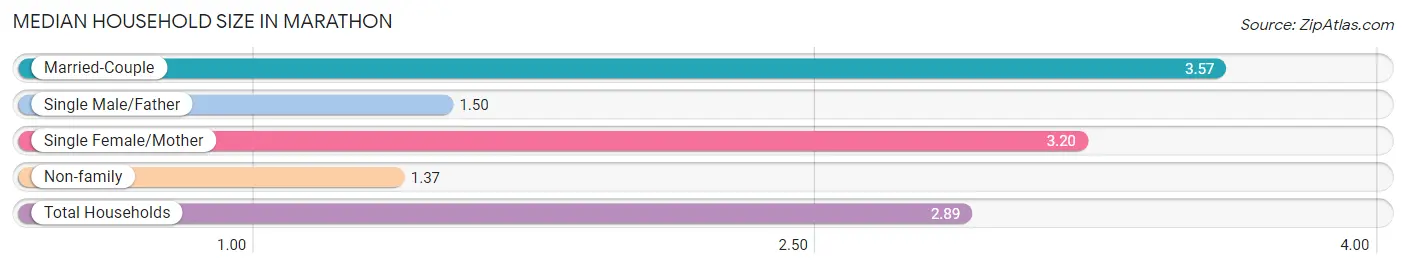
The median household size in Marathon is 2.89 persons per household, with married-couple households (214 | 59.8%) accounting for the largest median household size of 3.57 persons per household. non-family households (98 | 27.4%) represent the smallest median household size with 1.37 persons per household.
| Household Type | # Households | Household Size |
| Married-Couple | 214 (59.8%) | 3.57 |
| Single Male/Father | 6 (1.7%) | 1.50 |
| Single Female/Mother | 40 (11.2%) | 3.20 |
| Non-family | 98 (27.4%) | 1.37 |
| Total Households | 358 (100.0%) | 2.89 |
Household Size by Marriage Status in Marathon
Out of a total of 358 households in Marathon, 260 (72.6%) are family households, while 98 (27.4%) are nonfamily households. The most numerous type of family households are 2-person households, comprising 85, and the most common type of nonfamily households are 1-person households, comprising 54.
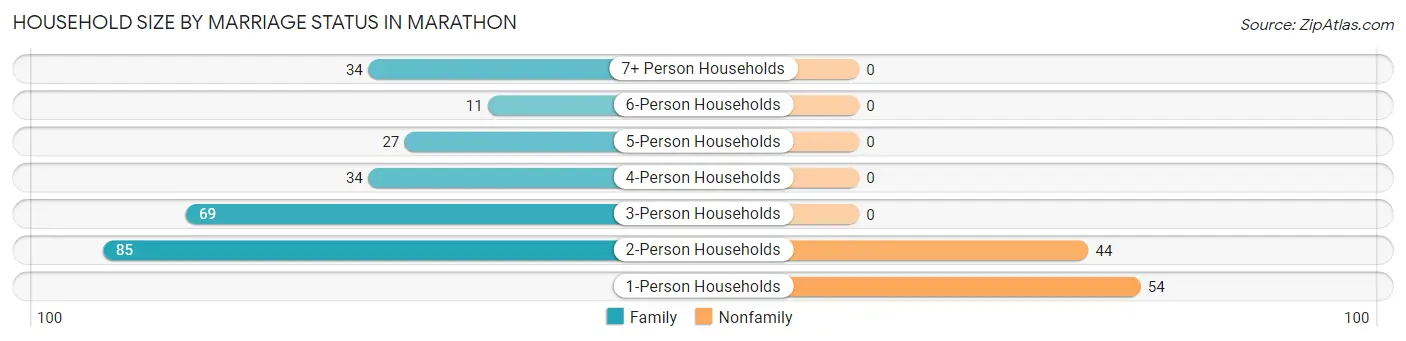
| Household Size | Family Households | Nonfamily Households |
| 1-Person Households | - | 54 (15.1%) |
| 2-Person Households | 85 (23.7%) | 44 (12.3%) |
| 3-Person Households | 69 (19.3%) | 0 (0.0%) |
| 4-Person Households | 34 (9.5%) | 0 (0.0%) |
| 5-Person Households | 27 (7.5%) | 0 (0.0%) |
| 6-Person Households | 11 (3.1%) | 0 (0.0%) |
| 7+ Person Households | 34 (9.5%) | 0 (0.0%) |
| Total | 260 (72.6%) | 98 (27.4%) |
Female Fertility in Marathon
Fertility by Age in Marathon
Average fertility rate in Marathon is 93.0 births per 1,000 women. Women in the age bracket of 20 to 34 years have the highest fertility rate with 190.0 births per 1,000 women. Women in the age bracket of 20 to 34 years acount for 100.0% of all women with births.
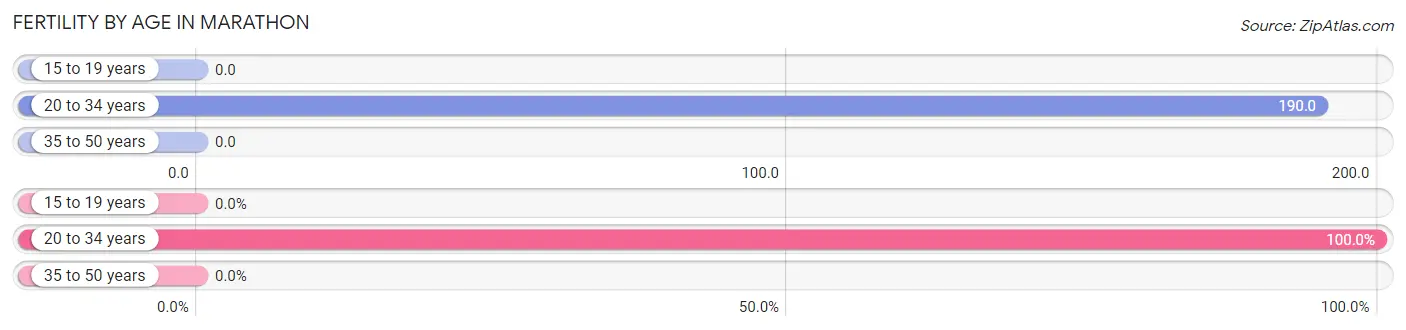
| Age Bracket | Women with Births | Births / 1,000 Women |
| 15 to 19 years | 0 (0.0%) | 0.0 |
| 20 to 34 years | 29 (100.0%) | 190.0 |
| 35 to 50 years | 0 (0.0%) | 0.0 |
| Total | 29 (100.0%) | 93.0 |
Fertility by Age by Marriage Status in Marathon
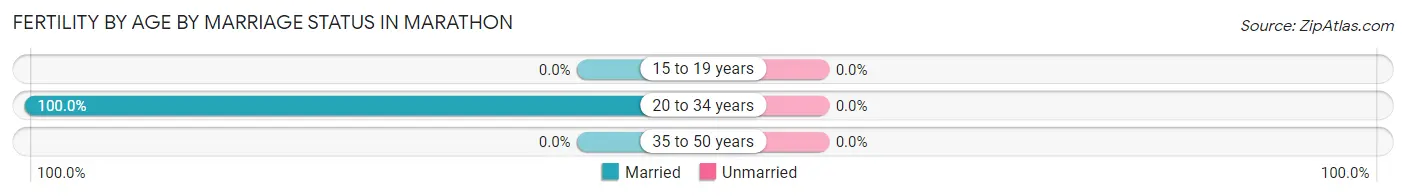
| Age Bracket | Married | Unmarried |
| 15 to 19 years | 0 (0.0%) | 0 (0.0%) |
| 20 to 34 years | 29 (100.0%) | 0 (0.0%) |
| 35 to 50 years | 0 (0.0%) | 0 (0.0%) |
| Total | 29 (100.0%) | 0 (0.0%) |
Fertility by Education in Marathon
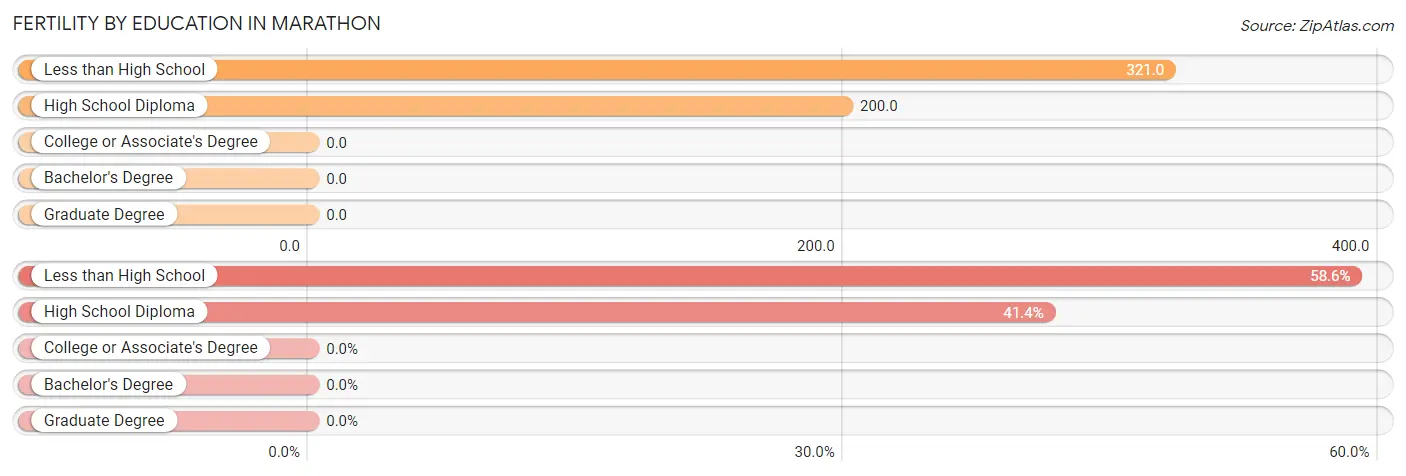
| Educational Attainment | Women with Births | Births / 1,000 Women |
| Less than High School | 17 (58.6%) | 321.0 |
| High School Diploma | 12 (41.4%) | 200.0 |
| College or Associate's Degree | 0 (0.0%) | 0.0 |
| Bachelor's Degree | 0 (0.0%) | 0.0 |
| Graduate Degree | 0 (0.0%) | 0.0 |
| Total | 29 (100.0%) | 93.0 |
Fertility by Education by Marriage Status in Marathon
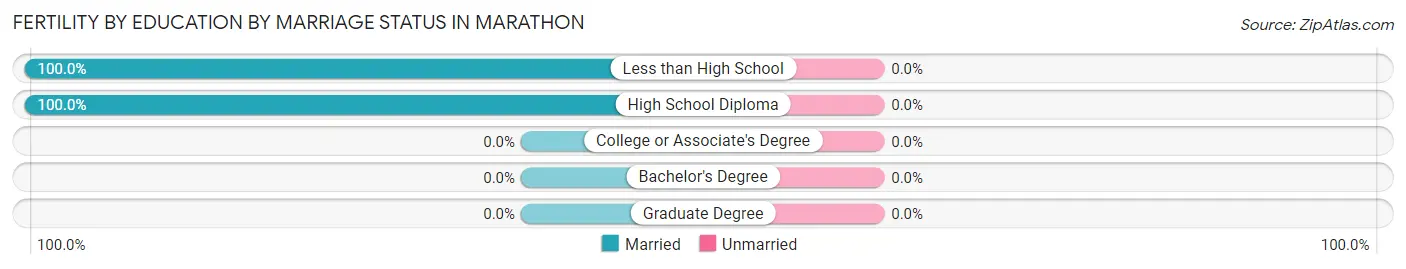
| Educational Attainment | Married | Unmarried |
| Less than High School | 17 (100.0%) | 0 (0.0%) |
| High School Diploma | 12 (100.0%) | 0 (0.0%) |
| College or Associate's Degree | 0 (0.0%) | 0 (0.0%) |
| Bachelor's Degree | 0 (0.0%) | 0 (0.0%) |
| Graduate Degree | 0 (0.0%) | 0 (0.0%) |
| Total | 29 (100.0%) | 0 (0.0%) |
Employment Characteristics in Marathon
Employment by Class of Employer in Marathon
Among the 464 employed individuals in Marathon, private company employees (275 | 59.3%), local government employees (66 | 14.2%), and not-for-profit organizations (59 | 12.7%) make up the most common classes of employment.
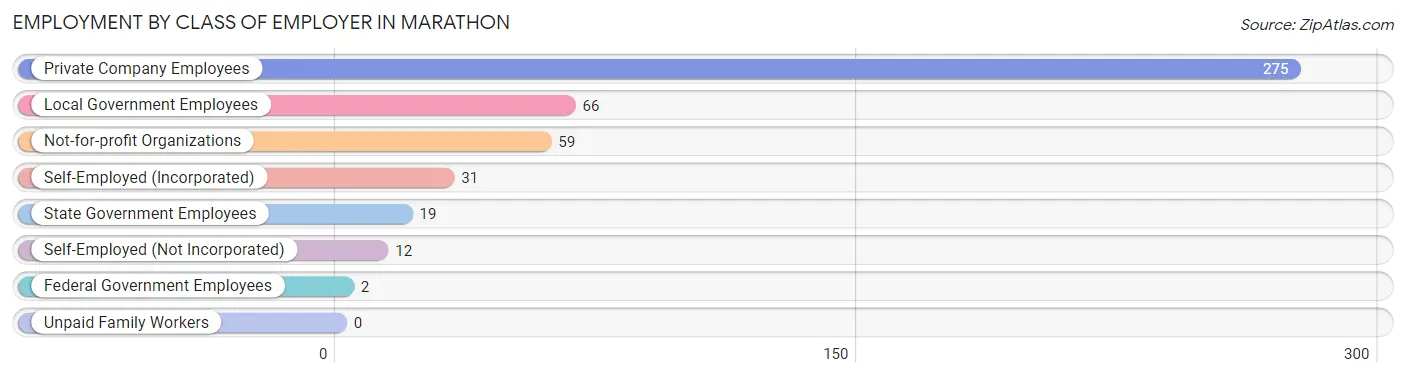
| Employer Class | # Employees | % Employees |
| Private Company Employees | 275 | 59.3% |
| Self-Employed (Incorporated) | 31 | 6.7% |
| Self-Employed (Not Incorporated) | 12 | 2.6% |
| Not-for-profit Organizations | 59 | 12.7% |
| Local Government Employees | 66 | 14.2% |
| State Government Employees | 19 | 4.1% |
| Federal Government Employees | 2 | 0.4% |
| Unpaid Family Workers | 0 | 0.0% |
| Total | 464 | 100.0% |
Employment Status by Age in Marathon
According to the labor force statistics for Marathon, out of the total population over 16 years of age (750), 68.7% or 515 individuals are in the labor force, with 7.0% or 36 of them unemployed. The age group with the highest labor force participation rate is 45 to 54 years, with 93.0% or 66 individuals in the labor force. Within the labor force, the 35 to 44 years age range has the highest percentage of unemployed individuals, with 16.0% or 28 of them being unemployed.
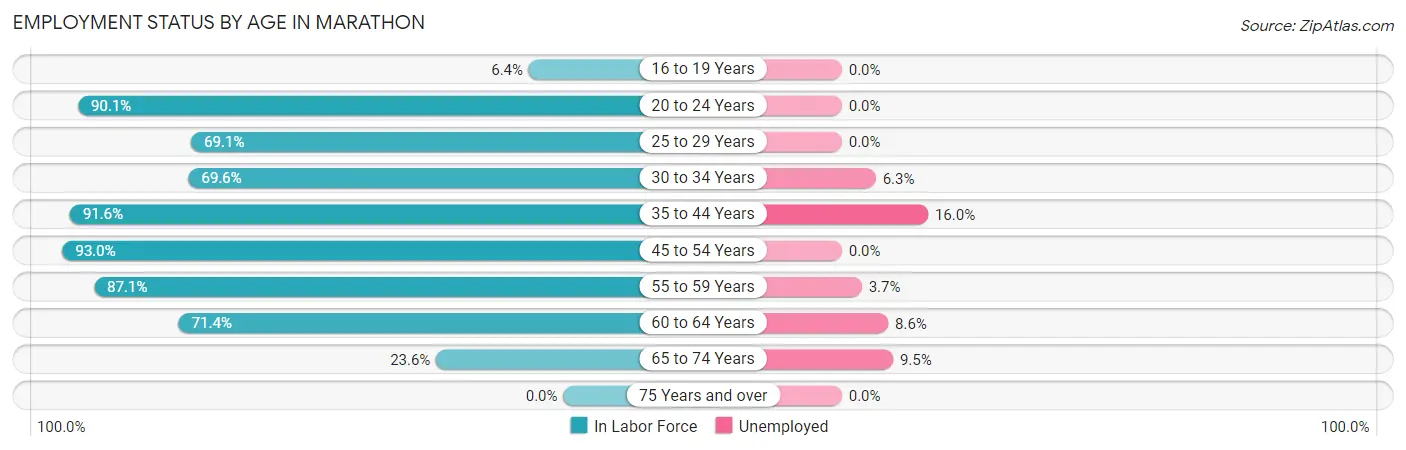
| Age Bracket | In Labor Force | Unemployed |
| 16 to 19 Years | 3 (6.4%) | 0 (0.0%) |
| 20 to 24 Years | 100 (90.1%) | 0 (0.0%) |
| 25 to 29 Years | 56 (69.1%) | 0 (0.0%) |
| 30 to 34 Years | 32 (69.6%) | 2 (6.3%) |
| 35 to 44 Years | 175 (91.6%) | 28 (16.0%) |
| 45 to 54 Years | 66 (93.0%) | 0 (0.0%) |
| 55 to 59 Years | 27 (87.1%) | 1 (3.7%) |
| 60 to 64 Years | 35 (71.4%) | 3 (8.6%) |
| 65 to 74 Years | 21 (23.6%) | 2 (9.5%) |
| 75 Years and over | 0 (0.0%) | 0 (0.0%) |
| Total | 515 (68.7%) | 36 (7.0%) |
Employment Status by Educational Attainment in Marathon
According to labor force statistics for Marathon, 83.4% of individuals (391) out of the total population between 25 and 64 years of age (469) are in the labor force, with 8.7% or 34 of them being unemployed. The group with the highest labor force participation rate are those with the educational attainment of college / associate degree, with 91.5% or 161 individuals in the labor force. Within the labor force, individuals with college / associate degree education have the highest percentage of unemployment, with 17.4% or 28 of them being unemployed.
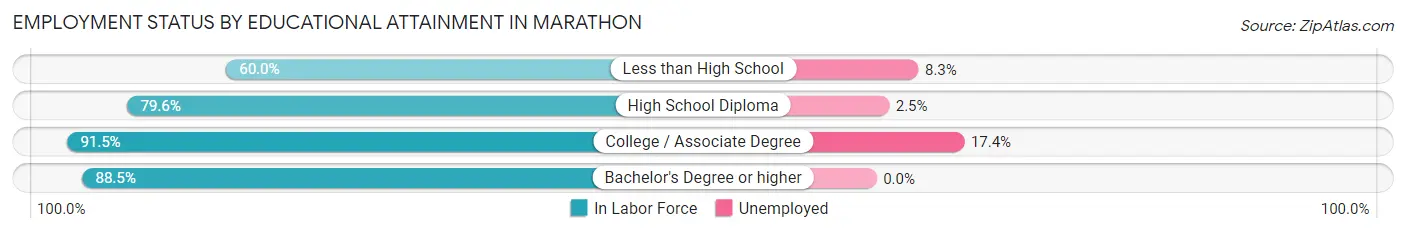
| Educational Attainment | In Labor Force | Unemployed |
| Less than High School | 24 (60.0%) | 3 (8.3%) |
| High School Diploma | 160 (79.6%) | 5 (2.5%) |
| College / Associate Degree | 161 (91.5%) | 31 (17.4%) |
| Bachelor's Degree or higher | 46 (88.5%) | 0 (0.0%) |
| Total | 391 (83.4%) | 41 (8.7%) |
Employment Occupations by Sex in Marathon
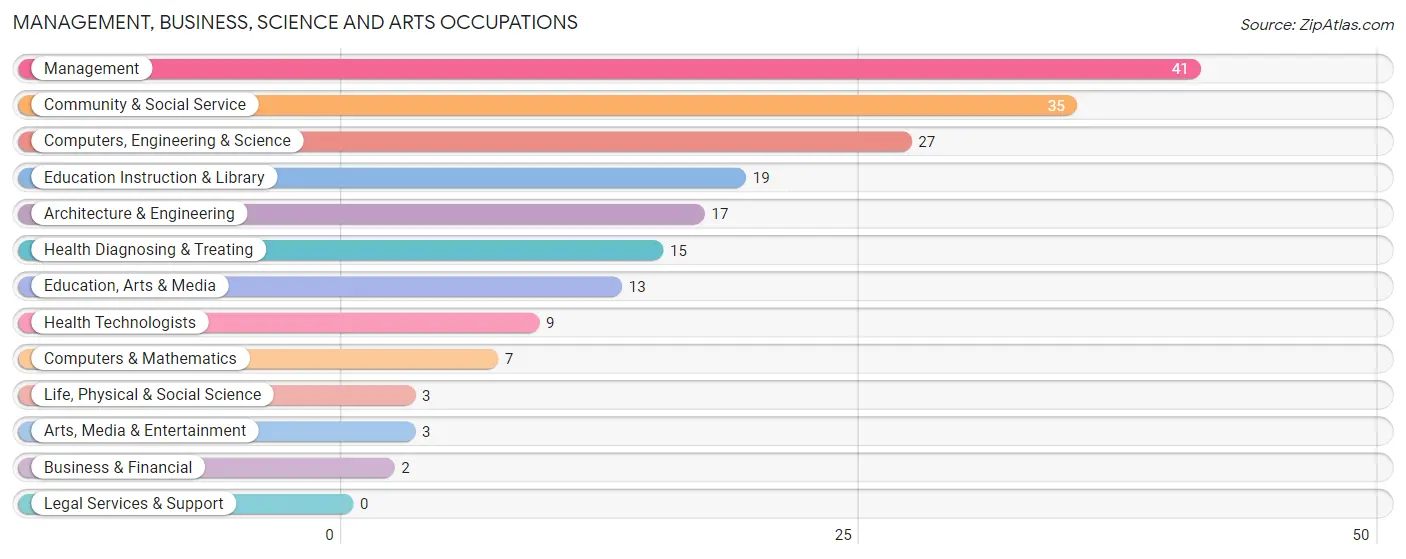
Management, Business, Science and Arts Occupations
The most common Management, Business, Science and Arts occupations in Marathon are Management (41 | 8.6%), Community & Social Service (35 | 7.3%), Computers, Engineering & Science (27 | 5.6%), Education Instruction & Library (19 | 4.0%), and Architecture & Engineering (17 | 3.5%).
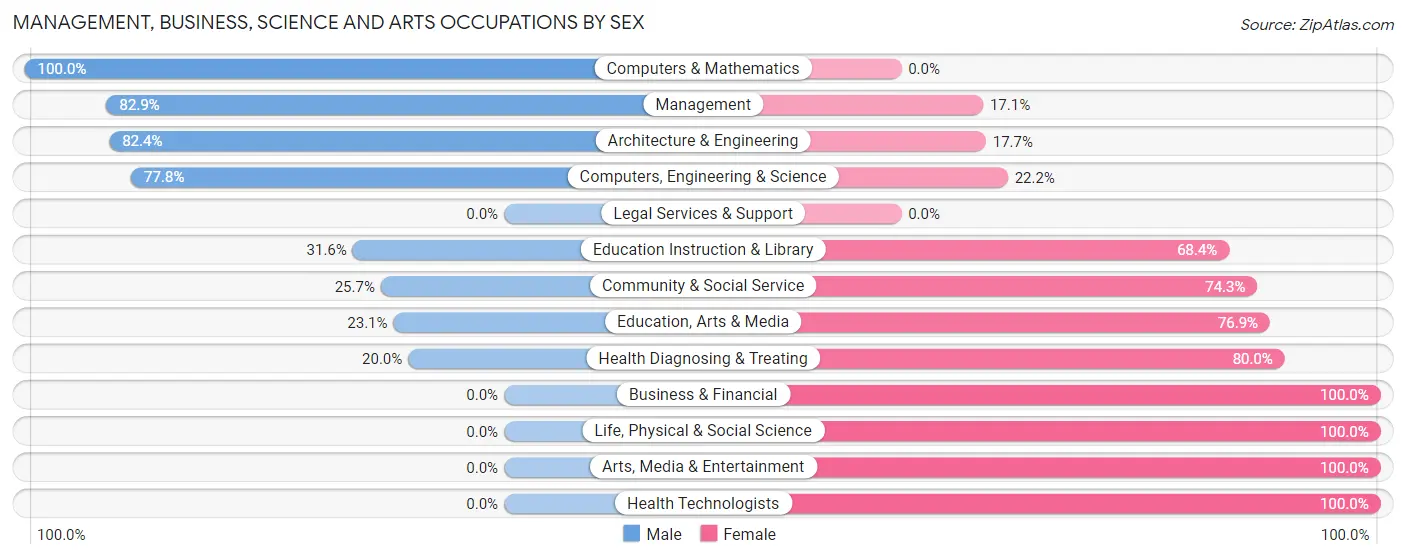
Management, Business, Science and Arts Occupations by Sex
Within the Management, Business, Science and Arts occupations in Marathon, the most male-oriented occupations are Computers & Mathematics (100.0%), Management (82.9%), and Architecture & Engineering (82.4%), while the most female-oriented occupations are Business & Financial (100.0%), Life, Physical & Social Science (100.0%), and Arts, Media & Entertainment (100.0%).
| Occupation | Male | Female |
| Management | 34 (82.9%) | 7 (17.1%) |
| Business & Financial | 0 (0.0%) | 2 (100.0%) |
| Computers, Engineering & Science | 21 (77.8%) | 6 (22.2%) |
| Computers & Mathematics | 7 (100.0%) | 0 (0.0%) |
| Architecture & Engineering | 14 (82.4%) | 3 (17.6%) |
| Life, Physical & Social Science | 0 (0.0%) | 3 (100.0%) |
| Community & Social Service | 9 (25.7%) | 26 (74.3%) |
| Education, Arts & Media | 3 (23.1%) | 10 (76.9%) |
| Legal Services & Support | 0 (0.0%) | 0 (0.0%) |
| Education Instruction & Library | 6 (31.6%) | 13 (68.4%) |
| Arts, Media & Entertainment | 0 (0.0%) | 3 (100.0%) |
| Health Diagnosing & Treating | 3 (20.0%) | 12 (80.0%) |
| Health Technologists | 0 (0.0%) | 9 (100.0%) |
| Total (Category) | 67 (55.8%) | 53 (44.2%) |
| Total (Overall) | 245 (51.1%) | 234 (48.8%) |
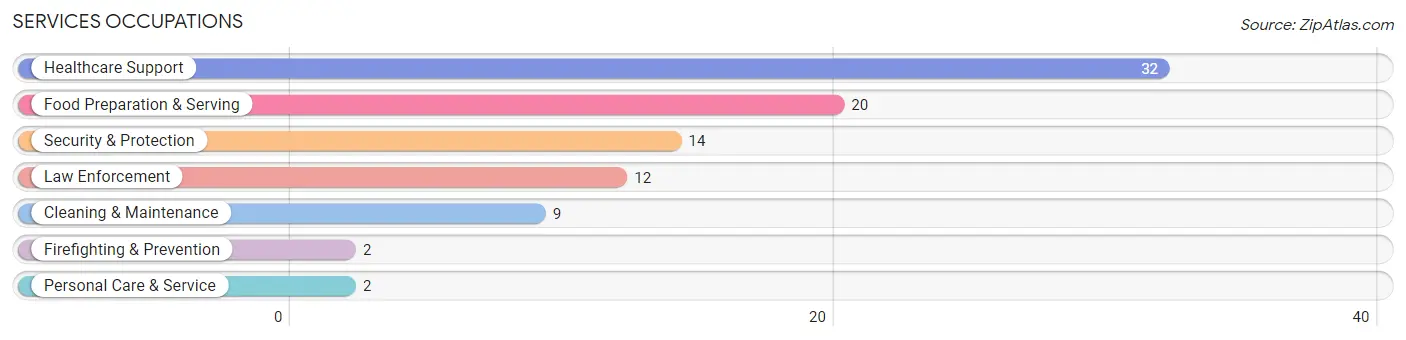
Services Occupations
The most common Services occupations in Marathon are Healthcare Support (32 | 6.7%), Food Preparation & Serving (20 | 4.2%), Security & Protection (14 | 2.9%), Law Enforcement (12 | 2.5%), and Cleaning & Maintenance (9 | 1.9%).
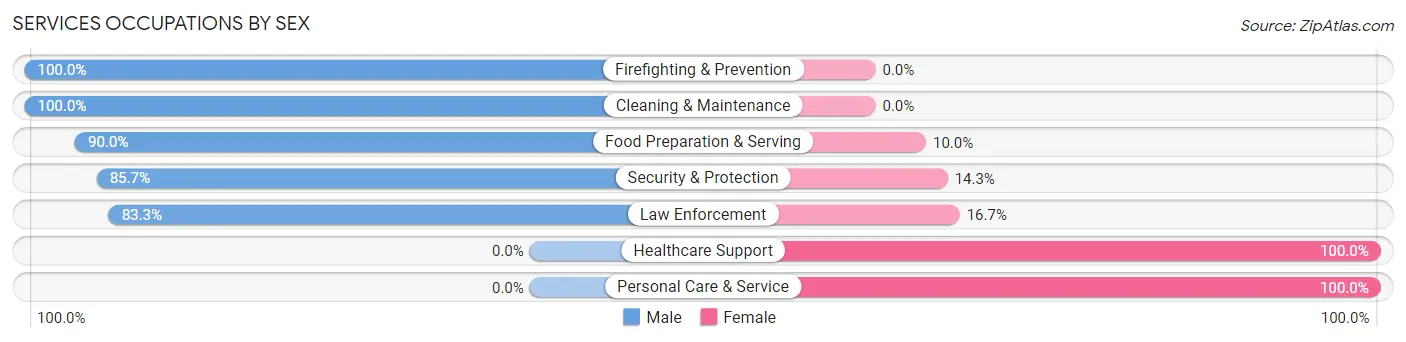
Services Occupations by Sex
Within the Services occupations in Marathon, the most male-oriented occupations are Firefighting & Prevention (100.0%), Cleaning & Maintenance (100.0%), and Food Preparation & Serving (90.0%), while the most female-oriented occupations are Healthcare Support (100.0%), Personal Care & Service (100.0%), and Law Enforcement (16.7%).
| Occupation | Male | Female |
| Healthcare Support | 0 (0.0%) | 32 (100.0%) |
| Security & Protection | 12 (85.7%) | 2 (14.3%) |
| Firefighting & Prevention | 2 (100.0%) | 0 (0.0%) |
| Law Enforcement | 10 (83.3%) | 2 (16.7%) |
| Food Preparation & Serving | 18 (90.0%) | 2 (10.0%) |
| Cleaning & Maintenance | 9 (100.0%) | 0 (0.0%) |
| Personal Care & Service | 0 (0.0%) | 2 (100.0%) |
| Total (Category) | 39 (50.6%) | 38 (49.3%) |
| Total (Overall) | 245 (51.1%) | 234 (48.8%) |
Sales and Office Occupations
The most common Sales and Office occupations in Marathon are Office & Administration (74 | 15.4%), and Sales & Related (43 | 9.0%).
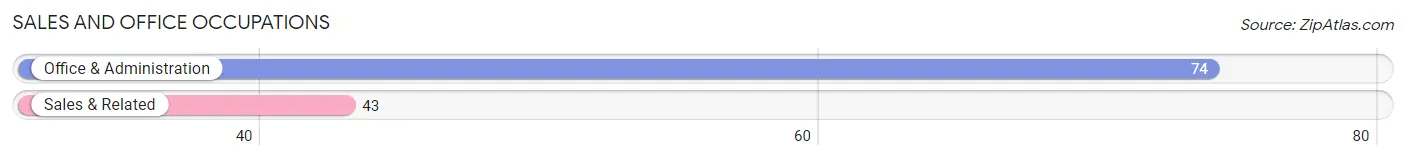
Sales and Office Occupations by Sex
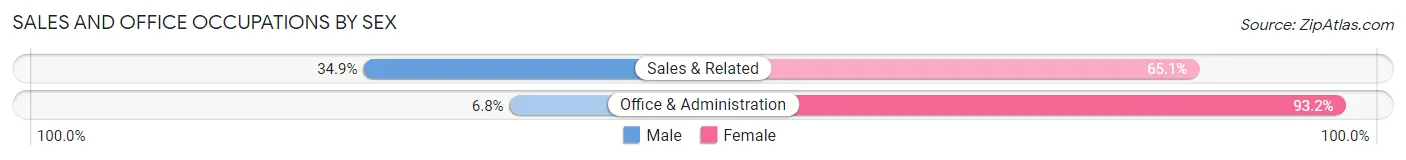
| Occupation | Male | Female |
| Sales & Related | 15 (34.9%) | 28 (65.1%) |
| Office & Administration | 5 (6.8%) | 69 (93.2%) |
| Total (Category) | 20 (17.1%) | 97 (82.9%) |
| Total (Overall) | 245 (51.1%) | 234 (48.8%) |
Natural Resources, Construction and Maintenance Occupations
The most common Natural Resources, Construction and Maintenance occupations in Marathon are Installation, Maintenance & Repair (50 | 10.4%), and Construction & Extraction (24 | 5.0%).
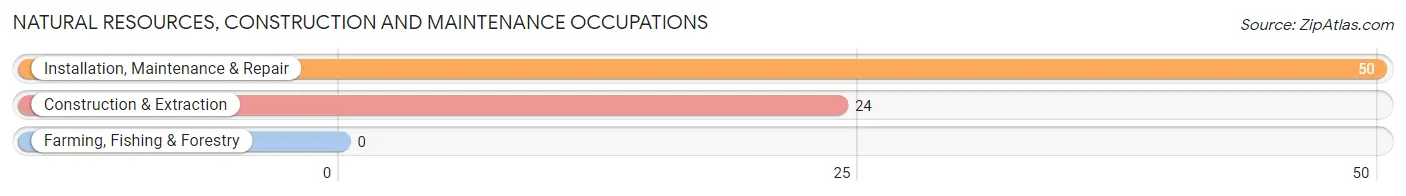
Natural Resources, Construction and Maintenance Occupations by Sex
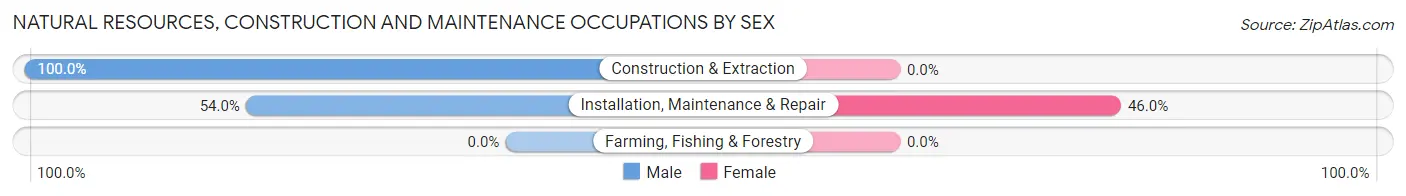
| Occupation | Male | Female |
| Farming, Fishing & Forestry | 0 (0.0%) | 0 (0.0%) |
| Construction & Extraction | 24 (100.0%) | 0 (0.0%) |
| Installation, Maintenance & Repair | 27 (54.0%) | 23 (46.0%) |
| Total (Category) | 51 (68.9%) | 23 (31.1%) |
| Total (Overall) | 245 (51.1%) | 234 (48.8%) |
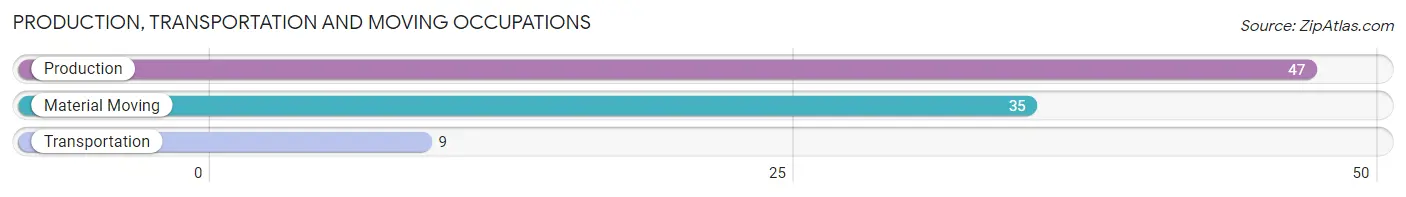
Production, Transportation and Moving Occupations
The most common Production, Transportation and Moving occupations in Marathon are Production (47 | 9.8%), Material Moving (35 | 7.3%), and Transportation (9 | 1.9%).
Production, Transportation and Moving Occupations by Sex
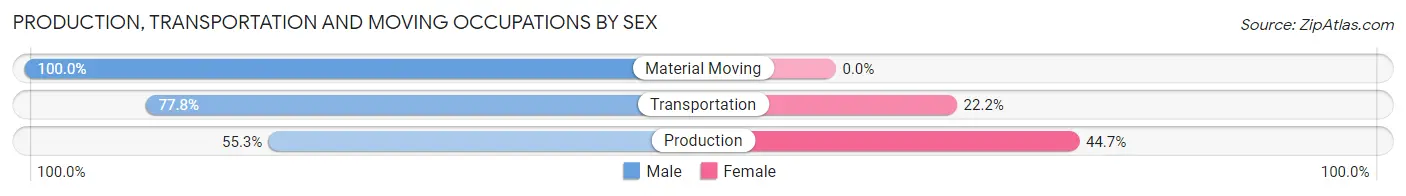
| Occupation | Male | Female |
| Production | 26 (55.3%) | 21 (44.7%) |
| Transportation | 7 (77.8%) | 2 (22.2%) |
| Material Moving | 35 (100.0%) | 0 (0.0%) |
| Total (Category) | 68 (74.7%) | 23 (25.3%) |
| Total (Overall) | 245 (51.1%) | 234 (48.8%) |
Employment Industries by Sex in Marathon
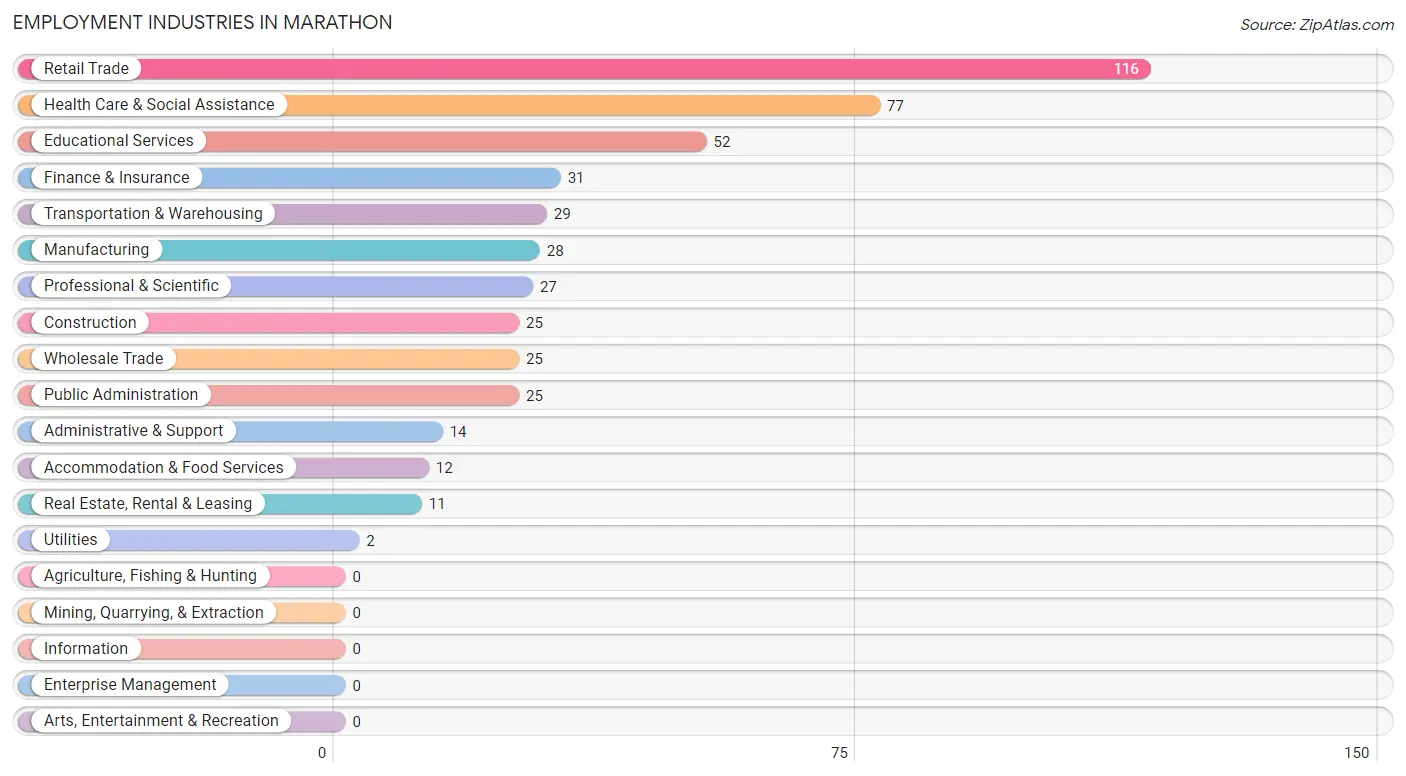
Employment Industries in Marathon
The major employment industries in Marathon include Retail Trade (116 | 24.2%), Health Care & Social Assistance (77 | 16.1%), Educational Services (52 | 10.9%), Finance & Insurance (31 | 6.5%), and Transportation & Warehousing (29 | 6.0%).
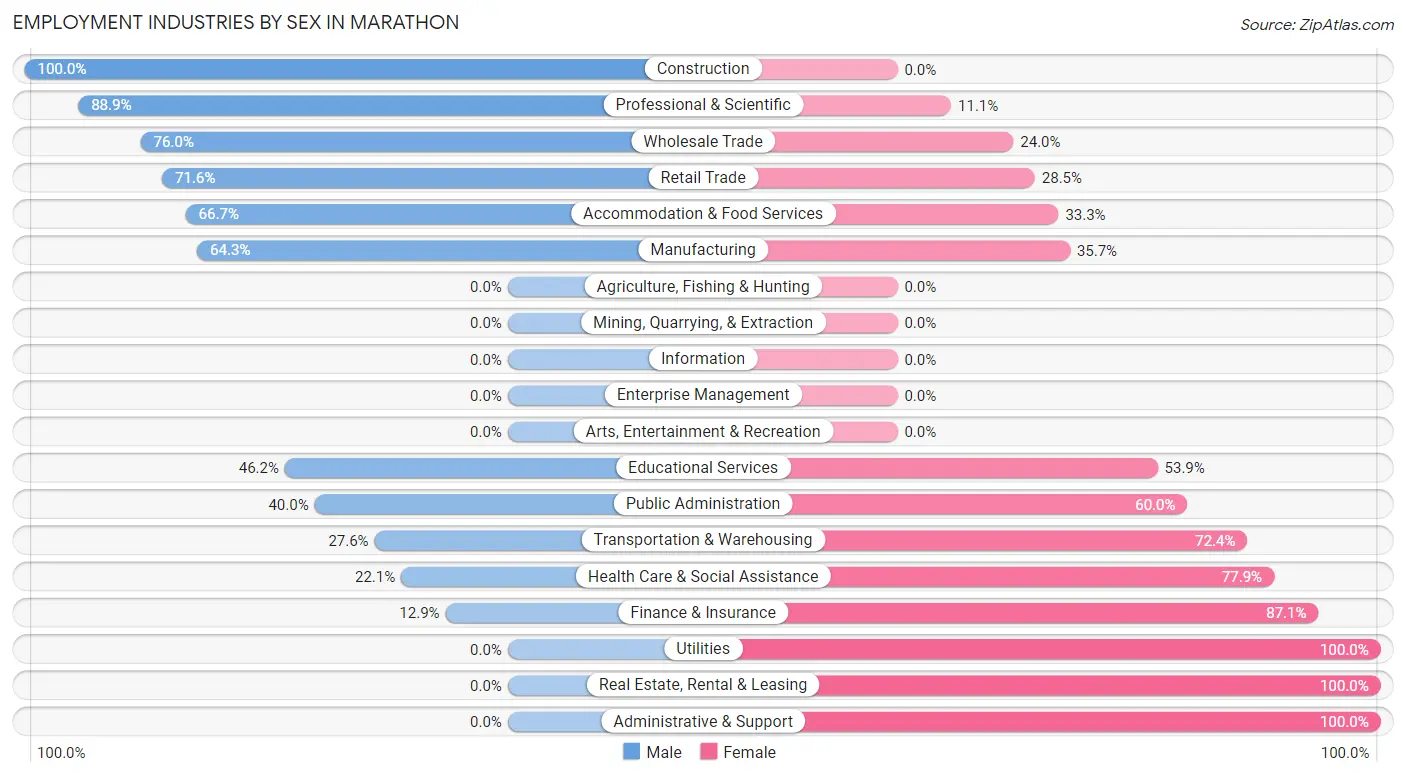
Employment Industries by Sex in Marathon
The Marathon industries that see more men than women are Construction (100.0%), Professional & Scientific (88.9%), and Wholesale Trade (76.0%), whereas the industries that tend to have a higher number of women are Utilities (100.0%), Real Estate, Rental & Leasing (100.0%), and Administrative & Support (100.0%).
| Industry | Male | Female |
| Agriculture, Fishing & Hunting | 0 (0.0%) | 0 (0.0%) |
| Mining, Quarrying, & Extraction | 0 (0.0%) | 0 (0.0%) |
| Construction | 25 (100.0%) | 0 (0.0%) |
| Manufacturing | 18 (64.3%) | 10 (35.7%) |
| Wholesale Trade | 19 (76.0%) | 6 (24.0%) |
| Retail Trade | 83 (71.6%) | 33 (28.4%) |
| Transportation & Warehousing | 8 (27.6%) | 21 (72.4%) |
| Utilities | 0 (0.0%) | 2 (100.0%) |
| Information | 0 (0.0%) | 0 (0.0%) |
| Finance & Insurance | 4 (12.9%) | 27 (87.1%) |
| Real Estate, Rental & Leasing | 0 (0.0%) | 11 (100.0%) |
| Professional & Scientific | 24 (88.9%) | 3 (11.1%) |
| Enterprise Management | 0 (0.0%) | 0 (0.0%) |
| Administrative & Support | 0 (0.0%) | 14 (100.0%) |
| Educational Services | 24 (46.2%) | 28 (53.8%) |
| Health Care & Social Assistance | 17 (22.1%) | 60 (77.9%) |
| Arts, Entertainment & Recreation | 0 (0.0%) | 0 (0.0%) |
| Accommodation & Food Services | 8 (66.7%) | 4 (33.3%) |
| Public Administration | 10 (40.0%) | 15 (60.0%) |
| Total | 245 (51.1%) | 234 (48.8%) |
Education in Marathon
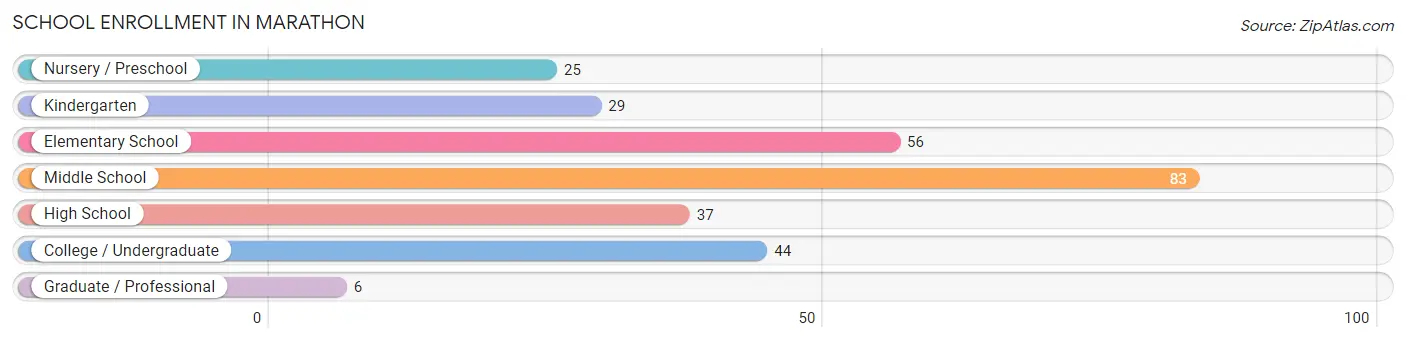
School Enrollment in Marathon
The most common levels of schooling among the 280 students in Marathon are middle school (83 | 29.6%), elementary school (56 | 20.0%), and college / undergraduate (44 | 15.7%).
| School Level | # Students | % Students |
| Nursery / Preschool | 25 | 8.9% |
| Kindergarten | 29 | 10.4% |
| Elementary School | 56 | 20.0% |
| Middle School | 83 | 29.6% |
| High School | 37 | 13.2% |
| College / Undergraduate | 44 | 15.7% |
| Graduate / Professional | 6 | 2.1% |
| Total | 280 | 100.0% |
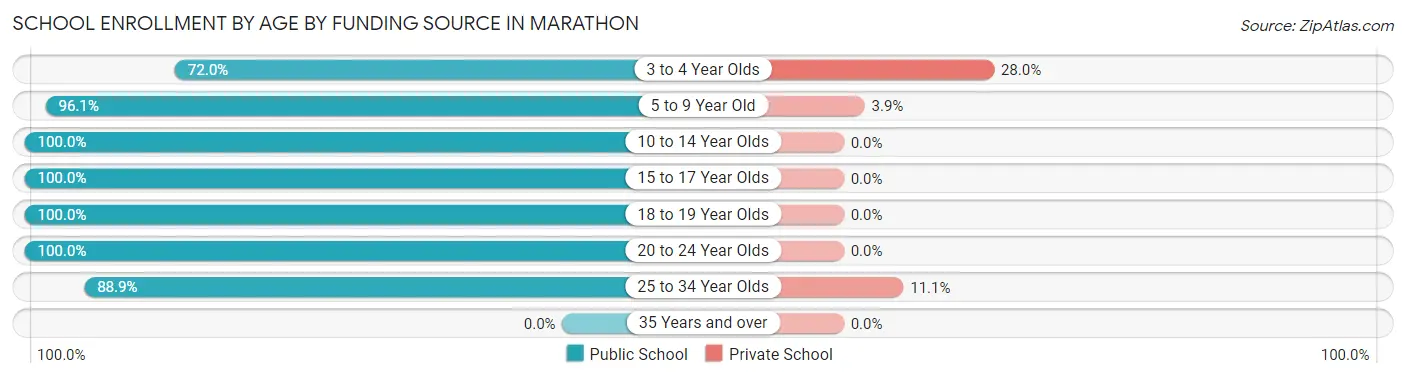
School Enrollment by Age by Funding Source in Marathon
Out of a total of 280 students who are enrolled in schools in Marathon, 12 (4.3%) attend a private institution, while the remaining 268 (95.7%) are enrolled in public schools. The age group of 3 to 4 year olds has the highest likelihood of being enrolled in private schools, with 7 (28.0% in the age bracket) enrolled. Conversely, the age group of 10 to 14 year olds has the lowest likelihood of being enrolled in a private school, with 94 (100.0% in the age bracket) attending a public institution.
| Age Bracket | Public School | Private School |
| 3 to 4 Year Olds | 18 (72.0%) | 7 (28.0%) |
| 5 to 9 Year Old | 74 (96.1%) | 3 (3.9%) |
| 10 to 14 Year Olds | 94 (100.0%) | 0 (0.0%) |
| 15 to 17 Year Olds | 32 (100.0%) | 0 (0.0%) |
| 18 to 19 Year Olds | 17 (100.0%) | 0 (0.0%) |
| 20 to 24 Year Olds | 17 (100.0%) | 0 (0.0%) |
| 25 to 34 Year Olds | 16 (88.9%) | 2 (11.1%) |
| 35 Years and over | 0 (0.0%) | 0 (0.0%) |
| Total | 268 (95.7%) | 12 (4.3%) |
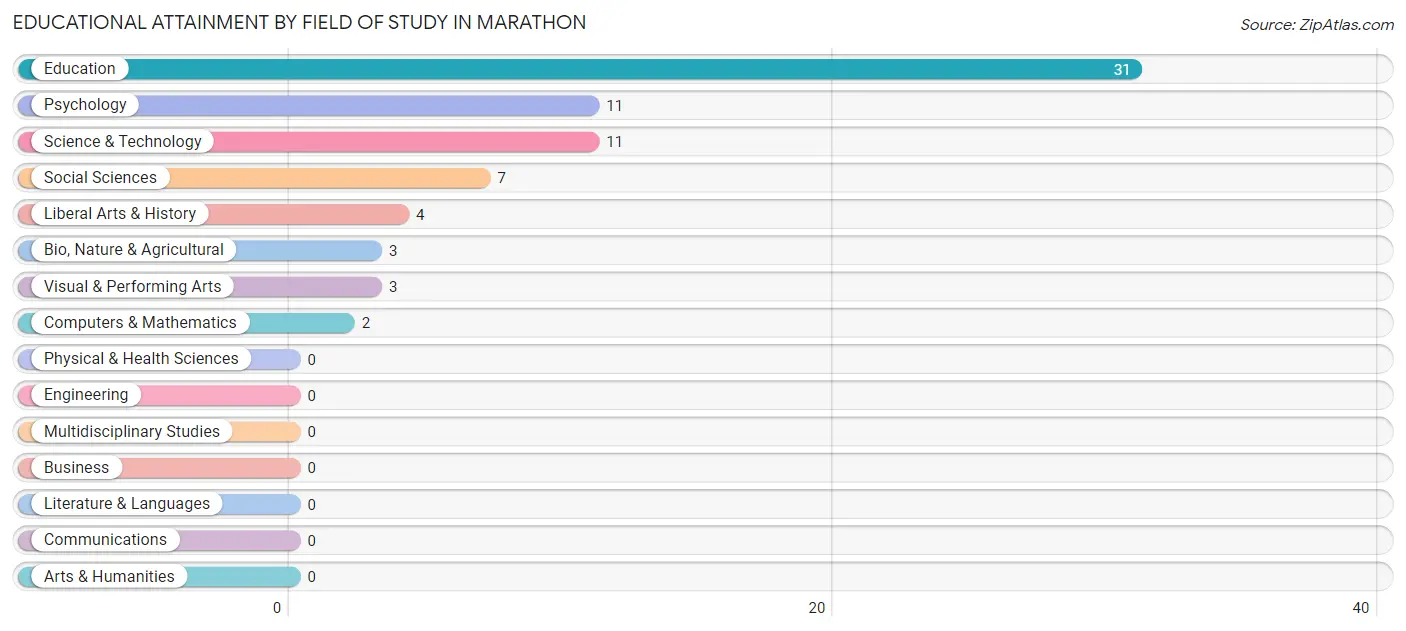
Educational Attainment by Field of Study in Marathon
Education (31 | 43.1%), psychology (11 | 15.3%), science & technology (11 | 15.3%), social sciences (7 | 9.7%), and liberal arts & history (4 | 5.6%) are the most common fields of study among 72 individuals in Marathon who have obtained a bachelor's degree or higher.
| Field of Study | # Graduates | % Graduates |
| Computers & Mathematics | 2 | 2.8% |
| Bio, Nature & Agricultural | 3 | 4.2% |
| Physical & Health Sciences | 0 | 0.0% |
| Psychology | 11 | 15.3% |
| Social Sciences | 7 | 9.7% |
| Engineering | 0 | 0.0% |
| Multidisciplinary Studies | 0 | 0.0% |
| Science & Technology | 11 | 15.3% |
| Business | 0 | 0.0% |
| Education | 31 | 43.1% |
| Literature & Languages | 0 | 0.0% |
| Liberal Arts & History | 4 | 5.6% |
| Visual & Performing Arts | 3 | 4.2% |
| Communications | 0 | 0.0% |
| Arts & Humanities | 0 | 0.0% |
| Total | 72 | 100.0% |
Transportation & Commute in Marathon
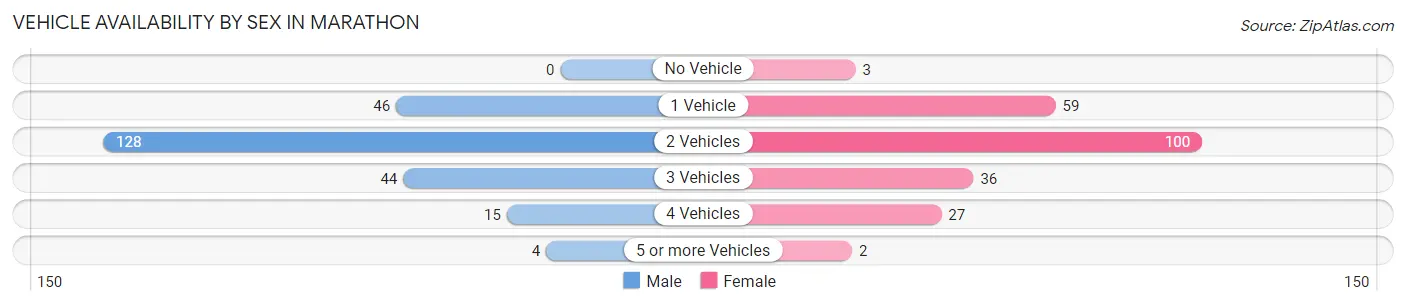
Vehicle Availability by Sex in Marathon
The most prevalent vehicle ownership categories in Marathon are males with 2 vehicles (128, accounting for 54.0%) and females with 2 vehicles (100, making up 56.4%).
| Vehicles Available | Male | Female |
| No Vehicle | 0 (0.0%) | 3 (1.3%) |
| 1 Vehicle | 46 (19.4%) | 59 (26.0%) |
| 2 Vehicles | 128 (54.0%) | 100 (44.1%) |
| 3 Vehicles | 44 (18.6%) | 36 (15.9%) |
| 4 Vehicles | 15 (6.3%) | 27 (11.9%) |
| 5 or more Vehicles | 4 (1.7%) | 2 (0.9%) |
| Total | 237 (100.0%) | 227 (100.0%) |
Commute Time in Marathon
The most frequently occuring commute durations in Marathon are 30 to 34 minutes (112 commuters, 25.6%), 20 to 24 minutes (81 commuters, 18.5%), and 45 to 59 minutes (58 commuters, 13.3%).
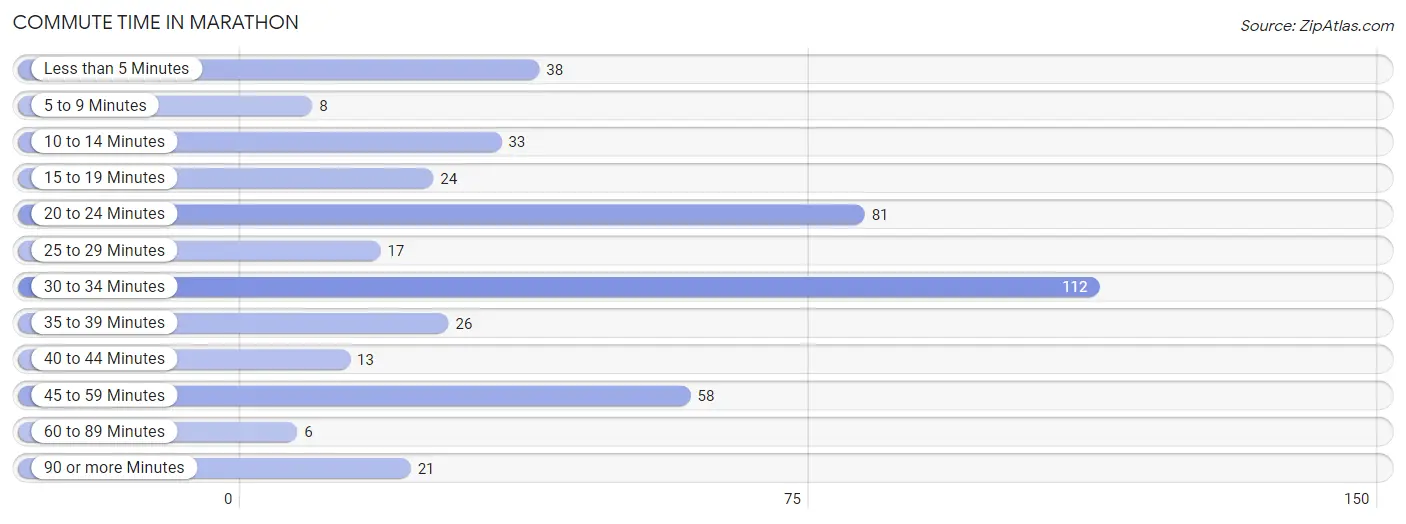
| Commute Time | # Commuters | % Commuters |
| Less than 5 Minutes | 38 | 8.7% |
| 5 to 9 Minutes | 8 | 1.8% |
| 10 to 14 Minutes | 33 | 7.5% |
| 15 to 19 Minutes | 24 | 5.5% |
| 20 to 24 Minutes | 81 | 18.5% |
| 25 to 29 Minutes | 17 | 3.9% |
| 30 to 34 Minutes | 112 | 25.6% |
| 35 to 39 Minutes | 26 | 5.9% |
| 40 to 44 Minutes | 13 | 3.0% |
| 45 to 59 Minutes | 58 | 13.3% |
| 60 to 89 Minutes | 6 | 1.4% |
| 90 or more Minutes | 21 | 4.8% |
Commute Time by Sex in Marathon
The most common commute times in Marathon are 20 to 24 minutes (52 commuters, 23.2%) for males and 30 to 34 minutes (80 commuters, 37.6%) for females.
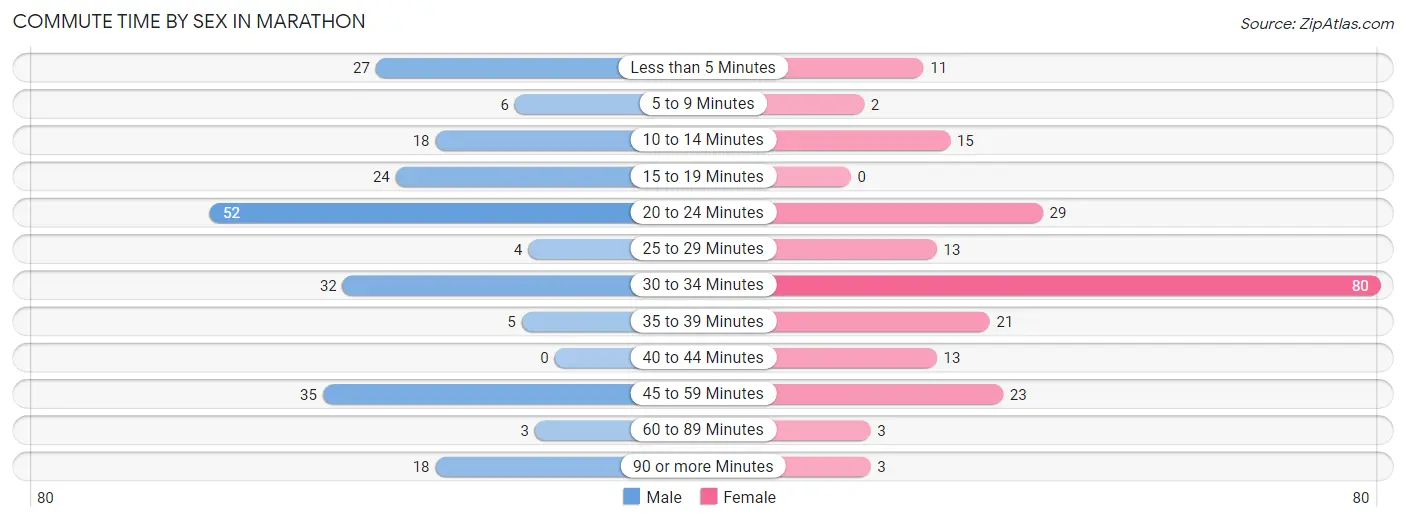
| Commute Time | Male | Female |
| Less than 5 Minutes | 27 (12.0%) | 11 (5.2%) |
| 5 to 9 Minutes | 6 (2.7%) | 2 (0.9%) |
| 10 to 14 Minutes | 18 (8.0%) | 15 (7.0%) |
| 15 to 19 Minutes | 24 (10.7%) | 0 (0.0%) |
| 20 to 24 Minutes | 52 (23.2%) | 29 (13.6%) |
| 25 to 29 Minutes | 4 (1.8%) | 13 (6.1%) |
| 30 to 34 Minutes | 32 (14.3%) | 80 (37.6%) |
| 35 to 39 Minutes | 5 (2.2%) | 21 (9.9%) |
| 40 to 44 Minutes | 0 (0.0%) | 13 (6.1%) |
| 45 to 59 Minutes | 35 (15.6%) | 23 (10.8%) |
| 60 to 89 Minutes | 3 (1.3%) | 3 (1.4%) |
| 90 or more Minutes | 18 (8.0%) | 3 (1.4%) |
Time of Departure to Work by Sex in Marathon
The most frequent times of departure to work in Marathon are 7:30 AM to 7:59 AM (50, 22.3%) for males and 6:00 AM to 6:29 AM (41, 19.3%) for females.
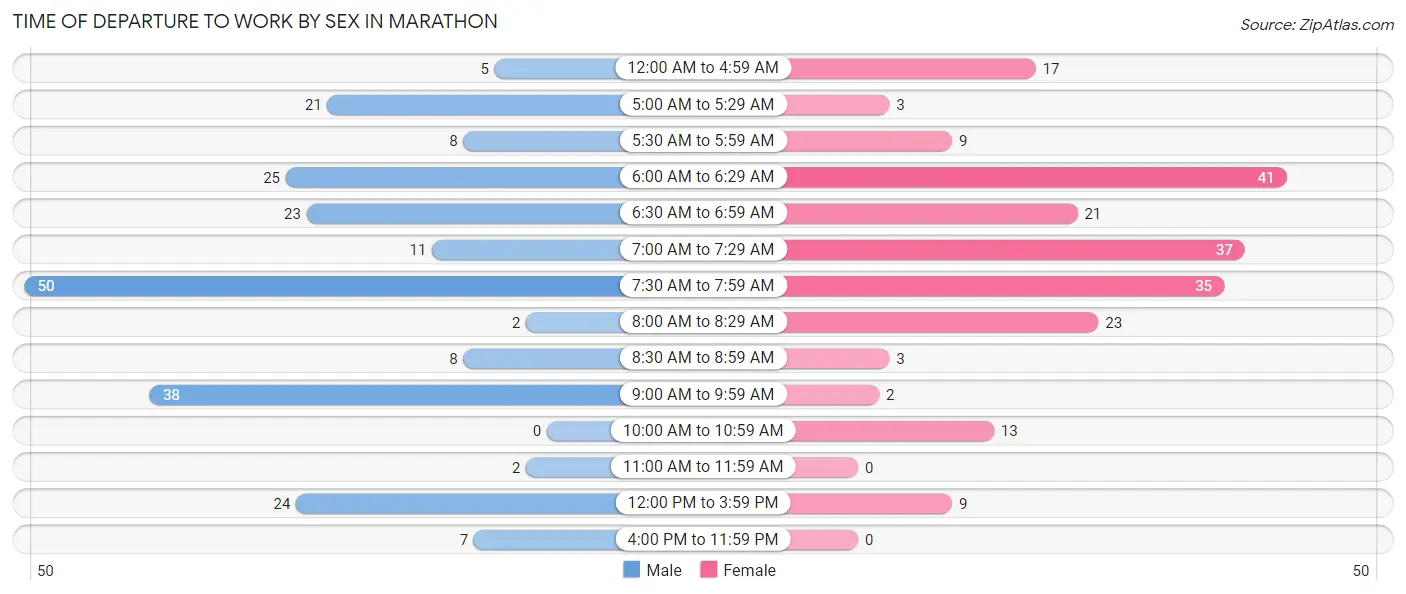
| Time of Departure | Male | Female |
| 12:00 AM to 4:59 AM | 5 (2.2%) | 17 (8.0%) |
| 5:00 AM to 5:29 AM | 21 (9.4%) | 3 (1.4%) |
| 5:30 AM to 5:59 AM | 8 (3.6%) | 9 (4.2%) |
| 6:00 AM to 6:29 AM | 25 (11.2%) | 41 (19.3%) |
| 6:30 AM to 6:59 AM | 23 (10.3%) | 21 (9.9%) |
| 7:00 AM to 7:29 AM | 11 (4.9%) | 37 (17.4%) |
| 7:30 AM to 7:59 AM | 50 (22.3%) | 35 (16.4%) |
| 8:00 AM to 8:29 AM | 2 (0.9%) | 23 (10.8%) |
| 8:30 AM to 8:59 AM | 8 (3.6%) | 3 (1.4%) |
| 9:00 AM to 9:59 AM | 38 (17.0%) | 2 (0.9%) |
| 10:00 AM to 10:59 AM | 0 (0.0%) | 13 (6.1%) |
| 11:00 AM to 11:59 AM | 2 (0.9%) | 0 (0.0%) |
| 12:00 PM to 3:59 PM | 24 (10.7%) | 9 (4.2%) |
| 4:00 PM to 11:59 PM | 7 (3.1%) | 0 (0.0%) |
| Total | 224 (100.0%) | 213 (100.0%) |
Housing Occupancy in Marathon
Occupancy by Ownership in Marathon
Of the total 358 dwellings in Marathon, owner-occupied units account for 255 (71.2%), while renter-occupied units make up 103 (28.8%).
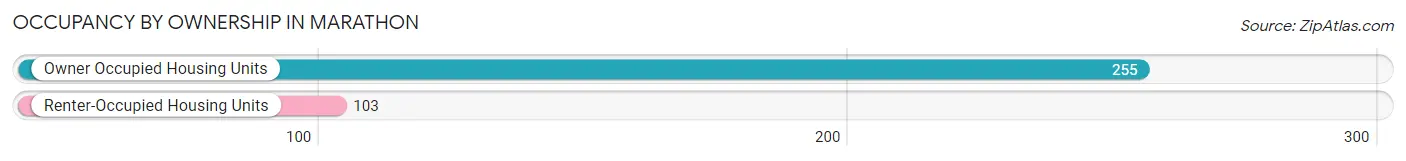
| Occupancy | # Housing Units | % Housing Units |
| Owner Occupied Housing Units | 255 | 71.2% |
| Renter-Occupied Housing Units | 103 | 28.8% |
| Total Occupied Housing Units | 358 | 100.0% |
Occupancy by Household Size in Marathon
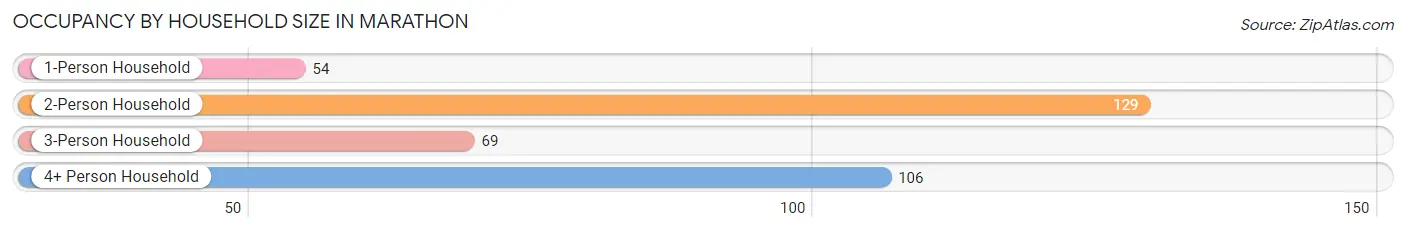
| Household Size | # Housing Units | % Housing Units |
| 1-Person Household | 54 | 15.1% |
| 2-Person Household | 129 | 36.0% |
| 3-Person Household | 69 | 19.3% |
| 4+ Person Household | 106 | 29.6% |
| Total Housing Units | 358 | 100.0% |
Occupancy by Ownership by Household Size in Marathon
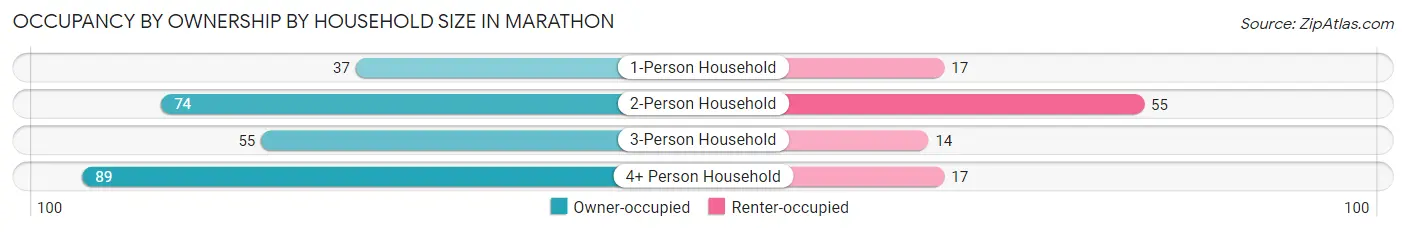
| Household Size | Owner-occupied | Renter-occupied |
| 1-Person Household | 37 (68.5%) | 17 (31.5%) |
| 2-Person Household | 74 (57.4%) | 55 (42.6%) |
| 3-Person Household | 55 (79.7%) | 14 (20.3%) |
| 4+ Person Household | 89 (84.0%) | 17 (16.0%) |
| Total Housing Units | 255 (71.2%) | 103 (28.8%) |
Occupancy by Educational Attainment in Marathon
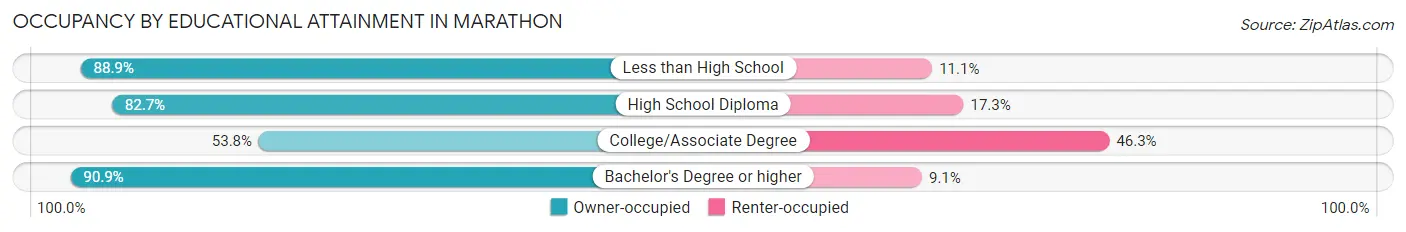
| Household Size | Owner-occupied | Renter-occupied |
| Less than High School | 24 (88.9%) | 3 (11.1%) |
| High School Diploma | 105 (82.7%) | 22 (17.3%) |
| College/Associate Degree | 86 (53.7%) | 74 (46.3%) |
| Bachelor's Degree or higher | 40 (90.9%) | 4 (9.1%) |
Occupancy by Age of Householder in Marathon
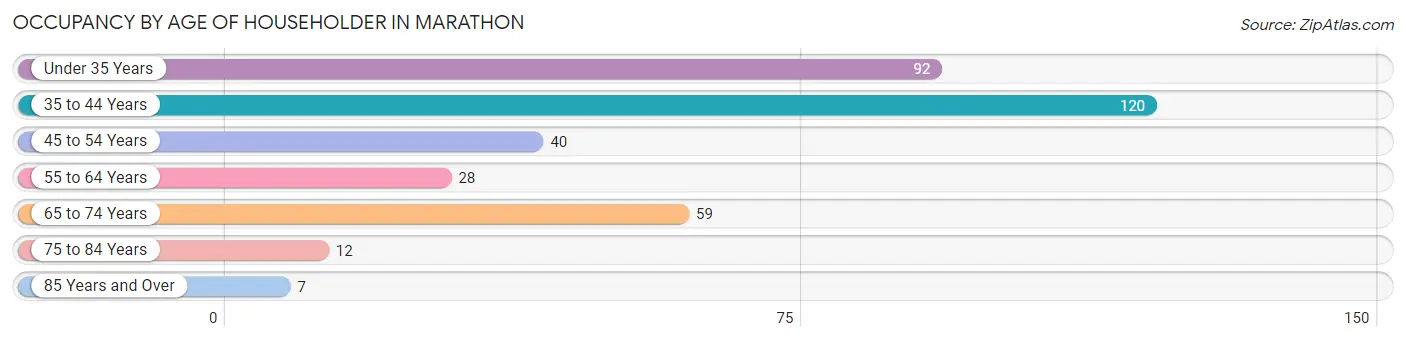
| Age Bracket | # Households | % Households |
| Under 35 Years | 92 | 25.7% |
| 35 to 44 Years | 120 | 33.5% |
| 45 to 54 Years | 40 | 11.2% |
| 55 to 64 Years | 28 | 7.8% |
| 65 to 74 Years | 59 | 16.5% |
| 75 to 84 Years | 12 | 3.4% |
| 85 Years and Over | 7 | 2.0% |
| Total | 358 | 100.0% |
Housing Finances in Marathon
Median Income by Occupancy in Marathon
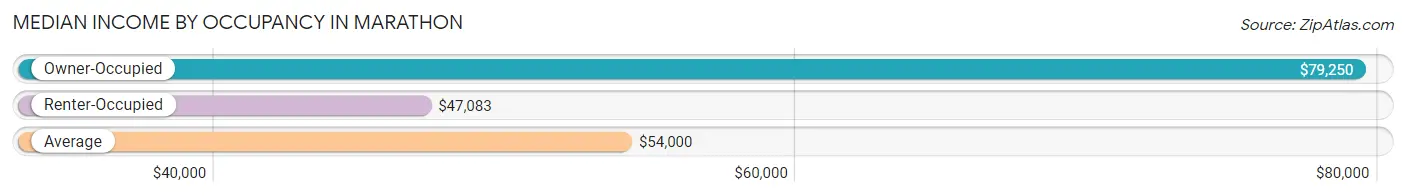
| Occupancy Type | # Households | Median Income |
| Owner-Occupied | 255 (71.2%) | $79,250 |
| Renter-Occupied | 103 (28.8%) | $47,083 |
| Average | 358 (100.0%) | $54,000 |
Occupancy by Householder Income Bracket in Marathon
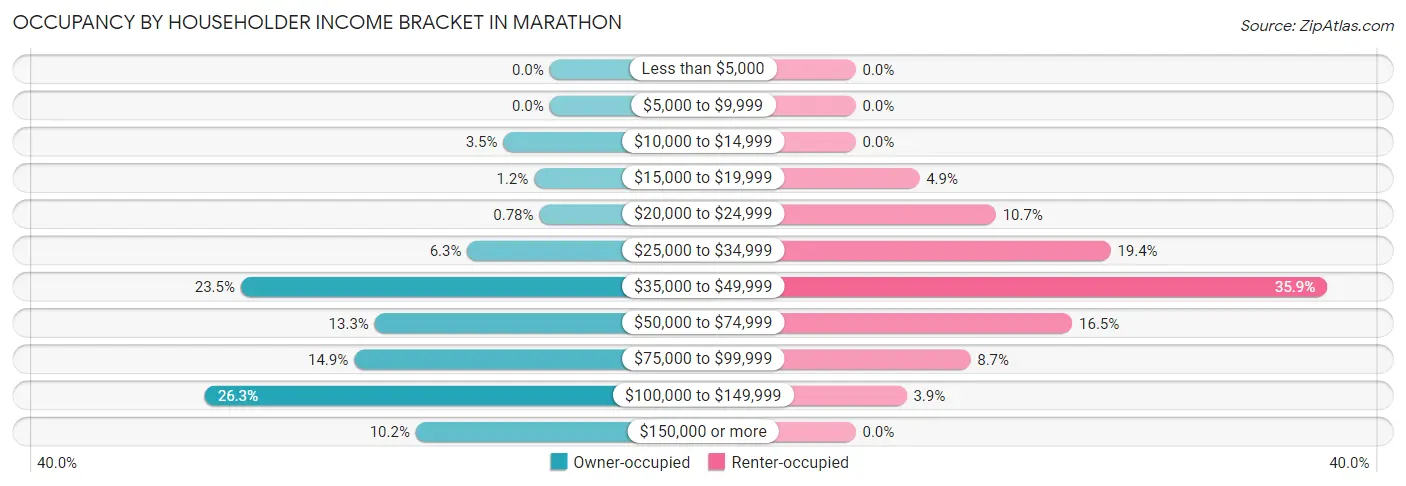
| Income Bracket | Owner-occupied | Renter-occupied |
| Less than $5,000 | 0 (0.0%) | 0 (0.0%) |
| $5,000 to $9,999 | 0 (0.0%) | 0 (0.0%) |
| $10,000 to $14,999 | 9 (3.5%) | 0 (0.0%) |
| $15,000 to $19,999 | 3 (1.2%) | 5 (4.9%) |
| $20,000 to $24,999 | 2 (0.8%) | 11 (10.7%) |
| $25,000 to $34,999 | 16 (6.3%) | 20 (19.4%) |
| $35,000 to $49,999 | 60 (23.5%) | 37 (35.9%) |
| $50,000 to $74,999 | 34 (13.3%) | 17 (16.5%) |
| $75,000 to $99,999 | 38 (14.9%) | 9 (8.7%) |
| $100,000 to $149,999 | 67 (26.3%) | 4 (3.9%) |
| $150,000 or more | 26 (10.2%) | 0 (0.0%) |
| Total | 255 (100.0%) | 103 (100.0%) |
Monthly Housing Cost Tiers in Marathon
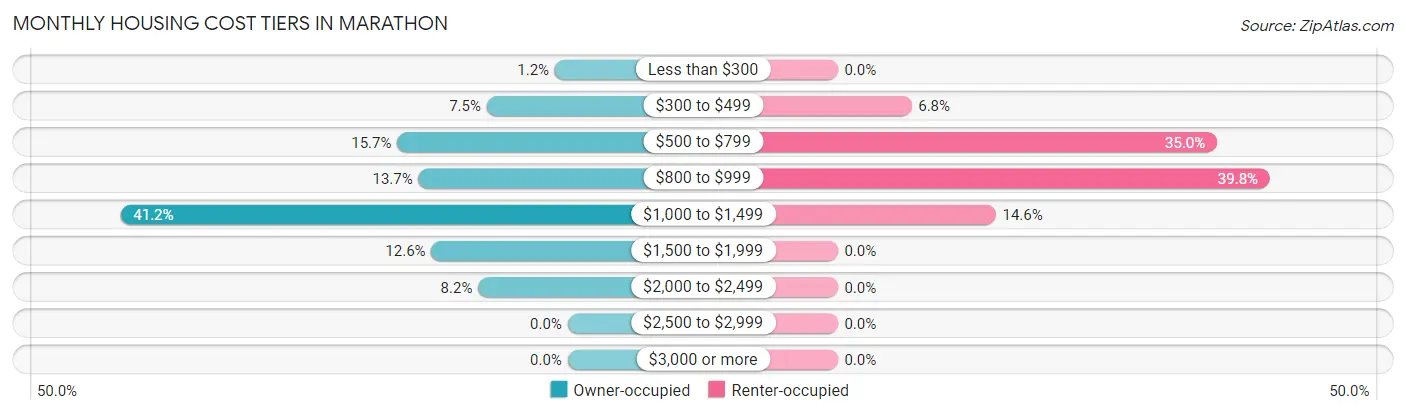
| Monthly Cost | Owner-occupied | Renter-occupied |
| Less than $300 | 3 (1.2%) | 0 (0.0%) |
| $300 to $499 | 19 (7.4%) | 7 (6.8%) |
| $500 to $799 | 40 (15.7%) | 36 (34.9%) |
| $800 to $999 | 35 (13.7%) | 41 (39.8%) |
| $1,000 to $1,499 | 105 (41.2%) | 15 (14.6%) |
| $1,500 to $1,999 | 32 (12.6%) | 0 (0.0%) |
| $2,000 to $2,499 | 21 (8.2%) | 0 (0.0%) |
| $2,500 to $2,999 | 0 (0.0%) | 0 (0.0%) |
| $3,000 or more | 0 (0.0%) | 0 (0.0%) |
| Total | 255 (100.0%) | 103 (100.0%) |
Physical Housing Characteristics in Marathon
Housing Structures in Marathon
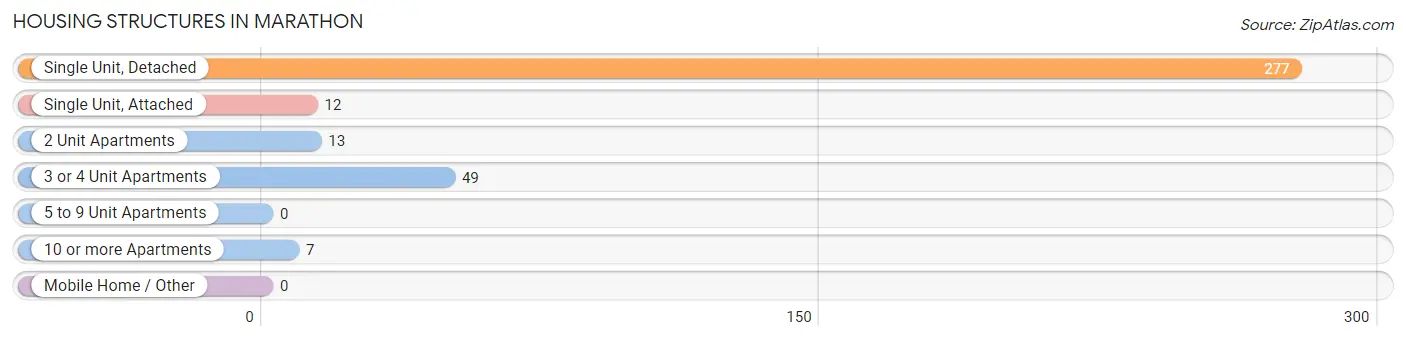
| Structure Type | # Housing Units | % Housing Units |
| Single Unit, Detached | 277 | 77.4% |
| Single Unit, Attached | 12 | 3.4% |
| 2 Unit Apartments | 13 | 3.6% |
| 3 or 4 Unit Apartments | 49 | 13.7% |
| 5 to 9 Unit Apartments | 0 | 0.0% |
| 10 or more Apartments | 7 | 2.0% |
| Mobile Home / Other | 0 | 0.0% |
| Total | 358 | 100.0% |
Housing Structures by Occupancy in Marathon
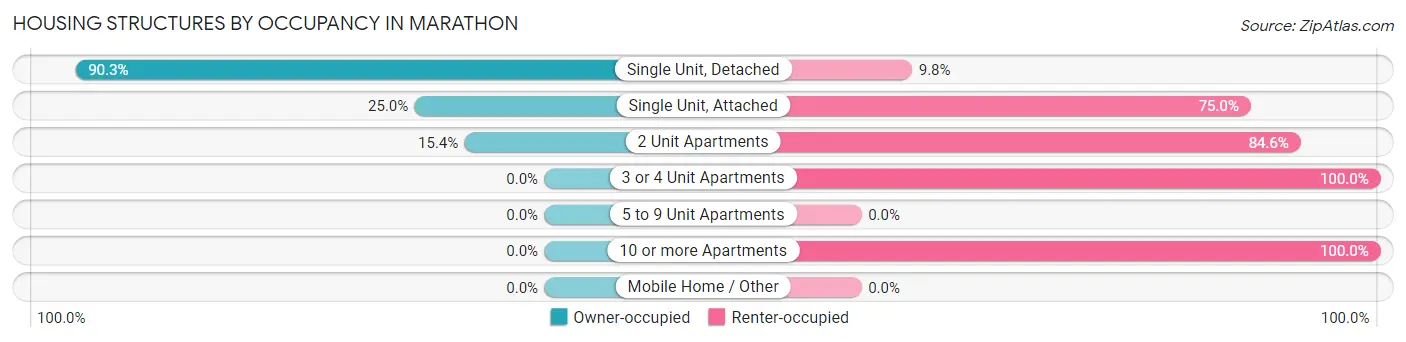
| Structure Type | Owner-occupied | Renter-occupied |
| Single Unit, Detached | 250 (90.2%) | 27 (9.8%) |
| Single Unit, Attached | 3 (25.0%) | 9 (75.0%) |
| 2 Unit Apartments | 2 (15.4%) | 11 (84.6%) |
| 3 or 4 Unit Apartments | 0 (0.0%) | 49 (100.0%) |
| 5 to 9 Unit Apartments | 0 (0.0%) | 0 (0.0%) |
| 10 or more Apartments | 0 (0.0%) | 7 (100.0%) |
| Mobile Home / Other | 0 (0.0%) | 0 (0.0%) |
| Total | 255 (71.2%) | 103 (28.8%) |
Housing Structures by Number of Rooms in Marathon
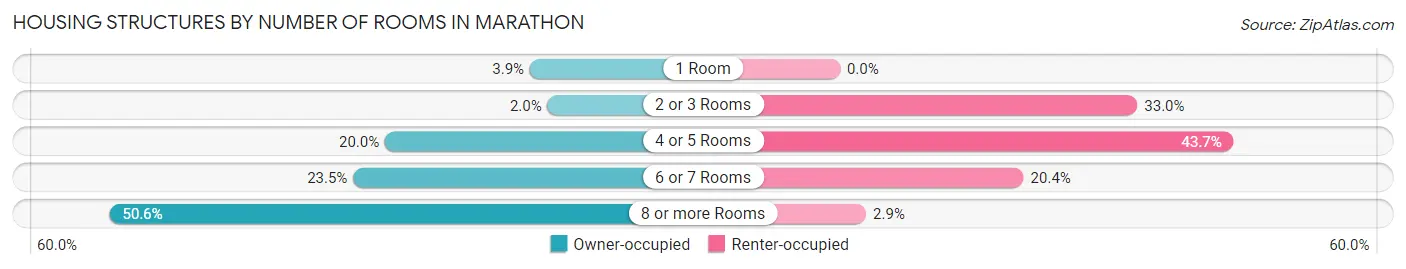
| Number of Rooms | Owner-occupied | Renter-occupied |
| 1 Room | 10 (3.9%) | 0 (0.0%) |
| 2 or 3 Rooms | 5 (2.0%) | 34 (33.0%) |
| 4 or 5 Rooms | 51 (20.0%) | 45 (43.7%) |
| 6 or 7 Rooms | 60 (23.5%) | 21 (20.4%) |
| 8 or more Rooms | 129 (50.6%) | 3 (2.9%) |
| Total | 255 (100.0%) | 103 (100.0%) |
Housing Structure by Heating Type in Marathon
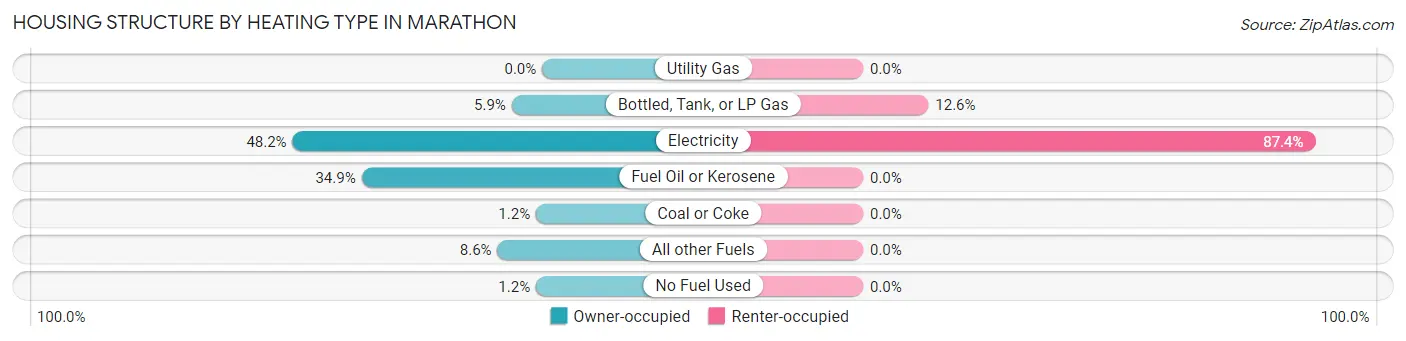
| Heating Type | Owner-occupied | Renter-occupied |
| Utility Gas | 0 (0.0%) | 0 (0.0%) |
| Bottled, Tank, or LP Gas | 15 (5.9%) | 13 (12.6%) |
| Electricity | 123 (48.2%) | 90 (87.4%) |
| Fuel Oil or Kerosene | 89 (34.9%) | 0 (0.0%) |
| Coal or Coke | 3 (1.2%) | 0 (0.0%) |
| All other Fuels | 22 (8.6%) | 0 (0.0%) |
| No Fuel Used | 3 (1.2%) | 0 (0.0%) |
| Total | 255 (100.0%) | 103 (100.0%) |
Household Vehicle Usage in Marathon
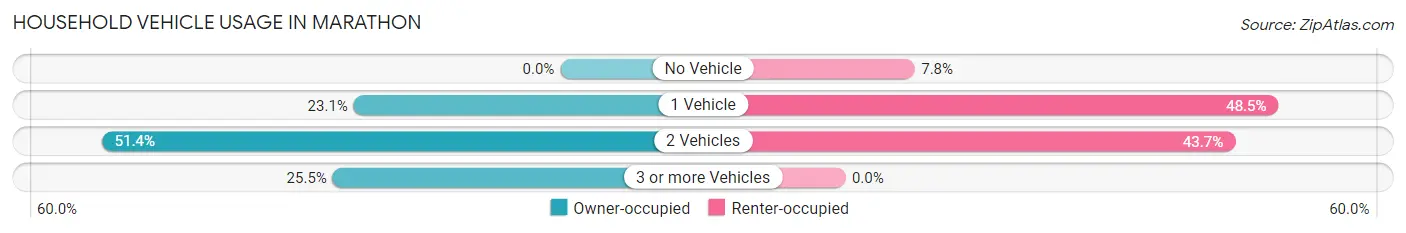
| Vehicles per Household | Owner-occupied | Renter-occupied |
| No Vehicle | 0 (0.0%) | 8 (7.8%) |
| 1 Vehicle | 59 (23.1%) | 50 (48.5%) |
| 2 Vehicles | 131 (51.4%) | 45 (43.7%) |
| 3 or more Vehicles | 65 (25.5%) | 0 (0.0%) |
| Total | 255 (100.0%) | 103 (100.0%) |
Real Estate & Mortgages in Marathon
Real Estate and Mortgage Overview in Marathon
| Characteristic | Without Mortgage | With Mortgage |
| Housing Units | 80 | 175 |
| Median Property Value | $79,600 | $119,800 |
| Median Household Income | $48,854 | $23 |
| Monthly Housing Costs | $559 | $0 |
| Real Estate Taxes | $3,394 | $17 |
Property Value by Mortgage Status in Marathon
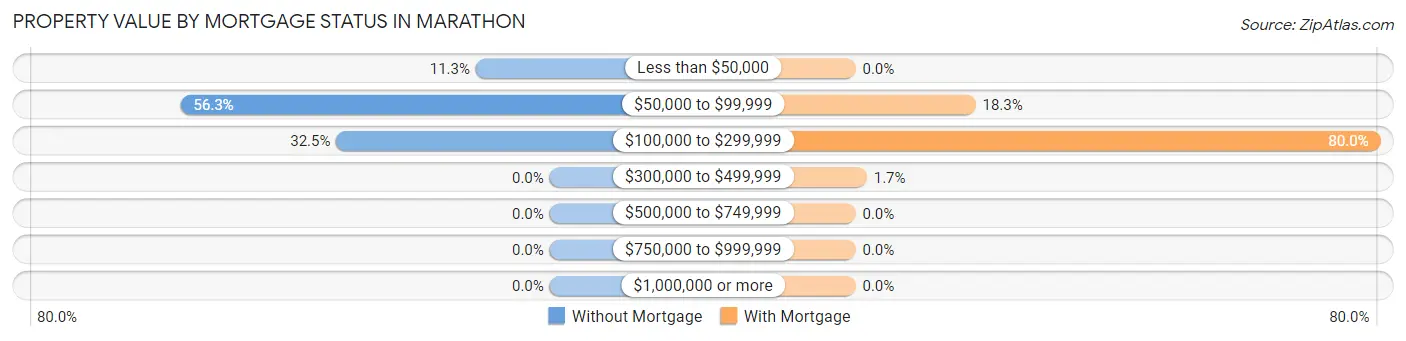
| Property Value | Without Mortgage | With Mortgage |
| Less than $50,000 | 9 (11.3%) | 0 (0.0%) |
| $50,000 to $99,999 | 45 (56.2%) | 32 (18.3%) |
| $100,000 to $299,999 | 26 (32.5%) | 140 (80.0%) |
| $300,000 to $499,999 | 0 (0.0%) | 3 (1.7%) |
| $500,000 to $749,999 | 0 (0.0%) | 0 (0.0%) |
| $750,000 to $999,999 | 0 (0.0%) | 0 (0.0%) |
| $1,000,000 or more | 0 (0.0%) | 0 (0.0%) |
| Total | 80 (100.0%) | 175 (100.0%) |
Household Income by Mortgage Status in Marathon
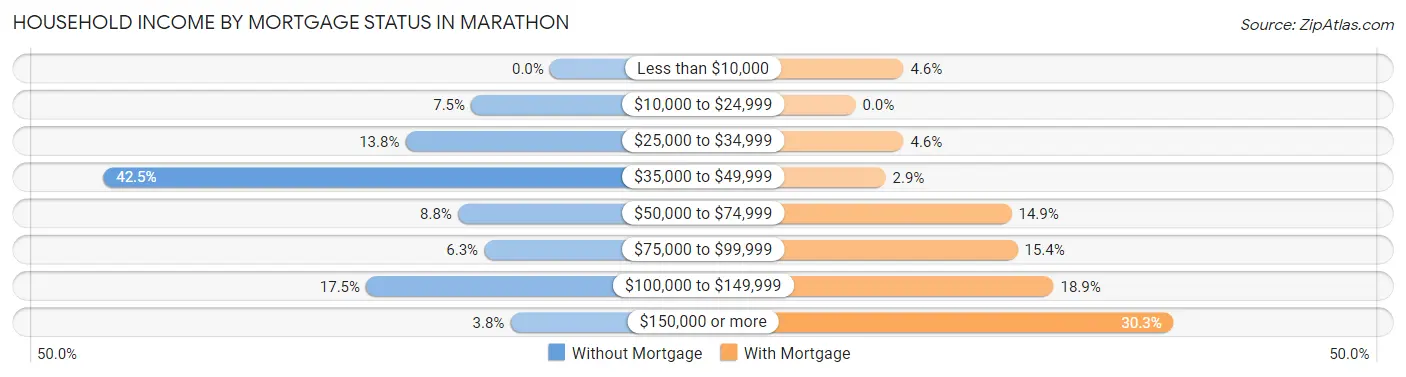
| Household Income | Without Mortgage | With Mortgage |
| Less than $10,000 | 0 (0.0%) | 8 (4.6%) |
| $10,000 to $24,999 | 6 (7.5%) | 0 (0.0%) |
| $25,000 to $34,999 | 11 (13.8%) | 8 (4.6%) |
| $35,000 to $49,999 | 34 (42.5%) | 5 (2.9%) |
| $50,000 to $74,999 | 7 (8.7%) | 26 (14.9%) |
| $75,000 to $99,999 | 5 (6.2%) | 27 (15.4%) |
| $100,000 to $149,999 | 14 (17.5%) | 33 (18.9%) |
| $150,000 or more | 3 (3.7%) | 53 (30.3%) |
| Total | 80 (100.0%) | 175 (100.0%) |
Property Value to Household Income Ratio in Marathon
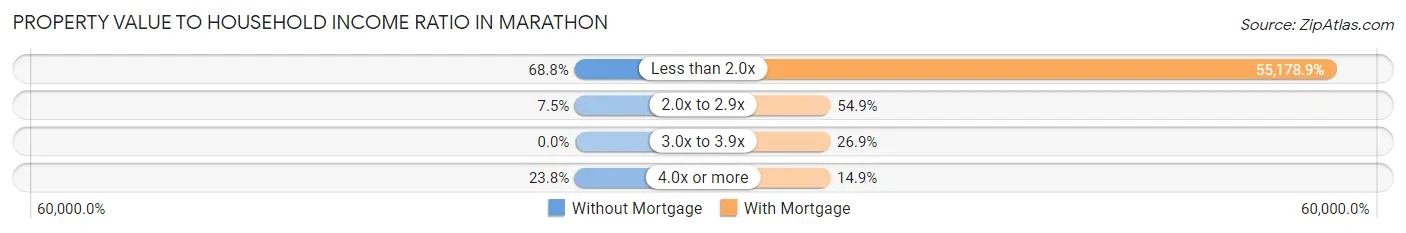
| Value-to-Income Ratio | Without Mortgage | With Mortgage |
| Less than 2.0x | 55 (68.8%) | 96,563 (55,178.9%) |
| 2.0x to 2.9x | 6 (7.5%) | 96 (54.9%) |
| 3.0x to 3.9x | 0 (0.0%) | 47 (26.9%) |
| 4.0x or more | 19 (23.7%) | 26 (14.9%) |
| Total | 80 (100.0%) | 175 (100.0%) |
Real Estate Taxes by Mortgage Status in Marathon
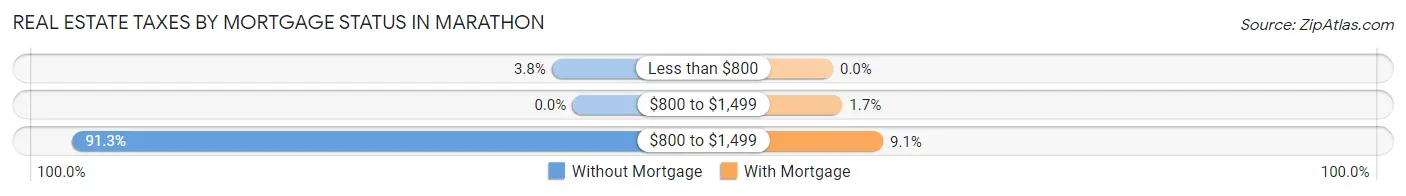
| Property Taxes | Without Mortgage | With Mortgage |
| Less than $800 | 3 (3.7%) | 0 (0.0%) |
| $800 to $1,499 | 0 (0.0%) | 3 (1.7%) |
| $800 to $1,499 | 73 (91.2%) | 16 (9.1%) |
| Total | 80 (100.0%) | 175 (100.0%) |
Health & Disability in Marathon
Health Insurance Coverage by Age in Marathon
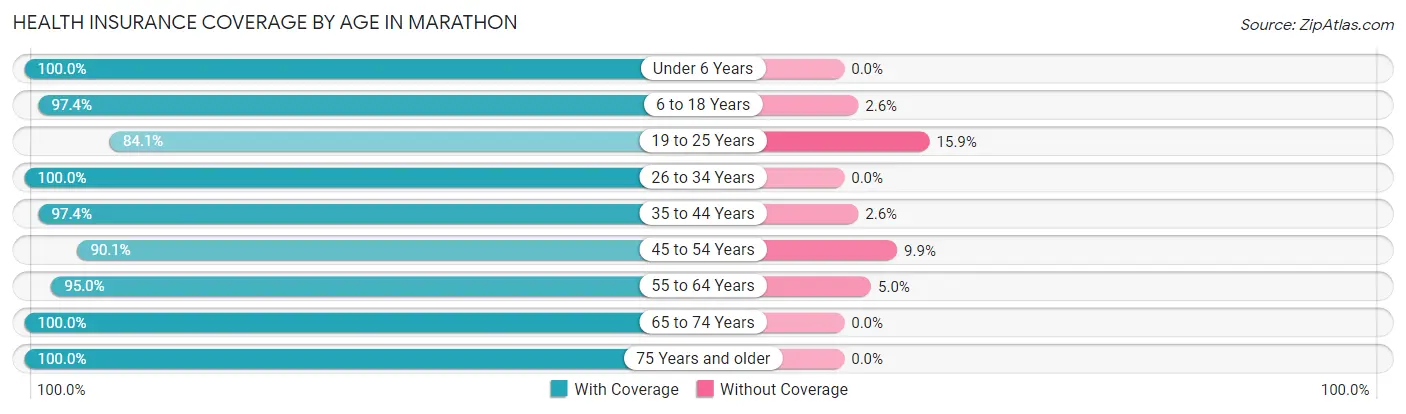
| Age Bracket | With Coverage | Without Coverage |
| Under 6 Years | 136 (100.0%) | 0 (0.0%) |
| 6 to 18 Years | 186 (97.4%) | 5 (2.6%) |
| 19 to 25 Years | 111 (84.1%) | 21 (15.9%) |
| 26 to 34 Years | 112 (100.0%) | 0 (0.0%) |
| 35 to 44 Years | 186 (97.4%) | 5 (2.6%) |
| 45 to 54 Years | 64 (90.1%) | 7 (9.9%) |
| 55 to 64 Years | 76 (95.0%) | 4 (5.0%) |
| 65 to 74 Years | 89 (100.0%) | 0 (0.0%) |
| 75 Years and older | 34 (100.0%) | 0 (0.0%) |
| Total | 994 (96.0%) | 42 (4.1%) |
Health Insurance Coverage by Citizenship Status in Marathon
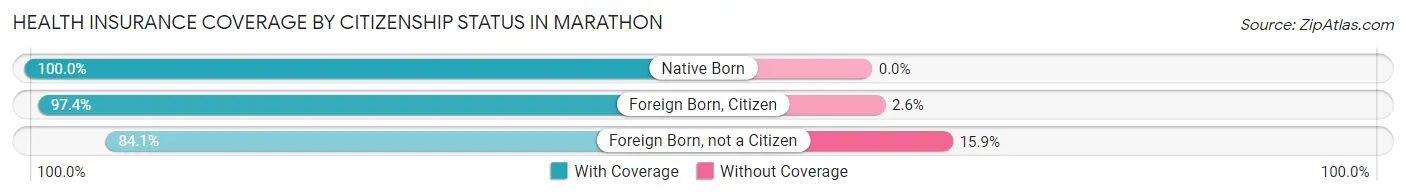
| Citizenship Status | With Coverage | Without Coverage |
| Native Born | 136 (100.0%) | 0 (0.0%) |
| Foreign Born, Citizen | 186 (97.4%) | 5 (2.6%) |
| Foreign Born, not a Citizen | 111 (84.1%) | 21 (15.9%) |
Health Insurance Coverage by Household Income in Marathon
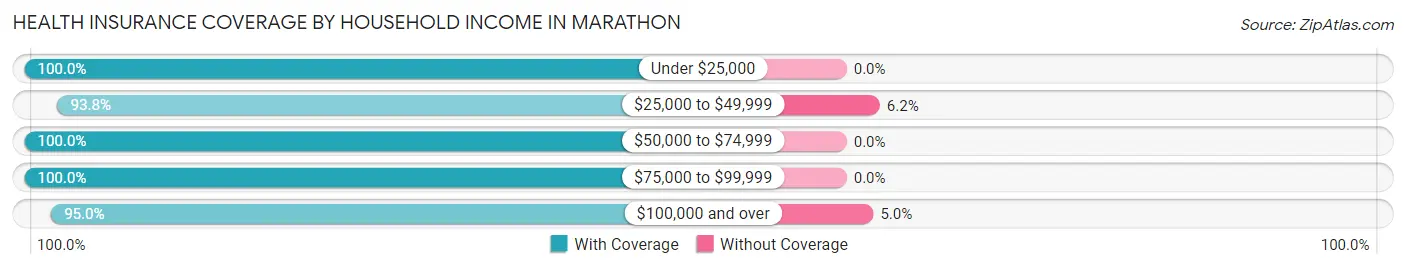
| Household Income | With Coverage | Without Coverage |
| Under $25,000 | 45 (100.0%) | 0 (0.0%) |
| $25,000 to $49,999 | 348 (93.8%) | 23 (6.2%) |
| $50,000 to $74,999 | 118 (100.0%) | 0 (0.0%) |
| $75,000 to $99,999 | 122 (100.0%) | 0 (0.0%) |
| $100,000 and over | 361 (95.0%) | 19 (5.0%) |
Public vs Private Health Insurance Coverage by Age in Marathon
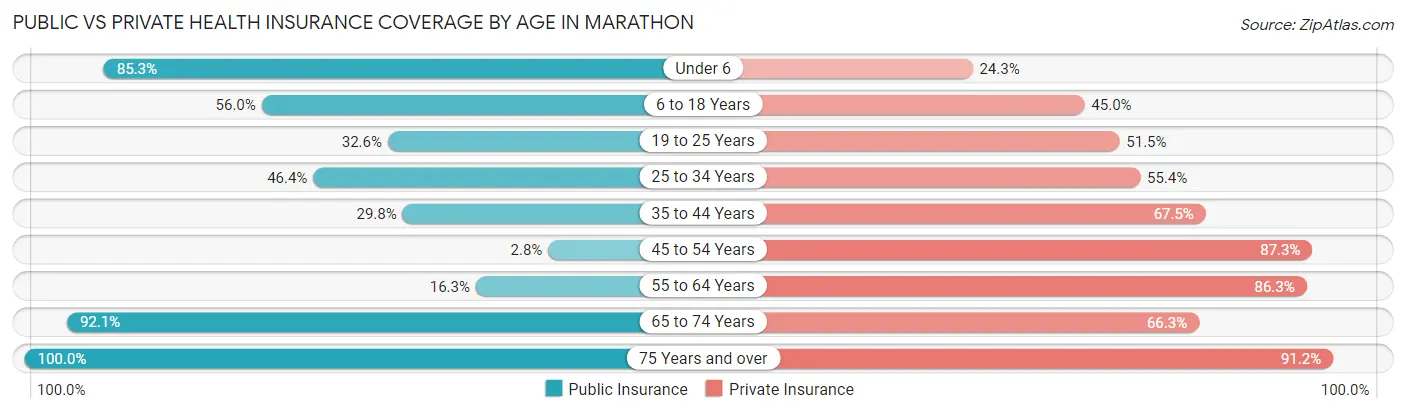
| Age Bracket | Public Insurance | Private Insurance |
| Under 6 | 116 (85.3%) | 33 (24.3%) |
| 6 to 18 Years | 107 (56.0%) | 86 (45.0%) |
| 19 to 25 Years | 43 (32.6%) | 68 (51.5%) |
| 25 to 34 Years | 52 (46.4%) | 62 (55.4%) |
| 35 to 44 Years | 57 (29.8%) | 129 (67.5%) |
| 45 to 54 Years | 2 (2.8%) | 62 (87.3%) |
| 55 to 64 Years | 13 (16.3%) | 69 (86.3%) |
| 65 to 74 Years | 82 (92.1%) | 59 (66.3%) |
| 75 Years and over | 34 (100.0%) | 31 (91.2%) |
| Total | 506 (48.8%) | 599 (57.8%) |
Disability Status by Sex by Age in Marathon
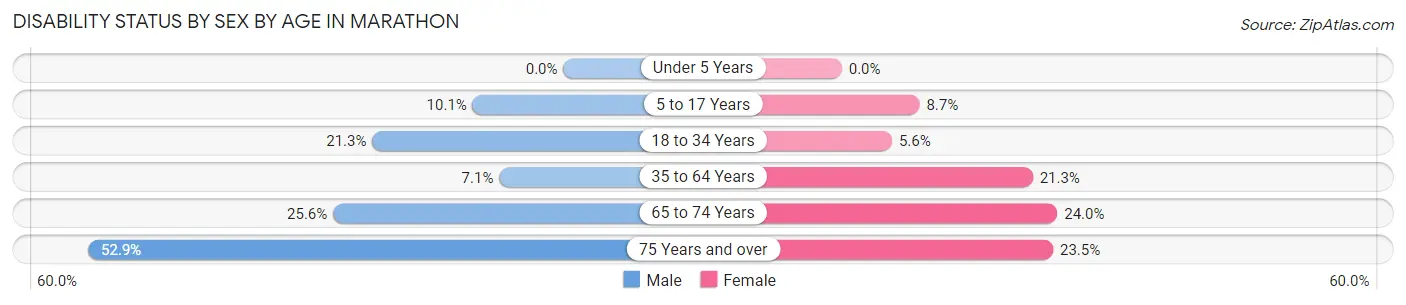
| Age Bracket | Male | Female |
| Under 5 Years | 0 (0.0%) | 0 (0.0%) |
| 5 to 17 Years | 10 (10.1%) | 9 (8.6%) |
| 18 to 34 Years | 20 (21.3%) | 9 (5.6%) |
| 35 to 64 Years | 12 (7.1%) | 37 (21.3%) |
| 65 to 74 Years | 10 (25.6%) | 12 (24.0%) |
| 75 Years and over | 9 (52.9%) | 4 (23.5%) |
Disability Class by Sex by Age in Marathon
Disability Class: Hearing Difficulty
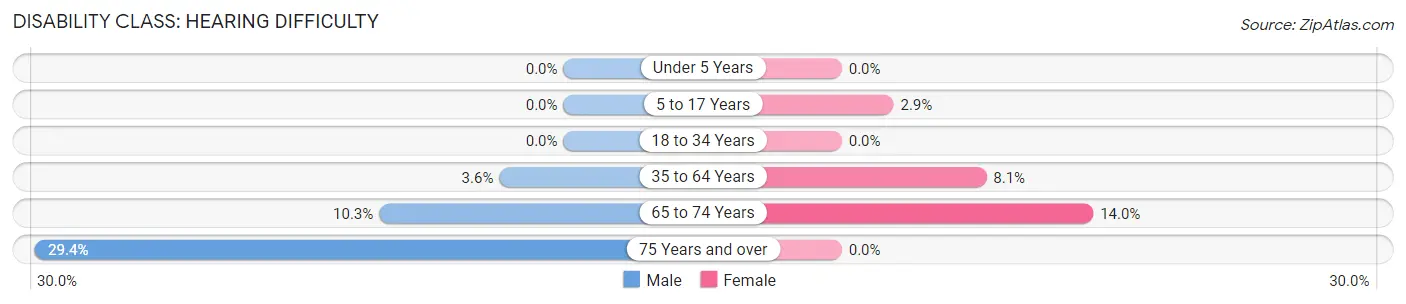
| Age Bracket | Male | Female |
| Under 5 Years | 0 (0.0%) | 0 (0.0%) |
| 5 to 17 Years | 0 (0.0%) | 3 (2.9%) |
| 18 to 34 Years | 0 (0.0%) | 0 (0.0%) |
| 35 to 64 Years | 6 (3.6%) | 14 (8.1%) |
| 65 to 74 Years | 4 (10.3%) | 7 (14.0%) |
| 75 Years and over | 5 (29.4%) | 0 (0.0%) |
Disability Class: Vision Difficulty
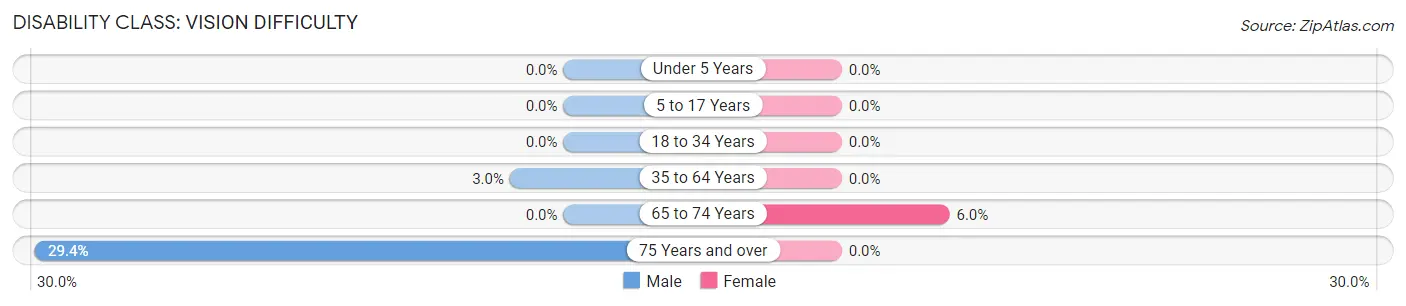
| Age Bracket | Male | Female |
| Under 5 Years | 0 (0.0%) | 0 (0.0%) |
| 5 to 17 Years | 0 (0.0%) | 0 (0.0%) |
| 18 to 34 Years | 0 (0.0%) | 0 (0.0%) |
| 35 to 64 Years | 5 (3.0%) | 0 (0.0%) |
| 65 to 74 Years | 0 (0.0%) | 3 (6.0%) |
| 75 Years and over | 5 (29.4%) | 0 (0.0%) |
Disability Class: Cognitive Difficulty
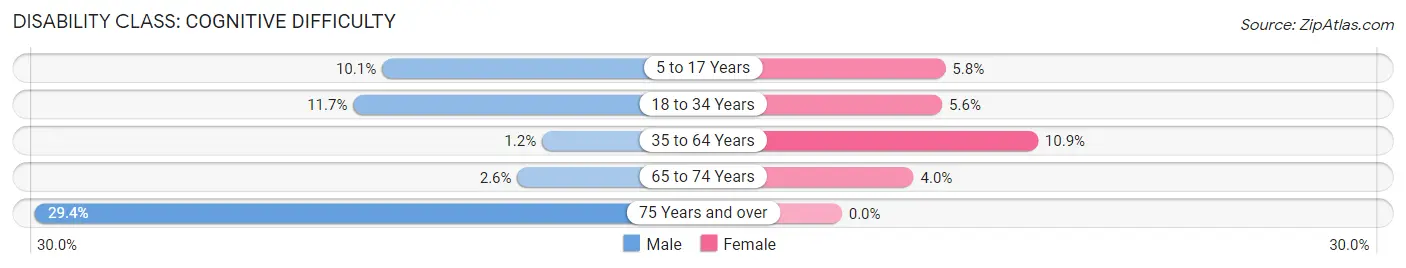
| Age Bracket | Male | Female |
| 5 to 17 Years | 10 (10.1%) | 6 (5.8%) |
| 18 to 34 Years | 11 (11.7%) | 9 (5.6%) |
| 35 to 64 Years | 2 (1.2%) | 19 (10.9%) |
| 65 to 74 Years | 1 (2.6%) | 2 (4.0%) |
| 75 Years and over | 5 (29.4%) | 0 (0.0%) |
Disability Class: Ambulatory Difficulty
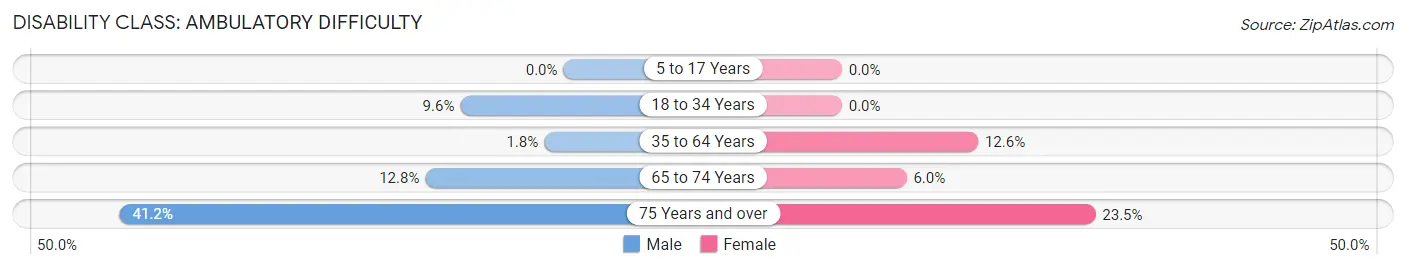
| Age Bracket | Male | Female |
| 5 to 17 Years | 0 (0.0%) | 0 (0.0%) |
| 18 to 34 Years | 9 (9.6%) | 0 (0.0%) |
| 35 to 64 Years | 3 (1.8%) | 22 (12.6%) |
| 65 to 74 Years | 5 (12.8%) | 3 (6.0%) |
| 75 Years and over | 7 (41.2%) | 4 (23.5%) |
Disability Class: Self-Care Difficulty
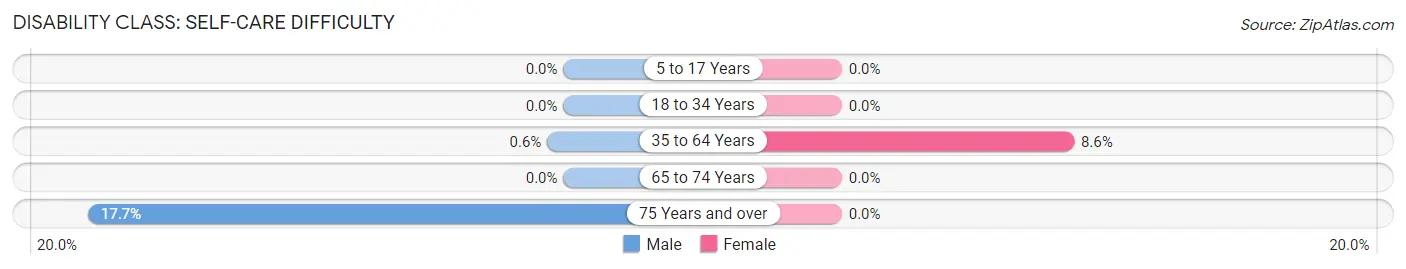
| Age Bracket | Male | Female |
| 5 to 17 Years | 0 (0.0%) | 0 (0.0%) |
| 18 to 34 Years | 0 (0.0%) | 0 (0.0%) |
| 35 to 64 Years | 1 (0.6%) | 15 (8.6%) |
| 65 to 74 Years | 0 (0.0%) | 0 (0.0%) |
| 75 Years and over | 3 (17.6%) | 0 (0.0%) |
Technology Access in Marathon
Computing Device Access in Marathon
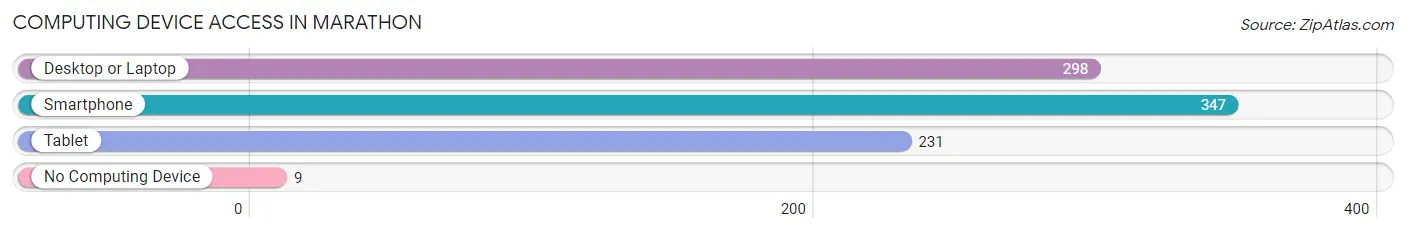
| Device Type | # Households | % Households |
| Desktop or Laptop | 298 | 83.2% |
| Smartphone | 347 | 96.9% |
| Tablet | 231 | 64.5% |
| No Computing Device | 9 | 2.5% |
| Total | 358 | 100.0% |
Internet Access in Marathon
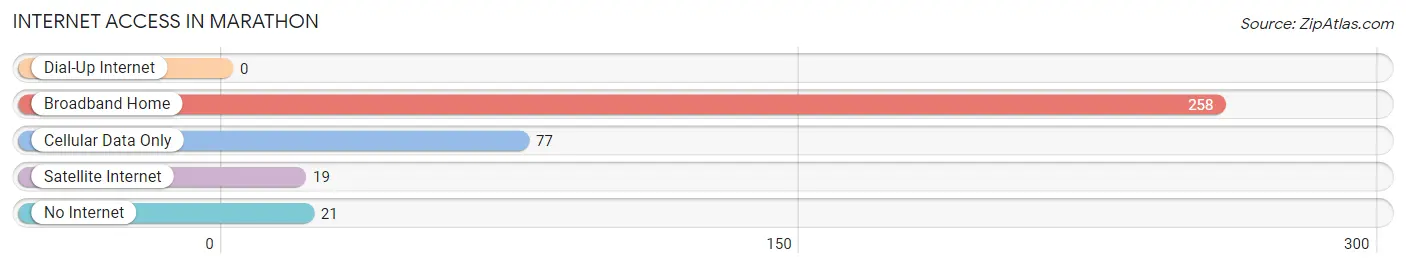
| Internet Type | # Households | % Households |
| Dial-Up Internet | 0 | 0.0% |
| Broadband Home | 258 | 72.1% |
| Cellular Data Only | 77 | 21.5% |
| Satellite Internet | 19 | 5.3% |
| No Internet | 21 | 5.9% |
| Total | 358 | 100.0% |
Marathon Summary
Marathon is a town located in Cortland County, New York, United States. The population was 2,867 at the 2010 census. The town is named after the ancient Greek legend of the runner Pheidippides, who ran from Marathon to Athens to announce the victory of the Greeks over the Persians in the Battle of Marathon.
Geography
Marathon is located in the western part of Cortland County, bordered by the towns of Cincinnatus to the north, Willet to the east, and Freetown to the south. The town is situated in the Finger Lakes region of New York, and is located on the eastern shore of Cayuga Lake. The town has a total area of 36.2 square miles, of which 35.9 square miles is land and 0.3 square miles is water.
The town is home to several small lakes, including Mud Lake, Little Mud Lake, and Little York Lake. The town is also home to several small creeks, including Mud Creek, Little York Creek, and Little Mud Creek.
History
The area that is now Marathon was first settled around 1790. The town was formed from the town of Cincinnatus in 1819. The town was named after the ancient Greek legend of the runner Pheidippides, who ran from Marathon to Athens to announce the victory of the Greeks over the Persians in the Battle of Marathon.
The town was home to several small industries, including a sawmill, gristmill, and a tannery. The town also had several small stores and a post office.
Economy
The economy of Marathon is largely based on agriculture and tourism. The town is home to several small farms, which produce a variety of crops, including corn, soybeans, hay, and apples. The town is also home to several wineries, which produce a variety of wines.
The town is also home to several small businesses, including restaurants, stores, and a gas station. The town is also home to several small bed and breakfasts, which attract tourists from all over the world.
Demographics
As of the 2010 census, there were 2,867 people, 1,093 households, and 790 families residing in the town. The population density was 79.7 people per square mile. The racial makeup of the town was 97.2% White, 0.7% African American, 0.2% Native American, 0.3% Asian, 0.1% Pacific Islander, 0.3% from other races, and 1.2% from two or more races. Hispanic or Latino of any race were 1.3% of the population.
The median income for a household in the town was $41,250, and the median income for a family was $50,000. The per capita income for the town was $20,845. About 10.2% of families and 13.2% of the population were below the poverty line, including 17.2% of those under age 18 and 8.2% of those age 65 or over.
Common Questions
What is Per Capita Income in Marathon?
Per Capita income in Marathon is $24,073.
What is the Median Family Income in Marathon?
Median Family Income in Marathon is $78,500.
What is the Median Household income in Marathon?
Median Household Income in Marathon is $54,000.
What is Income or Wage Gap in Marathon?
Income or Wage Gap in Marathon is 9.8%.
Women in Marathon earn 90.2 cents for every dollar earned by a man.
What is Inequality or Gini Index in Marathon?
Inequality or Gini Index in Marathon is 0.33.
What is the Total Population of Marathon?
Total Population of Marathon is 1,036.
What is the Total Male Population of Marathon?
Total Male Population of Marathon is 501.
What is the Total Female Population of Marathon?
Total Female Population of Marathon is 535.
What is the Ratio of Males per 100 Females in Marathon?
There are 93.64 Males per 100 Females in Marathon.
What is the Ratio of Females per 100 Males in Marathon?
There are 106.79 Females per 100 Males in Marathon.
What is the Median Population Age in Marathon?
Median Population Age in Marathon is 29.1 Years.
What is the Average Family Size in Marathon
Average Family Size in Marathon is 3.4 People.
What is the Average Household Size in Marathon
Average Household Size in Marathon is 2.9 People.
How Large is the Labor Force in Marathon?
There are 515 People in the Labor Forcein in Marathon.
What is the Percentage of People in the Labor Force in Marathon?
68.7% of People are in the Labor Force in Marathon.
What is the Unemployment Rate in Marathon?
Unemployment Rate in Marathon is 7.0%.