Manorville, NY Map & Demographics
Manorville Map
Manorville Overview
$56,933
PER CAPITA INCOME
$146,765
AVG FAMILY INCOME
$126,790
AVG HOUSEHOLD INCOME
34.5%
WAGE / INCOME GAP [ % ]
65.5¢/ $1
WAGE / INCOME GAP [ $ ]
0.41
INEQUALITY / GINI INDEX
12,681
TOTAL POPULATION
6,467
MALE POPULATION
6,214
FEMALE POPULATION
104.07
MALES / 100 FEMALES
96.09
FEMALES / 100 MALES
48.7
MEDIAN AGE
3.1
AVG FAMILY SIZE
2.6
AVG HOUSEHOLD SIZE
6,654
LABOR FORCE [ PEOPLE ]
63.1%
PERCENT IN LABOR FORCE
1.6%
UNEMPLOYMENT RATE
Manorville Zip Codes
Manorville Area Codes
Income in Manorville
Income Overview in Manorville
Per Capita Income in Manorville is $56,933, while median incomes of families and households are $146,765 and $126,790 respectively.
| Characteristic | Number | Measure |
| Per Capita Income | 12,681 | $56,933 |
| Median Family Income | 3,564 | $146,765 |
| Mean Family Income | 3,564 | $170,149 |
| Median Household Income | 4,896 | $126,790 |
| Mean Household Income | 4,896 | $144,384 |
| Income Deficit | 3,564 | $0 |
| Wage / Income Gap (%) | 12,681 | 34.47% |
| Wage / Income Gap ($) | 12,681 | 65.53¢ per $1 |
| Gini / Inequality Index | 12,681 | 0.41 |
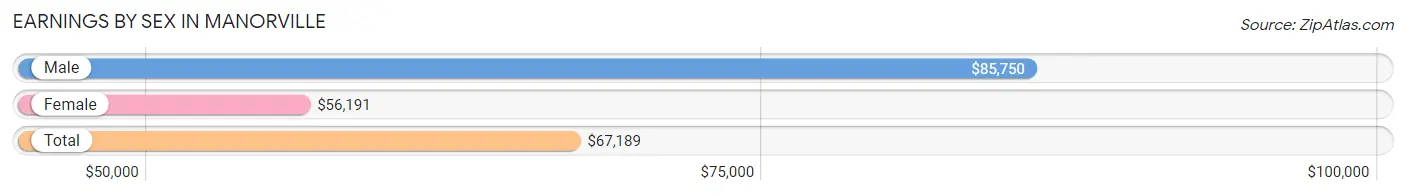
Earnings by Sex in Manorville
Average Earnings in Manorville are $67,189, $85,750 for men and $56,191 for women, a difference of 34.5%.
| Sex | Number | Average Earnings |
| Male | 3,586 (52.0%) | $85,750 |
| Female | 3,309 (48.0%) | $56,191 |
| Total | 6,895 (100.0%) | $67,189 |
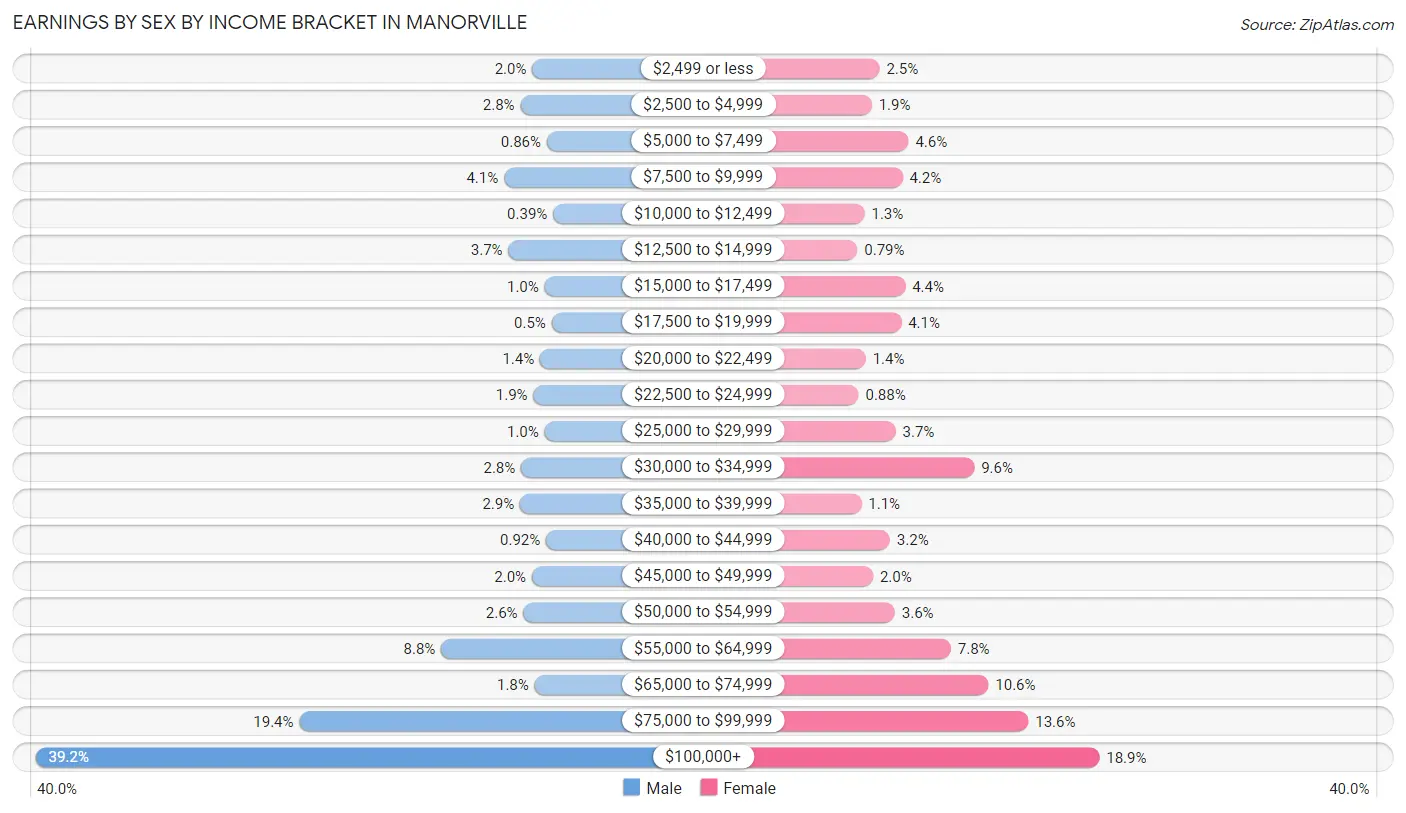
Earnings by Sex by Income Bracket in Manorville
The most common earnings brackets in Manorville are $100,000+ for men (1,405 | 39.2%) and $100,000+ for women (626 | 18.9%).
| Income | Male | Female |
| $2,499 or less | 70 (1.9%) | 81 (2.5%) |
| $2,500 to $4,999 | 102 (2.8%) | 62 (1.9%) |
| $5,000 to $7,499 | 31 (0.9%) | 153 (4.6%) |
| $7,500 to $9,999 | 146 (4.1%) | 138 (4.2%) |
| $10,000 to $12,499 | 14 (0.4%) | 44 (1.3%) |
| $12,500 to $14,999 | 134 (3.7%) | 26 (0.8%) |
| $15,000 to $17,499 | 37 (1.0%) | 145 (4.4%) |
| $17,500 to $19,999 | 18 (0.5%) | 135 (4.1%) |
| $20,000 to $22,499 | 49 (1.4%) | 47 (1.4%) |
| $22,500 to $24,999 | 67 (1.9%) | 29 (0.9%) |
| $25,000 to $29,999 | 37 (1.0%) | 121 (3.7%) |
| $30,000 to $34,999 | 100 (2.8%) | 316 (9.6%) |
| $35,000 to $39,999 | 103 (2.9%) | 36 (1.1%) |
| $40,000 to $44,999 | 33 (0.9%) | 107 (3.2%) |
| $45,000 to $49,999 | 71 (2.0%) | 65 (2.0%) |
| $50,000 to $54,999 | 94 (2.6%) | 119 (3.6%) |
| $55,000 to $64,999 | 315 (8.8%) | 258 (7.8%) |
| $65,000 to $74,999 | 64 (1.8%) | 351 (10.6%) |
| $75,000 to $99,999 | 696 (19.4%) | 450 (13.6%) |
| $100,000+ | 1,405 (39.2%) | 626 (18.9%) |
| Total | 3,586 (100.0%) | 3,309 (100.0%) |
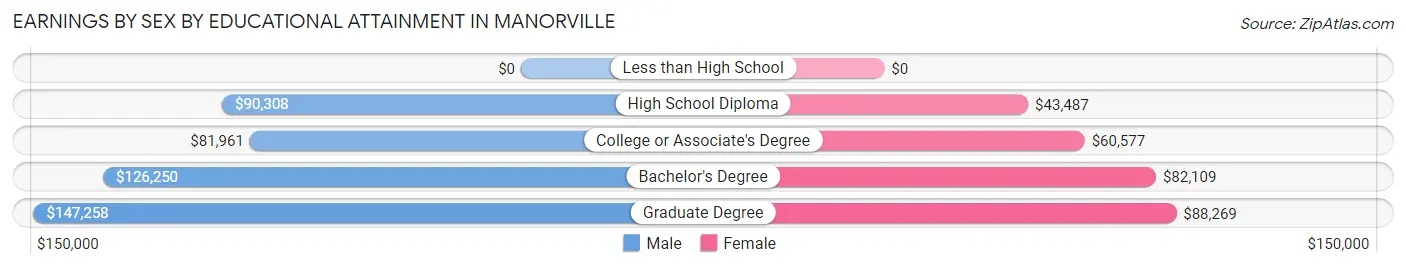
Earnings by Sex by Educational Attainment in Manorville
Average earnings in Manorville are $90,798 for men and $64,464 for women, a difference of 29.0%. Men with an educational attainment of graduate degree enjoy the highest average annual earnings of $147,258, while those with college or associate's degree education earn the least with $81,961. Women with an educational attainment of graduate degree earn the most with the average annual earnings of $88,269, while those with high school diploma education have the smallest earnings of $43,487.
| Educational Attainment | Male Income | Female Income |
| Less than High School | - | - |
| High School Diploma | $90,308 | $43,487 |
| College or Associate's Degree | $81,961 | $60,577 |
| Bachelor's Degree | $126,250 | $82,109 |
| Graduate Degree | $147,258 | $88,269 |
| Total | $90,798 | $64,464 |
Family Income in Manorville
Family Income Brackets in Manorville
According to the Manorville family income data, there are 1,087 families falling into the $200,000+ income range, which is the most common income bracket and makes up 30.5% of all families. Conversely, the $25,000 to $34,999 income bracket is the least frequent group with only 43 families (1.2%) belonging to this category.
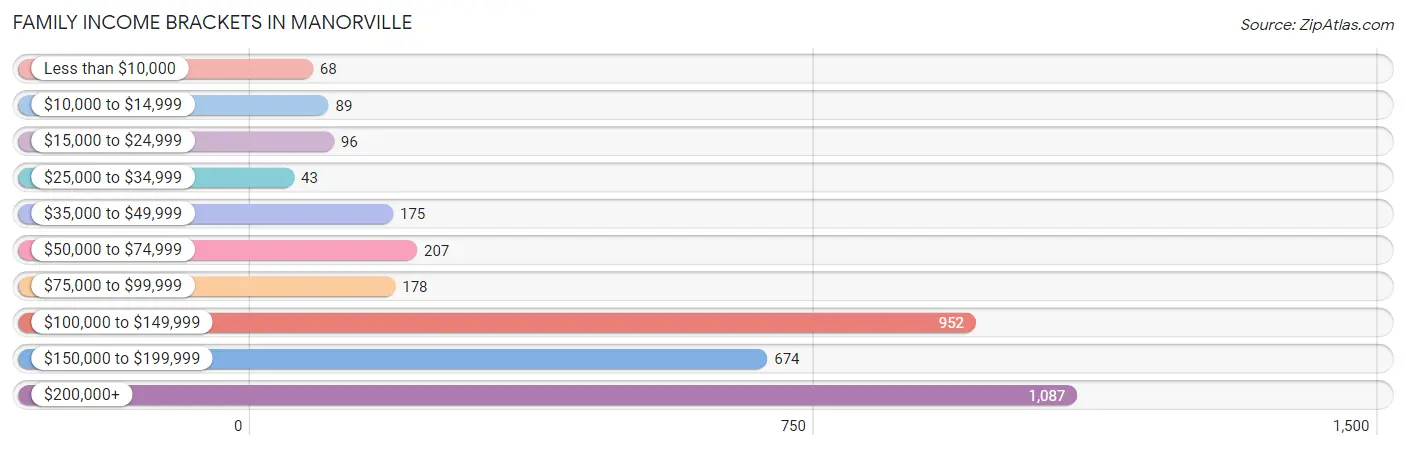
| Income Bracket | # Families | % Families |
| Less than $10,000 | 68 | 1.9% |
| $10,000 to $14,999 | 89 | 2.5% |
| $15,000 to $24,999 | 96 | 2.7% |
| $25,000 to $34,999 | 43 | 1.2% |
| $35,000 to $49,999 | 175 | 4.9% |
| $50,000 to $74,999 | 207 | 5.8% |
| $75,000 to $99,999 | 178 | 5.0% |
| $100,000 to $149,999 | 952 | 26.7% |
| $150,000 to $199,999 | 674 | 18.9% |
| $200,000+ | 1,087 | 30.5% |
Family Income by Famaliy Size in Manorville
4-person families (766 | 21.5%) account for the highest median family income in Manorville with $213,654 per family, while 2-person families (1,805 | 50.6%) have the highest median income of $64,798 per family member.
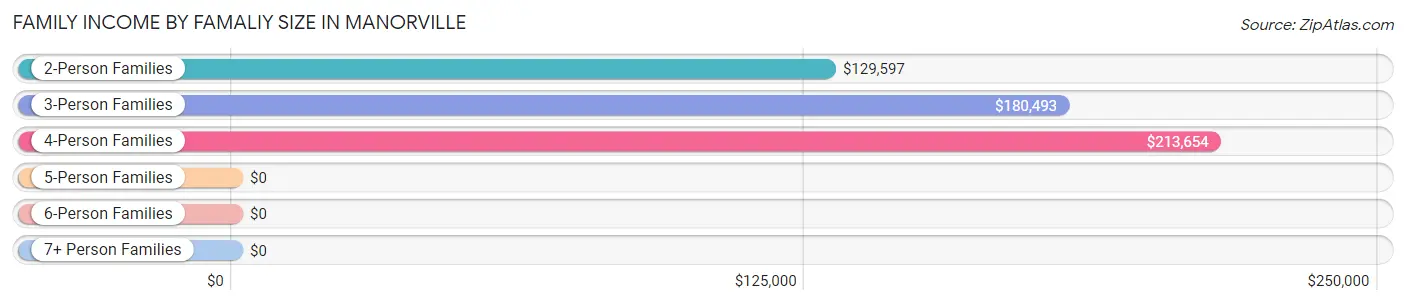
| Income Bracket | # Families | Median Income |
| 2-Person Families | 1,805 (50.6%) | $129,597 |
| 3-Person Families | 689 (19.3%) | $180,493 |
| 4-Person Families | 766 (21.5%) | $213,654 |
| 5-Person Families | 209 (5.9%) | $0 |
| 6-Person Families | 68 (1.9%) | $0 |
| 7+ Person Families | 27 (0.8%) | $0 |
| Total | 3,564 (100.0%) | $146,765 |
Family Income by Number of Earners in Manorville
The median family income in Manorville is $146,765, with families comprising 3+ earners (588) having the highest median family income of $249,375, while families with no earners (472) have the lowest median family income of $68,478, accounting for 16.5% and 13.2% of families, respectively.
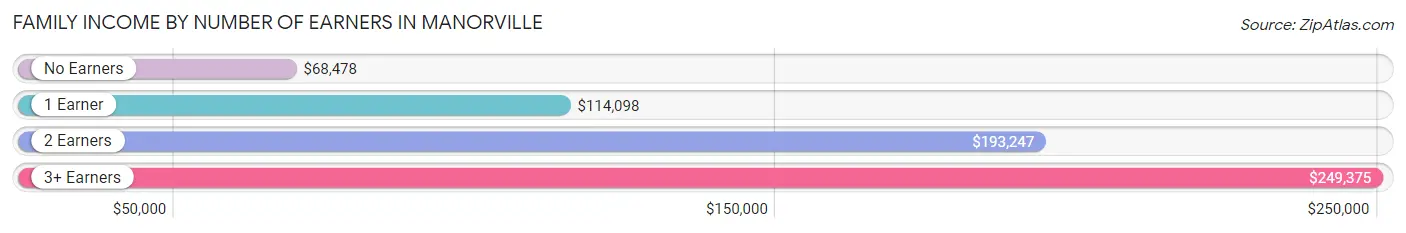
| Number of Earners | # Families | Median Income |
| No Earners | 472 (13.2%) | $68,478 |
| 1 Earner | 1,088 (30.5%) | $114,098 |
| 2 Earners | 1,416 (39.7%) | $193,247 |
| 3+ Earners | 588 (16.5%) | $249,375 |
| Total | 3,564 (100.0%) | $146,765 |
Household Income in Manorville
Household Income Brackets in Manorville
With 1,204 households falling in the category, the $100,000 to $149,999 income range is the most frequent in Manorville, accounting for 24.6% of all households. In contrast, only 118 households (2.4%) fall into the $10,000 to $14,999 income bracket, making it the least populous group.
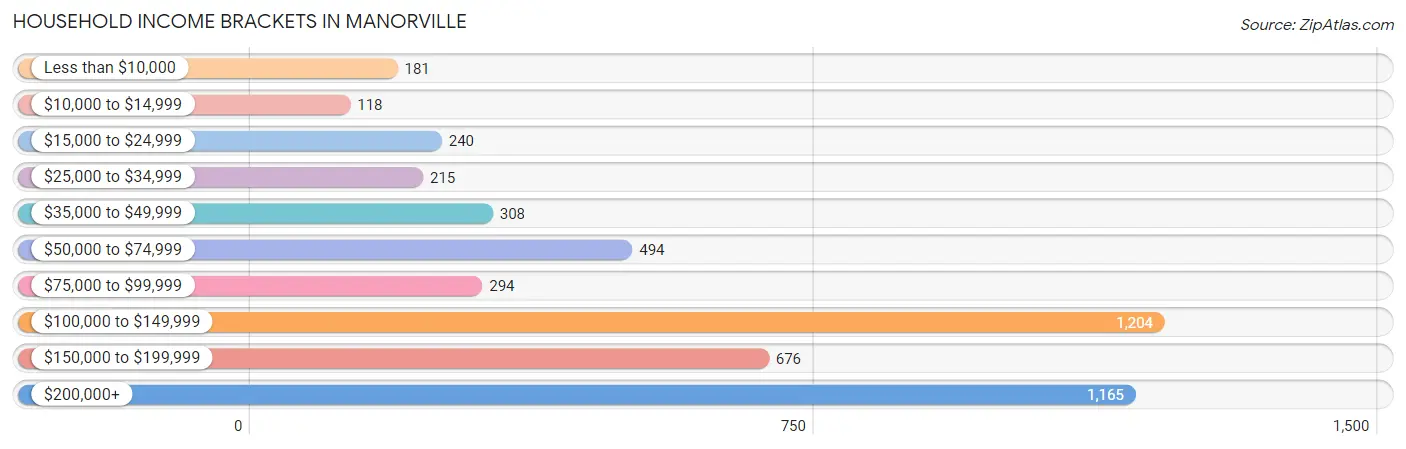
| Income Bracket | # Households | % Households |
| Less than $10,000 | 181 | 3.7% |
| $10,000 to $14,999 | 118 | 2.4% |
| $15,000 to $24,999 | 240 | 4.9% |
| $25,000 to $34,999 | 215 | 4.4% |
| $35,000 to $49,999 | 308 | 6.3% |
| $50,000 to $74,999 | 494 | 10.1% |
| $75,000 to $99,999 | 294 | 6.0% |
| $100,000 to $149,999 | 1,204 | 24.6% |
| $150,000 to $199,999 | 676 | 13.8% |
| $200,000+ | 1,165 | 23.8% |
Household Income by Householder Age in Manorville
The median household income in Manorville is $126,790, with the highest median household income of $164,048 found in the 45 to 64 years age bracket for the primary householder. A total of 2,480 households (50.6%) fall into this category. Meanwhile, the 15 to 24 years age bracket for the primary householder has the lowest median household income of $0, with 21 households (0.4%) in this group.
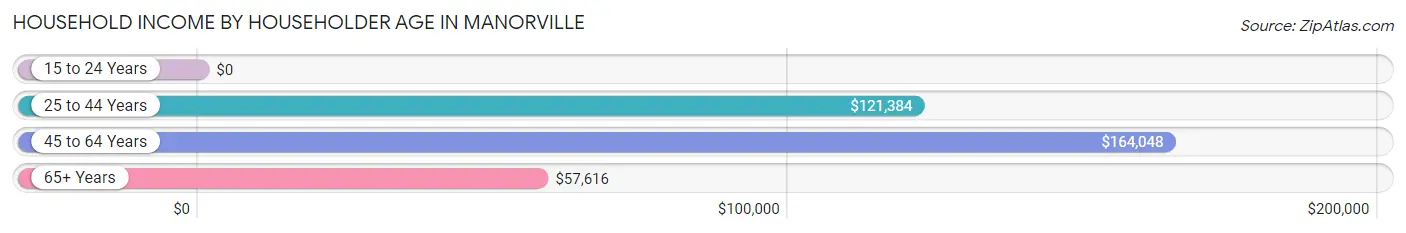
| Income Bracket | # Households | Median Income |
| 15 to 24 Years | 21 (0.4%) | $0 |
| 25 to 44 Years | 839 (17.1%) | $121,384 |
| 45 to 64 Years | 2,480 (50.6%) | $164,048 |
| 65+ Years | 1,556 (31.8%) | $57,616 |
| Total | 4,896 (100.0%) | $126,790 |
Poverty in Manorville
Income Below Poverty by Sex and Age in Manorville
With 10.0% poverty level for males and 10.4% for females among the residents of Manorville, under 5 year old males and under 5 year old females are the most vulnerable to poverty, with 148 males (39.5%) and 75 females (38.7%) in their respective age groups living below the poverty level.
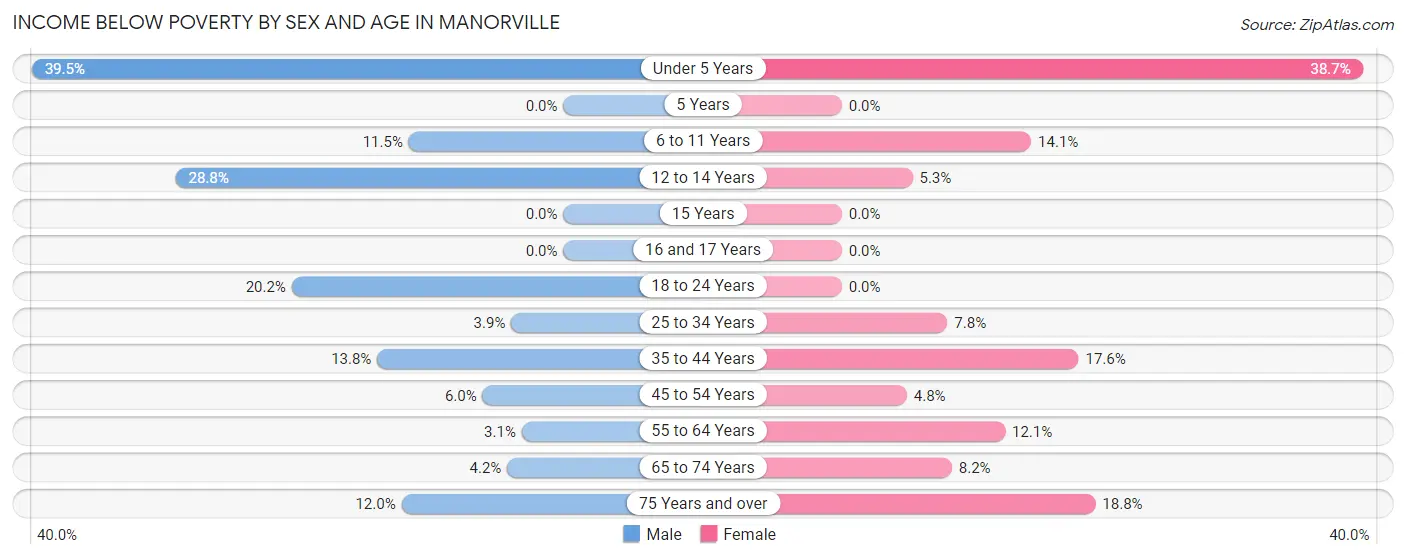
| Age Bracket | Male | Female |
| Under 5 Years | 148 (39.5%) | 75 (38.7%) |
| 5 Years | 0 (0.0%) | 0 (0.0%) |
| 6 to 11 Years | 45 (11.5%) | 45 (14.1%) |
| 12 to 14 Years | 74 (28.8%) | 16 (5.2%) |
| 15 Years | 0 (0.0%) | 0 (0.0%) |
| 16 and 17 Years | 0 (0.0%) | 0 (0.0%) |
| 18 to 24 Years | 96 (20.2%) | 0 (0.0%) |
| 25 to 34 Years | 20 (3.9%) | 50 (7.8%) |
| 35 to 44 Years | 81 (13.8%) | 99 (17.6%) |
| 45 to 54 Years | 59 (6.0%) | 49 (4.8%) |
| 55 to 64 Years | 44 (3.1%) | 147 (12.1%) |
| 65 to 74 Years | 31 (4.2%) | 63 (8.2%) |
| 75 Years and over | 47 (12.0%) | 103 (18.8%) |
| Total | 645 (10.0%) | 647 (10.4%) |
Income Above Poverty by Sex and Age in Manorville
According to the poverty statistics in Manorville, males aged 5 years and females aged 5 years are the age groups that are most secure financially, with 100.0% of males and 100.0% of females in these age groups living above the poverty line.
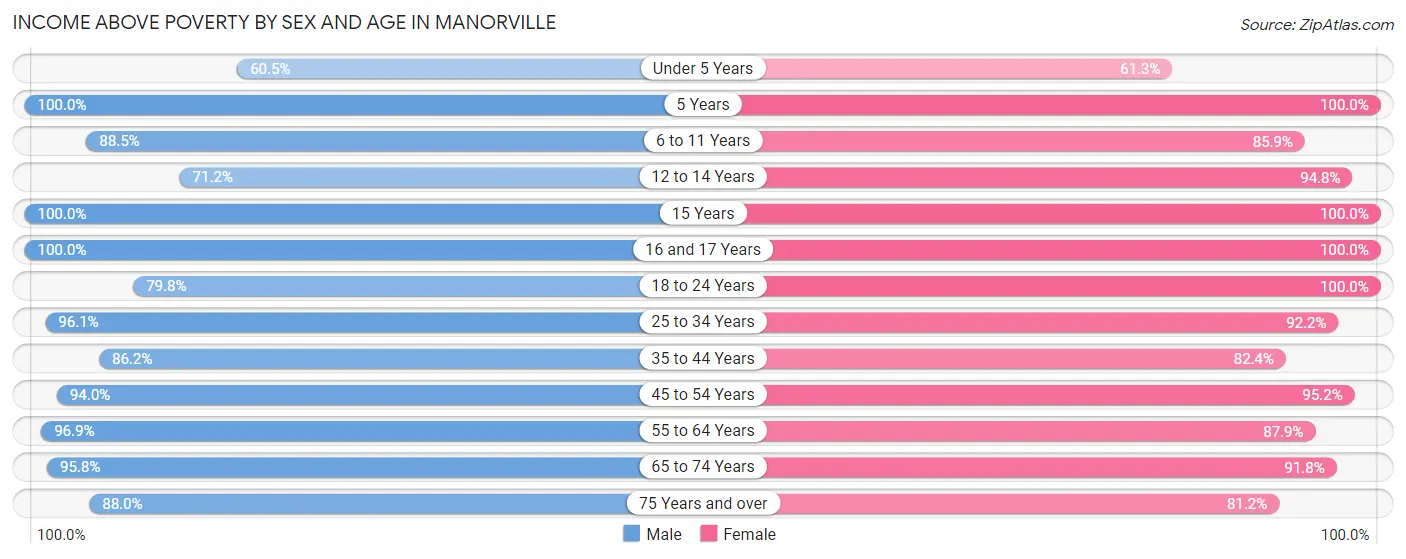
| Age Bracket | Male | Female |
| Under 5 Years | 227 (60.5%) | 119 (61.3%) |
| 5 Years | 70 (100.0%) | 5 (100.0%) |
| 6 to 11 Years | 347 (88.5%) | 275 (85.9%) |
| 12 to 14 Years | 183 (71.2%) | 289 (94.8%) |
| 15 Years | 116 (100.0%) | 96 (100.0%) |
| 16 and 17 Years | 135 (100.0%) | 141 (100.0%) |
| 18 to 24 Years | 380 (79.8%) | 399 (100.0%) |
| 25 to 34 Years | 497 (96.1%) | 588 (92.2%) |
| 35 to 44 Years | 505 (86.2%) | 464 (82.4%) |
| 45 to 54 Years | 925 (94.0%) | 966 (95.2%) |
| 55 to 64 Years | 1,381 (96.9%) | 1,066 (87.9%) |
| 65 to 74 Years | 712 (95.8%) | 708 (91.8%) |
| 75 Years and over | 344 (88.0%) | 444 (81.2%) |
| Total | 5,822 (90.0%) | 5,560 (89.6%) |
Income Below Poverty Among Married-Couple Families in Manorville
The poverty statistics for married-couple families in Manorville show that 6.4% or 193 of the total 3,041 families live below the poverty line. Families with 1 or 2 children have the highest poverty rate of 12.4%, comprising of 110 families. On the other hand, families with 3 or 4 children have the lowest poverty rate of 0.0%, which includes 0 families.
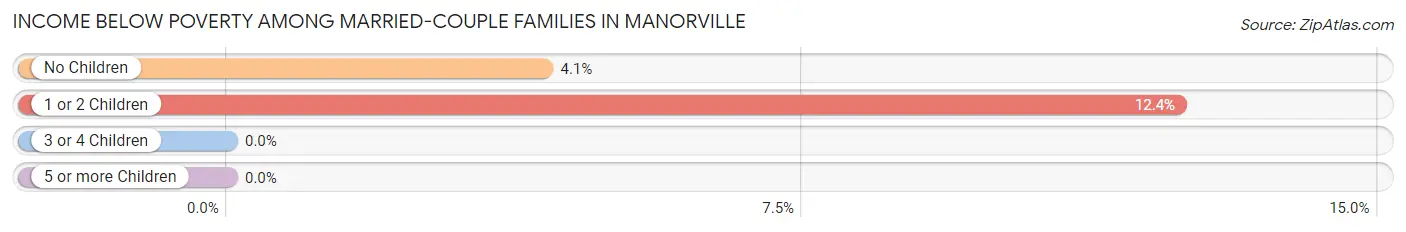
| Children | Above Poverty | Below Poverty |
| No Children | 1,933 (95.9%) | 83 (4.1%) |
| 1 or 2 Children | 778 (87.6%) | 110 (12.4%) |
| 3 or 4 Children | 137 (100.0%) | 0 (0.0%) |
| 5 or more Children | 0 (0.0%) | 0 (0.0%) |
| Total | 2,848 (93.6%) | 193 (6.4%) |
Income Below Poverty Among Single-Parent Households in Manorville
According to the poverty data in Manorville, 11.8% or 20 single-father households and 4.5% or 16 single-mother households are living below the poverty line. Among single-father households, those with 3 or 4 children have the highest poverty rate, with 20 households (100.0%) experiencing poverty. Likewise, among single-mother households, those with 3 or 4 children have the highest poverty rate, with 16 households (69.6%) falling below the poverty line.
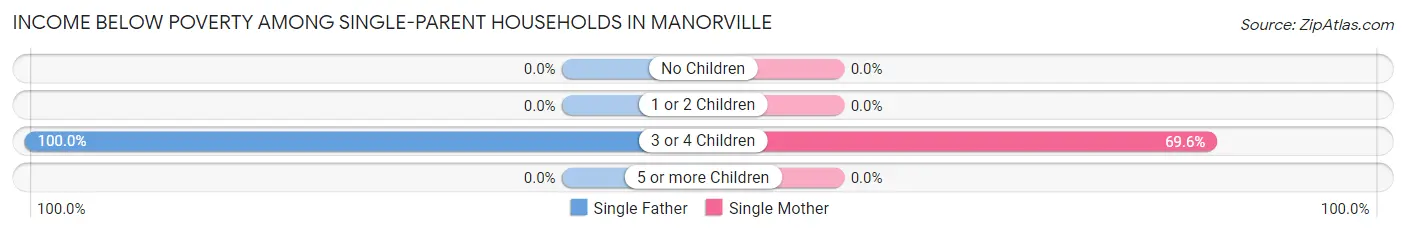
| Children | Single Father | Single Mother |
| No Children | 0 (0.0%) | 0 (0.0%) |
| 1 or 2 Children | 0 (0.0%) | 0 (0.0%) |
| 3 or 4 Children | 20 (100.0%) | 16 (69.6%) |
| 5 or more Children | 0 (0.0%) | 0 (0.0%) |
| Total | 20 (11.8%) | 16 (4.5%) |
Income Below Poverty Among Married-Couple vs Single-Parent Households in Manorville
The poverty data for Manorville shows that 193 of the married-couple family households (6.4%) and 36 of the single-parent households (6.9%) are living below the poverty level. Within the married-couple family households, those with 1 or 2 children have the highest poverty rate, with 110 households (12.4%) falling below the poverty line. Among the single-parent households, those with 3 or 4 children have the highest poverty rate, with 36 household (83.7%) living below poverty.
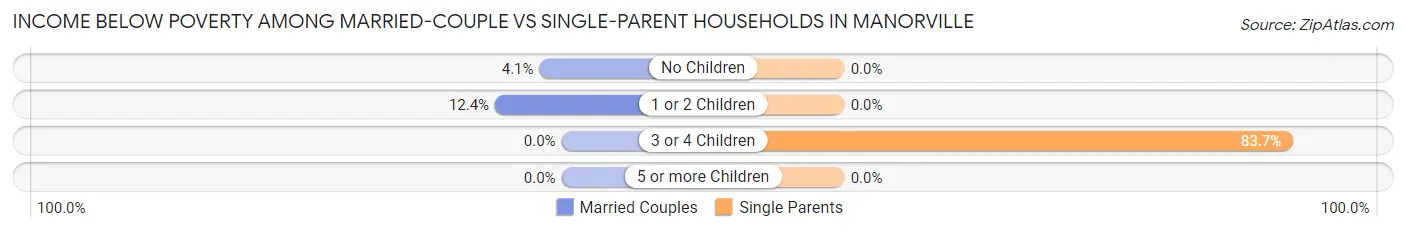
| Children | Married-Couple Families | Single-Parent Households |
| No Children | 83 (4.1%) | 0 (0.0%) |
| 1 or 2 Children | 110 (12.4%) | 0 (0.0%) |
| 3 or 4 Children | 0 (0.0%) | 36 (83.7%) |
| 5 or more Children | 0 (0.0%) | 0 (0.0%) |
| Total | 193 (6.4%) | 36 (6.9%) |
Race in Manorville
The most populous races in Manorville are White / Caucasian (10,999 | 86.7%), Hispanic or Latino (1,122 | 8.8%), and Two or more Races (899 | 7.1%).
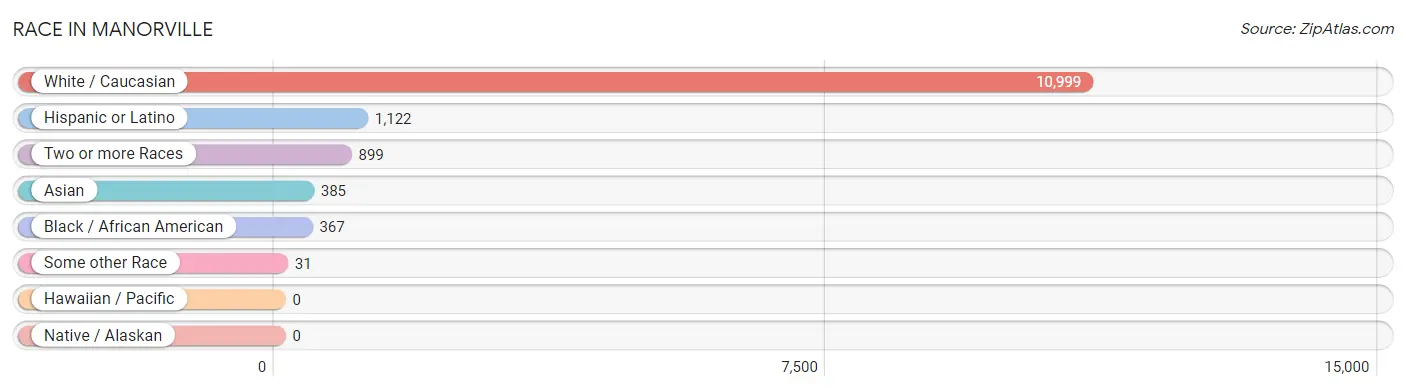
| Race | # Population | % Population |
| Asian | 385 | 3.0% |
| Black / African American | 367 | 2.9% |
| Hawaiian / Pacific | 0 | 0.0% |
| Hispanic or Latino | 1,122 | 8.8% |
| Native / Alaskan | 0 | 0.0% |
| White / Caucasian | 10,999 | 86.7% |
| Two or more Races | 899 | 7.1% |
| Some other Race | 31 | 0.2% |
| Total | 12,681 | 100.0% |
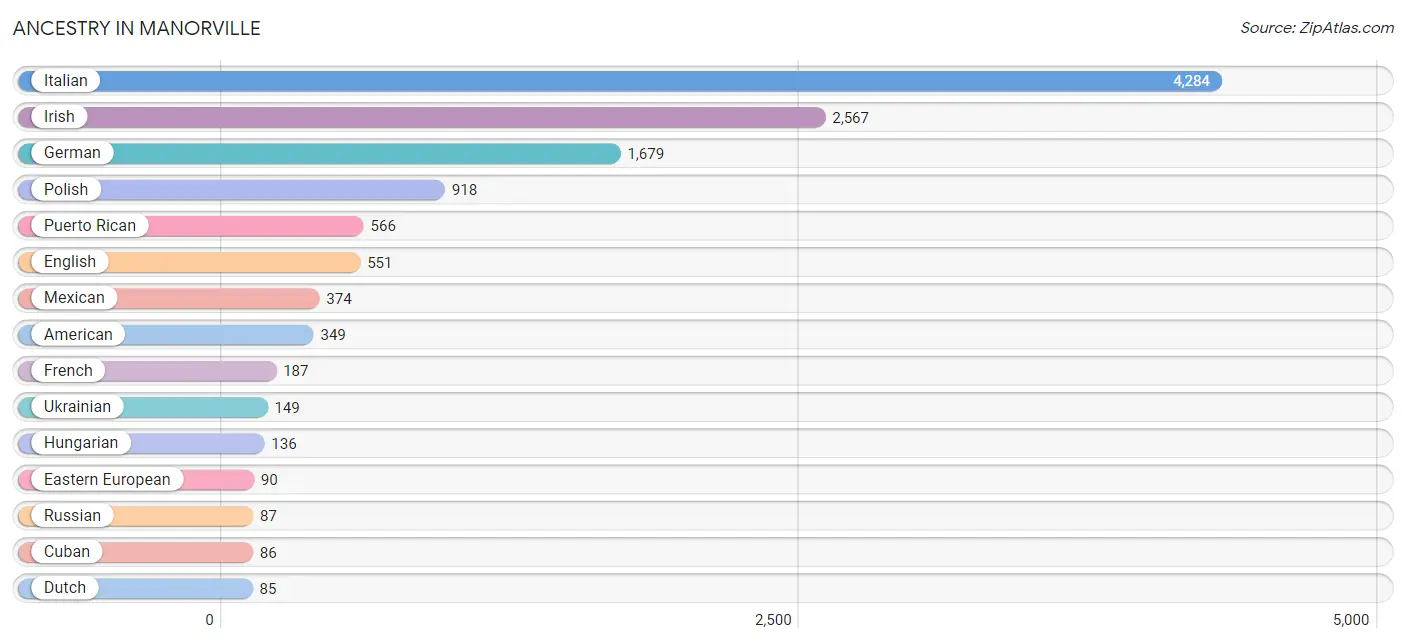
Ancestry in Manorville
The most populous ancestries reported in Manorville are Italian (4,284 | 33.8%), Irish (2,567 | 20.2%), German (1,679 | 13.2%), Polish (918 | 7.2%), and Puerto Rican (566 | 4.5%), together accounting for 79.0% of all Manorville residents.
| Ancestry | # Population | % Population |
| African | 34 | 0.3% |
| American | 349 | 2.8% |
| Armenian | 17 | 0.1% |
| Australian | 16 | 0.1% |
| Austrian | 24 | 0.2% |
| Brazilian | 26 | 0.2% |
| British | 9 | 0.1% |
| Burmese | 30 | 0.2% |
| Canadian | 22 | 0.2% |
| Cuban | 86 | 0.7% |
| Czechoslovakian | 45 | 0.4% |
| Danish | 14 | 0.1% |
| Dominican | 23 | 0.2% |
| Dutch | 85 | 0.7% |
| Eastern European | 90 | 0.7% |
| Ecuadorian | 11 | 0.1% |
| English | 551 | 4.3% |
| European | 20 | 0.2% |
| French | 187 | 1.5% |
| French Canadian | 34 | 0.3% |
| German | 1,679 | 13.2% |
| Greek | 57 | 0.4% |
| Hungarian | 136 | 1.1% |
| Indian (Asian) | 43 | 0.3% |
| Indonesian | 48 | 0.4% |
| Irish | 2,567 | 20.2% |
| Italian | 4,284 | 33.8% |
| Jamaican | 18 | 0.1% |
| Korean | 14 | 0.1% |
| Latvian | 15 | 0.1% |
| Lithuanian | 25 | 0.2% |
| Mexican | 374 | 2.9% |
| Norwegian | 71 | 0.6% |
| Peruvian | 36 | 0.3% |
| Polish | 918 | 7.2% |
| Portuguese | 56 | 0.4% |
| Puerto Rican | 566 | 4.5% |
| Russian | 87 | 0.7% |
| Scotch-Irish | 33 | 0.3% |
| Scottish | 42 | 0.3% |
| Seminole | 53 | 0.4% |
| South American | 51 | 0.4% |
| Spaniard | 22 | 0.2% |
| Subsaharan African | 34 | 0.3% |
| Swedish | 77 | 0.6% |
| Thai | 71 | 0.6% |
| Ukrainian | 149 | 1.2% |
| Venezuelan | 4 | 0.0% | View All 48 Rows |
Immigrants in Manorville
The most numerous immigrant groups reported in Manorville came from Europe (460 | 3.6%), Asia (378 | 3.0%), South Central Asia (276 | 2.2%), Latin America (189 | 1.5%), and Eastern Europe (181 | 1.4%), together accounting for 11.7% of all Manorville residents.
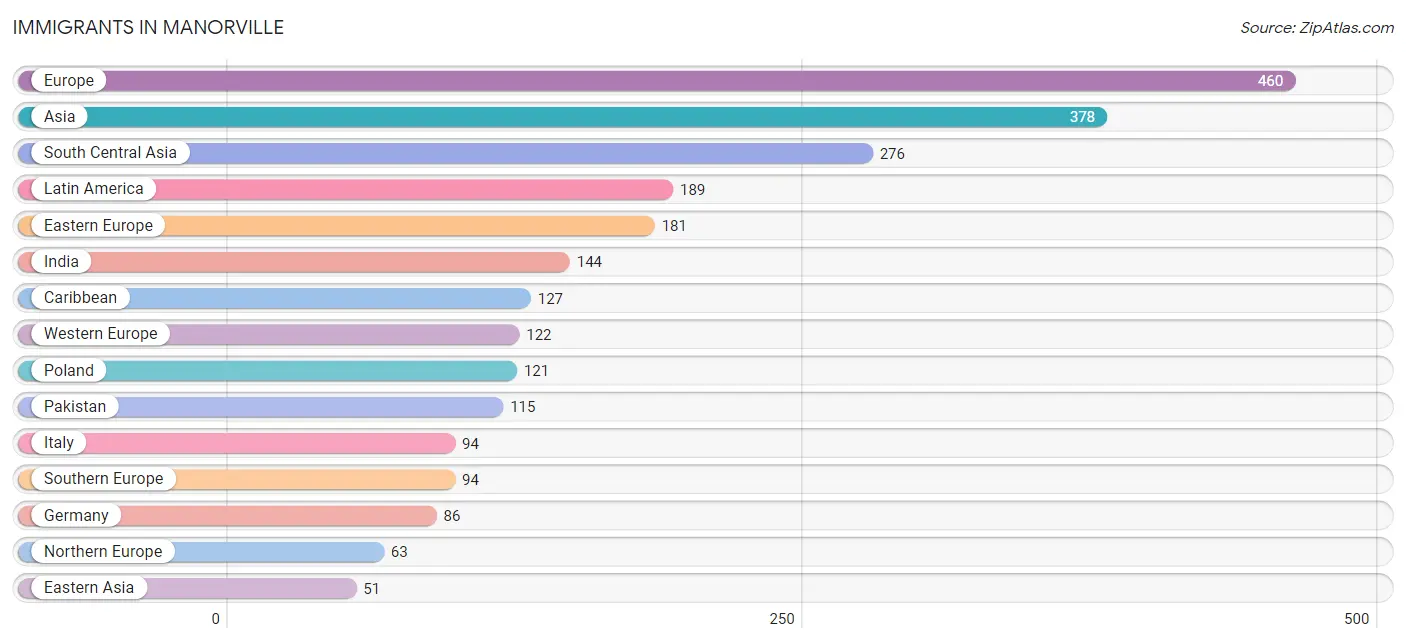
| Immigration Origin | # Population | % Population |
| Asia | 378 | 3.0% |
| Australia | 16 | 0.1% |
| Austria | 12 | 0.1% |
| Brazil | 26 | 0.2% |
| Canada | 13 | 0.1% |
| Caribbean | 127 | 1.0% |
| Central America | 25 | 0.2% |
| China | 21 | 0.2% |
| Cuba | 38 | 0.3% |
| Dominican Republic | 23 | 0.2% |
| Eastern Asia | 51 | 0.4% |
| Eastern Europe | 181 | 1.4% |
| Ecuador | 11 | 0.1% |
| England | 32 | 0.3% |
| Europe | 460 | 3.6% |
| France | 24 | 0.2% |
| Germany | 86 | 0.7% |
| Haiti | 34 | 0.3% |
| Hong Kong | 21 | 0.2% |
| India | 144 | 1.1% |
| Iran | 17 | 0.1% |
| Ireland | 31 | 0.2% |
| Italy | 94 | 0.7% |
| Jamaica | 32 | 0.3% |
| Korea | 30 | 0.2% |
| Latin America | 189 | 1.5% |
| Mexico | 25 | 0.2% |
| Northern Europe | 63 | 0.5% |
| Oceania | 29 | 0.2% |
| Pakistan | 115 | 0.9% |
| Philippines | 14 | 0.1% |
| Poland | 121 | 0.9% |
| Romania | 38 | 0.3% |
| South America | 37 | 0.3% |
| South Central Asia | 276 | 2.2% |
| South Eastern Asia | 51 | 0.4% |
| Southern Europe | 94 | 0.7% |
| Ukraine | 22 | 0.2% |
| Western Europe | 122 | 1.0% | View All 39 Rows |
Sex and Age in Manorville
Sex and Age in Manorville
The most populous age groups in Manorville are 55 to 59 Years (754 | 11.7%) for men and 60 to 64 Years (735 | 11.8%) for women.
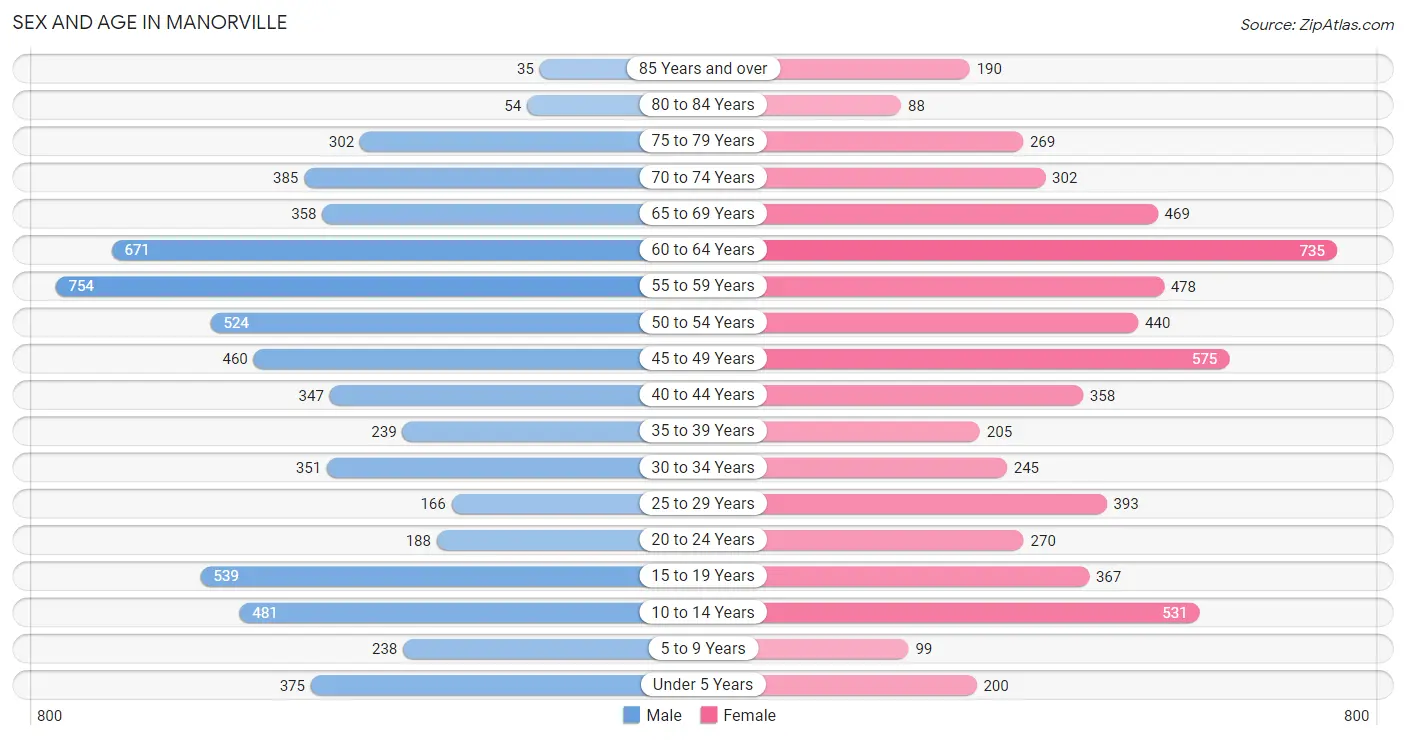
| Age Bracket | Male | Female |
| Under 5 Years | 375 (5.8%) | 200 (3.2%) |
| 5 to 9 Years | 238 (3.7%) | 99 (1.6%) |
| 10 to 14 Years | 481 (7.4%) | 531 (8.6%) |
| 15 to 19 Years | 539 (8.3%) | 367 (5.9%) |
| 20 to 24 Years | 188 (2.9%) | 270 (4.3%) |
| 25 to 29 Years | 166 (2.6%) | 393 (6.3%) |
| 30 to 34 Years | 351 (5.4%) | 245 (3.9%) |
| 35 to 39 Years | 239 (3.7%) | 205 (3.3%) |
| 40 to 44 Years | 347 (5.4%) | 358 (5.8%) |
| 45 to 49 Years | 460 (7.1%) | 575 (9.2%) |
| 50 to 54 Years | 524 (8.1%) | 440 (7.1%) |
| 55 to 59 Years | 754 (11.7%) | 478 (7.7%) |
| 60 to 64 Years | 671 (10.4%) | 735 (11.8%) |
| 65 to 69 Years | 358 (5.5%) | 469 (7.5%) |
| 70 to 74 Years | 385 (5.9%) | 302 (4.9%) |
| 75 to 79 Years | 302 (4.7%) | 269 (4.3%) |
| 80 to 84 Years | 54 (0.8%) | 88 (1.4%) |
| 85 Years and over | 35 (0.5%) | 190 (3.1%) |
| Total | 6,467 (100.0%) | 6,214 (100.0%) |
Families and Households in Manorville
Median Family Size in Manorville
The median family size in Manorville is 3.09 persons per family, with married-couple families (3,041 | 85.3%) accounting for the largest median family size of 3.17 persons per family. On the other hand, single male/father families (170 | 4.8%) represent the smallest median family size with 2.31 persons per family.
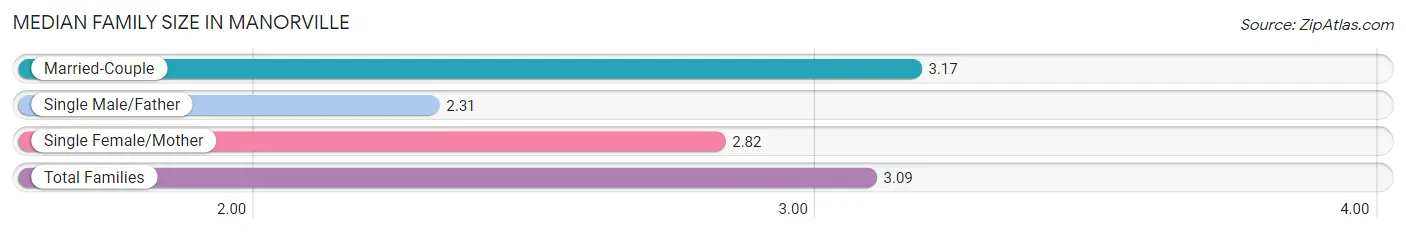
| Family Type | # Families | Family Size |
| Married-Couple | 3,041 (85.3%) | 3.17 |
| Single Male/Father | 170 (4.8%) | 2.31 |
| Single Female/Mother | 353 (9.9%) | 2.82 |
| Total Families | 3,564 (100.0%) | 3.09 |
Median Household Size in Manorville
The median household size in Manorville is 2.57 persons per household, with married-couple households (3,041 | 62.1%) accounting for the largest median household size of 3.18 persons per household. non-family households (1,332 | 27.2%) represent the smallest median household size with 1.11 persons per household.
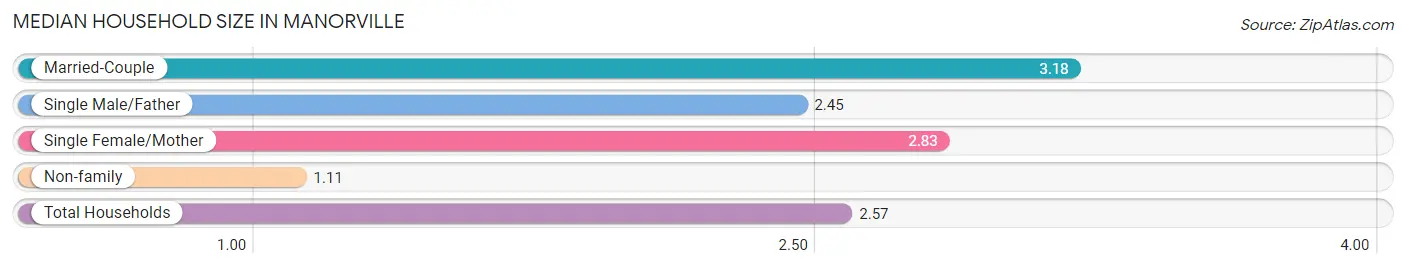
| Household Type | # Households | Household Size |
| Married-Couple | 3,041 (62.1%) | 3.18 |
| Single Male/Father | 170 (3.5%) | 2.45 |
| Single Female/Mother | 353 (7.2%) | 2.83 |
| Non-family | 1,332 (27.2%) | 1.11 |
| Total Households | 4,896 (100.0%) | 2.57 |
Household Size by Marriage Status in Manorville
Out of a total of 4,896 households in Manorville, 3,564 (72.8%) are family households, while 1,332 (27.2%) are nonfamily households. The most numerous type of family households are 2-person households, comprising 1,762, and the most common type of nonfamily households are 1-person households, comprising 1,184.
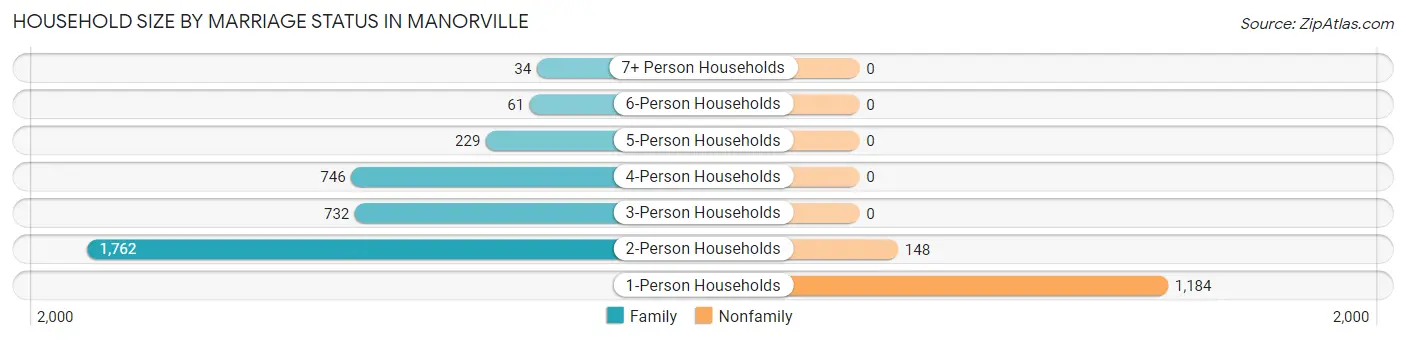
| Household Size | Family Households | Nonfamily Households |
| 1-Person Households | - | 1,184 (24.2%) |
| 2-Person Households | 1,762 (36.0%) | 148 (3.0%) |
| 3-Person Households | 732 (14.9%) | 0 (0.0%) |
| 4-Person Households | 746 (15.2%) | 0 (0.0%) |
| 5-Person Households | 229 (4.7%) | 0 (0.0%) |
| 6-Person Households | 61 (1.3%) | 0 (0.0%) |
| 7+ Person Households | 34 (0.7%) | 0 (0.0%) |
| Total | 3,564 (72.8%) | 1,332 (27.2%) |
Female Fertility in Manorville
Fertility by Age in Manorville
Average fertility rate in Manorville is 13.0 births per 1,000 women. Women in the age bracket of 20 to 34 years have the highest fertility rate with 36.0 births per 1,000 women. Women in the age bracket of 20 to 34 years acount for 100.0% of all women with births.
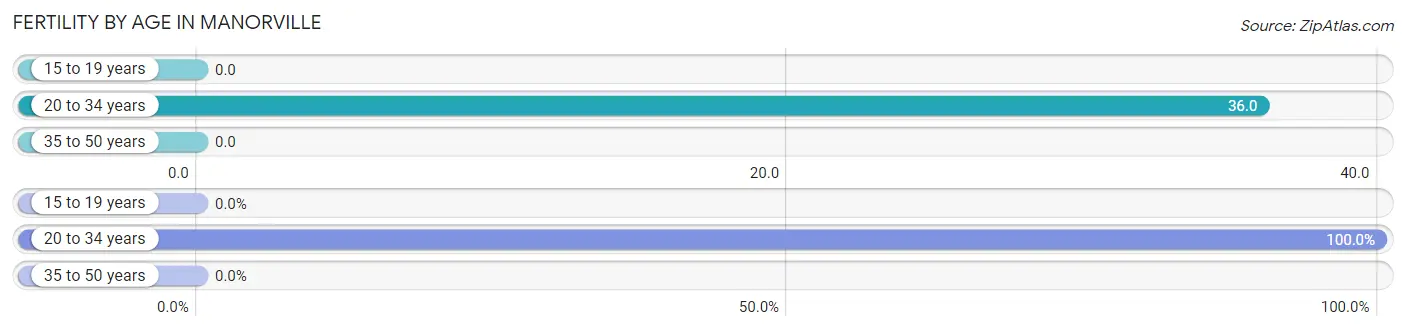
| Age Bracket | Women with Births | Births / 1,000 Women |
| 15 to 19 years | 0 (0.0%) | 0.0 |
| 20 to 34 years | 33 (100.0%) | 36.0 |
| 35 to 50 years | 0 (0.0%) | 0.0 |
| Total | 33 (100.0%) | 13.0 |
Fertility by Age by Marriage Status in Manorville
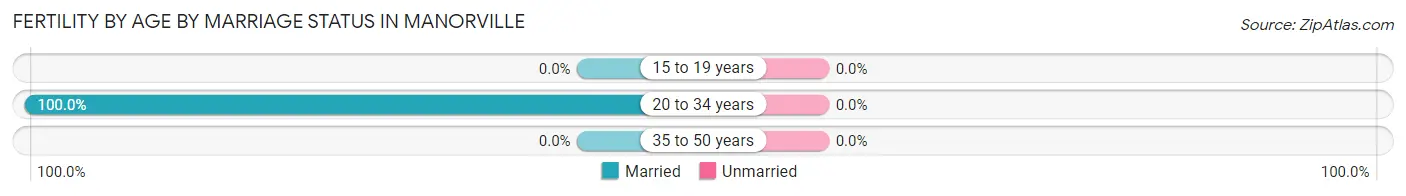
| Age Bracket | Married | Unmarried |
| 15 to 19 years | 0 (0.0%) | 0 (0.0%) |
| 20 to 34 years | 33 (100.0%) | 0 (0.0%) |
| 35 to 50 years | 0 (0.0%) | 0 (0.0%) |
| Total | 33 (100.0%) | 0 (0.0%) |
Fertility by Education in Manorville
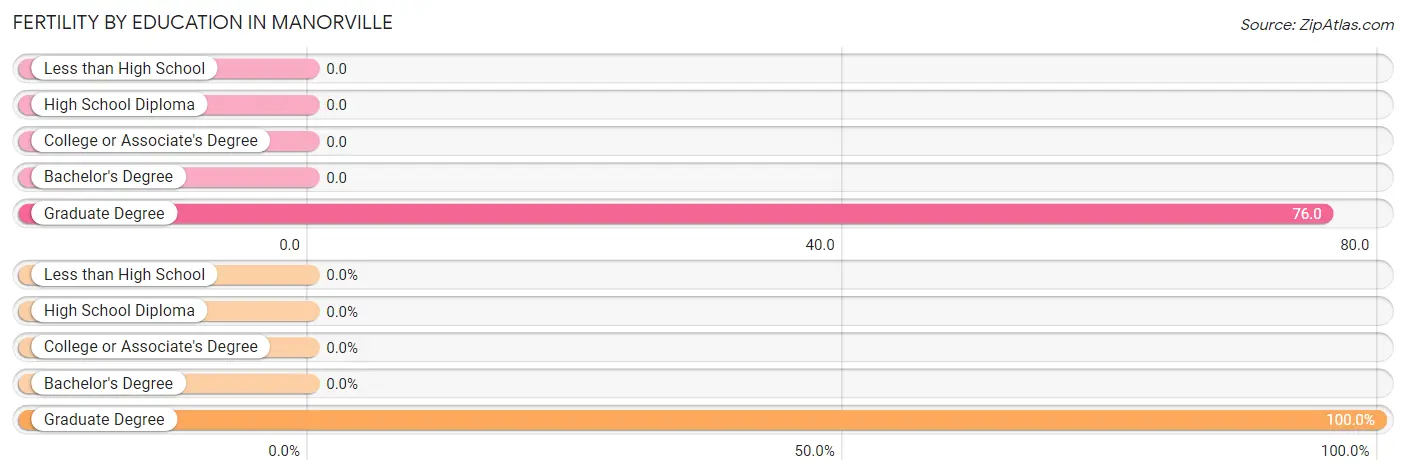
| Educational Attainment | Women with Births | Births / 1,000 Women |
| Less than High School | 0 (0.0%) | 0.0 |
| High School Diploma | 0 (0.0%) | 0.0 |
| College or Associate's Degree | 0 (0.0%) | 0.0 |
| Bachelor's Degree | 0 (0.0%) | 0.0 |
| Graduate Degree | 33 (100.0%) | 76.0 |
| Total | 33 (100.0%) | 13.0 |
Fertility by Education by Marriage Status in Manorville
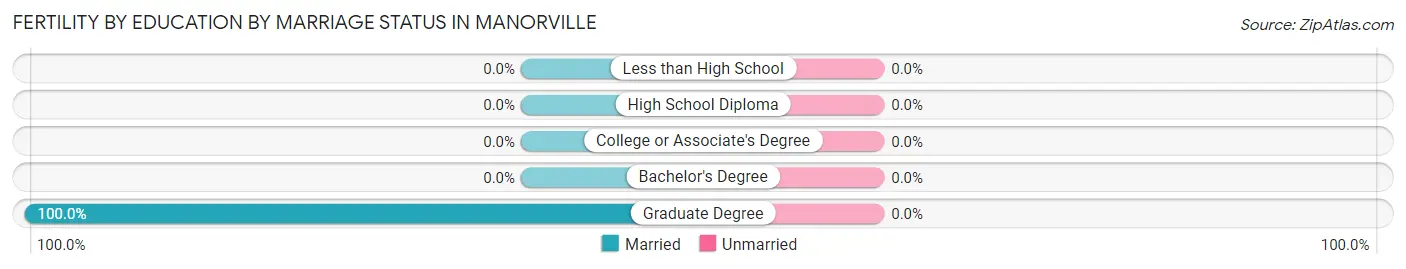
| Educational Attainment | Married | Unmarried |
| Less than High School | 0 (0.0%) | 0 (0.0%) |
| High School Diploma | 0 (0.0%) | 0 (0.0%) |
| College or Associate's Degree | 0 (0.0%) | 0 (0.0%) |
| Bachelor's Degree | 0 (0.0%) | 0 (0.0%) |
| Graduate Degree | 33 (100.0%) | 0 (0.0%) |
| Total | 33 (100.0%) | 0 (0.0%) |
Employment Characteristics in Manorville
Employment by Class of Employer in Manorville
Among the 6,550 employed individuals in Manorville, private company employees (3,664 | 55.9%), not-for-profit organizations (731 | 11.2%), and self-employed (incorporated) (637 | 9.7%) make up the most common classes of employment.
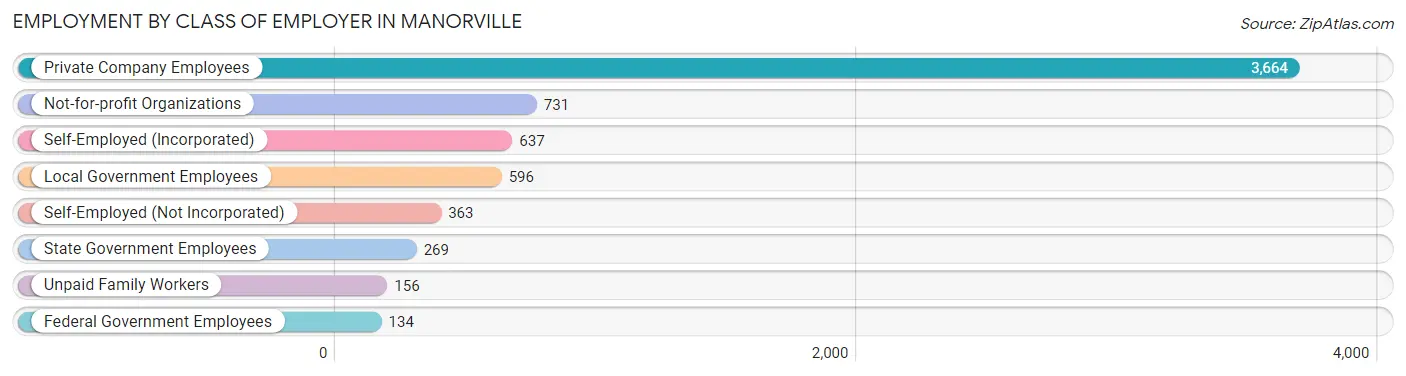
| Employer Class | # Employees | % Employees |
| Private Company Employees | 3,664 | 55.9% |
| Self-Employed (Incorporated) | 637 | 9.7% |
| Self-Employed (Not Incorporated) | 363 | 5.5% |
| Not-for-profit Organizations | 731 | 11.2% |
| Local Government Employees | 596 | 9.1% |
| State Government Employees | 269 | 4.1% |
| Federal Government Employees | 134 | 2.1% |
| Unpaid Family Workers | 156 | 2.4% |
| Total | 6,550 | 100.0% |
Employment Status by Age in Manorville
According to the labor force statistics for Manorville, out of the total population over 16 years of age (10,545), 63.1% or 6,654 individuals are in the labor force, with 1.6% or 106 of them unemployed. The age group with the highest labor force participation rate is 30 to 34 years, with 93.5% or 557 individuals in the labor force. Within the labor force, the 25 to 29 years age range has the highest percentage of unemployed individuals, with 7.1% or 36 of them being unemployed.
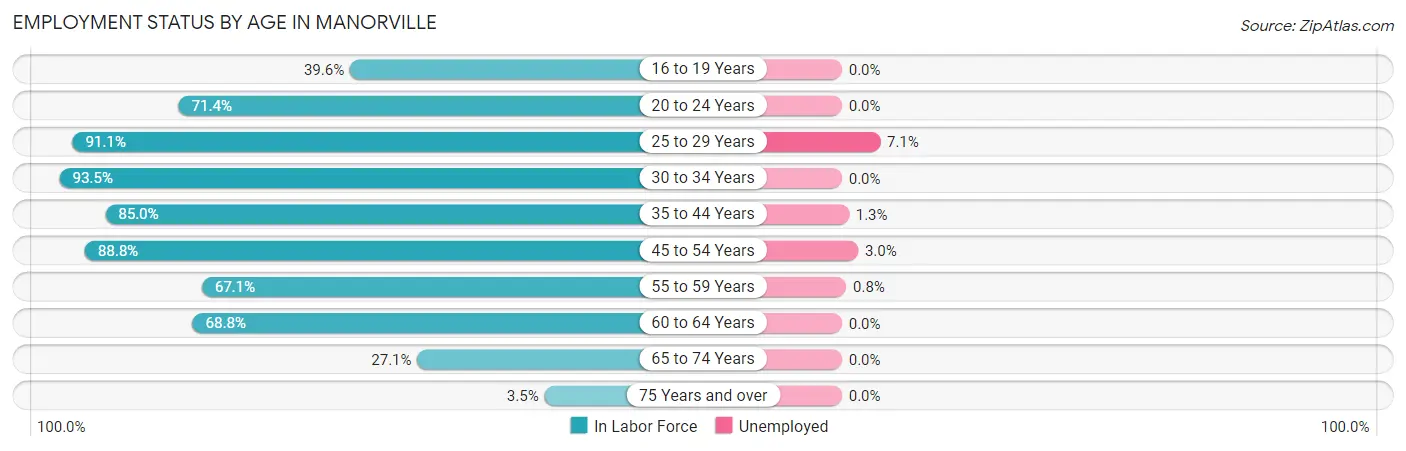
| Age Bracket | In Labor Force | Unemployed |
| 16 to 19 Years | 275 (39.6%) | 0 (0.0%) |
| 20 to 24 Years | 327 (71.4%) | 0 (0.0%) |
| 25 to 29 Years | 509 (91.1%) | 36 (7.1%) |
| 30 to 34 Years | 557 (93.5%) | 0 (0.0%) |
| 35 to 44 Years | 977 (85.0%) | 13 (1.3%) |
| 45 to 54 Years | 1,775 (88.8%) | 53 (3.0%) |
| 55 to 59 Years | 827 (67.1%) | 7 (0.8%) |
| 60 to 64 Years | 967 (68.8%) | 0 (0.0%) |
| 65 to 74 Years | 410 (27.1%) | 0 (0.0%) |
| 75 Years and over | 33 (3.5%) | 0 (0.0%) |
| Total | 6,654 (63.1%) | 106 (1.6%) |
Employment Status by Educational Attainment in Manorville
According to labor force statistics for Manorville, 80.9% of individuals (5,615) out of the total population between 25 and 64 years of age (6,941) are in the labor force, with 1.9% or 107 of them being unemployed. The group with the highest labor force participation rate are those with the educational attainment of bachelor's degree or higher, with 92.7% or 1,911 individuals in the labor force. Within the labor force, individuals with bachelor's degree or higher education have the highest percentage of unemployment, with 2.6% or 50 of them being unemployed.
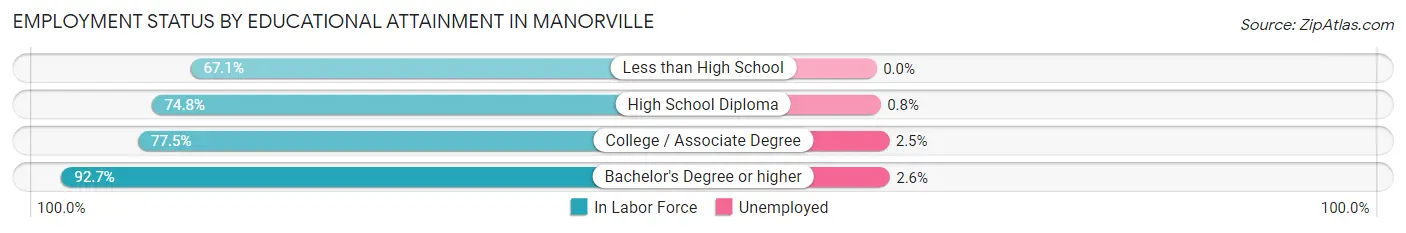
| Educational Attainment | In Labor Force | Unemployed |
| Less than High School | 139 (67.1%) | 0 (0.0%) |
| High School Diploma | 1,659 (74.8%) | 18 (0.8%) |
| College / Associate Degree | 1,902 (77.5%) | 61 (2.5%) |
| Bachelor's Degree or higher | 1,911 (92.7%) | 54 (2.6%) |
| Total | 5,615 (80.9%) | 132 (1.9%) |
Employment Occupations by Sex in Manorville
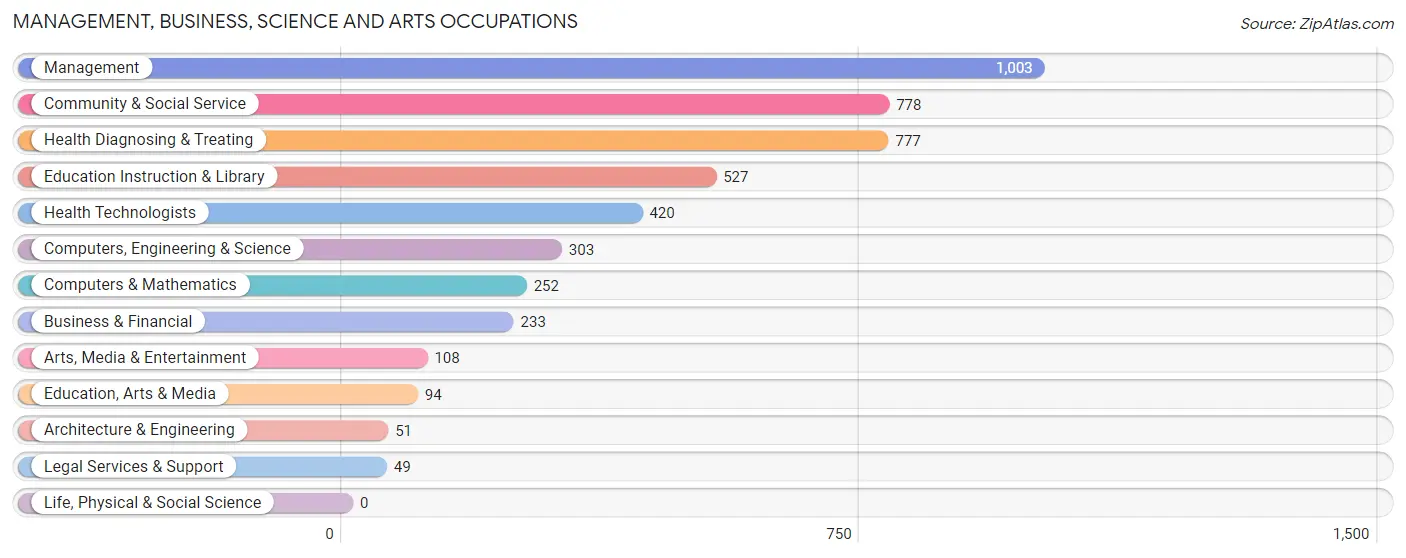
Management, Business, Science and Arts Occupations
The most common Management, Business, Science and Arts occupations in Manorville are Management (1,003 | 15.3%), Community & Social Service (778 | 11.9%), Health Diagnosing & Treating (777 | 11.9%), Education Instruction & Library (527 | 8.1%), and Health Technologists (420 | 6.4%).
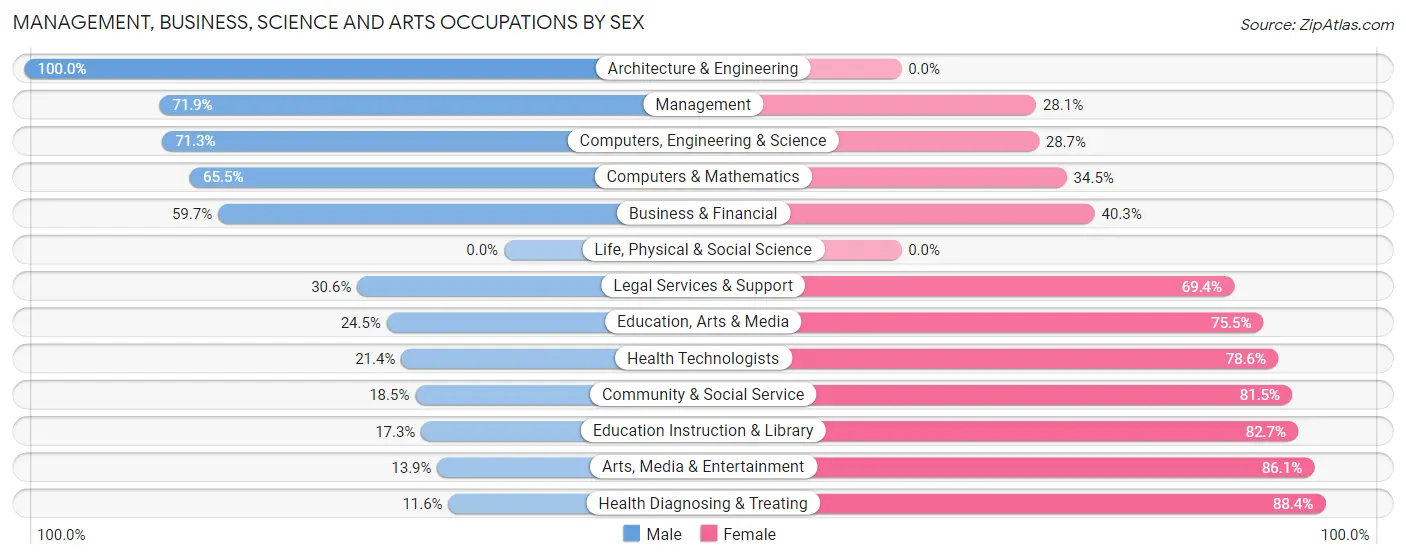
Management, Business, Science and Arts Occupations by Sex
Within the Management, Business, Science and Arts occupations in Manorville, the most male-oriented occupations are Architecture & Engineering (100.0%), Management (71.9%), and Computers, Engineering & Science (71.3%), while the most female-oriented occupations are Health Diagnosing & Treating (88.4%), Arts, Media & Entertainment (86.1%), and Education Instruction & Library (82.7%).
| Occupation | Male | Female |
| Management | 721 (71.9%) | 282 (28.1%) |
| Business & Financial | 139 (59.7%) | 94 (40.3%) |
| Computers, Engineering & Science | 216 (71.3%) | 87 (28.7%) |
| Computers & Mathematics | 165 (65.5%) | 87 (34.5%) |
| Architecture & Engineering | 51 (100.0%) | 0 (0.0%) |
| Life, Physical & Social Science | 0 (0.0%) | 0 (0.0%) |
| Community & Social Service | 144 (18.5%) | 634 (81.5%) |
| Education, Arts & Media | 23 (24.5%) | 71 (75.5%) |
| Legal Services & Support | 15 (30.6%) | 34 (69.4%) |
| Education Instruction & Library | 91 (17.3%) | 436 (82.7%) |
| Arts, Media & Entertainment | 15 (13.9%) | 93 (86.1%) |
| Health Diagnosing & Treating | 90 (11.6%) | 687 (88.4%) |
| Health Technologists | 90 (21.4%) | 330 (78.6%) |
| Total (Category) | 1,310 (42.3%) | 1,784 (57.7%) |
| Total (Overall) | 3,361 (51.3%) | 3,189 (48.7%) |
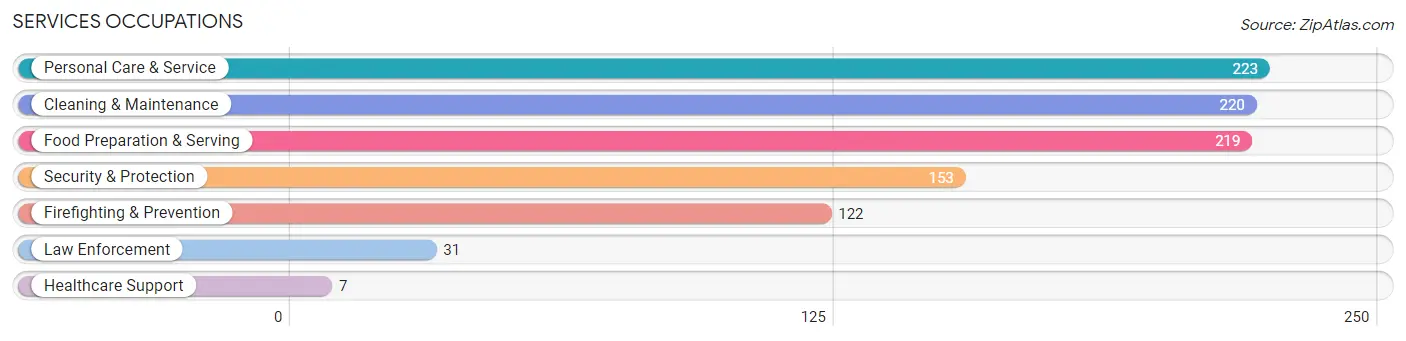
Services Occupations
The most common Services occupations in Manorville are Personal Care & Service (223 | 3.4%), Cleaning & Maintenance (220 | 3.4%), Food Preparation & Serving (219 | 3.3%), Security & Protection (153 | 2.3%), and Firefighting & Prevention (122 | 1.9%).
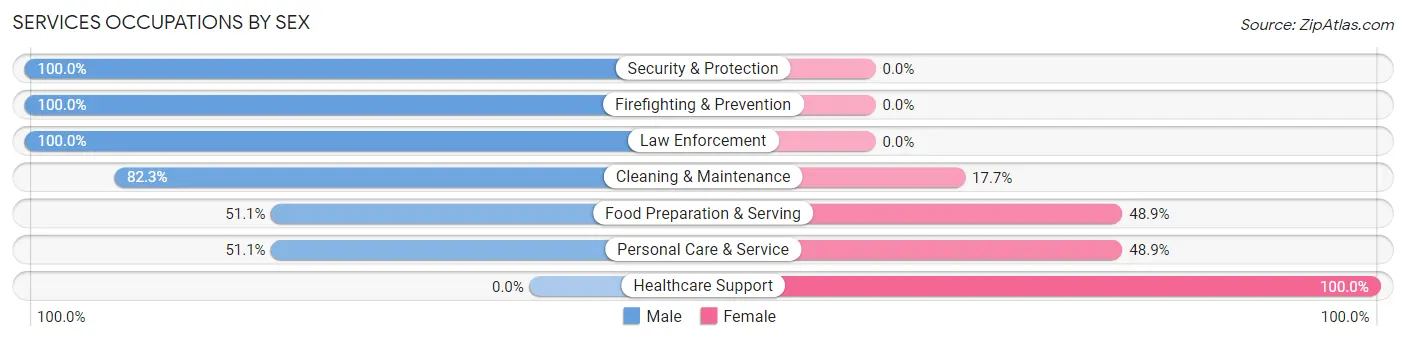
Services Occupations by Sex
Within the Services occupations in Manorville, the most male-oriented occupations are Security & Protection (100.0%), Firefighting & Prevention (100.0%), and Law Enforcement (100.0%), while the most female-oriented occupations are Healthcare Support (100.0%), Personal Care & Service (48.9%), and Food Preparation & Serving (48.9%).
| Occupation | Male | Female |
| Healthcare Support | 0 (0.0%) | 7 (100.0%) |
| Security & Protection | 153 (100.0%) | 0 (0.0%) |
| Firefighting & Prevention | 122 (100.0%) | 0 (0.0%) |
| Law Enforcement | 31 (100.0%) | 0 (0.0%) |
| Food Preparation & Serving | 112 (51.1%) | 107 (48.9%) |
| Cleaning & Maintenance | 181 (82.3%) | 39 (17.7%) |
| Personal Care & Service | 114 (51.1%) | 109 (48.9%) |
| Total (Category) | 560 (68.1%) | 262 (31.9%) |
| Total (Overall) | 3,361 (51.3%) | 3,189 (48.7%) |
Sales and Office Occupations
The most common Sales and Office occupations in Manorville are Office & Administration (914 | 14.0%), and Sales & Related (571 | 8.7%).

Sales and Office Occupations by Sex

| Occupation | Male | Female |
| Sales & Related | 318 (55.7%) | 253 (44.3%) |
| Office & Administration | 82 (9.0%) | 832 (91.0%) |
| Total (Category) | 400 (26.9%) | 1,085 (73.1%) |
| Total (Overall) | 3,361 (51.3%) | 3,189 (48.7%) |
Natural Resources, Construction and Maintenance Occupations
The most common Natural Resources, Construction and Maintenance occupations in Manorville are Installation, Maintenance & Repair (317 | 4.8%), and Construction & Extraction (305 | 4.7%).

Natural Resources, Construction and Maintenance Occupations by Sex

| Occupation | Male | Female |
| Farming, Fishing & Forestry | 0 (0.0%) | 0 (0.0%) |
| Construction & Extraction | 305 (100.0%) | 0 (0.0%) |
| Installation, Maintenance & Repair | 304 (95.9%) | 13 (4.1%) |
| Total (Category) | 609 (97.9%) | 13 (2.1%) |
| Total (Overall) | 3,361 (51.3%) | 3,189 (48.7%) |
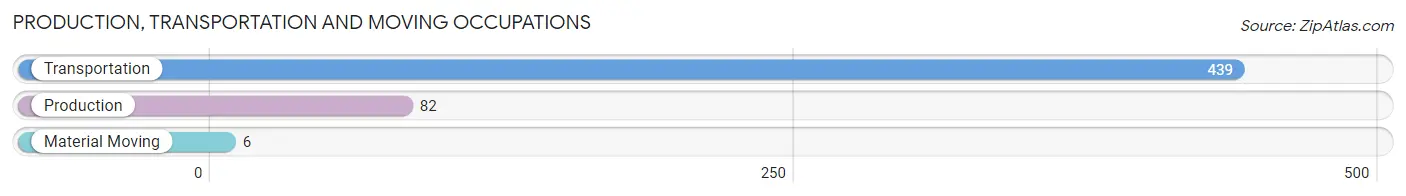
Production, Transportation and Moving Occupations
The most common Production, Transportation and Moving occupations in Manorville are Transportation (439 | 6.7%), Production (82 | 1.3%), and Material Moving (6 | 0.1%).
Production, Transportation and Moving Occupations by Sex

| Occupation | Male | Female |
| Production | 66 (80.5%) | 16 (19.5%) |
| Transportation | 416 (94.8%) | 23 (5.2%) |
| Material Moving | 0 (0.0%) | 6 (100.0%) |
| Total (Category) | 482 (91.5%) | 45 (8.5%) |
| Total (Overall) | 3,361 (51.3%) | 3,189 (48.7%) |
Employment Industries by Sex in Manorville
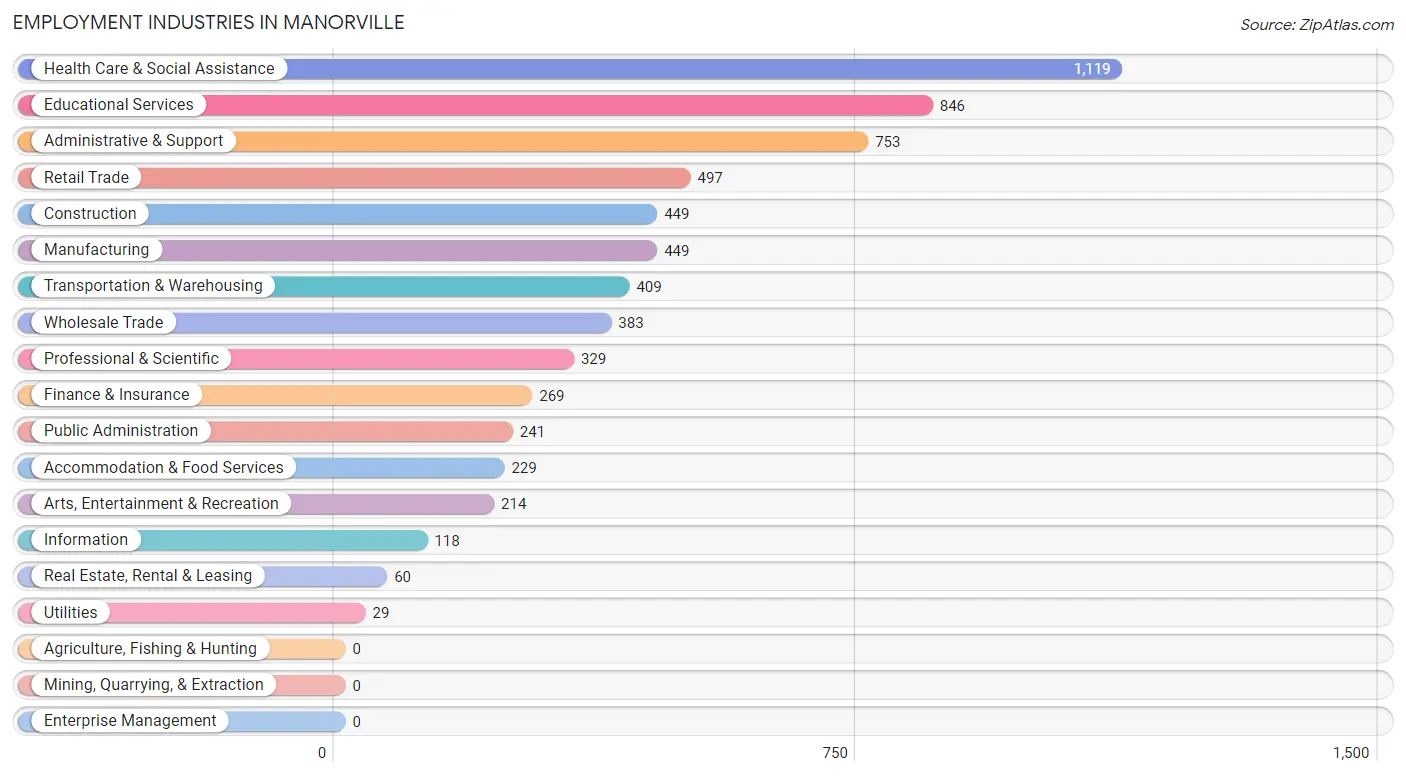
Employment Industries in Manorville
The major employment industries in Manorville include Health Care & Social Assistance (1,119 | 17.1%), Educational Services (846 | 12.9%), Administrative & Support (753 | 11.5%), Retail Trade (497 | 7.6%), and Construction (449 | 6.9%).
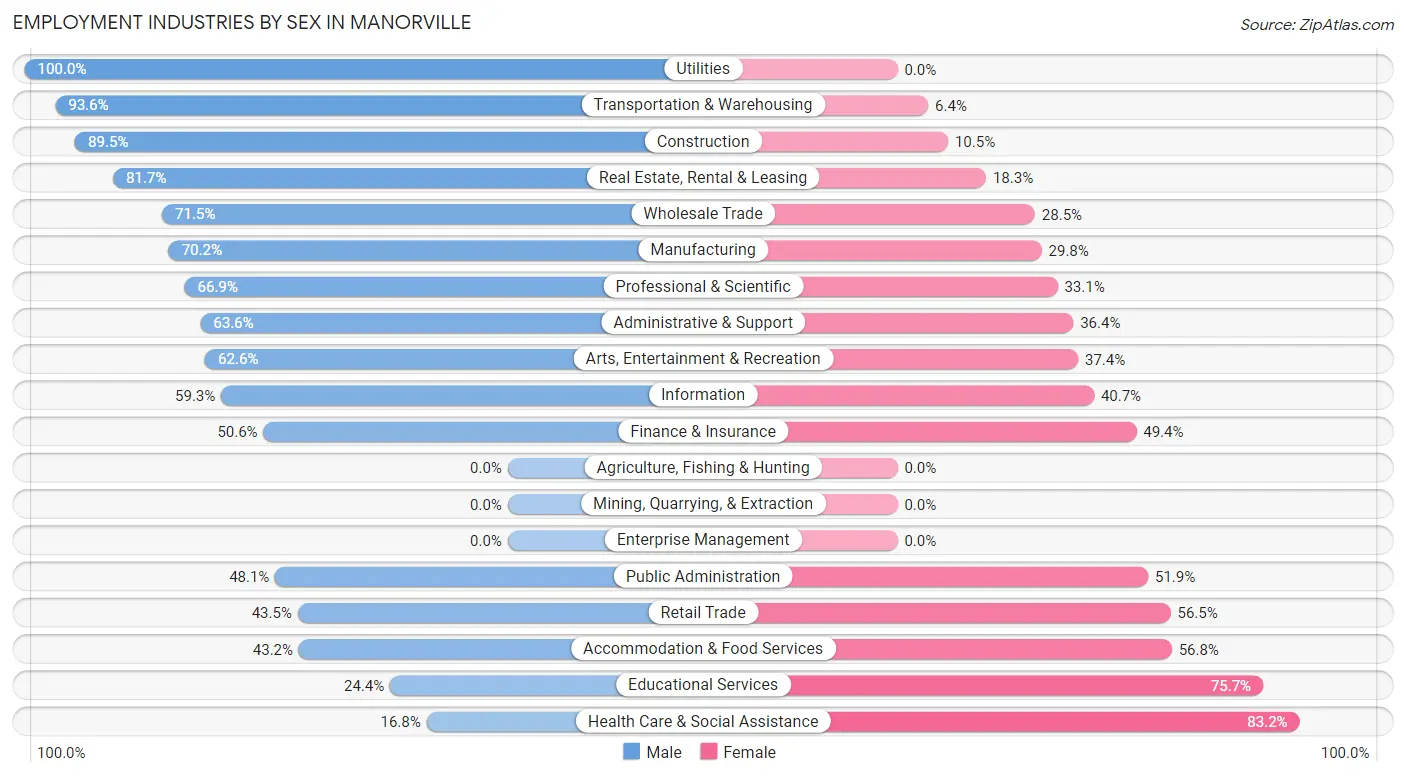
Employment Industries by Sex in Manorville
The Manorville industries that see more men than women are Utilities (100.0%), Transportation & Warehousing (93.6%), and Construction (89.5%), whereas the industries that tend to have a higher number of women are Health Care & Social Assistance (83.2%), Educational Services (75.6%), and Accommodation & Food Services (56.8%).
| Industry | Male | Female |
| Agriculture, Fishing & Hunting | 0 (0.0%) | 0 (0.0%) |
| Mining, Quarrying, & Extraction | 0 (0.0%) | 0 (0.0%) |
| Construction | 402 (89.5%) | 47 (10.5%) |
| Manufacturing | 315 (70.2%) | 134 (29.8%) |
| Wholesale Trade | 274 (71.5%) | 109 (28.5%) |
| Retail Trade | 216 (43.5%) | 281 (56.5%) |
| Transportation & Warehousing | 383 (93.6%) | 26 (6.4%) |
| Utilities | 29 (100.0%) | 0 (0.0%) |
| Information | 70 (59.3%) | 48 (40.7%) |
| Finance & Insurance | 136 (50.6%) | 133 (49.4%) |
| Real Estate, Rental & Leasing | 49 (81.7%) | 11 (18.3%) |
| Professional & Scientific | 220 (66.9%) | 109 (33.1%) |
| Enterprise Management | 0 (0.0%) | 0 (0.0%) |
| Administrative & Support | 479 (63.6%) | 274 (36.4%) |
| Educational Services | 206 (24.3%) | 640 (75.6%) |
| Health Care & Social Assistance | 188 (16.8%) | 931 (83.2%) |
| Arts, Entertainment & Recreation | 134 (62.6%) | 80 (37.4%) |
| Accommodation & Food Services | 99 (43.2%) | 130 (56.8%) |
| Public Administration | 116 (48.1%) | 125 (51.9%) |
| Total | 3,361 (51.3%) | 3,189 (48.7%) |
Education in Manorville
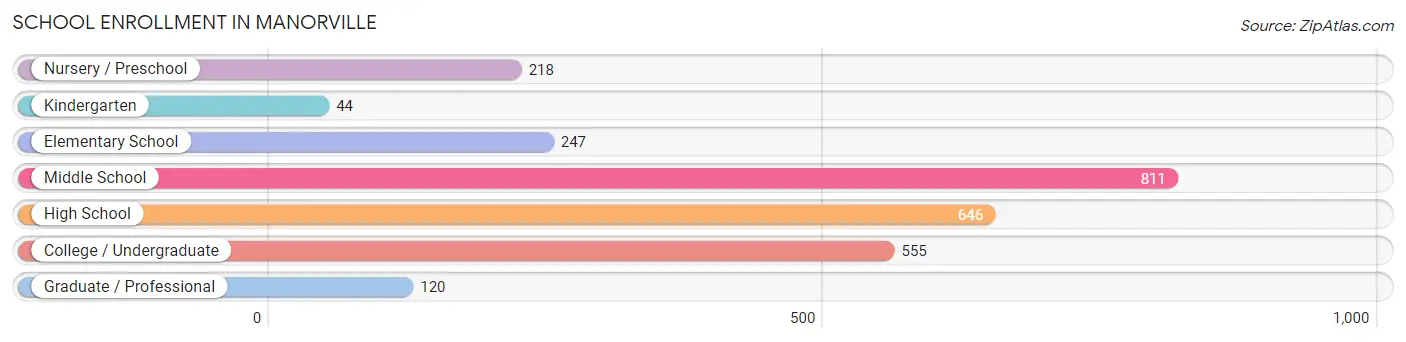
School Enrollment in Manorville
The most common levels of schooling among the 2,641 students in Manorville are middle school (811 | 30.7%), high school (646 | 24.5%), and college / undergraduate (555 | 21.0%).
| School Level | # Students | % Students |
| Nursery / Preschool | 218 | 8.3% |
| Kindergarten | 44 | 1.7% |
| Elementary School | 247 | 9.3% |
| Middle School | 811 | 30.7% |
| High School | 646 | 24.5% |
| College / Undergraduate | 555 | 21.0% |
| Graduate / Professional | 120 | 4.5% |
| Total | 2,641 | 100.0% |
School Enrollment by Age by Funding Source in Manorville
Out of a total of 2,641 students who are enrolled in schools in Manorville, 378 (14.3%) attend a private institution, while the remaining 2,263 (85.7%) are enrolled in public schools. The age group of 25 to 34 year olds has the highest likelihood of being enrolled in private schools, with 116 (82.9% in the age bracket) enrolled. Conversely, the age group of 10 to 14 year olds has the lowest likelihood of being enrolled in a private school, with 904 (100.0% in the age bracket) attending a public institution.
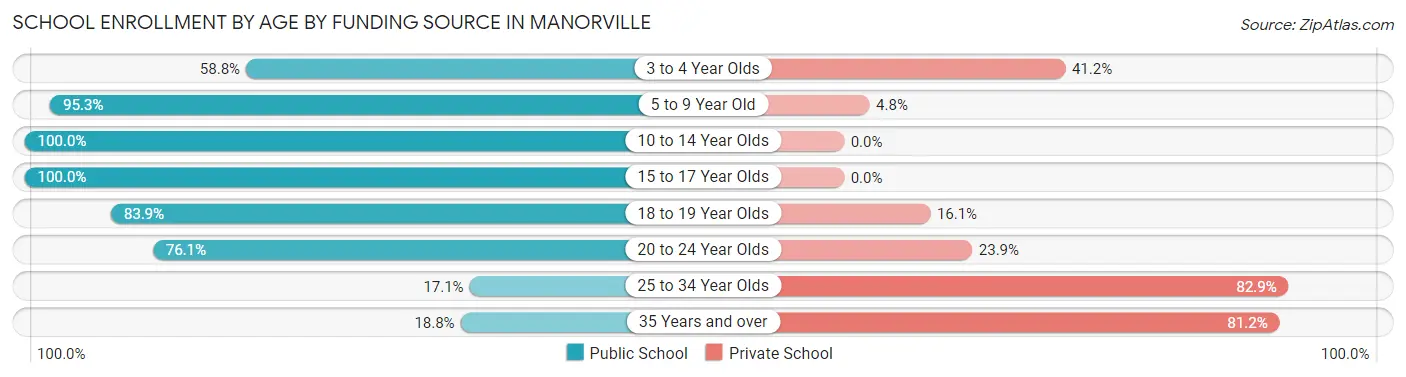
| Age Bracket | Public School | Private School |
| 3 to 4 Year Olds | 87 (58.8%) | 61 (41.2%) |
| 5 to 9 Year Old | 321 (95.3%) | 16 (4.8%) |
| 10 to 14 Year Olds | 904 (100.0%) | 0 (0.0%) |
| 15 to 17 Year Olds | 409 (100.0%) | 0 (0.0%) |
| 18 to 19 Year Olds | 350 (83.9%) | 67 (16.1%) |
| 20 to 24 Year Olds | 153 (76.1%) | 48 (23.9%) |
| 25 to 34 Year Olds | 24 (17.1%) | 116 (82.9%) |
| 35 Years and over | 16 (18.8%) | 69 (81.2%) |
| Total | 2,263 (85.7%) | 378 (14.3%) |
Educational Attainment by Field of Study in Manorville
Business (596 | 20.2%), education (582 | 19.7%), science & technology (368 | 12.4%), engineering (228 | 7.7%), and social sciences (178 | 6.0%) are the most common fields of study among 2,955 individuals in Manorville who have obtained a bachelor's degree or higher.
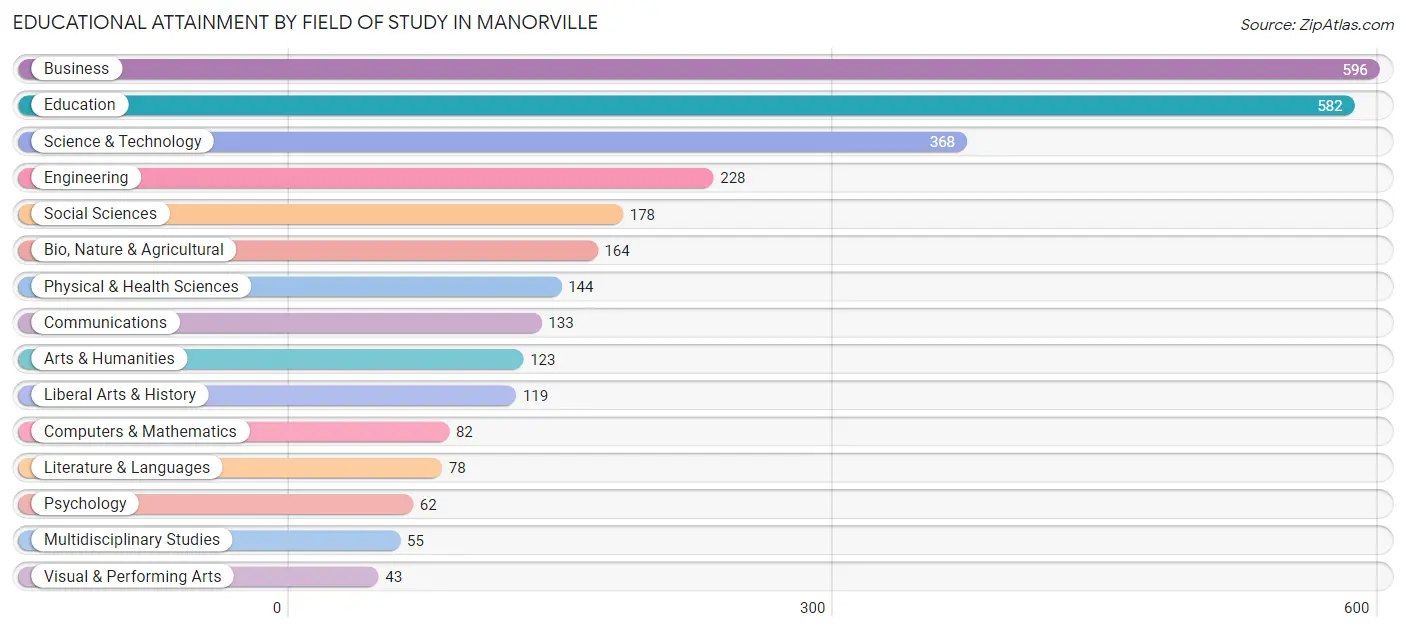
| Field of Study | # Graduates | % Graduates |
| Computers & Mathematics | 82 | 2.8% |
| Bio, Nature & Agricultural | 164 | 5.6% |
| Physical & Health Sciences | 144 | 4.9% |
| Psychology | 62 | 2.1% |
| Social Sciences | 178 | 6.0% |
| Engineering | 228 | 7.7% |
| Multidisciplinary Studies | 55 | 1.9% |
| Science & Technology | 368 | 12.4% |
| Business | 596 | 20.2% |
| Education | 582 | 19.7% |
| Literature & Languages | 78 | 2.6% |
| Liberal Arts & History | 119 | 4.0% |
| Visual & Performing Arts | 43 | 1.5% |
| Communications | 133 | 4.5% |
| Arts & Humanities | 123 | 4.2% |
| Total | 2,955 | 100.0% |
Transportation & Commute in Manorville
Vehicle Availability by Sex in Manorville
The most prevalent vehicle ownership categories in Manorville are males with 2 vehicles (956, accounting for 28.5%) and females with 2 vehicles (937, making up 30.0%).
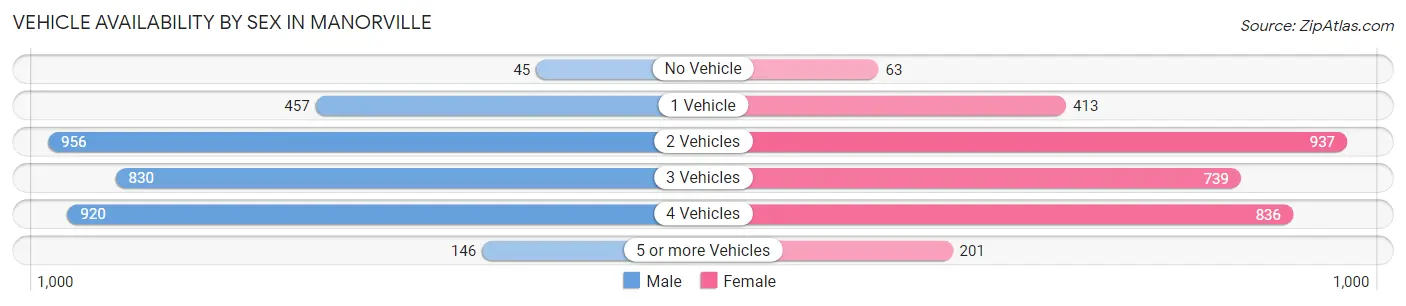
| Vehicles Available | Male | Female |
| No Vehicle | 45 (1.3%) | 63 (2.0%) |
| 1 Vehicle | 457 (13.6%) | 413 (13.0%) |
| 2 Vehicles | 956 (28.5%) | 937 (29.4%) |
| 3 Vehicles | 830 (24.7%) | 739 (23.2%) |
| 4 Vehicles | 920 (27.4%) | 836 (26.2%) |
| 5 or more Vehicles | 146 (4.3%) | 201 (6.3%) |
| Total | 3,354 (100.0%) | 3,189 (100.0%) |
Commute Time in Manorville
The most frequently occuring commute durations in Manorville are 15 to 19 minutes (1,090 commuters, 18.2%), 30 to 34 minutes (996 commuters, 16.6%), and 45 to 59 minutes (810 commuters, 13.5%).
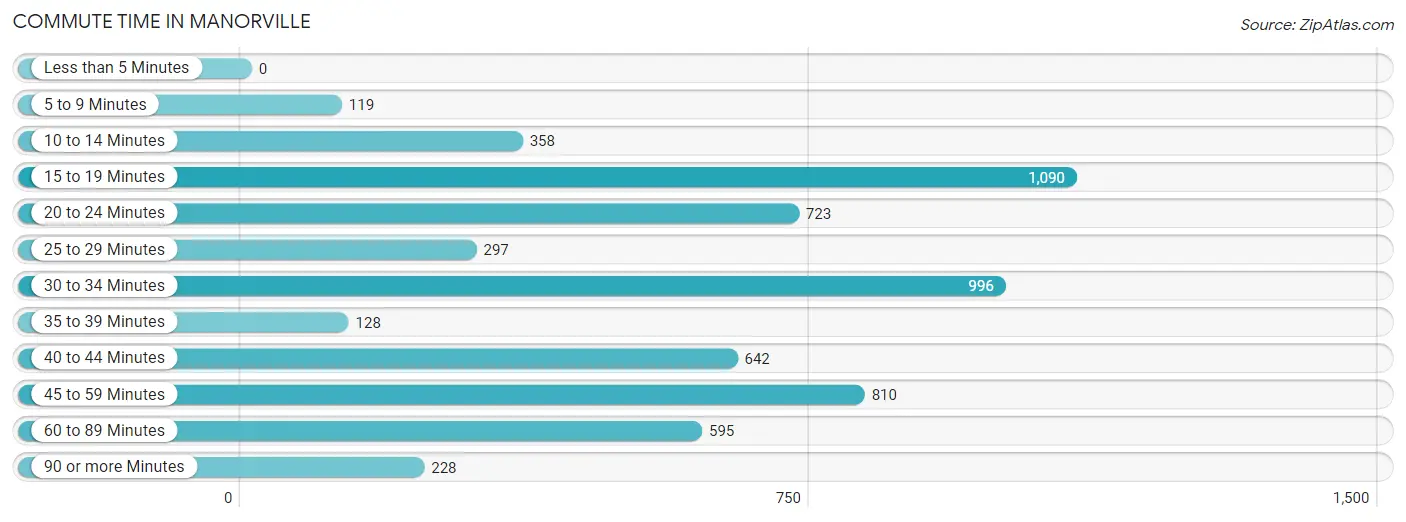
| Commute Time | # Commuters | % Commuters |
| Less than 5 Minutes | 0 | 0.0% |
| 5 to 9 Minutes | 119 | 2.0% |
| 10 to 14 Minutes | 358 | 6.0% |
| 15 to 19 Minutes | 1,090 | 18.2% |
| 20 to 24 Minutes | 723 | 12.1% |
| 25 to 29 Minutes | 297 | 5.0% |
| 30 to 34 Minutes | 996 | 16.6% |
| 35 to 39 Minutes | 128 | 2.1% |
| 40 to 44 Minutes | 642 | 10.7% |
| 45 to 59 Minutes | 810 | 13.5% |
| 60 to 89 Minutes | 595 | 9.9% |
| 90 or more Minutes | 228 | 3.8% |
Commute Time by Sex in Manorville
The most common commute times in Manorville are 30 to 34 minutes (572 commuters, 18.0%) for males and 15 to 19 minutes (588 commuters, 20.9%) for females.
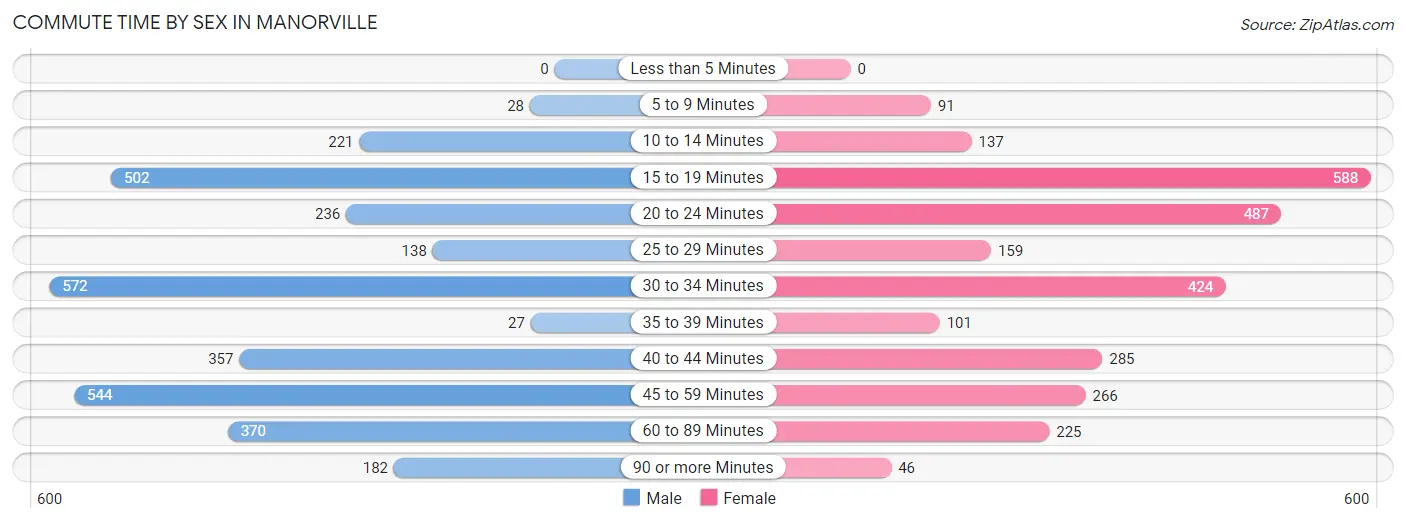
| Commute Time | Male | Female |
| Less than 5 Minutes | 0 (0.0%) | 0 (0.0%) |
| 5 to 9 Minutes | 28 (0.9%) | 91 (3.2%) |
| 10 to 14 Minutes | 221 (7.0%) | 137 (4.9%) |
| 15 to 19 Minutes | 502 (15.8%) | 588 (20.9%) |
| 20 to 24 Minutes | 236 (7.4%) | 487 (17.3%) |
| 25 to 29 Minutes | 138 (4.3%) | 159 (5.7%) |
| 30 to 34 Minutes | 572 (18.0%) | 424 (15.1%) |
| 35 to 39 Minutes | 27 (0.9%) | 101 (3.6%) |
| 40 to 44 Minutes | 357 (11.2%) | 285 (10.2%) |
| 45 to 59 Minutes | 544 (17.1%) | 266 (9.5%) |
| 60 to 89 Minutes | 370 (11.7%) | 225 (8.0%) |
| 90 or more Minutes | 182 (5.7%) | 46 (1.6%) |
Time of Departure to Work by Sex in Manorville
The most frequent times of departure to work in Manorville are 7:00 AM to 7:29 AM (597, 18.8%) for males and 7:30 AM to 7:59 AM (524, 18.6%) for females.
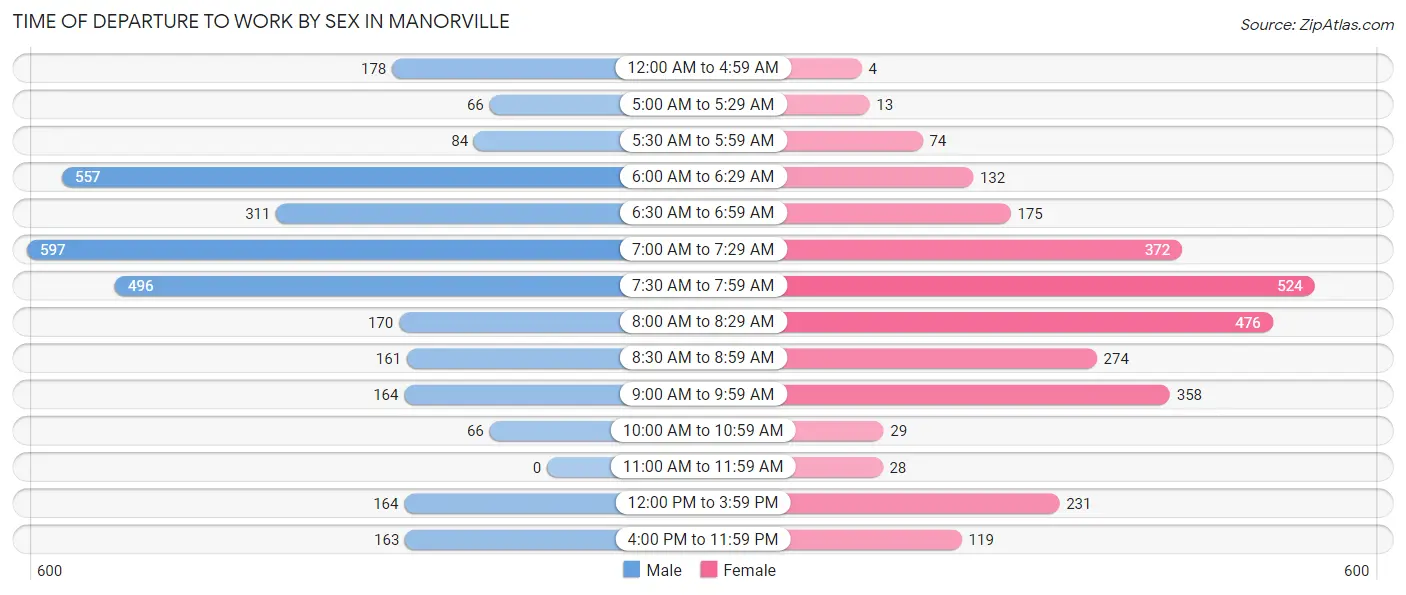
| Time of Departure | Male | Female |
| 12:00 AM to 4:59 AM | 178 (5.6%) | 4 (0.1%) |
| 5:00 AM to 5:29 AM | 66 (2.1%) | 13 (0.5%) |
| 5:30 AM to 5:59 AM | 84 (2.6%) | 74 (2.6%) |
| 6:00 AM to 6:29 AM | 557 (17.5%) | 132 (4.7%) |
| 6:30 AM to 6:59 AM | 311 (9.8%) | 175 (6.2%) |
| 7:00 AM to 7:29 AM | 597 (18.8%) | 372 (13.2%) |
| 7:30 AM to 7:59 AM | 496 (15.6%) | 524 (18.6%) |
| 8:00 AM to 8:29 AM | 170 (5.3%) | 476 (17.0%) |
| 8:30 AM to 8:59 AM | 161 (5.1%) | 274 (9.8%) |
| 9:00 AM to 9:59 AM | 164 (5.2%) | 358 (12.7%) |
| 10:00 AM to 10:59 AM | 66 (2.1%) | 29 (1.0%) |
| 11:00 AM to 11:59 AM | 0 (0.0%) | 28 (1.0%) |
| 12:00 PM to 3:59 PM | 164 (5.2%) | 231 (8.2%) |
| 4:00 PM to 11:59 PM | 163 (5.1%) | 119 (4.2%) |
| Total | 3,177 (100.0%) | 2,809 (100.0%) |
Housing Occupancy in Manorville
Occupancy by Ownership in Manorville
Of the total 4,896 dwellings in Manorville, owner-occupied units account for 4,148 (84.7%), while renter-occupied units make up 748 (15.3%).
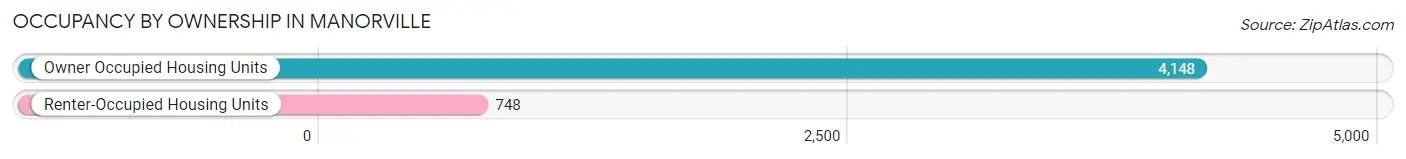
| Occupancy | # Housing Units | % Housing Units |
| Owner Occupied Housing Units | 4,148 | 84.7% |
| Renter-Occupied Housing Units | 748 | 15.3% |
| Total Occupied Housing Units | 4,896 | 100.0% |
Occupancy by Household Size in Manorville
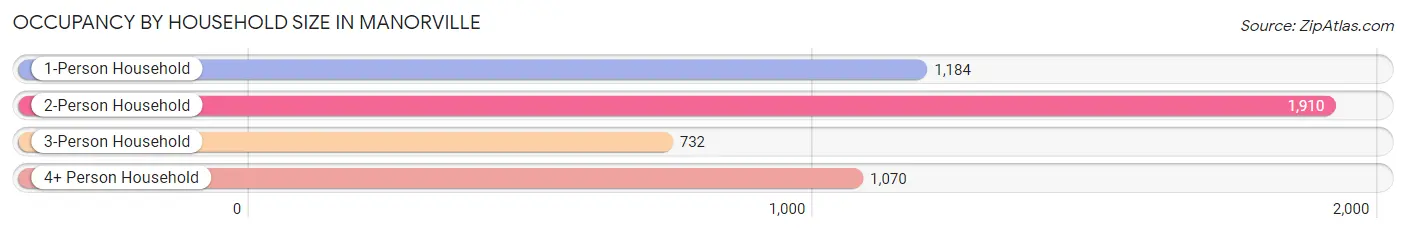
| Household Size | # Housing Units | % Housing Units |
| 1-Person Household | 1,184 | 24.2% |
| 2-Person Household | 1,910 | 39.0% |
| 3-Person Household | 732 | 14.9% |
| 4+ Person Household | 1,070 | 21.8% |
| Total Housing Units | 4,896 | 100.0% |
Occupancy by Ownership by Household Size in Manorville
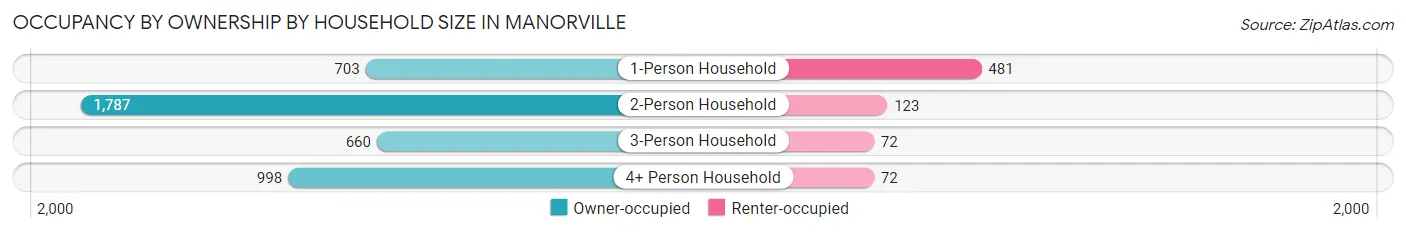
| Household Size | Owner-occupied | Renter-occupied |
| 1-Person Household | 703 (59.4%) | 481 (40.6%) |
| 2-Person Household | 1,787 (93.6%) | 123 (6.4%) |
| 3-Person Household | 660 (90.2%) | 72 (9.8%) |
| 4+ Person Household | 998 (93.3%) | 72 (6.7%) |
| Total Housing Units | 4,148 (84.7%) | 748 (15.3%) |
Occupancy by Educational Attainment in Manorville
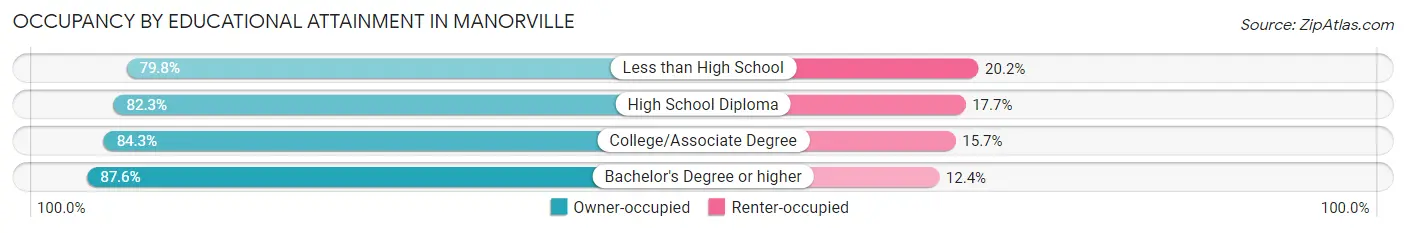
| Household Size | Owner-occupied | Renter-occupied |
| Less than High School | 142 (79.8%) | 36 (20.2%) |
| High School Diploma | 1,147 (82.3%) | 246 (17.7%) |
| College/Associate Degree | 1,353 (84.3%) | 252 (15.7%) |
| Bachelor's Degree or higher | 1,506 (87.6%) | 214 (12.4%) |
Occupancy by Age of Householder in Manorville
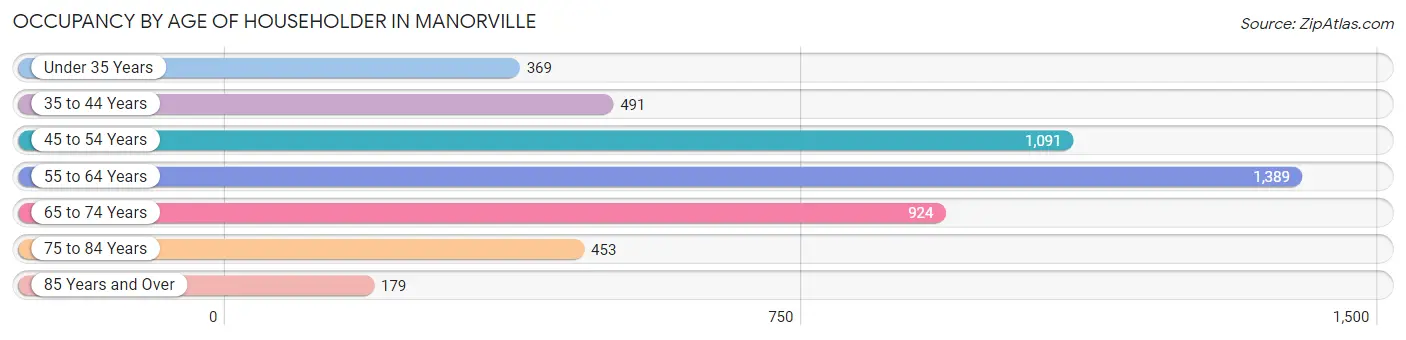
| Age Bracket | # Households | % Households |
| Under 35 Years | 369 | 7.5% |
| 35 to 44 Years | 491 | 10.0% |
| 45 to 54 Years | 1,091 | 22.3% |
| 55 to 64 Years | 1,389 | 28.4% |
| 65 to 74 Years | 924 | 18.9% |
| 75 to 84 Years | 453 | 9.2% |
| 85 Years and Over | 179 | 3.7% |
| Total | 4,896 | 100.0% |
Housing Finances in Manorville
Median Income by Occupancy in Manorville
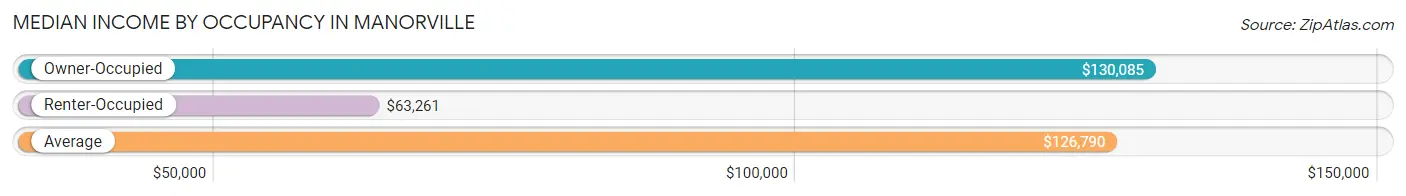
| Occupancy Type | # Households | Median Income |
| Owner-Occupied | 4,148 (84.7%) | $130,085 |
| Renter-Occupied | 748 (15.3%) | $63,261 |
| Average | 4,896 (100.0%) | $126,790 |
Occupancy by Householder Income Bracket in Manorville
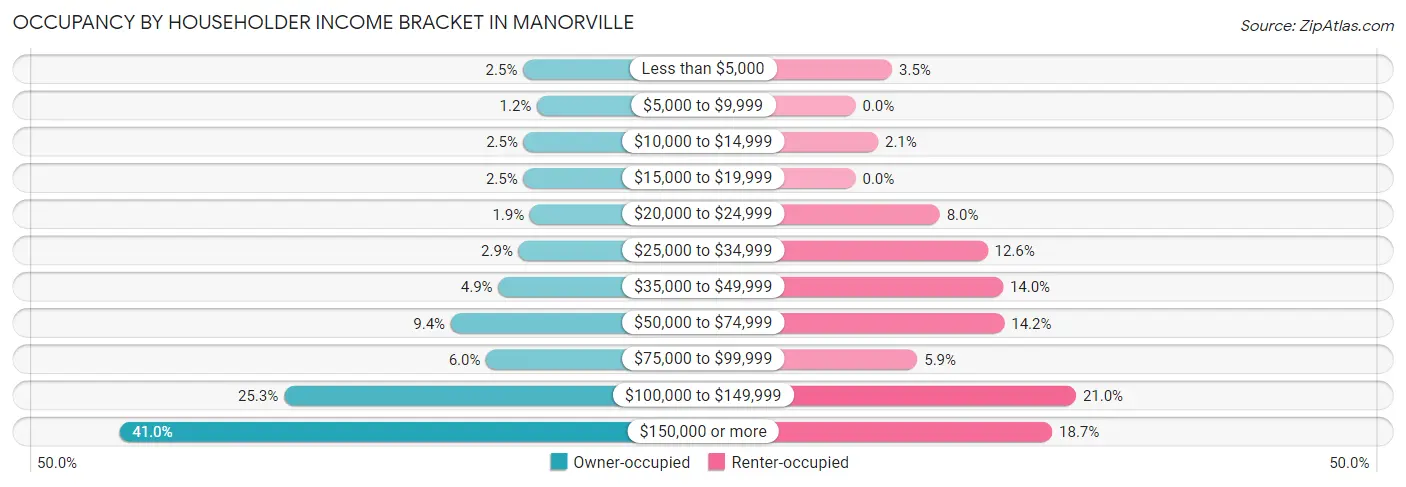
| Income Bracket | Owner-occupied | Renter-occupied |
| Less than $5,000 | 104 (2.5%) | 26 (3.5%) |
| $5,000 to $9,999 | 49 (1.2%) | 0 (0.0%) |
| $10,000 to $14,999 | 102 (2.5%) | 16 (2.1%) |
| $15,000 to $19,999 | 103 (2.5%) | 0 (0.0%) |
| $20,000 to $24,999 | 77 (1.9%) | 60 (8.0%) |
| $25,000 to $34,999 | 122 (2.9%) | 94 (12.6%) |
| $35,000 to $49,999 | 202 (4.9%) | 105 (14.0%) |
| $50,000 to $74,999 | 390 (9.4%) | 106 (14.2%) |
| $75,000 to $99,999 | 250 (6.0%) | 44 (5.9%) |
| $100,000 to $149,999 | 1,049 (25.3%) | 157 (21.0%) |
| $150,000 or more | 1,700 (41.0%) | 140 (18.7%) |
| Total | 4,148 (100.0%) | 748 (100.0%) |
Monthly Housing Cost Tiers in Manorville
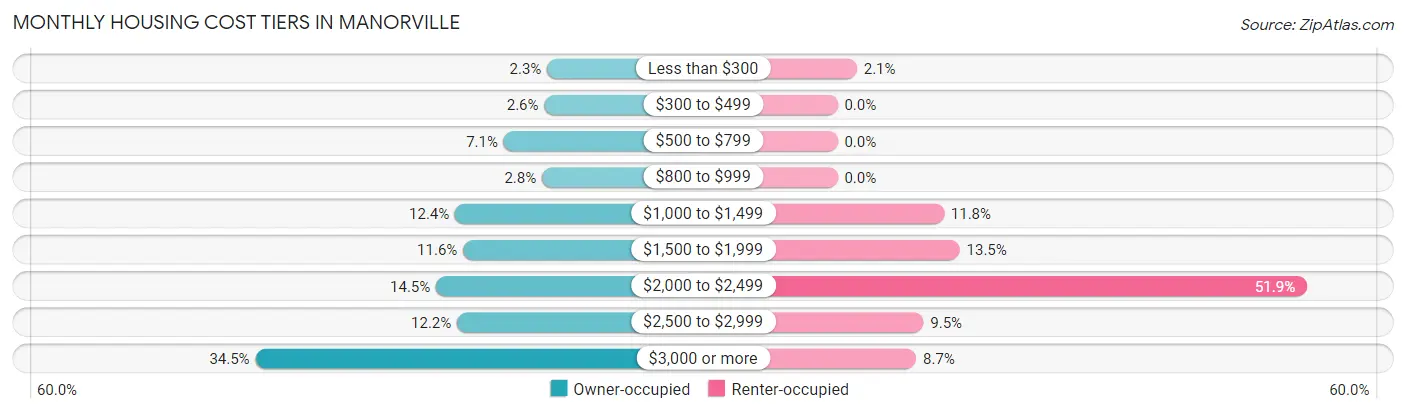
| Monthly Cost | Owner-occupied | Renter-occupied |
| Less than $300 | 94 (2.3%) | 16 (2.1%) |
| $300 to $499 | 107 (2.6%) | 0 (0.0%) |
| $500 to $799 | 293 (7.1%) | 0 (0.0%) |
| $800 to $999 | 118 (2.8%) | 0 (0.0%) |
| $1,000 to $1,499 | 516 (12.4%) | 88 (11.8%) |
| $1,500 to $1,999 | 479 (11.6%) | 101 (13.5%) |
| $2,000 to $2,499 | 603 (14.5%) | 388 (51.9%) |
| $2,500 to $2,999 | 507 (12.2%) | 71 (9.5%) |
| $3,000 or more | 1,431 (34.5%) | 65 (8.7%) |
| Total | 4,148 (100.0%) | 748 (100.0%) |
Physical Housing Characteristics in Manorville
Housing Structures in Manorville
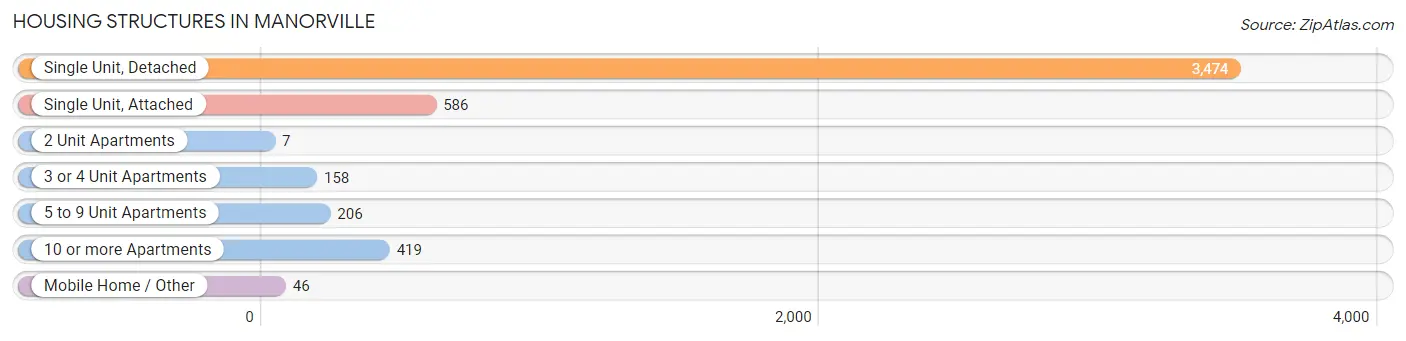
| Structure Type | # Housing Units | % Housing Units |
| Single Unit, Detached | 3,474 | 71.0% |
| Single Unit, Attached | 586 | 12.0% |
| 2 Unit Apartments | 7 | 0.1% |
| 3 or 4 Unit Apartments | 158 | 3.2% |
| 5 to 9 Unit Apartments | 206 | 4.2% |
| 10 or more Apartments | 419 | 8.6% |
| Mobile Home / Other | 46 | 0.9% |
| Total | 4,896 | 100.0% |
Housing Structures by Occupancy in Manorville
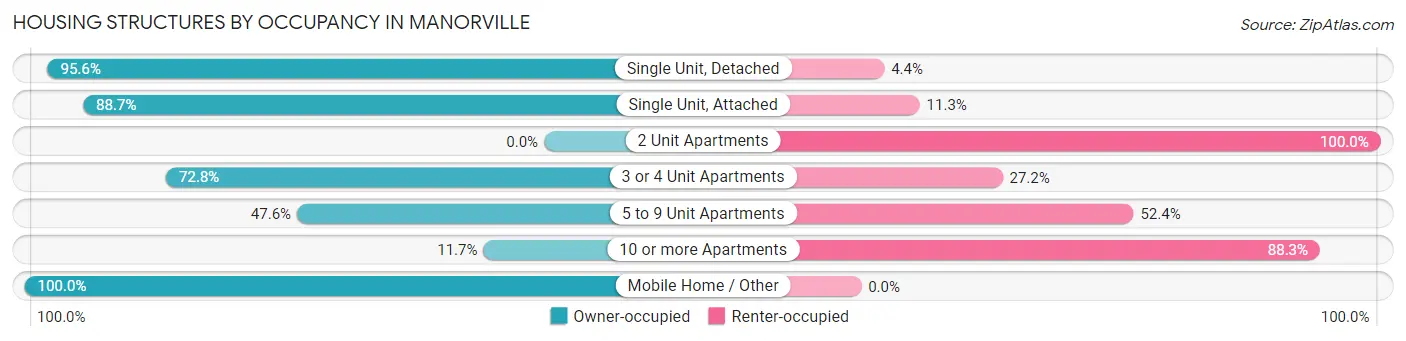
| Structure Type | Owner-occupied | Renter-occupied |
| Single Unit, Detached | 3,320 (95.6%) | 154 (4.4%) |
| Single Unit, Attached | 520 (88.7%) | 66 (11.3%) |
| 2 Unit Apartments | 0 (0.0%) | 7 (100.0%) |
| 3 or 4 Unit Apartments | 115 (72.8%) | 43 (27.2%) |
| 5 to 9 Unit Apartments | 98 (47.6%) | 108 (52.4%) |
| 10 or more Apartments | 49 (11.7%) | 370 (88.3%) |
| Mobile Home / Other | 46 (100.0%) | 0 (0.0%) |
| Total | 4,148 (84.7%) | 748 (15.3%) |
Housing Structures by Number of Rooms in Manorville
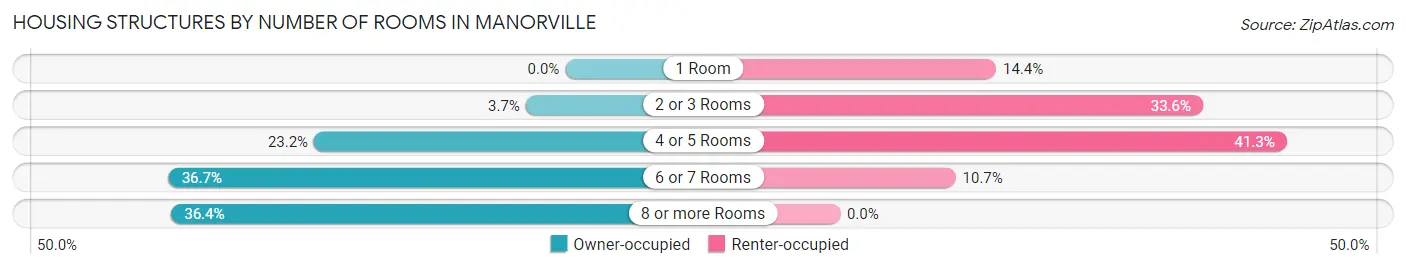
| Number of Rooms | Owner-occupied | Renter-occupied |
| 1 Room | 0 (0.0%) | 108 (14.4%) |
| 2 or 3 Rooms | 152 (3.7%) | 251 (33.6%) |
| 4 or 5 Rooms | 964 (23.2%) | 309 (41.3%) |
| 6 or 7 Rooms | 1,521 (36.7%) | 80 (10.7%) |
| 8 or more Rooms | 1,511 (36.4%) | 0 (0.0%) |
| Total | 4,148 (100.0%) | 748 (100.0%) |
Housing Structure by Heating Type in Manorville
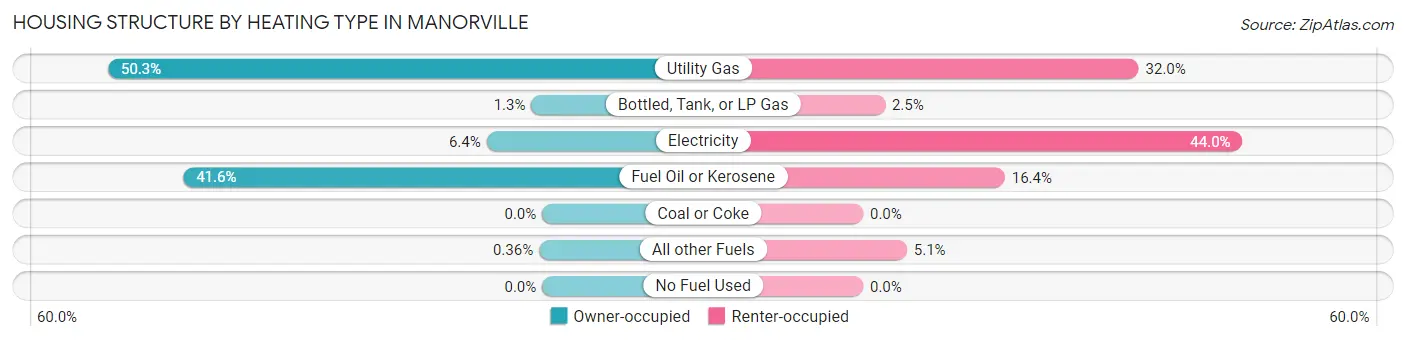
| Heating Type | Owner-occupied | Renter-occupied |
| Utility Gas | 2,088 (50.3%) | 239 (32.0%) |
| Bottled, Tank, or LP Gas | 52 (1.3%) | 19 (2.5%) |
| Electricity | 267 (6.4%) | 329 (44.0%) |
| Fuel Oil or Kerosene | 1,726 (41.6%) | 123 (16.4%) |
| Coal or Coke | 0 (0.0%) | 0 (0.0%) |
| All other Fuels | 15 (0.4%) | 38 (5.1%) |
| No Fuel Used | 0 (0.0%) | 0 (0.0%) |
| Total | 4,148 (100.0%) | 748 (100.0%) |
Household Vehicle Usage in Manorville
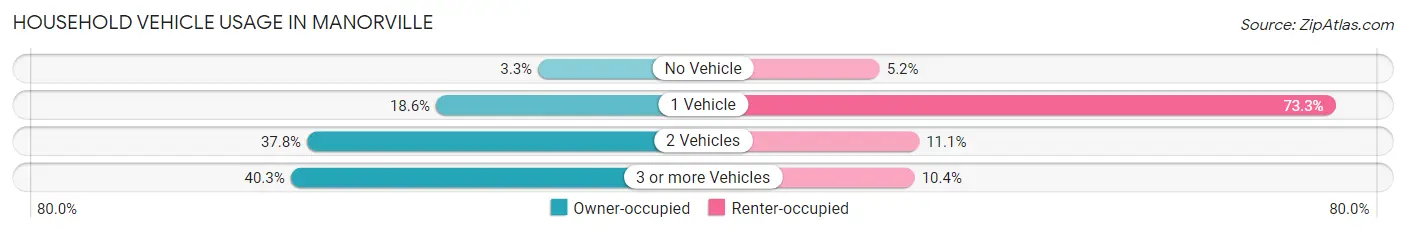
| Vehicles per Household | Owner-occupied | Renter-occupied |
| No Vehicle | 138 (3.3%) | 39 (5.2%) |
| 1 Vehicle | 770 (18.6%) | 548 (73.3%) |
| 2 Vehicles | 1,569 (37.8%) | 83 (11.1%) |
| 3 or more Vehicles | 1,671 (40.3%) | 78 (10.4%) |
| Total | 4,148 (100.0%) | 748 (100.0%) |
Real Estate & Mortgages in Manorville
Real Estate and Mortgage Overview in Manorville
| Characteristic | Without Mortgage | With Mortgage |
| Housing Units | 1,889 | 2,259 |
| Median Property Value | $461,400 | $554,800 |
| Median Household Income | $119,107 | $1,127 |
| Monthly Housing Costs | $1,388 | $1,431 |
| Real Estate Taxes | $8,692 | $7 |
Property Value by Mortgage Status in Manorville
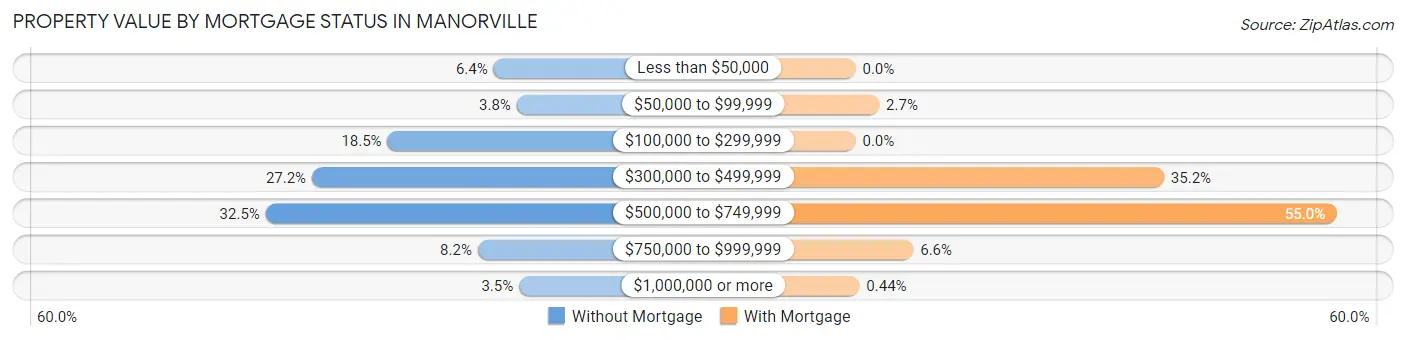
| Property Value | Without Mortgage | With Mortgage |
| Less than $50,000 | 121 (6.4%) | 0 (0.0%) |
| $50,000 to $99,999 | 71 (3.8%) | 61 (2.7%) |
| $100,000 to $299,999 | 350 (18.5%) | 0 (0.0%) |
| $300,000 to $499,999 | 513 (27.2%) | 796 (35.2%) |
| $500,000 to $749,999 | 613 (32.5%) | 1,243 (55.0%) |
| $750,000 to $999,999 | 155 (8.2%) | 149 (6.6%) |
| $1,000,000 or more | 66 (3.5%) | 10 (0.4%) |
| Total | 1,889 (100.0%) | 2,259 (100.0%) |
Household Income by Mortgage Status in Manorville
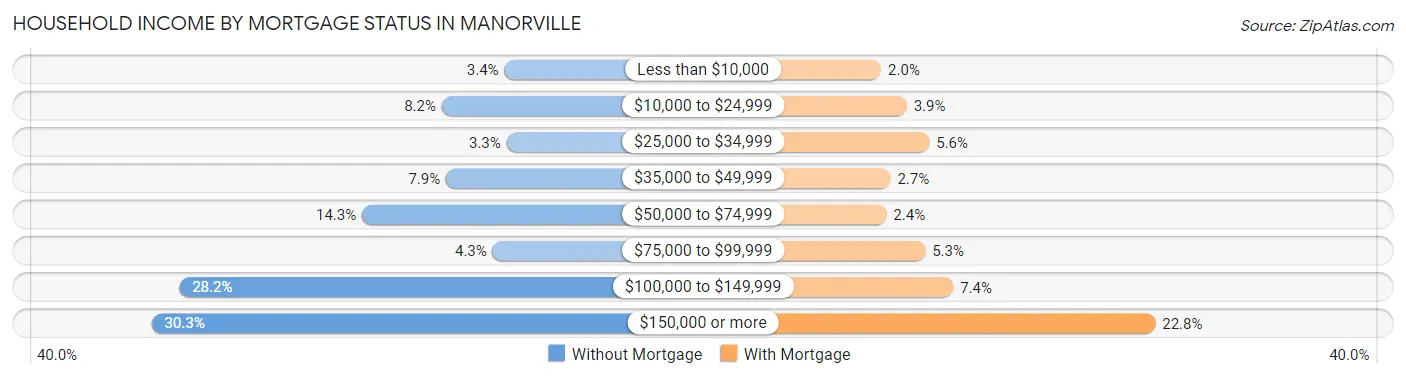
| Household Income | Without Mortgage | With Mortgage |
| Less than $10,000 | 65 (3.4%) | 44 (1.9%) |
| $10,000 to $24,999 | 155 (8.2%) | 88 (3.9%) |
| $25,000 to $34,999 | 62 (3.3%) | 127 (5.6%) |
| $35,000 to $49,999 | 149 (7.9%) | 60 (2.7%) |
| $50,000 to $74,999 | 270 (14.3%) | 53 (2.4%) |
| $75,000 to $99,999 | 82 (4.3%) | 120 (5.3%) |
| $100,000 to $149,999 | 533 (28.2%) | 168 (7.4%) |
| $150,000 or more | 573 (30.3%) | 516 (22.8%) |
| Total | 1,889 (100.0%) | 2,259 (100.0%) |
Property Value to Household Income Ratio in Manorville
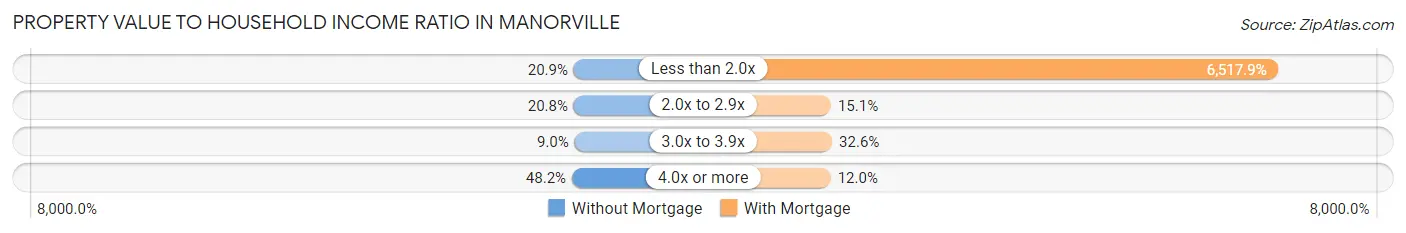
| Value-to-Income Ratio | Without Mortgage | With Mortgage |
| Less than 2.0x | 394 (20.9%) | 147,240 (6,517.9%) |
| 2.0x to 2.9x | 392 (20.7%) | 340 (15.0%) |
| 3.0x to 3.9x | 169 (8.9%) | 737 (32.6%) |
| 4.0x or more | 911 (48.2%) | 271 (12.0%) |
| Total | 1,889 (100.0%) | 2,259 (100.0%) |
Real Estate Taxes by Mortgage Status in Manorville

| Property Taxes | Without Mortgage | With Mortgage |
| Less than $800 | 112 (5.9%) | 0 (0.0%) |
| $800 to $1,499 | 77 (4.1%) | 27 (1.2%) |
| $800 to $1,499 | 1,607 (85.1%) | 27 (1.2%) |
| Total | 1,889 (100.0%) | 2,259 (100.0%) |
Health & Disability in Manorville
Health Insurance Coverage by Age in Manorville
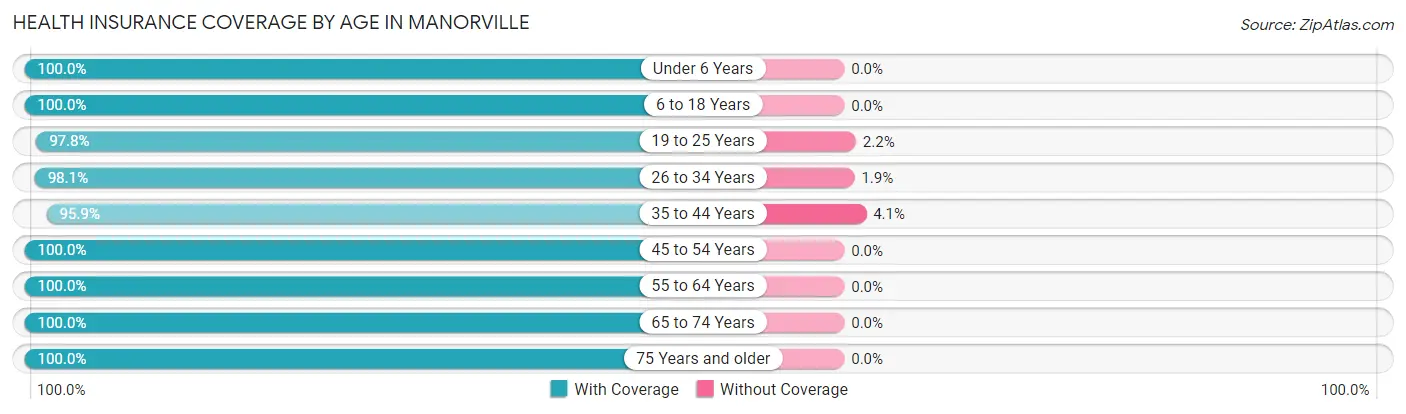
| Age Bracket | With Coverage | Without Coverage |
| Under 6 Years | 650 (100.0%) | 0 (0.0%) |
| 6 to 18 Years | 2,000 (100.0%) | 0 (0.0%) |
| 19 to 25 Years | 722 (97.8%) | 16 (2.2%) |
| 26 to 34 Years | 1,034 (98.1%) | 20 (1.9%) |
| 35 to 44 Years | 1,102 (95.9%) | 47 (4.1%) |
| 45 to 54 Years | 1,999 (100.0%) | 0 (0.0%) |
| 55 to 64 Years | 2,638 (100.0%) | 0 (0.0%) |
| 65 to 74 Years | 1,514 (100.0%) | 0 (0.0%) |
| 75 Years and older | 938 (100.0%) | 0 (0.0%) |
| Total | 12,597 (99.4%) | 83 (0.6%) |
Health Insurance Coverage by Citizenship Status in Manorville

| Citizenship Status | With Coverage | Without Coverage |
| Native Born | 650 (100.0%) | 0 (0.0%) |
| Foreign Born, Citizen | 2,000 (100.0%) | 0 (0.0%) |
| Foreign Born, not a Citizen | 722 (97.8%) | 16 (2.2%) |
Health Insurance Coverage by Household Income in Manorville
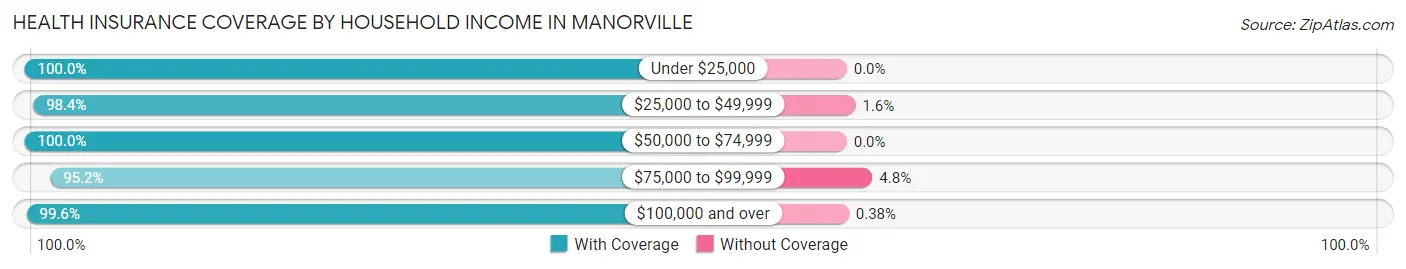
| Household Income | With Coverage | Without Coverage |
| Under $25,000 | 1,103 (100.0%) | 0 (0.0%) |
| $25,000 to $49,999 | 973 (98.4%) | 16 (1.6%) |
| $50,000 to $74,999 | 874 (100.0%) | 0 (0.0%) |
| $75,000 to $99,999 | 654 (95.2%) | 33 (4.8%) |
| $100,000 and over | 8,891 (99.6%) | 34 (0.4%) |
Public vs Private Health Insurance Coverage by Age in Manorville
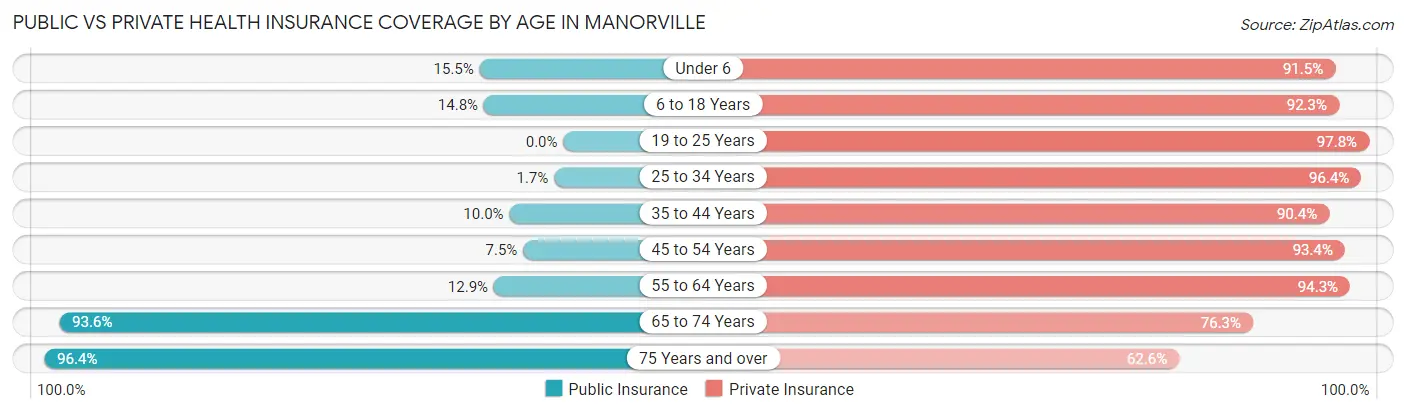
| Age Bracket | Public Insurance | Private Insurance |
| Under 6 | 101 (15.5%) | 595 (91.5%) |
| 6 to 18 Years | 295 (14.7%) | 1,845 (92.2%) |
| 19 to 25 Years | 0 (0.0%) | 722 (97.8%) |
| 25 to 34 Years | 18 (1.7%) | 1,016 (96.4%) |
| 35 to 44 Years | 115 (10.0%) | 1,039 (90.4%) |
| 45 to 54 Years | 149 (7.4%) | 1,866 (93.3%) |
| 55 to 64 Years | 340 (12.9%) | 2,488 (94.3%) |
| 65 to 74 Years | 1,417 (93.6%) | 1,155 (76.3%) |
| 75 Years and over | 904 (96.4%) | 587 (62.6%) |
| Total | 3,339 (26.3%) | 11,313 (89.2%) |
Disability Status by Sex by Age in Manorville
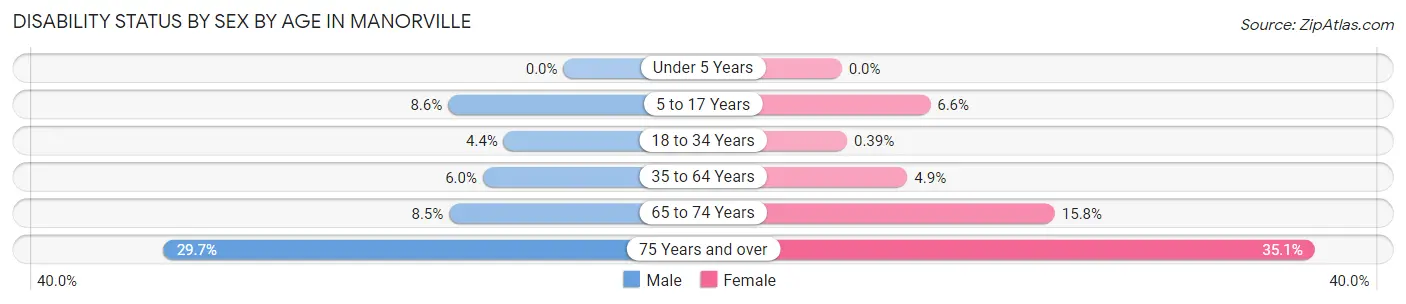
| Age Bracket | Male | Female |
| Under 5 Years | 0 (0.0%) | 0 (0.0%) |
| 5 to 17 Years | 83 (8.6%) | 57 (6.6%) |
| 18 to 34 Years | 44 (4.4%) | 4 (0.4%) |
| 35 to 64 Years | 179 (6.0%) | 136 (4.9%) |
| 65 to 74 Years | 63 (8.5%) | 122 (15.8%) |
| 75 Years and over | 116 (29.7%) | 192 (35.1%) |
Disability Class by Sex by Age in Manorville
Disability Class: Hearing Difficulty
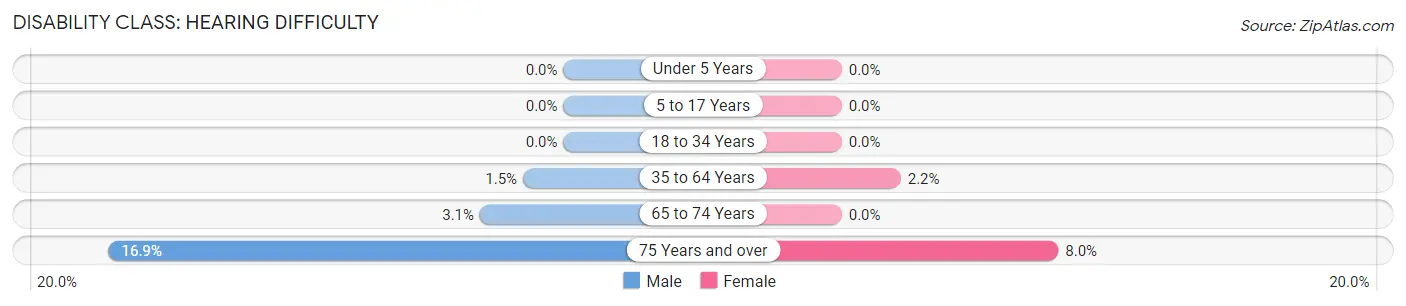
| Age Bracket | Male | Female |
| Under 5 Years | 0 (0.0%) | 0 (0.0%) |
| 5 to 17 Years | 0 (0.0%) | 0 (0.0%) |
| 18 to 34 Years | 0 (0.0%) | 0 (0.0%) |
| 35 to 64 Years | 45 (1.5%) | 61 (2.2%) |
| 65 to 74 Years | 23 (3.1%) | 0 (0.0%) |
| 75 Years and over | 66 (16.9%) | 44 (8.0%) |
Disability Class: Vision Difficulty
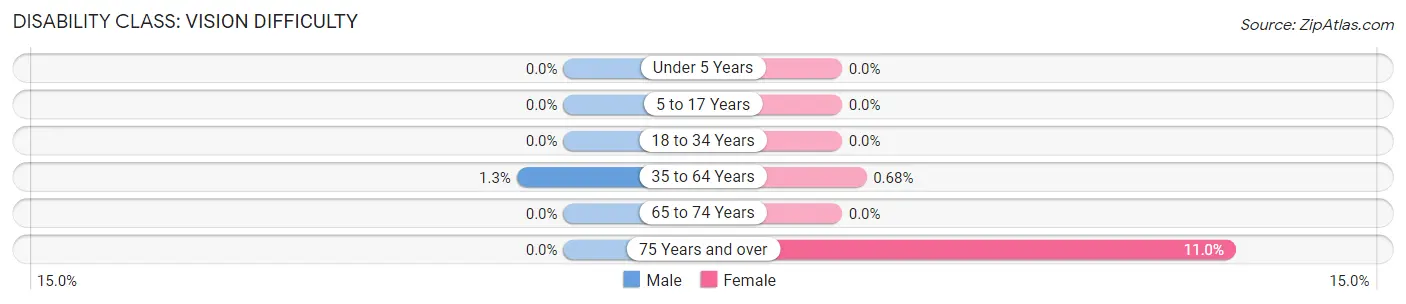
| Age Bracket | Male | Female |
| Under 5 Years | 0 (0.0%) | 0 (0.0%) |
| 5 to 17 Years | 0 (0.0%) | 0 (0.0%) |
| 18 to 34 Years | 0 (0.0%) | 0 (0.0%) |
| 35 to 64 Years | 39 (1.3%) | 19 (0.7%) |
| 65 to 74 Years | 0 (0.0%) | 0 (0.0%) |
| 75 Years and over | 0 (0.0%) | 60 (11.0%) |
Disability Class: Cognitive Difficulty
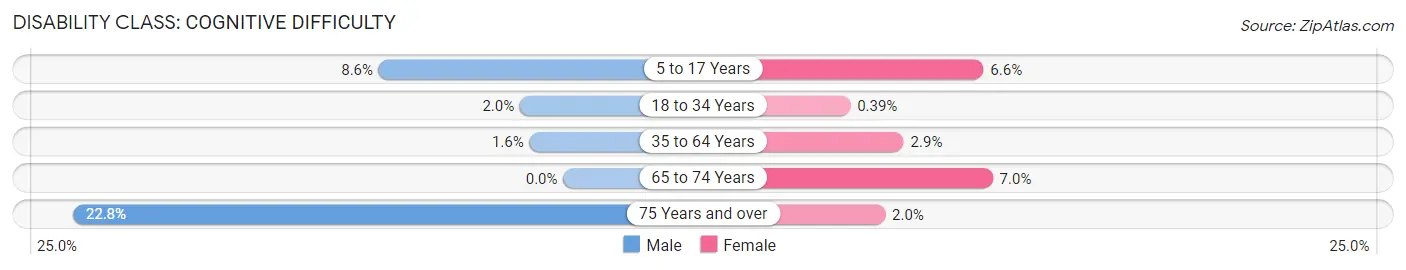
| Age Bracket | Male | Female |
| 5 to 17 Years | 83 (8.6%) | 57 (6.6%) |
| 18 to 34 Years | 20 (2.0%) | 4 (0.4%) |
| 35 to 64 Years | 47 (1.6%) | 80 (2.9%) |
| 65 to 74 Years | 0 (0.0%) | 54 (7.0%) |
| 75 Years and over | 89 (22.8%) | 11 (2.0%) |
Disability Class: Ambulatory Difficulty
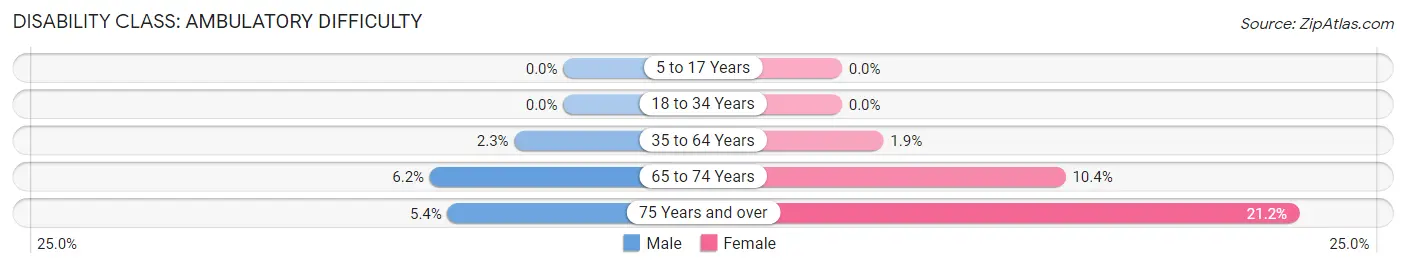
| Age Bracket | Male | Female |
| 5 to 17 Years | 0 (0.0%) | 0 (0.0%) |
| 18 to 34 Years | 0 (0.0%) | 0 (0.0%) |
| 35 to 64 Years | 68 (2.3%) | 54 (1.9%) |
| 65 to 74 Years | 46 (6.2%) | 80 (10.4%) |
| 75 Years and over | 21 (5.4%) | 116 (21.2%) |
Disability Class: Self-Care Difficulty
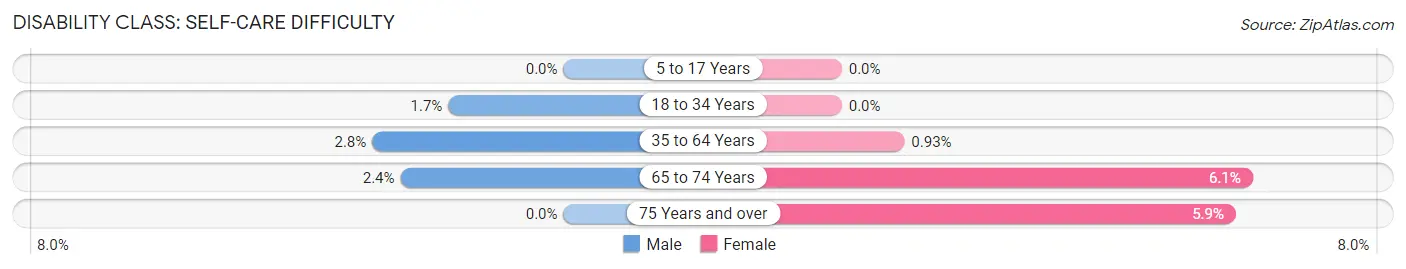
| Age Bracket | Male | Female |
| 5 to 17 Years | 0 (0.0%) | 0 (0.0%) |
| 18 to 34 Years | 17 (1.7%) | 0 (0.0%) |
| 35 to 64 Years | 85 (2.8%) | 26 (0.9%) |
| 65 to 74 Years | 18 (2.4%) | 47 (6.1%) |
| 75 Years and over | 0 (0.0%) | 32 (5.9%) |
Technology Access in Manorville
Computing Device Access in Manorville
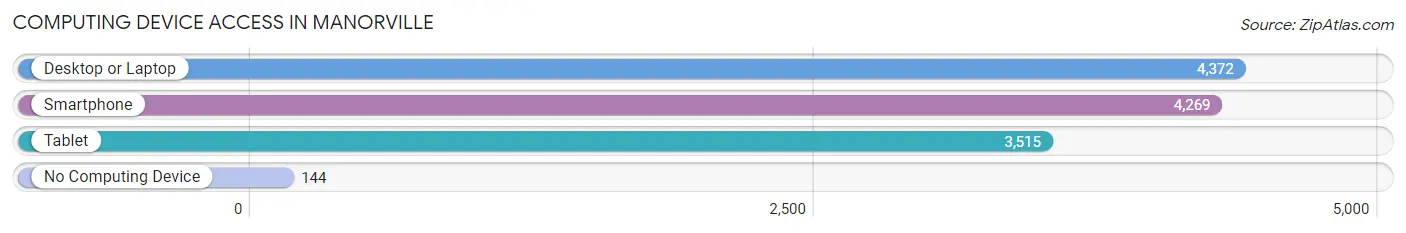
| Device Type | # Households | % Households |
| Desktop or Laptop | 4,372 | 89.3% |
| Smartphone | 4,269 | 87.2% |
| Tablet | 3,515 | 71.8% |
| No Computing Device | 144 | 2.9% |
| Total | 4,896 | 100.0% |
Internet Access in Manorville
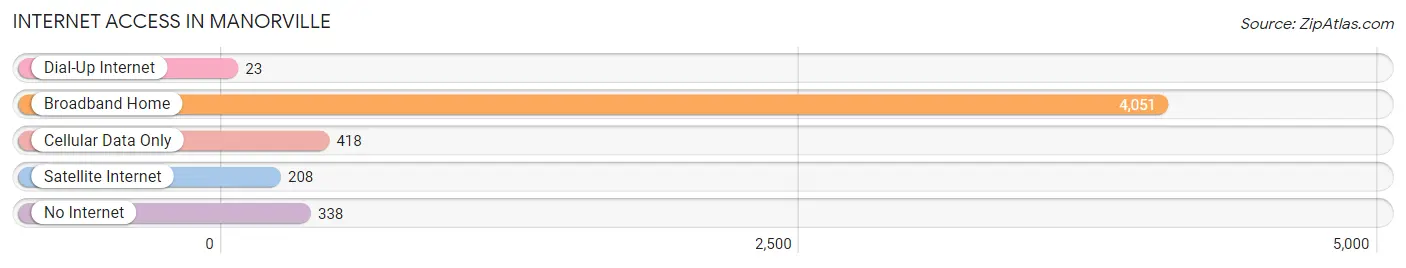
| Internet Type | # Households | % Households |
| Dial-Up Internet | 23 | 0.5% |
| Broadband Home | 4,051 | 82.7% |
| Cellular Data Only | 418 | 8.5% |
| Satellite Internet | 208 | 4.3% |
| No Internet | 338 | 6.9% |
| Total | 4,896 | 100.0% |
Manorville Summary
Manorville is a hamlet located in the Town of Brookhaven in Suffolk County, New York. It is situated on the south shore of Long Island, approximately 70 miles east of New York City. The hamlet is bordered by the hamlets of Eastport to the west, East Moriches to the east, and Calverton to the north.
History
The area that is now Manorville was originally inhabited by the Unkechaug Native American tribe. The first European settlers arrived in the area in the late 1600s, and the hamlet was officially established in 1790. The hamlet was named after the Manor family, who were among the first settlers in the area.
In the late 1800s, Manorville was a popular destination for wealthy New Yorkers looking to escape the hustle and bustle of the city. The hamlet was home to several large estates, including the Manorville Estate, which was owned by the prominent Vanderbilt family.
In the early 1900s, Manorville began to experience a population boom as more and more people moved to the area. The hamlet was home to several farms, and the population continued to grow throughout the 20th century.
Geography
Manorville is located on the south shore of Long Island, approximately 70 miles east of New York City. The hamlet is bordered by the hamlets of Eastport to the west, East Moriches to the east, and Calverton to the north.
The hamlet is situated on the Peconic River, which flows through the area and empties into the Great South Bay. The area is mostly flat, with some rolling hills in the northern part of the hamlet.
Economy
Manorville’s economy is largely based on agriculture and tourism. The hamlet is home to several farms, which produce a variety of crops, including corn, potatoes, and hay. The hamlet is also home to several wineries, which attract tourists from all over the region.
In addition to agriculture and tourism, Manorville is home to several small businesses, including restaurants, retail stores, and professional services. The hamlet is also home to several industrial parks, which provide employment opportunities for local residents.
Demographics
As of the 2010 census, the population of Manorville was 8,169. The population is predominantly white (90.2%), with small percentages of African American (3.2%), Asian (2.7%), and Hispanic (2.3%) residents. The median household income is $87,813, and the median home value is $346,400.
The hamlet is served by the Manorville Central School District, which consists of two elementary schools, one middle school, and one high school. The hamlet is also home to several churches, including the Manorville United Methodist Church and the St. John’s Episcopal Church.
Conclusion
Manorville is a hamlet located in the Town of Brookhaven in Suffolk County, New York. It is situated on the south shore of Long Island, approximately 70 miles east of New York City. The hamlet is bordered by the hamlets of Eastport to the west, East Moriches to the east, and Calverton to the north. The area was originally inhabited by the Unkechaug Native American tribe, and was officially established in 1790. Manorville’s economy is largely based on agriculture and tourism, and the population is predominantly white. The hamlet is served by the Manorville Central School District, and is home to several churches.
Common Questions
What is Per Capita Income in Manorville?
Per Capita income in Manorville is $56,933.
What is the Median Family Income in Manorville?
Median Family Income in Manorville is $146,765.
What is the Median Household income in Manorville?
Median Household Income in Manorville is $126,790.
What is Income or Wage Gap in Manorville?
Income or Wage Gap in Manorville is 34.5%.
Women in Manorville earn 65.5 cents for every dollar earned by a man.
What is Inequality or Gini Index in Manorville?
Inequality or Gini Index in Manorville is 0.41.
What is the Total Population of Manorville?
Total Population of Manorville is 12,681.
What is the Total Male Population of Manorville?
Total Male Population of Manorville is 6,467.
What is the Total Female Population of Manorville?
Total Female Population of Manorville is 6,214.
What is the Ratio of Males per 100 Females in Manorville?
There are 104.07 Males per 100 Females in Manorville.
What is the Ratio of Females per 100 Males in Manorville?
There are 96.09 Females per 100 Males in Manorville.
What is the Median Population Age in Manorville?
Median Population Age in Manorville is 48.7 Years.
What is the Average Family Size in Manorville
Average Family Size in Manorville is 3.1 People.
What is the Average Household Size in Manorville
Average Household Size in Manorville is 2.6 People.
How Large is the Labor Force in Manorville?
There are 6,654 People in the Labor Forcein in Manorville.
What is the Percentage of People in the Labor Force in Manorville?
63.1% of People are in the Labor Force in Manorville.
What is the Unemployment Rate in Manorville?
Unemployment Rate in Manorville is 1.6%.