Manlius, NY Map & Demographics
Manlius Map
Manlius Overview
$43,823
PER CAPITA INCOME
$115,045
AVG FAMILY INCOME
$70,156
AVG HOUSEHOLD INCOME
0.4%
WAGE / INCOME GAP [ % ]
99.6¢/ $1
WAGE / INCOME GAP [ $ ]
$13,133
FAMILY INCOME DEFICIT
0.48
INEQUALITY / GINI INDEX
4,675
TOTAL POPULATION
2,208
MALE POPULATION
2,467
FEMALE POPULATION
89.50
MALES / 100 FEMALES
111.73
FEMALES / 100 MALES
43.1
MEDIAN AGE
2.9
AVG FAMILY SIZE
2.3
AVG HOUSEHOLD SIZE
2,359
LABOR FORCE [ PEOPLE ]
60.7%
PERCENT IN LABOR FORCE
5.8%
UNEMPLOYMENT RATE
Manlius Zip Codes
Manlius Area Codes
Income in Manlius
Income Overview in Manlius
Per Capita Income in Manlius is $43,823, while median incomes of families and households are $115,045 and $70,156 respectively.
| Characteristic | Number | Measure |
| Per Capita Income | 4,675 | $43,823 |
| Median Family Income | 1,328 | $115,045 |
| Mean Family Income | 1,328 | $130,529 |
| Median Household Income | 2,047 | $70,156 |
| Mean Household Income | 2,047 | $100,114 |
| Income Deficit | 1,328 | $13,133 |
| Wage / Income Gap (%) | 4,675 | 0.41% |
| Wage / Income Gap ($) | 4,675 | 99.59¢ per $1 |
| Gini / Inequality Index | 4,675 | 0.48 |
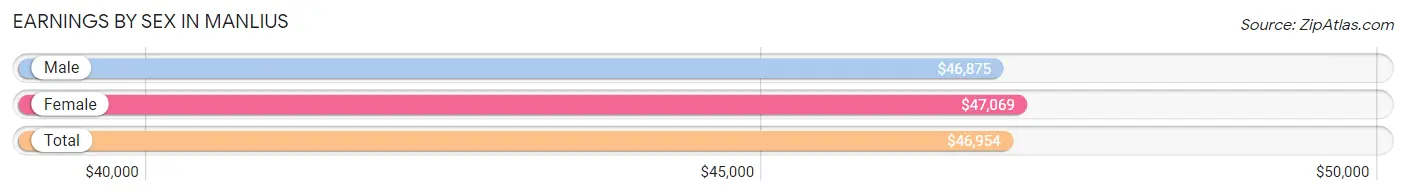
Earnings by Sex in Manlius
Average Earnings in Manlius are $46,954, $46,875 for men and $47,069 for women, a difference of 0.4%.
| Sex | Number | Average Earnings |
| Male | 1,433 (58.2%) | $46,875 |
| Female | 1,030 (41.8%) | $47,069 |
| Total | 2,463 (100.0%) | $46,954 |
Earnings by Sex by Income Bracket in Manlius
The most common earnings brackets in Manlius are $100,000+ for men (349 | 24.3%) and $75,000 to $99,999 for women (146 | 14.2%).

| Income | Male | Female |
| $2,499 or less | 102 (7.1%) | 98 (9.5%) |
| $2,500 to $4,999 | 62 (4.3%) | 10 (1.0%) |
| $5,000 to $7,499 | 0 (0.0%) | 8 (0.8%) |
| $7,500 to $9,999 | 17 (1.2%) | 8 (0.8%) |
| $10,000 to $12,499 | 103 (7.2%) | 16 (1.5%) |
| $12,500 to $14,999 | 17 (1.2%) | 25 (2.4%) |
| $15,000 to $17,499 | 34 (2.4%) | 11 (1.1%) |
| $17,500 to $19,999 | 7 (0.5%) | 140 (13.6%) |
| $20,000 to $22,499 | 34 (2.4%) | 51 (5.0%) |
| $22,500 to $24,999 | 69 (4.8%) | 11 (1.1%) |
| $25,000 to $29,999 | 107 (7.5%) | 7 (0.7%) |
| $30,000 to $34,999 | 35 (2.4%) | 66 (6.4%) |
| $35,000 to $39,999 | 60 (4.2%) | 14 (1.4%) |
| $40,000 to $44,999 | 38 (2.6%) | 26 (2.5%) |
| $45,000 to $49,999 | 42 (2.9%) | 46 (4.5%) |
| $50,000 to $54,999 | 25 (1.7%) | 78 (7.6%) |
| $55,000 to $64,999 | 72 (5.0%) | 115 (11.2%) |
| $65,000 to $74,999 | 98 (6.8%) | 89 (8.6%) |
| $75,000 to $99,999 | 162 (11.3%) | 146 (14.2%) |
| $100,000+ | 349 (24.3%) | 65 (6.3%) |
| Total | 1,433 (100.0%) | 1,030 (100.0%) |
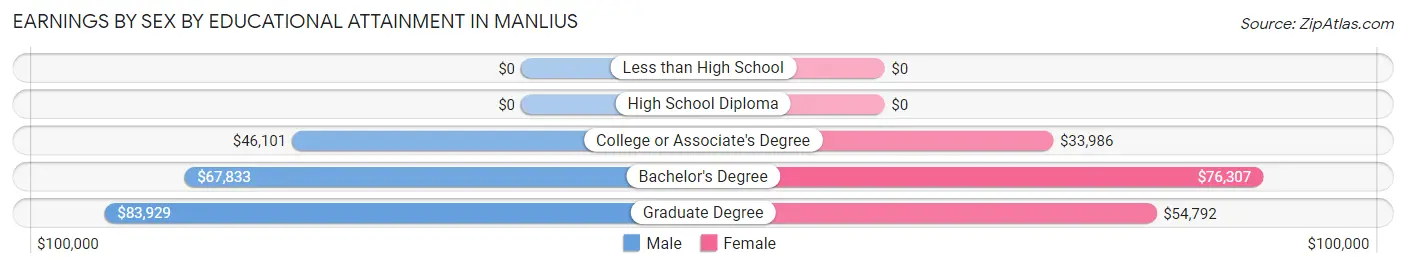
Earnings by Sex by Educational Attainment in Manlius
Average earnings in Manlius are $63,906 for men and $51,481 for women, a difference of 19.4%. Men with an educational attainment of graduate degree enjoy the highest average annual earnings of $83,929, while those with college or associate's degree education earn the least with $46,101. Women with an educational attainment of bachelor's degree earn the most with the average annual earnings of $76,307, while those with college or associate's degree education have the smallest earnings of $33,986.
| Educational Attainment | Male Income | Female Income |
| Less than High School | - | - |
| High School Diploma | - | - |
| College or Associate's Degree | $46,101 | $33,986 |
| Bachelor's Degree | $67,833 | $76,307 |
| Graduate Degree | $83,929 | $54,792 |
| Total | $63,906 | $51,481 |
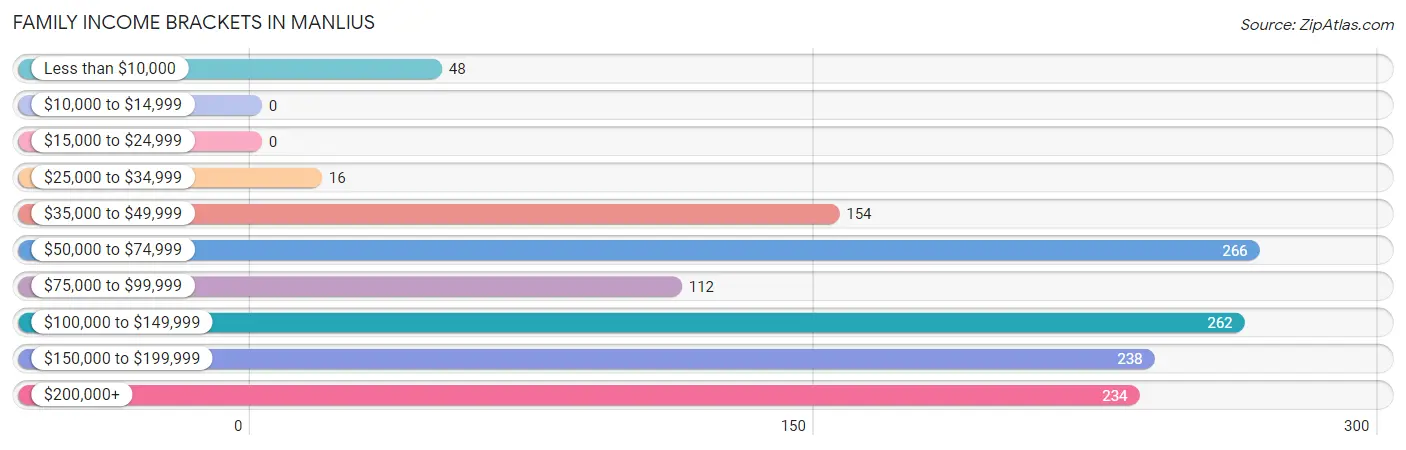
Family Income in Manlius
Family Income Brackets in Manlius
According to the Manlius family income data, there are 266 families falling into the $50,000 to $74,999 income range, which is the most common income bracket and makes up 20.0% of all families.
| Income Bracket | # Families | % Families |
| Less than $10,000 | 48 | 3.6% |
| $10,000 to $14,999 | 0 | 0.0% |
| $15,000 to $24,999 | 0 | 0.0% |
| $25,000 to $34,999 | 16 | 1.2% |
| $35,000 to $49,999 | 154 | 11.6% |
| $50,000 to $74,999 | 266 | 20.0% |
| $75,000 to $99,999 | 112 | 8.4% |
| $100,000 to $149,999 | 262 | 19.7% |
| $150,000 to $199,999 | 238 | 17.9% |
| $200,000+ | 234 | 17.6% |
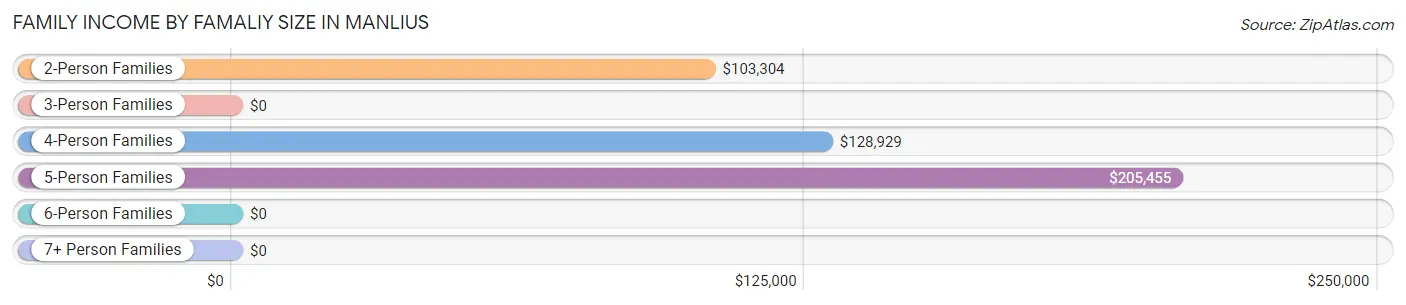
Family Income by Famaliy Size in Manlius
5-person families (78 | 5.9%) account for the highest median family income in Manlius with $205,455 per family, while 2-person families (592 | 44.6%) have the highest median income of $51,652 per family member.
| Income Bracket | # Families | Median Income |
| 2-Person Families | 592 (44.6%) | $103,304 |
| 3-Person Families | 423 (31.9%) | $0 |
| 4-Person Families | 190 (14.3%) | $128,929 |
| 5-Person Families | 78 (5.9%) | $205,455 |
| 6-Person Families | 45 (3.4%) | $0 |
| 7+ Person Families | 0 (0.0%) | $0 |
| Total | 1,328 (100.0%) | $115,045 |
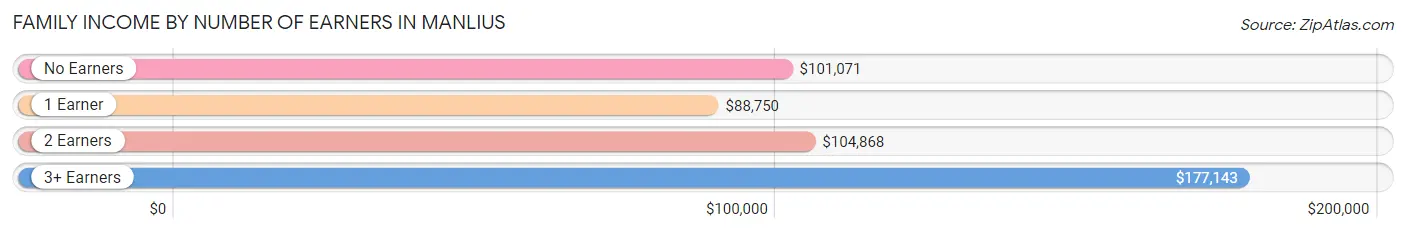
Family Income by Number of Earners in Manlius
The median family income in Manlius is $115,045, with families comprising 3+ earners (148) having the highest median family income of $177,143, while families with 1 earner (416) have the lowest median family income of $88,750, accounting for 11.1% and 31.3% of families, respectively.
| Number of Earners | # Families | Median Income |
| No Earners | 124 (9.3%) | $101,071 |
| 1 Earner | 416 (31.3%) | $88,750 |
| 2 Earners | 640 (48.2%) | $104,868 |
| 3+ Earners | 148 (11.1%) | $177,143 |
| Total | 1,328 (100.0%) | $115,045 |
Household Income in Manlius
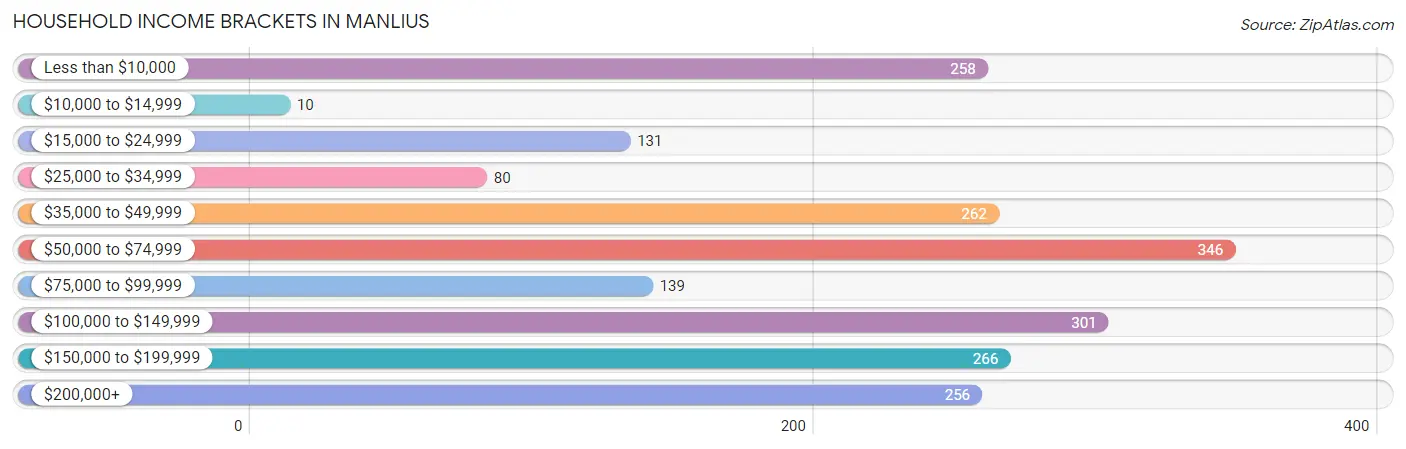
Household Income Brackets in Manlius
With 346 households falling in the category, the $50,000 to $74,999 income range is the most frequent in Manlius, accounting for 16.9% of all households. In contrast, only 10 households (0.5%) fall into the $10,000 to $14,999 income bracket, making it the least populous group.
| Income Bracket | # Households | % Households |
| Less than $10,000 | 258 | 12.6% |
| $10,000 to $14,999 | 10 | 0.5% |
| $15,000 to $24,999 | 131 | 6.4% |
| $25,000 to $34,999 | 80 | 3.9% |
| $35,000 to $49,999 | 262 | 12.8% |
| $50,000 to $74,999 | 346 | 16.9% |
| $75,000 to $99,999 | 139 | 6.8% |
| $100,000 to $149,999 | 301 | 14.7% |
| $150,000 to $199,999 | 266 | 13.0% |
| $200,000+ | 256 | 12.5% |
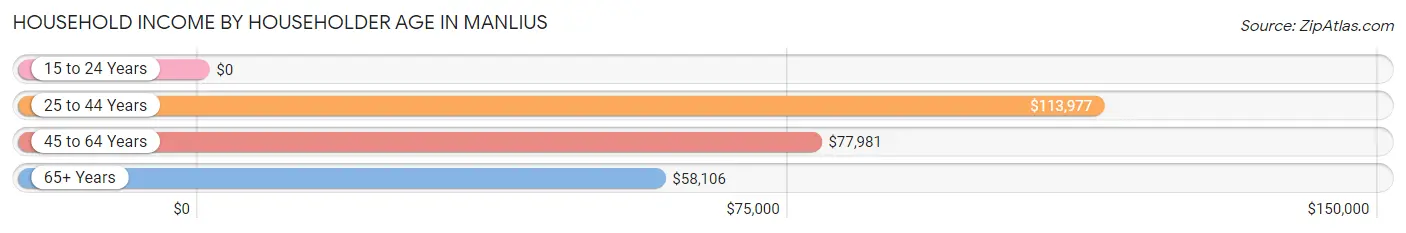
Household Income by Householder Age in Manlius
The median household income in Manlius is $70,156, with the highest median household income of $113,977 found in the 25 to 44 years age bracket for the primary householder. A total of 537 households (26.2%) fall into this category. Meanwhile, the 15 to 24 years age bracket for the primary householder has the lowest median household income of $0, with 38 households (1.9%) in this group.
| Income Bracket | # Households | Median Income |
| 15 to 24 Years | 38 (1.9%) | $0 |
| 25 to 44 Years | 537 (26.2%) | $113,977 |
| 45 to 64 Years | 660 (32.2%) | $77,981 |
| 65+ Years | 812 (39.7%) | $58,106 |
| Total | 2,047 (100.0%) | $70,156 |
Poverty in Manlius
Income Below Poverty by Sex and Age in Manlius
With 7.3% poverty level for males and 9.8% for females among the residents of Manlius, 15 year old males and 55 to 64 year old females are the most vulnerable to poverty, with 13 males (100.0%) and 61 females (21.8%) in their respective age groups living below the poverty level.
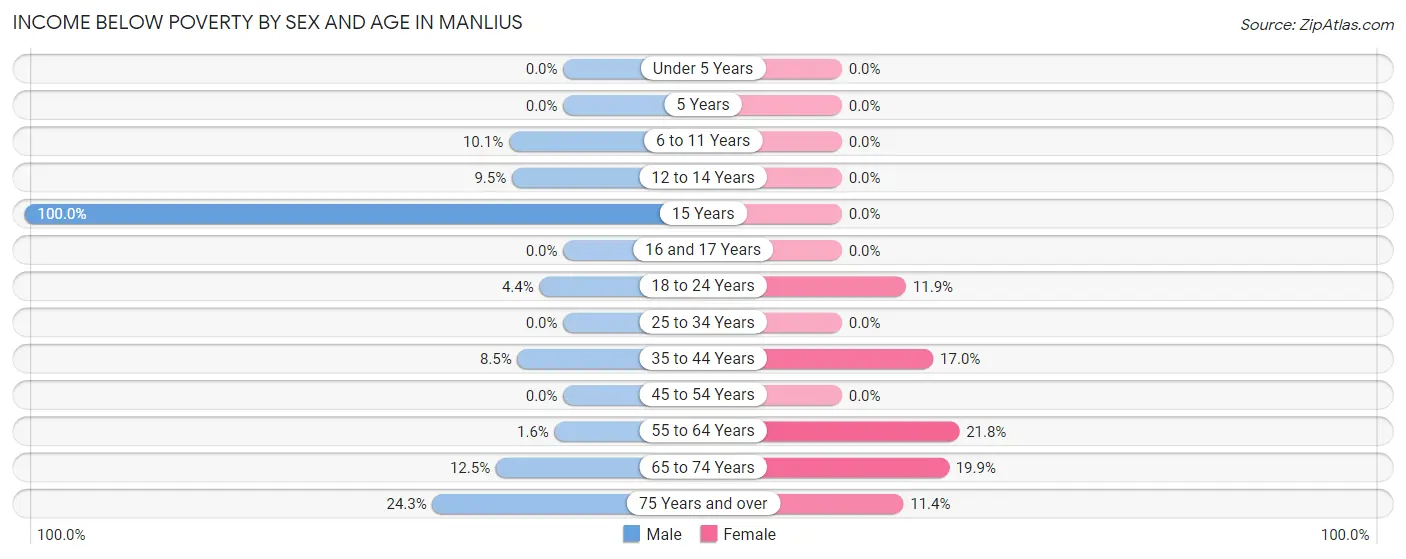
| Age Bracket | Male | Female |
| Under 5 Years | 0 (0.0%) | 0 (0.0%) |
| 5 Years | 0 (0.0%) | 0 (0.0%) |
| 6 to 11 Years | 11 (10.1%) | 0 (0.0%) |
| 12 to 14 Years | 12 (9.5%) | 0 (0.0%) |
| 15 Years | 13 (100.0%) | 0 (0.0%) |
| 16 and 17 Years | 0 (0.0%) | 0 (0.0%) |
| 18 to 24 Years | 11 (4.4%) | 10 (11.9%) |
| 25 to 34 Years | 0 (0.0%) | 0 (0.0%) |
| 35 to 44 Years | 26 (8.5%) | 57 (17.0%) |
| 45 to 54 Years | 0 (0.0%) | 0 (0.0%) |
| 55 to 64 Years | 4 (1.6%) | 61 (21.8%) |
| 65 to 74 Years | 17 (12.5%) | 78 (19.9%) |
| 75 Years and over | 67 (24.3%) | 33 (11.4%) |
| Total | 161 (7.3%) | 239 (9.8%) |
Income Above Poverty by Sex and Age in Manlius
According to the poverty statistics in Manlius, males aged under 5 years and females aged under 5 years are the age groups that are most secure financially, with 100.0% of males and 100.0% of females in these age groups living above the poverty line.
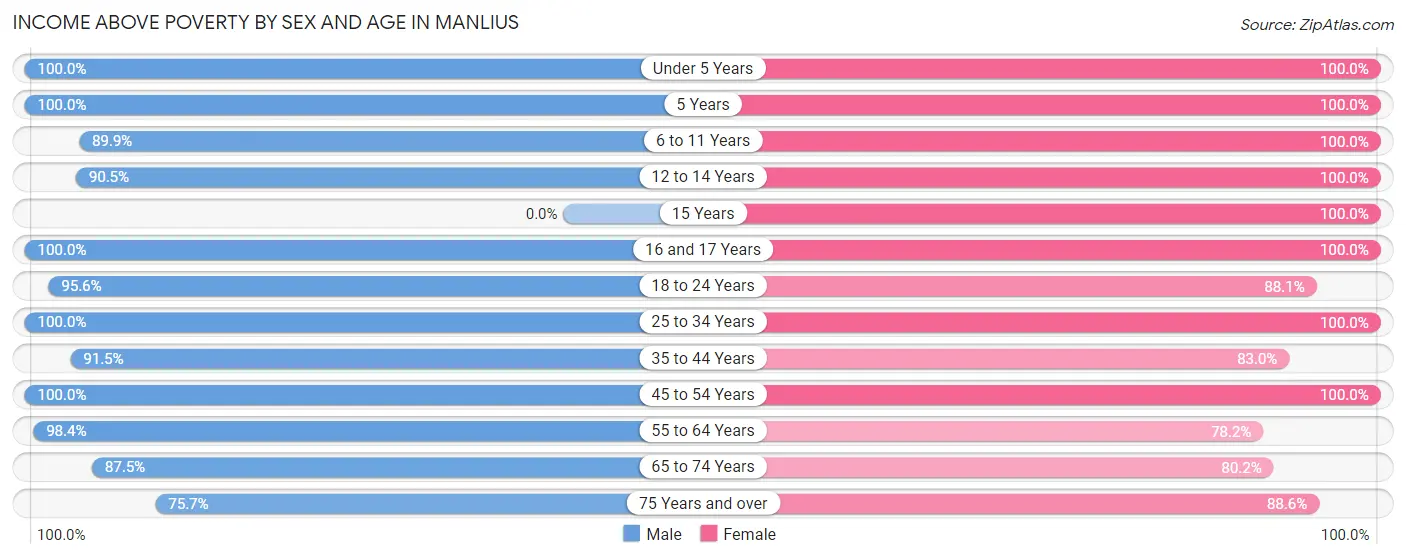
| Age Bracket | Male | Female |
| Under 5 Years | 89 (100.0%) | 119 (100.0%) |
| 5 Years | 19 (100.0%) | 33 (100.0%) |
| 6 to 11 Years | 98 (89.9%) | 120 (100.0%) |
| 12 to 14 Years | 114 (90.5%) | 119 (100.0%) |
| 15 Years | 0 (0.0%) | 33 (100.0%) |
| 16 and 17 Years | 80 (100.0%) | 76 (100.0%) |
| 18 to 24 Years | 238 (95.6%) | 74 (88.1%) |
| 25 to 34 Years | 321 (100.0%) | 260 (100.0%) |
| 35 to 44 Years | 280 (91.5%) | 279 (83.0%) |
| 45 to 54 Years | 236 (100.0%) | 304 (100.0%) |
| 55 to 64 Years | 244 (98.4%) | 219 (78.2%) |
| 65 to 74 Years | 119 (87.5%) | 315 (80.1%) |
| 75 Years and over | 209 (75.7%) | 256 (88.6%) |
| Total | 2,047 (92.7%) | 2,207 (90.2%) |
Income Below Poverty Among Married-Couple Families in Manlius
The poverty statistics for married-couple families in Manlius show that 5.6% or 48 of the total 862 families live below the poverty line. Families with 3 or 4 children have the highest poverty rate of 11.8%, comprising of 11 families. On the other hand, families with 1 or 2 children have the lowest poverty rate of 0.0%, which includes 0 families.
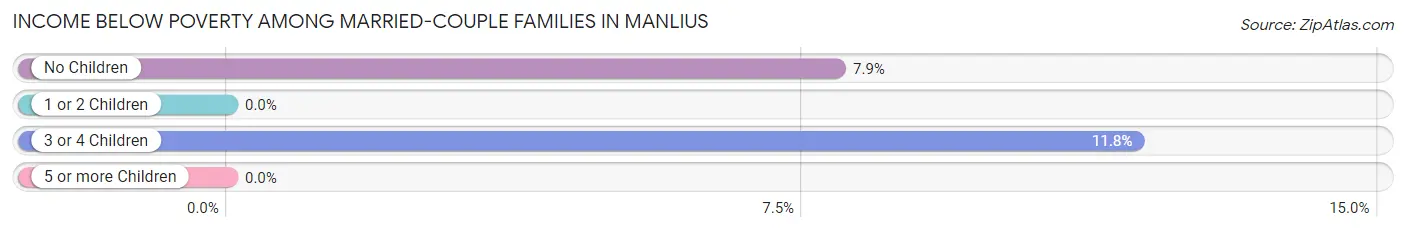
| Children | Above Poverty | Below Poverty |
| No Children | 429 (92.1%) | 37 (7.9%) |
| 1 or 2 Children | 303 (100.0%) | 0 (0.0%) |
| 3 or 4 Children | 82 (88.2%) | 11 (11.8%) |
| 5 or more Children | 0 (0.0%) | 0 (0.0%) |
| Total | 814 (94.4%) | 48 (5.6%) |
Income Below Poverty Among Single-Parent Households in Manlius
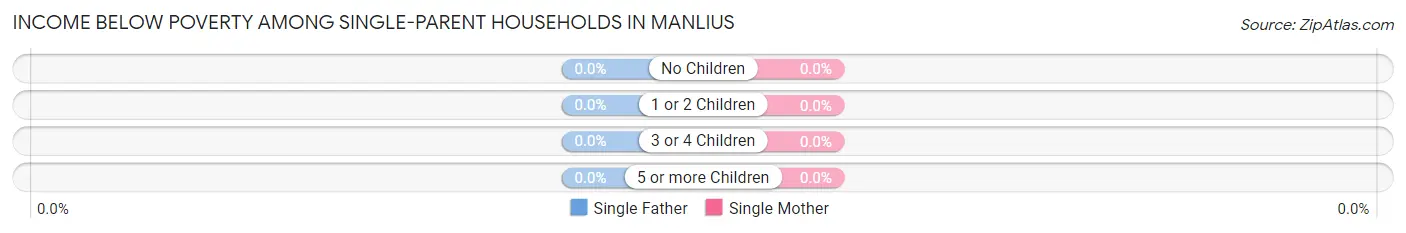
| Children | Single Father | Single Mother |
| No Children | 0 (0.0%) | 0 (0.0%) |
| 1 or 2 Children | 0 (0.0%) | 0 (0.0%) |
| 3 or 4 Children | 0 (0.0%) | 0 (0.0%) |
| 5 or more Children | 0 (0.0%) | 0 (0.0%) |
| Total | 0 (0.0%) | 0 (0.0%) |
Income Below Poverty Among Married-Couple vs Single-Parent Households in Manlius
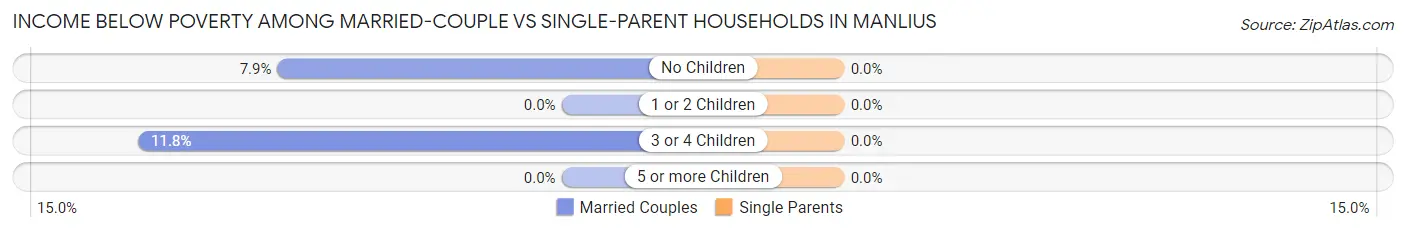
| Children | Married-Couple Families | Single-Parent Households |
| No Children | 37 (7.9%) | 0 (0.0%) |
| 1 or 2 Children | 0 (0.0%) | 0 (0.0%) |
| 3 or 4 Children | 11 (11.8%) | 0 (0.0%) |
| 5 or more Children | 0 (0.0%) | 0 (0.0%) |
| Total | 48 (5.6%) | 0 (0.0%) |
Race in Manlius
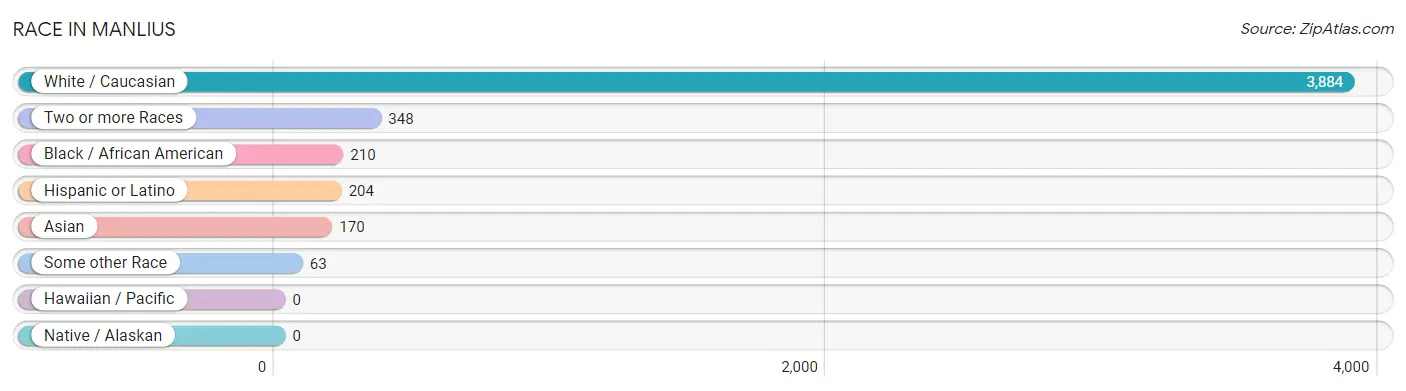
The most populous races in Manlius are White / Caucasian (3,884 | 83.1%), Two or more Races (348 | 7.4%), and Black / African American (210 | 4.5%).
| Race | # Population | % Population |
| Asian | 170 | 3.6% |
| Black / African American | 210 | 4.5% |
| Hawaiian / Pacific | 0 | 0.0% |
| Hispanic or Latino | 204 | 4.4% |
| Native / Alaskan | 0 | 0.0% |
| White / Caucasian | 3,884 | 83.1% |
| Two or more Races | 348 | 7.4% |
| Some other Race | 63 | 1.3% |
| Total | 4,675 | 100.0% |
Ancestry in Manlius
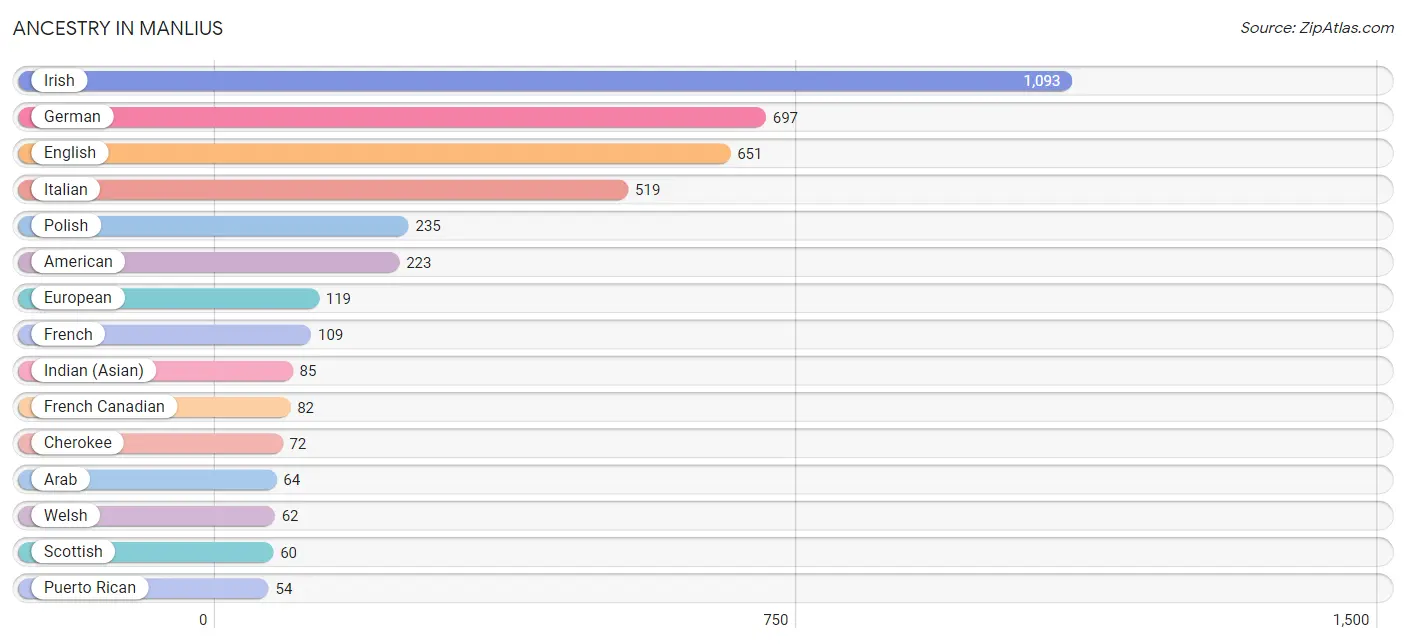
The most populous ancestries reported in Manlius are Irish (1,093 | 23.4%), German (697 | 14.9%), English (651 | 13.9%), Italian (519 | 11.1%), and Polish (235 | 5.0%), together accounting for 68.3% of all Manlius residents.
| Ancestry | # Population | % Population |
| African | 31 | 0.7% |
| American | 223 | 4.8% |
| Arab | 64 | 1.4% |
| Austrian | 37 | 0.8% |
| Bhutanese | 17 | 0.4% |
| Bolivian | 10 | 0.2% |
| British | 10 | 0.2% |
| Burmese | 19 | 0.4% |
| Celtic | 9 | 0.2% |
| Central American | 39 | 0.8% |
| Cherokee | 72 | 1.5% |
| Cuban | 5 | 0.1% |
| Czech | 31 | 0.7% |
| Danish | 6 | 0.1% |
| Dutch | 23 | 0.5% |
| Eastern European | 33 | 0.7% |
| English | 651 | 13.9% |
| European | 119 | 2.5% |
| Filipino | 1 | 0.0% |
| Finnish | 5 | 0.1% |
| French | 109 | 2.3% |
| French Canadian | 82 | 1.8% |
| German | 697 | 14.9% |
| Greek | 52 | 1.1% |
| Guatemalan | 39 | 0.8% |
| Hungarian | 10 | 0.2% |
| Indian (Asian) | 85 | 1.8% |
| Irish | 1,093 | 23.4% |
| Iroquois | 9 | 0.2% |
| Italian | 519 | 11.1% |
| Jamaican | 45 | 1.0% |
| Korean | 25 | 0.5% |
| Laotian | 29 | 0.6% |
| Lebanese | 30 | 0.6% |
| Lithuanian | 25 | 0.5% |
| Mexican | 47 | 1.0% |
| Osage | 20 | 0.4% |
| Palestinian | 36 | 0.8% |
| Polish | 235 | 5.0% |
| Puerto Rican | 54 | 1.2% |
| Russian | 7 | 0.2% |
| Scotch-Irish | 11 | 0.2% |
| Scottish | 60 | 1.3% |
| Slavic | 27 | 0.6% |
| Slovak | 10 | 0.2% |
| South American | 10 | 0.2% |
| Spanish | 47 | 1.0% |
| Subsaharan African | 31 | 0.7% |
| Swedish | 4 | 0.1% |
| Swiss | 18 | 0.4% |
| Thai | 32 | 0.7% |
| Welsh | 62 | 1.3% |
| Yugoslavian | 22 | 0.5% | View All 53 Rows |
Immigrants in Manlius
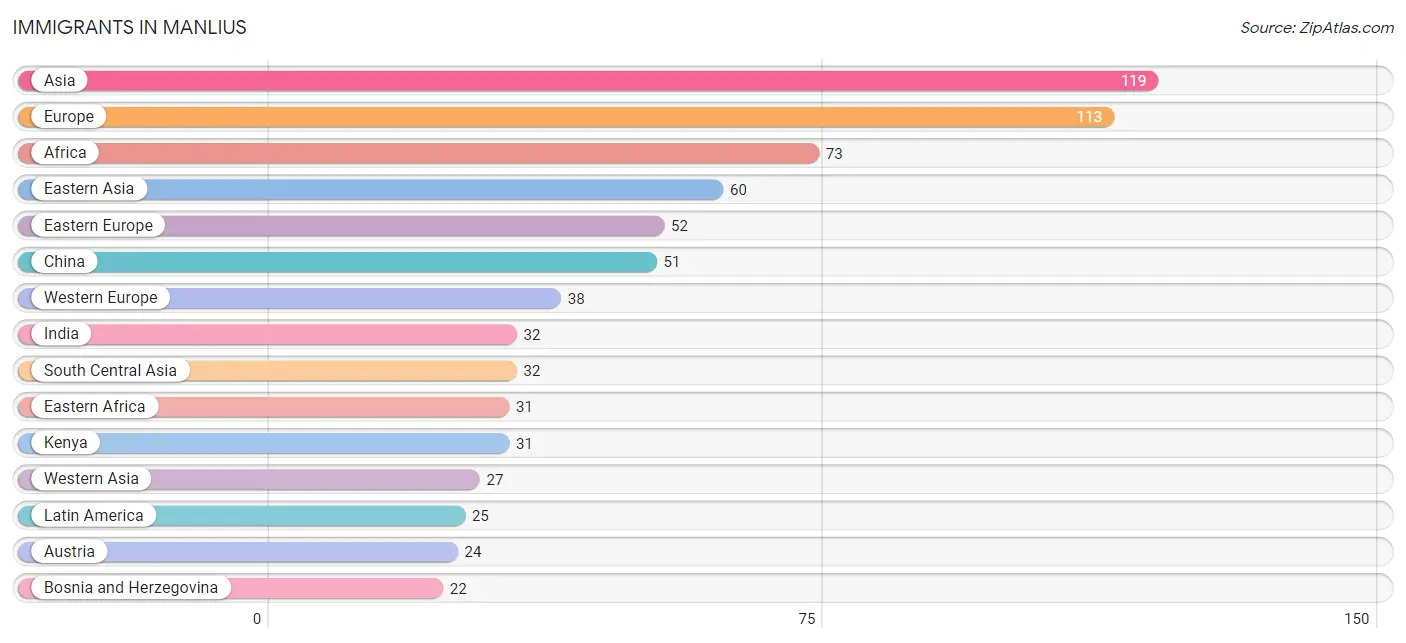
The most numerous immigrant groups reported in Manlius came from Asia (119 | 2.5%), Europe (113 | 2.4%), Africa (73 | 1.6%), Eastern Asia (60 | 1.3%), and Eastern Europe (52 | 1.1%), together accounting for 8.9% of all Manlius residents.
| Immigration Origin | # Population | % Population |
| Africa | 73 | 1.6% |
| Asia | 119 | 2.5% |
| Austria | 24 | 0.5% |
| Belgium | 14 | 0.3% |
| Bolivia | 10 | 0.2% |
| Bosnia and Herzegovina | 22 | 0.5% |
| Canada | 22 | 0.5% |
| Central America | 15 | 0.3% |
| China | 51 | 1.1% |
| Czechoslovakia | 16 | 0.3% |
| Eastern Africa | 31 | 0.7% |
| Eastern Asia | 60 | 1.3% |
| Eastern Europe | 52 | 1.1% |
| England | 7 | 0.2% |
| Europe | 113 | 2.4% |
| Guatemala | 15 | 0.3% |
| Hong Kong | 19 | 0.4% |
| India | 32 | 0.7% |
| Iraq | 14 | 0.3% |
| Israel | 13 | 0.3% |
| Italy | 16 | 0.3% |
| Kenya | 31 | 0.7% |
| Korea | 9 | 0.2% |
| Latin America | 25 | 0.5% |
| Northern Europe | 7 | 0.2% |
| Russia | 14 | 0.3% |
| South America | 10 | 0.2% |
| South Central Asia | 32 | 0.7% |
| Southern Europe | 16 | 0.3% |
| Taiwan | 12 | 0.3% |
| Western Asia | 27 | 0.6% |
| Western Europe | 38 | 0.8% | View All 32 Rows |
Sex and Age in Manlius
Sex and Age in Manlius
The most populous age groups in Manlius are 15 to 19 Years (200 | 9.1%) for men and 65 to 69 Years (229 | 9.3%) for women.
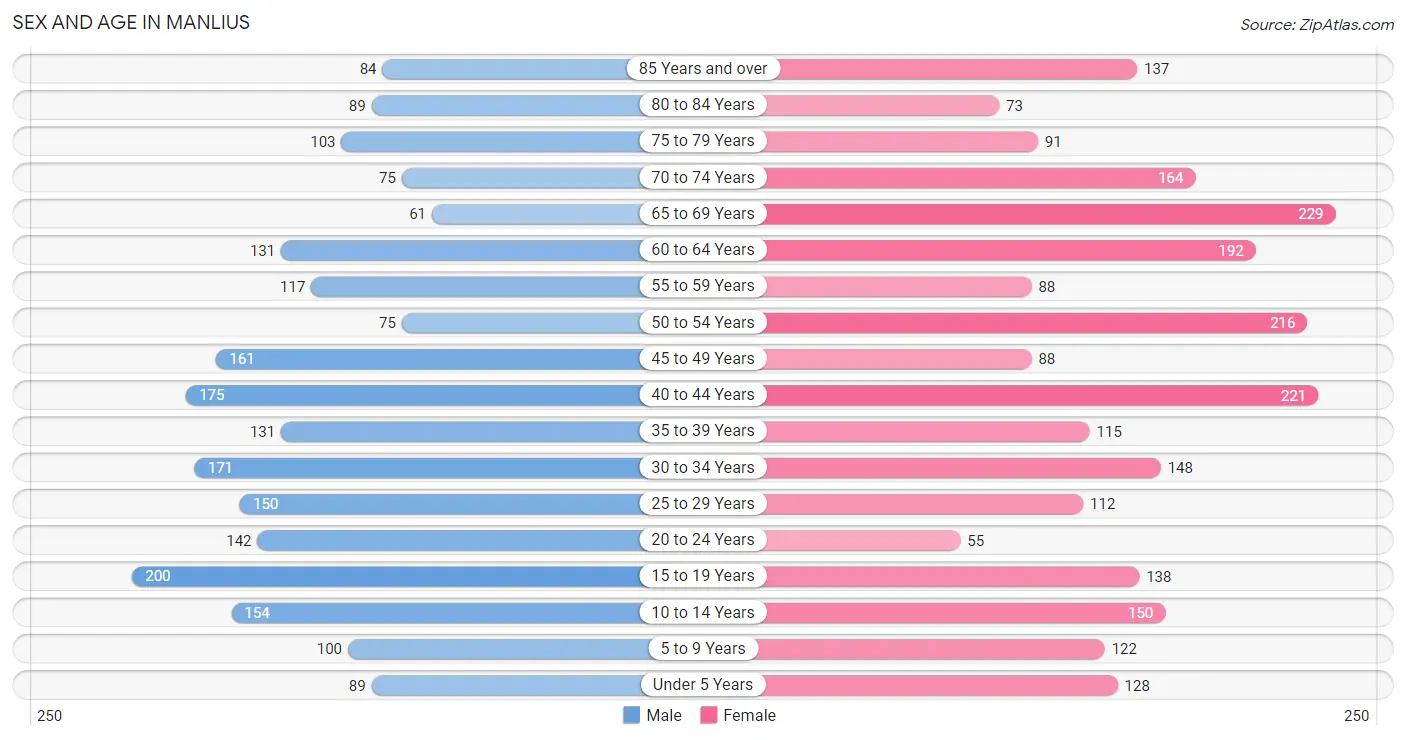
| Age Bracket | Male | Female |
| Under 5 Years | 89 (4.0%) | 128 (5.2%) |
| 5 to 9 Years | 100 (4.5%) | 122 (5.0%) |
| 10 to 14 Years | 154 (7.0%) | 150 (6.1%) |
| 15 to 19 Years | 200 (9.1%) | 138 (5.6%) |
| 20 to 24 Years | 142 (6.4%) | 55 (2.2%) |
| 25 to 29 Years | 150 (6.8%) | 112 (4.5%) |
| 30 to 34 Years | 171 (7.7%) | 148 (6.0%) |
| 35 to 39 Years | 131 (5.9%) | 115 (4.7%) |
| 40 to 44 Years | 175 (7.9%) | 221 (9.0%) |
| 45 to 49 Years | 161 (7.3%) | 88 (3.6%) |
| 50 to 54 Years | 75 (3.4%) | 216 (8.8%) |
| 55 to 59 Years | 117 (5.3%) | 88 (3.6%) |
| 60 to 64 Years | 131 (5.9%) | 192 (7.8%) |
| 65 to 69 Years | 61 (2.8%) | 229 (9.3%) |
| 70 to 74 Years | 75 (3.4%) | 164 (6.7%) |
| 75 to 79 Years | 103 (4.7%) | 91 (3.7%) |
| 80 to 84 Years | 89 (4.0%) | 73 (3.0%) |
| 85 Years and over | 84 (3.8%) | 137 (5.6%) |
| Total | 2,208 (100.0%) | 2,467 (100.0%) |
Families and Households in Manlius
Median Family Size in Manlius
The median family size in Manlius is 2.86 persons per family, with married-couple families (862 | 64.9%) accounting for the largest median family size of 3.1 persons per family. On the other hand, single female/mother families (360 | 27.1%) represent the smallest median family size with 2.40 persons per family.
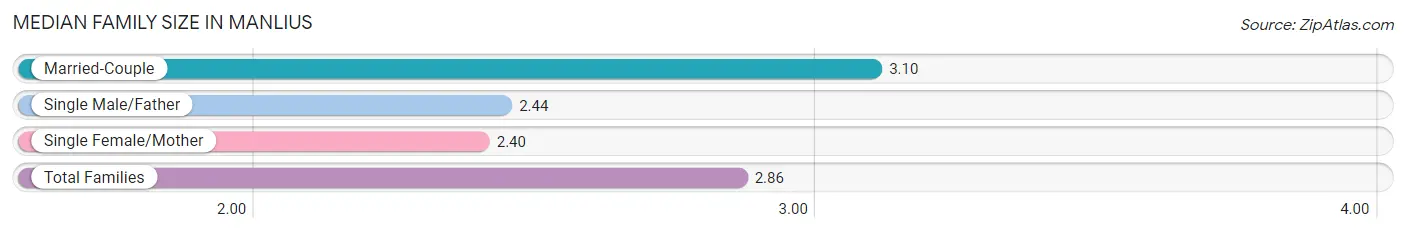
| Family Type | # Families | Family Size |
| Married-Couple | 862 (64.9%) | 3.10 |
| Single Male/Father | 106 (8.0%) | 2.44 |
| Single Female/Mother | 360 (27.1%) | 2.40 |
| Total Families | 1,328 (100.0%) | 2.86 |
Median Household Size in Manlius
The median household size in Manlius is 2.27 persons per household, with married-couple households (862 | 42.1%) accounting for the largest median household size of 3.1 persons per household. non-family households (719 | 35.1%) represent the smallest median household size with 1.13 persons per household.
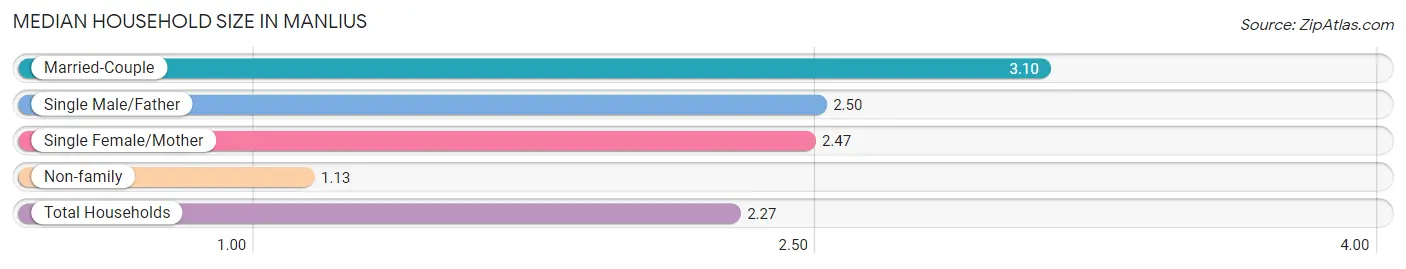
| Household Type | # Households | Household Size |
| Married-Couple | 862 (42.1%) | 3.10 |
| Single Male/Father | 106 (5.2%) | 2.50 |
| Single Female/Mother | 360 (17.6%) | 2.47 |
| Non-family | 719 (35.1%) | 1.13 |
| Total Households | 2,047 (100.0%) | 2.27 |
Household Size by Marriage Status in Manlius
Out of a total of 2,047 households in Manlius, 1,328 (64.9%) are family households, while 719 (35.1%) are nonfamily households. The most numerous type of family households are 2-person households, comprising 562, and the most common type of nonfamily households are 1-person households, comprising 630.
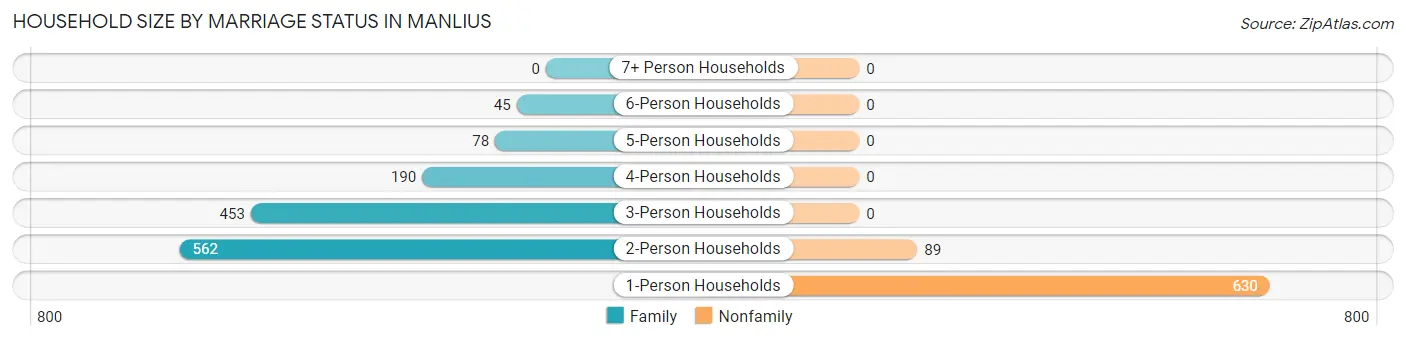
| Household Size | Family Households | Nonfamily Households |
| 1-Person Households | - | 630 (30.8%) |
| 2-Person Households | 562 (27.5%) | 89 (4.3%) |
| 3-Person Households | 453 (22.1%) | 0 (0.0%) |
| 4-Person Households | 190 (9.3%) | 0 (0.0%) |
| 5-Person Households | 78 (3.8%) | 0 (0.0%) |
| 6-Person Households | 45 (2.2%) | 0 (0.0%) |
| 7+ Person Households | 0 (0.0%) | 0 (0.0%) |
| Total | 1,328 (64.9%) | 719 (35.1%) |
Female Fertility in Manlius
Fertility by Age in Manlius
Average fertility rate in Manlius is 78.0 births per 1,000 women. Women in the age bracket of 20 to 34 years have the highest fertility rate with 133.0 births per 1,000 women. Women in the age bracket of 20 to 34 years acount for 60.9% of all women with births.
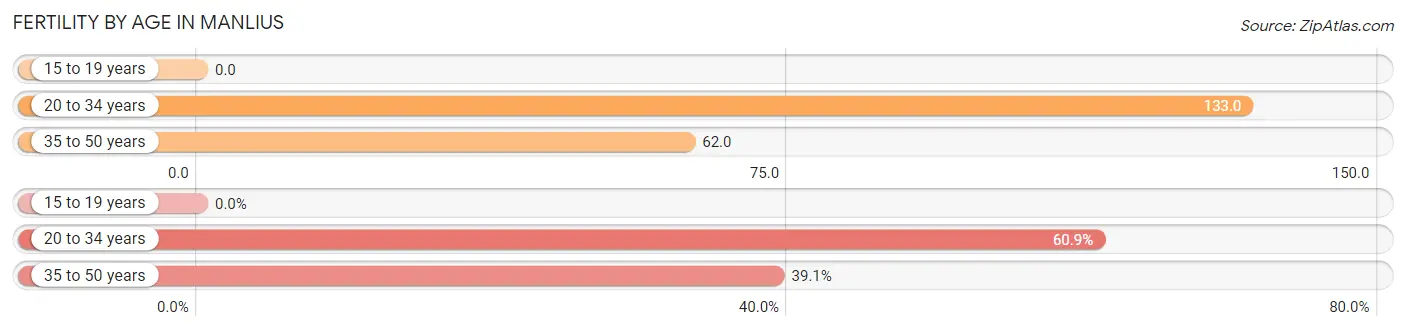
| Age Bracket | Women with Births | Births / 1,000 Women |
| 15 to 19 years | 0 (0.0%) | 0.0 |
| 20 to 34 years | 42 (60.9%) | 133.0 |
| 35 to 50 years | 27 (39.1%) | 62.0 |
| Total | 69 (100.0%) | 78.0 |
Fertility by Age by Marriage Status in Manlius
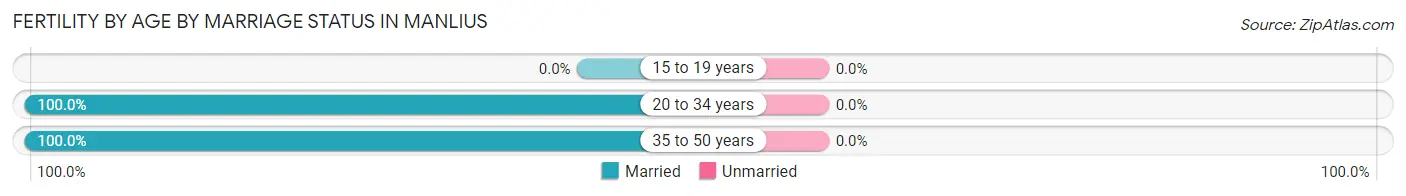
| Age Bracket | Married | Unmarried |
| 15 to 19 years | 0 (0.0%) | 0 (0.0%) |
| 20 to 34 years | 42 (100.0%) | 0 (0.0%) |
| 35 to 50 years | 27 (100.0%) | 0 (0.0%) |
| Total | 69 (100.0%) | 0 (0.0%) |
Fertility by Education in Manlius
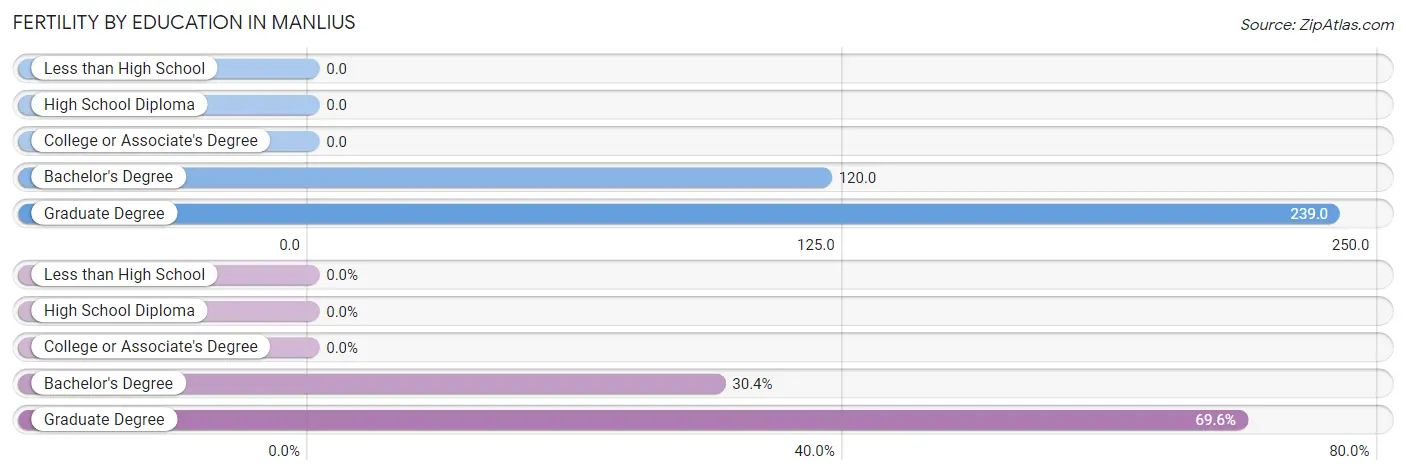
| Educational Attainment | Women with Births | Births / 1,000 Women |
| Less than High School | 0 (0.0%) | 0.0 |
| High School Diploma | 0 (0.0%) | 0.0 |
| College or Associate's Degree | 0 (0.0%) | 0.0 |
| Bachelor's Degree | 21 (30.4%) | 120.0 |
| Graduate Degree | 48 (69.6%) | 239.0 |
| Total | 69 (100.0%) | 78.0 |
Fertility by Education by Marriage Status in Manlius
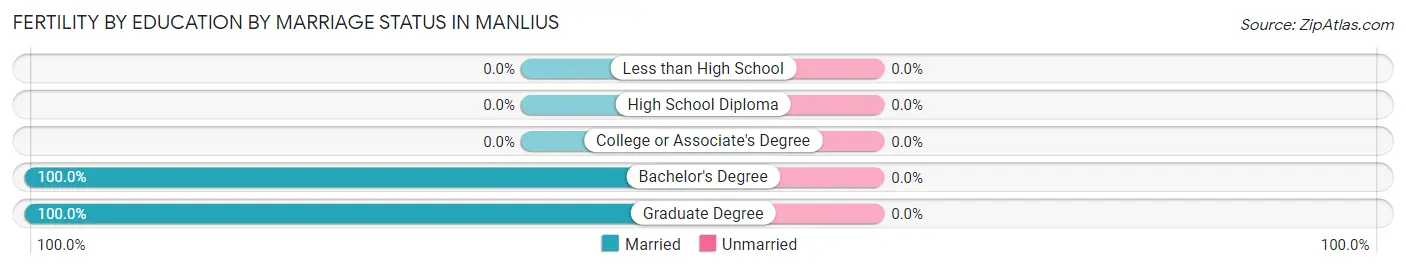
| Educational Attainment | Married | Unmarried |
| Less than High School | 0 (0.0%) | 0 (0.0%) |
| High School Diploma | 0 (0.0%) | 0 (0.0%) |
| College or Associate's Degree | 0 (0.0%) | 0 (0.0%) |
| Bachelor's Degree | 21 (100.0%) | 0 (0.0%) |
| Graduate Degree | 48 (100.0%) | 0 (0.0%) |
| Total | 69 (100.0%) | 0 (0.0%) |
Employment Characteristics in Manlius
Employment by Class of Employer in Manlius
Among the 2,187 employed individuals in Manlius, private company employees (1,206 | 55.1%), not-for-profit organizations (321 | 14.7%), and local government employees (200 | 9.1%) make up the most common classes of employment.
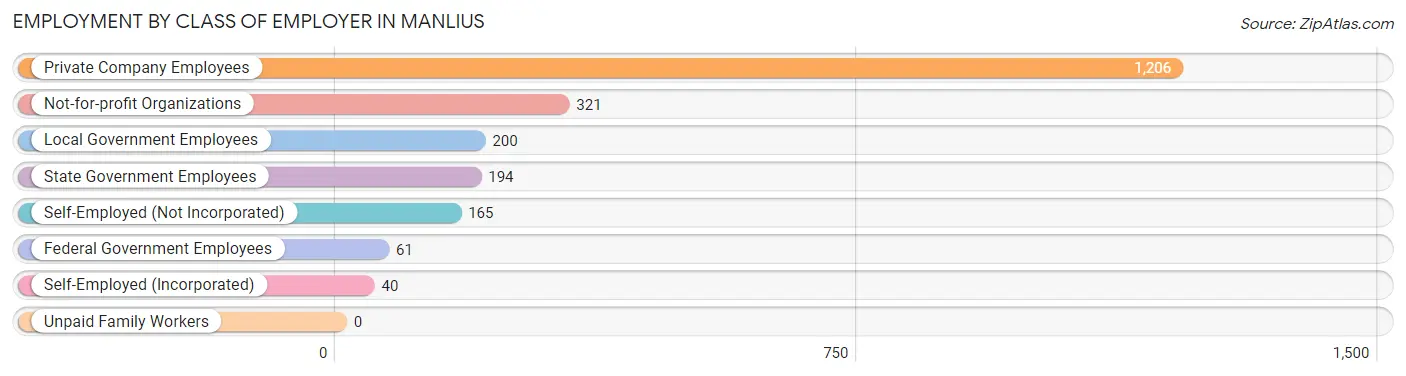
| Employer Class | # Employees | % Employees |
| Private Company Employees | 1,206 | 55.1% |
| Self-Employed (Incorporated) | 40 | 1.8% |
| Self-Employed (Not Incorporated) | 165 | 7.5% |
| Not-for-profit Organizations | 321 | 14.7% |
| Local Government Employees | 200 | 9.1% |
| State Government Employees | 194 | 8.9% |
| Federal Government Employees | 61 | 2.8% |
| Unpaid Family Workers | 0 | 0.0% |
| Total | 2,187 | 100.0% |
Employment Status by Age in Manlius
According to the labor force statistics for Manlius, out of the total population over 16 years of age (3,886), 60.7% or 2,359 individuals are in the labor force, with 5.8% or 137 of them unemployed. The age group with the highest labor force participation rate is 25 to 29 years, with 95.8% or 251 individuals in the labor force. Within the labor force, the 16 to 19 years age range has the highest percentage of unemployed individuals, with 46.9% or 92 of them being unemployed.
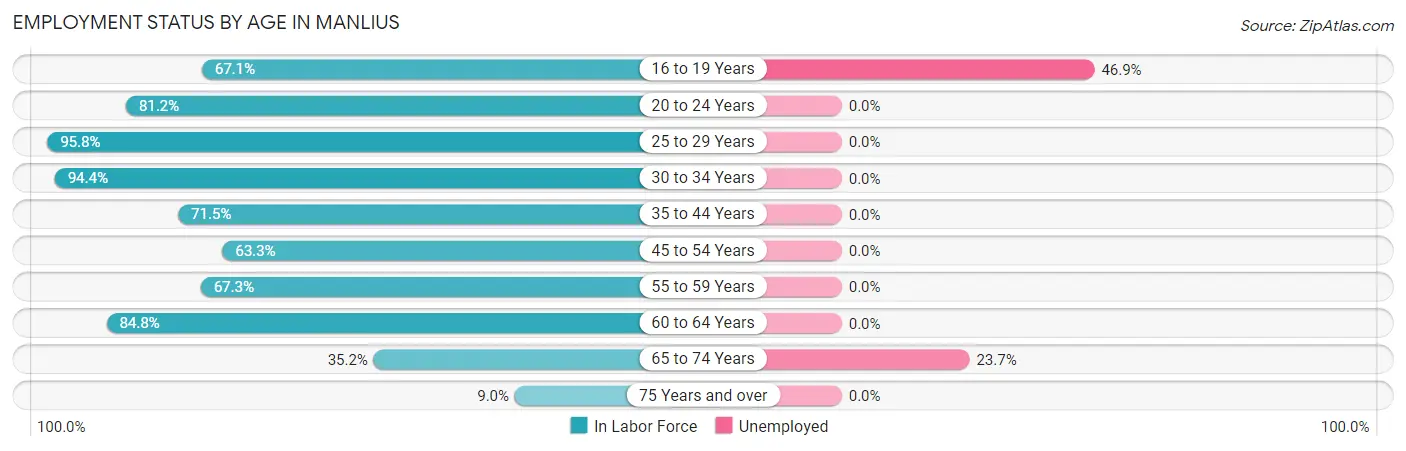
| Age Bracket | In Labor Force | Unemployed |
| 16 to 19 Years | 196 (67.1%) | 92 (46.9%) |
| 20 to 24 Years | 160 (81.2%) | 0 (0.0%) |
| 25 to 29 Years | 251 (95.8%) | 0 (0.0%) |
| 30 to 34 Years | 301 (94.4%) | 0 (0.0%) |
| 35 to 44 Years | 459 (71.5%) | 0 (0.0%) |
| 45 to 54 Years | 342 (63.3%) | 0 (0.0%) |
| 55 to 59 Years | 138 (67.3%) | 0 (0.0%) |
| 60 to 64 Years | 274 (84.8%) | 0 (0.0%) |
| 65 to 74 Years | 186 (35.2%) | 44 (23.7%) |
| 75 Years and over | 52 (9.0%) | 0 (0.0%) |
| Total | 2,359 (60.7%) | 137 (5.8%) |
Employment Status by Educational Attainment in Manlius
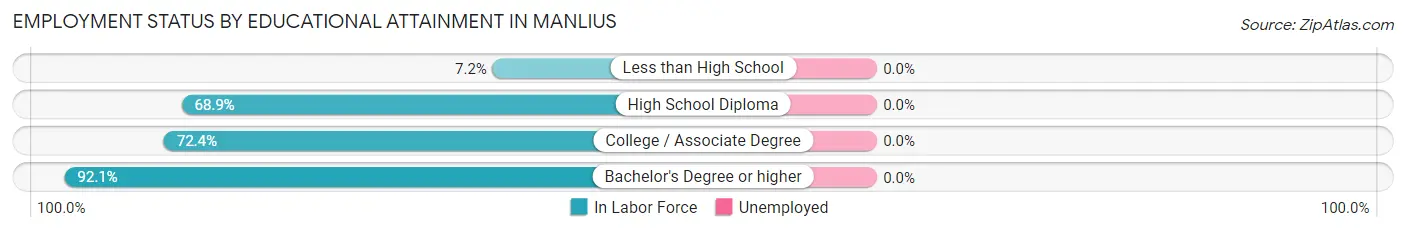
| Educational Attainment | In Labor Force | Unemployed |
| Less than High School | 13 (7.2%) | 0 (0.0%) |
| High School Diploma | 246 (68.9%) | 0 (0.0%) |
| College / Associate Degree | 404 (72.4%) | 0 (0.0%) |
| Bachelor's Degree or higher | 1,102 (92.1%) | 0 (0.0%) |
| Total | 1,764 (77.0%) | 0 (0.0%) |
Employment Occupations by Sex in Manlius
Management, Business, Science and Arts Occupations
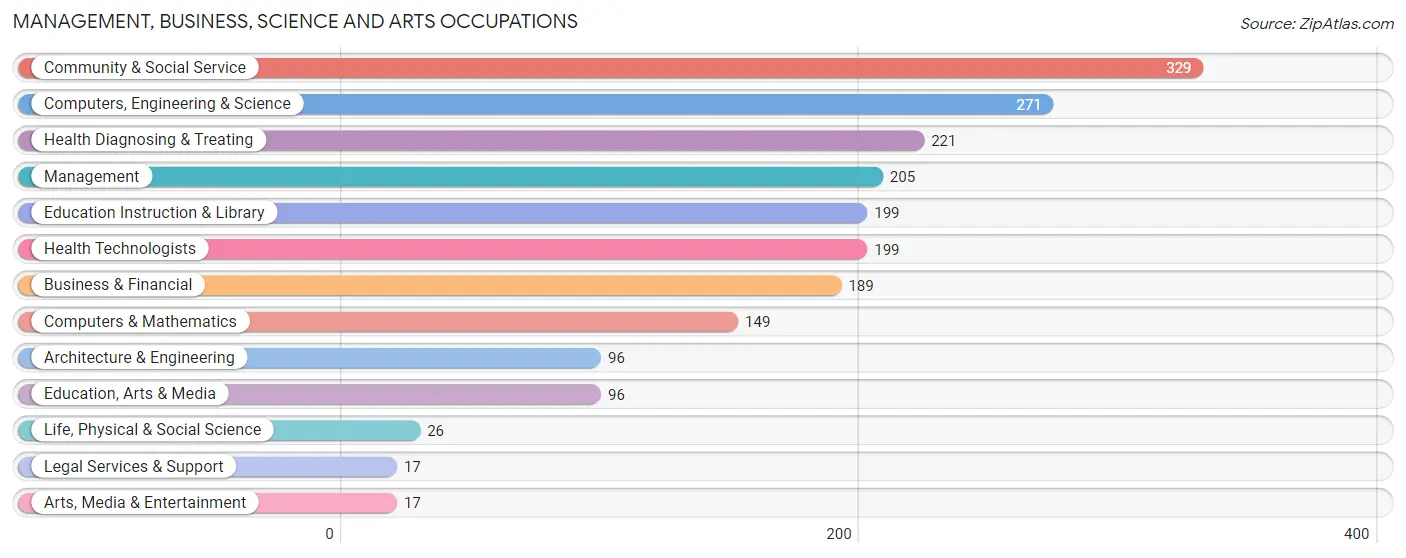
The most common Management, Business, Science and Arts occupations in Manlius are Community & Social Service (329 | 14.8%), Computers, Engineering & Science (271 | 12.2%), Health Diagnosing & Treating (221 | 10.0%), Management (205 | 9.3%), and Education Instruction & Library (199 | 9.0%).
Management, Business, Science and Arts Occupations by Sex
Within the Management, Business, Science and Arts occupations in Manlius, the most male-oriented occupations are Life, Physical & Social Science (100.0%), Computers, Engineering & Science (93.4%), and Architecture & Engineering (92.7%), while the most female-oriented occupations are Legal Services & Support (100.0%), Health Technologists (76.9%), and Health Diagnosing & Treating (73.3%).
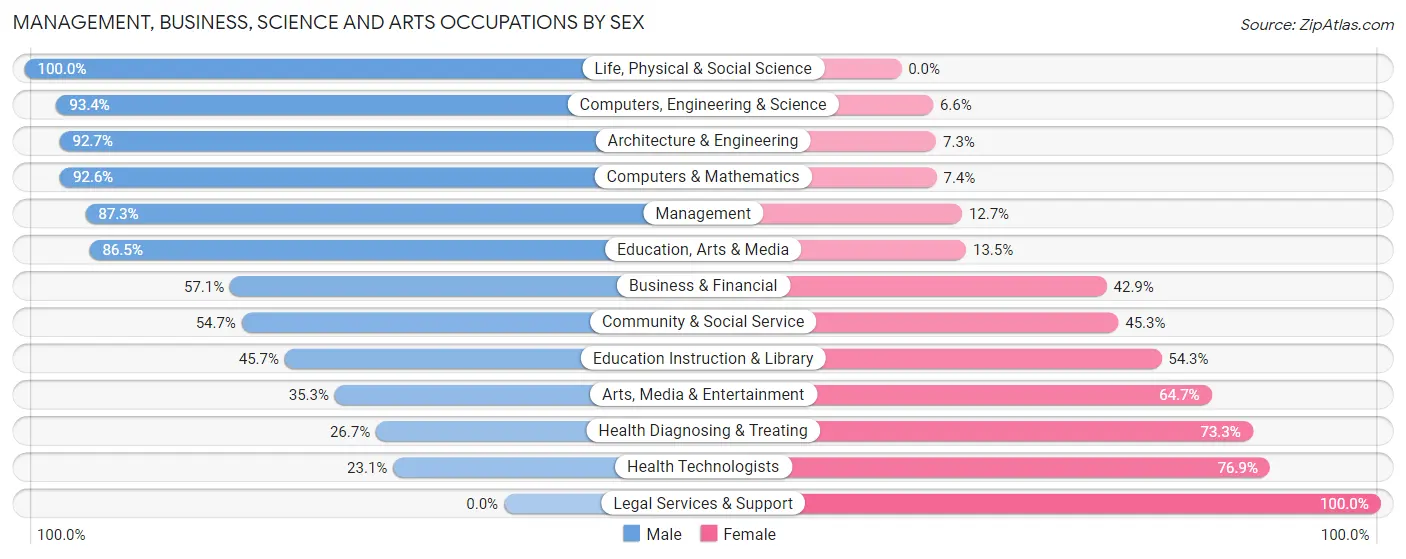
| Occupation | Male | Female |
| Management | 179 (87.3%) | 26 (12.7%) |
| Business & Financial | 108 (57.1%) | 81 (42.9%) |
| Computers, Engineering & Science | 253 (93.4%) | 18 (6.6%) |
| Computers & Mathematics | 138 (92.6%) | 11 (7.4%) |
| Architecture & Engineering | 89 (92.7%) | 7 (7.3%) |
| Life, Physical & Social Science | 26 (100.0%) | 0 (0.0%) |
| Community & Social Service | 180 (54.7%) | 149 (45.3%) |
| Education, Arts & Media | 83 (86.5%) | 13 (13.5%) |
| Legal Services & Support | 0 (0.0%) | 17 (100.0%) |
| Education Instruction & Library | 91 (45.7%) | 108 (54.3%) |
| Arts, Media & Entertainment | 6 (35.3%) | 11 (64.7%) |
| Health Diagnosing & Treating | 59 (26.7%) | 162 (73.3%) |
| Health Technologists | 46 (23.1%) | 153 (76.9%) |
| Total (Category) | 779 (64.1%) | 436 (35.9%) |
| Total (Overall) | 1,290 (58.2%) | 925 (41.8%) |
Services Occupations
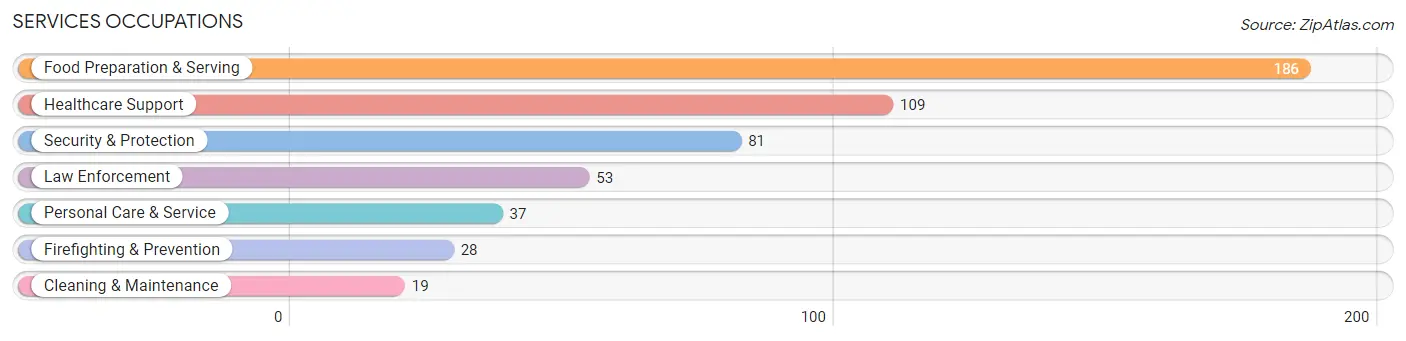
The most common Services occupations in Manlius are Food Preparation & Serving (186 | 8.4%), Healthcare Support (109 | 4.9%), Security & Protection (81 | 3.7%), Law Enforcement (53 | 2.4%), and Personal Care & Service (37 | 1.7%).
Services Occupations by Sex
Within the Services occupations in Manlius, the most male-oriented occupations are Firefighting & Prevention (100.0%), Cleaning & Maintenance (100.0%), and Security & Protection (86.4%), while the most female-oriented occupations are Healthcare Support (91.7%), Personal Care & Service (70.3%), and Food Preparation & Serving (65.0%).
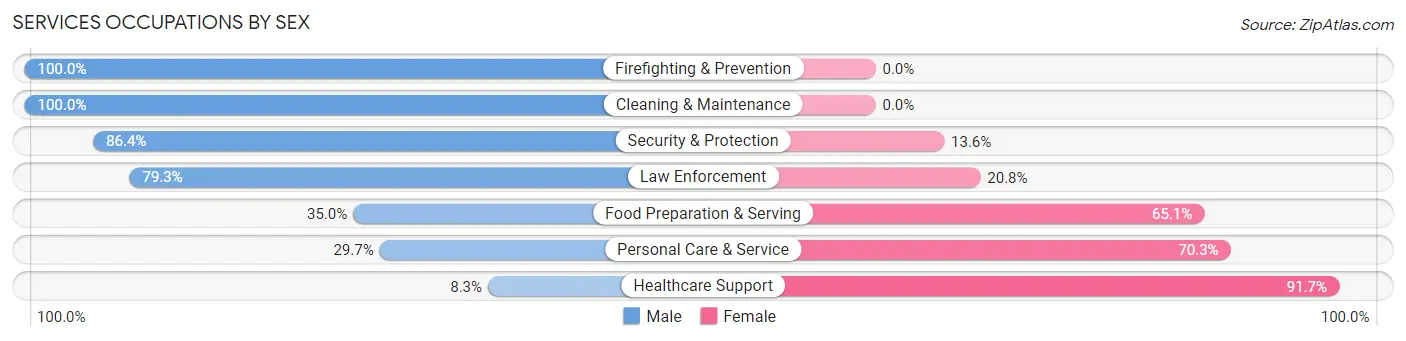
| Occupation | Male | Female |
| Healthcare Support | 9 (8.3%) | 100 (91.7%) |
| Security & Protection | 70 (86.4%) | 11 (13.6%) |
| Firefighting & Prevention | 28 (100.0%) | 0 (0.0%) |
| Law Enforcement | 42 (79.2%) | 11 (20.7%) |
| Food Preparation & Serving | 65 (34.9%) | 121 (65.0%) |
| Cleaning & Maintenance | 19 (100.0%) | 0 (0.0%) |
| Personal Care & Service | 11 (29.7%) | 26 (70.3%) |
| Total (Category) | 174 (40.3%) | 258 (59.7%) |
| Total (Overall) | 1,290 (58.2%) | 925 (41.8%) |
Sales and Office Occupations
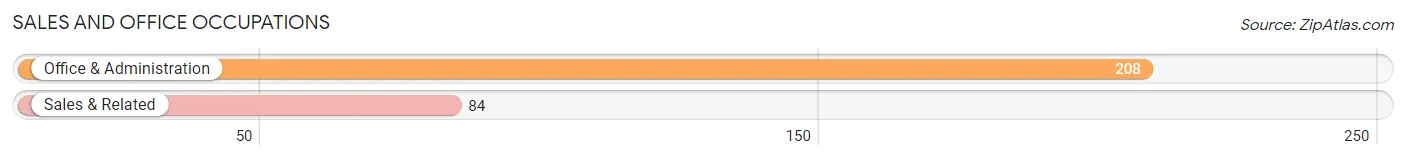
The most common Sales and Office occupations in Manlius are Office & Administration (208 | 9.4%), and Sales & Related (84 | 3.8%).
Sales and Office Occupations by Sex
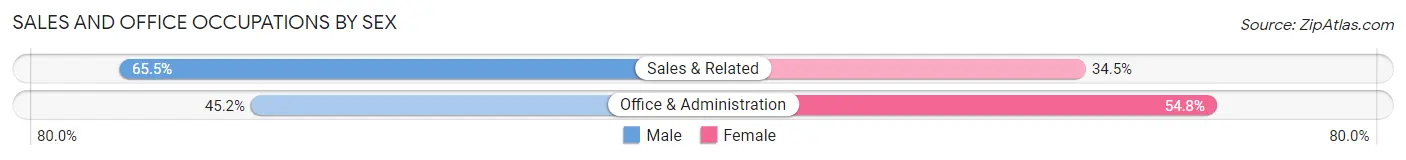
| Occupation | Male | Female |
| Sales & Related | 55 (65.5%) | 29 (34.5%) |
| Office & Administration | 94 (45.2%) | 114 (54.8%) |
| Total (Category) | 149 (51.0%) | 143 (49.0%) |
| Total (Overall) | 1,290 (58.2%) | 925 (41.8%) |
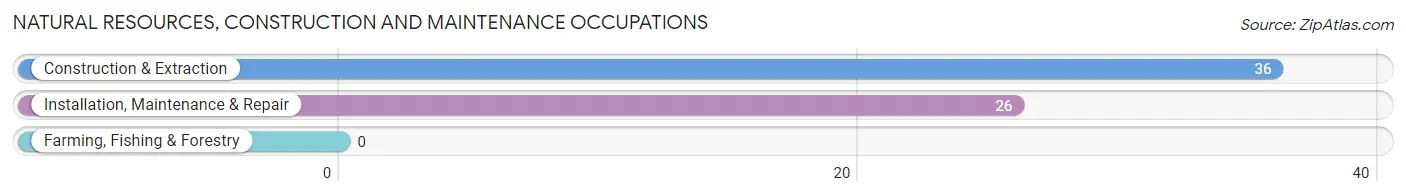
Natural Resources, Construction and Maintenance Occupations
The most common Natural Resources, Construction and Maintenance occupations in Manlius are Construction & Extraction (36 | 1.6%), and Installation, Maintenance & Repair (26 | 1.2%).
Natural Resources, Construction and Maintenance Occupations by Sex
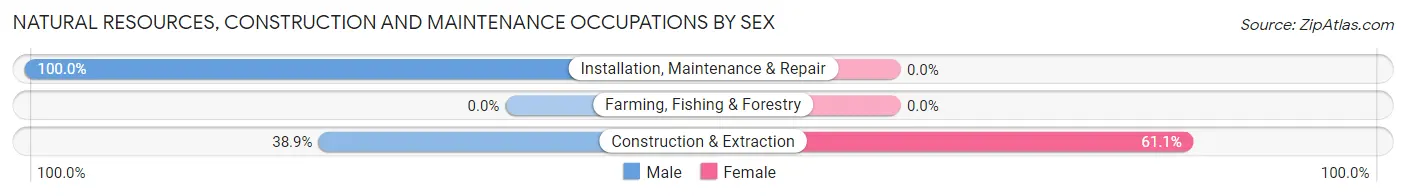
| Occupation | Male | Female |
| Farming, Fishing & Forestry | 0 (0.0%) | 0 (0.0%) |
| Construction & Extraction | 14 (38.9%) | 22 (61.1%) |
| Installation, Maintenance & Repair | 26 (100.0%) | 0 (0.0%) |
| Total (Category) | 40 (64.5%) | 22 (35.5%) |
| Total (Overall) | 1,290 (58.2%) | 925 (41.8%) |
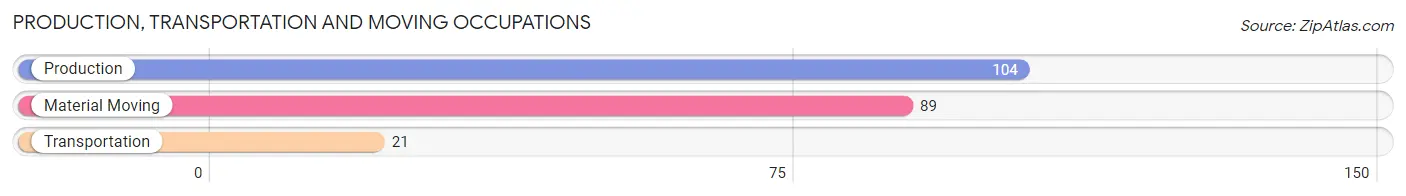
Production, Transportation and Moving Occupations
The most common Production, Transportation and Moving occupations in Manlius are Production (104 | 4.7%), Material Moving (89 | 4.0%), and Transportation (21 | 0.9%).
Production, Transportation and Moving Occupations by Sex
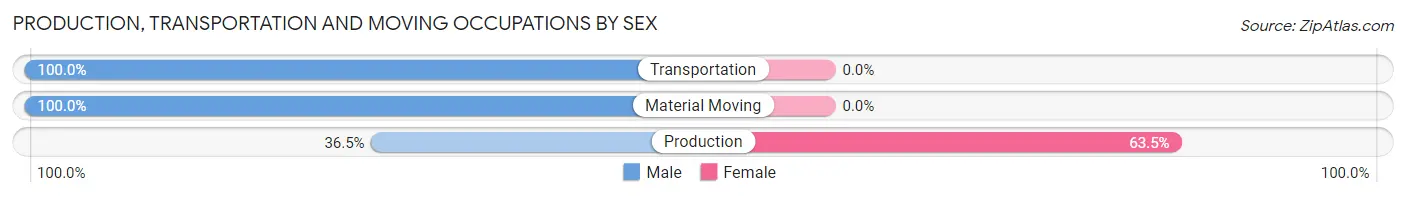
| Occupation | Male | Female |
| Production | 38 (36.5%) | 66 (63.5%) |
| Transportation | 21 (100.0%) | 0 (0.0%) |
| Material Moving | 89 (100.0%) | 0 (0.0%) |
| Total (Category) | 148 (69.2%) | 66 (30.8%) |
| Total (Overall) | 1,290 (58.2%) | 925 (41.8%) |
Employment Industries by Sex in Manlius
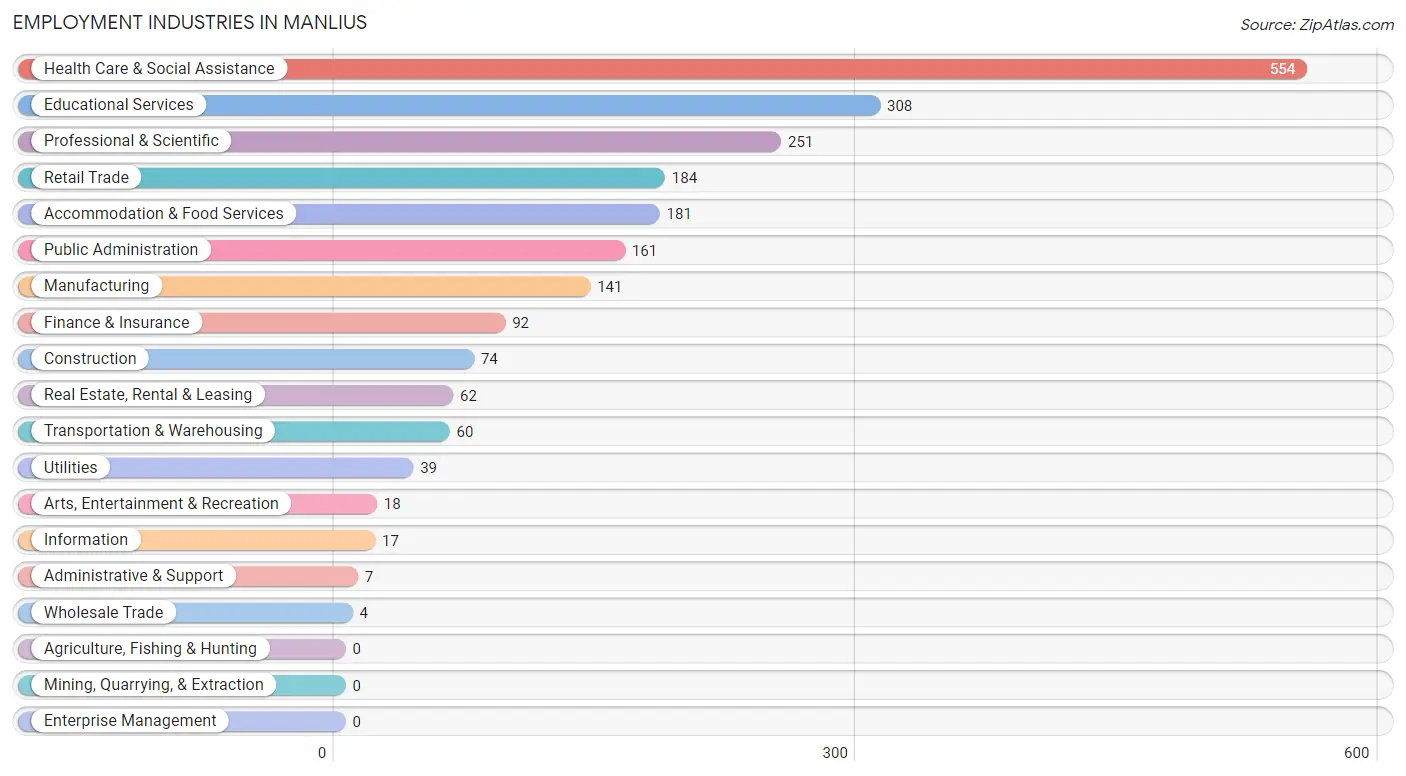
Employment Industries in Manlius
The major employment industries in Manlius include Health Care & Social Assistance (554 | 25.0%), Educational Services (308 | 13.9%), Professional & Scientific (251 | 11.3%), Retail Trade (184 | 8.3%), and Accommodation & Food Services (181 | 8.2%).
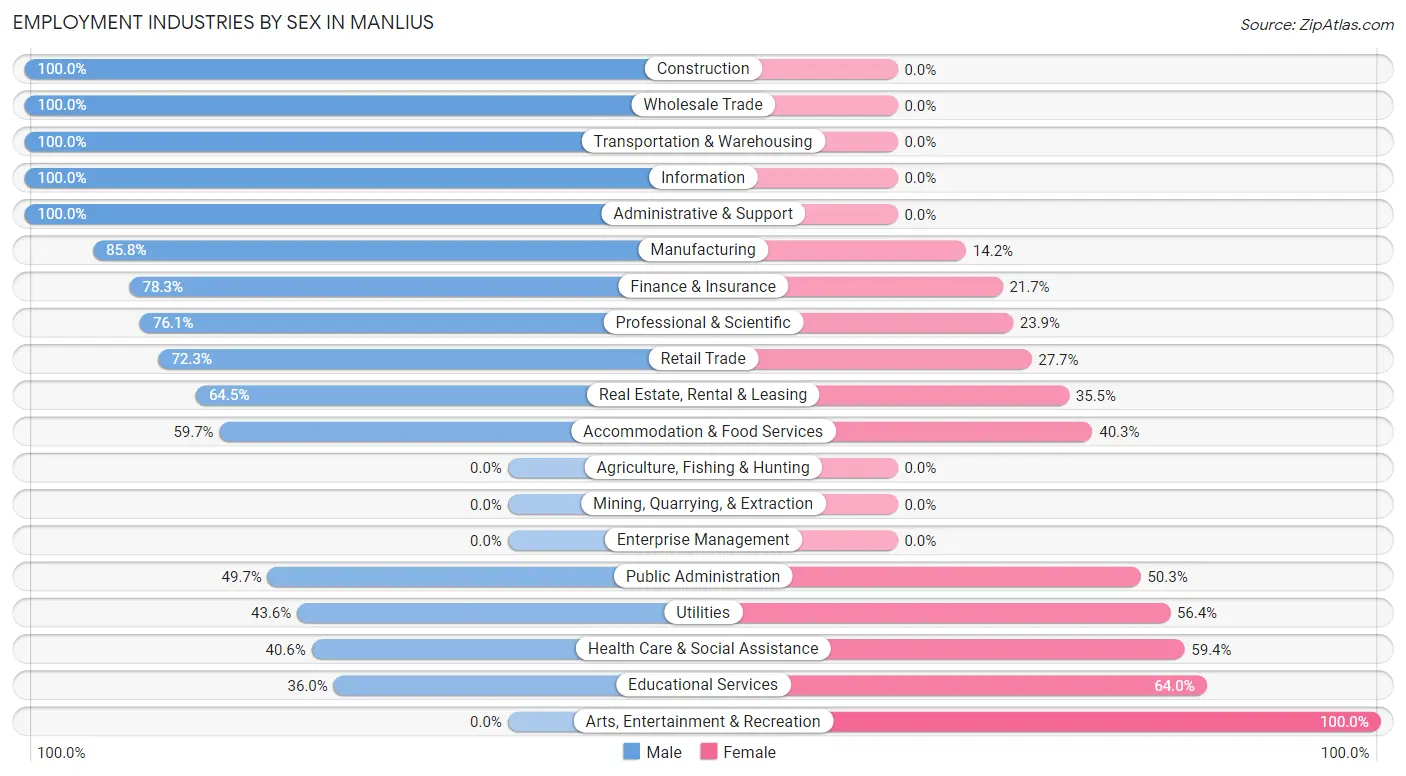
Employment Industries by Sex in Manlius
The Manlius industries that see more men than women are Construction (100.0%), Wholesale Trade (100.0%), and Transportation & Warehousing (100.0%), whereas the industries that tend to have a higher number of women are Arts, Entertainment & Recreation (100.0%), Educational Services (64.0%), and Health Care & Social Assistance (59.4%).
| Industry | Male | Female |
| Agriculture, Fishing & Hunting | 0 (0.0%) | 0 (0.0%) |
| Mining, Quarrying, & Extraction | 0 (0.0%) | 0 (0.0%) |
| Construction | 74 (100.0%) | 0 (0.0%) |
| Manufacturing | 121 (85.8%) | 20 (14.2%) |
| Wholesale Trade | 4 (100.0%) | 0 (0.0%) |
| Retail Trade | 133 (72.3%) | 51 (27.7%) |
| Transportation & Warehousing | 60 (100.0%) | 0 (0.0%) |
| Utilities | 17 (43.6%) | 22 (56.4%) |
| Information | 17 (100.0%) | 0 (0.0%) |
| Finance & Insurance | 72 (78.3%) | 20 (21.7%) |
| Real Estate, Rental & Leasing | 40 (64.5%) | 22 (35.5%) |
| Professional & Scientific | 191 (76.1%) | 60 (23.9%) |
| Enterprise Management | 0 (0.0%) | 0 (0.0%) |
| Administrative & Support | 7 (100.0%) | 0 (0.0%) |
| Educational Services | 111 (36.0%) | 197 (64.0%) |
| Health Care & Social Assistance | 225 (40.6%) | 329 (59.4%) |
| Arts, Entertainment & Recreation | 0 (0.0%) | 18 (100.0%) |
| Accommodation & Food Services | 108 (59.7%) | 73 (40.3%) |
| Public Administration | 80 (49.7%) | 81 (50.3%) |
| Total | 1,290 (58.2%) | 925 (41.8%) |
Education in Manlius
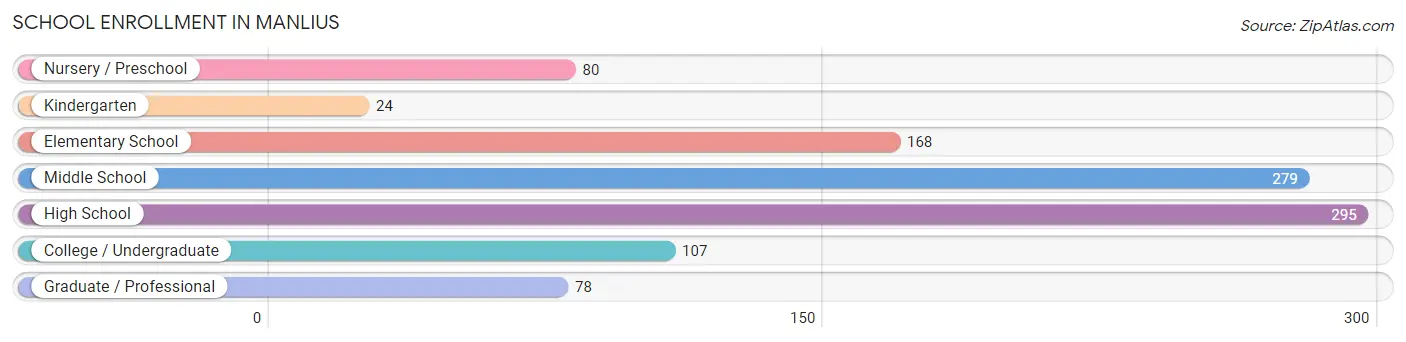
School Enrollment in Manlius
The most common levels of schooling among the 1,031 students in Manlius are high school (295 | 28.6%), middle school (279 | 27.1%), and elementary school (168 | 16.3%).
| School Level | # Students | % Students |
| Nursery / Preschool | 80 | 7.8% |
| Kindergarten | 24 | 2.3% |
| Elementary School | 168 | 16.3% |
| Middle School | 279 | 27.1% |
| High School | 295 | 28.6% |
| College / Undergraduate | 107 | 10.4% |
| Graduate / Professional | 78 | 7.6% |
| Total | 1,031 | 100.0% |
School Enrollment by Age by Funding Source in Manlius
Out of a total of 1,031 students who are enrolled in schools in Manlius, 205 (19.9%) attend a private institution, while the remaining 826 (80.1%) are enrolled in public schools. The age group of 20 to 24 year olds has the highest likelihood of being enrolled in private schools, with 62 (72.1% in the age bracket) enrolled. Conversely, the age group of 10 to 14 year olds has the lowest likelihood of being enrolled in a private school, with 304 (100.0% in the age bracket) attending a public institution.
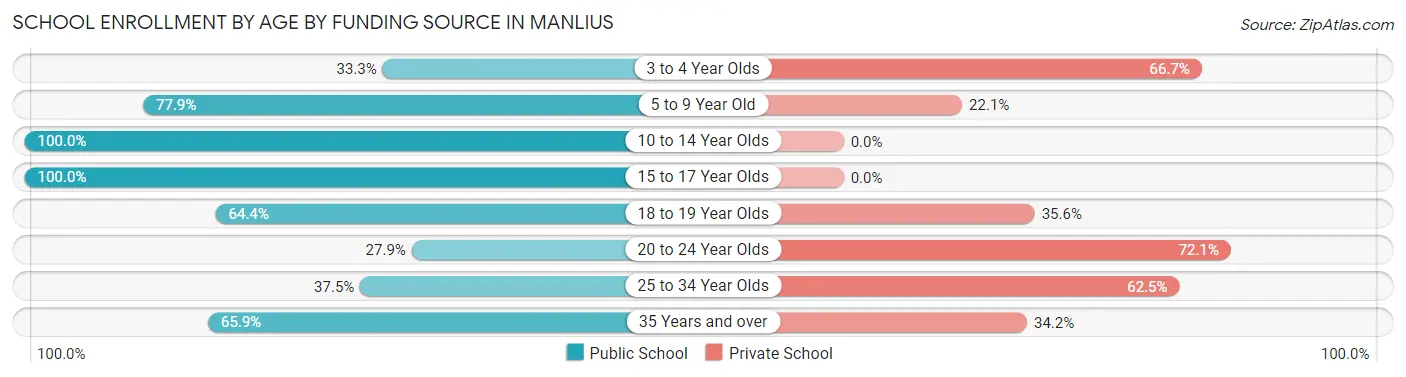
| Age Bracket | Public School | Private School |
| 3 to 4 Year Olds | 14 (33.3%) | 28 (66.7%) |
| 5 to 9 Year Old | 173 (77.9%) | 49 (22.1%) |
| 10 to 14 Year Olds | 304 (100.0%) | 0 (0.0%) |
| 15 to 17 Year Olds | 202 (100.0%) | 0 (0.0%) |
| 18 to 19 Year Olds | 76 (64.4%) | 42 (35.6%) |
| 20 to 24 Year Olds | 24 (27.9%) | 62 (72.1%) |
| 25 to 34 Year Olds | 6 (37.5%) | 10 (62.5%) |
| 35 Years and over | 27 (65.8%) | 14 (34.2%) |
| Total | 826 (80.1%) | 205 (19.9%) |
Educational Attainment by Field of Study in Manlius
Education (306 | 16.6%), business (231 | 12.5%), liberal arts & history (187 | 10.1%), science & technology (181 | 9.8%), and social sciences (166 | 9.0%) are the most common fields of study among 1,849 individuals in Manlius who have obtained a bachelor's degree or higher.
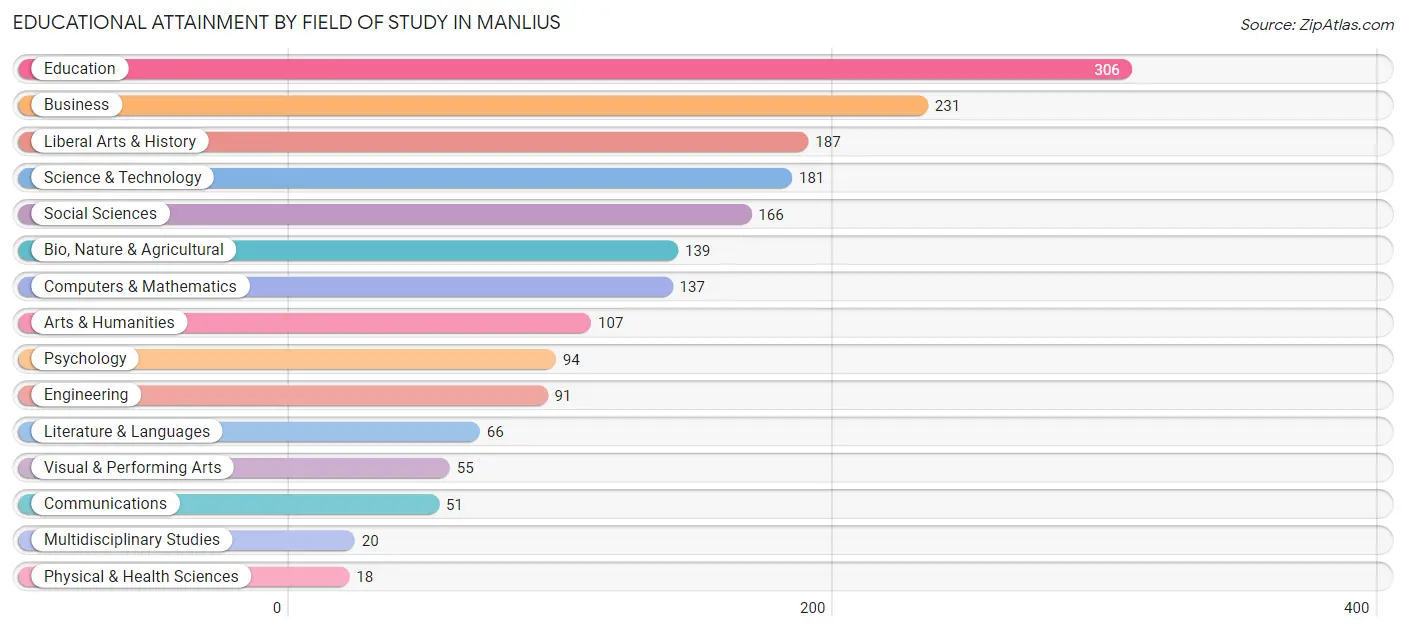
| Field of Study | # Graduates | % Graduates |
| Computers & Mathematics | 137 | 7.4% |
| Bio, Nature & Agricultural | 139 | 7.5% |
| Physical & Health Sciences | 18 | 1.0% |
| Psychology | 94 | 5.1% |
| Social Sciences | 166 | 9.0% |
| Engineering | 91 | 4.9% |
| Multidisciplinary Studies | 20 | 1.1% |
| Science & Technology | 181 | 9.8% |
| Business | 231 | 12.5% |
| Education | 306 | 16.6% |
| Literature & Languages | 66 | 3.6% |
| Liberal Arts & History | 187 | 10.1% |
| Visual & Performing Arts | 55 | 3.0% |
| Communications | 51 | 2.8% |
| Arts & Humanities | 107 | 5.8% |
| Total | 1,849 | 100.0% |
Transportation & Commute in Manlius
Vehicle Availability by Sex in Manlius
The most prevalent vehicle ownership categories in Manlius are males with 2 vehicles (539, accounting for 41.5%) and females with 2 vehicles (450, making up 60.6%).
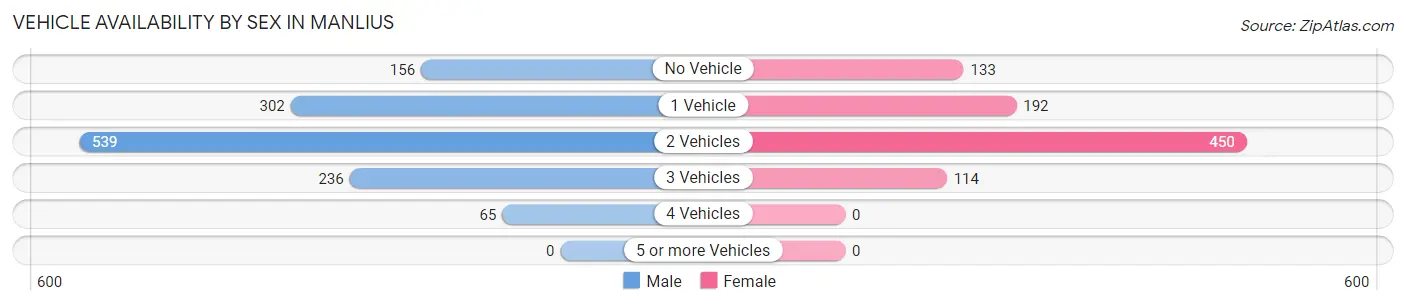
| Vehicles Available | Male | Female |
| No Vehicle | 156 (12.0%) | 133 (15.0%) |
| 1 Vehicle | 302 (23.3%) | 192 (21.6%) |
| 2 Vehicles | 539 (41.5%) | 450 (50.6%) |
| 3 Vehicles | 236 (18.2%) | 114 (12.8%) |
| 4 Vehicles | 65 (5.0%) | 0 (0.0%) |
| 5 or more Vehicles | 0 (0.0%) | 0 (0.0%) |
| Total | 1,298 (100.0%) | 889 (100.0%) |
Commute Time in Manlius
The most frequently occuring commute durations in Manlius are 15 to 19 minutes (403 commuters, 20.2%), 20 to 24 minutes (403 commuters, 20.2%), and 30 to 34 minutes (260 commuters, 13.0%).
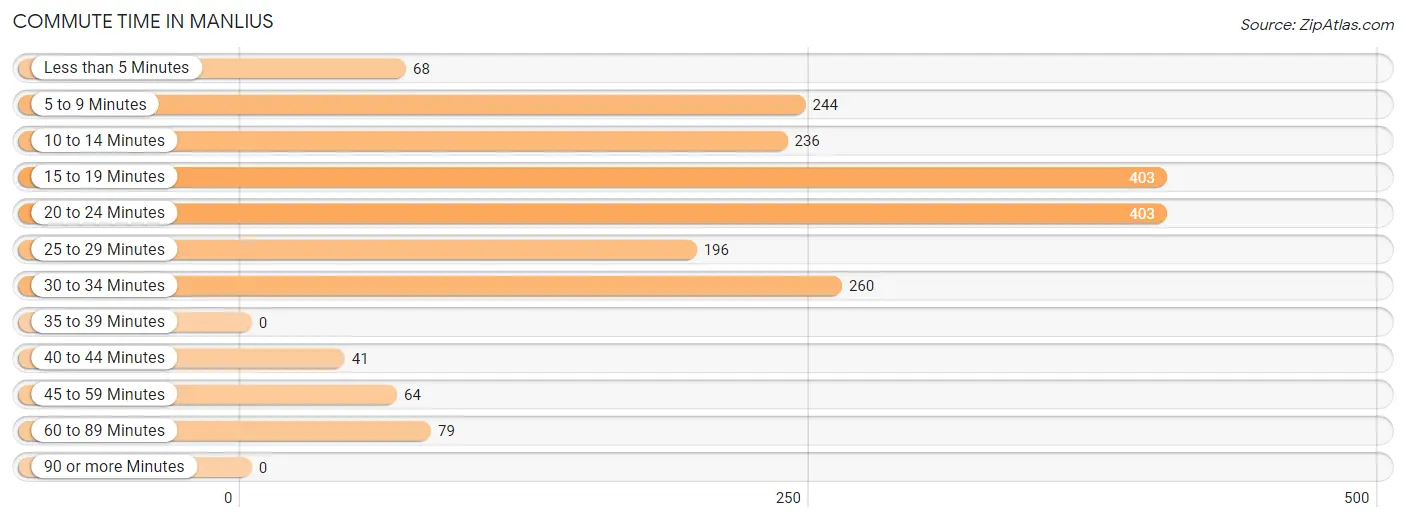
| Commute Time | # Commuters | % Commuters |
| Less than 5 Minutes | 68 | 3.4% |
| 5 to 9 Minutes | 244 | 12.2% |
| 10 to 14 Minutes | 236 | 11.8% |
| 15 to 19 Minutes | 403 | 20.2% |
| 20 to 24 Minutes | 403 | 20.2% |
| 25 to 29 Minutes | 196 | 9.8% |
| 30 to 34 Minutes | 260 | 13.0% |
| 35 to 39 Minutes | 0 | 0.0% |
| 40 to 44 Minutes | 41 | 2.1% |
| 45 to 59 Minutes | 64 | 3.2% |
| 60 to 89 Minutes | 79 | 4.0% |
| 90 or more Minutes | 0 | 0.0% |
Commute Time by Sex in Manlius
The most common commute times in Manlius are 15 to 19 minutes (279 commuters, 23.5%) for males and 20 to 24 minutes (185 commuters, 22.9%) for females.
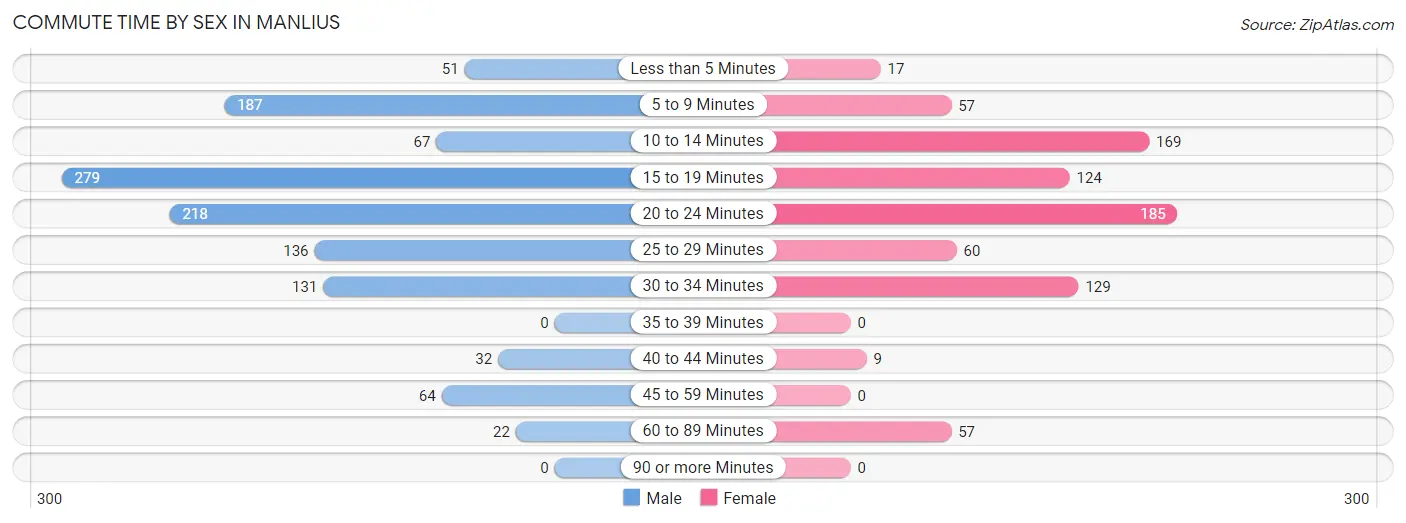
| Commute Time | Male | Female |
| Less than 5 Minutes | 51 (4.3%) | 17 (2.1%) |
| 5 to 9 Minutes | 187 (15.8%) | 57 (7.1%) |
| 10 to 14 Minutes | 67 (5.6%) | 169 (20.9%) |
| 15 to 19 Minutes | 279 (23.5%) | 124 (15.4%) |
| 20 to 24 Minutes | 218 (18.4%) | 185 (22.9%) |
| 25 to 29 Minutes | 136 (11.5%) | 60 (7.4%) |
| 30 to 34 Minutes | 131 (11.0%) | 129 (16.0%) |
| 35 to 39 Minutes | 0 (0.0%) | 0 (0.0%) |
| 40 to 44 Minutes | 32 (2.7%) | 9 (1.1%) |
| 45 to 59 Minutes | 64 (5.4%) | 0 (0.0%) |
| 60 to 89 Minutes | 22 (1.8%) | 57 (7.1%) |
| 90 or more Minutes | 0 (0.0%) | 0 (0.0%) |
Time of Departure to Work by Sex in Manlius
The most frequent times of departure to work in Manlius are 12:00 PM to 3:59 PM (228, 19.2%) for males and 7:30 AM to 7:59 AM (218, 27.0%) for females.
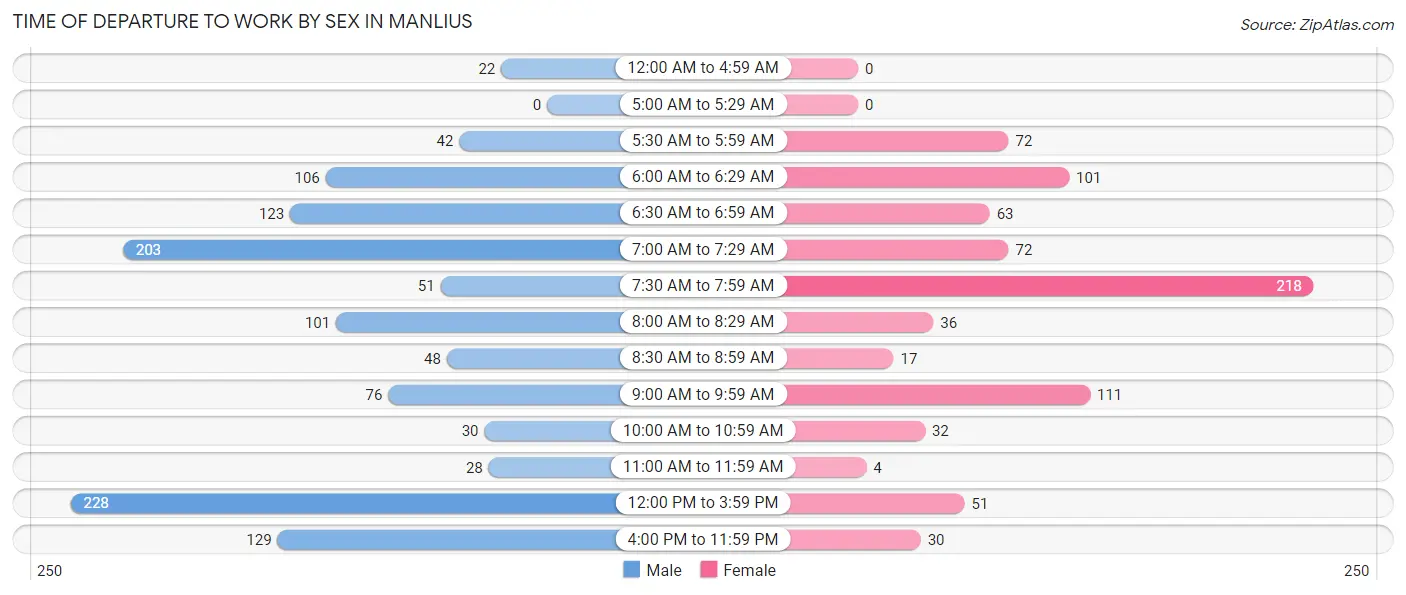
| Time of Departure | Male | Female |
| 12:00 AM to 4:59 AM | 22 (1.8%) | 0 (0.0%) |
| 5:00 AM to 5:29 AM | 0 (0.0%) | 0 (0.0%) |
| 5:30 AM to 5:59 AM | 42 (3.5%) | 72 (8.9%) |
| 6:00 AM to 6:29 AM | 106 (8.9%) | 101 (12.5%) |
| 6:30 AM to 6:59 AM | 123 (10.4%) | 63 (7.8%) |
| 7:00 AM to 7:29 AM | 203 (17.1%) | 72 (8.9%) |
| 7:30 AM to 7:59 AM | 51 (4.3%) | 218 (27.0%) |
| 8:00 AM to 8:29 AM | 101 (8.5%) | 36 (4.5%) |
| 8:30 AM to 8:59 AM | 48 (4.0%) | 17 (2.1%) |
| 9:00 AM to 9:59 AM | 76 (6.4%) | 111 (13.8%) |
| 10:00 AM to 10:59 AM | 30 (2.5%) | 32 (4.0%) |
| 11:00 AM to 11:59 AM | 28 (2.4%) | 4 (0.5%) |
| 12:00 PM to 3:59 PM | 228 (19.2%) | 51 (6.3%) |
| 4:00 PM to 11:59 PM | 129 (10.9%) | 30 (3.7%) |
| Total | 1,187 (100.0%) | 807 (100.0%) |
Housing Occupancy in Manlius
Occupancy by Ownership in Manlius
Of the total 2,047 dwellings in Manlius, owner-occupied units account for 1,201 (58.7%), while renter-occupied units make up 846 (41.3%).
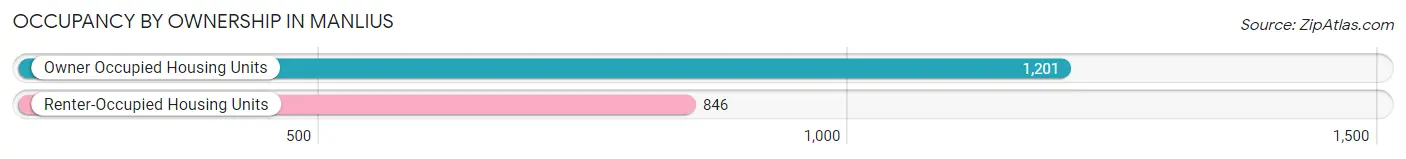
| Occupancy | # Housing Units | % Housing Units |
| Owner Occupied Housing Units | 1,201 | 58.7% |
| Renter-Occupied Housing Units | 846 | 41.3% |
| Total Occupied Housing Units | 2,047 | 100.0% |
Occupancy by Household Size in Manlius
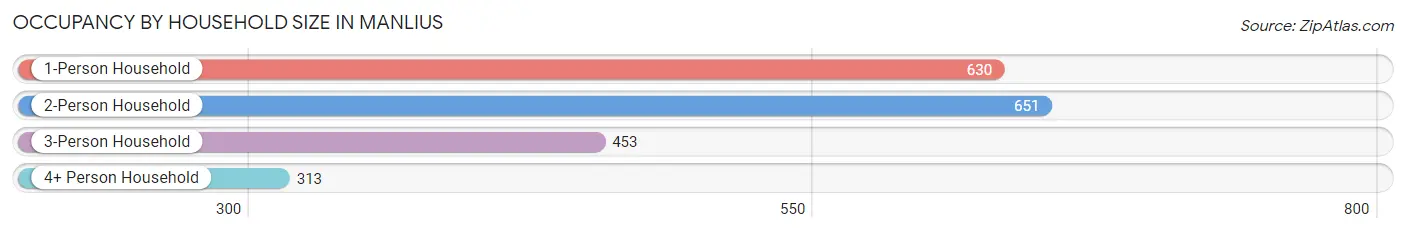
| Household Size | # Housing Units | % Housing Units |
| 1-Person Household | 630 | 30.8% |
| 2-Person Household | 651 | 31.8% |
| 3-Person Household | 453 | 22.1% |
| 4+ Person Household | 313 | 15.3% |
| Total Housing Units | 2,047 | 100.0% |
Occupancy by Ownership by Household Size in Manlius
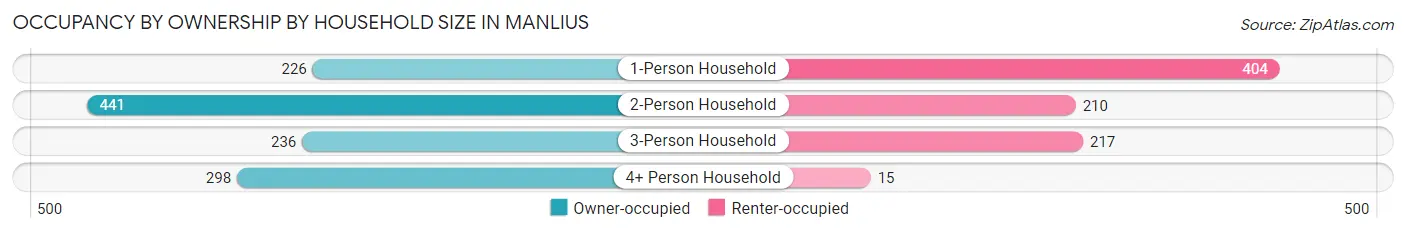
| Household Size | Owner-occupied | Renter-occupied |
| 1-Person Household | 226 (35.9%) | 404 (64.1%) |
| 2-Person Household | 441 (67.7%) | 210 (32.3%) |
| 3-Person Household | 236 (52.1%) | 217 (47.9%) |
| 4+ Person Household | 298 (95.2%) | 15 (4.8%) |
| Total Housing Units | 1,201 (58.7%) | 846 (41.3%) |
Occupancy by Educational Attainment in Manlius
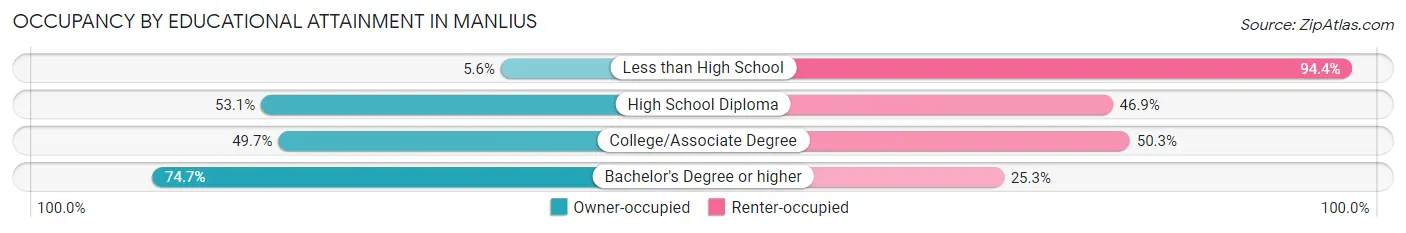
| Household Size | Owner-occupied | Renter-occupied |
| Less than High School | 9 (5.6%) | 152 (94.4%) |
| High School Diploma | 221 (53.1%) | 195 (46.9%) |
| College/Associate Degree | 253 (49.7%) | 256 (50.3%) |
| Bachelor's Degree or higher | 718 (74.7%) | 243 (25.3%) |
Occupancy by Age of Householder in Manlius
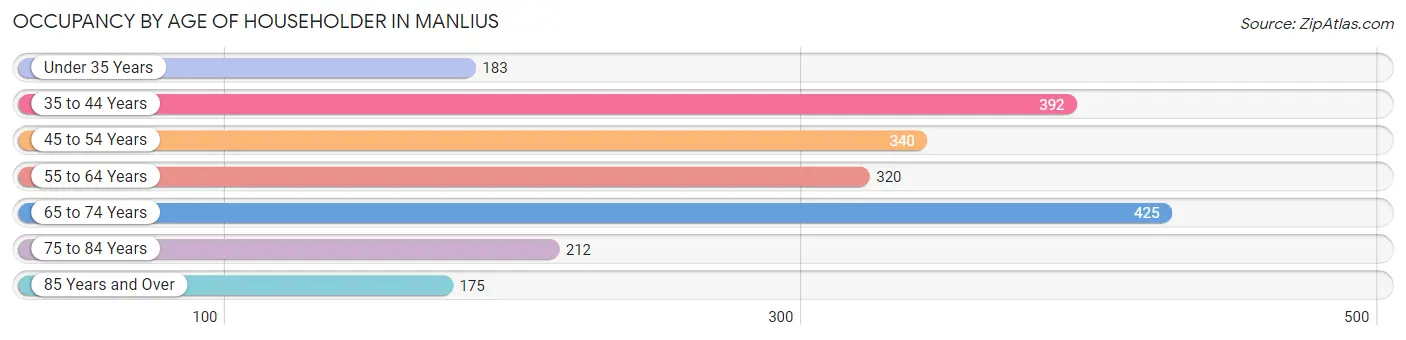
| Age Bracket | # Households | % Households |
| Under 35 Years | 183 | 8.9% |
| 35 to 44 Years | 392 | 19.2% |
| 45 to 54 Years | 340 | 16.6% |
| 55 to 64 Years | 320 | 15.6% |
| 65 to 74 Years | 425 | 20.8% |
| 75 to 84 Years | 212 | 10.4% |
| 85 Years and Over | 175 | 8.6% |
| Total | 2,047 | 100.0% |
Housing Finances in Manlius
Median Income by Occupancy in Manlius
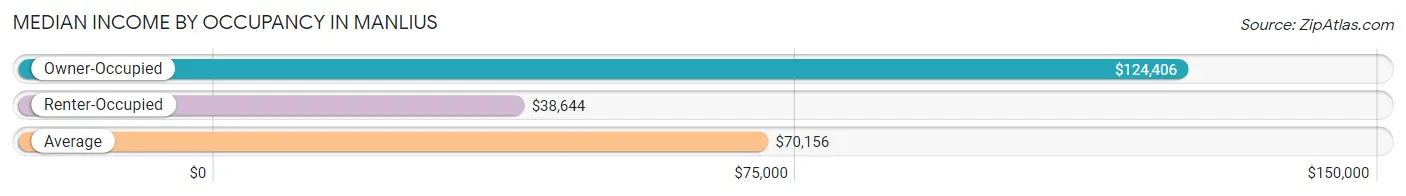
| Occupancy Type | # Households | Median Income |
| Owner-Occupied | 1,201 (58.7%) | $124,406 |
| Renter-Occupied | 846 (41.3%) | $38,644 |
| Average | 2,047 (100.0%) | $70,156 |
Occupancy by Householder Income Bracket in Manlius
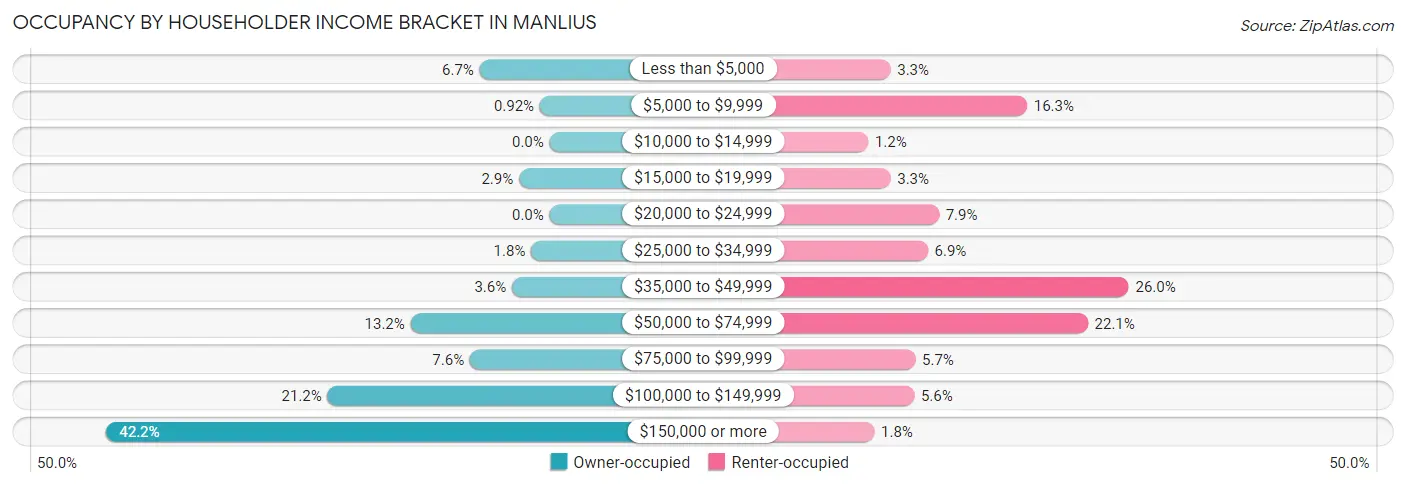
| Income Bracket | Owner-occupied | Renter-occupied |
| Less than $5,000 | 80 (6.7%) | 28 (3.3%) |
| $5,000 to $9,999 | 11 (0.9%) | 138 (16.3%) |
| $10,000 to $14,999 | 0 (0.0%) | 10 (1.2%) |
| $15,000 to $19,999 | 35 (2.9%) | 28 (3.3%) |
| $20,000 to $24,999 | 0 (0.0%) | 67 (7.9%) |
| $25,000 to $34,999 | 21 (1.8%) | 58 (6.9%) |
| $35,000 to $49,999 | 43 (3.6%) | 220 (26.0%) |
| $50,000 to $74,999 | 159 (13.2%) | 187 (22.1%) |
| $75,000 to $99,999 | 91 (7.6%) | 48 (5.7%) |
| $100,000 to $149,999 | 254 (21.1%) | 47 (5.6%) |
| $150,000 or more | 507 (42.2%) | 15 (1.8%) |
| Total | 1,201 (100.0%) | 846 (100.0%) |
Monthly Housing Cost Tiers in Manlius
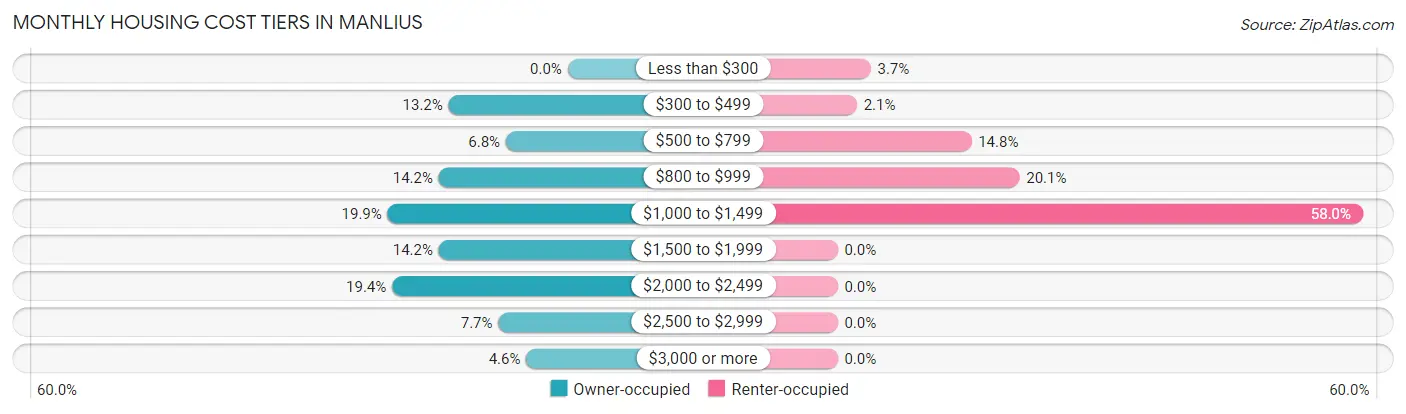
| Monthly Cost | Owner-occupied | Renter-occupied |
| Less than $300 | 0 (0.0%) | 31 (3.7%) |
| $300 to $499 | 158 (13.2%) | 18 (2.1%) |
| $500 to $799 | 82 (6.8%) | 125 (14.8%) |
| $800 to $999 | 171 (14.2%) | 170 (20.1%) |
| $1,000 to $1,499 | 239 (19.9%) | 491 (58.0%) |
| $1,500 to $1,999 | 171 (14.2%) | 0 (0.0%) |
| $2,000 to $2,499 | 233 (19.4%) | 0 (0.0%) |
| $2,500 to $2,999 | 92 (7.7%) | 0 (0.0%) |
| $3,000 or more | 55 (4.6%) | 0 (0.0%) |
| Total | 1,201 (100.0%) | 846 (100.0%) |
Physical Housing Characteristics in Manlius
Housing Structures in Manlius
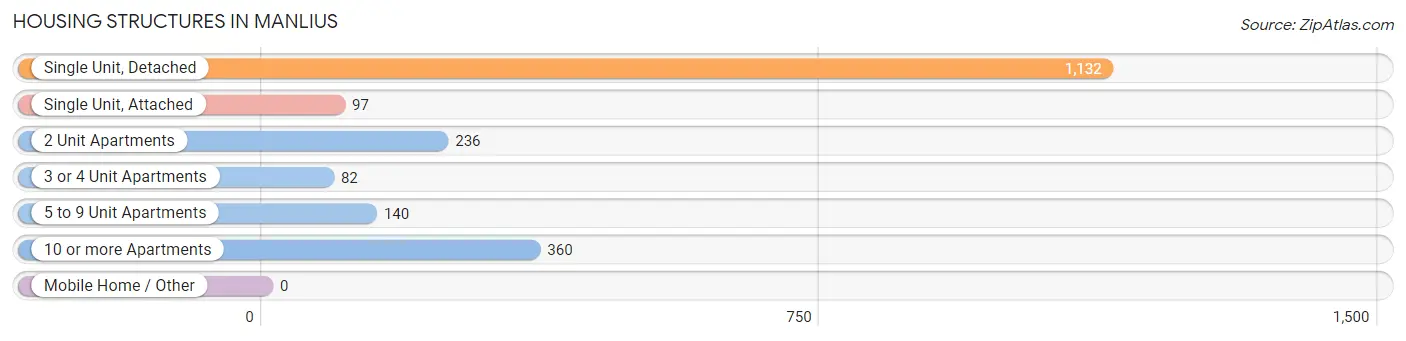
| Structure Type | # Housing Units | % Housing Units |
| Single Unit, Detached | 1,132 | 55.3% |
| Single Unit, Attached | 97 | 4.7% |
| 2 Unit Apartments | 236 | 11.5% |
| 3 or 4 Unit Apartments | 82 | 4.0% |
| 5 to 9 Unit Apartments | 140 | 6.8% |
| 10 or more Apartments | 360 | 17.6% |
| Mobile Home / Other | 0 | 0.0% |
| Total | 2,047 | 100.0% |
Housing Structures by Occupancy in Manlius
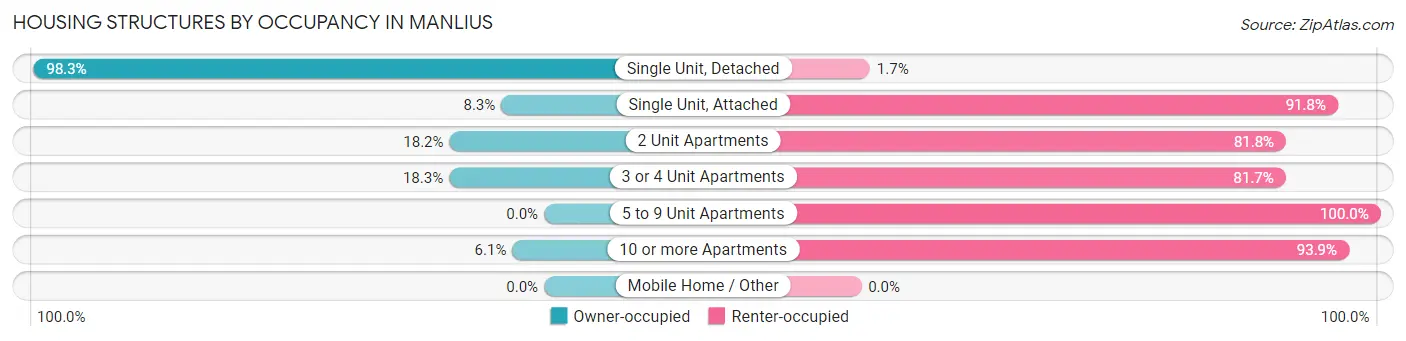
| Structure Type | Owner-occupied | Renter-occupied |
| Single Unit, Detached | 1,113 (98.3%) | 19 (1.7%) |
| Single Unit, Attached | 8 (8.3%) | 89 (91.7%) |
| 2 Unit Apartments | 43 (18.2%) | 193 (81.8%) |
| 3 or 4 Unit Apartments | 15 (18.3%) | 67 (81.7%) |
| 5 to 9 Unit Apartments | 0 (0.0%) | 140 (100.0%) |
| 10 or more Apartments | 22 (6.1%) | 338 (93.9%) |
| Mobile Home / Other | 0 (0.0%) | 0 (0.0%) |
| Total | 1,201 (58.7%) | 846 (41.3%) |
Housing Structures by Number of Rooms in Manlius
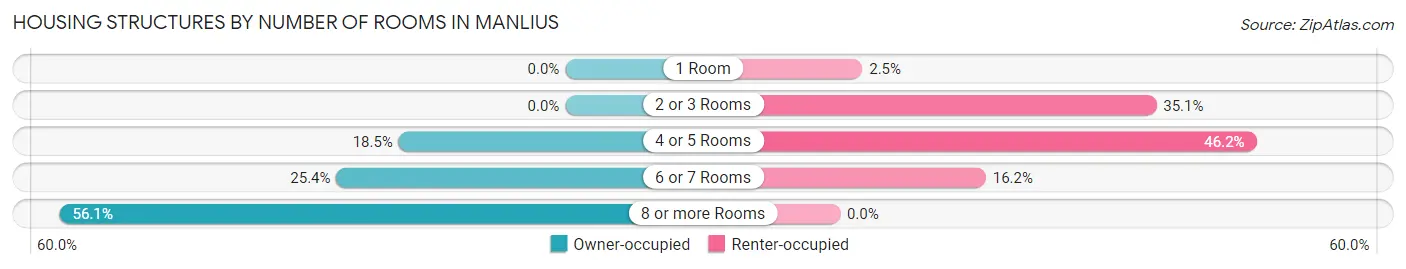
| Number of Rooms | Owner-occupied | Renter-occupied |
| 1 Room | 0 (0.0%) | 21 (2.5%) |
| 2 or 3 Rooms | 0 (0.0%) | 297 (35.1%) |
| 4 or 5 Rooms | 222 (18.5%) | 391 (46.2%) |
| 6 or 7 Rooms | 305 (25.4%) | 137 (16.2%) |
| 8 or more Rooms | 674 (56.1%) | 0 (0.0%) |
| Total | 1,201 (100.0%) | 846 (100.0%) |
Housing Structure by Heating Type in Manlius
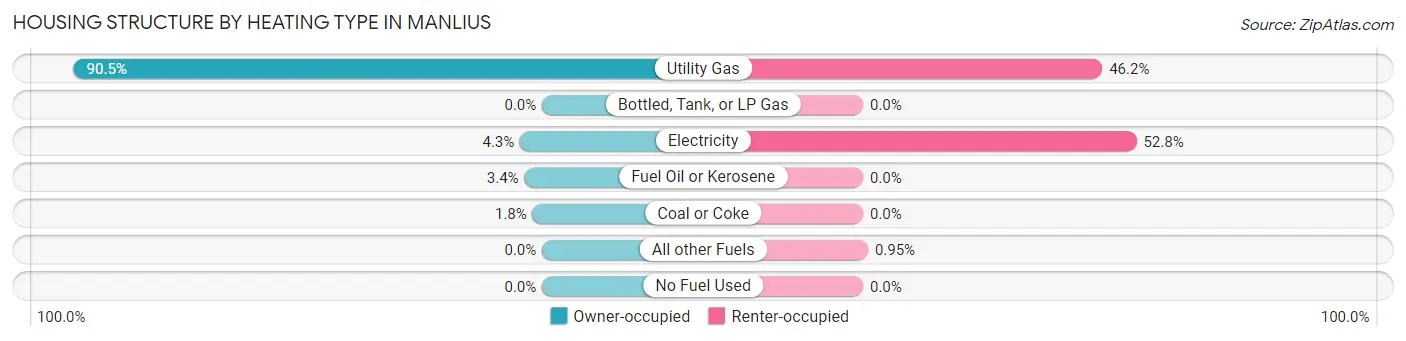
| Heating Type | Owner-occupied | Renter-occupied |
| Utility Gas | 1,087 (90.5%) | 391 (46.2%) |
| Bottled, Tank, or LP Gas | 0 (0.0%) | 0 (0.0%) |
| Electricity | 51 (4.3%) | 447 (52.8%) |
| Fuel Oil or Kerosene | 41 (3.4%) | 0 (0.0%) |
| Coal or Coke | 22 (1.8%) | 0 (0.0%) |
| All other Fuels | 0 (0.0%) | 8 (0.9%) |
| No Fuel Used | 0 (0.0%) | 0 (0.0%) |
| Total | 1,201 (100.0%) | 846 (100.0%) |
Household Vehicle Usage in Manlius
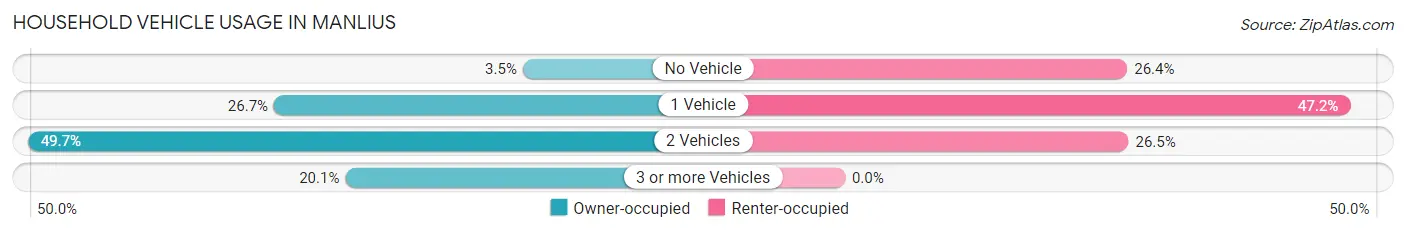
| Vehicles per Household | Owner-occupied | Renter-occupied |
| No Vehicle | 42 (3.5%) | 223 (26.4%) |
| 1 Vehicle | 321 (26.7%) | 399 (47.2%) |
| 2 Vehicles | 597 (49.7%) | 224 (26.5%) |
| 3 or more Vehicles | 241 (20.1%) | 0 (0.0%) |
| Total | 1,201 (100.0%) | 846 (100.0%) |
Real Estate & Mortgages in Manlius
Real Estate and Mortgage Overview in Manlius
| Characteristic | Without Mortgage | With Mortgage |
| Housing Units | 512 | 689 |
| Median Property Value | $208,800 | $248,500 |
| Median Household Income | $81,607 | $398 |
| Monthly Housing Costs | $858 | $55 |
| Real Estate Taxes | $6,891 | $13 |
Property Value by Mortgage Status in Manlius
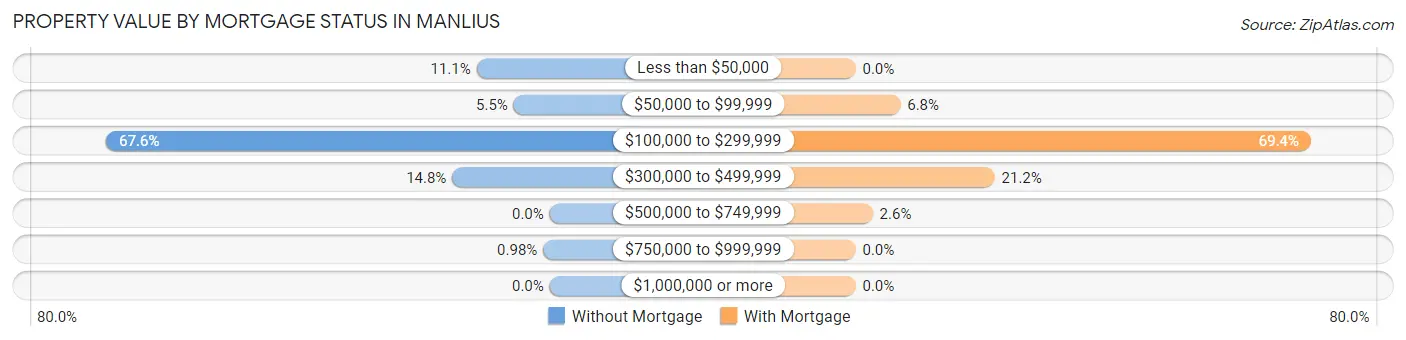
| Property Value | Without Mortgage | With Mortgage |
| Less than $50,000 | 57 (11.1%) | 0 (0.0%) |
| $50,000 to $99,999 | 28 (5.5%) | 47 (6.8%) |
| $100,000 to $299,999 | 346 (67.6%) | 478 (69.4%) |
| $300,000 to $499,999 | 76 (14.8%) | 146 (21.2%) |
| $500,000 to $749,999 | 0 (0.0%) | 18 (2.6%) |
| $750,000 to $999,999 | 5 (1.0%) | 0 (0.0%) |
| $1,000,000 or more | 0 (0.0%) | 0 (0.0%) |
| Total | 512 (100.0%) | 689 (100.0%) |
Household Income by Mortgage Status in Manlius
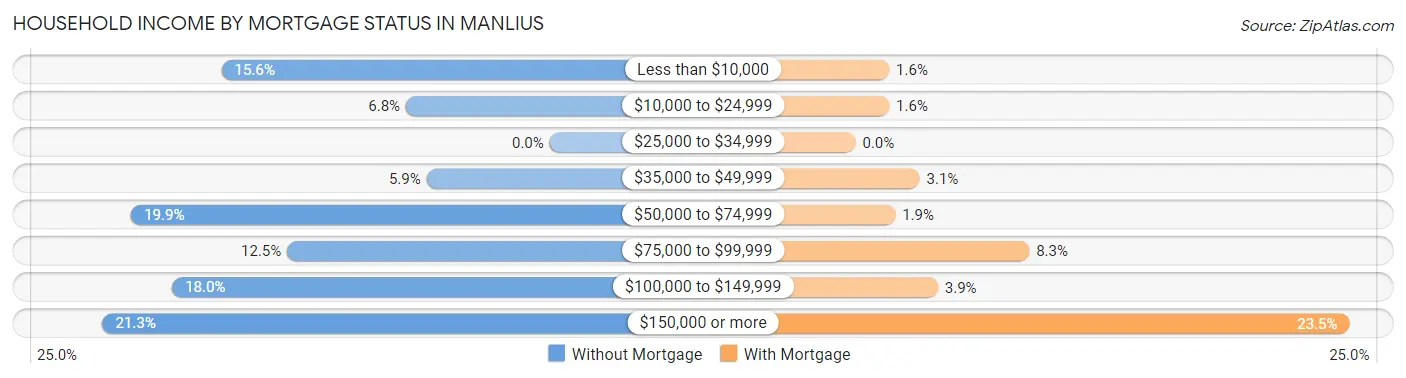
| Household Income | Without Mortgage | With Mortgage |
| Less than $10,000 | 80 (15.6%) | 11 (1.6%) |
| $10,000 to $24,999 | 35 (6.8%) | 11 (1.6%) |
| $25,000 to $34,999 | 0 (0.0%) | 0 (0.0%) |
| $35,000 to $49,999 | 30 (5.9%) | 21 (3.0%) |
| $50,000 to $74,999 | 102 (19.9%) | 13 (1.9%) |
| $75,000 to $99,999 | 64 (12.5%) | 57 (8.3%) |
| $100,000 to $149,999 | 92 (18.0%) | 27 (3.9%) |
| $150,000 or more | 109 (21.3%) | 162 (23.5%) |
| Total | 512 (100.0%) | 689 (100.0%) |
Property Value to Household Income Ratio in Manlius
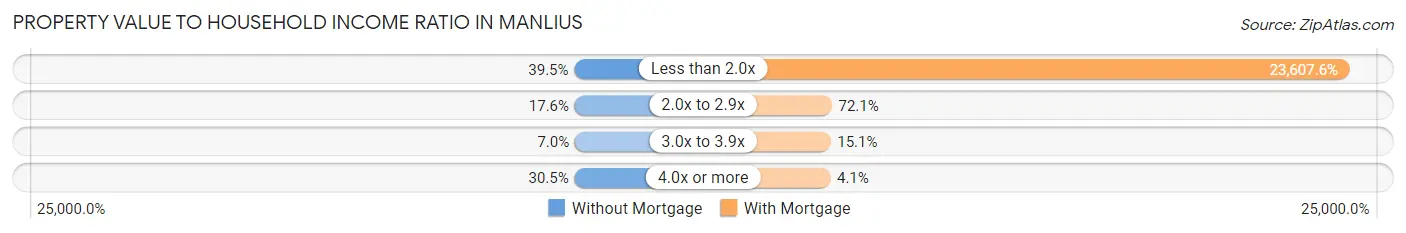
| Value-to-Income Ratio | Without Mortgage | With Mortgage |
| Less than 2.0x | 202 (39.5%) | 162,656 (23,607.6%) |
| 2.0x to 2.9x | 90 (17.6%) | 497 (72.1%) |
| 3.0x to 3.9x | 36 (7.0%) | 104 (15.1%) |
| 4.0x or more | 156 (30.5%) | 28 (4.1%) |
| Total | 512 (100.0%) | 689 (100.0%) |
Real Estate Taxes by Mortgage Status in Manlius
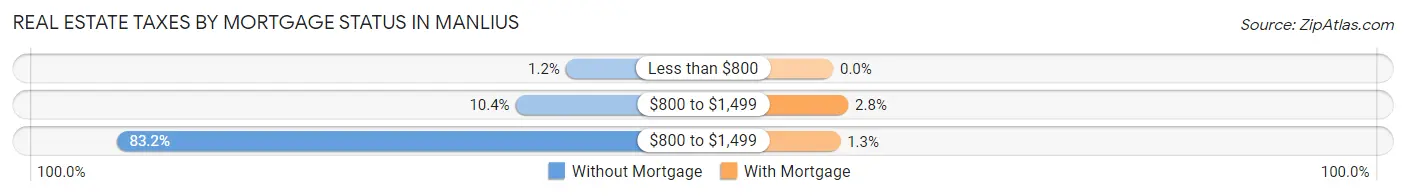
| Property Taxes | Without Mortgage | With Mortgage |
| Less than $800 | 6 (1.2%) | 0 (0.0%) |
| $800 to $1,499 | 53 (10.3%) | 19 (2.8%) |
| $800 to $1,499 | 426 (83.2%) | 9 (1.3%) |
| Total | 512 (100.0%) | 689 (100.0%) |
Health & Disability in Manlius
Health Insurance Coverage by Age in Manlius
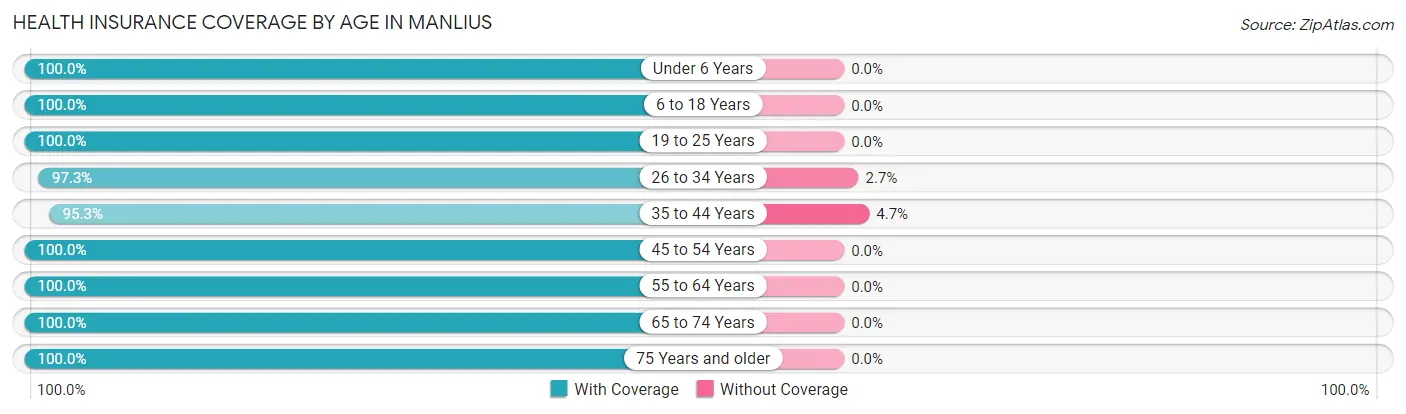
| Age Bracket | With Coverage | Without Coverage |
| Under 6 Years | 269 (100.0%) | 0 (0.0%) |
| 6 to 18 Years | 752 (100.0%) | 0 (0.0%) |
| 19 to 25 Years | 343 (100.0%) | 0 (0.0%) |
| 26 to 34 Years | 474 (97.3%) | 13 (2.7%) |
| 35 to 44 Years | 612 (95.3%) | 30 (4.7%) |
| 45 to 54 Years | 540 (100.0%) | 0 (0.0%) |
| 55 to 64 Years | 528 (100.0%) | 0 (0.0%) |
| 65 to 74 Years | 529 (100.0%) | 0 (0.0%) |
| 75 Years and older | 565 (100.0%) | 0 (0.0%) |
| Total | 4,612 (99.1%) | 43 (0.9%) |
Health Insurance Coverage by Citizenship Status in Manlius
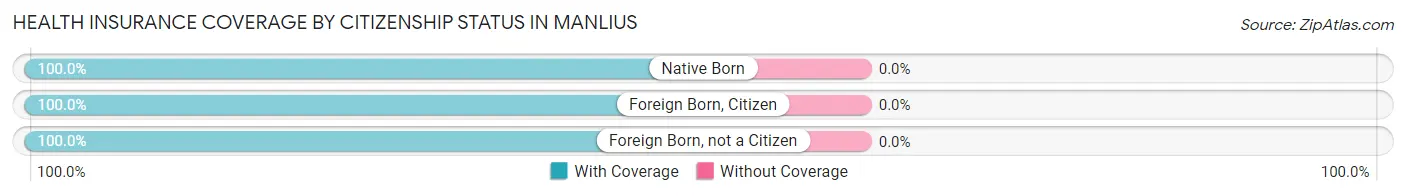
| Citizenship Status | With Coverage | Without Coverage |
| Native Born | 269 (100.0%) | 0 (0.0%) |
| Foreign Born, Citizen | 752 (100.0%) | 0 (0.0%) |
| Foreign Born, not a Citizen | 343 (100.0%) | 0 (0.0%) |
Health Insurance Coverage by Household Income in Manlius
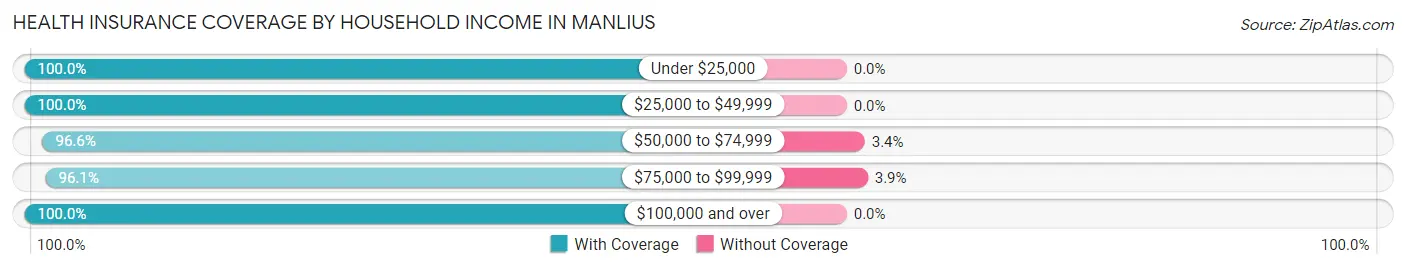
| Household Income | With Coverage | Without Coverage |
| Under $25,000 | 505 (100.0%) | 0 (0.0%) |
| $25,000 to $49,999 | 475 (100.0%) | 0 (0.0%) |
| $50,000 to $74,999 | 775 (96.6%) | 27 (3.4%) |
| $75,000 to $99,999 | 391 (96.1%) | 16 (3.9%) |
| $100,000 and over | 2,441 (100.0%) | 0 (0.0%) |
Public vs Private Health Insurance Coverage by Age in Manlius
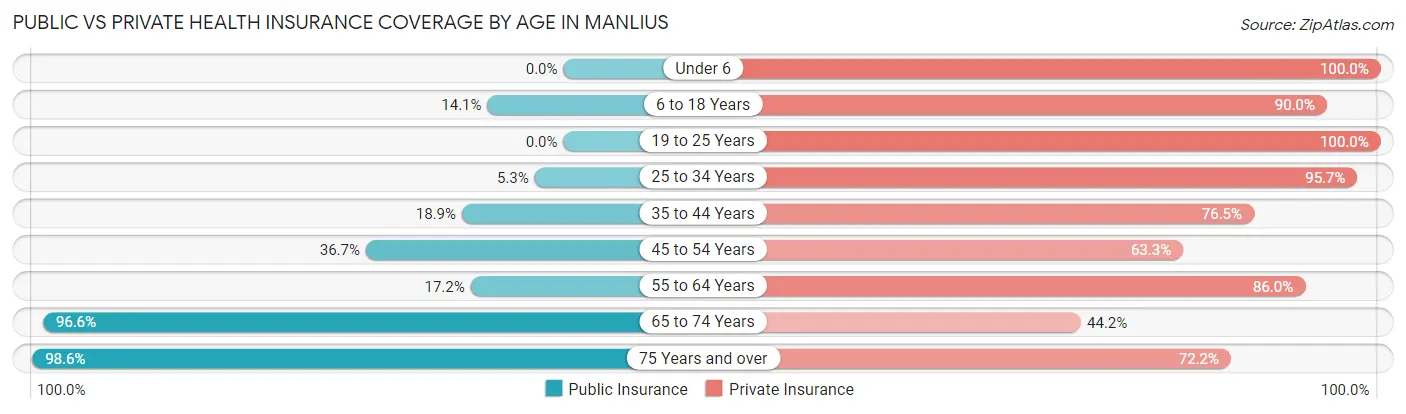
| Age Bracket | Public Insurance | Private Insurance |
| Under 6 | 0 (0.0%) | 269 (100.0%) |
| 6 to 18 Years | 106 (14.1%) | 677 (90.0%) |
| 19 to 25 Years | 0 (0.0%) | 343 (100.0%) |
| 25 to 34 Years | 26 (5.3%) | 466 (95.7%) |
| 35 to 44 Years | 121 (18.9%) | 491 (76.5%) |
| 45 to 54 Years | 198 (36.7%) | 342 (63.3%) |
| 55 to 64 Years | 91 (17.2%) | 454 (86.0%) |
| 65 to 74 Years | 511 (96.6%) | 234 (44.2%) |
| 75 Years and over | 557 (98.6%) | 408 (72.2%) |
| Total | 1,610 (34.6%) | 3,684 (79.1%) |
Disability Status by Sex by Age in Manlius
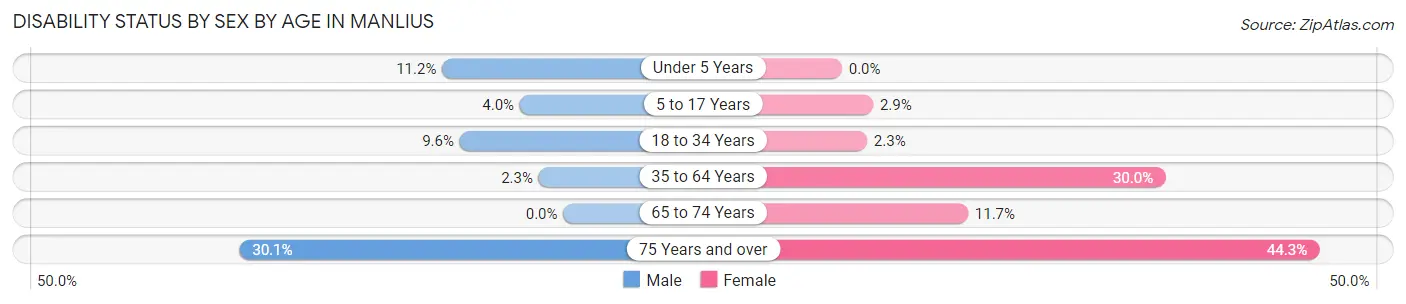
| Age Bracket | Male | Female |
| Under 5 Years | 10 (11.2%) | 0 (0.0%) |
| 5 to 17 Years | 14 (4.0%) | 11 (2.9%) |
| 18 to 34 Years | 54 (9.6%) | 8 (2.3%) |
| 35 to 64 Years | 18 (2.3%) | 276 (30.0%) |
| 65 to 74 Years | 0 (0.0%) | 46 (11.7%) |
| 75 Years and over | 83 (30.1%) | 128 (44.3%) |
Disability Class by Sex by Age in Manlius
Disability Class: Hearing Difficulty
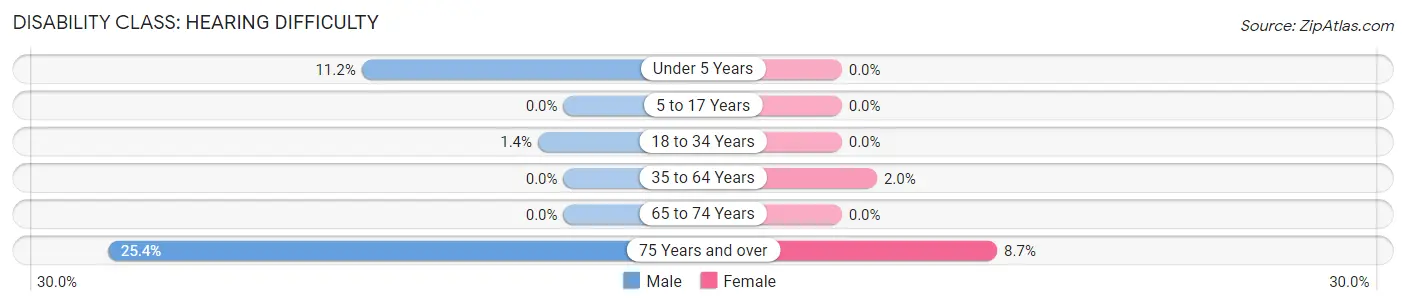
| Age Bracket | Male | Female |
| Under 5 Years | 10 (11.2%) | 0 (0.0%) |
| 5 to 17 Years | 0 (0.0%) | 0 (0.0%) |
| 18 to 34 Years | 8 (1.4%) | 0 (0.0%) |
| 35 to 64 Years | 0 (0.0%) | 18 (2.0%) |
| 65 to 74 Years | 0 (0.0%) | 0 (0.0%) |
| 75 Years and over | 70 (25.4%) | 25 (8.6%) |
Disability Class: Vision Difficulty
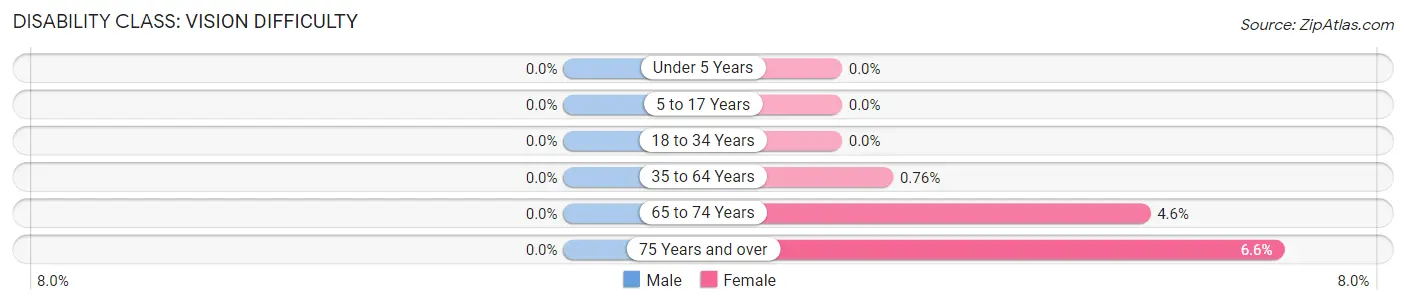
| Age Bracket | Male | Female |
| Under 5 Years | 0 (0.0%) | 0 (0.0%) |
| 5 to 17 Years | 0 (0.0%) | 0 (0.0%) |
| 18 to 34 Years | 0 (0.0%) | 0 (0.0%) |
| 35 to 64 Years | 0 (0.0%) | 7 (0.8%) |
| 65 to 74 Years | 0 (0.0%) | 18 (4.6%) |
| 75 Years and over | 0 (0.0%) | 19 (6.6%) |
Disability Class: Cognitive Difficulty
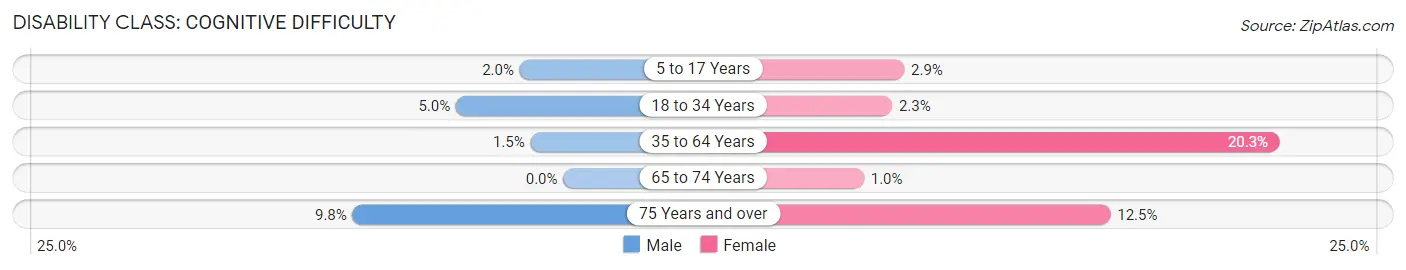
| Age Bracket | Male | Female |
| 5 to 17 Years | 7 (2.0%) | 11 (2.9%) |
| 18 to 34 Years | 28 (5.0%) | 8 (2.3%) |
| 35 to 64 Years | 12 (1.5%) | 187 (20.3%) |
| 65 to 74 Years | 0 (0.0%) | 4 (1.0%) |
| 75 Years and over | 27 (9.8%) | 36 (12.5%) |
Disability Class: Ambulatory Difficulty
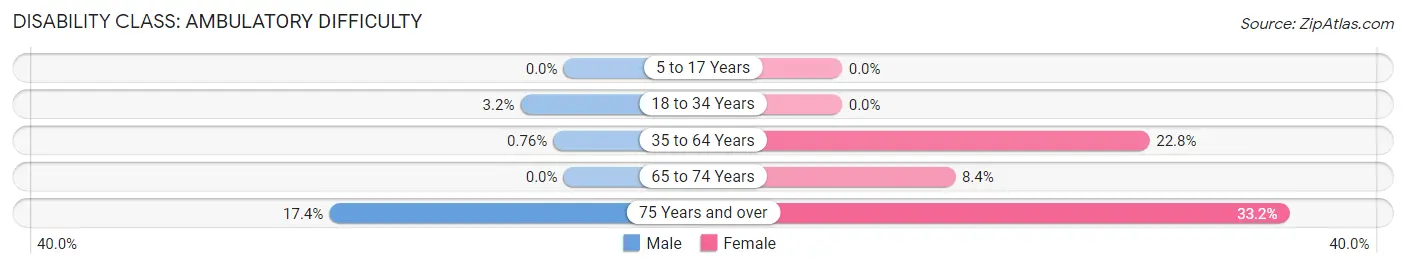
| Age Bracket | Male | Female |
| 5 to 17 Years | 0 (0.0%) | 0 (0.0%) |
| 18 to 34 Years | 18 (3.2%) | 0 (0.0%) |
| 35 to 64 Years | 6 (0.8%) | 210 (22.8%) |
| 65 to 74 Years | 0 (0.0%) | 33 (8.4%) |
| 75 Years and over | 48 (17.4%) | 96 (33.2%) |
Disability Class: Self-Care Difficulty
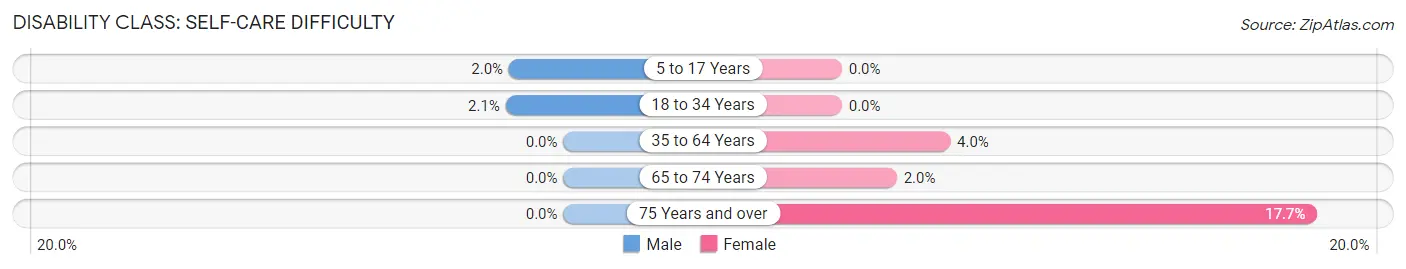
| Age Bracket | Male | Female |
| 5 to 17 Years | 7 (2.0%) | 0 (0.0%) |
| 18 to 34 Years | 12 (2.1%) | 0 (0.0%) |
| 35 to 64 Years | 0 (0.0%) | 37 (4.0%) |
| 65 to 74 Years | 0 (0.0%) | 8 (2.0%) |
| 75 Years and over | 0 (0.0%) | 51 (17.6%) |
Technology Access in Manlius
Computing Device Access in Manlius
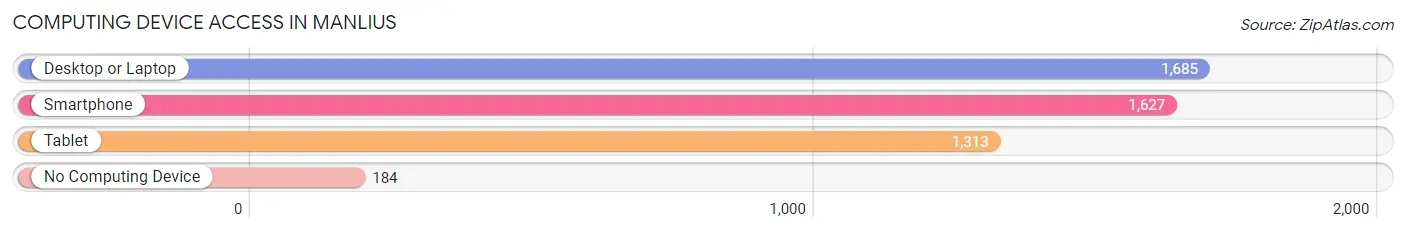
| Device Type | # Households | % Households |
| Desktop or Laptop | 1,685 | 82.3% |
| Smartphone | 1,627 | 79.5% |
| Tablet | 1,313 | 64.1% |
| No Computing Device | 184 | 9.0% |
| Total | 2,047 | 100.0% |
Internet Access in Manlius
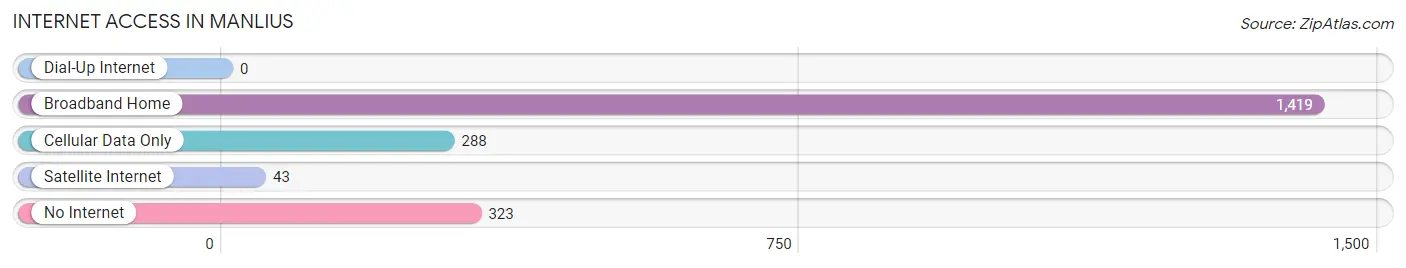
| Internet Type | # Households | % Households |
| Dial-Up Internet | 0 | 0.0% |
| Broadband Home | 1,419 | 69.3% |
| Cellular Data Only | 288 | 14.1% |
| Satellite Internet | 43 | 2.1% |
| No Internet | 323 | 15.8% |
| Total | 2,047 | 100.0% |
Manlius Summary
Manlius, NY is a town located in Onondaga County, New York, United States. The town is located in the eastern part of the county and is part of the Syracuse Metropolitan Statistical Area. As of the 2010 census, the town had a total population of 32,370.
History
The area that is now Manlius was first settled in 1794 by a group of settlers from New England. The town was originally known as "The Corners" and was part of the Central New York Military Tract. The town was officially established in 1813 and was named after Marcus Manlius, a Roman consul who was known for his bravery and courage.
Geography
Manlius is located in the eastern part of Onondaga County, New York. It is bordered by the towns of DeWitt, Pompey, Fabius, and Tully. The town has a total area of 33.2 square miles, of which 32.9 square miles is land and 0.3 square miles is water.
The town is located in the Finger Lakes region of New York and is home to several lakes, including Limestone Creek, Nine Mile Creek, and Onondaga Lake. The town is also home to several parks, including Green Lakes State Park, which is located in the northern part of the town.
Economy
Manlius is home to several businesses and industries, including manufacturing, retail, and healthcare. The town is also home to several educational institutions, including Le Moyne College, Syracuse University, and Onondaga Community College.
The town is also home to several large employers, including Lockheed Martin, Carrier Corporation, and Syracuse University. The town is also home to several small businesses, including restaurants, retail stores, and professional services.
Demographics
As of the 2010 census, there were 32,370 people, 12,845 households, and 8,845 families residing in the town. The population density was 976.2 people per square mile. The racial makeup of the town was 92.2% White, 3.3% African American, 0.3% Native American, 2.2% Asian, 0.1% Pacific Islander, 0.7% from other races, and 1.4% from two or more races. Hispanic or Latino of any race were 3.2% of the population.
The median income for a household in the town was $63,945, and the median income for a family was $77,945. The per capita income for the town was $30,945. About 4.2% of families and 6.2% of the population were below the poverty line, including 8.2% of those under age 18 and 4.2% of those age 65 or over.
Manlius is a diverse and vibrant community with a strong sense of community and a commitment to providing quality services to its residents. The town is home to several parks, recreational facilities, and educational institutions, making it an attractive place to live and work.
Common Questions
What is Per Capita Income in Manlius?
Per Capita income in Manlius is $43,823.
What is the Median Family Income in Manlius?
Median Family Income in Manlius is $115,045.
What is the Median Household income in Manlius?
Median Household Income in Manlius is $70,156.
What is Income or Wage Gap in Manlius?
Income or Wage Gap in Manlius is 0.4%.
Women in Manlius earn 99.6 cents for every dollar earned by a man.
What is Family Income Deficit in Manlius?
Family Income Deficit in Manlius is $13,133.
Families that are below poverty line in Manlius earn $13,133 less on average than the poverty threshold level.
What is Inequality or Gini Index in Manlius?
Inequality or Gini Index in Manlius is 0.48.
What is the Total Population of Manlius?
Total Population of Manlius is 4,675.
What is the Total Male Population of Manlius?
Total Male Population of Manlius is 2,208.
What is the Total Female Population of Manlius?
Total Female Population of Manlius is 2,467.
What is the Ratio of Males per 100 Females in Manlius?
There are 89.50 Males per 100 Females in Manlius.
What is the Ratio of Females per 100 Males in Manlius?
There are 111.73 Females per 100 Males in Manlius.
What is the Median Population Age in Manlius?
Median Population Age in Manlius is 43.1 Years.
What is the Average Family Size in Manlius
Average Family Size in Manlius is 2.9 People.
What is the Average Household Size in Manlius
Average Household Size in Manlius is 2.3 People.
How Large is the Labor Force in Manlius?
There are 2,359 People in the Labor Forcein in Manlius.
What is the Percentage of People in the Labor Force in Manlius?
60.7% of People are in the Labor Force in Manlius.
What is the Unemployment Rate in Manlius?
Unemployment Rate in Manlius is 5.8%.