Lowville, NY Map & Demographics
Lowville Map
Lowville Overview
$30,142
PER CAPITA INCOME
$75,591
AVG FAMILY INCOME
$55,607
AVG HOUSEHOLD INCOME
24.9%
WAGE / INCOME GAP [ % ]
75.1¢/ $1
WAGE / INCOME GAP [ $ ]
0.43
INEQUALITY / GINI INDEX
3,534
TOTAL POPULATION
1,620
MALE POPULATION
1,914
FEMALE POPULATION
84.64
MALES / 100 FEMALES
118.15
FEMALES / 100 MALES
38.2
MEDIAN AGE
2.8
AVG FAMILY SIZE
2.3
AVG HOUSEHOLD SIZE
1,736
LABOR FORCE [ PEOPLE ]
58.6%
PERCENT IN LABOR FORCE
7.6%
UNEMPLOYMENT RATE
Lowville Zip Codes
Lowville Area Codes
Income in Lowville
Income Overview in Lowville
Per Capita Income in Lowville is $30,142, while median incomes of families and households are $75,591 and $55,607 respectively.
| Characteristic | Number | Measure |
| Per Capita Income | 3,534 | $30,142 |
| Median Family Income | 977 | $75,591 |
| Mean Family Income | 977 | $89,292 |
| Median Household Income | 1,487 | $55,607 |
| Mean Household Income | 1,487 | $73,559 |
| Income Deficit | 977 | $0 |
| Wage / Income Gap (%) | 3,534 | 24.94% |
| Wage / Income Gap ($) | 3,534 | 75.06¢ per $1 |
| Gini / Inequality Index | 3,534 | 0.43 |
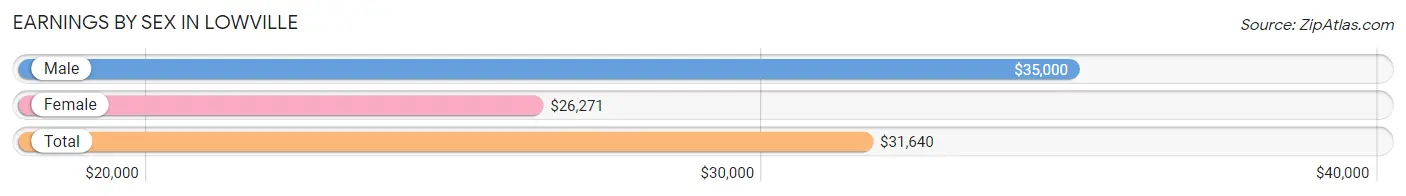
Earnings by Sex in Lowville
Average Earnings in Lowville are $31,640, $35,000 for men and $26,271 for women, a difference of 24.9%.
| Sex | Number | Average Earnings |
| Male | 934 (50.0%) | $35,000 |
| Female | 934 (50.0%) | $26,271 |
| Total | 1,868 (100.0%) | $31,640 |
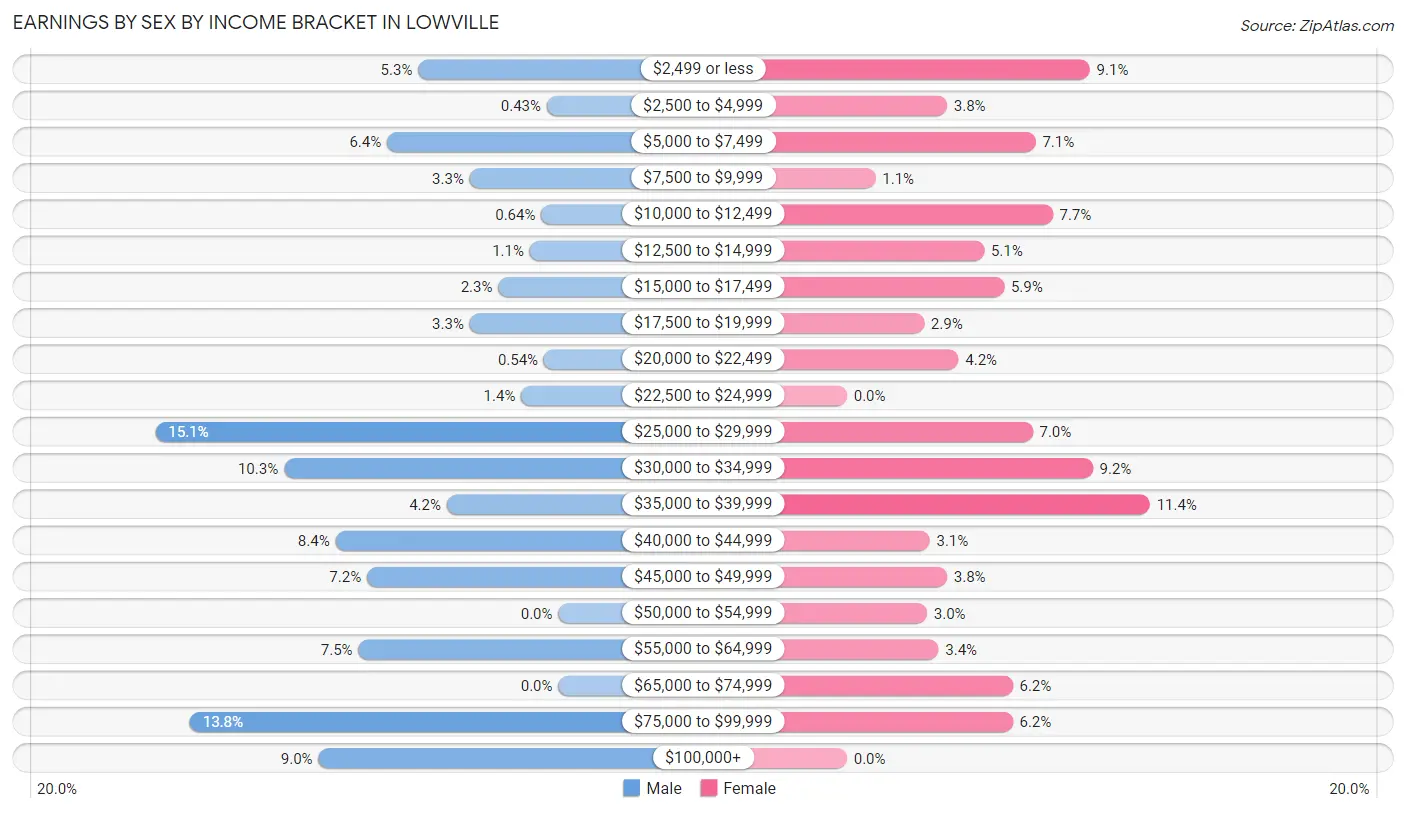
Earnings by Sex by Income Bracket in Lowville
The most common earnings brackets in Lowville are $25,000 to $29,999 for men (141 | 15.1%) and $35,000 to $39,999 for women (106 | 11.4%).
| Income | Male | Female |
| $2,499 or less | 49 (5.2%) | 85 (9.1%) |
| $2,500 to $4,999 | 4 (0.4%) | 35 (3.7%) |
| $5,000 to $7,499 | 60 (6.4%) | 66 (7.1%) |
| $7,500 to $9,999 | 31 (3.3%) | 10 (1.1%) |
| $10,000 to $12,499 | 6 (0.6%) | 72 (7.7%) |
| $12,500 to $14,999 | 10 (1.1%) | 48 (5.1%) |
| $15,000 to $17,499 | 21 (2.2%) | 55 (5.9%) |
| $17,500 to $19,999 | 31 (3.3%) | 27 (2.9%) |
| $20,000 to $22,499 | 5 (0.5%) | 39 (4.2%) |
| $22,500 to $24,999 | 13 (1.4%) | 0 (0.0%) |
| $25,000 to $29,999 | 141 (15.1%) | 65 (7.0%) |
| $30,000 to $34,999 | 96 (10.3%) | 86 (9.2%) |
| $35,000 to $39,999 | 39 (4.2%) | 106 (11.4%) |
| $40,000 to $44,999 | 78 (8.4%) | 29 (3.1%) |
| $45,000 to $49,999 | 67 (7.2%) | 35 (3.7%) |
| $50,000 to $54,999 | 0 (0.0%) | 28 (3.0%) |
| $55,000 to $64,999 | 70 (7.5%) | 32 (3.4%) |
| $65,000 to $74,999 | 0 (0.0%) | 58 (6.2%) |
| $75,000 to $99,999 | 129 (13.8%) | 58 (6.2%) |
| $100,000+ | 84 (9.0%) | 0 (0.0%) |
| Total | 934 (100.0%) | 934 (100.0%) |
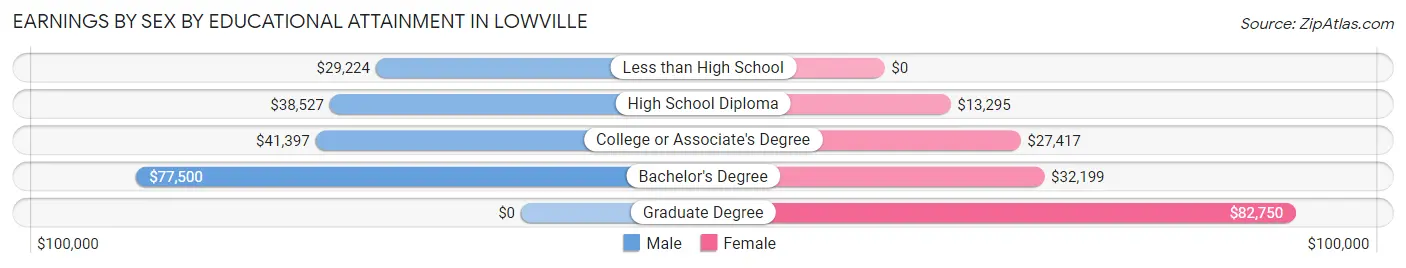
Earnings by Sex by Educational Attainment in Lowville
Average earnings in Lowville are $42,022 for men and $31,250 for women, a difference of 25.6%. Men with an educational attainment of bachelor's degree enjoy the highest average annual earnings of $77,500, while those with less than high school education earn the least with $29,224. Women with an educational attainment of graduate degree earn the most with the average annual earnings of $82,750, while those with high school diploma education have the smallest earnings of $13,295.
| Educational Attainment | Male Income | Female Income |
| Less than High School | $29,224 | $0 |
| High School Diploma | $38,527 | $13,295 |
| College or Associate's Degree | $41,397 | $27,417 |
| Bachelor's Degree | $77,500 | $32,199 |
| Graduate Degree | - | - |
| Total | $42,022 | $31,250 |
Family Income in Lowville
Family Income Brackets in Lowville
According to the Lowville family income data, there are 230 families falling into the $75,000 to $99,999 income range, which is the most common income bracket and makes up 23.5% of all families. Conversely, the $10,000 to $14,999 income bracket is the least frequent group with only 8 families (0.8%) belonging to this category.
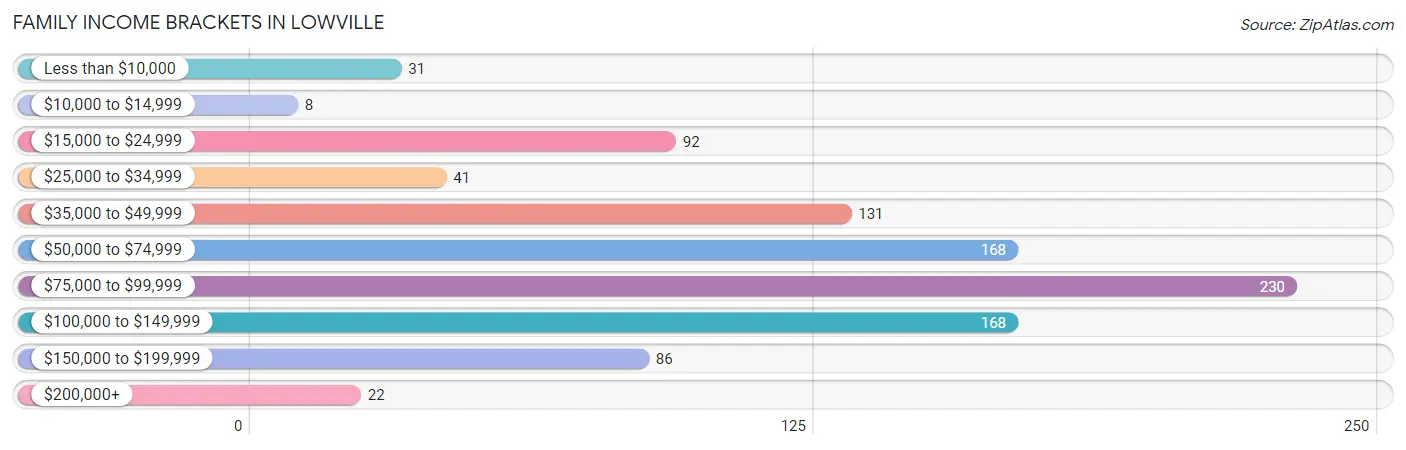
| Income Bracket | # Families | % Families |
| Less than $10,000 | 31 | 3.2% |
| $10,000 to $14,999 | 8 | 0.8% |
| $15,000 to $24,999 | 92 | 9.4% |
| $25,000 to $34,999 | 41 | 4.2% |
| $35,000 to $49,999 | 131 | 13.4% |
| $50,000 to $74,999 | 168 | 17.2% |
| $75,000 to $99,999 | 230 | 23.5% |
| $100,000 to $149,999 | 168 | 17.2% |
| $150,000 to $199,999 | 86 | 8.8% |
| $200,000+ | 22 | 2.3% |
Family Income by Famaliy Size in Lowville
4-person families (200 | 20.5%) account for the highest median family income in Lowville with $82,833 per family, while 2-person families (495 | 50.7%) have the highest median income of $40,117 per family member.
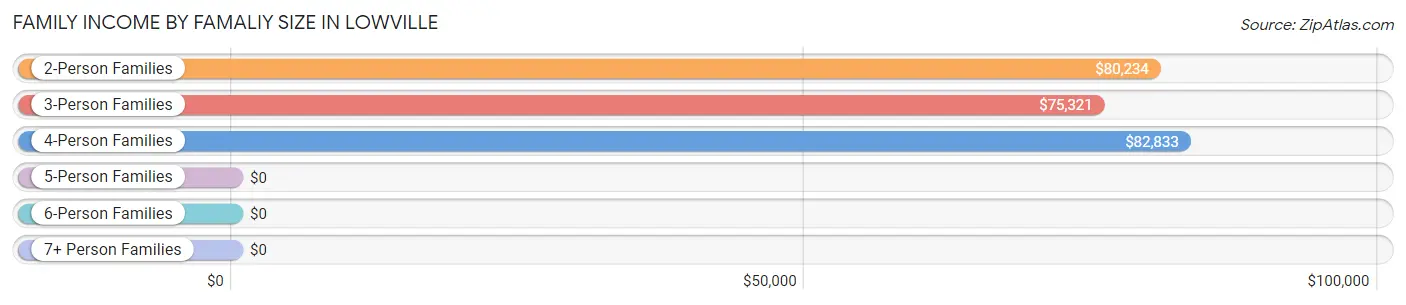
| Income Bracket | # Families | Median Income |
| 2-Person Families | 495 (50.7%) | $80,234 |
| 3-Person Families | 196 (20.1%) | $75,321 |
| 4-Person Families | 200 (20.5%) | $82,833 |
| 5-Person Families | 52 (5.3%) | $0 |
| 6-Person Families | 34 (3.5%) | $0 |
| 7+ Person Families | 0 (0.0%) | $0 |
| Total | 977 (100.0%) | $75,591 |
Family Income by Number of Earners in Lowville
The median family income in Lowville is $75,591, with families comprising no earners (116) having the highest median family income of $90,234, while families with 1 earner (273) have the lowest median family income of $47,974, accounting for 11.9% and 27.9% of families, respectively.
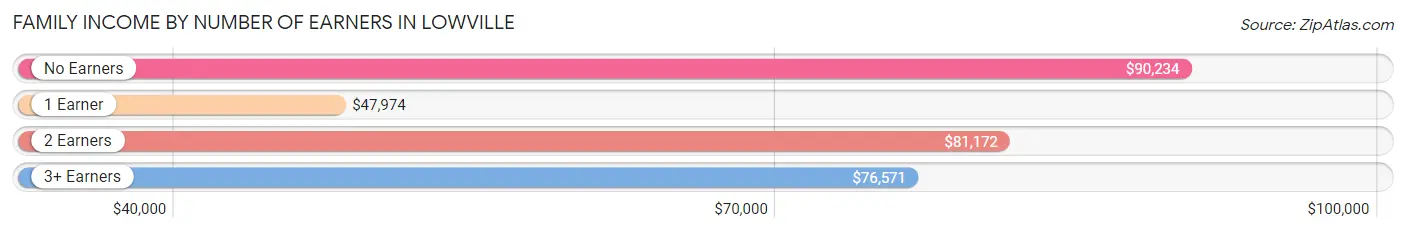
| Number of Earners | # Families | Median Income |
| No Earners | 116 (11.9%) | $90,234 |
| 1 Earner | 273 (27.9%) | $47,974 |
| 2 Earners | 479 (49.0%) | $81,172 |
| 3+ Earners | 109 (11.2%) | $76,571 |
| Total | 977 (100.0%) | $75,591 |
Household Income in Lowville
Household Income Brackets in Lowville
With 288 households falling in the category, the $35,000 to $49,999 income range is the most frequent in Lowville, accounting for 19.4% of all households. In contrast, only 22 households (1.5%) fall into the $200,000+ income bracket, making it the least populous group.
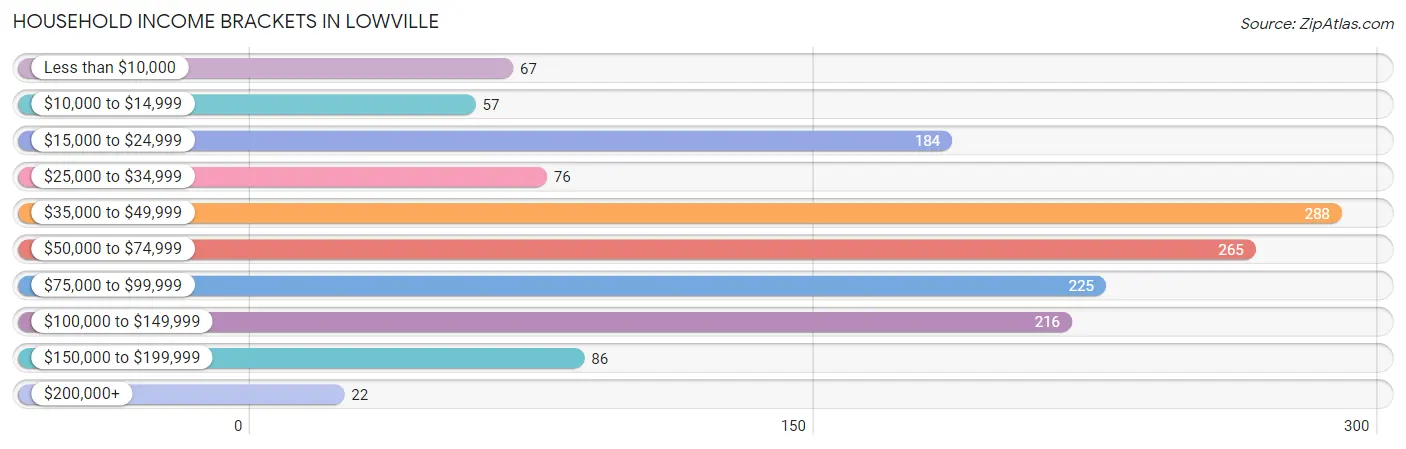
| Income Bracket | # Households | % Households |
| Less than $10,000 | 67 | 4.5% |
| $10,000 to $14,999 | 57 | 3.8% |
| $15,000 to $24,999 | 184 | 12.4% |
| $25,000 to $34,999 | 76 | 5.1% |
| $35,000 to $49,999 | 288 | 19.4% |
| $50,000 to $74,999 | 265 | 17.8% |
| $75,000 to $99,999 | 225 | 15.1% |
| $100,000 to $149,999 | 216 | 14.5% |
| $150,000 to $199,999 | 86 | 5.8% |
| $200,000+ | 22 | 1.5% |
Household Income by Householder Age in Lowville
The median household income in Lowville is $55,607, with the highest median household income of $72,452 found in the 25 to 44 years age bracket for the primary householder. A total of 393 households (26.4%) fall into this category. Meanwhile, the 15 to 24 years age bracket for the primary householder has the lowest median household income of $0, with 131 households (8.8%) in this group.
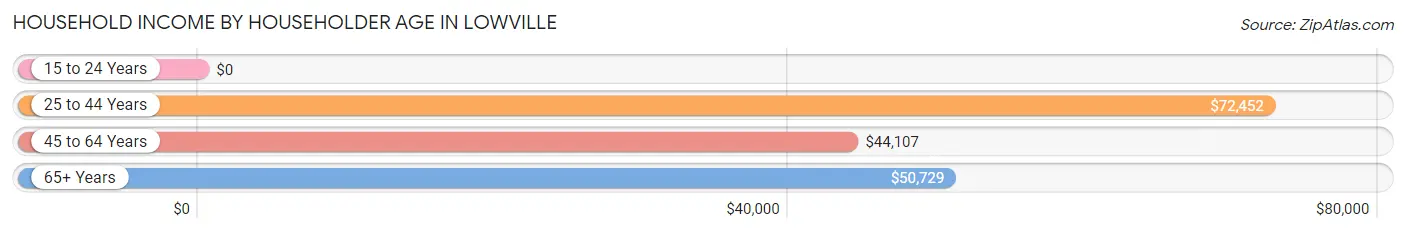
| Income Bracket | # Households | Median Income |
| 15 to 24 Years | 131 (8.8%) | $0 |
| 25 to 44 Years | 393 (26.4%) | $72,452 |
| 45 to 64 Years | 586 (39.4%) | $44,107 |
| 65+ Years | 377 (25.4%) | $50,729 |
| Total | 1,487 (100.0%) | $55,607 |
Poverty in Lowville
Income Below Poverty by Sex and Age in Lowville
With 11.5% poverty level for males and 19.3% for females among the residents of Lowville, 6 to 11 year old males and 16 and 17 year old females are the most vulnerable to poverty, with 43 males (46.7%) and 10 females (100.0%) in their respective age groups living below the poverty level.
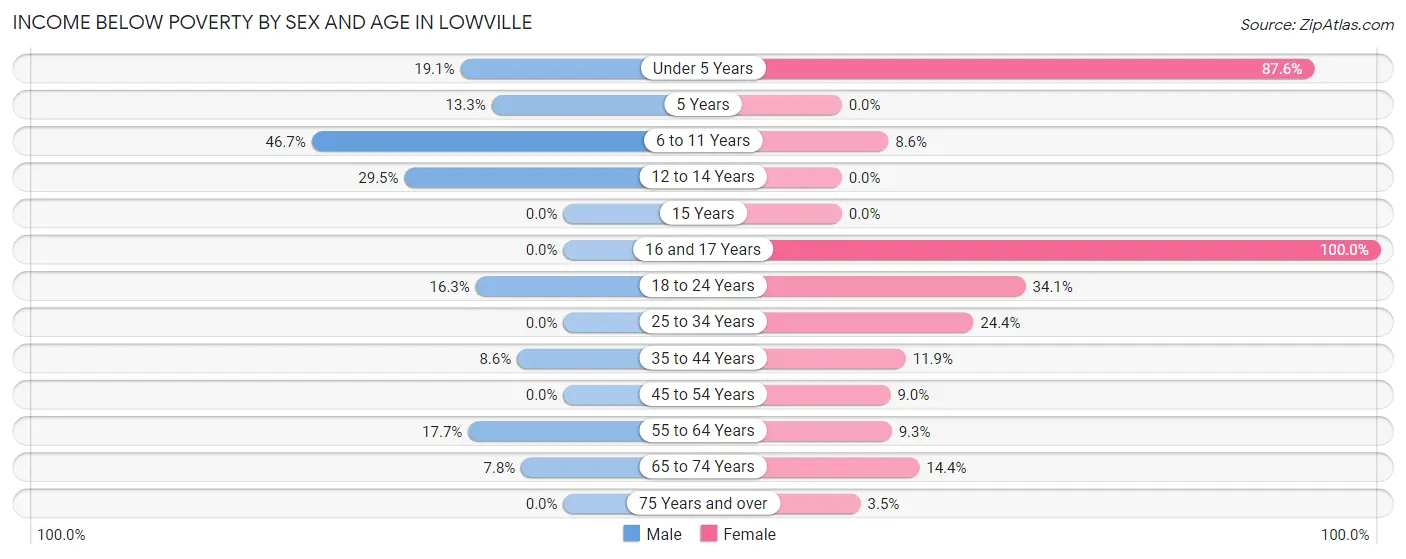
| Age Bracket | Male | Female |
| Under 5 Years | 13 (19.1%) | 78 (87.6%) |
| 5 Years | 2 (13.3%) | 0 (0.0%) |
| 6 to 11 Years | 43 (46.7%) | 12 (8.6%) |
| 12 to 14 Years | 18 (29.5%) | 0 (0.0%) |
| 15 Years | 0 (0.0%) | 0 (0.0%) |
| 16 and 17 Years | 0 (0.0%) | 10 (100.0%) |
| 18 to 24 Years | 36 (16.3%) | 116 (34.1%) |
| 25 to 34 Years | 0 (0.0%) | 53 (24.4%) |
| 35 to 44 Years | 14 (8.6%) | 31 (11.9%) |
| 45 to 54 Years | 0 (0.0%) | 16 (9.0%) |
| 55 to 64 Years | 44 (17.7%) | 23 (9.3%) |
| 65 to 74 Years | 13 (7.8%) | 23 (14.4%) |
| 75 Years and over | 0 (0.0%) | 6 (3.5%) |
| Total | 183 (11.5%) | 368 (19.3%) |
Income Above Poverty by Sex and Age in Lowville
According to the poverty statistics in Lowville, males aged 16 and 17 years and females aged 5 years are the age groups that are most secure financially, with 100.0% of males and 100.0% of females in these age groups living above the poverty line.
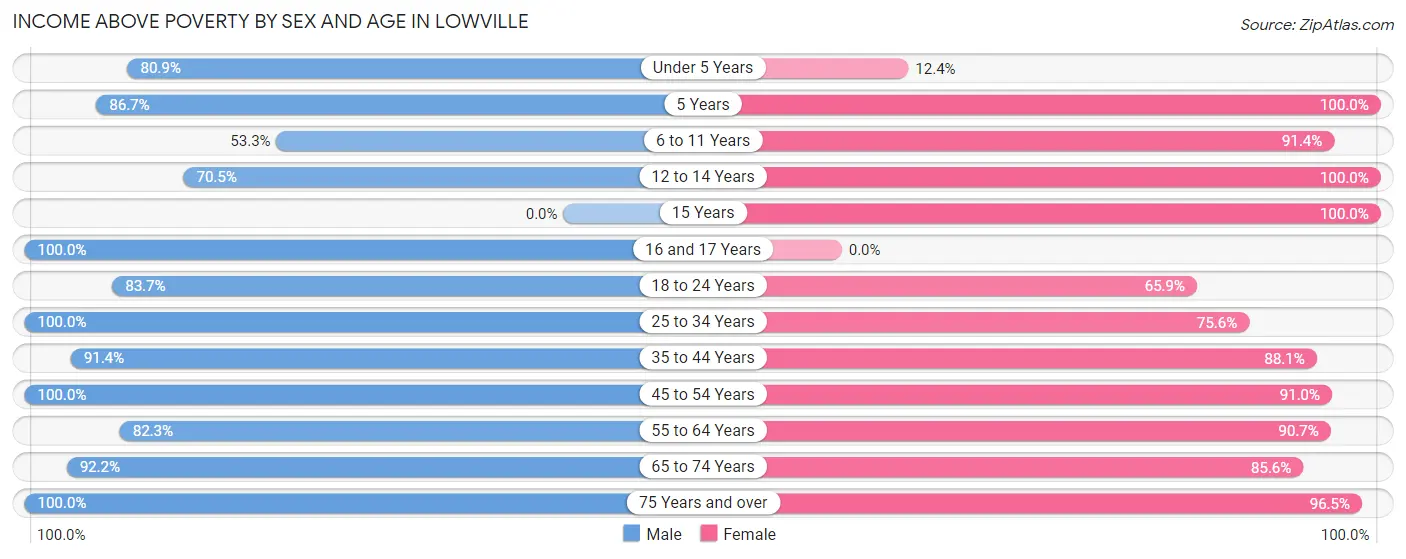
| Age Bracket | Male | Female |
| Under 5 Years | 55 (80.9%) | 11 (12.4%) |
| 5 Years | 13 (86.7%) | 7 (100.0%) |
| 6 to 11 Years | 49 (53.3%) | 127 (91.4%) |
| 12 to 14 Years | 43 (70.5%) | 38 (100.0%) |
| 15 Years | 0 (0.0%) | 49 (100.0%) |
| 16 and 17 Years | 59 (100.0%) | 0 (0.0%) |
| 18 to 24 Years | 185 (83.7%) | 224 (65.9%) |
| 25 to 34 Years | 222 (100.0%) | 164 (75.6%) |
| 35 to 44 Years | 149 (91.4%) | 230 (88.1%) |
| 45 to 54 Years | 185 (100.0%) | 161 (91.0%) |
| 55 to 64 Years | 205 (82.3%) | 225 (90.7%) |
| 65 to 74 Years | 153 (92.2%) | 137 (85.6%) |
| 75 Years and over | 88 (100.0%) | 166 (96.5%) |
| Total | 1,406 (88.5%) | 1,539 (80.7%) |
Income Below Poverty Among Married-Couple Families in Lowville
The poverty statistics for married-couple families in Lowville show that 1.2% or 8 of the total 657 families live below the poverty line. Families with no children have the highest poverty rate of 2.0%, comprising of 8 families. On the other hand, families with 1 or 2 children have the lowest poverty rate of 0.0%, which includes 0 families.
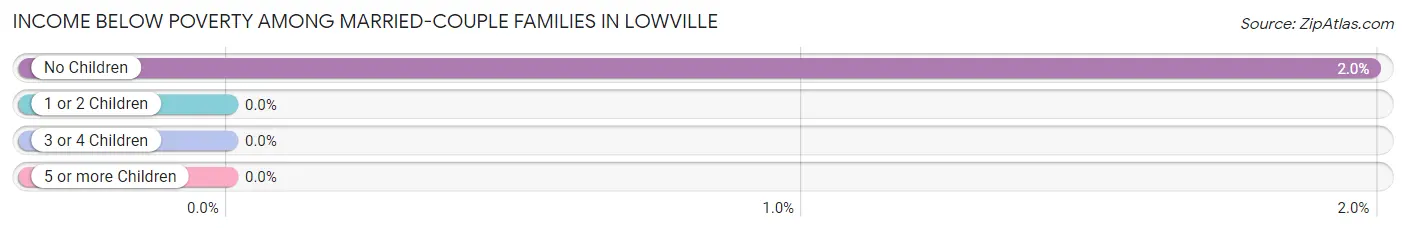
| Children | Above Poverty | Below Poverty |
| No Children | 394 (98.0%) | 8 (2.0%) |
| 1 or 2 Children | 219 (100.0%) | 0 (0.0%) |
| 3 or 4 Children | 36 (100.0%) | 0 (0.0%) |
| 5 or more Children | 0 (0.0%) | 0 (0.0%) |
| Total | 649 (98.8%) | 8 (1.2%) |
Income Below Poverty Among Single-Parent Households in Lowville
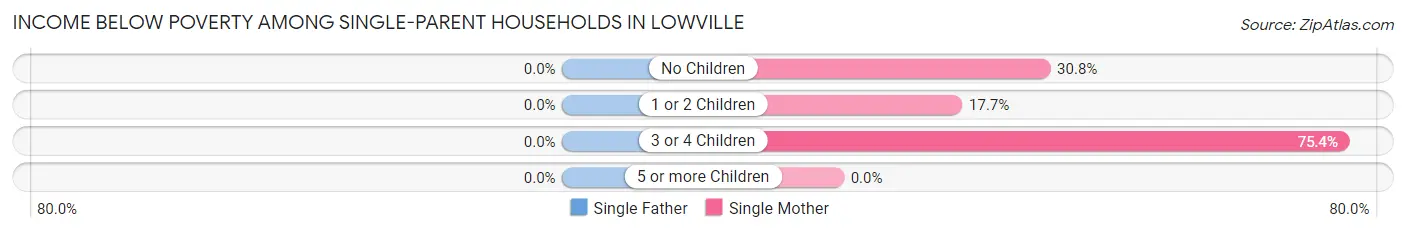
| Children | Single Father | Single Mother |
| No Children | 0 (0.0%) | 44 (30.8%) |
| 1 or 2 Children | 0 (0.0%) | 12 (17.6%) |
| 3 or 4 Children | 0 (0.0%) | 46 (75.4%) |
| 5 or more Children | 0 (0.0%) | 0 (0.0%) |
| Total | 0 (0.0%) | 102 (37.5%) |
Income Below Poverty Among Married-Couple vs Single-Parent Households in Lowville
The poverty data for Lowville shows that 8 of the married-couple family households (1.2%) and 102 of the single-parent households (31.9%) are living below the poverty level. Within the married-couple family households, those with no children have the highest poverty rate, with 8 households (2.0%) falling below the poverty line. Among the single-parent households, those with 3 or 4 children have the highest poverty rate, with 46 household (75.4%) living below poverty.
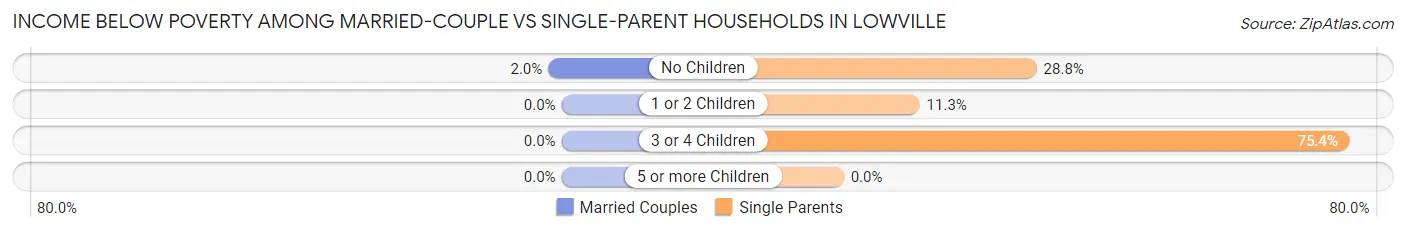
| Children | Married-Couple Families | Single-Parent Households |
| No Children | 8 (2.0%) | 44 (28.8%) |
| 1 or 2 Children | 0 (0.0%) | 12 (11.3%) |
| 3 or 4 Children | 0 (0.0%) | 46 (75.4%) |
| 5 or more Children | 0 (0.0%) | 0 (0.0%) |
| Total | 8 (1.2%) | 102 (31.9%) |
Race in Lowville
The most populous races in Lowville are White / Caucasian (3,204 | 90.7%), Two or more Races (187 | 5.3%), and Hispanic or Latino (137 | 3.9%).
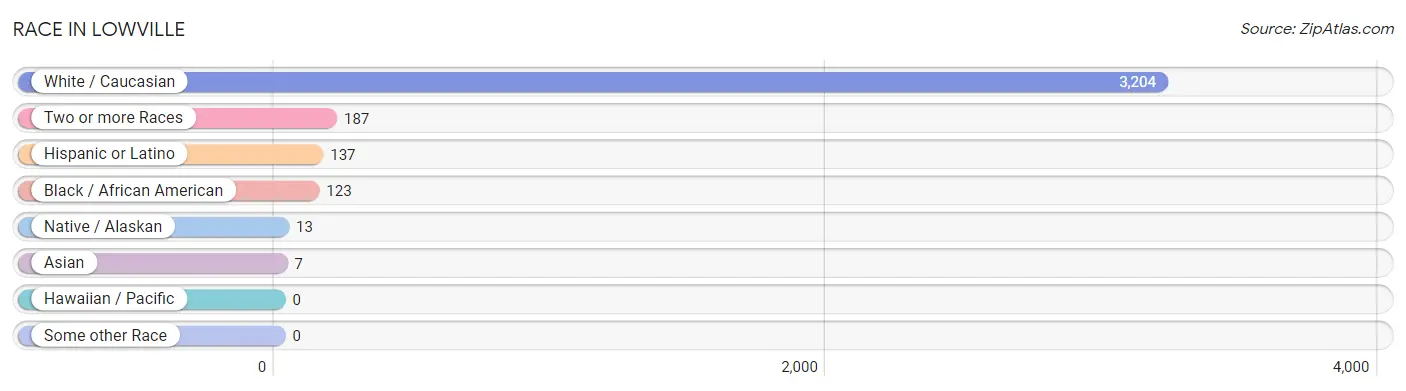
| Race | # Population | % Population |
| Asian | 7 | 0.2% |
| Black / African American | 123 | 3.5% |
| Hawaiian / Pacific | 0 | 0.0% |
| Hispanic or Latino | 137 | 3.9% |
| Native / Alaskan | 13 | 0.4% |
| White / Caucasian | 3,204 | 90.7% |
| Two or more Races | 187 | 5.3% |
| Some other Race | 0 | 0.0% |
| Total | 3,534 | 100.0% |
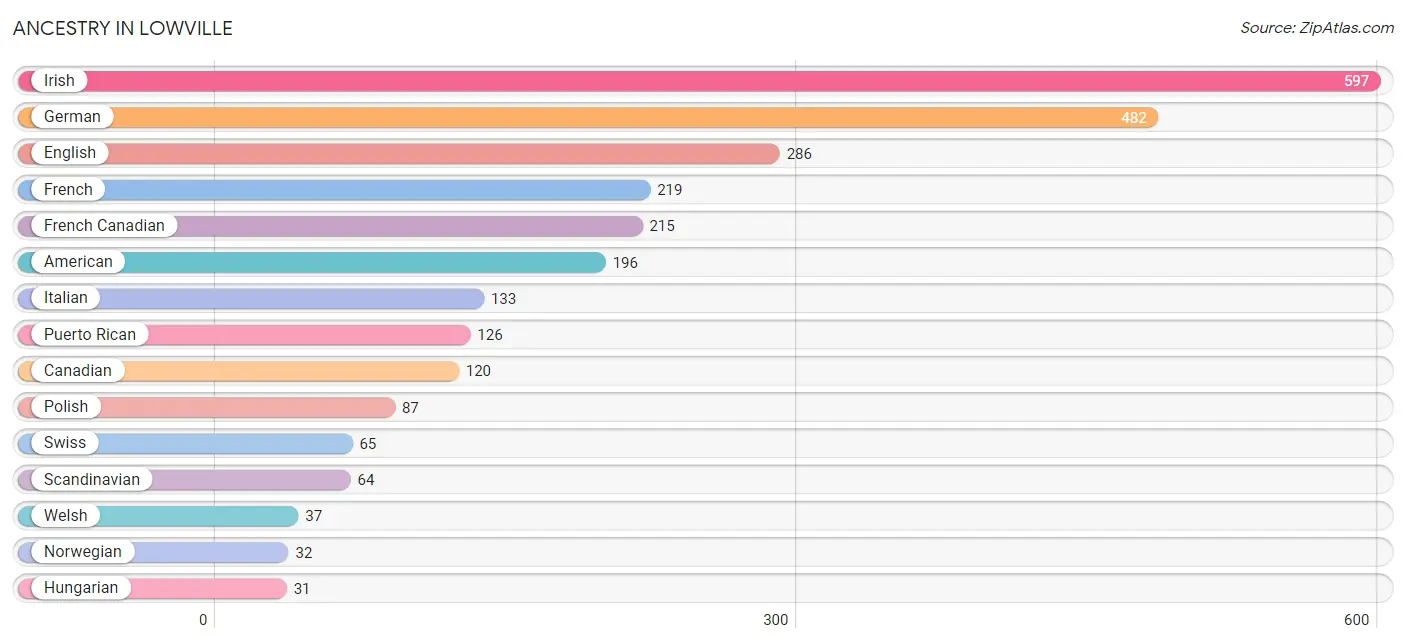
Ancestry in Lowville
The most populous ancestries reported in Lowville are Irish (597 | 16.9%), German (482 | 13.6%), English (286 | 8.1%), French (219 | 6.2%), and French Canadian (215 | 6.1%), together accounting for 50.9% of all Lowville residents.
| Ancestry | # Population | % Population |
| American | 196 | 5.6% |
| Bhutanese | 1 | 0.0% |
| Canadian | 120 | 3.4% |
| Central American | 11 | 0.3% |
| Dutch | 29 | 0.8% |
| English | 286 | 8.1% |
| European | 12 | 0.3% |
| French | 219 | 6.2% |
| French Canadian | 215 | 6.1% |
| German | 482 | 13.6% |
| Honduran | 11 | 0.3% |
| Hungarian | 31 | 0.9% |
| Indian (Asian) | 6 | 0.2% |
| Irish | 597 | 16.9% |
| Iroquois | 7 | 0.2% |
| Italian | 133 | 3.8% |
| Northern European | 16 | 0.4% |
| Norwegian | 32 | 0.9% |
| Polish | 87 | 2.5% |
| Puerto Rican | 126 | 3.6% |
| Russian | 11 | 0.3% |
| Scandinavian | 64 | 1.8% |
| Scotch-Irish | 24 | 0.7% |
| Scottish | 11 | 0.3% |
| Swiss | 65 | 1.8% |
| Welsh | 37 | 1.1% | View All 26 Rows |
Immigrants in Lowville
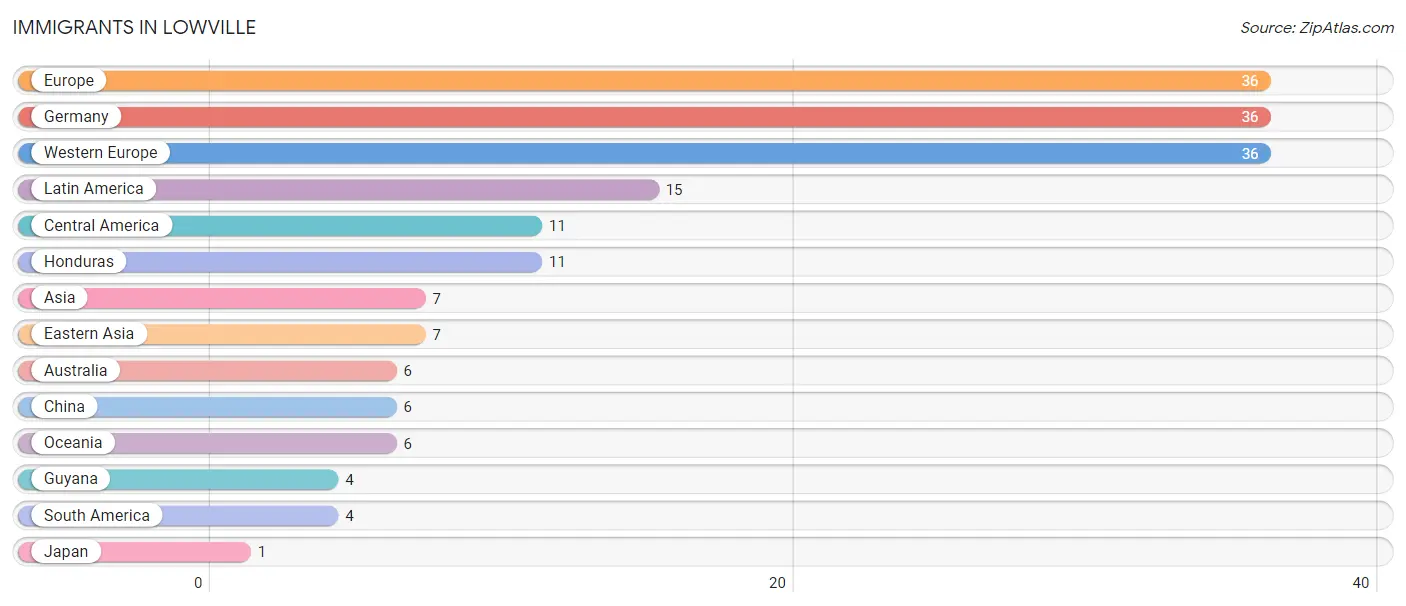
The most numerous immigrant groups reported in Lowville came from Europe (36 | 1.0%), Germany (36 | 1.0%), Western Europe (36 | 1.0%), Latin America (15 | 0.4%), and Central America (11 | 0.3%), together accounting for 3.8% of all Lowville residents.
| Immigration Origin | # Population | % Population |
| Asia | 7 | 0.2% |
| Australia | 6 | 0.2% |
| Central America | 11 | 0.3% |
| China | 6 | 0.2% |
| Eastern Asia | 7 | 0.2% |
| Europe | 36 | 1.0% |
| Germany | 36 | 1.0% |
| Guyana | 4 | 0.1% |
| Honduras | 11 | 0.3% |
| Japan | 1 | 0.0% |
| Latin America | 15 | 0.4% |
| Oceania | 6 | 0.2% |
| South America | 4 | 0.1% |
| Western Europe | 36 | 1.0% | View All 14 Rows |
Sex and Age in Lowville
Sex and Age in Lowville
The most populous age groups in Lowville are 25 to 29 Years (178 | 11.0%) for men and 20 to 24 Years (271 | 14.2%) for women.
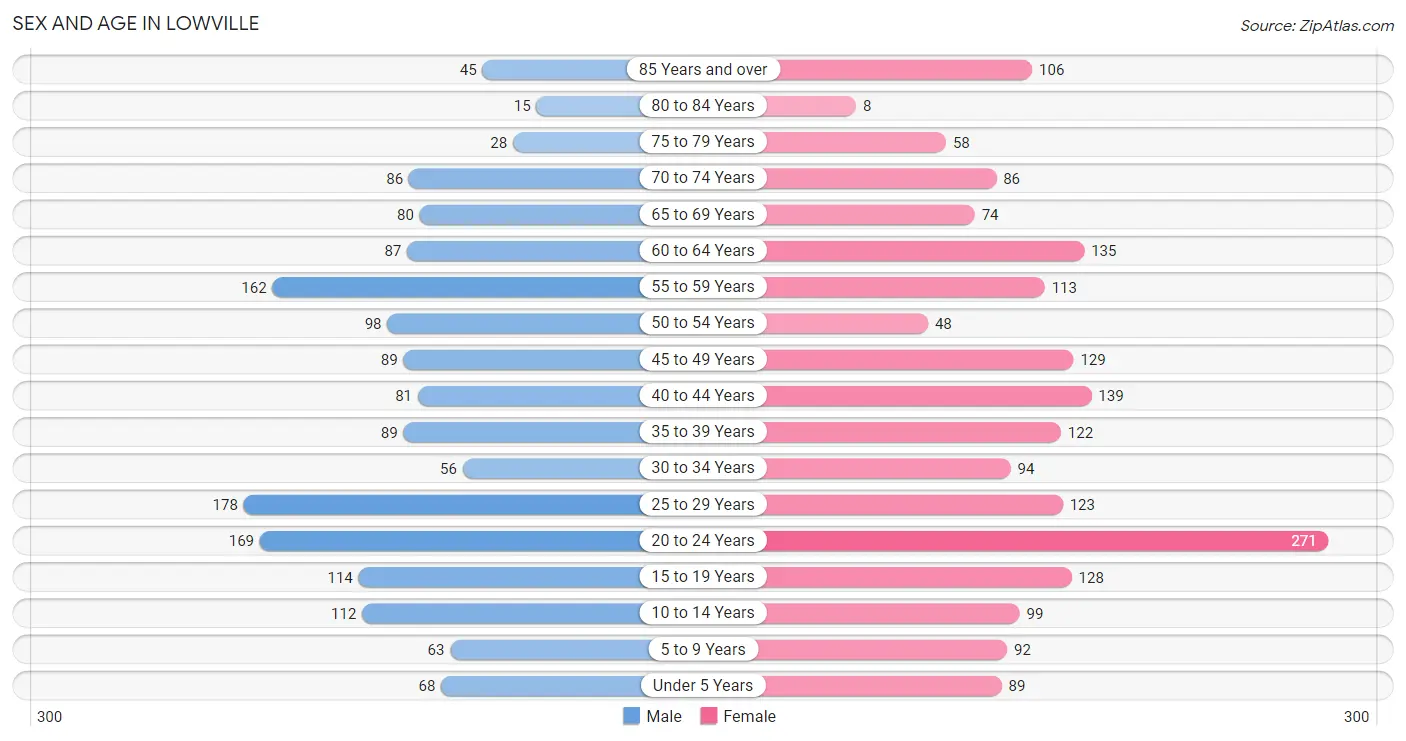
| Age Bracket | Male | Female |
| Under 5 Years | 68 (4.2%) | 89 (4.6%) |
| 5 to 9 Years | 63 (3.9%) | 92 (4.8%) |
| 10 to 14 Years | 112 (6.9%) | 99 (5.2%) |
| 15 to 19 Years | 114 (7.0%) | 128 (6.7%) |
| 20 to 24 Years | 169 (10.4%) | 271 (14.2%) |
| 25 to 29 Years | 178 (11.0%) | 123 (6.4%) |
| 30 to 34 Years | 56 (3.5%) | 94 (4.9%) |
| 35 to 39 Years | 89 (5.5%) | 122 (6.4%) |
| 40 to 44 Years | 81 (5.0%) | 139 (7.3%) |
| 45 to 49 Years | 89 (5.5%) | 129 (6.7%) |
| 50 to 54 Years | 98 (6.0%) | 48 (2.5%) |
| 55 to 59 Years | 162 (10.0%) | 113 (5.9%) |
| 60 to 64 Years | 87 (5.4%) | 135 (7.0%) |
| 65 to 69 Years | 80 (4.9%) | 74 (3.9%) |
| 70 to 74 Years | 86 (5.3%) | 86 (4.5%) |
| 75 to 79 Years | 28 (1.7%) | 58 (3.0%) |
| 80 to 84 Years | 15 (0.9%) | 8 (0.4%) |
| 85 Years and over | 45 (2.8%) | 106 (5.5%) |
| Total | 1,620 (100.0%) | 1,914 (100.0%) |
Families and Households in Lowville
Median Family Size in Lowville
The median family size in Lowville is 2.80 persons per family, with single male/father families (48 | 4.9%) accounting for the largest median family size of 2.98 persons per family. On the other hand, married-couple families (657 | 67.2%) represent the smallest median family size with 2.74 persons per family.
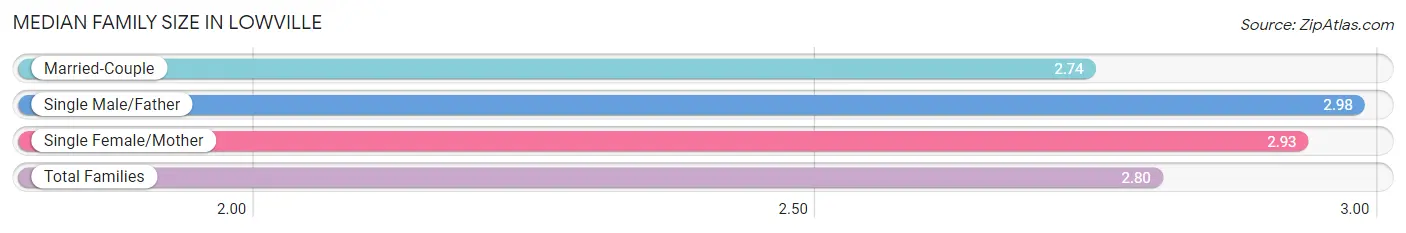
| Family Type | # Families | Family Size |
| Married-Couple | 657 (67.2%) | 2.74 |
| Single Male/Father | 48 (4.9%) | 2.98 |
| Single Female/Mother | 272 (27.8%) | 2.93 |
| Total Families | 977 (100.0%) | 2.80 |
Median Household Size in Lowville
The median household size in Lowville is 2.32 persons per household, with single male/father households (48 | 3.2%) accounting for the largest median household size of 3.92 persons per household. non-family households (510 | 34.3%) represent the smallest median household size with 1.10 persons per household.
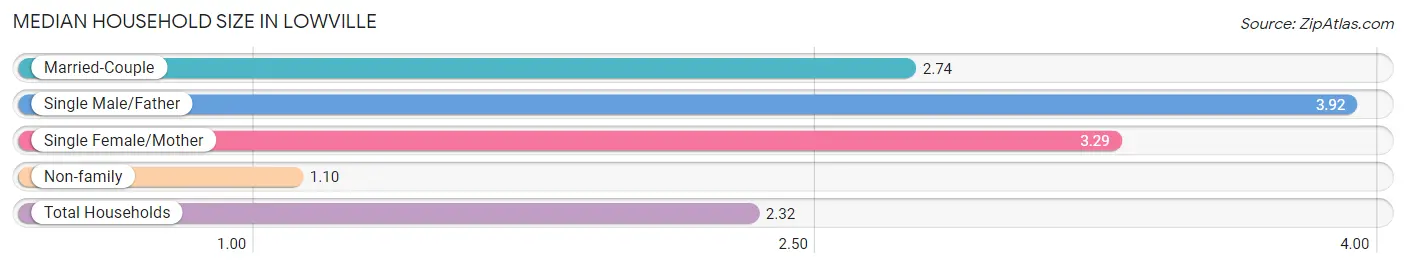
| Household Type | # Households | Household Size |
| Married-Couple | 657 (44.2%) | 2.74 |
| Single Male/Father | 48 (3.2%) | 3.92 |
| Single Female/Mother | 272 (18.3%) | 3.29 |
| Non-family | 510 (34.3%) | 1.10 |
| Total Households | 1,487 (100.0%) | 2.32 |
Household Size by Marriage Status in Lowville
Out of a total of 1,487 households in Lowville, 977 (65.7%) are family households, while 510 (34.3%) are nonfamily households. The most numerous type of family households are 2-person households, comprising 487, and the most common type of nonfamily households are 1-person households, comprising 460.
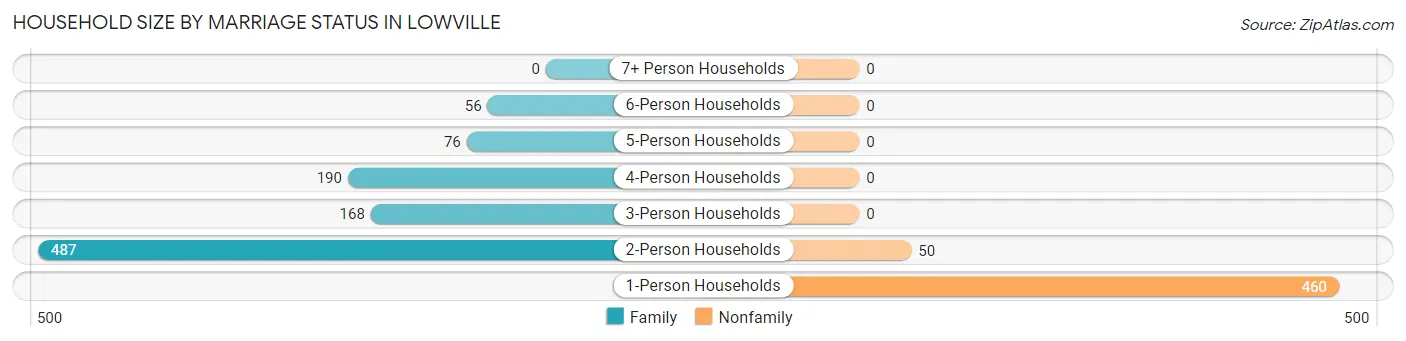
| Household Size | Family Households | Nonfamily Households |
| 1-Person Households | - | 460 (30.9%) |
| 2-Person Households | 487 (32.8%) | 50 (3.4%) |
| 3-Person Households | 168 (11.3%) | 0 (0.0%) |
| 4-Person Households | 190 (12.8%) | 0 (0.0%) |
| 5-Person Households | 76 (5.1%) | 0 (0.0%) |
| 6-Person Households | 56 (3.8%) | 0 (0.0%) |
| 7+ Person Households | 0 (0.0%) | 0 (0.0%) |
| Total | 977 (65.7%) | 510 (34.3%) |
Female Fertility in Lowville
Fertility by Age in Lowville
| Age Bracket | Women with Births | Births / 1,000 Women |
| 15 to 19 years | 0 (0.0%) | 0.0 |
| 20 to 34 years | 0 (0.0%) | 0.0 |
| 35 to 50 years | 0 (0.0%) | 0.0 |
| Total | 0 (0.0%) | 0.0 |
Fertility by Age by Marriage Status in Lowville
| Age Bracket | Married | Unmarried |
| 15 to 19 years | 0 (0.0%) | 0 (0.0%) |
| 20 to 34 years | 0 (0.0%) | 0 (0.0%) |
| 35 to 50 years | 0 (0.0%) | 0 (0.0%) |
| Total | 0 (0.0%) | 0 (0.0%) |
Fertility by Education in Lowville
| Educational Attainment | Women with Births | Births / 1,000 Women |
| Less than High School | 0 (0.0%) | 0.0 |
| High School Diploma | 0 (0.0%) | 0.0 |
| College or Associate's Degree | 0 (0.0%) | 0.0 |
| Bachelor's Degree | 0 (0.0%) | 0.0 |
| Graduate Degree | 0 (0.0%) | 0.0 |
| Total | 0 (0.0%) | 0.0 |
Fertility by Education by Marriage Status in Lowville
| Educational Attainment | Married | Unmarried |
| Less than High School | 0 (0.0%) | 0 (0.0%) |
| High School Diploma | 0 (0.0%) | 0 (0.0%) |
| College or Associate's Degree | 0 (0.0%) | 0 (0.0%) |
| Bachelor's Degree | 0 (0.0%) | 0 (0.0%) |
| Graduate Degree | 0 (0.0%) | 0 (0.0%) |
| Total | 0 (0.0%) | 0 (0.0%) |
Employment Characteristics in Lowville
Employment by Class of Employer in Lowville
Among the 1,570 employed individuals in Lowville, private company employees (851 | 54.2%), local government employees (404 | 25.7%), and not-for-profit organizations (88 | 5.6%) make up the most common classes of employment.
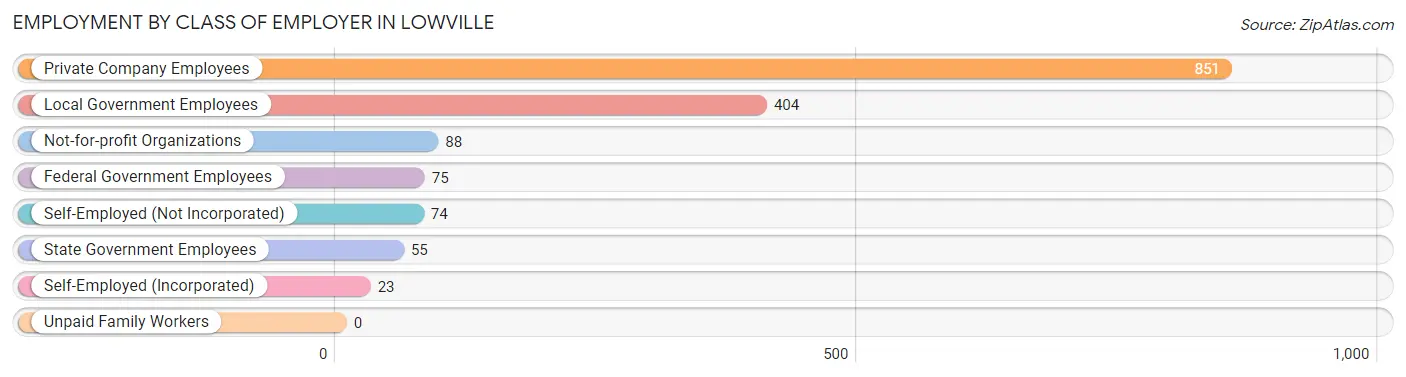
| Employer Class | # Employees | % Employees |
| Private Company Employees | 851 | 54.2% |
| Self-Employed (Incorporated) | 23 | 1.5% |
| Self-Employed (Not Incorporated) | 74 | 4.7% |
| Not-for-profit Organizations | 88 | 5.6% |
| Local Government Employees | 404 | 25.7% |
| State Government Employees | 55 | 3.5% |
| Federal Government Employees | 75 | 4.8% |
| Unpaid Family Workers | 0 | 0.0% |
| Total | 1,570 | 100.0% |
Employment Status by Age in Lowville
According to the labor force statistics for Lowville, out of the total population over 16 years of age (2,962), 58.6% or 1,736 individuals are in the labor force, with 7.6% or 132 of them unemployed. The age group with the highest labor force participation rate is 45 to 54 years, with 89.8% or 327 individuals in the labor force. Within the labor force, the 16 to 19 years age range has the highest percentage of unemployed individuals, with 39.0% or 32 of them being unemployed.
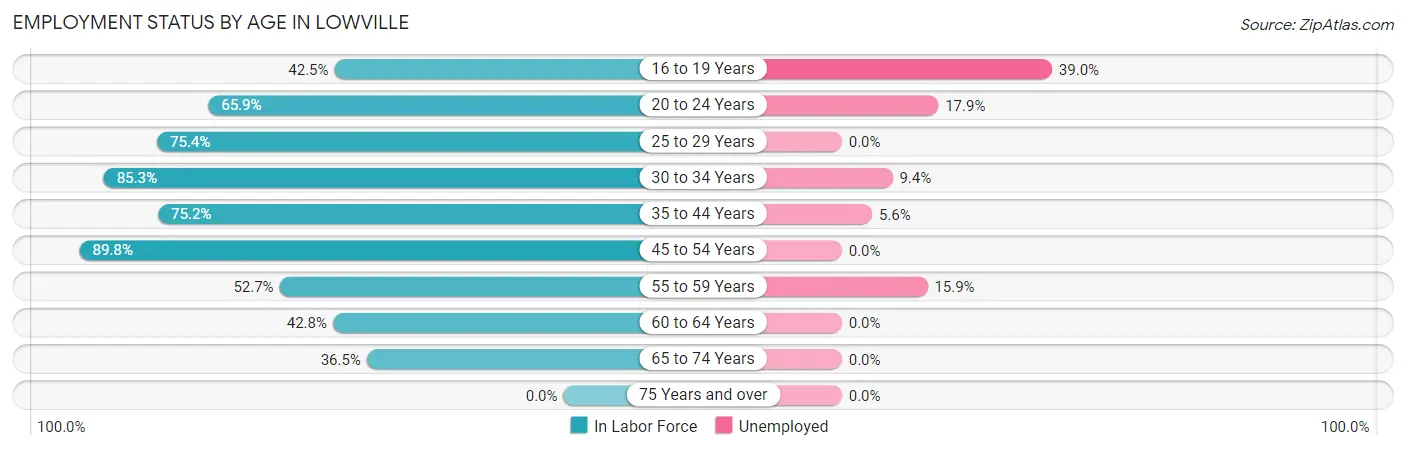
| Age Bracket | In Labor Force | Unemployed |
| 16 to 19 Years | 82 (42.5%) | 32 (39.0%) |
| 20 to 24 Years | 290 (65.9%) | 52 (17.9%) |
| 25 to 29 Years | 227 (75.4%) | 0 (0.0%) |
| 30 to 34 Years | 128 (85.3%) | 12 (9.4%) |
| 35 to 44 Years | 324 (75.2%) | 18 (5.6%) |
| 45 to 54 Years | 327 (89.8%) | 0 (0.0%) |
| 55 to 59 Years | 145 (52.7%) | 23 (15.9%) |
| 60 to 64 Years | 95 (42.8%) | 0 (0.0%) |
| 65 to 74 Years | 119 (36.5%) | 0 (0.0%) |
| 75 Years and over | 0 (0.0%) | 0 (0.0%) |
| Total | 1,736 (58.6%) | 132 (7.6%) |
Employment Status by Educational Attainment in Lowville
According to labor force statistics for Lowville, 71.5% of individuals (1,246) out of the total population between 25 and 64 years of age (1,743) are in the labor force, with 4.3% or 54 of them being unemployed. The group with the highest labor force participation rate are those with the educational attainment of bachelor's degree or higher, with 84.6% or 319 individuals in the labor force. Within the labor force, individuals with bachelor's degree or higher education have the highest percentage of unemployment, with 7.2% or 23 of them being unemployed.
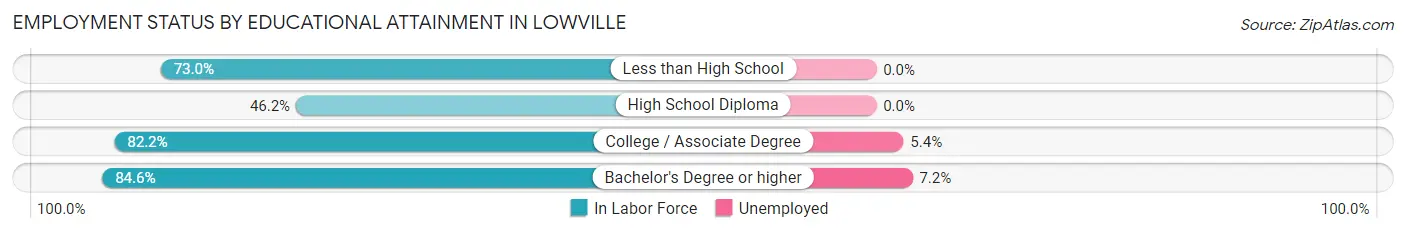
| Educational Attainment | In Labor Force | Unemployed |
| Less than High School | 143 (73.0%) | 0 (0.0%) |
| High School Diploma | 228 (46.2%) | 0 (0.0%) |
| College / Associate Degree | 556 (82.2%) | 37 (5.4%) |
| Bachelor's Degree or higher | 319 (84.6%) | 27 (7.2%) |
| Total | 1,246 (71.5%) | 75 (4.3%) |
Employment Occupations by Sex in Lowville
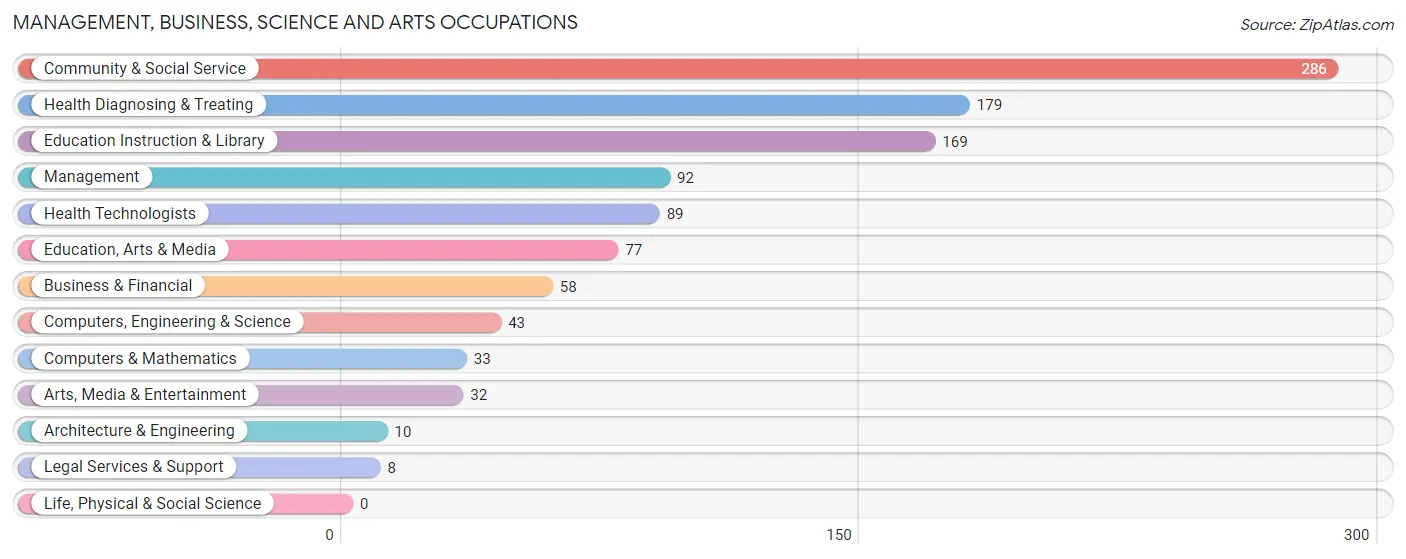
Management, Business, Science and Arts Occupations
The most common Management, Business, Science and Arts occupations in Lowville are Community & Social Service (286 | 18.3%), Health Diagnosing & Treating (179 | 11.5%), Education Instruction & Library (169 | 10.8%), Management (92 | 5.9%), and Health Technologists (89 | 5.7%).
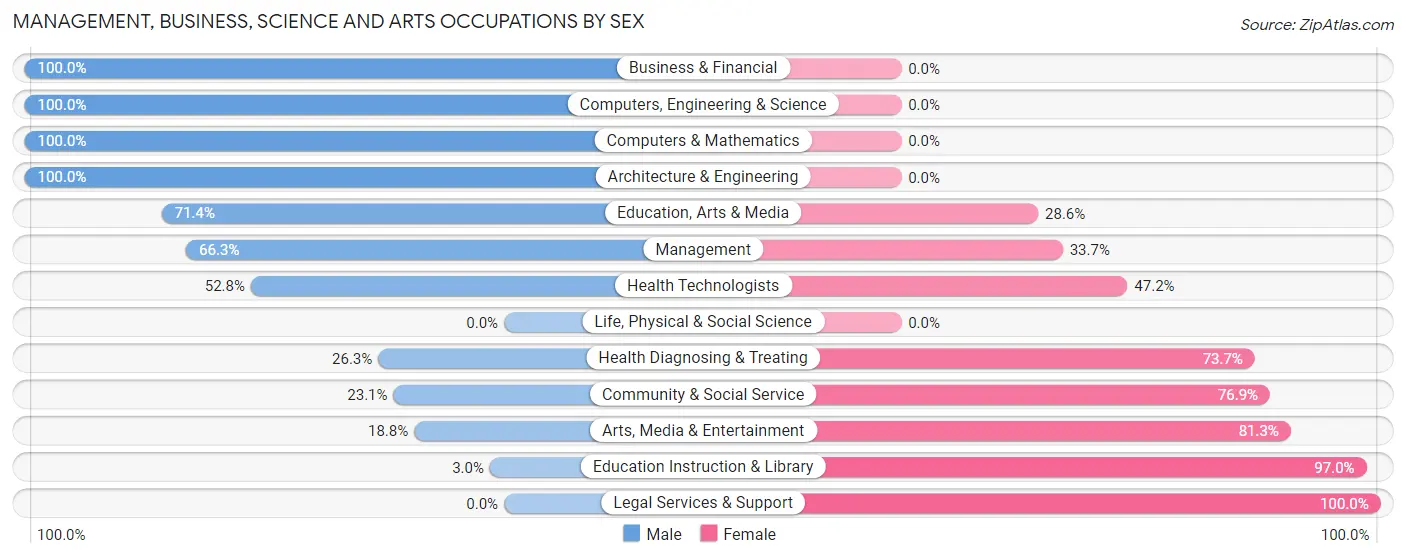
Management, Business, Science and Arts Occupations by Sex
Within the Management, Business, Science and Arts occupations in Lowville, the most male-oriented occupations are Business & Financial (100.0%), Computers, Engineering & Science (100.0%), and Computers & Mathematics (100.0%), while the most female-oriented occupations are Legal Services & Support (100.0%), Education Instruction & Library (97.0%), and Arts, Media & Entertainment (81.2%).
| Occupation | Male | Female |
| Management | 61 (66.3%) | 31 (33.7%) |
| Business & Financial | 58 (100.0%) | 0 (0.0%) |
| Computers, Engineering & Science | 43 (100.0%) | 0 (0.0%) |
| Computers & Mathematics | 33 (100.0%) | 0 (0.0%) |
| Architecture & Engineering | 10 (100.0%) | 0 (0.0%) |
| Life, Physical & Social Science | 0 (0.0%) | 0 (0.0%) |
| Community & Social Service | 66 (23.1%) | 220 (76.9%) |
| Education, Arts & Media | 55 (71.4%) | 22 (28.6%) |
| Legal Services & Support | 0 (0.0%) | 8 (100.0%) |
| Education Instruction & Library | 5 (3.0%) | 164 (97.0%) |
| Arts, Media & Entertainment | 6 (18.8%) | 26 (81.2%) |
| Health Diagnosing & Treating | 47 (26.3%) | 132 (73.7%) |
| Health Technologists | 47 (52.8%) | 42 (47.2%) |
| Total (Category) | 275 (41.8%) | 383 (58.2%) |
| Total (Overall) | 764 (48.8%) | 800 (51.1%) |
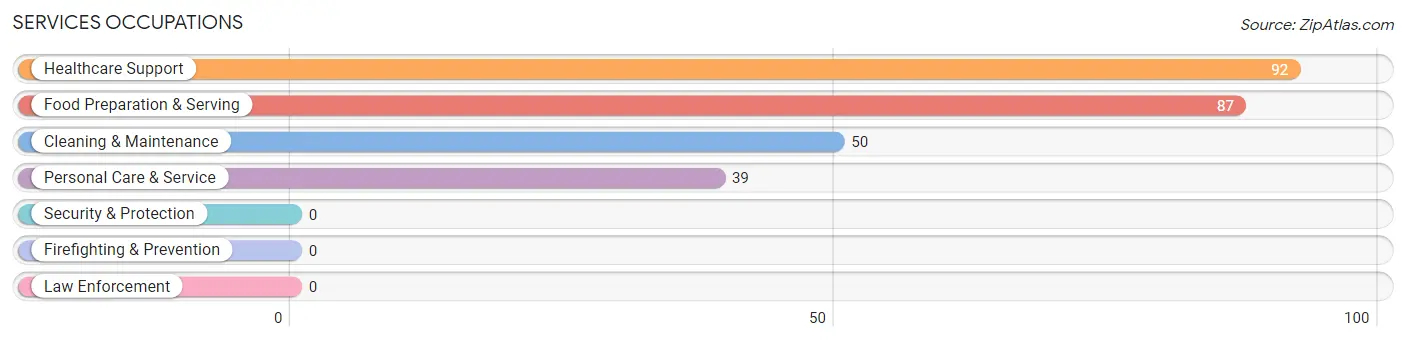
Services Occupations
The most common Services occupations in Lowville are Healthcare Support (92 | 5.9%), Food Preparation & Serving (87 | 5.6%), Cleaning & Maintenance (50 | 3.2%), and Personal Care & Service (39 | 2.5%).
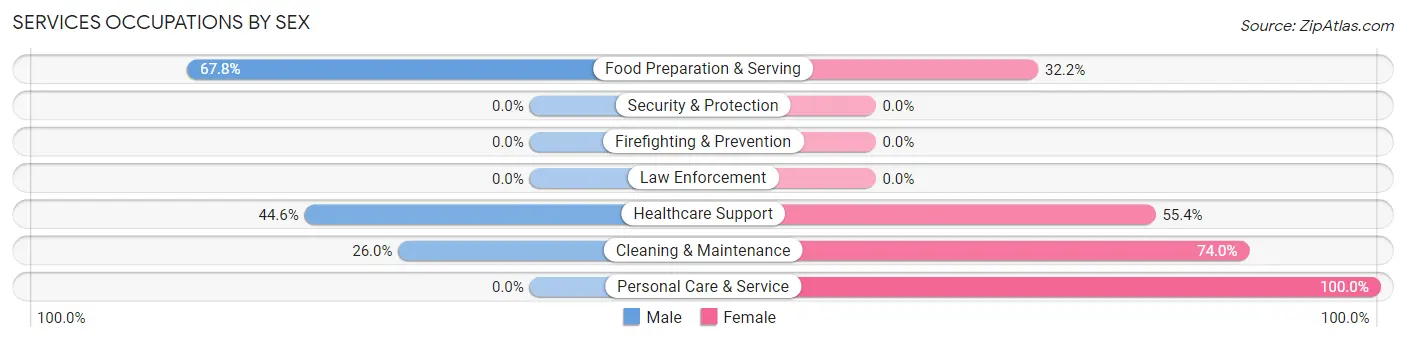
Services Occupations by Sex
Within the Services occupations in Lowville, the most male-oriented occupations are Food Preparation & Serving (67.8%), Healthcare Support (44.6%), and Cleaning & Maintenance (26.0%), while the most female-oriented occupations are Personal Care & Service (100.0%), Cleaning & Maintenance (74.0%), and Healthcare Support (55.4%).
| Occupation | Male | Female |
| Healthcare Support | 41 (44.6%) | 51 (55.4%) |
| Security & Protection | 0 (0.0%) | 0 (0.0%) |
| Firefighting & Prevention | 0 (0.0%) | 0 (0.0%) |
| Law Enforcement | 0 (0.0%) | 0 (0.0%) |
| Food Preparation & Serving | 59 (67.8%) | 28 (32.2%) |
| Cleaning & Maintenance | 13 (26.0%) | 37 (74.0%) |
| Personal Care & Service | 0 (0.0%) | 39 (100.0%) |
| Total (Category) | 113 (42.2%) | 155 (57.8%) |
| Total (Overall) | 764 (48.8%) | 800 (51.1%) |
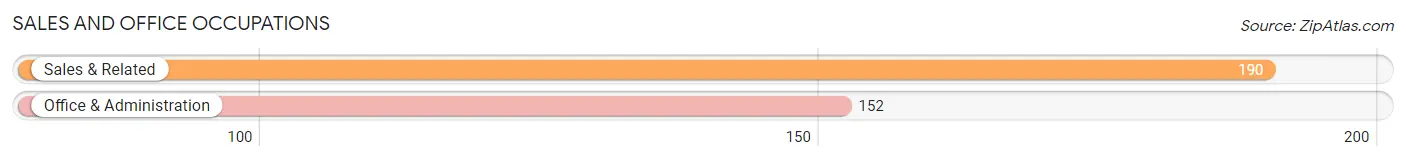
Sales and Office Occupations
The most common Sales and Office occupations in Lowville are Sales & Related (190 | 12.1%), and Office & Administration (152 | 9.7%).
Sales and Office Occupations by Sex
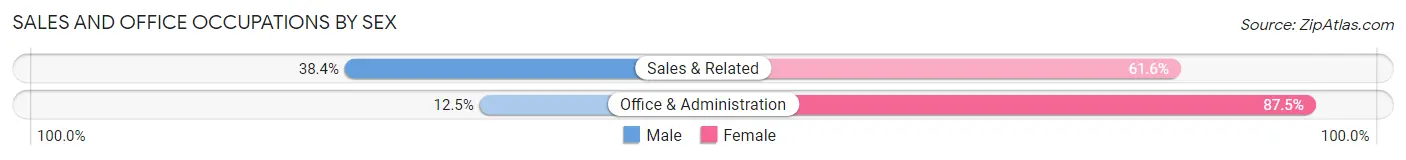
| Occupation | Male | Female |
| Sales & Related | 73 (38.4%) | 117 (61.6%) |
| Office & Administration | 19 (12.5%) | 133 (87.5%) |
| Total (Category) | 92 (26.9%) | 250 (73.1%) |
| Total (Overall) | 764 (48.8%) | 800 (51.1%) |
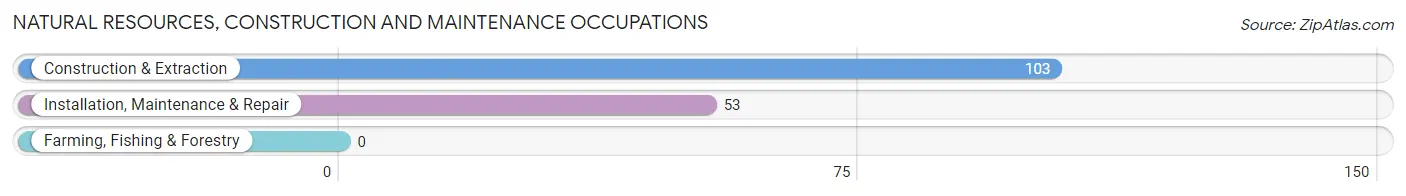
Natural Resources, Construction and Maintenance Occupations
The most common Natural Resources, Construction and Maintenance occupations in Lowville are Construction & Extraction (103 | 6.6%), and Installation, Maintenance & Repair (53 | 3.4%).
Natural Resources, Construction and Maintenance Occupations by Sex
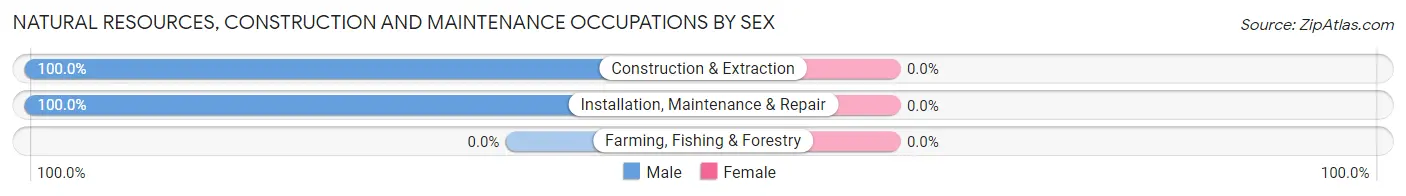
| Occupation | Male | Female |
| Farming, Fishing & Forestry | 0 (0.0%) | 0 (0.0%) |
| Construction & Extraction | 103 (100.0%) | 0 (0.0%) |
| Installation, Maintenance & Repair | 53 (100.0%) | 0 (0.0%) |
| Total (Category) | 156 (100.0%) | 0 (0.0%) |
| Total (Overall) | 764 (48.8%) | 800 (51.1%) |
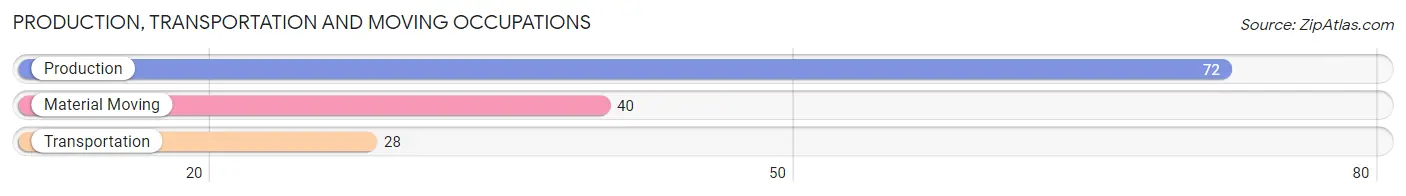
Production, Transportation and Moving Occupations
The most common Production, Transportation and Moving occupations in Lowville are Production (72 | 4.6%), Material Moving (40 | 2.6%), and Transportation (28 | 1.8%).
Production, Transportation and Moving Occupations by Sex
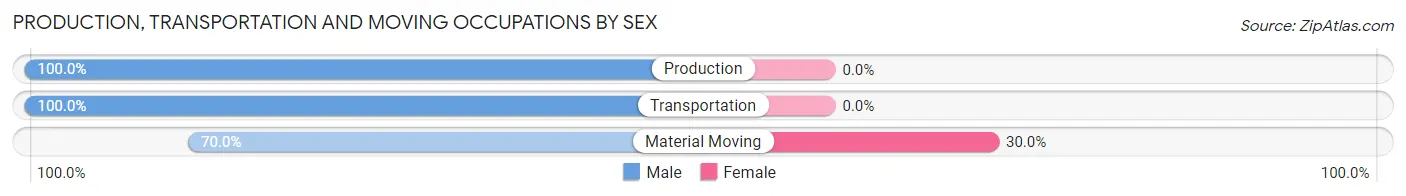
| Occupation | Male | Female |
| Production | 72 (100.0%) | 0 (0.0%) |
| Transportation | 28 (100.0%) | 0 (0.0%) |
| Material Moving | 28 (70.0%) | 12 (30.0%) |
| Total (Category) | 128 (91.4%) | 12 (8.6%) |
| Total (Overall) | 764 (48.8%) | 800 (51.1%) |
Employment Industries by Sex in Lowville
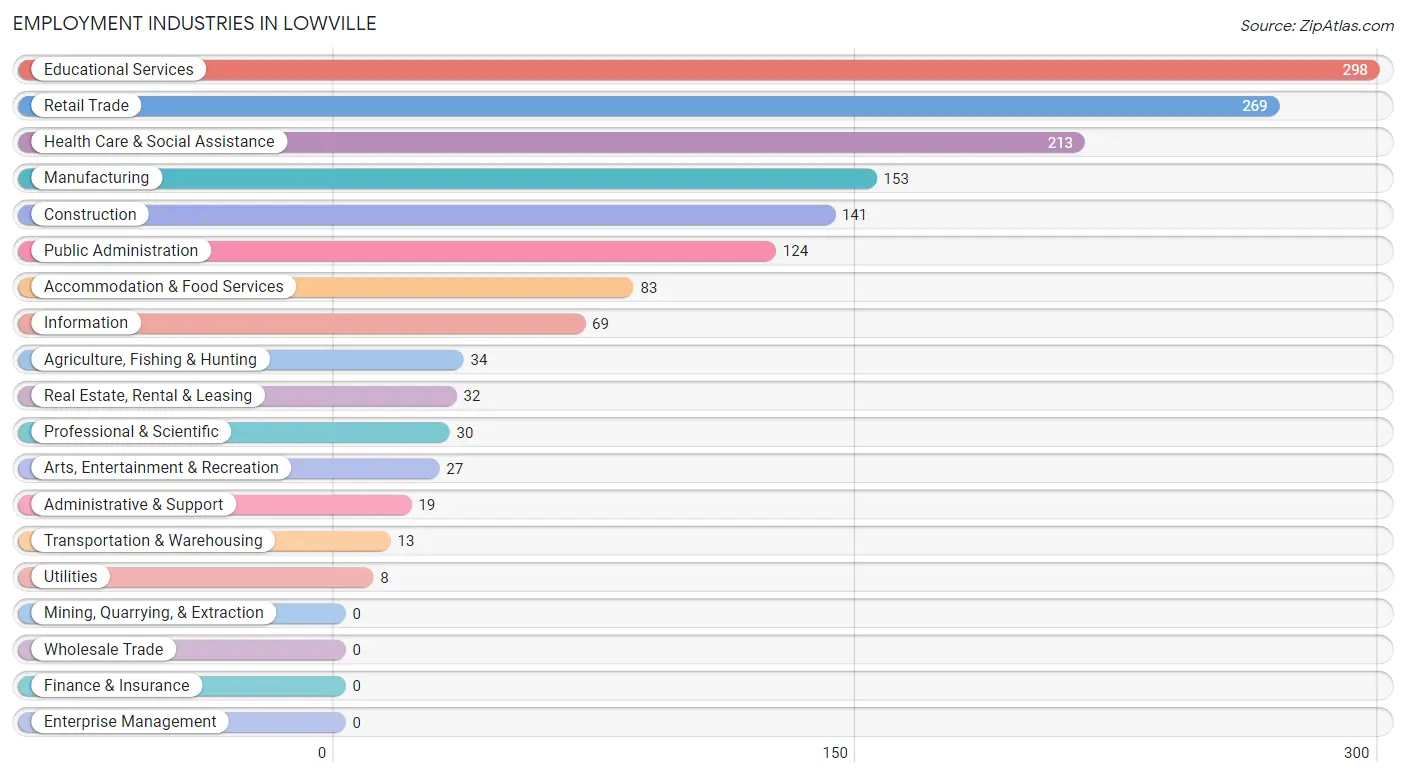
Employment Industries in Lowville
The major employment industries in Lowville include Educational Services (298 | 19.1%), Retail Trade (269 | 17.2%), Health Care & Social Assistance (213 | 13.6%), Manufacturing (153 | 9.8%), and Construction (141 | 9.0%).
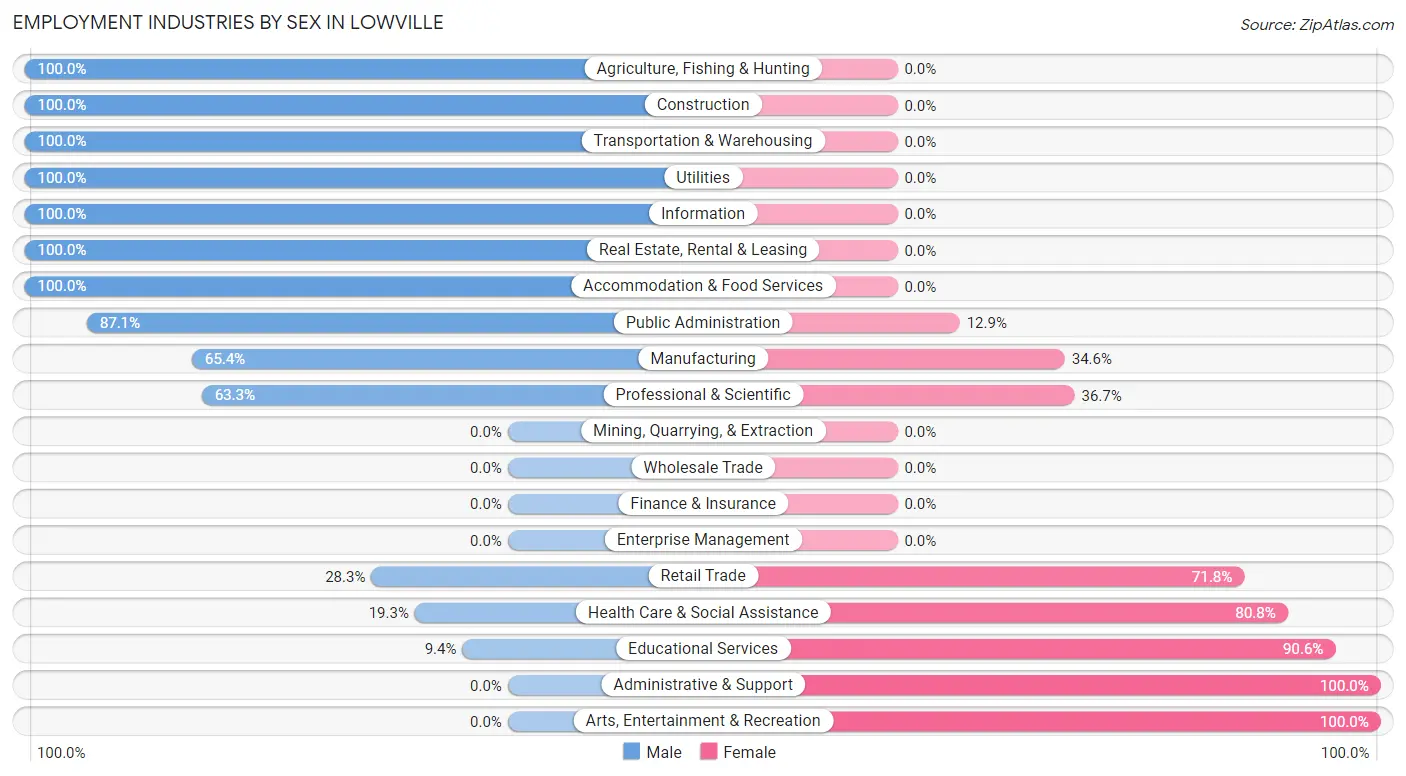
Employment Industries by Sex in Lowville
The Lowville industries that see more men than women are Agriculture, Fishing & Hunting (100.0%), Construction (100.0%), and Transportation & Warehousing (100.0%), whereas the industries that tend to have a higher number of women are Administrative & Support (100.0%), Arts, Entertainment & Recreation (100.0%), and Educational Services (90.6%).
| Industry | Male | Female |
| Agriculture, Fishing & Hunting | 34 (100.0%) | 0 (0.0%) |
| Mining, Quarrying, & Extraction | 0 (0.0%) | 0 (0.0%) |
| Construction | 141 (100.0%) | 0 (0.0%) |
| Manufacturing | 100 (65.4%) | 53 (34.6%) |
| Wholesale Trade | 0 (0.0%) | 0 (0.0%) |
| Retail Trade | 76 (28.2%) | 193 (71.8%) |
| Transportation & Warehousing | 13 (100.0%) | 0 (0.0%) |
| Utilities | 8 (100.0%) | 0 (0.0%) |
| Information | 69 (100.0%) | 0 (0.0%) |
| Finance & Insurance | 0 (0.0%) | 0 (0.0%) |
| Real Estate, Rental & Leasing | 32 (100.0%) | 0 (0.0%) |
| Professional & Scientific | 19 (63.3%) | 11 (36.7%) |
| Enterprise Management | 0 (0.0%) | 0 (0.0%) |
| Administrative & Support | 0 (0.0%) | 19 (100.0%) |
| Educational Services | 28 (9.4%) | 270 (90.6%) |
| Health Care & Social Assistance | 41 (19.3%) | 172 (80.7%) |
| Arts, Entertainment & Recreation | 0 (0.0%) | 27 (100.0%) |
| Accommodation & Food Services | 83 (100.0%) | 0 (0.0%) |
| Public Administration | 108 (87.1%) | 16 (12.9%) |
| Total | 764 (48.8%) | 800 (51.1%) |
Education in Lowville
School Enrollment in Lowville
The most common levels of schooling among the 769 students in Lowville are college / undergraduate (247 | 32.1%), high school (184 | 23.9%), and middle school (173 | 22.5%).
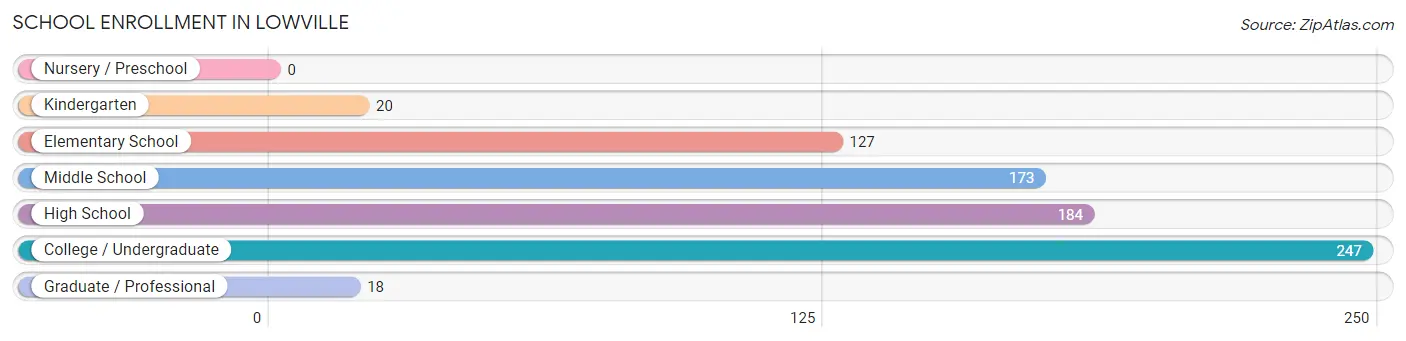
| School Level | # Students | % Students |
| Nursery / Preschool | 0 | 0.0% |
| Kindergarten | 20 | 2.6% |
| Elementary School | 127 | 16.5% |
| Middle School | 173 | 22.5% |
| High School | 184 | 23.9% |
| College / Undergraduate | 247 | 32.1% |
| Graduate / Professional | 18 | 2.3% |
| Total | 769 | 100.0% |
School Enrollment by Age by Funding Source in Lowville
Out of a total of 769 students who are enrolled in schools in Lowville, 55 (7.2%) attend a private institution, while the remaining 714 (92.8%) are enrolled in public schools. The age group of 20 to 24 year olds has the highest likelihood of being enrolled in private schools, with 53 (22.0% in the age bracket) enrolled. Conversely, the age group of 5 to 9 year old has the lowest likelihood of being enrolled in a private school, with 120 (100.0% in the age bracket) attending a public institution.
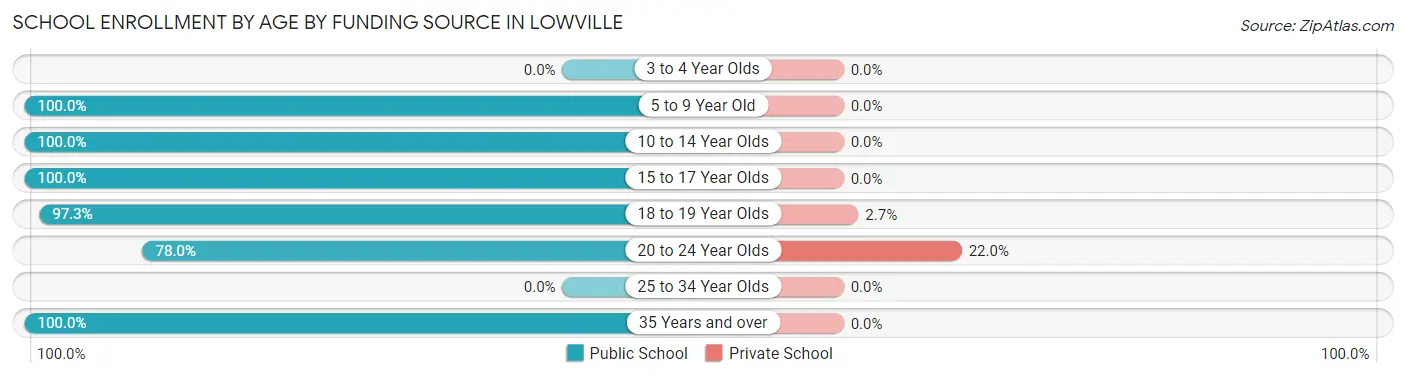
| Age Bracket | Public School | Private School |
| 3 to 4 Year Olds | 0 (0.0%) | 0 (0.0%) |
| 5 to 9 Year Old | 120 (100.0%) | 0 (0.0%) |
| 10 to 14 Year Olds | 211 (100.0%) | 0 (0.0%) |
| 15 to 17 Year Olds | 118 (100.0%) | 0 (0.0%) |
| 18 to 19 Year Olds | 71 (97.3%) | 2 (2.7%) |
| 20 to 24 Year Olds | 188 (78.0%) | 53 (22.0%) |
| 25 to 34 Year Olds | 0 (0.0%) | 0 (0.0%) |
| 35 Years and over | 6 (100.0%) | 0 (0.0%) |
| Total | 714 (92.8%) | 55 (7.2%) |
Educational Attainment by Field of Study in Lowville
Education (206 | 37.5%), psychology (57 | 10.4%), visual & performing arts (53 | 9.7%), arts & humanities (50 | 9.1%), and bio, nature & agricultural (45 | 8.2%) are the most common fields of study among 549 individuals in Lowville who have obtained a bachelor's degree or higher.
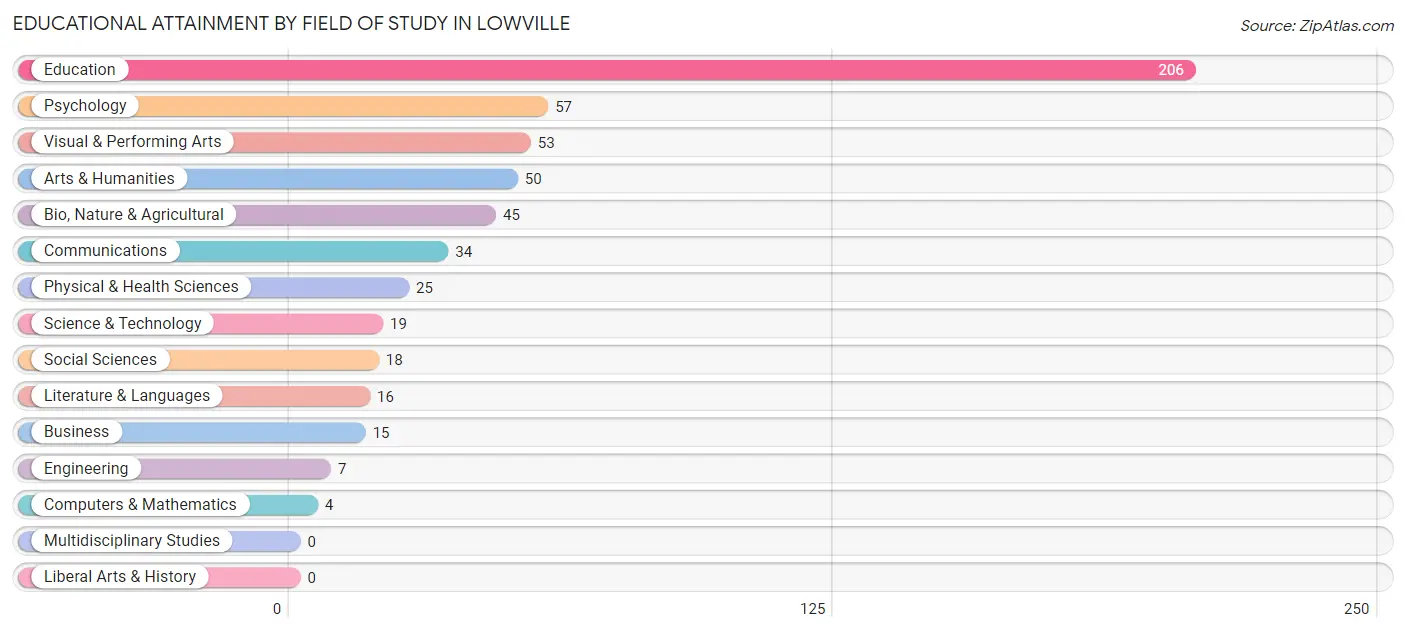
| Field of Study | # Graduates | % Graduates |
| Computers & Mathematics | 4 | 0.7% |
| Bio, Nature & Agricultural | 45 | 8.2% |
| Physical & Health Sciences | 25 | 4.5% |
| Psychology | 57 | 10.4% |
| Social Sciences | 18 | 3.3% |
| Engineering | 7 | 1.3% |
| Multidisciplinary Studies | 0 | 0.0% |
| Science & Technology | 19 | 3.5% |
| Business | 15 | 2.7% |
| Education | 206 | 37.5% |
| Literature & Languages | 16 | 2.9% |
| Liberal Arts & History | 0 | 0.0% |
| Visual & Performing Arts | 53 | 9.7% |
| Communications | 34 | 6.2% |
| Arts & Humanities | 50 | 9.1% |
| Total | 549 | 100.0% |
Transportation & Commute in Lowville
Vehicle Availability by Sex in Lowville
The most prevalent vehicle ownership categories in Lowville are males with 2 vehicles (357, accounting for 44.8%) and females with 2 vehicles (288, making up 46.9%).
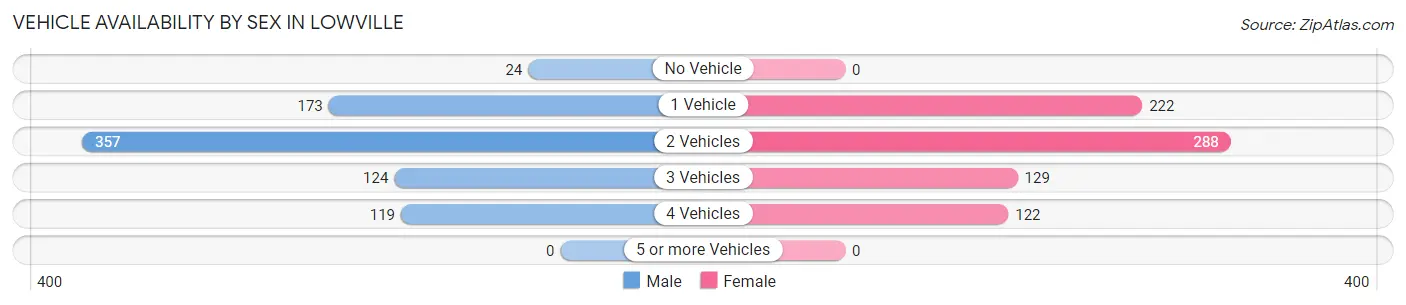
| Vehicles Available | Male | Female |
| No Vehicle | 24 (3.0%) | 0 (0.0%) |
| 1 Vehicle | 173 (21.7%) | 222 (29.2%) |
| 2 Vehicles | 357 (44.8%) | 288 (37.8%) |
| 3 Vehicles | 124 (15.6%) | 129 (17.0%) |
| 4 Vehicles | 119 (14.9%) | 122 (16.0%) |
| 5 or more Vehicles | 0 (0.0%) | 0 (0.0%) |
| Total | 797 (100.0%) | 761 (100.0%) |
Commute Time in Lowville
The most frequently occuring commute durations in Lowville are less than 5 minutes (431 commuters, 29.6%), 5 to 9 minutes (331 commuters, 22.7%), and 20 to 24 minutes (168 commuters, 11.5%).
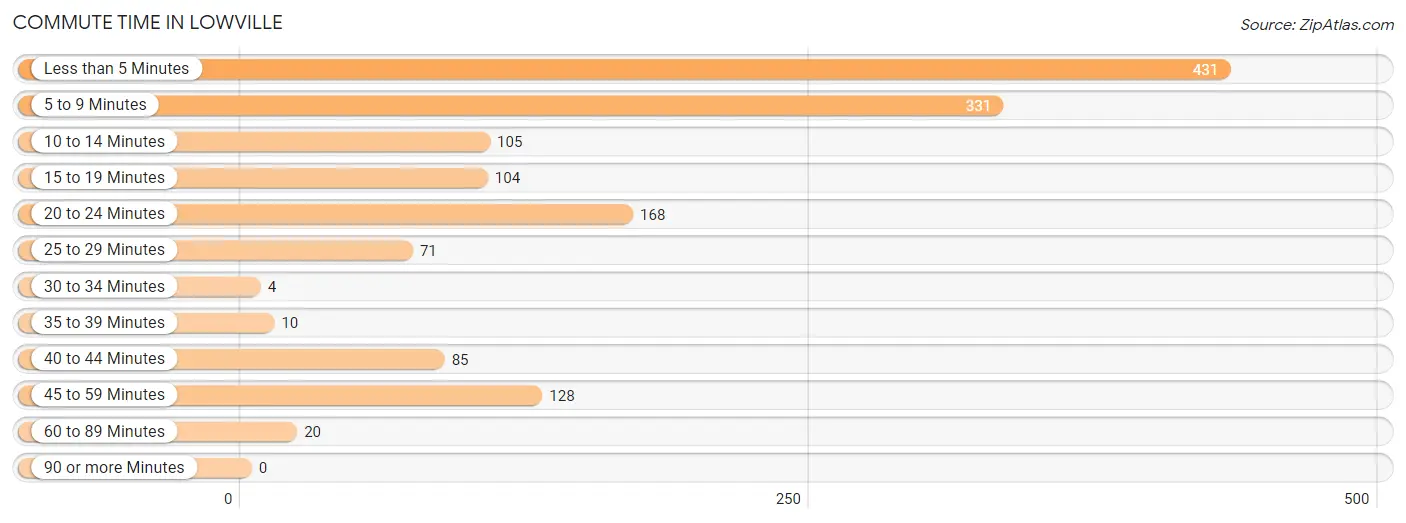
| Commute Time | # Commuters | % Commuters |
| Less than 5 Minutes | 431 | 29.6% |
| 5 to 9 Minutes | 331 | 22.7% |
| 10 to 14 Minutes | 105 | 7.2% |
| 15 to 19 Minutes | 104 | 7.1% |
| 20 to 24 Minutes | 168 | 11.5% |
| 25 to 29 Minutes | 71 | 4.9% |
| 30 to 34 Minutes | 4 | 0.3% |
| 35 to 39 Minutes | 10 | 0.7% |
| 40 to 44 Minutes | 85 | 5.8% |
| 45 to 59 Minutes | 128 | 8.8% |
| 60 to 89 Minutes | 20 | 1.4% |
| 90 or more Minutes | 0 | 0.0% |
Commute Time by Sex in Lowville
The most common commute times in Lowville are 5 to 9 minutes (162 commuters, 22.7%) for males and less than 5 minutes (279 commuters, 37.6%) for females.
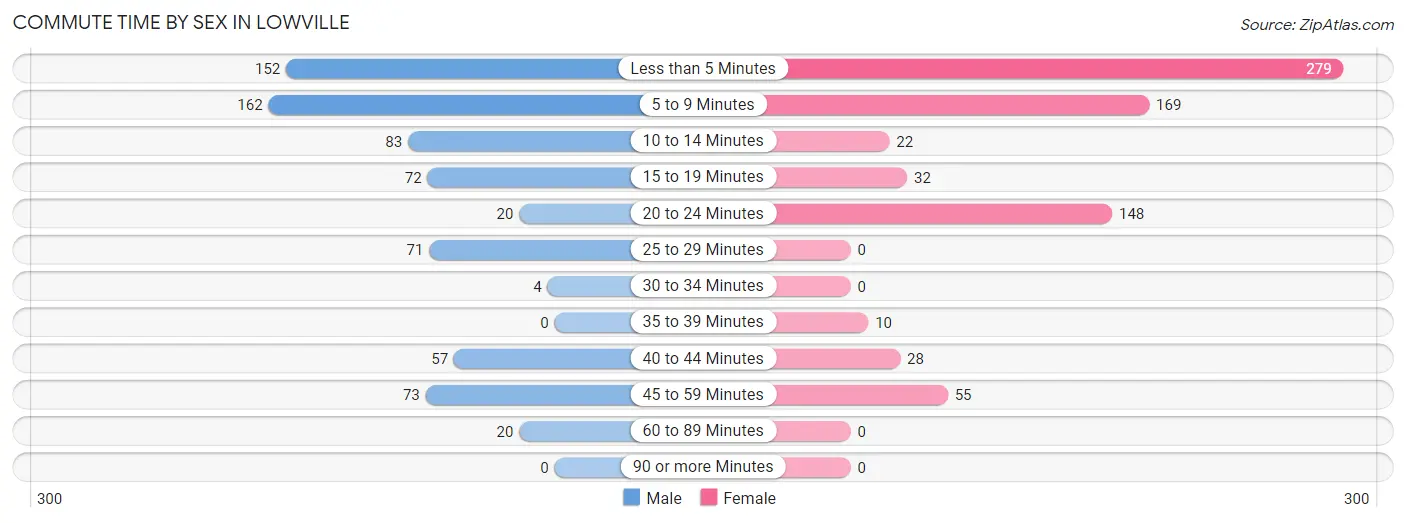
| Commute Time | Male | Female |
| Less than 5 Minutes | 152 (21.3%) | 279 (37.6%) |
| 5 to 9 Minutes | 162 (22.7%) | 169 (22.8%) |
| 10 to 14 Minutes | 83 (11.6%) | 22 (3.0%) |
| 15 to 19 Minutes | 72 (10.1%) | 32 (4.3%) |
| 20 to 24 Minutes | 20 (2.8%) | 148 (19.9%) |
| 25 to 29 Minutes | 71 (9.9%) | 0 (0.0%) |
| 30 to 34 Minutes | 4 (0.6%) | 0 (0.0%) |
| 35 to 39 Minutes | 0 (0.0%) | 10 (1.3%) |
| 40 to 44 Minutes | 57 (8.0%) | 28 (3.8%) |
| 45 to 59 Minutes | 73 (10.2%) | 55 (7.4%) |
| 60 to 89 Minutes | 20 (2.8%) | 0 (0.0%) |
| 90 or more Minutes | 0 (0.0%) | 0 (0.0%) |
Time of Departure to Work by Sex in Lowville
The most frequent times of departure to work in Lowville are 6:30 AM to 6:59 AM (122, 17.1%) for males and 8:00 AM to 8:29 AM (231, 31.1%) for females.
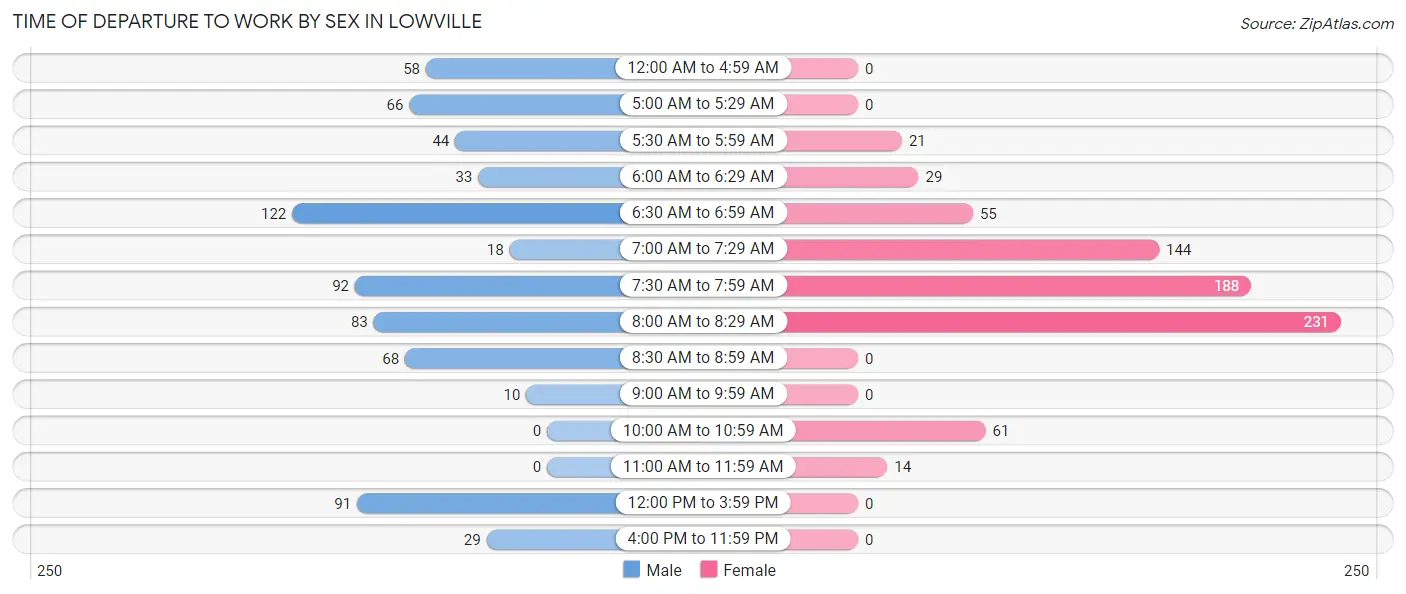
| Time of Departure | Male | Female |
| 12:00 AM to 4:59 AM | 58 (8.1%) | 0 (0.0%) |
| 5:00 AM to 5:29 AM | 66 (9.2%) | 0 (0.0%) |
| 5:30 AM to 5:59 AM | 44 (6.2%) | 21 (2.8%) |
| 6:00 AM to 6:29 AM | 33 (4.6%) | 29 (3.9%) |
| 6:30 AM to 6:59 AM | 122 (17.1%) | 55 (7.4%) |
| 7:00 AM to 7:29 AM | 18 (2.5%) | 144 (19.4%) |
| 7:30 AM to 7:59 AM | 92 (12.9%) | 188 (25.3%) |
| 8:00 AM to 8:29 AM | 83 (11.6%) | 231 (31.1%) |
| 8:30 AM to 8:59 AM | 68 (9.5%) | 0 (0.0%) |
| 9:00 AM to 9:59 AM | 10 (1.4%) | 0 (0.0%) |
| 10:00 AM to 10:59 AM | 0 (0.0%) | 61 (8.2%) |
| 11:00 AM to 11:59 AM | 0 (0.0%) | 14 (1.9%) |
| 12:00 PM to 3:59 PM | 91 (12.8%) | 0 (0.0%) |
| 4:00 PM to 11:59 PM | 29 (4.1%) | 0 (0.0%) |
| Total | 714 (100.0%) | 743 (100.0%) |
Housing Occupancy in Lowville
Occupancy by Ownership in Lowville
Of the total 1,487 dwellings in Lowville, owner-occupied units account for 876 (58.9%), while renter-occupied units make up 611 (41.1%).
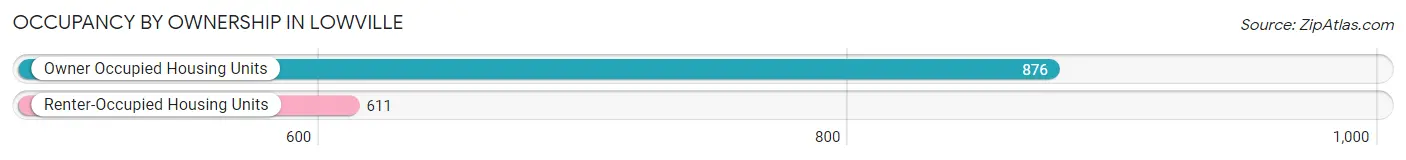
| Occupancy | # Housing Units | % Housing Units |
| Owner Occupied Housing Units | 876 | 58.9% |
| Renter-Occupied Housing Units | 611 | 41.1% |
| Total Occupied Housing Units | 1,487 | 100.0% |
Occupancy by Household Size in Lowville
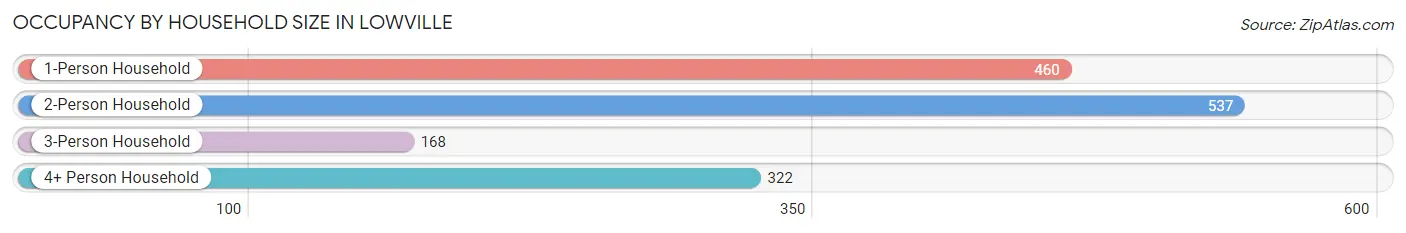
| Household Size | # Housing Units | % Housing Units |
| 1-Person Household | 460 | 30.9% |
| 2-Person Household | 537 | 36.1% |
| 3-Person Household | 168 | 11.3% |
| 4+ Person Household | 322 | 21.6% |
| Total Housing Units | 1,487 | 100.0% |
Occupancy by Ownership by Household Size in Lowville
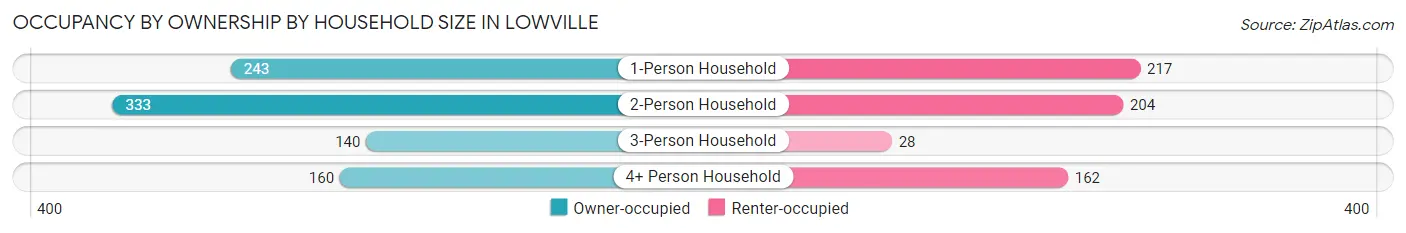
| Household Size | Owner-occupied | Renter-occupied |
| 1-Person Household | 243 (52.8%) | 217 (47.2%) |
| 2-Person Household | 333 (62.0%) | 204 (38.0%) |
| 3-Person Household | 140 (83.3%) | 28 (16.7%) |
| 4+ Person Household | 160 (49.7%) | 162 (50.3%) |
| Total Housing Units | 876 (58.9%) | 611 (41.1%) |
Occupancy by Educational Attainment in Lowville
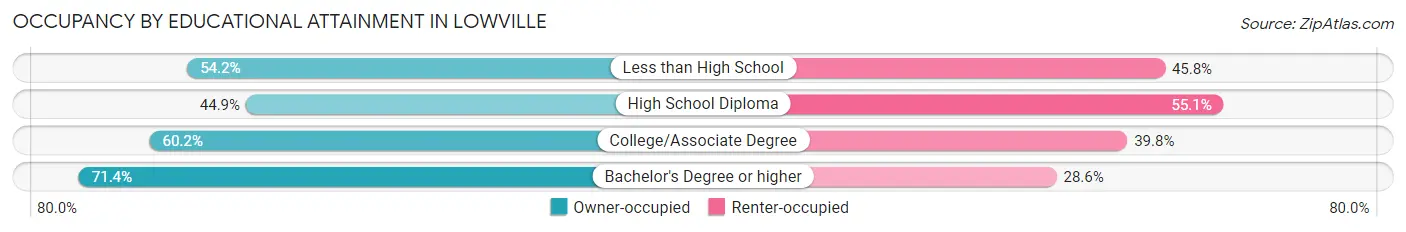
| Household Size | Owner-occupied | Renter-occupied |
| Less than High School | 71 (54.2%) | 60 (45.8%) |
| High School Diploma | 172 (44.9%) | 211 (55.1%) |
| College/Associate Degree | 331 (60.2%) | 219 (39.8%) |
| Bachelor's Degree or higher | 302 (71.4%) | 121 (28.6%) |
Occupancy by Age of Householder in Lowville
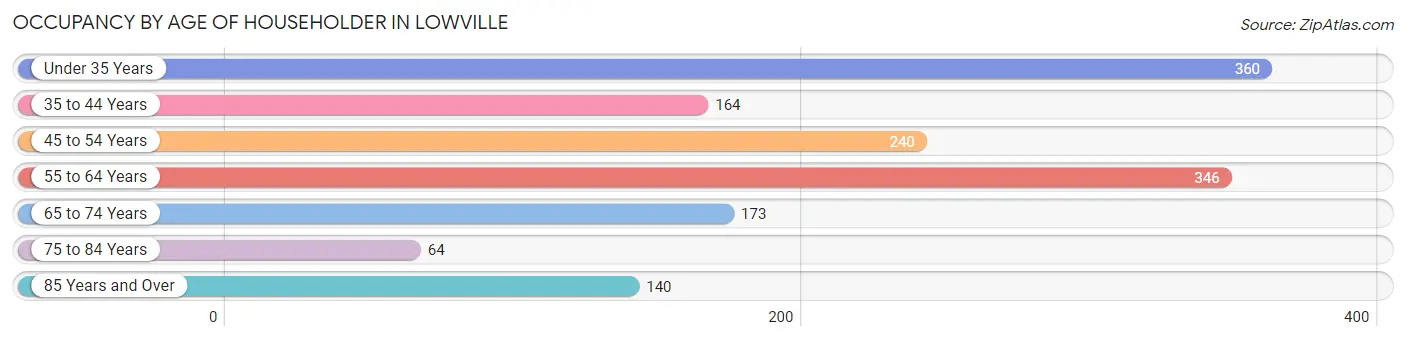
| Age Bracket | # Households | % Households |
| Under 35 Years | 360 | 24.2% |
| 35 to 44 Years | 164 | 11.0% |
| 45 to 54 Years | 240 | 16.1% |
| 55 to 64 Years | 346 | 23.3% |
| 65 to 74 Years | 173 | 11.6% |
| 75 to 84 Years | 64 | 4.3% |
| 85 Years and Over | 140 | 9.4% |
| Total | 1,487 | 100.0% |
Housing Finances in Lowville
Median Income by Occupancy in Lowville
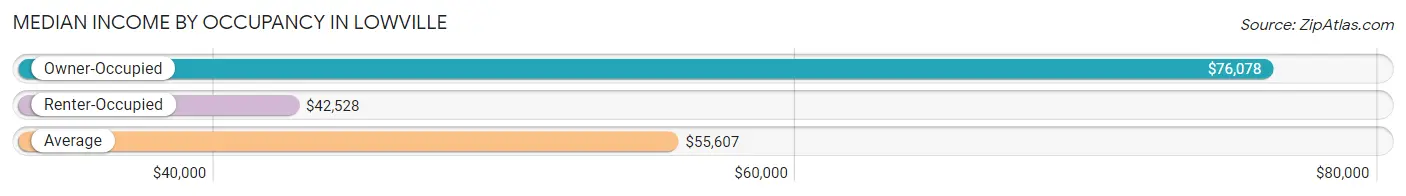
| Occupancy Type | # Households | Median Income |
| Owner-Occupied | 876 (58.9%) | $76,078 |
| Renter-Occupied | 611 (41.1%) | $42,528 |
| Average | 1,487 (100.0%) | $55,607 |
Occupancy by Householder Income Bracket in Lowville
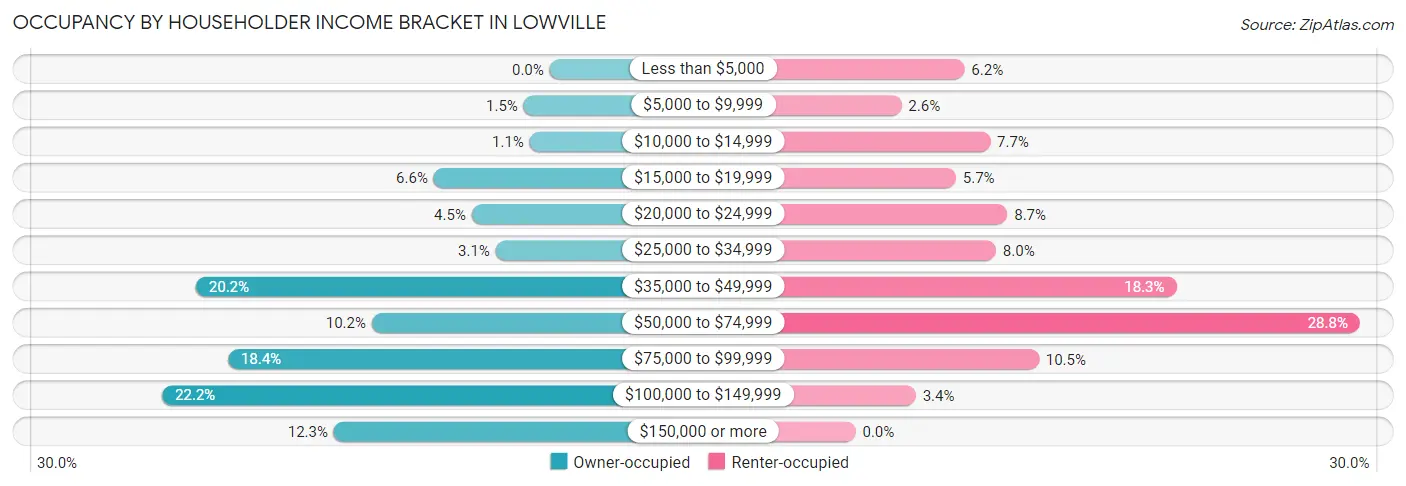
| Income Bracket | Owner-occupied | Renter-occupied |
| Less than $5,000 | 0 (0.0%) | 38 (6.2%) |
| $5,000 to $9,999 | 13 (1.5%) | 16 (2.6%) |
| $10,000 to $14,999 | 10 (1.1%) | 47 (7.7%) |
| $15,000 to $19,999 | 58 (6.6%) | 35 (5.7%) |
| $20,000 to $24,999 | 39 (4.4%) | 53 (8.7%) |
| $25,000 to $34,999 | 27 (3.1%) | 49 (8.0%) |
| $35,000 to $49,999 | 177 (20.2%) | 112 (18.3%) |
| $50,000 to $74,999 | 89 (10.2%) | 176 (28.8%) |
| $75,000 to $99,999 | 161 (18.4%) | 64 (10.5%) |
| $100,000 to $149,999 | 194 (22.2%) | 21 (3.4%) |
| $150,000 or more | 108 (12.3%) | 0 (0.0%) |
| Total | 876 (100.0%) | 611 (100.0%) |
Monthly Housing Cost Tiers in Lowville
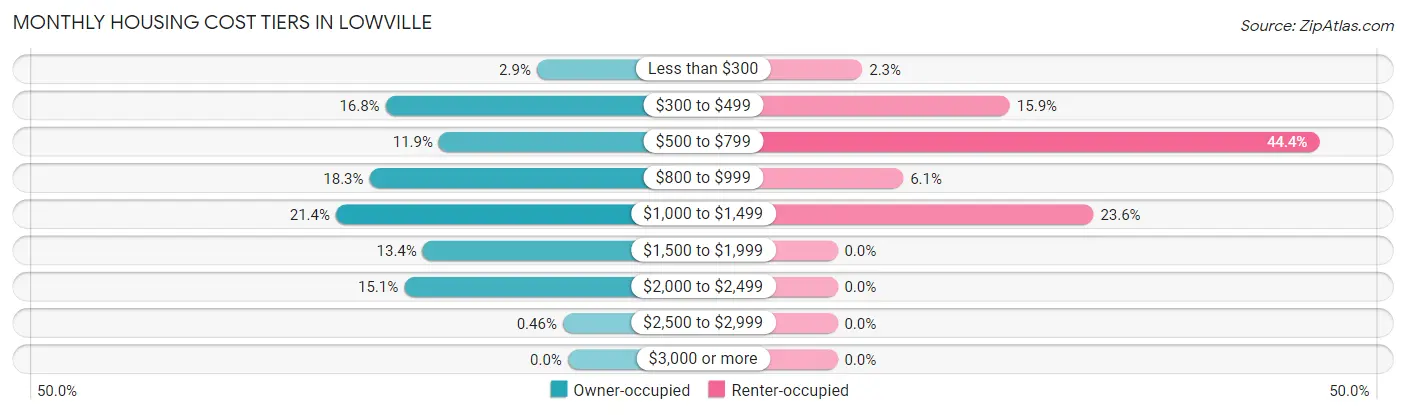
| Monthly Cost | Owner-occupied | Renter-occupied |
| Less than $300 | 25 (2.9%) | 14 (2.3%) |
| $300 to $499 | 147 (16.8%) | 97 (15.9%) |
| $500 to $799 | 104 (11.9%) | 271 (44.4%) |
| $800 to $999 | 160 (18.3%) | 37 (6.1%) |
| $1,000 to $1,499 | 187 (21.3%) | 144 (23.6%) |
| $1,500 to $1,999 | 117 (13.4%) | 0 (0.0%) |
| $2,000 to $2,499 | 132 (15.1%) | 0 (0.0%) |
| $2,500 to $2,999 | 4 (0.5%) | 0 (0.0%) |
| $3,000 or more | 0 (0.0%) | 0 (0.0%) |
| Total | 876 (100.0%) | 611 (100.0%) |
Physical Housing Characteristics in Lowville
Housing Structures in Lowville
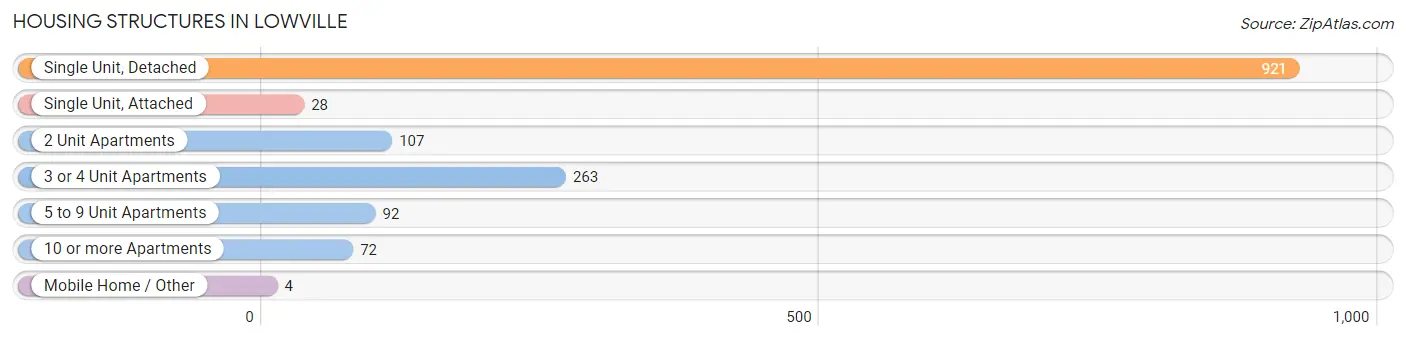
| Structure Type | # Housing Units | % Housing Units |
| Single Unit, Detached | 921 | 61.9% |
| Single Unit, Attached | 28 | 1.9% |
| 2 Unit Apartments | 107 | 7.2% |
| 3 or 4 Unit Apartments | 263 | 17.7% |
| 5 to 9 Unit Apartments | 92 | 6.2% |
| 10 or more Apartments | 72 | 4.8% |
| Mobile Home / Other | 4 | 0.3% |
| Total | 1,487 | 100.0% |
Housing Structures by Occupancy in Lowville
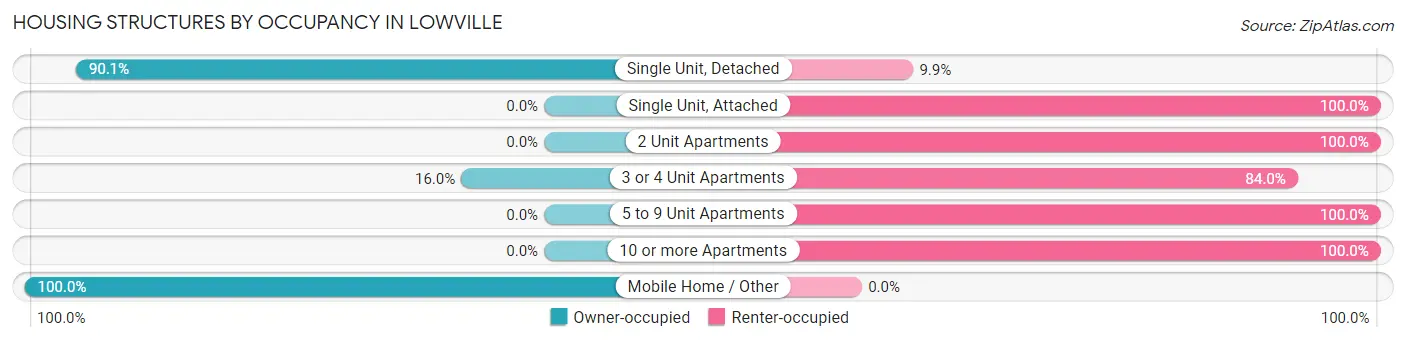
| Structure Type | Owner-occupied | Renter-occupied |
| Single Unit, Detached | 830 (90.1%) | 91 (9.9%) |
| Single Unit, Attached | 0 (0.0%) | 28 (100.0%) |
| 2 Unit Apartments | 0 (0.0%) | 107 (100.0%) |
| 3 or 4 Unit Apartments | 42 (16.0%) | 221 (84.0%) |
| 5 to 9 Unit Apartments | 0 (0.0%) | 92 (100.0%) |
| 10 or more Apartments | 0 (0.0%) | 72 (100.0%) |
| Mobile Home / Other | 4 (100.0%) | 0 (0.0%) |
| Total | 876 (58.9%) | 611 (41.1%) |
Housing Structures by Number of Rooms in Lowville
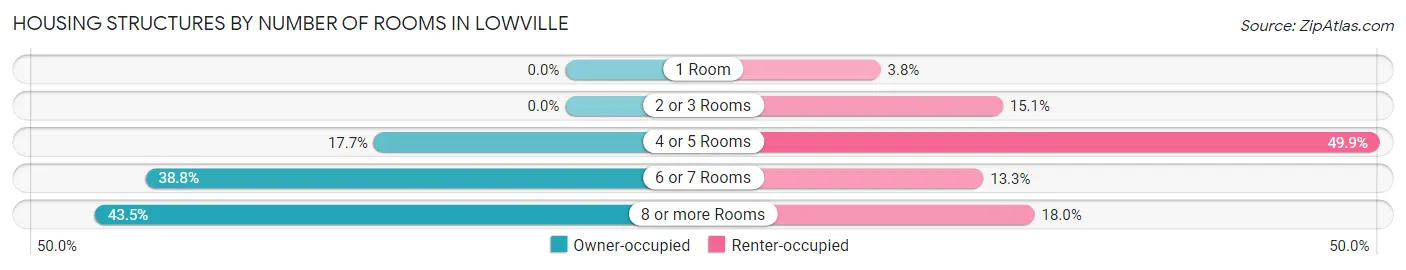
| Number of Rooms | Owner-occupied | Renter-occupied |
| 1 Room | 0 (0.0%) | 23 (3.8%) |
| 2 or 3 Rooms | 0 (0.0%) | 92 (15.1%) |
| 4 or 5 Rooms | 155 (17.7%) | 305 (49.9%) |
| 6 or 7 Rooms | 340 (38.8%) | 81 (13.3%) |
| 8 or more Rooms | 381 (43.5%) | 110 (18.0%) |
| Total | 876 (100.0%) | 611 (100.0%) |
Housing Structure by Heating Type in Lowville
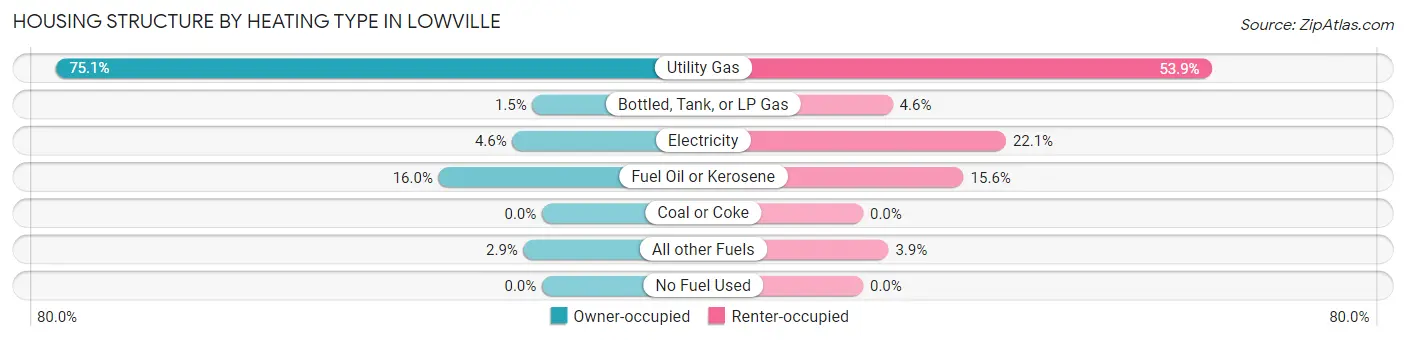
| Heating Type | Owner-occupied | Renter-occupied |
| Utility Gas | 658 (75.1%) | 329 (53.8%) |
| Bottled, Tank, or LP Gas | 13 (1.5%) | 28 (4.6%) |
| Electricity | 40 (4.6%) | 135 (22.1%) |
| Fuel Oil or Kerosene | 140 (16.0%) | 95 (15.5%) |
| Coal or Coke | 0 (0.0%) | 0 (0.0%) |
| All other Fuels | 25 (2.9%) | 24 (3.9%) |
| No Fuel Used | 0 (0.0%) | 0 (0.0%) |
| Total | 876 (100.0%) | 611 (100.0%) |
Household Vehicle Usage in Lowville
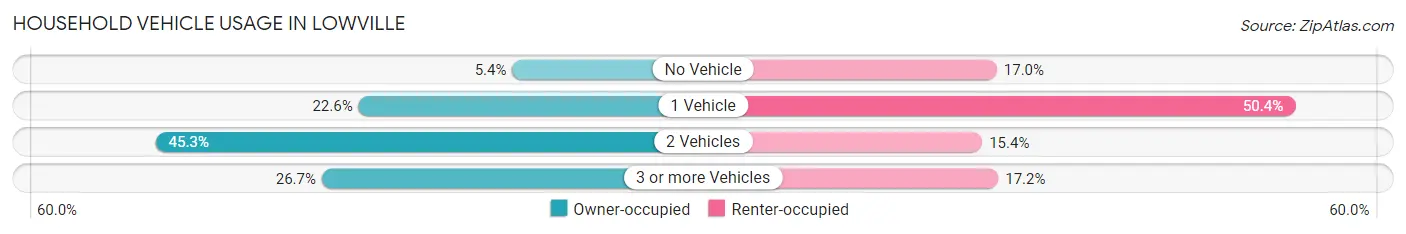
| Vehicles per Household | Owner-occupied | Renter-occupied |
| No Vehicle | 47 (5.4%) | 104 (17.0%) |
| 1 Vehicle | 198 (22.6%) | 308 (50.4%) |
| 2 Vehicles | 397 (45.3%) | 94 (15.4%) |
| 3 or more Vehicles | 234 (26.7%) | 105 (17.2%) |
| Total | 876 (100.0%) | 611 (100.0%) |
Real Estate & Mortgages in Lowville
Real Estate and Mortgage Overview in Lowville
| Characteristic | Without Mortgage | With Mortgage |
| Housing Units | 321 | 555 |
| Median Property Value | $144,200 | $150,200 |
| Median Household Income | $49,728 | $82 |
| Monthly Housing Costs | $490 | $0 |
| Real Estate Taxes | $2,816 | $7 |
Property Value by Mortgage Status in Lowville
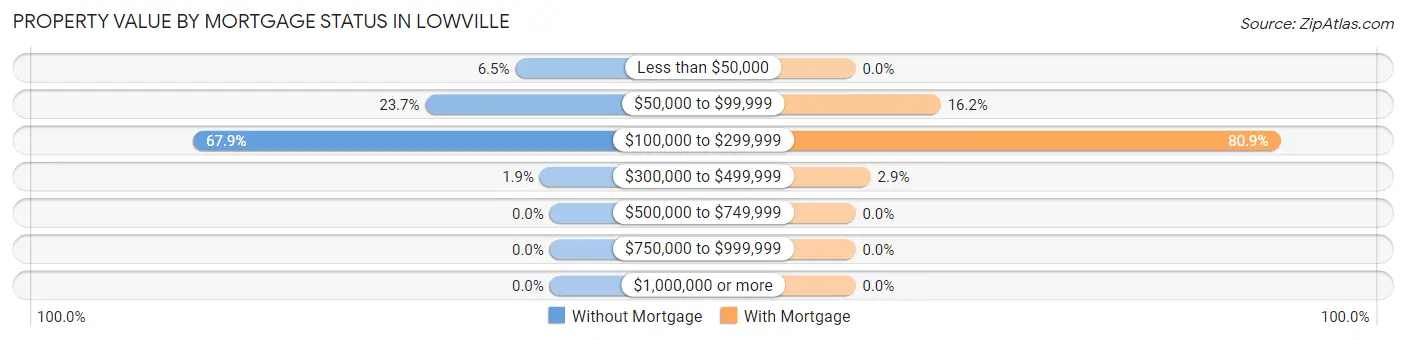
| Property Value | Without Mortgage | With Mortgage |
| Less than $50,000 | 21 (6.5%) | 0 (0.0%) |
| $50,000 to $99,999 | 76 (23.7%) | 90 (16.2%) |
| $100,000 to $299,999 | 218 (67.9%) | 449 (80.9%) |
| $300,000 to $499,999 | 6 (1.9%) | 16 (2.9%) |
| $500,000 to $749,999 | 0 (0.0%) | 0 (0.0%) |
| $750,000 to $999,999 | 0 (0.0%) | 0 (0.0%) |
| $1,000,000 or more | 0 (0.0%) | 0 (0.0%) |
| Total | 321 (100.0%) | 555 (100.0%) |
Household Income by Mortgage Status in Lowville
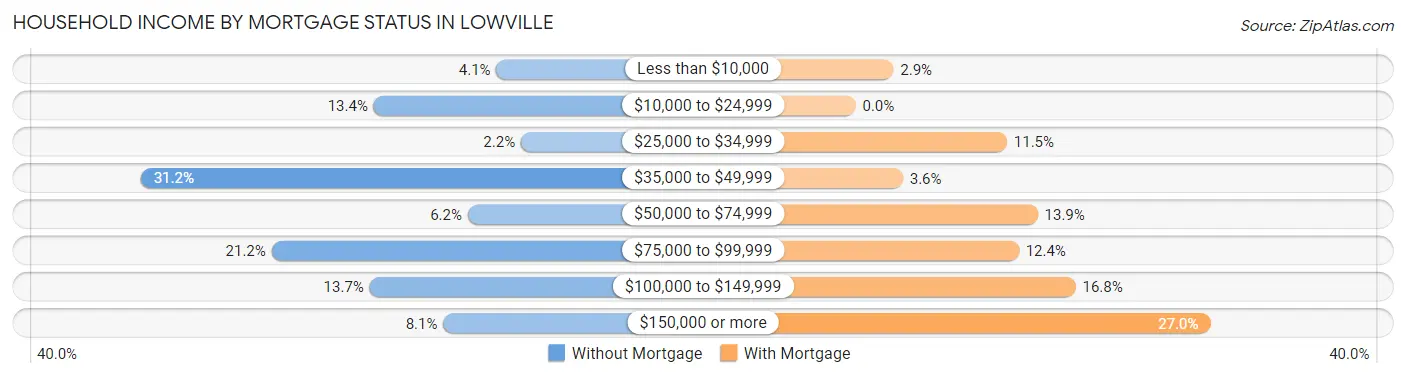
| Household Income | Without Mortgage | With Mortgage |
| Less than $10,000 | 13 (4.1%) | 16 (2.9%) |
| $10,000 to $24,999 | 43 (13.4%) | 0 (0.0%) |
| $25,000 to $34,999 | 7 (2.2%) | 64 (11.5%) |
| $35,000 to $49,999 | 100 (31.1%) | 20 (3.6%) |
| $50,000 to $74,999 | 20 (6.2%) | 77 (13.9%) |
| $75,000 to $99,999 | 68 (21.2%) | 69 (12.4%) |
| $100,000 to $149,999 | 44 (13.7%) | 93 (16.8%) |
| $150,000 or more | 26 (8.1%) | 150 (27.0%) |
| Total | 321 (100.0%) | 555 (100.0%) |
Property Value to Household Income Ratio in Lowville
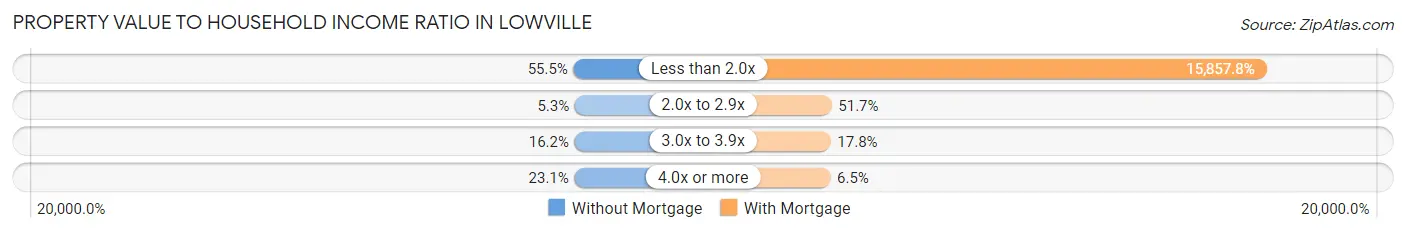
| Value-to-Income Ratio | Without Mortgage | With Mortgage |
| Less than 2.0x | 178 (55.4%) | 88,011 (15,857.8%) |
| 2.0x to 2.9x | 17 (5.3%) | 287 (51.7%) |
| 3.0x to 3.9x | 52 (16.2%) | 99 (17.8%) |
| 4.0x or more | 74 (23.1%) | 36 (6.5%) |
| Total | 321 (100.0%) | 555 (100.0%) |
Real Estate Taxes by Mortgage Status in Lowville
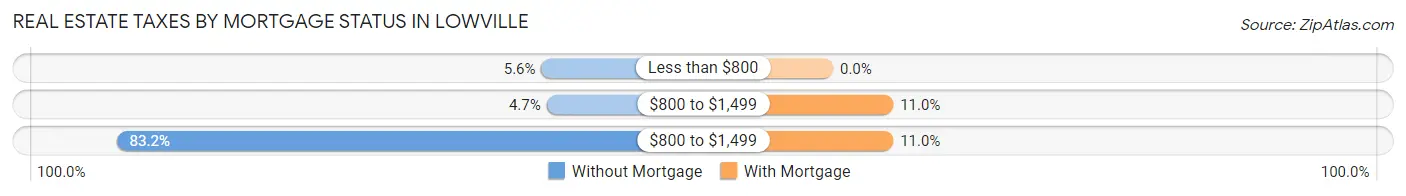
| Property Taxes | Without Mortgage | With Mortgage |
| Less than $800 | 18 (5.6%) | 0 (0.0%) |
| $800 to $1,499 | 15 (4.7%) | 61 (11.0%) |
| $800 to $1,499 | 267 (83.2%) | 61 (11.0%) |
| Total | 321 (100.0%) | 555 (100.0%) |
Health & Disability in Lowville
Health Insurance Coverage by Age in Lowville
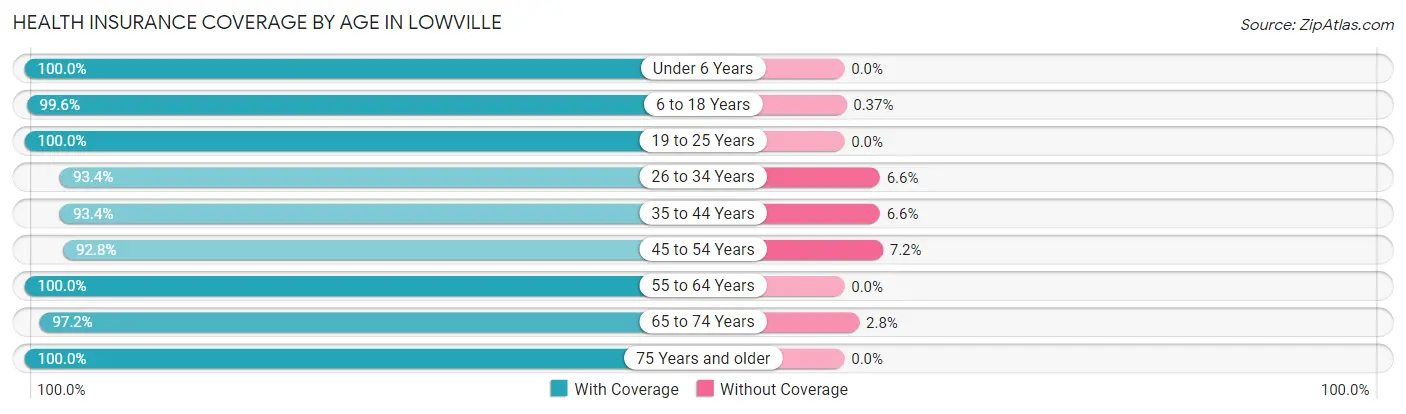
| Age Bracket | With Coverage | Without Coverage |
| Under 6 Years | 179 (100.0%) | 0 (0.0%) |
| 6 to 18 Years | 545 (99.6%) | 2 (0.4%) |
| 19 to 25 Years | 644 (100.0%) | 0 (0.0%) |
| 26 to 34 Years | 212 (93.4%) | 15 (6.6%) |
| 35 to 44 Years | 396 (93.4%) | 28 (6.6%) |
| 45 to 54 Years | 336 (92.8%) | 26 (7.2%) |
| 55 to 64 Years | 497 (100.0%) | 0 (0.0%) |
| 65 to 74 Years | 317 (97.2%) | 9 (2.8%) |
| 75 Years and older | 260 (100.0%) | 0 (0.0%) |
| Total | 3,386 (97.7%) | 80 (2.3%) |
Health Insurance Coverage by Citizenship Status in Lowville
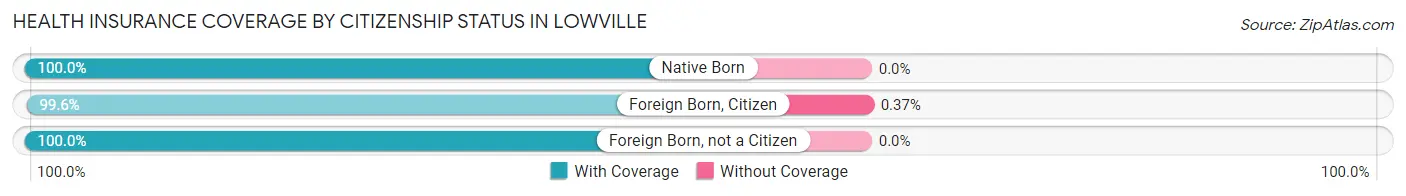
| Citizenship Status | With Coverage | Without Coverage |
| Native Born | 179 (100.0%) | 0 (0.0%) |
| Foreign Born, Citizen | 545 (99.6%) | 2 (0.4%) |
| Foreign Born, not a Citizen | 644 (100.0%) | 0 (0.0%) |
Health Insurance Coverage by Household Income in Lowville
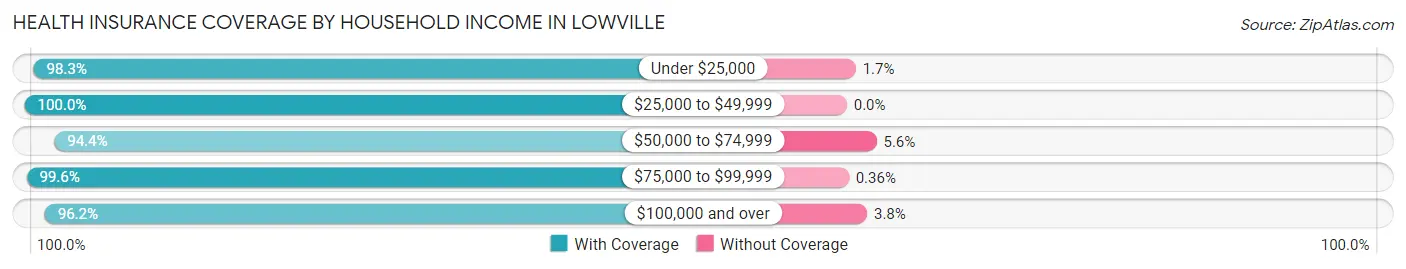
| Household Income | With Coverage | Without Coverage |
| Under $25,000 | 530 (98.3%) | 9 (1.7%) |
| $25,000 to $49,999 | 821 (100.0%) | 0 (0.0%) |
| $50,000 to $74,999 | 661 (94.4%) | 39 (5.6%) |
| $75,000 to $99,999 | 547 (99.6%) | 2 (0.4%) |
| $100,000 and over | 762 (96.2%) | 30 (3.8%) |
Public vs Private Health Insurance Coverage by Age in Lowville
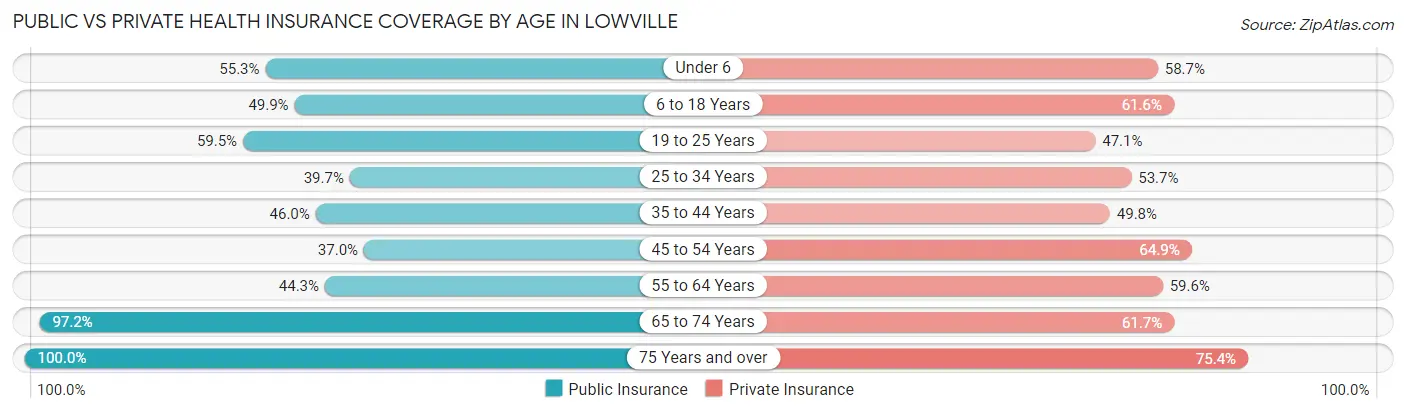
| Age Bracket | Public Insurance | Private Insurance |
| Under 6 | 99 (55.3%) | 105 (58.7%) |
| 6 to 18 Years | 273 (49.9%) | 337 (61.6%) |
| 19 to 25 Years | 383 (59.5%) | 303 (47.0%) |
| 25 to 34 Years | 90 (39.7%) | 122 (53.7%) |
| 35 to 44 Years | 195 (46.0%) | 211 (49.8%) |
| 45 to 54 Years | 134 (37.0%) | 235 (64.9%) |
| 55 to 64 Years | 220 (44.3%) | 296 (59.6%) |
| 65 to 74 Years | 317 (97.2%) | 201 (61.7%) |
| 75 Years and over | 260 (100.0%) | 196 (75.4%) |
| Total | 1,971 (56.9%) | 2,006 (57.9%) |
Disability Status by Sex by Age in Lowville
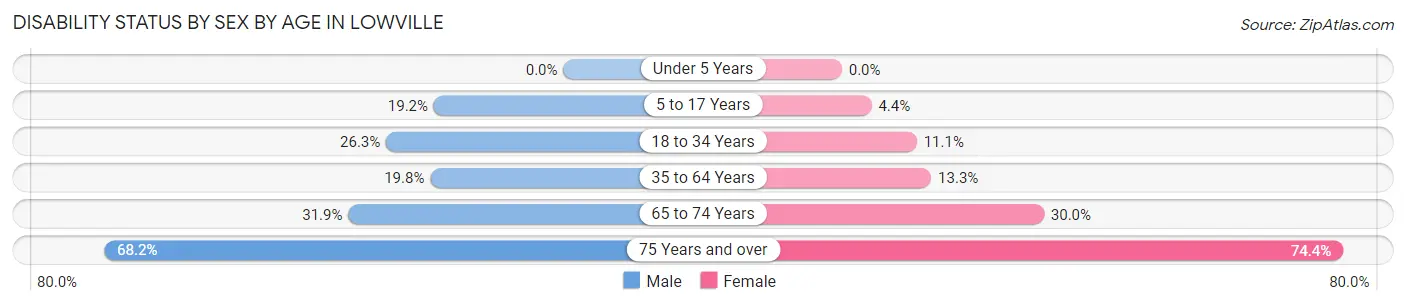
| Age Bracket | Male | Female |
| Under 5 Years | 0 (0.0%) | 0 (0.0%) |
| 5 to 17 Years | 45 (19.2%) | 11 (4.4%) |
| 18 to 34 Years | 105 (26.3%) | 62 (11.1%) |
| 35 to 64 Years | 118 (19.8%) | 91 (13.3%) |
| 65 to 74 Years | 53 (31.9%) | 48 (30.0%) |
| 75 Years and over | 60 (68.2%) | 128 (74.4%) |
Disability Class by Sex by Age in Lowville
Disability Class: Hearing Difficulty
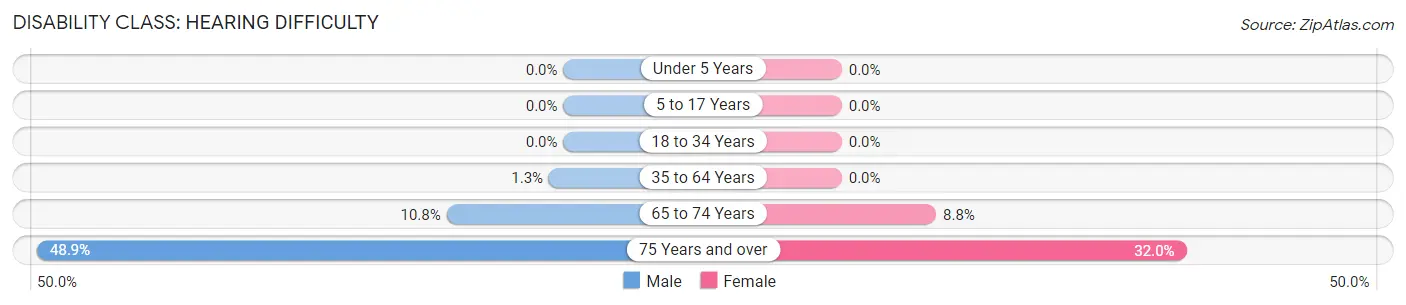
| Age Bracket | Male | Female |
| Under 5 Years | 0 (0.0%) | 0 (0.0%) |
| 5 to 17 Years | 0 (0.0%) | 0 (0.0%) |
| 18 to 34 Years | 0 (0.0%) | 0 (0.0%) |
| 35 to 64 Years | 8 (1.3%) | 0 (0.0%) |
| 65 to 74 Years | 18 (10.8%) | 14 (8.7%) |
| 75 Years and over | 43 (48.9%) | 55 (32.0%) |
Disability Class: Vision Difficulty
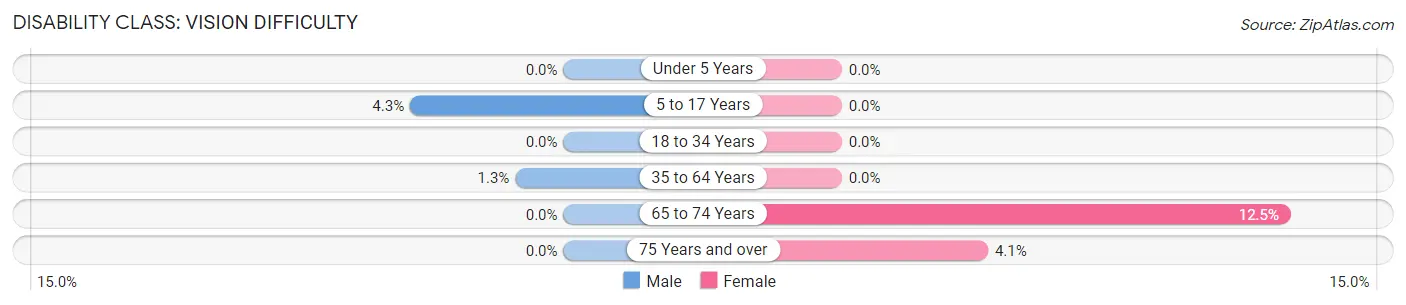
| Age Bracket | Male | Female |
| Under 5 Years | 0 (0.0%) | 0 (0.0%) |
| 5 to 17 Years | 10 (4.3%) | 0 (0.0%) |
| 18 to 34 Years | 0 (0.0%) | 0 (0.0%) |
| 35 to 64 Years | 8 (1.3%) | 0 (0.0%) |
| 65 to 74 Years | 0 (0.0%) | 20 (12.5%) |
| 75 Years and over | 0 (0.0%) | 7 (4.1%) |
Disability Class: Cognitive Difficulty
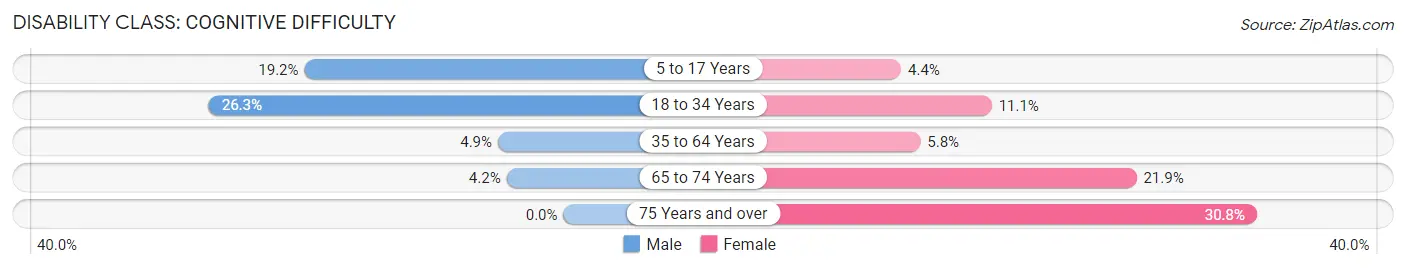
| Age Bracket | Male | Female |
| 5 to 17 Years | 45 (19.2%) | 11 (4.4%) |
| 18 to 34 Years | 105 (26.3%) | 62 (11.1%) |
| 35 to 64 Years | 29 (4.9%) | 40 (5.8%) |
| 65 to 74 Years | 7 (4.2%) | 35 (21.9%) |
| 75 Years and over | 0 (0.0%) | 53 (30.8%) |
Disability Class: Ambulatory Difficulty
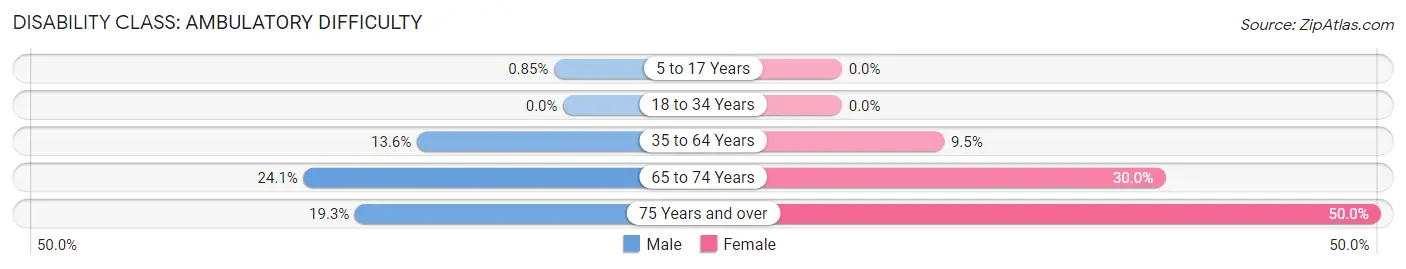
| Age Bracket | Male | Female |
| 5 to 17 Years | 2 (0.9%) | 0 (0.0%) |
| 18 to 34 Years | 0 (0.0%) | 0 (0.0%) |
| 35 to 64 Years | 81 (13.6%) | 65 (9.5%) |
| 65 to 74 Years | 40 (24.1%) | 48 (30.0%) |
| 75 Years and over | 17 (19.3%) | 86 (50.0%) |
Disability Class: Self-Care Difficulty
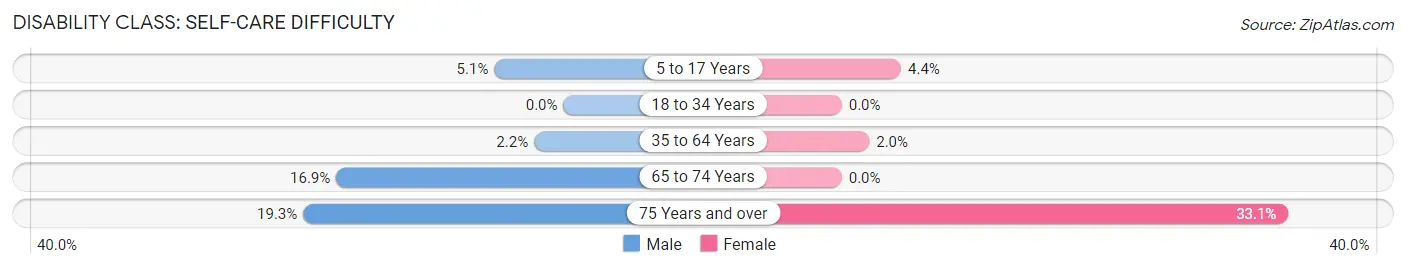
| Age Bracket | Male | Female |
| 5 to 17 Years | 12 (5.1%) | 11 (4.4%) |
| 18 to 34 Years | 0 (0.0%) | 0 (0.0%) |
| 35 to 64 Years | 13 (2.2%) | 14 (2.0%) |
| 65 to 74 Years | 28 (16.9%) | 0 (0.0%) |
| 75 Years and over | 17 (19.3%) | 57 (33.1%) |
Technology Access in Lowville
Computing Device Access in Lowville
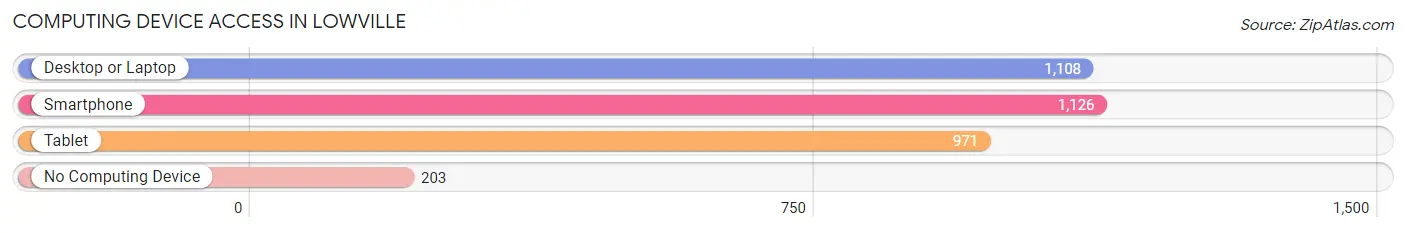
| Device Type | # Households | % Households |
| Desktop or Laptop | 1,108 | 74.5% |
| Smartphone | 1,126 | 75.7% |
| Tablet | 971 | 65.3% |
| No Computing Device | 203 | 13.7% |
| Total | 1,487 | 100.0% |
Internet Access in Lowville
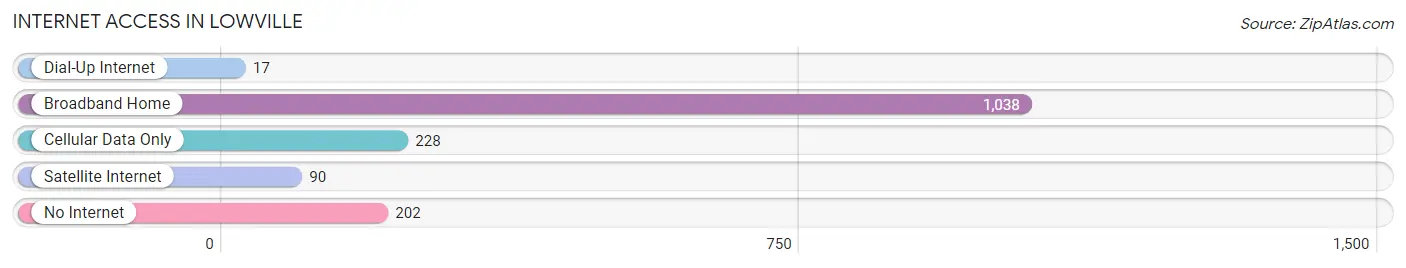
| Internet Type | # Households | % Households |
| Dial-Up Internet | 17 | 1.1% |
| Broadband Home | 1,038 | 69.8% |
| Cellular Data Only | 228 | 15.3% |
| Satellite Internet | 90 | 6.0% |
| No Internet | 202 | 13.6% |
| Total | 1,487 | 100.0% |
Lowville Summary
Lowville is a town located in Lewis County, New York, United States. The population was 3,741 at the 2010 census. It is the county seat of Lewis County. The town is named after Nicholas Low, an early settler.
Geography
Lowville is located in the northwest corner of Lewis County, bordered to the north by Jefferson County and to the west by Oneida County. The Black River flows through the town, entering from the north and exiting to the south.
According to the United States Census Bureau, the town has a total area of 57.2sqmi, of which 56.9sqmi is land and 0.3sqmi, or 0.50%, is water.
History
The area that is now Lowville was first settled around 1797. The town of Lowville was formed in 1802 from the town of Turin in Oneida County. The town was named after Nicholas Low, an early settler.
Lowville was the site of the first county seat of Lewis County, which was established in 1805. The county seat was moved to Martinsburg in 1813, but was returned to Lowville in 1817.
Economy
Lowville is the economic center of Lewis County. The town is home to several large employers, including Lowville Producers Dairy Cooperative, a large dairy cooperative, and Lowville Medical Associates, a medical practice.
The town is also home to several small businesses, including restaurants, retail stores, and service providers.
Demographics
As of the census of 2000, there were 3,741 people, 1,521 households, and 990 families residing in the town. The population density was 65.9 people per square mile (25.4/km^2). There were 1,717 housing units at an average density of 30.2 per square mile (11.7/km^2). The racial makeup of the town was 97.90% White, 0.30% African American, 0.19% Native American, 0.45% Asian, 0.05% Pacific Islander, 0.27% from other races, and 0.84% from two or more races. Hispanic or Latino of any race were 0.76% of the population.
There were 1,521 households, out of which 30.2% had children under the age of 18 living with them, 50.2% were married couples living together, 10.7% had a female householder with no husband present, and 34.2% were non-families. 29.2% of all households were made up of individuals, and 14.2% had someone living alone who was 65 years of age or older. The average household size was 2.44 and the average family size was 3.01.
In the town, the population was spread out, with 25.2% under the age of 18, 7.7% from 18 to 24, 27.2% from 25 to 44, 23.2% from 45 to 64, and 16.7% who were 65 years of age or older. The median age was 38 years. For every 100 females, there were 93.2 males. For every 100 females age 18 and over, there were 90.2 males.
The median income for a household in the town was $33,958, and the median income for a family was $41,944. Males had a median income of $30,917 versus $21,917 for females. The per capita income for the town was $17,845. About 8.2% of families and 10.7% of the population were below the poverty line, including 14.2% of those under age 18 and 8.2% of those age 65 or over.
Common Questions
What is Per Capita Income in Lowville?
Per Capita income in Lowville is $30,142.
What is the Median Family Income in Lowville?
Median Family Income in Lowville is $75,591.
What is the Median Household income in Lowville?
Median Household Income in Lowville is $55,607.
What is Income or Wage Gap in Lowville?
Income or Wage Gap in Lowville is 24.9%.
Women in Lowville earn 75.1 cents for every dollar earned by a man.
What is Inequality or Gini Index in Lowville?
Inequality or Gini Index in Lowville is 0.43.
What is the Total Population of Lowville?
Total Population of Lowville is 3,534.
What is the Total Male Population of Lowville?
Total Male Population of Lowville is 1,620.
What is the Total Female Population of Lowville?
Total Female Population of Lowville is 1,914.
What is the Ratio of Males per 100 Females in Lowville?
There are 84.64 Males per 100 Females in Lowville.
What is the Ratio of Females per 100 Males in Lowville?
There are 118.15 Females per 100 Males in Lowville.
What is the Median Population Age in Lowville?
Median Population Age in Lowville is 38.2 Years.
What is the Average Family Size in Lowville
Average Family Size in Lowville is 2.8 People.
What is the Average Household Size in Lowville
Average Household Size in Lowville is 2.3 People.
How Large is the Labor Force in Lowville?
There are 1,736 People in the Labor Forcein in Lowville.
What is the Percentage of People in the Labor Force in Lowville?
58.6% of People are in the Labor Force in Lowville.
What is the Unemployment Rate in Lowville?
Unemployment Rate in Lowville is 7.6%.