Lockport, NY Map & Demographics
Lockport Map
Lockport Overview
$31,877
PER CAPITA INCOME
$73,503
AVG FAMILY INCOME
$56,053
AVG HOUSEHOLD INCOME
29.1%
WAGE / INCOME GAP [ % ]
70.9¢/ $1
WAGE / INCOME GAP [ $ ]
$12,398
FAMILY INCOME DEFICIT
0.42
INEQUALITY / GINI INDEX
20,808
TOTAL POPULATION
10,010
MALE POPULATION
10,798
FEMALE POPULATION
92.70
MALES / 100 FEMALES
107.87
FEMALES / 100 MALES
36.8
MEDIAN AGE
3.0
AVG FAMILY SIZE
2.2
AVG HOUSEHOLD SIZE
10,744
LABOR FORCE [ PEOPLE ]
64.1%
PERCENT IN LABOR FORCE
5.7%
UNEMPLOYMENT RATE
Lockport Zip Codes
Lockport Area Codes
Income in Lockport
Income Overview in Lockport
Per Capita Income in Lockport is $31,877, while median incomes of families and households are $73,503 and $56,053 respectively.
| Characteristic | Number | Measure |
| Per Capita Income | 20,808 | $31,877 |
| Median Family Income | 5,143 | $73,503 |
| Mean Family Income | 5,143 | $85,374 |
| Median Household Income | 9,220 | $56,053 |
| Mean Household Income | 9,220 | $71,330 |
| Income Deficit | 5,143 | $12,398 |
| Wage / Income Gap (%) | 20,808 | 29.08% |
| Wage / Income Gap ($) | 20,808 | 70.92¢ per $1 |
| Gini / Inequality Index | 20,808 | 0.42 |
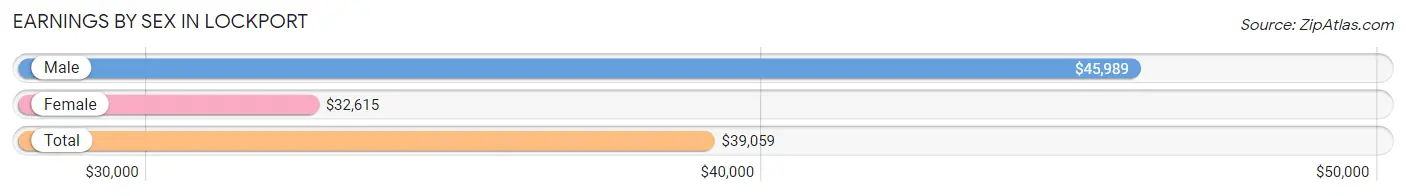
Earnings by Sex in Lockport
Average Earnings in Lockport are $39,059, $45,989 for men and $32,615 for women, a difference of 29.1%.
| Sex | Number | Average Earnings |
| Male | 5,519 (50.8%) | $45,989 |
| Female | 5,345 (49.2%) | $32,615 |
| Total | 10,864 (100.0%) | $39,059 |
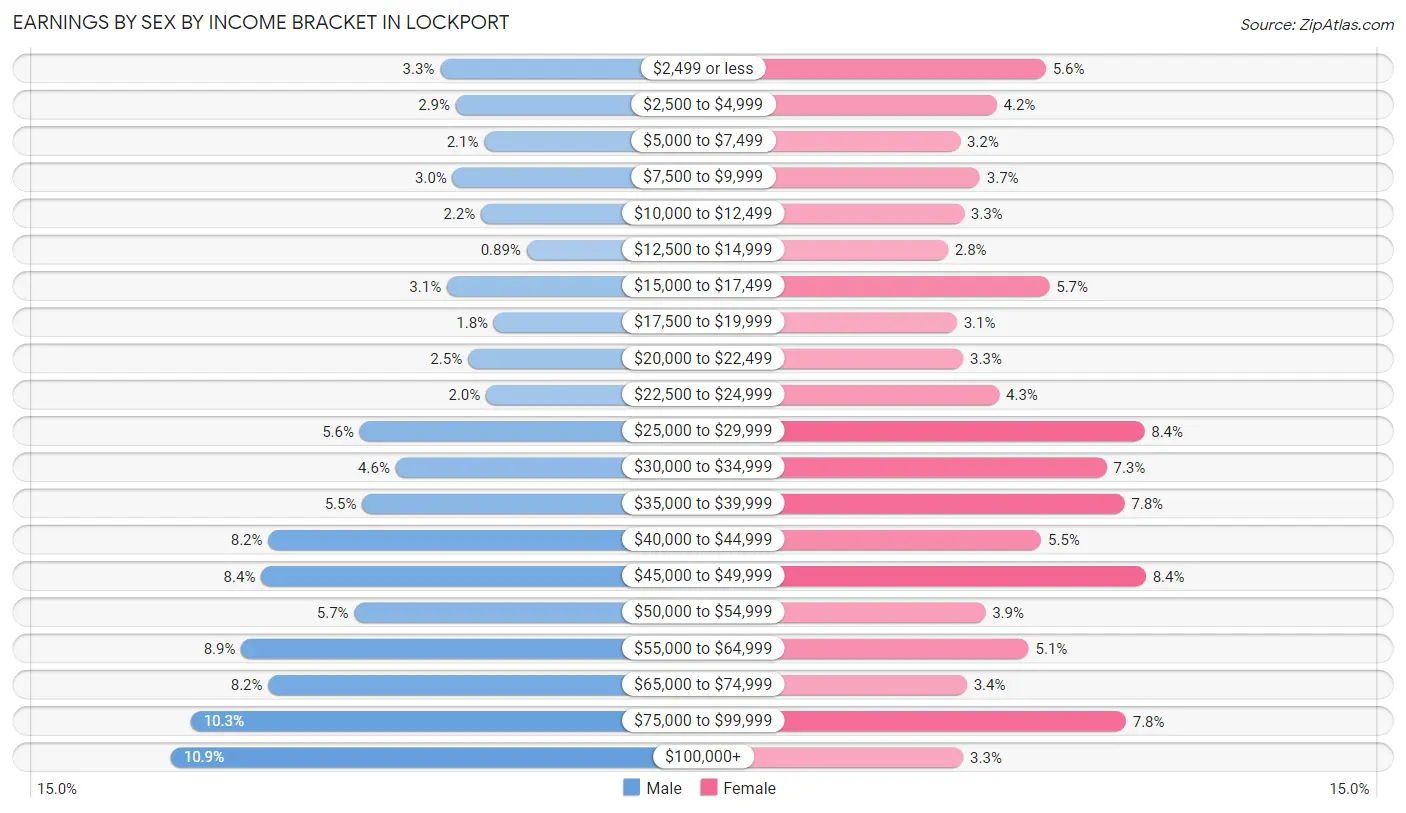
Earnings by Sex by Income Bracket in Lockport
The most common earnings brackets in Lockport are $100,000+ for men (601 | 10.9%) and $45,000 to $49,999 for women (449 | 8.4%).
| Income | Male | Female |
| $2,499 or less | 183 (3.3%) | 299 (5.6%) |
| $2,500 to $4,999 | 159 (2.9%) | 225 (4.2%) |
| $5,000 to $7,499 | 115 (2.1%) | 170 (3.2%) |
| $7,500 to $9,999 | 164 (3.0%) | 200 (3.7%) |
| $10,000 to $12,499 | 120 (2.2%) | 176 (3.3%) |
| $12,500 to $14,999 | 49 (0.9%) | 152 (2.8%) |
| $15,000 to $17,499 | 173 (3.1%) | 304 (5.7%) |
| $17,500 to $19,999 | 100 (1.8%) | 165 (3.1%) |
| $20,000 to $22,499 | 140 (2.5%) | 175 (3.3%) |
| $22,500 to $24,999 | 112 (2.0%) | 229 (4.3%) |
| $25,000 to $29,999 | 308 (5.6%) | 447 (8.4%) |
| $30,000 to $34,999 | 252 (4.6%) | 390 (7.3%) |
| $35,000 to $39,999 | 304 (5.5%) | 417 (7.8%) |
| $40,000 to $44,999 | 450 (8.2%) | 292 (5.5%) |
| $45,000 to $49,999 | 461 (8.4%) | 449 (8.4%) |
| $50,000 to $54,999 | 316 (5.7%) | 208 (3.9%) |
| $55,000 to $64,999 | 492 (8.9%) | 273 (5.1%) |
| $65,000 to $74,999 | 450 (8.2%) | 180 (3.4%) |
| $75,000 to $99,999 | 570 (10.3%) | 419 (7.8%) |
| $100,000+ | 601 (10.9%) | 175 (3.3%) |
| Total | 5,519 (100.0%) | 5,345 (100.0%) |
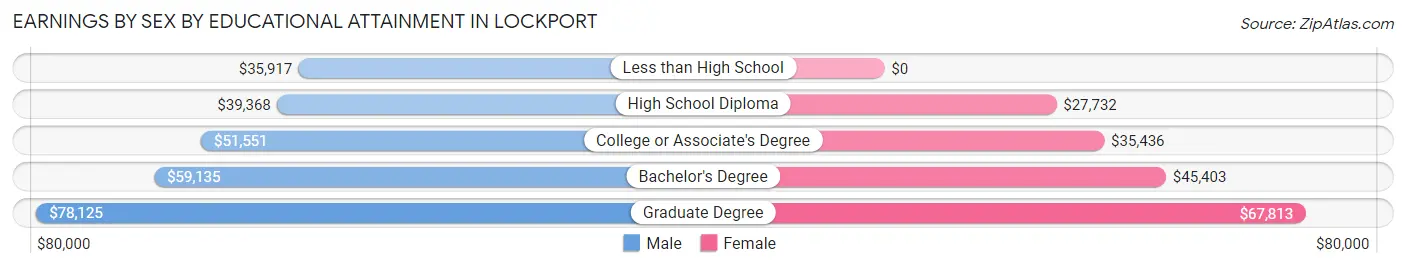
Earnings by Sex by Educational Attainment in Lockport
Average earnings in Lockport are $50,133 for men and $36,315 for women, a difference of 27.6%. Men with an educational attainment of graduate degree enjoy the highest average annual earnings of $78,125, while those with less than high school education earn the least with $35,917. Women with an educational attainment of graduate degree earn the most with the average annual earnings of $67,813, while those with high school diploma education have the smallest earnings of $27,732.
| Educational Attainment | Male Income | Female Income |
| Less than High School | $35,917 | $0 |
| High School Diploma | $39,368 | $27,732 |
| College or Associate's Degree | $51,551 | $35,436 |
| Bachelor's Degree | $59,135 | $45,403 |
| Graduate Degree | $78,125 | $67,813 |
| Total | $50,133 | $36,315 |
Family Income in Lockport
Family Income Brackets in Lockport
According to the Lockport family income data, there are 921 families falling into the $100,000 to $149,999 income range, which is the most common income bracket and makes up 17.9% of all families. Conversely, the $10,000 to $14,999 income bracket is the least frequent group with only 82 families (1.6%) belonging to this category.
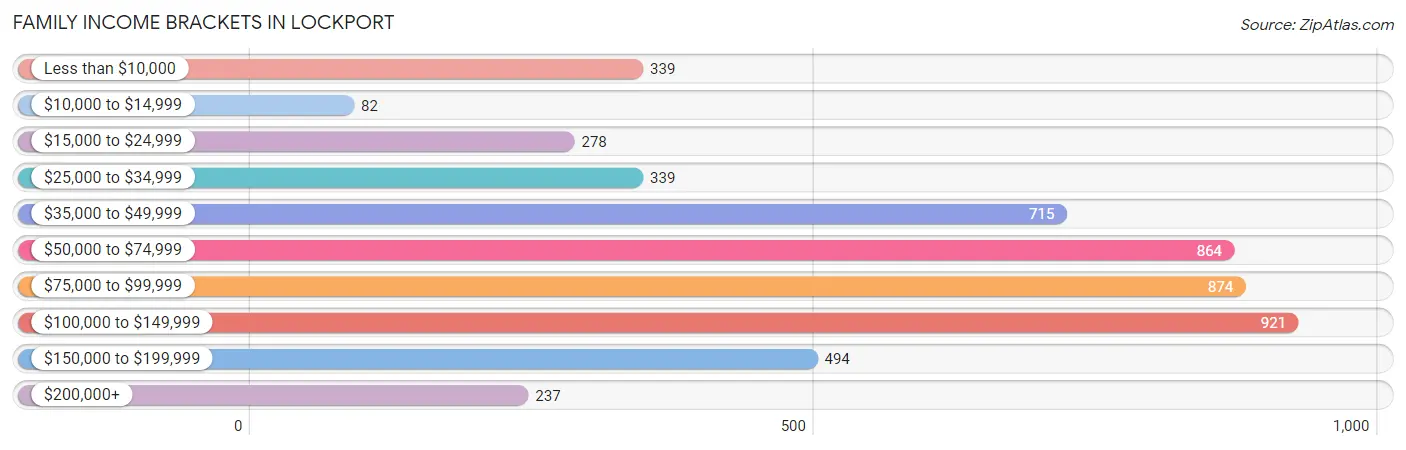
| Income Bracket | # Families | % Families |
| Less than $10,000 | 339 | 6.6% |
| $10,000 to $14,999 | 82 | 1.6% |
| $15,000 to $24,999 | 278 | 5.4% |
| $25,000 to $34,999 | 339 | 6.6% |
| $35,000 to $49,999 | 715 | 13.9% |
| $50,000 to $74,999 | 864 | 16.8% |
| $75,000 to $99,999 | 874 | 17.0% |
| $100,000 to $149,999 | 921 | 17.9% |
| $150,000 to $199,999 | 494 | 9.6% |
| $200,000+ | 237 | 4.6% |
Family Income by Famaliy Size in Lockport
4-person families (817 | 15.9%) account for the highest median family income in Lockport with $83,138 per family, while 2-person families (2,563 | 49.8%) have the highest median income of $31,658 per family member.
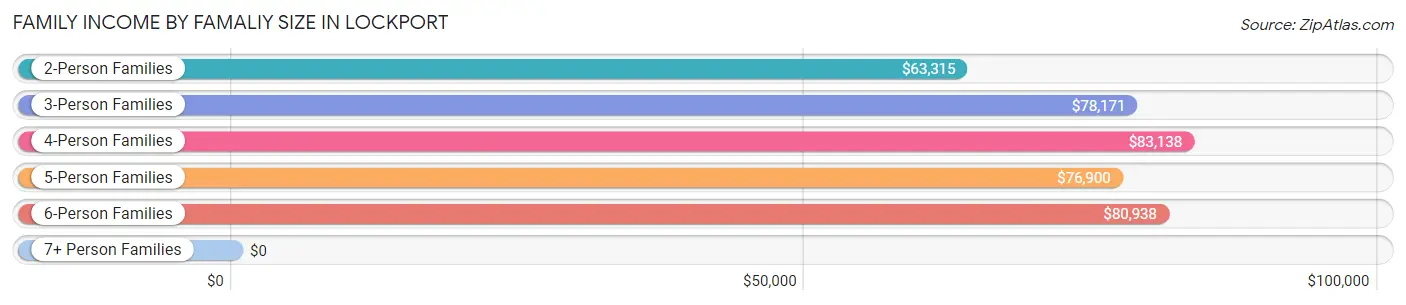
| Income Bracket | # Families | Median Income |
| 2-Person Families | 2,563 (49.8%) | $63,315 |
| 3-Person Families | 1,182 (23.0%) | $78,171 |
| 4-Person Families | 817 (15.9%) | $83,138 |
| 5-Person Families | 416 (8.1%) | $76,900 |
| 6-Person Families | 135 (2.6%) | $80,938 |
| 7+ Person Families | 30 (0.6%) | $0 |
| Total | 5,143 (100.0%) | $73,503 |
Family Income by Number of Earners in Lockport
The median family income in Lockport is $73,503, with families comprising 3+ earners (478) having the highest median family income of $143,500, while families with no earners (827) have the lowest median family income of $38,720, accounting for 9.3% and 16.1% of families, respectively.
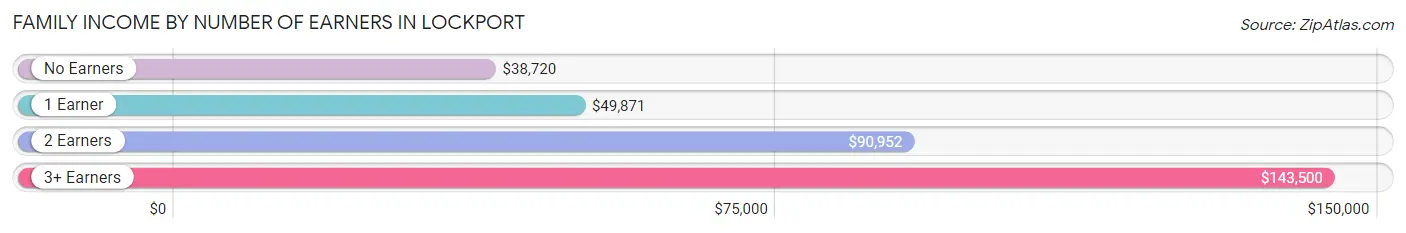
| Number of Earners | # Families | Median Income |
| No Earners | 827 (16.1%) | $38,720 |
| 1 Earner | 1,858 (36.1%) | $49,871 |
| 2 Earners | 1,980 (38.5%) | $90,952 |
| 3+ Earners | 478 (9.3%) | $143,500 |
| Total | 5,143 (100.0%) | $73,503 |
Household Income in Lockport
Household Income Brackets in Lockport
With 1,503 households falling in the category, the $35,000 to $49,999 income range is the most frequent in Lockport, accounting for 16.3% of all households. In contrast, only 267 households (2.9%) fall into the $200,000+ income bracket, making it the least populous group.
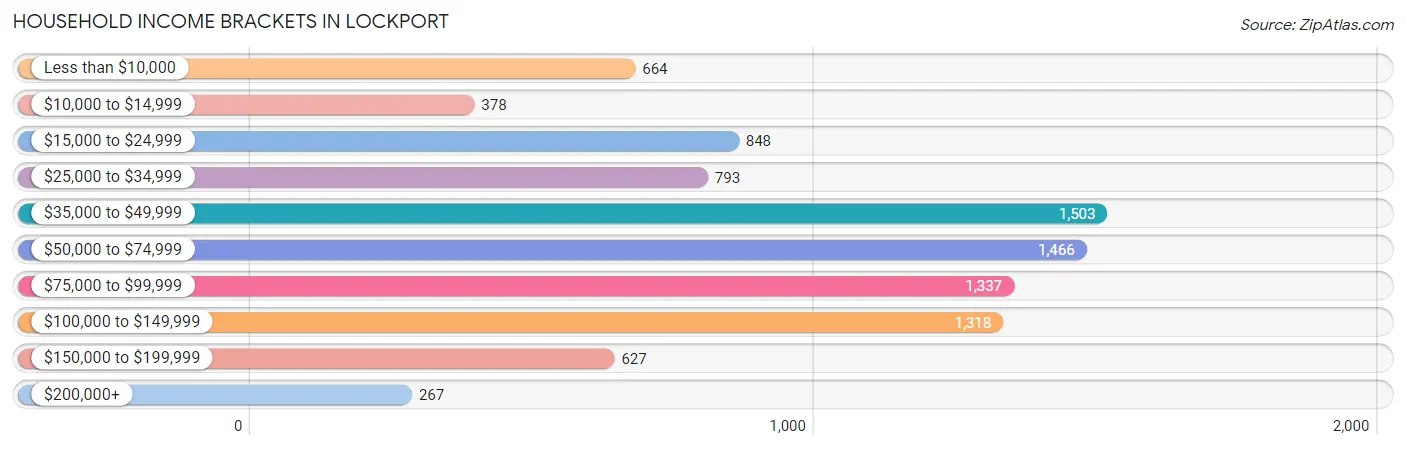
| Income Bracket | # Households | % Households |
| Less than $10,000 | 664 | 7.2% |
| $10,000 to $14,999 | 378 | 4.1% |
| $15,000 to $24,999 | 848 | 9.2% |
| $25,000 to $34,999 | 793 | 8.6% |
| $35,000 to $49,999 | 1,503 | 16.3% |
| $50,000 to $74,999 | 1,466 | 15.9% |
| $75,000 to $99,999 | 1,337 | 14.5% |
| $100,000 to $149,999 | 1,318 | 14.3% |
| $150,000 to $199,999 | 627 | 6.8% |
| $200,000+ | 267 | 2.9% |
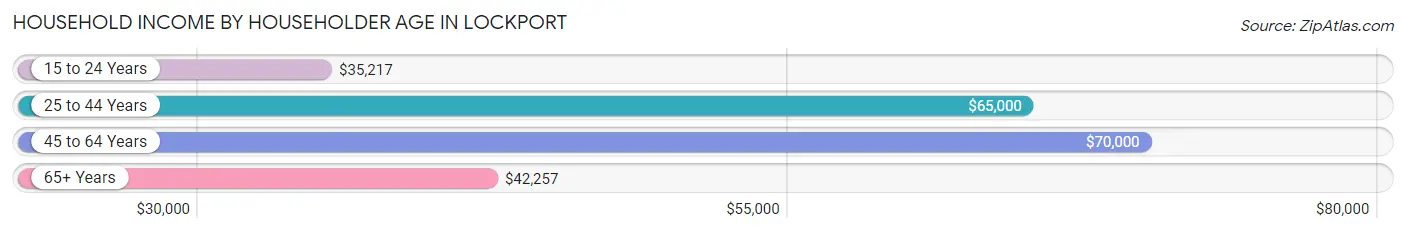
Household Income by Householder Age in Lockport
The median household income in Lockport is $56,053, with the highest median household income of $70,000 found in the 45 to 64 years age bracket for the primary householder. A total of 3,304 households (35.8%) fall into this category. Meanwhile, the 15 to 24 years age bracket for the primary householder has the lowest median household income of $35,217, with 380 households (4.1%) in this group.
| Income Bracket | # Households | Median Income |
| 15 to 24 Years | 380 (4.1%) | $35,217 |
| 25 to 44 Years | 3,204 (34.7%) | $65,000 |
| 45 to 64 Years | 3,304 (35.8%) | $70,000 |
| 65+ Years | 2,332 (25.3%) | $42,257 |
| Total | 9,220 (100.0%) | $56,053 |
Poverty in Lockport
Income Below Poverty by Sex and Age in Lockport
With 13.9% poverty level for males and 18.7% for females among the residents of Lockport, under 5 year old males and 5 year old females are the most vulnerable to poverty, with 214 males (39.5%) and 90 females (40.7%) in their respective age groups living below the poverty level.
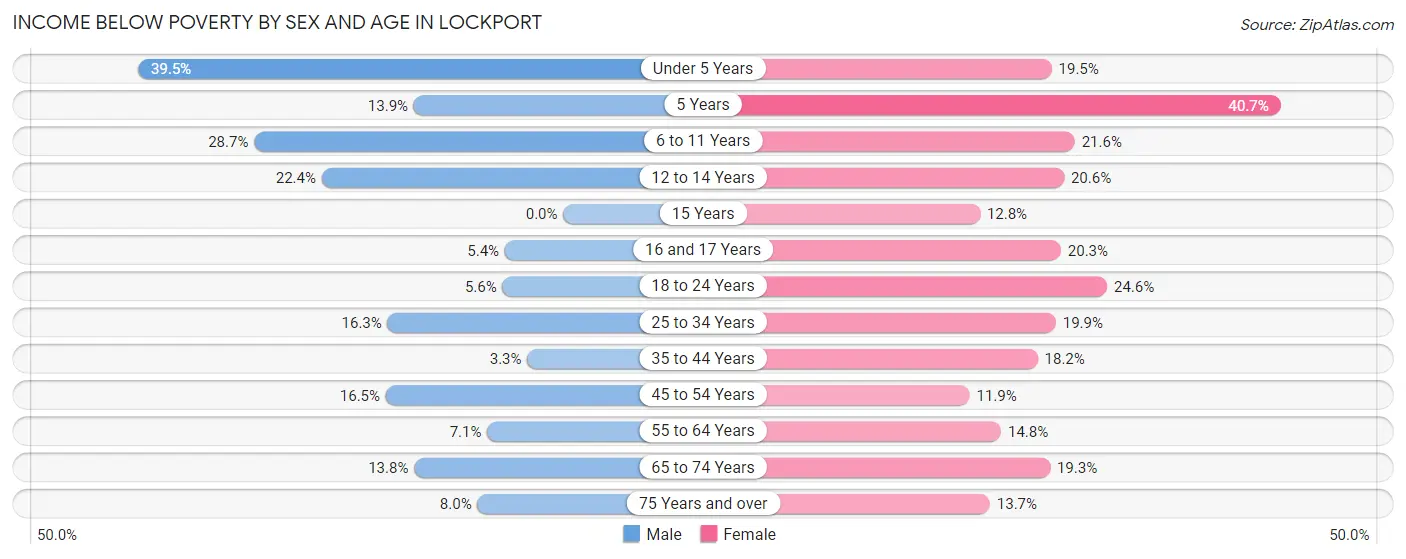
| Age Bracket | Male | Female |
| Under 5 Years | 214 (39.5%) | 73 (19.5%) |
| 5 Years | 19 (13.9%) | 90 (40.7%) |
| 6 to 11 Years | 212 (28.7%) | 198 (21.6%) |
| 12 to 14 Years | 113 (22.4%) | 73 (20.6%) |
| 15 Years | 0 (0.0%) | 15 (12.8%) |
| 16 and 17 Years | 11 (5.4%) | 62 (20.3%) |
| 18 to 24 Years | 45 (5.6%) | 256 (24.6%) |
| 25 to 34 Years | 244 (16.3%) | 350 (19.9%) |
| 35 to 44 Years | 49 (3.3%) | 241 (18.2%) |
| 45 to 54 Years | 205 (16.5%) | 119 (11.9%) |
| 55 to 64 Years | 88 (7.1%) | 230 (14.8%) |
| 65 to 74 Years | 137 (13.8%) | 177 (19.3%) |
| 75 Years and over | 35 (8.0%) | 105 (13.7%) |
| Total | 1,372 (13.9%) | 1,989 (18.7%) |
Income Above Poverty by Sex and Age in Lockport
According to the poverty statistics in Lockport, males aged 15 years and females aged 45 to 54 years are the age groups that are most secure financially, with 100.0% of males and 88.1% of females in these age groups living above the poverty line.
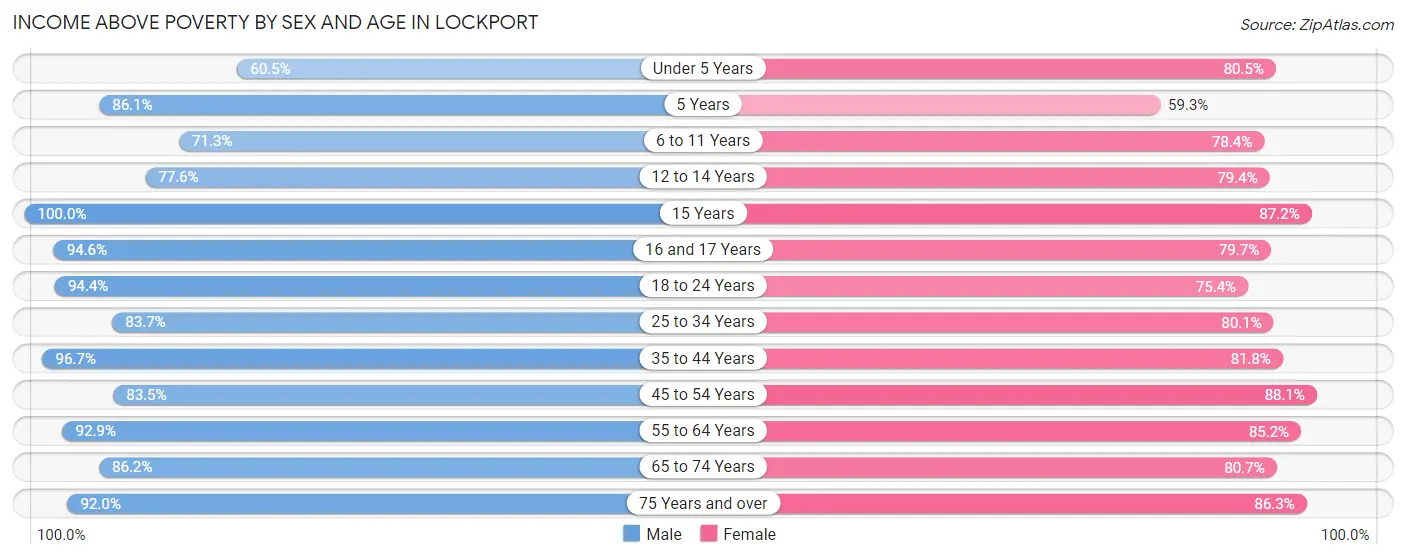
| Age Bracket | Male | Female |
| Under 5 Years | 328 (60.5%) | 302 (80.5%) |
| 5 Years | 118 (86.1%) | 131 (59.3%) |
| 6 to 11 Years | 527 (71.3%) | 718 (78.4%) |
| 12 to 14 Years | 391 (77.6%) | 281 (79.4%) |
| 15 Years | 60 (100.0%) | 102 (87.2%) |
| 16 and 17 Years | 192 (94.6%) | 243 (79.7%) |
| 18 to 24 Years | 753 (94.4%) | 784 (75.4%) |
| 25 to 34 Years | 1,252 (83.7%) | 1,412 (80.1%) |
| 35 to 44 Years | 1,417 (96.7%) | 1,085 (81.8%) |
| 45 to 54 Years | 1,040 (83.5%) | 884 (88.1%) |
| 55 to 64 Years | 1,158 (92.9%) | 1,326 (85.2%) |
| 65 to 74 Years | 853 (86.2%) | 739 (80.7%) |
| 75 Years and over | 404 (92.0%) | 659 (86.3%) |
| Total | 8,493 (86.1%) | 8,666 (81.3%) |
Income Below Poverty Among Married-Couple Families in Lockport
The poverty statistics for married-couple families in Lockport show that 5.1% or 155 of the total 3,032 families live below the poverty line. Families with 3 or 4 children have the highest poverty rate of 10.8%, comprising of 17 families. On the other hand, families with no children have the lowest poverty rate of 1.9%, which includes 33 families.
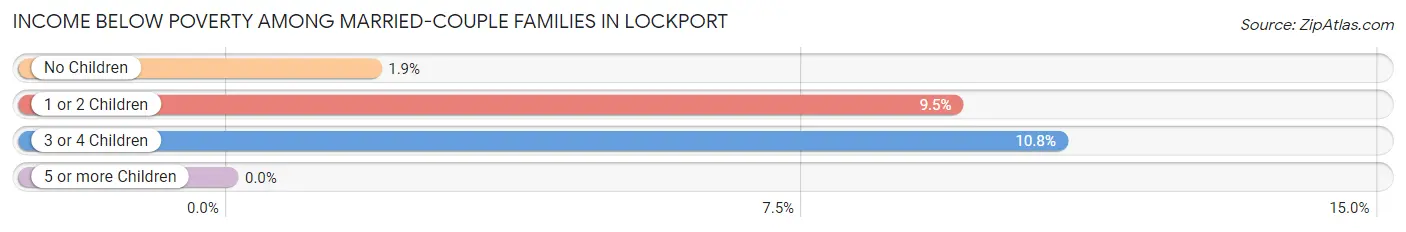
| Children | Above Poverty | Below Poverty |
| No Children | 1,733 (98.1%) | 33 (1.9%) |
| 1 or 2 Children | 1,004 (90.5%) | 105 (9.5%) |
| 3 or 4 Children | 140 (89.2%) | 17 (10.8%) |
| 5 or more Children | 0 (0.0%) | 0 (0.0%) |
| Total | 2,877 (94.9%) | 155 (5.1%) |
Income Below Poverty Among Single-Parent Households in Lockport
According to the poverty data in Lockport, 9.7% or 67 single-father households and 34.4% or 488 single-mother households are living below the poverty line. Among single-father households, those with no children have the highest poverty rate, with 50 households (22.9%) experiencing poverty. Likewise, among single-mother households, those with 3 or 4 children have the highest poverty rate, with 106 households (65.0%) falling below the poverty line.
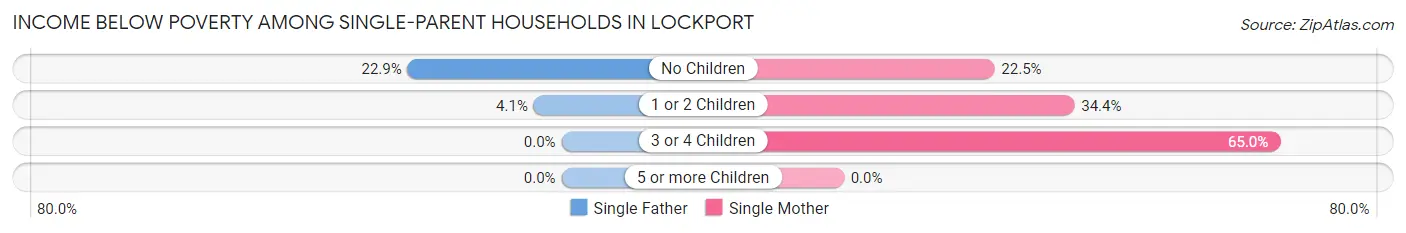
| Children | Single Father | Single Mother |
| No Children | 50 (22.9%) | 93 (22.5%) |
| 1 or 2 Children | 17 (4.1%) | 289 (34.4%) |
| 3 or 4 Children | 0 (0.0%) | 106 (65.0%) |
| 5 or more Children | 0 (0.0%) | 0 (0.0%) |
| Total | 67 (9.7%) | 488 (34.4%) |
Income Below Poverty Among Married-Couple vs Single-Parent Households in Lockport
The poverty data for Lockport shows that 155 of the married-couple family households (5.1%) and 555 of the single-parent households (26.3%) are living below the poverty level. Within the married-couple family households, those with 3 or 4 children have the highest poverty rate, with 17 households (10.8%) falling below the poverty line. Among the single-parent households, those with 3 or 4 children have the highest poverty rate, with 106 household (46.9%) living below poverty.
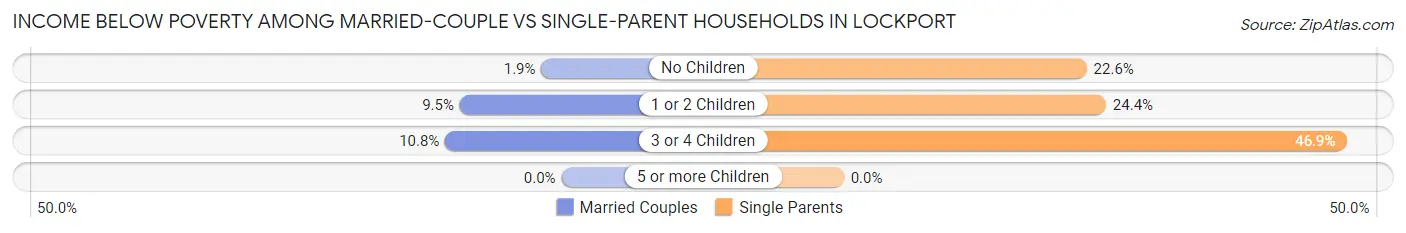
| Children | Married-Couple Families | Single-Parent Households |
| No Children | 33 (1.9%) | 143 (22.6%) |
| 1 or 2 Children | 105 (9.5%) | 306 (24.4%) |
| 3 or 4 Children | 17 (10.8%) | 106 (46.9%) |
| 5 or more Children | 0 (0.0%) | 0 (0.0%) |
| Total | 155 (5.1%) | 555 (26.3%) |
Race in Lockport
The most populous races in Lockport are White / Caucasian (16,080 | 77.3%), Black / African American (2,568 | 12.3%), and Two or more Races (1,835 | 8.8%).
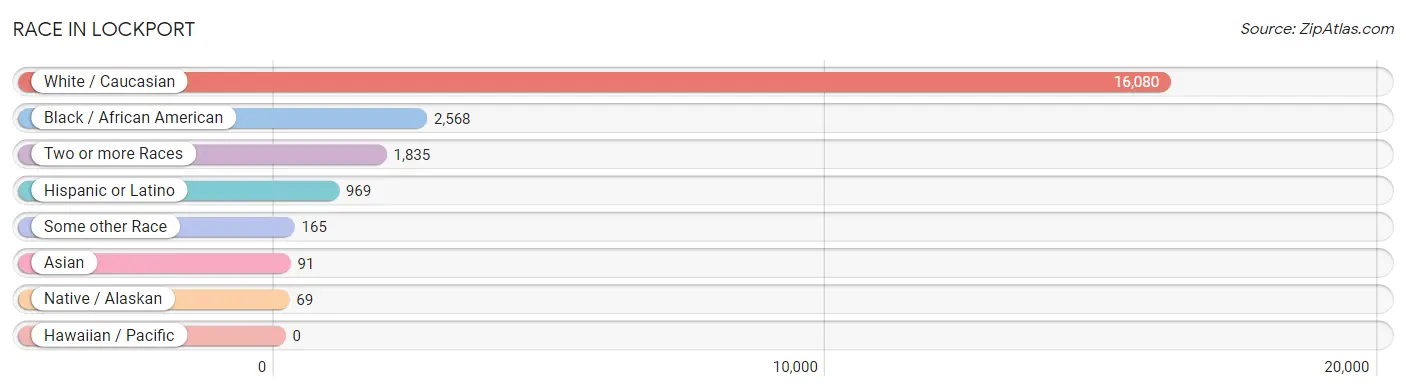
| Race | # Population | % Population |
| Asian | 91 | 0.4% |
| Black / African American | 2,568 | 12.3% |
| Hawaiian / Pacific | 0 | 0.0% |
| Hispanic or Latino | 969 | 4.7% |
| Native / Alaskan | 69 | 0.3% |
| White / Caucasian | 16,080 | 77.3% |
| Two or more Races | 1,835 | 8.8% |
| Some other Race | 165 | 0.8% |
| Total | 20,808 | 100.0% |
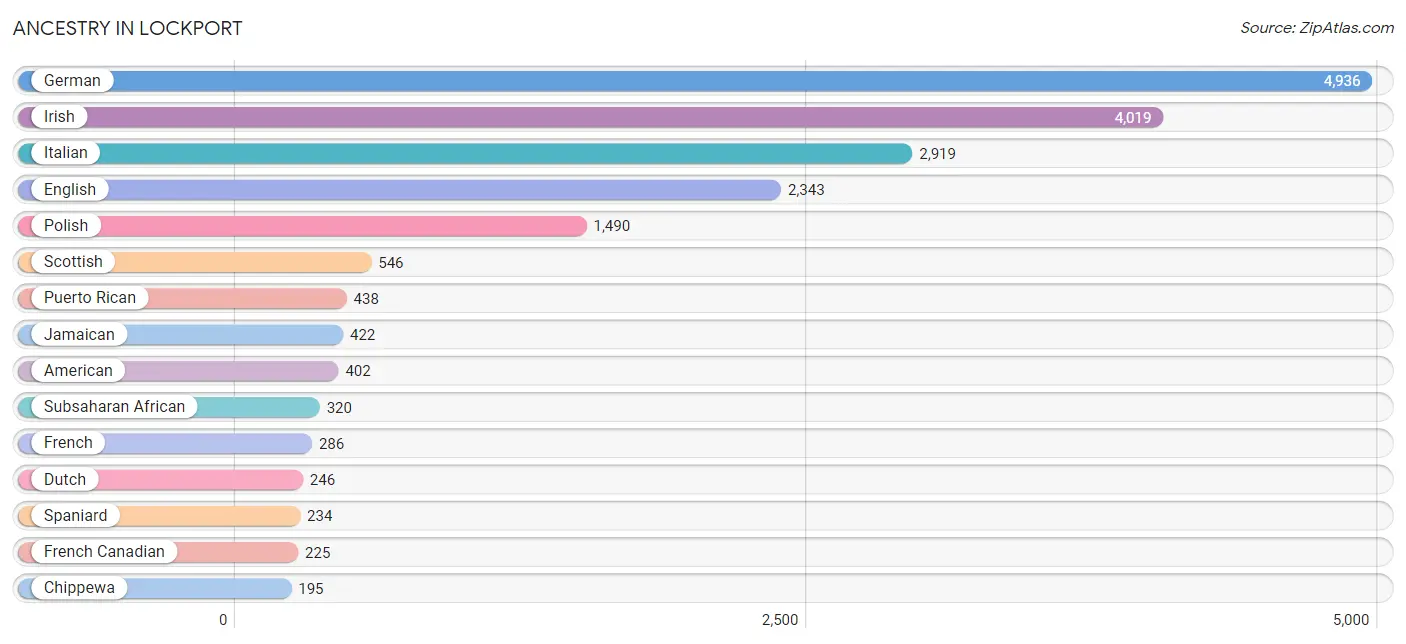
Ancestry in Lockport
The most populous ancestries reported in Lockport are German (4,936 | 23.7%), Irish (4,019 | 19.3%), Italian (2,919 | 14.0%), English (2,343 | 11.3%), and Polish (1,490 | 7.2%), together accounting for 75.5% of all Lockport residents.
| Ancestry | # Population | % Population |
| African | 56 | 0.3% |
| Albanian | 21 | 0.1% |
| American | 402 | 1.9% |
| Arab | 62 | 0.3% |
| Arapaho | 19 | 0.1% |
| Armenian | 7 | 0.0% |
| Austrian | 96 | 0.5% |
| Belgian | 10 | 0.1% |
| Bhutanese | 24 | 0.1% |
| Brazilian | 38 | 0.2% |
| British | 62 | 0.3% |
| Burmese | 13 | 0.1% |
| Canadian | 28 | 0.1% |
| Celtic | 24 | 0.1% |
| Central American | 118 | 0.6% |
| Cherokee | 44 | 0.2% |
| Chippewa | 195 | 0.9% |
| Croatian | 16 | 0.1% |
| Czech | 30 | 0.1% |
| Dominican | 1 | 0.0% |
| Dutch | 246 | 1.2% |
| Eastern European | 54 | 0.3% |
| English | 2,343 | 11.3% |
| Estonian | 15 | 0.1% |
| European | 77 | 0.4% |
| Finnish | 20 | 0.1% |
| French | 286 | 1.4% |
| French Canadian | 225 | 1.1% |
| German | 4,936 | 23.7% |
| Ghanaian | 15 | 0.1% |
| Greek | 98 | 0.5% |
| Hungarian | 74 | 0.4% |
| Icelander | 17 | 0.1% |
| Irish | 4,019 | 19.3% |
| Iroquois | 109 | 0.5% |
| Italian | 2,919 | 14.0% |
| Jamaican | 422 | 2.0% |
| Korean | 33 | 0.2% |
| Lebanese | 53 | 0.3% |
| Lithuanian | 49 | 0.2% |
| Mexican | 44 | 0.2% |
| Norwegian | 41 | 0.2% |
| Panamanian | 118 | 0.6% |
| Pennsylvania German | 56 | 0.3% |
| Polish | 1,490 | 7.2% |
| Portuguese | 51 | 0.3% |
| Puerto Rican | 438 | 2.1% |
| Russian | 21 | 0.1% |
| Samoan | 12 | 0.1% |
| Scandinavian | 21 | 0.1% |
| Scotch-Irish | 74 | 0.4% |
| Scottish | 546 | 2.6% |
| Slovak | 105 | 0.5% |
| South American | 38 | 0.2% |
| Spaniard | 234 | 1.1% |
| Spanish | 11 | 0.1% |
| Sri Lankan | 2 | 0.0% |
| Subsaharan African | 320 | 1.5% |
| Swedish | 111 | 0.5% |
| Swiss | 9 | 0.0% |
| Thai | 39 | 0.2% |
| Trinidadian and Tobagonian | 9 | 0.0% |
| Ukrainian | 24 | 0.1% |
| Welsh | 155 | 0.7% | View All 64 Rows |
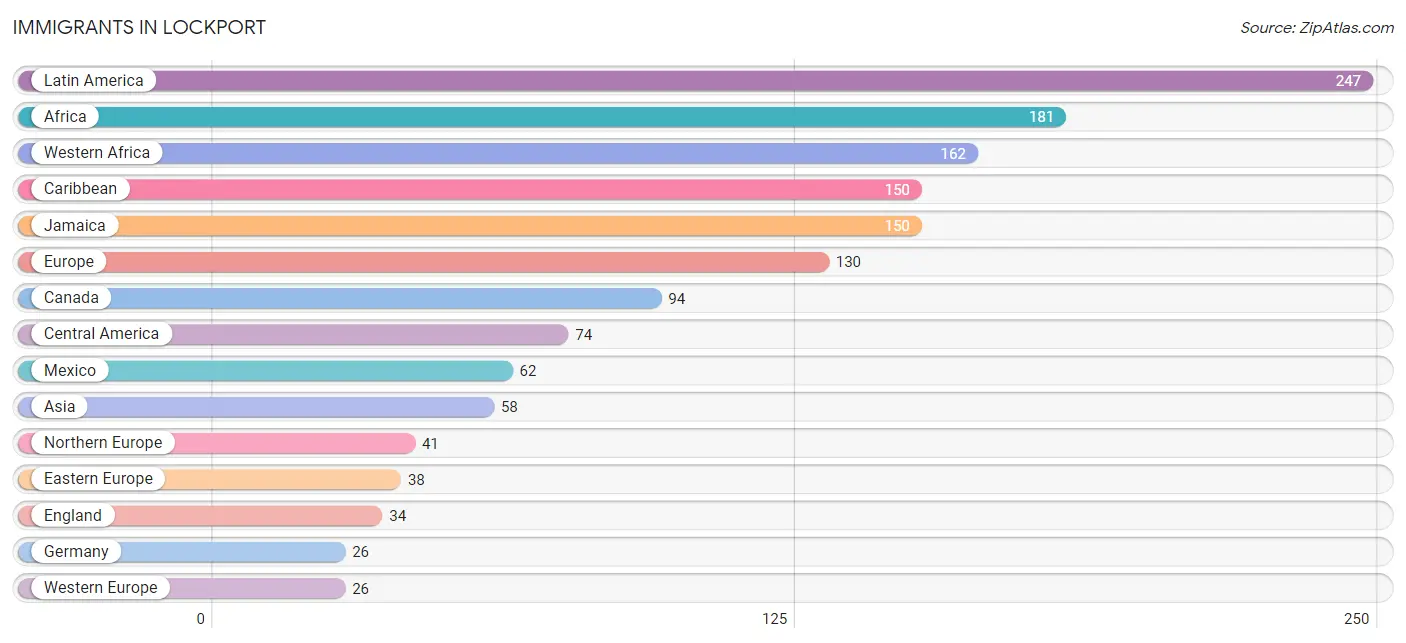
Immigrants in Lockport
The most numerous immigrant groups reported in Lockport came from Latin America (247 | 1.2%), Africa (181 | 0.9%), Western Africa (162 | 0.8%), Caribbean (150 | 0.7%), and Jamaica (150 | 0.7%), together accounting for 4.3% of all Lockport residents.
| Immigration Origin | # Population | % Population |
| Africa | 181 | 0.9% |
| Albania | 21 | 0.1% |
| Asia | 58 | 0.3% |
| Brazil | 23 | 0.1% |
| Canada | 94 | 0.4% |
| Caribbean | 150 | 0.7% |
| Central America | 74 | 0.4% |
| Czechoslovakia | 12 | 0.1% |
| Eastern Asia | 18 | 0.1% |
| Eastern Europe | 38 | 0.2% |
| England | 34 | 0.2% |
| Europe | 130 | 0.6% |
| Germany | 26 | 0.1% |
| India | 5 | 0.0% |
| Italy | 25 | 0.1% |
| Jamaica | 150 | 0.7% |
| Japan | 12 | 0.1% |
| Korea | 6 | 0.0% |
| Latin America | 247 | 1.2% |
| Mexico | 62 | 0.3% |
| Northern Africa | 19 | 0.1% |
| Northern Europe | 41 | 0.2% |
| Panama | 12 | 0.1% |
| Philippines | 10 | 0.1% |
| Poland | 5 | 0.0% |
| Saudi Arabia | 23 | 0.1% |
| South America | 23 | 0.1% |
| South Central Asia | 5 | 0.0% |
| South Eastern Asia | 12 | 0.1% |
| Southern Europe | 25 | 0.1% |
| Vietnam | 2 | 0.0% |
| Western Africa | 162 | 0.8% |
| Western Asia | 23 | 0.1% |
| Western Europe | 26 | 0.1% | View All 34 Rows |
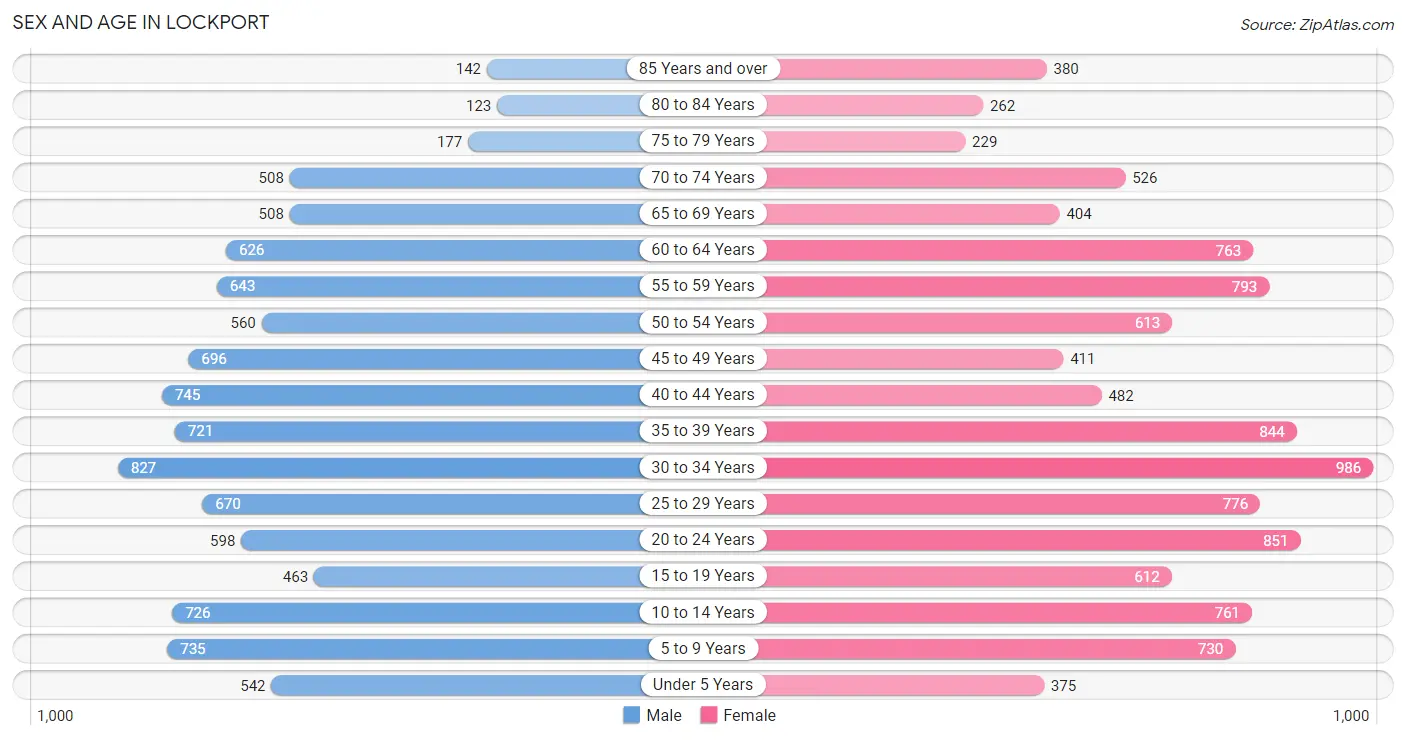
Sex and Age in Lockport
Sex and Age in Lockport
The most populous age groups in Lockport are 30 to 34 Years (827 | 8.3%) for men and 30 to 34 Years (986 | 9.1%) for women.
| Age Bracket | Male | Female |
| Under 5 Years | 542 (5.4%) | 375 (3.5%) |
| 5 to 9 Years | 735 (7.3%) | 730 (6.8%) |
| 10 to 14 Years | 726 (7.2%) | 761 (7.0%) |
| 15 to 19 Years | 463 (4.6%) | 612 (5.7%) |
| 20 to 24 Years | 598 (6.0%) | 851 (7.9%) |
| 25 to 29 Years | 670 (6.7%) | 776 (7.2%) |
| 30 to 34 Years | 827 (8.3%) | 986 (9.1%) |
| 35 to 39 Years | 721 (7.2%) | 844 (7.8%) |
| 40 to 44 Years | 745 (7.4%) | 482 (4.5%) |
| 45 to 49 Years | 696 (7.0%) | 411 (3.8%) |
| 50 to 54 Years | 560 (5.6%) | 613 (5.7%) |
| 55 to 59 Years | 643 (6.4%) | 793 (7.3%) |
| 60 to 64 Years | 626 (6.2%) | 763 (7.1%) |
| 65 to 69 Years | 508 (5.1%) | 404 (3.7%) |
| 70 to 74 Years | 508 (5.1%) | 526 (4.9%) |
| 75 to 79 Years | 177 (1.8%) | 229 (2.1%) |
| 80 to 84 Years | 123 (1.2%) | 262 (2.4%) |
| 85 Years and over | 142 (1.4%) | 380 (3.5%) |
| Total | 10,010 (100.0%) | 10,798 (100.0%) |
Families and Households in Lockport
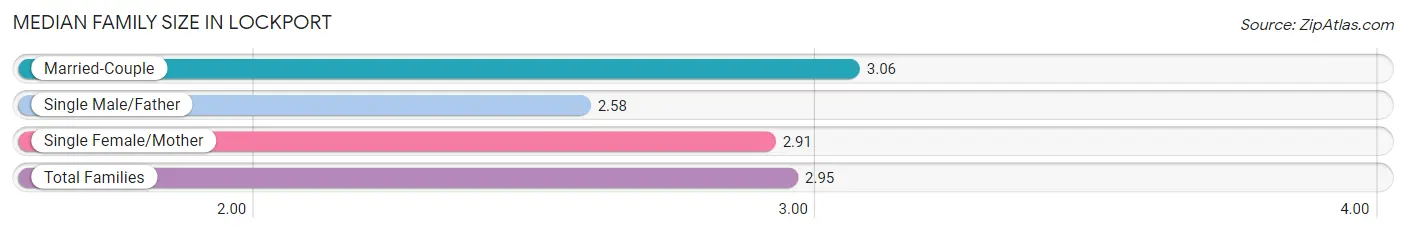
Median Family Size in Lockport
The median family size in Lockport is 2.95 persons per family, with married-couple families (3,032 | 59.0%) accounting for the largest median family size of 3.06 persons per family. On the other hand, single male/father families (693 | 13.5%) represent the smallest median family size with 2.58 persons per family.
| Family Type | # Families | Family Size |
| Married-Couple | 3,032 (59.0%) | 3.06 |
| Single Male/Father | 693 (13.5%) | 2.58 |
| Single Female/Mother | 1,418 (27.6%) | 2.91 |
| Total Families | 5,143 (100.0%) | 2.95 |
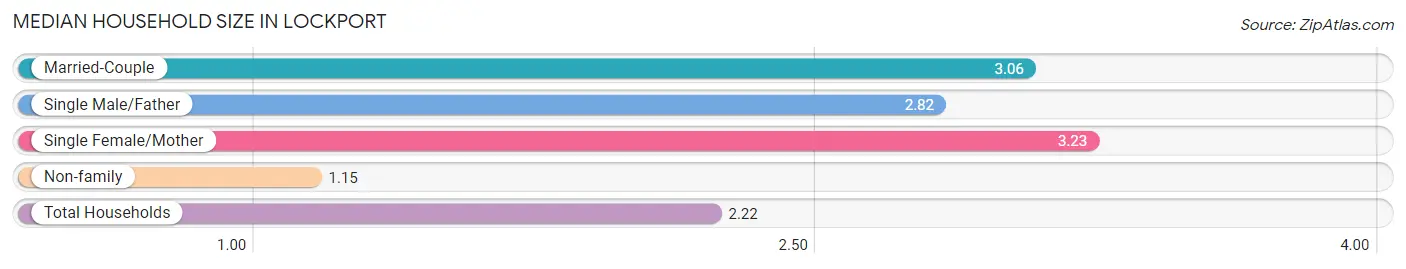
Median Household Size in Lockport
The median household size in Lockport is 2.22 persons per household, with single female/mother households (1,418 | 15.4%) accounting for the largest median household size of 3.23 persons per household. non-family households (4,077 | 44.2%) represent the smallest median household size with 1.15 persons per household.
| Household Type | # Households | Household Size |
| Married-Couple | 3,032 (32.9%) | 3.06 |
| Single Male/Father | 693 (7.5%) | 2.82 |
| Single Female/Mother | 1,418 (15.4%) | 3.23 |
| Non-family | 4,077 (44.2%) | 1.15 |
| Total Households | 9,220 (100.0%) | 2.22 |
Household Size by Marriage Status in Lockport
Out of a total of 9,220 households in Lockport, 5,143 (55.8%) are family households, while 4,077 (44.2%) are nonfamily households. The most numerous type of family households are 2-person households, comprising 2,363, and the most common type of nonfamily households are 1-person households, comprising 3,498.
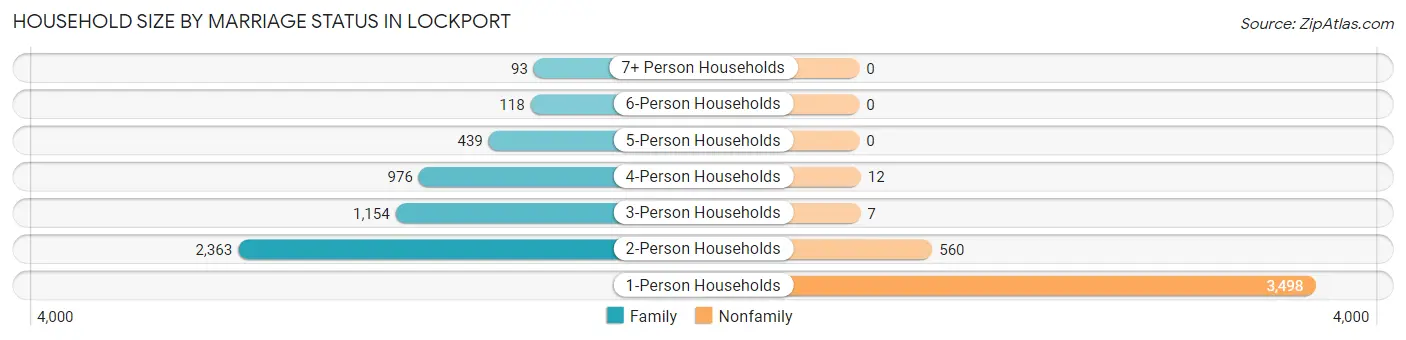
| Household Size | Family Households | Nonfamily Households |
| 1-Person Households | - | 3,498 (37.9%) |
| 2-Person Households | 2,363 (25.6%) | 560 (6.1%) |
| 3-Person Households | 1,154 (12.5%) | 7 (0.1%) |
| 4-Person Households | 976 (10.6%) | 12 (0.1%) |
| 5-Person Households | 439 (4.8%) | 0 (0.0%) |
| 6-Person Households | 118 (1.3%) | 0 (0.0%) |
| 7+ Person Households | 93 (1.0%) | 0 (0.0%) |
| Total | 5,143 (55.8%) | 4,077 (44.2%) |
Female Fertility in Lockport
Fertility by Age in Lockport
Average fertility rate in Lockport is 43.0 births per 1,000 women. Women in the age bracket of 20 to 34 years have the highest fertility rate with 56.0 births per 1,000 women. Women in the age bracket of 20 to 34 years acount for 67.6% of all women with births.
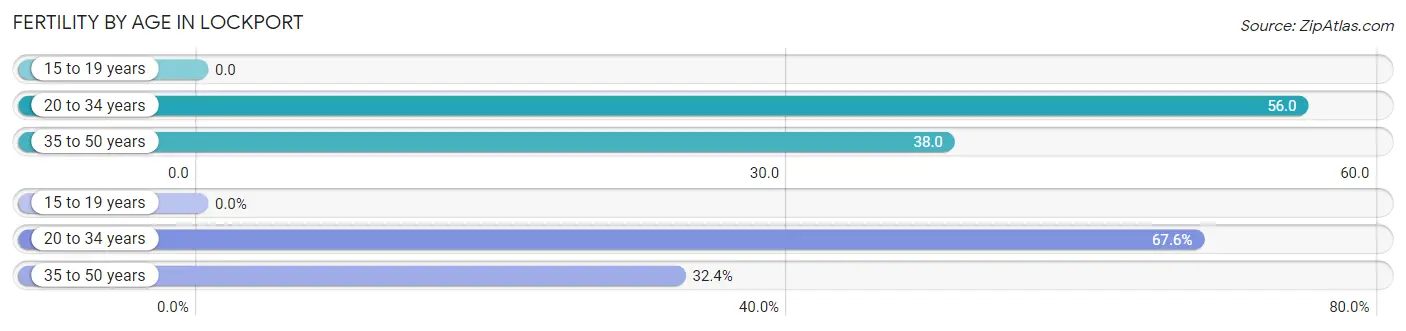
| Age Bracket | Women with Births | Births / 1,000 Women |
| 15 to 19 years | 0 (0.0%) | 0.0 |
| 20 to 34 years | 146 (67.6%) | 56.0 |
| 35 to 50 years | 70 (32.4%) | 38.0 |
| Total | 216 (100.0%) | 43.0 |
Fertility by Age by Marriage Status in Lockport
63.0% of women with births (216) in Lockport are married. The highest percentage of unmarried women with births falls into 35 to 50 years age bracket with 40.0% of them unmarried at the time of birth, while the lowest percentage of unmarried women with births belong to 20 to 34 years age bracket with 35.6% of them unmarried.
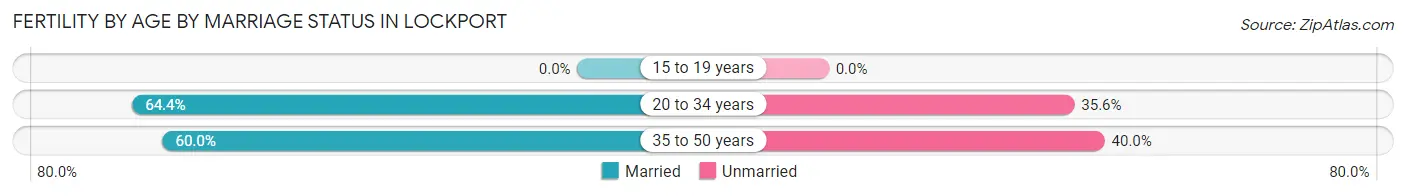
| Age Bracket | Married | Unmarried |
| 15 to 19 years | 0 (0.0%) | 0 (0.0%) |
| 20 to 34 years | 94 (64.4%) | 52 (35.6%) |
| 35 to 50 years | 42 (60.0%) | 28 (40.0%) |
| Total | 136 (63.0%) | 80 (37.0%) |
Fertility by Education in Lockport
Average fertility rate in Lockport is 43.0 births per 1,000 women. Women with the education attainment of high school diploma have the highest fertility rate of 60.0 births per 1,000 women, while women with the education attainment of less than high school have the lowest fertility at 16.0 births per 1,000 women. Women with the education attainment of college or associate's degree represent 53.7% of all women with births.
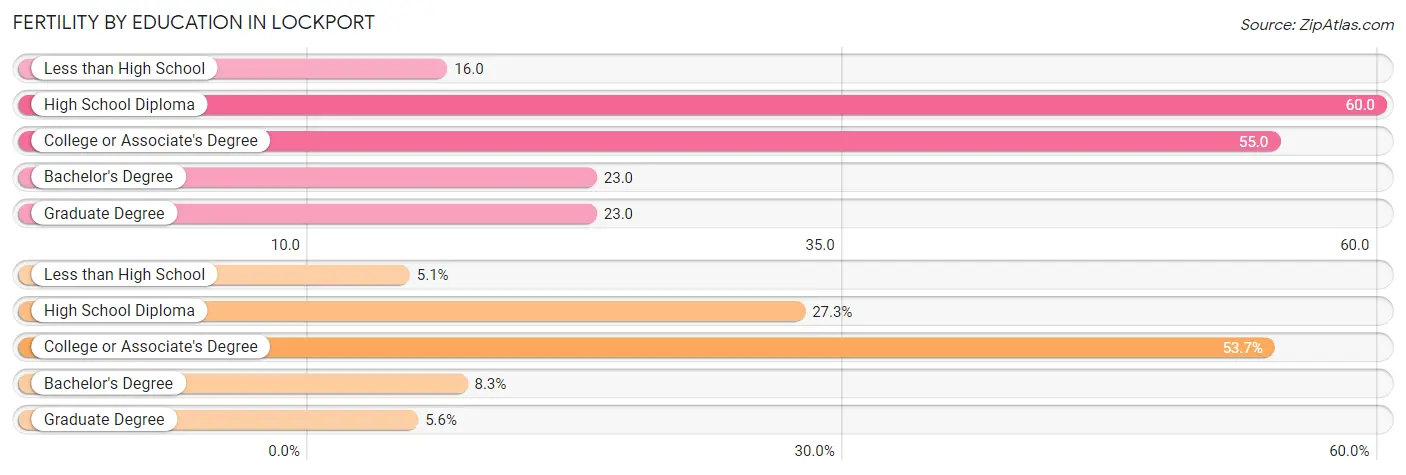
| Educational Attainment | Women with Births | Births / 1,000 Women |
| Less than High School | 11 (5.1%) | 16.0 |
| High School Diploma | 59 (27.3%) | 60.0 |
| College or Associate's Degree | 116 (53.7%) | 55.0 |
| Bachelor's Degree | 18 (8.3%) | 23.0 |
| Graduate Degree | 12 (5.6%) | 23.0 |
| Total | 216 (100.0%) | 43.0 |
Fertility by Education by Marriage Status in Lockport
37.0% of women with births in Lockport are unmarried. Women with the educational attainment of bachelor's degree are most likely to be married with 100.0% of them married at childbirth, while women with the educational attainment of less than high school are least likely to be married with 100.0% of them unmarried at childbirth.
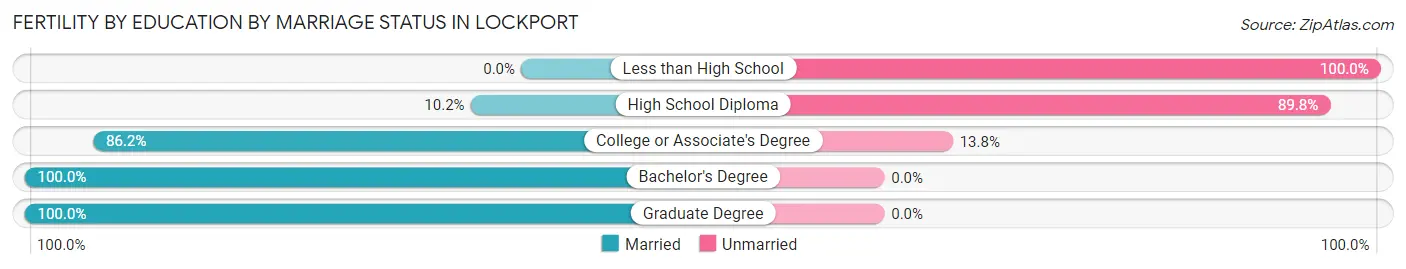
| Educational Attainment | Married | Unmarried |
| Less than High School | 0 (0.0%) | 11 (100.0%) |
| High School Diploma | 6 (10.2%) | 53 (89.8%) |
| College or Associate's Degree | 100 (86.2%) | 16 (13.8%) |
| Bachelor's Degree | 18 (100.0%) | 0 (0.0%) |
| Graduate Degree | 12 (100.0%) | 0 (0.0%) |
| Total | 136 (63.0%) | 80 (37.0%) |
Employment Characteristics in Lockport
Employment by Class of Employer in Lockport
Among the 9,861 employed individuals in Lockport, private company employees (7,121 | 72.2%), local government employees (952 | 9.7%), and not-for-profit organizations (780 | 7.9%) make up the most common classes of employment.
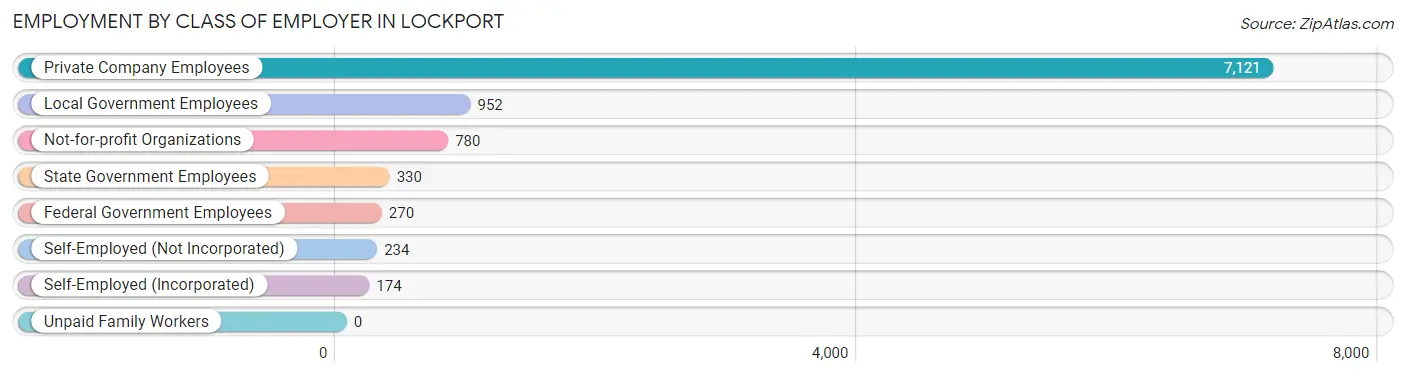
| Employer Class | # Employees | % Employees |
| Private Company Employees | 7,121 | 72.2% |
| Self-Employed (Incorporated) | 174 | 1.8% |
| Self-Employed (Not Incorporated) | 234 | 2.4% |
| Not-for-profit Organizations | 780 | 7.9% |
| Local Government Employees | 952 | 9.7% |
| State Government Employees | 330 | 3.4% |
| Federal Government Employees | 270 | 2.7% |
| Unpaid Family Workers | 0 | 0.0% |
| Total | 9,861 | 100.0% |
Employment Status by Age in Lockport
According to the labor force statistics for Lockport, out of the total population over 16 years of age (16,762), 64.1% or 10,744 individuals are in the labor force, with 5.7% or 612 of them unemployed. The age group with the highest labor force participation rate is 25 to 29 years, with 89.4% or 1,293 individuals in the labor force. Within the labor force, the 16 to 19 years age range has the highest percentage of unemployed individuals, with 27.9% or 149 of them being unemployed.
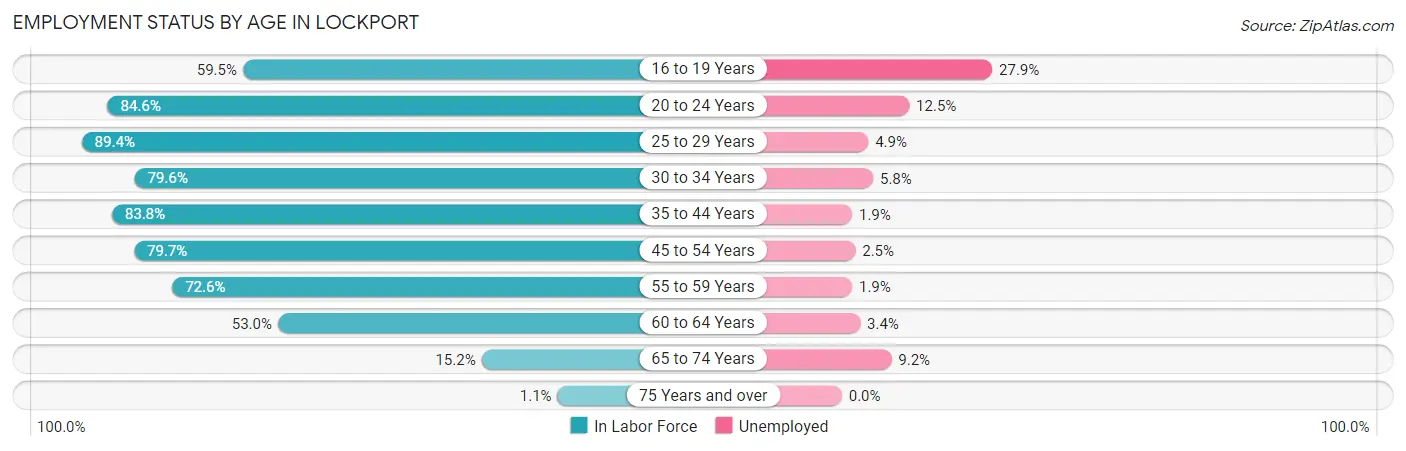
| Age Bracket | In Labor Force | Unemployed |
| 16 to 19 Years | 534 (59.5%) | 149 (27.9%) |
| 20 to 24 Years | 1,226 (84.6%) | 153 (12.5%) |
| 25 to 29 Years | 1,293 (89.4%) | 63 (4.9%) |
| 30 to 34 Years | 1,443 (79.6%) | 84 (5.8%) |
| 35 to 44 Years | 2,340 (83.8%) | 44 (1.9%) |
| 45 to 54 Years | 1,817 (79.7%) | 45 (2.5%) |
| 55 to 59 Years | 1,043 (72.6%) | 20 (1.9%) |
| 60 to 64 Years | 736 (53.0%) | 25 (3.4%) |
| 65 to 74 Years | 296 (15.2%) | 27 (9.2%) |
| 75 Years and over | 14 (1.1%) | 0 (0.0%) |
| Total | 10,744 (64.1%) | 612 (5.7%) |
Employment Status by Educational Attainment in Lockport
According to labor force statistics for Lockport, 77.7% of individuals (8,668) out of the total population between 25 and 64 years of age (11,156) are in the labor force, with 3.3% or 286 of them being unemployed. The group with the highest labor force participation rate are those with the educational attainment of bachelor's degree or higher, with 83.4% or 2,303 individuals in the labor force. Within the labor force, individuals with bachelor's degree or higher education have the highest percentage of unemployment, with 4.5% or 104 of them being unemployed.
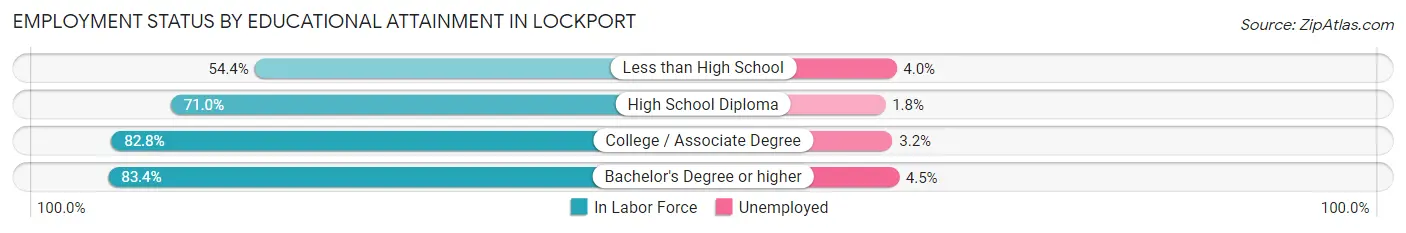
| Educational Attainment | In Labor Force | Unemployed |
| Less than High School | 478 (54.4%) | 35 (4.0%) |
| High School Diploma | 2,014 (71.0%) | 51 (1.8%) |
| College / Associate Degree | 3,876 (82.8%) | 150 (3.2%) |
| Bachelor's Degree or higher | 2,303 (83.4%) | 124 (4.5%) |
| Total | 8,668 (77.7%) | 368 (3.3%) |
Employment Occupations by Sex in Lockport
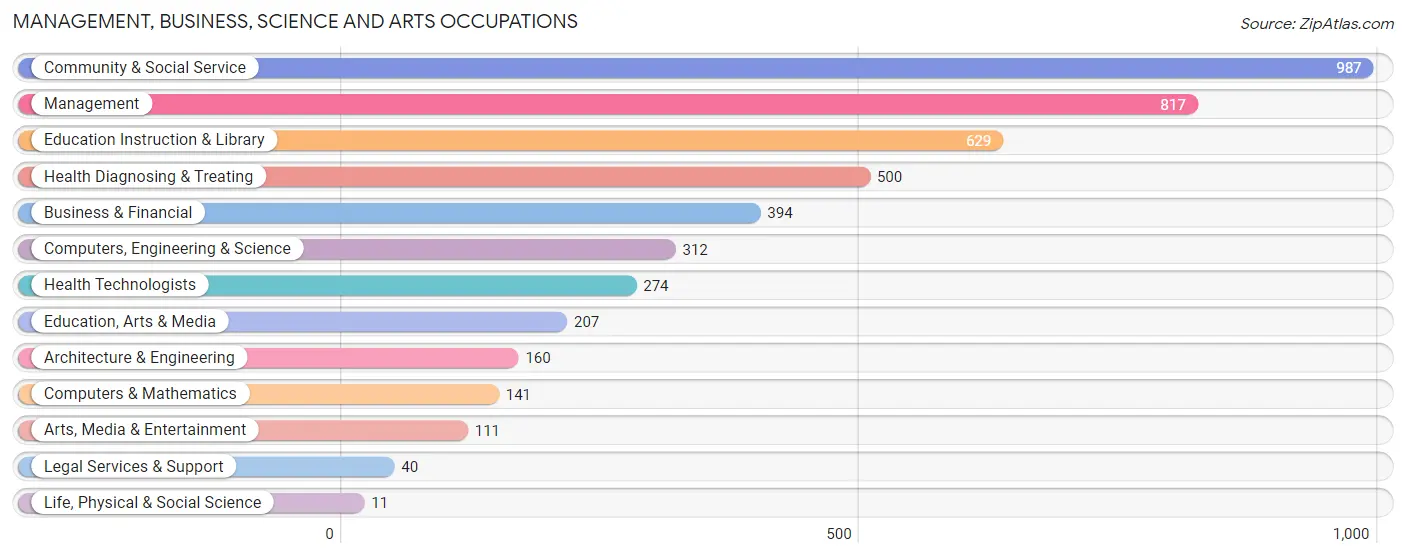
Management, Business, Science and Arts Occupations
The most common Management, Business, Science and Arts occupations in Lockport are Community & Social Service (987 | 9.8%), Management (817 | 8.1%), Education Instruction & Library (629 | 6.2%), Health Diagnosing & Treating (500 | 4.9%), and Business & Financial (394 | 3.9%).
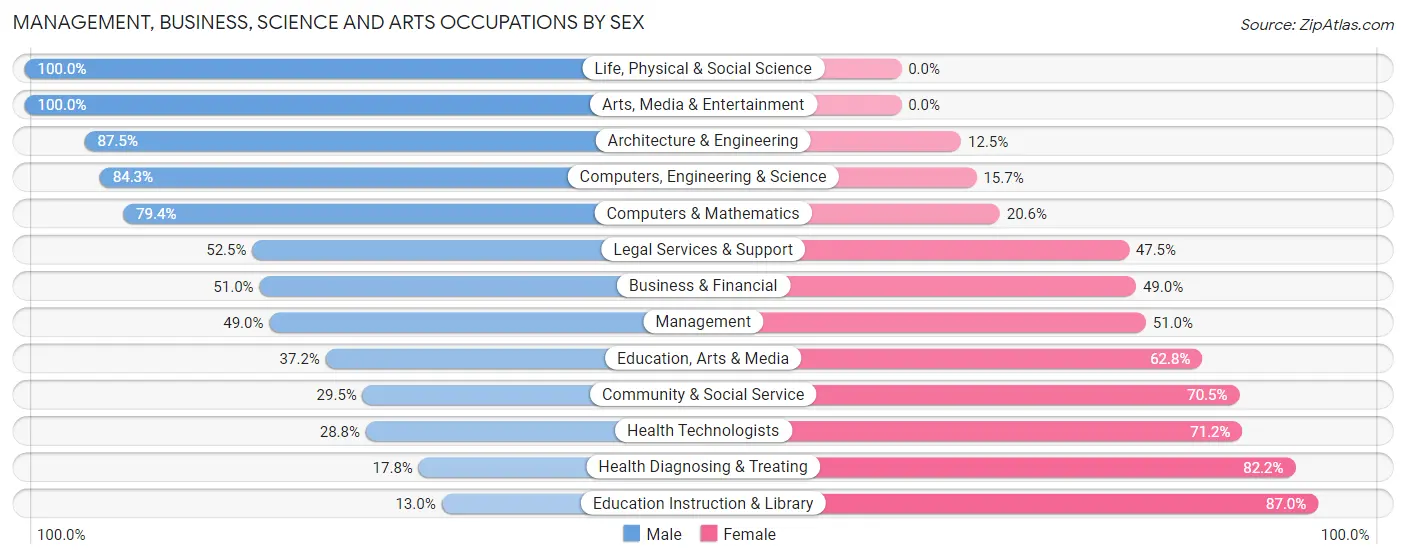
Management, Business, Science and Arts Occupations by Sex
Within the Management, Business, Science and Arts occupations in Lockport, the most male-oriented occupations are Life, Physical & Social Science (100.0%), Arts, Media & Entertainment (100.0%), and Architecture & Engineering (87.5%), while the most female-oriented occupations are Education Instruction & Library (87.0%), Health Diagnosing & Treating (82.2%), and Health Technologists (71.2%).
| Occupation | Male | Female |
| Management | 400 (49.0%) | 417 (51.0%) |
| Business & Financial | 201 (51.0%) | 193 (49.0%) |
| Computers, Engineering & Science | 263 (84.3%) | 49 (15.7%) |
| Computers & Mathematics | 112 (79.4%) | 29 (20.6%) |
| Architecture & Engineering | 140 (87.5%) | 20 (12.5%) |
| Life, Physical & Social Science | 11 (100.0%) | 0 (0.0%) |
| Community & Social Service | 291 (29.5%) | 696 (70.5%) |
| Education, Arts & Media | 77 (37.2%) | 130 (62.8%) |
| Legal Services & Support | 21 (52.5%) | 19 (47.5%) |
| Education Instruction & Library | 82 (13.0%) | 547 (87.0%) |
| Arts, Media & Entertainment | 111 (100.0%) | 0 (0.0%) |
| Health Diagnosing & Treating | 89 (17.8%) | 411 (82.2%) |
| Health Technologists | 79 (28.8%) | 195 (71.2%) |
| Total (Category) | 1,244 (41.3%) | 1,766 (58.7%) |
| Total (Overall) | 5,217 (51.6%) | 4,902 (48.4%) |
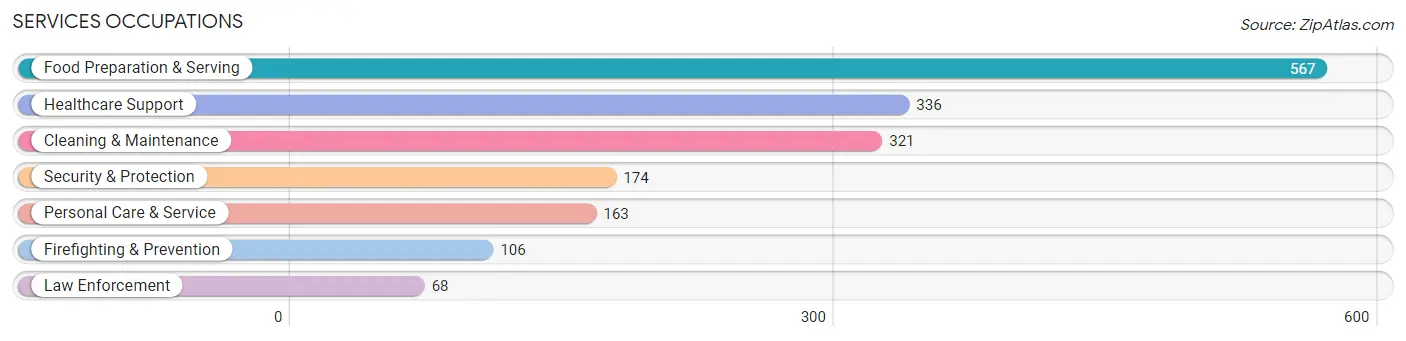
Services Occupations
The most common Services occupations in Lockport are Food Preparation & Serving (567 | 5.6%), Healthcare Support (336 | 3.3%), Cleaning & Maintenance (321 | 3.2%), Security & Protection (174 | 1.7%), and Personal Care & Service (163 | 1.6%).
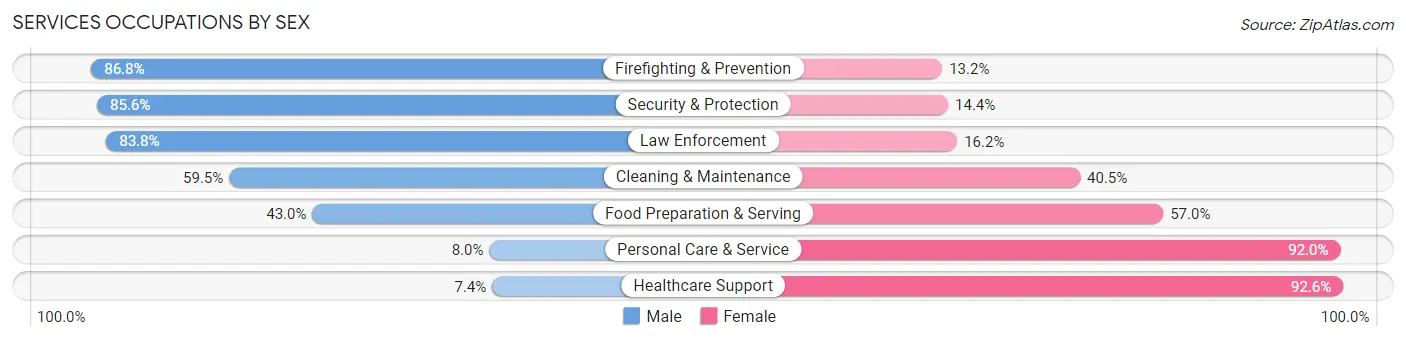
Services Occupations by Sex
Within the Services occupations in Lockport, the most male-oriented occupations are Firefighting & Prevention (86.8%), Security & Protection (85.6%), and Law Enforcement (83.8%), while the most female-oriented occupations are Healthcare Support (92.6%), Personal Care & Service (92.0%), and Food Preparation & Serving (57.0%).
| Occupation | Male | Female |
| Healthcare Support | 25 (7.4%) | 311 (92.6%) |
| Security & Protection | 149 (85.6%) | 25 (14.4%) |
| Firefighting & Prevention | 92 (86.8%) | 14 (13.2%) |
| Law Enforcement | 57 (83.8%) | 11 (16.2%) |
| Food Preparation & Serving | 244 (43.0%) | 323 (57.0%) |
| Cleaning & Maintenance | 191 (59.5%) | 130 (40.5%) |
| Personal Care & Service | 13 (8.0%) | 150 (92.0%) |
| Total (Category) | 622 (39.9%) | 939 (60.2%) |
| Total (Overall) | 5,217 (51.6%) | 4,902 (48.4%) |
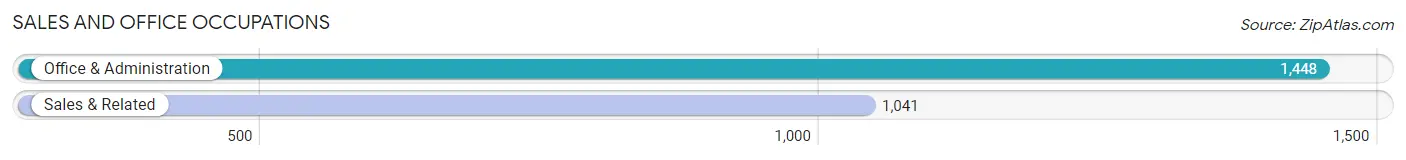
Sales and Office Occupations
The most common Sales and Office occupations in Lockport are Office & Administration (1,448 | 14.3%), and Sales & Related (1,041 | 10.3%).
Sales and Office Occupations by Sex
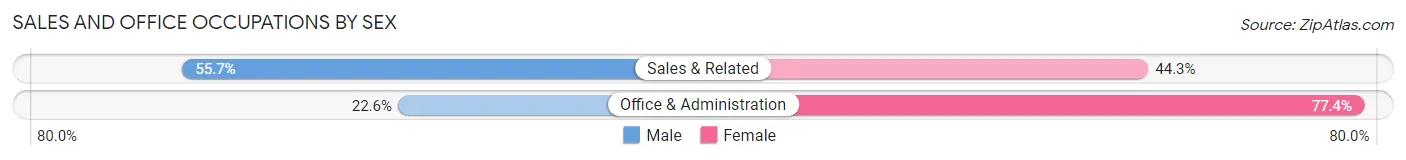
| Occupation | Male | Female |
| Sales & Related | 580 (55.7%) | 461 (44.3%) |
| Office & Administration | 327 (22.6%) | 1,121 (77.4%) |
| Total (Category) | 907 (36.4%) | 1,582 (63.6%) |
| Total (Overall) | 5,217 (51.6%) | 4,902 (48.4%) |
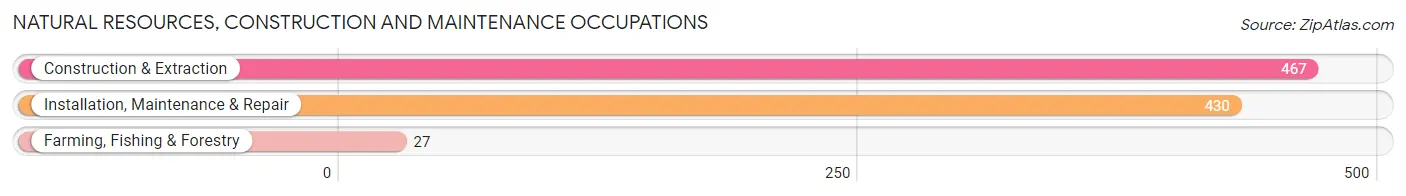
Natural Resources, Construction and Maintenance Occupations
The most common Natural Resources, Construction and Maintenance occupations in Lockport are Construction & Extraction (467 | 4.6%), Installation, Maintenance & Repair (430 | 4.3%), and Farming, Fishing & Forestry (27 | 0.3%).
Natural Resources, Construction and Maintenance Occupations by Sex
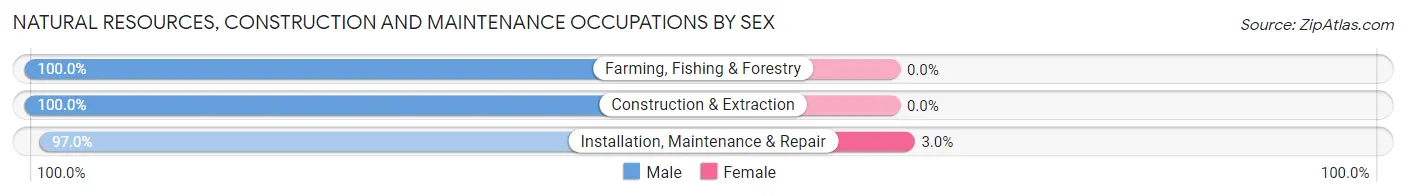
| Occupation | Male | Female |
| Farming, Fishing & Forestry | 27 (100.0%) | 0 (0.0%) |
| Construction & Extraction | 467 (100.0%) | 0 (0.0%) |
| Installation, Maintenance & Repair | 417 (97.0%) | 13 (3.0%) |
| Total (Category) | 911 (98.6%) | 13 (1.4%) |
| Total (Overall) | 5,217 (51.6%) | 4,902 (48.4%) |
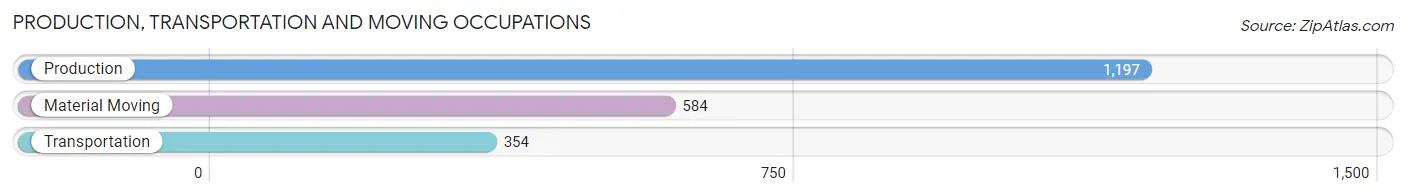
Production, Transportation and Moving Occupations
The most common Production, Transportation and Moving occupations in Lockport are Production (1,197 | 11.8%), Material Moving (584 | 5.8%), and Transportation (354 | 3.5%).
Production, Transportation and Moving Occupations by Sex
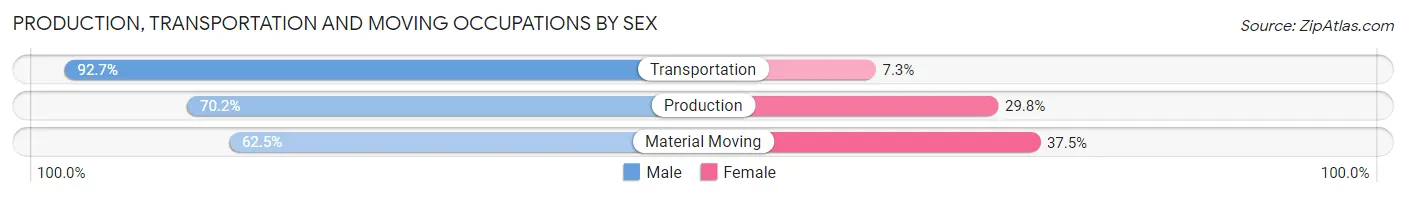
| Occupation | Male | Female |
| Production | 840 (70.2%) | 357 (29.8%) |
| Transportation | 328 (92.7%) | 26 (7.3%) |
| Material Moving | 365 (62.5%) | 219 (37.5%) |
| Total (Category) | 1,533 (71.8%) | 602 (28.2%) |
| Total (Overall) | 5,217 (51.6%) | 4,902 (48.4%) |
Employment Industries by Sex in Lockport
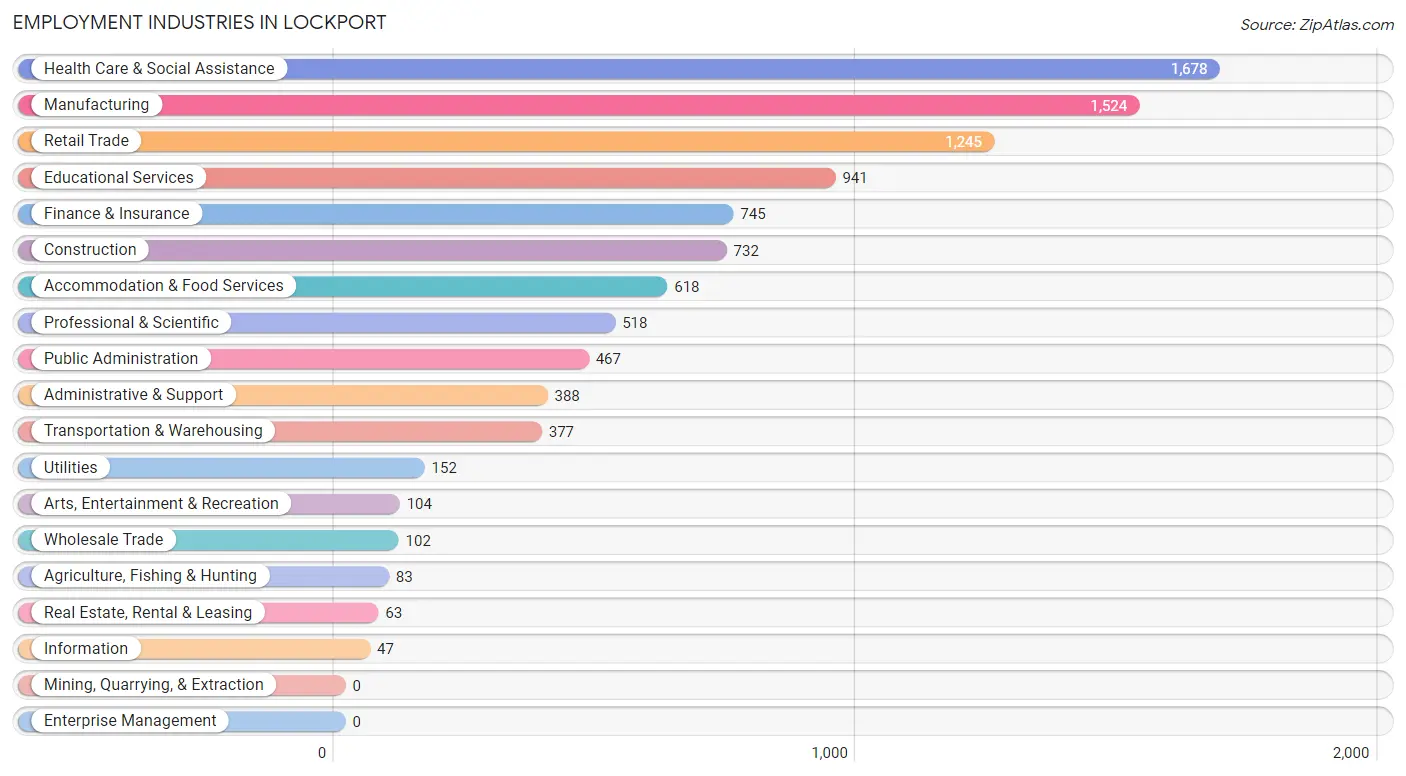
Employment Industries in Lockport
The major employment industries in Lockport include Health Care & Social Assistance (1,678 | 16.6%), Manufacturing (1,524 | 15.1%), Retail Trade (1,245 | 12.3%), Educational Services (941 | 9.3%), and Finance & Insurance (745 | 7.4%).
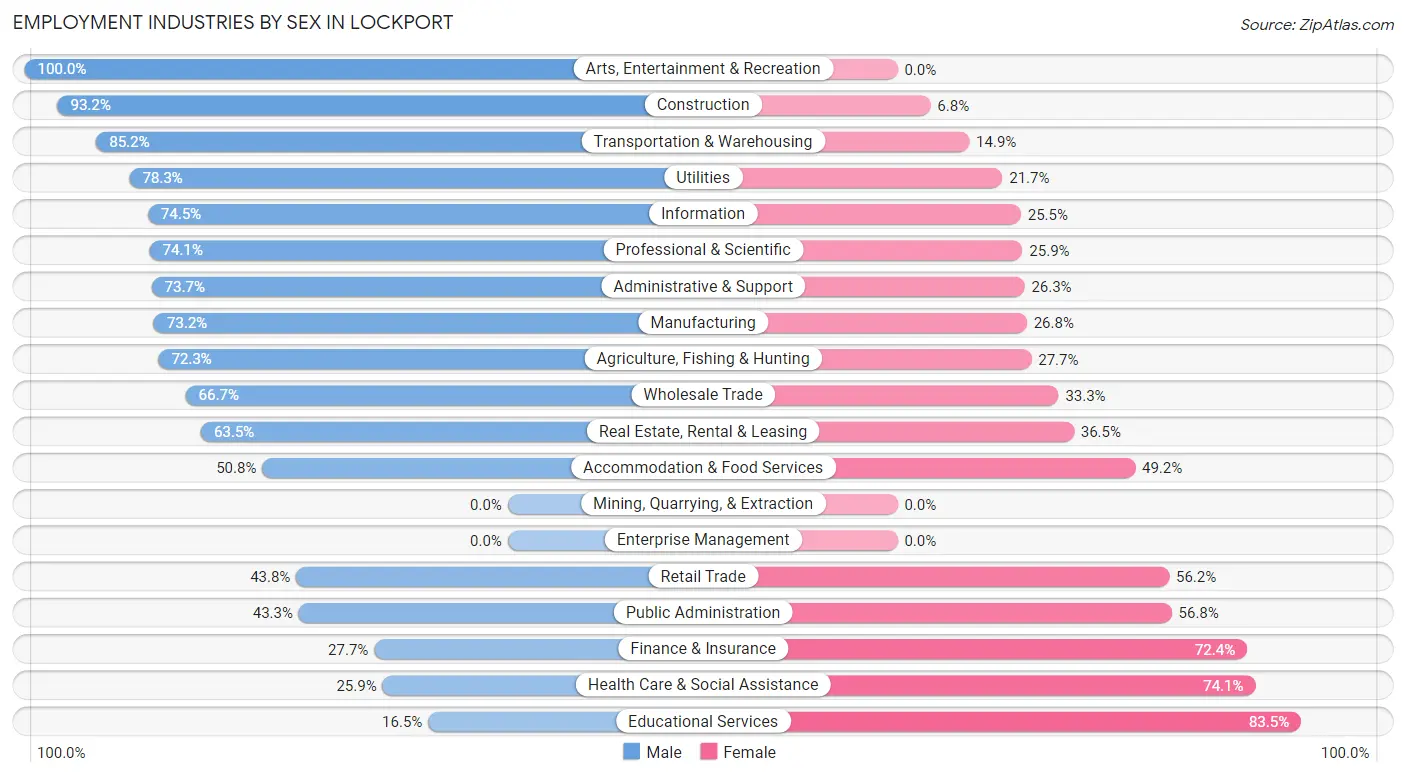
Employment Industries by Sex in Lockport
The Lockport industries that see more men than women are Arts, Entertainment & Recreation (100.0%), Construction (93.2%), and Transportation & Warehousing (85.2%), whereas the industries that tend to have a higher number of women are Educational Services (83.5%), Health Care & Social Assistance (74.1%), and Finance & Insurance (72.4%).
| Industry | Male | Female |
| Agriculture, Fishing & Hunting | 60 (72.3%) | 23 (27.7%) |
| Mining, Quarrying, & Extraction | 0 (0.0%) | 0 (0.0%) |
| Construction | 682 (93.2%) | 50 (6.8%) |
| Manufacturing | 1,116 (73.2%) | 408 (26.8%) |
| Wholesale Trade | 68 (66.7%) | 34 (33.3%) |
| Retail Trade | 545 (43.8%) | 700 (56.2%) |
| Transportation & Warehousing | 321 (85.2%) | 56 (14.8%) |
| Utilities | 119 (78.3%) | 33 (21.7%) |
| Information | 35 (74.5%) | 12 (25.5%) |
| Finance & Insurance | 206 (27.7%) | 539 (72.4%) |
| Real Estate, Rental & Leasing | 40 (63.5%) | 23 (36.5%) |
| Professional & Scientific | 384 (74.1%) | 134 (25.9%) |
| Enterprise Management | 0 (0.0%) | 0 (0.0%) |
| Administrative & Support | 286 (73.7%) | 102 (26.3%) |
| Educational Services | 155 (16.5%) | 786 (83.5%) |
| Health Care & Social Assistance | 435 (25.9%) | 1,243 (74.1%) |
| Arts, Entertainment & Recreation | 104 (100.0%) | 0 (0.0%) |
| Accommodation & Food Services | 314 (50.8%) | 304 (49.2%) |
| Public Administration | 202 (43.2%) | 265 (56.8%) |
| Total | 5,217 (51.6%) | 4,902 (48.4%) |
Education in Lockport
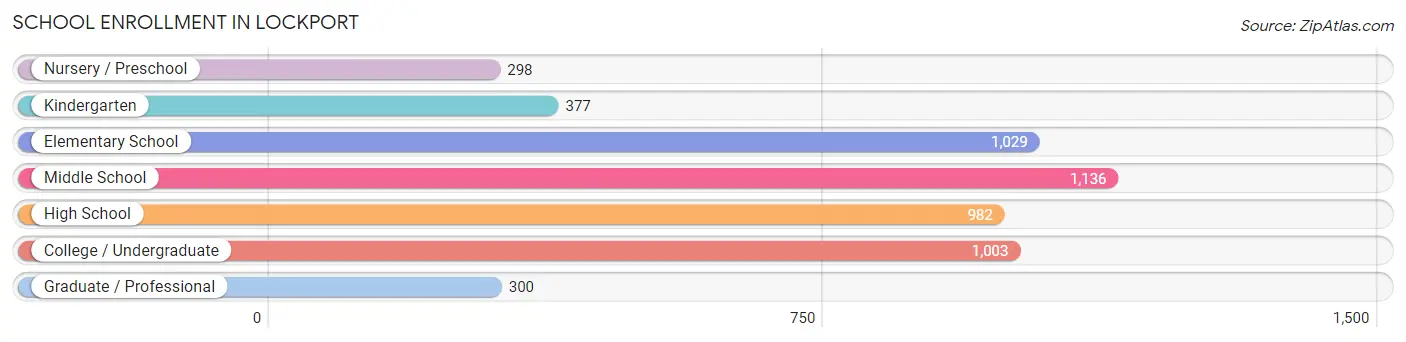
School Enrollment in Lockport
The most common levels of schooling among the 5,125 students in Lockport are middle school (1,136 | 22.2%), elementary school (1,029 | 20.1%), and college / undergraduate (1,003 | 19.6%).
| School Level | # Students | % Students |
| Nursery / Preschool | 298 | 5.8% |
| Kindergarten | 377 | 7.4% |
| Elementary School | 1,029 | 20.1% |
| Middle School | 1,136 | 22.2% |
| High School | 982 | 19.2% |
| College / Undergraduate | 1,003 | 19.6% |
| Graduate / Professional | 300 | 5.9% |
| Total | 5,125 | 100.0% |
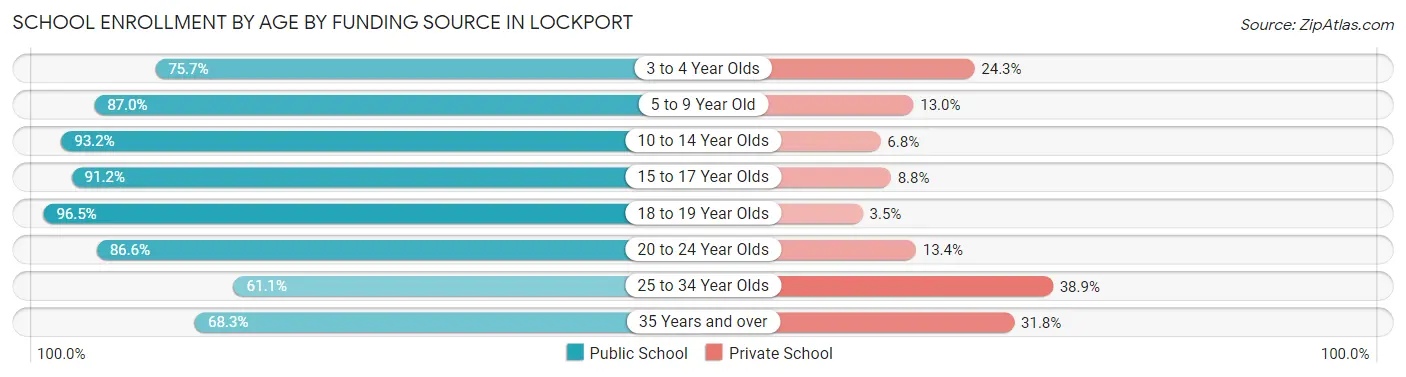
School Enrollment by Age by Funding Source in Lockport
Out of a total of 5,125 students who are enrolled in schools in Lockport, 712 (13.9%) attend a private institution, while the remaining 4,413 (86.1%) are enrolled in public schools. The age group of 25 to 34 year olds has the highest likelihood of being enrolled in private schools, with 176 (38.9% in the age bracket) enrolled. Conversely, the age group of 18 to 19 year olds has the lowest likelihood of being enrolled in a private school, with 274 (96.5% in the age bracket) attending a public institution.
| Age Bracket | Public School | Private School |
| 3 to 4 Year Olds | 115 (75.7%) | 37 (24.3%) |
| 5 to 9 Year Old | 1,262 (87.0%) | 188 (13.0%) |
| 10 to 14 Year Olds | 1,294 (93.2%) | 95 (6.8%) |
| 15 to 17 Year Olds | 625 (91.2%) | 60 (8.8%) |
| 18 to 19 Year Olds | 274 (96.5%) | 10 (3.5%) |
| 20 to 24 Year Olds | 380 (86.6%) | 59 (13.4%) |
| 25 to 34 Year Olds | 276 (61.1%) | 176 (38.9%) |
| 35 Years and over | 187 (68.2%) | 87 (31.8%) |
| Total | 4,413 (86.1%) | 712 (13.9%) |
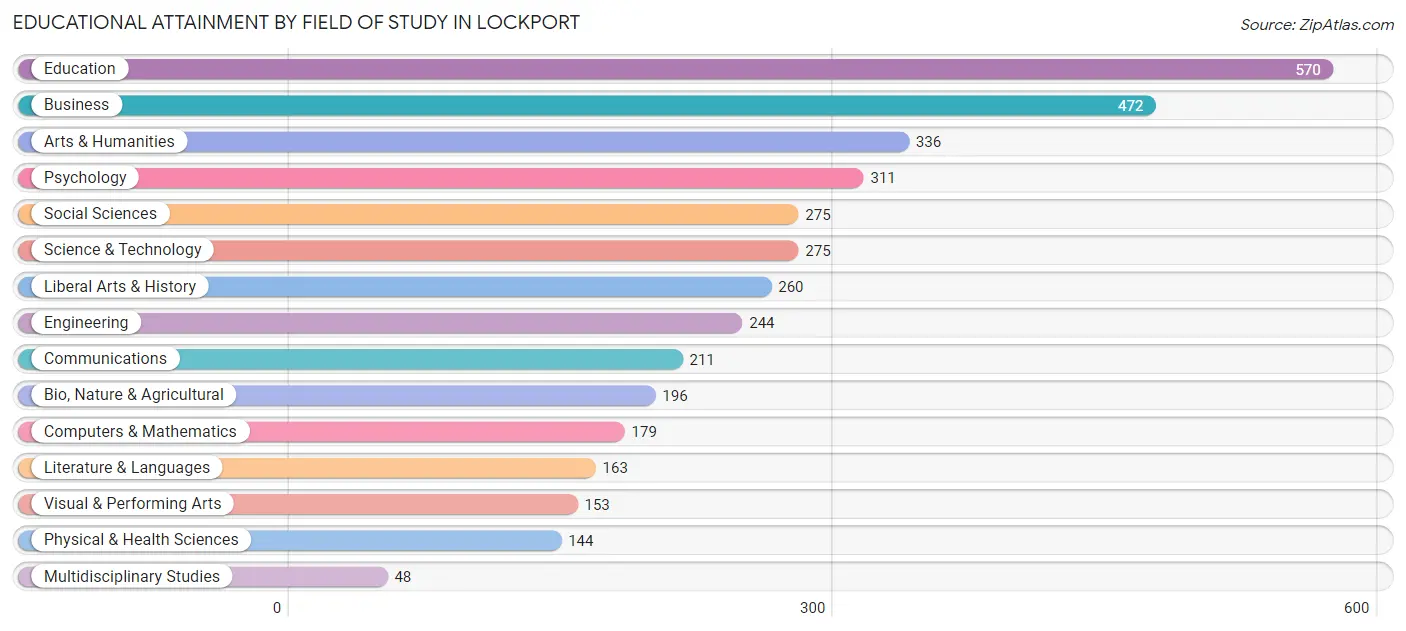
Educational Attainment by Field of Study in Lockport
Education (570 | 14.9%), business (472 | 12.3%), arts & humanities (336 | 8.8%), psychology (311 | 8.1%), and social sciences (275 | 7.2%) are the most common fields of study among 3,837 individuals in Lockport who have obtained a bachelor's degree or higher.
| Field of Study | # Graduates | % Graduates |
| Computers & Mathematics | 179 | 4.7% |
| Bio, Nature & Agricultural | 196 | 5.1% |
| Physical & Health Sciences | 144 | 3.7% |
| Psychology | 311 | 8.1% |
| Social Sciences | 275 | 7.2% |
| Engineering | 244 | 6.4% |
| Multidisciplinary Studies | 48 | 1.3% |
| Science & Technology | 275 | 7.2% |
| Business | 472 | 12.3% |
| Education | 570 | 14.9% |
| Literature & Languages | 163 | 4.3% |
| Liberal Arts & History | 260 | 6.8% |
| Visual & Performing Arts | 153 | 4.0% |
| Communications | 211 | 5.5% |
| Arts & Humanities | 336 | 8.8% |
| Total | 3,837 | 100.0% |
Transportation & Commute in Lockport
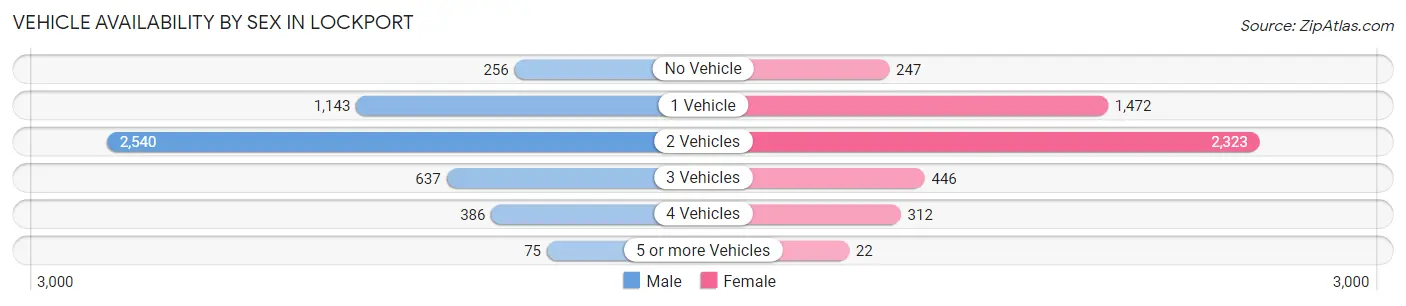
Vehicle Availability by Sex in Lockport
The most prevalent vehicle ownership categories in Lockport are males with 2 vehicles (2,540, accounting for 50.4%) and females with 2 vehicles (2,323, making up 52.7%).
| Vehicles Available | Male | Female |
| No Vehicle | 256 (5.1%) | 247 (5.1%) |
| 1 Vehicle | 1,143 (22.7%) | 1,472 (30.5%) |
| 2 Vehicles | 2,540 (50.4%) | 2,323 (48.2%) |
| 3 Vehicles | 637 (12.7%) | 446 (9.2%) |
| 4 Vehicles | 386 (7.7%) | 312 (6.5%) |
| 5 or more Vehicles | 75 (1.5%) | 22 (0.5%) |
| Total | 5,037 (100.0%) | 4,822 (100.0%) |
Commute Time in Lockport
The most frequently occuring commute durations in Lockport are 5 to 9 minutes (1,421 commuters, 15.5%), 10 to 14 minutes (1,305 commuters, 14.3%), and 30 to 34 minutes (1,289 commuters, 14.1%).
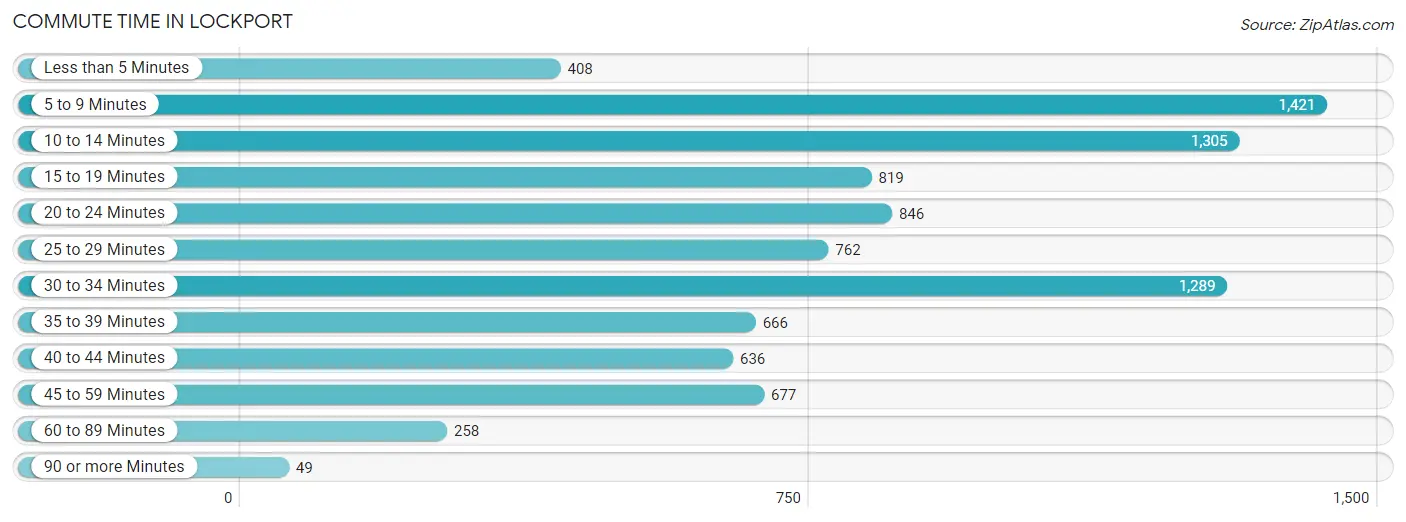
| Commute Time | # Commuters | % Commuters |
| Less than 5 Minutes | 408 | 4.5% |
| 5 to 9 Minutes | 1,421 | 15.5% |
| 10 to 14 Minutes | 1,305 | 14.3% |
| 15 to 19 Minutes | 819 | 9.0% |
| 20 to 24 Minutes | 846 | 9.3% |
| 25 to 29 Minutes | 762 | 8.3% |
| 30 to 34 Minutes | 1,289 | 14.1% |
| 35 to 39 Minutes | 666 | 7.3% |
| 40 to 44 Minutes | 636 | 7.0% |
| 45 to 59 Minutes | 677 | 7.4% |
| 60 to 89 Minutes | 258 | 2.8% |
| 90 or more Minutes | 49 | 0.5% |
Commute Time by Sex in Lockport
The most common commute times in Lockport are 10 to 14 minutes (861 commuters, 18.1%) for males and 5 to 9 minutes (825 commuters, 18.9%) for females.
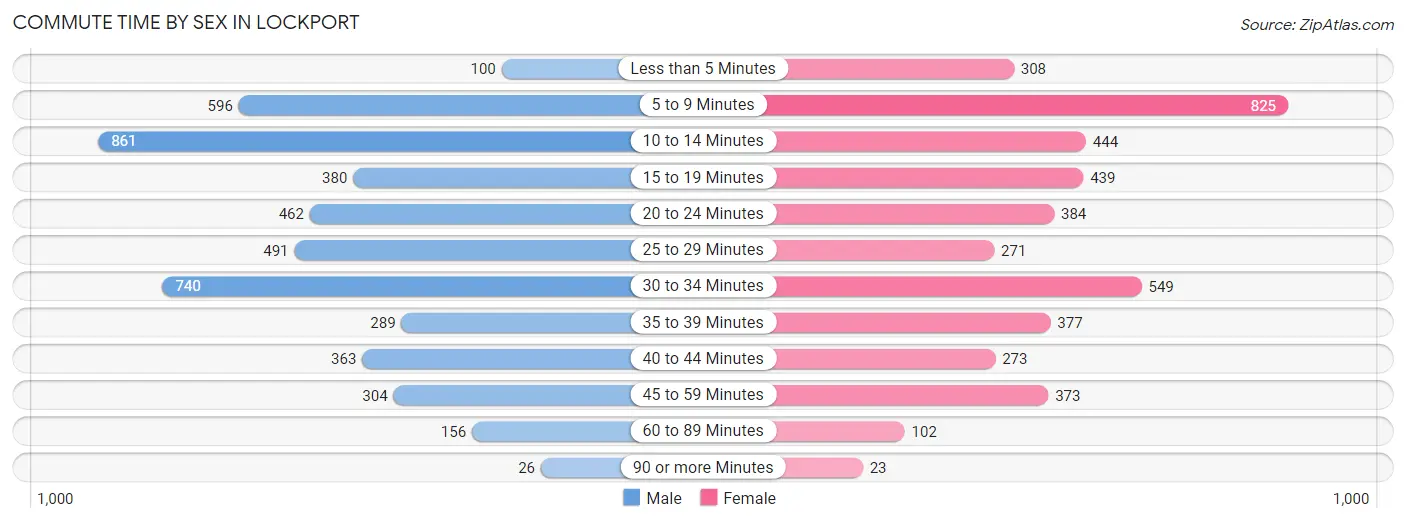
| Commute Time | Male | Female |
| Less than 5 Minutes | 100 (2.1%) | 308 (7.0%) |
| 5 to 9 Minutes | 596 (12.5%) | 825 (18.9%) |
| 10 to 14 Minutes | 861 (18.1%) | 444 (10.2%) |
| 15 to 19 Minutes | 380 (8.0%) | 439 (10.1%) |
| 20 to 24 Minutes | 462 (9.7%) | 384 (8.8%) |
| 25 to 29 Minutes | 491 (10.3%) | 271 (6.2%) |
| 30 to 34 Minutes | 740 (15.5%) | 549 (12.6%) |
| 35 to 39 Minutes | 289 (6.1%) | 377 (8.6%) |
| 40 to 44 Minutes | 363 (7.6%) | 273 (6.2%) |
| 45 to 59 Minutes | 304 (6.4%) | 373 (8.5%) |
| 60 to 89 Minutes | 156 (3.3%) | 102 (2.3%) |
| 90 or more Minutes | 26 (0.5%) | 23 (0.5%) |
Time of Departure to Work by Sex in Lockport
The most frequent times of departure to work in Lockport are 6:30 AM to 6:59 AM (739, 15.5%) for males and 7:00 AM to 7:29 AM (652, 14.9%) for females.
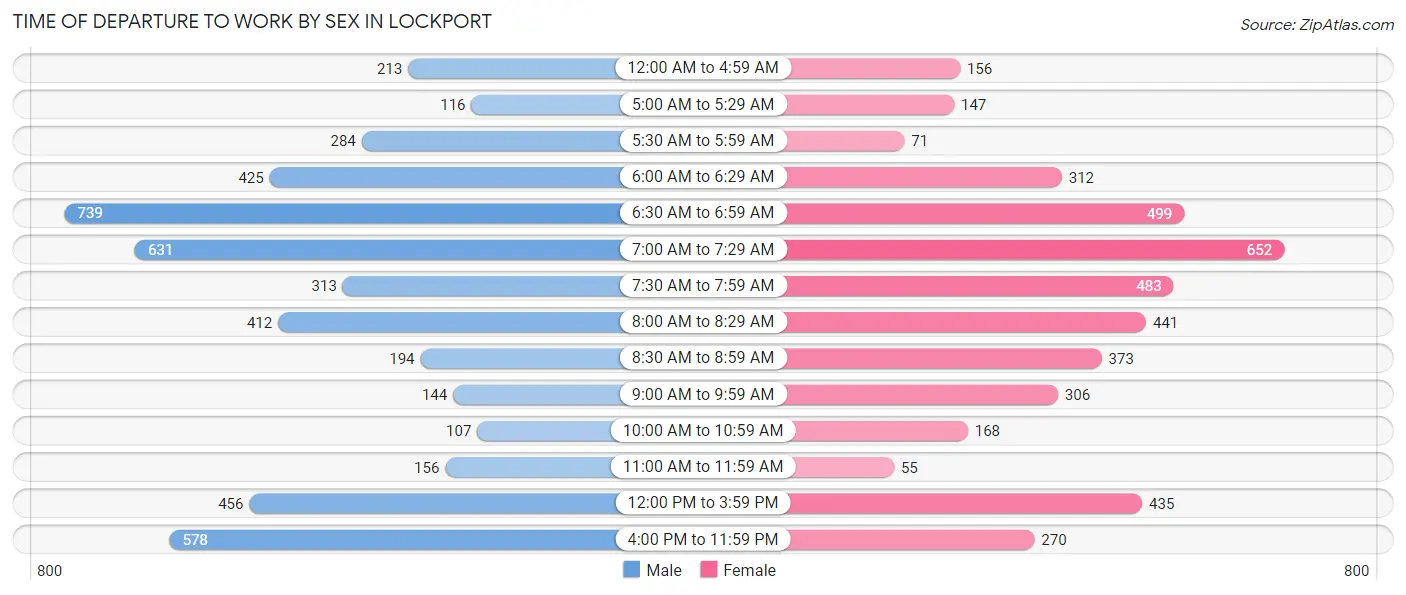
| Time of Departure | Male | Female |
| 12:00 AM to 4:59 AM | 213 (4.5%) | 156 (3.6%) |
| 5:00 AM to 5:29 AM | 116 (2.4%) | 147 (3.4%) |
| 5:30 AM to 5:59 AM | 284 (6.0%) | 71 (1.6%) |
| 6:00 AM to 6:29 AM | 425 (8.9%) | 312 (7.1%) |
| 6:30 AM to 6:59 AM | 739 (15.5%) | 499 (11.4%) |
| 7:00 AM to 7:29 AM | 631 (13.2%) | 652 (14.9%) |
| 7:30 AM to 7:59 AM | 313 (6.6%) | 483 (11.1%) |
| 8:00 AM to 8:29 AM | 412 (8.6%) | 441 (10.1%) |
| 8:30 AM to 8:59 AM | 194 (4.1%) | 373 (8.5%) |
| 9:00 AM to 9:59 AM | 144 (3.0%) | 306 (7.0%) |
| 10:00 AM to 10:59 AM | 107 (2.2%) | 168 (3.8%) |
| 11:00 AM to 11:59 AM | 156 (3.3%) | 55 (1.3%) |
| 12:00 PM to 3:59 PM | 456 (9.6%) | 435 (10.0%) |
| 4:00 PM to 11:59 PM | 578 (12.1%) | 270 (6.2%) |
| Total | 4,768 (100.0%) | 4,368 (100.0%) |
Housing Occupancy in Lockport
Occupancy by Ownership in Lockport
Of the total 9,220 dwellings in Lockport, owner-occupied units account for 5,177 (56.1%), while renter-occupied units make up 4,043 (43.9%).
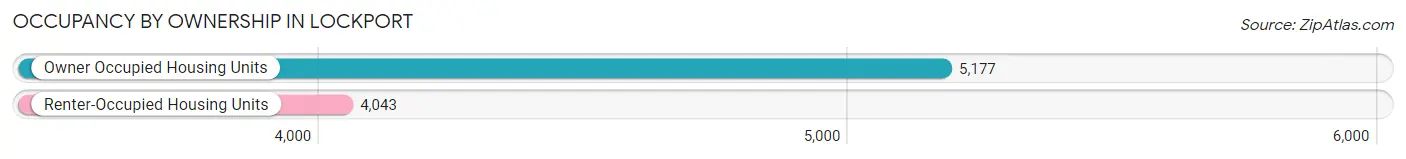
| Occupancy | # Housing Units | % Housing Units |
| Owner Occupied Housing Units | 5,177 | 56.1% |
| Renter-Occupied Housing Units | 4,043 | 43.9% |
| Total Occupied Housing Units | 9,220 | 100.0% |
Occupancy by Household Size in Lockport
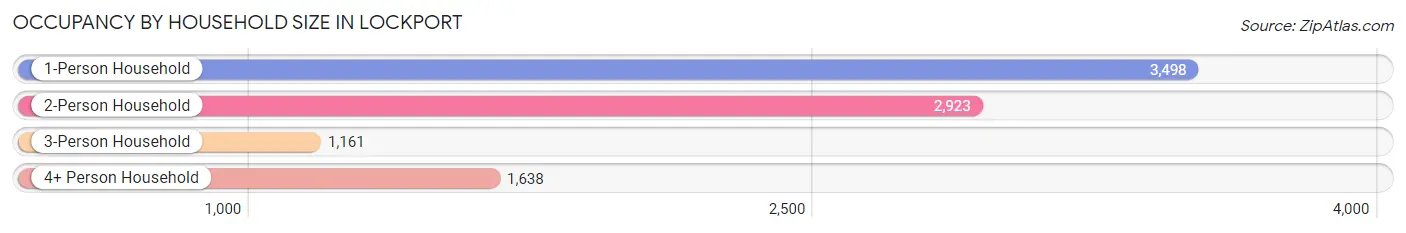
| Household Size | # Housing Units | % Housing Units |
| 1-Person Household | 3,498 | 37.9% |
| 2-Person Household | 2,923 | 31.7% |
| 3-Person Household | 1,161 | 12.6% |
| 4+ Person Household | 1,638 | 17.8% |
| Total Housing Units | 9,220 | 100.0% |
Occupancy by Ownership by Household Size in Lockport
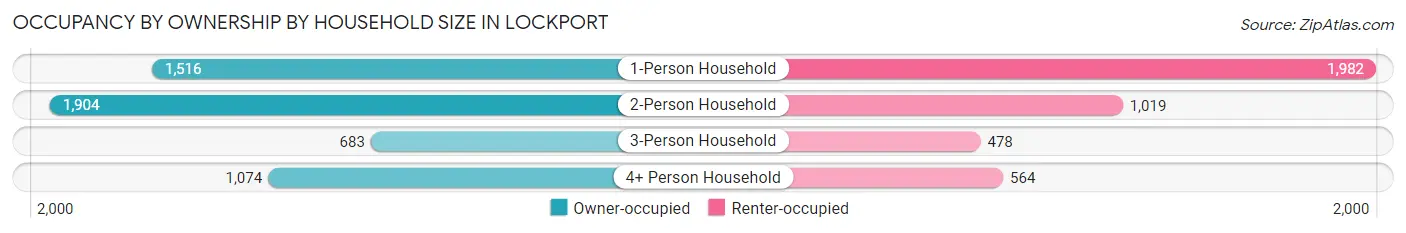
| Household Size | Owner-occupied | Renter-occupied |
| 1-Person Household | 1,516 (43.3%) | 1,982 (56.7%) |
| 2-Person Household | 1,904 (65.1%) | 1,019 (34.9%) |
| 3-Person Household | 683 (58.8%) | 478 (41.2%) |
| 4+ Person Household | 1,074 (65.6%) | 564 (34.4%) |
| Total Housing Units | 5,177 (56.1%) | 4,043 (43.9%) |
Occupancy by Educational Attainment in Lockport
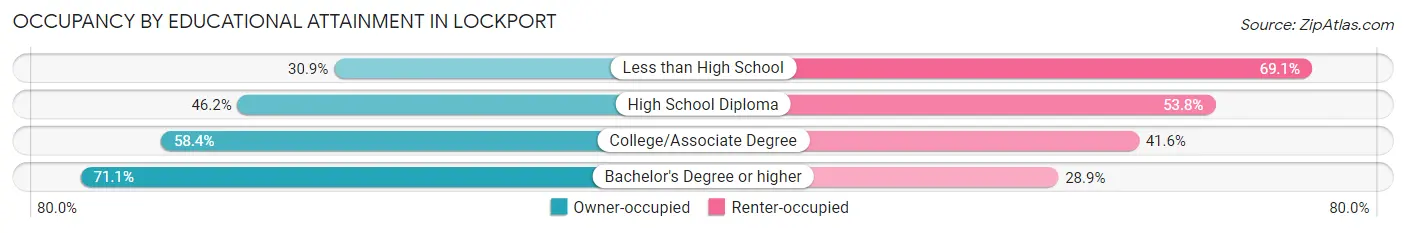
| Household Size | Owner-occupied | Renter-occupied |
| Less than High School | 247 (30.9%) | 552 (69.1%) |
| High School Diploma | 1,182 (46.2%) | 1,375 (53.8%) |
| College/Associate Degree | 1,933 (58.4%) | 1,379 (41.6%) |
| Bachelor's Degree or higher | 1,815 (71.1%) | 737 (28.9%) |
Occupancy by Age of Householder in Lockport
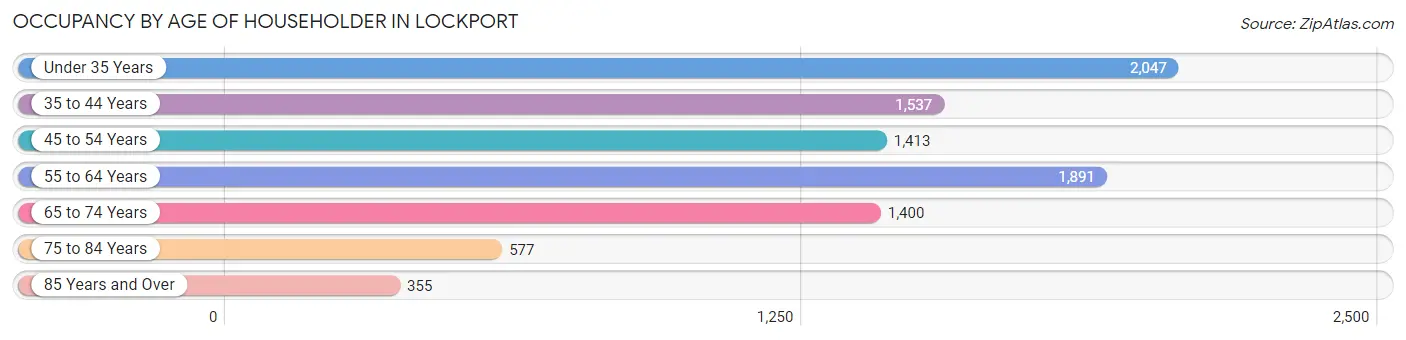
| Age Bracket | # Households | % Households |
| Under 35 Years | 2,047 | 22.2% |
| 35 to 44 Years | 1,537 | 16.7% |
| 45 to 54 Years | 1,413 | 15.3% |
| 55 to 64 Years | 1,891 | 20.5% |
| 65 to 74 Years | 1,400 | 15.2% |
| 75 to 84 Years | 577 | 6.3% |
| 85 Years and Over | 355 | 3.8% |
| Total | 9,220 | 100.0% |
Housing Finances in Lockport
Median Income by Occupancy in Lockport
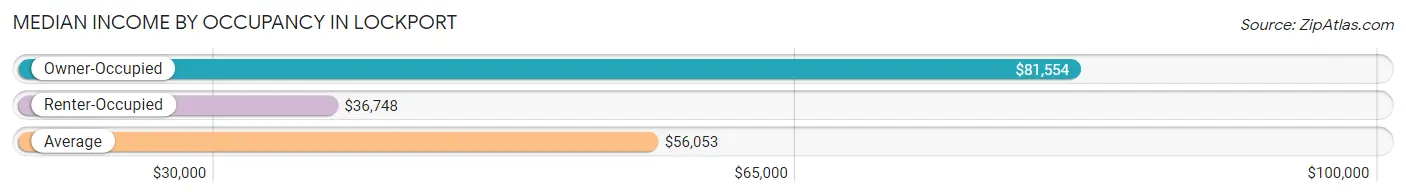
| Occupancy Type | # Households | Median Income |
| Owner-Occupied | 5,177 (56.1%) | $81,554 |
| Renter-Occupied | 4,043 (43.9%) | $36,748 |
| Average | 9,220 (100.0%) | $56,053 |
Occupancy by Householder Income Bracket in Lockport
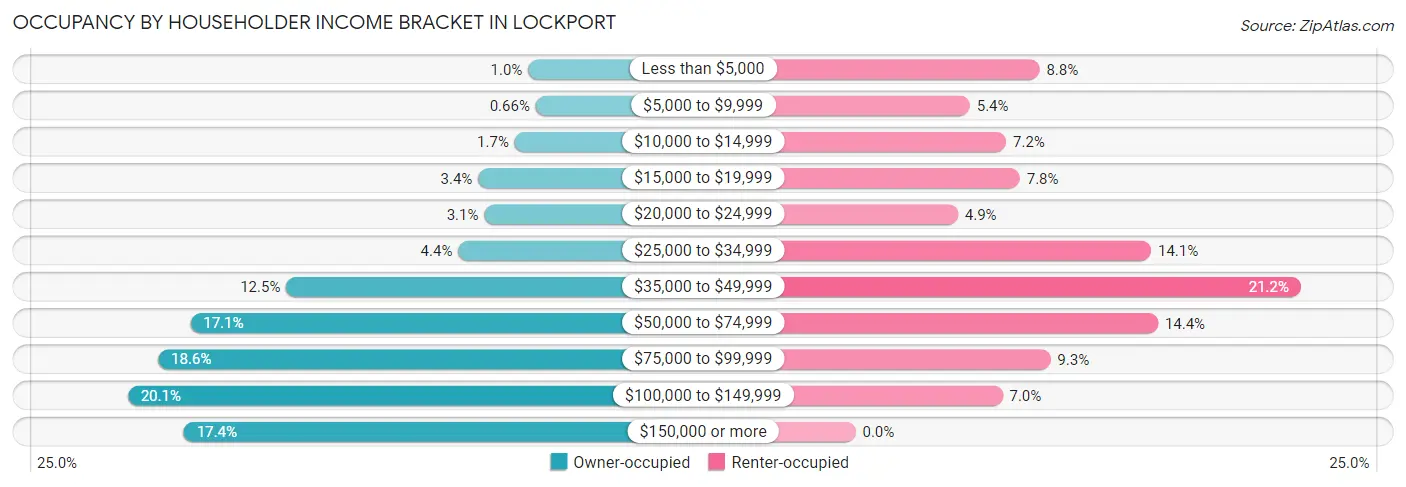
| Income Bracket | Owner-occupied | Renter-occupied |
| Less than $5,000 | 53 (1.0%) | 354 (8.8%) |
| $5,000 to $9,999 | 34 (0.7%) | 220 (5.4%) |
| $10,000 to $14,999 | 86 (1.7%) | 290 (7.2%) |
| $15,000 to $19,999 | 176 (3.4%) | 316 (7.8%) |
| $20,000 to $24,999 | 161 (3.1%) | 197 (4.9%) |
| $25,000 to $34,999 | 225 (4.3%) | 569 (14.1%) |
| $35,000 to $49,999 | 649 (12.5%) | 857 (21.2%) |
| $50,000 to $74,999 | 886 (17.1%) | 582 (14.4%) |
| $75,000 to $99,999 | 965 (18.6%) | 375 (9.3%) |
| $100,000 to $149,999 | 1,040 (20.1%) | 283 (7.0%) |
| $150,000 or more | 902 (17.4%) | 0 (0.0%) |
| Total | 5,177 (100.0%) | 4,043 (100.0%) |
Monthly Housing Cost Tiers in Lockport
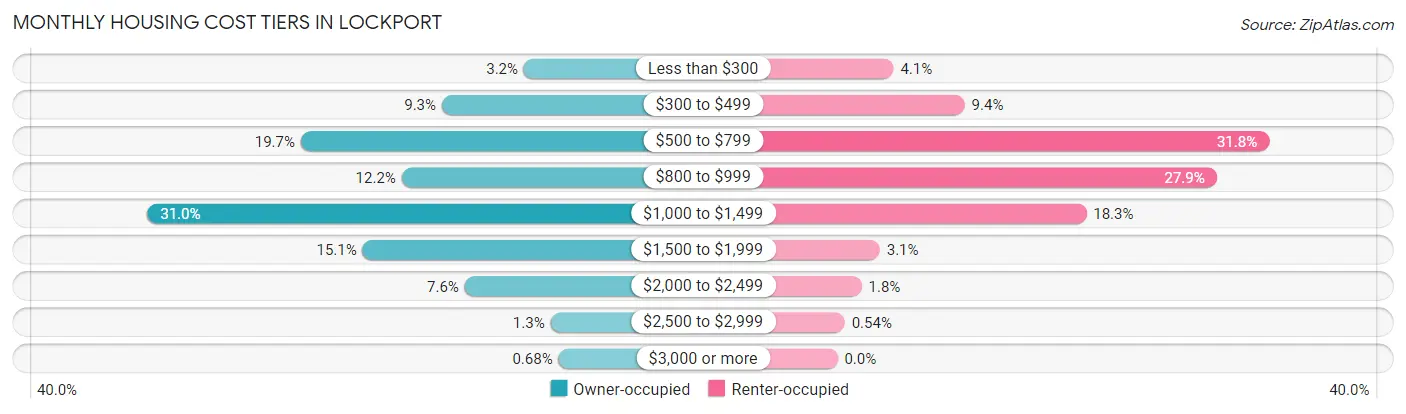
| Monthly Cost | Owner-occupied | Renter-occupied |
| Less than $300 | 167 (3.2%) | 167 (4.1%) |
| $300 to $499 | 480 (9.3%) | 379 (9.4%) |
| $500 to $799 | 1,018 (19.7%) | 1,285 (31.8%) |
| $800 to $999 | 633 (12.2%) | 1,129 (27.9%) |
| $1,000 to $1,499 | 1,603 (31.0%) | 741 (18.3%) |
| $1,500 to $1,999 | 782 (15.1%) | 126 (3.1%) |
| $2,000 to $2,499 | 393 (7.6%) | 72 (1.8%) |
| $2,500 to $2,999 | 66 (1.3%) | 22 (0.5%) |
| $3,000 or more | 35 (0.7%) | 0 (0.0%) |
| Total | 5,177 (100.0%) | 4,043 (100.0%) |
Physical Housing Characteristics in Lockport
Housing Structures in Lockport
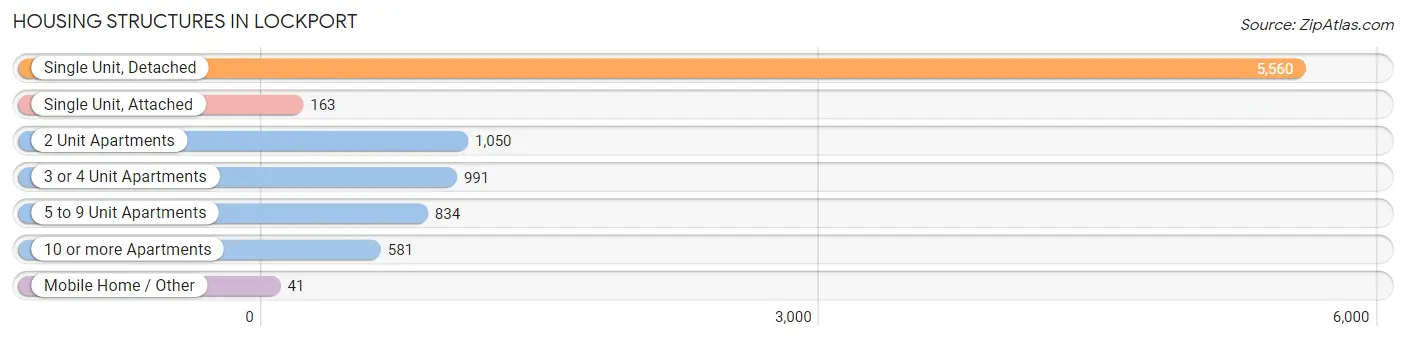
| Structure Type | # Housing Units | % Housing Units |
| Single Unit, Detached | 5,560 | 60.3% |
| Single Unit, Attached | 163 | 1.8% |
| 2 Unit Apartments | 1,050 | 11.4% |
| 3 or 4 Unit Apartments | 991 | 10.7% |
| 5 to 9 Unit Apartments | 834 | 9.0% |
| 10 or more Apartments | 581 | 6.3% |
| Mobile Home / Other | 41 | 0.4% |
| Total | 9,220 | 100.0% |
Housing Structures by Occupancy in Lockport
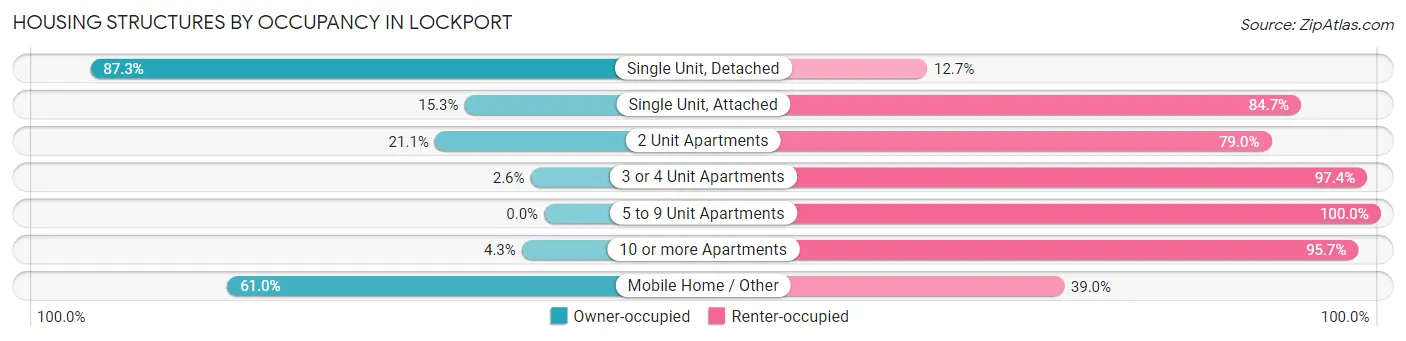
| Structure Type | Owner-occupied | Renter-occupied |
| Single Unit, Detached | 4,855 (87.3%) | 705 (12.7%) |
| Single Unit, Attached | 25 (15.3%) | 138 (84.7%) |
| 2 Unit Apartments | 221 (21.0%) | 829 (78.9%) |
| 3 or 4 Unit Apartments | 26 (2.6%) | 965 (97.4%) |
| 5 to 9 Unit Apartments | 0 (0.0%) | 834 (100.0%) |
| 10 or more Apartments | 25 (4.3%) | 556 (95.7%) |
| Mobile Home / Other | 25 (61.0%) | 16 (39.0%) |
| Total | 5,177 (56.1%) | 4,043 (43.9%) |
Housing Structures by Number of Rooms in Lockport
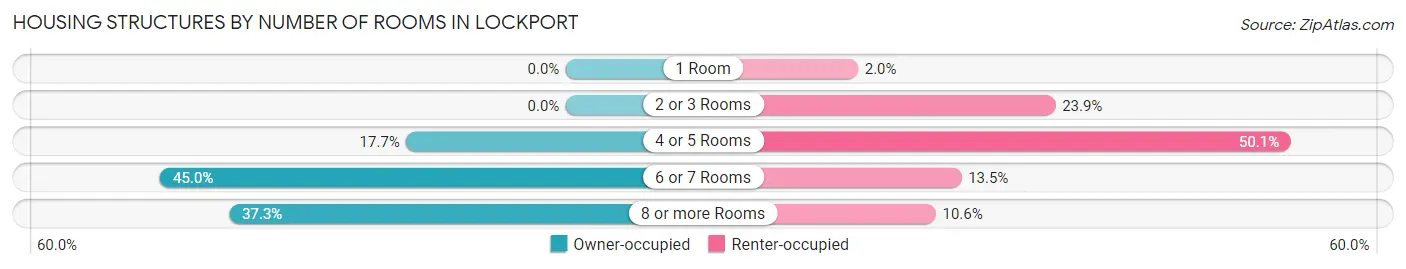
| Number of Rooms | Owner-occupied | Renter-occupied |
| 1 Room | 0 (0.0%) | 80 (2.0%) |
| 2 or 3 Rooms | 0 (0.0%) | 966 (23.9%) |
| 4 or 5 Rooms | 917 (17.7%) | 2,024 (50.1%) |
| 6 or 7 Rooms | 2,328 (45.0%) | 544 (13.5%) |
| 8 or more Rooms | 1,932 (37.3%) | 429 (10.6%) |
| Total | 5,177 (100.0%) | 4,043 (100.0%) |
Housing Structure by Heating Type in Lockport
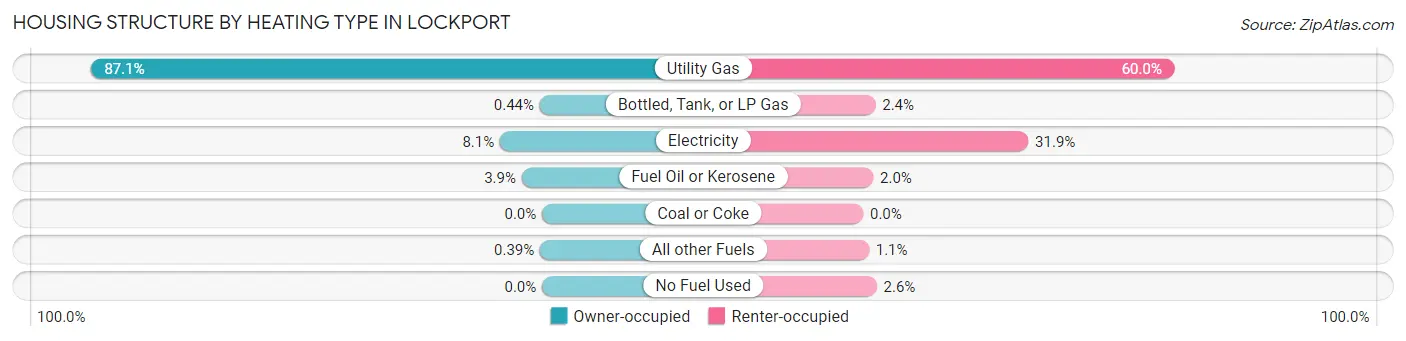
| Heating Type | Owner-occupied | Renter-occupied |
| Utility Gas | 4,510 (87.1%) | 2,427 (60.0%) |
| Bottled, Tank, or LP Gas | 23 (0.4%) | 96 (2.4%) |
| Electricity | 421 (8.1%) | 1,290 (31.9%) |
| Fuel Oil or Kerosene | 203 (3.9%) | 79 (1.9%) |
| Coal or Coke | 0 (0.0%) | 0 (0.0%) |
| All other Fuels | 20 (0.4%) | 45 (1.1%) |
| No Fuel Used | 0 (0.0%) | 106 (2.6%) |
| Total | 5,177 (100.0%) | 4,043 (100.0%) |
Household Vehicle Usage in Lockport
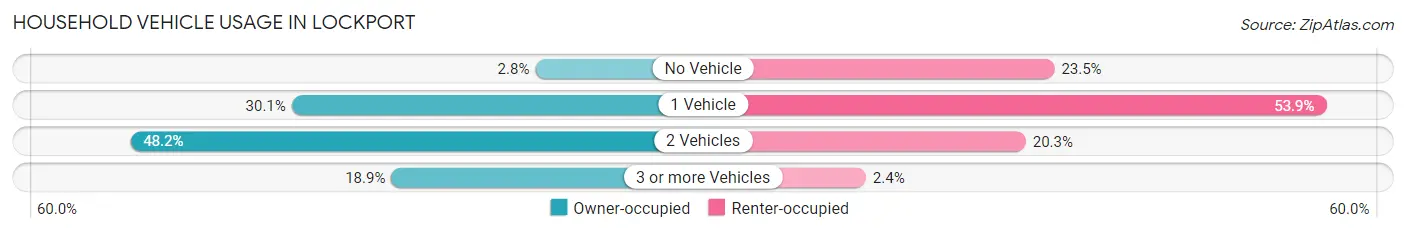
| Vehicles per Household | Owner-occupied | Renter-occupied |
| No Vehicle | 145 (2.8%) | 949 (23.5%) |
| 1 Vehicle | 1,558 (30.1%) | 2,180 (53.9%) |
| 2 Vehicles | 2,494 (48.2%) | 819 (20.3%) |
| 3 or more Vehicles | 980 (18.9%) | 95 (2.4%) |
| Total | 5,177 (100.0%) | 4,043 (100.0%) |
Real Estate & Mortgages in Lockport
Real Estate and Mortgage Overview in Lockport
| Characteristic | Without Mortgage | With Mortgage |
| Housing Units | 1,990 | 3,187 |
| Median Property Value | $116,800 | $122,500 |
| Median Household Income | $65,833 | $584 |
| Monthly Housing Costs | $605 | $35 |
| Real Estate Taxes | $3,429 | $45 |
Property Value by Mortgage Status in Lockport
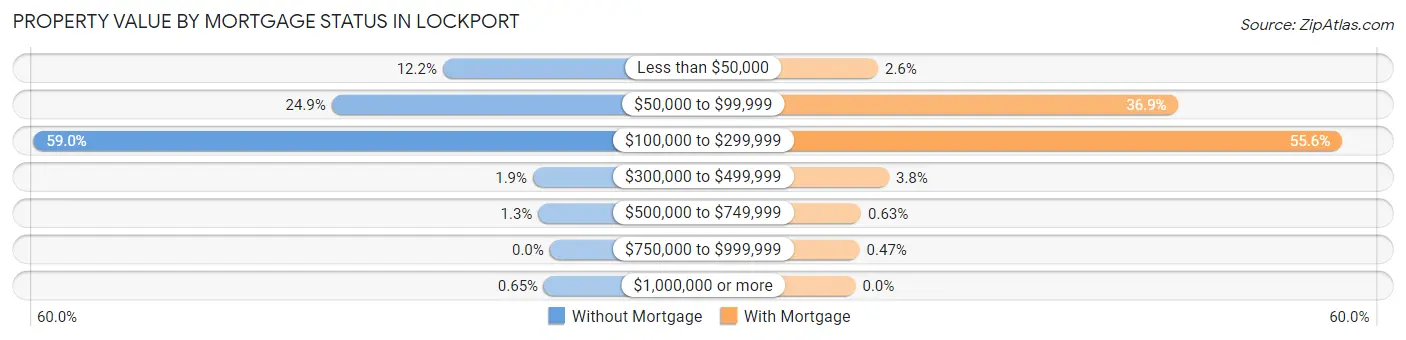
| Property Value | Without Mortgage | With Mortgage |
| Less than $50,000 | 243 (12.2%) | 82 (2.6%) |
| $50,000 to $99,999 | 496 (24.9%) | 1,176 (36.9%) |
| $100,000 to $299,999 | 1,174 (59.0%) | 1,772 (55.6%) |
| $300,000 to $499,999 | 38 (1.9%) | 122 (3.8%) |
| $500,000 to $749,999 | 26 (1.3%) | 20 (0.6%) |
| $750,000 to $999,999 | 0 (0.0%) | 15 (0.5%) |
| $1,000,000 or more | 13 (0.6%) | 0 (0.0%) |
| Total | 1,990 (100.0%) | 3,187 (100.0%) |
Household Income by Mortgage Status in Lockport
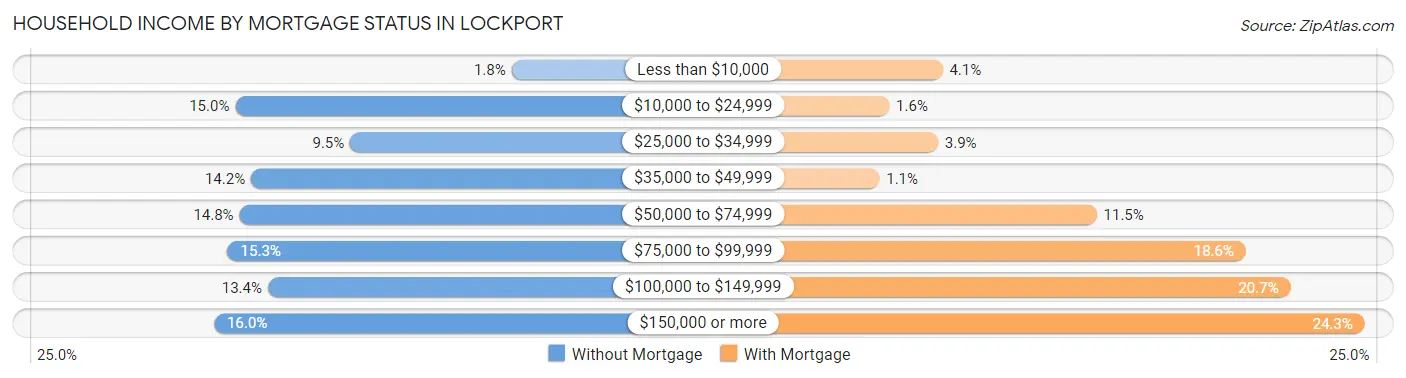
| Household Income | Without Mortgage | With Mortgage |
| Less than $10,000 | 36 (1.8%) | 132 (4.1%) |
| $10,000 to $24,999 | 298 (15.0%) | 51 (1.6%) |
| $25,000 to $34,999 | 189 (9.5%) | 125 (3.9%) |
| $35,000 to $49,999 | 283 (14.2%) | 36 (1.1%) |
| $50,000 to $74,999 | 294 (14.8%) | 366 (11.5%) |
| $75,000 to $99,999 | 305 (15.3%) | 592 (18.6%) |
| $100,000 to $149,999 | 267 (13.4%) | 660 (20.7%) |
| $150,000 or more | 318 (16.0%) | 773 (24.2%) |
| Total | 1,990 (100.0%) | 3,187 (100.0%) |
Property Value to Household Income Ratio in Lockport
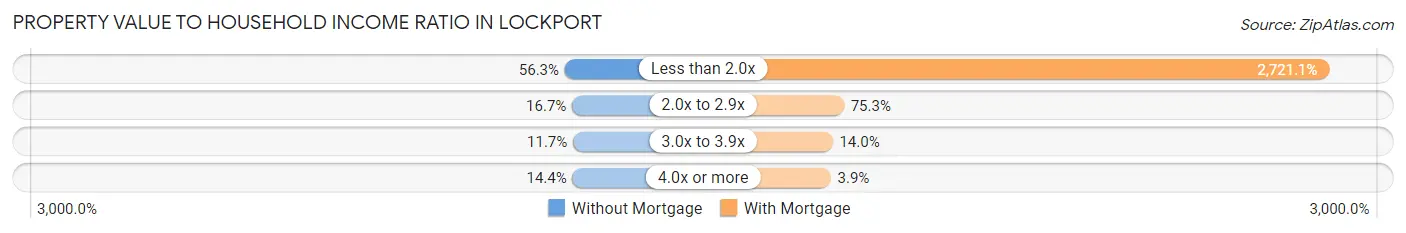
| Value-to-Income Ratio | Without Mortgage | With Mortgage |
| Less than 2.0x | 1,121 (56.3%) | 86,721 (2,721.1%) |
| 2.0x to 2.9x | 332 (16.7%) | 2,399 (75.3%) |
| 3.0x to 3.9x | 232 (11.7%) | 445 (14.0%) |
| 4.0x or more | 286 (14.4%) | 123 (3.9%) |
| Total | 1,990 (100.0%) | 3,187 (100.0%) |
Real Estate Taxes by Mortgage Status in Lockport
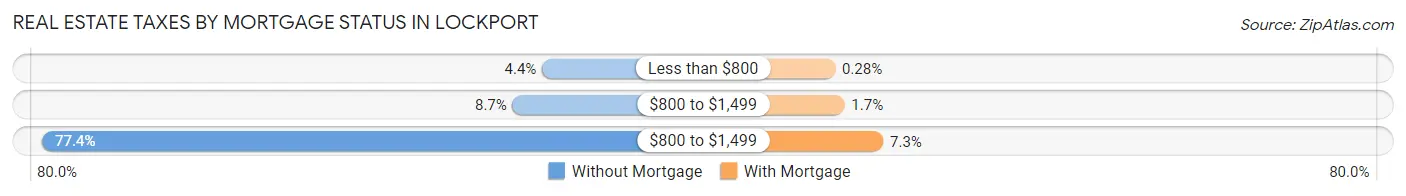
| Property Taxes | Without Mortgage | With Mortgage |
| Less than $800 | 87 (4.4%) | 9 (0.3%) |
| $800 to $1,499 | 173 (8.7%) | 53 (1.7%) |
| $800 to $1,499 | 1,541 (77.4%) | 233 (7.3%) |
| Total | 1,990 (100.0%) | 3,187 (100.0%) |
Health & Disability in Lockport
Health Insurance Coverage by Age in Lockport
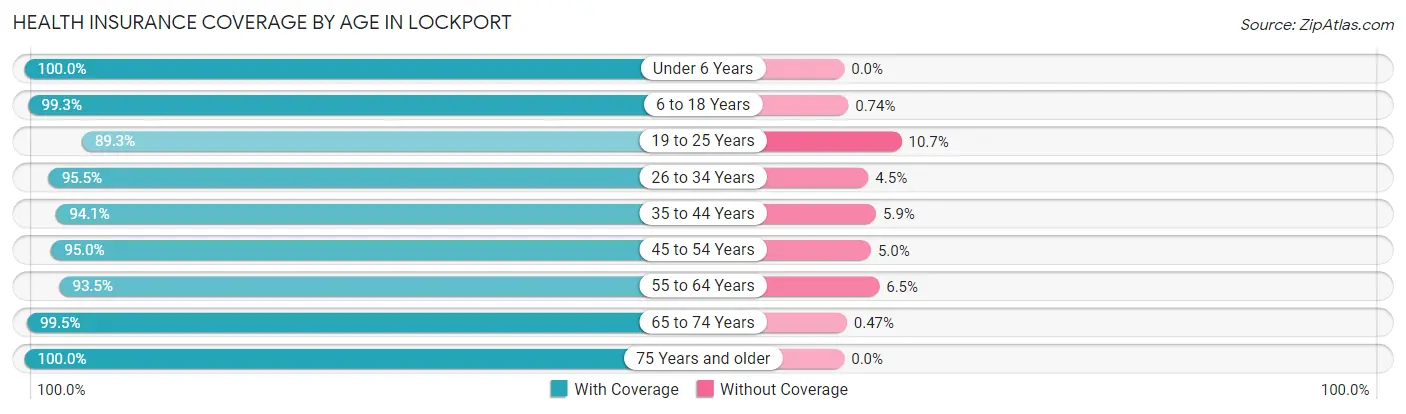
| Age Bracket | With Coverage | Without Coverage |
| Under 6 Years | 1,275 (100.0%) | 0 (0.0%) |
| 6 to 18 Years | 3,494 (99.3%) | 26 (0.7%) |
| 19 to 25 Years | 1,597 (89.3%) | 191 (10.7%) |
| 26 to 34 Years | 2,929 (95.5%) | 138 (4.5%) |
| 35 to 44 Years | 2,616 (94.1%) | 165 (5.9%) |
| 45 to 54 Years | 2,136 (95.0%) | 112 (5.0%) |
| 55 to 64 Years | 2,619 (93.5%) | 183 (6.5%) |
| 65 to 74 Years | 1,897 (99.5%) | 9 (0.5%) |
| 75 Years and older | 1,203 (100.0%) | 0 (0.0%) |
| Total | 19,766 (96.0%) | 824 (4.0%) |
Health Insurance Coverage by Citizenship Status in Lockport
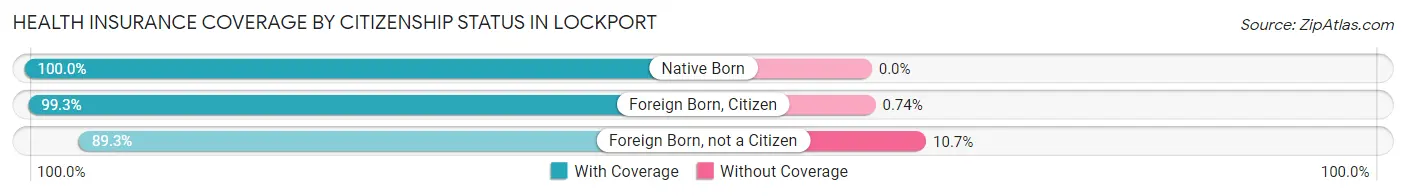
| Citizenship Status | With Coverage | Without Coverage |
| Native Born | 1,275 (100.0%) | 0 (0.0%) |
| Foreign Born, Citizen | 3,494 (99.3%) | 26 (0.7%) |
| Foreign Born, not a Citizen | 1,597 (89.3%) | 191 (10.7%) |
Health Insurance Coverage by Household Income in Lockport
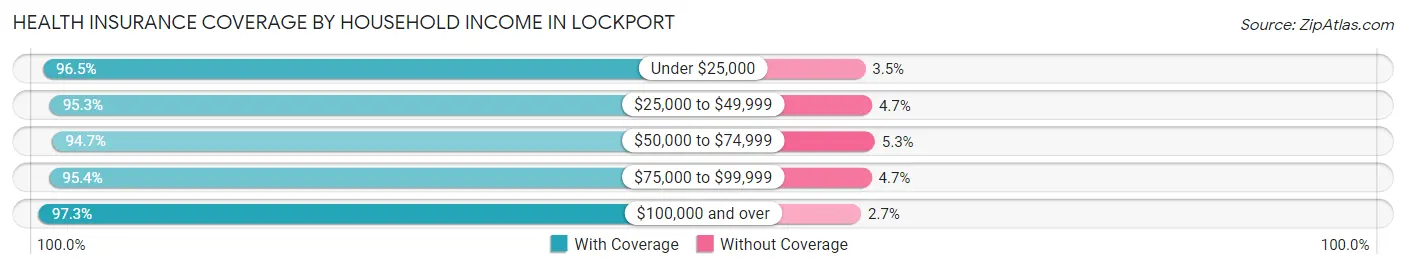
| Household Income | With Coverage | Without Coverage |
| Under $25,000 | 2,940 (96.5%) | 106 (3.5%) |
| $25,000 to $49,999 | 3,780 (95.3%) | 187 (4.7%) |
| $50,000 to $74,999 | 3,406 (94.7%) | 189 (5.3%) |
| $75,000 to $99,999 | 3,667 (95.4%) | 179 (4.6%) |
| $100,000 and over | 5,883 (97.3%) | 162 (2.7%) |
Public vs Private Health Insurance Coverage by Age in Lockport
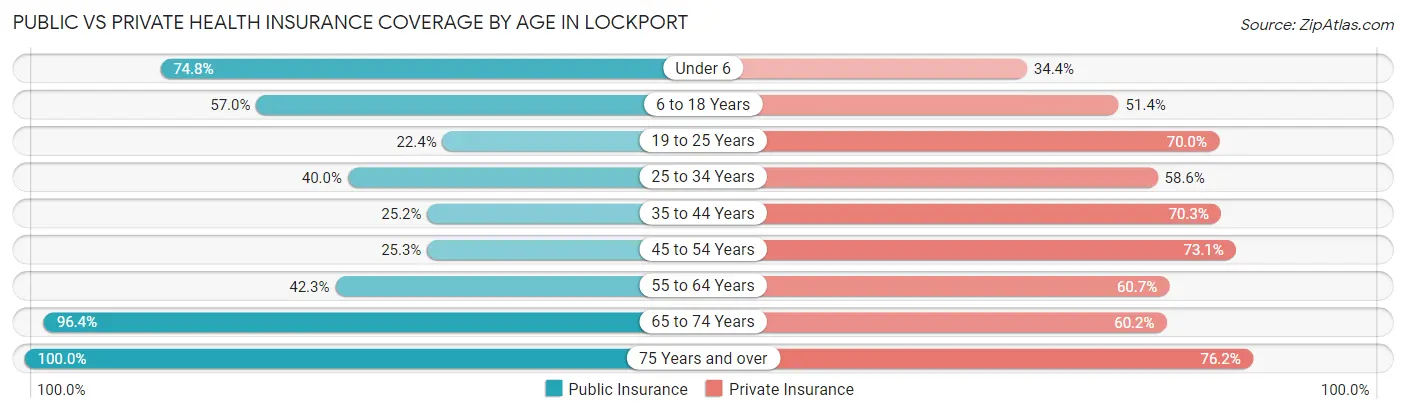
| Age Bracket | Public Insurance | Private Insurance |
| Under 6 | 954 (74.8%) | 438 (34.4%) |
| 6 to 18 Years | 2,006 (57.0%) | 1,809 (51.4%) |
| 19 to 25 Years | 401 (22.4%) | 1,251 (70.0%) |
| 25 to 34 Years | 1,227 (40.0%) | 1,798 (58.6%) |
| 35 to 44 Years | 702 (25.2%) | 1,956 (70.3%) |
| 45 to 54 Years | 568 (25.3%) | 1,643 (73.1%) |
| 55 to 64 Years | 1,186 (42.3%) | 1,702 (60.7%) |
| 65 to 74 Years | 1,838 (96.4%) | 1,148 (60.2%) |
| 75 Years and over | 1,203 (100.0%) | 917 (76.2%) |
| Total | 10,085 (49.0%) | 12,662 (61.5%) |
Disability Status by Sex by Age in Lockport

| Age Bracket | Male | Female |
| Under 5 Years | 0 (0.0%) | 19 (5.1%) |
| 5 to 17 Years | 232 (13.5%) | 146 (7.6%) |
| 18 to 34 Years | 182 (7.9%) | 255 (9.1%) |
| 35 to 64 Years | 561 (14.2%) | 707 (18.2%) |
| 65 to 74 Years | 245 (24.7%) | 282 (30.8%) |
| 75 Years and over | 168 (38.3%) | 340 (44.5%) |
Disability Class by Sex by Age in Lockport
Disability Class: Hearing Difficulty
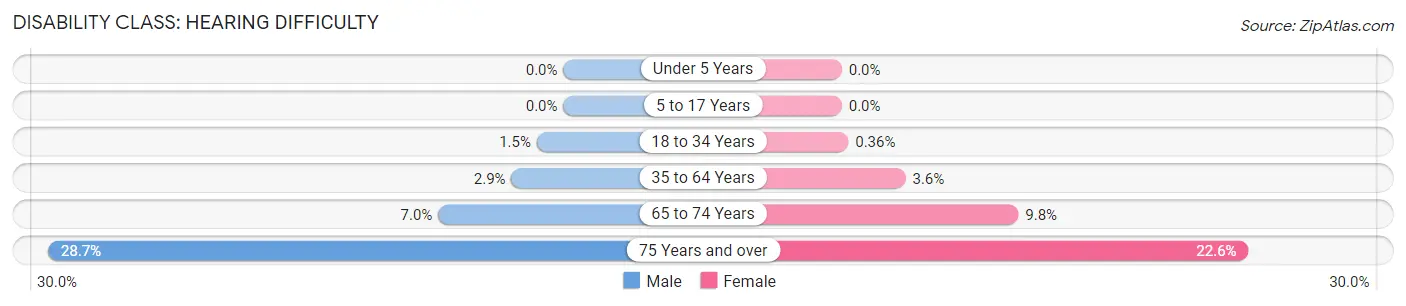
| Age Bracket | Male | Female |
| Under 5 Years | 0 (0.0%) | 0 (0.0%) |
| 5 to 17 Years | 0 (0.0%) | 0 (0.0%) |
| 18 to 34 Years | 34 (1.5%) | 10 (0.4%) |
| 35 to 64 Years | 114 (2.9%) | 138 (3.5%) |
| 65 to 74 Years | 69 (7.0%) | 90 (9.8%) |
| 75 Years and over | 126 (28.7%) | 173 (22.6%) |
Disability Class: Vision Difficulty
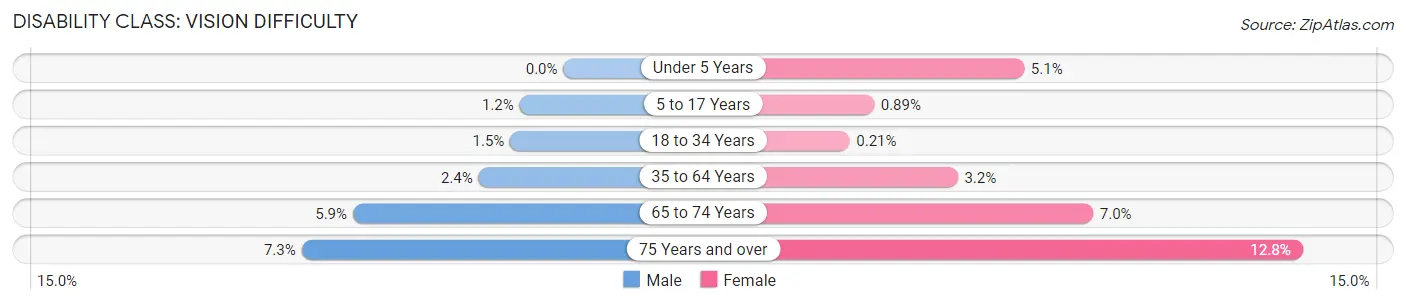
| Age Bracket | Male | Female |
| Under 5 Years | 0 (0.0%) | 19 (5.1%) |
| 5 to 17 Years | 21 (1.2%) | 17 (0.9%) |
| 18 to 34 Years | 34 (1.5%) | 6 (0.2%) |
| 35 to 64 Years | 93 (2.4%) | 125 (3.2%) |
| 65 to 74 Years | 58 (5.9%) | 64 (7.0%) |
| 75 Years and over | 32 (7.3%) | 98 (12.8%) |
Disability Class: Cognitive Difficulty
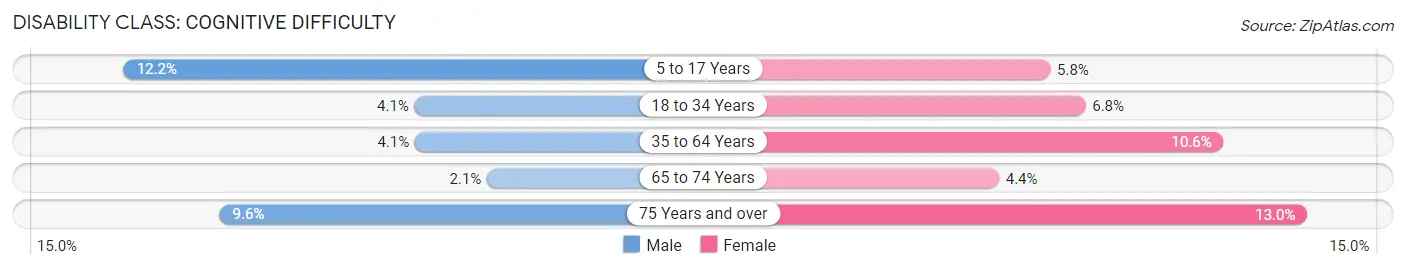
| Age Bracket | Male | Female |
| 5 to 17 Years | 211 (12.2%) | 111 (5.8%) |
| 18 to 34 Years | 95 (4.1%) | 190 (6.8%) |
| 35 to 64 Years | 163 (4.1%) | 413 (10.6%) |
| 65 to 74 Years | 21 (2.1%) | 40 (4.4%) |
| 75 Years and over | 42 (9.6%) | 99 (13.0%) |
Disability Class: Ambulatory Difficulty
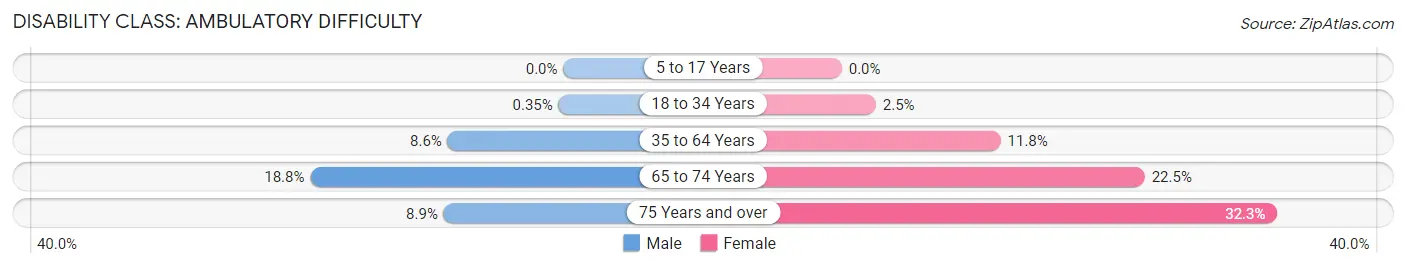
| Age Bracket | Male | Female |
| 5 to 17 Years | 0 (0.0%) | 0 (0.0%) |
| 18 to 34 Years | 8 (0.4%) | 71 (2.5%) |
| 35 to 64 Years | 339 (8.6%) | 458 (11.8%) |
| 65 to 74 Years | 186 (18.8%) | 206 (22.5%) |
| 75 Years and over | 39 (8.9%) | 247 (32.3%) |
Disability Class: Self-Care Difficulty
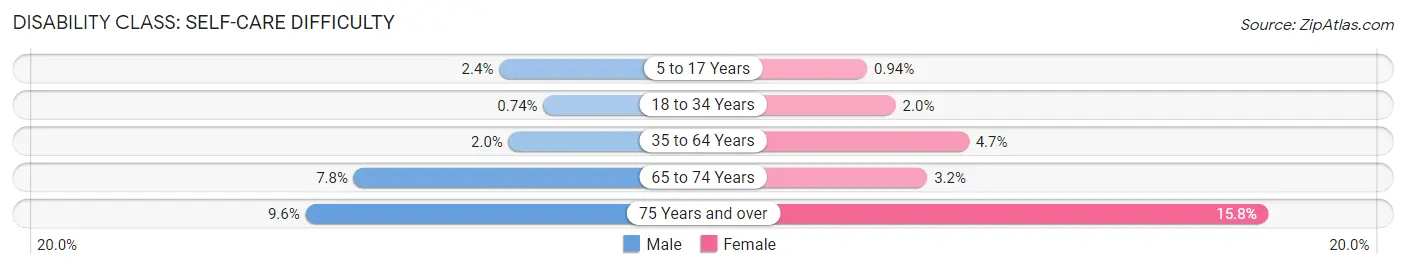
| Age Bracket | Male | Female |
| 5 to 17 Years | 41 (2.4%) | 18 (0.9%) |
| 18 to 34 Years | 17 (0.7%) | 56 (2.0%) |
| 35 to 64 Years | 80 (2.0%) | 183 (4.7%) |
| 65 to 74 Years | 77 (7.8%) | 29 (3.2%) |
| 75 Years and over | 42 (9.6%) | 121 (15.8%) |
Technology Access in Lockport
Computing Device Access in Lockport
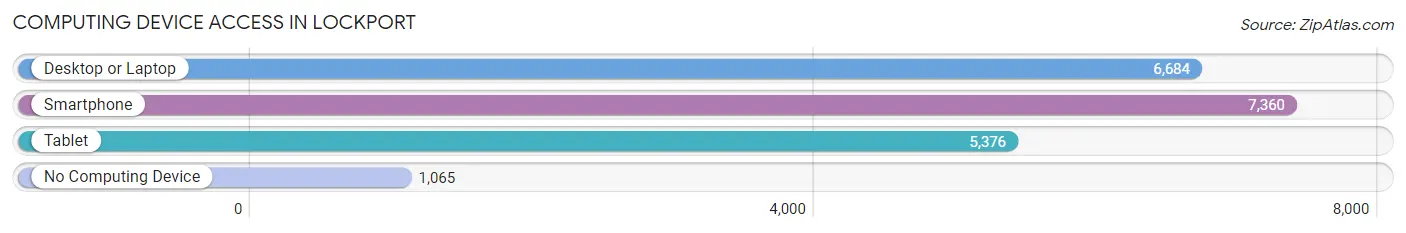
| Device Type | # Households | % Households |
| Desktop or Laptop | 6,684 | 72.5% |
| Smartphone | 7,360 | 79.8% |
| Tablet | 5,376 | 58.3% |
| No Computing Device | 1,065 | 11.6% |
| Total | 9,220 | 100.0% |
Internet Access in Lockport
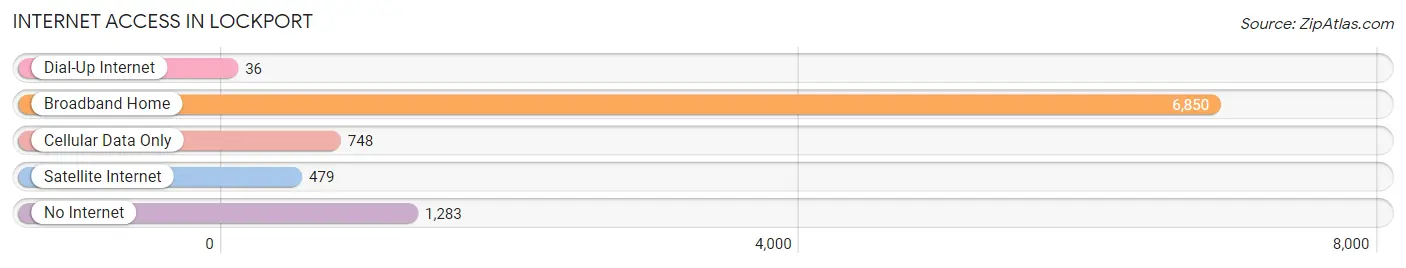
| Internet Type | # Households | % Households |
| Dial-Up Internet | 36 | 0.4% |
| Broadband Home | 6,850 | 74.3% |
| Cellular Data Only | 748 | 8.1% |
| Satellite Internet | 479 | 5.2% |
| No Internet | 1,283 | 13.9% |
| Total | 9,220 | 100.0% |
Lockport Summary
Lockport, New York is a city located in Niagara County, New York, United States. The city is located on the Erie Canal, which is a major waterway in the region. The population of Lockport was 21,165 at the 2010 census.
History
The area that is now Lockport was first settled in 1824 by William and Joseph Lockwood, who were brothers from England. The brothers purchased land from the Holland Land Company and began to develop the area. The city was officially incorporated in 1829 and was named after the Lockwood brothers.
The city of Lockport was an important part of the Erie Canal, which was completed in 1825. The canal was a major transportation route for goods and people in the region. The city was also an important industrial center, with many factories and mills located along the canal.
The city of Lockport experienced a period of growth in the late 19th and early 20th centuries. The population of the city increased from 4,000 in 1880 to over 20,000 by 1920. The city was also home to several important industries, including the Lockport Paper Company, the Lockport Brewing Company, and the Lockport Woolen Mills.
Geography
Lockport is located in Niagara County, New York, United States. The city is located on the Erie Canal, which is a major waterway in the region. The city is located approximately 25 miles northeast of Buffalo and 40 miles southwest of Rochester.
The city of Lockport has a total area of 8.2 square miles, of which 8.1 square miles is land and 0.1 square miles is water. The city is located at an elevation of 590 feet above sea level.
Economy
The economy of Lockport is largely based on manufacturing and tourism. The city is home to several manufacturing companies, including the Lockport Paper Company, the Lockport Brewing Company, and the Lockport Woolen Mills. The city is also home to several tourist attractions, including the Erie Canal Museum, the Lockport Locks and Erie Canal Cruises, and the Lockport Cave and Underground Boat Ride.
The city of Lockport also has a vibrant retail sector, with several shopping centers and malls located in the city. The city is also home to several restaurants, bars, and other entertainment venues.
Demographics
The population of Lockport was 21,165 at the 2010 census. The racial makeup of the city was 90.2% White, 4.3% African American, 0.4% Native American, 1.2% Asian, 0.1% Pacific Islander, 1.7% from other races, and 2.1% from two or more races. Hispanic or Latino of any race were 5.2% of the population.
The median income for a household in the city was $41,945, and the median income for a family was $50,945. The per capita income for the city was $20,945. About 8.7% of families and 11.2% of the population were below the poverty line, including 15.2% of those under age 18 and 6.2% of those age 65 or over.
Common Questions
What is Per Capita Income in Lockport?
Per Capita income in Lockport is $31,877.
What is the Median Family Income in Lockport?
Median Family Income in Lockport is $73,503.
What is the Median Household income in Lockport?
Median Household Income in Lockport is $56,053.
What is Income or Wage Gap in Lockport?
Income or Wage Gap in Lockport is 29.1%.
Women in Lockport earn 70.9 cents for every dollar earned by a man.
What is Family Income Deficit in Lockport?
Family Income Deficit in Lockport is $12,398.
Families that are below poverty line in Lockport earn $12,398 less on average than the poverty threshold level.
What is Inequality or Gini Index in Lockport?
Inequality or Gini Index in Lockport is 0.42.
What is the Total Population of Lockport?
Total Population of Lockport is 20,808.
What is the Total Male Population of Lockport?
Total Male Population of Lockport is 10,010.
What is the Total Female Population of Lockport?
Total Female Population of Lockport is 10,798.
What is the Ratio of Males per 100 Females in Lockport?
There are 92.70 Males per 100 Females in Lockport.
What is the Ratio of Females per 100 Males in Lockport?
There are 107.87 Females per 100 Males in Lockport.
What is the Median Population Age in Lockport?
Median Population Age in Lockport is 36.8 Years.
What is the Average Family Size in Lockport
Average Family Size in Lockport is 3.0 People.
What is the Average Household Size in Lockport
Average Household Size in Lockport is 2.2 People.
How Large is the Labor Force in Lockport?
There are 10,744 People in the Labor Forcein in Lockport.
What is the Percentage of People in the Labor Force in Lockport?
64.1% of People are in the Labor Force in Lockport.
What is the Unemployment Rate in Lockport?
Unemployment Rate in Lockport is 5.7%.