Little Valley, NY Map & Demographics
Little Valley Map
Little Valley Overview
$21,134
PER CAPITA INCOME
$57,500
AVG FAMILY INCOME
$40,972
AVG HOUSEHOLD INCOME
0.45
INEQUALITY / GINI INDEX
1,010
TOTAL POPULATION
577
MALE POPULATION
433
FEMALE POPULATION
133.26
MALES / 100 FEMALES
75.04
FEMALES / 100 MALES
37.2
MEDIAN AGE
2.5
AVG FAMILY SIZE
2.2
AVG HOUSEHOLD SIZE
358
LABOR FORCE [ PEOPLE ]
41.8%
PERCENT IN LABOR FORCE
3.9%
UNEMPLOYMENT RATE
Little Valley Zip Codes
Little Valley Area Codes
Income in Little Valley
Income Overview in Little Valley
Per Capita Income in Little Valley is $21,134, while median incomes of families and households are $57,500 and $40,972 respectively.
| Characteristic | Number | Measure |
| Per Capita Income | 1,010 | $21,134 |
| Median Family Income | 242 | $57,500 |
| Mean Family Income | 242 | $60,920 |
| Median Household Income | 400 | $40,972 |
| Mean Household Income | 400 | $54,022 |
| Income Deficit | 242 | $0 |
| Wage / Income Gap (%) | 1,010 | 0.00% |
| Wage / Income Gap ($) | 1,010 | 100.00¢ per $1 |
| Gini / Inequality Index | 1,010 | 0.45 |
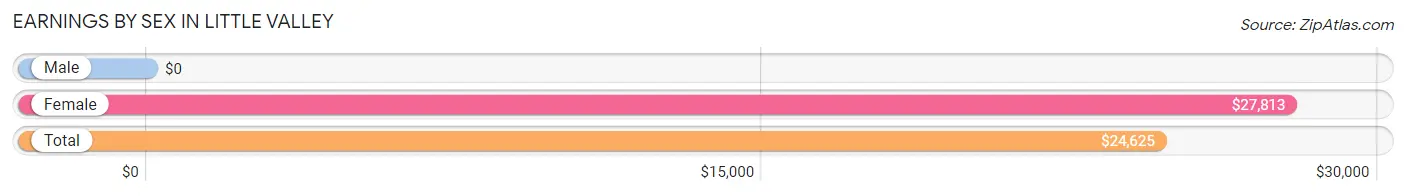
Earnings by Sex in Little Valley
| Sex | Number | Average Earnings |
| Male | 284 (58.8%) | $0 |
| Female | 199 (41.2%) | $27,813 |
| Total | 483 (100.0%) | $24,625 |
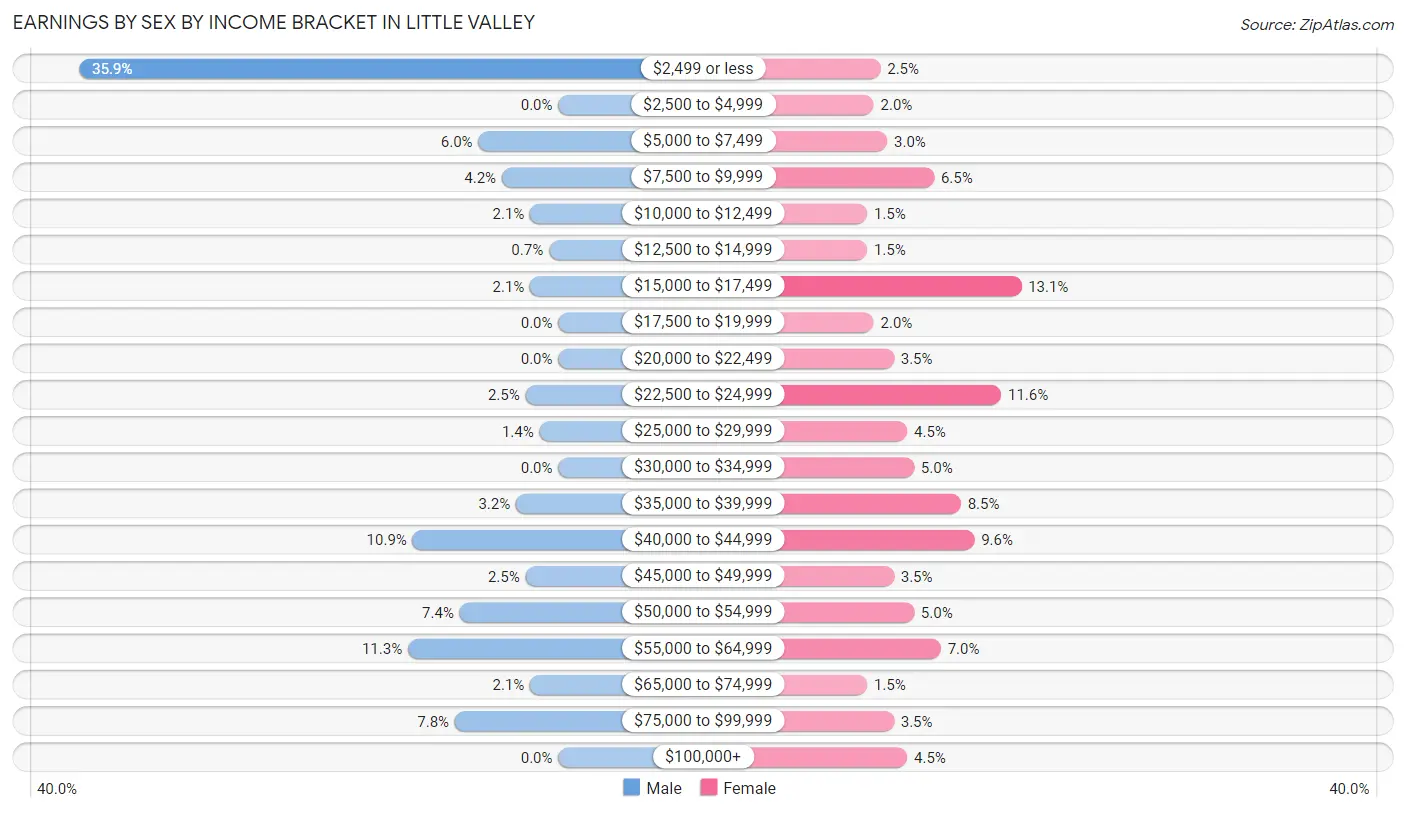
Earnings by Sex by Income Bracket in Little Valley
The most common earnings brackets in Little Valley are $2,499 or less for men (102 | 35.9%) and $15,000 to $17,499 for women (26 | 13.1%).
| Income | Male | Female |
| $2,499 or less | 102 (35.9%) | 5 (2.5%) |
| $2,500 to $4,999 | 0 (0.0%) | 4 (2.0%) |
| $5,000 to $7,499 | 17 (6.0%) | 6 (3.0%) |
| $7,500 to $9,999 | 12 (4.2%) | 13 (6.5%) |
| $10,000 to $12,499 | 6 (2.1%) | 3 (1.5%) |
| $12,500 to $14,999 | 2 (0.7%) | 3 (1.5%) |
| $15,000 to $17,499 | 6 (2.1%) | 26 (13.1%) |
| $17,500 to $19,999 | 0 (0.0%) | 4 (2.0%) |
| $20,000 to $22,499 | 0 (0.0%) | 7 (3.5%) |
| $22,500 to $24,999 | 7 (2.5%) | 23 (11.6%) |
| $25,000 to $29,999 | 4 (1.4%) | 9 (4.5%) |
| $30,000 to $34,999 | 0 (0.0%) | 10 (5.0%) |
| $35,000 to $39,999 | 9 (3.2%) | 17 (8.5%) |
| $40,000 to $44,999 | 31 (10.9%) | 19 (9.6%) |
| $45,000 to $49,999 | 7 (2.5%) | 7 (3.5%) |
| $50,000 to $54,999 | 21 (7.4%) | 10 (5.0%) |
| $55,000 to $64,999 | 32 (11.3%) | 14 (7.0%) |
| $65,000 to $74,999 | 6 (2.1%) | 3 (1.5%) |
| $75,000 to $99,999 | 22 (7.7%) | 7 (3.5%) |
| $100,000+ | 0 (0.0%) | 9 (4.5%) |
| Total | 284 (100.0%) | 199 (100.0%) |
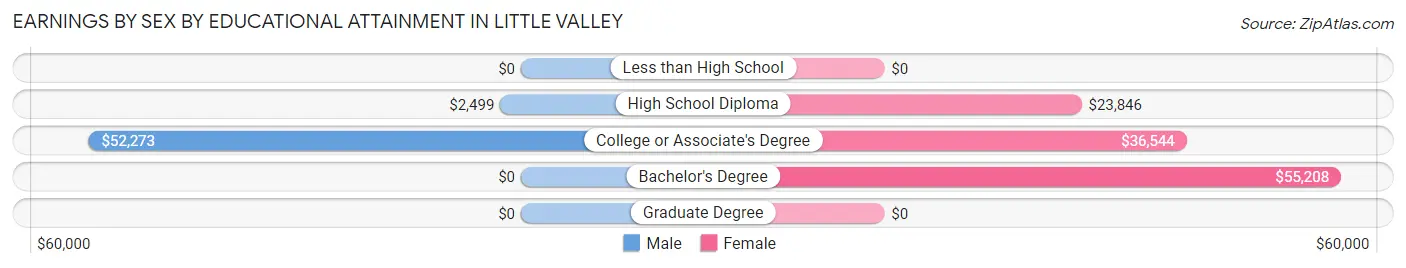
Earnings by Sex by Educational Attainment in Little Valley
| Educational Attainment | Male Income | Female Income |
| Less than High School | - | - |
| High School Diploma | $2,499 | $23,846 |
| College or Associate's Degree | $52,273 | $36,544 |
| Bachelor's Degree | - | - |
| Graduate Degree | - | - |
| Total | - | - |
Family Income in Little Valley
Family Income Brackets in Little Valley
According to the Little Valley family income data, there are 51 families falling into the $50,000 to $74,999 income range, which is the most common income bracket and makes up 21.1% of all families.
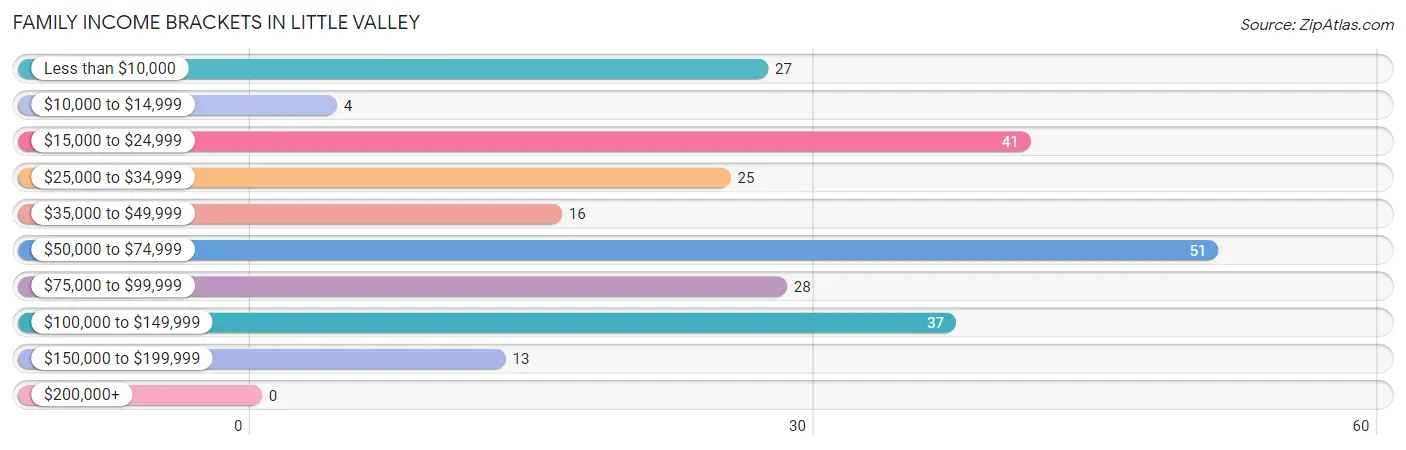
| Income Bracket | # Families | % Families |
| Less than $10,000 | 27 | 11.2% |
| $10,000 to $14,999 | 4 | 1.7% |
| $15,000 to $24,999 | 41 | 16.9% |
| $25,000 to $34,999 | 25 | 10.3% |
| $35,000 to $49,999 | 16 | 6.6% |
| $50,000 to $74,999 | 51 | 21.1% |
| $75,000 to $99,999 | 28 | 11.6% |
| $100,000 to $149,999 | 37 | 15.3% |
| $150,000 to $199,999 | 13 | 5.4% |
| $200,000+ | 0 | 0.0% |
Family Income by Famaliy Size in Little Valley
3-person families (34 | 14.1%) account for the highest median family income in Little Valley with $119,167 per family, while 3-person families (34 | 14.1%) have the highest median income of $39,722 per family member.
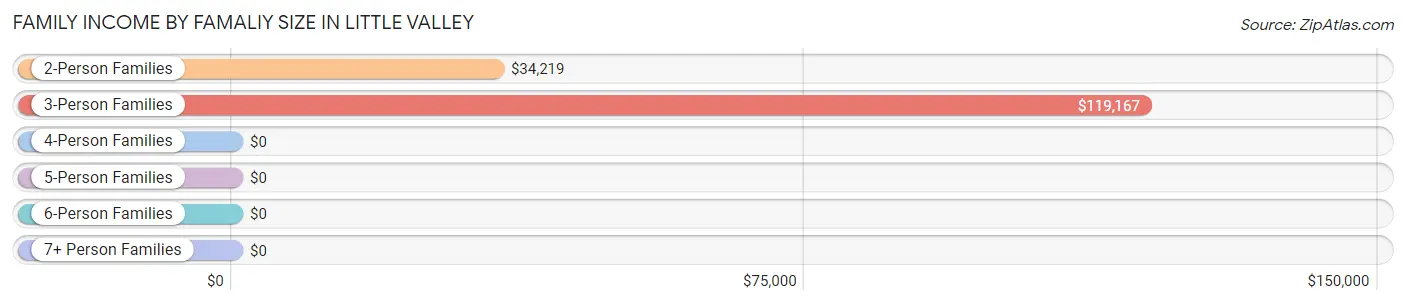
| Income Bracket | # Families | Median Income |
| 2-Person Families | 167 (69.0%) | $34,219 |
| 3-Person Families | 34 (14.1%) | $119,167 |
| 4-Person Families | 25 (10.3%) | $0 |
| 5-Person Families | 13 (5.4%) | $0 |
| 6-Person Families | 3 (1.2%) | $0 |
| 7+ Person Families | 0 (0.0%) | $0 |
| Total | 242 (100.0%) | $57,500 |
Family Income by Number of Earners in Little Valley
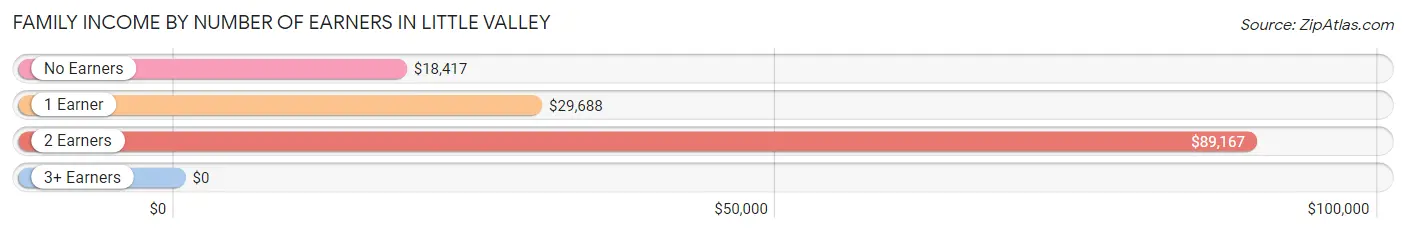
| Number of Earners | # Families | Median Income |
| No Earners | 53 (21.9%) | $18,417 |
| 1 Earner | 97 (40.1%) | $29,688 |
| 2 Earners | 86 (35.5%) | $89,167 |
| 3+ Earners | 6 (2.5%) | $0 |
| Total | 242 (100.0%) | $57,500 |
Household Income in Little Valley
Household Income Brackets in Little Valley
With 81 households falling in the category, the $50,000 to $74,999 income range is the most frequent in Little Valley, accounting for 20.3% of all households.
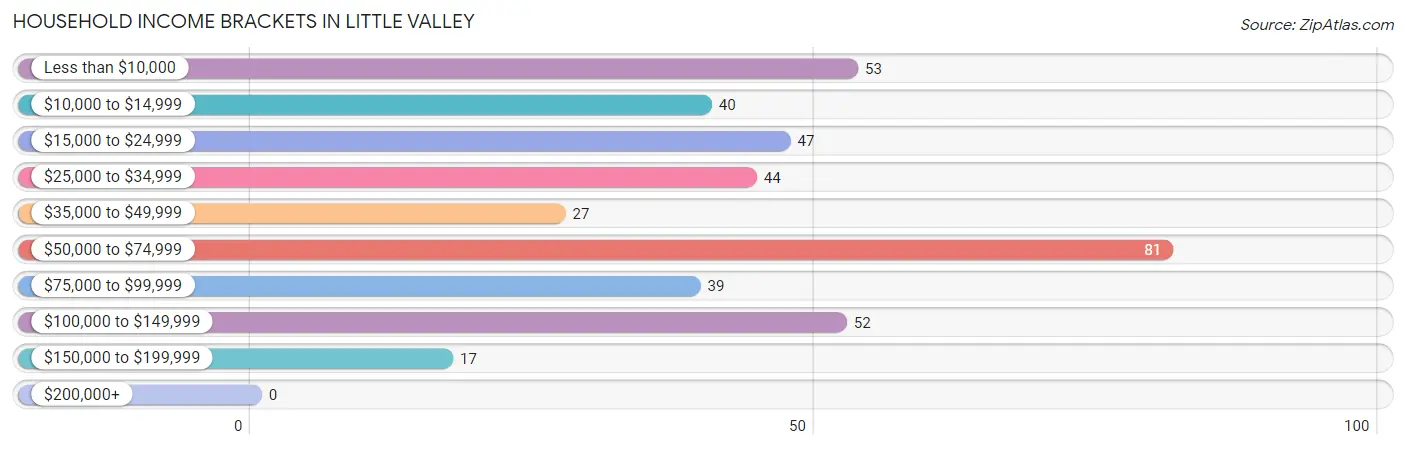
| Income Bracket | # Households | % Households |
| Less than $10,000 | 53 | 13.3% |
| $10,000 to $14,999 | 40 | 10.0% |
| $15,000 to $24,999 | 47 | 11.8% |
| $25,000 to $34,999 | 44 | 11.0% |
| $35,000 to $49,999 | 27 | 6.8% |
| $50,000 to $74,999 | 81 | 20.3% |
| $75,000 to $99,999 | 39 | 9.8% |
| $100,000 to $149,999 | 52 | 13.0% |
| $150,000 to $199,999 | 17 | 4.3% |
| $200,000+ | 0 | 0.0% |
Household Income by Householder Age in Little Valley
The median household income in Little Valley is $40,972, with the highest median household income of $59,844 found in the 25 to 44 years age bracket for the primary householder. A total of 119 households (29.7%) fall into this category. Meanwhile, the 15 to 24 years age bracket for the primary householder has the lowest median household income of $0, with 34 households (8.5%) in this group.
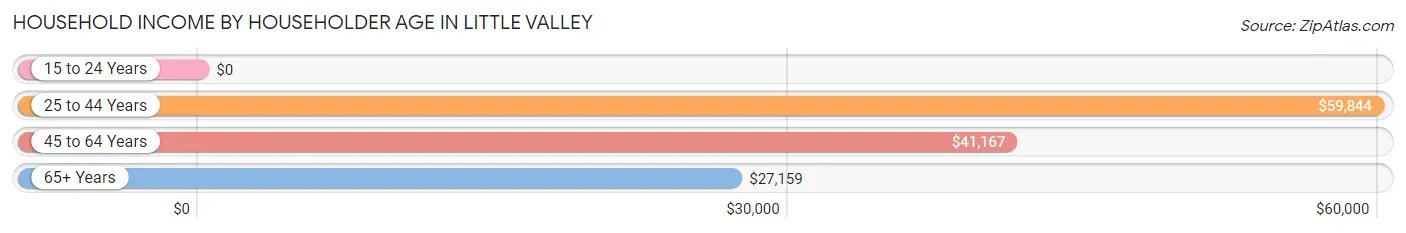
| Income Bracket | # Households | Median Income |
| 15 to 24 Years | 34 (8.5%) | $0 |
| 25 to 44 Years | 119 (29.7%) | $59,844 |
| 45 to 64 Years | 148 (37.0%) | $41,167 |
| 65+ Years | 99 (24.7%) | $27,159 |
| Total | 400 (100.0%) | $40,972 |
Poverty in Little Valley
Income Below Poverty by Sex and Age in Little Valley
With 41.4% poverty level for males and 22.7% for females among the residents of Little Valley, 5 year old males and 6 to 11 year old females are the most vulnerable to poverty, with 23 males (82.1%) and 10 females (41.7%) in their respective age groups living below the poverty level.
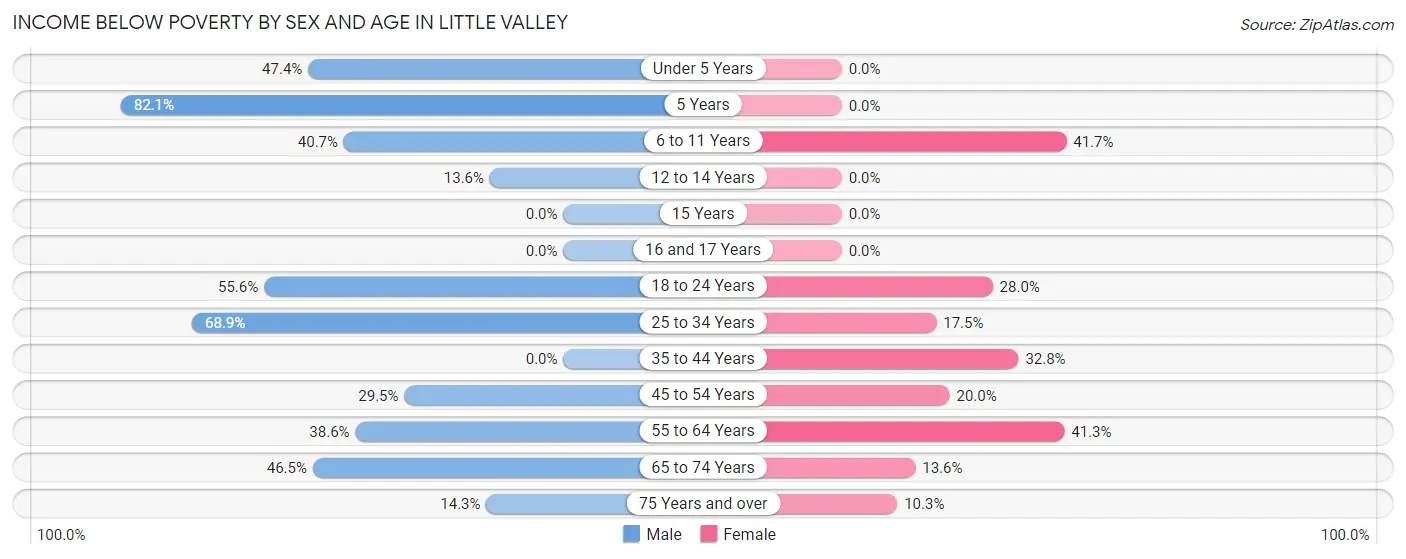
| Age Bracket | Male | Female |
| Under 5 Years | 9 (47.4%) | 0 (0.0%) |
| 5 Years | 23 (82.1%) | 0 (0.0%) |
| 6 to 11 Years | 11 (40.7%) | 10 (41.7%) |
| 12 to 14 Years | 3 (13.6%) | 0 (0.0%) |
| 15 Years | 0 (0.0%) | 0 (0.0%) |
| 16 and 17 Years | 0 (0.0%) | 0 (0.0%) |
| 18 to 24 Years | 5 (55.6%) | 14 (28.0%) |
| 25 to 34 Years | 82 (68.9%) | 10 (17.5%) |
| 35 to 44 Years | 0 (0.0%) | 20 (32.8%) |
| 45 to 54 Years | 18 (29.5%) | 14 (20.0%) |
| 55 to 64 Years | 22 (38.6%) | 19 (41.3%) |
| 65 to 74 Years | 20 (46.5%) | 3 (13.6%) |
| 75 Years and over | 5 (14.3%) | 7 (10.3%) |
| Total | 198 (41.4%) | 97 (22.7%) |
Income Above Poverty by Sex and Age in Little Valley
According to the poverty statistics in Little Valley, males aged 15 years and females aged under 5 years are the age groups that are most secure financially, with 100.0% of males and 100.0% of females in these age groups living above the poverty line.
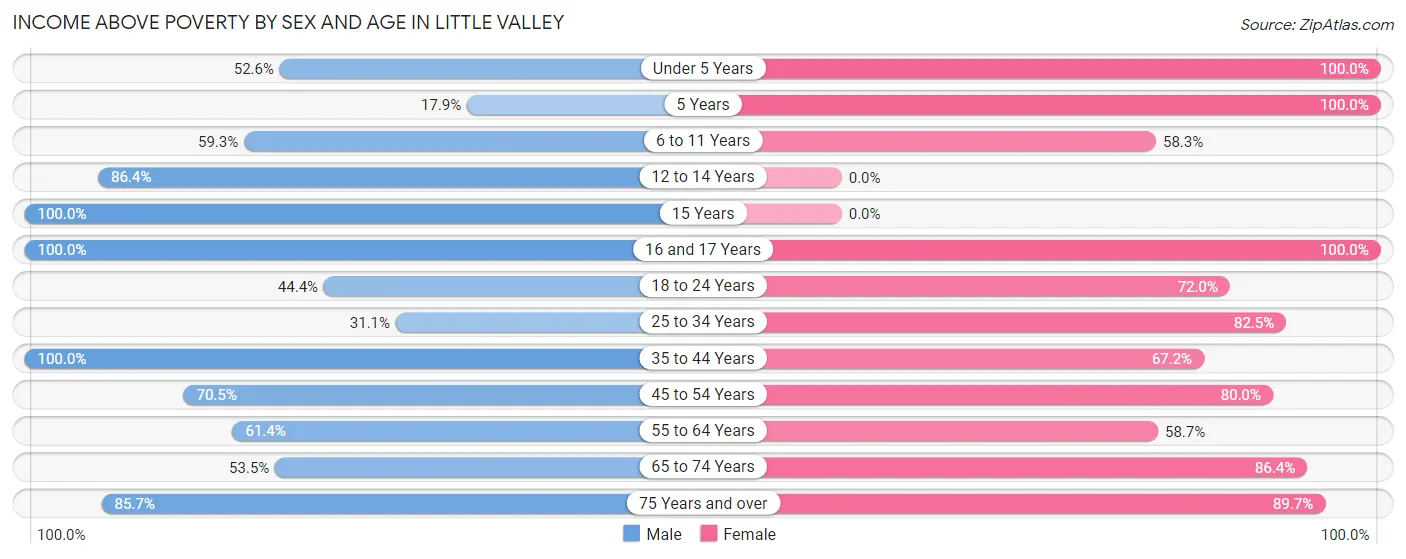
| Age Bracket | Male | Female |
| Under 5 Years | 10 (52.6%) | 21 (100.0%) |
| 5 Years | 5 (17.9%) | 3 (100.0%) |
| 6 to 11 Years | 16 (59.3%) | 14 (58.3%) |
| 12 to 14 Years | 19 (86.4%) | 0 (0.0%) |
| 15 Years | 9 (100.0%) | 0 (0.0%) |
| 16 and 17 Years | 7 (100.0%) | 5 (100.0%) |
| 18 to 24 Years | 4 (44.4%) | 36 (72.0%) |
| 25 to 34 Years | 37 (31.1%) | 47 (82.5%) |
| 35 to 44 Years | 42 (100.0%) | 41 (67.2%) |
| 45 to 54 Years | 43 (70.5%) | 56 (80.0%) |
| 55 to 64 Years | 35 (61.4%) | 27 (58.7%) |
| 65 to 74 Years | 23 (53.5%) | 19 (86.4%) |
| 75 Years and over | 30 (85.7%) | 61 (89.7%) |
| Total | 280 (58.6%) | 330 (77.3%) |
Income Below Poverty Among Married-Couple Families in Little Valley
The poverty statistics for married-couple families in Little Valley show that 9.9% or 13 of the total 131 families live below the poverty line. Families with no children have the highest poverty rate of 14.8%, comprising of 13 families. On the other hand, families with 1 or 2 children have the lowest poverty rate of 0.0%, which includes 0 families.
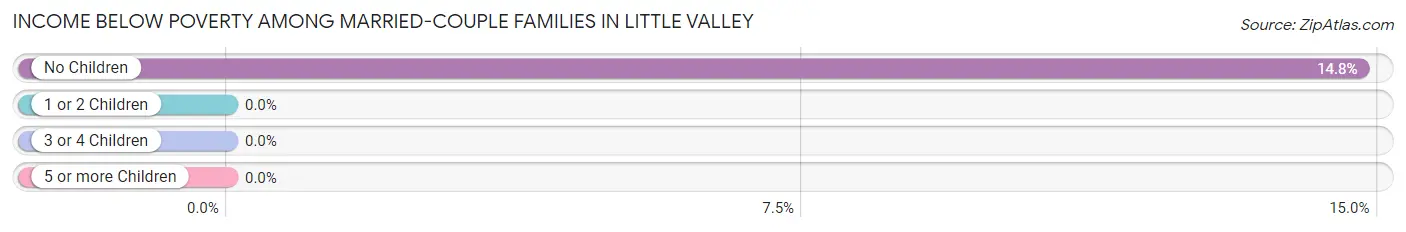
| Children | Above Poverty | Below Poverty |
| No Children | 75 (85.2%) | 13 (14.8%) |
| 1 or 2 Children | 37 (100.0%) | 0 (0.0%) |
| 3 or 4 Children | 6 (100.0%) | 0 (0.0%) |
| 5 or more Children | 0 (0.0%) | 0 (0.0%) |
| Total | 118 (90.1%) | 13 (9.9%) |
Income Below Poverty Among Single-Parent Households in Little Valley
According to the poverty data in Little Valley, 14.3% or 3 single-father households and 42.2% or 38 single-mother households are living below the poverty line. Among single-father households, those with 1 or 2 children have the highest poverty rate, with 3 households (30.0%) experiencing poverty. Likewise, among single-mother households, those with 1 or 2 children have the highest poverty rate, with 18 households (54.5%) falling below the poverty line.
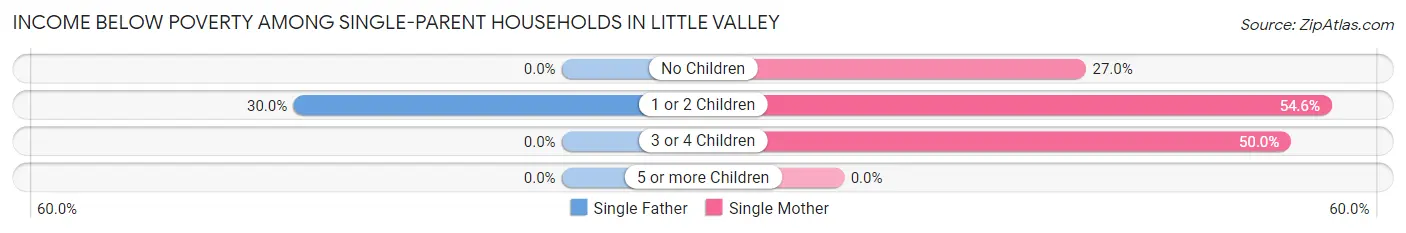
| Children | Single Father | Single Mother |
| No Children | 0 (0.0%) | 10 (27.0%) |
| 1 or 2 Children | 3 (30.0%) | 18 (54.5%) |
| 3 or 4 Children | 0 (0.0%) | 10 (50.0%) |
| 5 or more Children | 0 (0.0%) | 0 (0.0%) |
| Total | 3 (14.3%) | 38 (42.2%) |
Income Below Poverty Among Married-Couple vs Single-Parent Households in Little Valley
The poverty data for Little Valley shows that 13 of the married-couple family households (9.9%) and 41 of the single-parent households (36.9%) are living below the poverty level. Within the married-couple family households, those with no children have the highest poverty rate, with 13 households (14.8%) falling below the poverty line. Among the single-parent households, those with 3 or 4 children have the highest poverty rate, with 10 household (50.0%) living below poverty.
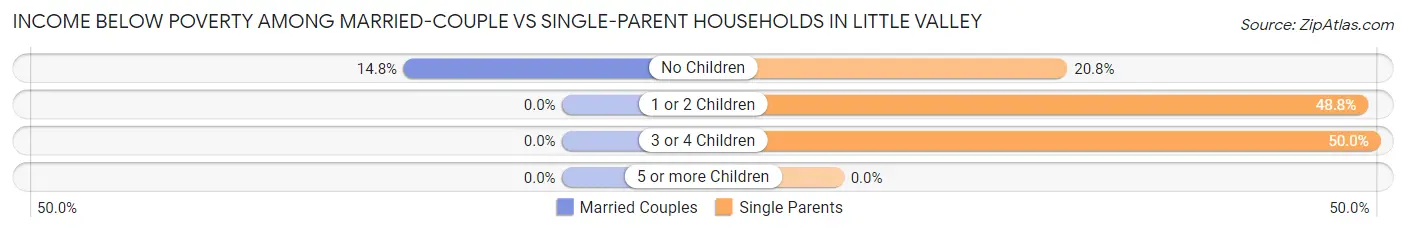
| Children | Married-Couple Families | Single-Parent Households |
| No Children | 13 (14.8%) | 10 (20.8%) |
| 1 or 2 Children | 0 (0.0%) | 21 (48.8%) |
| 3 or 4 Children | 0 (0.0%) | 10 (50.0%) |
| 5 or more Children | 0 (0.0%) | 0 (0.0%) |
| Total | 13 (9.9%) | 41 (36.9%) |
Race in Little Valley
The most populous races in Little Valley are White / Caucasian (884 | 87.5%), Black / African American (50 | 5.0%), and Native / Alaskan (32 | 3.2%).
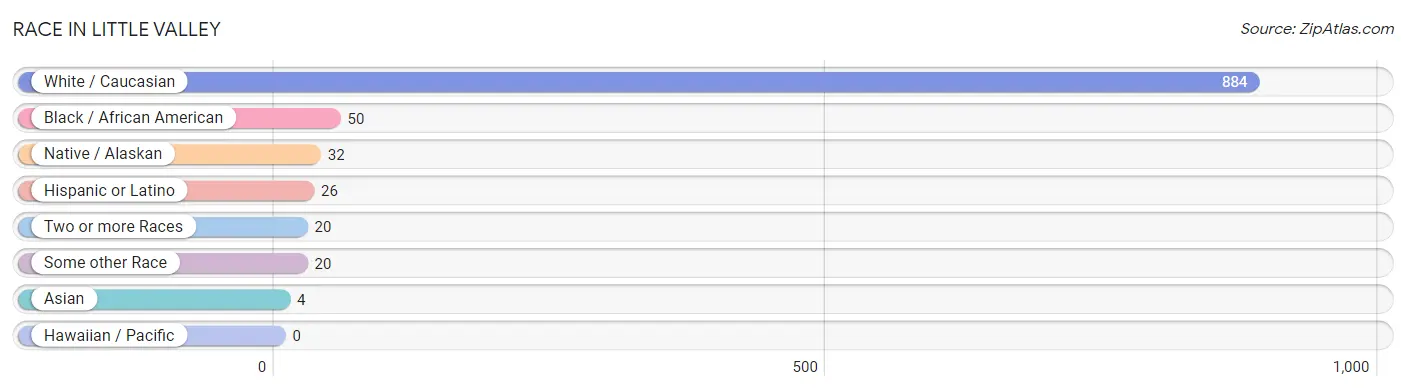
| Race | # Population | % Population |
| Asian | 4 | 0.4% |
| Black / African American | 50 | 5.0% |
| Hawaiian / Pacific | 0 | 0.0% |
| Hispanic or Latino | 26 | 2.6% |
| Native / Alaskan | 32 | 3.2% |
| White / Caucasian | 884 | 87.5% |
| Two or more Races | 20 | 2.0% |
| Some other Race | 20 | 2.0% |
| Total | 1,010 | 100.0% |
Ancestry in Little Valley
The most populous ancestries reported in Little Valley are German (222 | 22.0%), Irish (197 | 19.5%), English (119 | 11.8%), Polish (78 | 7.7%), and Italian (66 | 6.5%), together accounting for 67.5% of all Little Valley residents.
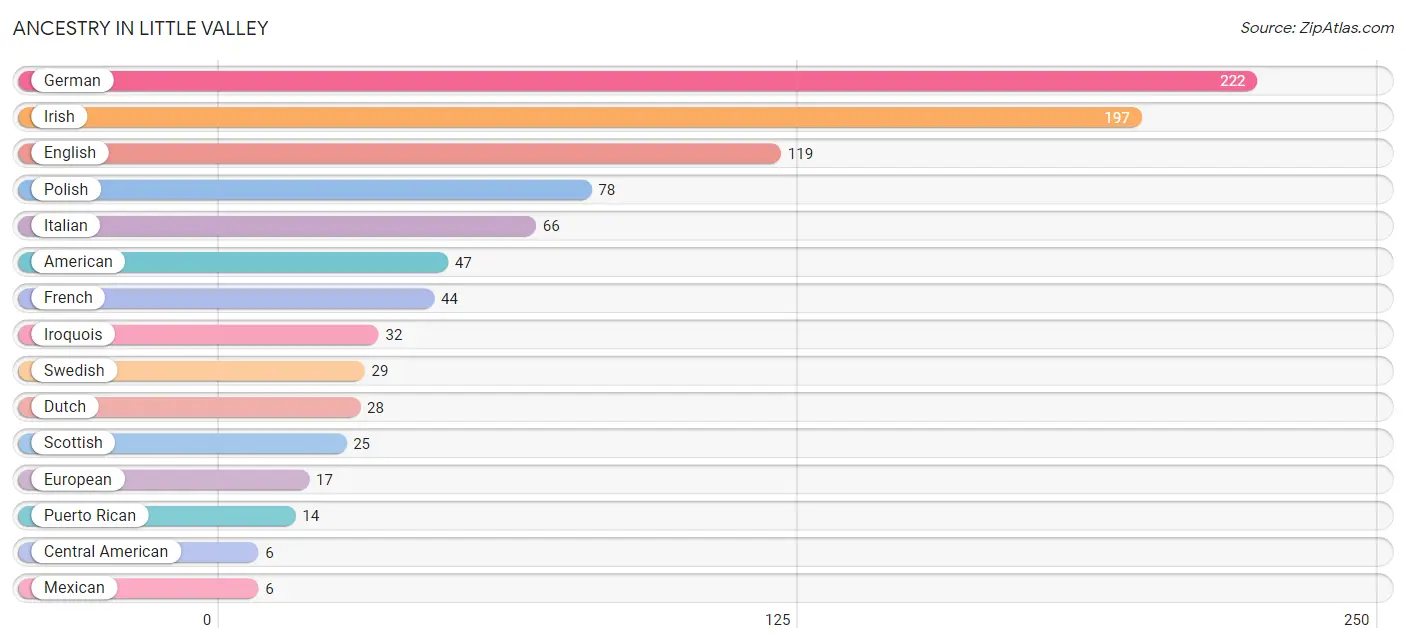
| Ancestry | # Population | % Population |
| American | 47 | 4.6% |
| Arab | 4 | 0.4% |
| Central American | 6 | 0.6% |
| Dutch | 28 | 2.8% |
| English | 119 | 11.8% |
| European | 17 | 1.7% |
| French | 44 | 4.4% |
| German | 222 | 22.0% |
| Irish | 197 | 19.5% |
| Iroquois | 32 | 3.2% |
| Italian | 66 | 6.5% |
| Lebanese | 4 | 0.4% |
| Mexican | 6 | 0.6% |
| Pennsylvania German | 3 | 0.3% |
| Polish | 78 | 7.7% |
| Puerto Rican | 14 | 1.4% |
| Salvadoran | 6 | 0.6% |
| Scotch-Irish | 4 | 0.4% |
| Scottish | 25 | 2.5% |
| Swedish | 29 | 2.9% |
| Thai | 4 | 0.4% | View All 21 Rows |
Immigrants in Little Valley
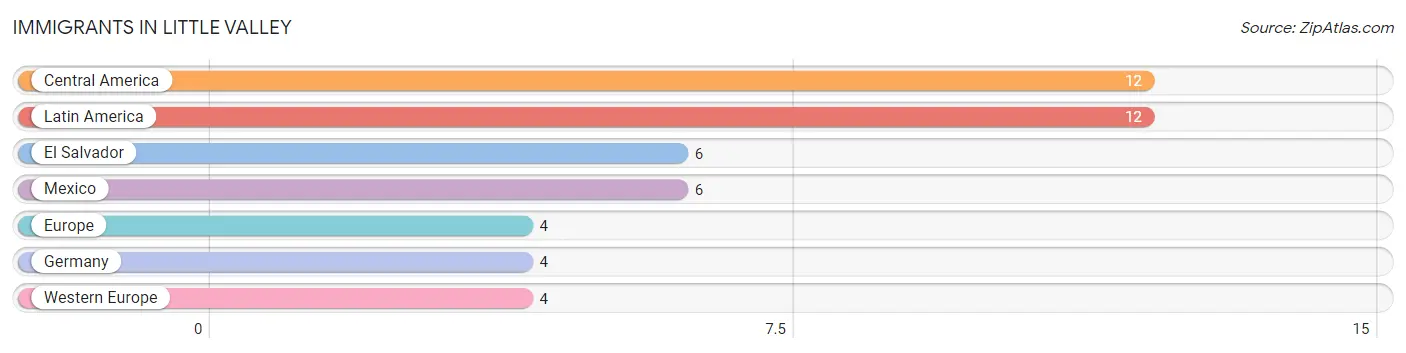
The most numerous immigrant groups reported in Little Valley came from Central America (12 | 1.2%), Latin America (12 | 1.2%), El Salvador (6 | 0.6%), Mexico (6 | 0.6%), and Europe (4 | 0.4%), together accounting for 4.0% of all Little Valley residents.
| Immigration Origin | # Population | % Population |
| Central America | 12 | 1.2% |
| El Salvador | 6 | 0.6% |
| Europe | 4 | 0.4% |
| Germany | 4 | 0.4% |
| Latin America | 12 | 1.2% |
| Mexico | 6 | 0.6% |
| Western Europe | 4 | 0.4% | View All 7 Rows |
Sex and Age in Little Valley
Sex and Age in Little Valley
The most populous age groups in Little Valley are 30 to 34 Years (132 | 22.9%) for men and 50 to 54 Years (45 | 10.4%) for women.
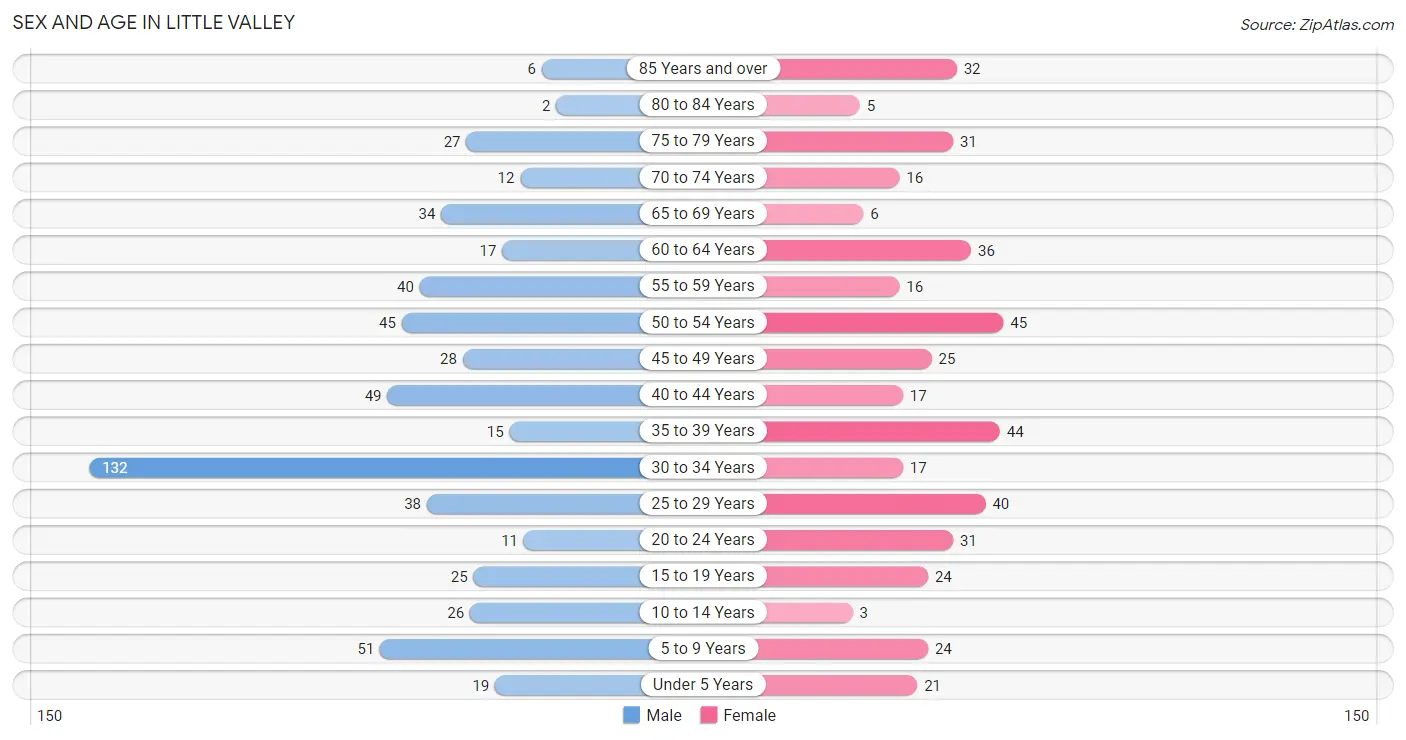
| Age Bracket | Male | Female |
| Under 5 Years | 19 (3.3%) | 21 (4.9%) |
| 5 to 9 Years | 51 (8.8%) | 24 (5.5%) |
| 10 to 14 Years | 26 (4.5%) | 3 (0.7%) |
| 15 to 19 Years | 25 (4.3%) | 24 (5.5%) |
| 20 to 24 Years | 11 (1.9%) | 31 (7.2%) |
| 25 to 29 Years | 38 (6.6%) | 40 (9.2%) |
| 30 to 34 Years | 132 (22.9%) | 17 (3.9%) |
| 35 to 39 Years | 15 (2.6%) | 44 (10.2%) |
| 40 to 44 Years | 49 (8.5%) | 17 (3.9%) |
| 45 to 49 Years | 28 (4.9%) | 25 (5.8%) |
| 50 to 54 Years | 45 (7.8%) | 45 (10.4%) |
| 55 to 59 Years | 40 (6.9%) | 16 (3.7%) |
| 60 to 64 Years | 17 (2.9%) | 36 (8.3%) |
| 65 to 69 Years | 34 (5.9%) | 6 (1.4%) |
| 70 to 74 Years | 12 (2.1%) | 16 (3.7%) |
| 75 to 79 Years | 27 (4.7%) | 31 (7.2%) |
| 80 to 84 Years | 2 (0.4%) | 5 (1.1%) |
| 85 Years and over | 6 (1.0%) | 32 (7.4%) |
| Total | 577 (100.0%) | 433 (100.0%) |
Families and Households in Little Valley
Median Family Size in Little Valley
The median family size in Little Valley is 2.54 persons per family, with married-couple families (131 | 54.1%) accounting for the largest median family size of 2.59 persons per family. On the other hand, single male/father families (21 | 8.7%) represent the smallest median family size with 2.24 persons per family.
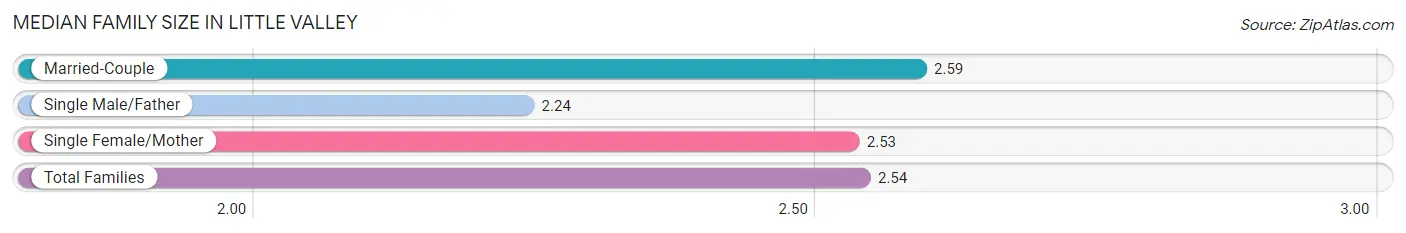
| Family Type | # Families | Family Size |
| Married-Couple | 131 (54.1%) | 2.59 |
| Single Male/Father | 21 (8.7%) | 2.24 |
| Single Female/Mother | 90 (37.2%) | 2.53 |
| Total Families | 242 (100.0%) | 2.54 |
Median Household Size in Little Valley
The median household size in Little Valley is 2.23 persons per household, with single female/mother households (90 | 22.5%) accounting for the largest median household size of 3.57 persons per household. non-family households (158 | 39.5%) represent the smallest median household size with 1.18 persons per household.
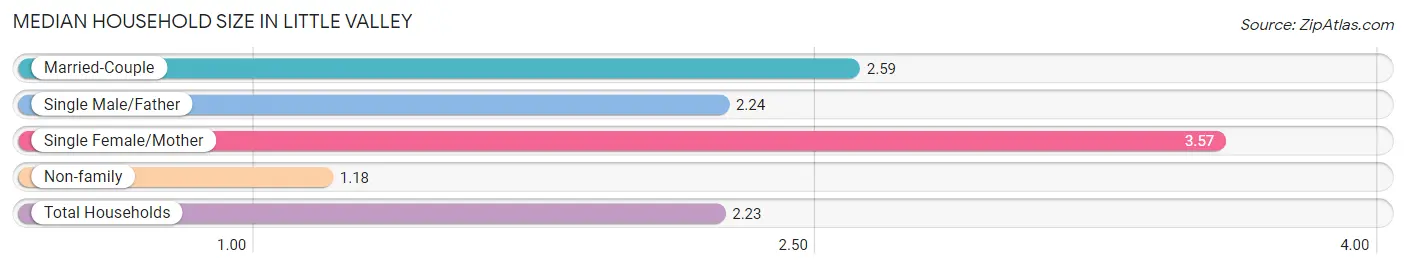
| Household Type | # Households | Household Size |
| Married-Couple | 131 (32.8%) | 2.59 |
| Single Male/Father | 21 (5.2%) | 2.24 |
| Single Female/Mother | 90 (22.5%) | 3.57 |
| Non-family | 158 (39.5%) | 1.18 |
| Total Households | 400 (100.0%) | 2.23 |
Household Size by Marriage Status in Little Valley
Out of a total of 400 households in Little Valley, 242 (60.5%) are family households, while 158 (39.5%) are nonfamily households. The most numerous type of family households are 2-person households, comprising 157, and the most common type of nonfamily households are 1-person households, comprising 134.
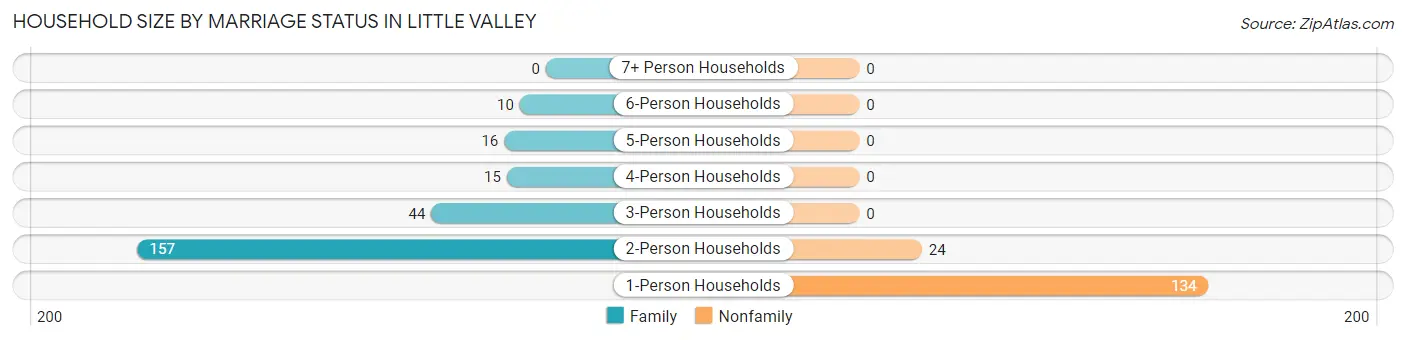
| Household Size | Family Households | Nonfamily Households |
| 1-Person Households | - | 134 (33.5%) |
| 2-Person Households | 157 (39.3%) | 24 (6.0%) |
| 3-Person Households | 44 (11.0%) | 0 (0.0%) |
| 4-Person Households | 15 (3.7%) | 0 (0.0%) |
| 5-Person Households | 16 (4.0%) | 0 (0.0%) |
| 6-Person Households | 10 (2.5%) | 0 (0.0%) |
| 7+ Person Households | 0 (0.0%) | 0 (0.0%) |
| Total | 242 (60.5%) | 158 (39.5%) |
Female Fertility in Little Valley
Fertility by Age in Little Valley
Average fertility rate in Little Valley is 39.0 births per 1,000 women. Women in the age bracket of 20 to 34 years have the highest fertility rate with 91.0 births per 1,000 women. Women in the age bracket of 20 to 34 years acount for 100.0% of all women with births.
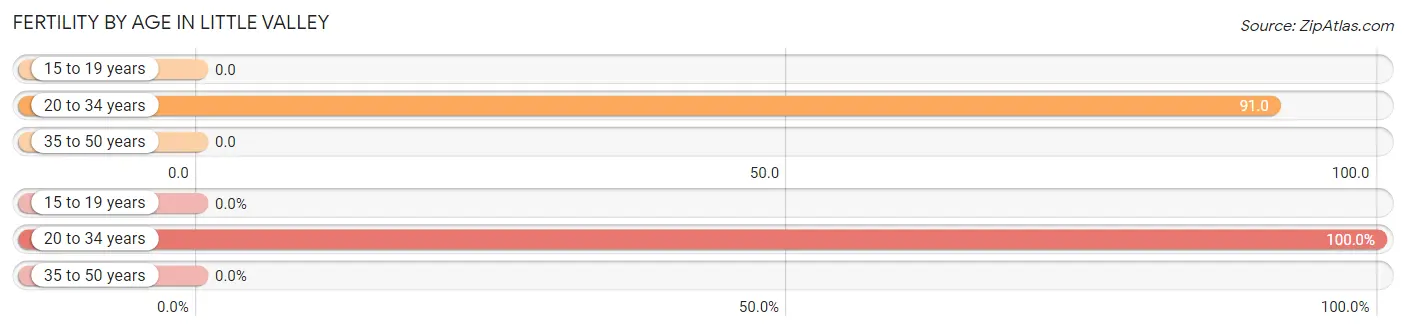
| Age Bracket | Women with Births | Births / 1,000 Women |
| 15 to 19 years | 0 (0.0%) | 0.0 |
| 20 to 34 years | 8 (100.0%) | 91.0 |
| 35 to 50 years | 0 (0.0%) | 0.0 |
| Total | 8 (100.0%) | 39.0 |
Fertility by Age by Marriage Status in Little Valley
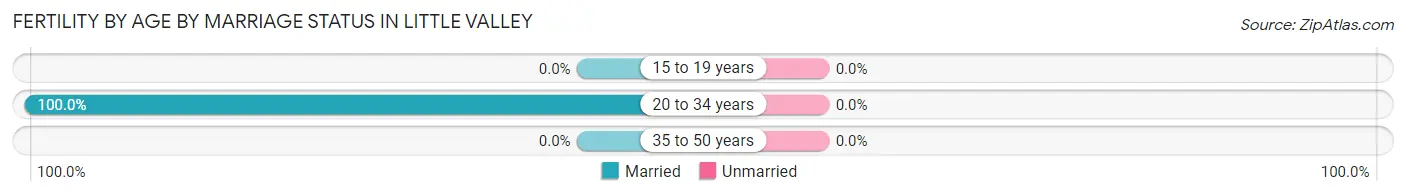
| Age Bracket | Married | Unmarried |
| 15 to 19 years | 0 (0.0%) | 0 (0.0%) |
| 20 to 34 years | 8 (100.0%) | 0 (0.0%) |
| 35 to 50 years | 0 (0.0%) | 0 (0.0%) |
| Total | 8 (100.0%) | 0 (0.0%) |
Fertility by Education in Little Valley
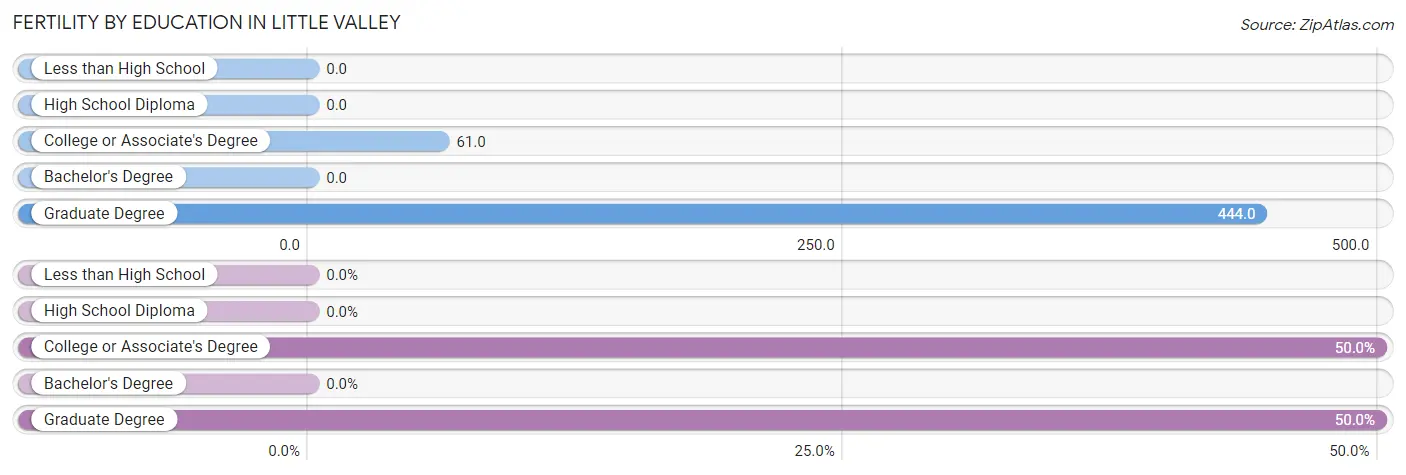
| Educational Attainment | Women with Births | Births / 1,000 Women |
| Less than High School | 0 (0.0%) | 0.0 |
| High School Diploma | 0 (0.0%) | 0.0 |
| College or Associate's Degree | 4 (50.0%) | 61.0 |
| Bachelor's Degree | 0 (0.0%) | 0.0 |
| Graduate Degree | 4 (50.0%) | 444.0 |
| Total | 8 (100.0%) | 39.0 |
Fertility by Education by Marriage Status in Little Valley
| Educational Attainment | Married | Unmarried |
| Less than High School | 0 (0.0%) | 0 (0.0%) |
| High School Diploma | 0 (0.0%) | 0 (0.0%) |
| College or Associate's Degree | 4 (100.0%) | 0 (0.0%) |
| Bachelor's Degree | 0 (0.0%) | 0 (0.0%) |
| Graduate Degree | 4 (100.0%) | 0 (0.0%) |
| Total | 8 (100.0%) | 0 (0.0%) |
Employment Characteristics in Little Valley
Employment by Class of Employer in Little Valley
Among the 337 employed individuals in Little Valley, private company employees (169 | 50.1%), local government employees (90 | 26.7%), and not-for-profit organizations (39 | 11.6%) make up the most common classes of employment.
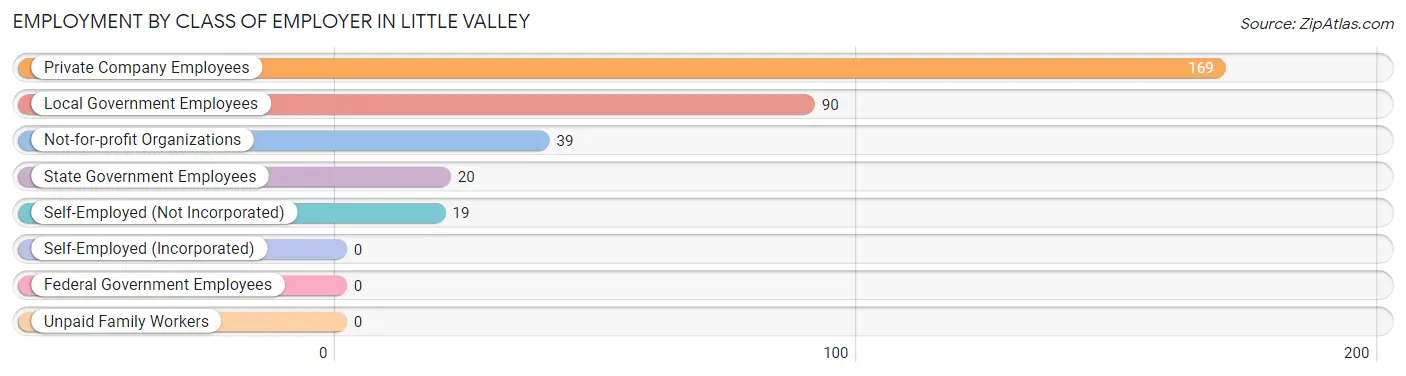
| Employer Class | # Employees | % Employees |
| Private Company Employees | 169 | 50.1% |
| Self-Employed (Incorporated) | 0 | 0.0% |
| Self-Employed (Not Incorporated) | 19 | 5.6% |
| Not-for-profit Organizations | 39 | 11.6% |
| Local Government Employees | 90 | 26.7% |
| State Government Employees | 20 | 5.9% |
| Federal Government Employees | 0 | 0.0% |
| Unpaid Family Workers | 0 | 0.0% |
| Total | 337 | 100.0% |
Employment Status by Age in Little Valley
According to the labor force statistics for Little Valley, out of the total population over 16 years of age (857), 41.8% or 358 individuals are in the labor force, with 3.9% or 14 of them unemployed. The age group with the highest labor force participation rate is 25 to 29 years, with 71.8% or 56 individuals in the labor force. Within the labor force, the 16 to 19 years age range has the highest percentage of unemployed individuals, with 13.3% or 2 of them being unemployed.
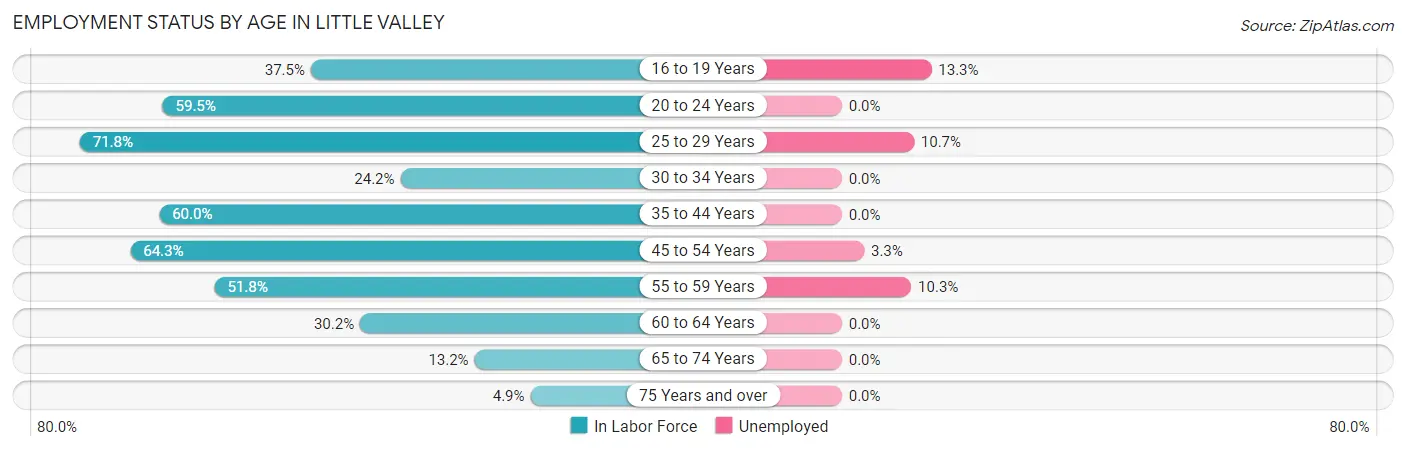
| Age Bracket | In Labor Force | Unemployed |
| 16 to 19 Years | 15 (37.5%) | 2 (13.3%) |
| 20 to 24 Years | 25 (59.5%) | 0 (0.0%) |
| 25 to 29 Years | 56 (71.8%) | 6 (10.7%) |
| 30 to 34 Years | 36 (24.2%) | 0 (0.0%) |
| 35 to 44 Years | 75 (60.0%) | 0 (0.0%) |
| 45 to 54 Years | 92 (64.3%) | 3 (3.3%) |
| 55 to 59 Years | 29 (51.8%) | 3 (10.3%) |
| 60 to 64 Years | 16 (30.2%) | 0 (0.0%) |
| 65 to 74 Years | 9 (13.2%) | 0 (0.0%) |
| 75 Years and over | 5 (4.9%) | 0 (0.0%) |
| Total | 358 (41.8%) | 14 (3.9%) |
Employment Status by Educational Attainment in Little Valley
According to labor force statistics for Little Valley, 50.3% of individuals (304) out of the total population between 25 and 64 years of age (604) are in the labor force, with 3.9% or 12 of them being unemployed. The group with the highest labor force participation rate are those with the educational attainment of bachelor's degree or higher, with 76.6% or 36 individuals in the labor force. Within the labor force, individuals with less than high school education have the highest percentage of unemployment, with 23.1% or 3 of them being unemployed.
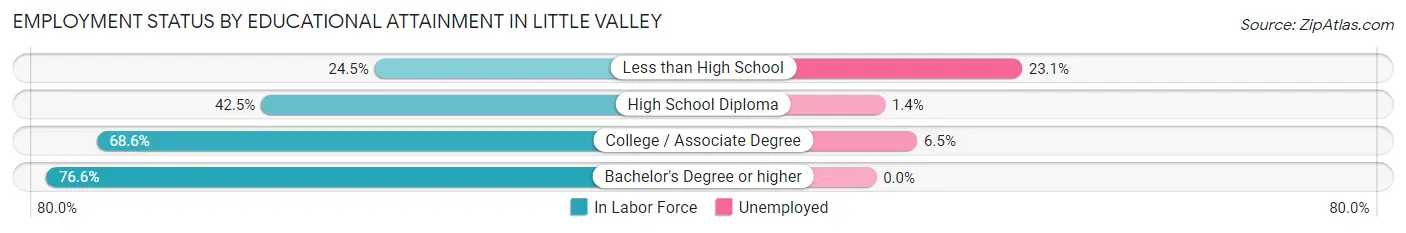
| Educational Attainment | In Labor Force | Unemployed |
| Less than High School | 13 (24.5%) | 12 (23.1%) |
| High School Diploma | 148 (42.5%) | 5 (1.4%) |
| College / Associate Degree | 107 (68.6%) | 10 (6.5%) |
| Bachelor's Degree or higher | 36 (76.6%) | 0 (0.0%) |
| Total | 304 (50.3%) | 24 (3.9%) |
Employment Occupations by Sex in Little Valley
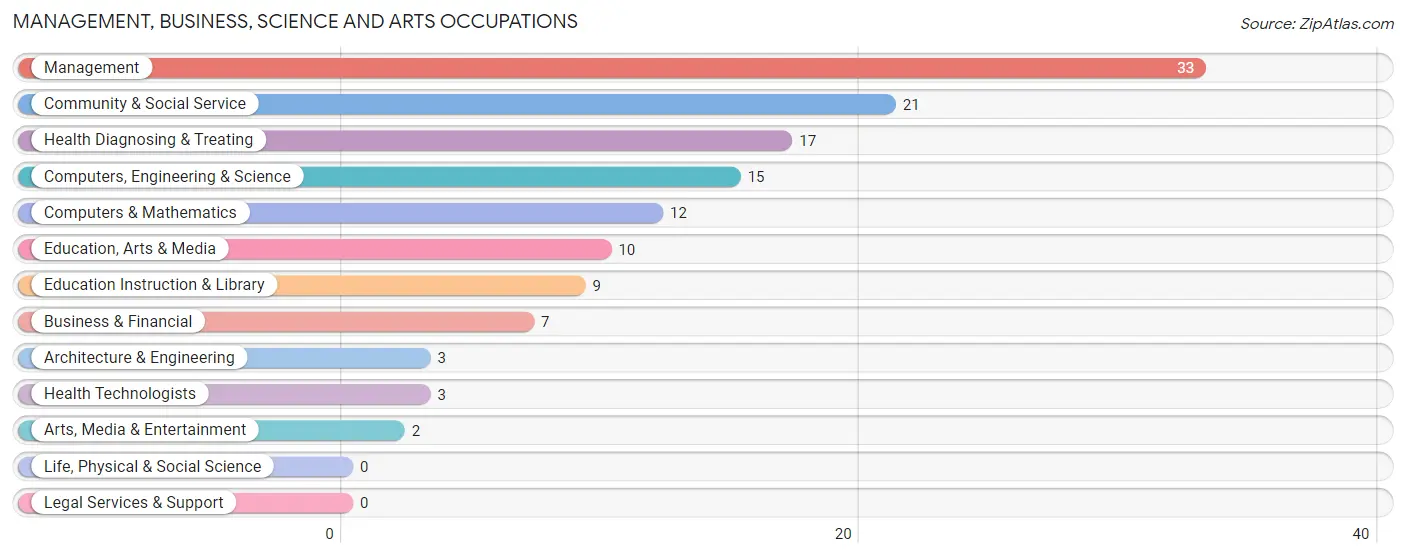
Management, Business, Science and Arts Occupations
The most common Management, Business, Science and Arts occupations in Little Valley are Management (33 | 9.6%), Community & Social Service (21 | 6.1%), Health Diagnosing & Treating (17 | 4.9%), Computers, Engineering & Science (15 | 4.4%), and Computers & Mathematics (12 | 3.5%).
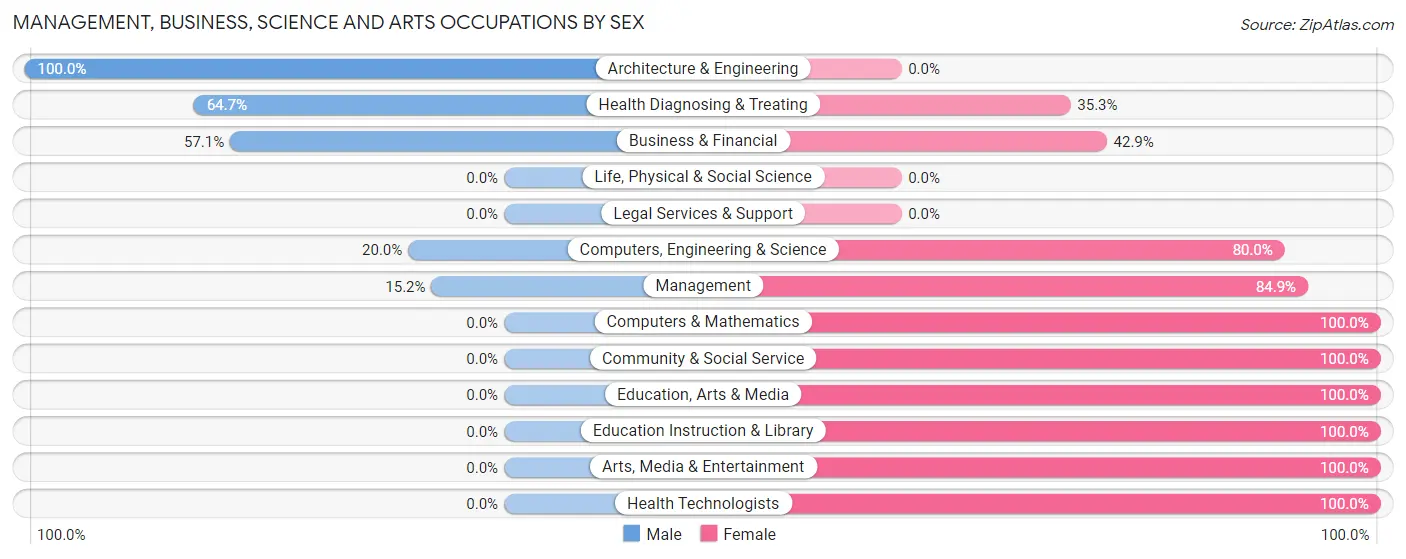
Management, Business, Science and Arts Occupations by Sex
Within the Management, Business, Science and Arts occupations in Little Valley, the most male-oriented occupations are Architecture & Engineering (100.0%), Health Diagnosing & Treating (64.7%), and Business & Financial (57.1%), while the most female-oriented occupations are Computers & Mathematics (100.0%), Community & Social Service (100.0%), and Education, Arts & Media (100.0%).
| Occupation | Male | Female |
| Management | 5 (15.1%) | 28 (84.9%) |
| Business & Financial | 4 (57.1%) | 3 (42.9%) |
| Computers, Engineering & Science | 3 (20.0%) | 12 (80.0%) |
| Computers & Mathematics | 0 (0.0%) | 12 (100.0%) |
| Architecture & Engineering | 3 (100.0%) | 0 (0.0%) |
| Life, Physical & Social Science | 0 (0.0%) | 0 (0.0%) |
| Community & Social Service | 0 (0.0%) | 21 (100.0%) |
| Education, Arts & Media | 0 (0.0%) | 10 (100.0%) |
| Legal Services & Support | 0 (0.0%) | 0 (0.0%) |
| Education Instruction & Library | 0 (0.0%) | 9 (100.0%) |
| Arts, Media & Entertainment | 0 (0.0%) | 2 (100.0%) |
| Health Diagnosing & Treating | 11 (64.7%) | 6 (35.3%) |
| Health Technologists | 0 (0.0%) | 3 (100.0%) |
| Total (Category) | 23 (24.7%) | 70 (75.3%) |
| Total (Overall) | 158 (45.9%) | 186 (54.1%) |
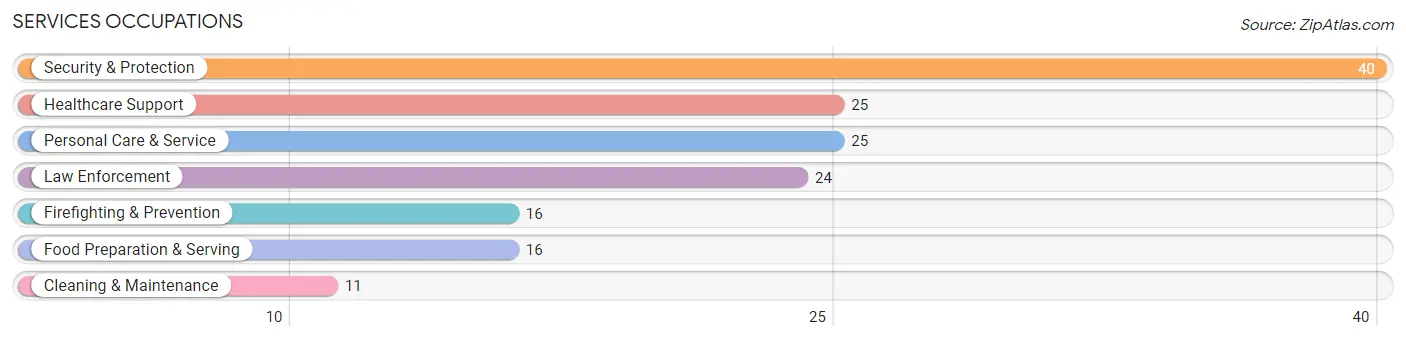
Services Occupations
The most common Services occupations in Little Valley are Security & Protection (40 | 11.6%), Healthcare Support (25 | 7.3%), Personal Care & Service (25 | 7.3%), Law Enforcement (24 | 7.0%), and Firefighting & Prevention (16 | 4.6%).
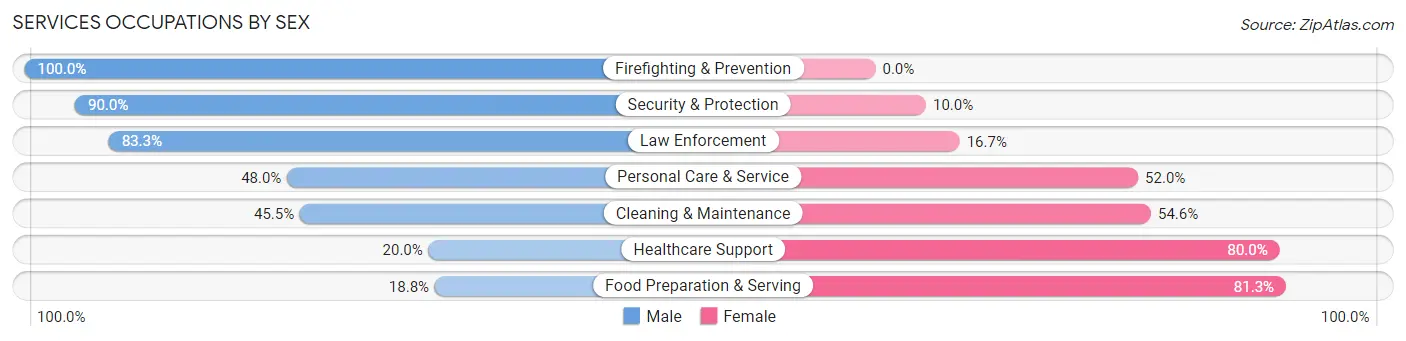
Services Occupations by Sex
Within the Services occupations in Little Valley, the most male-oriented occupations are Firefighting & Prevention (100.0%), Security & Protection (90.0%), and Law Enforcement (83.3%), while the most female-oriented occupations are Food Preparation & Serving (81.2%), Healthcare Support (80.0%), and Cleaning & Maintenance (54.5%).
| Occupation | Male | Female |
| Healthcare Support | 5 (20.0%) | 20 (80.0%) |
| Security & Protection | 36 (90.0%) | 4 (10.0%) |
| Firefighting & Prevention | 16 (100.0%) | 0 (0.0%) |
| Law Enforcement | 20 (83.3%) | 4 (16.7%) |
| Food Preparation & Serving | 3 (18.8%) | 13 (81.2%) |
| Cleaning & Maintenance | 5 (45.5%) | 6 (54.5%) |
| Personal Care & Service | 12 (48.0%) | 13 (52.0%) |
| Total (Category) | 61 (52.1%) | 56 (47.9%) |
| Total (Overall) | 158 (45.9%) | 186 (54.1%) |
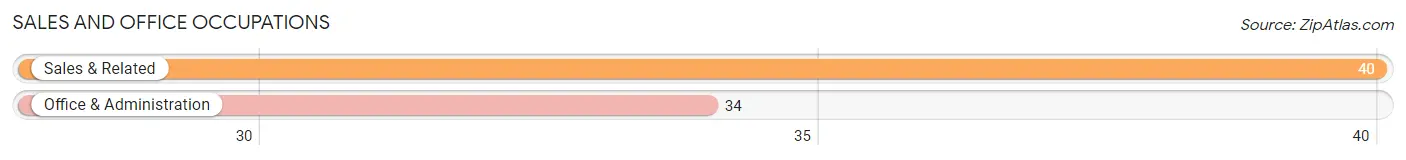
Sales and Office Occupations
The most common Sales and Office occupations in Little Valley are Sales & Related (40 | 11.6%), and Office & Administration (34 | 9.9%).
Sales and Office Occupations by Sex
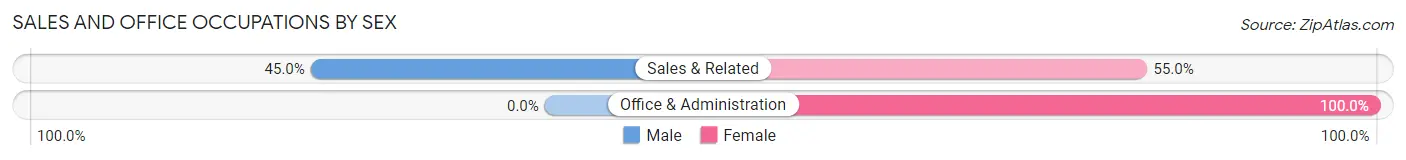
| Occupation | Male | Female |
| Sales & Related | 18 (45.0%) | 22 (55.0%) |
| Office & Administration | 0 (0.0%) | 34 (100.0%) |
| Total (Category) | 18 (24.3%) | 56 (75.7%) |
| Total (Overall) | 158 (45.9%) | 186 (54.1%) |
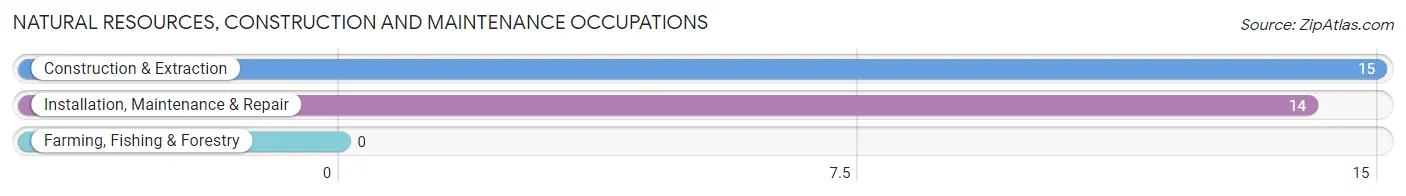
Natural Resources, Construction and Maintenance Occupations
The most common Natural Resources, Construction and Maintenance occupations in Little Valley are Construction & Extraction (15 | 4.4%), and Installation, Maintenance & Repair (14 | 4.1%).
Natural Resources, Construction and Maintenance Occupations by Sex
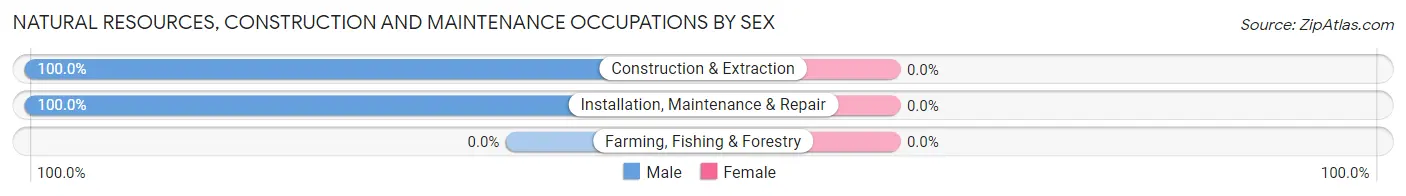
| Occupation | Male | Female |
| Farming, Fishing & Forestry | 0 (0.0%) | 0 (0.0%) |
| Construction & Extraction | 15 (100.0%) | 0 (0.0%) |
| Installation, Maintenance & Repair | 14 (100.0%) | 0 (0.0%) |
| Total (Category) | 29 (100.0%) | 0 (0.0%) |
| Total (Overall) | 158 (45.9%) | 186 (54.1%) |
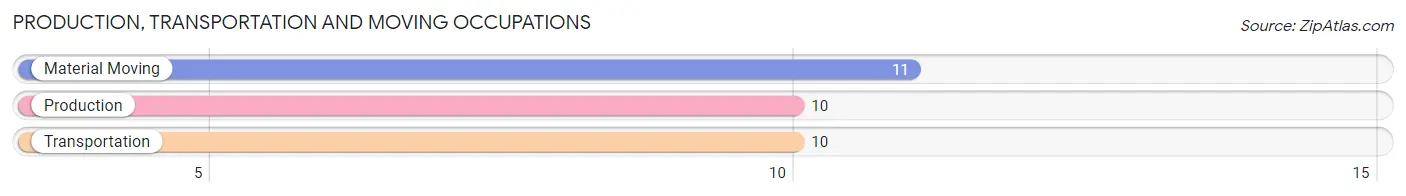
Production, Transportation and Moving Occupations
The most common Production, Transportation and Moving occupations in Little Valley are Material Moving (11 | 3.2%), Production (10 | 2.9%), and Transportation (10 | 2.9%).
Production, Transportation and Moving Occupations by Sex
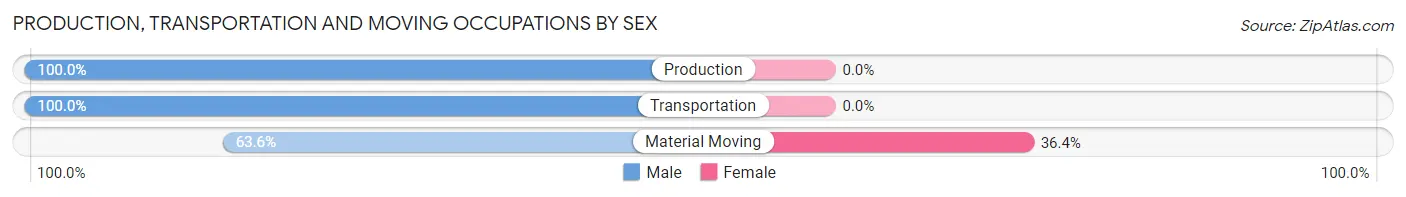
| Occupation | Male | Female |
| Production | 10 (100.0%) | 0 (0.0%) |
| Transportation | 10 (100.0%) | 0 (0.0%) |
| Material Moving | 7 (63.6%) | 4 (36.4%) |
| Total (Category) | 27 (87.1%) | 4 (12.9%) |
| Total (Overall) | 158 (45.9%) | 186 (54.1%) |
Employment Industries by Sex in Little Valley
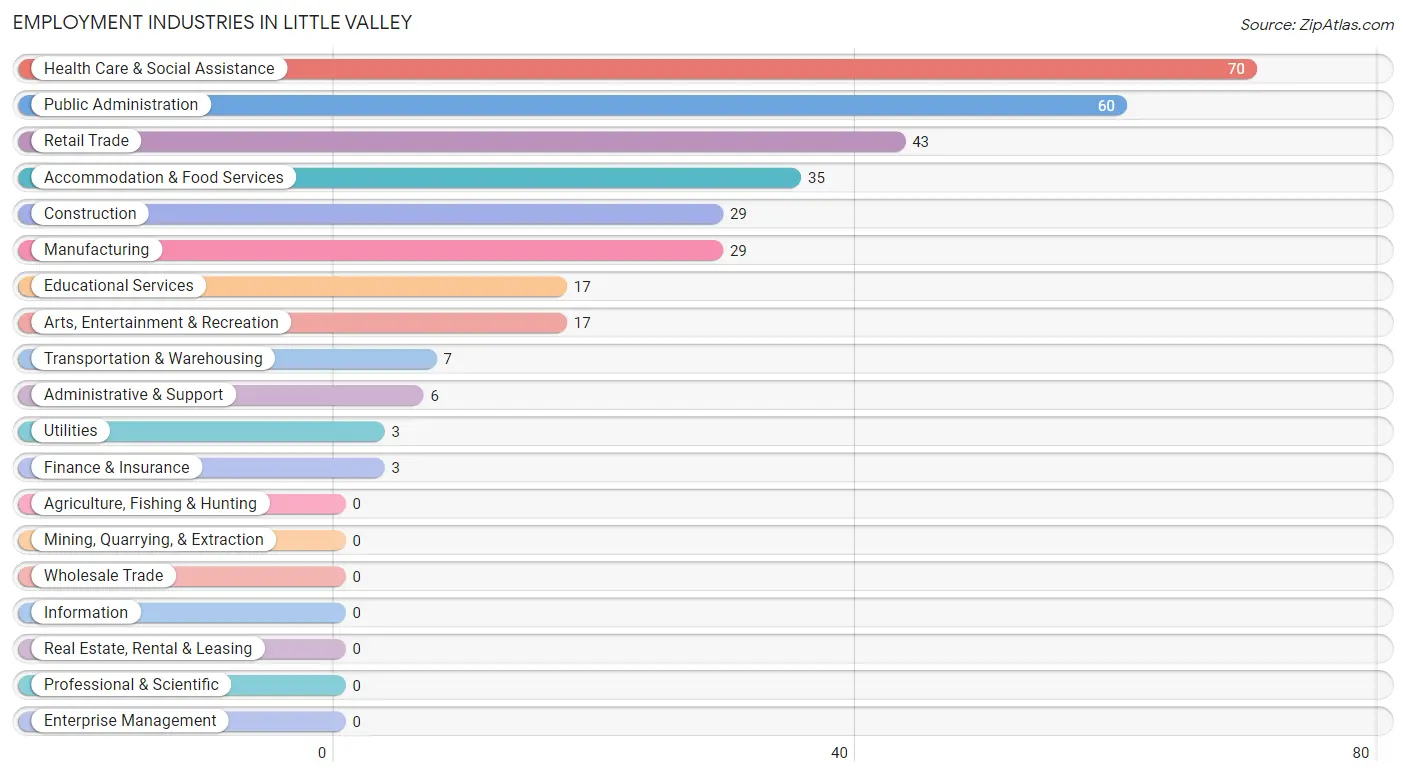
Employment Industries in Little Valley
The major employment industries in Little Valley include Health Care & Social Assistance (70 | 20.3%), Public Administration (60 | 17.4%), Retail Trade (43 | 12.5%), Accommodation & Food Services (35 | 10.2%), and Construction (29 | 8.4%).
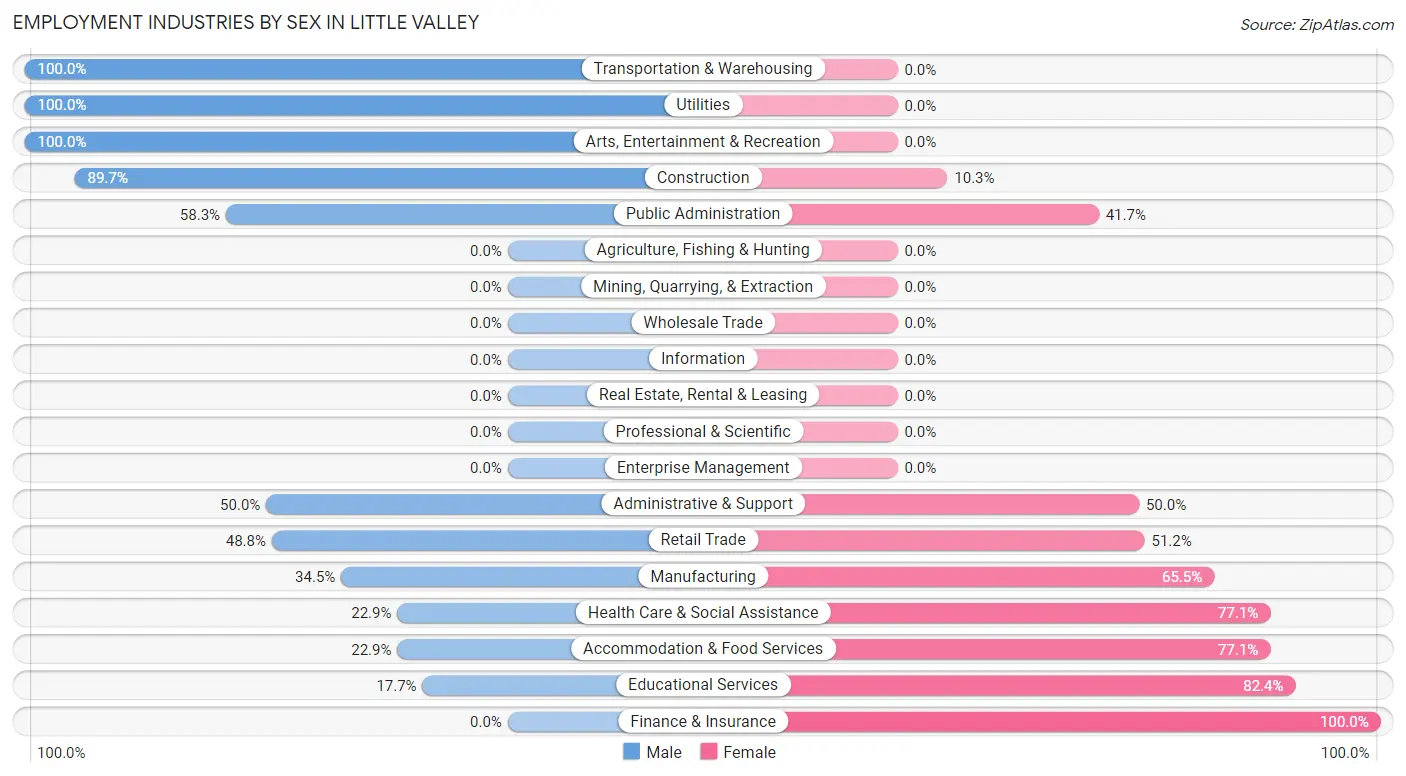
Employment Industries by Sex in Little Valley
The Little Valley industries that see more men than women are Transportation & Warehousing (100.0%), Utilities (100.0%), and Arts, Entertainment & Recreation (100.0%), whereas the industries that tend to have a higher number of women are Finance & Insurance (100.0%), Educational Services (82.4%), and Health Care & Social Assistance (77.1%).
| Industry | Male | Female |
| Agriculture, Fishing & Hunting | 0 (0.0%) | 0 (0.0%) |
| Mining, Quarrying, & Extraction | 0 (0.0%) | 0 (0.0%) |
| Construction | 26 (89.7%) | 3 (10.3%) |
| Manufacturing | 10 (34.5%) | 19 (65.5%) |
| Wholesale Trade | 0 (0.0%) | 0 (0.0%) |
| Retail Trade | 21 (48.8%) | 22 (51.2%) |
| Transportation & Warehousing | 7 (100.0%) | 0 (0.0%) |
| Utilities | 3 (100.0%) | 0 (0.0%) |
| Information | 0 (0.0%) | 0 (0.0%) |
| Finance & Insurance | 0 (0.0%) | 3 (100.0%) |
| Real Estate, Rental & Leasing | 0 (0.0%) | 0 (0.0%) |
| Professional & Scientific | 0 (0.0%) | 0 (0.0%) |
| Enterprise Management | 0 (0.0%) | 0 (0.0%) |
| Administrative & Support | 3 (50.0%) | 3 (50.0%) |
| Educational Services | 3 (17.6%) | 14 (82.4%) |
| Health Care & Social Assistance | 16 (22.9%) | 54 (77.1%) |
| Arts, Entertainment & Recreation | 17 (100.0%) | 0 (0.0%) |
| Accommodation & Food Services | 8 (22.9%) | 27 (77.1%) |
| Public Administration | 35 (58.3%) | 25 (41.7%) |
| Total | 158 (45.9%) | 186 (54.1%) |
Education in Little Valley
School Enrollment in Little Valley
The most common levels of schooling among the 160 students in Little Valley are elementary school (44 | 27.5%), high school (42 | 26.3%), and middle school (27 | 16.9%).
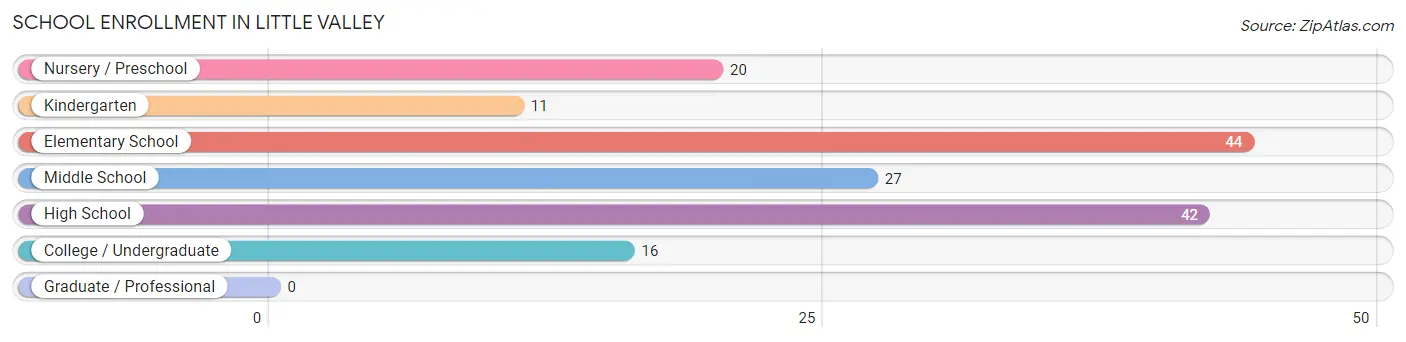
| School Level | # Students | % Students |
| Nursery / Preschool | 20 | 12.5% |
| Kindergarten | 11 | 6.9% |
| Elementary School | 44 | 27.5% |
| Middle School | 27 | 16.9% |
| High School | 42 | 26.3% |
| College / Undergraduate | 16 | 10.0% |
| Graduate / Professional | 0 | 0.0% |
| Total | 160 | 100.0% |
School Enrollment by Age by Funding Source in Little Valley
Out of a total of 160 students who are enrolled in schools in Little Valley, 15 (9.4%) attend a private institution, while the remaining 145 (90.6%) are enrolled in public schools. The age group of 35 years and over has the highest likelihood of being enrolled in private schools, with 6 (100.0% in the age bracket) enrolled. Conversely, the age group of 15 to 17 year olds has the lowest likelihood of being enrolled in a private school, with 21 (100.0% in the age bracket) attending a public institution.
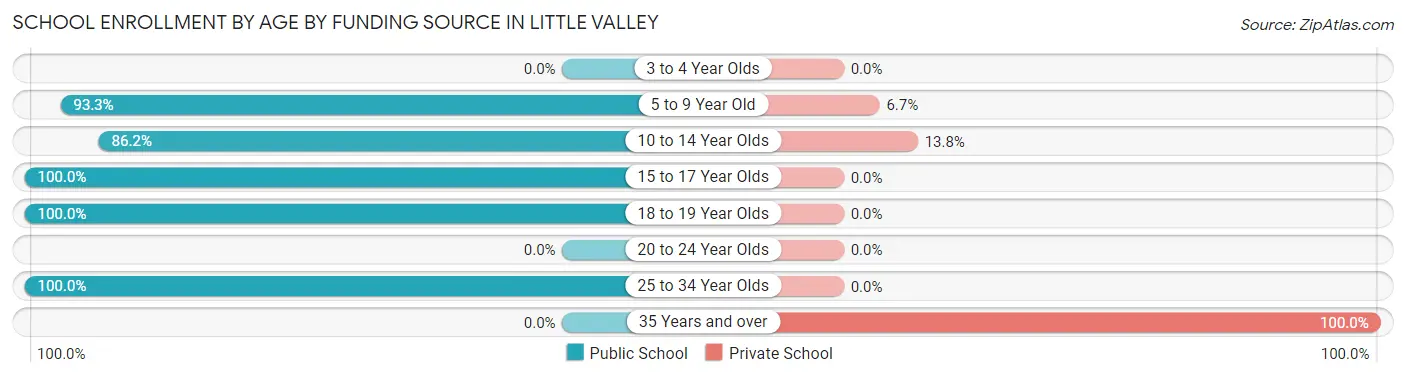
| Age Bracket | Public School | Private School |
| 3 to 4 Year Olds | 0 (0.0%) | 0 (0.0%) |
| 5 to 9 Year Old | 70 (93.3%) | 5 (6.7%) |
| 10 to 14 Year Olds | 25 (86.2%) | 4 (13.8%) |
| 15 to 17 Year Olds | 21 (100.0%) | 0 (0.0%) |
| 18 to 19 Year Olds | 24 (100.0%) | 0 (0.0%) |
| 20 to 24 Year Olds | 0 (0.0%) | 0 (0.0%) |
| 25 to 34 Year Olds | 5 (100.0%) | 0 (0.0%) |
| 35 Years and over | 0 (0.0%) | 6 (100.0%) |
| Total | 145 (90.6%) | 15 (9.4%) |
Educational Attainment by Field of Study in Little Valley
Education (15 | 19.2%), business (14 | 17.9%), physical & health sciences (11 | 14.1%), social sciences (11 | 14.1%), and literature & languages (7 | 9.0%) are the most common fields of study among 78 individuals in Little Valley who have obtained a bachelor's degree or higher.
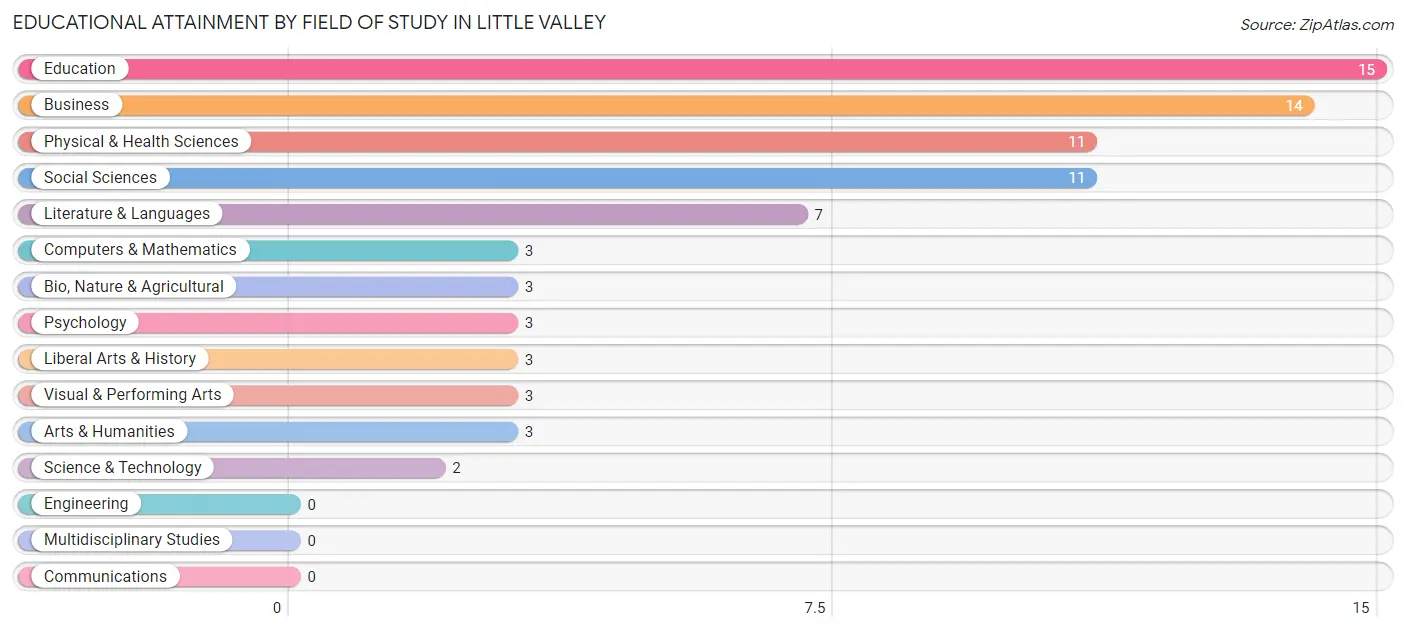
| Field of Study | # Graduates | % Graduates |
| Computers & Mathematics | 3 | 3.8% |
| Bio, Nature & Agricultural | 3 | 3.8% |
| Physical & Health Sciences | 11 | 14.1% |
| Psychology | 3 | 3.8% |
| Social Sciences | 11 | 14.1% |
| Engineering | 0 | 0.0% |
| Multidisciplinary Studies | 0 | 0.0% |
| Science & Technology | 2 | 2.6% |
| Business | 14 | 17.9% |
| Education | 15 | 19.2% |
| Literature & Languages | 7 | 9.0% |
| Liberal Arts & History | 3 | 3.8% |
| Visual & Performing Arts | 3 | 3.8% |
| Communications | 0 | 0.0% |
| Arts & Humanities | 3 | 3.8% |
| Total | 78 | 100.0% |
Transportation & Commute in Little Valley
Vehicle Availability by Sex in Little Valley
The most prevalent vehicle ownership categories in Little Valley are males with 2 vehicles (88, accounting for 56.8%) and females with 2 vehicles (124, making up 48.3%).
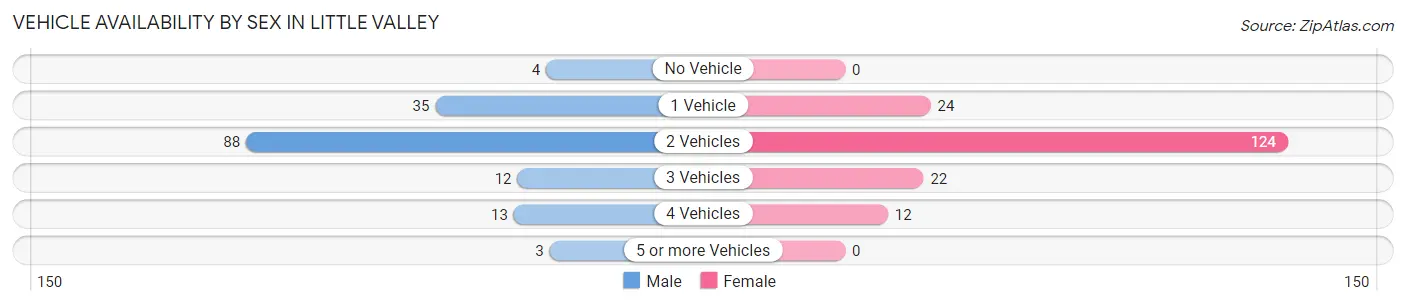
| Vehicles Available | Male | Female |
| No Vehicle | 4 (2.6%) | 0 (0.0%) |
| 1 Vehicle | 35 (22.6%) | 24 (13.2%) |
| 2 Vehicles | 88 (56.8%) | 124 (68.1%) |
| 3 Vehicles | 12 (7.7%) | 22 (12.1%) |
| 4 Vehicles | 13 (8.4%) | 12 (6.6%) |
| 5 or more Vehicles | 3 (1.9%) | 0 (0.0%) |
| Total | 155 (100.0%) | 182 (100.0%) |
Commute Time in Little Valley
The most frequently occuring commute durations in Little Valley are 15 to 19 minutes (75 commuters, 22.7%), less than 5 minutes (47 commuters, 14.2%), and 35 to 39 minutes (46 commuters, 13.9%).
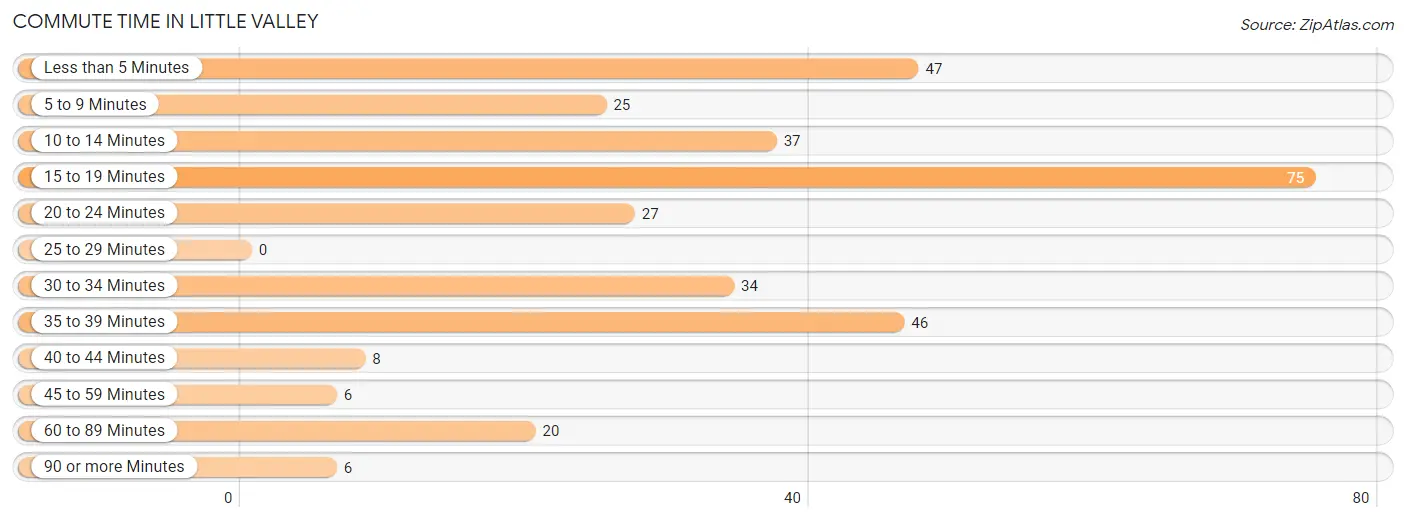
| Commute Time | # Commuters | % Commuters |
| Less than 5 Minutes | 47 | 14.2% |
| 5 to 9 Minutes | 25 | 7.5% |
| 10 to 14 Minutes | 37 | 11.2% |
| 15 to 19 Minutes | 75 | 22.7% |
| 20 to 24 Minutes | 27 | 8.2% |
| 25 to 29 Minutes | 0 | 0.0% |
| 30 to 34 Minutes | 34 | 10.3% |
| 35 to 39 Minutes | 46 | 13.9% |
| 40 to 44 Minutes | 8 | 2.4% |
| 45 to 59 Minutes | 6 | 1.8% |
| 60 to 89 Minutes | 20 | 6.0% |
| 90 or more Minutes | 6 | 1.8% |
Commute Time by Sex in Little Valley
The most common commute times in Little Valley are less than 5 minutes (36 commuters, 23.2%) for males and 15 to 19 minutes (63 commuters, 35.8%) for females.
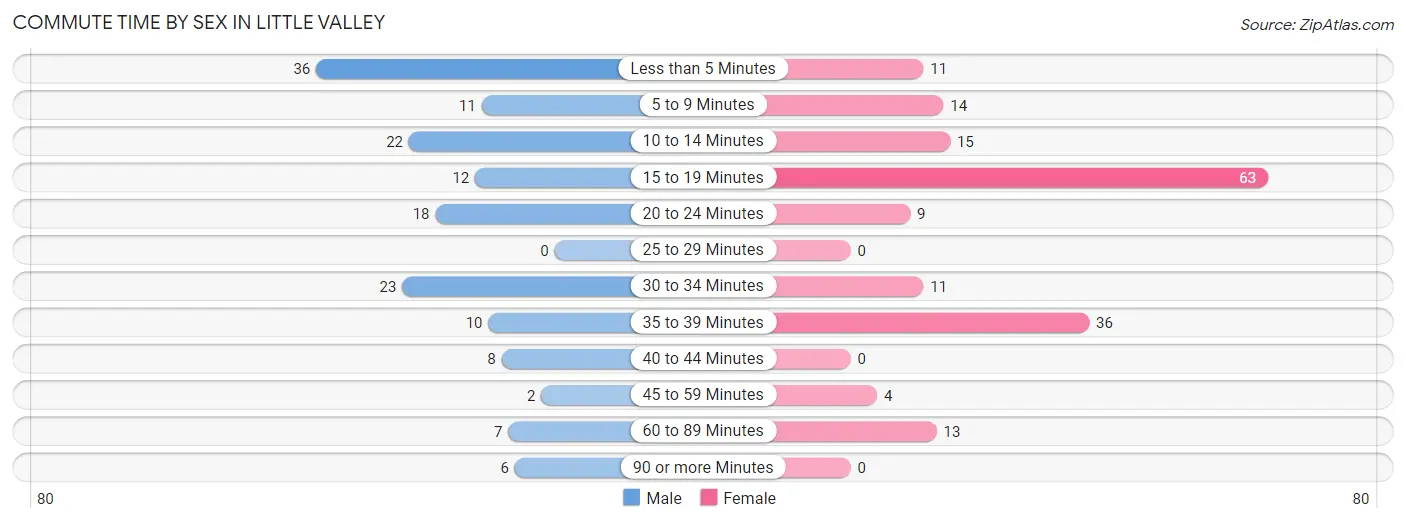
| Commute Time | Male | Female |
| Less than 5 Minutes | 36 (23.2%) | 11 (6.2%) |
| 5 to 9 Minutes | 11 (7.1%) | 14 (8.0%) |
| 10 to 14 Minutes | 22 (14.2%) | 15 (8.5%) |
| 15 to 19 Minutes | 12 (7.7%) | 63 (35.8%) |
| 20 to 24 Minutes | 18 (11.6%) | 9 (5.1%) |
| 25 to 29 Minutes | 0 (0.0%) | 0 (0.0%) |
| 30 to 34 Minutes | 23 (14.8%) | 11 (6.2%) |
| 35 to 39 Minutes | 10 (6.5%) | 36 (20.4%) |
| 40 to 44 Minutes | 8 (5.2%) | 0 (0.0%) |
| 45 to 59 Minutes | 2 (1.3%) | 4 (2.3%) |
| 60 to 89 Minutes | 7 (4.5%) | 13 (7.4%) |
| 90 or more Minutes | 6 (3.9%) | 0 (0.0%) |
Time of Departure to Work by Sex in Little Valley
The most frequent times of departure to work in Little Valley are 4:00 PM to 11:59 PM (30, 19.4%) for males and 7:30 AM to 7:59 AM (36, 20.4%) for females.
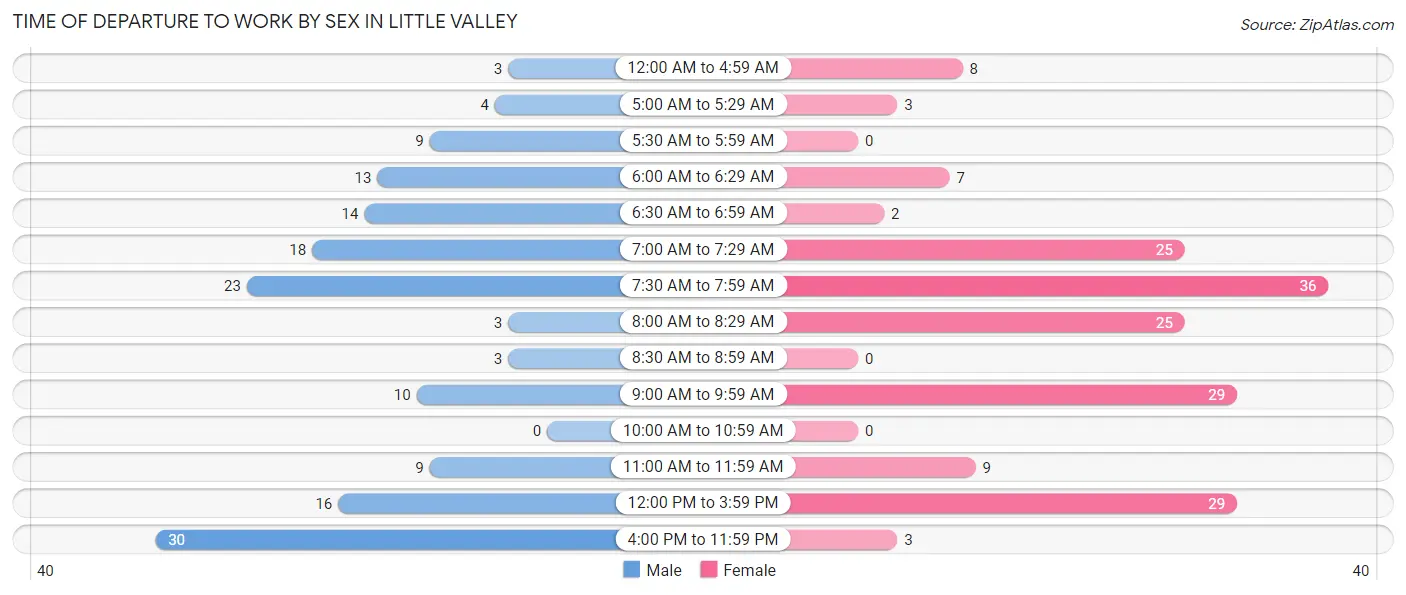
| Time of Departure | Male | Female |
| 12:00 AM to 4:59 AM | 3 (1.9%) | 8 (4.5%) |
| 5:00 AM to 5:29 AM | 4 (2.6%) | 3 (1.7%) |
| 5:30 AM to 5:59 AM | 9 (5.8%) | 0 (0.0%) |
| 6:00 AM to 6:29 AM | 13 (8.4%) | 7 (4.0%) |
| 6:30 AM to 6:59 AM | 14 (9.0%) | 2 (1.1%) |
| 7:00 AM to 7:29 AM | 18 (11.6%) | 25 (14.2%) |
| 7:30 AM to 7:59 AM | 23 (14.8%) | 36 (20.4%) |
| 8:00 AM to 8:29 AM | 3 (1.9%) | 25 (14.2%) |
| 8:30 AM to 8:59 AM | 3 (1.9%) | 0 (0.0%) |
| 9:00 AM to 9:59 AM | 10 (6.5%) | 29 (16.5%) |
| 10:00 AM to 10:59 AM | 0 (0.0%) | 0 (0.0%) |
| 11:00 AM to 11:59 AM | 9 (5.8%) | 9 (5.1%) |
| 12:00 PM to 3:59 PM | 16 (10.3%) | 29 (16.5%) |
| 4:00 PM to 11:59 PM | 30 (19.4%) | 3 (1.7%) |
| Total | 155 (100.0%) | 176 (100.0%) |
Housing Occupancy in Little Valley
Occupancy by Ownership in Little Valley
Of the total 400 dwellings in Little Valley, owner-occupied units account for 235 (58.8%), while renter-occupied units make up 165 (41.2%).
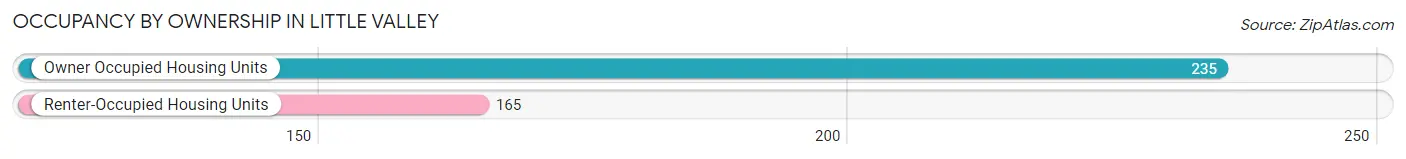
| Occupancy | # Housing Units | % Housing Units |
| Owner Occupied Housing Units | 235 | 58.8% |
| Renter-Occupied Housing Units | 165 | 41.2% |
| Total Occupied Housing Units | 400 | 100.0% |
Occupancy by Household Size in Little Valley
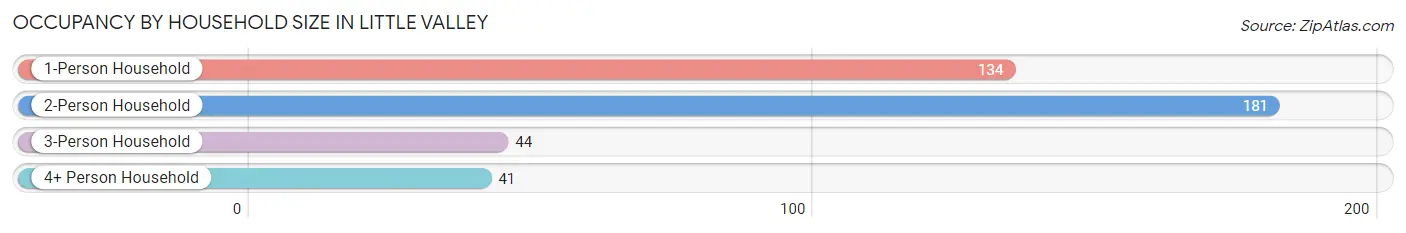
| Household Size | # Housing Units | % Housing Units |
| 1-Person Household | 134 | 33.5% |
| 2-Person Household | 181 | 45.3% |
| 3-Person Household | 44 | 11.0% |
| 4+ Person Household | 41 | 10.2% |
| Total Housing Units | 400 | 100.0% |
Occupancy by Ownership by Household Size in Little Valley
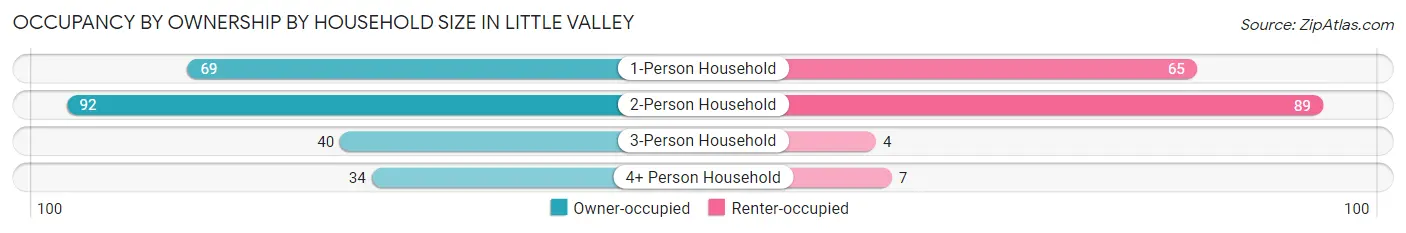
| Household Size | Owner-occupied | Renter-occupied |
| 1-Person Household | 69 (51.5%) | 65 (48.5%) |
| 2-Person Household | 92 (50.8%) | 89 (49.2%) |
| 3-Person Household | 40 (90.9%) | 4 (9.1%) |
| 4+ Person Household | 34 (82.9%) | 7 (17.1%) |
| Total Housing Units | 235 (58.8%) | 165 (41.2%) |
Occupancy by Educational Attainment in Little Valley
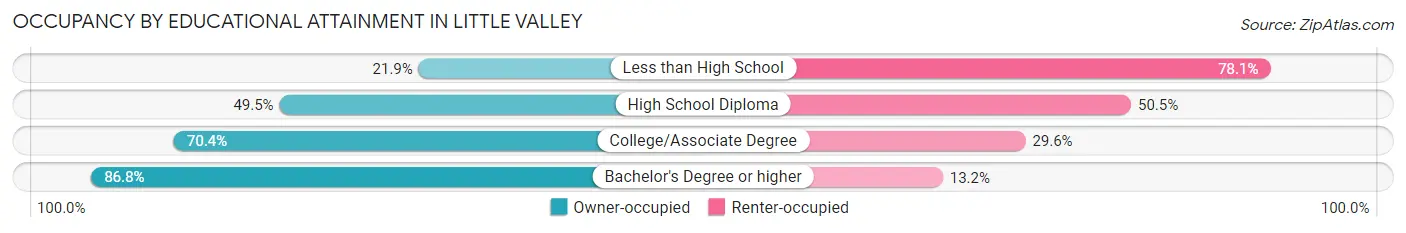
| Household Size | Owner-occupied | Renter-occupied |
| Less than High School | 7 (21.9%) | 25 (78.1%) |
| High School Diploma | 94 (49.5%) | 96 (50.5%) |
| College/Associate Degree | 88 (70.4%) | 37 (29.6%) |
| Bachelor's Degree or higher | 46 (86.8%) | 7 (13.2%) |
Occupancy by Age of Householder in Little Valley
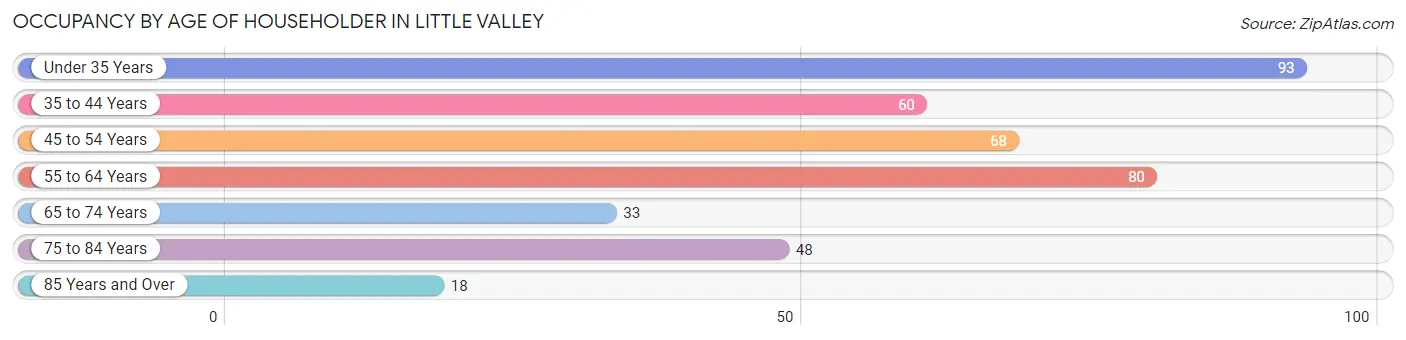
| Age Bracket | # Households | % Households |
| Under 35 Years | 93 | 23.3% |
| 35 to 44 Years | 60 | 15.0% |
| 45 to 54 Years | 68 | 17.0% |
| 55 to 64 Years | 80 | 20.0% |
| 65 to 74 Years | 33 | 8.3% |
| 75 to 84 Years | 48 | 12.0% |
| 85 Years and Over | 18 | 4.5% |
| Total | 400 | 100.0% |
Housing Finances in Little Valley
Median Income by Occupancy in Little Valley
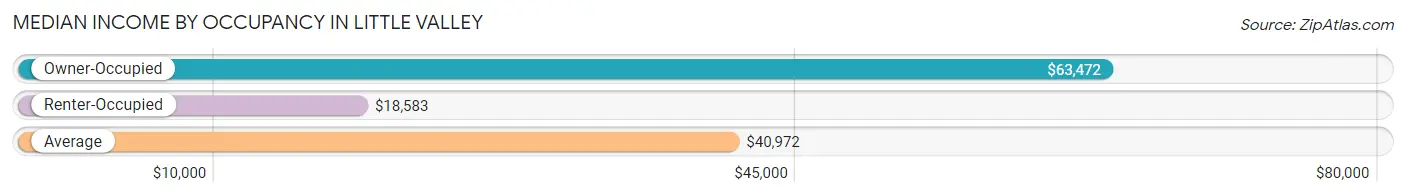
| Occupancy Type | # Households | Median Income |
| Owner-Occupied | 235 (58.8%) | $63,472 |
| Renter-Occupied | 165 (41.2%) | $18,583 |
| Average | 400 (100.0%) | $40,972 |
Occupancy by Householder Income Bracket in Little Valley
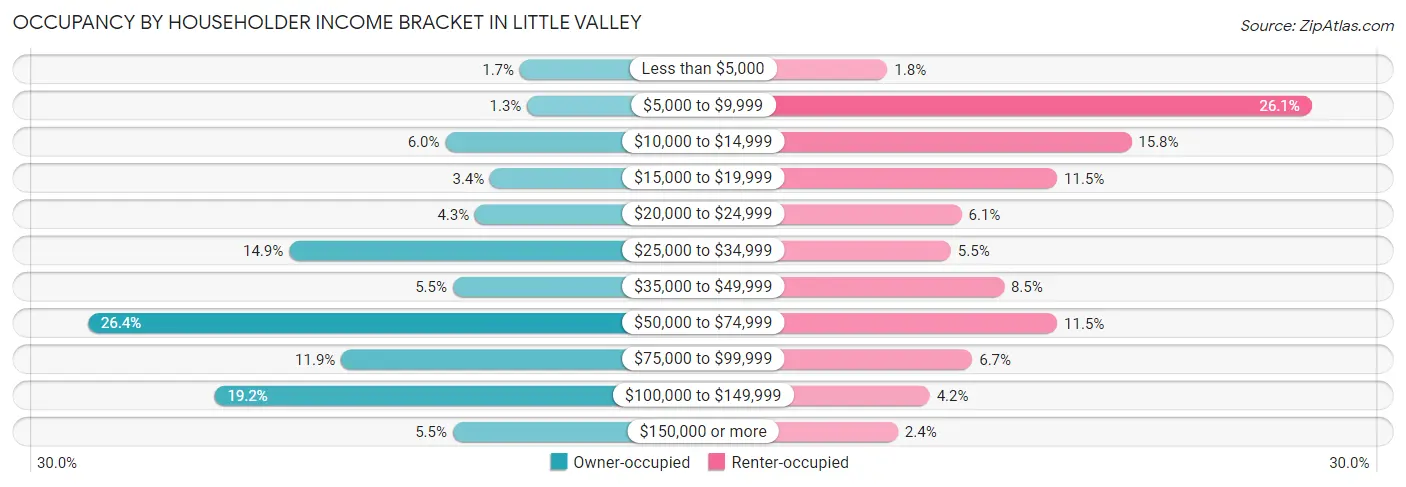
| Income Bracket | Owner-occupied | Renter-occupied |
| Less than $5,000 | 4 (1.7%) | 3 (1.8%) |
| $5,000 to $9,999 | 3 (1.3%) | 43 (26.1%) |
| $10,000 to $14,999 | 14 (6.0%) | 26 (15.8%) |
| $15,000 to $19,999 | 8 (3.4%) | 19 (11.5%) |
| $20,000 to $24,999 | 10 (4.3%) | 10 (6.1%) |
| $25,000 to $34,999 | 35 (14.9%) | 9 (5.4%) |
| $35,000 to $49,999 | 13 (5.5%) | 14 (8.5%) |
| $50,000 to $74,999 | 62 (26.4%) | 19 (11.5%) |
| $75,000 to $99,999 | 28 (11.9%) | 11 (6.7%) |
| $100,000 to $149,999 | 45 (19.2%) | 7 (4.2%) |
| $150,000 or more | 13 (5.5%) | 4 (2.4%) |
| Total | 235 (100.0%) | 165 (100.0%) |
Monthly Housing Cost Tiers in Little Valley
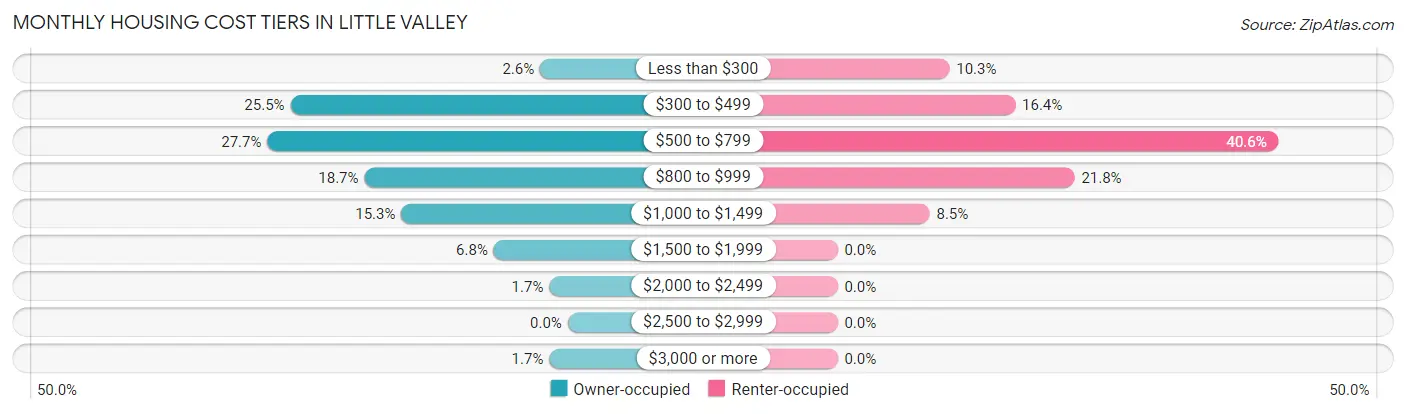
| Monthly Cost | Owner-occupied | Renter-occupied |
| Less than $300 | 6 (2.5%) | 17 (10.3%) |
| $300 to $499 | 60 (25.5%) | 27 (16.4%) |
| $500 to $799 | 65 (27.7%) | 67 (40.6%) |
| $800 to $999 | 44 (18.7%) | 36 (21.8%) |
| $1,000 to $1,499 | 36 (15.3%) | 14 (8.5%) |
| $1,500 to $1,999 | 16 (6.8%) | 0 (0.0%) |
| $2,000 to $2,499 | 4 (1.7%) | 0 (0.0%) |
| $2,500 to $2,999 | 0 (0.0%) | 0 (0.0%) |
| $3,000 or more | 4 (1.7%) | 0 (0.0%) |
| Total | 235 (100.0%) | 165 (100.0%) |
Physical Housing Characteristics in Little Valley
Housing Structures in Little Valley
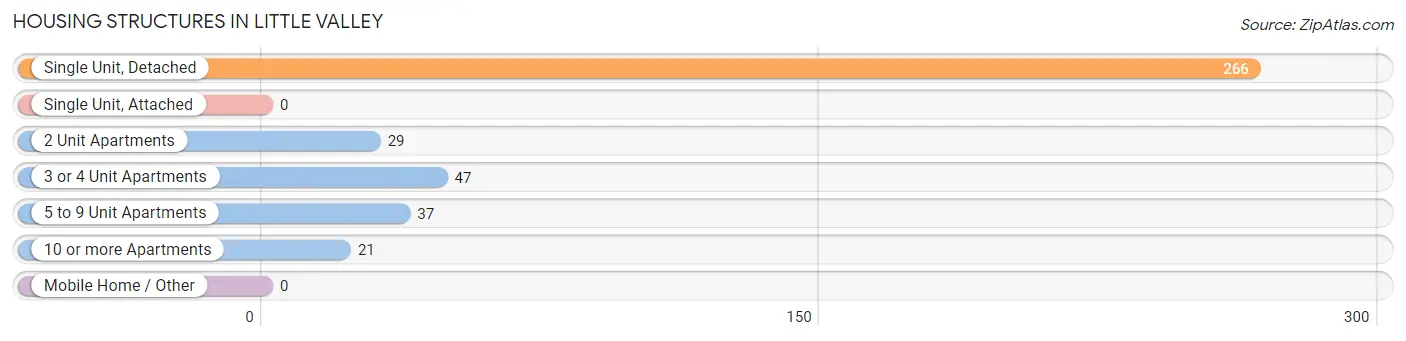
| Structure Type | # Housing Units | % Housing Units |
| Single Unit, Detached | 266 | 66.5% |
| Single Unit, Attached | 0 | 0.0% |
| 2 Unit Apartments | 29 | 7.2% |
| 3 or 4 Unit Apartments | 47 | 11.7% |
| 5 to 9 Unit Apartments | 37 | 9.2% |
| 10 or more Apartments | 21 | 5.2% |
| Mobile Home / Other | 0 | 0.0% |
| Total | 400 | 100.0% |
Housing Structures by Occupancy in Little Valley
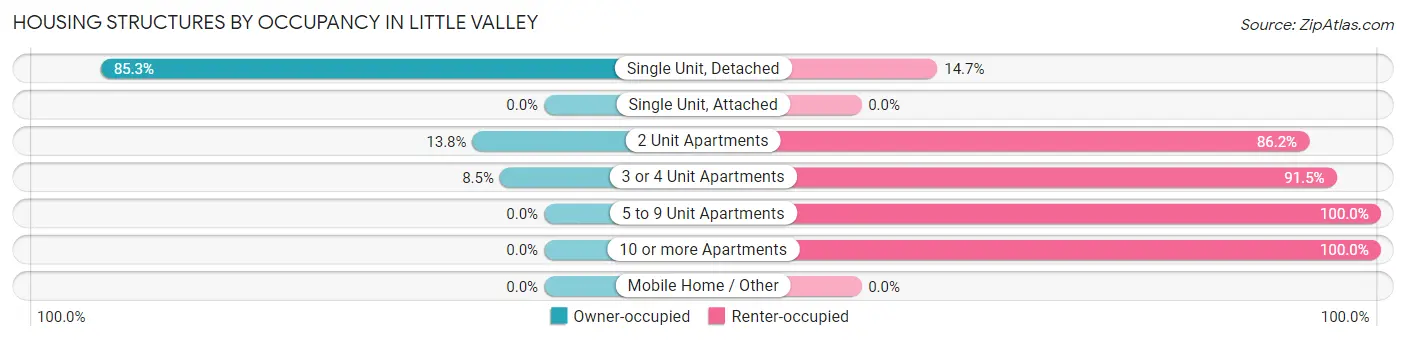
| Structure Type | Owner-occupied | Renter-occupied |
| Single Unit, Detached | 227 (85.3%) | 39 (14.7%) |
| Single Unit, Attached | 0 (0.0%) | 0 (0.0%) |
| 2 Unit Apartments | 4 (13.8%) | 25 (86.2%) |
| 3 or 4 Unit Apartments | 4 (8.5%) | 43 (91.5%) |
| 5 to 9 Unit Apartments | 0 (0.0%) | 37 (100.0%) |
| 10 or more Apartments | 0 (0.0%) | 21 (100.0%) |
| Mobile Home / Other | 0 (0.0%) | 0 (0.0%) |
| Total | 235 (58.8%) | 165 (41.2%) |
Housing Structures by Number of Rooms in Little Valley
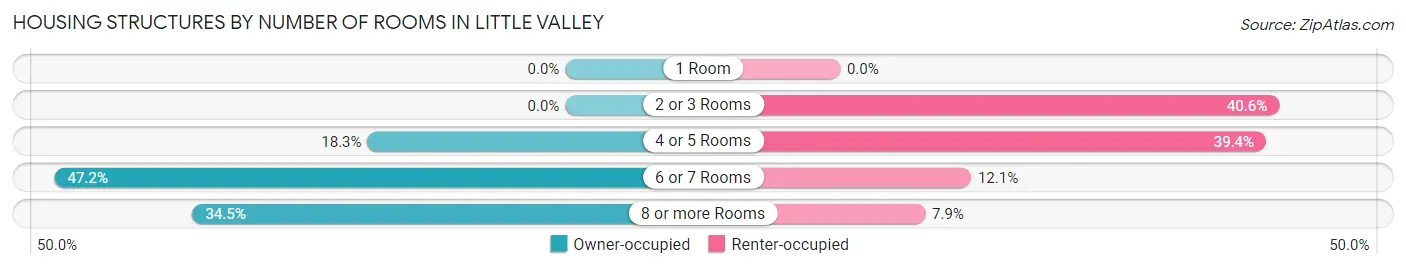
| Number of Rooms | Owner-occupied | Renter-occupied |
| 1 Room | 0 (0.0%) | 0 (0.0%) |
| 2 or 3 Rooms | 0 (0.0%) | 67 (40.6%) |
| 4 or 5 Rooms | 43 (18.3%) | 65 (39.4%) |
| 6 or 7 Rooms | 111 (47.2%) | 20 (12.1%) |
| 8 or more Rooms | 81 (34.5%) | 13 (7.9%) |
| Total | 235 (100.0%) | 165 (100.0%) |
Housing Structure by Heating Type in Little Valley
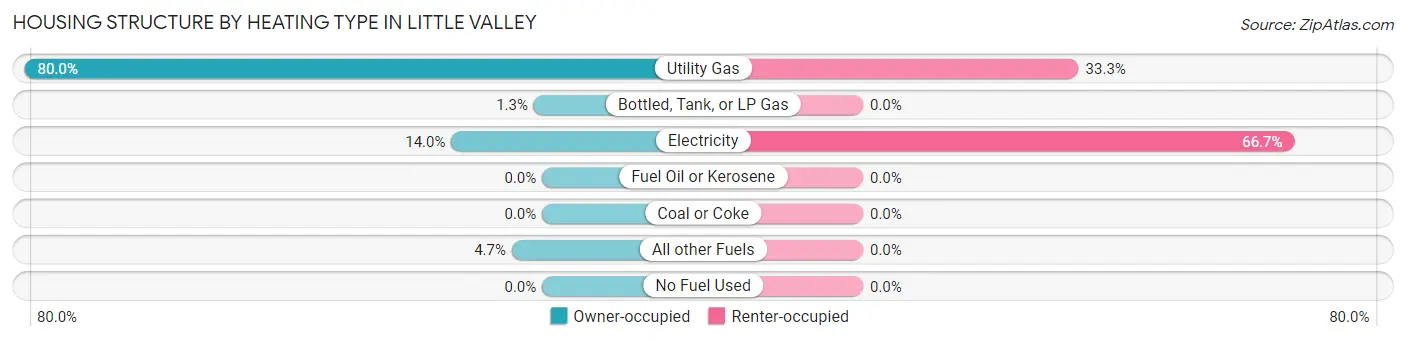
| Heating Type | Owner-occupied | Renter-occupied |
| Utility Gas | 188 (80.0%) | 55 (33.3%) |
| Bottled, Tank, or LP Gas | 3 (1.3%) | 0 (0.0%) |
| Electricity | 33 (14.0%) | 110 (66.7%) |
| Fuel Oil or Kerosene | 0 (0.0%) | 0 (0.0%) |
| Coal or Coke | 0 (0.0%) | 0 (0.0%) |
| All other Fuels | 11 (4.7%) | 0 (0.0%) |
| No Fuel Used | 0 (0.0%) | 0 (0.0%) |
| Total | 235 (100.0%) | 165 (100.0%) |
Household Vehicle Usage in Little Valley
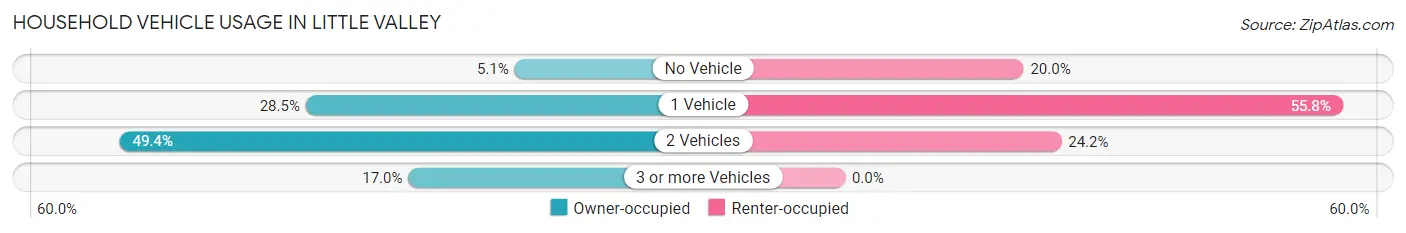
| Vehicles per Household | Owner-occupied | Renter-occupied |
| No Vehicle | 12 (5.1%) | 33 (20.0%) |
| 1 Vehicle | 67 (28.5%) | 92 (55.8%) |
| 2 Vehicles | 116 (49.4%) | 40 (24.2%) |
| 3 or more Vehicles | 40 (17.0%) | 0 (0.0%) |
| Total | 235 (100.0%) | 165 (100.0%) |
Real Estate & Mortgages in Little Valley
Real Estate and Mortgage Overview in Little Valley
| Characteristic | Without Mortgage | With Mortgage |
| Housing Units | 139 | 96 |
| Median Property Value | $71,200 | $93,800 |
| Median Household Income | $50,417 | $9 |
| Monthly Housing Costs | $527 | $4 |
| Real Estate Taxes | $2,678 | $0 |
Property Value by Mortgage Status in Little Valley
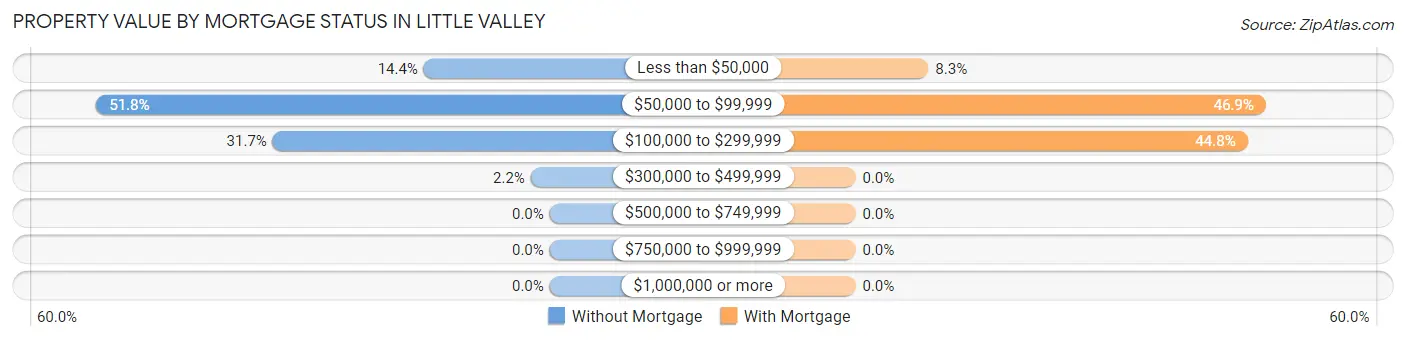
| Property Value | Without Mortgage | With Mortgage |
| Less than $50,000 | 20 (14.4%) | 8 (8.3%) |
| $50,000 to $99,999 | 72 (51.8%) | 45 (46.9%) |
| $100,000 to $299,999 | 44 (31.7%) | 43 (44.8%) |
| $300,000 to $499,999 | 3 (2.2%) | 0 (0.0%) |
| $500,000 to $749,999 | 0 (0.0%) | 0 (0.0%) |
| $750,000 to $999,999 | 0 (0.0%) | 0 (0.0%) |
| $1,000,000 or more | 0 (0.0%) | 0 (0.0%) |
| Total | 139 (100.0%) | 96 (100.0%) |
Household Income by Mortgage Status in Little Valley
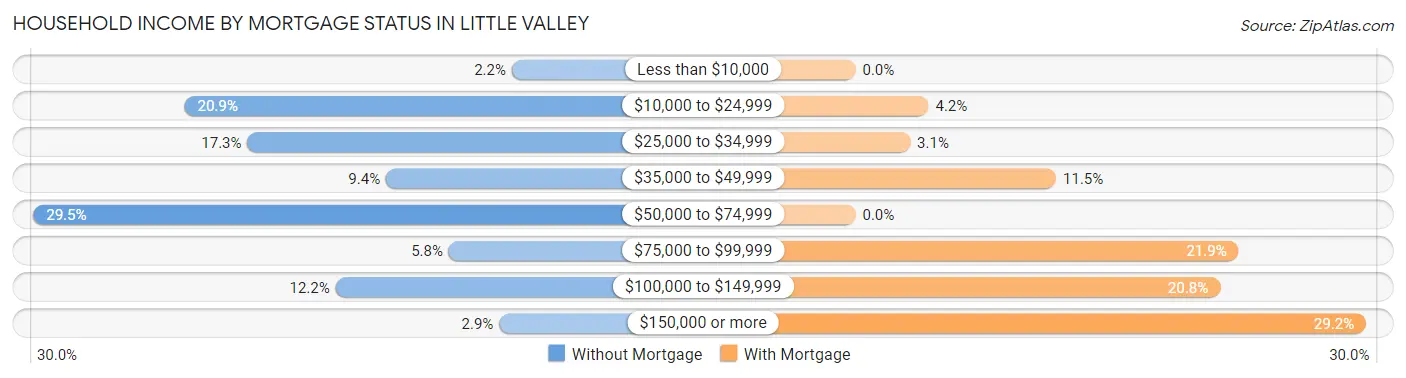
| Household Income | Without Mortgage | With Mortgage |
| Less than $10,000 | 3 (2.2%) | 0 (0.0%) |
| $10,000 to $24,999 | 29 (20.9%) | 4 (4.2%) |
| $25,000 to $34,999 | 24 (17.3%) | 3 (3.1%) |
| $35,000 to $49,999 | 13 (9.3%) | 11 (11.5%) |
| $50,000 to $74,999 | 41 (29.5%) | 0 (0.0%) |
| $75,000 to $99,999 | 8 (5.8%) | 21 (21.9%) |
| $100,000 to $149,999 | 17 (12.2%) | 20 (20.8%) |
| $150,000 or more | 4 (2.9%) | 28 (29.2%) |
| Total | 139 (100.0%) | 96 (100.0%) |
Property Value to Household Income Ratio in Little Valley
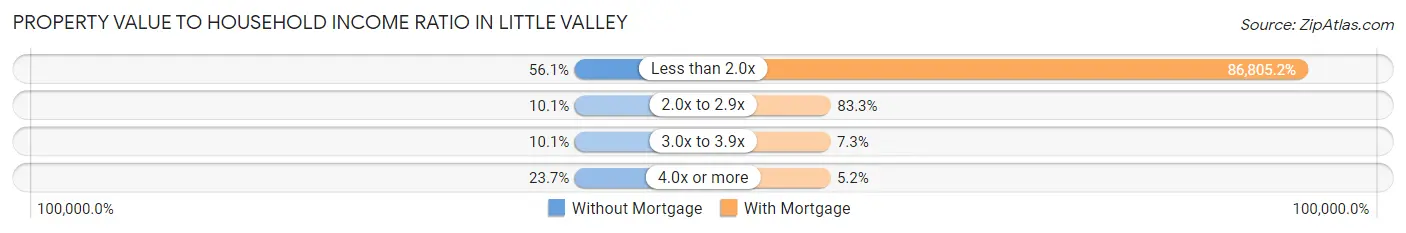
| Value-to-Income Ratio | Without Mortgage | With Mortgage |
| Less than 2.0x | 78 (56.1%) | 83,333 (86,805.2%) |
| 2.0x to 2.9x | 14 (10.1%) | 80 (83.3%) |
| 3.0x to 3.9x | 14 (10.1%) | 7 (7.3%) |
| 4.0x or more | 33 (23.7%) | 5 (5.2%) |
| Total | 139 (100.0%) | 96 (100.0%) |
Real Estate Taxes by Mortgage Status in Little Valley
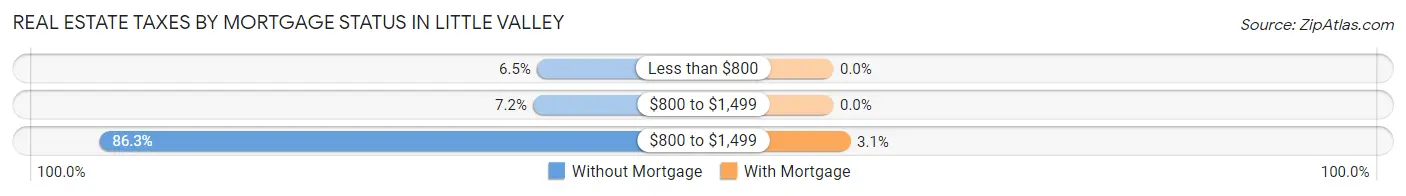
| Property Taxes | Without Mortgage | With Mortgage |
| Less than $800 | 9 (6.5%) | 0 (0.0%) |
| $800 to $1,499 | 10 (7.2%) | 0 (0.0%) |
| $800 to $1,499 | 120 (86.3%) | 3 (3.1%) |
| Total | 139 (100.0%) | 96 (100.0%) |
Health & Disability in Little Valley
Health Insurance Coverage by Age in Little Valley
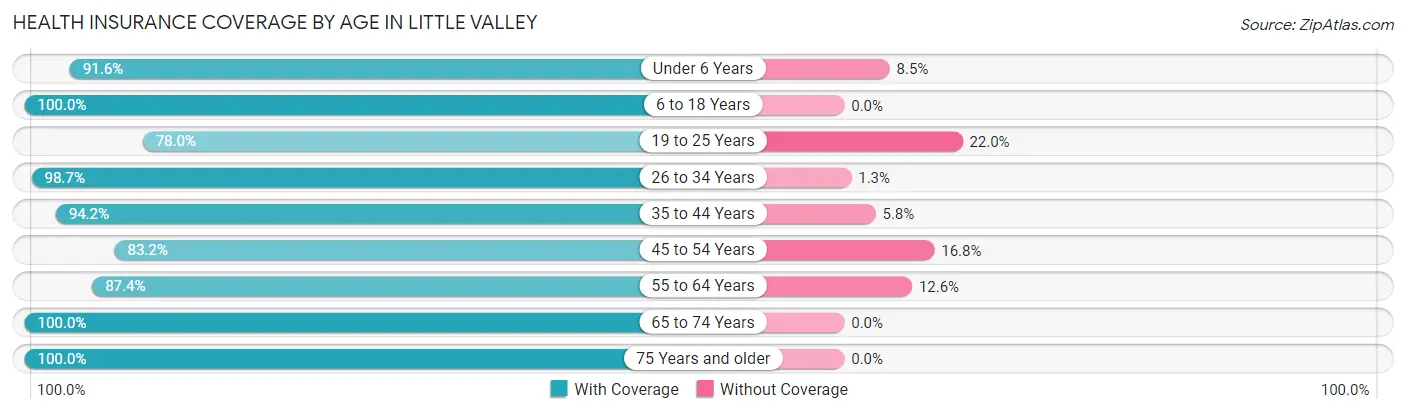
| Age Bracket | With Coverage | Without Coverage |
| Under 6 Years | 65 (91.5%) | 6 (8.5%) |
| 6 to 18 Years | 116 (100.0%) | 0 (0.0%) |
| 19 to 25 Years | 46 (78.0%) | 13 (22.0%) |
| 26 to 34 Years | 152 (98.7%) | 2 (1.3%) |
| 35 to 44 Years | 97 (94.2%) | 6 (5.8%) |
| 45 to 54 Years | 109 (83.2%) | 22 (16.8%) |
| 55 to 64 Years | 90 (87.4%) | 13 (12.6%) |
| 65 to 74 Years | 65 (100.0%) | 0 (0.0%) |
| 75 Years and older | 103 (100.0%) | 0 (0.0%) |
| Total | 843 (93.1%) | 62 (6.9%) |
Health Insurance Coverage by Citizenship Status in Little Valley
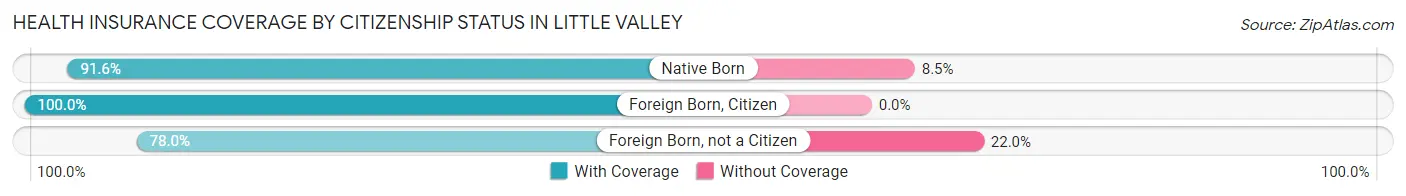
| Citizenship Status | With Coverage | Without Coverage |
| Native Born | 65 (91.5%) | 6 (8.5%) |
| Foreign Born, Citizen | 116 (100.0%) | 0 (0.0%) |
| Foreign Born, not a Citizen | 46 (78.0%) | 13 (22.0%) |
Health Insurance Coverage by Household Income in Little Valley
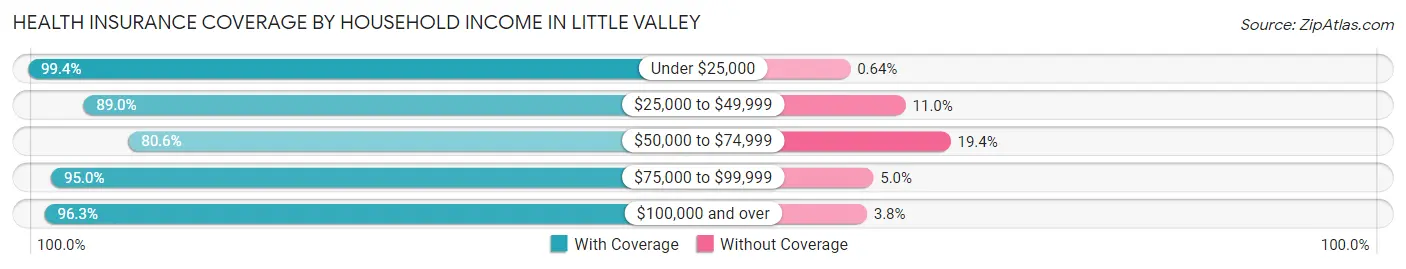
| Household Income | With Coverage | Without Coverage |
| Under $25,000 | 312 (99.4%) | 2 (0.6%) |
| $25,000 to $49,999 | 105 (89.0%) | 13 (11.0%) |
| $50,000 to $74,999 | 145 (80.6%) | 35 (19.4%) |
| $75,000 to $99,999 | 115 (95.0%) | 6 (5.0%) |
| $100,000 and over | 154 (96.3%) | 6 (3.7%) |
Public vs Private Health Insurance Coverage by Age in Little Valley
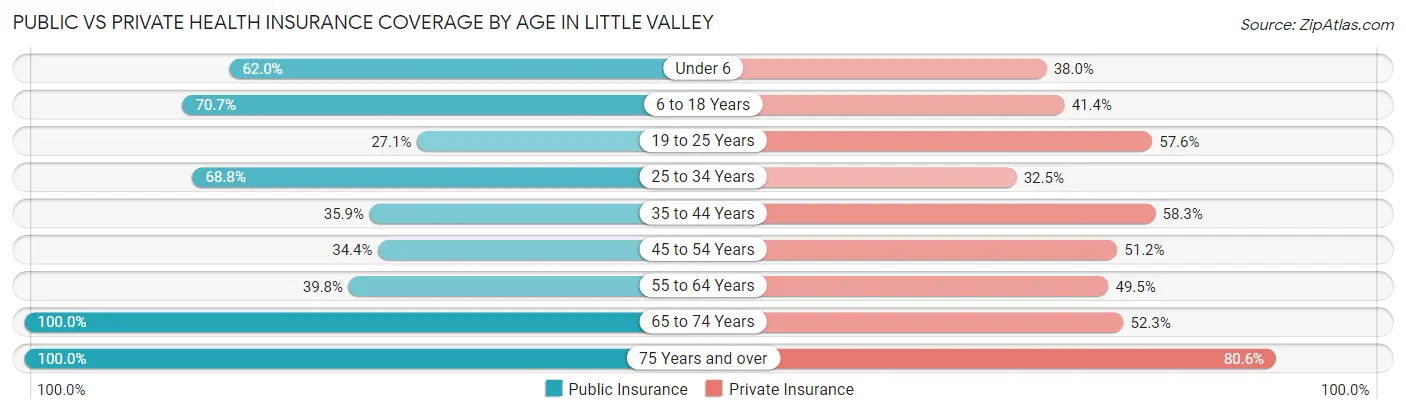
| Age Bracket | Public Insurance | Private Insurance |
| Under 6 | 44 (62.0%) | 27 (38.0%) |
| 6 to 18 Years | 82 (70.7%) | 48 (41.4%) |
| 19 to 25 Years | 16 (27.1%) | 34 (57.6%) |
| 25 to 34 Years | 106 (68.8%) | 50 (32.5%) |
| 35 to 44 Years | 37 (35.9%) | 60 (58.3%) |
| 45 to 54 Years | 45 (34.4%) | 67 (51.1%) |
| 55 to 64 Years | 41 (39.8%) | 51 (49.5%) |
| 65 to 74 Years | 65 (100.0%) | 34 (52.3%) |
| 75 Years and over | 103 (100.0%) | 83 (80.6%) |
| Total | 539 (59.6%) | 454 (50.2%) |
Disability Status by Sex by Age in Little Valley
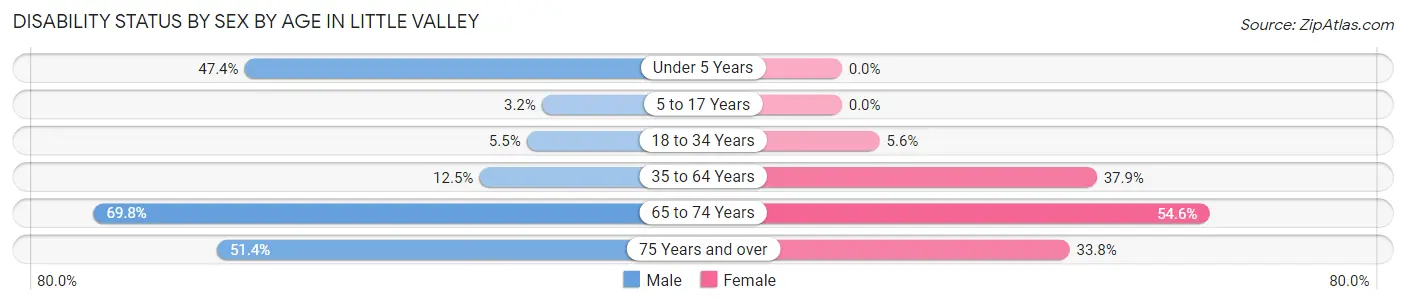
| Age Bracket | Male | Female |
| Under 5 Years | 9 (47.4%) | 0 (0.0%) |
| 5 to 17 Years | 3 (3.2%) | 0 (0.0%) |
| 18 to 34 Years | 7 (5.5%) | 6 (5.6%) |
| 35 to 64 Years | 20 (12.5%) | 67 (37.9%) |
| 65 to 74 Years | 30 (69.8%) | 12 (54.5%) |
| 75 Years and over | 18 (51.4%) | 23 (33.8%) |
Disability Class by Sex by Age in Little Valley
Disability Class: Hearing Difficulty
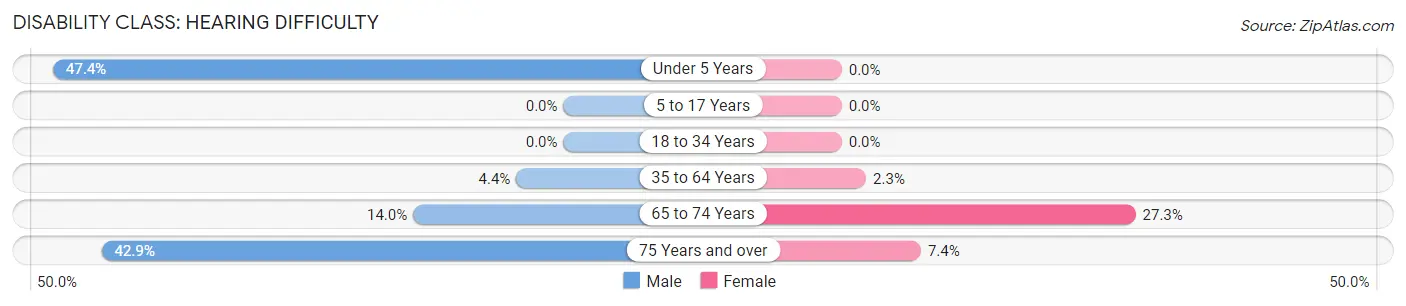
| Age Bracket | Male | Female |
| Under 5 Years | 9 (47.4%) | 0 (0.0%) |
| 5 to 17 Years | 0 (0.0%) | 0 (0.0%) |
| 18 to 34 Years | 0 (0.0%) | 0 (0.0%) |
| 35 to 64 Years | 7 (4.4%) | 4 (2.3%) |
| 65 to 74 Years | 6 (14.0%) | 6 (27.3%) |
| 75 Years and over | 15 (42.9%) | 5 (7.3%) |
Disability Class: Vision Difficulty
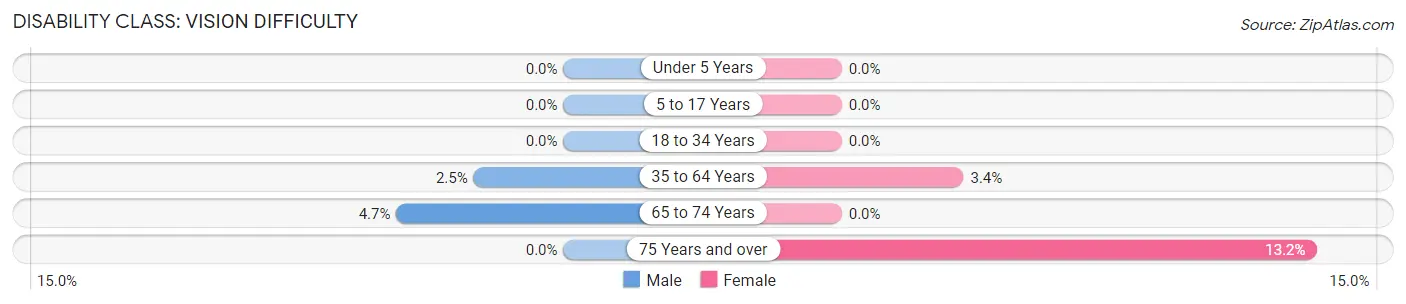
| Age Bracket | Male | Female |
| Under 5 Years | 0 (0.0%) | 0 (0.0%) |
| 5 to 17 Years | 0 (0.0%) | 0 (0.0%) |
| 18 to 34 Years | 0 (0.0%) | 0 (0.0%) |
| 35 to 64 Years | 4 (2.5%) | 6 (3.4%) |
| 65 to 74 Years | 2 (4.6%) | 0 (0.0%) |
| 75 Years and over | 0 (0.0%) | 9 (13.2%) |
Disability Class: Cognitive Difficulty
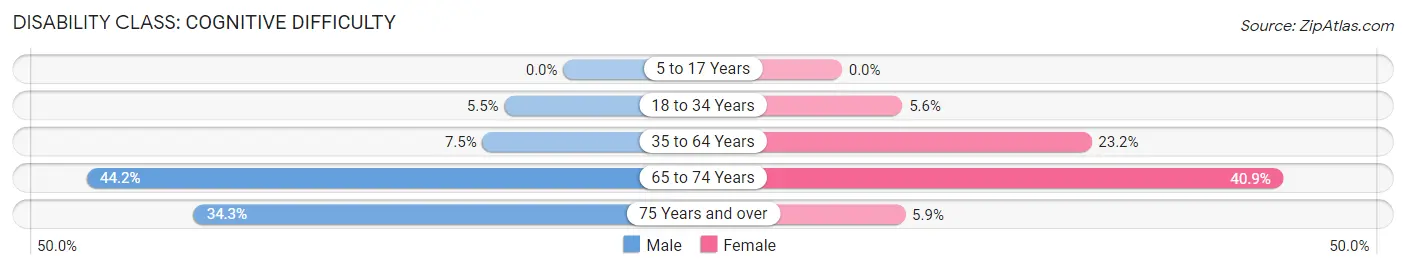
| Age Bracket | Male | Female |
| 5 to 17 Years | 0 (0.0%) | 0 (0.0%) |
| 18 to 34 Years | 7 (5.5%) | 6 (5.6%) |
| 35 to 64 Years | 12 (7.5%) | 41 (23.2%) |
| 65 to 74 Years | 19 (44.2%) | 9 (40.9%) |
| 75 Years and over | 12 (34.3%) | 4 (5.9%) |
Disability Class: Ambulatory Difficulty
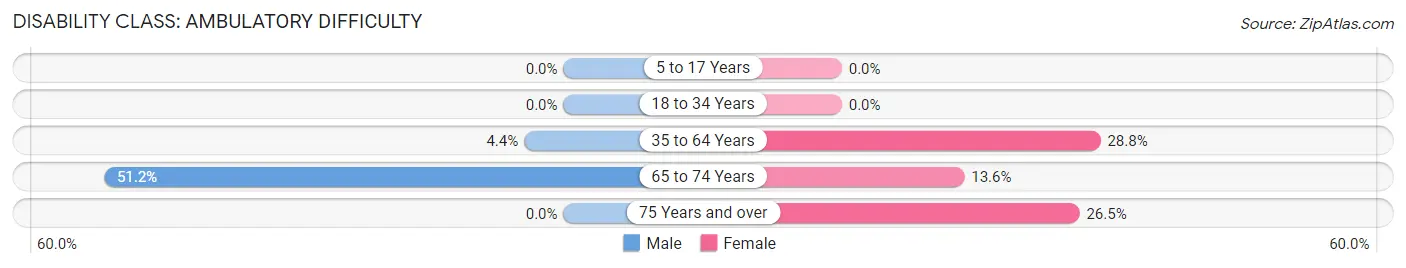
| Age Bracket | Male | Female |
| 5 to 17 Years | 0 (0.0%) | 0 (0.0%) |
| 18 to 34 Years | 0 (0.0%) | 0 (0.0%) |
| 35 to 64 Years | 7 (4.4%) | 51 (28.8%) |
| 65 to 74 Years | 22 (51.2%) | 3 (13.6%) |
| 75 Years and over | 0 (0.0%) | 18 (26.5%) |
Disability Class: Self-Care Difficulty
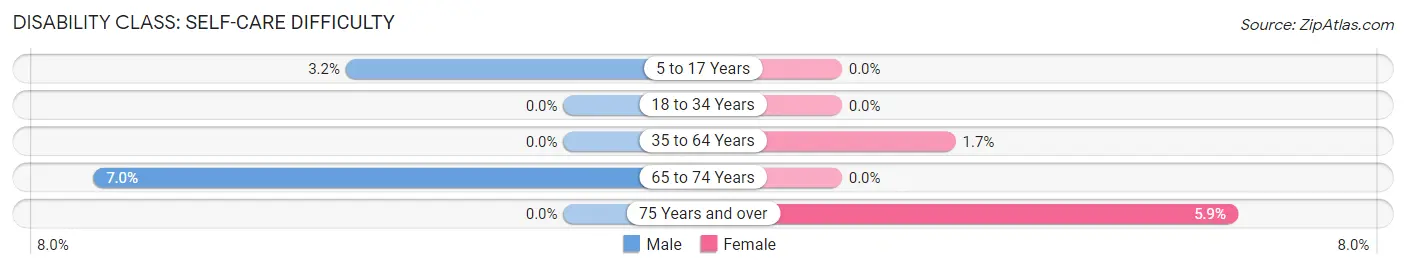
| Age Bracket | Male | Female |
| 5 to 17 Years | 3 (3.2%) | 0 (0.0%) |
| 18 to 34 Years | 0 (0.0%) | 0 (0.0%) |
| 35 to 64 Years | 0 (0.0%) | 3 (1.7%) |
| 65 to 74 Years | 3 (7.0%) | 0 (0.0%) |
| 75 Years and over | 0 (0.0%) | 4 (5.9%) |
Technology Access in Little Valley
Computing Device Access in Little Valley
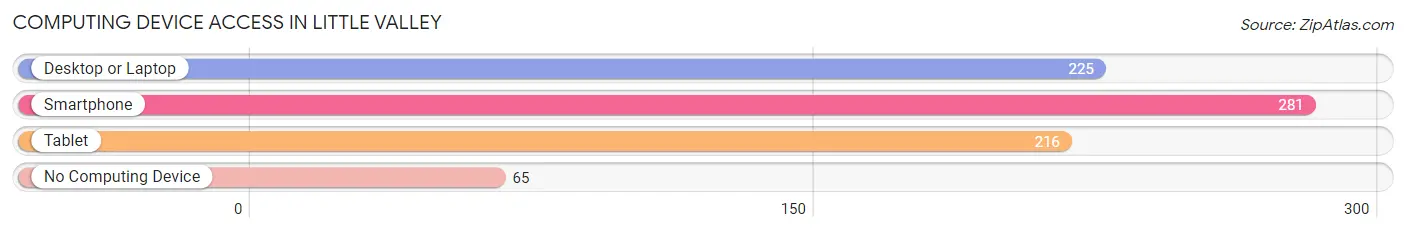
| Device Type | # Households | % Households |
| Desktop or Laptop | 225 | 56.2% |
| Smartphone | 281 | 70.3% |
| Tablet | 216 | 54.0% |
| No Computing Device | 65 | 16.3% |
| Total | 400 | 100.0% |
Internet Access in Little Valley
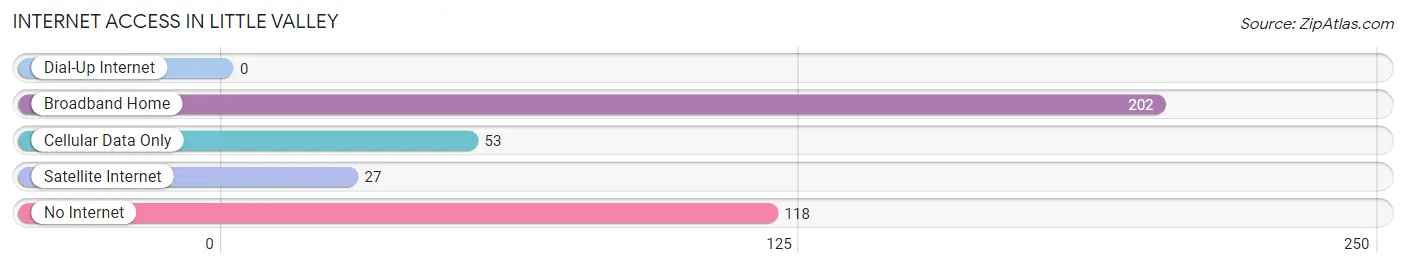
| Internet Type | # Households | % Households |
| Dial-Up Internet | 0 | 0.0% |
| Broadband Home | 202 | 50.5% |
| Cellular Data Only | 53 | 13.3% |
| Satellite Internet | 27 | 6.8% |
| No Internet | 118 | 29.5% |
| Total | 400 | 100.0% |
Little Valley Summary
Valley History
Little Valley is a small town located in Cattaraugus County, New York. It is situated in the foothills of the Allegheny Mountains and is part of the Southern Tier region of the state. The town was first settled in 1808 by a group of settlers from Connecticut. The town was originally known as "Little Valley Settlement" and was later changed to "Little Valley" in 1820.
The town was originally a farming community, with the main crops being wheat, corn, and potatoes. The town also had a number of sawmills and gristmills, which provided lumber and grain for the local population. In the late 19th century, the town began to develop into a manufacturing center, with the establishment of several factories, including a paper mill, a tannery, and a furniture factory.
The town was also home to a number of educational institutions, including the Little Valley Academy, which was founded in 1845. The academy was a private school that offered classes in a variety of subjects, including mathematics, science, and literature. The school was eventually closed in the early 20th century.
The town was also home to a number of churches, including the First Presbyterian Church, which was founded in 1820. The church is still active today and is located in the center of town.
Geography
Little Valley is located in the foothills of the Allegheny Mountains in Cattaraugus County, New York. The town is situated at an elevation of 1,400 feet above sea level and is located approximately 30 miles south of Buffalo. The town is bordered by the towns of Great Valley to the north, Napoli to the east, and East Otto to the south.
The town is located in a valley that is surrounded by hills and mountains. The valley is drained by the Little Valley Creek, which flows through the town and empties into the Allegheny River. The town is also home to several small lakes, including Little Valley Lake, which is located in the center of town.
Economy
The economy of Little Valley is largely based on agriculture and manufacturing. The town is home to several farms, which produce a variety of crops, including corn, wheat, and potatoes. The town is also home to several factories, including a paper mill, a tannery, and a furniture factory.
The town is also home to a number of small businesses, including restaurants, retail stores, and service providers. The town is also home to a number of tourist attractions, including the Little Valley Historical Society Museum, which is located in the center of town.
Demographics
As of the 2010 census, the population of Little Valley was 1,845. The population is largely white, with a small percentage of African Americans, Native Americans, and Asians. The median household income in the town is $41,250, and the median home value is $90,000. The town has a high rate of homeownership, with nearly 80% of the population owning their own homes.
Common Questions
What is Per Capita Income in Little Valley?
Per Capita income in Little Valley is $21,134.
What is the Median Family Income in Little Valley?
Median Family Income in Little Valley is $57,500.
What is the Median Household income in Little Valley?
Median Household Income in Little Valley is $40,972.
What is Inequality or Gini Index in Little Valley?
Inequality or Gini Index in Little Valley is 0.45.
What is the Total Population of Little Valley?
Total Population of Little Valley is 1,010.
What is the Total Male Population of Little Valley?
Total Male Population of Little Valley is 577.
What is the Total Female Population of Little Valley?
Total Female Population of Little Valley is 433.
What is the Ratio of Males per 100 Females in Little Valley?
There are 133.26 Males per 100 Females in Little Valley.
What is the Ratio of Females per 100 Males in Little Valley?
There are 75.04 Females per 100 Males in Little Valley.
What is the Median Population Age in Little Valley?
Median Population Age in Little Valley is 37.2 Years.
What is the Average Family Size in Little Valley
Average Family Size in Little Valley is 2.5 People.
What is the Average Household Size in Little Valley
Average Household Size in Little Valley is 2.2 People.
How Large is the Labor Force in Little Valley?
There are 358 People in the Labor Forcein in Little Valley.
What is the Percentage of People in the Labor Force in Little Valley?
41.8% of People are in the Labor Force in Little Valley.
What is the Unemployment Rate in Little Valley?
Unemployment Rate in Little Valley is 3.9%.