Leeds, NY Map & Demographics
Leeds Map
Leeds Overview
$19,513
PER CAPITA INCOME
87.9%
WAGE / INCOME GAP [ % ]
12.1¢/ $1
WAGE / INCOME GAP [ $ ]
0.27
INEQUALITY / GINI INDEX
309
TOTAL POPULATION
131
MALE POPULATION
178
FEMALE POPULATION
73.60
MALES / 100 FEMALES
135.88
FEMALES / 100 MALES
31.1
MEDIAN AGE
4.1
AVG FAMILY SIZE
3.5
AVG HOUSEHOLD SIZE
263
LABOR FORCE [ PEOPLE ]
85.1%
PERCENT IN LABOR FORCE
Leeds Zip Codes
Leeds Area Codes
Income in Leeds
Income Overview in Leeds
| Characteristic | Number | Measure |
| Per Capita Income | 309 | $19,513 |
| Median Family Income | 71 | $0 |
| Mean Family Income | 71 | $57,707 |
| Median Household Income | 87 | $0 |
| Mean Household Income | 87 | $57,428 |
| Income Deficit | 71 | $0 |
| Wage / Income Gap (%) | 309 | 87.93% |
| Wage / Income Gap ($) | 309 | 12.07¢ per $1 |
| Gini / Inequality Index | 309 | 0.27 |
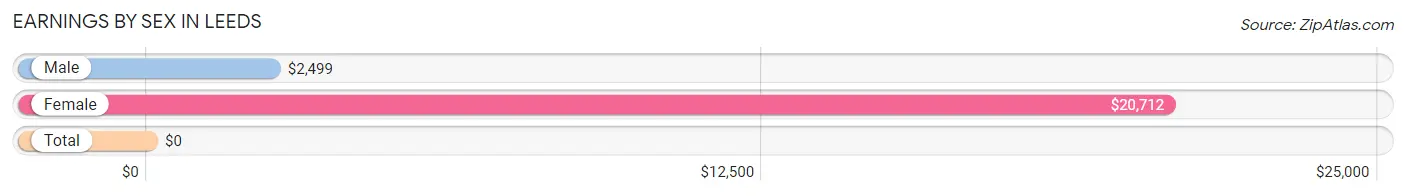
Earnings by Sex in Leeds
| Sex | Number | Average Earnings |
| Male | 122 (46.4%) | $2,499 |
| Female | 141 (53.6%) | $20,712 |
| Total | 263 (100.0%) | $0 |
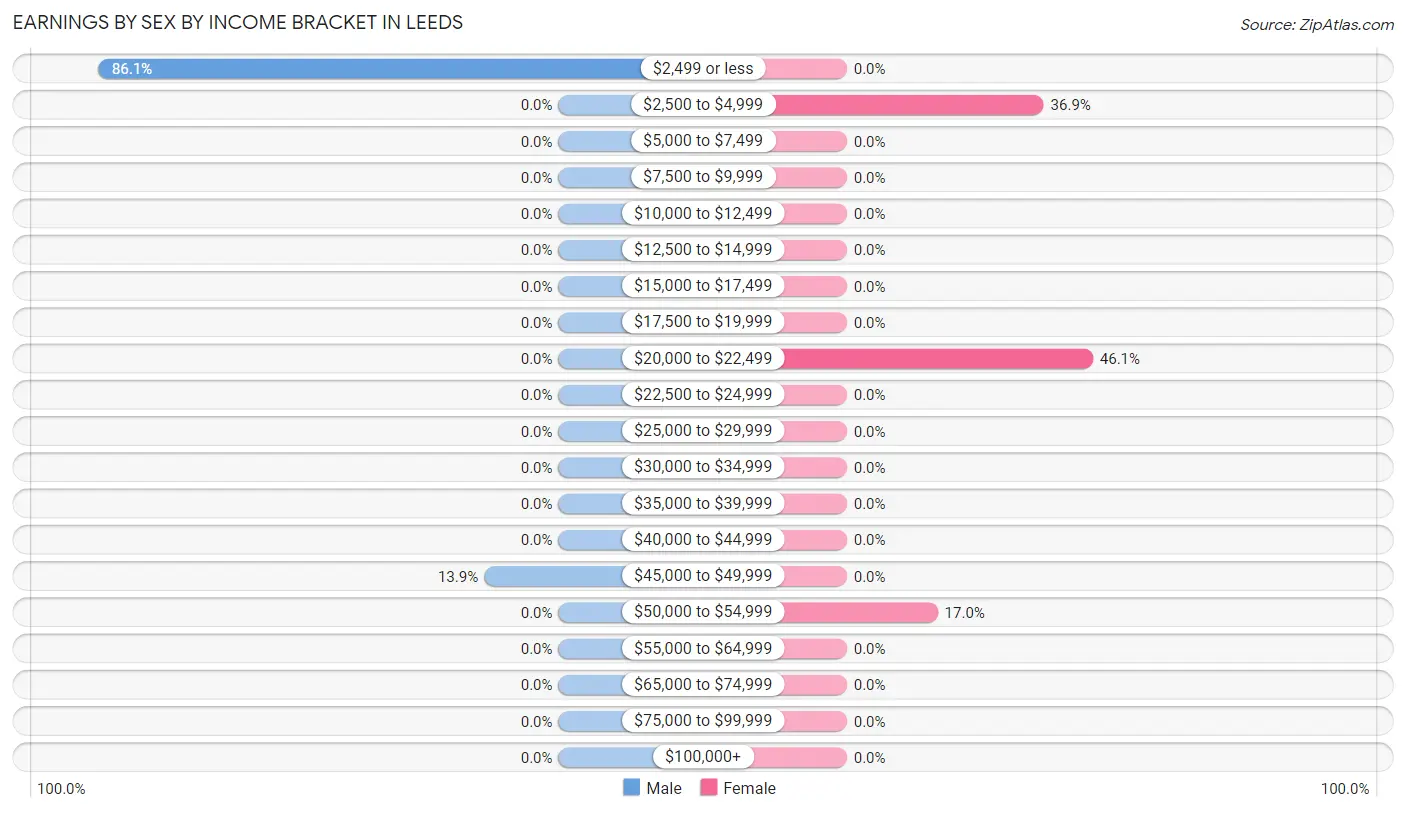
Earnings by Sex by Income Bracket in Leeds
The most common earnings brackets in Leeds are $2,499 or less for men (105 | 86.1%) and $20,000 to $22,499 for women (65 | 46.1%).
| Income | Male | Female |
| $2,499 or less | 105 (86.1%) | 0 (0.0%) |
| $2,500 to $4,999 | 0 (0.0%) | 52 (36.9%) |
| $5,000 to $7,499 | 0 (0.0%) | 0 (0.0%) |
| $7,500 to $9,999 | 0 (0.0%) | 0 (0.0%) |
| $10,000 to $12,499 | 0 (0.0%) | 0 (0.0%) |
| $12,500 to $14,999 | 0 (0.0%) | 0 (0.0%) |
| $15,000 to $17,499 | 0 (0.0%) | 0 (0.0%) |
| $17,500 to $19,999 | 0 (0.0%) | 0 (0.0%) |
| $20,000 to $22,499 | 0 (0.0%) | 65 (46.1%) |
| $22,500 to $24,999 | 0 (0.0%) | 0 (0.0%) |
| $25,000 to $29,999 | 0 (0.0%) | 0 (0.0%) |
| $30,000 to $34,999 | 0 (0.0%) | 0 (0.0%) |
| $35,000 to $39,999 | 0 (0.0%) | 0 (0.0%) |
| $40,000 to $44,999 | 0 (0.0%) | 0 (0.0%) |
| $45,000 to $49,999 | 17 (13.9%) | 0 (0.0%) |
| $50,000 to $54,999 | 0 (0.0%) | 24 (17.0%) |
| $55,000 to $64,999 | 0 (0.0%) | 0 (0.0%) |
| $65,000 to $74,999 | 0 (0.0%) | 0 (0.0%) |
| $75,000 to $99,999 | 0 (0.0%) | 0 (0.0%) |
| $100,000+ | 0 (0.0%) | 0 (0.0%) |
| Total | 122 (100.0%) | 141 (100.0%) |
Earnings by Sex by Educational Attainment in Leeds
| Educational Attainment | Male Income | Female Income |
| Less than High School | - | - |
| High School Diploma | - | - |
| College or Associate's Degree | - | - |
| Bachelor's Degree | - | - |
| Graduate Degree | - | - |
| Total | - | - |
Family Income in Leeds
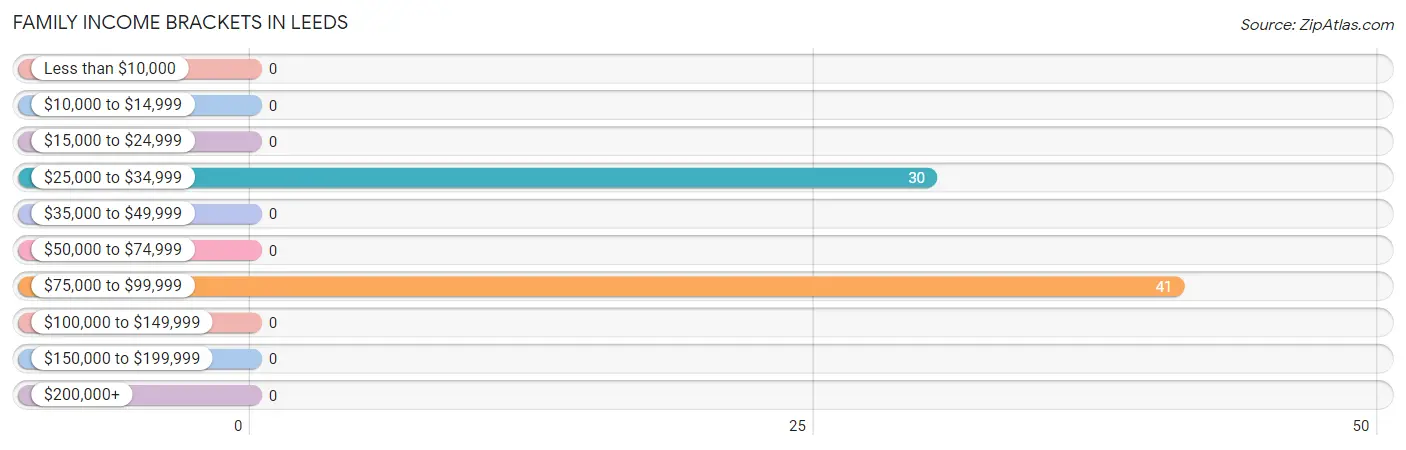
Family Income Brackets in Leeds
According to the Leeds family income data, there are 41 families falling into the $75,000 to $99,999 income range, which is the most common income bracket and makes up 57.8% of all families.
| Income Bracket | # Families | % Families |
| Less than $10,000 | 0 | 0.0% |
| $10,000 to $14,999 | 0 | 0.0% |
| $15,000 to $24,999 | 0 | 0.0% |
| $25,000 to $34,999 | 30 | 42.3% |
| $35,000 to $49,999 | 0 | 0.0% |
| $50,000 to $74,999 | 0 | 0.0% |
| $75,000 to $99,999 | 41 | 57.7% |
| $100,000 to $149,999 | 0 | 0.0% |
| $150,000 to $199,999 | 0 | 0.0% |
| $200,000+ | 0 | 0.0% |
Family Income by Famaliy Size in Leeds
| Income Bracket | # Families | Median Income |
| 2-Person Families | 47 (66.2%) | $0 |
| 3-Person Families | 24 (33.8%) | $0 |
| 4-Person Families | 0 (0.0%) | $0 |
| 5-Person Families | 0 (0.0%) | $0 |
| 6-Person Families | 0 (0.0%) | $0 |
| 7+ Person Families | 0 (0.0%) | $0 |
| Total | 71 (100.0%) | $0 |
Family Income by Number of Earners in Leeds
| Number of Earners | # Families | Median Income |
| No Earners | 0 (0.0%) | $0 |
| 1 Earner | 30 (42.2%) | $0 |
| 2 Earners | 17 (23.9%) | $0 |
| 3+ Earners | 24 (33.8%) | $0 |
| Total | 71 (100.0%) | $0 |
Household Income in Leeds
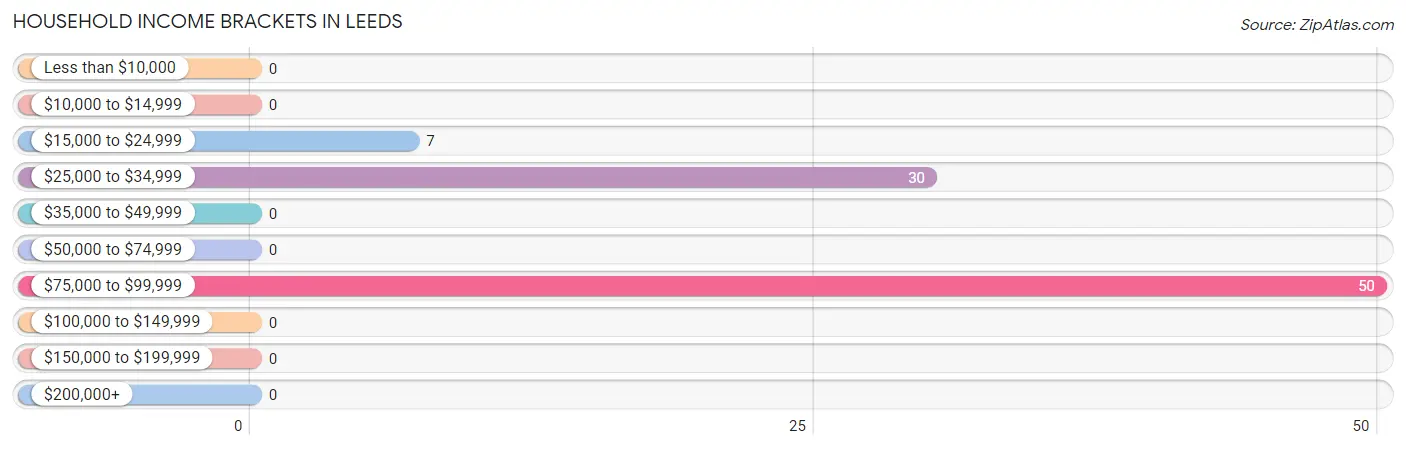
Household Income Brackets in Leeds
With 50 households falling in the category, the $75,000 to $99,999 income range is the most frequent in Leeds, accounting for 57.5% of all households.
| Income Bracket | # Households | % Households |
| Less than $10,000 | 0 | 0.0% |
| $10,000 to $14,999 | 0 | 0.0% |
| $15,000 to $24,999 | 7 | 8.0% |
| $25,000 to $34,999 | 30 | 34.5% |
| $35,000 to $49,999 | 0 | 0.0% |
| $50,000 to $74,999 | 0 | 0.0% |
| $75,000 to $99,999 | 50 | 57.5% |
| $100,000 to $149,999 | 0 | 0.0% |
| $150,000 to $199,999 | 0 | 0.0% |
| $200,000+ | 0 | 0.0% |
Household Income by Householder Age in Leeds
| Income Bracket | # Households | Median Income |
| 15 to 24 Years | 0 (0.0%) | $0 |
| 25 to 44 Years | 0 (0.0%) | $0 |
| 45 to 64 Years | 41 (47.1%) | $0 |
| 65+ Years | 46 (52.9%) | $0 |
| Total | 87 (100.0%) | $0 |
Poverty in Leeds
Income Below Poverty by Sex and Age in Leeds
| Age Bracket | Male | Female |
| Under 5 Years | 0 (0.0%) | 0 (0.0%) |
| 5 Years | 0 (0.0%) | 0 (0.0%) |
| 6 to 11 Years | 0 (0.0%) | 0 (0.0%) |
| 12 to 14 Years | 0 (0.0%) | 0 (0.0%) |
| 15 Years | 0 (0.0%) | 0 (0.0%) |
| 16 and 17 Years | 0 (0.0%) | 0 (0.0%) |
| 18 to 24 Years | 0 (0.0%) | 0 (0.0%) |
| 25 to 34 Years | 0 (0.0%) | 0 (0.0%) |
| 35 to 44 Years | 0 (0.0%) | 0 (0.0%) |
| 45 to 54 Years | 0 (0.0%) | 0 (0.0%) |
| 55 to 64 Years | 0 (0.0%) | 0 (0.0%) |
| 65 to 74 Years | 0 (0.0%) | 0 (0.0%) |
| 75 Years and over | 0 (0.0%) | 0 (0.0%) |
| Total | 0 (0.0%) | 0 (0.0%) |
Income Above Poverty by Sex and Age in Leeds
According to the poverty statistics in Leeds, males aged 18 to 24 years and females aged 25 to 34 years are the age groups that are most secure financially, with 100.0% of males and 100.0% of females in these age groups living above the poverty line.
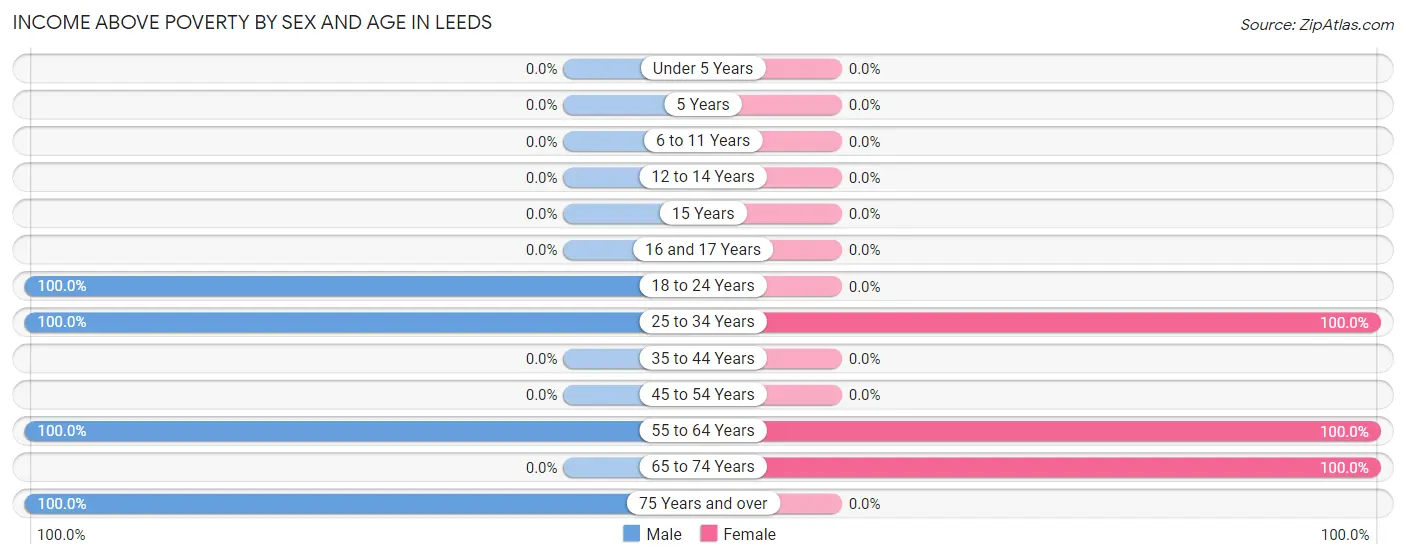
| Age Bracket | Male | Female |
| Under 5 Years | 0 (0.0%) | 0 (0.0%) |
| 5 Years | 0 (0.0%) | 0 (0.0%) |
| 6 to 11 Years | 0 (0.0%) | 0 (0.0%) |
| 12 to 14 Years | 0 (0.0%) | 0 (0.0%) |
| 15 Years | 0 (0.0%) | 0 (0.0%) |
| 16 and 17 Years | 0 (0.0%) | 0 (0.0%) |
| 18 to 24 Years | 29 (100.0%) | 0 (0.0%) |
| 25 to 34 Years | 76 (100.0%) | 117 (100.0%) |
| 35 to 44 Years | 0 (0.0%) | 0 (0.0%) |
| 45 to 54 Years | 0 (0.0%) | 0 (0.0%) |
| 55 to 64 Years | 17 (100.0%) | 24 (100.0%) |
| 65 to 74 Years | 0 (0.0%) | 37 (100.0%) |
| 75 Years and over | 9 (100.0%) | 0 (0.0%) |
| Total | 131 (100.0%) | 178 (100.0%) |
Income Below Poverty Among Married-Couple Families in Leeds
| Children | Above Poverty | Below Poverty |
| No Children | 0 (0.0%) | 0 (0.0%) |
| 1 or 2 Children | 0 (0.0%) | 0 (0.0%) |
| 3 or 4 Children | 0 (0.0%) | 0 (0.0%) |
| 5 or more Children | 0 (0.0%) | 0 (0.0%) |
| Total | 0 (0.0%) | 0 (0.0%) |
Income Below Poverty Among Single-Parent Households in Leeds
| Children | Single Father | Single Mother |
| No Children | 0 (0.0%) | 0 (0.0%) |
| 1 or 2 Children | 0 (0.0%) | 0 (0.0%) |
| 3 or 4 Children | 0 (0.0%) | 0 (0.0%) |
| 5 or more Children | 0 (0.0%) | 0 (0.0%) |
| Total | 0 (0.0%) | 0 (0.0%) |
Income Below Poverty Among Married-Couple vs Single-Parent Households in Leeds
| Children | Married-Couple Families | Single-Parent Households |
| No Children | 0 (0.0%) | 0 (0.0%) |
| 1 or 2 Children | 0 (0.0%) | 0 (0.0%) |
| 3 or 4 Children | 0 (0.0%) | 0 (0.0%) |
| 5 or more Children | 0 (0.0%) | 0 (0.0%) |
| Total | 0 (0.0%) | 0 (0.0%) |
Race in Leeds
The most populous races in Leeds are , and White / Caucasian (309 | 100.0%).
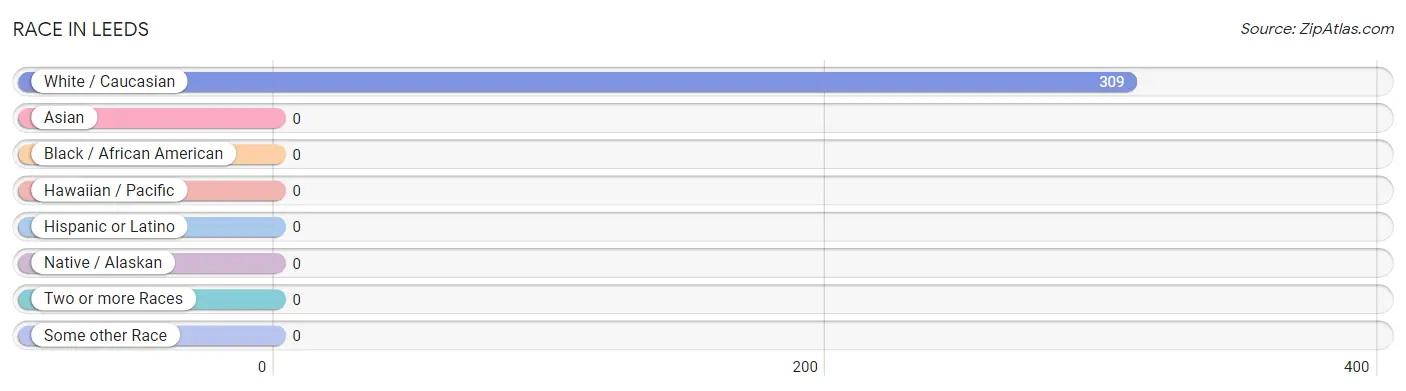
| Race | # Population | % Population |
| Asian | 0 | 0.0% |
| Black / African American | 0 | 0.0% |
| Hawaiian / Pacific | 0 | 0.0% |
| Hispanic or Latino | 0 | 0.0% |
| Native / Alaskan | 0 | 0.0% |
| White / Caucasian | 309 | 100.0% |
| Two or more Races | 0 | 0.0% |
| Some other Race | 0 | 0.0% |
| Total | 309 | 100.0% |
Ancestry in Leeds
The most populous ancestries reported in Leeds are Italian (171 | 55.3%), Irish (143 | 46.3%), American (83 | 26.9%), German (55 | 17.8%), and French (29 | 9.4%), together accounting for 155.7% of all Leeds residents.
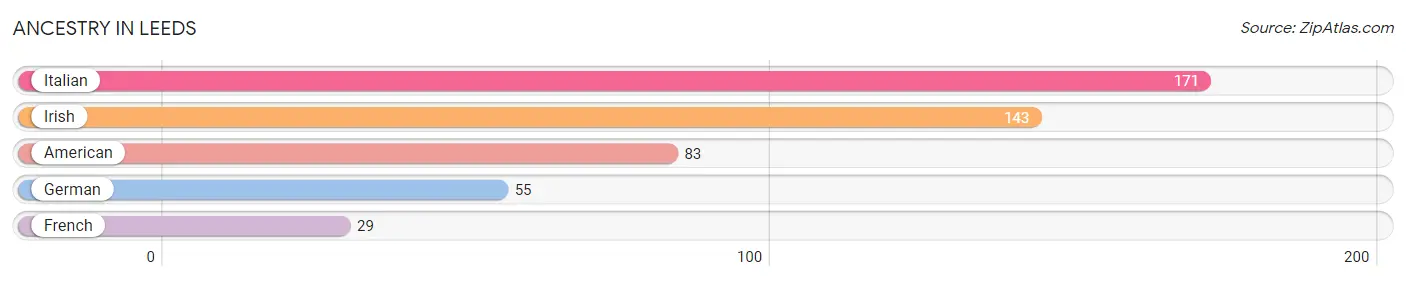
| Ancestry | # Population | % Population |
| American | 83 | 26.9% |
| French | 29 | 9.4% |
| German | 55 | 17.8% |
| Irish | 143 | 46.3% |
| Italian | 171 | 55.3% | View All 5 Rows |
Immigrants in Leeds

| Immigration Origin | # Population | % Population | View All 0 Rows |
Sex and Age in Leeds
Sex and Age in Leeds
The most populous age groups in Leeds are 30 to 34 Years (76 | 58.0%) for men and 30 to 34 Years (65 | 36.5%) for women.
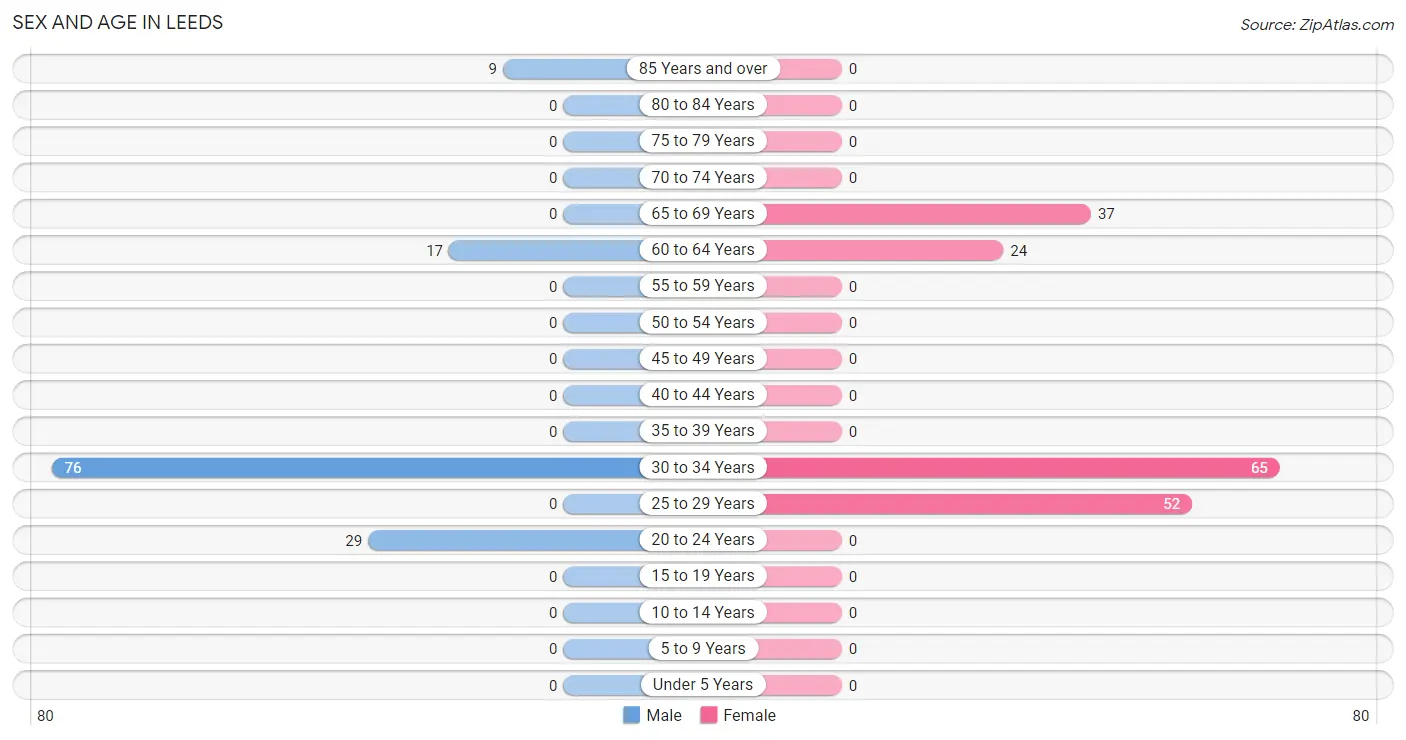
| Age Bracket | Male | Female |
| Under 5 Years | 0 (0.0%) | 0 (0.0%) |
| 5 to 9 Years | 0 (0.0%) | 0 (0.0%) |
| 10 to 14 Years | 0 (0.0%) | 0 (0.0%) |
| 15 to 19 Years | 0 (0.0%) | 0 (0.0%) |
| 20 to 24 Years | 29 (22.1%) | 0 (0.0%) |
| 25 to 29 Years | 0 (0.0%) | 52 (29.2%) |
| 30 to 34 Years | 76 (58.0%) | 65 (36.5%) |
| 35 to 39 Years | 0 (0.0%) | 0 (0.0%) |
| 40 to 44 Years | 0 (0.0%) | 0 (0.0%) |
| 45 to 49 Years | 0 (0.0%) | 0 (0.0%) |
| 50 to 54 Years | 0 (0.0%) | 0 (0.0%) |
| 55 to 59 Years | 0 (0.0%) | 0 (0.0%) |
| 60 to 64 Years | 17 (13.0%) | 24 (13.5%) |
| 65 to 69 Years | 0 (0.0%) | 37 (20.8%) |
| 70 to 74 Years | 0 (0.0%) | 0 (0.0%) |
| 75 to 79 Years | 0 (0.0%) | 0 (0.0%) |
| 80 to 84 Years | 0 (0.0%) | 0 (0.0%) |
| 85 Years and over | 9 (6.9%) | 0 (0.0%) |
| Total | 131 (100.0%) | 178 (100.0%) |
Families and Households in Leeds
Median Family Size in Leeds
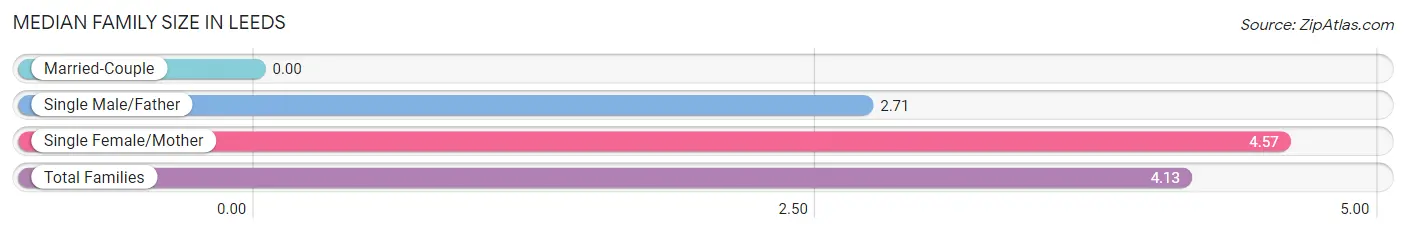
| Family Type | # Families | Family Size |
| Married-Couple | 0 (0.0%) | - |
| Single Male/Father | 17 (23.9%) | 2.71 |
| Single Female/Mother | 54 (76.1%) | 4.57 |
| Total Families | 71 (100.0%) | 4.13 |
Median Household Size in Leeds
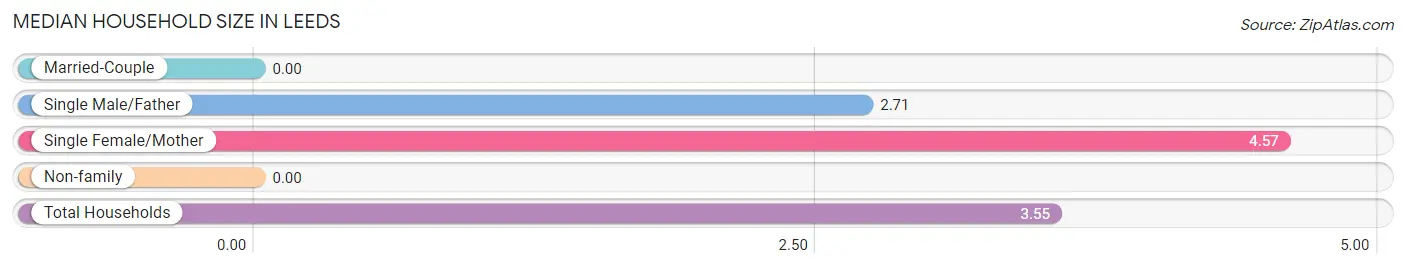
| Household Type | # Households | Household Size |
| Married-Couple | 0 (0.0%) | - |
| Single Male/Father | 17 (19.5%) | 2.71 |
| Single Female/Mother | 54 (62.1%) | 4.57 |
| Non-family | 16 (18.4%) | - |
| Total Households | 87 (100.0%) | 3.55 |
Household Size by Marriage Status in Leeds
Out of a total of 87 households in Leeds, 71 (81.6%) are family households, while 16 (18.4%) are nonfamily households. The most numerous type of family households are 2-person households, comprising 47, and the most common type of nonfamily households are 1-person households, comprising 16.
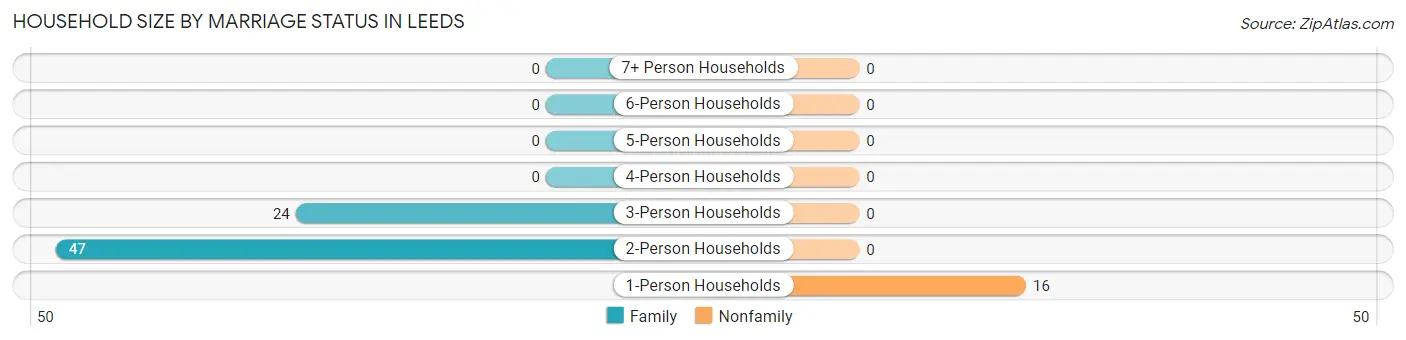
| Household Size | Family Households | Nonfamily Households |
| 1-Person Households | - | 16 (18.4%) |
| 2-Person Households | 47 (54.0%) | 0 (0.0%) |
| 3-Person Households | 24 (27.6%) | 0 (0.0%) |
| 4-Person Households | 0 (0.0%) | 0 (0.0%) |
| 5-Person Households | 0 (0.0%) | 0 (0.0%) |
| 6-Person Households | 0 (0.0%) | 0 (0.0%) |
| 7+ Person Households | 0 (0.0%) | 0 (0.0%) |
| Total | 71 (81.6%) | 16 (18.4%) |
Female Fertility in Leeds
Fertility by Age in Leeds
| Age Bracket | Women with Births | Births / 1,000 Women |
| 15 to 19 years | 0 (0.0%) | 0.0 |
| 20 to 34 years | 0 (0.0%) | 0.0 |
| 35 to 50 years | 0 (0.0%) | 0.0 |
| Total | 0 (0.0%) | 0.0 |
Fertility by Age by Marriage Status in Leeds
| Age Bracket | Married | Unmarried |
| 15 to 19 years | 0 (0.0%) | 0 (0.0%) |
| 20 to 34 years | 0 (0.0%) | 0 (0.0%) |
| 35 to 50 years | 0 (0.0%) | 0 (0.0%) |
| Total | 0 (0.0%) | 0 (0.0%) |
Fertility by Education in Leeds
| Educational Attainment | Women with Births | Births / 1,000 Women |
| Less than High School | 0 (0.0%) | 0.0 |
| High School Diploma | 0 (0.0%) | 0.0 |
| College or Associate's Degree | 0 (0.0%) | 0.0 |
| Bachelor's Degree | 0 (0.0%) | 0.0 |
| Graduate Degree | 0 (0.0%) | 0.0 |
| Total | 0 (0.0%) | 0.0 |
Fertility by Education by Marriage Status in Leeds
| Educational Attainment | Married | Unmarried |
| Less than High School | 0 (0.0%) | 0 (0.0%) |
| High School Diploma | 0 (0.0%) | 0 (0.0%) |
| College or Associate's Degree | 0 (0.0%) | 0 (0.0%) |
| Bachelor's Degree | 0 (0.0%) | 0 (0.0%) |
| Graduate Degree | 0 (0.0%) | 0 (0.0%) |
| Total | 0 (0.0%) | 0 (0.0%) |
Employment Characteristics in Leeds
Employment by Class of Employer in Leeds
Among the 263 employed individuals in Leeds, private company employees (146 | 55.5%), self-employed (not incorporated) (76 | 28.9%), and state government employees (24 | 9.1%) make up the most common classes of employment.
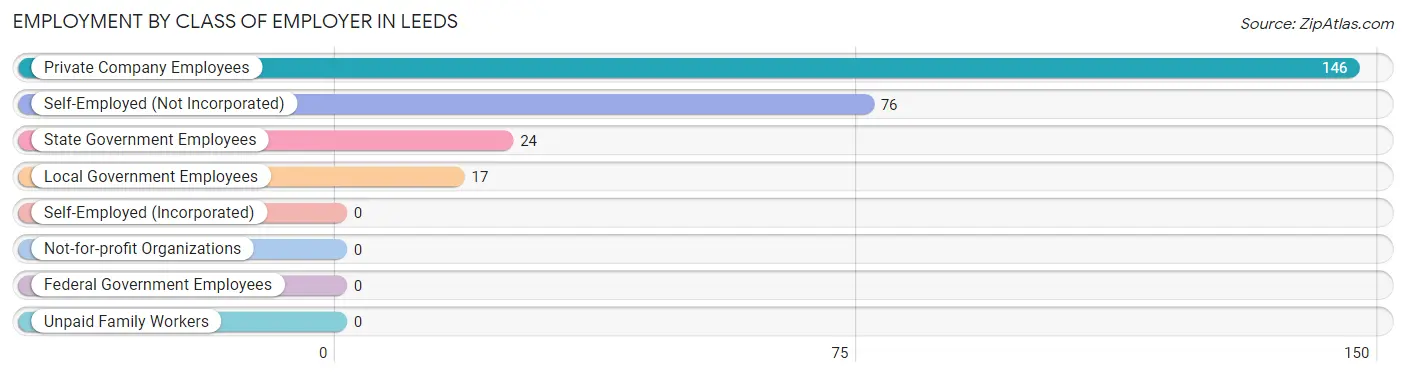
| Employer Class | # Employees | % Employees |
| Private Company Employees | 146 | 55.5% |
| Self-Employed (Incorporated) | 0 | 0.0% |
| Self-Employed (Not Incorporated) | 76 | 28.9% |
| Not-for-profit Organizations | 0 | 0.0% |
| Local Government Employees | 17 | 6.5% |
| State Government Employees | 24 | 9.1% |
| Federal Government Employees | 0 | 0.0% |
| Unpaid Family Workers | 0 | 0.0% |
| Total | 263 | 100.0% |
Employment Status by Age in Leeds
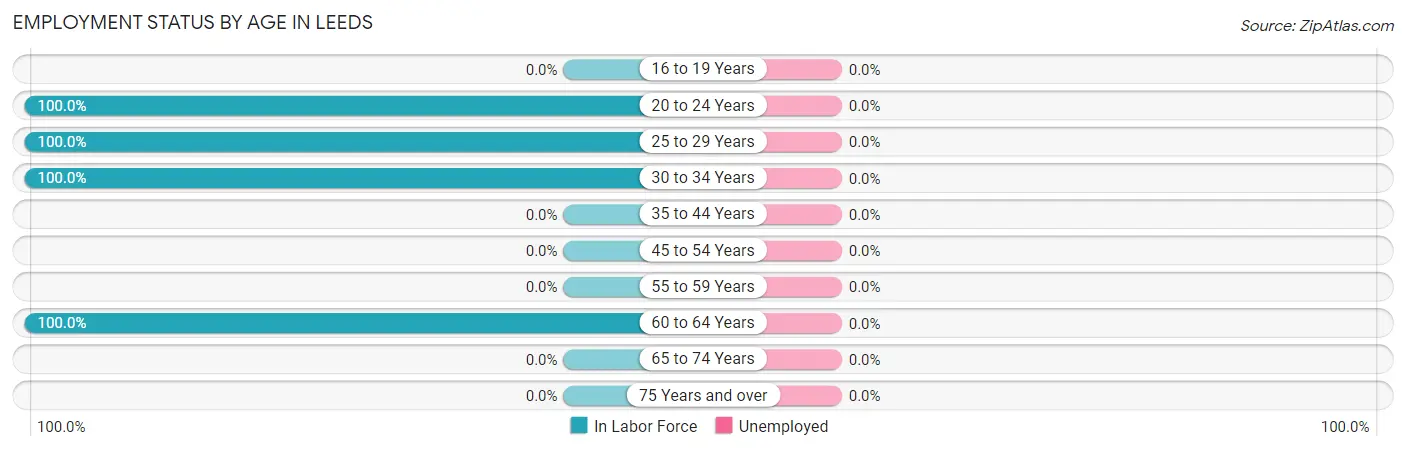
| Age Bracket | In Labor Force | Unemployed |
| 16 to 19 Years | 0 (0.0%) | 0 (0.0%) |
| 20 to 24 Years | 29 (100.0%) | 0 (0.0%) |
| 25 to 29 Years | 52 (100.0%) | 0 (0.0%) |
| 30 to 34 Years | 141 (100.0%) | 0 (0.0%) |
| 35 to 44 Years | 0 (0.0%) | 0 (0.0%) |
| 45 to 54 Years | 0 (0.0%) | 0 (0.0%) |
| 55 to 59 Years | 0 (0.0%) | 0 (0.0%) |
| 60 to 64 Years | 41 (100.0%) | 0 (0.0%) |
| 65 to 74 Years | 0 (0.0%) | 0 (0.0%) |
| 75 Years and over | 0 (0.0%) | 0 (0.0%) |
| Total | 263 (85.1%) | 0 (0.0%) |
Employment Status by Educational Attainment in Leeds
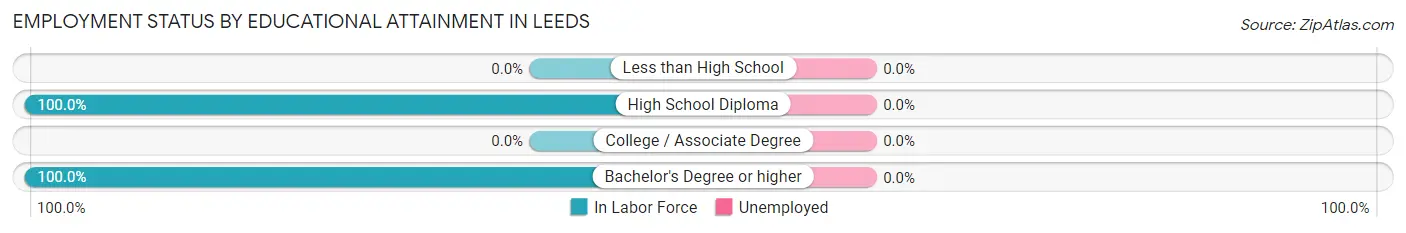
| Educational Attainment | In Labor Force | Unemployed |
| Less than High School | 0 (0.0%) | 0 (0.0%) |
| High School Diploma | 17 (100.0%) | 0 (0.0%) |
| College / Associate Degree | 0 (0.0%) | 0 (0.0%) |
| Bachelor's Degree or higher | 217 (100.0%) | 0 (0.0%) |
| Total | 234 (100.0%) | 0 (0.0%) |
Employment Occupations by Sex in Leeds
Management, Business, Science and Arts Occupations
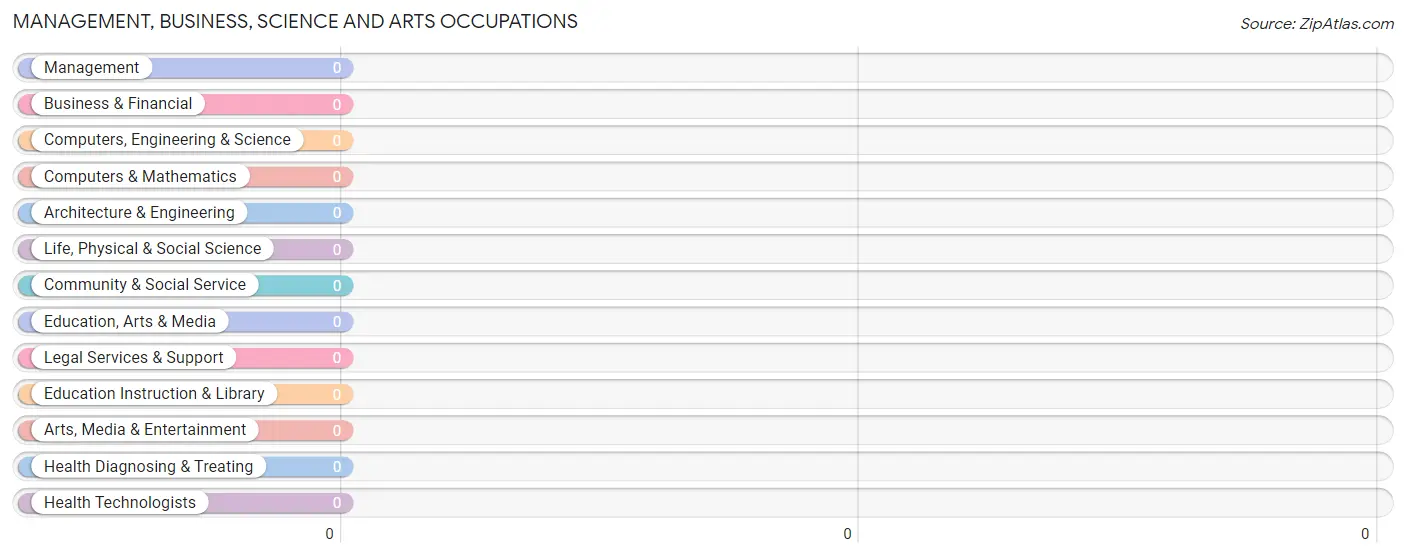
Management, Business, Science and Arts Occupations by Sex
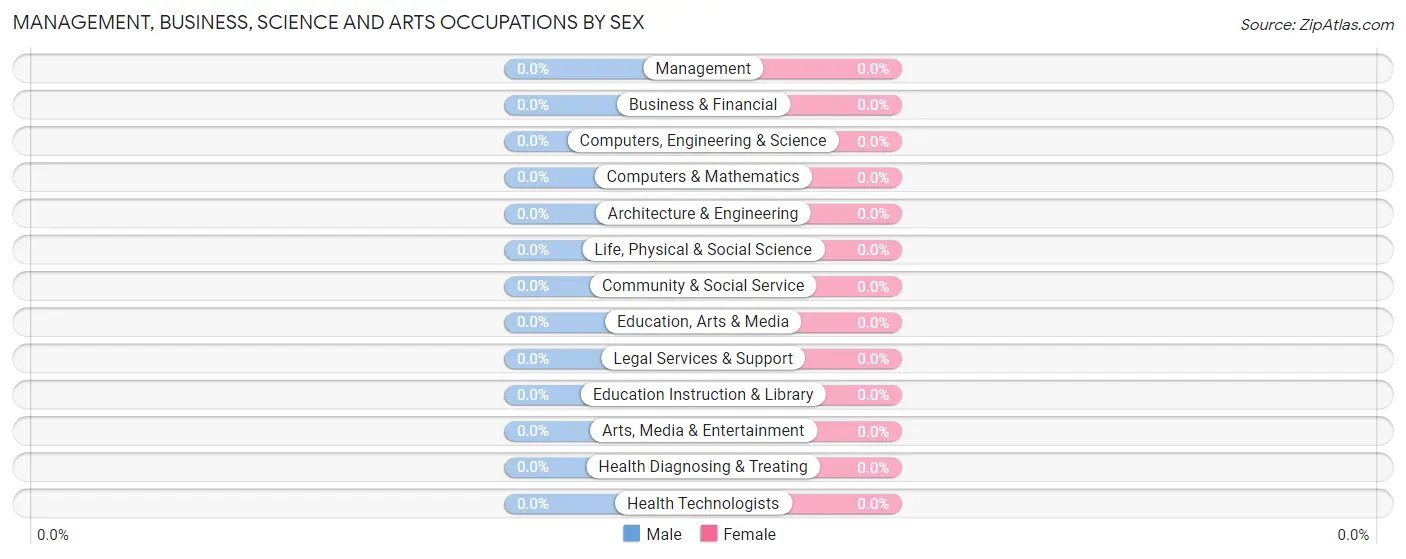
| Occupation | Male | Female |
| Management | 0 (0.0%) | 0 (0.0%) |
| Business & Financial | 0 (0.0%) | 0 (0.0%) |
| Computers, Engineering & Science | 0 (0.0%) | 0 (0.0%) |
| Computers & Mathematics | 0 (0.0%) | 0 (0.0%) |
| Architecture & Engineering | 0 (0.0%) | 0 (0.0%) |
| Life, Physical & Social Science | 0 (0.0%) | 0 (0.0%) |
| Community & Social Service | 0 (0.0%) | 0 (0.0%) |
| Education, Arts & Media | 0 (0.0%) | 0 (0.0%) |
| Legal Services & Support | 0 (0.0%) | 0 (0.0%) |
| Education Instruction & Library | 0 (0.0%) | 0 (0.0%) |
| Arts, Media & Entertainment | 0 (0.0%) | 0 (0.0%) |
| Health Diagnosing & Treating | 0 (0.0%) | 0 (0.0%) |
| Health Technologists | 0 (0.0%) | 0 (0.0%) |
| Total (Category) | 0 (0.0%) | 0 (0.0%) |
| Total (Overall) | 122 (46.4%) | 141 (53.6%) |
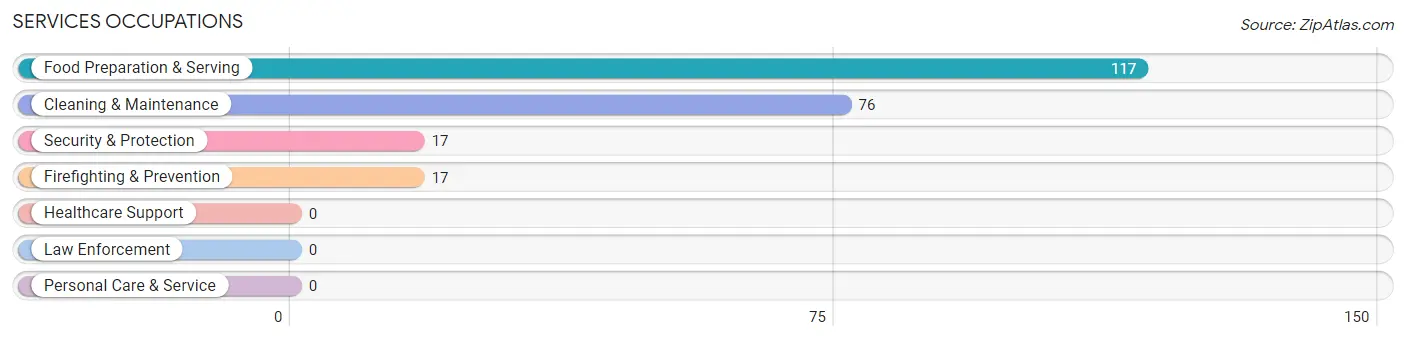
Services Occupations
The most common Services occupations in Leeds are Food Preparation & Serving (117 | 44.5%), Cleaning & Maintenance (76 | 28.9%), Security & Protection (17 | 6.5%), and Firefighting & Prevention (17 | 6.5%).
Services Occupations by Sex
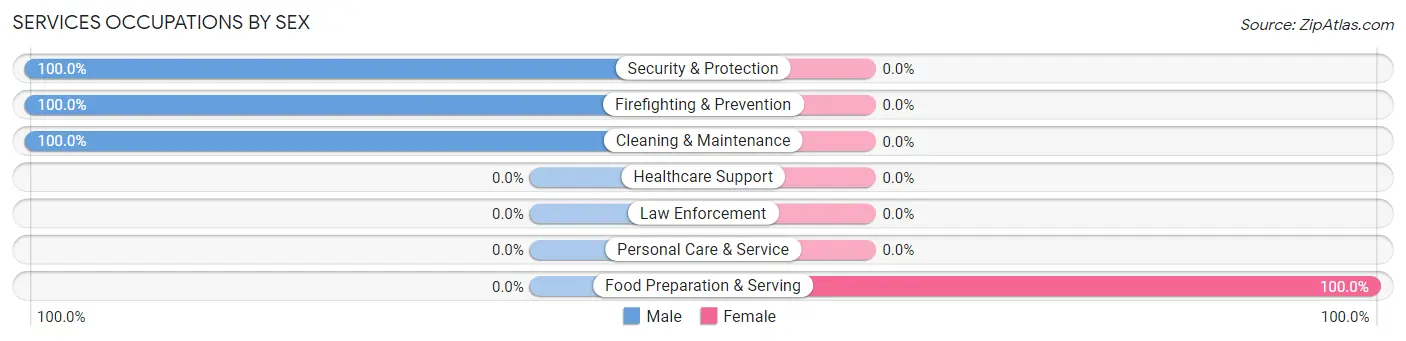
| Occupation | Male | Female |
| Healthcare Support | 0 (0.0%) | 0 (0.0%) |
| Security & Protection | 17 (100.0%) | 0 (0.0%) |
| Firefighting & Prevention | 17 (100.0%) | 0 (0.0%) |
| Law Enforcement | 0 (0.0%) | 0 (0.0%) |
| Food Preparation & Serving | 0 (0.0%) | 117 (100.0%) |
| Cleaning & Maintenance | 76 (100.0%) | 0 (0.0%) |
| Personal Care & Service | 0 (0.0%) | 0 (0.0%) |
| Total (Category) | 93 (44.3%) | 117 (55.7%) |
| Total (Overall) | 122 (46.4%) | 141 (53.6%) |
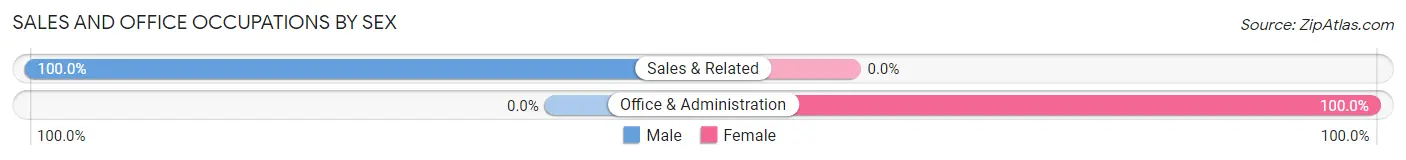
Sales and Office Occupations
The most common Sales and Office occupations in Leeds are Sales & Related (29 | 11.0%), and Office & Administration (24 | 9.1%).
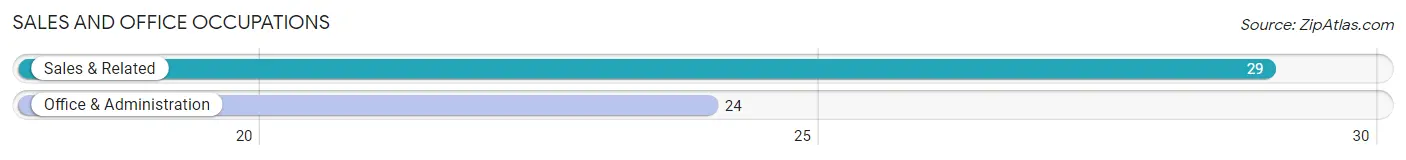
Sales and Office Occupations by Sex
| Occupation | Male | Female |
| Sales & Related | 29 (100.0%) | 0 (0.0%) |
| Office & Administration | 0 (0.0%) | 24 (100.0%) |
| Total (Category) | 29 (54.7%) | 24 (45.3%) |
| Total (Overall) | 122 (46.4%) | 141 (53.6%) |
Natural Resources, Construction and Maintenance Occupations

Natural Resources, Construction and Maintenance Occupations by Sex
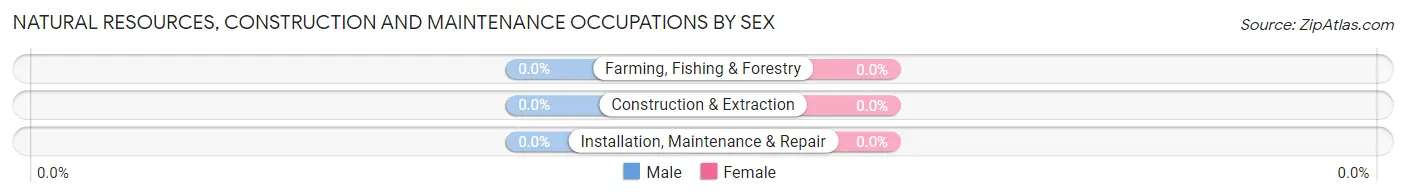
| Occupation | Male | Female |
| Farming, Fishing & Forestry | 0 (0.0%) | 0 (0.0%) |
| Construction & Extraction | 0 (0.0%) | 0 (0.0%) |
| Installation, Maintenance & Repair | 0 (0.0%) | 0 (0.0%) |
| Total (Category) | 0 (0.0%) | 0 (0.0%) |
| Total (Overall) | 122 (46.4%) | 141 (53.6%) |
Production, Transportation and Moving Occupations
Production, Transportation and Moving Occupations by Sex
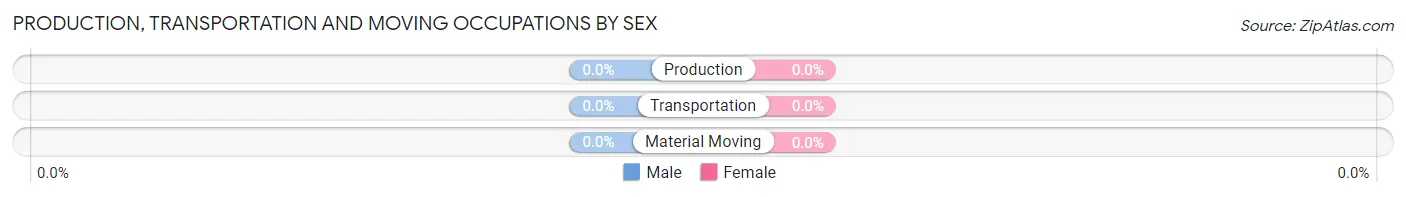
| Occupation | Male | Female |
| Production | 0 (0.0%) | 0 (0.0%) |
| Transportation | 0 (0.0%) | 0 (0.0%) |
| Material Moving | 0 (0.0%) | 0 (0.0%) |
| Total (Category) | 0 (0.0%) | 0 (0.0%) |
| Total (Overall) | 122 (46.4%) | 141 (53.6%) |
Employment Industries by Sex in Leeds
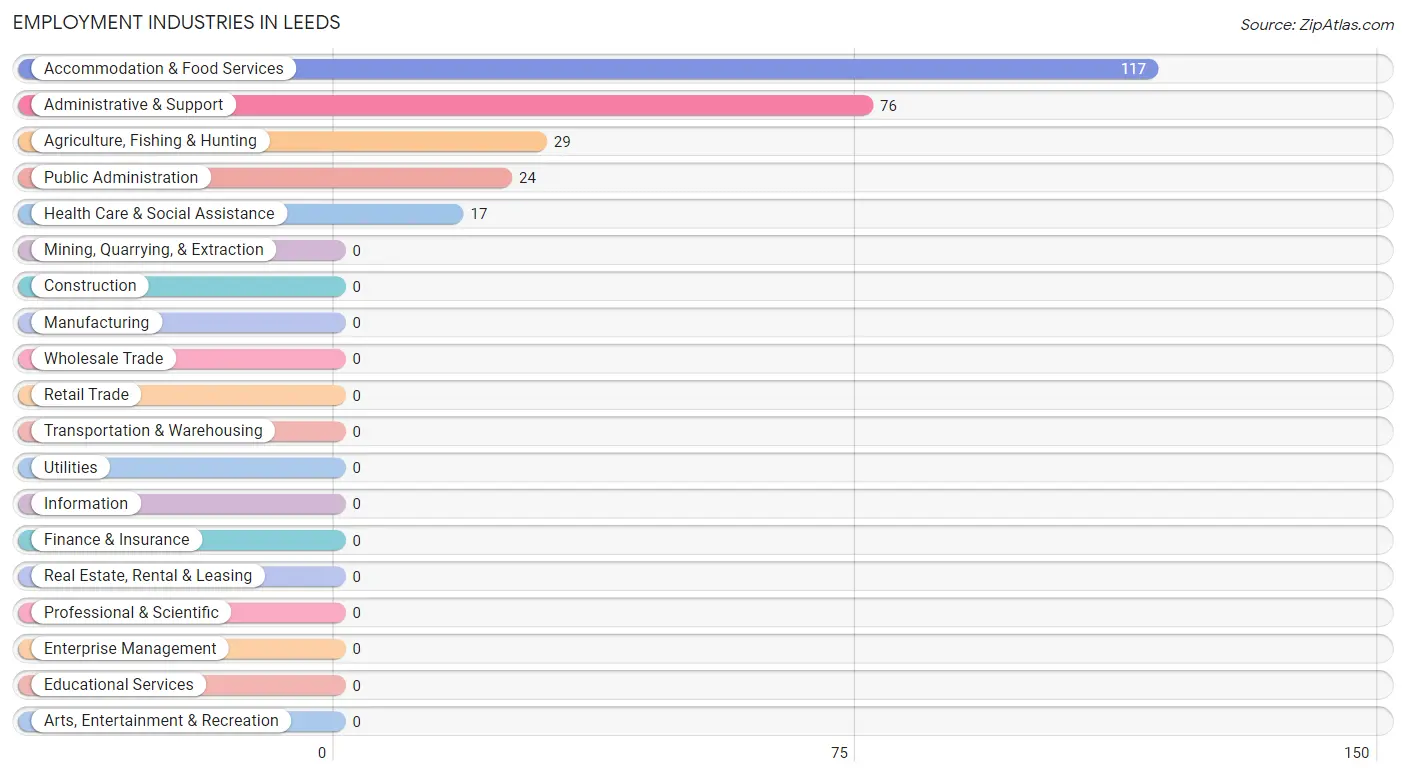
Employment Industries in Leeds
The major employment industries in Leeds include Accommodation & Food Services (117 | 44.5%), Administrative & Support (76 | 28.9%), Agriculture, Fishing & Hunting (29 | 11.0%), Public Administration (24 | 9.1%), and Health Care & Social Assistance (17 | 6.5%).
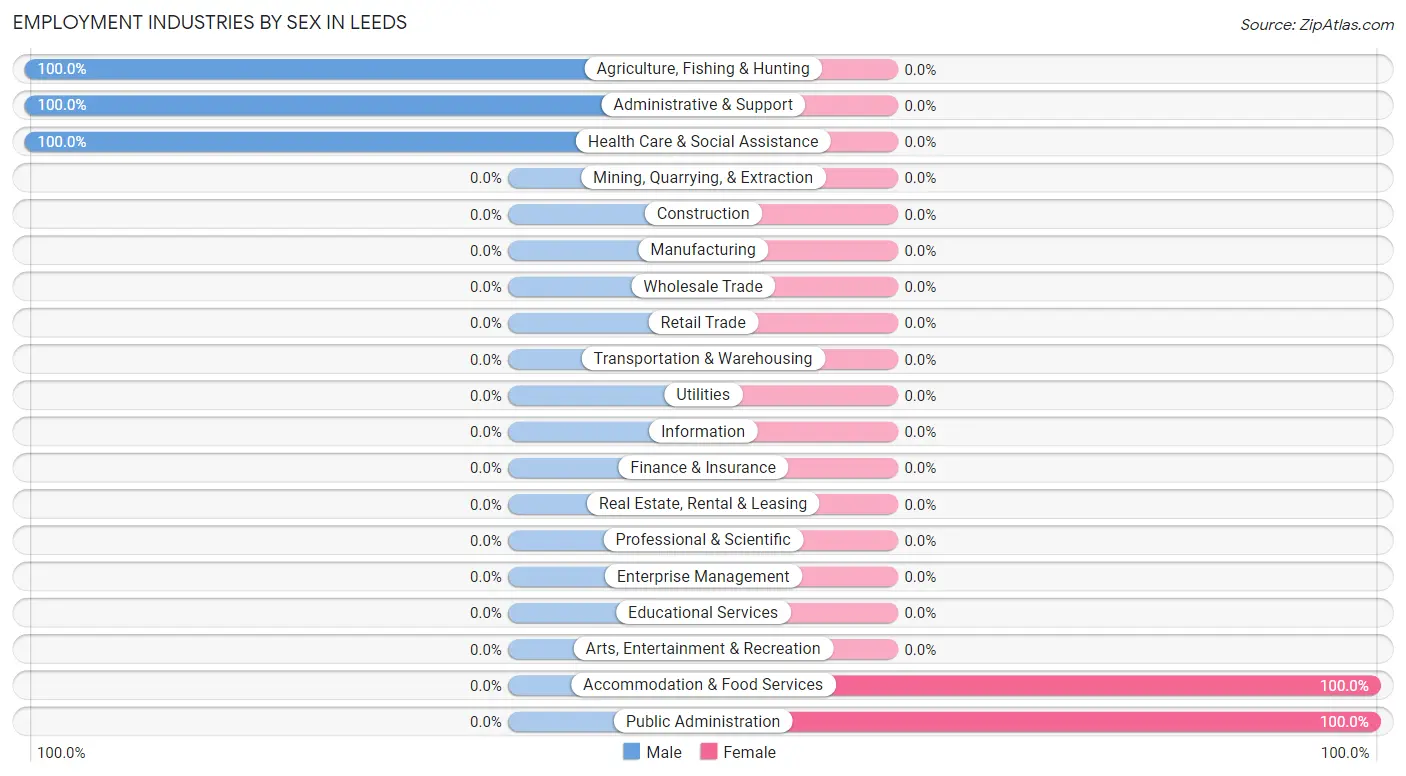
Employment Industries by Sex in Leeds
The Leeds industries that see more men than women are Agriculture, Fishing & Hunting (100.0%), Administrative & Support (100.0%), and Health Care & Social Assistance (100.0%), whereas the industries that tend to have a higher number of women are Accommodation & Food Services (100.0%), and Public Administration (100.0%).
| Industry | Male | Female |
| Agriculture, Fishing & Hunting | 29 (100.0%) | 0 (0.0%) |
| Mining, Quarrying, & Extraction | 0 (0.0%) | 0 (0.0%) |
| Construction | 0 (0.0%) | 0 (0.0%) |
| Manufacturing | 0 (0.0%) | 0 (0.0%) |
| Wholesale Trade | 0 (0.0%) | 0 (0.0%) |
| Retail Trade | 0 (0.0%) | 0 (0.0%) |
| Transportation & Warehousing | 0 (0.0%) | 0 (0.0%) |
| Utilities | 0 (0.0%) | 0 (0.0%) |
| Information | 0 (0.0%) | 0 (0.0%) |
| Finance & Insurance | 0 (0.0%) | 0 (0.0%) |
| Real Estate, Rental & Leasing | 0 (0.0%) | 0 (0.0%) |
| Professional & Scientific | 0 (0.0%) | 0 (0.0%) |
| Enterprise Management | 0 (0.0%) | 0 (0.0%) |
| Administrative & Support | 76 (100.0%) | 0 (0.0%) |
| Educational Services | 0 (0.0%) | 0 (0.0%) |
| Health Care & Social Assistance | 17 (100.0%) | 0 (0.0%) |
| Arts, Entertainment & Recreation | 0 (0.0%) | 0 (0.0%) |
| Accommodation & Food Services | 0 (0.0%) | 117 (100.0%) |
| Public Administration | 0 (0.0%) | 24 (100.0%) |
| Total | 122 (46.4%) | 141 (53.6%) |
Education in Leeds
School Enrollment in Leeds
| School Level | # Students | % Students |
| Nursery / Preschool | 0 | 0.0% |
| Kindergarten | 0 | 0.0% |
| Elementary School | 0 | 0.0% |
| Middle School | 0 | 0.0% |
| High School | 0 | 0.0% |
| College / Undergraduate | 0 | 0.0% |
| Graduate / Professional | 0 | 0.0% |
| Total | 0 | 0.0% |
School Enrollment by Age by Funding Source in Leeds
| Age Bracket | Public School | Private School |
| 3 to 4 Year Olds | 0 (0.0%) | 0 (0.0%) |
| 5 to 9 Year Old | 0 (0.0%) | 0 (0.0%) |
| 10 to 14 Year Olds | 0 (0.0%) | 0 (0.0%) |
| 15 to 17 Year Olds | 0 (0.0%) | 0 (0.0%) |
| 18 to 19 Year Olds | 0 (0.0%) | 0 (0.0%) |
| 20 to 24 Year Olds | 0 (0.0%) | 0 (0.0%) |
| 25 to 34 Year Olds | 0 (0.0%) | 0 (0.0%) |
| 35 Years and over | 0 (0.0%) | 0 (0.0%) |
| Total | 0 (0.0%) | 0 (0.0%) |
Educational Attainment by Field of Study in Leeds
Bio, nature & agricultural (76 | 28.2%), literature & languages (65 | 24.2%), social sciences (52 | 19.3%), arts & humanities (52 | 19.3%), and visual & performing arts (24 | 8.9%) are the most common fields of study among 269 individuals in Leeds who have obtained a bachelor's degree or higher.
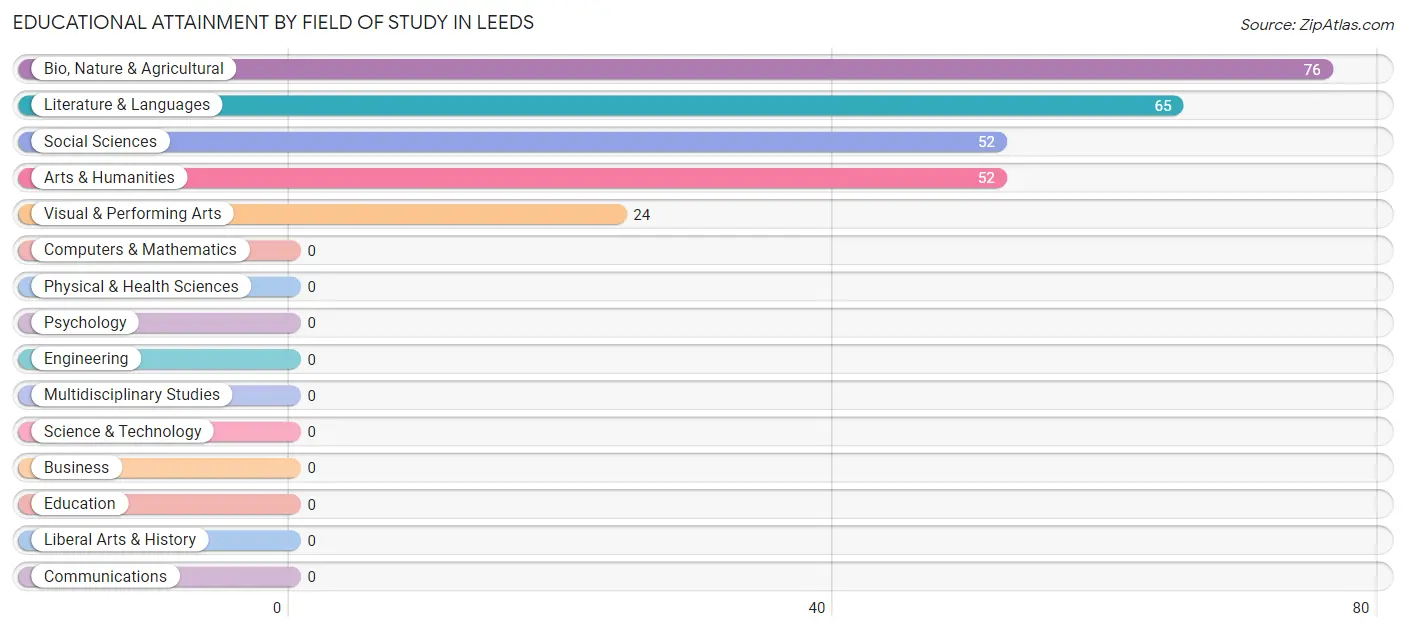
| Field of Study | # Graduates | % Graduates |
| Computers & Mathematics | 0 | 0.0% |
| Bio, Nature & Agricultural | 76 | 28.2% |
| Physical & Health Sciences | 0 | 0.0% |
| Psychology | 0 | 0.0% |
| Social Sciences | 52 | 19.3% |
| Engineering | 0 | 0.0% |
| Multidisciplinary Studies | 0 | 0.0% |
| Science & Technology | 0 | 0.0% |
| Business | 0 | 0.0% |
| Education | 0 | 0.0% |
| Literature & Languages | 65 | 24.2% |
| Liberal Arts & History | 0 | 0.0% |
| Visual & Performing Arts | 24 | 8.9% |
| Communications | 0 | 0.0% |
| Arts & Humanities | 52 | 19.3% |
| Total | 269 | 100.0% |
Transportation & Commute in Leeds
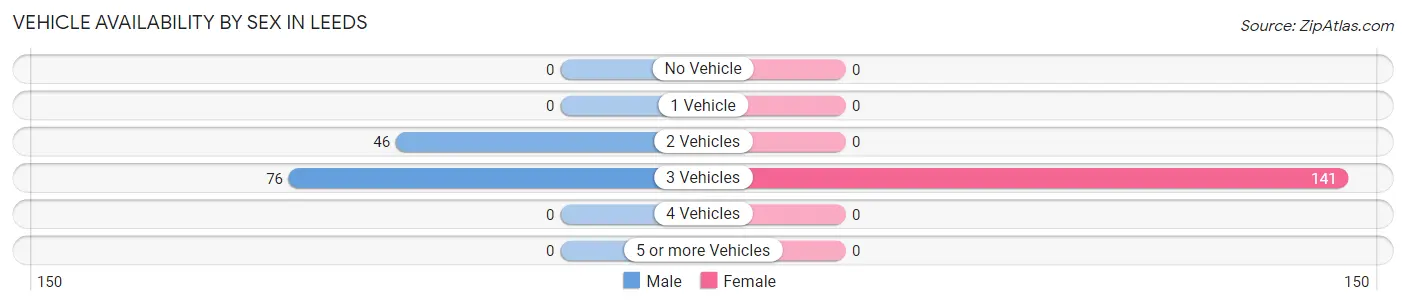
Vehicle Availability by Sex in Leeds
The most prevalent vehicle ownership categories in Leeds are males with 3 vehicles (76, accounting for 62.3%) and females with 3 vehicles (141, making up 53.9%).
| Vehicles Available | Male | Female |
| No Vehicle | 0 (0.0%) | 0 (0.0%) |
| 1 Vehicle | 0 (0.0%) | 0 (0.0%) |
| 2 Vehicles | 46 (37.7%) | 0 (0.0%) |
| 3 Vehicles | 76 (62.3%) | 141 (100.0%) |
| 4 Vehicles | 0 (0.0%) | 0 (0.0%) |
| 5 or more Vehicles | 0 (0.0%) | 0 (0.0%) |
| Total | 122 (100.0%) | 141 (100.0%) |
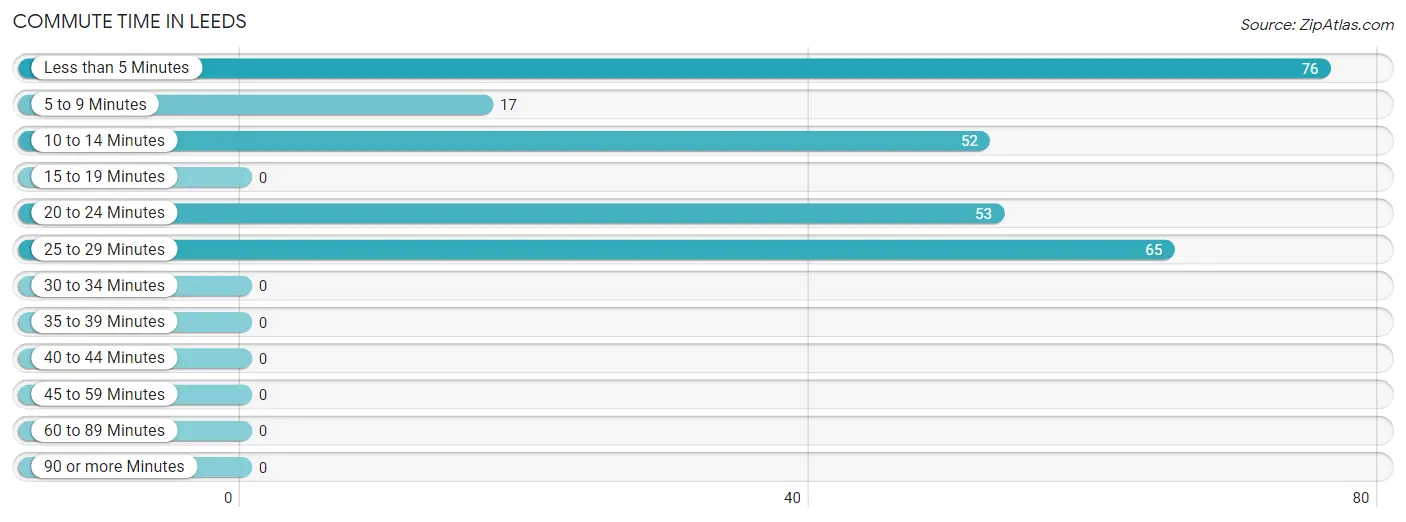
Commute Time in Leeds
The most frequently occuring commute durations in Leeds are less than 5 minutes (76 commuters, 28.9%), 25 to 29 minutes (65 commuters, 24.7%), and 20 to 24 minutes (53 commuters, 20.2%).
| Commute Time | # Commuters | % Commuters |
| Less than 5 Minutes | 76 | 28.9% |
| 5 to 9 Minutes | 17 | 6.5% |
| 10 to 14 Minutes | 52 | 19.8% |
| 15 to 19 Minutes | 0 | 0.0% |
| 20 to 24 Minutes | 53 | 20.2% |
| 25 to 29 Minutes | 65 | 24.7% |
| 30 to 34 Minutes | 0 | 0.0% |
| 35 to 39 Minutes | 0 | 0.0% |
| 40 to 44 Minutes | 0 | 0.0% |
| 45 to 59 Minutes | 0 | 0.0% |
| 60 to 89 Minutes | 0 | 0.0% |
| 90 or more Minutes | 0 | 0.0% |
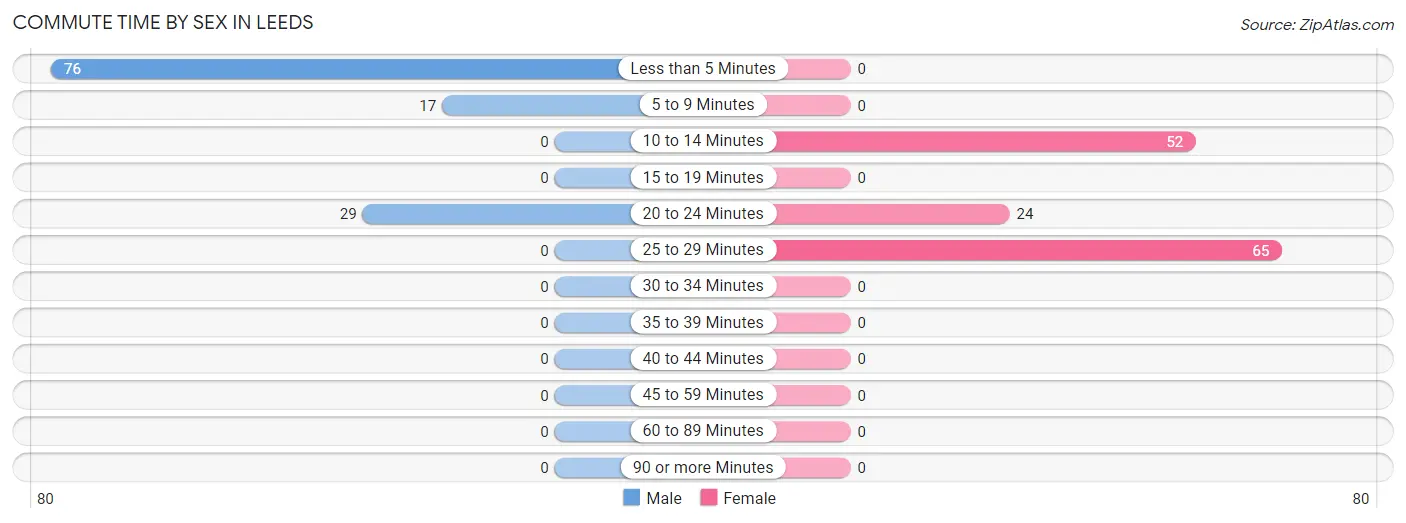
Commute Time by Sex in Leeds
The most common commute times in Leeds are less than 5 minutes (76 commuters, 62.3%) for males and 25 to 29 minutes (65 commuters, 46.1%) for females.
| Commute Time | Male | Female |
| Less than 5 Minutes | 76 (62.3%) | 0 (0.0%) |
| 5 to 9 Minutes | 17 (13.9%) | 0 (0.0%) |
| 10 to 14 Minutes | 0 (0.0%) | 52 (36.9%) |
| 15 to 19 Minutes | 0 (0.0%) | 0 (0.0%) |
| 20 to 24 Minutes | 29 (23.8%) | 24 (17.0%) |
| 25 to 29 Minutes | 0 (0.0%) | 65 (46.1%) |
| 30 to 34 Minutes | 0 (0.0%) | 0 (0.0%) |
| 35 to 39 Minutes | 0 (0.0%) | 0 (0.0%) |
| 40 to 44 Minutes | 0 (0.0%) | 0 (0.0%) |
| 45 to 59 Minutes | 0 (0.0%) | 0 (0.0%) |
| 60 to 89 Minutes | 0 (0.0%) | 0 (0.0%) |
| 90 or more Minutes | 0 (0.0%) | 0 (0.0%) |
Time of Departure to Work by Sex in Leeds
The most frequent times of departure to work in Leeds are 6:00 AM to 6:29 AM (76, 62.3%) for males and 4:00 PM to 11:59 PM (117, 83.0%) for females.
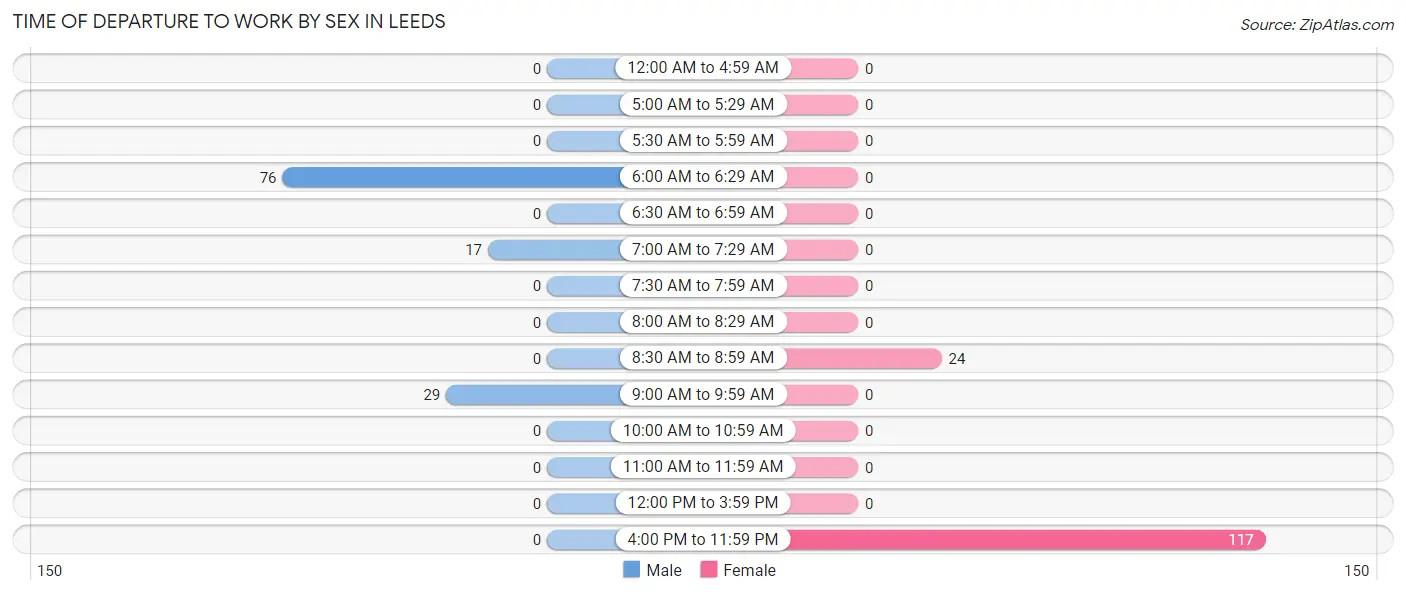
| Time of Departure | Male | Female |
| 12:00 AM to 4:59 AM | 0 (0.0%) | 0 (0.0%) |
| 5:00 AM to 5:29 AM | 0 (0.0%) | 0 (0.0%) |
| 5:30 AM to 5:59 AM | 0 (0.0%) | 0 (0.0%) |
| 6:00 AM to 6:29 AM | 76 (62.3%) | 0 (0.0%) |
| 6:30 AM to 6:59 AM | 0 (0.0%) | 0 (0.0%) |
| 7:00 AM to 7:29 AM | 17 (13.9%) | 0 (0.0%) |
| 7:30 AM to 7:59 AM | 0 (0.0%) | 0 (0.0%) |
| 8:00 AM to 8:29 AM | 0 (0.0%) | 0 (0.0%) |
| 8:30 AM to 8:59 AM | 0 (0.0%) | 24 (17.0%) |
| 9:00 AM to 9:59 AM | 29 (23.8%) | 0 (0.0%) |
| 10:00 AM to 10:59 AM | 0 (0.0%) | 0 (0.0%) |
| 11:00 AM to 11:59 AM | 0 (0.0%) | 0 (0.0%) |
| 12:00 PM to 3:59 PM | 0 (0.0%) | 0 (0.0%) |
| 4:00 PM to 11:59 PM | 0 (0.0%) | 117 (83.0%) |
| Total | 122 (100.0%) | 141 (100.0%) |
Housing Occupancy in Leeds
Occupancy by Ownership in Leeds
Of the total 87 dwellings in Leeds, owner-occupied units account for 63 (72.4%), while renter-occupied units make up 24 (27.6%).
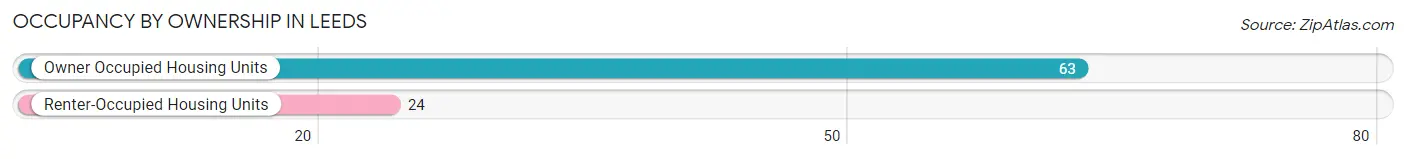
| Occupancy | # Housing Units | % Housing Units |
| Owner Occupied Housing Units | 63 | 72.4% |
| Renter-Occupied Housing Units | 24 | 27.6% |
| Total Occupied Housing Units | 87 | 100.0% |
Occupancy by Household Size in Leeds
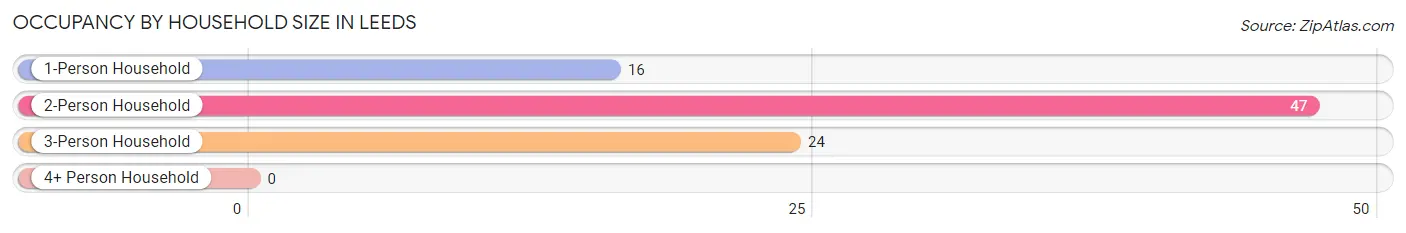
| Household Size | # Housing Units | % Housing Units |
| 1-Person Household | 16 | 18.4% |
| 2-Person Household | 47 | 54.0% |
| 3-Person Household | 24 | 27.6% |
| 4+ Person Household | 0 | 0.0% |
| Total Housing Units | 87 | 100.0% |
Occupancy by Ownership by Household Size in Leeds
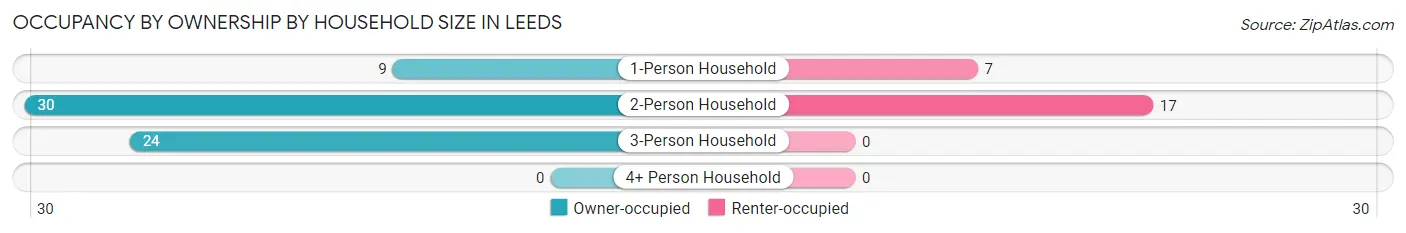
| Household Size | Owner-occupied | Renter-occupied |
| 1-Person Household | 9 (56.2%) | 7 (43.8%) |
| 2-Person Household | 30 (63.8%) | 17 (36.2%) |
| 3-Person Household | 24 (100.0%) | 0 (0.0%) |
| 4+ Person Household | 0 (0.0%) | 0 (0.0%) |
| Total Housing Units | 63 (72.4%) | 24 (27.6%) |
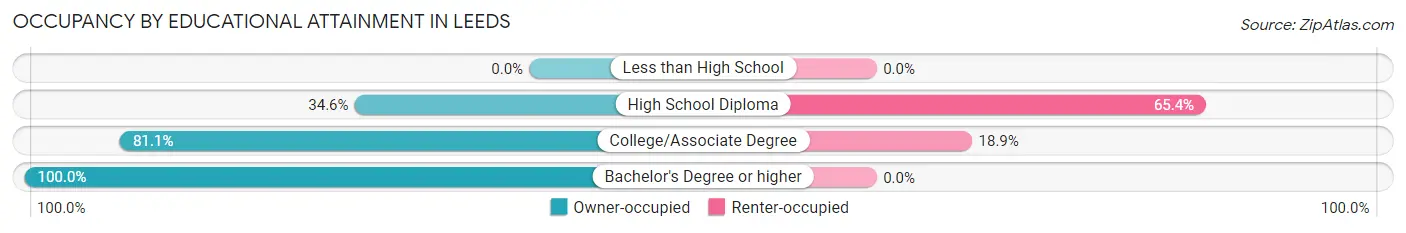
Occupancy by Educational Attainment in Leeds
| Household Size | Owner-occupied | Renter-occupied |
| Less than High School | 0 (0.0%) | 0 (0.0%) |
| High School Diploma | 9 (34.6%) | 17 (65.4%) |
| College/Associate Degree | 30 (81.1%) | 7 (18.9%) |
| Bachelor's Degree or higher | 24 (100.0%) | 0 (0.0%) |
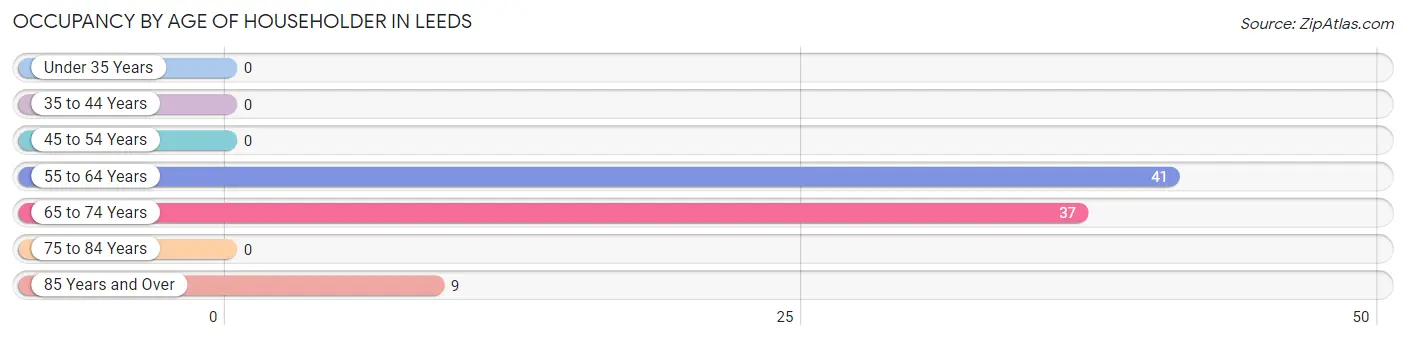
Occupancy by Age of Householder in Leeds
| Age Bracket | # Households | % Households |
| Under 35 Years | 0 | 0.0% |
| 35 to 44 Years | 0 | 0.0% |
| 45 to 54 Years | 0 | 0.0% |
| 55 to 64 Years | 41 | 47.1% |
| 65 to 74 Years | 37 | 42.5% |
| 75 to 84 Years | 0 | 0.0% |
| 85 Years and Over | 9 | 10.3% |
| Total | 87 | 100.0% |
Housing Finances in Leeds
Median Income by Occupancy in Leeds
| Occupancy Type | # Households | Median Income |
| Owner-Occupied | 63 (72.4%) | $0 |
| Renter-Occupied | 24 (27.6%) | $0 |
| Average | 87 (100.0%) | $0 |
Occupancy by Householder Income Bracket in Leeds
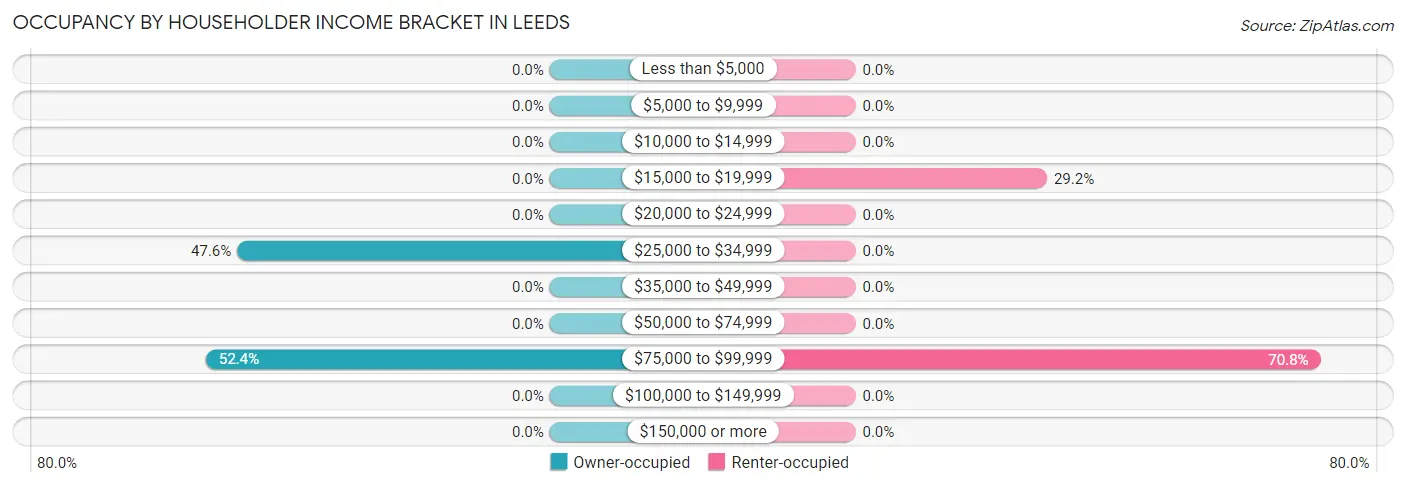
| Income Bracket | Owner-occupied | Renter-occupied |
| Less than $5,000 | 0 (0.0%) | 0 (0.0%) |
| $5,000 to $9,999 | 0 (0.0%) | 0 (0.0%) |
| $10,000 to $14,999 | 0 (0.0%) | 0 (0.0%) |
| $15,000 to $19,999 | 0 (0.0%) | 7 (29.2%) |
| $20,000 to $24,999 | 0 (0.0%) | 0 (0.0%) |
| $25,000 to $34,999 | 30 (47.6%) | 0 (0.0%) |
| $35,000 to $49,999 | 0 (0.0%) | 0 (0.0%) |
| $50,000 to $74,999 | 0 (0.0%) | 0 (0.0%) |
| $75,000 to $99,999 | 33 (52.4%) | 17 (70.8%) |
| $100,000 to $149,999 | 0 (0.0%) | 0 (0.0%) |
| $150,000 or more | 0 (0.0%) | 0 (0.0%) |
| Total | 63 (100.0%) | 24 (100.0%) |
Monthly Housing Cost Tiers in Leeds
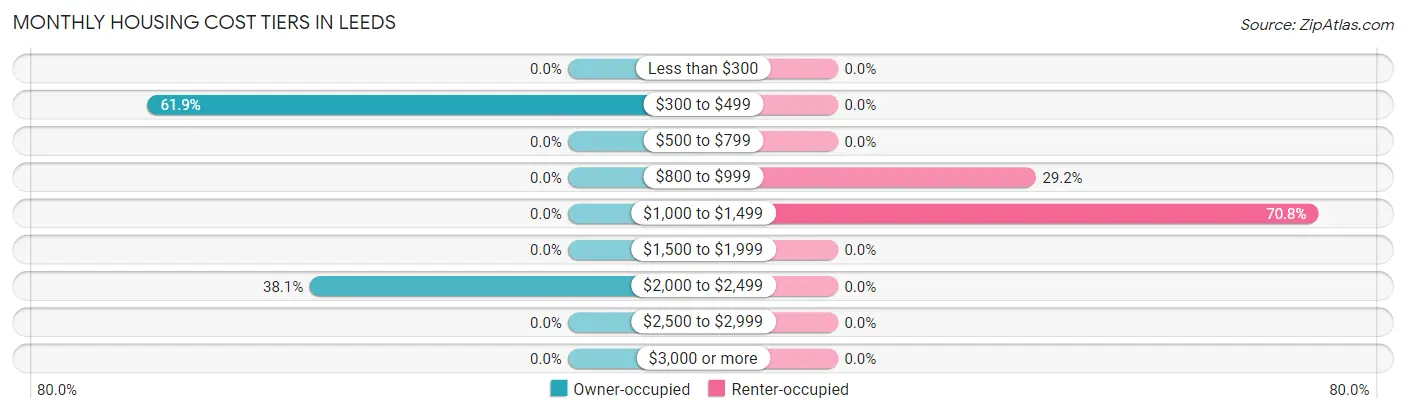
| Monthly Cost | Owner-occupied | Renter-occupied |
| Less than $300 | 0 (0.0%) | 0 (0.0%) |
| $300 to $499 | 39 (61.9%) | 0 (0.0%) |
| $500 to $799 | 0 (0.0%) | 0 (0.0%) |
| $800 to $999 | 0 (0.0%) | 7 (29.2%) |
| $1,000 to $1,499 | 0 (0.0%) | 17 (70.8%) |
| $1,500 to $1,999 | 0 (0.0%) | 0 (0.0%) |
| $2,000 to $2,499 | 24 (38.1%) | 0 (0.0%) |
| $2,500 to $2,999 | 0 (0.0%) | 0 (0.0%) |
| $3,000 or more | 0 (0.0%) | 0 (0.0%) |
| Total | 63 (100.0%) | 24 (100.0%) |
Physical Housing Characteristics in Leeds
Housing Structures in Leeds
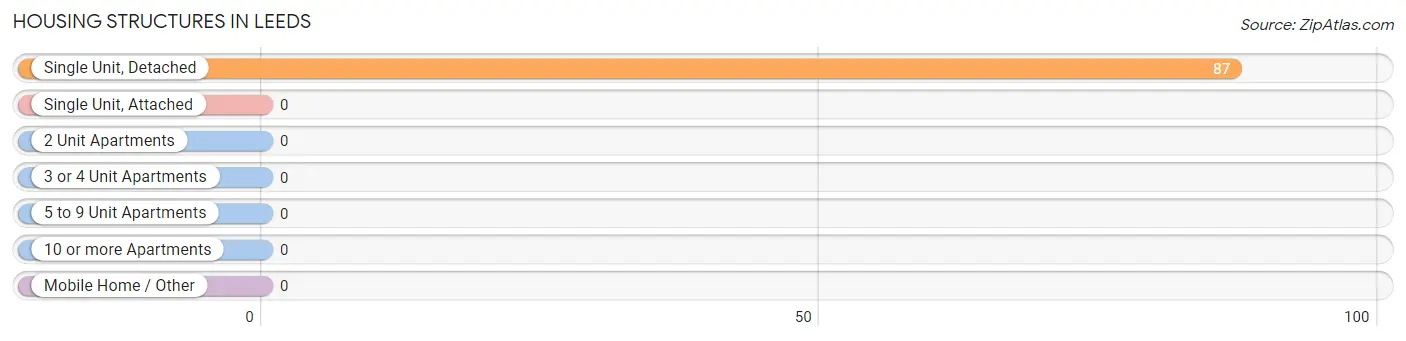
| Structure Type | # Housing Units | % Housing Units |
| Single Unit, Detached | 87 | 100.0% |
| Single Unit, Attached | 0 | 0.0% |
| 2 Unit Apartments | 0 | 0.0% |
| 3 or 4 Unit Apartments | 0 | 0.0% |
| 5 to 9 Unit Apartments | 0 | 0.0% |
| 10 or more Apartments | 0 | 0.0% |
| Mobile Home / Other | 0 | 0.0% |
| Total | 87 | 100.0% |
Housing Structures by Occupancy in Leeds
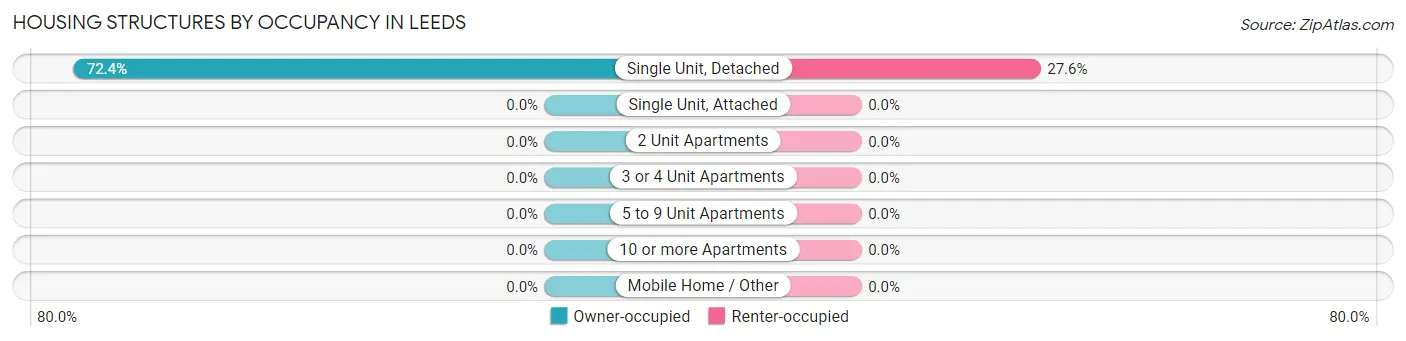
| Structure Type | Owner-occupied | Renter-occupied |
| Single Unit, Detached | 63 (72.4%) | 24 (27.6%) |
| Single Unit, Attached | 0 (0.0%) | 0 (0.0%) |
| 2 Unit Apartments | 0 (0.0%) | 0 (0.0%) |
| 3 or 4 Unit Apartments | 0 (0.0%) | 0 (0.0%) |
| 5 to 9 Unit Apartments | 0 (0.0%) | 0 (0.0%) |
| 10 or more Apartments | 0 (0.0%) | 0 (0.0%) |
| Mobile Home / Other | 0 (0.0%) | 0 (0.0%) |
| Total | 63 (72.4%) | 24 (27.6%) |
Housing Structures by Number of Rooms in Leeds
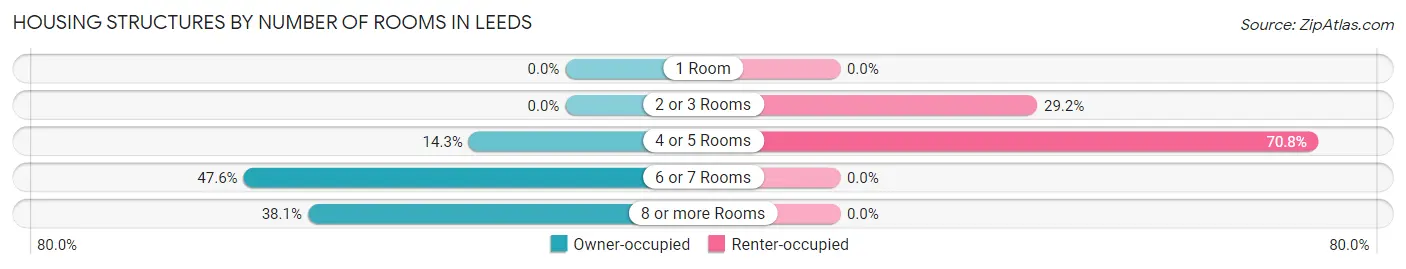
| Number of Rooms | Owner-occupied | Renter-occupied |
| 1 Room | 0 (0.0%) | 0 (0.0%) |
| 2 or 3 Rooms | 0 (0.0%) | 7 (29.2%) |
| 4 or 5 Rooms | 9 (14.3%) | 17 (70.8%) |
| 6 or 7 Rooms | 30 (47.6%) | 0 (0.0%) |
| 8 or more Rooms | 24 (38.1%) | 0 (0.0%) |
| Total | 63 (100.0%) | 24 (100.0%) |
Housing Structure by Heating Type in Leeds
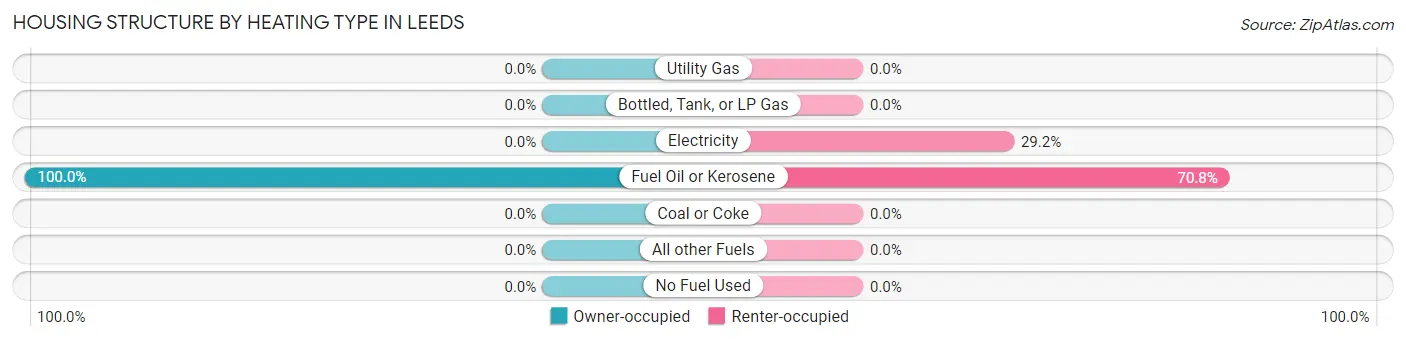
| Heating Type | Owner-occupied | Renter-occupied |
| Utility Gas | 0 (0.0%) | 0 (0.0%) |
| Bottled, Tank, or LP Gas | 0 (0.0%) | 0 (0.0%) |
| Electricity | 0 (0.0%) | 7 (29.2%) |
| Fuel Oil or Kerosene | 63 (100.0%) | 17 (70.8%) |
| Coal or Coke | 0 (0.0%) | 0 (0.0%) |
| All other Fuels | 0 (0.0%) | 0 (0.0%) |
| No Fuel Used | 0 (0.0%) | 0 (0.0%) |
| Total | 63 (100.0%) | 24 (100.0%) |
Household Vehicle Usage in Leeds
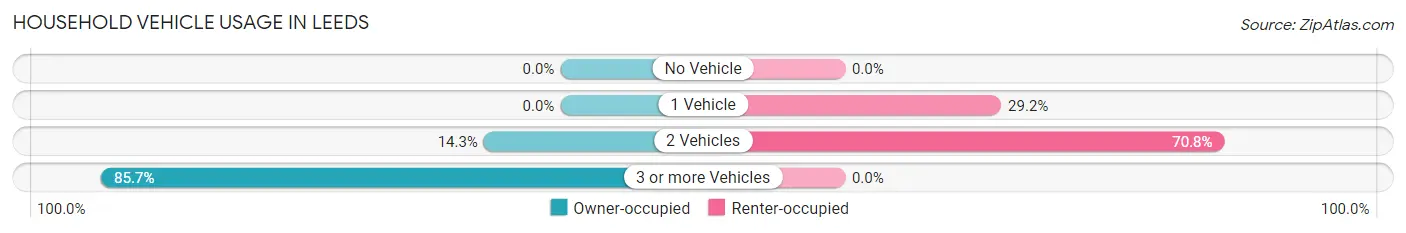
| Vehicles per Household | Owner-occupied | Renter-occupied |
| No Vehicle | 0 (0.0%) | 0 (0.0%) |
| 1 Vehicle | 0 (0.0%) | 7 (29.2%) |
| 2 Vehicles | 9 (14.3%) | 17 (70.8%) |
| 3 or more Vehicles | 54 (85.7%) | 0 (0.0%) |
| Total | 63 (100.0%) | 24 (100.0%) |
Real Estate & Mortgages in Leeds
Real Estate and Mortgage Overview in Leeds
| Characteristic | Without Mortgage | With Mortgage |
| Housing Units | 39 | 24 |
| Median Property Value | - | - |
| Median Household Income | - | - |
| Monthly Housing Costs | - | - |
| Real Estate Taxes | - | - |
Property Value by Mortgage Status in Leeds
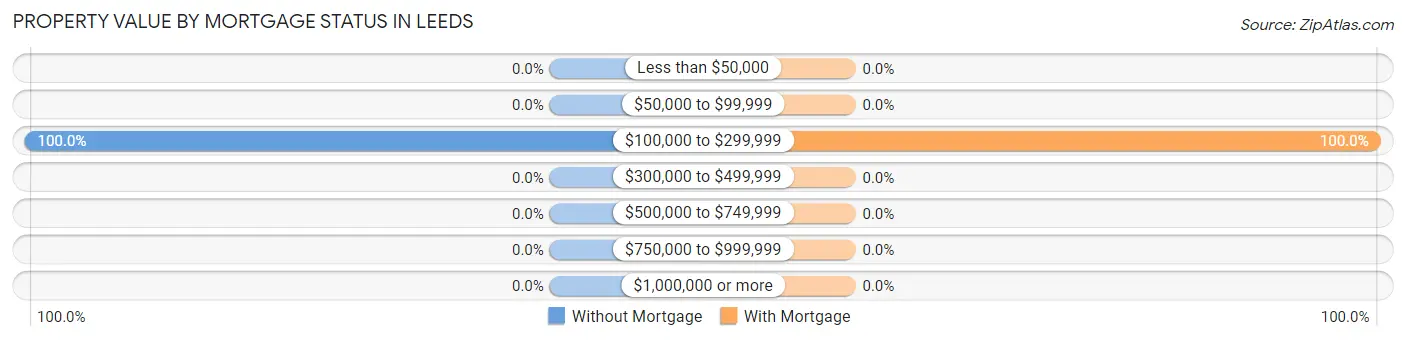
| Property Value | Without Mortgage | With Mortgage |
| Less than $50,000 | 0 (0.0%) | 0 (0.0%) |
| $50,000 to $99,999 | 0 (0.0%) | 0 (0.0%) |
| $100,000 to $299,999 | 39 (100.0%) | 24 (100.0%) |
| $300,000 to $499,999 | 0 (0.0%) | 0 (0.0%) |
| $500,000 to $749,999 | 0 (0.0%) | 0 (0.0%) |
| $750,000 to $999,999 | 0 (0.0%) | 0 (0.0%) |
| $1,000,000 or more | 0 (0.0%) | 0 (0.0%) |
| Total | 39 (100.0%) | 24 (100.0%) |
Household Income by Mortgage Status in Leeds
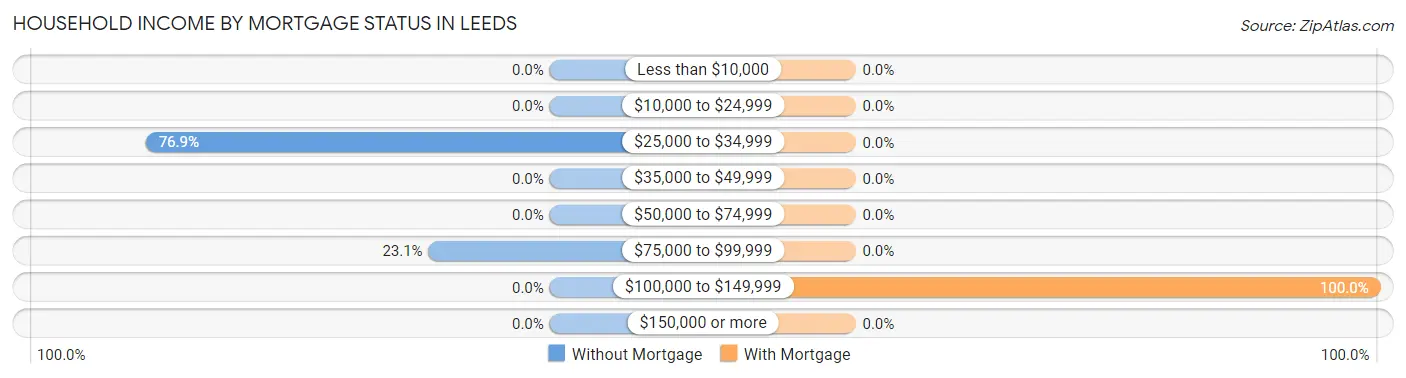
| Household Income | Without Mortgage | With Mortgage |
| Less than $10,000 | 0 (0.0%) | 0 (0.0%) |
| $10,000 to $24,999 | 0 (0.0%) | 0 (0.0%) |
| $25,000 to $34,999 | 30 (76.9%) | 0 (0.0%) |
| $35,000 to $49,999 | 0 (0.0%) | 0 (0.0%) |
| $50,000 to $74,999 | 0 (0.0%) | 0 (0.0%) |
| $75,000 to $99,999 | 9 (23.1%) | 0 (0.0%) |
| $100,000 to $149,999 | 0 (0.0%) | 24 (100.0%) |
| $150,000 or more | 0 (0.0%) | 0 (0.0%) |
| Total | 39 (100.0%) | 24 (100.0%) |
Property Value to Household Income Ratio in Leeds
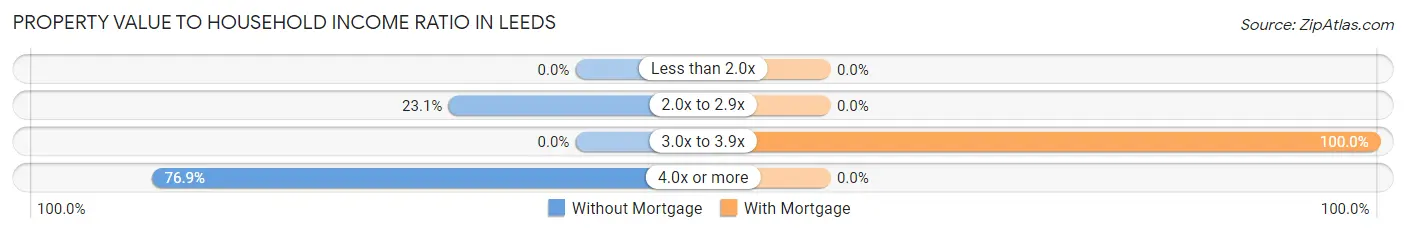
| Value-to-Income Ratio | Without Mortgage | With Mortgage |
| Less than 2.0x | 0 (0.0%) | 0 (0.0%) |
| 2.0x to 2.9x | 9 (23.1%) | 0 (0.0%) |
| 3.0x to 3.9x | 0 (0.0%) | 24 (100.0%) |
| 4.0x or more | 30 (76.9%) | 0 (0.0%) |
| Total | 39 (100.0%) | 24 (100.0%) |
Real Estate Taxes by Mortgage Status in Leeds
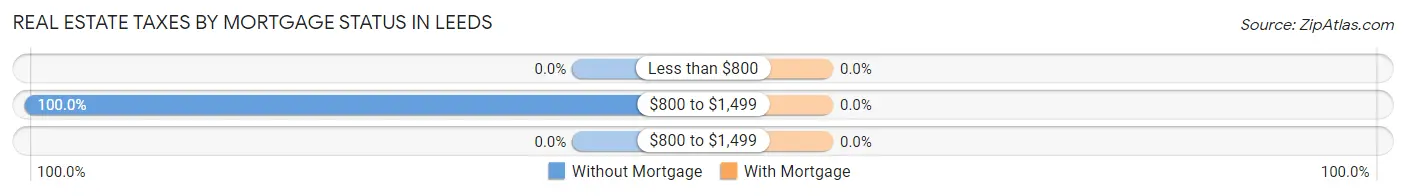
| Property Taxes | Without Mortgage | With Mortgage |
| Less than $800 | 0 (0.0%) | 0 (0.0%) |
| $800 to $1,499 | 39 (100.0%) | 0 (0.0%) |
| $800 to $1,499 | 0 (0.0%) | 0 (0.0%) |
| Total | 39 (100.0%) | 24 (100.0%) |
Health & Disability in Leeds
Health Insurance Coverage by Age in Leeds
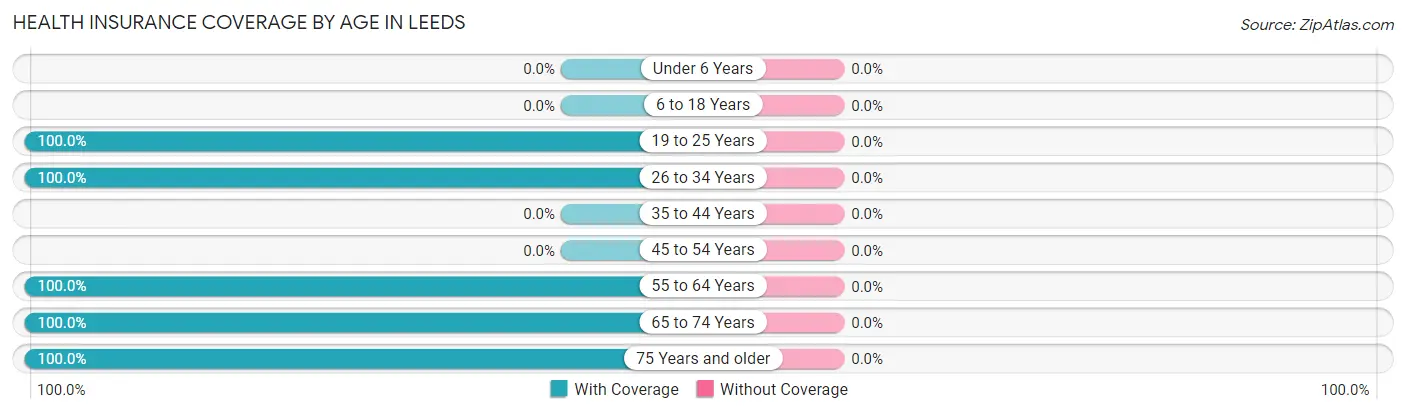
| Age Bracket | With Coverage | Without Coverage |
| Under 6 Years | 0 (0.0%) | 0 (0.0%) |
| 6 to 18 Years | 0 (0.0%) | 0 (0.0%) |
| 19 to 25 Years | 29 (100.0%) | 0 (0.0%) |
| 26 to 34 Years | 193 (100.0%) | 0 (0.0%) |
| 35 to 44 Years | 0 (0.0%) | 0 (0.0%) |
| 45 to 54 Years | 0 (0.0%) | 0 (0.0%) |
| 55 to 64 Years | 41 (100.0%) | 0 (0.0%) |
| 65 to 74 Years | 37 (100.0%) | 0 (0.0%) |
| 75 Years and older | 9 (100.0%) | 0 (0.0%) |
| Total | 309 (100.0%) | 0 (0.0%) |
Health Insurance Coverage by Citizenship Status in Leeds
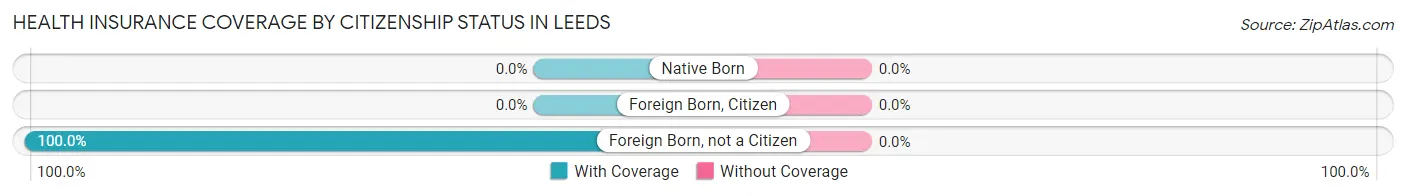
| Citizenship Status | With Coverage | Without Coverage |
| Native Born | 0 (0.0%) | 0 (0.0%) |
| Foreign Born, Citizen | 0 (0.0%) | 0 (0.0%) |
| Foreign Born, not a Citizen | 29 (100.0%) | 0 (0.0%) |
Health Insurance Coverage by Household Income in Leeds
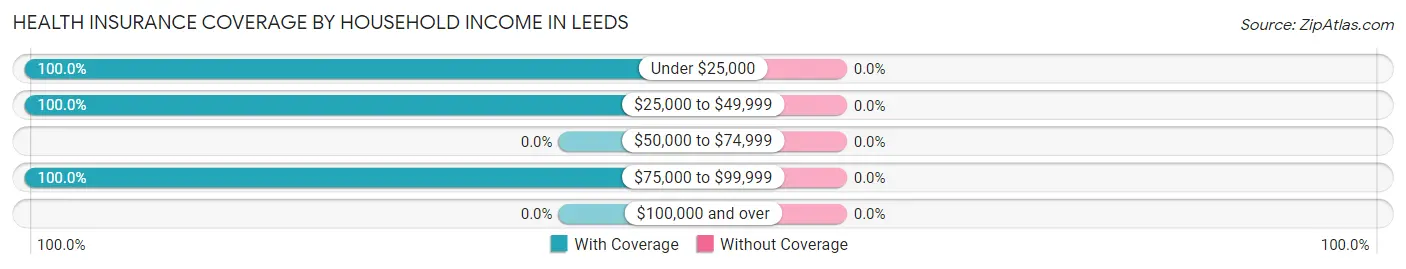
| Household Income | With Coverage | Without Coverage |
| Under $25,000 | 7 (100.0%) | 0 (0.0%) |
| $25,000 to $49,999 | 106 (100.0%) | 0 (0.0%) |
| $50,000 to $74,999 | 0 (0.0%) | 0 (0.0%) |
| $75,000 to $99,999 | 196 (100.0%) | 0 (0.0%) |
| $100,000 and over | 0 (0.0%) | 0 (0.0%) |
Public vs Private Health Insurance Coverage by Age in Leeds
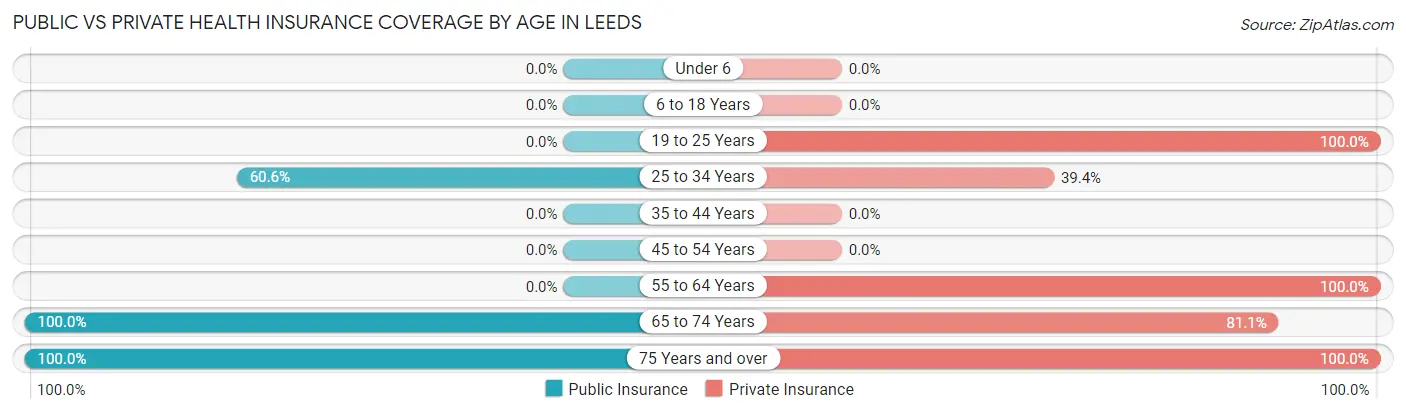
| Age Bracket | Public Insurance | Private Insurance |
| Under 6 | 0 (0.0%) | 0 (0.0%) |
| 6 to 18 Years | 0 (0.0%) | 0 (0.0%) |
| 19 to 25 Years | 0 (0.0%) | 29 (100.0%) |
| 25 to 34 Years | 117 (60.6%) | 76 (39.4%) |
| 35 to 44 Years | 0 (0.0%) | 0 (0.0%) |
| 45 to 54 Years | 0 (0.0%) | 0 (0.0%) |
| 55 to 64 Years | 0 (0.0%) | 41 (100.0%) |
| 65 to 74 Years | 37 (100.0%) | 30 (81.1%) |
| 75 Years and over | 9 (100.0%) | 9 (100.0%) |
| Total | 163 (52.7%) | 185 (59.9%) |
Disability Status by Sex by Age in Leeds
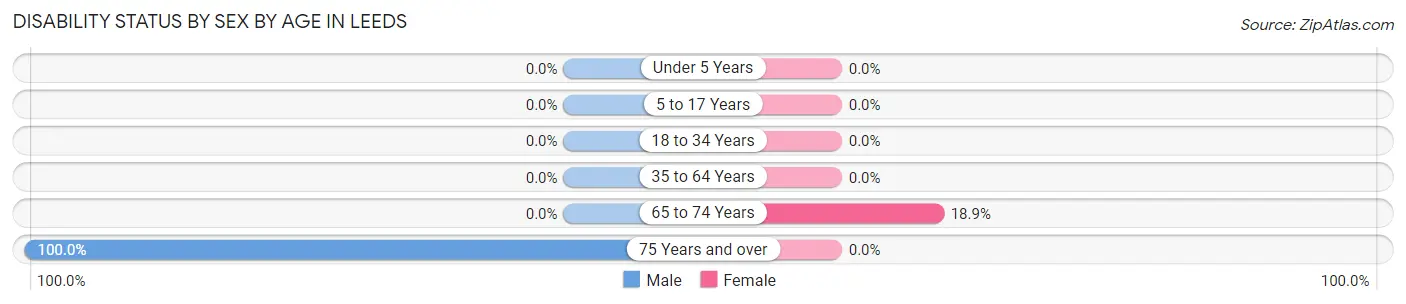
| Age Bracket | Male | Female |
| Under 5 Years | 0 (0.0%) | 0 (0.0%) |
| 5 to 17 Years | 0 (0.0%) | 0 (0.0%) |
| 18 to 34 Years | 0 (0.0%) | 0 (0.0%) |
| 35 to 64 Years | 0 (0.0%) | 0 (0.0%) |
| 65 to 74 Years | 0 (0.0%) | 7 (18.9%) |
| 75 Years and over | 9 (100.0%) | 0 (0.0%) |
Disability Class by Sex by Age in Leeds
Disability Class: Hearing Difficulty
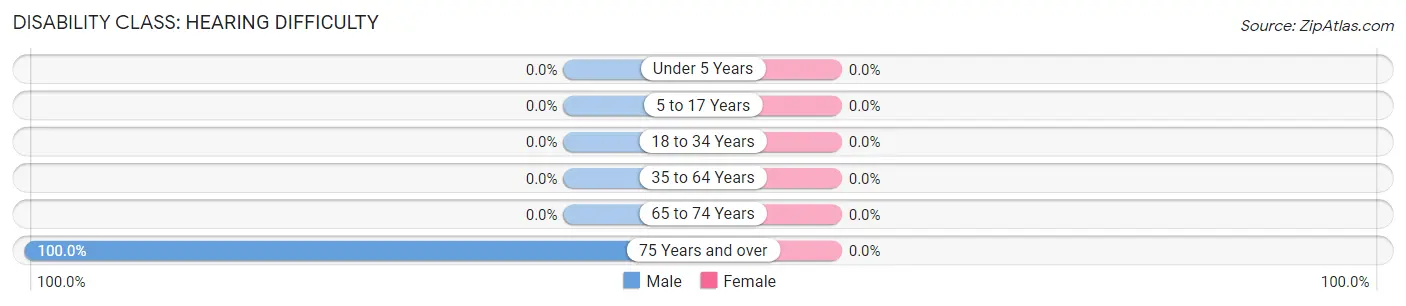
| Age Bracket | Male | Female |
| Under 5 Years | 0 (0.0%) | 0 (0.0%) |
| 5 to 17 Years | 0 (0.0%) | 0 (0.0%) |
| 18 to 34 Years | 0 (0.0%) | 0 (0.0%) |
| 35 to 64 Years | 0 (0.0%) | 0 (0.0%) |
| 65 to 74 Years | 0 (0.0%) | 0 (0.0%) |
| 75 Years and over | 9 (100.0%) | 0 (0.0%) |
Disability Class: Vision Difficulty
| Age Bracket | Male | Female |
| Under 5 Years | 0 (0.0%) | 0 (0.0%) |
| 5 to 17 Years | 0 (0.0%) | 0 (0.0%) |
| 18 to 34 Years | 0 (0.0%) | 0 (0.0%) |
| 35 to 64 Years | 0 (0.0%) | 0 (0.0%) |
| 65 to 74 Years | 0 (0.0%) | 0 (0.0%) |
| 75 Years and over | 0 (0.0%) | 0 (0.0%) |
Disability Class: Cognitive Difficulty
| Age Bracket | Male | Female |
| 5 to 17 Years | 0 (0.0%) | 0 (0.0%) |
| 18 to 34 Years | 0 (0.0%) | 0 (0.0%) |
| 35 to 64 Years | 0 (0.0%) | 0 (0.0%) |
| 65 to 74 Years | 0 (0.0%) | 0 (0.0%) |
| 75 Years and over | 0 (0.0%) | 0 (0.0%) |
Disability Class: Ambulatory Difficulty
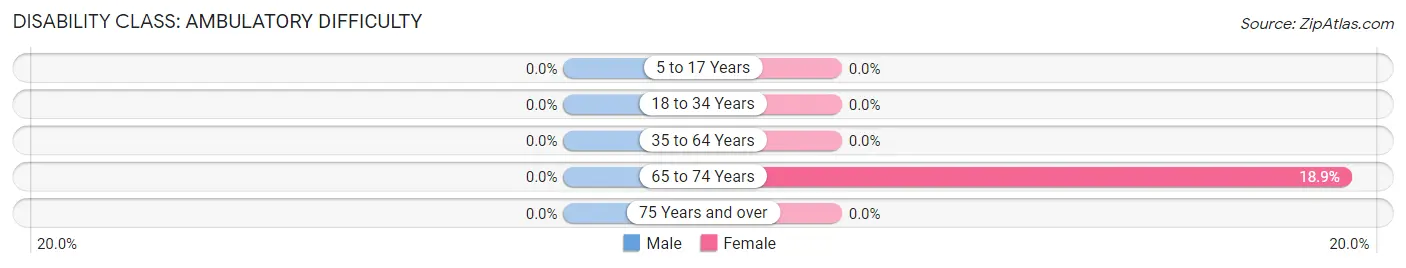
| Age Bracket | Male | Female |
| 5 to 17 Years | 0 (0.0%) | 0 (0.0%) |
| 18 to 34 Years | 0 (0.0%) | 0 (0.0%) |
| 35 to 64 Years | 0 (0.0%) | 0 (0.0%) |
| 65 to 74 Years | 0 (0.0%) | 7 (18.9%) |
| 75 Years and over | 0 (0.0%) | 0 (0.0%) |
Disability Class: Self-Care Difficulty
| Age Bracket | Male | Female |
| 5 to 17 Years | 0 (0.0%) | 0 (0.0%) |
| 18 to 34 Years | 0 (0.0%) | 0 (0.0%) |
| 35 to 64 Years | 0 (0.0%) | 0 (0.0%) |
| 65 to 74 Years | 0 (0.0%) | 0 (0.0%) |
| 75 Years and over | 0 (0.0%) | 0 (0.0%) |
Technology Access in Leeds
Computing Device Access in Leeds
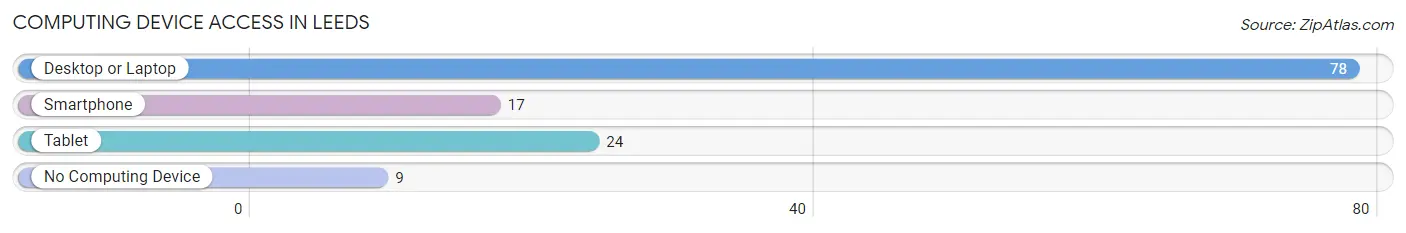
| Device Type | # Households | % Households |
| Desktop or Laptop | 78 | 89.7% |
| Smartphone | 17 | 19.5% |
| Tablet | 24 | 27.6% |
| No Computing Device | 9 | 10.3% |
| Total | 87 | 100.0% |
Internet Access in Leeds
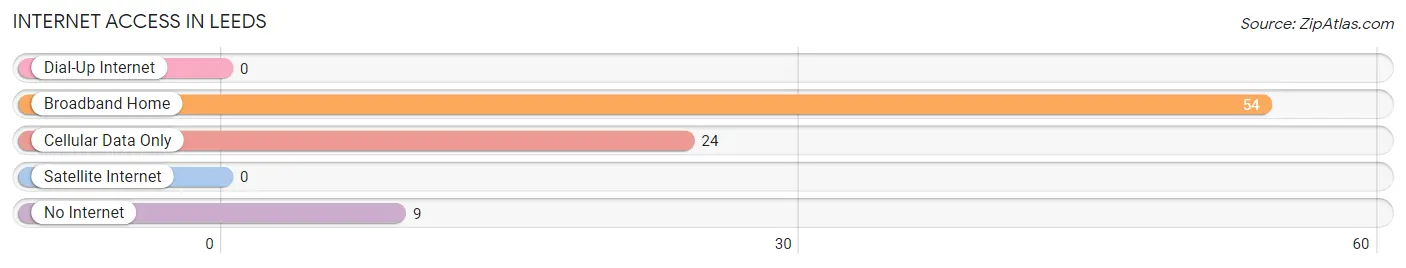
| Internet Type | # Households | % Households |
| Dial-Up Internet | 0 | 0.0% |
| Broadband Home | 54 | 62.1% |
| Cellular Data Only | 24 | 27.6% |
| Satellite Internet | 0 | 0.0% |
| No Internet | 9 | 10.3% |
| Total | 87 | 100.0% |
Leeds Summary
Leeds is a small town located in the Finger Lakes region of New York State. It is situated in the Town of Torrey in Yates County, approximately 20 miles south of Geneva and 30 miles east of Rochester. Leeds is a rural community with a population of approximately 1,000 people.
History
Leeds was first settled in 1790 by a group of settlers from Massachusetts. The town was originally known as “Leeds Corners” and was named after the Leeds family who were among the first settlers. The town was officially incorporated in 1817.
In the early 19th century, Leeds was a thriving agricultural community. The town was known for its production of apples, grapes, and other fruits. The town also had a number of mills, including a grist mill, a saw mill, and a woolen mill.
In the late 19th century, Leeds began to experience a decline in its agricultural industry. This was due to the introduction of new farming techniques and the development of new transportation routes. As a result, many of the town’s residents began to look for other sources of income.
In the early 20th century, Leeds began to experience a resurgence in its economy. This was due to the development of the nearby Seneca Lake and the construction of the New York State Barge Canal. The canal provided a new transportation route for goods and services, which helped to revitalize the town’s economy.
Geography
Leeds is located in the Finger Lakes region of New York State. The town is situated in the Town of Torrey in Yates County, approximately 20 miles south of Geneva and 30 miles east of Rochester.
The town is located on the western shore of Seneca Lake, the largest of the Finger Lakes. The lake is approximately 40 miles long and is a popular destination for fishing, boating, and other recreational activities.
The town is also located near several state parks, including Letchworth State Park, which is known for its spectacular waterfalls and gorges.
Economy
Leeds is a rural community with a population of approximately 1,000 people. The town’s economy is largely based on agriculture and tourism.
Agriculture is still an important part of the town’s economy. The town is known for its production of apples, grapes, and other fruits. The town also has a number of wineries and vineyards, which attract visitors from all over the region.
Tourism is also an important part of the town’s economy. The town is located near several state parks, including Letchworth State Park, which is known for its spectacular waterfalls and gorges. The town is also located on the western shore of Seneca Lake, which is a popular destination for fishing, boating, and other recreational activities.
Demographics
As of the 2010 census, the population of Leeds was 1,037. The racial makeup of the town was 97.3% White, 0.7% African American, 0.2% Native American, 0.2% Asian, 0.2% from other races, and 1.5% from two or more races. Hispanic or Latino of any race were 1.2% of the population.
The median household income in Leeds was $45,000, and the median family income was $50,000. The per capita income for the town was $20,000. About 8.3% of families and 10.2% of the population were below the poverty line, including 13.2% of those under age 18 and 8.3% of those age 65 or over.
Conclusion
Leeds is a small town located in the Finger Lakes region of New York State. It is situated in the Town of Torrey in Yates County, approximately 20 miles south of Geneva and 30 miles east of Rochester. Leeds is a rural community with a population of approximately 1,000 people. The town’s economy is largely based on agriculture and tourism. The town is known for its production of apples, grapes, and other fruits, and is also located near several state parks, including Letchworth State Park, which is known for its spectacular waterfalls and gorges. The racial makeup of the town was 97.3% White, 0.7% African American, 0.2% Native American, 0.2% Asian, 0.2% from other races, and 1.5% from two or more races. The median household income in Leeds was $45,000, and the median family income was $50,000.
Common Questions
What is Per Capita Income in Leeds?
Per Capita income in Leeds is $19,513.
What is Income or Wage Gap in Leeds?
Income or Wage Gap in Leeds is 87.9%.
Women in Leeds earn 12.1 cents for every dollar earned by a man.
What is Inequality or Gini Index in Leeds?
Inequality or Gini Index in Leeds is 0.27.
What is the Total Population of Leeds?
Total Population of Leeds is 309.
What is the Total Male Population of Leeds?
Total Male Population of Leeds is 131.
What is the Total Female Population of Leeds?
Total Female Population of Leeds is 178.
What is the Ratio of Males per 100 Females in Leeds?
There are 73.60 Males per 100 Females in Leeds.
What is the Ratio of Females per 100 Males in Leeds?
There are 135.88 Females per 100 Males in Leeds.
What is the Median Population Age in Leeds?
Median Population Age in Leeds is 31.1 Years.
What is the Average Family Size in Leeds
Average Family Size in Leeds is 4.1 People.
What is the Average Household Size in Leeds
Average Household Size in Leeds is 3.5 People.
How Large is the Labor Force in Leeds?
There are 263 People in the Labor Forcein in Leeds.
What is the Percentage of People in the Labor Force in Leeds?
85.1% of People are in the Labor Force in Leeds.