Keuka Park, NY Map & Demographics
Keuka Park Map
Keuka Park Overview
$16,685
PER CAPITA INCOME
$89,063
AVG FAMILY INCOME
$79,569
AVG HOUSEHOLD INCOME
50.4%
WAGE / INCOME GAP [ % ]
49.6¢/ $1
WAGE / INCOME GAP [ $ ]
0.37
INEQUALITY / GINI INDEX
1,092
TOTAL POPULATION
428
MALE POPULATION
664
FEMALE POPULATION
64.46
MALES / 100 FEMALES
155.14
FEMALES / 100 MALES
20.4
MEDIAN AGE
3.2
AVG FAMILY SIZE
2.1
AVG HOUSEHOLD SIZE
518
LABOR FORCE [ PEOPLE ]
50.7%
PERCENT IN LABOR FORCE
5.6%
UNEMPLOYMENT RATE
Keuka Park Zip Codes
Keuka Park Area Codes
Income in Keuka Park
Income Overview in Keuka Park
Per Capita Income in Keuka Park is $16,685, while median incomes of families and households are $89,063 and $79,569 respectively.
| Characteristic | Number | Measure |
| Per Capita Income | 1,092 | $16,685 |
| Median Family Income | 72 | $89,063 |
| Mean Family Income | 72 | $136,767 |
| Median Household Income | 140 | $79,569 |
| Mean Household Income | 140 | $97,649 |
| Income Deficit | 72 | $0 |
| Wage / Income Gap (%) | 1,092 | 50.38% |
| Wage / Income Gap ($) | 1,092 | 49.62¢ per $1 |
| Gini / Inequality Index | 1,092 | 0.37 |
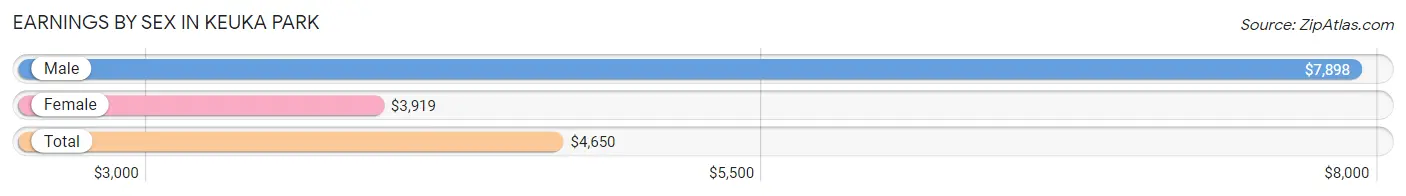
Earnings by Sex in Keuka Park
Average Earnings in Keuka Park are $4,650, $7,898 for men and $3,919 for women, a difference of 50.4%.
| Sex | Number | Average Earnings |
| Male | 293 (37.3%) | $7,898 |
| Female | 493 (62.7%) | $3,919 |
| Total | 786 (100.0%) | $4,650 |
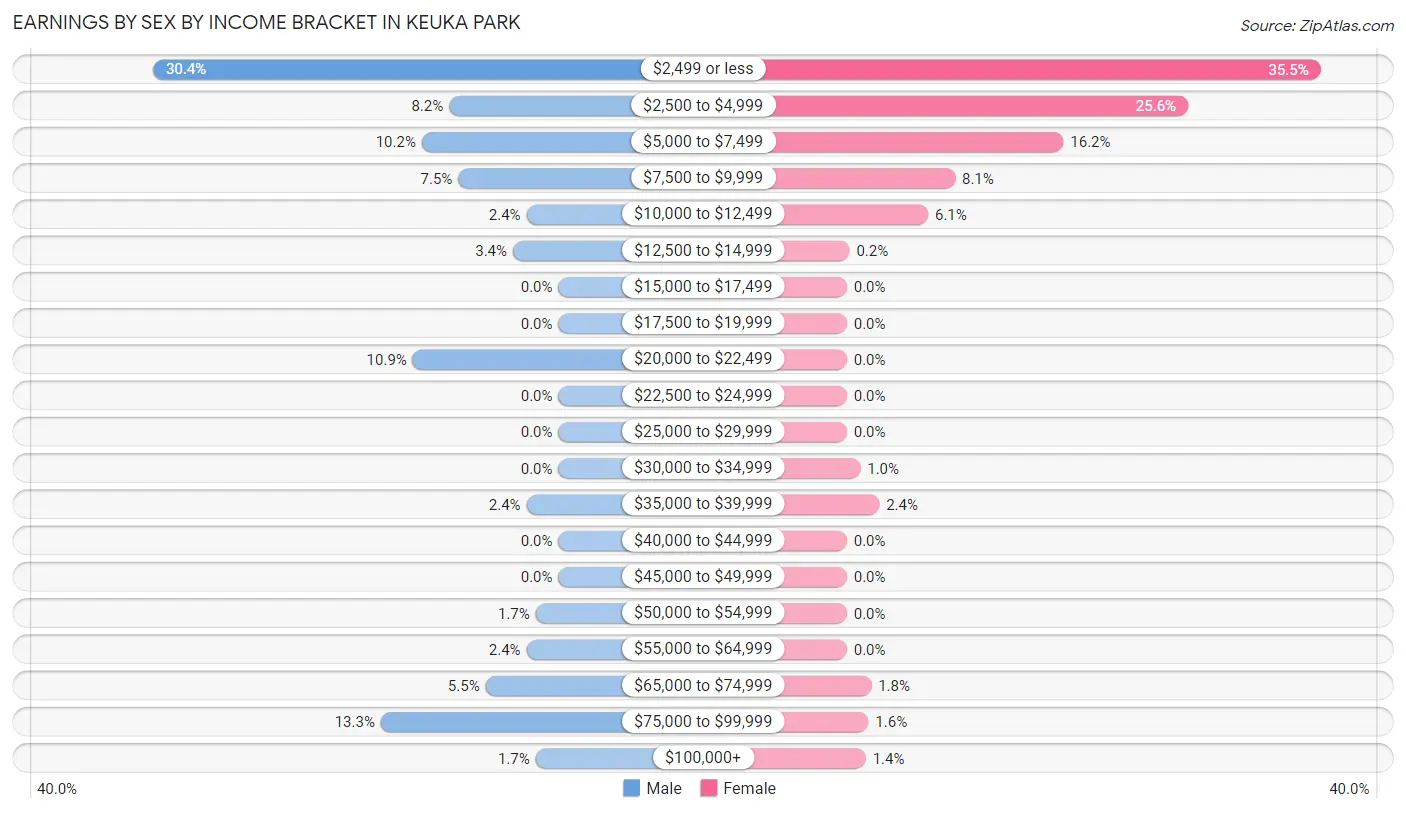
Earnings by Sex by Income Bracket in Keuka Park
The most common earnings brackets in Keuka Park are $2,499 or less for men (89 | 30.4%) and $2,499 or less for women (175 | 35.5%).
| Income | Male | Female |
| $2,499 or less | 89 (30.4%) | 175 (35.5%) |
| $2,500 to $4,999 | 24 (8.2%) | 126 (25.6%) |
| $5,000 to $7,499 | 30 (10.2%) | 80 (16.2%) |
| $7,500 to $9,999 | 22 (7.5%) | 40 (8.1%) |
| $10,000 to $12,499 | 7 (2.4%) | 30 (6.1%) |
| $12,500 to $14,999 | 10 (3.4%) | 1 (0.2%) |
| $15,000 to $17,499 | 0 (0.0%) | 0 (0.0%) |
| $17,500 to $19,999 | 0 (0.0%) | 0 (0.0%) |
| $20,000 to $22,499 | 32 (10.9%) | 0 (0.0%) |
| $22,500 to $24,999 | 0 (0.0%) | 0 (0.0%) |
| $25,000 to $29,999 | 0 (0.0%) | 0 (0.0%) |
| $30,000 to $34,999 | 0 (0.0%) | 5 (1.0%) |
| $35,000 to $39,999 | 7 (2.4%) | 12 (2.4%) |
| $40,000 to $44,999 | 0 (0.0%) | 0 (0.0%) |
| $45,000 to $49,999 | 0 (0.0%) | 0 (0.0%) |
| $50,000 to $54,999 | 5 (1.7%) | 0 (0.0%) |
| $55,000 to $64,999 | 7 (2.4%) | 0 (0.0%) |
| $65,000 to $74,999 | 16 (5.5%) | 9 (1.8%) |
| $75,000 to $99,999 | 39 (13.3%) | 8 (1.6%) |
| $100,000+ | 5 (1.7%) | 7 (1.4%) |
| Total | 293 (100.0%) | 493 (100.0%) |
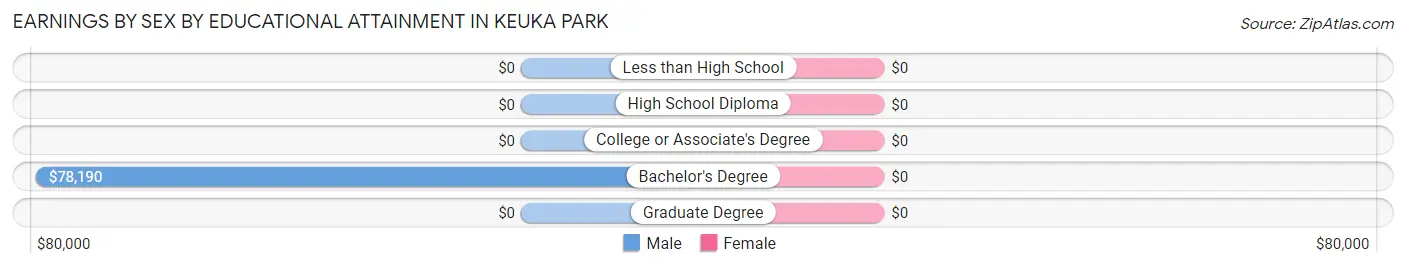
Earnings by Sex by Educational Attainment in Keuka Park
| Educational Attainment | Male Income | Female Income |
| Less than High School | - | - |
| High School Diploma | - | - |
| College or Associate's Degree | - | - |
| Bachelor's Degree | $78,190 | $0 |
| Graduate Degree | - | - |
| Total | $77,759 | $0 |
Family Income in Keuka Park
Family Income Brackets in Keuka Park
According to the Keuka Park family income data, there are 35 families falling into the $75,000 to $99,999 income range, which is the most common income bracket and makes up 48.6% of all families.
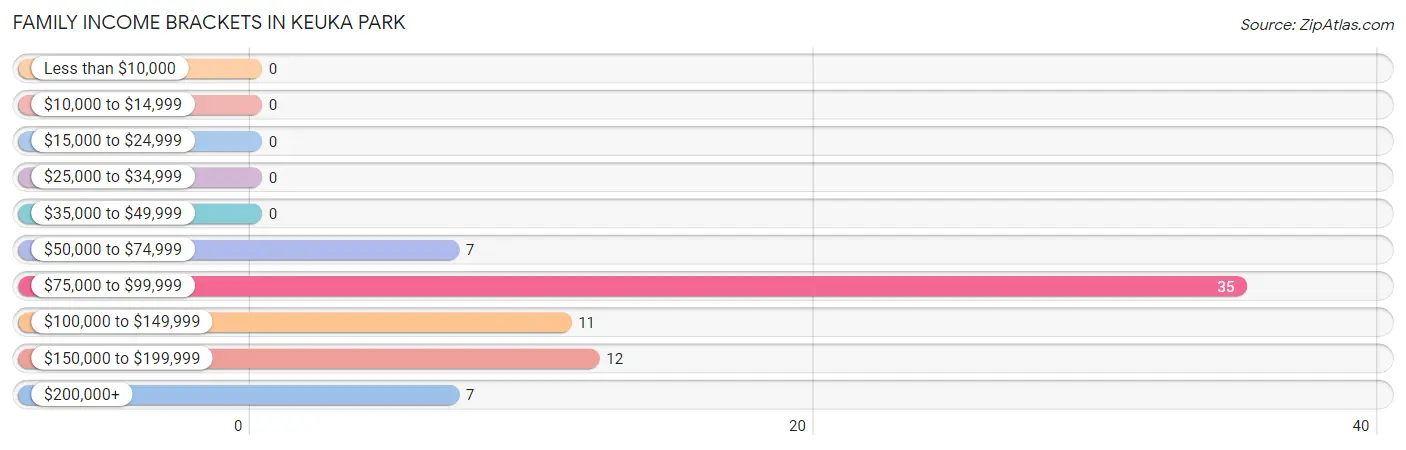
| Income Bracket | # Families | % Families |
| Less than $10,000 | 0 | 0.0% |
| $10,000 to $14,999 | 0 | 0.0% |
| $15,000 to $24,999 | 0 | 0.0% |
| $25,000 to $34,999 | 0 | 0.0% |
| $35,000 to $49,999 | 0 | 0.0% |
| $50,000 to $74,999 | 7 | 9.7% |
| $75,000 to $99,999 | 35 | 48.6% |
| $100,000 to $149,999 | 11 | 15.3% |
| $150,000 to $199,999 | 12 | 16.7% |
| $200,000+ | 7 | 9.7% |
Family Income by Famaliy Size in Keuka Park
4-person families (31 | 43.1%) account for the highest median family income in Keuka Park with $88,359 per family, while 4-person families (31 | 43.1%) have the highest median income of $22,090 per family member.
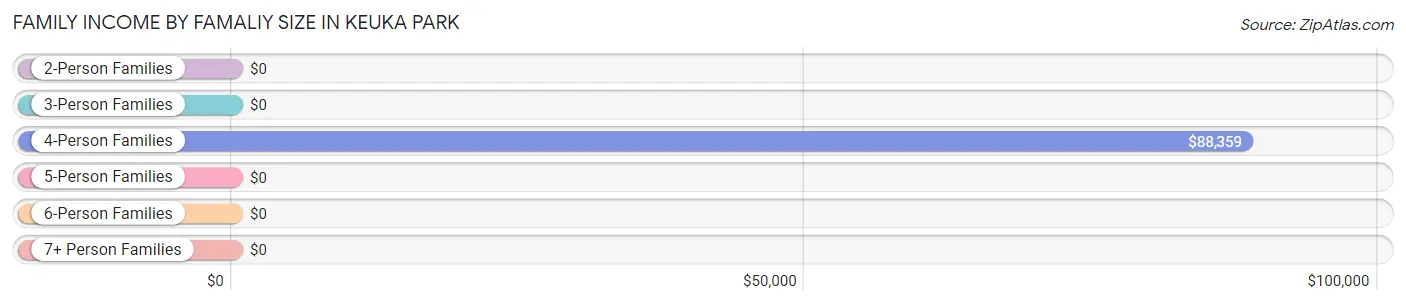
| Income Bracket | # Families | Median Income |
| 2-Person Families | 27 (37.5%) | $0 |
| 3-Person Families | 14 (19.4%) | $0 |
| 4-Person Families | 31 (43.1%) | $88,359 |
| 5-Person Families | 0 (0.0%) | $0 |
| 6-Person Families | 0 (0.0%) | $0 |
| 7+ Person Families | 0 (0.0%) | $0 |
| Total | 72 (100.0%) | $89,063 |
Family Income by Number of Earners in Keuka Park
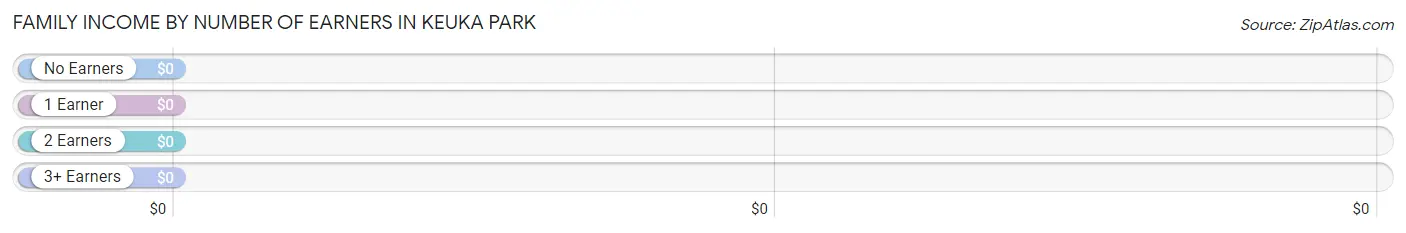
| Number of Earners | # Families | Median Income |
| No Earners | 15 (20.8%) | $0 |
| 1 Earner | 7 (9.7%) | $0 |
| 2 Earners | 45 (62.5%) | $0 |
| 3+ Earners | 5 (6.9%) | $0 |
| Total | 72 (100.0%) | $89,063 |
Household Income in Keuka Park
Household Income Brackets in Keuka Park
With 64 households falling in the category, the $75,000 to $99,999 income range is the most frequent in Keuka Park, accounting for 45.7% of all households.
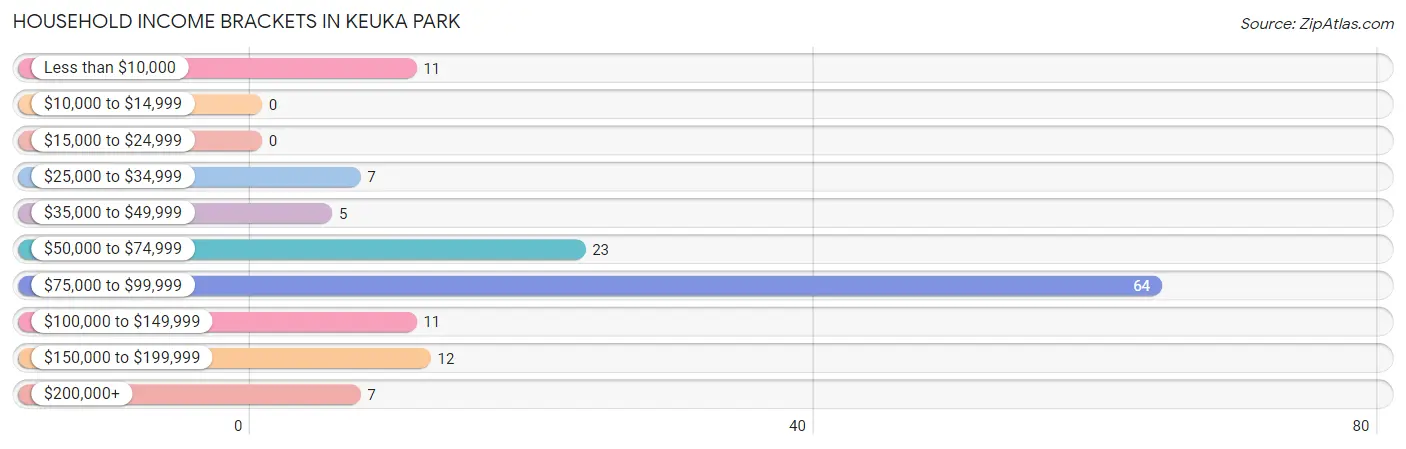
| Income Bracket | # Households | % Households |
| Less than $10,000 | 11 | 7.9% |
| $10,000 to $14,999 | 0 | 0.0% |
| $15,000 to $24,999 | 0 | 0.0% |
| $25,000 to $34,999 | 7 | 5.0% |
| $35,000 to $49,999 | 5 | 3.6% |
| $50,000 to $74,999 | 23 | 16.4% |
| $75,000 to $99,999 | 64 | 45.7% |
| $100,000 to $149,999 | 11 | 7.9% |
| $150,000 to $199,999 | 12 | 8.6% |
| $200,000+ | 7 | 5.0% |
Household Income by Householder Age in Keuka Park
The median household income in Keuka Park is $79,569, with the highest median household income of $141,000 found in the 45 to 64 years age bracket for the primary householder. A total of 34 households (24.3%) fall into this category.
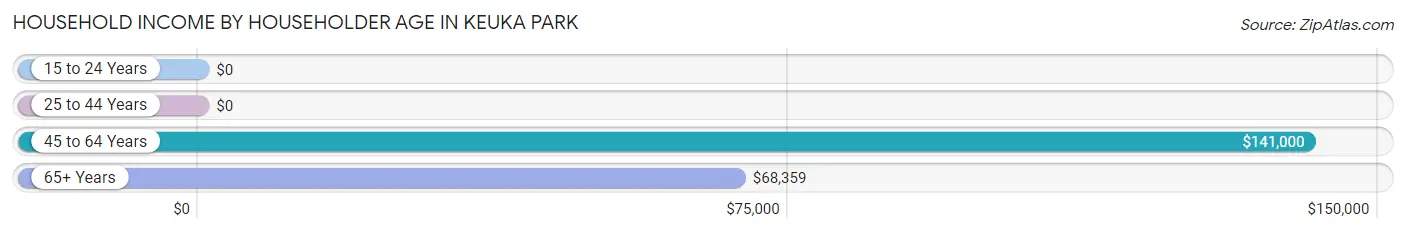
| Income Bracket | # Households | Median Income |
| 15 to 24 Years | 0 (0.0%) | $0 |
| 25 to 44 Years | 45 (32.1%) | $0 |
| 45 to 64 Years | 34 (24.3%) | $141,000 |
| 65+ Years | 61 (43.6%) | $68,359 |
| Total | 140 (100.0%) | $79,569 |
Poverty in Keuka Park
Income Below Poverty by Sex and Age in Keuka Park
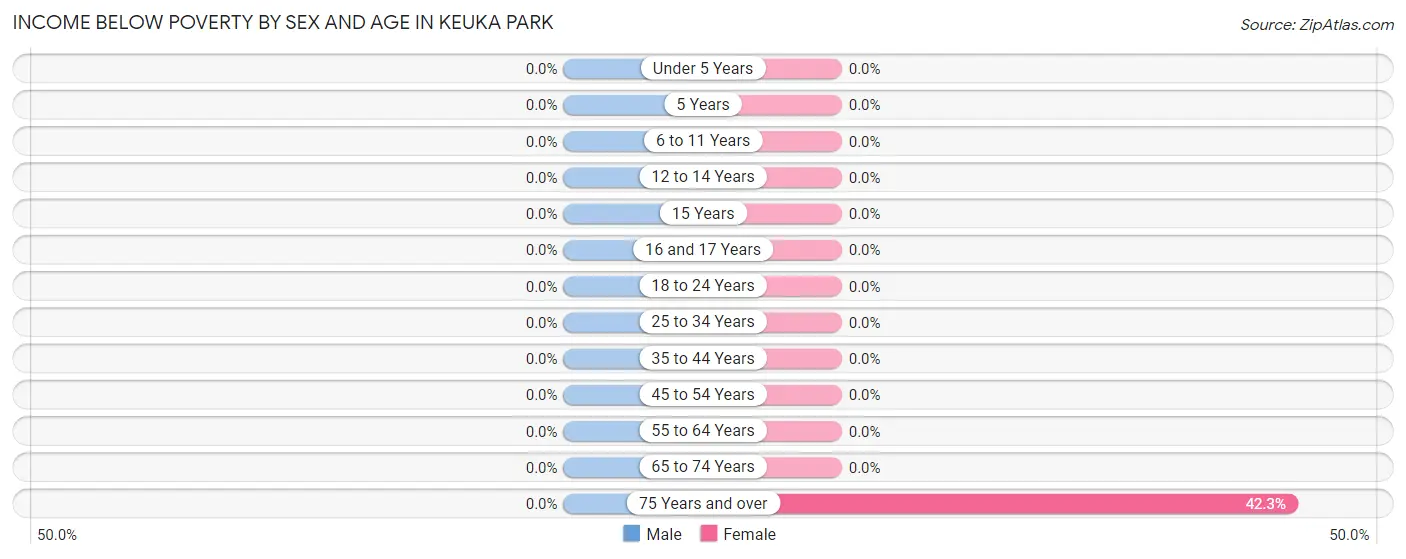
| Age Bracket | Male | Female |
| Under 5 Years | 0 (0.0%) | 0 (0.0%) |
| 5 Years | 0 (0.0%) | 0 (0.0%) |
| 6 to 11 Years | 0 (0.0%) | 0 (0.0%) |
| 12 to 14 Years | 0 (0.0%) | 0 (0.0%) |
| 15 Years | 0 (0.0%) | 0 (0.0%) |
| 16 and 17 Years | 0 (0.0%) | 0 (0.0%) |
| 18 to 24 Years | 0 (0.0%) | 0 (0.0%) |
| 25 to 34 Years | 0 (0.0%) | 0 (0.0%) |
| 35 to 44 Years | 0 (0.0%) | 0 (0.0%) |
| 45 to 54 Years | 0 (0.0%) | 0 (0.0%) |
| 55 to 64 Years | 0 (0.0%) | 0 (0.0%) |
| 65 to 74 Years | 0 (0.0%) | 0 (0.0%) |
| 75 Years and over | 0 (0.0%) | 11 (42.3%) |
| Total | 0 (0.0%) | 11 (7.5%) |
Income Above Poverty by Sex and Age in Keuka Park
According to the poverty statistics in Keuka Park, males aged under 5 years and females aged under 5 years are the age groups that are most secure financially, with 100.0% of males and 100.0% of females in these age groups living above the poverty line.
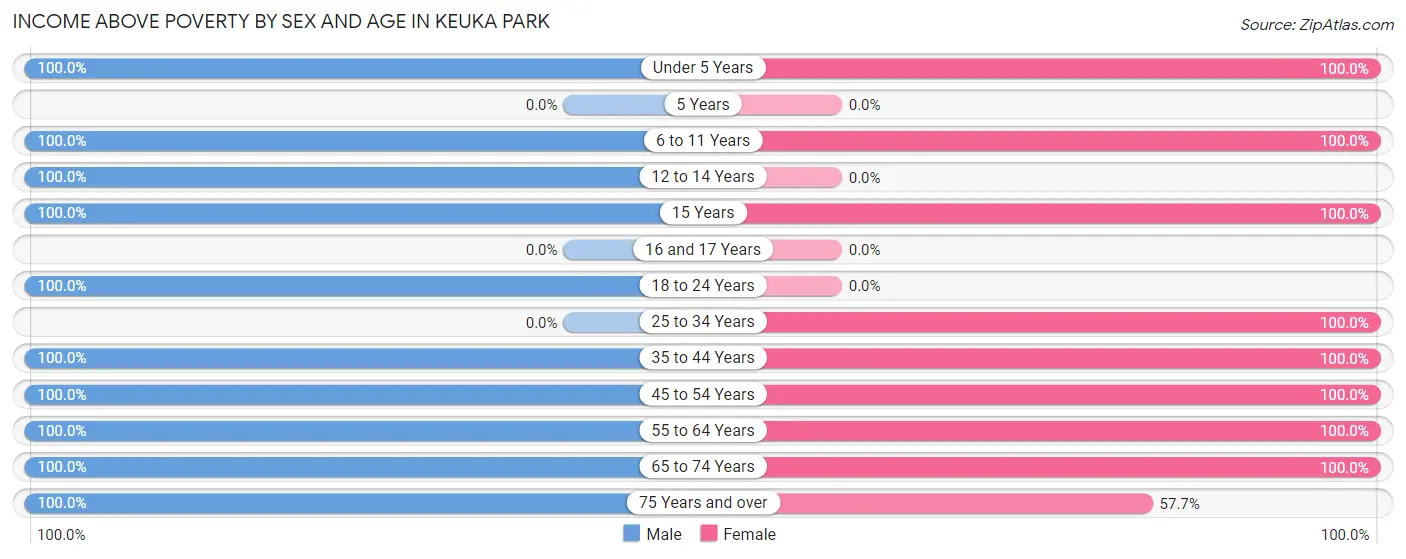
| Age Bracket | Male | Female |
| Under 5 Years | 14 (100.0%) | 12 (100.0%) |
| 5 Years | 0 (0.0%) | 0 (0.0%) |
| 6 to 11 Years | 8 (100.0%) | 8 (100.0%) |
| 12 to 14 Years | 10 (100.0%) | 0 (0.0%) |
| 15 Years | 8 (100.0%) | 10 (100.0%) |
| 16 and 17 Years | 0 (0.0%) | 0 (0.0%) |
| 18 to 24 Years | 7 (100.0%) | 0 (0.0%) |
| 25 to 34 Years | 0 (0.0%) | 13 (100.0%) |
| 35 to 44 Years | 55 (100.0%) | 9 (100.0%) |
| 45 to 54 Years | 10 (100.0%) | 19 (100.0%) |
| 55 to 64 Years | 12 (100.0%) | 20 (100.0%) |
| 65 to 74 Years | 8 (100.0%) | 30 (100.0%) |
| 75 Years and over | 20 (100.0%) | 15 (57.7%) |
| Total | 152 (100.0%) | 136 (92.5%) |
Income Below Poverty Among Married-Couple Families in Keuka Park
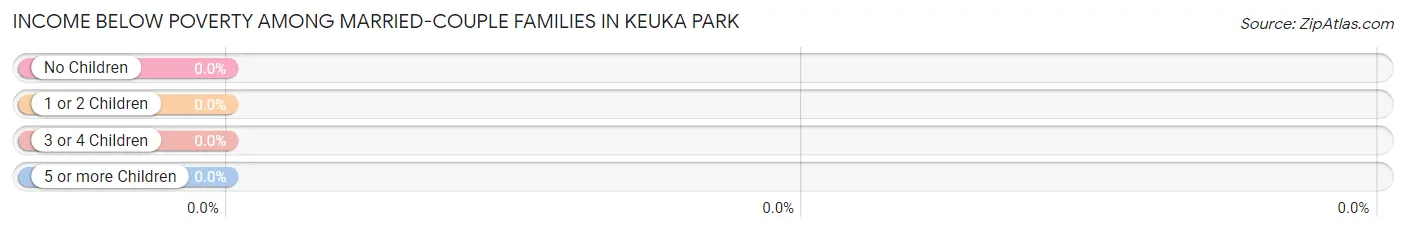
| Children | Above Poverty | Below Poverty |
| No Children | 27 (100.0%) | 0 (0.0%) |
| 1 or 2 Children | 40 (100.0%) | 0 (0.0%) |
| 3 or 4 Children | 0 (0.0%) | 0 (0.0%) |
| 5 or more Children | 0 (0.0%) | 0 (0.0%) |
| Total | 67 (100.0%) | 0 (0.0%) |
Income Below Poverty Among Single-Parent Households in Keuka Park
| Children | Single Father | Single Mother |
| No Children | 0 (0.0%) | 0 (0.0%) |
| 1 or 2 Children | 0 (0.0%) | 0 (0.0%) |
| 3 or 4 Children | 0 (0.0%) | 0 (0.0%) |
| 5 or more Children | 0 (0.0%) | 0 (0.0%) |
| Total | 0 (0.0%) | 0 (0.0%) |
Income Below Poverty Among Married-Couple vs Single-Parent Households in Keuka Park
| Children | Married-Couple Families | Single-Parent Households |
| No Children | 0 (0.0%) | 0 (0.0%) |
| 1 or 2 Children | 0 (0.0%) | 0 (0.0%) |
| 3 or 4 Children | 0 (0.0%) | 0 (0.0%) |
| 5 or more Children | 0 (0.0%) | 0 (0.0%) |
| Total | 0 (0.0%) | 0 (0.0%) |
Race in Keuka Park
The most populous races in Keuka Park are White / Caucasian (1,062 | 97.3%), Two or more Races (16 | 1.5%), and Black / African American (14 | 1.3%).
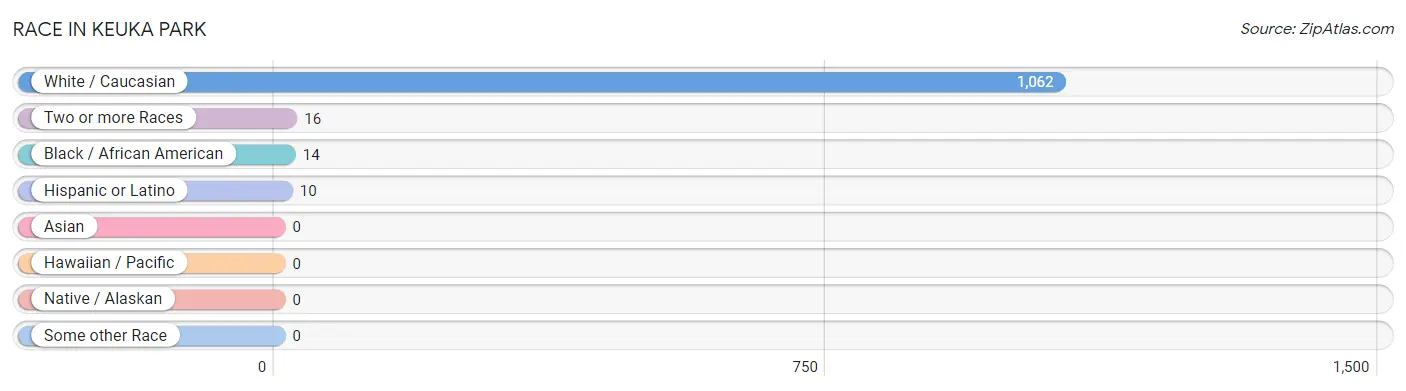
| Race | # Population | % Population |
| Asian | 0 | 0.0% |
| Black / African American | 14 | 1.3% |
| Hawaiian / Pacific | 0 | 0.0% |
| Hispanic or Latino | 10 | 0.9% |
| Native / Alaskan | 0 | 0.0% |
| White / Caucasian | 1,062 | 97.3% |
| Two or more Races | 16 | 1.5% |
| Some other Race | 0 | 0.0% |
| Total | 1,092 | 100.0% |
Ancestry in Keuka Park
The most populous ancestries reported in Keuka Park are Irish (169 | 15.5%), Italian (151 | 13.8%), German (78 | 7.1%), Polish (65 | 5.9%), and English (48 | 4.4%), together accounting for 46.8% of all Keuka Park residents.
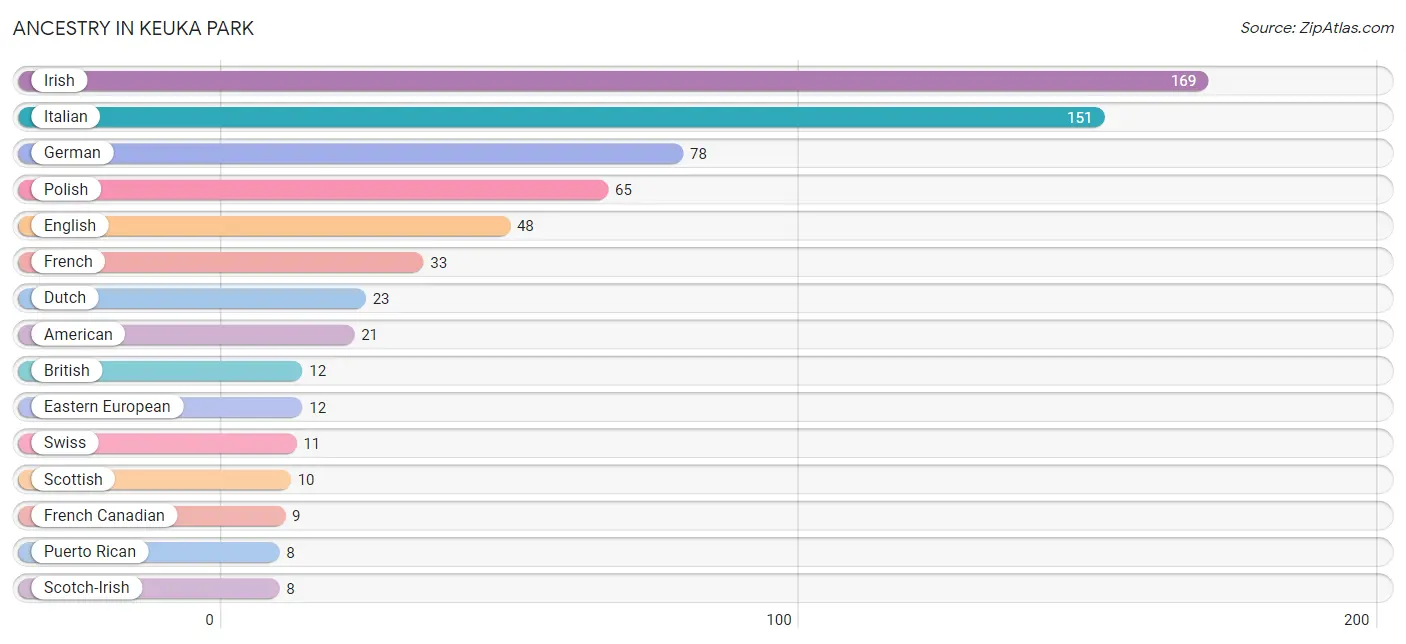
| Ancestry | # Population | % Population |
| American | 21 | 1.9% |
| British | 12 | 1.1% |
| Dutch | 23 | 2.1% |
| Eastern European | 12 | 1.1% |
| English | 48 | 4.4% |
| French | 33 | 3.0% |
| French Canadian | 9 | 0.8% |
| German | 78 | 7.1% |
| Greek | 4 | 0.4% |
| Hungarian | 7 | 0.6% |
| Irish | 169 | 15.5% |
| Italian | 151 | 13.8% |
| Macedonian | 4 | 0.4% |
| Mexican | 2 | 0.2% |
| Polish | 65 | 5.9% |
| Puerto Rican | 8 | 0.7% |
| Scotch-Irish | 8 | 0.7% |
| Scottish | 10 | 0.9% |
| Swiss | 11 | 1.0% | View All 19 Rows |
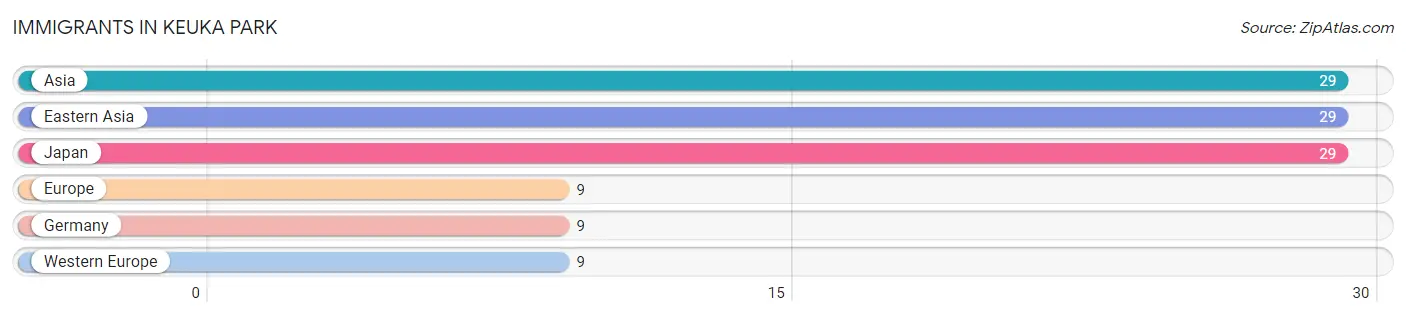
Immigrants in Keuka Park
The most numerous immigrant groups reported in Keuka Park came from Asia (29 | 2.7%), Eastern Asia (29 | 2.7%), Japan (29 | 2.7%), Europe (9 | 0.8%), and Germany (9 | 0.8%), together accounting for 9.6% of all Keuka Park residents.
| Immigration Origin | # Population | % Population |
| Asia | 29 | 2.7% |
| Eastern Asia | 29 | 2.7% |
| Europe | 9 | 0.8% |
| Germany | 9 | 0.8% |
| Japan | 29 | 2.7% |
| Western Europe | 9 | 0.8% | View All 6 Rows |
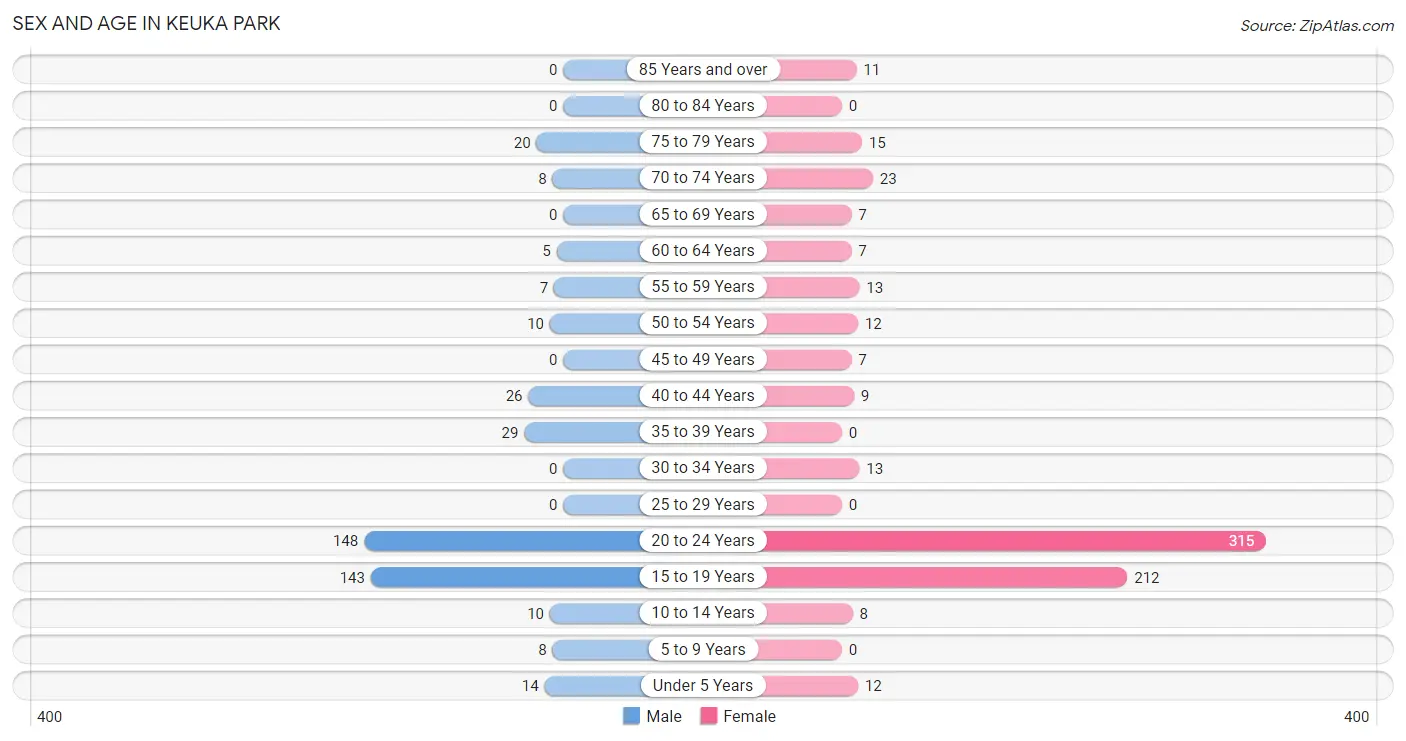
Sex and Age in Keuka Park
Sex and Age in Keuka Park
The most populous age groups in Keuka Park are 20 to 24 Years (148 | 34.6%) for men and 20 to 24 Years (315 | 47.4%) for women.
| Age Bracket | Male | Female |
| Under 5 Years | 14 (3.3%) | 12 (1.8%) |
| 5 to 9 Years | 8 (1.9%) | 0 (0.0%) |
| 10 to 14 Years | 10 (2.3%) | 8 (1.2%) |
| 15 to 19 Years | 143 (33.4%) | 212 (31.9%) |
| 20 to 24 Years | 148 (34.6%) | 315 (47.4%) |
| 25 to 29 Years | 0 (0.0%) | 0 (0.0%) |
| 30 to 34 Years | 0 (0.0%) | 13 (2.0%) |
| 35 to 39 Years | 29 (6.8%) | 0 (0.0%) |
| 40 to 44 Years | 26 (6.1%) | 9 (1.4%) |
| 45 to 49 Years | 0 (0.0%) | 7 (1.1%) |
| 50 to 54 Years | 10 (2.3%) | 12 (1.8%) |
| 55 to 59 Years | 7 (1.6%) | 13 (2.0%) |
| 60 to 64 Years | 5 (1.2%) | 7 (1.1%) |
| 65 to 69 Years | 0 (0.0%) | 7 (1.1%) |
| 70 to 74 Years | 8 (1.9%) | 23 (3.5%) |
| 75 to 79 Years | 20 (4.7%) | 15 (2.3%) |
| 80 to 84 Years | 0 (0.0%) | 0 (0.0%) |
| 85 Years and over | 0 (0.0%) | 11 (1.7%) |
| Total | 428 (100.0%) | 664 (100.0%) |
Families and Households in Keuka Park
Median Family Size in Keuka Park
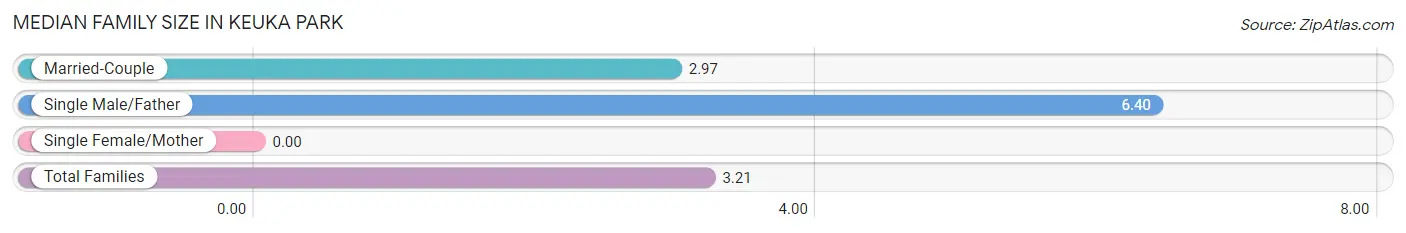
| Family Type | # Families | Family Size |
| Married-Couple | 67 (93.1%) | 2.97 |
| Single Male/Father | 5 (6.9%) | 6.40 |
| Single Female/Mother | 0 (0.0%) | - |
| Total Families | 72 (100.0%) | 3.21 |
Median Household Size in Keuka Park
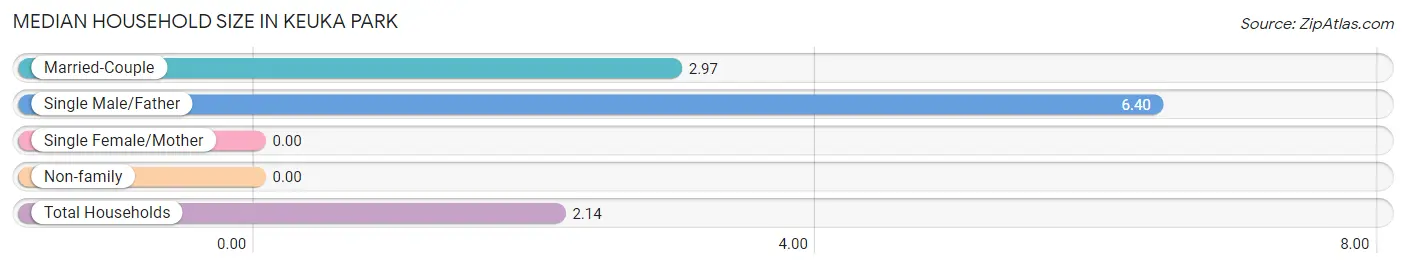
| Household Type | # Households | Household Size |
| Married-Couple | 67 (47.9%) | 2.97 |
| Single Male/Father | 5 (3.6%) | 6.40 |
| Single Female/Mother | 0 (0.0%) | - |
| Non-family | 68 (48.6%) | - |
| Total Households | 140 (100.0%) | 2.14 |
Household Size by Marriage Status in Keuka Park
Out of a total of 140 households in Keuka Park, 72 (51.4%) are family households, while 68 (48.6%) are nonfamily households. The most numerous type of family households are 4-person households, comprising 31, and the most common type of nonfamily households are 1-person households, comprising 68.
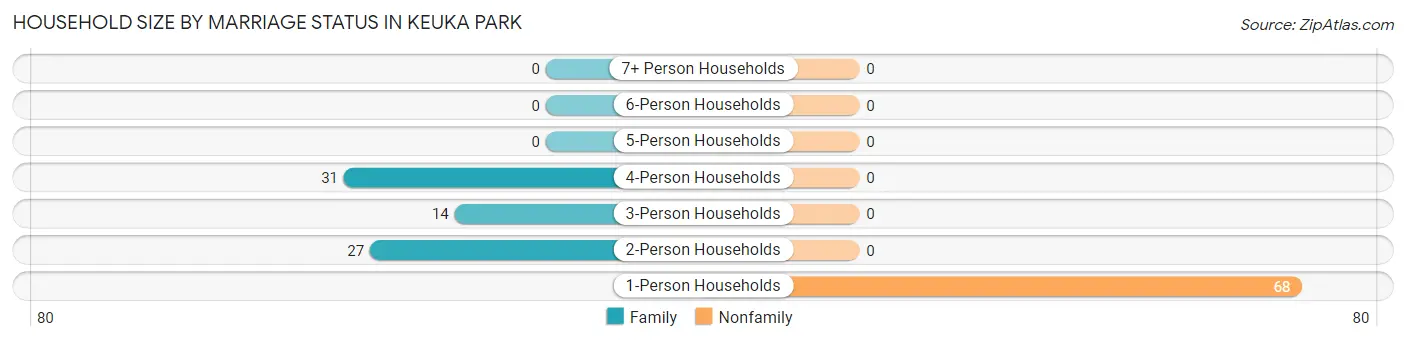
| Household Size | Family Households | Nonfamily Households |
| 1-Person Households | - | 68 (48.6%) |
| 2-Person Households | 27 (19.3%) | 0 (0.0%) |
| 3-Person Households | 14 (10.0%) | 0 (0.0%) |
| 4-Person Households | 31 (22.1%) | 0 (0.0%) |
| 5-Person Households | 0 (0.0%) | 0 (0.0%) |
| 6-Person Households | 0 (0.0%) | 0 (0.0%) |
| 7+ Person Households | 0 (0.0%) | 0 (0.0%) |
| Total | 72 (51.4%) | 68 (48.6%) |
Female Fertility in Keuka Park
Fertility by Age in Keuka Park
Average fertility rate in Keuka Park is 23.0 births per 1,000 women. Women in the age bracket of 20 to 34 years have the highest fertility rate with 40.0 births per 1,000 women. Women in the age bracket of 20 to 34 years acount for 100.0% of all women with births.
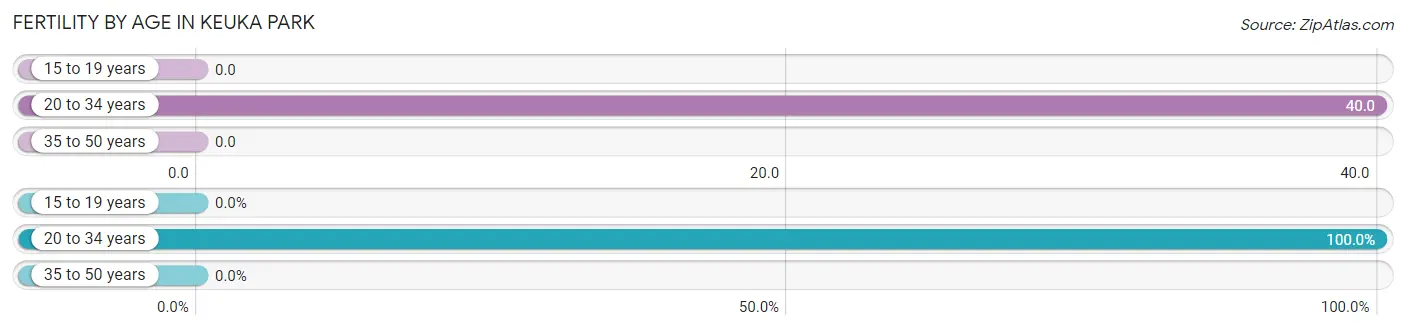
| Age Bracket | Women with Births | Births / 1,000 Women |
| 15 to 19 years | 0 (0.0%) | 0.0 |
| 20 to 34 years | 13 (100.0%) | 40.0 |
| 35 to 50 years | 0 (0.0%) | 0.0 |
| Total | 13 (100.0%) | 23.0 |
Fertility by Age by Marriage Status in Keuka Park
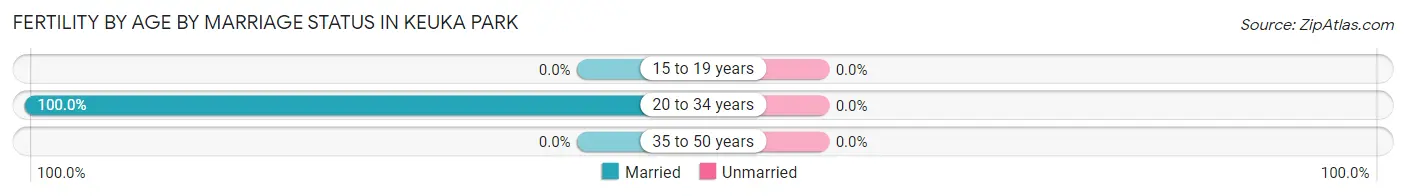
| Age Bracket | Married | Unmarried |
| 15 to 19 years | 0 (0.0%) | 0 (0.0%) |
| 20 to 34 years | 13 (100.0%) | 0 (0.0%) |
| 35 to 50 years | 0 (0.0%) | 0 (0.0%) |
| Total | 13 (100.0%) | 0 (0.0%) |
Fertility by Education in Keuka Park
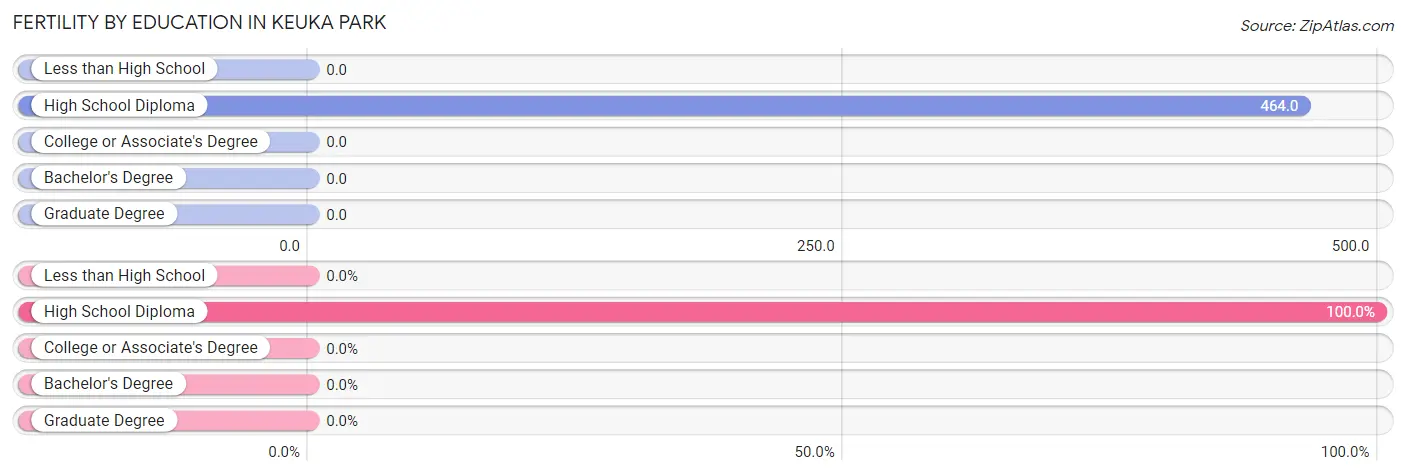
| Educational Attainment | Women with Births | Births / 1,000 Women |
| Less than High School | 0 (0.0%) | 0.0 |
| High School Diploma | 13 (100.0%) | 464.0 |
| College or Associate's Degree | 0 (0.0%) | 0.0 |
| Bachelor's Degree | 0 (0.0%) | 0.0 |
| Graduate Degree | 0 (0.0%) | 0.0 |
| Total | 13 (100.0%) | 23.0 |
Fertility by Education by Marriage Status in Keuka Park
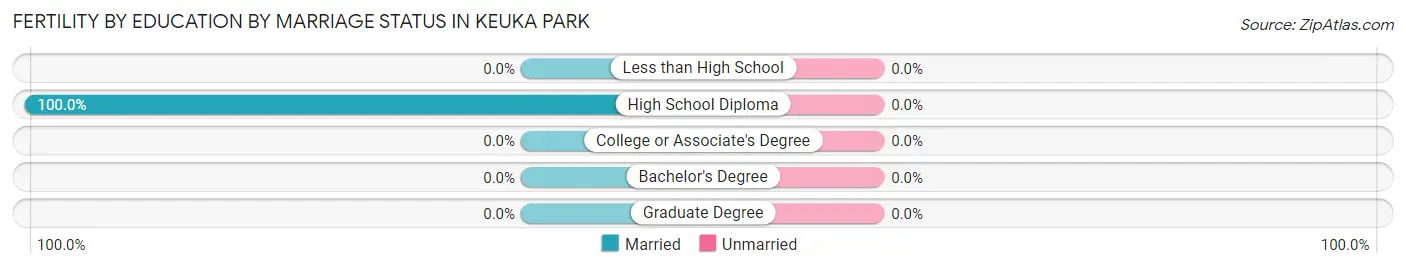
| Educational Attainment | Married | Unmarried |
| Less than High School | 0 (0.0%) | 0 (0.0%) |
| High School Diploma | 13 (100.0%) | 0 (0.0%) |
| College or Associate's Degree | 0 (0.0%) | 0 (0.0%) |
| Bachelor's Degree | 0 (0.0%) | 0 (0.0%) |
| Graduate Degree | 0 (0.0%) | 0 (0.0%) |
| Total | 13 (100.0%) | 0 (0.0%) |
Employment Characteristics in Keuka Park
Employment by Class of Employer in Keuka Park
Among the 474 employed individuals in Keuka Park, private company employees (325 | 68.6%), not-for-profit organizations (86 | 18.1%), and self-employed (incorporated) (19 | 4.0%) make up the most common classes of employment.
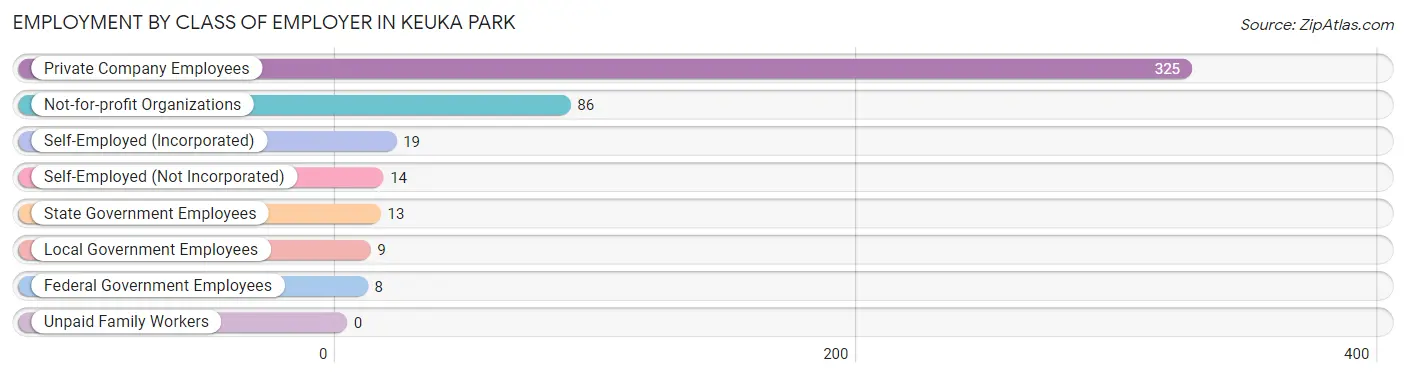
| Employer Class | # Employees | % Employees |
| Private Company Employees | 325 | 68.6% |
| Self-Employed (Incorporated) | 19 | 4.0% |
| Self-Employed (Not Incorporated) | 14 | 2.9% |
| Not-for-profit Organizations | 86 | 18.1% |
| Local Government Employees | 9 | 1.9% |
| State Government Employees | 13 | 2.7% |
| Federal Government Employees | 8 | 1.7% |
| Unpaid Family Workers | 0 | 0.0% |
| Total | 474 | 100.0% |
Employment Status by Age in Keuka Park
According to the labor force statistics for Keuka Park, out of the total population over 16 years of age (1,022), 50.7% or 518 individuals are in the labor force, with 5.6% or 29 of them unemployed. The age group with the highest labor force participation rate is 30 to 34 years, with 100.0% or 13 individuals in the labor force. Within the labor force, the 16 to 19 years age range has the highest percentage of unemployed individuals, with 21.5% or 29 of them being unemployed.
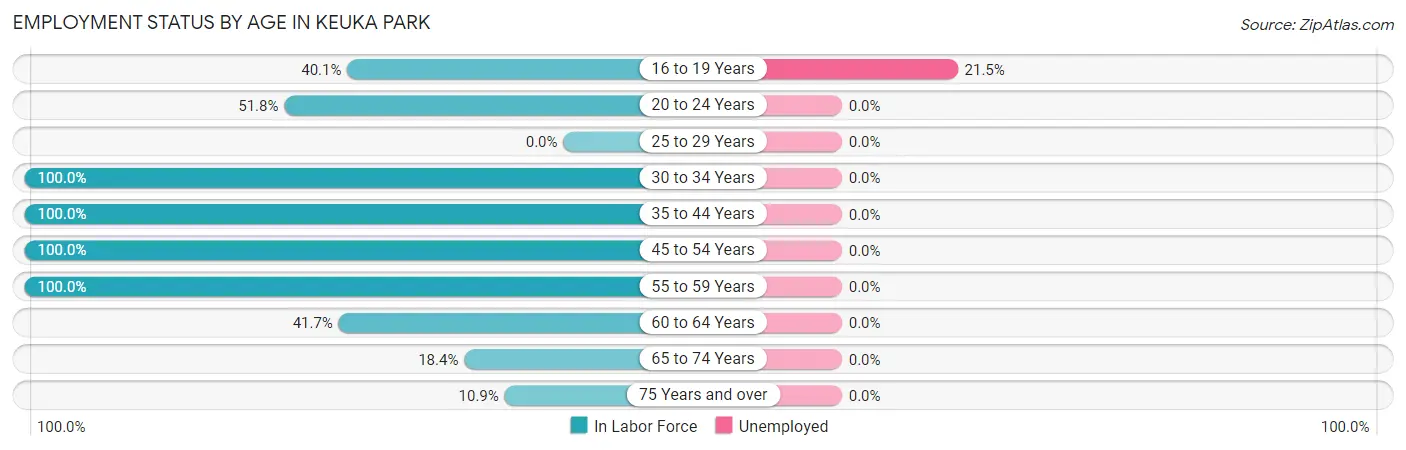
| Age Bracket | In Labor Force | Unemployed |
| 16 to 19 Years | 135 (40.1%) | 29 (21.5%) |
| 20 to 24 Years | 240 (51.8%) | 0 (0.0%) |
| 25 to 29 Years | 0 (0.0%) | 0 (0.0%) |
| 30 to 34 Years | 13 (100.0%) | 0 (0.0%) |
| 35 to 44 Years | 64 (100.0%) | 0 (0.0%) |
| 45 to 54 Years | 29 (100.0%) | 0 (0.0%) |
| 55 to 59 Years | 20 (100.0%) | 0 (0.0%) |
| 60 to 64 Years | 5 (41.7%) | 0 (0.0%) |
| 65 to 74 Years | 7 (18.4%) | 0 (0.0%) |
| 75 Years and over | 5 (10.9%) | 0 (0.0%) |
| Total | 518 (50.7%) | 29 (5.6%) |
Employment Status by Educational Attainment in Keuka Park
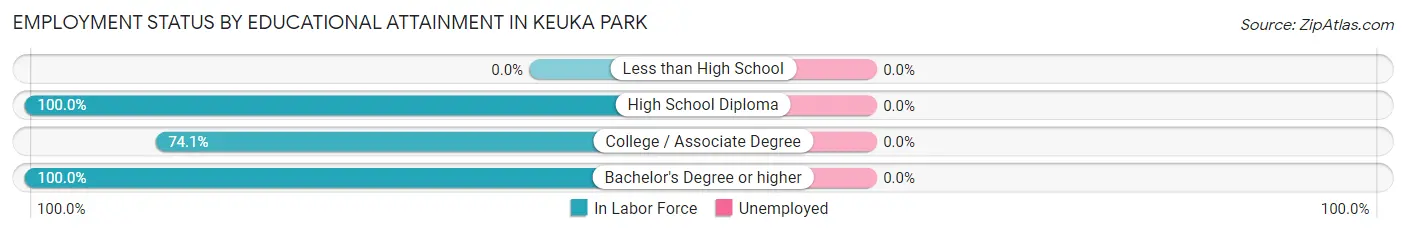
| Educational Attainment | In Labor Force | Unemployed |
| Less than High School | 0 (0.0%) | 0 (0.0%) |
| High School Diploma | 23 (100.0%) | 0 (0.0%) |
| College / Associate Degree | 20 (74.1%) | 0 (0.0%) |
| Bachelor's Degree or higher | 88 (100.0%) | 0 (0.0%) |
| Total | 131 (94.9%) | 0 (0.0%) |
Employment Occupations by Sex in Keuka Park
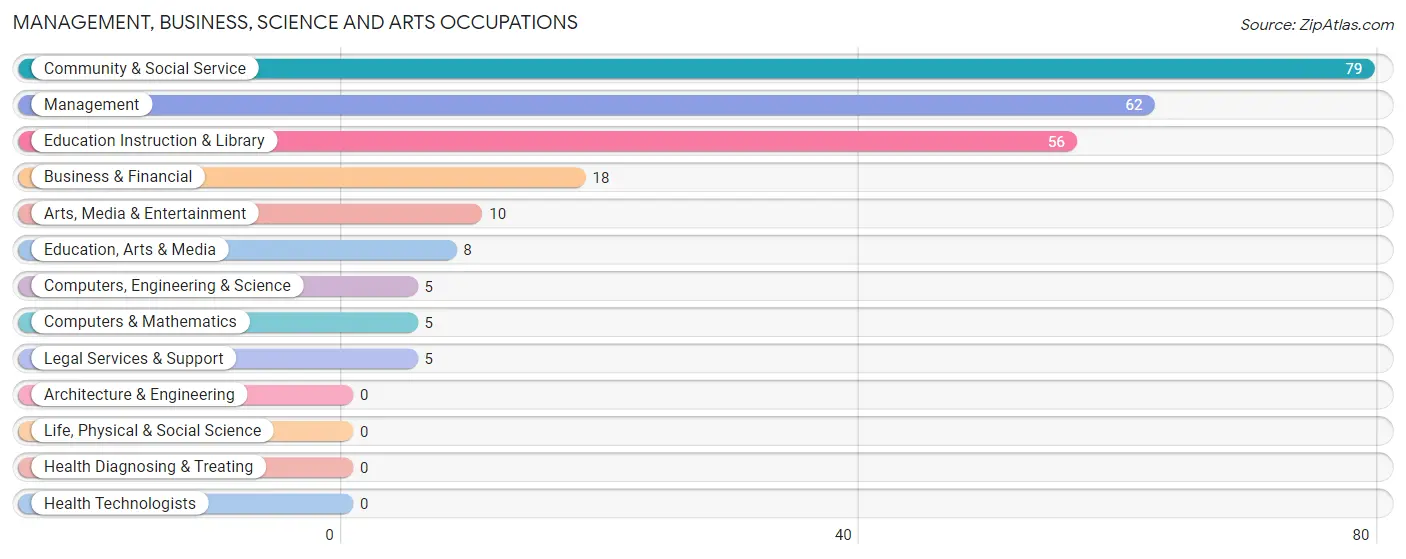
Management, Business, Science and Arts Occupations
The most common Management, Business, Science and Arts occupations in Keuka Park are Community & Social Service (79 | 16.2%), Management (62 | 12.7%), Education Instruction & Library (56 | 11.5%), Business & Financial (18 | 3.7%), and Arts, Media & Entertainment (10 | 2.0%).
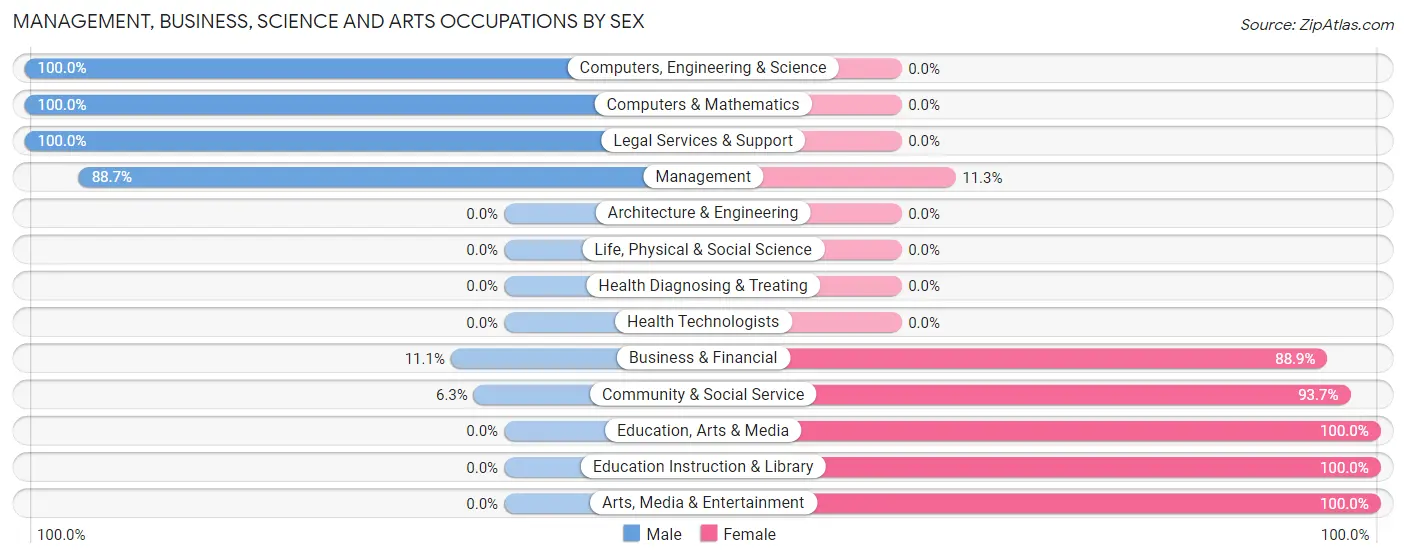
Management, Business, Science and Arts Occupations by Sex
Within the Management, Business, Science and Arts occupations in Keuka Park, the most male-oriented occupations are Computers, Engineering & Science (100.0%), Computers & Mathematics (100.0%), and Legal Services & Support (100.0%), while the most female-oriented occupations are Education, Arts & Media (100.0%), Education Instruction & Library (100.0%), and Arts, Media & Entertainment (100.0%).
| Occupation | Male | Female |
| Management | 55 (88.7%) | 7 (11.3%) |
| Business & Financial | 2 (11.1%) | 16 (88.9%) |
| Computers, Engineering & Science | 5 (100.0%) | 0 (0.0%) |
| Computers & Mathematics | 5 (100.0%) | 0 (0.0%) |
| Architecture & Engineering | 0 (0.0%) | 0 (0.0%) |
| Life, Physical & Social Science | 0 (0.0%) | 0 (0.0%) |
| Community & Social Service | 5 (6.3%) | 74 (93.7%) |
| Education, Arts & Media | 0 (0.0%) | 8 (100.0%) |
| Legal Services & Support | 5 (100.0%) | 0 (0.0%) |
| Education Instruction & Library | 0 (0.0%) | 56 (100.0%) |
| Arts, Media & Entertainment | 0 (0.0%) | 10 (100.0%) |
| Health Diagnosing & Treating | 0 (0.0%) | 0 (0.0%) |
| Health Technologists | 0 (0.0%) | 0 (0.0%) |
| Total (Category) | 67 (40.8%) | 97 (59.2%) |
| Total (Overall) | 191 (39.1%) | 298 (60.9%) |
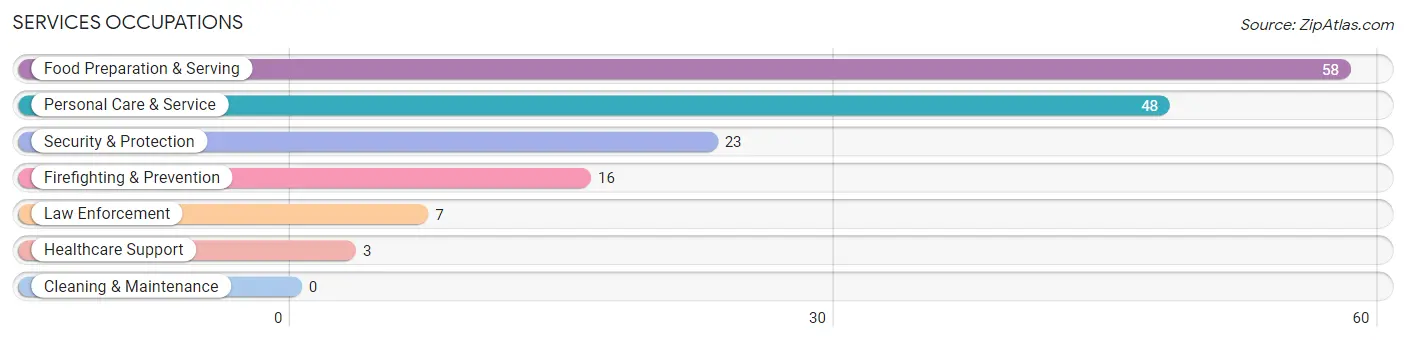
Services Occupations
The most common Services occupations in Keuka Park are Food Preparation & Serving (58 | 11.9%), Personal Care & Service (48 | 9.8%), Security & Protection (23 | 4.7%), Firefighting & Prevention (16 | 3.3%), and Law Enforcement (7 | 1.4%).
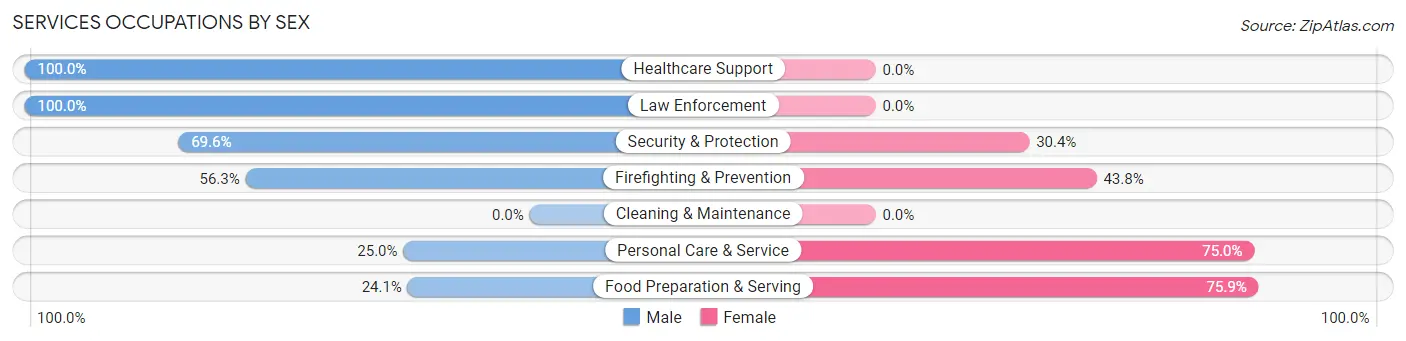
Services Occupations by Sex
Within the Services occupations in Keuka Park, the most male-oriented occupations are Healthcare Support (100.0%), Law Enforcement (100.0%), and Security & Protection (69.6%), while the most female-oriented occupations are Food Preparation & Serving (75.9%), Personal Care & Service (75.0%), and Firefighting & Prevention (43.8%).
| Occupation | Male | Female |
| Healthcare Support | 3 (100.0%) | 0 (0.0%) |
| Security & Protection | 16 (69.6%) | 7 (30.4%) |
| Firefighting & Prevention | 9 (56.2%) | 7 (43.8%) |
| Law Enforcement | 7 (100.0%) | 0 (0.0%) |
| Food Preparation & Serving | 14 (24.1%) | 44 (75.9%) |
| Cleaning & Maintenance | 0 (0.0%) | 0 (0.0%) |
| Personal Care & Service | 12 (25.0%) | 36 (75.0%) |
| Total (Category) | 45 (34.1%) | 87 (65.9%) |
| Total (Overall) | 191 (39.1%) | 298 (60.9%) |
Sales and Office Occupations
The most common Sales and Office occupations in Keuka Park are Office & Administration (83 | 17.0%), and Sales & Related (23 | 4.7%).
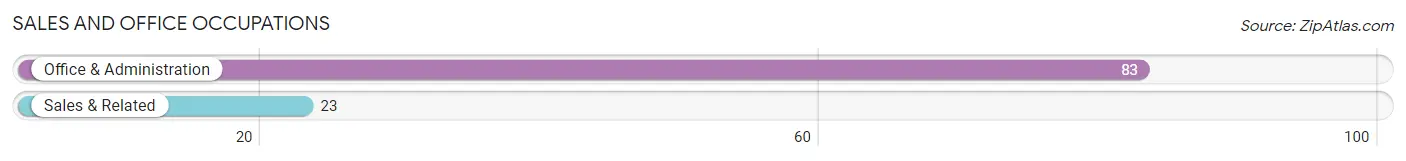
Sales and Office Occupations by Sex
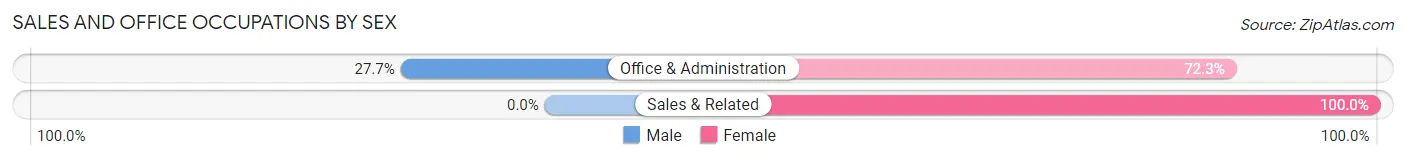
| Occupation | Male | Female |
| Sales & Related | 0 (0.0%) | 23 (100.0%) |
| Office & Administration | 23 (27.7%) | 60 (72.3%) |
| Total (Category) | 23 (21.7%) | 83 (78.3%) |
| Total (Overall) | 191 (39.1%) | 298 (60.9%) |
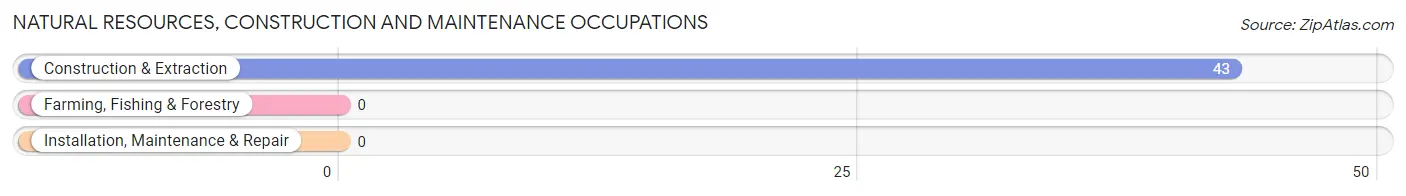
Natural Resources, Construction and Maintenance Occupations
The most common Natural Resources, Construction and Maintenance occupations in Keuka Park are , and Construction & Extraction (43 | 8.8%).
Natural Resources, Construction and Maintenance Occupations by Sex
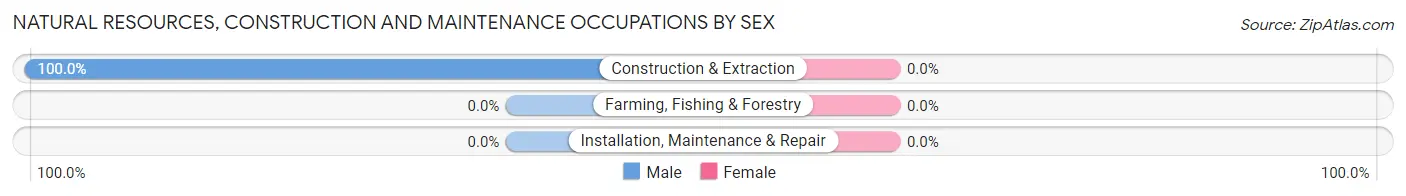
| Occupation | Male | Female |
| Farming, Fishing & Forestry | 0 (0.0%) | 0 (0.0%) |
| Construction & Extraction | 43 (100.0%) | 0 (0.0%) |
| Installation, Maintenance & Repair | 0 (0.0%) | 0 (0.0%) |
| Total (Category) | 43 (100.0%) | 0 (0.0%) |
| Total (Overall) | 191 (39.1%) | 298 (60.9%) |
Production, Transportation and Moving Occupations
The most common Production, Transportation and Moving occupations in Keuka Park are , and Material Moving (44 | 9.0%).
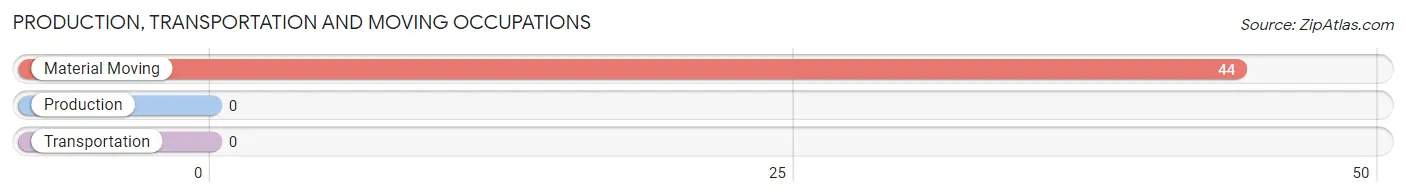
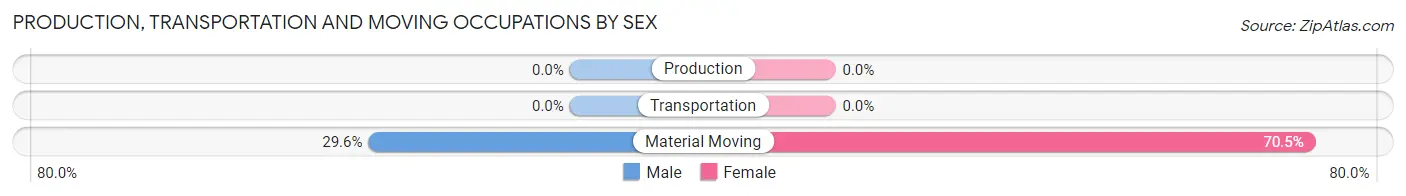
Production, Transportation and Moving Occupations by Sex
| Occupation | Male | Female |
| Production | 0 (0.0%) | 0 (0.0%) |
| Transportation | 0 (0.0%) | 0 (0.0%) |
| Material Moving | 13 (29.5%) | 31 (70.5%) |
| Total (Category) | 13 (29.5%) | 31 (70.5%) |
| Total (Overall) | 191 (39.1%) | 298 (60.9%) |
Employment Industries by Sex in Keuka Park
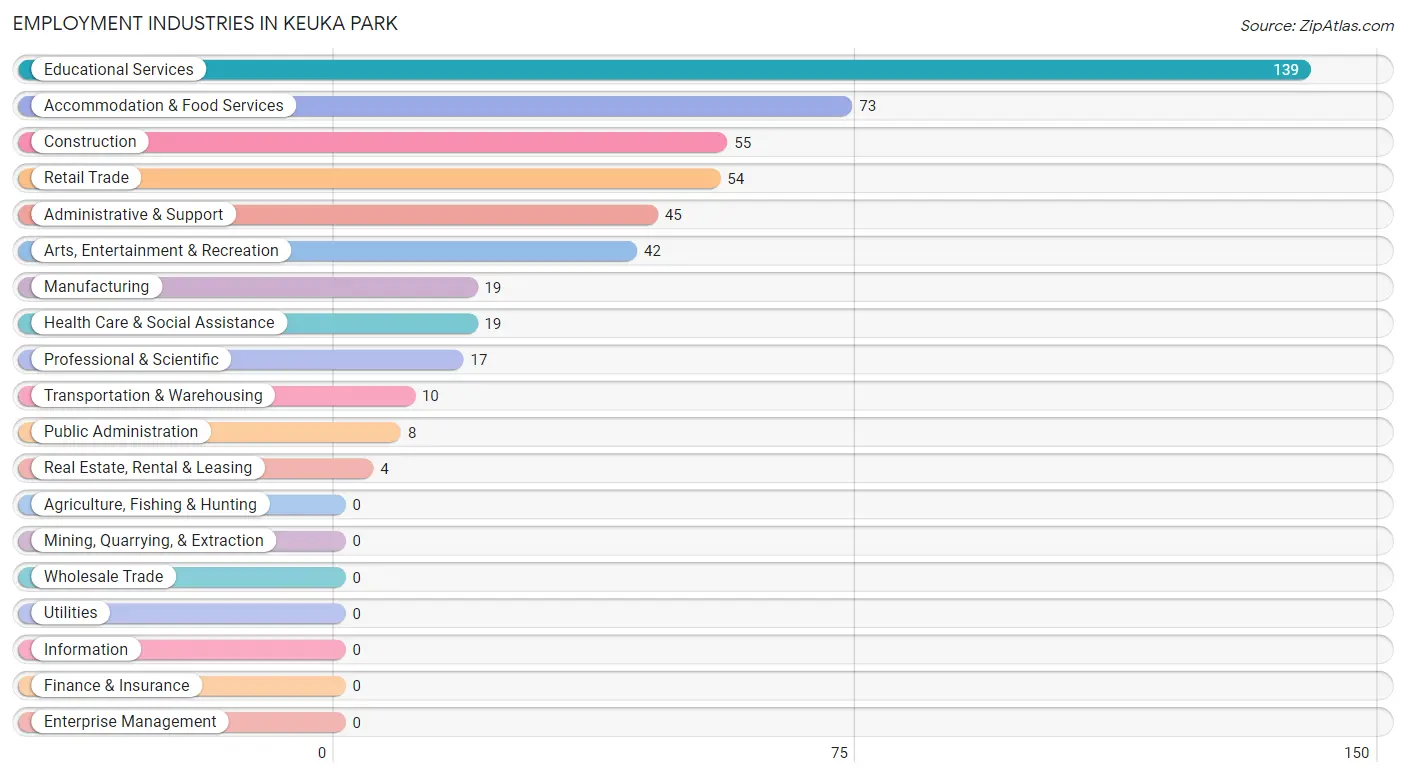
Employment Industries in Keuka Park
The major employment industries in Keuka Park include Educational Services (139 | 28.4%), Accommodation & Food Services (73 | 14.9%), Construction (55 | 11.3%), Retail Trade (54 | 11.0%), and Administrative & Support (45 | 9.2%).
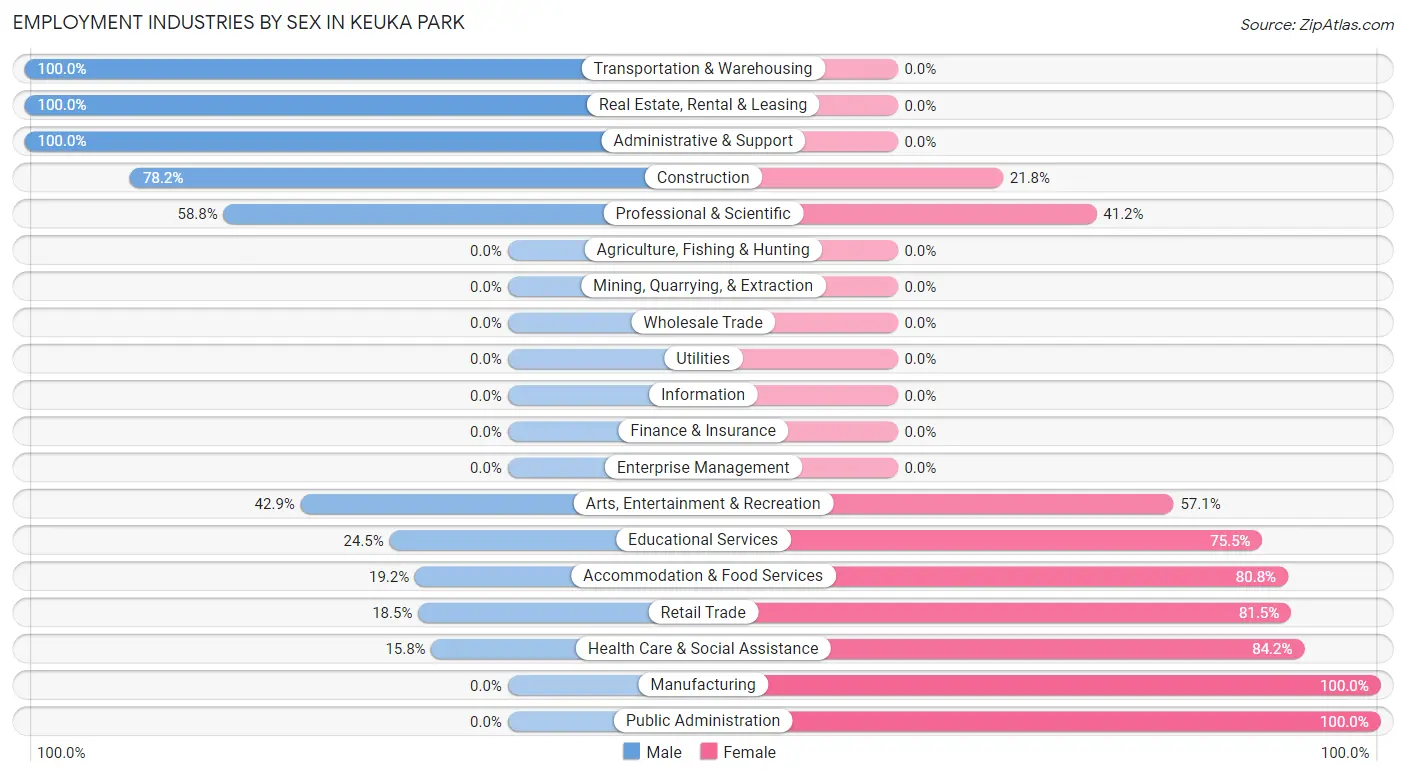
Employment Industries by Sex in Keuka Park
The Keuka Park industries that see more men than women are Transportation & Warehousing (100.0%), Real Estate, Rental & Leasing (100.0%), and Administrative & Support (100.0%), whereas the industries that tend to have a higher number of women are Manufacturing (100.0%), Public Administration (100.0%), and Health Care & Social Assistance (84.2%).
| Industry | Male | Female |
| Agriculture, Fishing & Hunting | 0 (0.0%) | 0 (0.0%) |
| Mining, Quarrying, & Extraction | 0 (0.0%) | 0 (0.0%) |
| Construction | 43 (78.2%) | 12 (21.8%) |
| Manufacturing | 0 (0.0%) | 19 (100.0%) |
| Wholesale Trade | 0 (0.0%) | 0 (0.0%) |
| Retail Trade | 10 (18.5%) | 44 (81.5%) |
| Transportation & Warehousing | 10 (100.0%) | 0 (0.0%) |
| Utilities | 0 (0.0%) | 0 (0.0%) |
| Information | 0 (0.0%) | 0 (0.0%) |
| Finance & Insurance | 0 (0.0%) | 0 (0.0%) |
| Real Estate, Rental & Leasing | 4 (100.0%) | 0 (0.0%) |
| Professional & Scientific | 10 (58.8%) | 7 (41.2%) |
| Enterprise Management | 0 (0.0%) | 0 (0.0%) |
| Administrative & Support | 45 (100.0%) | 0 (0.0%) |
| Educational Services | 34 (24.5%) | 105 (75.5%) |
| Health Care & Social Assistance | 3 (15.8%) | 16 (84.2%) |
| Arts, Entertainment & Recreation | 18 (42.9%) | 24 (57.1%) |
| Accommodation & Food Services | 14 (19.2%) | 59 (80.8%) |
| Public Administration | 0 (0.0%) | 8 (100.0%) |
| Total | 191 (39.1%) | 298 (60.9%) |
Education in Keuka Park
School Enrollment in Keuka Park
The most common levels of schooling among the 837 students in Keuka Park are college / undergraduate (793 | 94.7%), middle school (18 | 2.1%), and high school (18 | 2.1%).
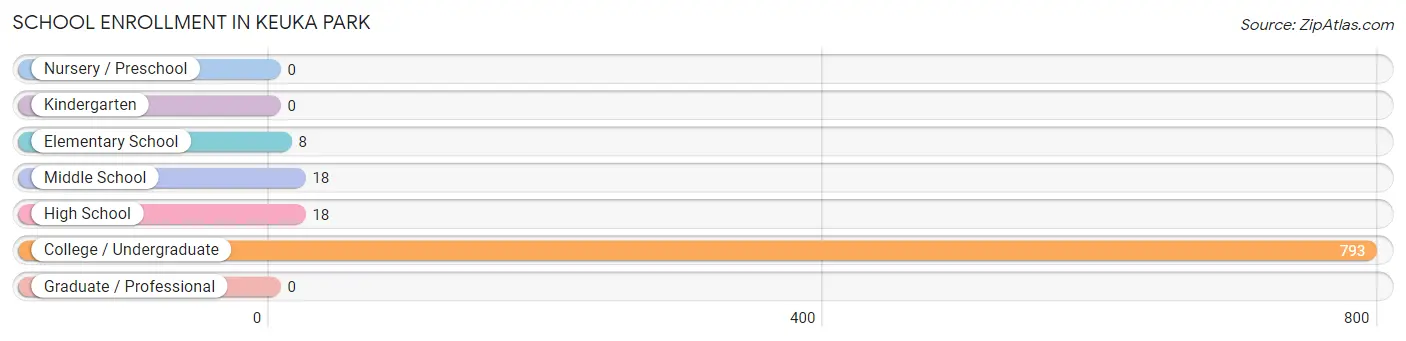
| School Level | # Students | % Students |
| Nursery / Preschool | 0 | 0.0% |
| Kindergarten | 0 | 0.0% |
| Elementary School | 8 | 1.0% |
| Middle School | 18 | 2.1% |
| High School | 18 | 2.1% |
| College / Undergraduate | 793 | 94.7% |
| Graduate / Professional | 0 | 0.0% |
| Total | 837 | 100.0% |
School Enrollment by Age by Funding Source in Keuka Park
Out of a total of 837 students who are enrolled in schools in Keuka Park, 715 (85.4%) attend a private institution, while the remaining 122 (14.6%) are enrolled in public schools. The age group of 5 to 9 year old has the highest likelihood of being enrolled in private schools, with 8 (100.0% in the age bracket) enrolled. Conversely, the age group of 10 to 14 year olds has the lowest likelihood of being enrolled in a private school, with 18 (100.0% in the age bracket) attending a public institution.
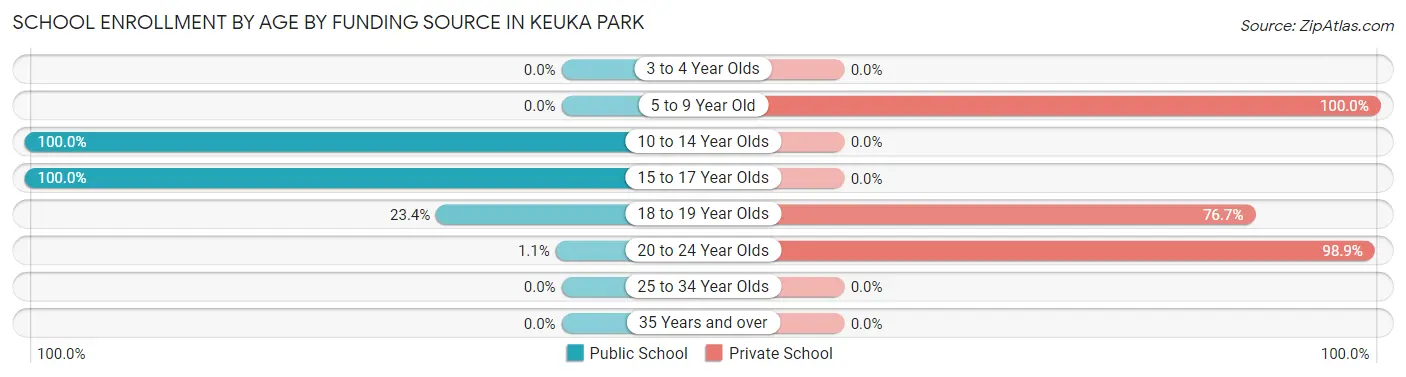
| Age Bracket | Public School | Private School |
| 3 to 4 Year Olds | 0 (0.0%) | 0 (0.0%) |
| 5 to 9 Year Old | 0 (0.0%) | 8 (100.0%) |
| 10 to 14 Year Olds | 18 (100.0%) | 0 (0.0%) |
| 15 to 17 Year Olds | 21 (100.0%) | 0 (0.0%) |
| 18 to 19 Year Olds | 78 (23.4%) | 256 (76.6%) |
| 20 to 24 Year Olds | 5 (1.1%) | 451 (98.9%) |
| 25 to 34 Year Olds | 0 (0.0%) | 0 (0.0%) |
| 35 Years and over | 0 (0.0%) | 0 (0.0%) |
| Total | 122 (14.6%) | 715 (85.4%) |
Educational Attainment by Field of Study in Keuka Park
Business (49 | 32.9%), computers & mathematics (29 | 19.5%), education (26 | 17.4%), bio, nature & agricultural (14 | 9.4%), and social sciences (13 | 8.7%) are the most common fields of study among 149 individuals in Keuka Park who have obtained a bachelor's degree or higher.
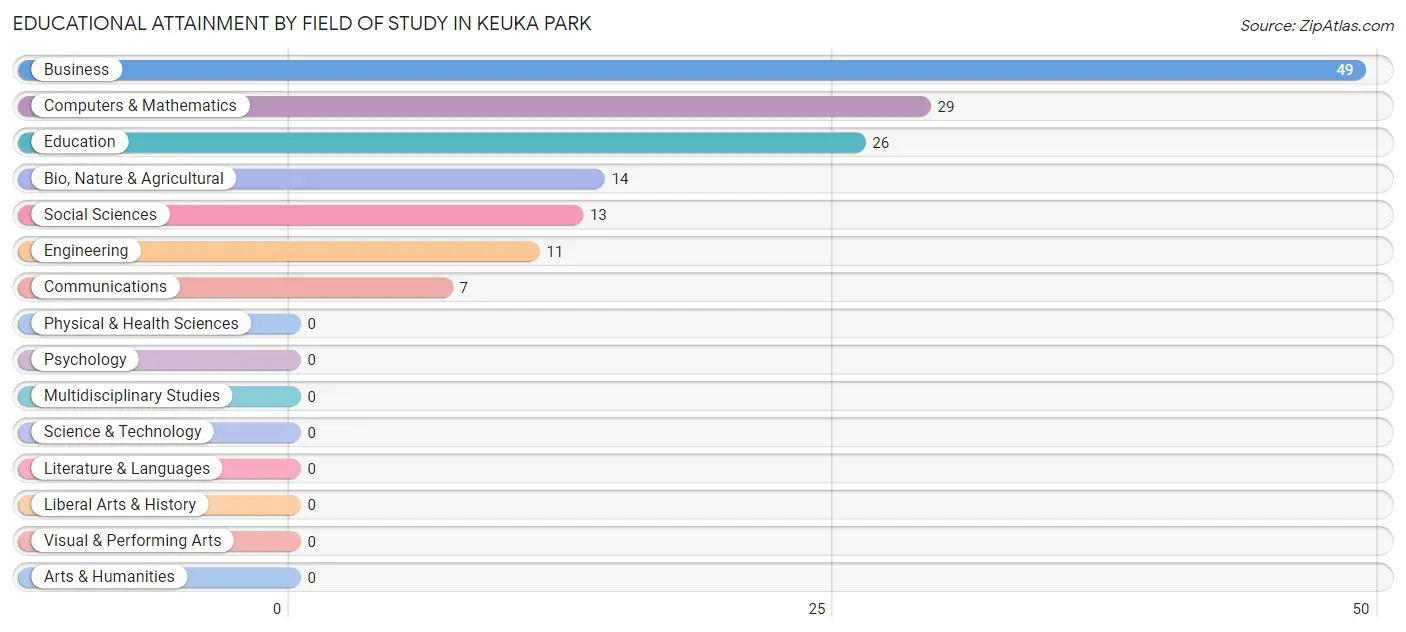
| Field of Study | # Graduates | % Graduates |
| Computers & Mathematics | 29 | 19.5% |
| Bio, Nature & Agricultural | 14 | 9.4% |
| Physical & Health Sciences | 0 | 0.0% |
| Psychology | 0 | 0.0% |
| Social Sciences | 13 | 8.7% |
| Engineering | 11 | 7.4% |
| Multidisciplinary Studies | 0 | 0.0% |
| Science & Technology | 0 | 0.0% |
| Business | 49 | 32.9% |
| Education | 26 | 17.4% |
| Literature & Languages | 0 | 0.0% |
| Liberal Arts & History | 0 | 0.0% |
| Visual & Performing Arts | 0 | 0.0% |
| Communications | 7 | 4.7% |
| Arts & Humanities | 0 | 0.0% |
| Total | 149 | 100.0% |
Transportation & Commute in Keuka Park
Vehicle Availability by Sex in Keuka Park
The most prevalent vehicle ownership categories in Keuka Park are males with 2 vehicles (31, accounting for 34.8%) and females with 2 vehicles (29, making up 50.8%).
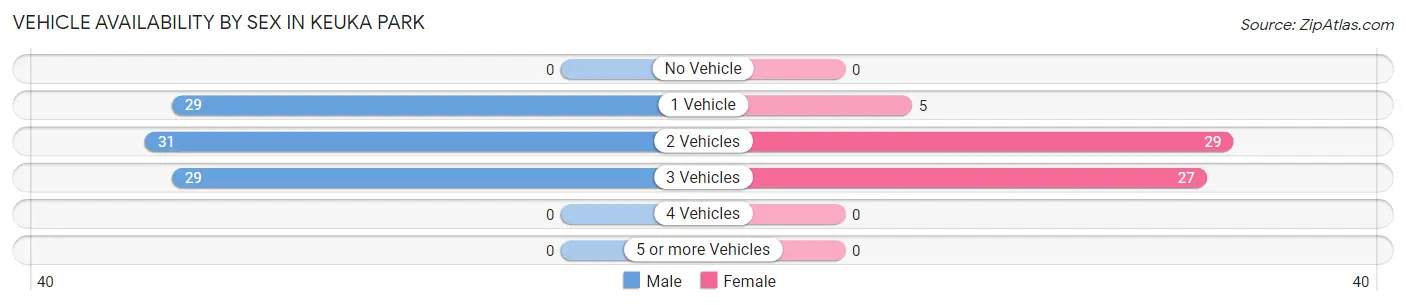
| Vehicles Available | Male | Female |
| No Vehicle | 0 (0.0%) | 0 (0.0%) |
| 1 Vehicle | 29 (32.6%) | 5 (8.2%) |
| 2 Vehicles | 31 (34.8%) | 29 (47.5%) |
| 3 Vehicles | 29 (32.6%) | 27 (44.3%) |
| 4 Vehicles | 0 (0.0%) | 0 (0.0%) |
| 5 or more Vehicles | 0 (0.0%) | 0 (0.0%) |
| Total | 89 (100.0%) | 61 (100.0%) |
Commute Time in Keuka Park
The most frequently occuring commute durations in Keuka Park are 5 to 9 minutes (108 commuters, 26.7%), 10 to 14 minutes (97 commuters, 24.0%), and 60 to 89 minutes (55 commuters, 13.6%).
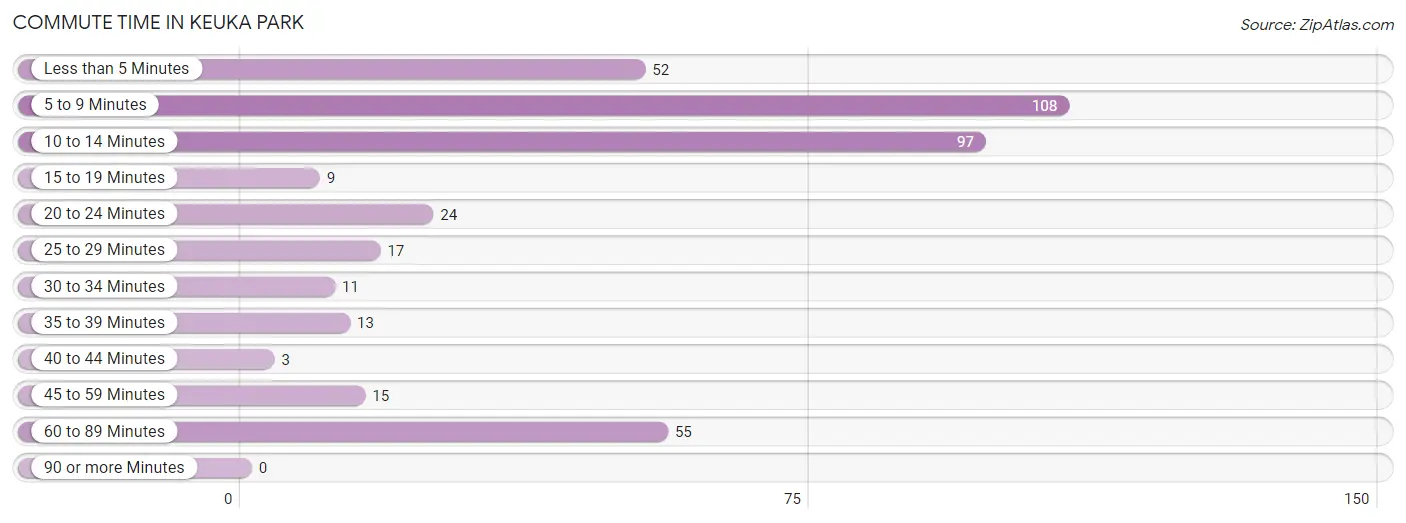
| Commute Time | # Commuters | % Commuters |
| Less than 5 Minutes | 52 | 12.9% |
| 5 to 9 Minutes | 108 | 26.7% |
| 10 to 14 Minutes | 97 | 24.0% |
| 15 to 19 Minutes | 9 | 2.2% |
| 20 to 24 Minutes | 24 | 5.9% |
| 25 to 29 Minutes | 17 | 4.2% |
| 30 to 34 Minutes | 11 | 2.7% |
| 35 to 39 Minutes | 13 | 3.2% |
| 40 to 44 Minutes | 3 | 0.7% |
| 45 to 59 Minutes | 15 | 3.7% |
| 60 to 89 Minutes | 55 | 13.6% |
| 90 or more Minutes | 0 | 0.0% |
Commute Time by Sex in Keuka Park
The most common commute times in Keuka Park are 60 to 89 minutes (55 commuters, 34.6%) for males and 5 to 9 minutes (99 commuters, 40.4%) for females.
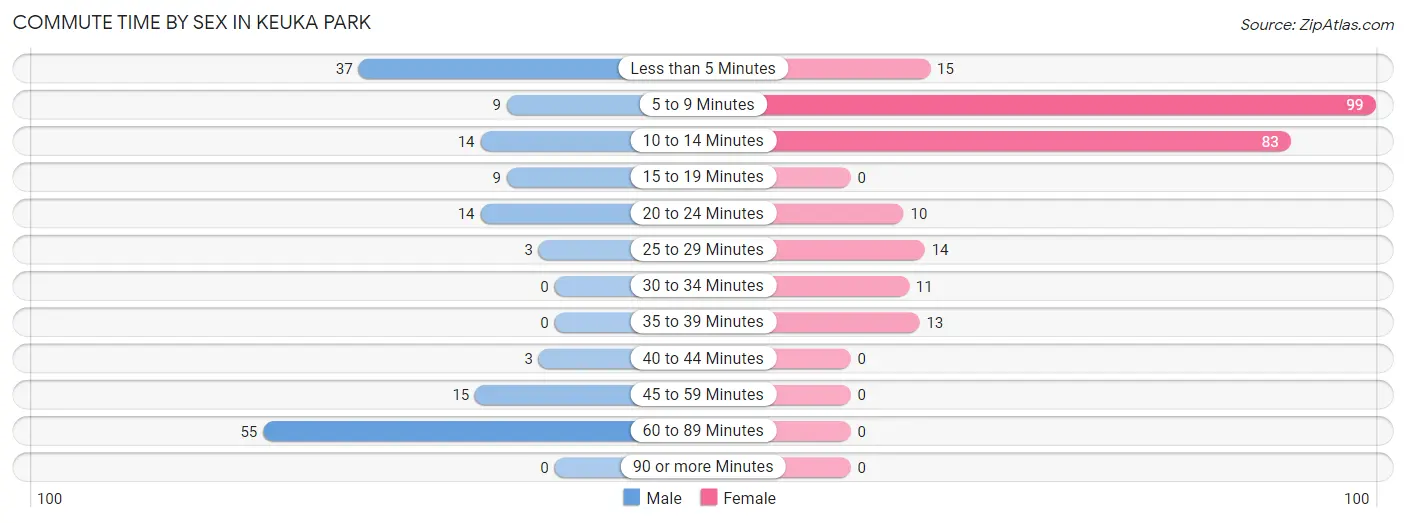
| Commute Time | Male | Female |
| Less than 5 Minutes | 37 (23.3%) | 15 (6.1%) |
| 5 to 9 Minutes | 9 (5.7%) | 99 (40.4%) |
| 10 to 14 Minutes | 14 (8.8%) | 83 (33.9%) |
| 15 to 19 Minutes | 9 (5.7%) | 0 (0.0%) |
| 20 to 24 Minutes | 14 (8.8%) | 10 (4.1%) |
| 25 to 29 Minutes | 3 (1.9%) | 14 (5.7%) |
| 30 to 34 Minutes | 0 (0.0%) | 11 (4.5%) |
| 35 to 39 Minutes | 0 (0.0%) | 13 (5.3%) |
| 40 to 44 Minutes | 3 (1.9%) | 0 (0.0%) |
| 45 to 59 Minutes | 15 (9.4%) | 0 (0.0%) |
| 60 to 89 Minutes | 55 (34.6%) | 0 (0.0%) |
| 90 or more Minutes | 0 (0.0%) | 0 (0.0%) |
Time of Departure to Work by Sex in Keuka Park
The most frequent times of departure to work in Keuka Park are 6:00 AM to 6:29 AM (50, 31.5%) for males and 12:00 PM to 3:59 PM (92, 37.6%) for females.
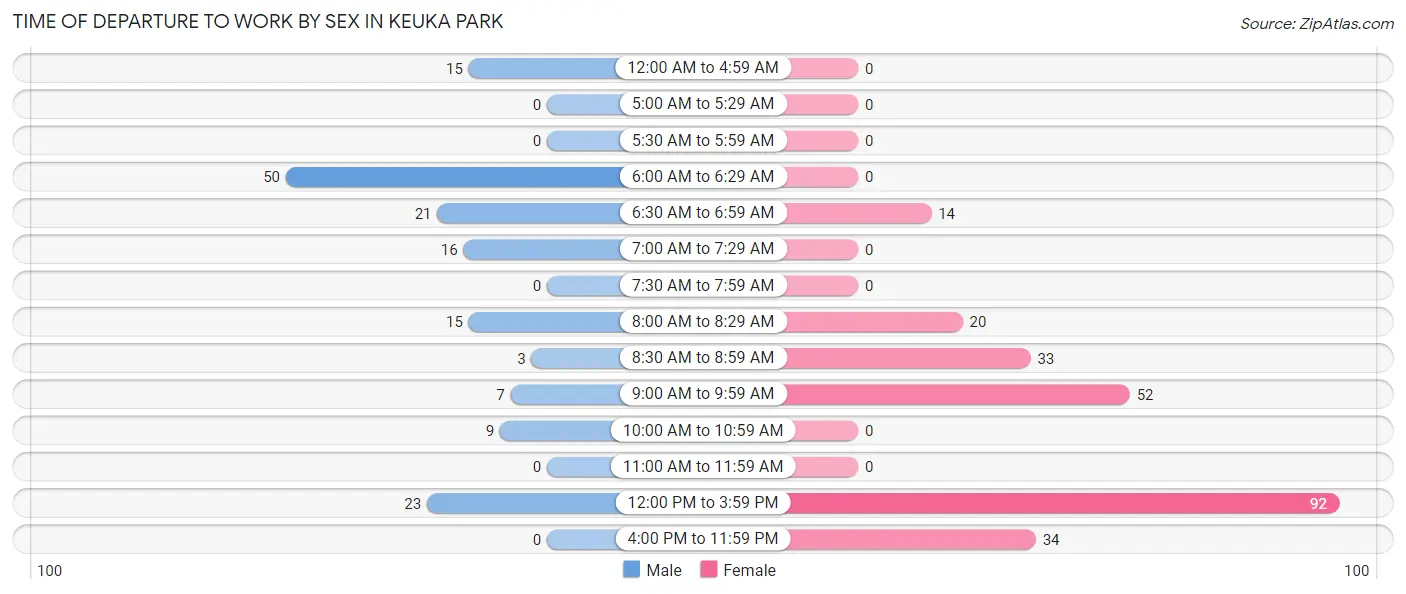
| Time of Departure | Male | Female |
| 12:00 AM to 4:59 AM | 15 (9.4%) | 0 (0.0%) |
| 5:00 AM to 5:29 AM | 0 (0.0%) | 0 (0.0%) |
| 5:30 AM to 5:59 AM | 0 (0.0%) | 0 (0.0%) |
| 6:00 AM to 6:29 AM | 50 (31.5%) | 0 (0.0%) |
| 6:30 AM to 6:59 AM | 21 (13.2%) | 14 (5.7%) |
| 7:00 AM to 7:29 AM | 16 (10.1%) | 0 (0.0%) |
| 7:30 AM to 7:59 AM | 0 (0.0%) | 0 (0.0%) |
| 8:00 AM to 8:29 AM | 15 (9.4%) | 20 (8.2%) |
| 8:30 AM to 8:59 AM | 3 (1.9%) | 33 (13.5%) |
| 9:00 AM to 9:59 AM | 7 (4.4%) | 52 (21.2%) |
| 10:00 AM to 10:59 AM | 9 (5.7%) | 0 (0.0%) |
| 11:00 AM to 11:59 AM | 0 (0.0%) | 0 (0.0%) |
| 12:00 PM to 3:59 PM | 23 (14.5%) | 92 (37.6%) |
| 4:00 PM to 11:59 PM | 0 (0.0%) | 34 (13.9%) |
| Total | 159 (100.0%) | 245 (100.0%) |
Housing Occupancy in Keuka Park
Occupancy by Ownership in Keuka Park
Of the total 140 dwellings in Keuka Park, owner-occupied units account for 77 (55.0%), while renter-occupied units make up 63 (45.0%).
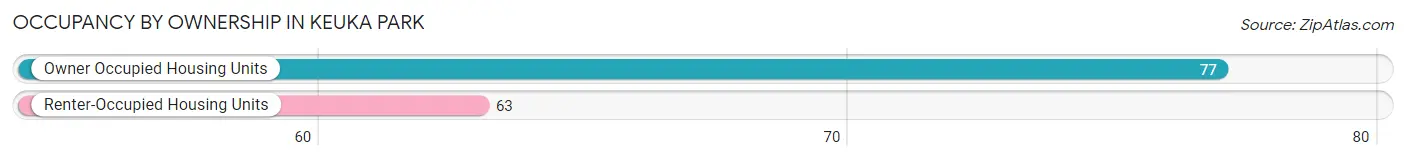
| Occupancy | # Housing Units | % Housing Units |
| Owner Occupied Housing Units | 77 | 55.0% |
| Renter-Occupied Housing Units | 63 | 45.0% |
| Total Occupied Housing Units | 140 | 100.0% |
Occupancy by Household Size in Keuka Park
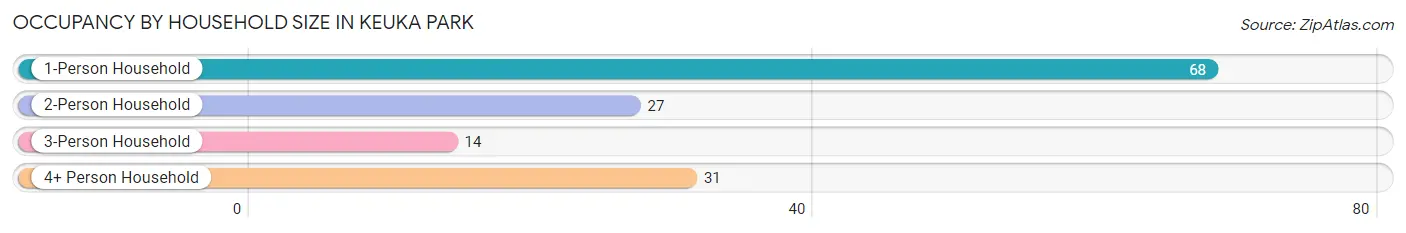
| Household Size | # Housing Units | % Housing Units |
| 1-Person Household | 68 | 48.6% |
| 2-Person Household | 27 | 19.3% |
| 3-Person Household | 14 | 10.0% |
| 4+ Person Household | 31 | 22.1% |
| Total Housing Units | 140 | 100.0% |
Occupancy by Ownership by Household Size in Keuka Park
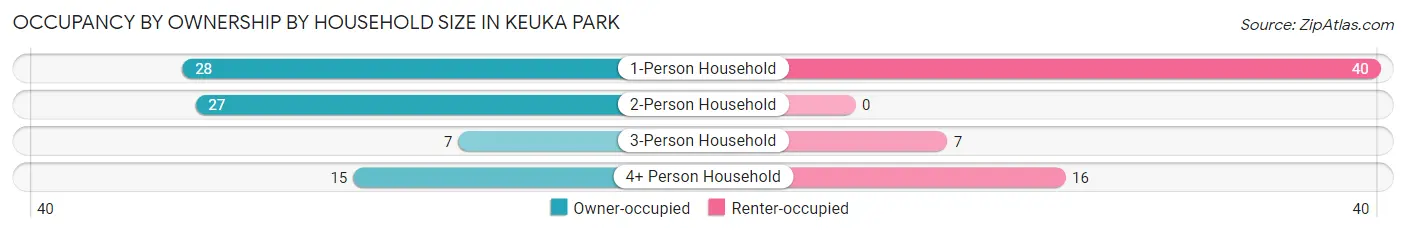
| Household Size | Owner-occupied | Renter-occupied |
| 1-Person Household | 28 (41.2%) | 40 (58.8%) |
| 2-Person Household | 27 (100.0%) | 0 (0.0%) |
| 3-Person Household | 7 (50.0%) | 7 (50.0%) |
| 4+ Person Household | 15 (48.4%) | 16 (51.6%) |
| Total Housing Units | 77 (55.0%) | 63 (45.0%) |
Occupancy by Educational Attainment in Keuka Park
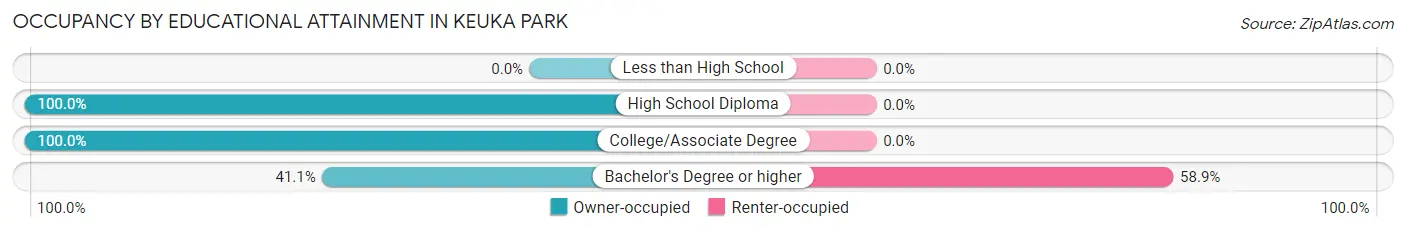
| Household Size | Owner-occupied | Renter-occupied |
| Less than High School | 0 (0.0%) | 0 (0.0%) |
| High School Diploma | 26 (100.0%) | 0 (0.0%) |
| College/Associate Degree | 7 (100.0%) | 0 (0.0%) |
| Bachelor's Degree or higher | 44 (41.1%) | 63 (58.9%) |
Occupancy by Age of Householder in Keuka Park
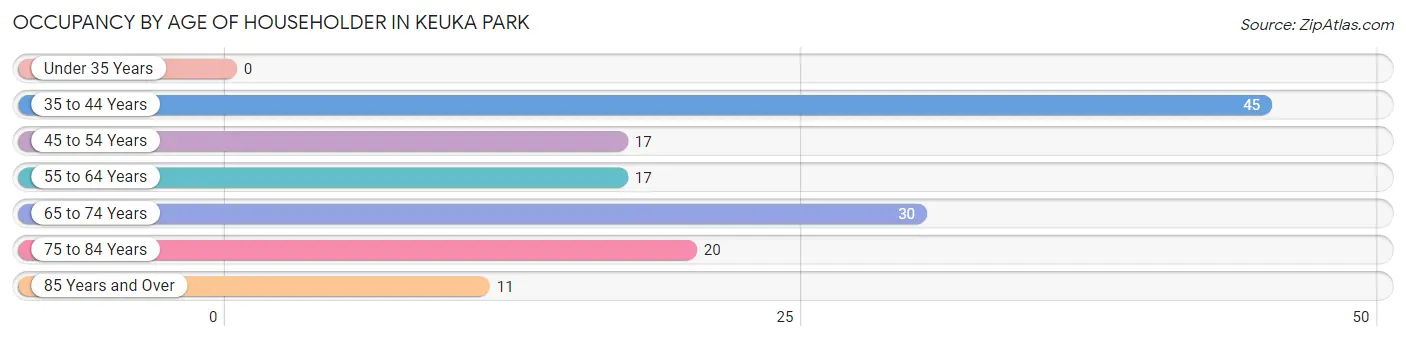
| Age Bracket | # Households | % Households |
| Under 35 Years | 0 | 0.0% |
| 35 to 44 Years | 45 | 32.1% |
| 45 to 54 Years | 17 | 12.1% |
| 55 to 64 Years | 17 | 12.1% |
| 65 to 74 Years | 30 | 21.4% |
| 75 to 84 Years | 20 | 14.3% |
| 85 Years and Over | 11 | 7.9% |
| Total | 140 | 100.0% |
Housing Finances in Keuka Park
Median Income by Occupancy in Keuka Park
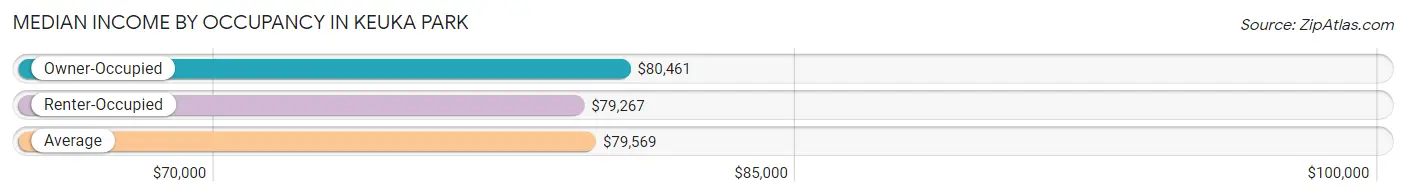
| Occupancy Type | # Households | Median Income |
| Owner-Occupied | 77 (55.0%) | $80,461 |
| Renter-Occupied | 63 (45.0%) | $79,267 |
| Average | 140 (100.0%) | $79,569 |
Occupancy by Householder Income Bracket in Keuka Park
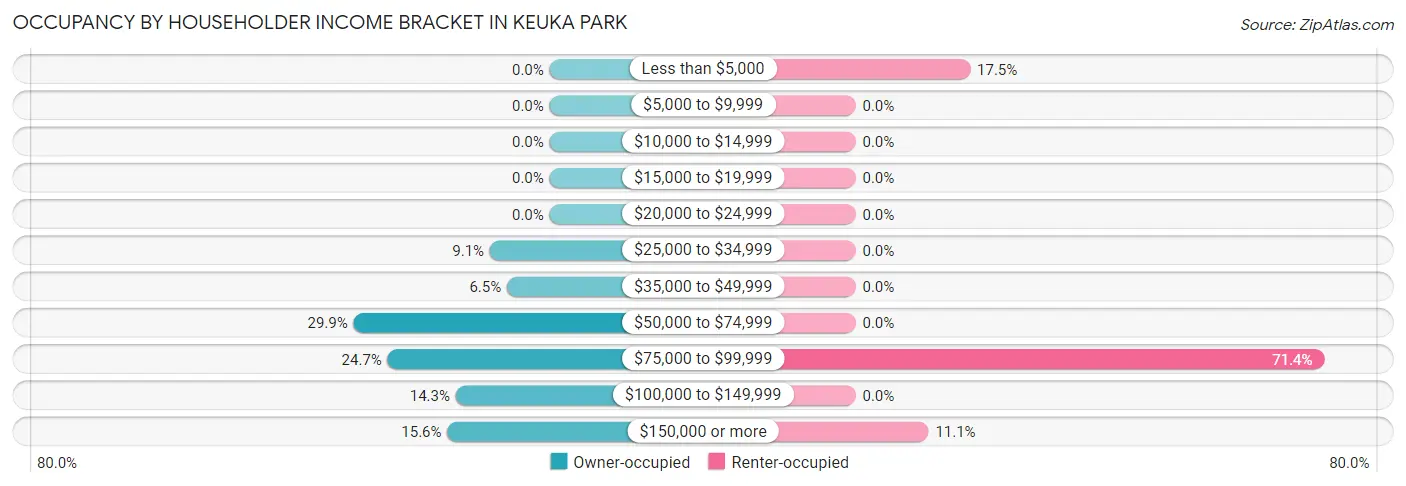
| Income Bracket | Owner-occupied | Renter-occupied |
| Less than $5,000 | 0 (0.0%) | 11 (17.5%) |
| $5,000 to $9,999 | 0 (0.0%) | 0 (0.0%) |
| $10,000 to $14,999 | 0 (0.0%) | 0 (0.0%) |
| $15,000 to $19,999 | 0 (0.0%) | 0 (0.0%) |
| $20,000 to $24,999 | 0 (0.0%) | 0 (0.0%) |
| $25,000 to $34,999 | 7 (9.1%) | 0 (0.0%) |
| $35,000 to $49,999 | 5 (6.5%) | 0 (0.0%) |
| $50,000 to $74,999 | 23 (29.9%) | 0 (0.0%) |
| $75,000 to $99,999 | 19 (24.7%) | 45 (71.4%) |
| $100,000 to $149,999 | 11 (14.3%) | 0 (0.0%) |
| $150,000 or more | 12 (15.6%) | 7 (11.1%) |
| Total | 77 (100.0%) | 63 (100.0%) |
Monthly Housing Cost Tiers in Keuka Park
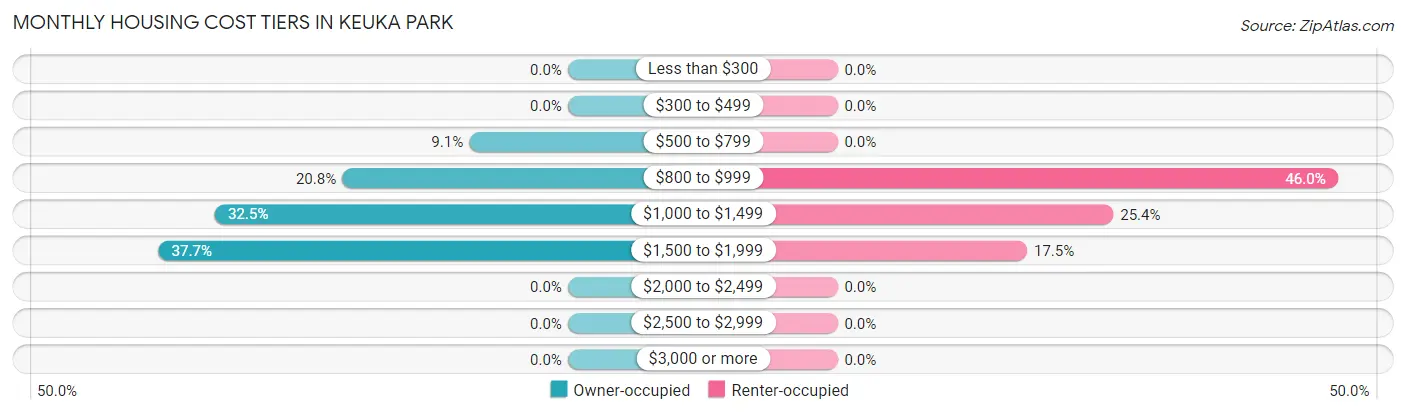
| Monthly Cost | Owner-occupied | Renter-occupied |
| Less than $300 | 0 (0.0%) | 0 (0.0%) |
| $300 to $499 | 0 (0.0%) | 0 (0.0%) |
| $500 to $799 | 7 (9.1%) | 0 (0.0%) |
| $800 to $999 | 16 (20.8%) | 29 (46.0%) |
| $1,000 to $1,499 | 25 (32.5%) | 16 (25.4%) |
| $1,500 to $1,999 | 29 (37.7%) | 11 (17.5%) |
| $2,000 to $2,499 | 0 (0.0%) | 0 (0.0%) |
| $2,500 to $2,999 | 0 (0.0%) | 0 (0.0%) |
| $3,000 or more | 0 (0.0%) | 0 (0.0%) |
| Total | 77 (100.0%) | 63 (100.0%) |
Physical Housing Characteristics in Keuka Park
Housing Structures in Keuka Park
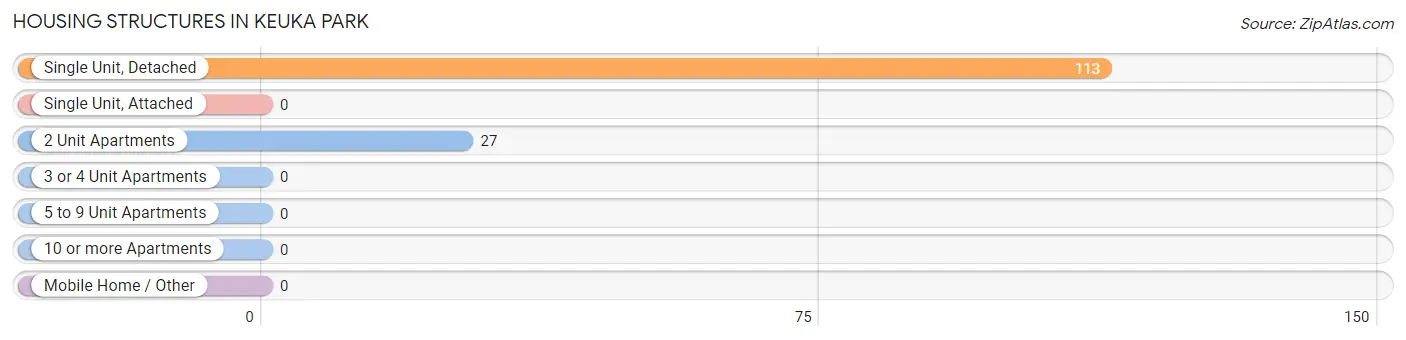
| Structure Type | # Housing Units | % Housing Units |
| Single Unit, Detached | 113 | 80.7% |
| Single Unit, Attached | 0 | 0.0% |
| 2 Unit Apartments | 27 | 19.3% |
| 3 or 4 Unit Apartments | 0 | 0.0% |
| 5 to 9 Unit Apartments | 0 | 0.0% |
| 10 or more Apartments | 0 | 0.0% |
| Mobile Home / Other | 0 | 0.0% |
| Total | 140 | 100.0% |
Housing Structures by Occupancy in Keuka Park
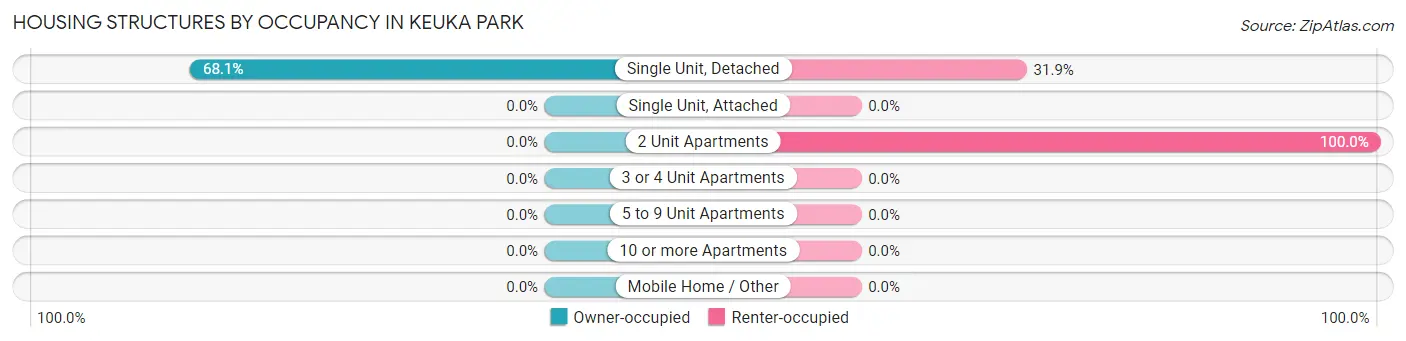
| Structure Type | Owner-occupied | Renter-occupied |
| Single Unit, Detached | 77 (68.1%) | 36 (31.9%) |
| Single Unit, Attached | 0 (0.0%) | 0 (0.0%) |
| 2 Unit Apartments | 0 (0.0%) | 27 (100.0%) |
| 3 or 4 Unit Apartments | 0 (0.0%) | 0 (0.0%) |
| 5 to 9 Unit Apartments | 0 (0.0%) | 0 (0.0%) |
| 10 or more Apartments | 0 (0.0%) | 0 (0.0%) |
| Mobile Home / Other | 0 (0.0%) | 0 (0.0%) |
| Total | 77 (55.0%) | 63 (45.0%) |
Housing Structures by Number of Rooms in Keuka Park
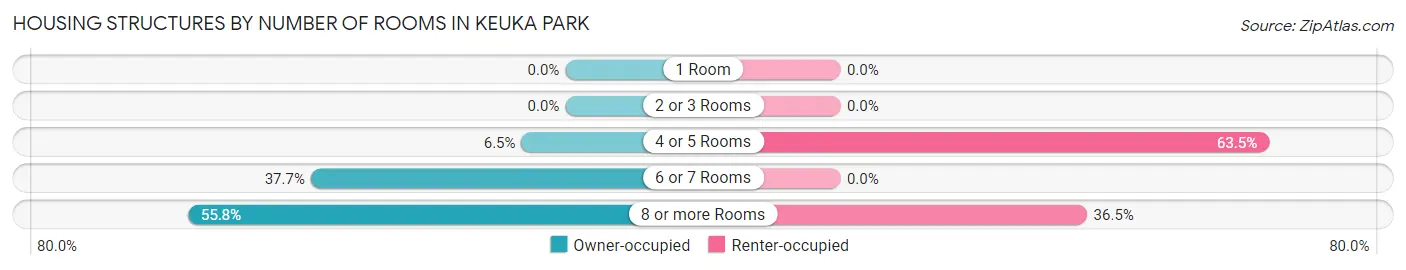
| Number of Rooms | Owner-occupied | Renter-occupied |
| 1 Room | 0 (0.0%) | 0 (0.0%) |
| 2 or 3 Rooms | 0 (0.0%) | 0 (0.0%) |
| 4 or 5 Rooms | 5 (6.5%) | 40 (63.5%) |
| 6 or 7 Rooms | 29 (37.7%) | 0 (0.0%) |
| 8 or more Rooms | 43 (55.8%) | 23 (36.5%) |
| Total | 77 (100.0%) | 63 (100.0%) |
Housing Structure by Heating Type in Keuka Park
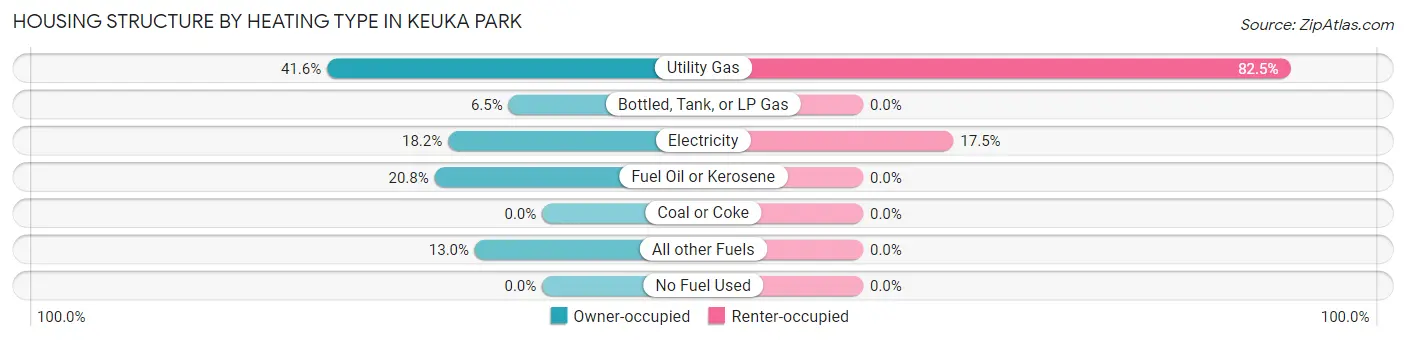
| Heating Type | Owner-occupied | Renter-occupied |
| Utility Gas | 32 (41.6%) | 52 (82.5%) |
| Bottled, Tank, or LP Gas | 5 (6.5%) | 0 (0.0%) |
| Electricity | 14 (18.2%) | 11 (17.5%) |
| Fuel Oil or Kerosene | 16 (20.8%) | 0 (0.0%) |
| Coal or Coke | 0 (0.0%) | 0 (0.0%) |
| All other Fuels | 10 (13.0%) | 0 (0.0%) |
| No Fuel Used | 0 (0.0%) | 0 (0.0%) |
| Total | 77 (100.0%) | 63 (100.0%) |
Household Vehicle Usage in Keuka Park
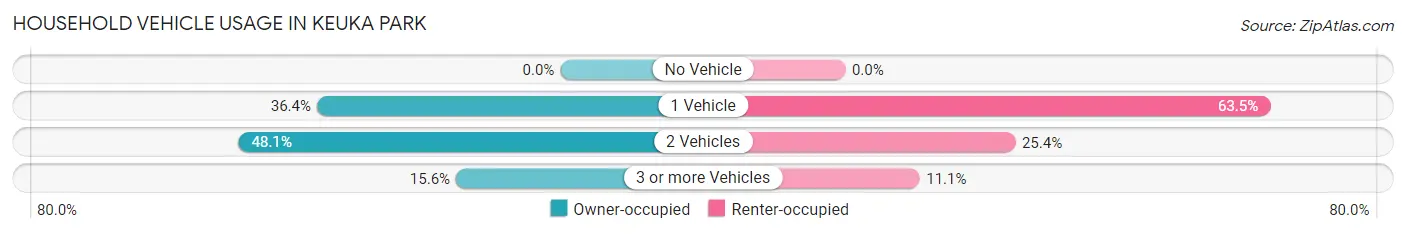
| Vehicles per Household | Owner-occupied | Renter-occupied |
| No Vehicle | 0 (0.0%) | 0 (0.0%) |
| 1 Vehicle | 28 (36.4%) | 40 (63.5%) |
| 2 Vehicles | 37 (48.0%) | 16 (25.4%) |
| 3 or more Vehicles | 12 (15.6%) | 7 (11.1%) |
| Total | 77 (100.0%) | 63 (100.0%) |
Real Estate & Mortgages in Keuka Park
Real Estate and Mortgage Overview in Keuka Park
| Characteristic | Without Mortgage | With Mortgage |
| Housing Units | 38 | 39 |
| Median Property Value | - | - |
| Median Household Income | $69,375 | $12 |
| Monthly Housing Costs | $975 | $0 |
| Real Estate Taxes | $8,700 | $0 |
Property Value by Mortgage Status in Keuka Park
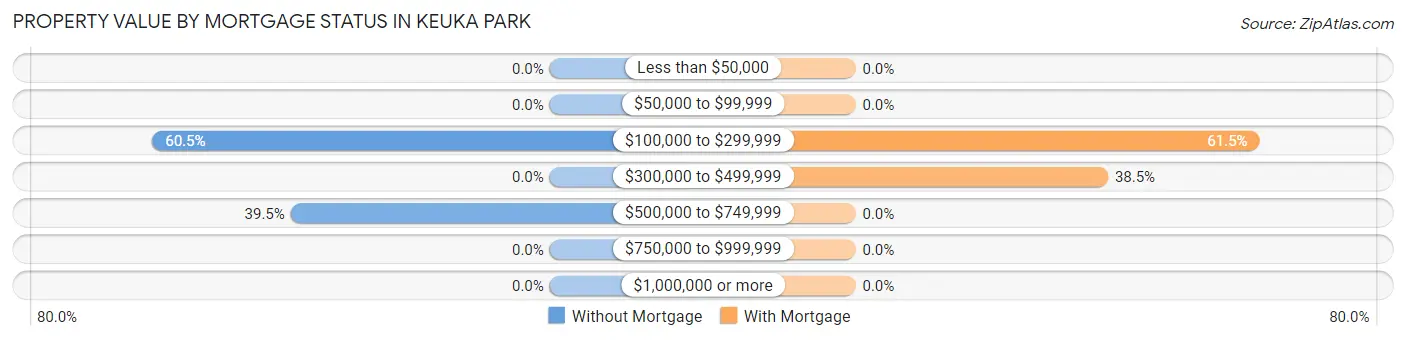
| Property Value | Without Mortgage | With Mortgage |
| Less than $50,000 | 0 (0.0%) | 0 (0.0%) |
| $50,000 to $99,999 | 0 (0.0%) | 0 (0.0%) |
| $100,000 to $299,999 | 23 (60.5%) | 24 (61.5%) |
| $300,000 to $499,999 | 0 (0.0%) | 15 (38.5%) |
| $500,000 to $749,999 | 15 (39.5%) | 0 (0.0%) |
| $750,000 to $999,999 | 0 (0.0%) | 0 (0.0%) |
| $1,000,000 or more | 0 (0.0%) | 0 (0.0%) |
| Total | 38 (100.0%) | 39 (100.0%) |
Household Income by Mortgage Status in Keuka Park
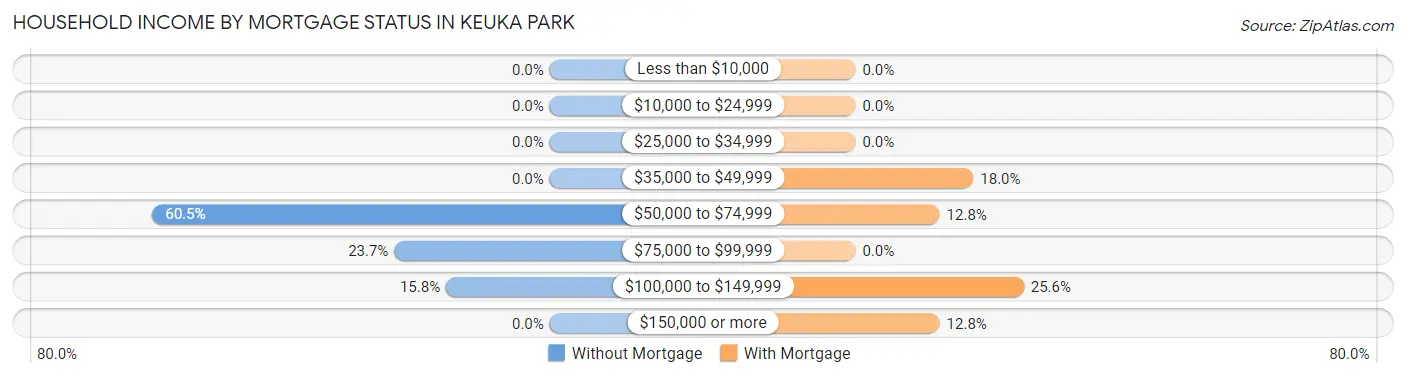
| Household Income | Without Mortgage | With Mortgage |
| Less than $10,000 | 0 (0.0%) | 0 (0.0%) |
| $10,000 to $24,999 | 0 (0.0%) | 0 (0.0%) |
| $25,000 to $34,999 | 0 (0.0%) | 0 (0.0%) |
| $35,000 to $49,999 | 0 (0.0%) | 7 (17.9%) |
| $50,000 to $74,999 | 23 (60.5%) | 5 (12.8%) |
| $75,000 to $99,999 | 9 (23.7%) | 0 (0.0%) |
| $100,000 to $149,999 | 6 (15.8%) | 10 (25.6%) |
| $150,000 or more | 0 (0.0%) | 5 (12.8%) |
| Total | 38 (100.0%) | 39 (100.0%) |
Property Value to Household Income Ratio in Keuka Park
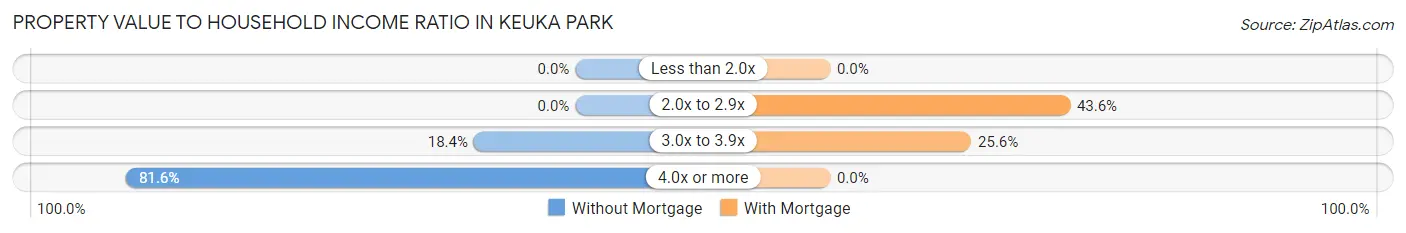
| Value-to-Income Ratio | Without Mortgage | With Mortgage |
| Less than 2.0x | 0 (0.0%) | 0 (0.0%) |
| 2.0x to 2.9x | 0 (0.0%) | 17 (43.6%) |
| 3.0x to 3.9x | 7 (18.4%) | 10 (25.6%) |
| 4.0x or more | 31 (81.6%) | 0 (0.0%) |
| Total | 38 (100.0%) | 39 (100.0%) |
Real Estate Taxes by Mortgage Status in Keuka Park
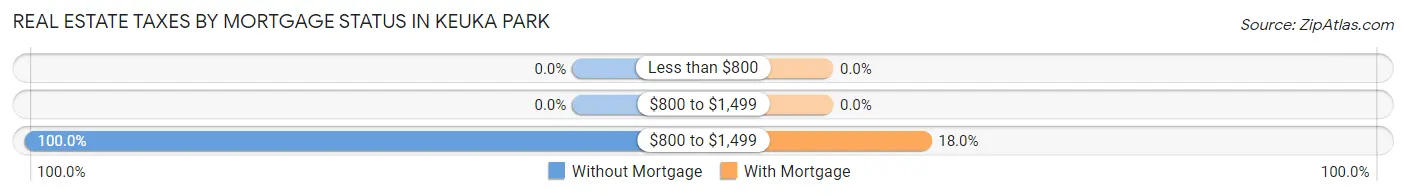
| Property Taxes | Without Mortgage | With Mortgage |
| Less than $800 | 0 (0.0%) | 0 (0.0%) |
| $800 to $1,499 | 0 (0.0%) | 0 (0.0%) |
| $800 to $1,499 | 38 (100.0%) | 7 (17.9%) |
| Total | 38 (100.0%) | 39 (100.0%) |
Health & Disability in Keuka Park
Health Insurance Coverage by Age in Keuka Park
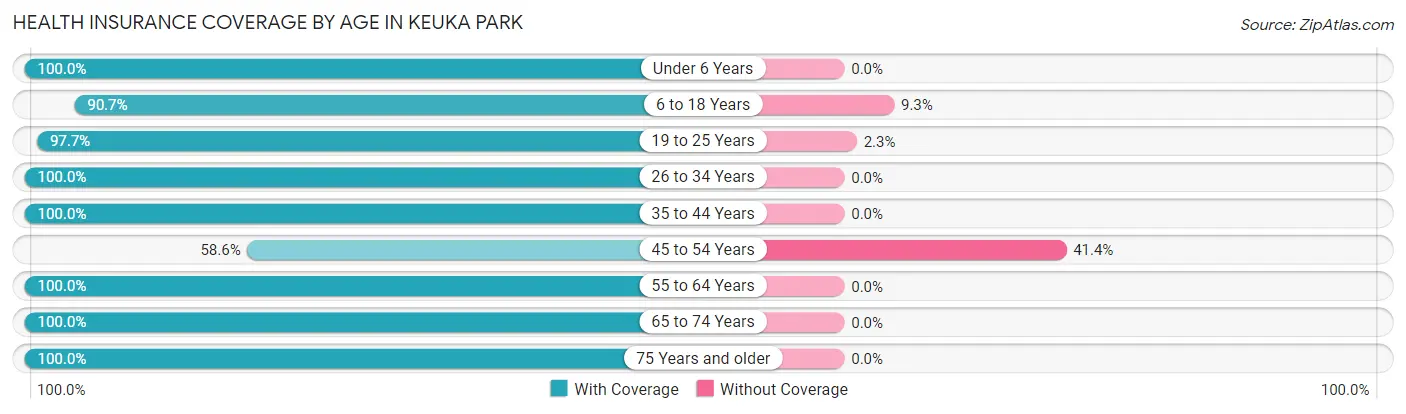
| Age Bracket | With Coverage | Without Coverage |
| Under 6 Years | 26 (100.0%) | 0 (0.0%) |
| 6 to 18 Years | 176 (90.7%) | 18 (9.3%) |
| 19 to 25 Years | 635 (97.7%) | 15 (2.3%) |
| 26 to 34 Years | 13 (100.0%) | 0 (0.0%) |
| 35 to 44 Years | 64 (100.0%) | 0 (0.0%) |
| 45 to 54 Years | 17 (58.6%) | 12 (41.4%) |
| 55 to 64 Years | 32 (100.0%) | 0 (0.0%) |
| 65 to 74 Years | 38 (100.0%) | 0 (0.0%) |
| 75 Years and older | 46 (100.0%) | 0 (0.0%) |
| Total | 1,047 (95.9%) | 45 (4.1%) |
Health Insurance Coverage by Citizenship Status in Keuka Park
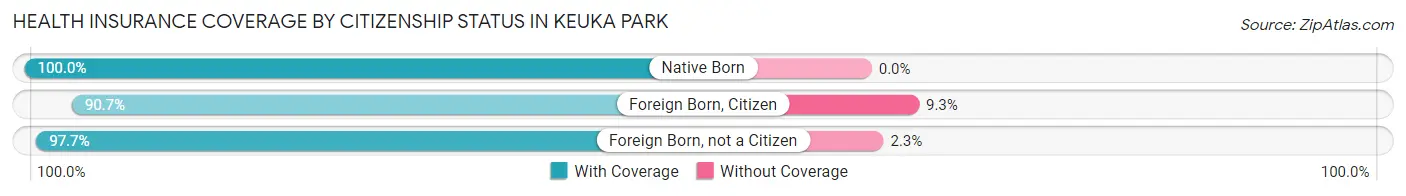
| Citizenship Status | With Coverage | Without Coverage |
| Native Born | 26 (100.0%) | 0 (0.0%) |
| Foreign Born, Citizen | 176 (90.7%) | 18 (9.3%) |
| Foreign Born, not a Citizen | 635 (97.7%) | 15 (2.3%) |
Health Insurance Coverage by Household Income in Keuka Park
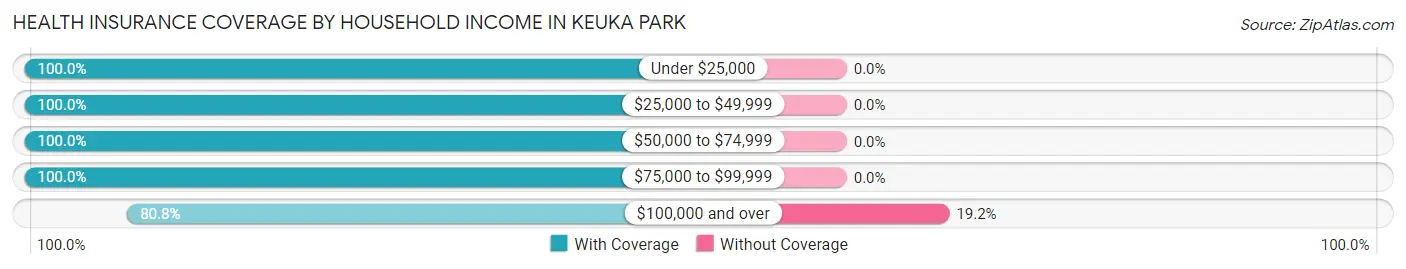
| Household Income | With Coverage | Without Coverage |
| Under $25,000 | 11 (100.0%) | 0 (0.0%) |
| $25,000 to $49,999 | 12 (100.0%) | 0 (0.0%) |
| $50,000 to $74,999 | 31 (100.0%) | 0 (0.0%) |
| $75,000 to $99,999 | 141 (100.0%) | 0 (0.0%) |
| $100,000 and over | 84 (80.8%) | 20 (19.2%) |
Public vs Private Health Insurance Coverage by Age in Keuka Park
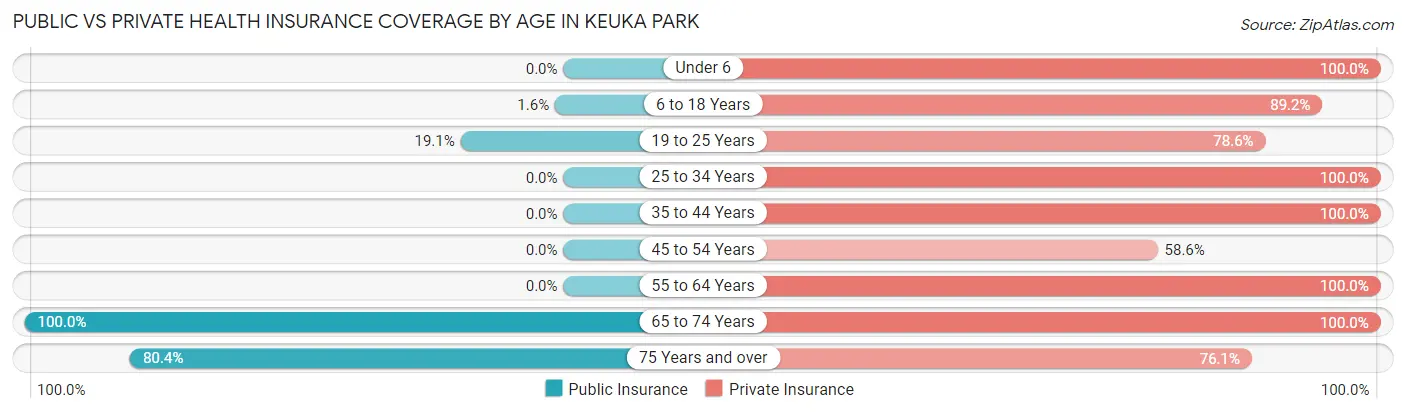
| Age Bracket | Public Insurance | Private Insurance |
| Under 6 | 0 (0.0%) | 26 (100.0%) |
| 6 to 18 Years | 3 (1.5%) | 173 (89.2%) |
| 19 to 25 Years | 124 (19.1%) | 511 (78.6%) |
| 25 to 34 Years | 0 (0.0%) | 13 (100.0%) |
| 35 to 44 Years | 0 (0.0%) | 64 (100.0%) |
| 45 to 54 Years | 0 (0.0%) | 17 (58.6%) |
| 55 to 64 Years | 0 (0.0%) | 32 (100.0%) |
| 65 to 74 Years | 38 (100.0%) | 38 (100.0%) |
| 75 Years and over | 37 (80.4%) | 35 (76.1%) |
| Total | 202 (18.5%) | 909 (83.2%) |
Disability Status by Sex by Age in Keuka Park
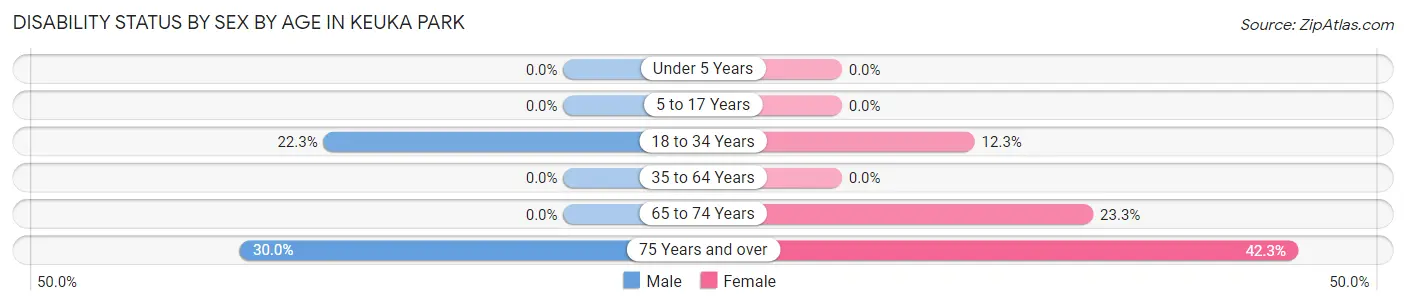
| Age Bracket | Male | Female |
| Under 5 Years | 0 (0.0%) | 0 (0.0%) |
| 5 to 17 Years | 0 (0.0%) | 0 (0.0%) |
| 18 to 34 Years | 63 (22.3%) | 65 (12.3%) |
| 35 to 64 Years | 0 (0.0%) | 0 (0.0%) |
| 65 to 74 Years | 0 (0.0%) | 7 (23.3%) |
| 75 Years and over | 6 (30.0%) | 11 (42.3%) |
Disability Class by Sex by Age in Keuka Park
Disability Class: Hearing Difficulty
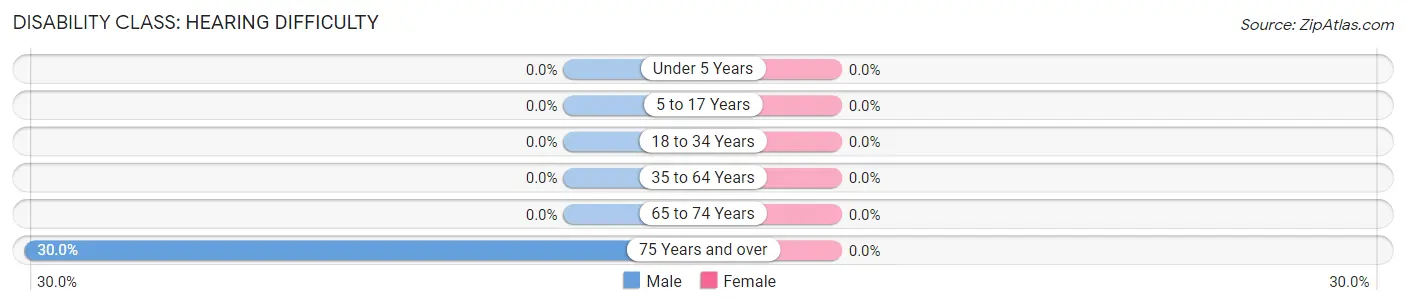
| Age Bracket | Male | Female |
| Under 5 Years | 0 (0.0%) | 0 (0.0%) |
| 5 to 17 Years | 0 (0.0%) | 0 (0.0%) |
| 18 to 34 Years | 0 (0.0%) | 0 (0.0%) |
| 35 to 64 Years | 0 (0.0%) | 0 (0.0%) |
| 65 to 74 Years | 0 (0.0%) | 0 (0.0%) |
| 75 Years and over | 6 (30.0%) | 0 (0.0%) |
Disability Class: Vision Difficulty
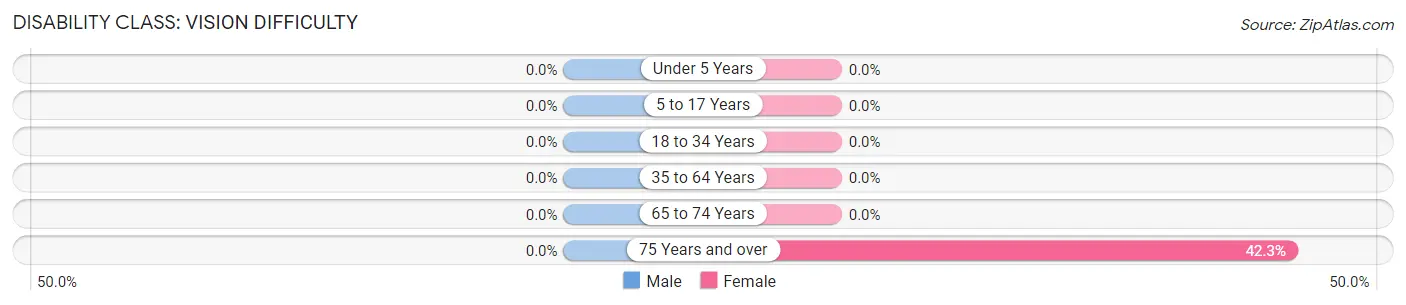
| Age Bracket | Male | Female |
| Under 5 Years | 0 (0.0%) | 0 (0.0%) |
| 5 to 17 Years | 0 (0.0%) | 0 (0.0%) |
| 18 to 34 Years | 0 (0.0%) | 0 (0.0%) |
| 35 to 64 Years | 0 (0.0%) | 0 (0.0%) |
| 65 to 74 Years | 0 (0.0%) | 0 (0.0%) |
| 75 Years and over | 0 (0.0%) | 11 (42.3%) |
Disability Class: Cognitive Difficulty
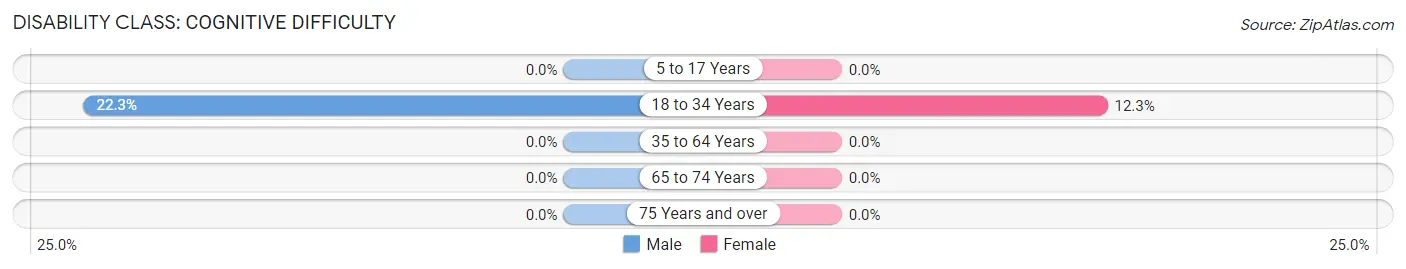
| Age Bracket | Male | Female |
| 5 to 17 Years | 0 (0.0%) | 0 (0.0%) |
| 18 to 34 Years | 63 (22.3%) | 65 (12.3%) |
| 35 to 64 Years | 0 (0.0%) | 0 (0.0%) |
| 65 to 74 Years | 0 (0.0%) | 0 (0.0%) |
| 75 Years and over | 0 (0.0%) | 0 (0.0%) |
Disability Class: Ambulatory Difficulty
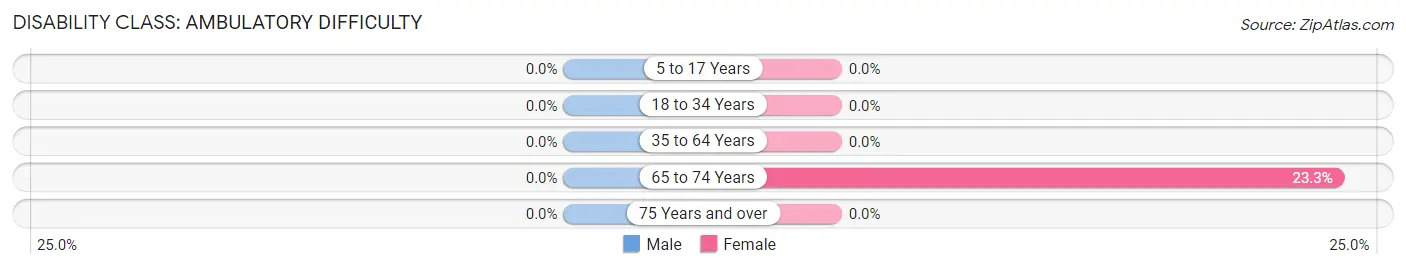
| Age Bracket | Male | Female |
| 5 to 17 Years | 0 (0.0%) | 0 (0.0%) |
| 18 to 34 Years | 0 (0.0%) | 0 (0.0%) |
| 35 to 64 Years | 0 (0.0%) | 0 (0.0%) |
| 65 to 74 Years | 0 (0.0%) | 7 (23.3%) |
| 75 Years and over | 0 (0.0%) | 0 (0.0%) |
Disability Class: Self-Care Difficulty
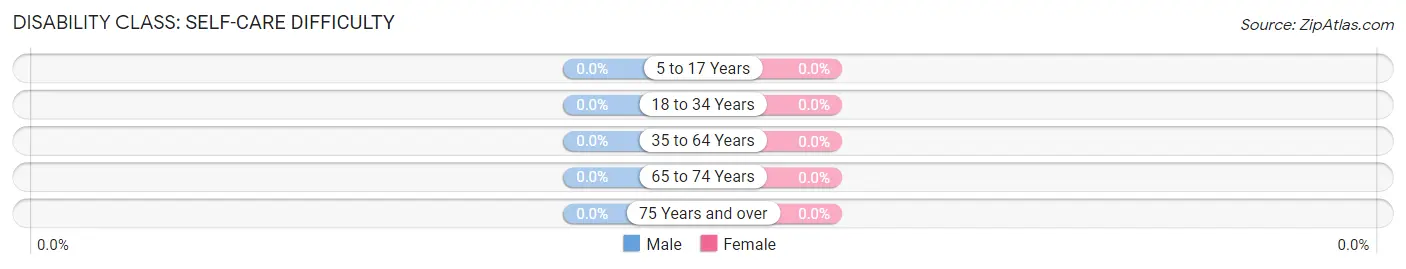
| Age Bracket | Male | Female |
| 5 to 17 Years | 0 (0.0%) | 0 (0.0%) |
| 18 to 34 Years | 0 (0.0%) | 0 (0.0%) |
| 35 to 64 Years | 0 (0.0%) | 0 (0.0%) |
| 65 to 74 Years | 0 (0.0%) | 0 (0.0%) |
| 75 Years and over | 0 (0.0%) | 0 (0.0%) |
Technology Access in Keuka Park
Computing Device Access in Keuka Park
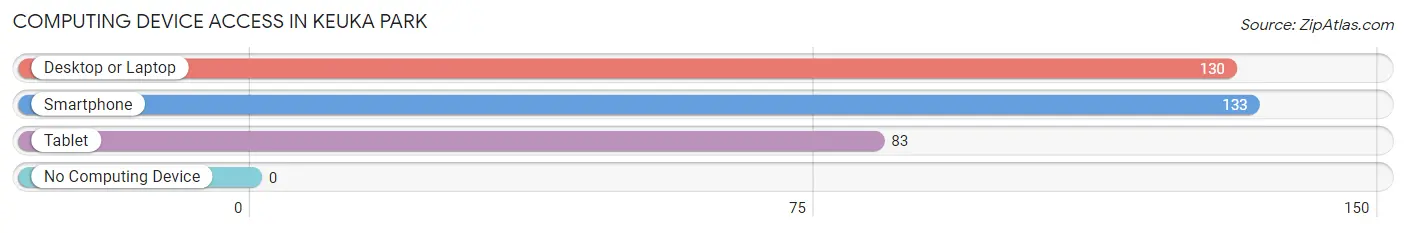
| Device Type | # Households | % Households |
| Desktop or Laptop | 130 | 92.9% |
| Smartphone | 133 | 95.0% |
| Tablet | 83 | 59.3% |
| No Computing Device | 0 | 0.0% |
| Total | 140 | 100.0% |
Internet Access in Keuka Park
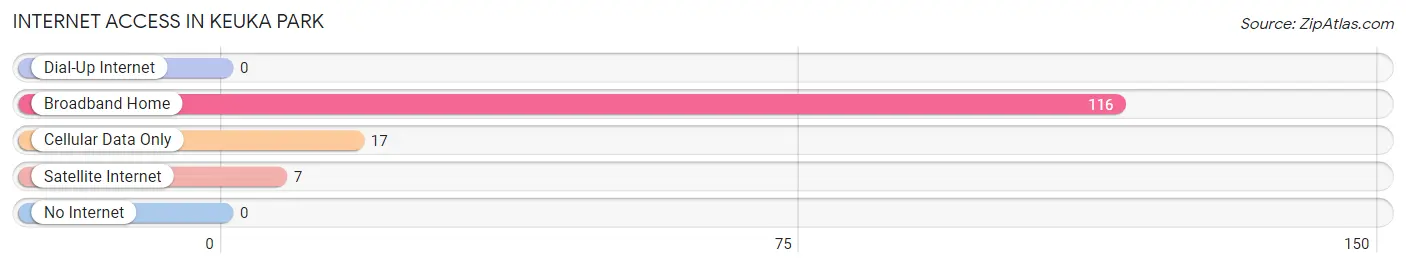
| Internet Type | # Households | % Households |
| Dial-Up Internet | 0 | 0.0% |
| Broadband Home | 116 | 82.9% |
| Cellular Data Only | 17 | 12.1% |
| Satellite Internet | 7 | 5.0% |
| No Internet | 0 | 0.0% |
| Total | 140 | 100.0% |
Keuka Park Summary
Keuka Park is a small hamlet located in the town of Jerusalem in Yates County, New York. It is situated on the east side of Keuka Lake, one of the Finger Lakes in the region. The hamlet is known for its picturesque views of the lake and its surrounding hills, as well as its proximity to the Finger Lakes Wine Trail.
History
The area that is now Keuka Park was first settled in the early 19th century by settlers from New England. The hamlet was originally known as “East Bluff” and was part of the town of Jerusalem. In 1872, the hamlet was renamed Keuka Park after the lake it sits on. The name “Keuka” is derived from the Iroquois word for “lake.”
In the late 19th century, Keuka Park became a popular summer resort destination for wealthy families from Rochester and Syracuse. The hamlet was home to several large hotels, including the Keuka Park Hotel, which was built in 1887 and was the largest hotel in the Finger Lakes region. The hotel was destroyed by fire in 1912.
In the early 20th century, Keuka Park became a popular destination for boaters and fishermen. The hamlet was home to several marinas, including the Keuka Park Marina, which was established in the 1920s.
Geography
Keuka Park is located in the Finger Lakes region of New York, on the east side of Keuka Lake. The hamlet is situated at an elevation of 645 feet (196 m) above sea level. The area is characterized by rolling hills and is surrounded by vineyards and orchards.
The climate in Keuka Park is humid continental, with cold winters and warm summers. The average annual temperature is 48°F (9°C), and the average annual precipitation is 37 inches (94 cm).
Economy
The economy of Keuka Park is largely based on tourism. The hamlet is home to several wineries, including the Keuka Lake Vineyards, which produces award-winning wines. The hamlet is also home to several marinas, which offer boat rentals and fishing charters.
In addition, Keuka Park is home to several small businesses, including restaurants, gift shops, and art galleries. The hamlet is also home to the Keuka College, which offers a variety of undergraduate and graduate degree programs.
Demographics
As of the 2010 census, the population of Keuka Park was 1,093. The racial makeup of the hamlet was 97.2% White, 0.7% African American, 0.3% Native American, 0.3% Asian, and 1.5% from other races. The median household income was $45,000, and the median family income was $50,000.
The majority of the population (90.2%) is over the age of 18, and the median age is 43. The population is evenly split between males and females. The majority of the population (90.2%) is married, and the median household size is 2.5 people.
Common Questions
What is Per Capita Income in Keuka Park?
Per Capita income in Keuka Park is $16,685.
What is the Median Family Income in Keuka Park?
Median Family Income in Keuka Park is $89,063.
What is the Median Household income in Keuka Park?
Median Household Income in Keuka Park is $79,569.
What is Income or Wage Gap in Keuka Park?
Income or Wage Gap in Keuka Park is 50.4%.
Women in Keuka Park earn 49.6 cents for every dollar earned by a man.
What is Inequality or Gini Index in Keuka Park?
Inequality or Gini Index in Keuka Park is 0.37.
What is the Total Population of Keuka Park?
Total Population of Keuka Park is 1,092.
What is the Total Male Population of Keuka Park?
Total Male Population of Keuka Park is 428.
What is the Total Female Population of Keuka Park?
Total Female Population of Keuka Park is 664.
What is the Ratio of Males per 100 Females in Keuka Park?
There are 64.46 Males per 100 Females in Keuka Park.
What is the Ratio of Females per 100 Males in Keuka Park?
There are 155.14 Females per 100 Males in Keuka Park.
What is the Median Population Age in Keuka Park?
Median Population Age in Keuka Park is 20.4 Years.
What is the Average Family Size in Keuka Park
Average Family Size in Keuka Park is 3.2 People.
What is the Average Household Size in Keuka Park
Average Household Size in Keuka Park is 2.1 People.
How Large is the Labor Force in Keuka Park?
There are 518 People in the Labor Forcein in Keuka Park.
What is the Percentage of People in the Labor Force in Keuka Park?
50.7% of People are in the Labor Force in Keuka Park.
What is the Unemployment Rate in Keuka Park?
Unemployment Rate in Keuka Park is 5.6%.