Jordan, NY Map & Demographics
Jordan Map
Jordan Overview
$32,505
PER CAPITA INCOME
$81,719
AVG FAMILY INCOME
$71,488
AVG HOUSEHOLD INCOME
55.8%
WAGE / INCOME GAP [ % ]
44.2¢/ $1
WAGE / INCOME GAP [ $ ]
0.38
INEQUALITY / GINI INDEX
1,480
TOTAL POPULATION
659
MALE POPULATION
821
FEMALE POPULATION
80.27
MALES / 100 FEMALES
124.58
FEMALES / 100 MALES
38.9
MEDIAN AGE
3.1
AVG FAMILY SIZE
2.5
AVG HOUSEHOLD SIZE
722
LABOR FORCE [ PEOPLE ]
63.8%
PERCENT IN LABOR FORCE
3.7%
UNEMPLOYMENT RATE
Jordan Zip Codes
Jordan Area Codes
Income in Jordan
Income Overview in Jordan
Per Capita Income in Jordan is $32,505, while median incomes of families and households are $81,719 and $71,488 respectively.
| Characteristic | Number | Measure |
| Per Capita Income | 1,480 | $32,505 |
| Median Family Income | 393 | $81,719 |
| Mean Family Income | 393 | $91,462 |
| Median Household Income | 600 | $71,488 |
| Mean Household Income | 600 | $80,765 |
| Income Deficit | 393 | $0 |
| Wage / Income Gap (%) | 1,480 | 55.81% |
| Wage / Income Gap ($) | 1,480 | 44.19¢ per $1 |
| Gini / Inequality Index | 1,480 | 0.38 |
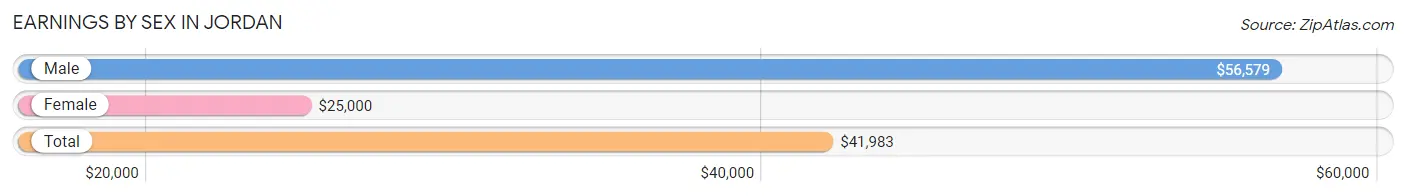
Earnings by Sex in Jordan
Average Earnings in Jordan are $41,983, $56,579 for men and $25,000 for women, a difference of 55.8%.
| Sex | Number | Average Earnings |
| Male | 314 (40.5%) | $56,579 |
| Female | 462 (59.5%) | $25,000 |
| Total | 776 (100.0%) | $41,983 |
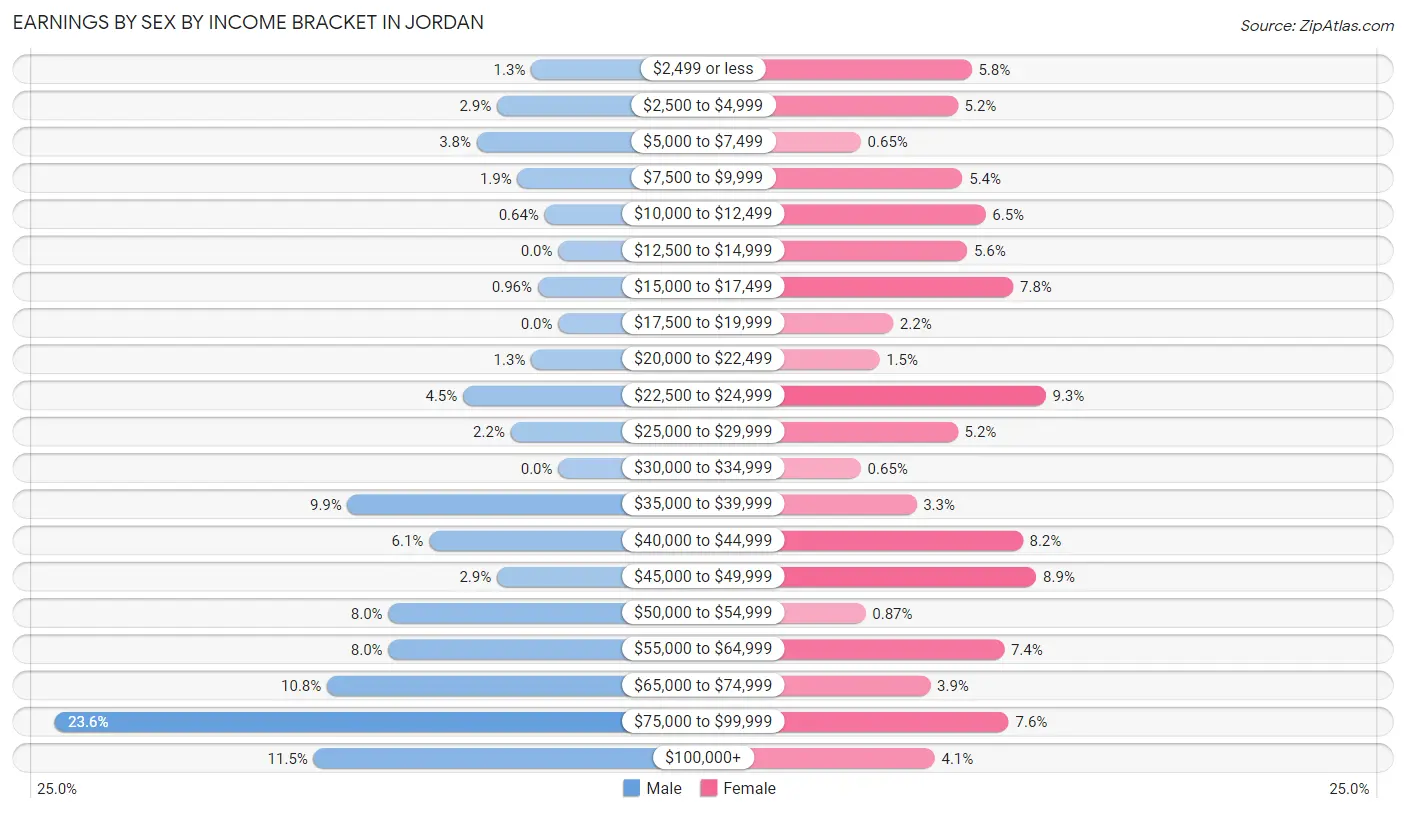
Earnings by Sex by Income Bracket in Jordan
The most common earnings brackets in Jordan are $75,000 to $99,999 for men (74 | 23.6%) and $22,500 to $24,999 for women (43 | 9.3%).
| Income | Male | Female |
| $2,499 or less | 4 (1.3%) | 27 (5.8%) |
| $2,500 to $4,999 | 9 (2.9%) | 24 (5.2%) |
| $5,000 to $7,499 | 12 (3.8%) | 3 (0.6%) |
| $7,500 to $9,999 | 6 (1.9%) | 25 (5.4%) |
| $10,000 to $12,499 | 2 (0.6%) | 30 (6.5%) |
| $12,500 to $14,999 | 0 (0.0%) | 26 (5.6%) |
| $15,000 to $17,499 | 3 (1.0%) | 36 (7.8%) |
| $17,500 to $19,999 | 0 (0.0%) | 10 (2.2%) |
| $20,000 to $22,499 | 4 (1.3%) | 7 (1.5%) |
| $22,500 to $24,999 | 14 (4.5%) | 43 (9.3%) |
| $25,000 to $29,999 | 7 (2.2%) | 24 (5.2%) |
| $30,000 to $34,999 | 0 (0.0%) | 3 (0.6%) |
| $35,000 to $39,999 | 31 (9.9%) | 15 (3.3%) |
| $40,000 to $44,999 | 19 (6.0%) | 38 (8.2%) |
| $45,000 to $49,999 | 9 (2.9%) | 41 (8.9%) |
| $50,000 to $54,999 | 25 (8.0%) | 4 (0.9%) |
| $55,000 to $64,999 | 25 (8.0%) | 34 (7.4%) |
| $65,000 to $74,999 | 34 (10.8%) | 18 (3.9%) |
| $75,000 to $99,999 | 74 (23.6%) | 35 (7.6%) |
| $100,000+ | 36 (11.5%) | 19 (4.1%) |
| Total | 314 (100.0%) | 462 (100.0%) |
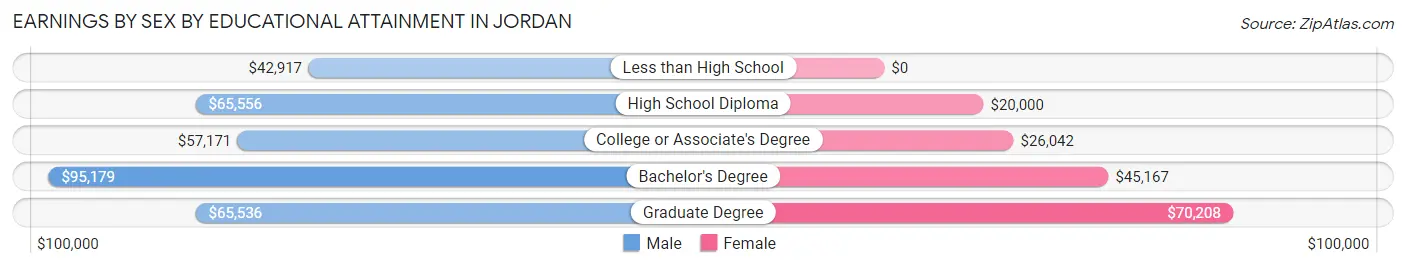
Earnings by Sex by Educational Attainment in Jordan
Average earnings in Jordan are $65,156 for men and $38,250 for women, a difference of 41.3%. Men with an educational attainment of bachelor's degree enjoy the highest average annual earnings of $95,179, while those with less than high school education earn the least with $42,917. Women with an educational attainment of graduate degree earn the most with the average annual earnings of $70,208, while those with high school diploma education have the smallest earnings of $20,000.
| Educational Attainment | Male Income | Female Income |
| Less than High School | $42,917 | $0 |
| High School Diploma | $65,556 | $20,000 |
| College or Associate's Degree | $57,171 | $26,042 |
| Bachelor's Degree | $95,179 | $45,167 |
| Graduate Degree | $65,536 | $70,208 |
| Total | $65,156 | $38,250 |
Family Income in Jordan
Family Income Brackets in Jordan
According to the Jordan family income data, there are 100 families falling into the $100,000 to $149,999 income range, which is the most common income bracket and makes up 25.5% of all families. Conversely, the less than $10,000 income bracket is the least frequent group with only 3 families (0.8%) belonging to this category.
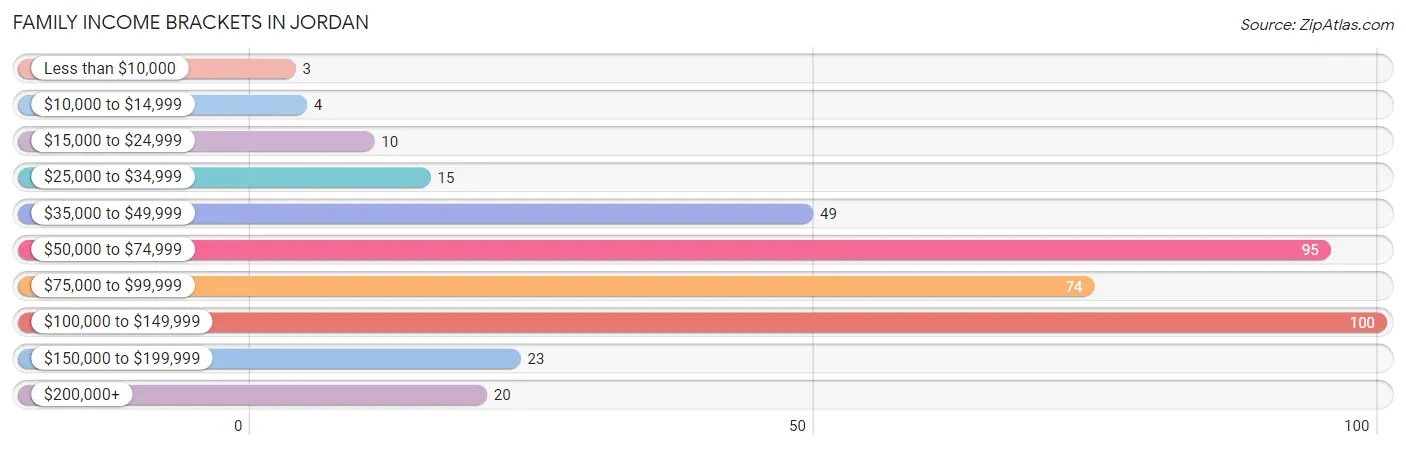
| Income Bracket | # Families | % Families |
| Less than $10,000 | 3 | 0.8% |
| $10,000 to $14,999 | 4 | 1.0% |
| $15,000 to $24,999 | 10 | 2.5% |
| $25,000 to $34,999 | 15 | 3.8% |
| $35,000 to $49,999 | 49 | 12.5% |
| $50,000 to $74,999 | 95 | 24.2% |
| $75,000 to $99,999 | 74 | 18.8% |
| $100,000 to $149,999 | 100 | 25.4% |
| $150,000 to $199,999 | 23 | 5.9% |
| $200,000+ | 20 | 5.1% |
Family Income by Famaliy Size in Jordan
4-person families (41 | 10.4%) account for the highest median family income in Jordan with $138,750 per family, while 2-person families (194 | 49.4%) have the highest median income of $36,020 per family member.
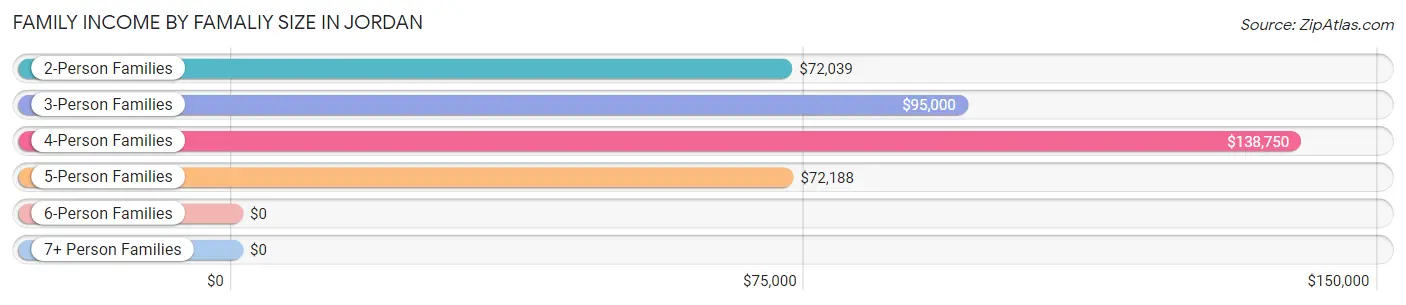
| Income Bracket | # Families | Median Income |
| 2-Person Families | 194 (49.4%) | $72,039 |
| 3-Person Families | 88 (22.4%) | $95,000 |
| 4-Person Families | 41 (10.4%) | $138,750 |
| 5-Person Families | 53 (13.5%) | $72,188 |
| 6-Person Families | 4 (1.0%) | $0 |
| 7+ Person Families | 13 (3.3%) | $0 |
| Total | 393 (100.0%) | $81,719 |
Family Income by Number of Earners in Jordan
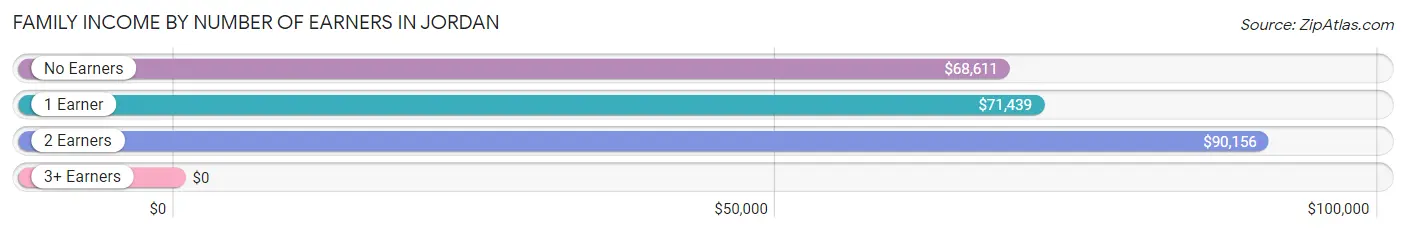
| Number of Earners | # Families | Median Income |
| No Earners | 54 (13.7%) | $68,611 |
| 1 Earner | 96 (24.4%) | $71,439 |
| 2 Earners | 219 (55.7%) | $90,156 |
| 3+ Earners | 24 (6.1%) | $0 |
| Total | 393 (100.0%) | $81,719 |
Household Income in Jordan
Household Income Brackets in Jordan
With 119 households falling in the category, the $100,000 to $149,999 income range is the most frequent in Jordan, accounting for 19.8% of all households. In contrast, only 13 households (2.2%) fall into the less than $10,000 income bracket, making it the least populous group.
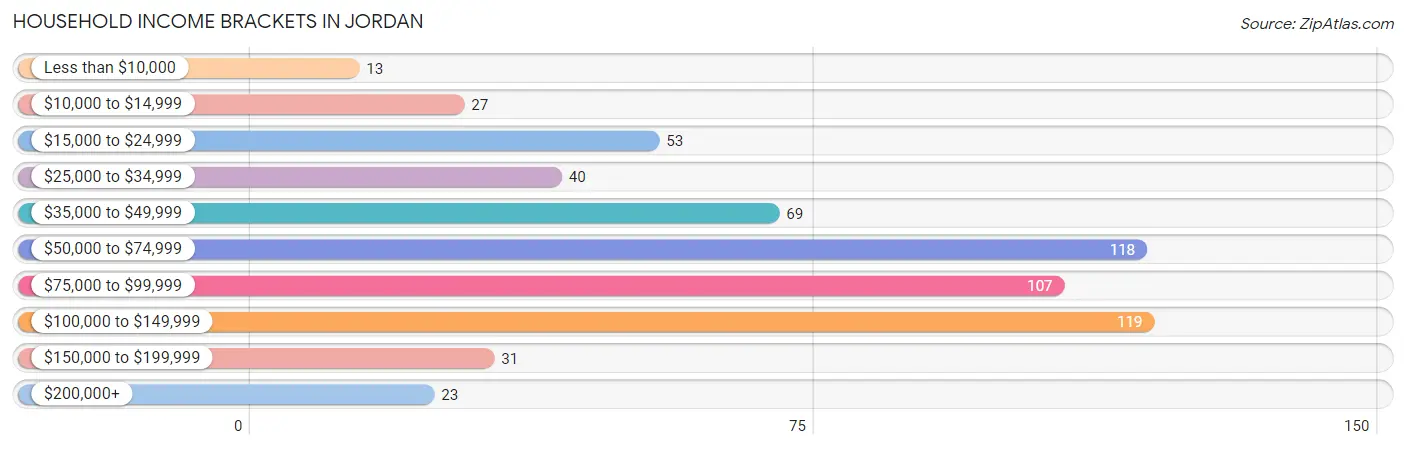
| Income Bracket | # Households | % Households |
| Less than $10,000 | 13 | 2.2% |
| $10,000 to $14,999 | 27 | 4.5% |
| $15,000 to $24,999 | 53 | 8.8% |
| $25,000 to $34,999 | 40 | 6.7% |
| $35,000 to $49,999 | 69 | 11.5% |
| $50,000 to $74,999 | 118 | 19.7% |
| $75,000 to $99,999 | 107 | 17.8% |
| $100,000 to $149,999 | 119 | 19.8% |
| $150,000 to $199,999 | 31 | 5.2% |
| $200,000+ | 23 | 3.8% |
Household Income by Householder Age in Jordan
The median household income in Jordan is $71,488, with the highest median household income of $90,156 found in the 25 to 44 years age bracket for the primary householder. A total of 177 households (29.5%) fall into this category. Meanwhile, the 15 to 24 years age bracket for the primary householder has the lowest median household income of $0, with 16 households (2.7%) in this group.
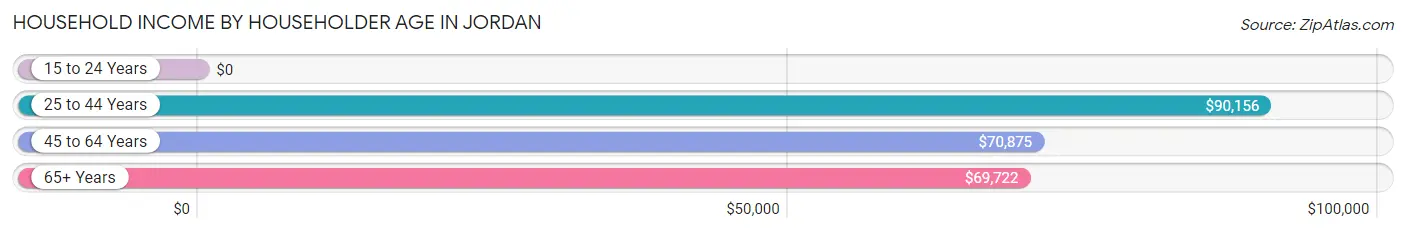
| Income Bracket | # Households | Median Income |
| 15 to 24 Years | 16 (2.7%) | $0 |
| 25 to 44 Years | 177 (29.5%) | $90,156 |
| 45 to 64 Years | 233 (38.8%) | $70,875 |
| 65+ Years | 174 (29.0%) | $69,722 |
| Total | 600 (100.0%) | $71,488 |
Poverty in Jordan
Income Below Poverty by Sex and Age in Jordan
With 13.8% poverty level for males and 12.9% for females among the residents of Jordan, 16 and 17 year old males and 12 to 14 year old females are the most vulnerable to poverty, with 12 males (66.7%) and 8 females (100.0%) in their respective age groups living below the poverty level.
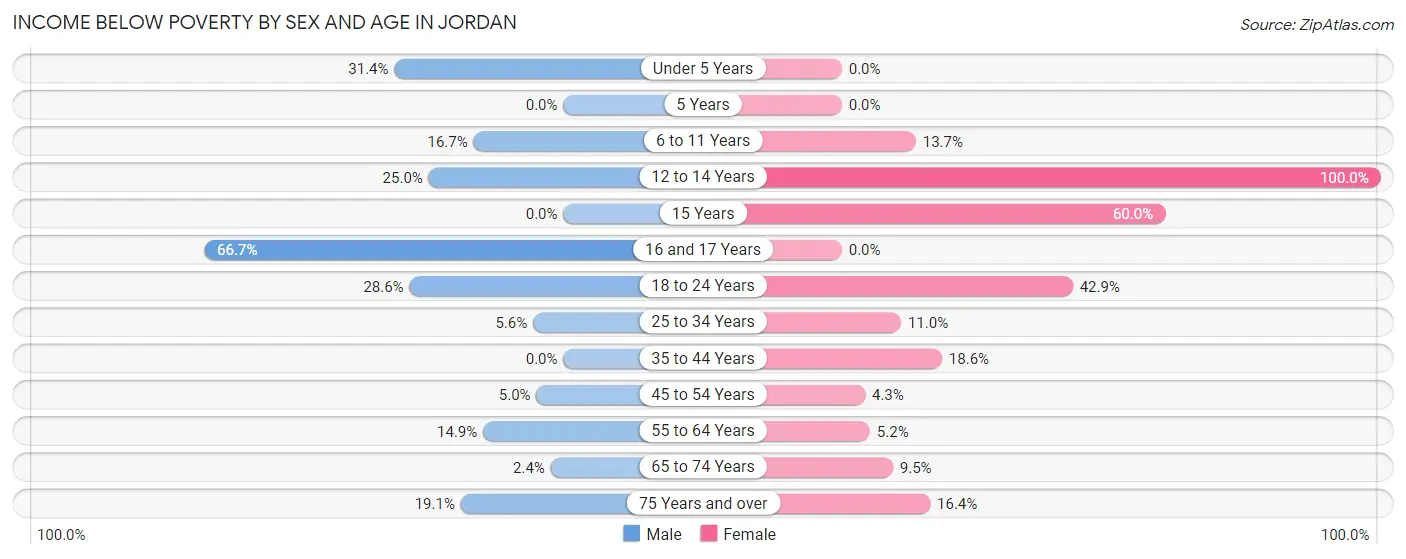
| Age Bracket | Male | Female |
| Under 5 Years | 16 (31.4%) | 0 (0.0%) |
| 5 Years | 0 (0.0%) | 0 (0.0%) |
| 6 to 11 Years | 10 (16.7%) | 7 (13.7%) |
| 12 to 14 Years | 7 (25.0%) | 8 (100.0%) |
| 15 Years | 0 (0.0%) | 12 (60.0%) |
| 16 and 17 Years | 12 (66.7%) | 0 (0.0%) |
| 18 to 24 Years | 14 (28.6%) | 18 (42.9%) |
| 25 to 34 Years | 4 (5.6%) | 10 (11.0%) |
| 35 to 44 Years | 0 (0.0%) | 21 (18.6%) |
| 45 to 54 Years | 3 (5.0%) | 4 (4.3%) |
| 55 to 64 Years | 14 (14.9%) | 6 (5.2%) |
| 65 to 74 Years | 2 (2.4%) | 9 (9.5%) |
| 75 Years and over | 8 (19.1%) | 10 (16.4%) |
| Total | 90 (13.8%) | 105 (12.9%) |
Income Above Poverty by Sex and Age in Jordan
According to the poverty statistics in Jordan, males aged 5 years and females aged under 5 years are the age groups that are most secure financially, with 100.0% of males and 100.0% of females in these age groups living above the poverty line.
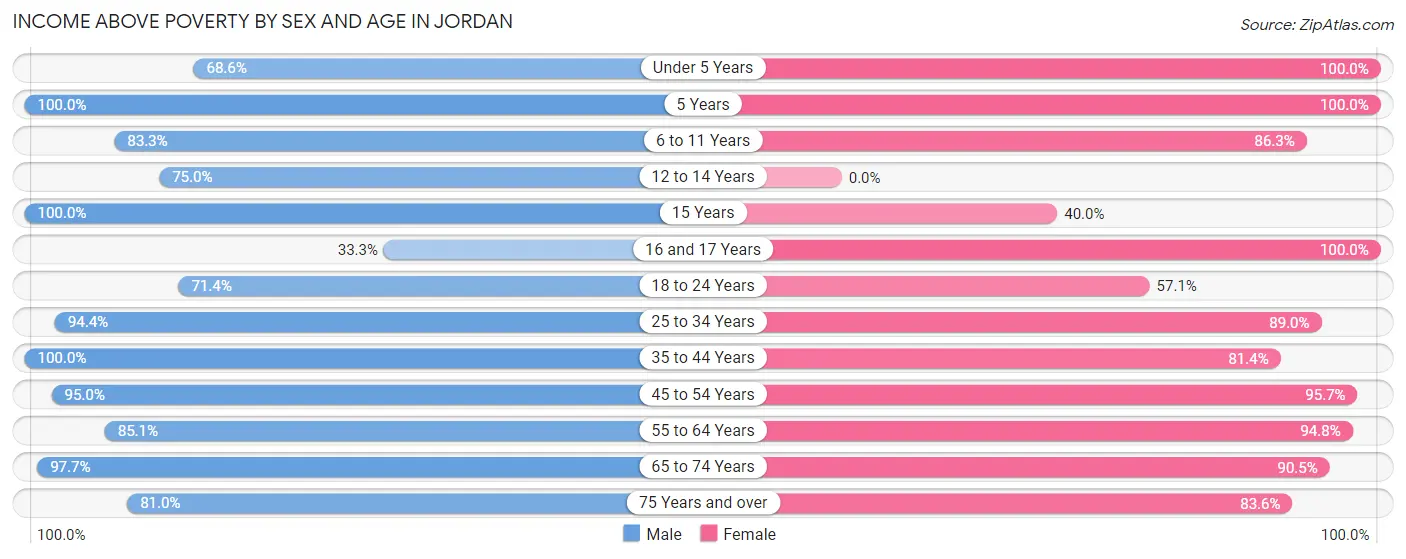
| Age Bracket | Male | Female |
| Under 5 Years | 35 (68.6%) | 94 (100.0%) |
| 5 Years | 6 (100.0%) | 11 (100.0%) |
| 6 to 11 Years | 50 (83.3%) | 44 (86.3%) |
| 12 to 14 Years | 21 (75.0%) | 0 (0.0%) |
| 15 Years | 6 (100.0%) | 8 (40.0%) |
| 16 and 17 Years | 6 (33.3%) | 21 (100.0%) |
| 18 to 24 Years | 35 (71.4%) | 24 (57.1%) |
| 25 to 34 Years | 67 (94.4%) | 81 (89.0%) |
| 35 to 44 Years | 81 (100.0%) | 92 (81.4%) |
| 45 to 54 Years | 57 (95.0%) | 89 (95.7%) |
| 55 to 64 Years | 80 (85.1%) | 109 (94.8%) |
| 65 to 74 Years | 83 (97.7%) | 86 (90.5%) |
| 75 Years and over | 34 (80.9%) | 51 (83.6%) |
| Total | 561 (86.2%) | 710 (87.1%) |
Income Below Poverty Among Married-Couple Families in Jordan
The poverty statistics for married-couple families in Jordan show that 3.0% or 10 of the total 338 families live below the poverty line. Families with 3 or 4 children have the highest poverty rate of 15.1%, comprising of 10 families. On the other hand, families with no children have the lowest poverty rate of 0.0%, which includes 0 families.
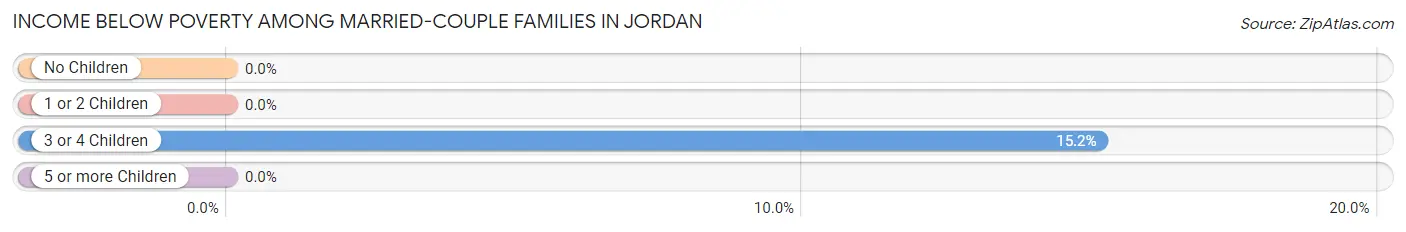
| Children | Above Poverty | Below Poverty |
| No Children | 194 (100.0%) | 0 (0.0%) |
| 1 or 2 Children | 78 (100.0%) | 0 (0.0%) |
| 3 or 4 Children | 56 (84.9%) | 10 (15.1%) |
| 5 or more Children | 0 (0.0%) | 0 (0.0%) |
| Total | 328 (97.0%) | 10 (3.0%) |
Income Below Poverty Among Single-Parent Households in Jordan
According to the poverty data in Jordan, 23.1% or 3 single-father households and 33.3% or 14 single-mother households are living below the poverty line. Among single-father households, those with no children have the highest poverty rate, with 3 households (100.0%) experiencing poverty. Likewise, among single-mother households, those with 1 or 2 children have the highest poverty rate, with 14 households (35.9%) falling below the poverty line.
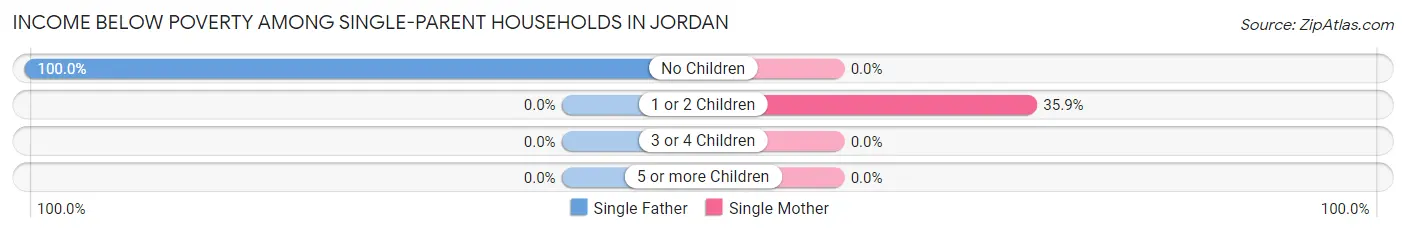
| Children | Single Father | Single Mother |
| No Children | 3 (100.0%) | 0 (0.0%) |
| 1 or 2 Children | 0 (0.0%) | 14 (35.9%) |
| 3 or 4 Children | 0 (0.0%) | 0 (0.0%) |
| 5 or more Children | 0 (0.0%) | 0 (0.0%) |
| Total | 3 (23.1%) | 14 (33.3%) |
Income Below Poverty Among Married-Couple vs Single-Parent Households in Jordan
The poverty data for Jordan shows that 10 of the married-couple family households (3.0%) and 17 of the single-parent households (30.9%) are living below the poverty level. Within the married-couple family households, those with 3 or 4 children have the highest poverty rate, with 10 households (15.1%) falling below the poverty line. Among the single-parent households, those with no children have the highest poverty rate, with 3 household (50.0%) living below poverty.
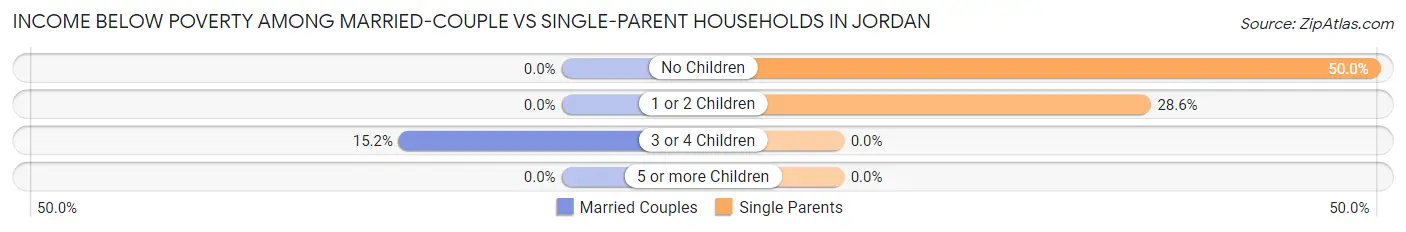
| Children | Married-Couple Families | Single-Parent Households |
| No Children | 0 (0.0%) | 3 (50.0%) |
| 1 or 2 Children | 0 (0.0%) | 14 (28.6%) |
| 3 or 4 Children | 10 (15.1%) | 0 (0.0%) |
| 5 or more Children | 0 (0.0%) | 0 (0.0%) |
| Total | 10 (3.0%) | 17 (30.9%) |
Race in Jordan
The most populous races in Jordan are White / Caucasian (1,402 | 94.7%), Two or more Races (57 | 3.8%), and Hispanic or Latino (20 | 1.3%).
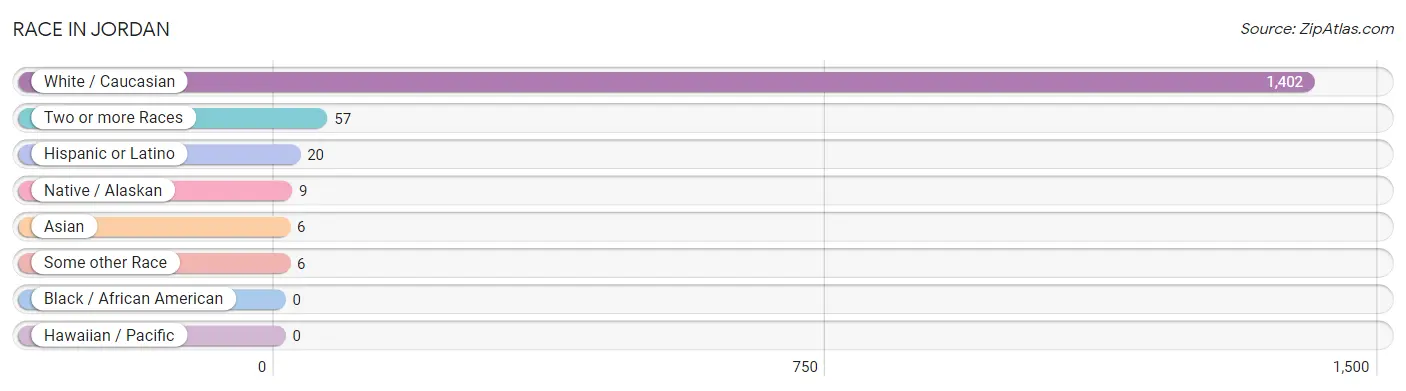
| Race | # Population | % Population |
| Asian | 6 | 0.4% |
| Black / African American | 0 | 0.0% |
| Hawaiian / Pacific | 0 | 0.0% |
| Hispanic or Latino | 20 | 1.3% |
| Native / Alaskan | 9 | 0.6% |
| White / Caucasian | 1,402 | 94.7% |
| Two or more Races | 57 | 3.8% |
| Some other Race | 6 | 0.4% |
| Total | 1,480 | 100.0% |
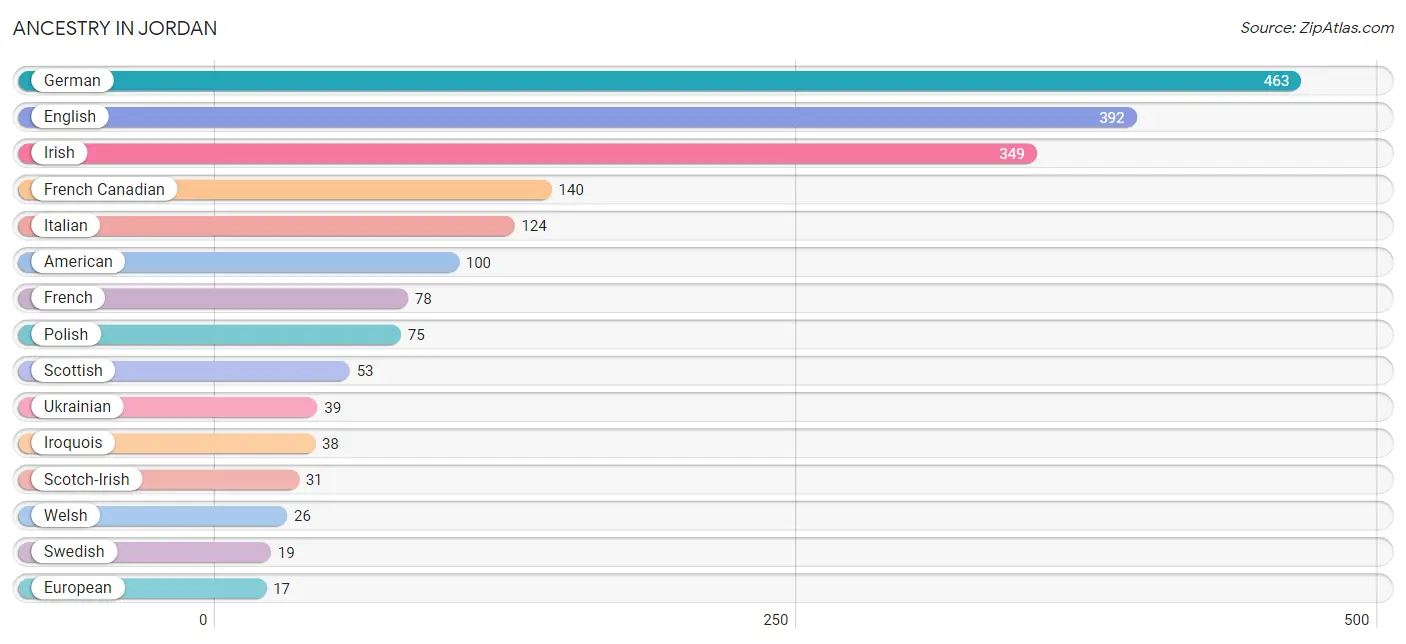
Ancestry in Jordan
The most populous ancestries reported in Jordan are German (463 | 31.3%), English (392 | 26.5%), Irish (349 | 23.6%), French Canadian (140 | 9.5%), and Italian (124 | 8.4%), together accounting for 99.2% of all Jordan residents.
| Ancestry | # Population | % Population |
| American | 100 | 6.8% |
| Austrian | 6 | 0.4% |
| Canadian | 7 | 0.5% |
| Cuban | 4 | 0.3% |
| Czechoslovakian | 3 | 0.2% |
| Danish | 11 | 0.7% |
| Dutch | 13 | 0.9% |
| English | 392 | 26.5% |
| European | 17 | 1.1% |
| Finnish | 3 | 0.2% |
| French | 78 | 5.3% |
| French Canadian | 140 | 9.5% |
| German | 463 | 31.3% |
| Irish | 349 | 23.6% |
| Iroquois | 38 | 2.6% |
| Italian | 124 | 8.4% |
| Mexican | 6 | 0.4% |
| Norwegian | 7 | 0.5% |
| Polish | 75 | 5.1% |
| Puerto Rican | 9 | 0.6% |
| Russian | 14 | 0.9% |
| Scandinavian | 9 | 0.6% |
| Scotch-Irish | 31 | 2.1% |
| Scottish | 53 | 3.6% |
| Spanish | 1 | 0.1% |
| Swedish | 19 | 1.3% |
| Swiss | 2 | 0.1% |
| Ukrainian | 39 | 2.6% |
| Vietnamese | 6 | 0.4% |
| Welsh | 26 | 1.8% | View All 30 Rows |
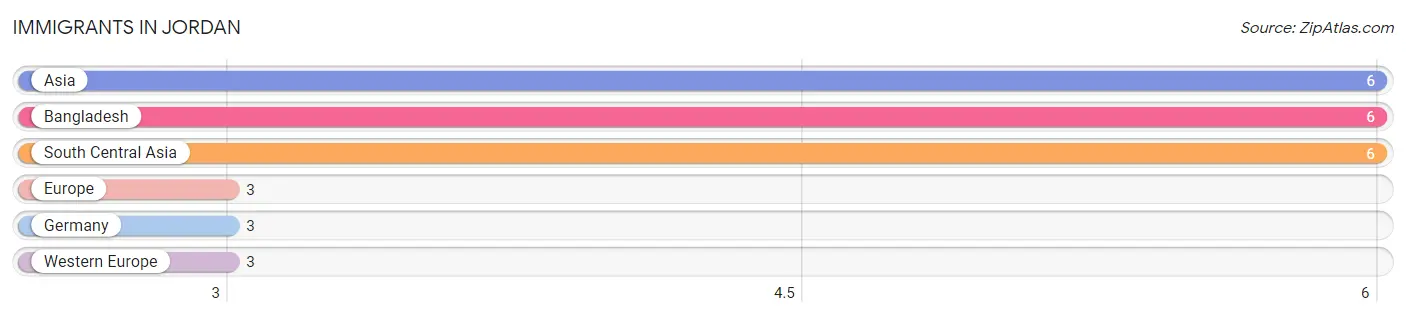
Immigrants in Jordan
The most numerous immigrant groups reported in Jordan came from Asia (6 | 0.4%), Bangladesh (6 | 0.4%), South Central Asia (6 | 0.4%), Europe (3 | 0.2%), and Germany (3 | 0.2%), together accounting for 1.6% of all Jordan residents.
| Immigration Origin | # Population | % Population |
| Asia | 6 | 0.4% |
| Bangladesh | 6 | 0.4% |
| Europe | 3 | 0.2% |
| Germany | 3 | 0.2% |
| South Central Asia | 6 | 0.4% |
| Western Europe | 3 | 0.2% | View All 6 Rows |
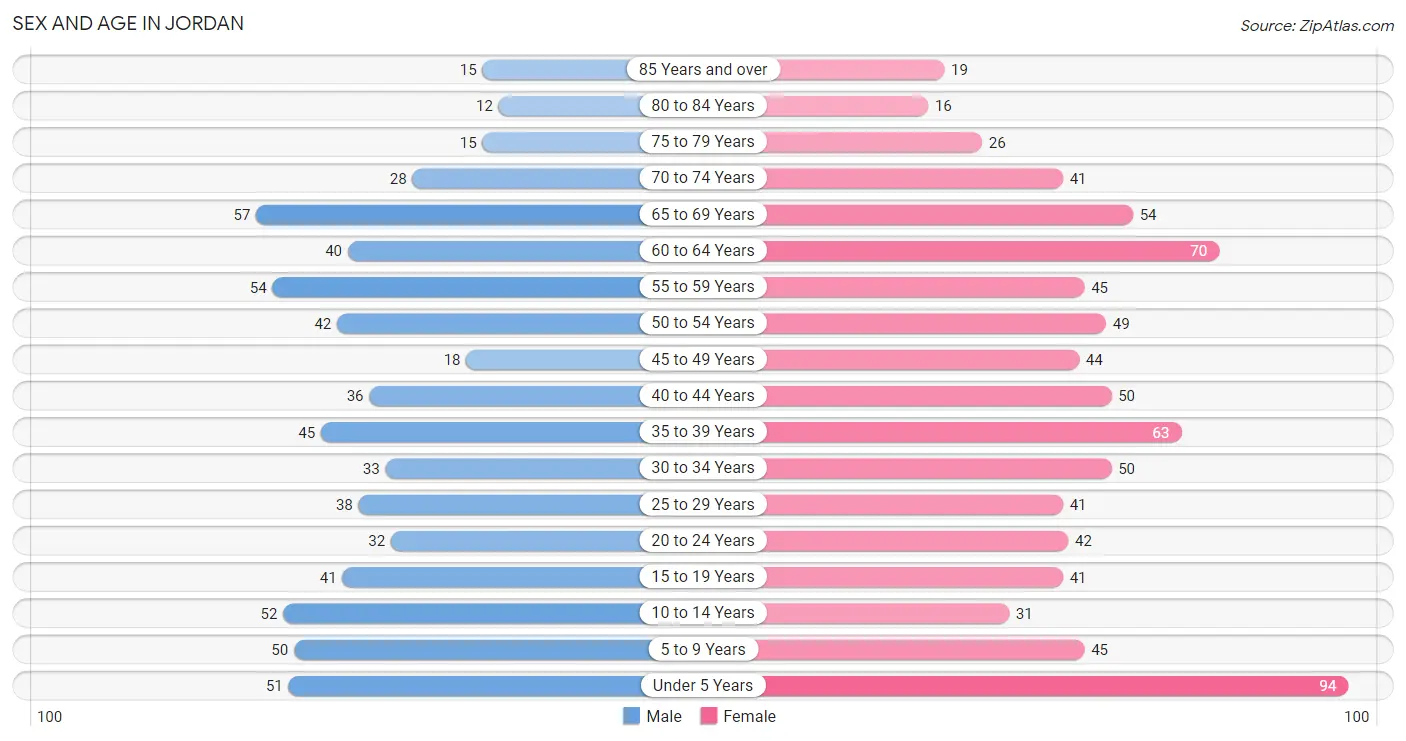
Sex and Age in Jordan
Sex and Age in Jordan
The most populous age groups in Jordan are 65 to 69 Years (57 | 8.6%) for men and Under 5 Years (94 | 11.5%) for women.
| Age Bracket | Male | Female |
| Under 5 Years | 51 (7.7%) | 94 (11.5%) |
| 5 to 9 Years | 50 (7.6%) | 45 (5.5%) |
| 10 to 14 Years | 52 (7.9%) | 31 (3.8%) |
| 15 to 19 Years | 41 (6.2%) | 41 (5.0%) |
| 20 to 24 Years | 32 (4.9%) | 42 (5.1%) |
| 25 to 29 Years | 38 (5.8%) | 41 (5.0%) |
| 30 to 34 Years | 33 (5.0%) | 50 (6.1%) |
| 35 to 39 Years | 45 (6.8%) | 63 (7.7%) |
| 40 to 44 Years | 36 (5.5%) | 50 (6.1%) |
| 45 to 49 Years | 18 (2.7%) | 44 (5.4%) |
| 50 to 54 Years | 42 (6.4%) | 49 (6.0%) |
| 55 to 59 Years | 54 (8.2%) | 45 (5.5%) |
| 60 to 64 Years | 40 (6.1%) | 70 (8.5%) |
| 65 to 69 Years | 57 (8.6%) | 54 (6.6%) |
| 70 to 74 Years | 28 (4.3%) | 41 (5.0%) |
| 75 to 79 Years | 15 (2.3%) | 26 (3.2%) |
| 80 to 84 Years | 12 (1.8%) | 16 (1.9%) |
| 85 Years and over | 15 (2.3%) | 19 (2.3%) |
| Total | 659 (100.0%) | 821 (100.0%) |
Families and Households in Jordan
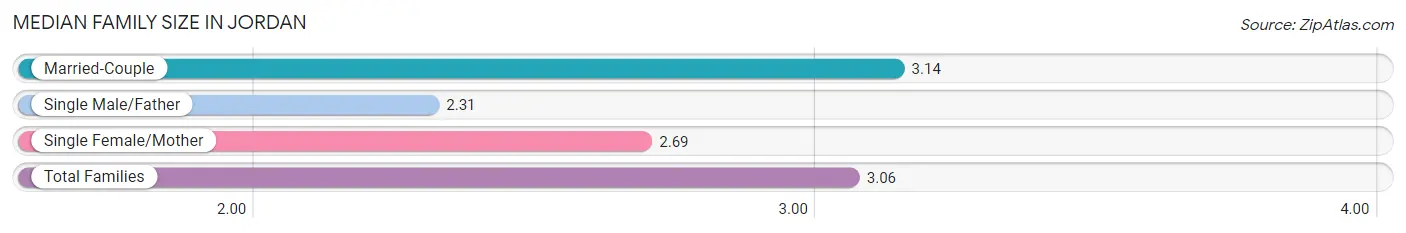
Median Family Size in Jordan
The median family size in Jordan is 3.06 persons per family, with married-couple families (338 | 86.0%) accounting for the largest median family size of 3.14 persons per family. On the other hand, single male/father families (13 | 3.3%) represent the smallest median family size with 2.31 persons per family.
| Family Type | # Families | Family Size |
| Married-Couple | 338 (86.0%) | 3.14 |
| Single Male/Father | 13 (3.3%) | 2.31 |
| Single Female/Mother | 42 (10.7%) | 2.69 |
| Total Families | 393 (100.0%) | 3.06 |
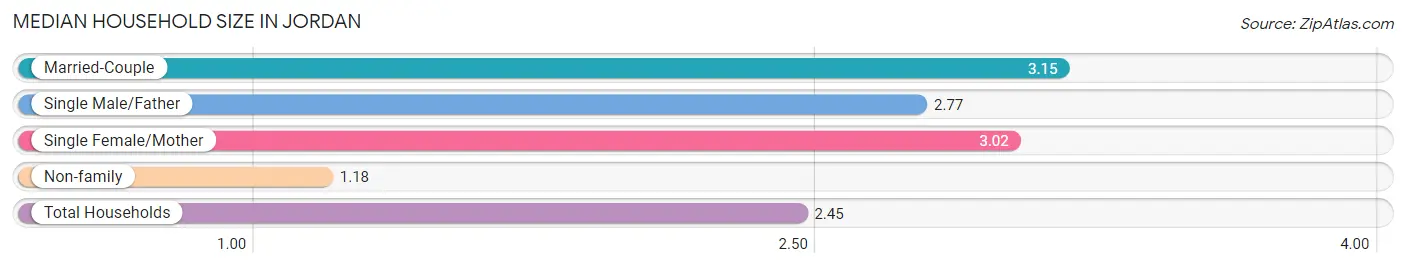
Median Household Size in Jordan
The median household size in Jordan is 2.45 persons per household, with married-couple households (338 | 56.3%) accounting for the largest median household size of 3.15 persons per household. non-family households (207 | 34.5%) represent the smallest median household size with 1.18 persons per household.
| Household Type | # Households | Household Size |
| Married-Couple | 338 (56.3%) | 3.15 |
| Single Male/Father | 13 (2.2%) | 2.77 |
| Single Female/Mother | 42 (7.0%) | 3.02 |
| Non-family | 207 (34.5%) | 1.18 |
| Total Households | 600 (100.0%) | 2.45 |
Household Size by Marriage Status in Jordan
Out of a total of 600 households in Jordan, 393 (65.5%) are family households, while 207 (34.5%) are nonfamily households. The most numerous type of family households are 2-person households, comprising 180, and the most common type of nonfamily households are 1-person households, comprising 191.
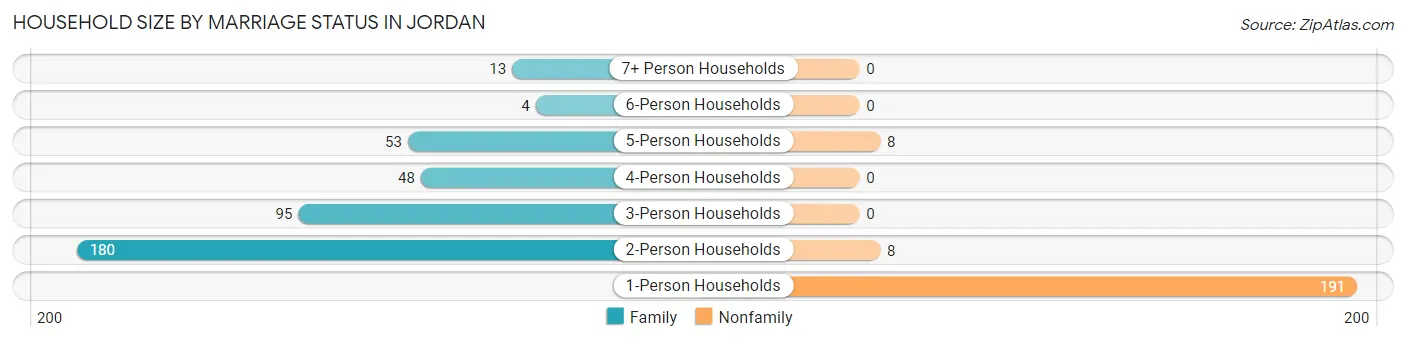
| Household Size | Family Households | Nonfamily Households |
| 1-Person Households | - | 191 (31.8%) |
| 2-Person Households | 180 (30.0%) | 8 (1.3%) |
| 3-Person Households | 95 (15.8%) | 0 (0.0%) |
| 4-Person Households | 48 (8.0%) | 0 (0.0%) |
| 5-Person Households | 53 (8.8%) | 8 (1.3%) |
| 6-Person Households | 4 (0.7%) | 0 (0.0%) |
| 7+ Person Households | 13 (2.2%) | 0 (0.0%) |
| Total | 393 (65.5%) | 207 (34.5%) |
Female Fertility in Jordan
Fertility by Age in Jordan
Average fertility rate in Jordan is 36.0 births per 1,000 women. Women in the age bracket of 35 to 50 years have the highest fertility rate with 45.0 births per 1,000 women. Women in the age bracket of 35 to 50 years acount for 58.3% of all women with births.
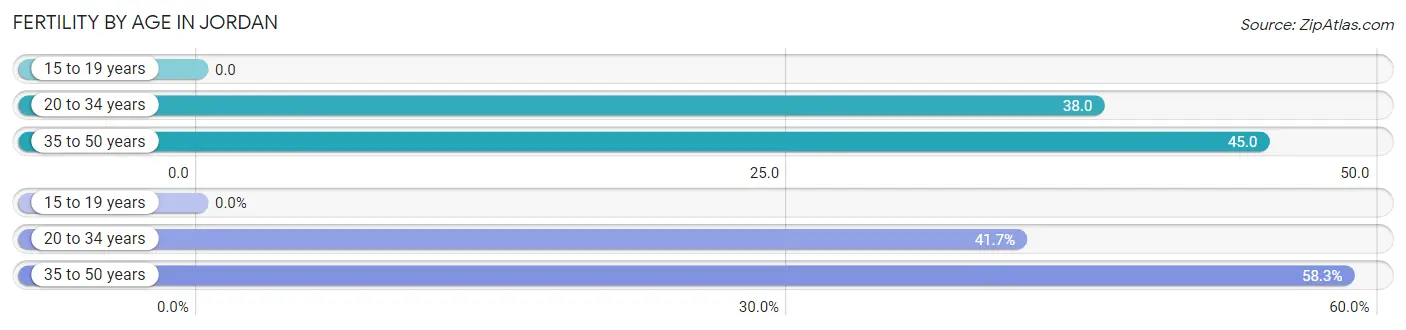
| Age Bracket | Women with Births | Births / 1,000 Women |
| 15 to 19 years | 0 (0.0%) | 0.0 |
| 20 to 34 years | 5 (41.7%) | 38.0 |
| 35 to 50 years | 7 (58.3%) | 45.0 |
| Total | 12 (100.0%) | 36.0 |
Fertility by Age by Marriage Status in Jordan
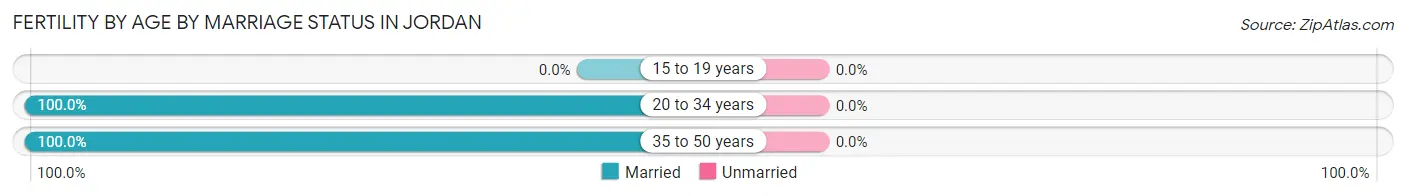
| Age Bracket | Married | Unmarried |
| 15 to 19 years | 0 (0.0%) | 0 (0.0%) |
| 20 to 34 years | 5 (100.0%) | 0 (0.0%) |
| 35 to 50 years | 7 (100.0%) | 0 (0.0%) |
| Total | 12 (100.0%) | 0 (0.0%) |
Fertility by Education in Jordan
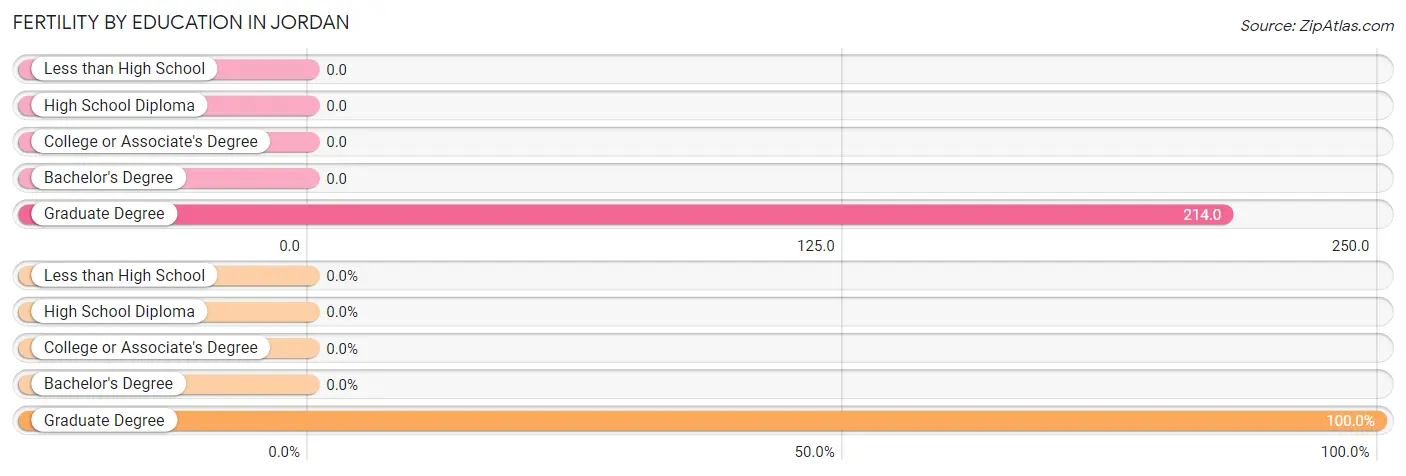
| Educational Attainment | Women with Births | Births / 1,000 Women |
| Less than High School | 0 (0.0%) | 0.0 |
| High School Diploma | 0 (0.0%) | 0.0 |
| College or Associate's Degree | 0 (0.0%) | 0.0 |
| Bachelor's Degree | 0 (0.0%) | 0.0 |
| Graduate Degree | 12 (100.0%) | 214.0 |
| Total | 12 (100.0%) | 36.0 |
Fertility by Education by Marriage Status in Jordan
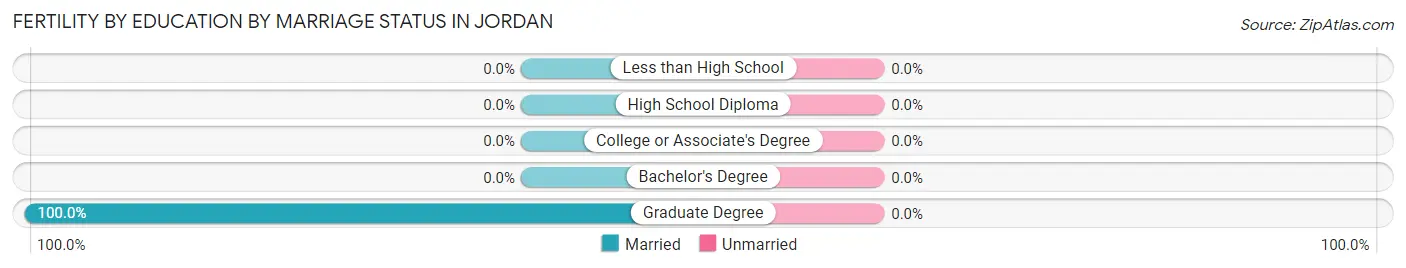
| Educational Attainment | Married | Unmarried |
| Less than High School | 0 (0.0%) | 0 (0.0%) |
| High School Diploma | 0 (0.0%) | 0 (0.0%) |
| College or Associate's Degree | 0 (0.0%) | 0 (0.0%) |
| Bachelor's Degree | 0 (0.0%) | 0 (0.0%) |
| Graduate Degree | 12 (100.0%) | 0 (0.0%) |
| Total | 12 (100.0%) | 0 (0.0%) |
Employment Characteristics in Jordan
Employment by Class of Employer in Jordan
Among the 695 employed individuals in Jordan, private company employees (413 | 59.4%), not-for-profit organizations (99 | 14.2%), and local government employees (77 | 11.1%) make up the most common classes of employment.
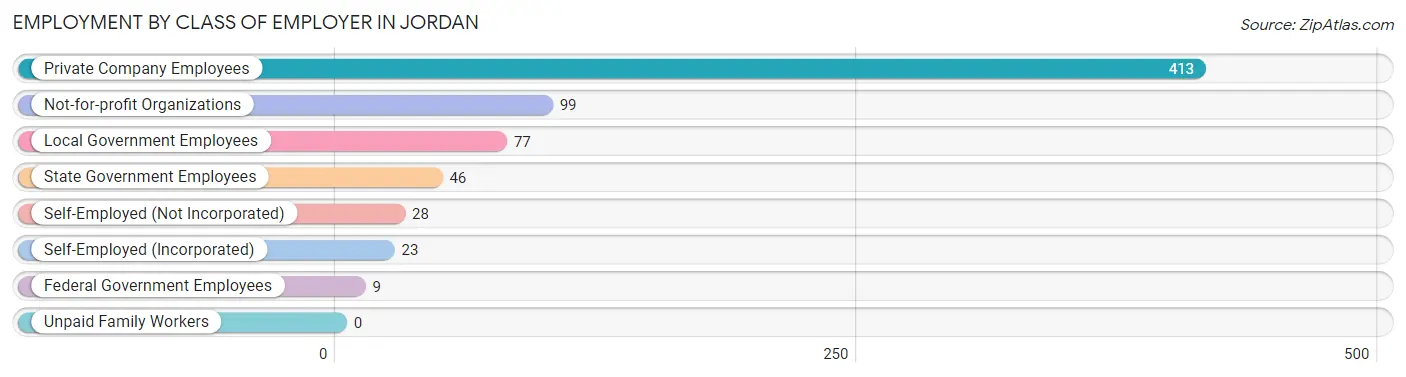
| Employer Class | # Employees | % Employees |
| Private Company Employees | 413 | 59.4% |
| Self-Employed (Incorporated) | 23 | 3.3% |
| Self-Employed (Not Incorporated) | 28 | 4.0% |
| Not-for-profit Organizations | 99 | 14.2% |
| Local Government Employees | 77 | 11.1% |
| State Government Employees | 46 | 6.6% |
| Federal Government Employees | 9 | 1.3% |
| Unpaid Family Workers | 0 | 0.0% |
| Total | 695 | 100.0% |
Employment Status by Age in Jordan
According to the labor force statistics for Jordan, out of the total population over 16 years of age (1,131), 63.8% or 722 individuals are in the labor force, with 3.7% or 27 of them unemployed. The age group with the highest labor force participation rate is 30 to 34 years, with 96.4% or 80 individuals in the labor force. Within the labor force, the 75 years and over age range has the highest percentage of unemployed individuals, with 25.0% or 3 of them being unemployed.
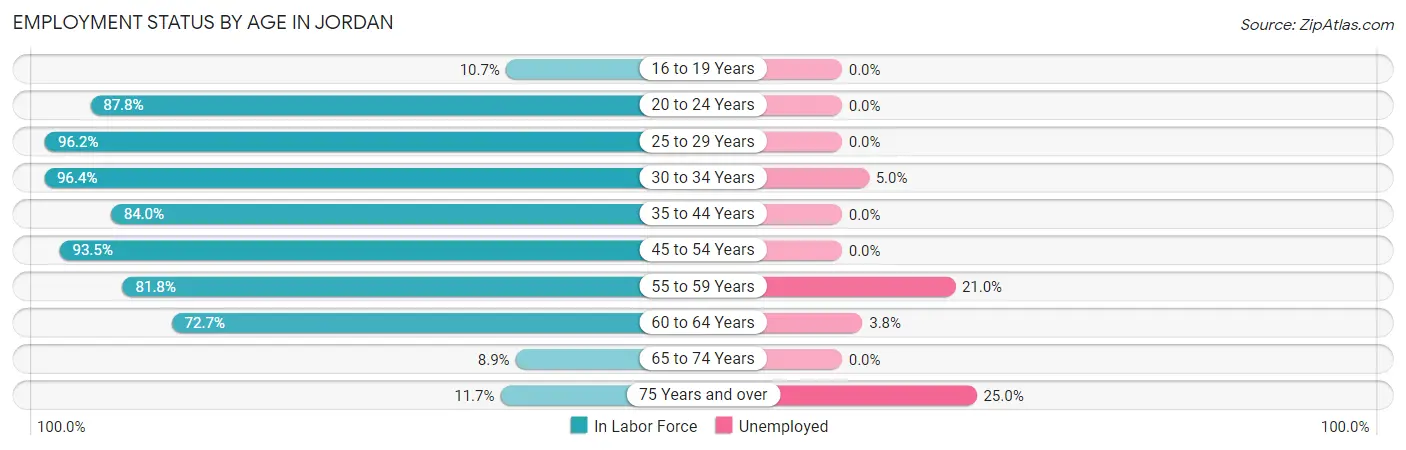
| Age Bracket | In Labor Force | Unemployed |
| 16 to 19 Years | 6 (10.7%) | 0 (0.0%) |
| 20 to 24 Years | 65 (87.8%) | 0 (0.0%) |
| 25 to 29 Years | 76 (96.2%) | 0 (0.0%) |
| 30 to 34 Years | 80 (96.4%) | 4 (5.0%) |
| 35 to 44 Years | 163 (84.0%) | 0 (0.0%) |
| 45 to 54 Years | 143 (93.5%) | 0 (0.0%) |
| 55 to 59 Years | 81 (81.8%) | 17 (21.0%) |
| 60 to 64 Years | 80 (72.7%) | 3 (3.8%) |
| 65 to 74 Years | 16 (8.9%) | 0 (0.0%) |
| 75 Years and over | 12 (11.7%) | 3 (25.0%) |
| Total | 722 (63.8%) | 27 (3.7%) |
Employment Status by Educational Attainment in Jordan
According to labor force statistics for Jordan, 86.8% of individuals (623) out of the total population between 25 and 64 years of age (718) are in the labor force, with 3.9% or 24 of them being unemployed. The group with the highest labor force participation rate are those with the educational attainment of bachelor's degree or higher, with 98.1% or 205 individuals in the labor force. Within the labor force, individuals with less than high school education have the highest percentage of unemployment, with 31.4% or 11 of them being unemployed.
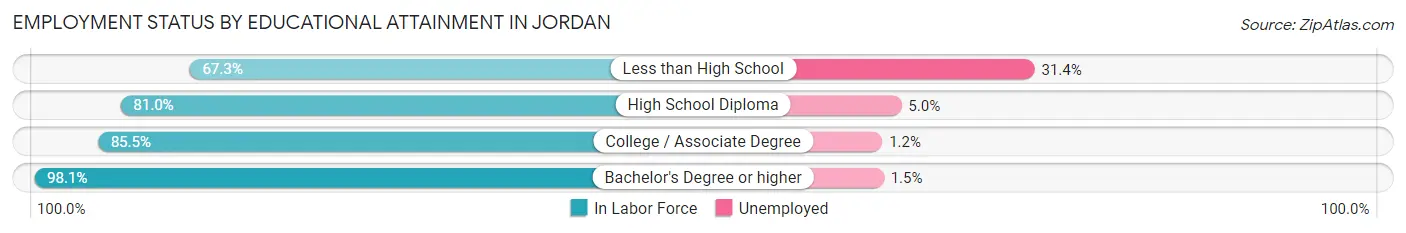
| Educational Attainment | In Labor Force | Unemployed |
| Less than High School | 35 (67.3%) | 16 (31.4%) |
| High School Diploma | 141 (81.0%) | 9 (5.0%) |
| College / Associate Degree | 242 (85.5%) | 3 (1.2%) |
| Bachelor's Degree or higher | 205 (98.1%) | 3 (1.5%) |
| Total | 623 (86.8%) | 28 (3.9%) |
Employment Occupations by Sex in Jordan
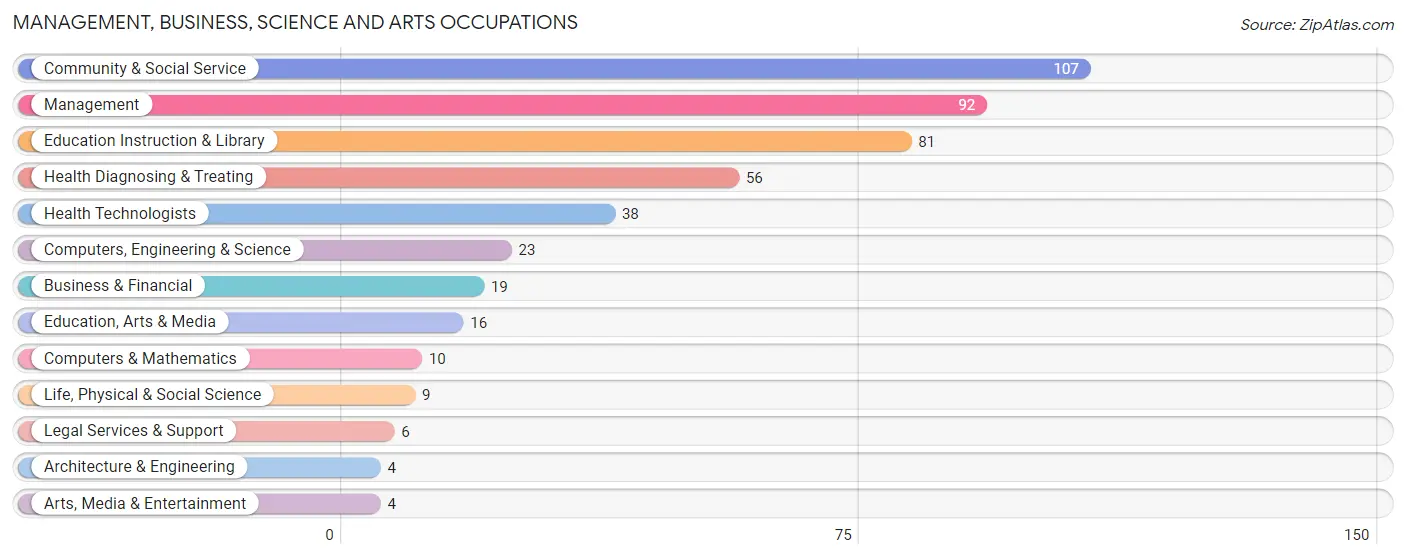
Management, Business, Science and Arts Occupations
The most common Management, Business, Science and Arts occupations in Jordan are Community & Social Service (107 | 15.4%), Management (92 | 13.2%), Education Instruction & Library (81 | 11.7%), Health Diagnosing & Treating (56 | 8.1%), and Health Technologists (38 | 5.5%).
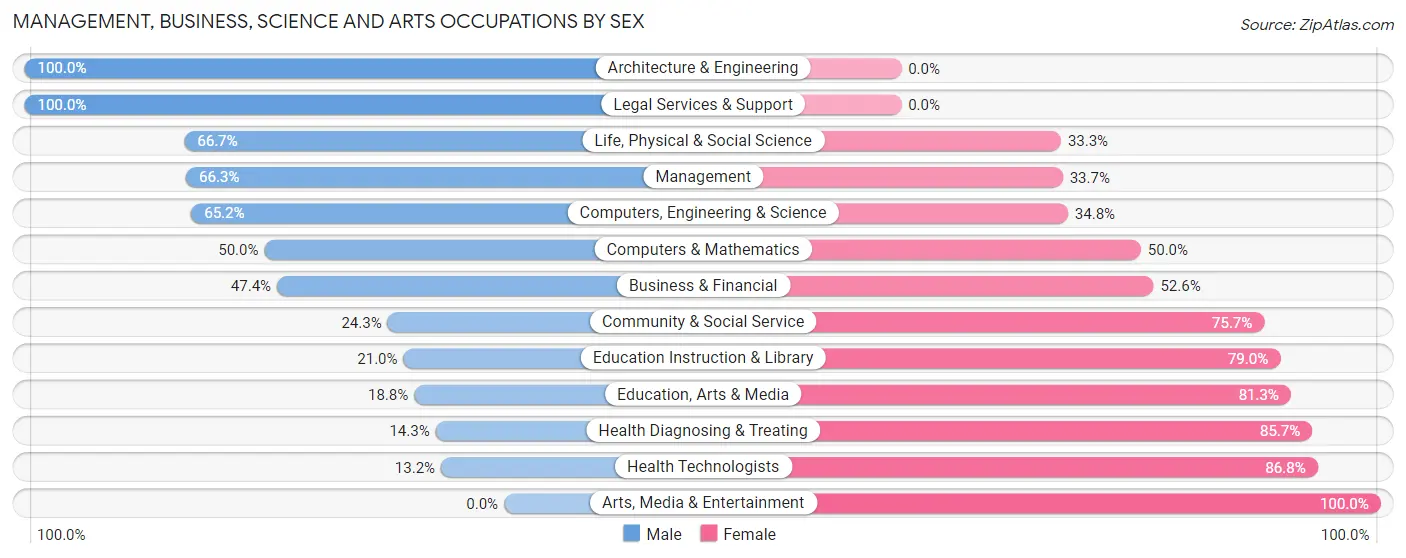
Management, Business, Science and Arts Occupations by Sex
Within the Management, Business, Science and Arts occupations in Jordan, the most male-oriented occupations are Architecture & Engineering (100.0%), Legal Services & Support (100.0%), and Life, Physical & Social Science (66.7%), while the most female-oriented occupations are Arts, Media & Entertainment (100.0%), Health Technologists (86.8%), and Health Diagnosing & Treating (85.7%).
| Occupation | Male | Female |
| Management | 61 (66.3%) | 31 (33.7%) |
| Business & Financial | 9 (47.4%) | 10 (52.6%) |
| Computers, Engineering & Science | 15 (65.2%) | 8 (34.8%) |
| Computers & Mathematics | 5 (50.0%) | 5 (50.0%) |
| Architecture & Engineering | 4 (100.0%) | 0 (0.0%) |
| Life, Physical & Social Science | 6 (66.7%) | 3 (33.3%) |
| Community & Social Service | 26 (24.3%) | 81 (75.7%) |
| Education, Arts & Media | 3 (18.8%) | 13 (81.2%) |
| Legal Services & Support | 6 (100.0%) | 0 (0.0%) |
| Education Instruction & Library | 17 (21.0%) | 64 (79.0%) |
| Arts, Media & Entertainment | 0 (0.0%) | 4 (100.0%) |
| Health Diagnosing & Treating | 8 (14.3%) | 48 (85.7%) |
| Health Technologists | 5 (13.2%) | 33 (86.8%) |
| Total (Category) | 119 (40.1%) | 178 (59.9%) |
| Total (Overall) | 307 (44.2%) | 388 (55.8%) |
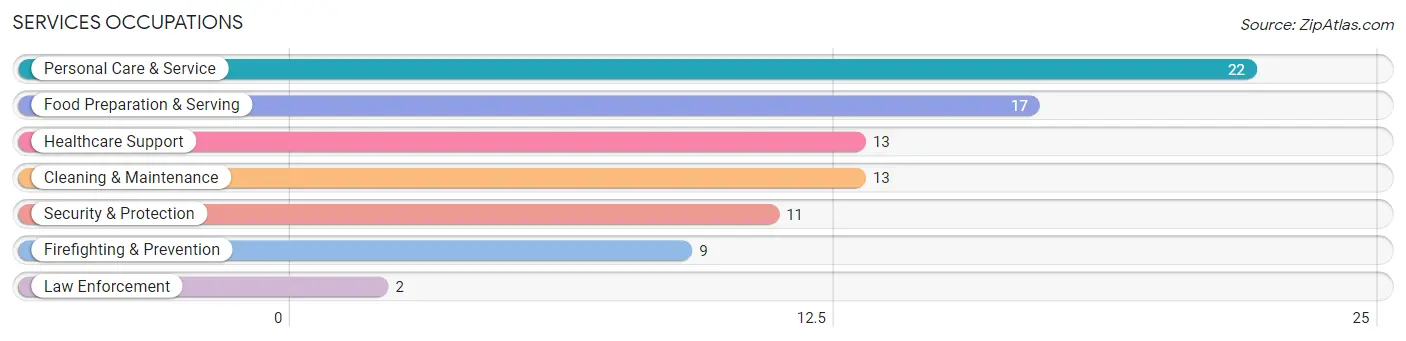
Services Occupations
The most common Services occupations in Jordan are Personal Care & Service (22 | 3.2%), Food Preparation & Serving (17 | 2.5%), Healthcare Support (13 | 1.9%), Cleaning & Maintenance (13 | 1.9%), and Security & Protection (11 | 1.6%).
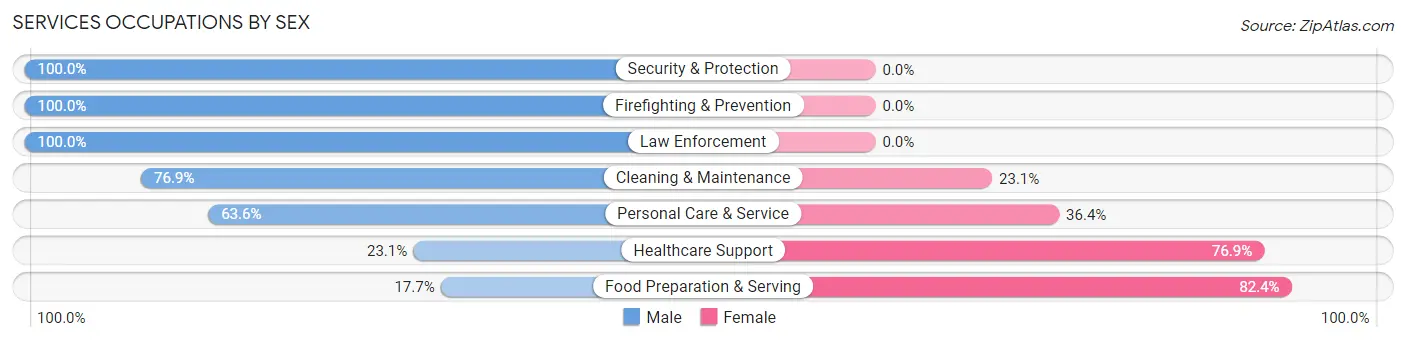
Services Occupations by Sex
Within the Services occupations in Jordan, the most male-oriented occupations are Security & Protection (100.0%), Firefighting & Prevention (100.0%), and Law Enforcement (100.0%), while the most female-oriented occupations are Food Preparation & Serving (82.4%), Healthcare Support (76.9%), and Personal Care & Service (36.4%).
| Occupation | Male | Female |
| Healthcare Support | 3 (23.1%) | 10 (76.9%) |
| Security & Protection | 11 (100.0%) | 0 (0.0%) |
| Firefighting & Prevention | 9 (100.0%) | 0 (0.0%) |
| Law Enforcement | 2 (100.0%) | 0 (0.0%) |
| Food Preparation & Serving | 3 (17.6%) | 14 (82.4%) |
| Cleaning & Maintenance | 10 (76.9%) | 3 (23.1%) |
| Personal Care & Service | 14 (63.6%) | 8 (36.4%) |
| Total (Category) | 41 (53.9%) | 35 (46.1%) |
| Total (Overall) | 307 (44.2%) | 388 (55.8%) |
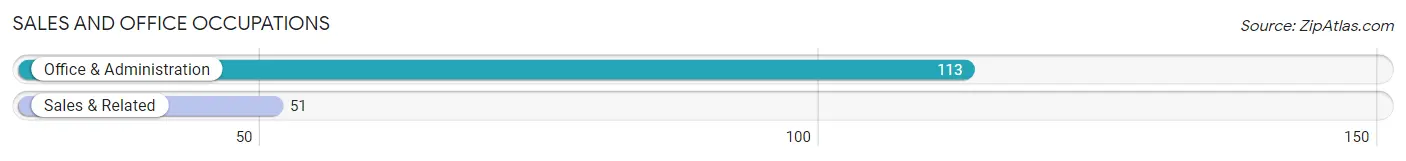
Sales and Office Occupations
The most common Sales and Office occupations in Jordan are Office & Administration (113 | 16.3%), and Sales & Related (51 | 7.3%).
Sales and Office Occupations by Sex
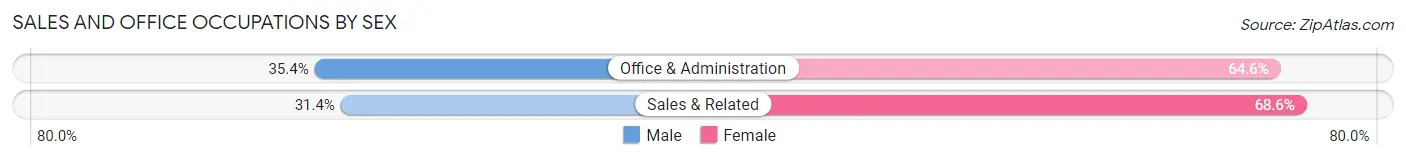
| Occupation | Male | Female |
| Sales & Related | 16 (31.4%) | 35 (68.6%) |
| Office & Administration | 40 (35.4%) | 73 (64.6%) |
| Total (Category) | 56 (34.2%) | 108 (65.8%) |
| Total (Overall) | 307 (44.2%) | 388 (55.8%) |
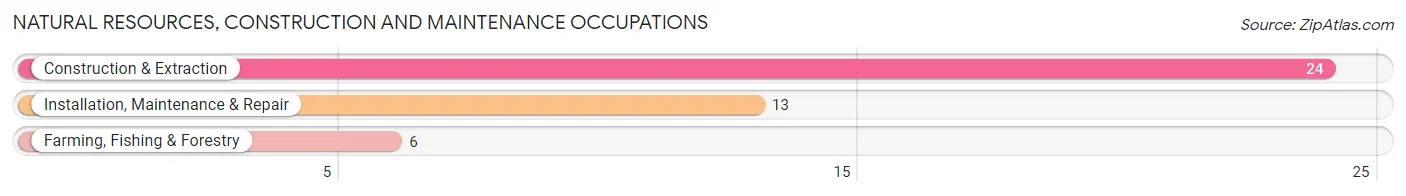
Natural Resources, Construction and Maintenance Occupations
The most common Natural Resources, Construction and Maintenance occupations in Jordan are Construction & Extraction (24 | 3.5%), Installation, Maintenance & Repair (13 | 1.9%), and Farming, Fishing & Forestry (6 | 0.9%).
Natural Resources, Construction and Maintenance Occupations by Sex
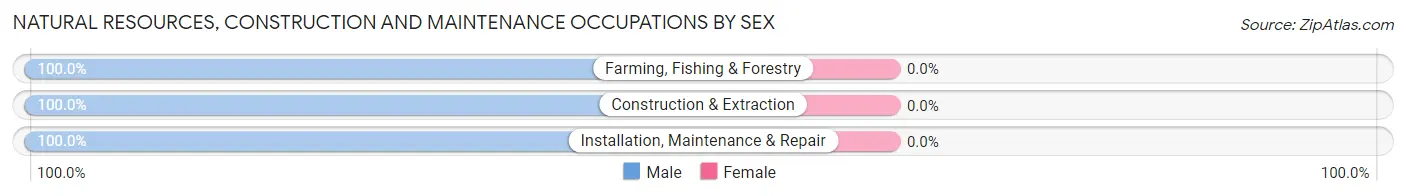
| Occupation | Male | Female |
| Farming, Fishing & Forestry | 6 (100.0%) | 0 (0.0%) |
| Construction & Extraction | 24 (100.0%) | 0 (0.0%) |
| Installation, Maintenance & Repair | 13 (100.0%) | 0 (0.0%) |
| Total (Category) | 43 (100.0%) | 0 (0.0%) |
| Total (Overall) | 307 (44.2%) | 388 (55.8%) |
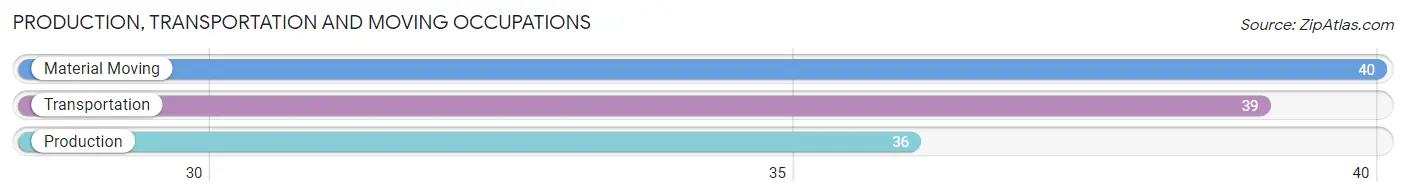
Production, Transportation and Moving Occupations
The most common Production, Transportation and Moving occupations in Jordan are Material Moving (40 | 5.8%), Transportation (39 | 5.6%), and Production (36 | 5.2%).
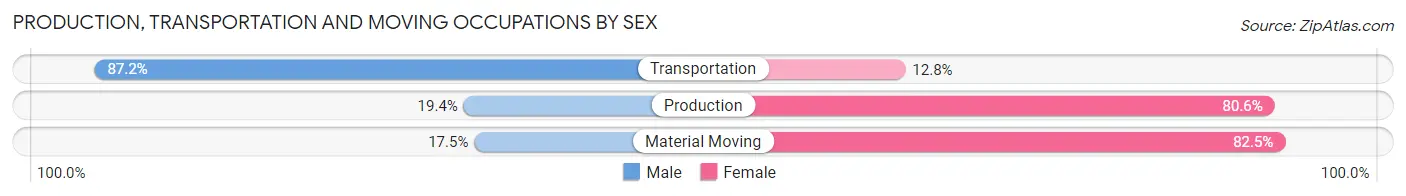
Production, Transportation and Moving Occupations by Sex
| Occupation | Male | Female |
| Production | 7 (19.4%) | 29 (80.6%) |
| Transportation | 34 (87.2%) | 5 (12.8%) |
| Material Moving | 7 (17.5%) | 33 (82.5%) |
| Total (Category) | 48 (41.7%) | 67 (58.3%) |
| Total (Overall) | 307 (44.2%) | 388 (55.8%) |
Employment Industries by Sex in Jordan
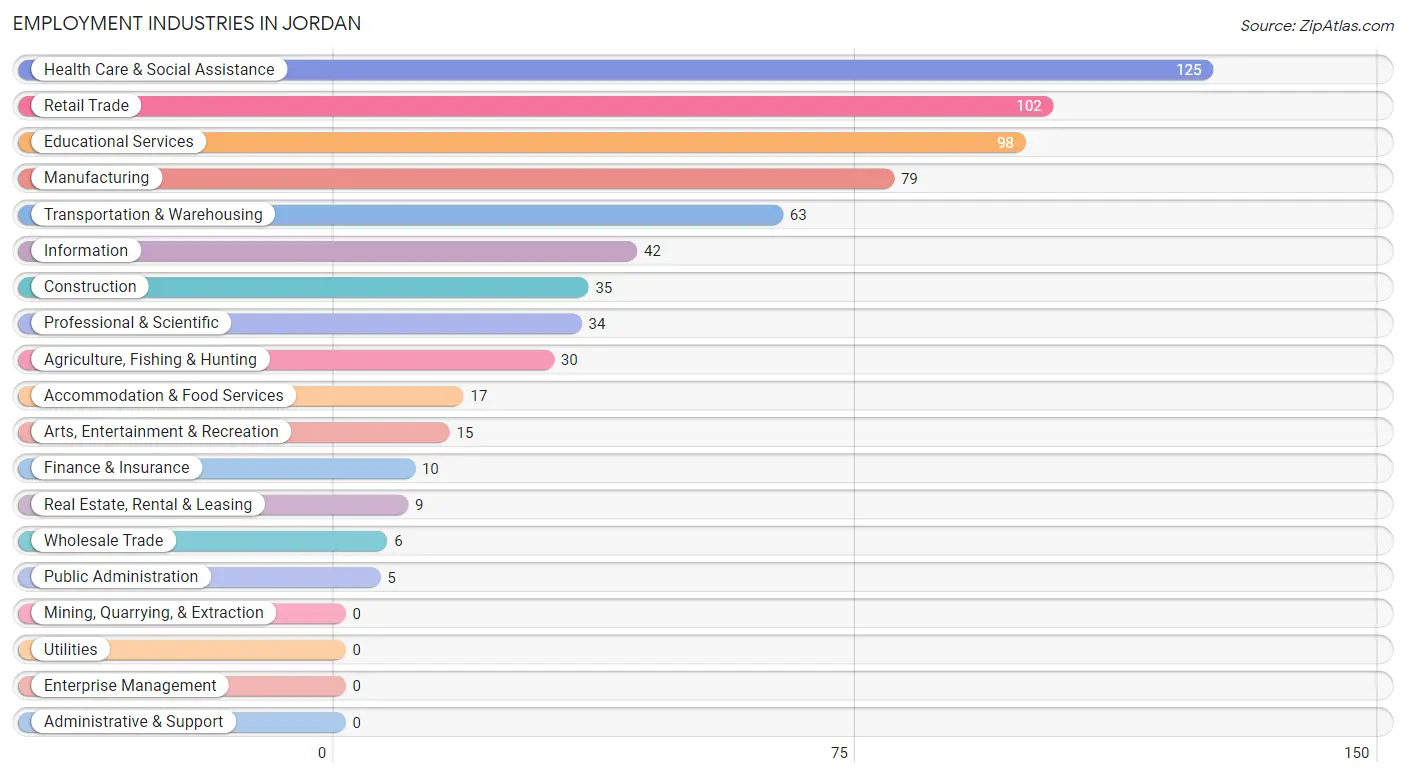
Employment Industries in Jordan
The major employment industries in Jordan include Health Care & Social Assistance (125 | 18.0%), Retail Trade (102 | 14.7%), Educational Services (98 | 14.1%), Manufacturing (79 | 11.4%), and Transportation & Warehousing (63 | 9.1%).
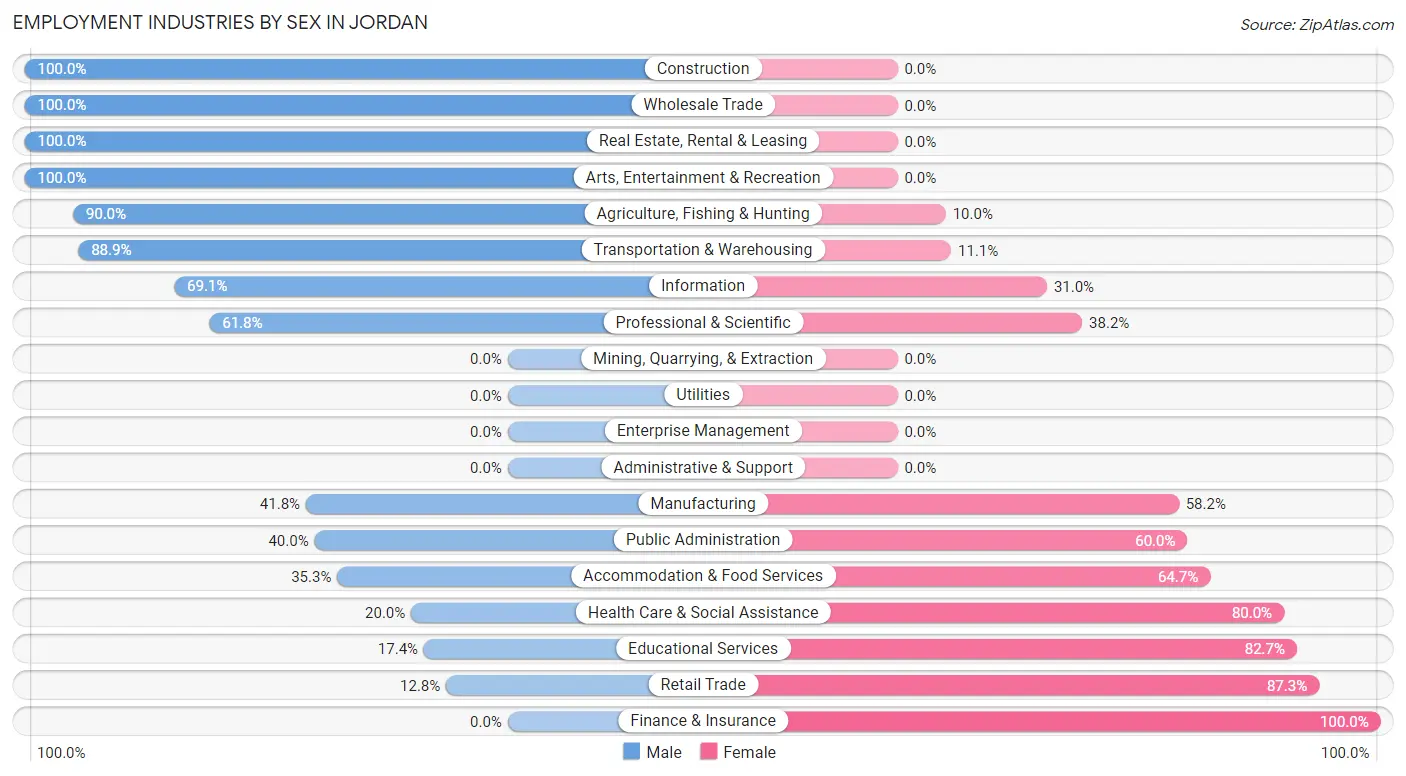
Employment Industries by Sex in Jordan
The Jordan industries that see more men than women are Construction (100.0%), Wholesale Trade (100.0%), and Real Estate, Rental & Leasing (100.0%), whereas the industries that tend to have a higher number of women are Finance & Insurance (100.0%), Retail Trade (87.3%), and Educational Services (82.7%).
| Industry | Male | Female |
| Agriculture, Fishing & Hunting | 27 (90.0%) | 3 (10.0%) |
| Mining, Quarrying, & Extraction | 0 (0.0%) | 0 (0.0%) |
| Construction | 35 (100.0%) | 0 (0.0%) |
| Manufacturing | 33 (41.8%) | 46 (58.2%) |
| Wholesale Trade | 6 (100.0%) | 0 (0.0%) |
| Retail Trade | 13 (12.8%) | 89 (87.3%) |
| Transportation & Warehousing | 56 (88.9%) | 7 (11.1%) |
| Utilities | 0 (0.0%) | 0 (0.0%) |
| Information | 29 (69.1%) | 13 (30.9%) |
| Finance & Insurance | 0 (0.0%) | 10 (100.0%) |
| Real Estate, Rental & Leasing | 9 (100.0%) | 0 (0.0%) |
| Professional & Scientific | 21 (61.8%) | 13 (38.2%) |
| Enterprise Management | 0 (0.0%) | 0 (0.0%) |
| Administrative & Support | 0 (0.0%) | 0 (0.0%) |
| Educational Services | 17 (17.3%) | 81 (82.7%) |
| Health Care & Social Assistance | 25 (20.0%) | 100 (80.0%) |
| Arts, Entertainment & Recreation | 15 (100.0%) | 0 (0.0%) |
| Accommodation & Food Services | 6 (35.3%) | 11 (64.7%) |
| Public Administration | 2 (40.0%) | 3 (60.0%) |
| Total | 307 (44.2%) | 388 (55.8%) |
Education in Jordan
School Enrollment in Jordan
The most common levels of schooling among the 321 students in Jordan are elementary school (73 | 22.7%), middle school (73 | 22.7%), and high school (66 | 20.6%).
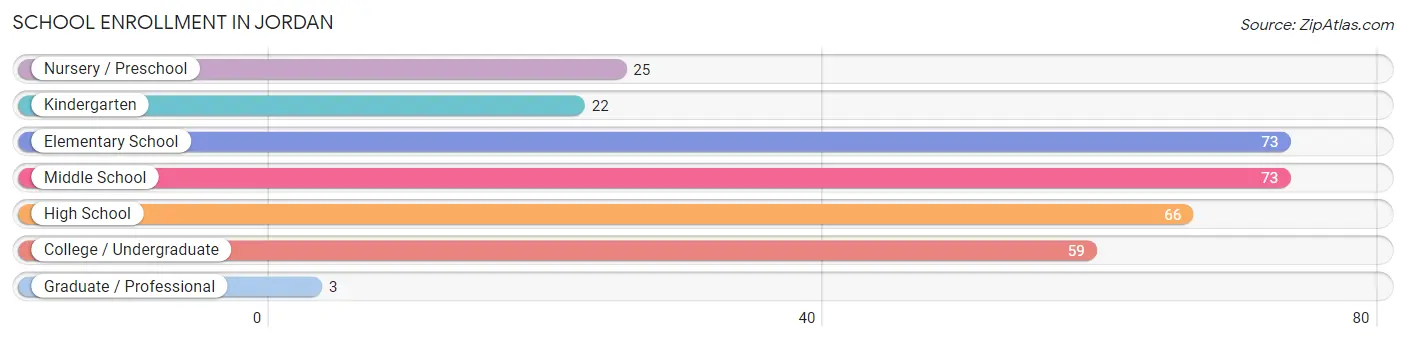
| School Level | # Students | % Students |
| Nursery / Preschool | 25 | 7.8% |
| Kindergarten | 22 | 6.9% |
| Elementary School | 73 | 22.7% |
| Middle School | 73 | 22.7% |
| High School | 66 | 20.6% |
| College / Undergraduate | 59 | 18.4% |
| Graduate / Professional | 3 | 0.9% |
| Total | 321 | 100.0% |
School Enrollment by Age by Funding Source in Jordan
Out of a total of 321 students who are enrolled in schools in Jordan, 50 (15.6%) attend a private institution, while the remaining 271 (84.4%) are enrolled in public schools. The age group of 18 to 19 year olds has the highest likelihood of being enrolled in private schools, with 3 (100.0% in the age bracket) enrolled. Conversely, the age group of 3 to 4 year olds has the lowest likelihood of being enrolled in a private school, with 25 (100.0% in the age bracket) attending a public institution.
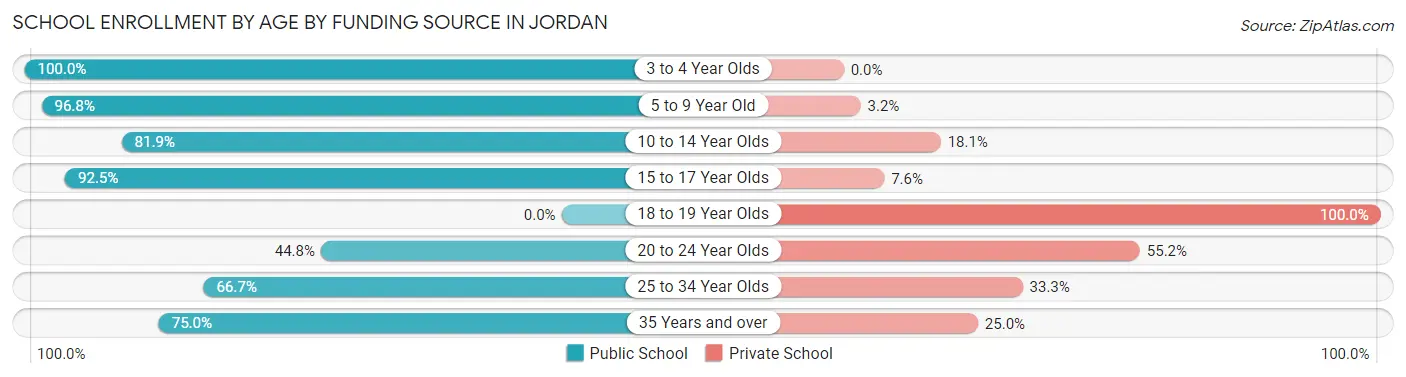
| Age Bracket | Public School | Private School |
| 3 to 4 Year Olds | 25 (100.0%) | 0 (0.0%) |
| 5 to 9 Year Old | 92 (96.8%) | 3 (3.2%) |
| 10 to 14 Year Olds | 68 (81.9%) | 15 (18.1%) |
| 15 to 17 Year Olds | 49 (92.4%) | 4 (7.5%) |
| 18 to 19 Year Olds | 0 (0.0%) | 3 (100.0%) |
| 20 to 24 Year Olds | 13 (44.8%) | 16 (55.2%) |
| 25 to 34 Year Olds | 6 (66.7%) | 3 (33.3%) |
| 35 Years and over | 18 (75.0%) | 6 (25.0%) |
| Total | 271 (84.4%) | 50 (15.6%) |
Educational Attainment by Field of Study in Jordan
Business (47 | 16.6%), education (46 | 16.3%), science & technology (37 | 13.1%), psychology (34 | 12.0%), and arts & humanities (21 | 7.4%) are the most common fields of study among 283 individuals in Jordan who have obtained a bachelor's degree or higher.
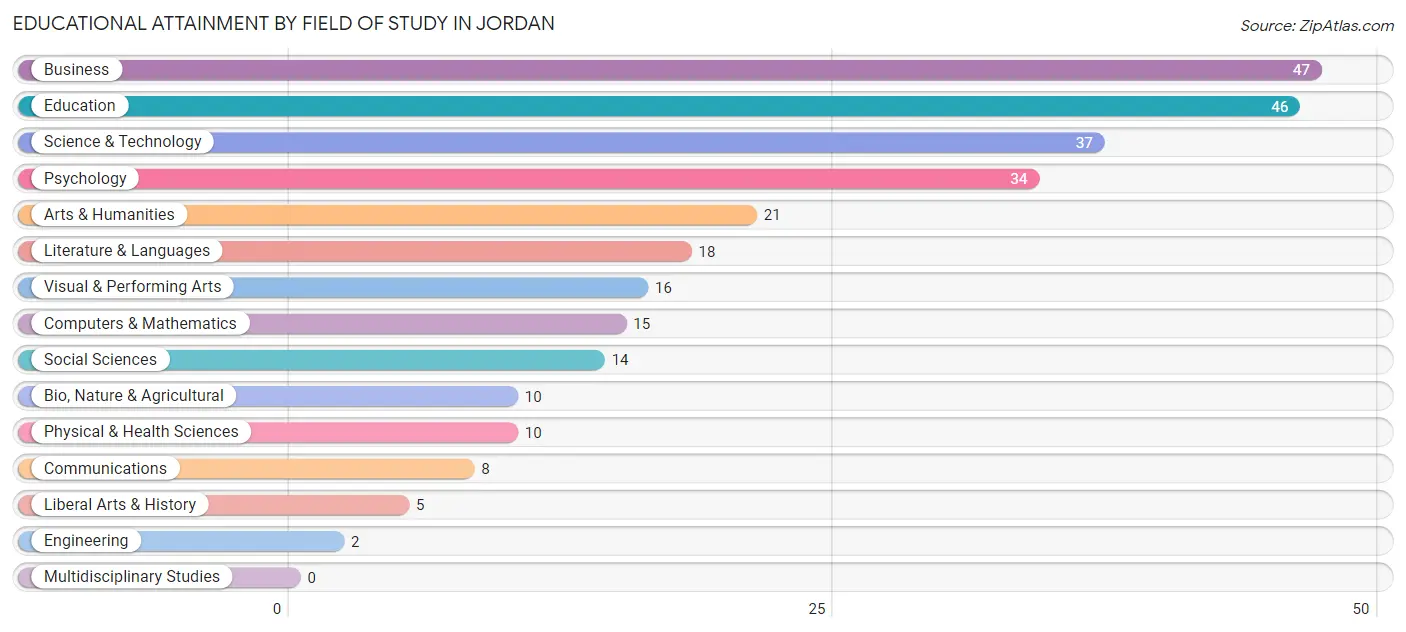
| Field of Study | # Graduates | % Graduates |
| Computers & Mathematics | 15 | 5.3% |
| Bio, Nature & Agricultural | 10 | 3.5% |
| Physical & Health Sciences | 10 | 3.5% |
| Psychology | 34 | 12.0% |
| Social Sciences | 14 | 5.0% |
| Engineering | 2 | 0.7% |
| Multidisciplinary Studies | 0 | 0.0% |
| Science & Technology | 37 | 13.1% |
| Business | 47 | 16.6% |
| Education | 46 | 16.3% |
| Literature & Languages | 18 | 6.4% |
| Liberal Arts & History | 5 | 1.8% |
| Visual & Performing Arts | 16 | 5.7% |
| Communications | 8 | 2.8% |
| Arts & Humanities | 21 | 7.4% |
| Total | 283 | 100.0% |
Transportation & Commute in Jordan
Vehicle Availability by Sex in Jordan
The most prevalent vehicle ownership categories in Jordan are males with 2 vehicles (168, accounting for 54.7%) and females with 2 vehicles (174, making up 43.3%).
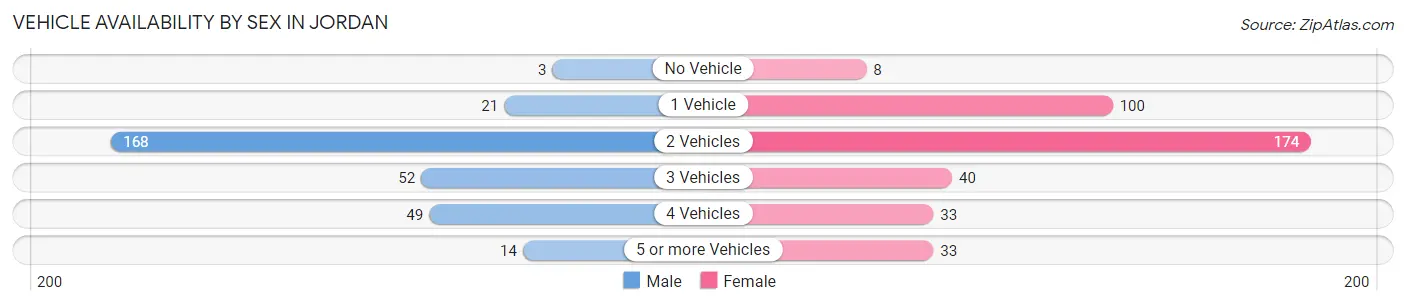
| Vehicles Available | Male | Female |
| No Vehicle | 3 (1.0%) | 8 (2.1%) |
| 1 Vehicle | 21 (6.8%) | 100 (25.8%) |
| 2 Vehicles | 168 (54.7%) | 174 (44.9%) |
| 3 Vehicles | 52 (16.9%) | 40 (10.3%) |
| 4 Vehicles | 49 (16.0%) | 33 (8.5%) |
| 5 or more Vehicles | 14 (4.6%) | 33 (8.5%) |
| Total | 307 (100.0%) | 388 (100.0%) |
Commute Time in Jordan
The most frequently occuring commute durations in Jordan are 30 to 34 minutes (178 commuters, 27.1%), 15 to 19 minutes (123 commuters, 18.7%), and 10 to 14 minutes (103 commuters, 15.7%).
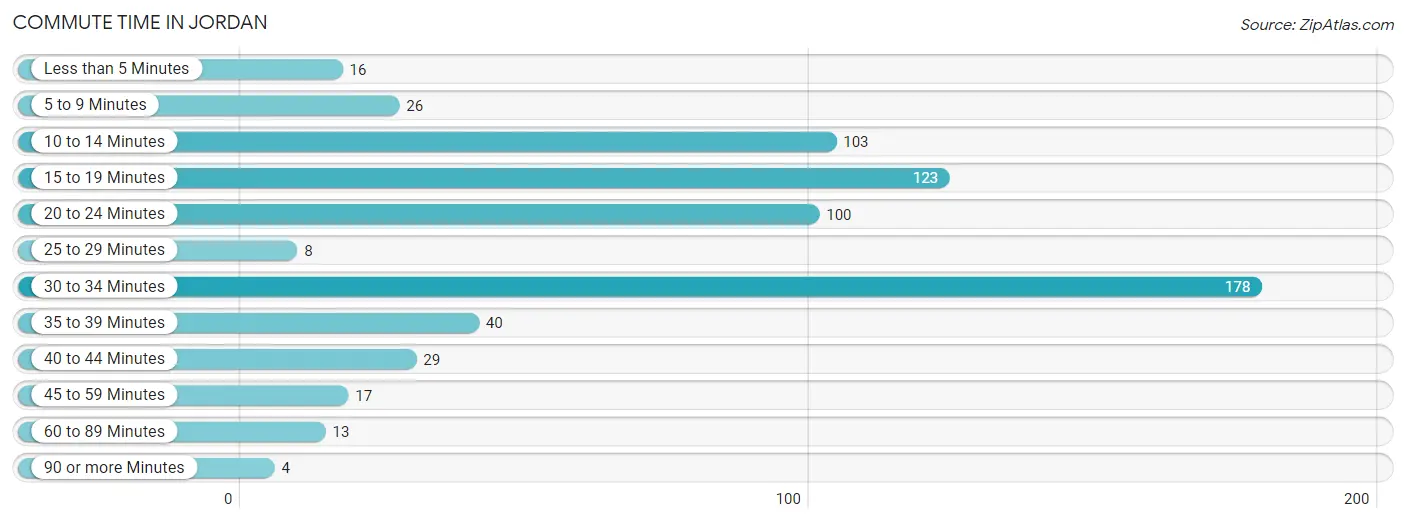
| Commute Time | # Commuters | % Commuters |
| Less than 5 Minutes | 16 | 2.4% |
| 5 to 9 Minutes | 26 | 4.0% |
| 10 to 14 Minutes | 103 | 15.7% |
| 15 to 19 Minutes | 123 | 18.7% |
| 20 to 24 Minutes | 100 | 15.2% |
| 25 to 29 Minutes | 8 | 1.2% |
| 30 to 34 Minutes | 178 | 27.1% |
| 35 to 39 Minutes | 40 | 6.1% |
| 40 to 44 Minutes | 29 | 4.4% |
| 45 to 59 Minutes | 17 | 2.6% |
| 60 to 89 Minutes | 13 | 2.0% |
| 90 or more Minutes | 4 | 0.6% |
Commute Time by Sex in Jordan
The most common commute times in Jordan are 30 to 34 minutes (108 commuters, 35.2%) for males and 10 to 14 minutes (73 commuters, 20.9%) for females.
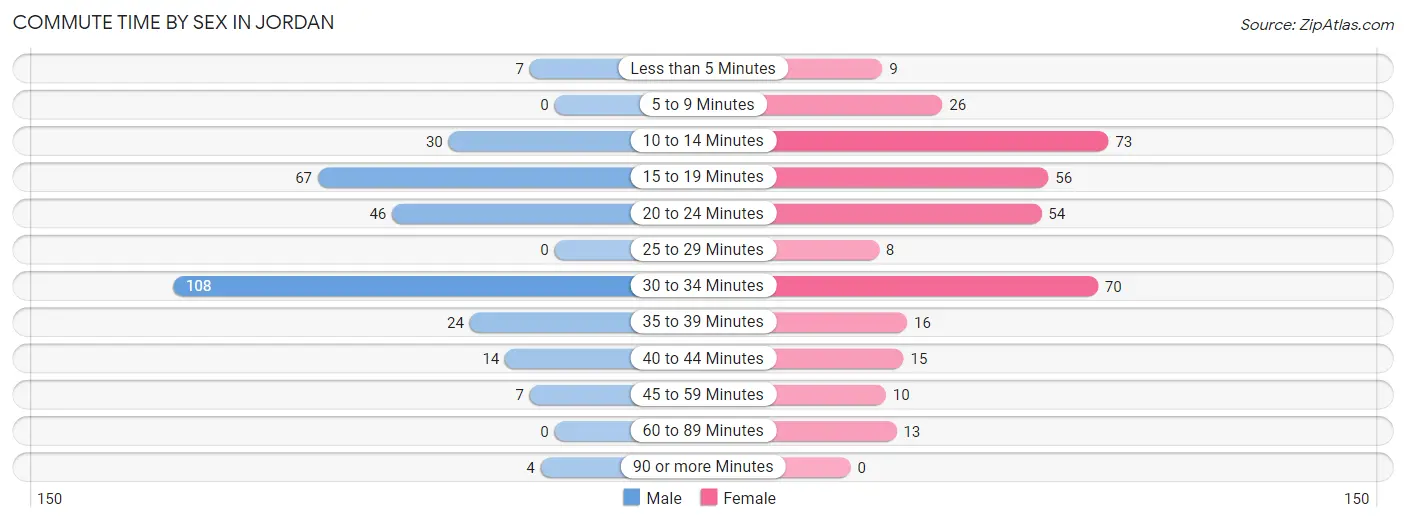
| Commute Time | Male | Female |
| Less than 5 Minutes | 7 (2.3%) | 9 (2.6%) |
| 5 to 9 Minutes | 0 (0.0%) | 26 (7.4%) |
| 10 to 14 Minutes | 30 (9.8%) | 73 (20.9%) |
| 15 to 19 Minutes | 67 (21.8%) | 56 (16.0%) |
| 20 to 24 Minutes | 46 (15.0%) | 54 (15.4%) |
| 25 to 29 Minutes | 0 (0.0%) | 8 (2.3%) |
| 30 to 34 Minutes | 108 (35.2%) | 70 (20.0%) |
| 35 to 39 Minutes | 24 (7.8%) | 16 (4.6%) |
| 40 to 44 Minutes | 14 (4.6%) | 15 (4.3%) |
| 45 to 59 Minutes | 7 (2.3%) | 10 (2.9%) |
| 60 to 89 Minutes | 0 (0.0%) | 13 (3.7%) |
| 90 or more Minutes | 4 (1.3%) | 0 (0.0%) |
Time of Departure to Work by Sex in Jordan
The most frequent times of departure to work in Jordan are 6:00 AM to 6:29 AM (74, 24.1%) for males and 6:00 AM to 6:29 AM (81, 23.1%) for females.
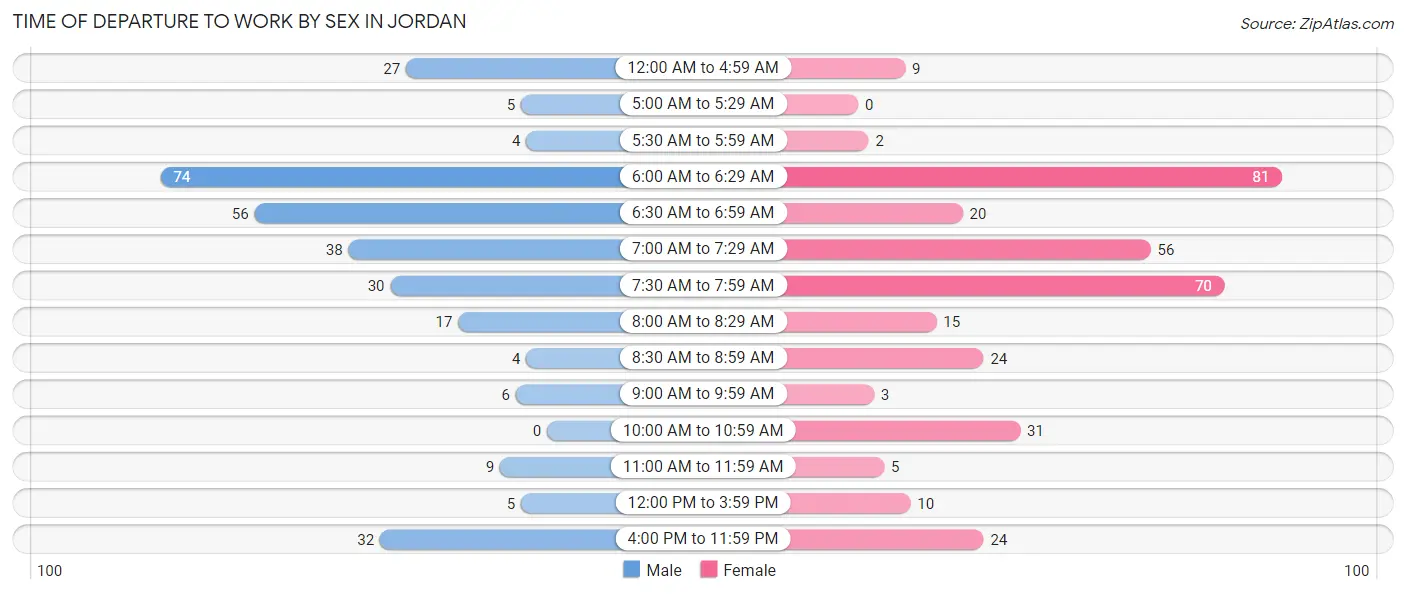
| Time of Departure | Male | Female |
| 12:00 AM to 4:59 AM | 27 (8.8%) | 9 (2.6%) |
| 5:00 AM to 5:29 AM | 5 (1.6%) | 0 (0.0%) |
| 5:30 AM to 5:59 AM | 4 (1.3%) | 2 (0.6%) |
| 6:00 AM to 6:29 AM | 74 (24.1%) | 81 (23.1%) |
| 6:30 AM to 6:59 AM | 56 (18.2%) | 20 (5.7%) |
| 7:00 AM to 7:29 AM | 38 (12.4%) | 56 (16.0%) |
| 7:30 AM to 7:59 AM | 30 (9.8%) | 70 (20.0%) |
| 8:00 AM to 8:29 AM | 17 (5.5%) | 15 (4.3%) |
| 8:30 AM to 8:59 AM | 4 (1.3%) | 24 (6.9%) |
| 9:00 AM to 9:59 AM | 6 (1.9%) | 3 (0.9%) |
| 10:00 AM to 10:59 AM | 0 (0.0%) | 31 (8.9%) |
| 11:00 AM to 11:59 AM | 9 (2.9%) | 5 (1.4%) |
| 12:00 PM to 3:59 PM | 5 (1.6%) | 10 (2.9%) |
| 4:00 PM to 11:59 PM | 32 (10.4%) | 24 (6.9%) |
| Total | 307 (100.0%) | 350 (100.0%) |
Housing Occupancy in Jordan
Occupancy by Ownership in Jordan
Of the total 600 dwellings in Jordan, owner-occupied units account for 428 (71.3%), while renter-occupied units make up 172 (28.7%).
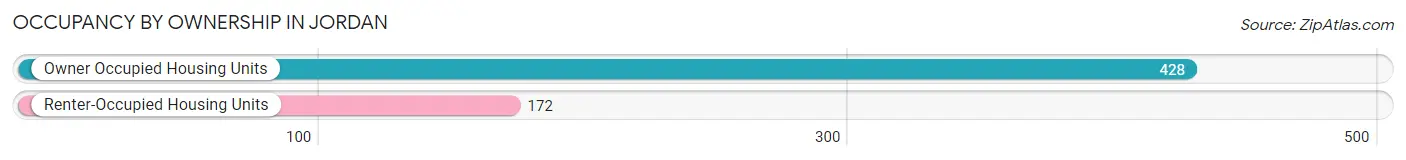
| Occupancy | # Housing Units | % Housing Units |
| Owner Occupied Housing Units | 428 | 71.3% |
| Renter-Occupied Housing Units | 172 | 28.7% |
| Total Occupied Housing Units | 600 | 100.0% |
Occupancy by Household Size in Jordan
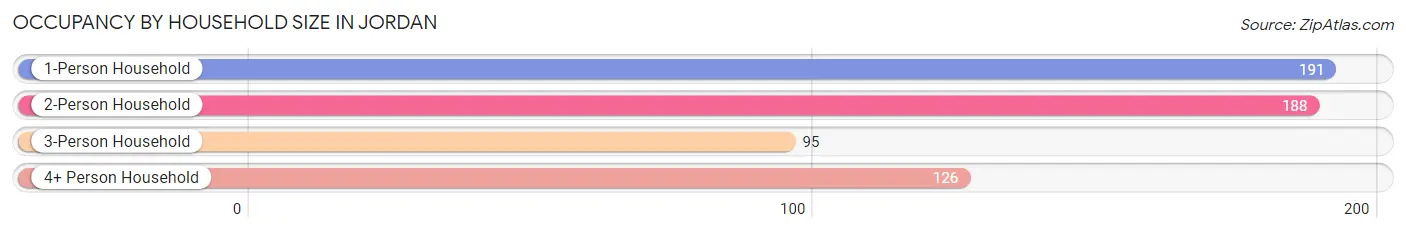
| Household Size | # Housing Units | % Housing Units |
| 1-Person Household | 191 | 31.8% |
| 2-Person Household | 188 | 31.3% |
| 3-Person Household | 95 | 15.8% |
| 4+ Person Household | 126 | 21.0% |
| Total Housing Units | 600 | 100.0% |
Occupancy by Ownership by Household Size in Jordan
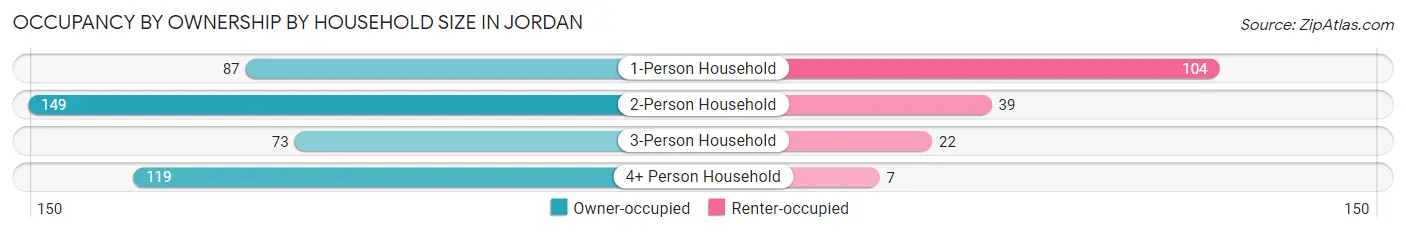
| Household Size | Owner-occupied | Renter-occupied |
| 1-Person Household | 87 (45.6%) | 104 (54.4%) |
| 2-Person Household | 149 (79.3%) | 39 (20.7%) |
| 3-Person Household | 73 (76.8%) | 22 (23.2%) |
| 4+ Person Household | 119 (94.4%) | 7 (5.6%) |
| Total Housing Units | 428 (71.3%) | 172 (28.7%) |
Occupancy by Educational Attainment in Jordan
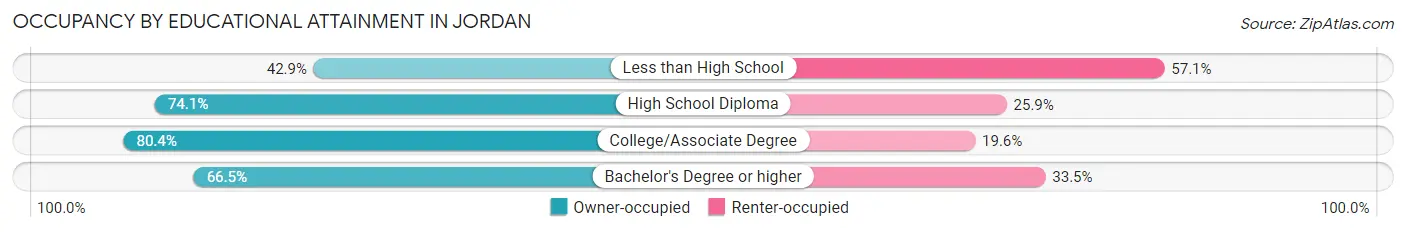
| Household Size | Owner-occupied | Renter-occupied |
| Less than High School | 24 (42.9%) | 32 (57.1%) |
| High School Diploma | 129 (74.1%) | 45 (25.9%) |
| College/Associate Degree | 168 (80.4%) | 41 (19.6%) |
| Bachelor's Degree or higher | 107 (66.5%) | 54 (33.5%) |
Occupancy by Age of Householder in Jordan
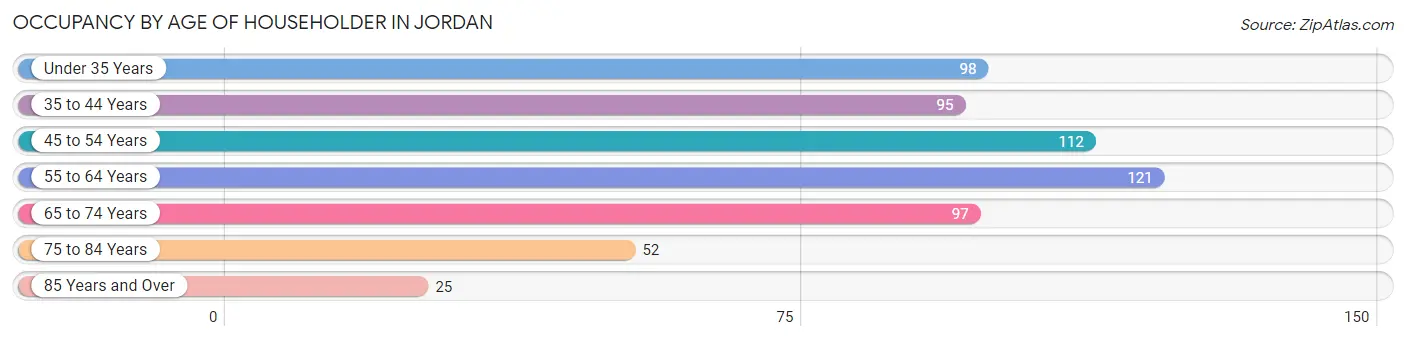
| Age Bracket | # Households | % Households |
| Under 35 Years | 98 | 16.3% |
| 35 to 44 Years | 95 | 15.8% |
| 45 to 54 Years | 112 | 18.7% |
| 55 to 64 Years | 121 | 20.2% |
| 65 to 74 Years | 97 | 16.2% |
| 75 to 84 Years | 52 | 8.7% |
| 85 Years and Over | 25 | 4.2% |
| Total | 600 | 100.0% |
Housing Finances in Jordan
Median Income by Occupancy in Jordan
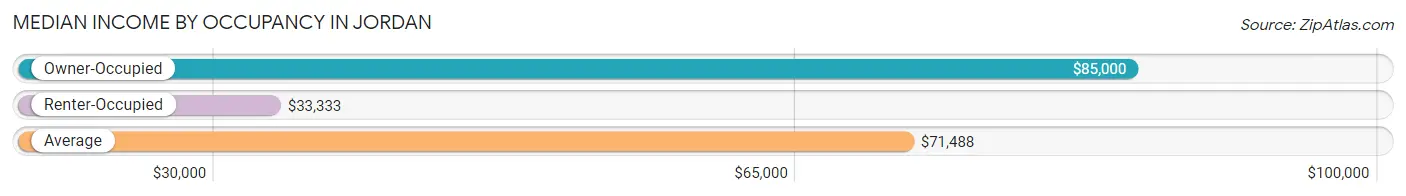
| Occupancy Type | # Households | Median Income |
| Owner-Occupied | 428 (71.3%) | $85,000 |
| Renter-Occupied | 172 (28.7%) | $33,333 |
| Average | 600 (100.0%) | $71,488 |
Occupancy by Householder Income Bracket in Jordan
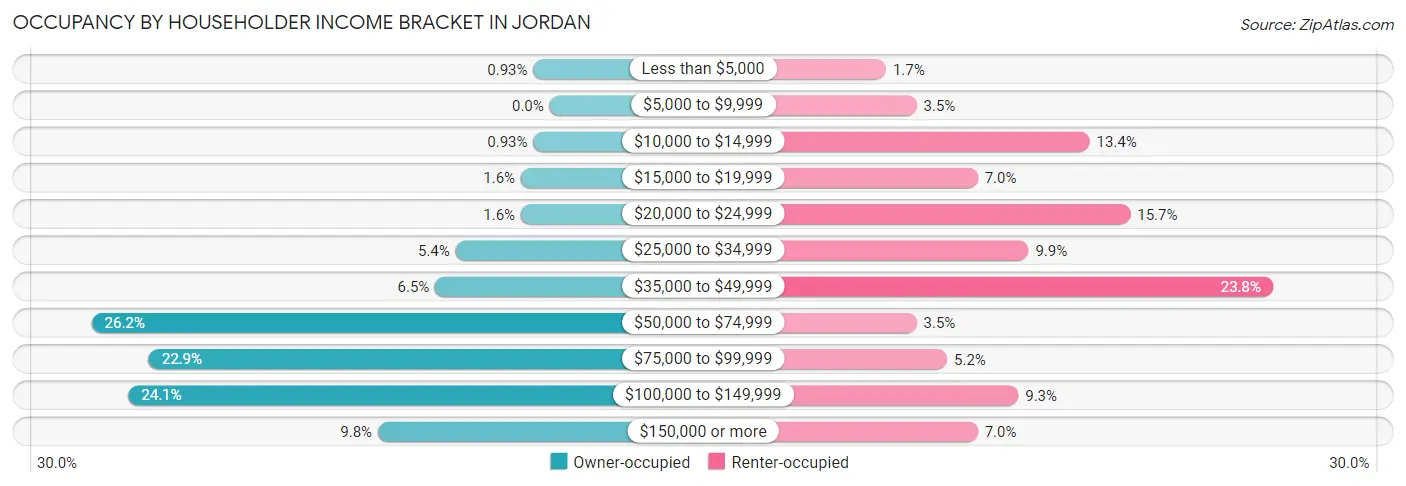
| Income Bracket | Owner-occupied | Renter-occupied |
| Less than $5,000 | 4 (0.9%) | 3 (1.7%) |
| $5,000 to $9,999 | 0 (0.0%) | 6 (3.5%) |
| $10,000 to $14,999 | 4 (0.9%) | 23 (13.4%) |
| $15,000 to $19,999 | 7 (1.6%) | 12 (7.0%) |
| $20,000 to $24,999 | 7 (1.6%) | 27 (15.7%) |
| $25,000 to $34,999 | 23 (5.4%) | 17 (9.9%) |
| $35,000 to $49,999 | 28 (6.5%) | 41 (23.8%) |
| $50,000 to $74,999 | 112 (26.2%) | 6 (3.5%) |
| $75,000 to $99,999 | 98 (22.9%) | 9 (5.2%) |
| $100,000 to $149,999 | 103 (24.1%) | 16 (9.3%) |
| $150,000 or more | 42 (9.8%) | 12 (7.0%) |
| Total | 428 (100.0%) | 172 (100.0%) |
Monthly Housing Cost Tiers in Jordan
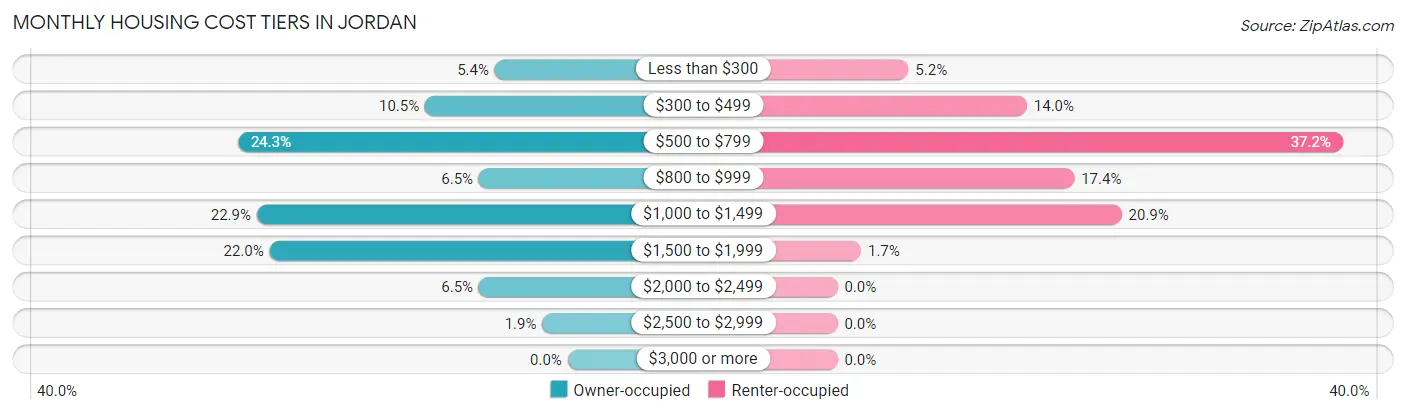
| Monthly Cost | Owner-occupied | Renter-occupied |
| Less than $300 | 23 (5.4%) | 9 (5.2%) |
| $300 to $499 | 45 (10.5%) | 24 (14.0%) |
| $500 to $799 | 104 (24.3%) | 64 (37.2%) |
| $800 to $999 | 28 (6.5%) | 30 (17.4%) |
| $1,000 to $1,499 | 98 (22.9%) | 36 (20.9%) |
| $1,500 to $1,999 | 94 (22.0%) | 3 (1.7%) |
| $2,000 to $2,499 | 28 (6.5%) | 0 (0.0%) |
| $2,500 to $2,999 | 8 (1.9%) | 0 (0.0%) |
| $3,000 or more | 0 (0.0%) | 0 (0.0%) |
| Total | 428 (100.0%) | 172 (100.0%) |
Physical Housing Characteristics in Jordan
Housing Structures in Jordan
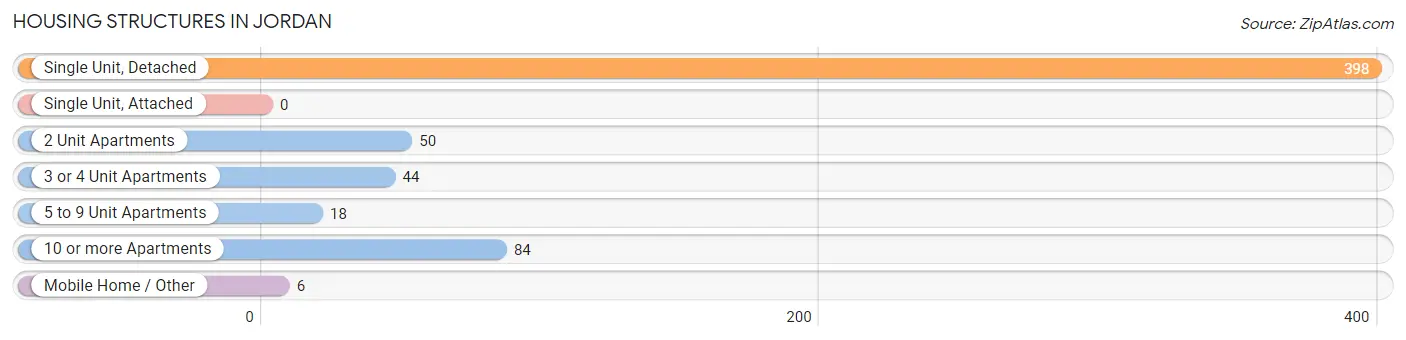
| Structure Type | # Housing Units | % Housing Units |
| Single Unit, Detached | 398 | 66.3% |
| Single Unit, Attached | 0 | 0.0% |
| 2 Unit Apartments | 50 | 8.3% |
| 3 or 4 Unit Apartments | 44 | 7.3% |
| 5 to 9 Unit Apartments | 18 | 3.0% |
| 10 or more Apartments | 84 | 14.0% |
| Mobile Home / Other | 6 | 1.0% |
| Total | 600 | 100.0% |
Housing Structures by Occupancy in Jordan
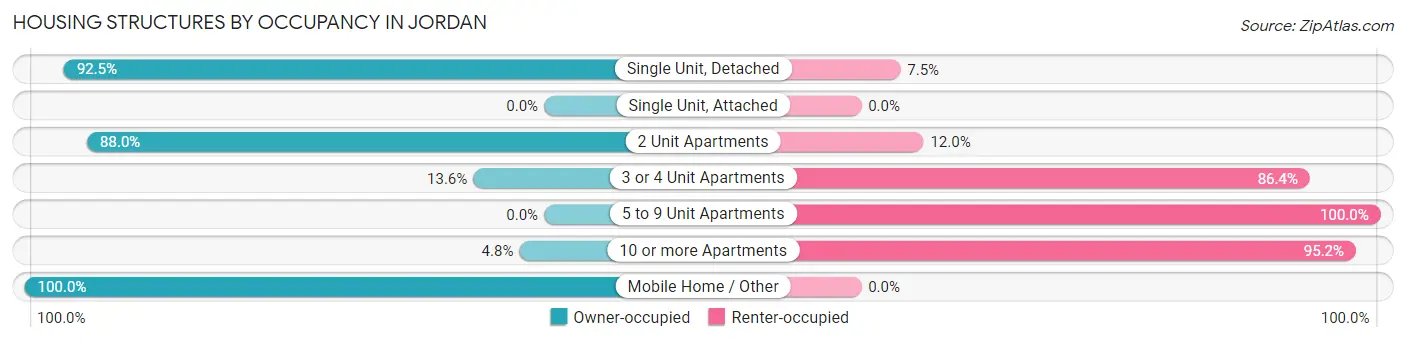
| Structure Type | Owner-occupied | Renter-occupied |
| Single Unit, Detached | 368 (92.5%) | 30 (7.5%) |
| Single Unit, Attached | 0 (0.0%) | 0 (0.0%) |
| 2 Unit Apartments | 44 (88.0%) | 6 (12.0%) |
| 3 or 4 Unit Apartments | 6 (13.6%) | 38 (86.4%) |
| 5 to 9 Unit Apartments | 0 (0.0%) | 18 (100.0%) |
| 10 or more Apartments | 4 (4.8%) | 80 (95.2%) |
| Mobile Home / Other | 6 (100.0%) | 0 (0.0%) |
| Total | 428 (71.3%) | 172 (28.7%) |
Housing Structures by Number of Rooms in Jordan
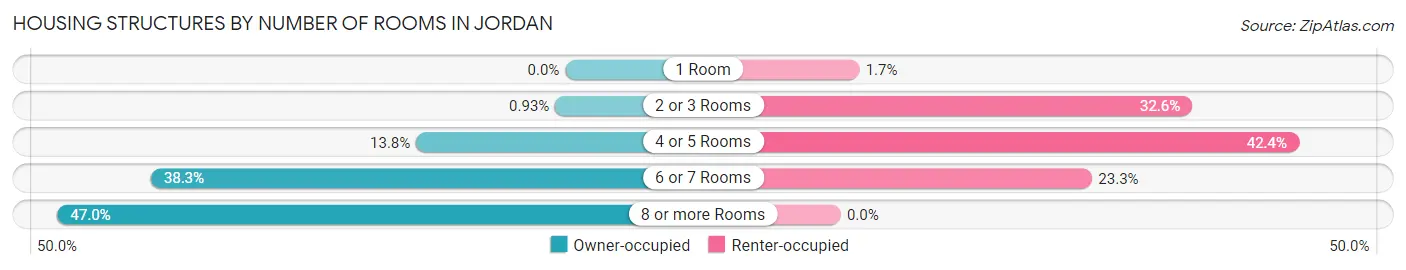
| Number of Rooms | Owner-occupied | Renter-occupied |
| 1 Room | 0 (0.0%) | 3 (1.7%) |
| 2 or 3 Rooms | 4 (0.9%) | 56 (32.6%) |
| 4 or 5 Rooms | 59 (13.8%) | 73 (42.4%) |
| 6 or 7 Rooms | 164 (38.3%) | 40 (23.3%) |
| 8 or more Rooms | 201 (47.0%) | 0 (0.0%) |
| Total | 428 (100.0%) | 172 (100.0%) |
Housing Structure by Heating Type in Jordan
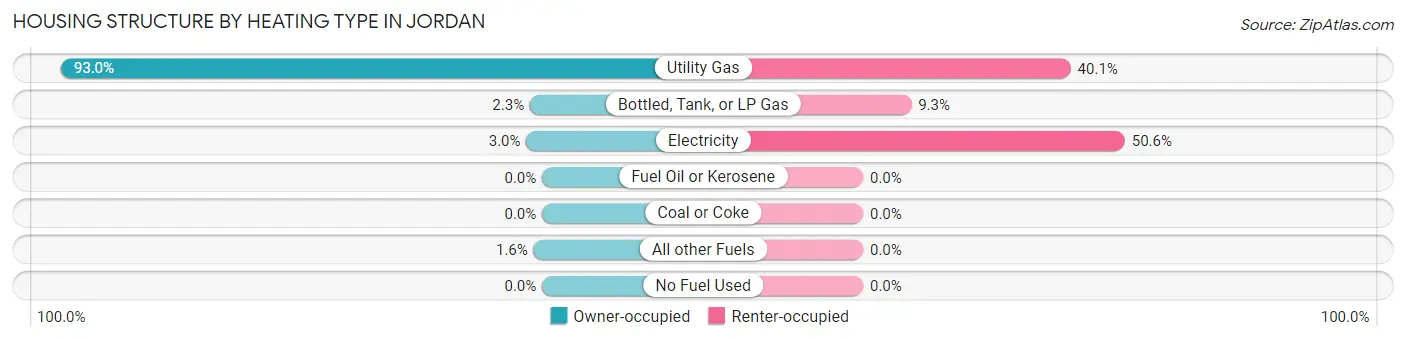
| Heating Type | Owner-occupied | Renter-occupied |
| Utility Gas | 398 (93.0%) | 69 (40.1%) |
| Bottled, Tank, or LP Gas | 10 (2.3%) | 16 (9.3%) |
| Electricity | 13 (3.0%) | 87 (50.6%) |
| Fuel Oil or Kerosene | 0 (0.0%) | 0 (0.0%) |
| Coal or Coke | 0 (0.0%) | 0 (0.0%) |
| All other Fuels | 7 (1.6%) | 0 (0.0%) |
| No Fuel Used | 0 (0.0%) | 0 (0.0%) |
| Total | 428 (100.0%) | 172 (100.0%) |
Household Vehicle Usage in Jordan
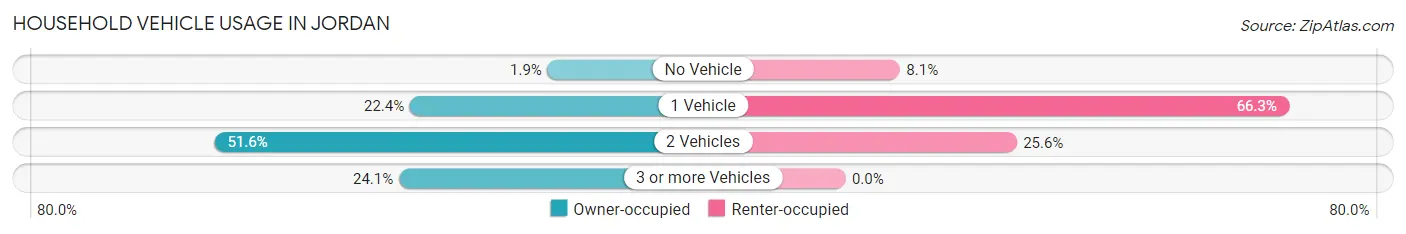
| Vehicles per Household | Owner-occupied | Renter-occupied |
| No Vehicle | 8 (1.9%) | 14 (8.1%) |
| 1 Vehicle | 96 (22.4%) | 114 (66.3%) |
| 2 Vehicles | 221 (51.6%) | 44 (25.6%) |
| 3 or more Vehicles | 103 (24.1%) | 0 (0.0%) |
| Total | 428 (100.0%) | 172 (100.0%) |
Real Estate & Mortgages in Jordan
Real Estate and Mortgage Overview in Jordan
| Characteristic | Without Mortgage | With Mortgage |
| Housing Units | 183 | 245 |
| Median Property Value | $129,300 | $135,200 |
| Median Household Income | $71,098 | $32 |
| Monthly Housing Costs | $584 | $0 |
| Real Estate Taxes | $3,337 | $0 |
Property Value by Mortgage Status in Jordan
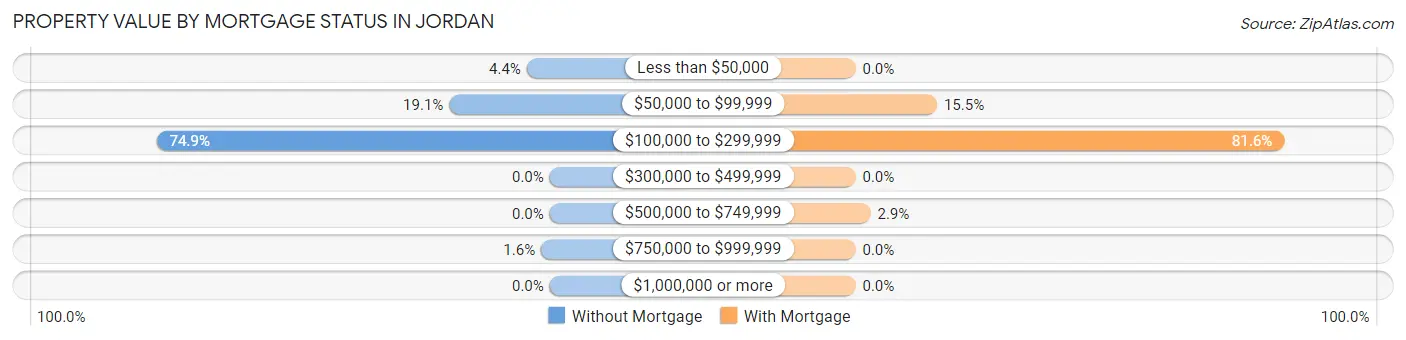
| Property Value | Without Mortgage | With Mortgage |
| Less than $50,000 | 8 (4.4%) | 0 (0.0%) |
| $50,000 to $99,999 | 35 (19.1%) | 38 (15.5%) |
| $100,000 to $299,999 | 137 (74.9%) | 200 (81.6%) |
| $300,000 to $499,999 | 0 (0.0%) | 0 (0.0%) |
| $500,000 to $749,999 | 0 (0.0%) | 7 (2.9%) |
| $750,000 to $999,999 | 3 (1.6%) | 0 (0.0%) |
| $1,000,000 or more | 0 (0.0%) | 0 (0.0%) |
| Total | 183 (100.0%) | 245 (100.0%) |
Household Income by Mortgage Status in Jordan
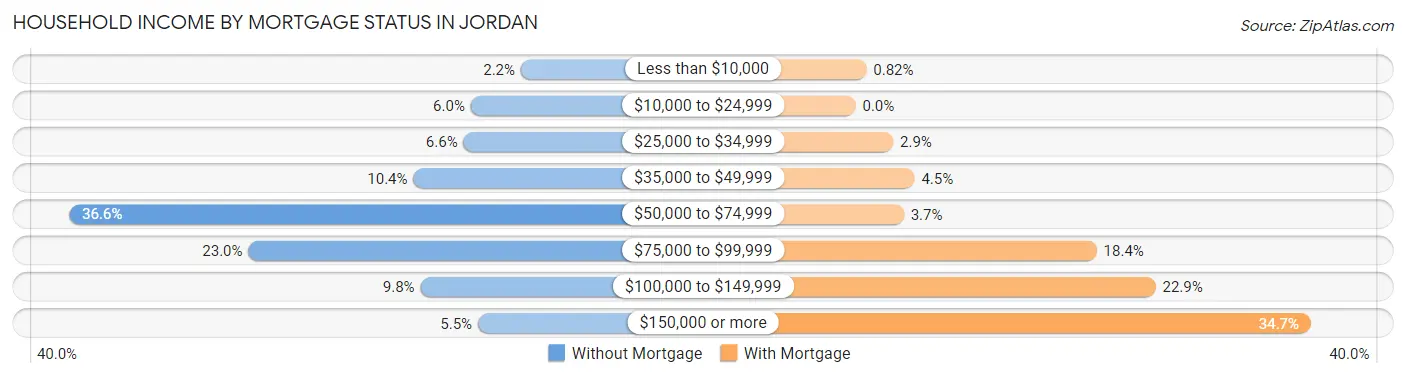
| Household Income | Without Mortgage | With Mortgage |
| Less than $10,000 | 4 (2.2%) | 2 (0.8%) |
| $10,000 to $24,999 | 11 (6.0%) | 0 (0.0%) |
| $25,000 to $34,999 | 12 (6.6%) | 7 (2.9%) |
| $35,000 to $49,999 | 19 (10.4%) | 11 (4.5%) |
| $50,000 to $74,999 | 67 (36.6%) | 9 (3.7%) |
| $75,000 to $99,999 | 42 (23.0%) | 45 (18.4%) |
| $100,000 to $149,999 | 18 (9.8%) | 56 (22.9%) |
| $150,000 or more | 10 (5.5%) | 85 (34.7%) |
| Total | 183 (100.0%) | 245 (100.0%) |
Property Value to Household Income Ratio in Jordan
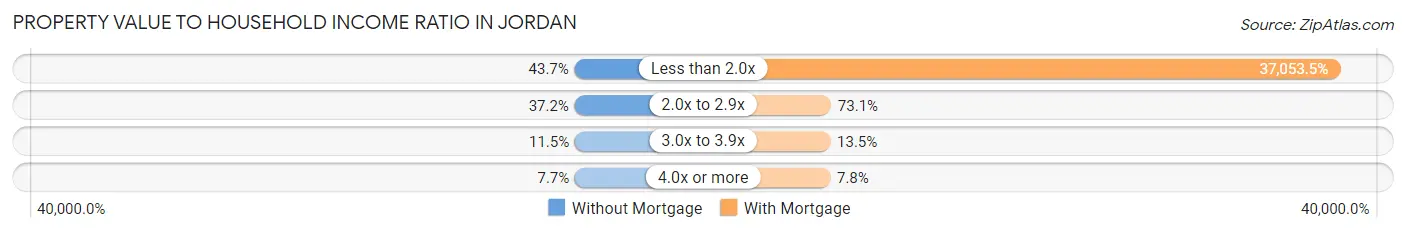
| Value-to-Income Ratio | Without Mortgage | With Mortgage |
| Less than 2.0x | 80 (43.7%) | 90,781 (37,053.5%) |
| 2.0x to 2.9x | 68 (37.2%) | 179 (73.1%) |
| 3.0x to 3.9x | 21 (11.5%) | 33 (13.5%) |
| 4.0x or more | 14 (7.6%) | 19 (7.8%) |
| Total | 183 (100.0%) | 245 (100.0%) |
Real Estate Taxes by Mortgage Status in Jordan
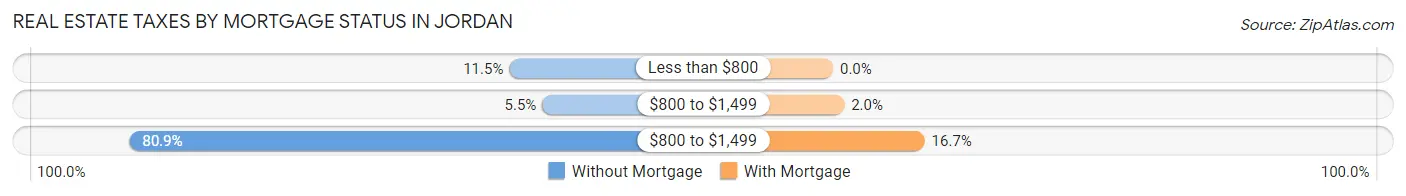
| Property Taxes | Without Mortgage | With Mortgage |
| Less than $800 | 21 (11.5%) | 0 (0.0%) |
| $800 to $1,499 | 10 (5.5%) | 5 (2.0%) |
| $800 to $1,499 | 148 (80.9%) | 41 (16.7%) |
| Total | 183 (100.0%) | 245 (100.0%) |
Health & Disability in Jordan
Health Insurance Coverage by Age in Jordan
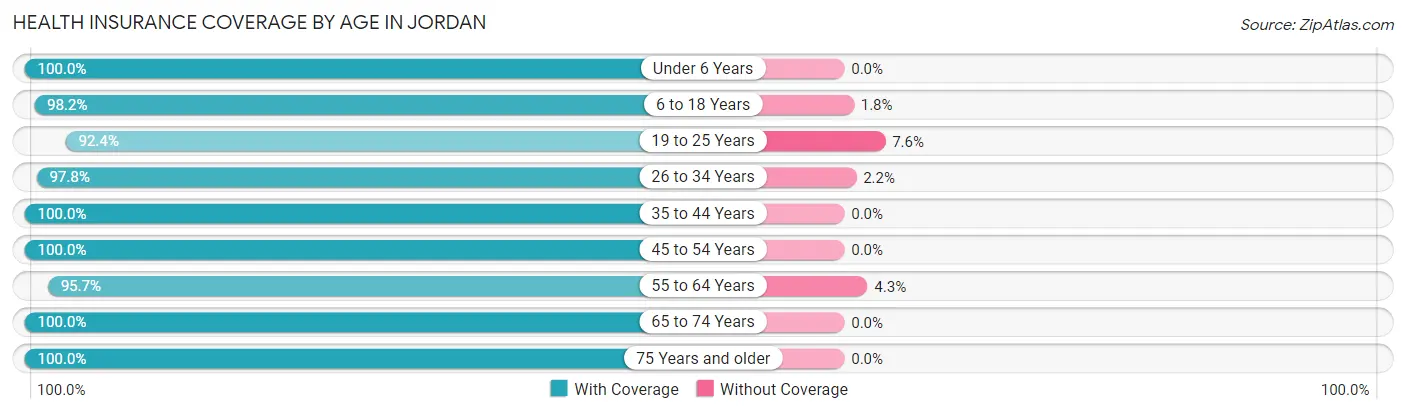
| Age Bracket | With Coverage | Without Coverage |
| Under 6 Years | 162 (100.0%) | 0 (0.0%) |
| 6 to 18 Years | 222 (98.2%) | 4 (1.8%) |
| 19 to 25 Years | 109 (92.4%) | 9 (7.6%) |
| 26 to 34 Years | 132 (97.8%) | 3 (2.2%) |
| 35 to 44 Years | 194 (100.0%) | 0 (0.0%) |
| 45 to 54 Years | 153 (100.0%) | 0 (0.0%) |
| 55 to 64 Years | 200 (95.7%) | 9 (4.3%) |
| 65 to 74 Years | 180 (100.0%) | 0 (0.0%) |
| 75 Years and older | 103 (100.0%) | 0 (0.0%) |
| Total | 1,455 (98.3%) | 25 (1.7%) |
Health Insurance Coverage by Citizenship Status in Jordan
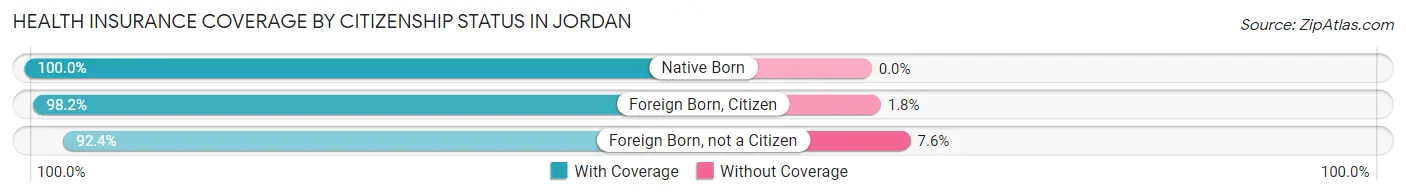
| Citizenship Status | With Coverage | Without Coverage |
| Native Born | 162 (100.0%) | 0 (0.0%) |
| Foreign Born, Citizen | 222 (98.2%) | 4 (1.8%) |
| Foreign Born, not a Citizen | 109 (92.4%) | 9 (7.6%) |
Health Insurance Coverage by Household Income in Jordan
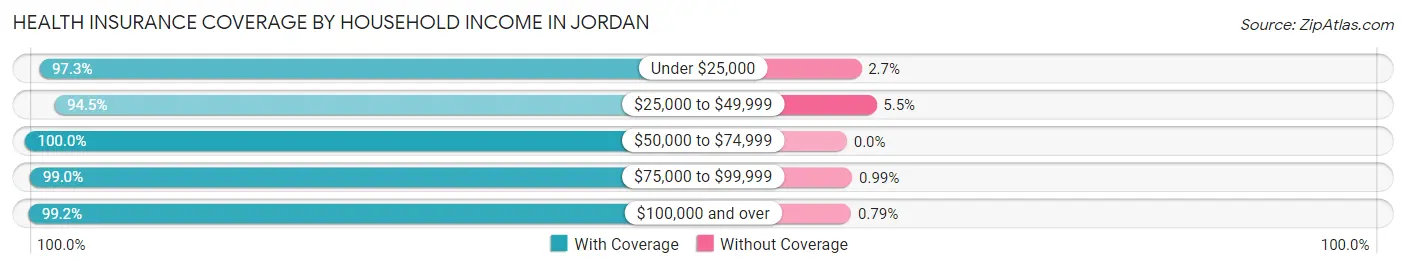
| Household Income | With Coverage | Without Coverage |
| Under $25,000 | 108 (97.3%) | 3 (2.7%) |
| $25,000 to $49,999 | 256 (94.5%) | 15 (5.5%) |
| $50,000 to $74,999 | 282 (100.0%) | 0 (0.0%) |
| $75,000 to $99,999 | 301 (99.0%) | 3 (1.0%) |
| $100,000 and over | 500 (99.2%) | 4 (0.8%) |
Public vs Private Health Insurance Coverage by Age in Jordan
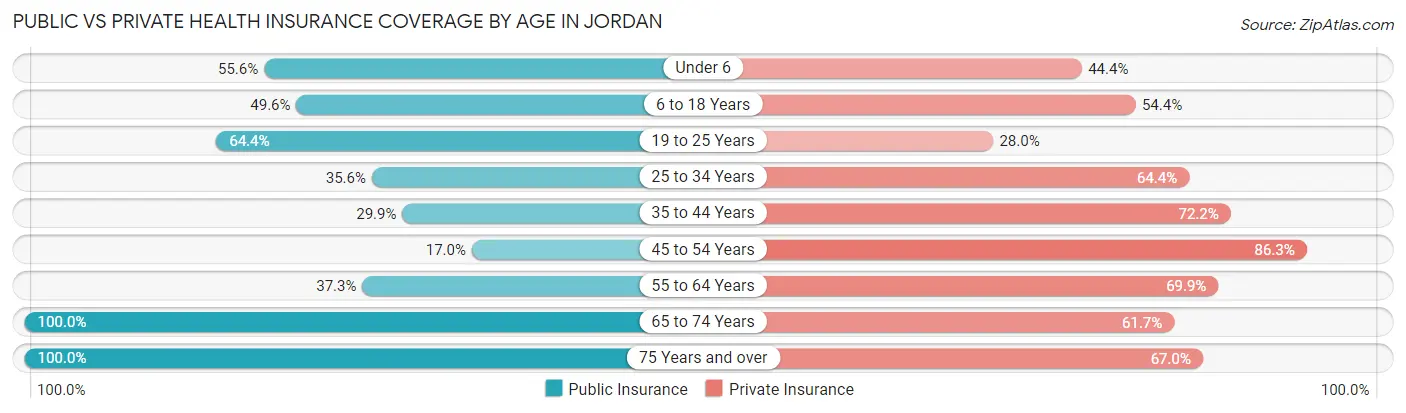
| Age Bracket | Public Insurance | Private Insurance |
| Under 6 | 90 (55.6%) | 72 (44.4%) |
| 6 to 18 Years | 112 (49.6%) | 123 (54.4%) |
| 19 to 25 Years | 76 (64.4%) | 33 (28.0%) |
| 25 to 34 Years | 48 (35.6%) | 87 (64.4%) |
| 35 to 44 Years | 58 (29.9%) | 140 (72.2%) |
| 45 to 54 Years | 26 (17.0%) | 132 (86.3%) |
| 55 to 64 Years | 78 (37.3%) | 146 (69.9%) |
| 65 to 74 Years | 180 (100.0%) | 111 (61.7%) |
| 75 Years and over | 103 (100.0%) | 69 (67.0%) |
| Total | 771 (52.1%) | 913 (61.7%) |
Disability Status by Sex by Age in Jordan
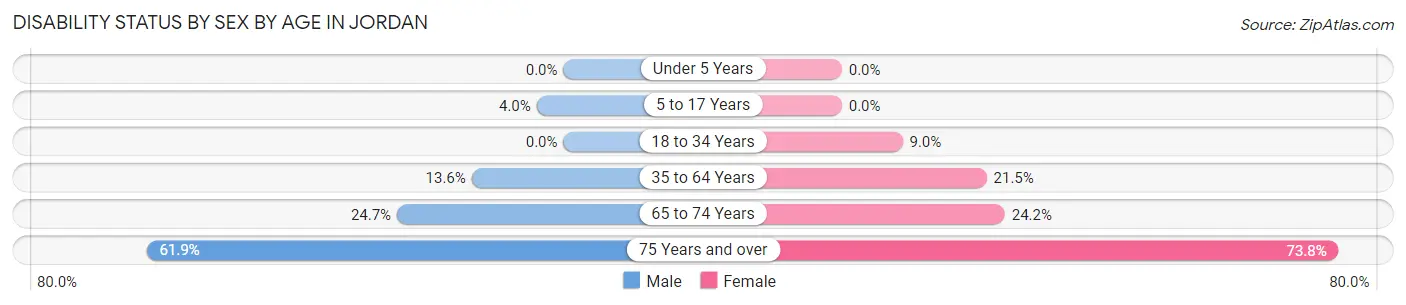
| Age Bracket | Male | Female |
| Under 5 Years | 0 (0.0%) | 0 (0.0%) |
| 5 to 17 Years | 5 (4.0%) | 0 (0.0%) |
| 18 to 34 Years | 0 (0.0%) | 12 (9.0%) |
| 35 to 64 Years | 32 (13.6%) | 69 (21.5%) |
| 65 to 74 Years | 21 (24.7%) | 23 (24.2%) |
| 75 Years and over | 26 (61.9%) | 45 (73.8%) |
Disability Class by Sex by Age in Jordan
Disability Class: Hearing Difficulty
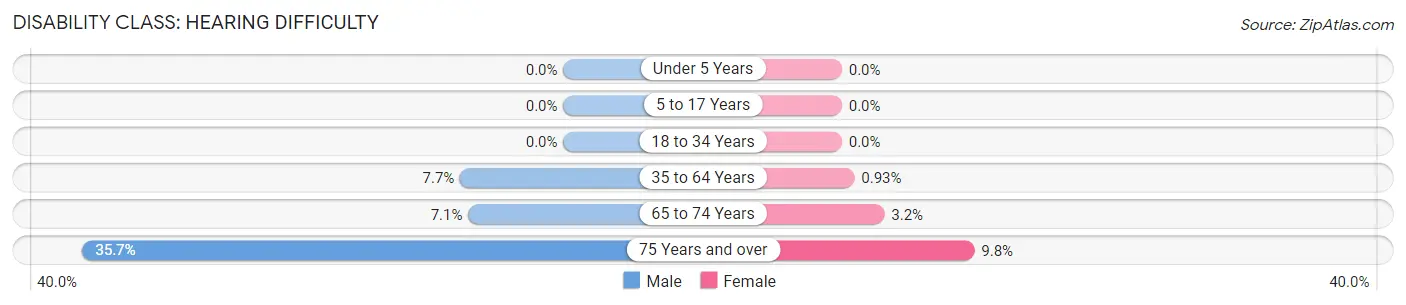
| Age Bracket | Male | Female |
| Under 5 Years | 0 (0.0%) | 0 (0.0%) |
| 5 to 17 Years | 0 (0.0%) | 0 (0.0%) |
| 18 to 34 Years | 0 (0.0%) | 0 (0.0%) |
| 35 to 64 Years | 18 (7.7%) | 3 (0.9%) |
| 65 to 74 Years | 6 (7.1%) | 3 (3.2%) |
| 75 Years and over | 15 (35.7%) | 6 (9.8%) |
Disability Class: Vision Difficulty
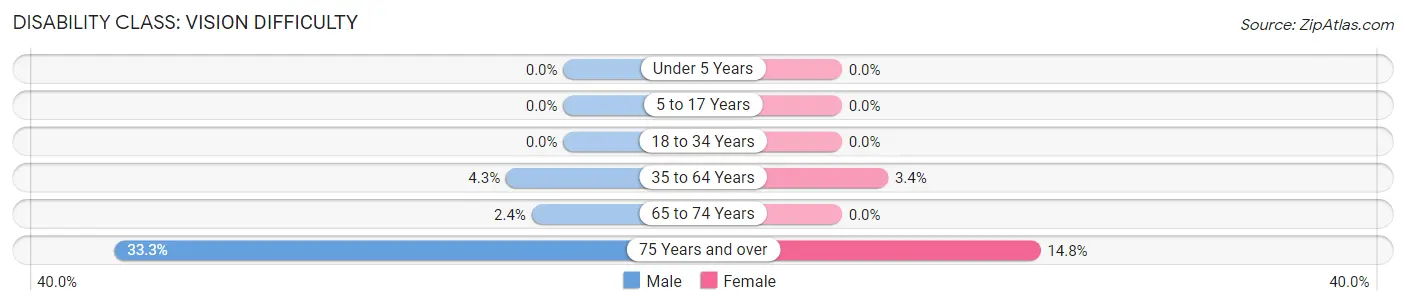
| Age Bracket | Male | Female |
| Under 5 Years | 0 (0.0%) | 0 (0.0%) |
| 5 to 17 Years | 0 (0.0%) | 0 (0.0%) |
| 18 to 34 Years | 0 (0.0%) | 0 (0.0%) |
| 35 to 64 Years | 10 (4.3%) | 11 (3.4%) |
| 65 to 74 Years | 2 (2.4%) | 0 (0.0%) |
| 75 Years and over | 14 (33.3%) | 9 (14.7%) |
Disability Class: Cognitive Difficulty
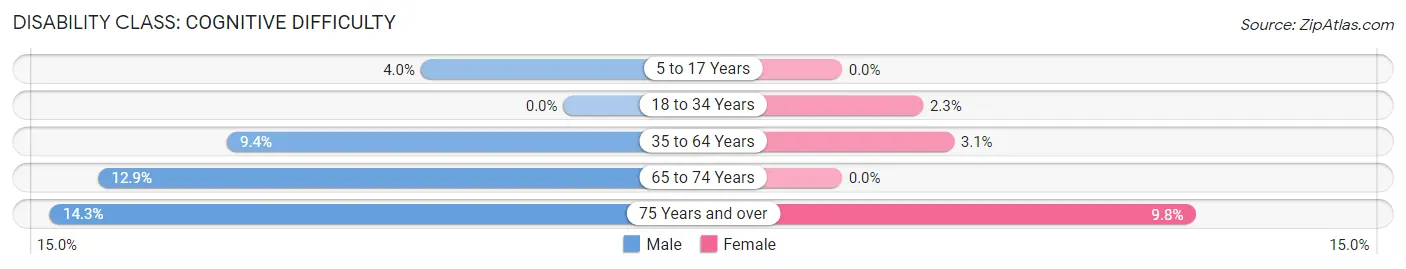
| Age Bracket | Male | Female |
| 5 to 17 Years | 5 (4.0%) | 0 (0.0%) |
| 18 to 34 Years | 0 (0.0%) | 3 (2.3%) |
| 35 to 64 Years | 22 (9.4%) | 10 (3.1%) |
| 65 to 74 Years | 11 (12.9%) | 0 (0.0%) |
| 75 Years and over | 6 (14.3%) | 6 (9.8%) |
Disability Class: Ambulatory Difficulty
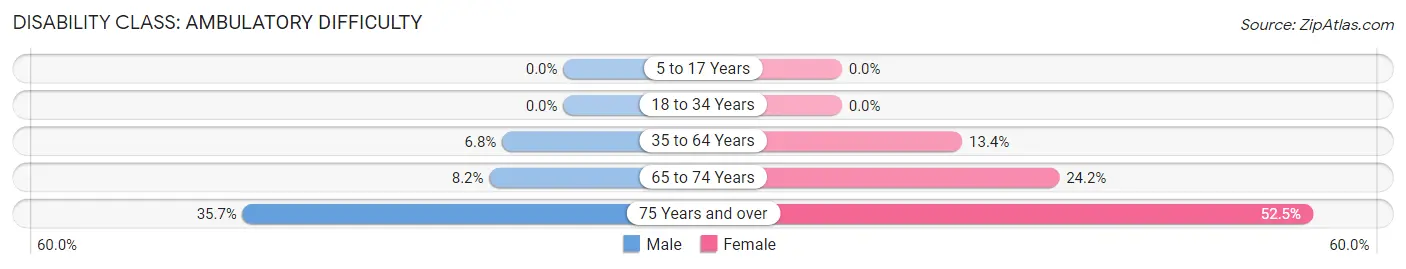
| Age Bracket | Male | Female |
| 5 to 17 Years | 0 (0.0%) | 0 (0.0%) |
| 18 to 34 Years | 0 (0.0%) | 0 (0.0%) |
| 35 to 64 Years | 16 (6.8%) | 43 (13.4%) |
| 65 to 74 Years | 7 (8.2%) | 23 (24.2%) |
| 75 Years and over | 15 (35.7%) | 32 (52.5%) |
Disability Class: Self-Care Difficulty
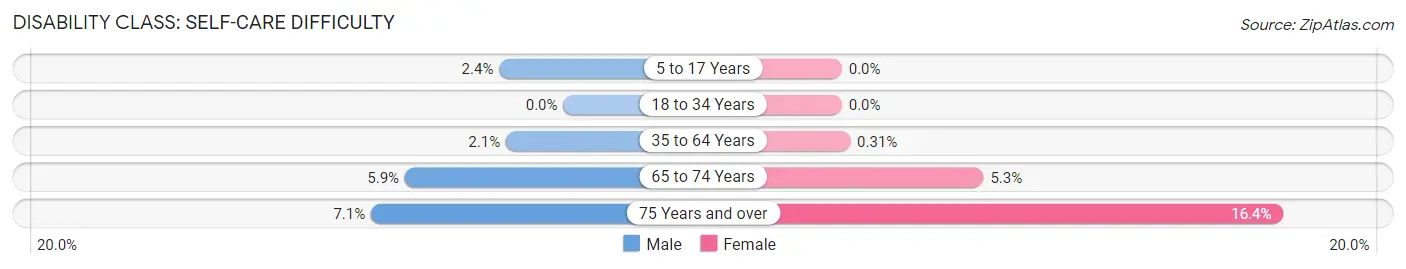
| Age Bracket | Male | Female |
| 5 to 17 Years | 3 (2.4%) | 0 (0.0%) |
| 18 to 34 Years | 0 (0.0%) | 0 (0.0%) |
| 35 to 64 Years | 5 (2.1%) | 1 (0.3%) |
| 65 to 74 Years | 5 (5.9%) | 5 (5.3%) |
| 75 Years and over | 3 (7.1%) | 10 (16.4%) |
Technology Access in Jordan
Computing Device Access in Jordan
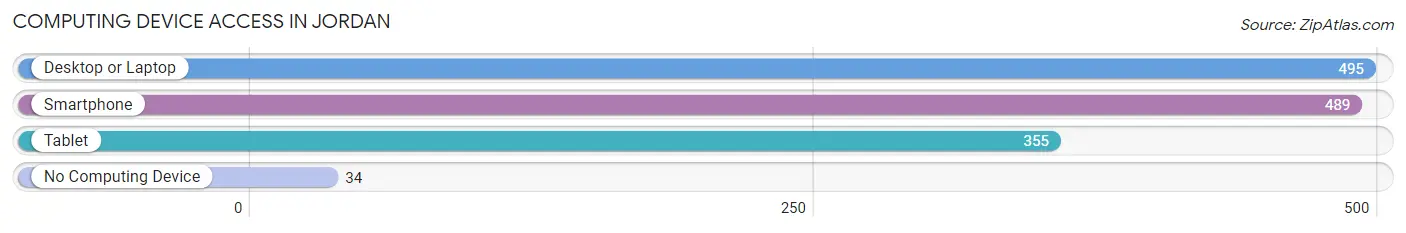
| Device Type | # Households | % Households |
| Desktop or Laptop | 495 | 82.5% |
| Smartphone | 489 | 81.5% |
| Tablet | 355 | 59.2% |
| No Computing Device | 34 | 5.7% |
| Total | 600 | 100.0% |
Internet Access in Jordan
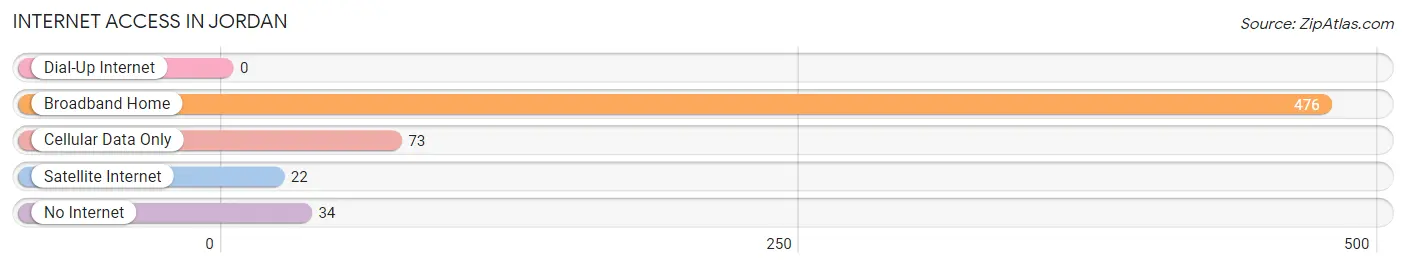
| Internet Type | # Households | % Households |
| Dial-Up Internet | 0 | 0.0% |
| Broadband Home | 476 | 79.3% |
| Cellular Data Only | 73 | 12.2% |
| Satellite Internet | 22 | 3.7% |
| No Internet | 34 | 5.7% |
| Total | 600 | 100.0% |
Jordan Summary
Jordan, New York is a small village located in Onondaga County, New York. It is situated on the banks of the Seneca River, which is part of the Finger Lakes region. The village is located approximately 20 miles northwest of Syracuse and is part of the Syracuse Metropolitan Statistical Area. As of the 2010 census, the population of Jordan was 2,845.
History
The area that is now Jordan was originally inhabited by the Onondaga Nation, a member of the Iroquois Confederacy. The first European settlers arrived in the area in the late 1700s, and the village was officially incorporated in 1827. The village was named after the Jordan River in the Middle East, which was believed to be the site of Jesus’ baptism.
In the early 19th century, the village was a major stop on the Erie Canal, which connected the Great Lakes to the Hudson River. The canal brought a large influx of settlers to the area, and the village quickly grew. By the mid-1800s, Jordan was a thriving agricultural and industrial center. The village was home to several mills, including a paper mill, a grist mill, and a saw mill.
Geography
Jordan is located in the Finger Lakes region of New York, approximately 20 miles northwest of Syracuse. The village is situated on the banks of the Seneca River, which flows through the village. The village is located in the Onondaga Valley, which is surrounded by rolling hills and forests. The village is located at an elevation of approximately 600 feet above sea level.
The climate in Jordan is classified as humid continental, with cold winters and warm summers. The average annual temperature is approximately 48 degrees Fahrenheit, with an average high of 68 degrees in the summer and an average low of 28 degrees in the winter. The average annual precipitation is approximately 37 inches.
Economy
The economy of Jordan is largely based on agriculture and tourism. The village is home to several farms, which produce a variety of crops, including corn, soybeans, and hay. The village is also home to several wineries, which produce a variety of wines.
Tourism is also an important part of the local economy. The village is home to several historic sites, including the Jordan Historical Museum and the Jordan Canal Museum. The village is also home to several parks, including the Jordan Canal Park and the Jordan River Park.
Demographics
As of the 2010 census, the population of Jordan was 2,845. The population is approximately 97% white, 1% African American, 1% Hispanic, and 1% Asian. The median household income is approximately $50,000, and the median home value is approximately $150,000. The village is home to several churches, including the Jordan United Methodist Church and the Jordan Presbyterian Church.
Common Questions
What is Per Capita Income in Jordan?
Per Capita income in Jordan is $32,505.
What is the Median Family Income in Jordan?
Median Family Income in Jordan is $81,719.
What is the Median Household income in Jordan?
Median Household Income in Jordan is $71,488.
What is Income or Wage Gap in Jordan?
Income or Wage Gap in Jordan is 55.8%.
Women in Jordan earn 44.2 cents for every dollar earned by a man.
What is Inequality or Gini Index in Jordan?
Inequality or Gini Index in Jordan is 0.38.
What is the Total Population of Jordan?
Total Population of Jordan is 1,480.
What is the Total Male Population of Jordan?
Total Male Population of Jordan is 659.
What is the Total Female Population of Jordan?
Total Female Population of Jordan is 821.
What is the Ratio of Males per 100 Females in Jordan?
There are 80.27 Males per 100 Females in Jordan.
What is the Ratio of Females per 100 Males in Jordan?
There are 124.58 Females per 100 Males in Jordan.
What is the Median Population Age in Jordan?
Median Population Age in Jordan is 38.9 Years.
What is the Average Family Size in Jordan
Average Family Size in Jordan is 3.1 People.
What is the Average Household Size in Jordan
Average Household Size in Jordan is 2.5 People.
How Large is the Labor Force in Jordan?
There are 722 People in the Labor Forcein in Jordan.
What is the Percentage of People in the Labor Force in Jordan?
63.8% of People are in the Labor Force in Jordan.
What is the Unemployment Rate in Jordan?
Unemployment Rate in Jordan is 3.7%.