Ilion, NY Map & Demographics
Ilion Map
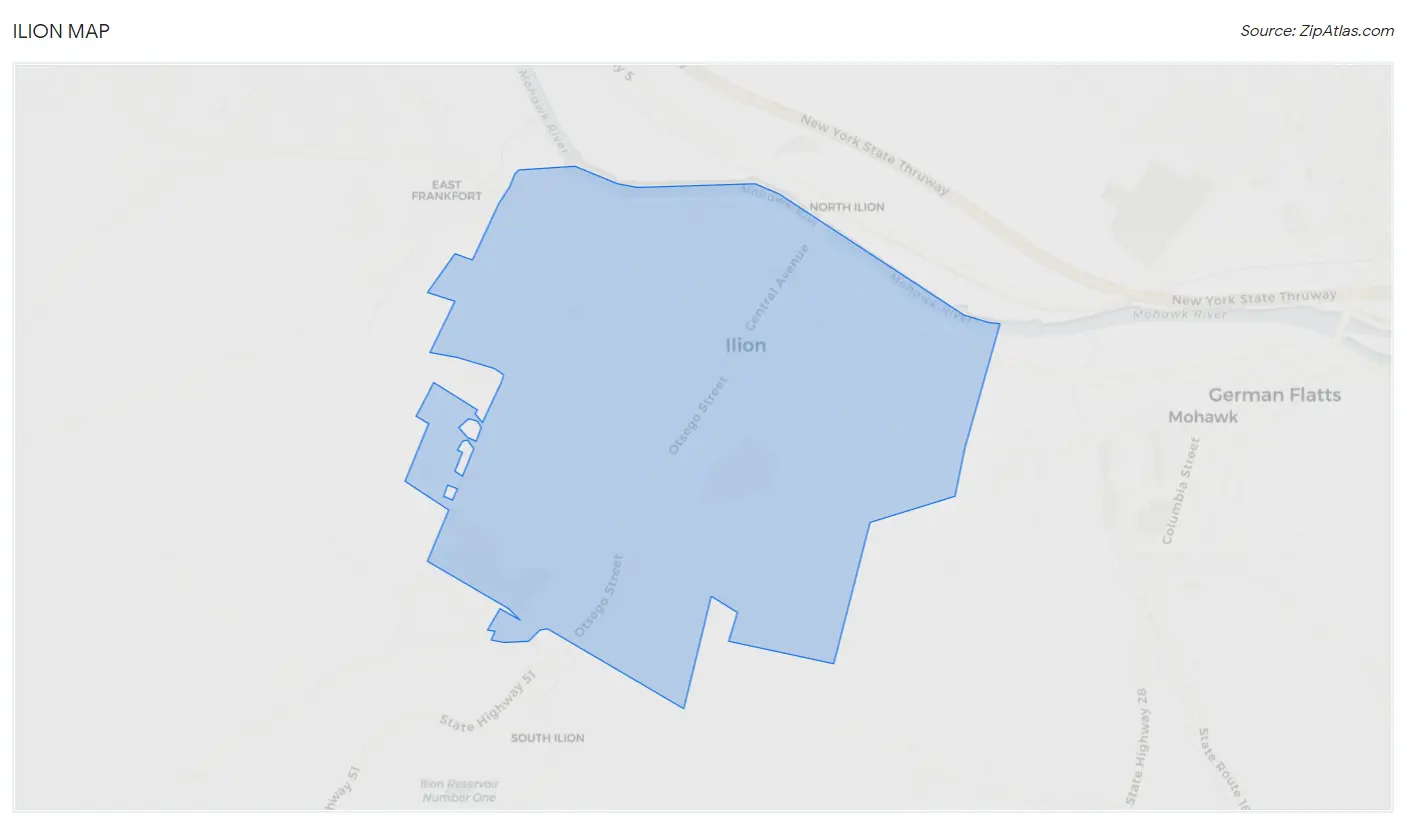
Ilion Overview
$31,836
PER CAPITA INCOME
$89,002
AVG FAMILY INCOME
$71,556
AVG HOUSEHOLD INCOME
21.2%
WAGE / INCOME GAP [ % ]
78.8¢/ $1
WAGE / INCOME GAP [ $ ]
0.38
INEQUALITY / GINI INDEX
7,703
TOTAL POPULATION
3,648
MALE POPULATION
4,055
FEMALE POPULATION
89.96
MALES / 100 FEMALES
111.16
FEMALES / 100 MALES
42.8
MEDIAN AGE
3.0
AVG FAMILY SIZE
2.3
AVG HOUSEHOLD SIZE
3,643
LABOR FORCE [ PEOPLE ]
59.8%
PERCENT IN LABOR FORCE
4.1%
UNEMPLOYMENT RATE
Ilion Zip Codes
Ilion Area Codes
Income in Ilion
Income Overview in Ilion
Per Capita Income in Ilion is $31,836, while median incomes of families and households are $89,002 and $71,556 respectively.
| Characteristic | Number | Measure |
| Per Capita Income | 7,703 | $31,836 |
| Median Family Income | 1,853 | $89,002 |
| Mean Family Income | 1,853 | $93,221 |
| Median Household Income | 3,340 | $71,556 |
| Mean Household Income | 3,340 | $72,477 |
| Income Deficit | 1,853 | $0 |
| Wage / Income Gap (%) | 7,703 | 21.24% |
| Wage / Income Gap ($) | 7,703 | 78.76¢ per $1 |
| Gini / Inequality Index | 7,703 | 0.38 |
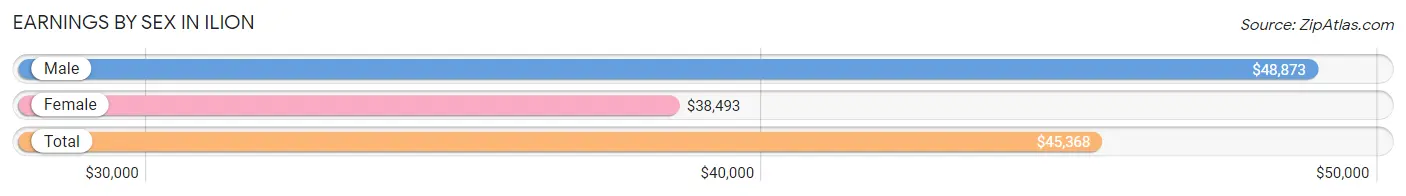
Earnings by Sex in Ilion
Average Earnings in Ilion are $45,368, $48,873 for men and $38,493 for women, a difference of 21.2%.
| Sex | Number | Average Earnings |
| Male | 2,112 (53.4%) | $48,873 |
| Female | 1,844 (46.6%) | $38,493 |
| Total | 3,956 (100.0%) | $45,368 |
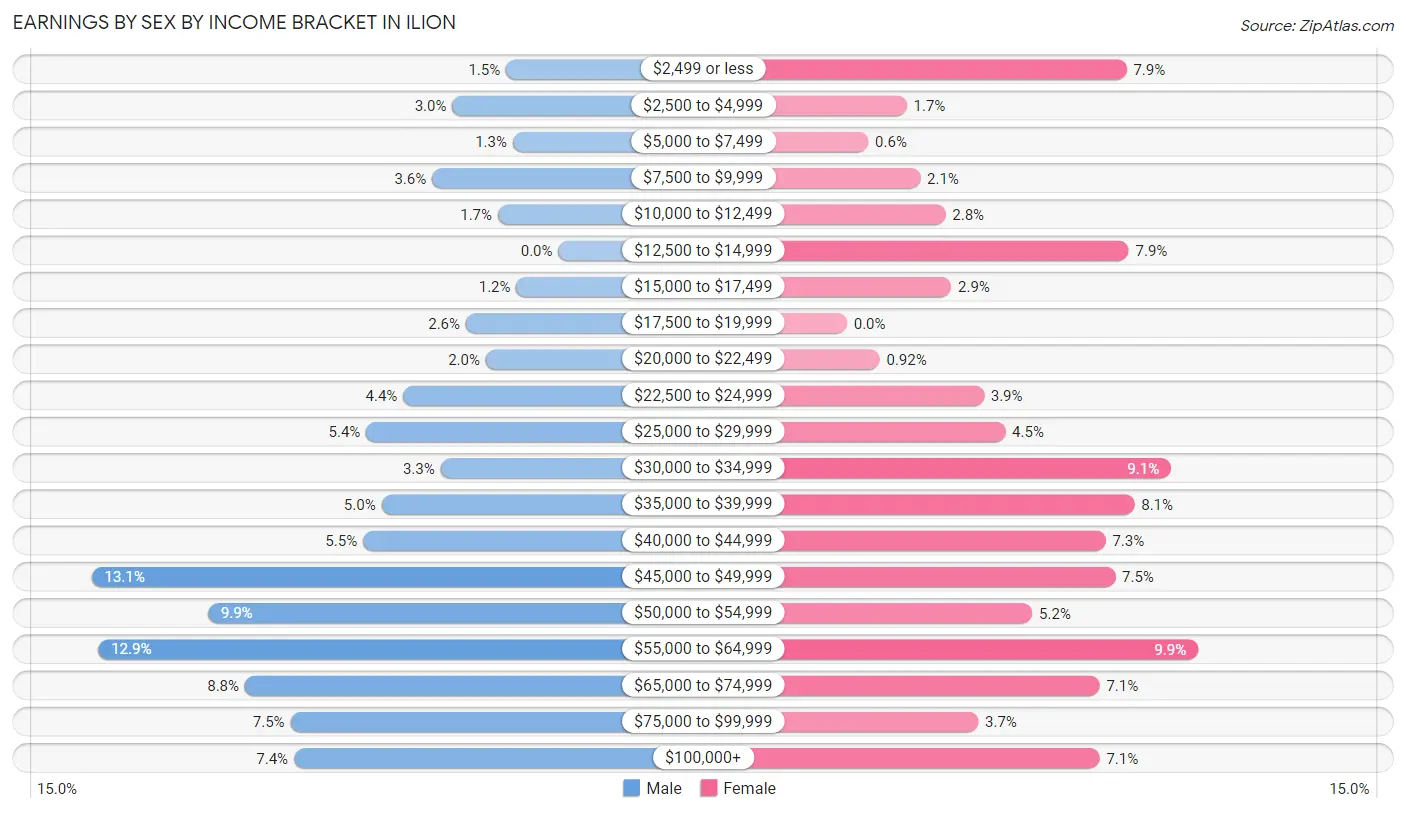
Earnings by Sex by Income Bracket in Ilion
The most common earnings brackets in Ilion are $45,000 to $49,999 for men (277 | 13.1%) and $55,000 to $64,999 for women (182 | 9.9%).
| Income | Male | Female |
| $2,499 or less | 31 (1.5%) | 145 (7.9%) |
| $2,500 to $4,999 | 63 (3.0%) | 31 (1.7%) |
| $5,000 to $7,499 | 27 (1.3%) | 11 (0.6%) |
| $7,500 to $9,999 | 75 (3.5%) | 38 (2.1%) |
| $10,000 to $12,499 | 36 (1.7%) | 51 (2.8%) |
| $12,500 to $14,999 | 0 (0.0%) | 146 (7.9%) |
| $15,000 to $17,499 | 25 (1.2%) | 54 (2.9%) |
| $17,500 to $19,999 | 55 (2.6%) | 0 (0.0%) |
| $20,000 to $22,499 | 43 (2.0%) | 17 (0.9%) |
| $22,500 to $24,999 | 92 (4.4%) | 71 (3.8%) |
| $25,000 to $29,999 | 114 (5.4%) | 82 (4.4%) |
| $30,000 to $34,999 | 70 (3.3%) | 168 (9.1%) |
| $35,000 to $39,999 | 105 (5.0%) | 149 (8.1%) |
| $40,000 to $44,999 | 116 (5.5%) | 134 (7.3%) |
| $45,000 to $49,999 | 277 (13.1%) | 139 (7.5%) |
| $50,000 to $54,999 | 208 (9.9%) | 96 (5.2%) |
| $55,000 to $64,999 | 273 (12.9%) | 182 (9.9%) |
| $65,000 to $74,999 | 186 (8.8%) | 131 (7.1%) |
| $75,000 to $99,999 | 159 (7.5%) | 68 (3.7%) |
| $100,000+ | 157 (7.4%) | 131 (7.1%) |
| Total | 2,112 (100.0%) | 1,844 (100.0%) |
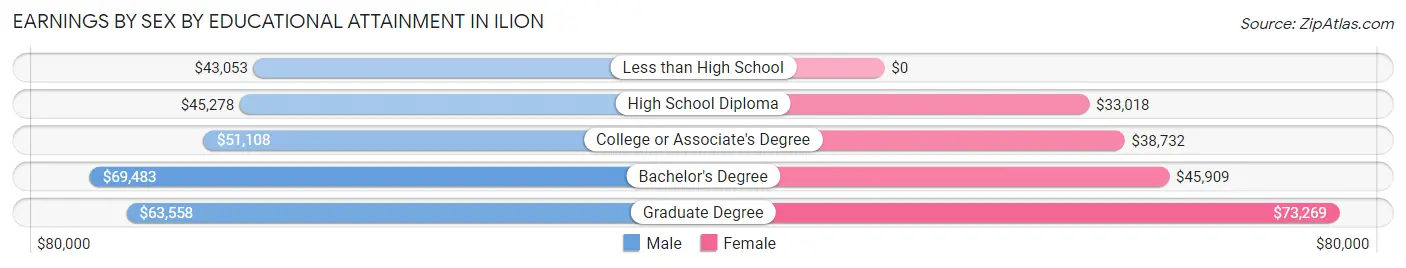
Earnings by Sex by Educational Attainment in Ilion
Average earnings in Ilion are $50,308 for men and $39,320 for women, a difference of 21.8%. Men with an educational attainment of bachelor's degree enjoy the highest average annual earnings of $69,483, while those with less than high school education earn the least with $43,053. Women with an educational attainment of graduate degree earn the most with the average annual earnings of $73,269, while those with high school diploma education have the smallest earnings of $33,018.
| Educational Attainment | Male Income | Female Income |
| Less than High School | $43,053 | $0 |
| High School Diploma | $45,278 | $33,018 |
| College or Associate's Degree | $51,108 | $38,732 |
| Bachelor's Degree | $69,483 | $45,909 |
| Graduate Degree | $63,558 | $73,269 |
| Total | $50,308 | $39,320 |
Family Income in Ilion
Family Income Brackets in Ilion
According to the Ilion family income data, there are 611 families falling into the $75,000 to $99,999 income range, which is the most common income bracket and makes up 33.0% of all families.
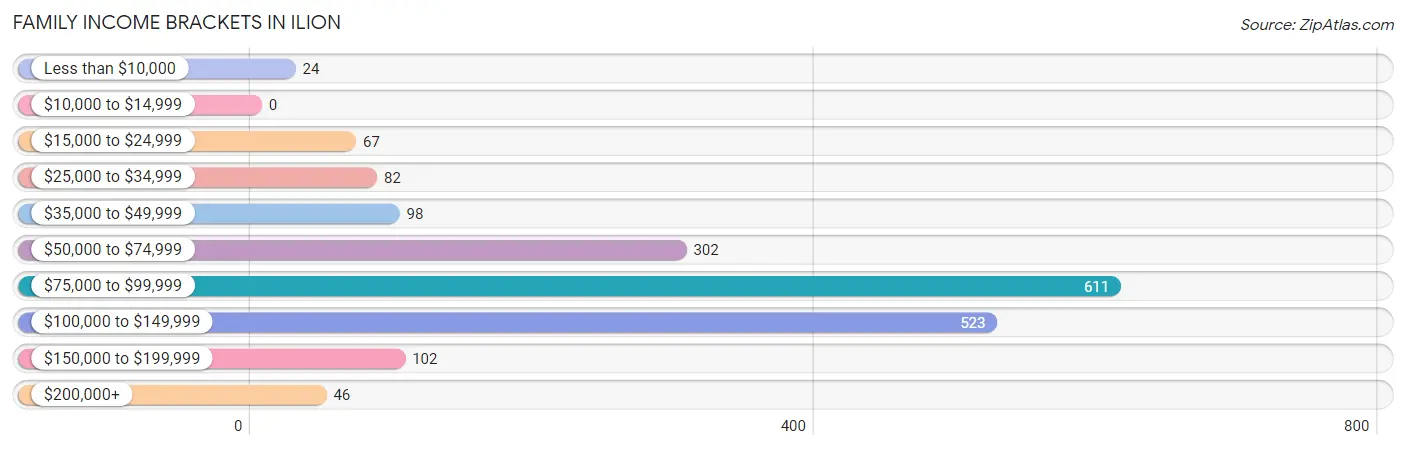
| Income Bracket | # Families | % Families |
| Less than $10,000 | 24 | 1.3% |
| $10,000 to $14,999 | 0 | 0.0% |
| $15,000 to $24,999 | 67 | 3.6% |
| $25,000 to $34,999 | 82 | 4.4% |
| $35,000 to $49,999 | 98 | 5.3% |
| $50,000 to $74,999 | 302 | 16.3% |
| $75,000 to $99,999 | 611 | 33.0% |
| $100,000 to $149,999 | 523 | 28.2% |
| $150,000 to $199,999 | 102 | 5.5% |
| $200,000+ | 46 | 2.5% |
Family Income by Famaliy Size in Ilion
5-person families (123 | 6.6%) account for the highest median family income in Ilion with $103,386 per family, while 2-person families (1,139 | 61.5%) have the highest median income of $44,320 per family member.
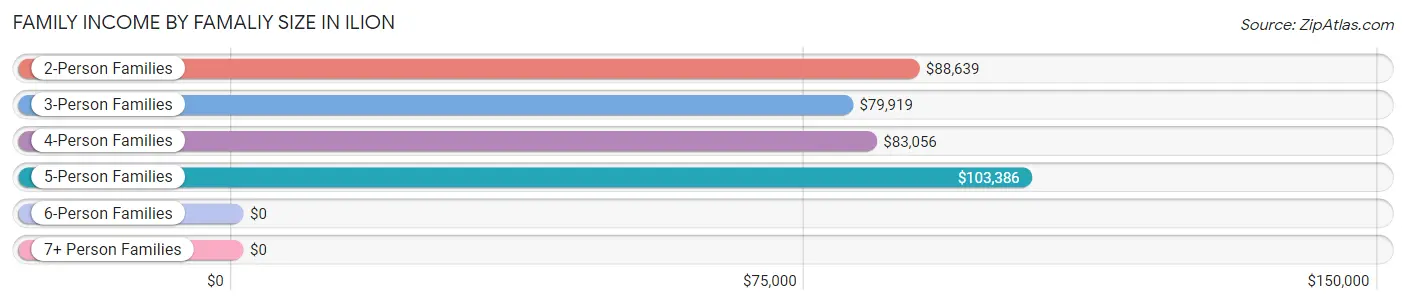
| Income Bracket | # Families | Median Income |
| 2-Person Families | 1,139 (61.5%) | $88,639 |
| 3-Person Families | 231 (12.5%) | $79,919 |
| 4-Person Families | 284 (15.3%) | $83,056 |
| 5-Person Families | 123 (6.6%) | $103,386 |
| 6-Person Families | 76 (4.1%) | $0 |
| 7+ Person Families | 0 (0.0%) | $0 |
| Total | 1,853 (100.0%) | $89,002 |
Family Income by Number of Earners in Ilion
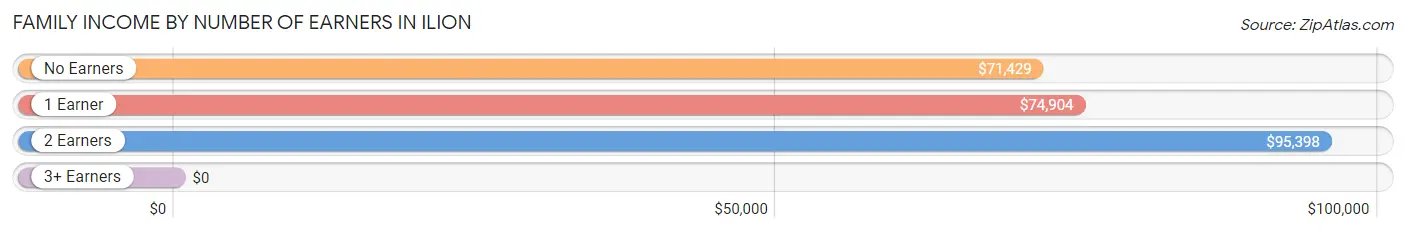
| Number of Earners | # Families | Median Income |
| No Earners | 214 (11.6%) | $71,429 |
| 1 Earner | 410 (22.1%) | $74,904 |
| 2 Earners | 1,225 (66.1%) | $95,398 |
| 3+ Earners | 4 (0.2%) | $0 |
| Total | 1,853 (100.0%) | $89,002 |
Household Income in Ilion
Household Income Brackets in Ilion
With 701 households falling in the category, the $75,000 to $99,999 income range is the most frequent in Ilion, accounting for 21.0% of all households. In contrast, only 63 households (1.9%) fall into the $200,000+ income bracket, making it the least populous group.
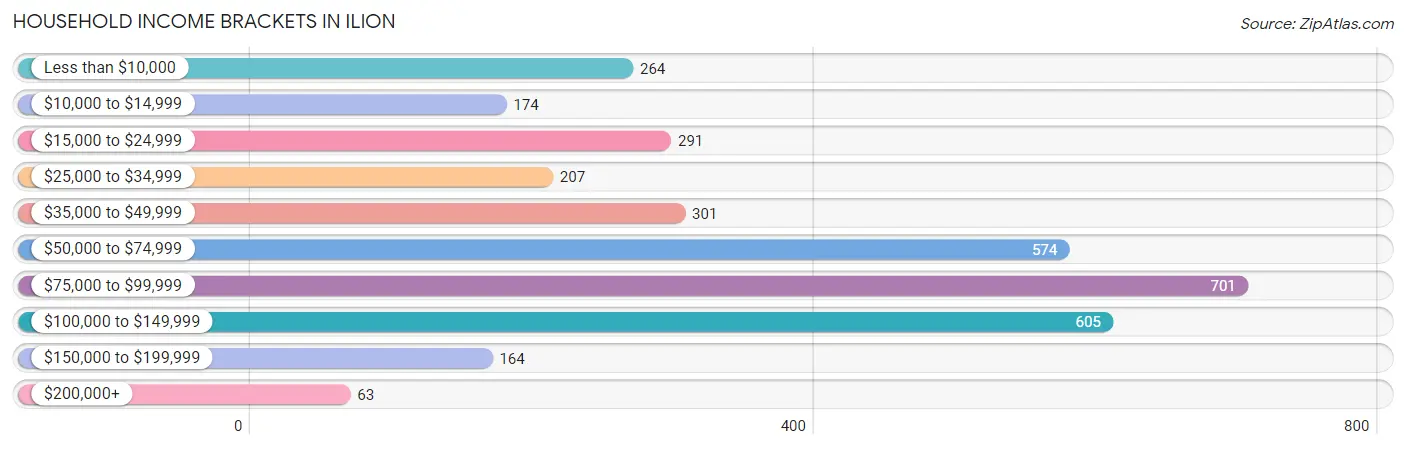
| Income Bracket | # Households | % Households |
| Less than $10,000 | 264 | 7.9% |
| $10,000 to $14,999 | 174 | 5.2% |
| $15,000 to $24,999 | 291 | 8.7% |
| $25,000 to $34,999 | 207 | 6.2% |
| $35,000 to $49,999 | 301 | 9.0% |
| $50,000 to $74,999 | 574 | 17.2% |
| $75,000 to $99,999 | 701 | 21.0% |
| $100,000 to $149,999 | 605 | 18.1% |
| $150,000 to $199,999 | 164 | 4.9% |
| $200,000+ | 63 | 1.9% |
Household Income by Householder Age in Ilion
The median household income in Ilion is $71,556, with the highest median household income of $92,076 found in the 45 to 64 years age bracket for the primary householder. A total of 1,239 households (37.1%) fall into this category. Meanwhile, the 15 to 24 years age bracket for the primary householder has the lowest median household income of $0, with 102 households (3.0%) in this group.
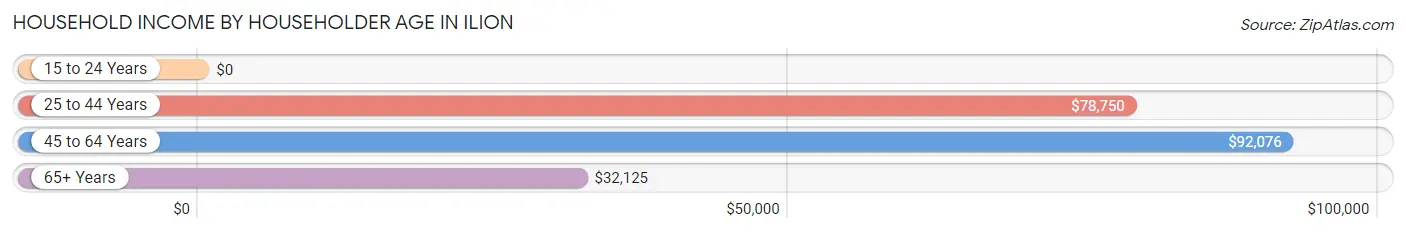
| Income Bracket | # Households | Median Income |
| 15 to 24 Years | 102 (3.0%) | $0 |
| 25 to 44 Years | 899 (26.9%) | $78,750 |
| 45 to 64 Years | 1,239 (37.1%) | $92,076 |
| 65+ Years | 1,100 (32.9%) | $32,125 |
| Total | 3,340 (100.0%) | $71,556 |
Poverty in Ilion
Income Below Poverty by Sex and Age in Ilion
With 7.0% poverty level for males and 14.0% for females among the residents of Ilion, 18 to 24 year old males and 55 to 64 year old females are the most vulnerable to poverty, with 66 males (35.3%) and 125 females (25.7%) in their respective age groups living below the poverty level.
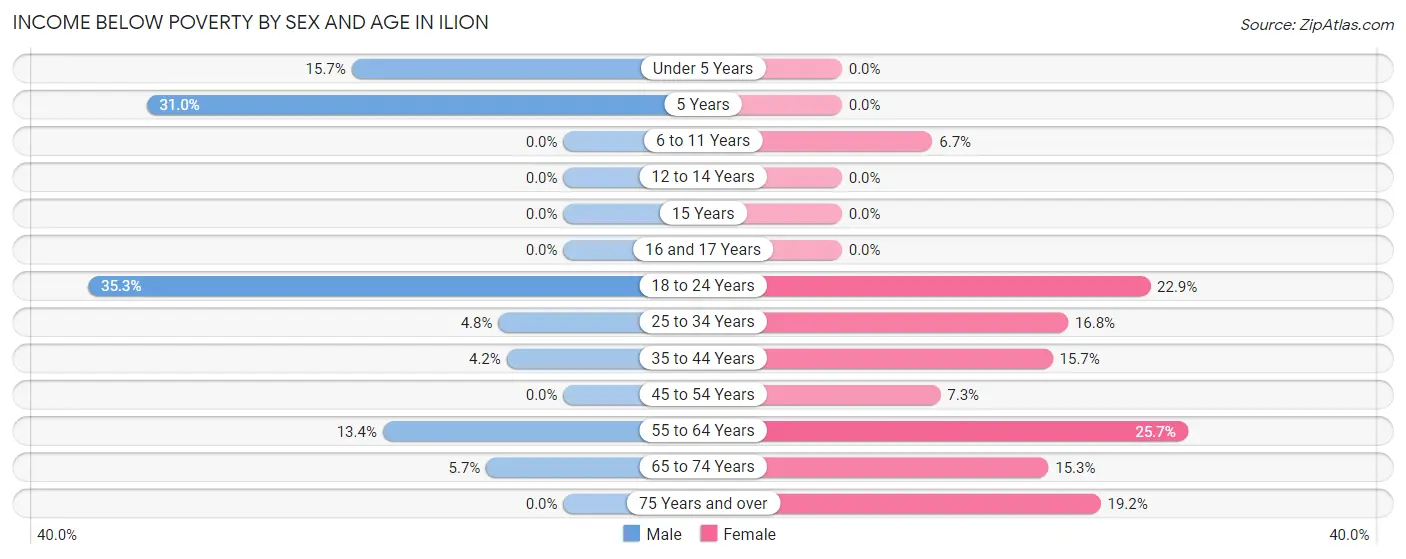
| Age Bracket | Male | Female |
| Under 5 Years | 25 (15.7%) | 0 (0.0%) |
| 5 Years | 26 (30.9%) | 0 (0.0%) |
| 6 to 11 Years | 0 (0.0%) | 24 (6.7%) |
| 12 to 14 Years | 0 (0.0%) | 0 (0.0%) |
| 15 Years | 0 (0.0%) | 0 (0.0%) |
| 16 and 17 Years | 0 (0.0%) | 0 (0.0%) |
| 18 to 24 Years | 66 (35.3%) | 38 (22.9%) |
| 25 to 34 Years | 24 (4.8%) | 114 (16.8%) |
| 35 to 44 Years | 17 (4.2%) | 41 (15.7%) |
| 45 to 54 Years | 0 (0.0%) | 39 (7.3%) |
| 55 to 64 Years | 74 (13.4%) | 125 (25.7%) |
| 65 to 74 Years | 20 (5.7%) | 71 (15.3%) |
| 75 Years and over | 0 (0.0%) | 93 (19.2%) |
| Total | 252 (7.0%) | 545 (14.0%) |
Income Above Poverty by Sex and Age in Ilion
According to the poverty statistics in Ilion, males aged 6 to 11 years and females aged under 5 years are the age groups that are most secure financially, with 100.0% of males and 100.0% of females in these age groups living above the poverty line.
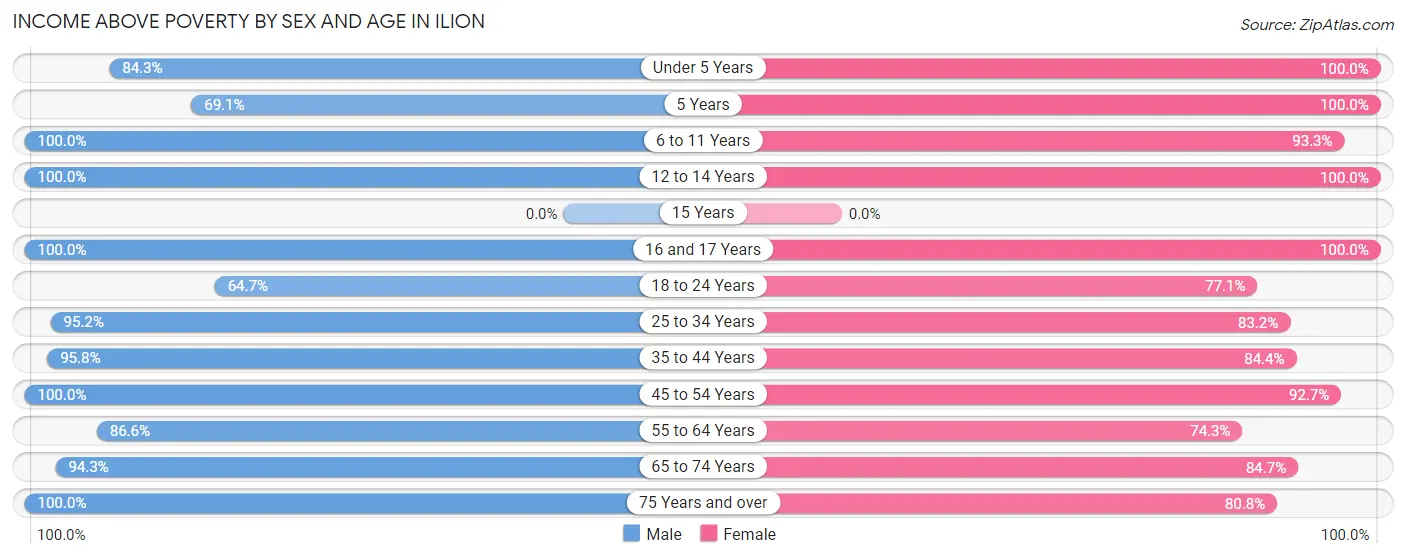
| Age Bracket | Male | Female |
| Under 5 Years | 134 (84.3%) | 103 (100.0%) |
| 5 Years | 58 (69.1%) | 61 (100.0%) |
| 6 to 11 Years | 223 (100.0%) | 333 (93.3%) |
| 12 to 14 Years | 304 (100.0%) | 217 (100.0%) |
| 15 Years | 0 (0.0%) | 0 (0.0%) |
| 16 and 17 Years | 65 (100.0%) | 92 (100.0%) |
| 18 to 24 Years | 121 (64.7%) | 128 (77.1%) |
| 25 to 34 Years | 473 (95.2%) | 565 (83.2%) |
| 35 to 44 Years | 387 (95.8%) | 221 (84.4%) |
| 45 to 54 Years | 595 (100.0%) | 494 (92.7%) |
| 55 to 64 Years | 478 (86.6%) | 362 (74.3%) |
| 65 to 74 Years | 329 (94.3%) | 392 (84.7%) |
| 75 Years and over | 179 (100.0%) | 391 (80.8%) |
| Total | 3,346 (93.0%) | 3,359 (86.0%) |
Income Below Poverty Among Married-Couple Families in Ilion
The poverty statistics for married-couple families in Ilion show that 2.6% or 42 of the total 1,583 families live below the poverty line. Families with no children have the highest poverty rate of 4.0%, comprising of 42 families. On the other hand, families with 1 or 2 children have the lowest poverty rate of 0.0%, which includes 0 families.
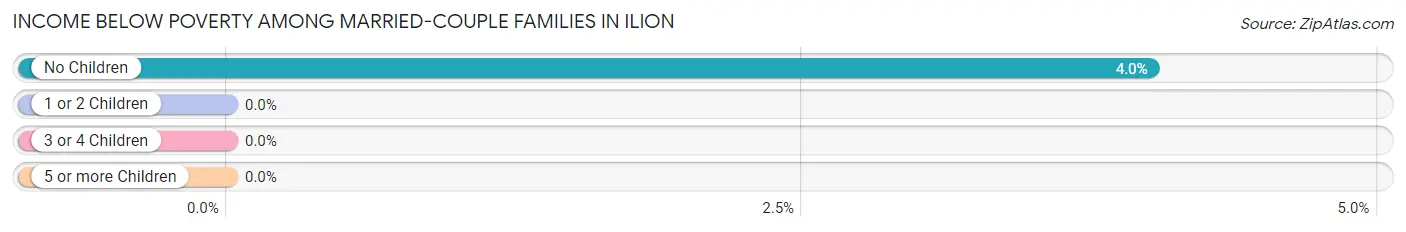
| Children | Above Poverty | Below Poverty |
| No Children | 1,005 (96.0%) | 42 (4.0%) |
| 1 or 2 Children | 345 (100.0%) | 0 (0.0%) |
| 3 or 4 Children | 191 (100.0%) | 0 (0.0%) |
| 5 or more Children | 0 (0.0%) | 0 (0.0%) |
| Total | 1,541 (97.4%) | 42 (2.6%) |
Income Below Poverty Among Single-Parent Households in Ilion
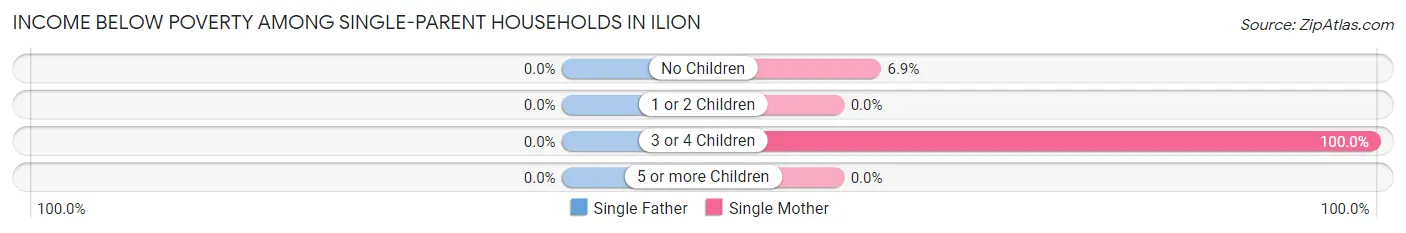
| Children | Single Father | Single Mother |
| No Children | 0 (0.0%) | 9 (6.9%) |
| 1 or 2 Children | 0 (0.0%) | 0 (0.0%) |
| 3 or 4 Children | 0 (0.0%) | 27 (100.0%) |
| 5 or more Children | 0 (0.0%) | 0 (0.0%) |
| Total | 0 (0.0%) | 36 (15.9%) |
Income Below Poverty Among Married-Couple vs Single-Parent Households in Ilion
The poverty data for Ilion shows that 42 of the married-couple family households (2.6%) and 36 of the single-parent households (13.3%) are living below the poverty level. Within the married-couple family households, those with no children have the highest poverty rate, with 42 households (4.0%) falling below the poverty line. Among the single-parent households, those with 3 or 4 children have the highest poverty rate, with 27 household (100.0%) living below poverty.
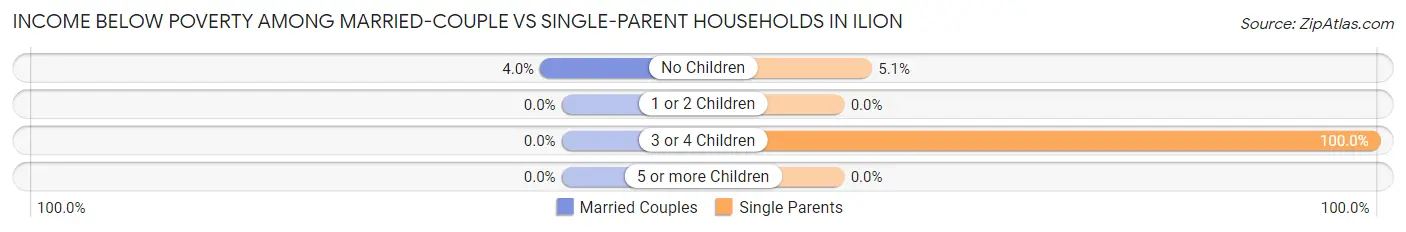
| Children | Married-Couple Families | Single-Parent Households |
| No Children | 42 (4.0%) | 9 (5.1%) |
| 1 or 2 Children | 0 (0.0%) | 0 (0.0%) |
| 3 or 4 Children | 0 (0.0%) | 27 (100.0%) |
| 5 or more Children | 0 (0.0%) | 0 (0.0%) |
| Total | 42 (2.6%) | 36 (13.3%) |
Race in Ilion
The most populous races in Ilion are White / Caucasian (7,137 | 92.6%), Two or more Races (297 | 3.9%), and Hispanic or Latino (152 | 2.0%).
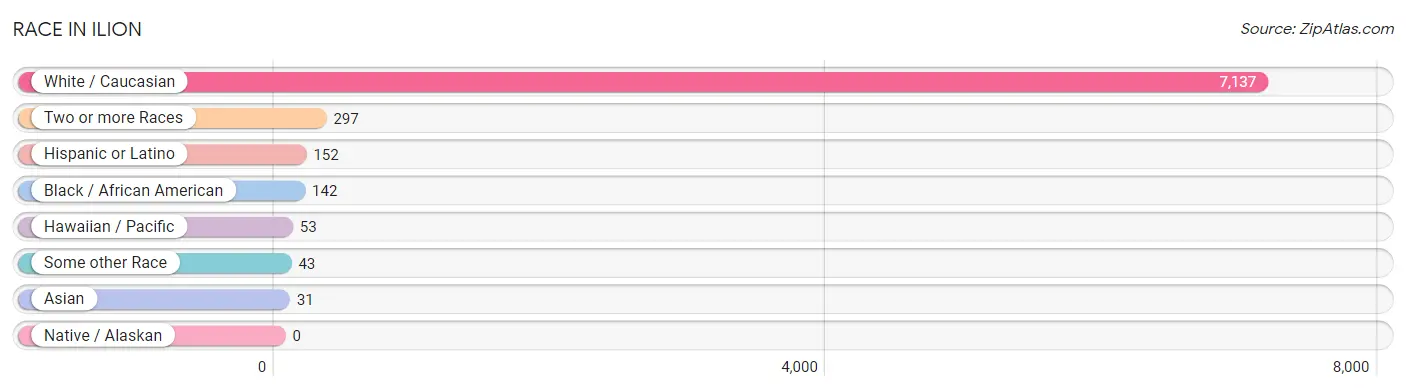
| Race | # Population | % Population |
| Asian | 31 | 0.4% |
| Black / African American | 142 | 1.8% |
| Hawaiian / Pacific | 53 | 0.7% |
| Hispanic or Latino | 152 | 2.0% |
| Native / Alaskan | 0 | 0.0% |
| White / Caucasian | 7,137 | 92.6% |
| Two or more Races | 297 | 3.9% |
| Some other Race | 43 | 0.6% |
| Total | 7,703 | 100.0% |
Ancestry in Ilion
The most populous ancestries reported in Ilion are Irish (1,819 | 23.6%), English (1,644 | 21.3%), Italian (1,318 | 17.1%), German (689 | 8.9%), and American (418 | 5.4%), together accounting for 76.4% of all Ilion residents.
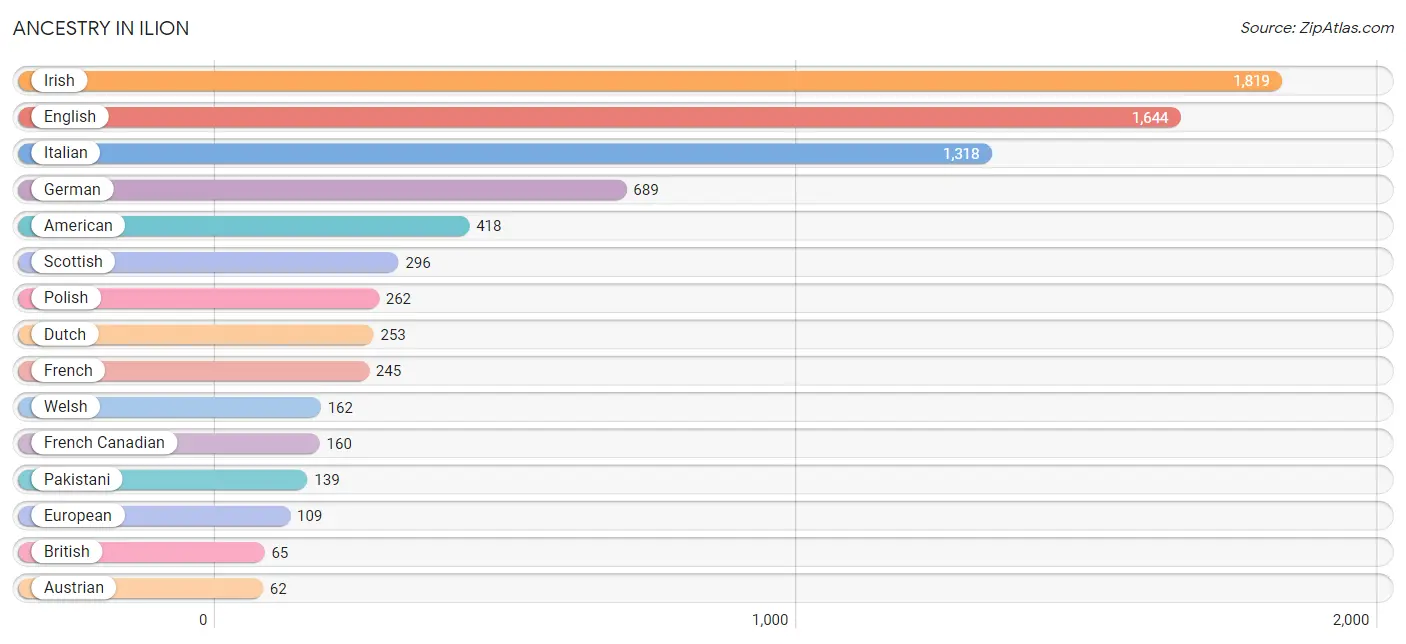
| Ancestry | # Population | % Population |
| American | 418 | 5.4% |
| Arab | 13 | 0.2% |
| Austrian | 62 | 0.8% |
| British | 65 | 0.8% |
| Bulgarian | 23 | 0.3% |
| Celtic | 16 | 0.2% |
| Cherokee | 3 | 0.0% |
| Cuban | 4 | 0.1% |
| Czech | 30 | 0.4% |
| Danish | 14 | 0.2% |
| Dutch | 253 | 3.3% |
| English | 1,644 | 21.3% |
| European | 109 | 1.4% |
| French | 245 | 3.2% |
| French Canadian | 160 | 2.1% |
| German | 689 | 8.9% |
| Greek | 38 | 0.5% |
| Hungarian | 35 | 0.4% |
| Indian (Asian) | 7 | 0.1% |
| Irish | 1,819 | 23.6% |
| Iroquois | 15 | 0.2% |
| Italian | 1,318 | 17.1% |
| Korean | 24 | 0.3% |
| Latvian | 29 | 0.4% |
| Lebanese | 13 | 0.2% |
| Lithuanian | 21 | 0.3% |
| Mexican | 60 | 0.8% |
| Northern European | 39 | 0.5% |
| Norwegian | 59 | 0.8% |
| Pakistani | 139 | 1.8% |
| Polish | 262 | 3.4% |
| Scandinavian | 10 | 0.1% |
| Scotch-Irish | 25 | 0.3% |
| Scottish | 296 | 3.8% |
| South American | 16 | 0.2% |
| Swedish | 11 | 0.1% |
| Trinidadian and Tobagonian | 25 | 0.3% |
| Ukrainian | 39 | 0.5% |
| Venezuelan | 16 | 0.2% |
| Welsh | 162 | 2.1% | View All 40 Rows |
Immigrants in Ilion
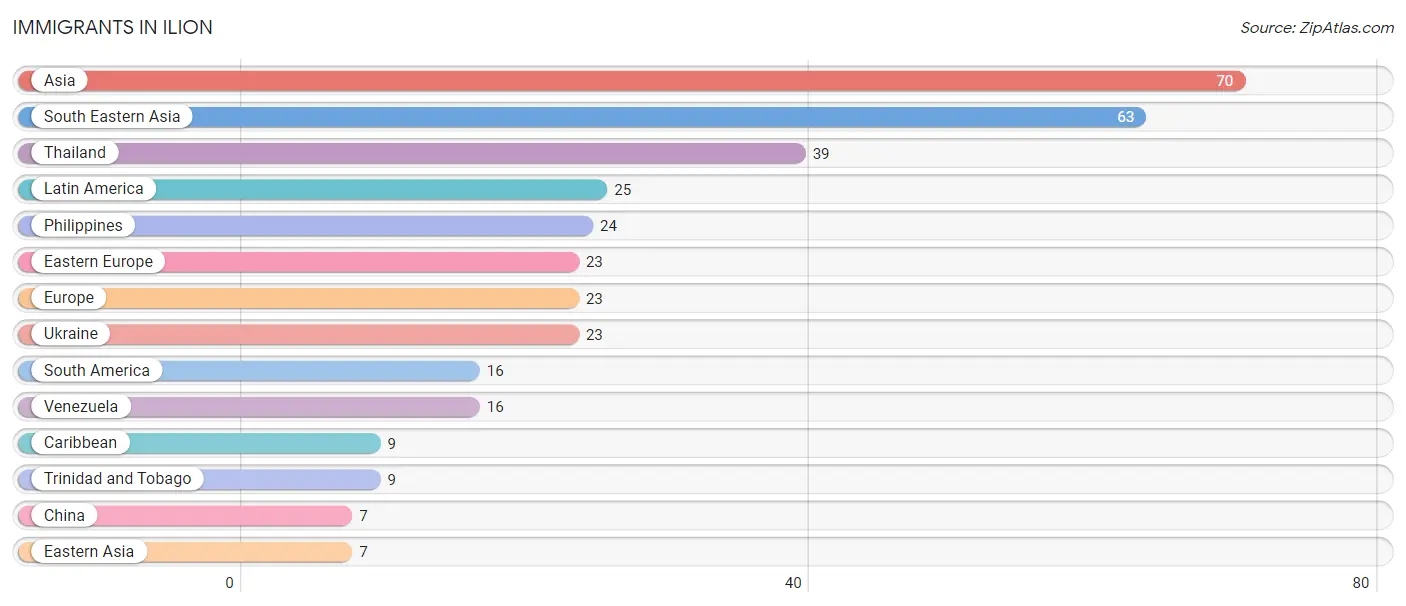
The most numerous immigrant groups reported in Ilion came from Asia (70 | 0.9%), South Eastern Asia (63 | 0.8%), Thailand (39 | 0.5%), Latin America (25 | 0.3%), and Philippines (24 | 0.3%), together accounting for 2.9% of all Ilion residents.
| Immigration Origin | # Population | % Population |
| Asia | 70 | 0.9% |
| Caribbean | 9 | 0.1% |
| China | 7 | 0.1% |
| Eastern Asia | 7 | 0.1% |
| Eastern Europe | 23 | 0.3% |
| Europe | 23 | 0.3% |
| Latin America | 25 | 0.3% |
| Philippines | 24 | 0.3% |
| South America | 16 | 0.2% |
| South Eastern Asia | 63 | 0.8% |
| Thailand | 39 | 0.5% |
| Trinidad and Tobago | 9 | 0.1% |
| Ukraine | 23 | 0.3% |
| Venezuela | 16 | 0.2% | View All 14 Rows |
Sex and Age in Ilion
Sex and Age in Ilion
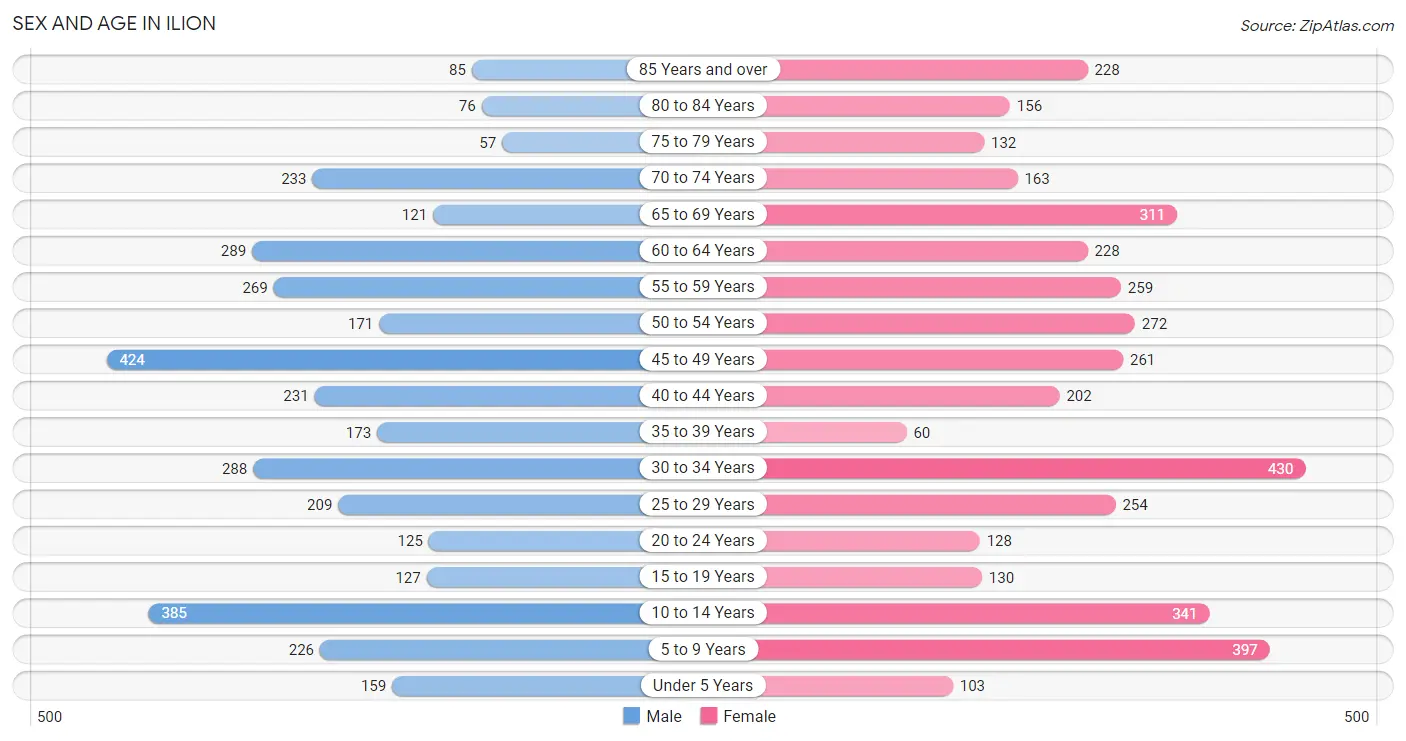
The most populous age groups in Ilion are 45 to 49 Years (424 | 11.6%) for men and 30 to 34 Years (430 | 10.6%) for women.
| Age Bracket | Male | Female |
| Under 5 Years | 159 (4.4%) | 103 (2.5%) |
| 5 to 9 Years | 226 (6.2%) | 397 (9.8%) |
| 10 to 14 Years | 385 (10.5%) | 341 (8.4%) |
| 15 to 19 Years | 127 (3.5%) | 130 (3.2%) |
| 20 to 24 Years | 125 (3.4%) | 128 (3.2%) |
| 25 to 29 Years | 209 (5.7%) | 254 (6.3%) |
| 30 to 34 Years | 288 (7.9%) | 430 (10.6%) |
| 35 to 39 Years | 173 (4.7%) | 60 (1.5%) |
| 40 to 44 Years | 231 (6.3%) | 202 (5.0%) |
| 45 to 49 Years | 424 (11.6%) | 261 (6.4%) |
| 50 to 54 Years | 171 (4.7%) | 272 (6.7%) |
| 55 to 59 Years | 269 (7.4%) | 259 (6.4%) |
| 60 to 64 Years | 289 (7.9%) | 228 (5.6%) |
| 65 to 69 Years | 121 (3.3%) | 311 (7.7%) |
| 70 to 74 Years | 233 (6.4%) | 163 (4.0%) |
| 75 to 79 Years | 57 (1.6%) | 132 (3.3%) |
| 80 to 84 Years | 76 (2.1%) | 156 (3.8%) |
| 85 Years and over | 85 (2.3%) | 228 (5.6%) |
| Total | 3,648 (100.0%) | 4,055 (100.0%) |
Families and Households in Ilion
Median Family Size in Ilion
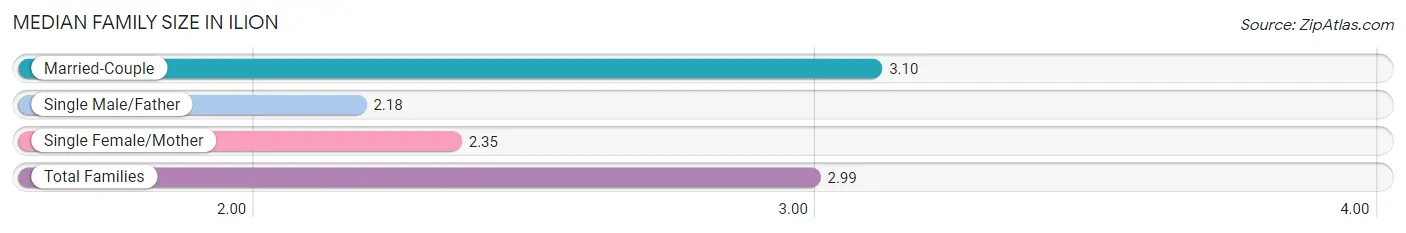
The median family size in Ilion is 2.99 persons per family, with married-couple families (1,583 | 85.4%) accounting for the largest median family size of 3.1 persons per family. On the other hand, single male/father families (44 | 2.4%) represent the smallest median family size with 2.18 persons per family.
| Family Type | # Families | Family Size |
| Married-Couple | 1,583 (85.4%) | 3.10 |
| Single Male/Father | 44 (2.4%) | 2.18 |
| Single Female/Mother | 226 (12.2%) | 2.35 |
| Total Families | 1,853 (100.0%) | 2.99 |
Median Household Size in Ilion
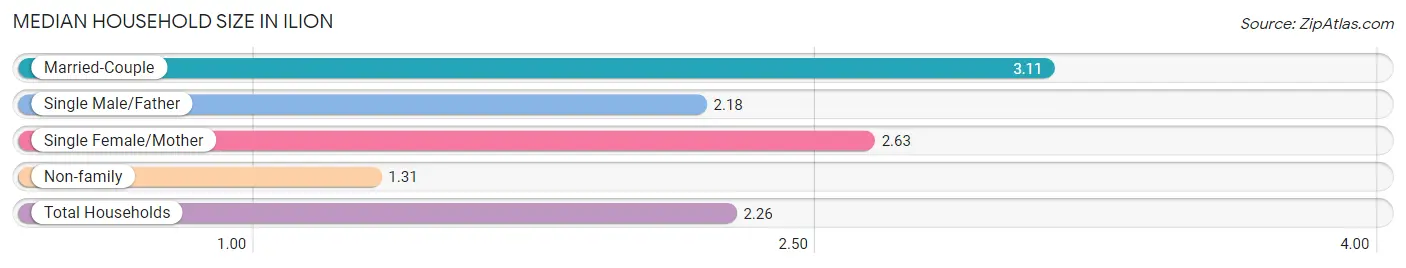
The median household size in Ilion is 2.26 persons per household, with married-couple households (1,583 | 47.4%) accounting for the largest median household size of 3.11 persons per household. non-family households (1,487 | 44.5%) represent the smallest median household size with 1.31 persons per household.
| Household Type | # Households | Household Size |
| Married-Couple | 1,583 (47.4%) | 3.11 |
| Single Male/Father | 44 (1.3%) | 2.18 |
| Single Female/Mother | 226 (6.8%) | 2.63 |
| Non-family | 1,487 (44.5%) | 1.31 |
| Total Households | 3,340 (100.0%) | 2.26 |
Household Size by Marriage Status in Ilion
Out of a total of 3,340 households in Ilion, 1,853 (55.5%) are family households, while 1,487 (44.5%) are nonfamily households. The most numerous type of family households are 2-person households, comprising 1,139, and the most common type of nonfamily households are 1-person households, comprising 1,206.
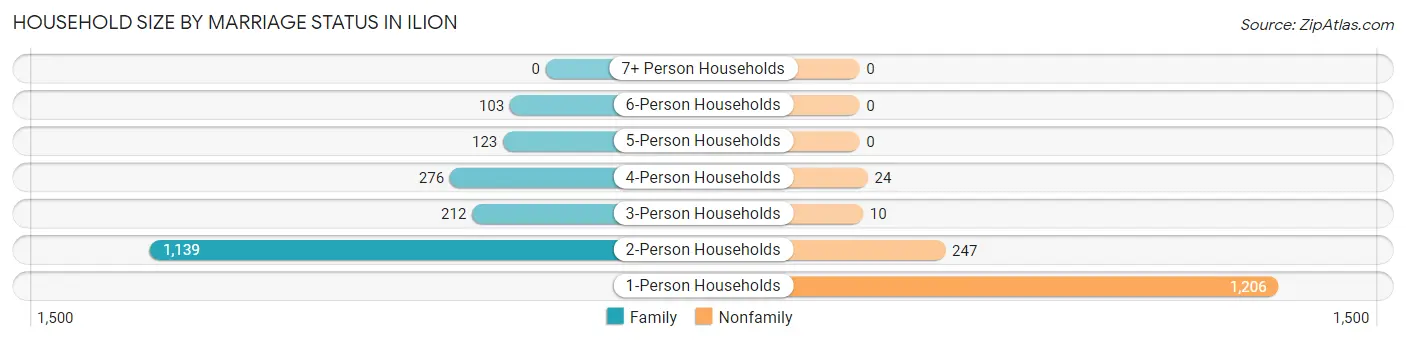
| Household Size | Family Households | Nonfamily Households |
| 1-Person Households | - | 1,206 (36.1%) |
| 2-Person Households | 1,139 (34.1%) | 247 (7.4%) |
| 3-Person Households | 212 (6.4%) | 10 (0.3%) |
| 4-Person Households | 276 (8.3%) | 24 (0.7%) |
| 5-Person Households | 123 (3.7%) | 0 (0.0%) |
| 6-Person Households | 103 (3.1%) | 0 (0.0%) |
| 7+ Person Households | 0 (0.0%) | 0 (0.0%) |
| Total | 1,853 (55.5%) | 1,487 (44.5%) |
Female Fertility in Ilion
Fertility by Age in Ilion
Average fertility rate in Ilion is 107.0 births per 1,000 women. Women in the age bracket of 20 to 34 years have the highest fertility rate with 133.0 births per 1,000 women. Women in the age bracket of 20 to 34 years acount for 67.5% of all women with births.
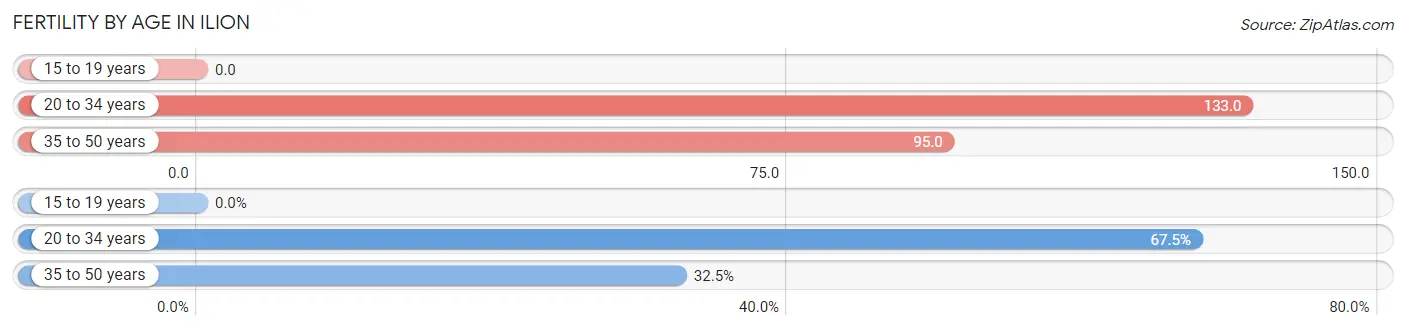
| Age Bracket | Women with Births | Births / 1,000 Women |
| 15 to 19 years | 0 (0.0%) | 0.0 |
| 20 to 34 years | 108 (67.5%) | 133.0 |
| 35 to 50 years | 52 (32.5%) | 95.0 |
| Total | 160 (100.0%) | 107.0 |
Fertility by Age by Marriage Status in Ilion
50.6% of women with births (160) in Ilion are married. The highest percentage of unmarried women with births falls into 35 to 50 years age bracket with 100.0% of them unmarried at the time of birth, while the lowest percentage of unmarried women with births belong to 20 to 34 years age bracket with 25.0% of them unmarried.
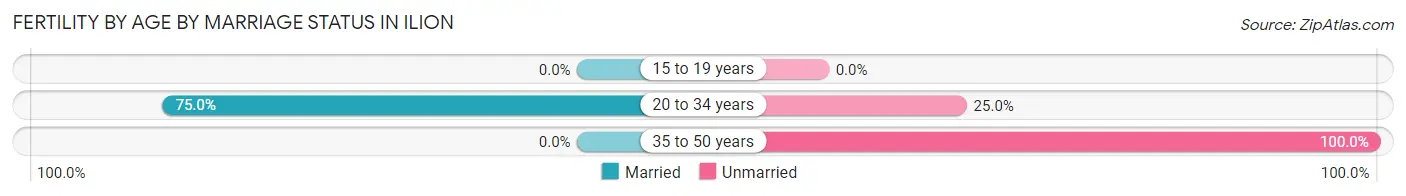
| Age Bracket | Married | Unmarried |
| 15 to 19 years | 0 (0.0%) | 0 (0.0%) |
| 20 to 34 years | 81 (75.0%) | 27 (25.0%) |
| 35 to 50 years | 0 (0.0%) | 52 (100.0%) |
| Total | 81 (50.6%) | 79 (49.4%) |
Fertility by Education in Ilion
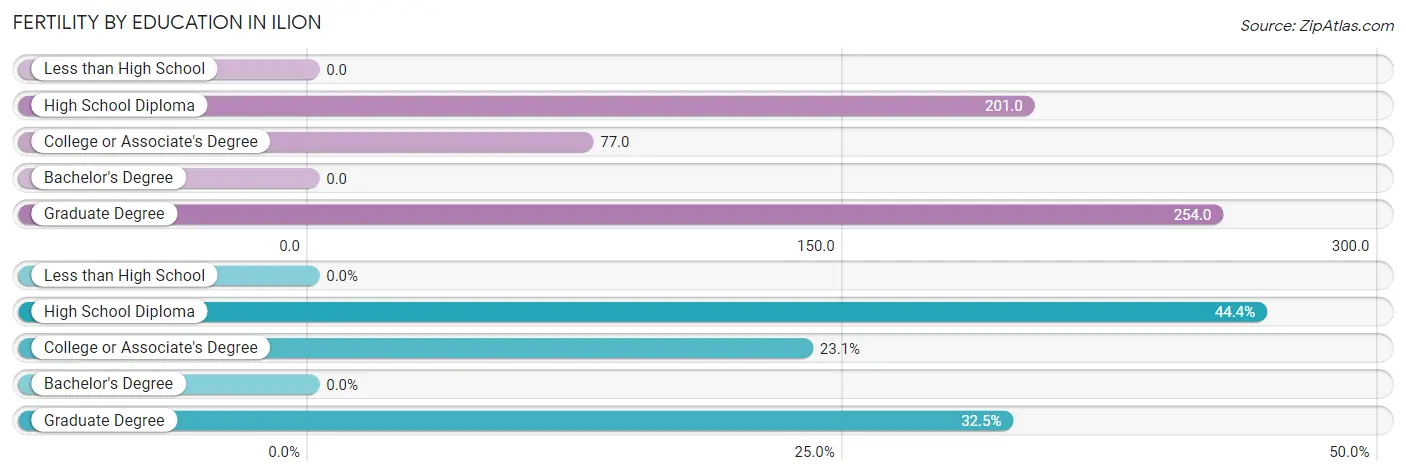
| Educational Attainment | Women with Births | Births / 1,000 Women |
| Less than High School | 0 (0.0%) | 0.0 |
| High School Diploma | 71 (44.4%) | 201.0 |
| College or Associate's Degree | 37 (23.1%) | 77.0 |
| Bachelor's Degree | 0 (0.0%) | 0.0 |
| Graduate Degree | 52 (32.5%) | 254.0 |
| Total | 160 (100.0%) | 107.0 |
Fertility by Education by Marriage Status in Ilion
49.4% of women with births in Ilion are unmarried. Women with the educational attainment of college or associate's degree are most likely to be married with 100.0% of them married at childbirth, while women with the educational attainment of graduate degree are least likely to be married with 100.0% of them unmarried at childbirth.
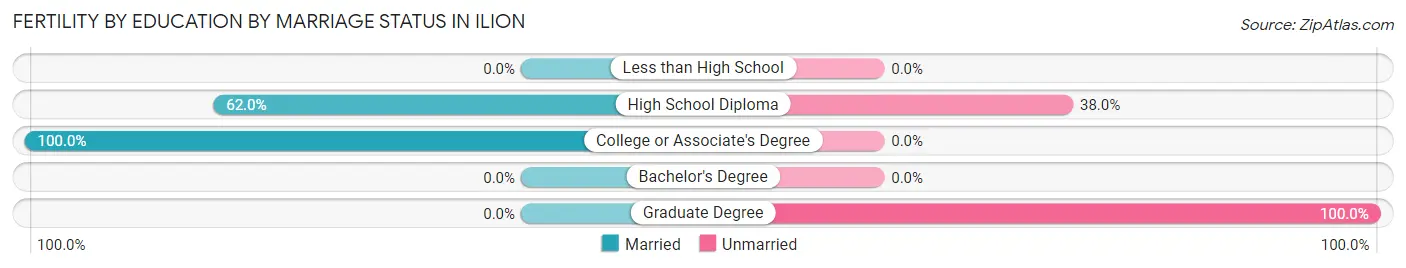
| Educational Attainment | Married | Unmarried |
| Less than High School | 0 (0.0%) | 0 (0.0%) |
| High School Diploma | 44 (62.0%) | 27 (38.0%) |
| College or Associate's Degree | 37 (100.0%) | 0 (0.0%) |
| Bachelor's Degree | 0 (0.0%) | 0 (0.0%) |
| Graduate Degree | 0 (0.0%) | 52 (100.0%) |
| Total | 81 (50.6%) | 79 (49.4%) |
Employment Characteristics in Ilion
Employment by Class of Employer in Ilion
Among the 3,398 employed individuals in Ilion, private company employees (2,087 | 61.4%), not-for-profit organizations (486 | 14.3%), and local government employees (459 | 13.5%) make up the most common classes of employment.
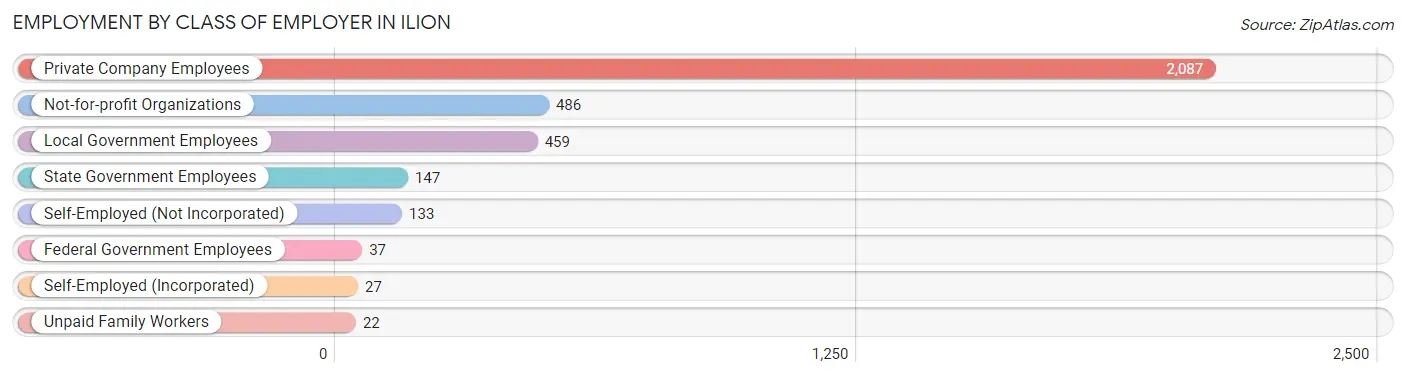
| Employer Class | # Employees | % Employees |
| Private Company Employees | 2,087 | 61.4% |
| Self-Employed (Incorporated) | 27 | 0.8% |
| Self-Employed (Not Incorporated) | 133 | 3.9% |
| Not-for-profit Organizations | 486 | 14.3% |
| Local Government Employees | 459 | 13.5% |
| State Government Employees | 147 | 4.3% |
| Federal Government Employees | 37 | 1.1% |
| Unpaid Family Workers | 22 | 0.6% |
| Total | 3,398 | 100.0% |
Employment Status by Age in Ilion
According to the labor force statistics for Ilion, out of the total population over 16 years of age (6,092), 59.8% or 3,643 individuals are in the labor force, with 4.1% or 149 of them unemployed. The age group with the highest labor force participation rate is 45 to 54 years, with 87.2% or 984 individuals in the labor force. Within the labor force, the 60 to 64 years age range has the highest percentage of unemployed individuals, with 14.1% or 47 of them being unemployed.
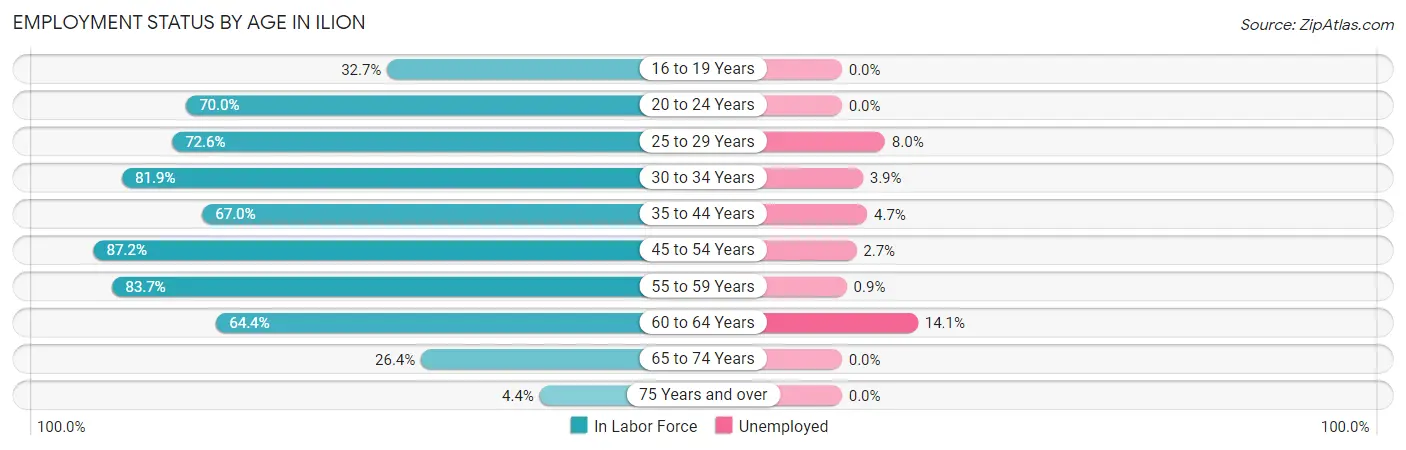
| Age Bracket | In Labor Force | Unemployed |
| 16 to 19 Years | 84 (32.7%) | 0 (0.0%) |
| 20 to 24 Years | 177 (70.0%) | 0 (0.0%) |
| 25 to 29 Years | 336 (72.6%) | 27 (8.0%) |
| 30 to 34 Years | 588 (81.9%) | 23 (3.9%) |
| 35 to 44 Years | 446 (67.0%) | 21 (4.7%) |
| 45 to 54 Years | 984 (87.2%) | 27 (2.7%) |
| 55 to 59 Years | 442 (83.7%) | 4 (0.9%) |
| 60 to 64 Years | 333 (64.4%) | 47 (14.1%) |
| 65 to 74 Years | 219 (26.4%) | 0 (0.0%) |
| 75 Years and over | 32 (4.4%) | 0 (0.0%) |
| Total | 3,643 (59.8%) | 149 (4.1%) |
Employment Status by Educational Attainment in Ilion
According to labor force statistics for Ilion, 77.8% of individuals (3,128) out of the total population between 25 and 64 years of age (4,020) are in the labor force, with 4.8% or 150 of them being unemployed. The group with the highest labor force participation rate are those with the educational attainment of bachelor's degree or higher, with 89.3% or 988 individuals in the labor force. Within the labor force, individuals with high school diploma education have the highest percentage of unemployment, with 11.4% or 99 of them being unemployed.
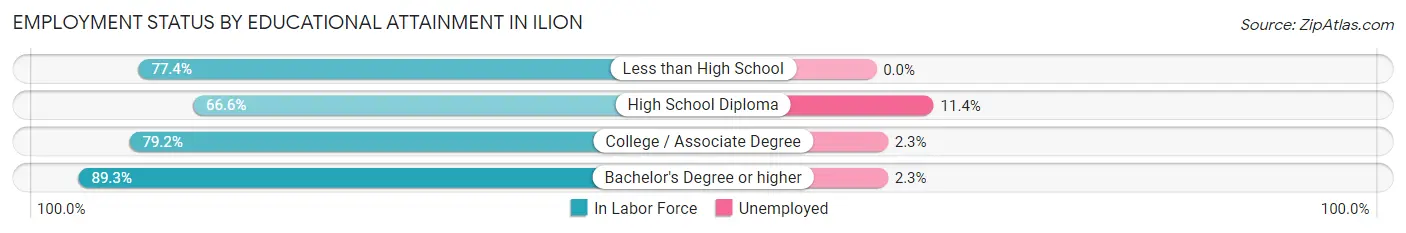
| Educational Attainment | In Labor Force | Unemployed |
| Less than High School | 103 (77.4%) | 0 (0.0%) |
| High School Diploma | 868 (66.6%) | 149 (11.4%) |
| College / Associate Degree | 1,170 (79.2%) | 34 (2.3%) |
| Bachelor's Degree or higher | 988 (89.3%) | 25 (2.3%) |
| Total | 3,128 (77.8%) | 193 (4.8%) |
Employment Occupations by Sex in Ilion
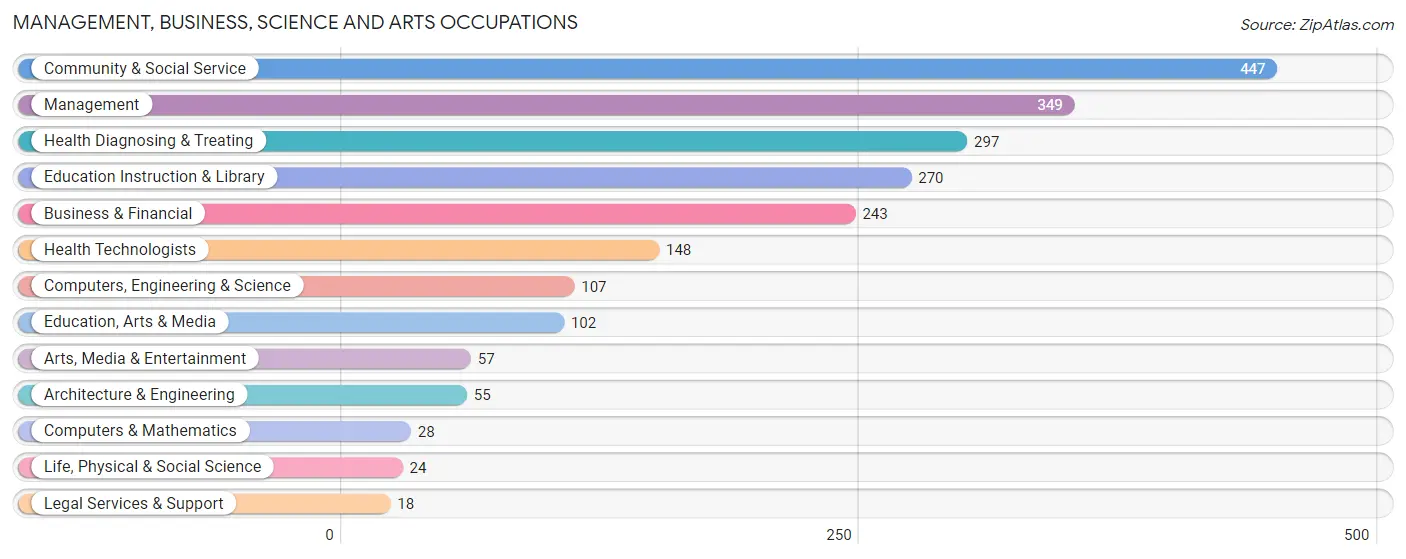
Management, Business, Science and Arts Occupations
The most common Management, Business, Science and Arts occupations in Ilion are Community & Social Service (447 | 12.8%), Management (349 | 10.0%), Health Diagnosing & Treating (297 | 8.5%), Education Instruction & Library (270 | 7.7%), and Business & Financial (243 | 7.0%).
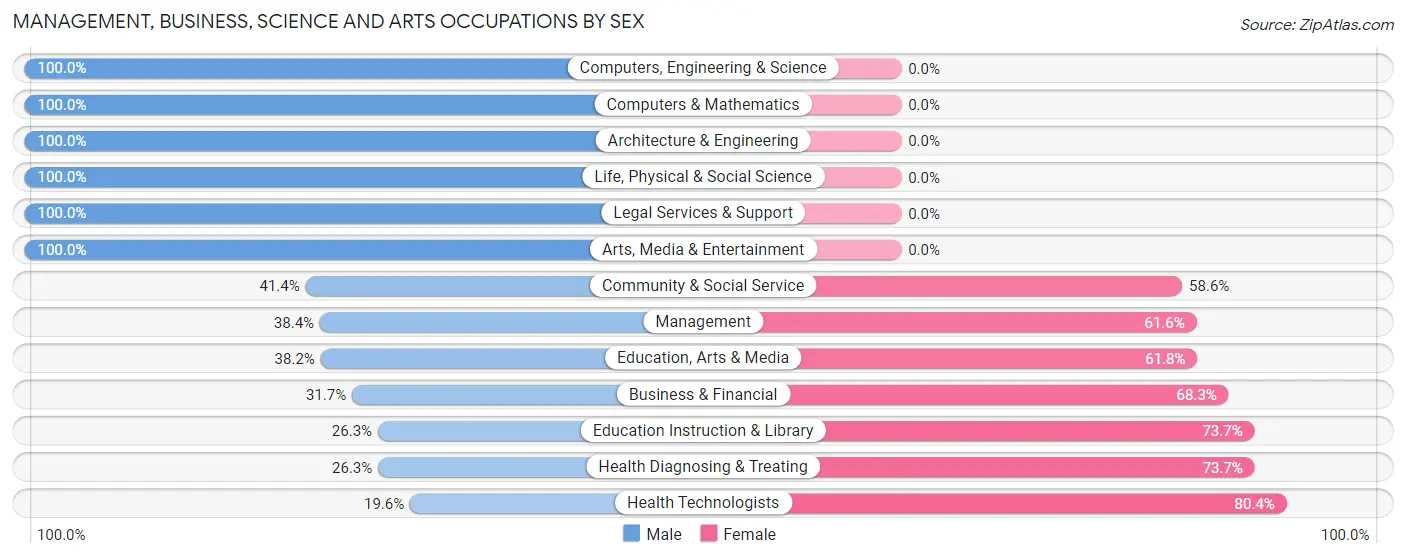
Management, Business, Science and Arts Occupations by Sex
Within the Management, Business, Science and Arts occupations in Ilion, the most male-oriented occupations are Computers, Engineering & Science (100.0%), Computers & Mathematics (100.0%), and Architecture & Engineering (100.0%), while the most female-oriented occupations are Health Technologists (80.4%), Health Diagnosing & Treating (73.7%), and Education Instruction & Library (73.7%).
| Occupation | Male | Female |
| Management | 134 (38.4%) | 215 (61.6%) |
| Business & Financial | 77 (31.7%) | 166 (68.3%) |
| Computers, Engineering & Science | 107 (100.0%) | 0 (0.0%) |
| Computers & Mathematics | 28 (100.0%) | 0 (0.0%) |
| Architecture & Engineering | 55 (100.0%) | 0 (0.0%) |
| Life, Physical & Social Science | 24 (100.0%) | 0 (0.0%) |
| Community & Social Service | 185 (41.4%) | 262 (58.6%) |
| Education, Arts & Media | 39 (38.2%) | 63 (61.8%) |
| Legal Services & Support | 18 (100.0%) | 0 (0.0%) |
| Education Instruction & Library | 71 (26.3%) | 199 (73.7%) |
| Arts, Media & Entertainment | 57 (100.0%) | 0 (0.0%) |
| Health Diagnosing & Treating | 78 (26.3%) | 219 (73.7%) |
| Health Technologists | 29 (19.6%) | 119 (80.4%) |
| Total (Category) | 581 (40.3%) | 862 (59.7%) |
| Total (Overall) | 1,908 (54.6%) | 1,584 (45.4%) |
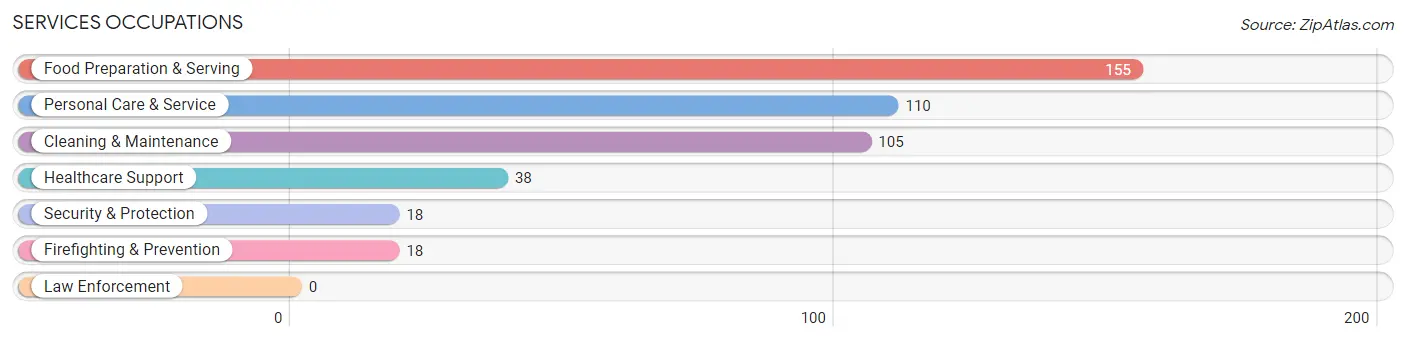
Services Occupations
The most common Services occupations in Ilion are Food Preparation & Serving (155 | 4.4%), Personal Care & Service (110 | 3.2%), Cleaning & Maintenance (105 | 3.0%), Healthcare Support (38 | 1.1%), and Security & Protection (18 | 0.5%).
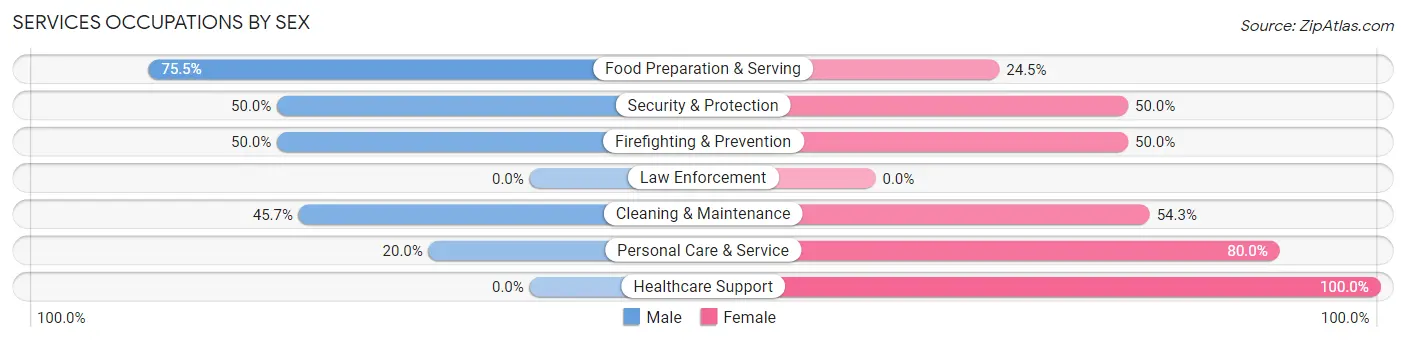
Services Occupations by Sex
Within the Services occupations in Ilion, the most male-oriented occupations are Food Preparation & Serving (75.5%), Security & Protection (50.0%), and Firefighting & Prevention (50.0%), while the most female-oriented occupations are Healthcare Support (100.0%), Personal Care & Service (80.0%), and Cleaning & Maintenance (54.3%).
| Occupation | Male | Female |
| Healthcare Support | 0 (0.0%) | 38 (100.0%) |
| Security & Protection | 9 (50.0%) | 9 (50.0%) |
| Firefighting & Prevention | 9 (50.0%) | 9 (50.0%) |
| Law Enforcement | 0 (0.0%) | 0 (0.0%) |
| Food Preparation & Serving | 117 (75.5%) | 38 (24.5%) |
| Cleaning & Maintenance | 48 (45.7%) | 57 (54.3%) |
| Personal Care & Service | 22 (20.0%) | 88 (80.0%) |
| Total (Category) | 196 (46.0%) | 230 (54.0%) |
| Total (Overall) | 1,908 (54.6%) | 1,584 (45.4%) |
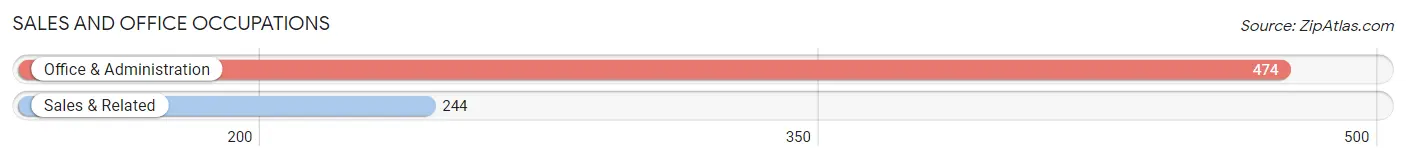
Sales and Office Occupations
The most common Sales and Office occupations in Ilion are Office & Administration (474 | 13.6%), and Sales & Related (244 | 7.0%).
Sales and Office Occupations by Sex
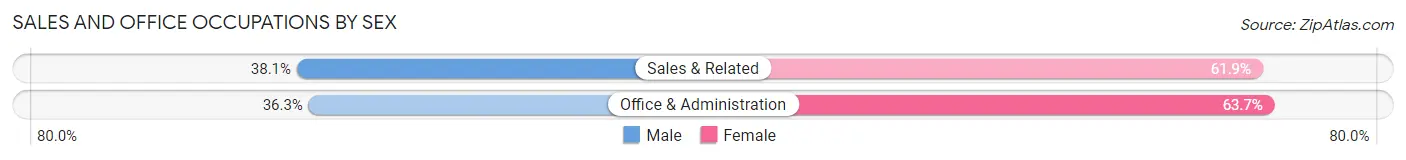
| Occupation | Male | Female |
| Sales & Related | 93 (38.1%) | 151 (61.9%) |
| Office & Administration | 172 (36.3%) | 302 (63.7%) |
| Total (Category) | 265 (36.9%) | 453 (63.1%) |
| Total (Overall) | 1,908 (54.6%) | 1,584 (45.4%) |
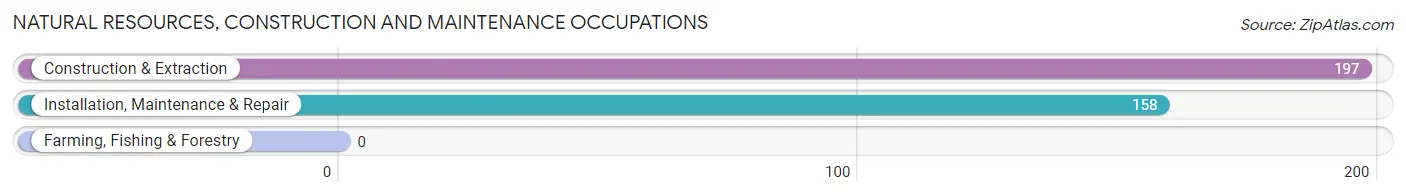
Natural Resources, Construction and Maintenance Occupations
The most common Natural Resources, Construction and Maintenance occupations in Ilion are Construction & Extraction (197 | 5.6%), and Installation, Maintenance & Repair (158 | 4.5%).
Natural Resources, Construction and Maintenance Occupations by Sex
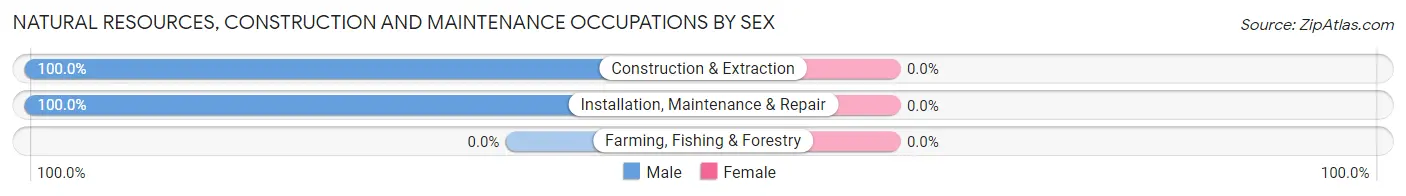
| Occupation | Male | Female |
| Farming, Fishing & Forestry | 0 (0.0%) | 0 (0.0%) |
| Construction & Extraction | 197 (100.0%) | 0 (0.0%) |
| Installation, Maintenance & Repair | 158 (100.0%) | 0 (0.0%) |
| Total (Category) | 355 (100.0%) | 0 (0.0%) |
| Total (Overall) | 1,908 (54.6%) | 1,584 (45.4%) |
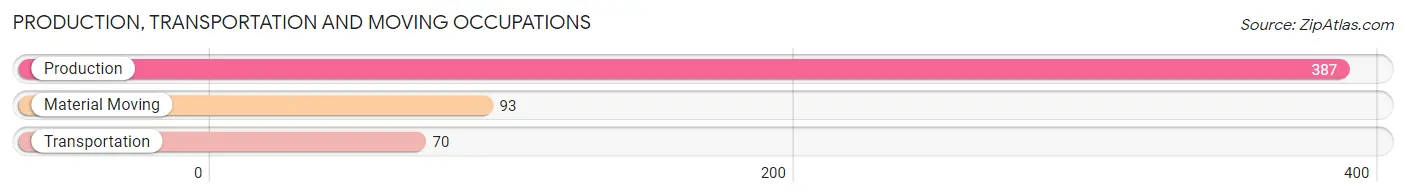
Production, Transportation and Moving Occupations
The most common Production, Transportation and Moving occupations in Ilion are Production (387 | 11.1%), Material Moving (93 | 2.7%), and Transportation (70 | 2.0%).
Production, Transportation and Moving Occupations by Sex
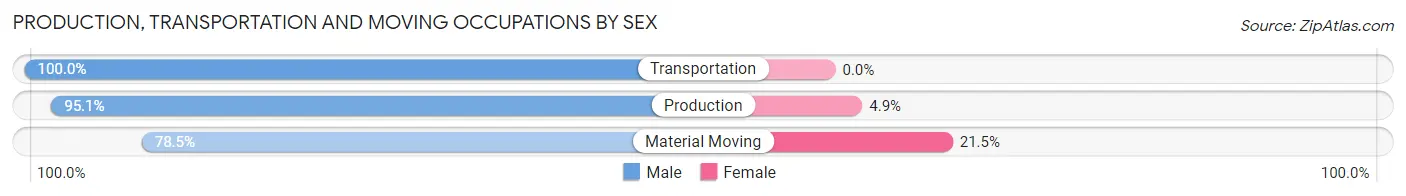
| Occupation | Male | Female |
| Production | 368 (95.1%) | 19 (4.9%) |
| Transportation | 70 (100.0%) | 0 (0.0%) |
| Material Moving | 73 (78.5%) | 20 (21.5%) |
| Total (Category) | 511 (92.9%) | 39 (7.1%) |
| Total (Overall) | 1,908 (54.6%) | 1,584 (45.4%) |
Employment Industries by Sex in Ilion
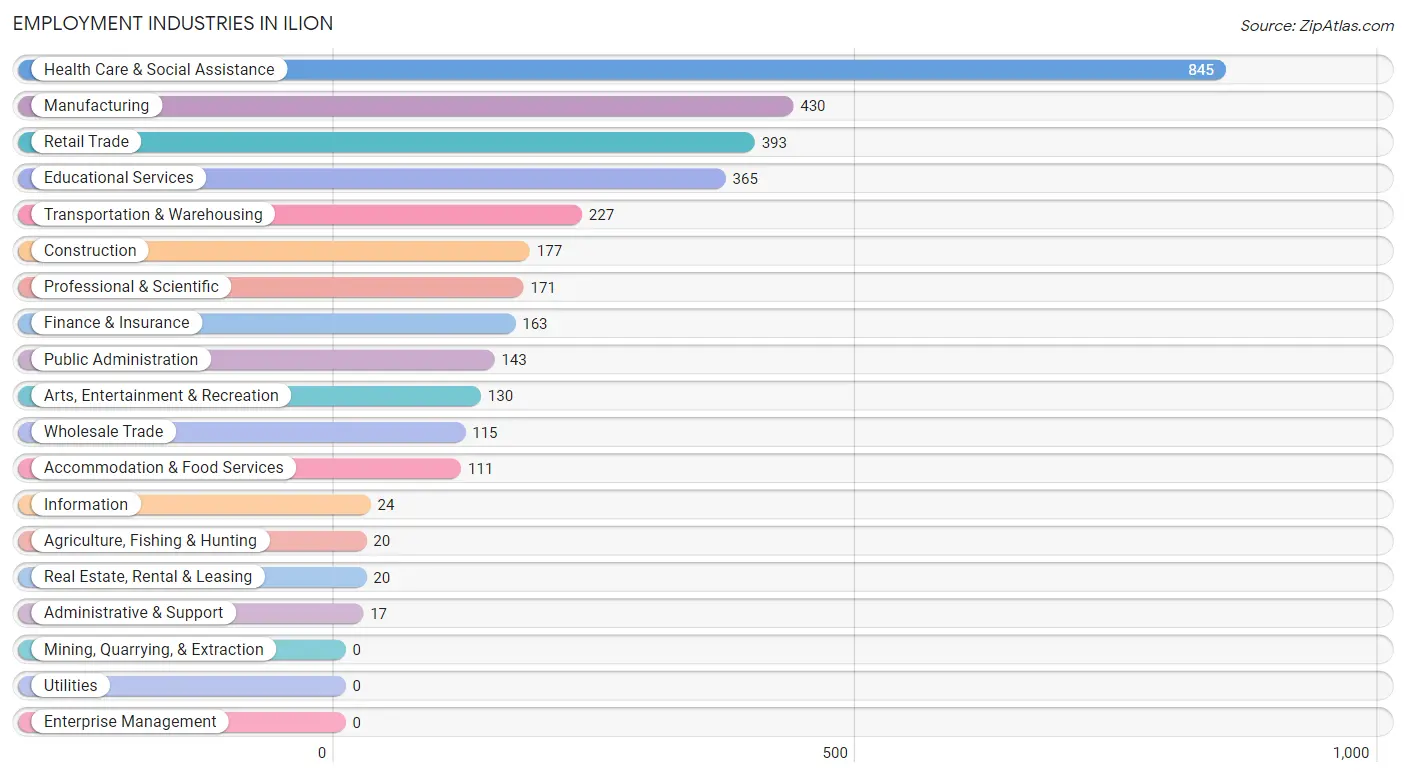
Employment Industries in Ilion
The major employment industries in Ilion include Health Care & Social Assistance (845 | 24.2%), Manufacturing (430 | 12.3%), Retail Trade (393 | 11.3%), Educational Services (365 | 10.4%), and Transportation & Warehousing (227 | 6.5%).
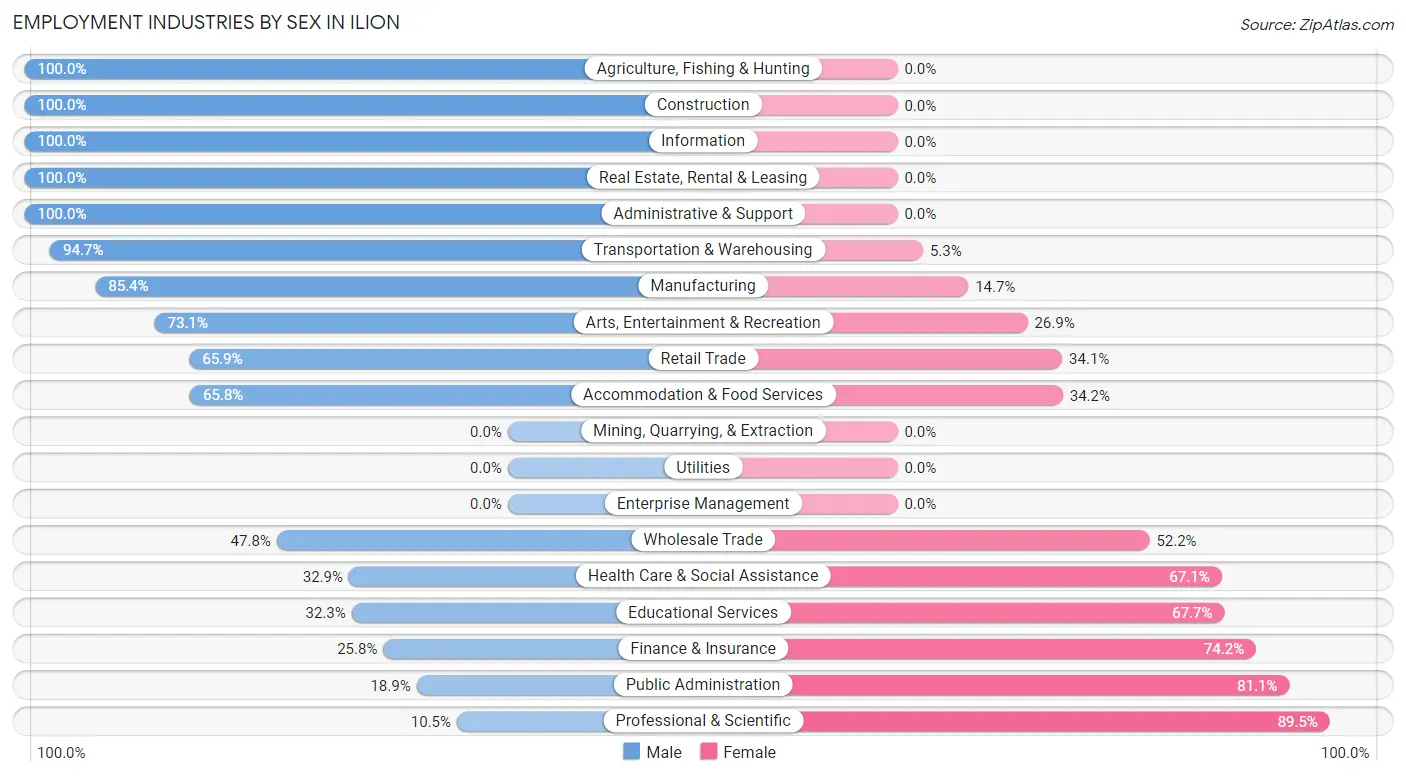
Employment Industries by Sex in Ilion
The Ilion industries that see more men than women are Agriculture, Fishing & Hunting (100.0%), Construction (100.0%), and Information (100.0%), whereas the industries that tend to have a higher number of women are Professional & Scientific (89.5%), Public Administration (81.1%), and Finance & Insurance (74.2%).
| Industry | Male | Female |
| Agriculture, Fishing & Hunting | 20 (100.0%) | 0 (0.0%) |
| Mining, Quarrying, & Extraction | 0 (0.0%) | 0 (0.0%) |
| Construction | 177 (100.0%) | 0 (0.0%) |
| Manufacturing | 367 (85.4%) | 63 (14.6%) |
| Wholesale Trade | 55 (47.8%) | 60 (52.2%) |
| Retail Trade | 259 (65.9%) | 134 (34.1%) |
| Transportation & Warehousing | 215 (94.7%) | 12 (5.3%) |
| Utilities | 0 (0.0%) | 0 (0.0%) |
| Information | 24 (100.0%) | 0 (0.0%) |
| Finance & Insurance | 42 (25.8%) | 121 (74.2%) |
| Real Estate, Rental & Leasing | 20 (100.0%) | 0 (0.0%) |
| Professional & Scientific | 18 (10.5%) | 153 (89.5%) |
| Enterprise Management | 0 (0.0%) | 0 (0.0%) |
| Administrative & Support | 17 (100.0%) | 0 (0.0%) |
| Educational Services | 118 (32.3%) | 247 (67.7%) |
| Health Care & Social Assistance | 278 (32.9%) | 567 (67.1%) |
| Arts, Entertainment & Recreation | 95 (73.1%) | 35 (26.9%) |
| Accommodation & Food Services | 73 (65.8%) | 38 (34.2%) |
| Public Administration | 27 (18.9%) | 116 (81.1%) |
| Total | 1,908 (54.6%) | 1,584 (45.4%) |
Education in Ilion
School Enrollment in Ilion
The most common levels of schooling among the 1,663 students in Ilion are middle school (520 | 31.3%), elementary school (478 | 28.7%), and high school (347 | 20.9%).
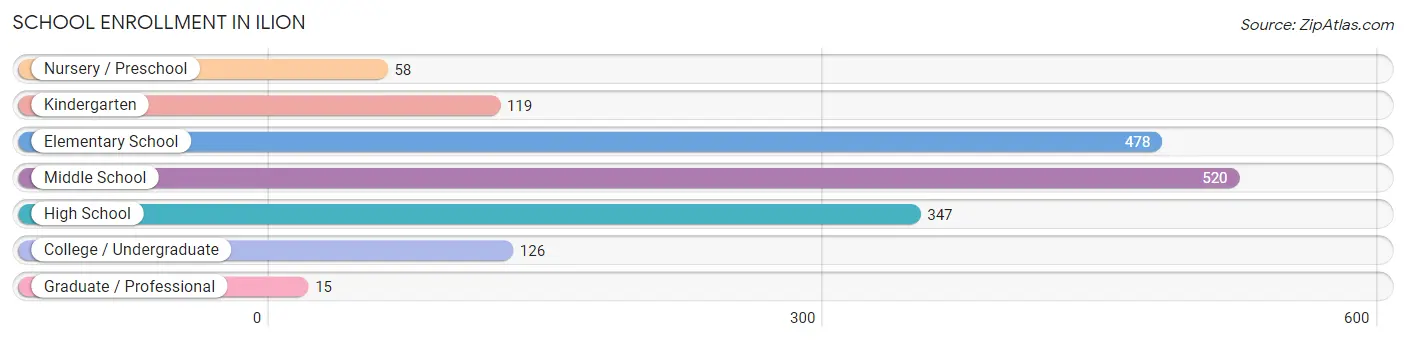
| School Level | # Students | % Students |
| Nursery / Preschool | 58 | 3.5% |
| Kindergarten | 119 | 7.2% |
| Elementary School | 478 | 28.7% |
| Middle School | 520 | 31.3% |
| High School | 347 | 20.9% |
| College / Undergraduate | 126 | 7.6% |
| Graduate / Professional | 15 | 0.9% |
| Total | 1,663 | 100.0% |
School Enrollment by Age by Funding Source in Ilion
Out of a total of 1,663 students who are enrolled in schools in Ilion, 136 (8.2%) attend a private institution, while the remaining 1,527 (91.8%) are enrolled in public schools. The age group of 35 years and over has the highest likelihood of being enrolled in private schools, with 4 (100.0% in the age bracket) enrolled. Conversely, the age group of 3 to 4 year olds has the lowest likelihood of being enrolled in a private school, with 58 (100.0% in the age bracket) attending a public institution.
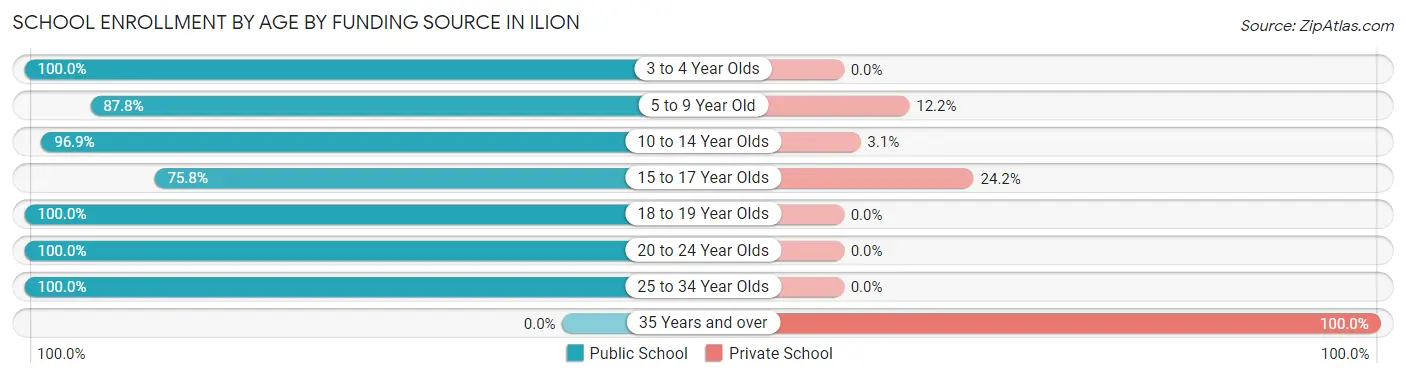
| Age Bracket | Public School | Private School |
| 3 to 4 Year Olds | 58 (100.0%) | 0 (0.0%) |
| 5 to 9 Year Old | 524 (87.8%) | 73 (12.2%) |
| 10 to 14 Year Olds | 651 (96.9%) | 21 (3.1%) |
| 15 to 17 Year Olds | 119 (75.8%) | 38 (24.2%) |
| 18 to 19 Year Olds | 65 (100.0%) | 0 (0.0%) |
| 20 to 24 Year Olds | 72 (100.0%) | 0 (0.0%) |
| 25 to 34 Year Olds | 38 (100.0%) | 0 (0.0%) |
| 35 Years and over | 0 (0.0%) | 4 (100.0%) |
| Total | 1,527 (91.8%) | 136 (8.2%) |
Educational Attainment by Field of Study in Ilion
Science & technology (306 | 19.3%), education (296 | 18.7%), business (170 | 10.7%), literature & languages (153 | 9.7%), and psychology (139 | 8.8%) are the most common fields of study among 1,582 individuals in Ilion who have obtained a bachelor's degree or higher.
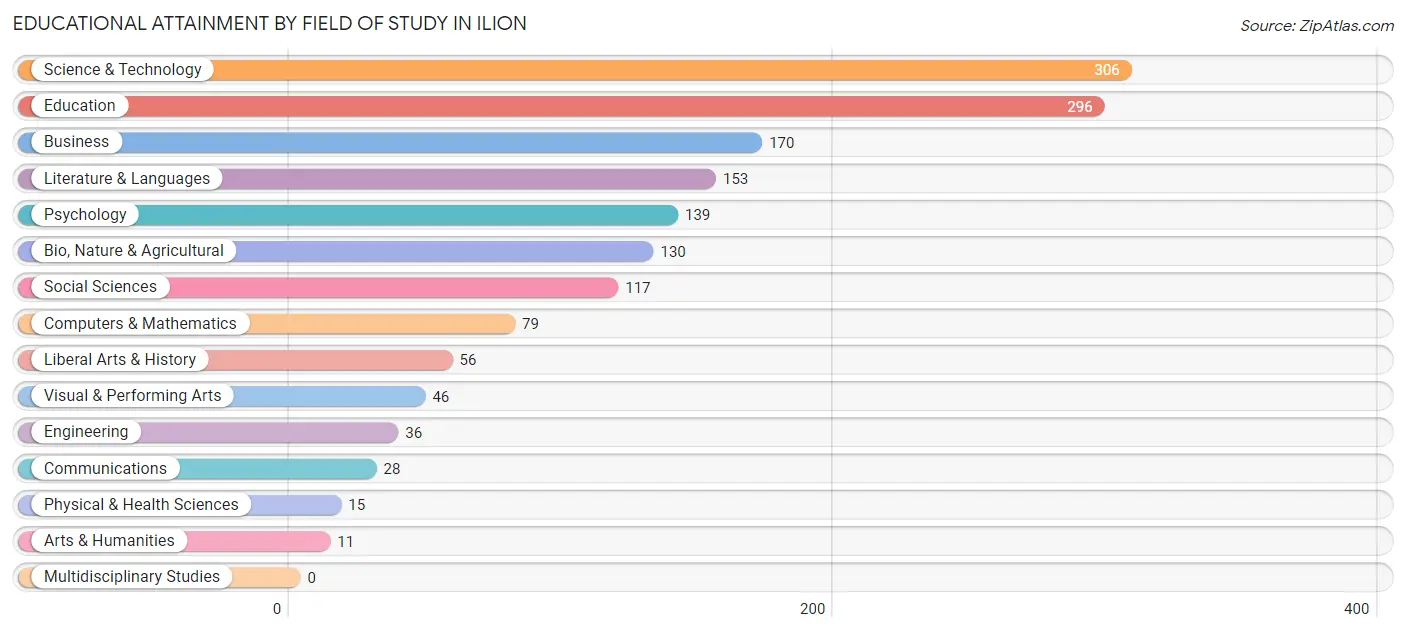
| Field of Study | # Graduates | % Graduates |
| Computers & Mathematics | 79 | 5.0% |
| Bio, Nature & Agricultural | 130 | 8.2% |
| Physical & Health Sciences | 15 | 0.9% |
| Psychology | 139 | 8.8% |
| Social Sciences | 117 | 7.4% |
| Engineering | 36 | 2.3% |
| Multidisciplinary Studies | 0 | 0.0% |
| Science & Technology | 306 | 19.3% |
| Business | 170 | 10.7% |
| Education | 296 | 18.7% |
| Literature & Languages | 153 | 9.7% |
| Liberal Arts & History | 56 | 3.5% |
| Visual & Performing Arts | 46 | 2.9% |
| Communications | 28 | 1.8% |
| Arts & Humanities | 11 | 0.7% |
| Total | 1,582 | 100.0% |
Transportation & Commute in Ilion
Vehicle Availability by Sex in Ilion
The most prevalent vehicle ownership categories in Ilion are males with 2 vehicles (1,016, accounting for 56.0%) and females with 2 vehicles (909, making up 64.1%).
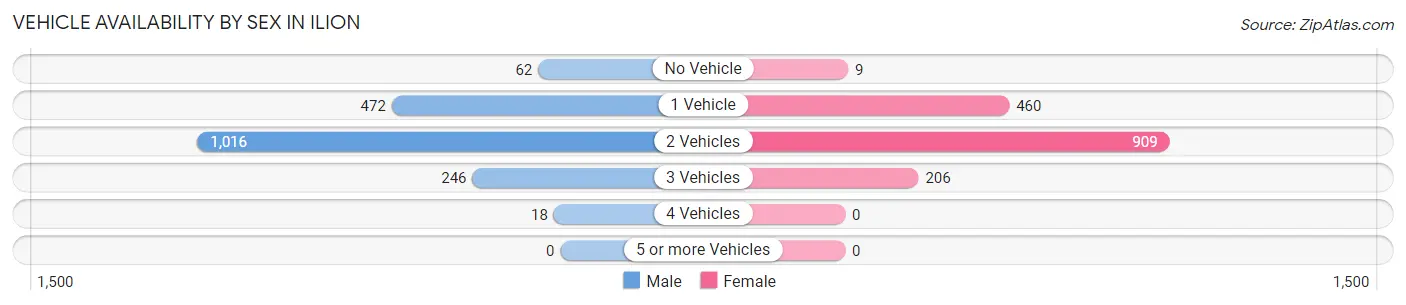
| Vehicles Available | Male | Female |
| No Vehicle | 62 (3.4%) | 9 (0.6%) |
| 1 Vehicle | 472 (26.0%) | 460 (29.0%) |
| 2 Vehicles | 1,016 (56.0%) | 909 (57.4%) |
| 3 Vehicles | 246 (13.6%) | 206 (13.0%) |
| 4 Vehicles | 18 (1.0%) | 0 (0.0%) |
| 5 or more Vehicles | 0 (0.0%) | 0 (0.0%) |
| Total | 1,814 (100.0%) | 1,584 (100.0%) |
Commute Time in Ilion
The most frequently occuring commute durations in Ilion are 5 to 9 minutes (832 commuters, 25.4%), 15 to 19 minutes (500 commuters, 15.2%), and 25 to 29 minutes (485 commuters, 14.8%).
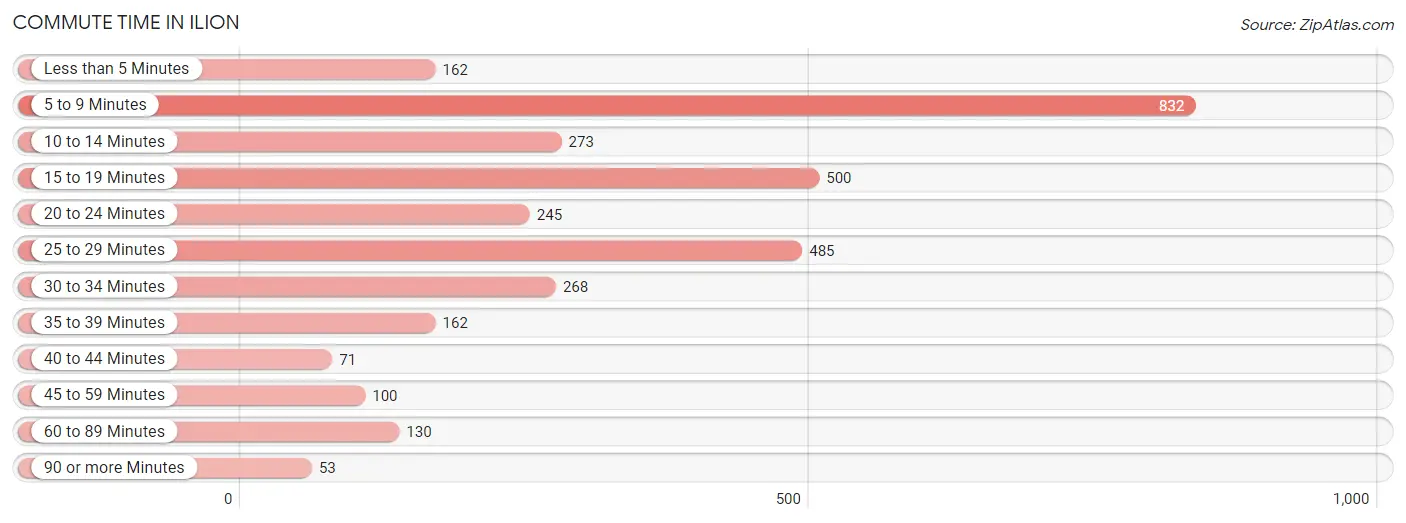
| Commute Time | # Commuters | % Commuters |
| Less than 5 Minutes | 162 | 4.9% |
| 5 to 9 Minutes | 832 | 25.4% |
| 10 to 14 Minutes | 273 | 8.3% |
| 15 to 19 Minutes | 500 | 15.2% |
| 20 to 24 Minutes | 245 | 7.5% |
| 25 to 29 Minutes | 485 | 14.8% |
| 30 to 34 Minutes | 268 | 8.2% |
| 35 to 39 Minutes | 162 | 4.9% |
| 40 to 44 Minutes | 71 | 2.2% |
| 45 to 59 Minutes | 100 | 3.0% |
| 60 to 89 Minutes | 130 | 4.0% |
| 90 or more Minutes | 53 | 1.6% |
Commute Time by Sex in Ilion
The most common commute times in Ilion are 25 to 29 minutes (386 commuters, 21.8%) for males and 5 to 9 minutes (521 commuters, 34.5%) for females.
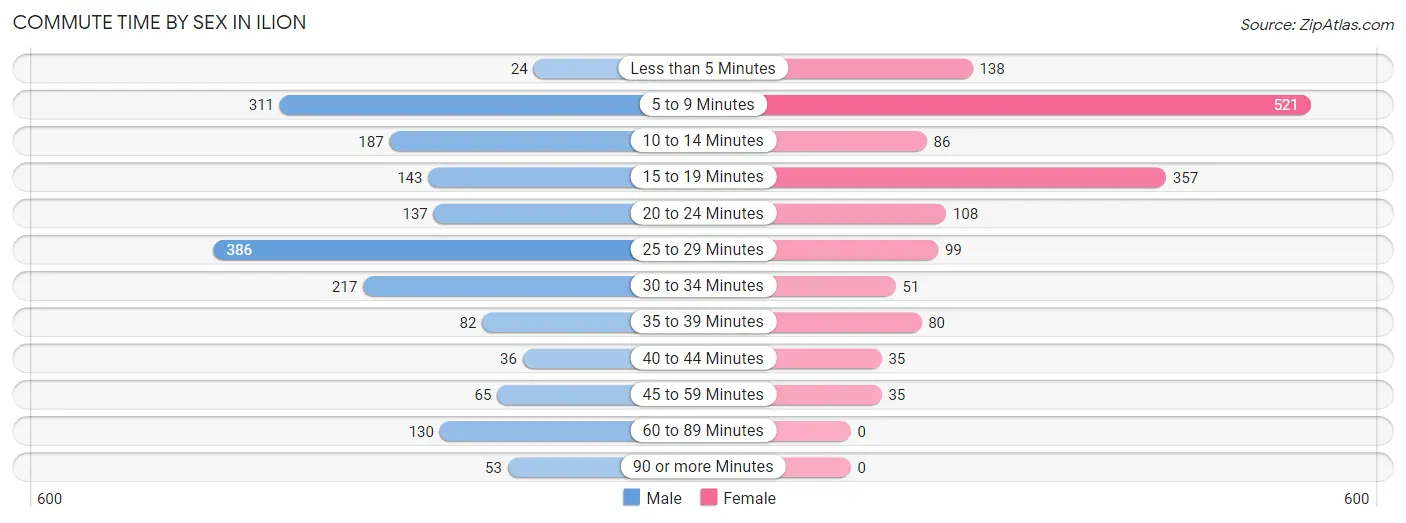
| Commute Time | Male | Female |
| Less than 5 Minutes | 24 (1.4%) | 138 (9.1%) |
| 5 to 9 Minutes | 311 (17.6%) | 521 (34.5%) |
| 10 to 14 Minutes | 187 (10.6%) | 86 (5.7%) |
| 15 to 19 Minutes | 143 (8.1%) | 357 (23.6%) |
| 20 to 24 Minutes | 137 (7.7%) | 108 (7.1%) |
| 25 to 29 Minutes | 386 (21.8%) | 99 (6.6%) |
| 30 to 34 Minutes | 217 (12.2%) | 51 (3.4%) |
| 35 to 39 Minutes | 82 (4.6%) | 80 (5.3%) |
| 40 to 44 Minutes | 36 (2.0%) | 35 (2.3%) |
| 45 to 59 Minutes | 65 (3.7%) | 35 (2.3%) |
| 60 to 89 Minutes | 130 (7.3%) | 0 (0.0%) |
| 90 or more Minutes | 53 (3.0%) | 0 (0.0%) |
Time of Departure to Work by Sex in Ilion
The most frequent times of departure to work in Ilion are 6:30 AM to 6:59 AM (338, 19.1%) for males and 7:30 AM to 7:59 AM (340, 22.5%) for females.
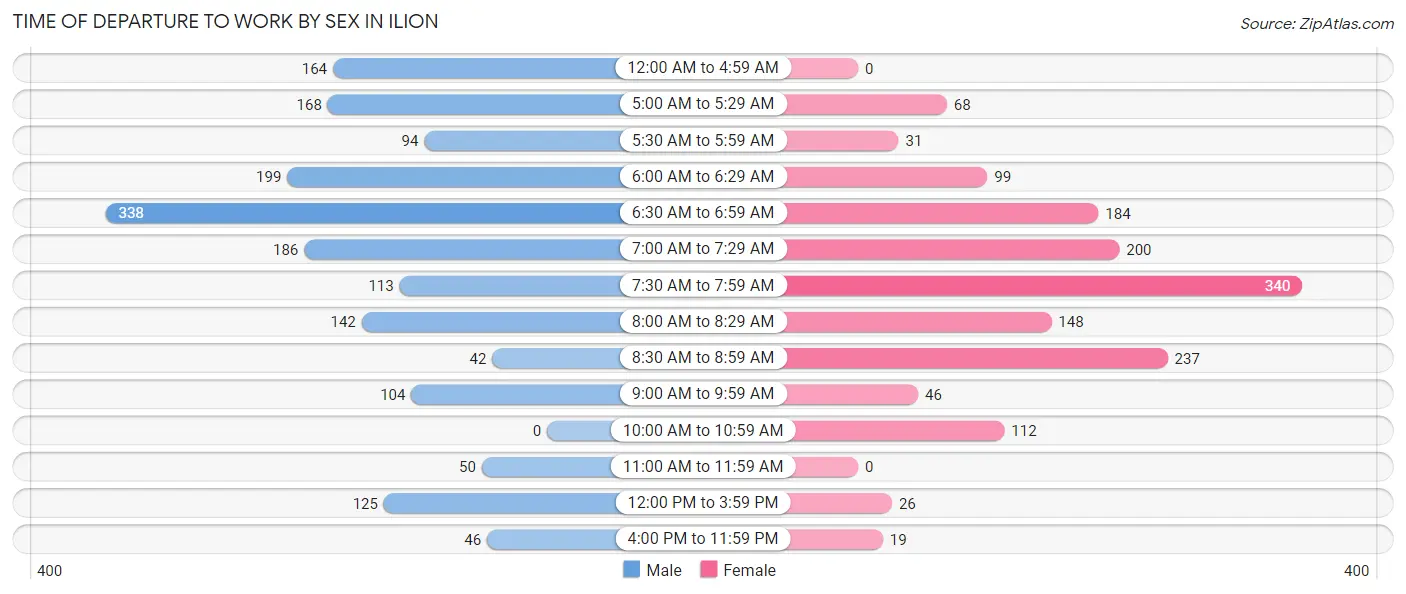
| Time of Departure | Male | Female |
| 12:00 AM to 4:59 AM | 164 (9.3%) | 0 (0.0%) |
| 5:00 AM to 5:29 AM | 168 (9.5%) | 68 (4.5%) |
| 5:30 AM to 5:59 AM | 94 (5.3%) | 31 (2.1%) |
| 6:00 AM to 6:29 AM | 199 (11.2%) | 99 (6.6%) |
| 6:30 AM to 6:59 AM | 338 (19.1%) | 184 (12.2%) |
| 7:00 AM to 7:29 AM | 186 (10.5%) | 200 (13.3%) |
| 7:30 AM to 7:59 AM | 113 (6.4%) | 340 (22.5%) |
| 8:00 AM to 8:29 AM | 142 (8.0%) | 148 (9.8%) |
| 8:30 AM to 8:59 AM | 42 (2.4%) | 237 (15.7%) |
| 9:00 AM to 9:59 AM | 104 (5.9%) | 46 (3.0%) |
| 10:00 AM to 10:59 AM | 0 (0.0%) | 112 (7.4%) |
| 11:00 AM to 11:59 AM | 50 (2.8%) | 0 (0.0%) |
| 12:00 PM to 3:59 PM | 125 (7.1%) | 26 (1.7%) |
| 4:00 PM to 11:59 PM | 46 (2.6%) | 19 (1.3%) |
| Total | 1,771 (100.0%) | 1,510 (100.0%) |
Housing Occupancy in Ilion
Occupancy by Ownership in Ilion
Of the total 3,340 dwellings in Ilion, owner-occupied units account for 2,176 (65.1%), while renter-occupied units make up 1,164 (34.8%).
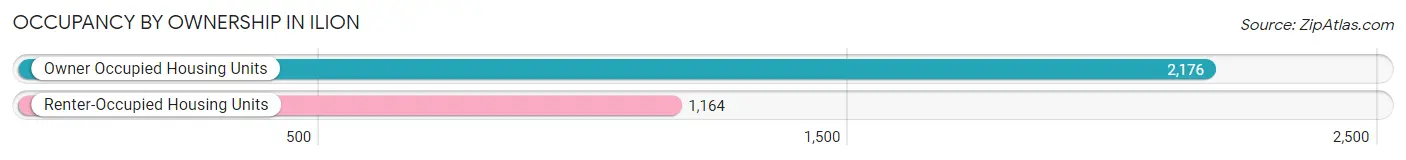
| Occupancy | # Housing Units | % Housing Units |
| Owner Occupied Housing Units | 2,176 | 65.1% |
| Renter-Occupied Housing Units | 1,164 | 34.8% |
| Total Occupied Housing Units | 3,340 | 100.0% |
Occupancy by Household Size in Ilion
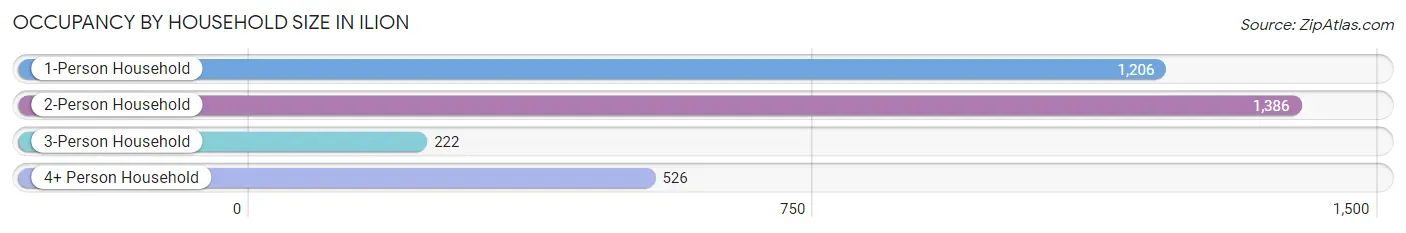
| Household Size | # Housing Units | % Housing Units |
| 1-Person Household | 1,206 | 36.1% |
| 2-Person Household | 1,386 | 41.5% |
| 3-Person Household | 222 | 6.7% |
| 4+ Person Household | 526 | 15.8% |
| Total Housing Units | 3,340 | 100.0% |
Occupancy by Ownership by Household Size in Ilion
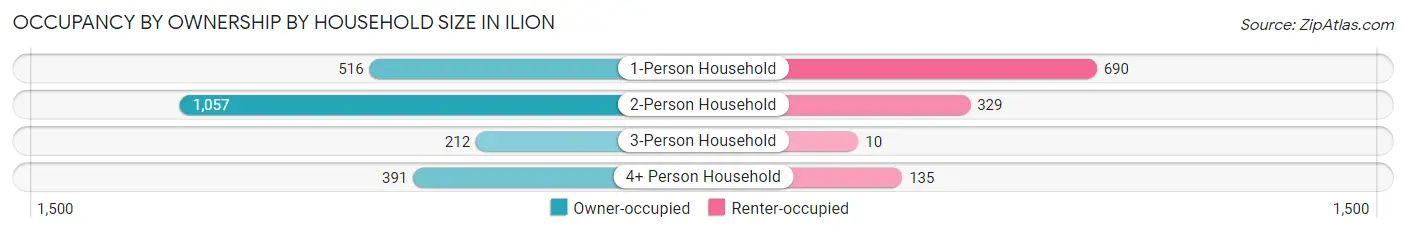
| Household Size | Owner-occupied | Renter-occupied |
| 1-Person Household | 516 (42.8%) | 690 (57.2%) |
| 2-Person Household | 1,057 (76.3%) | 329 (23.7%) |
| 3-Person Household | 212 (95.5%) | 10 (4.5%) |
| 4+ Person Household | 391 (74.3%) | 135 (25.7%) |
| Total Housing Units | 2,176 (65.1%) | 1,164 (34.8%) |
Occupancy by Educational Attainment in Ilion
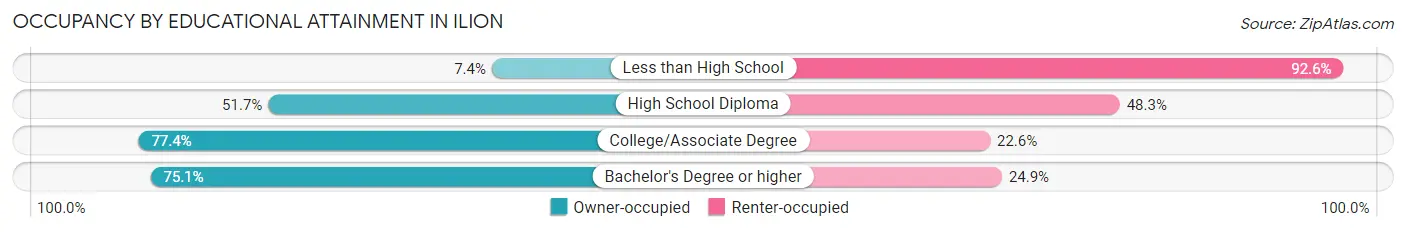
| Household Size | Owner-occupied | Renter-occupied |
| Less than High School | 14 (7.4%) | 176 (92.6%) |
| High School Diploma | 514 (51.7%) | 480 (48.3%) |
| College/Associate Degree | 977 (77.4%) | 285 (22.6%) |
| Bachelor's Degree or higher | 671 (75.1%) | 223 (24.9%) |
Occupancy by Age of Householder in Ilion
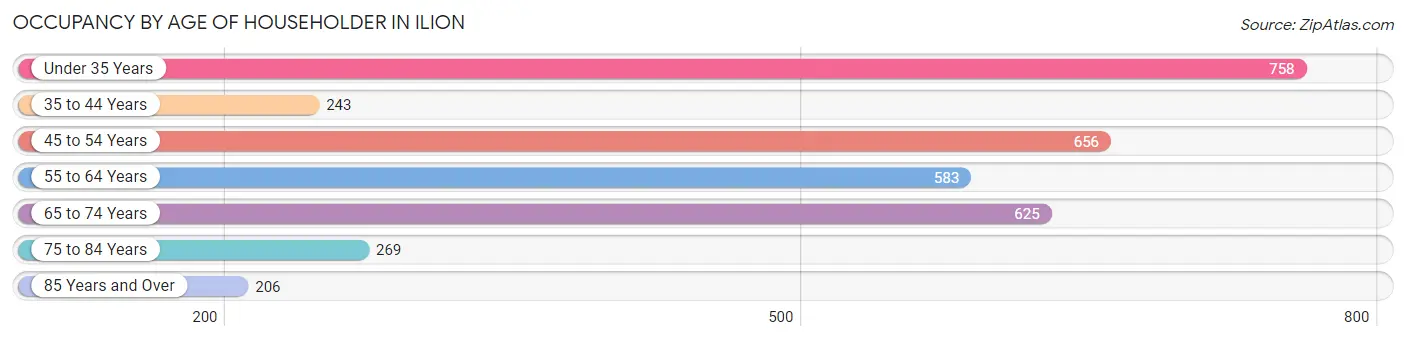
| Age Bracket | # Households | % Households |
| Under 35 Years | 758 | 22.7% |
| 35 to 44 Years | 243 | 7.3% |
| 45 to 54 Years | 656 | 19.6% |
| 55 to 64 Years | 583 | 17.5% |
| 65 to 74 Years | 625 | 18.7% |
| 75 to 84 Years | 269 | 8.1% |
| 85 Years and Over | 206 | 6.2% |
| Total | 3,340 | 100.0% |
Housing Finances in Ilion
Median Income by Occupancy in Ilion
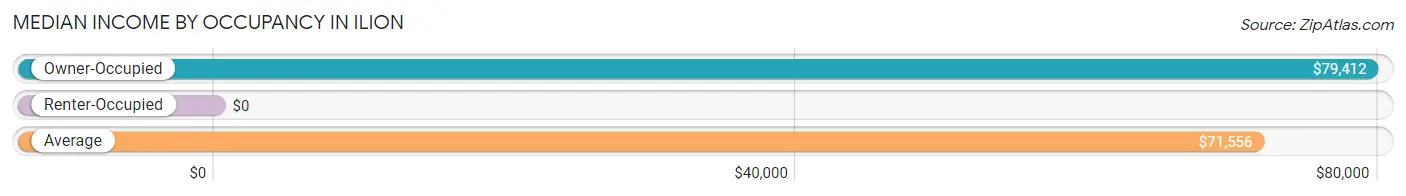
| Occupancy Type | # Households | Median Income |
| Owner-Occupied | 2,176 (65.1%) | $79,412 |
| Renter-Occupied | 1,164 (34.8%) | $0 |
| Average | 3,340 (100.0%) | $71,556 |
Occupancy by Householder Income Bracket in Ilion
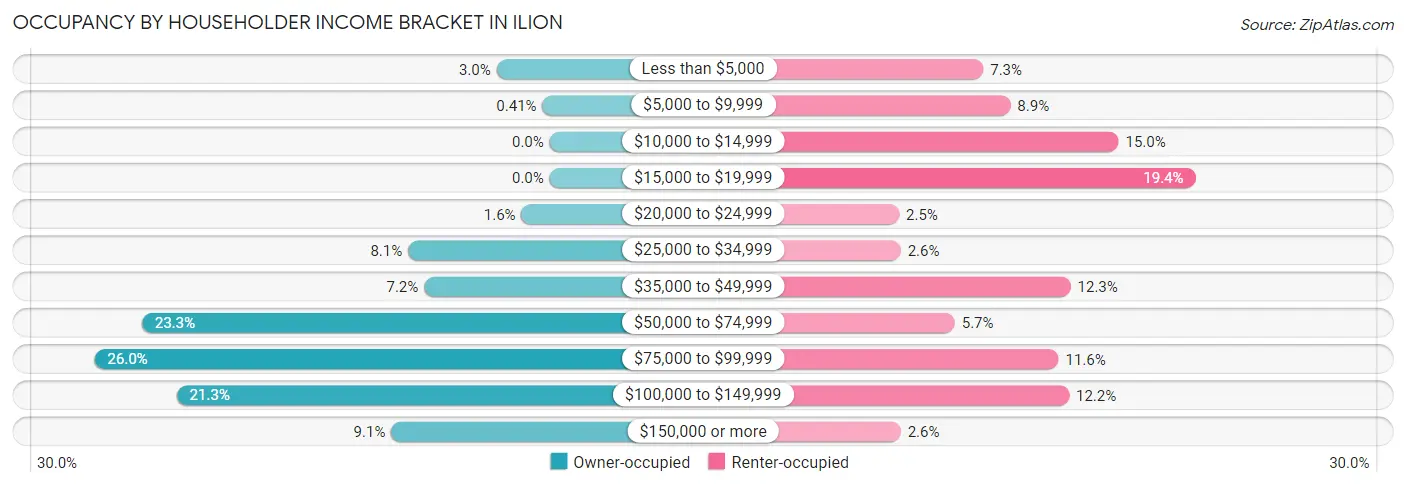
| Income Bracket | Owner-occupied | Renter-occupied |
| Less than $5,000 | 66 (3.0%) | 85 (7.3%) |
| $5,000 to $9,999 | 9 (0.4%) | 103 (8.8%) |
| $10,000 to $14,999 | 0 (0.0%) | 175 (15.0%) |
| $15,000 to $19,999 | 0 (0.0%) | 226 (19.4%) |
| $20,000 to $24,999 | 35 (1.6%) | 29 (2.5%) |
| $25,000 to $34,999 | 176 (8.1%) | 30 (2.6%) |
| $35,000 to $49,999 | 156 (7.2%) | 143 (12.3%) |
| $50,000 to $74,999 | 507 (23.3%) | 66 (5.7%) |
| $75,000 to $99,999 | 566 (26.0%) | 135 (11.6%) |
| $100,000 to $149,999 | 464 (21.3%) | 142 (12.2%) |
| $150,000 or more | 197 (9.0%) | 30 (2.6%) |
| Total | 2,176 (100.0%) | 1,164 (100.0%) |
Monthly Housing Cost Tiers in Ilion
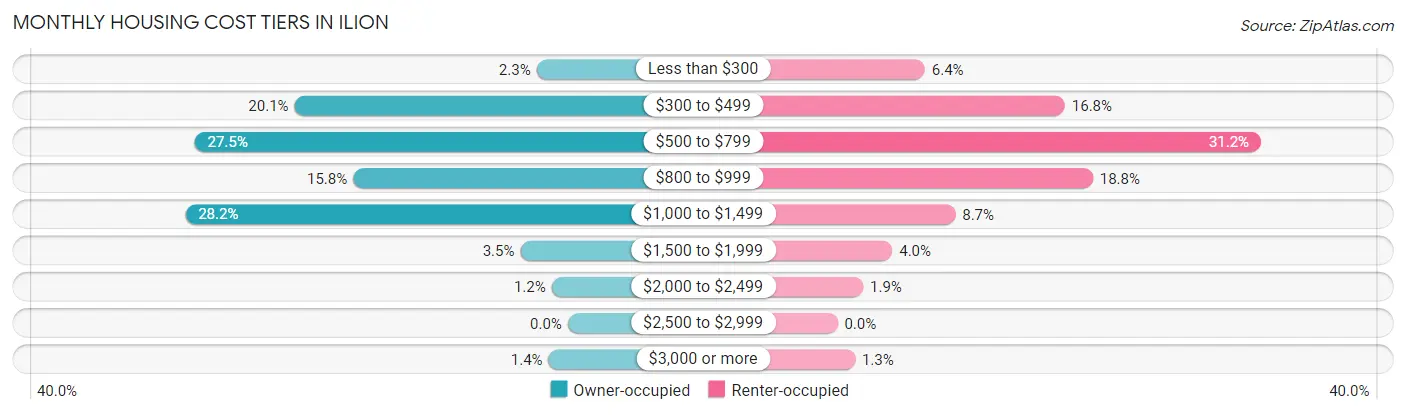
| Monthly Cost | Owner-occupied | Renter-occupied |
| Less than $300 | 50 (2.3%) | 75 (6.4%) |
| $300 to $499 | 438 (20.1%) | 195 (16.8%) |
| $500 to $799 | 598 (27.5%) | 363 (31.2%) |
| $800 to $999 | 344 (15.8%) | 219 (18.8%) |
| $1,000 to $1,499 | 613 (28.2%) | 101 (8.7%) |
| $1,500 to $1,999 | 76 (3.5%) | 47 (4.0%) |
| $2,000 to $2,499 | 26 (1.2%) | 22 (1.9%) |
| $2,500 to $2,999 | 0 (0.0%) | 0 (0.0%) |
| $3,000 or more | 31 (1.4%) | 15 (1.3%) |
| Total | 2,176 (100.0%) | 1,164 (100.0%) |
Physical Housing Characteristics in Ilion
Housing Structures in Ilion
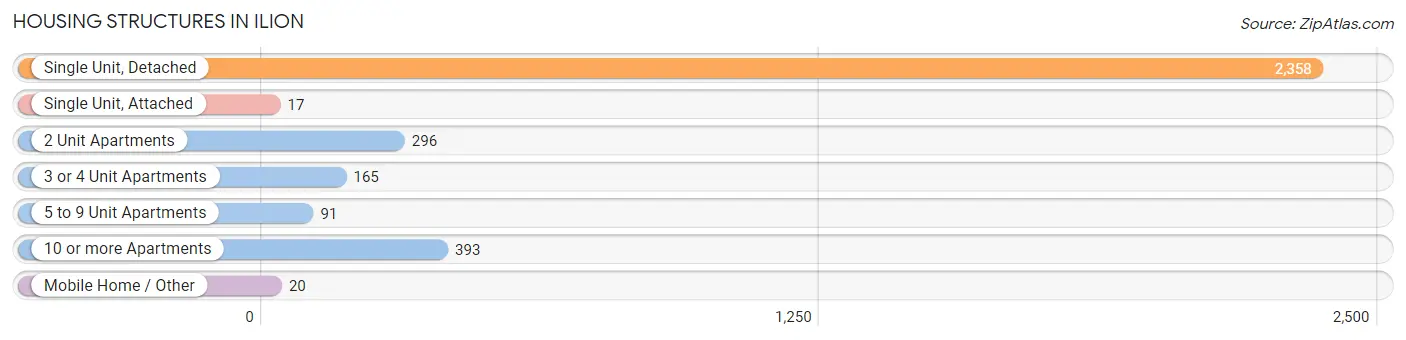
| Structure Type | # Housing Units | % Housing Units |
| Single Unit, Detached | 2,358 | 70.6% |
| Single Unit, Attached | 17 | 0.5% |
| 2 Unit Apartments | 296 | 8.9% |
| 3 or 4 Unit Apartments | 165 | 4.9% |
| 5 to 9 Unit Apartments | 91 | 2.7% |
| 10 or more Apartments | 393 | 11.8% |
| Mobile Home / Other | 20 | 0.6% |
| Total | 3,340 | 100.0% |
Housing Structures by Occupancy in Ilion
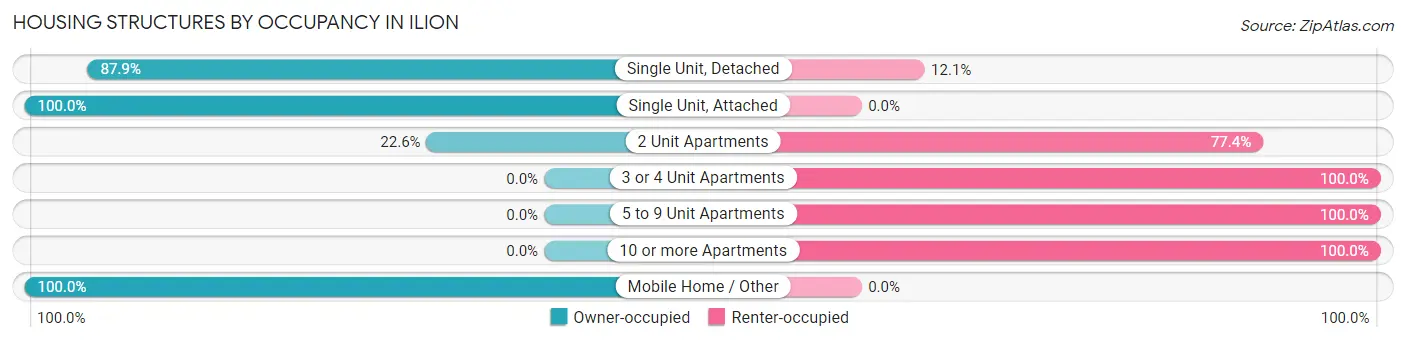
| Structure Type | Owner-occupied | Renter-occupied |
| Single Unit, Detached | 2,072 (87.9%) | 286 (12.1%) |
| Single Unit, Attached | 17 (100.0%) | 0 (0.0%) |
| 2 Unit Apartments | 67 (22.6%) | 229 (77.4%) |
| 3 or 4 Unit Apartments | 0 (0.0%) | 165 (100.0%) |
| 5 to 9 Unit Apartments | 0 (0.0%) | 91 (100.0%) |
| 10 or more Apartments | 0 (0.0%) | 393 (100.0%) |
| Mobile Home / Other | 20 (100.0%) | 0 (0.0%) |
| Total | 2,176 (65.1%) | 1,164 (34.8%) |
Housing Structures by Number of Rooms in Ilion
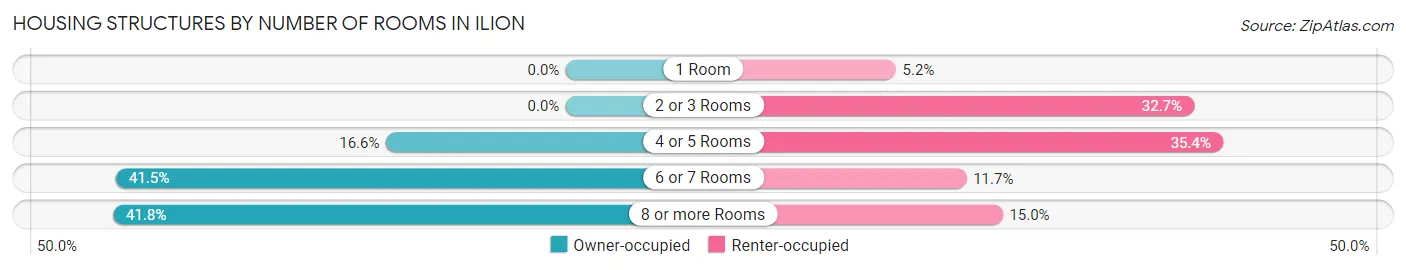
| Number of Rooms | Owner-occupied | Renter-occupied |
| 1 Room | 0 (0.0%) | 60 (5.1%) |
| 2 or 3 Rooms | 0 (0.0%) | 381 (32.7%) |
| 4 or 5 Rooms | 362 (16.6%) | 412 (35.4%) |
| 6 or 7 Rooms | 904 (41.5%) | 136 (11.7%) |
| 8 or more Rooms | 910 (41.8%) | 175 (15.0%) |
| Total | 2,176 (100.0%) | 1,164 (100.0%) |
Housing Structure by Heating Type in Ilion
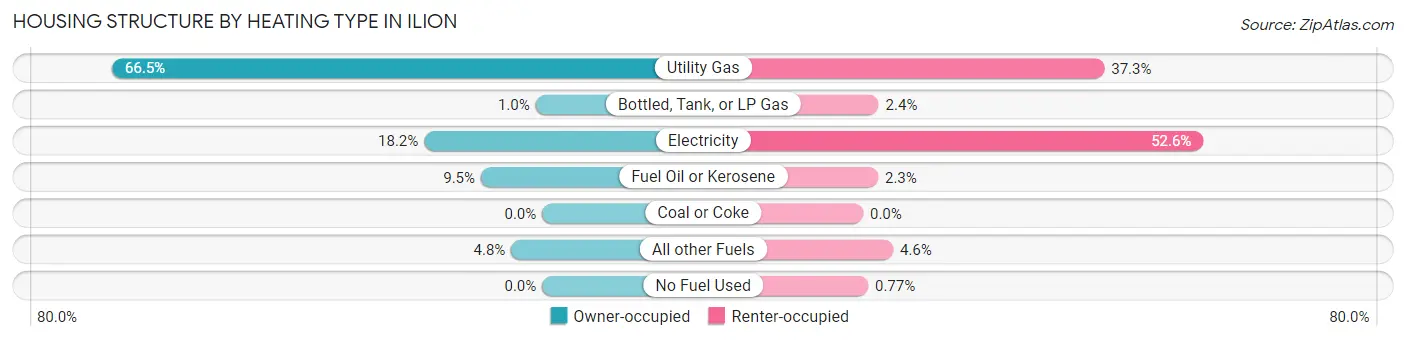
| Heating Type | Owner-occupied | Renter-occupied |
| Utility Gas | 1,447 (66.5%) | 434 (37.3%) |
| Bottled, Tank, or LP Gas | 22 (1.0%) | 28 (2.4%) |
| Electricity | 397 (18.2%) | 612 (52.6%) |
| Fuel Oil or Kerosene | 206 (9.5%) | 27 (2.3%) |
| Coal or Coke | 0 (0.0%) | 0 (0.0%) |
| All other Fuels | 104 (4.8%) | 54 (4.6%) |
| No Fuel Used | 0 (0.0%) | 9 (0.8%) |
| Total | 2,176 (100.0%) | 1,164 (100.0%) |
Household Vehicle Usage in Ilion
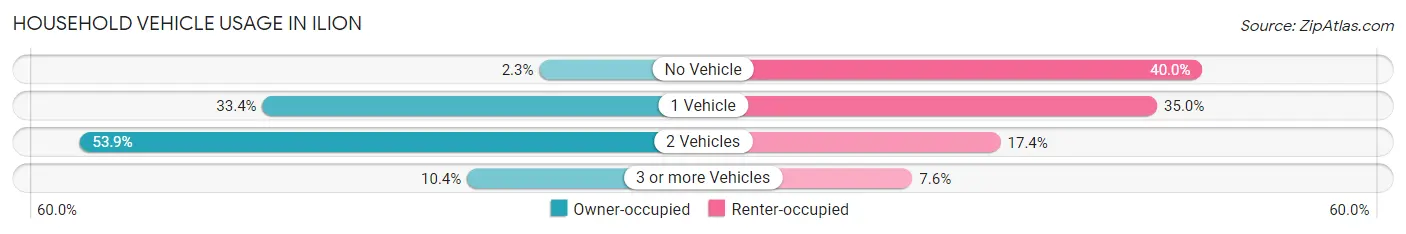
| Vehicles per Household | Owner-occupied | Renter-occupied |
| No Vehicle | 51 (2.3%) | 466 (40.0%) |
| 1 Vehicle | 726 (33.4%) | 407 (35.0%) |
| 2 Vehicles | 1,172 (53.9%) | 203 (17.4%) |
| 3 or more Vehicles | 227 (10.4%) | 88 (7.6%) |
| Total | 2,176 (100.0%) | 1,164 (100.0%) |
Real Estate & Mortgages in Ilion
Real Estate and Mortgage Overview in Ilion
| Characteristic | Without Mortgage | With Mortgage |
| Housing Units | 948 | 1,228 |
| Median Property Value | $99,700 | $92,100 |
| Median Household Income | $68,750 | $118 |
| Monthly Housing Costs | $499 | $31 |
| Real Estate Taxes | $2,875 | $38 |
Property Value by Mortgage Status in Ilion
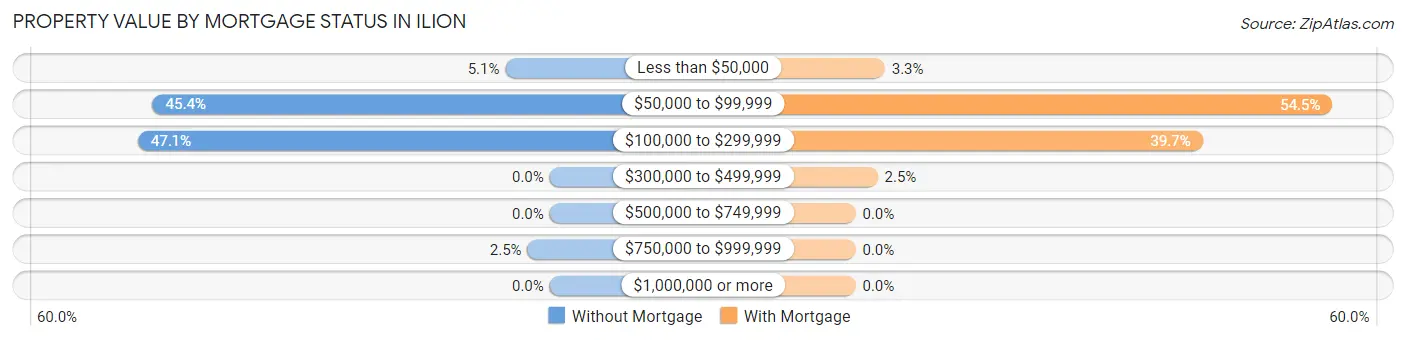
| Property Value | Without Mortgage | With Mortgage |
| Less than $50,000 | 48 (5.1%) | 41 (3.3%) |
| $50,000 to $99,999 | 430 (45.4%) | 669 (54.5%) |
| $100,000 to $299,999 | 446 (47.0%) | 487 (39.7%) |
| $300,000 to $499,999 | 0 (0.0%) | 31 (2.5%) |
| $500,000 to $749,999 | 0 (0.0%) | 0 (0.0%) |
| $750,000 to $999,999 | 24 (2.5%) | 0 (0.0%) |
| $1,000,000 or more | 0 (0.0%) | 0 (0.0%) |
| Total | 948 (100.0%) | 1,228 (100.0%) |
Household Income by Mortgage Status in Ilion
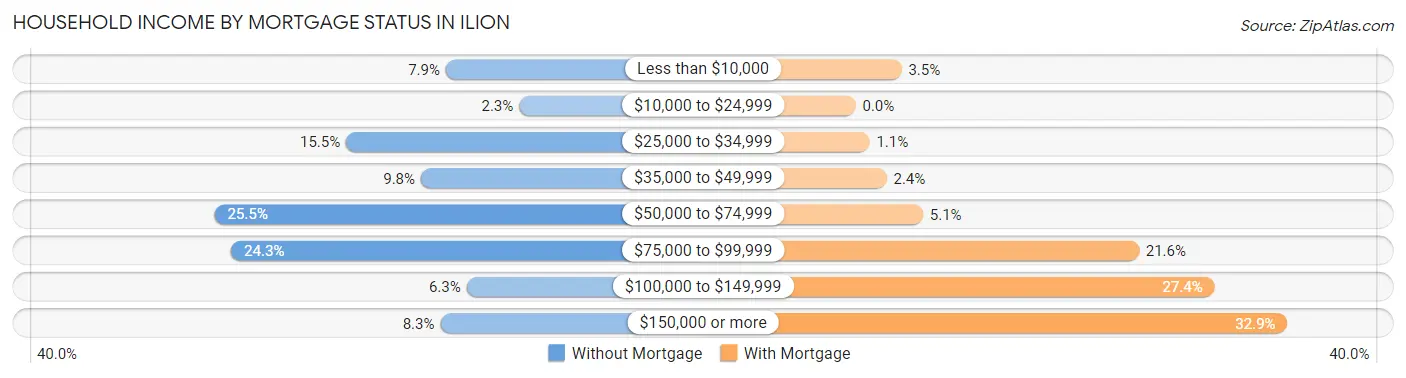
| Household Income | Without Mortgage | With Mortgage |
| Less than $10,000 | 75 (7.9%) | 43 (3.5%) |
| $10,000 to $24,999 | 22 (2.3%) | 0 (0.0%) |
| $25,000 to $34,999 | 147 (15.5%) | 13 (1.1%) |
| $35,000 to $49,999 | 93 (9.8%) | 29 (2.4%) |
| $50,000 to $74,999 | 242 (25.5%) | 63 (5.1%) |
| $75,000 to $99,999 | 230 (24.3%) | 265 (21.6%) |
| $100,000 to $149,999 | 60 (6.3%) | 336 (27.4%) |
| $150,000 or more | 79 (8.3%) | 404 (32.9%) |
| Total | 948 (100.0%) | 1,228 (100.0%) |
Property Value to Household Income Ratio in Ilion

| Value-to-Income Ratio | Without Mortgage | With Mortgage |
| Less than 2.0x | 624 (65.8%) | 89,684 (7,303.3%) |
| 2.0x to 2.9x | 187 (19.7%) | 1,115 (90.8%) |
| 3.0x to 3.9x | 33 (3.5%) | 100 (8.1%) |
| 4.0x or more | 80 (8.4%) | 13 (1.1%) |
| Total | 948 (100.0%) | 1,228 (100.0%) |
Real Estate Taxes by Mortgage Status in Ilion
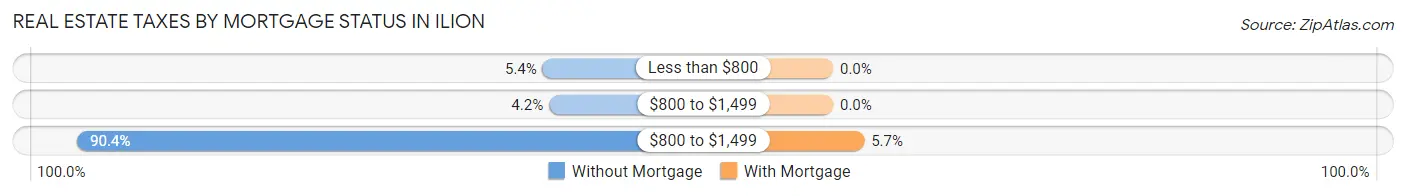
| Property Taxes | Without Mortgage | With Mortgage |
| Less than $800 | 51 (5.4%) | 0 (0.0%) |
| $800 to $1,499 | 40 (4.2%) | 0 (0.0%) |
| $800 to $1,499 | 857 (90.4%) | 70 (5.7%) |
| Total | 948 (100.0%) | 1,228 (100.0%) |
Health & Disability in Ilion
Health Insurance Coverage by Age in Ilion
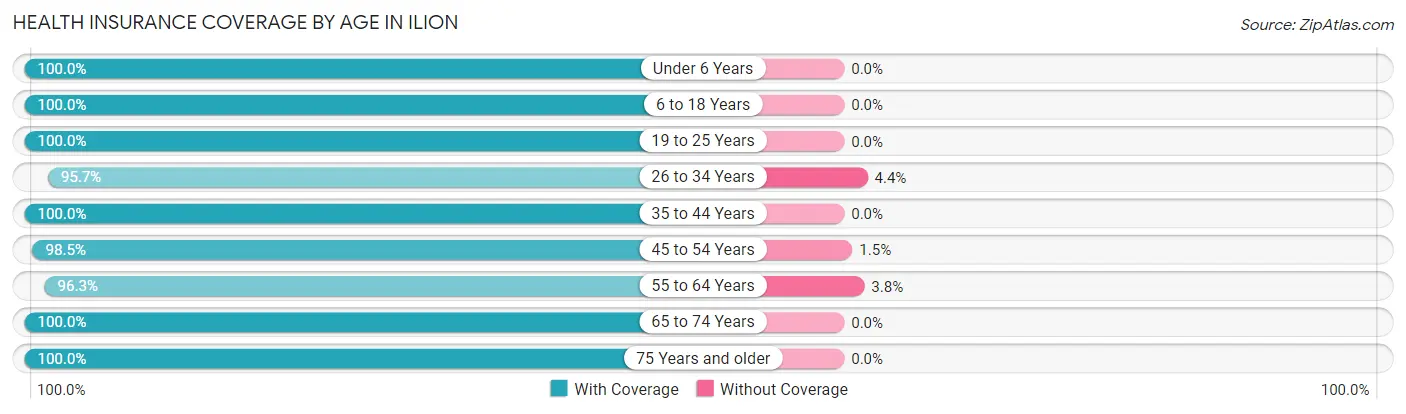
| Age Bracket | With Coverage | Without Coverage |
| Under 6 Years | 407 (100.0%) | 0 (0.0%) |
| 6 to 18 Years | 1,399 (100.0%) | 0 (0.0%) |
| 19 to 25 Years | 411 (100.0%) | 0 (0.0%) |
| 26 to 34 Years | 1,033 (95.7%) | 47 (4.3%) |
| 35 to 44 Years | 666 (100.0%) | 0 (0.0%) |
| 45 to 54 Years | 1,111 (98.5%) | 17 (1.5%) |
| 55 to 64 Years | 1,000 (96.3%) | 39 (3.7%) |
| 65 to 74 Years | 812 (100.0%) | 0 (0.0%) |
| 75 Years and older | 663 (100.0%) | 0 (0.0%) |
| Total | 7,502 (98.7%) | 103 (1.3%) |
Health Insurance Coverage by Citizenship Status in Ilion
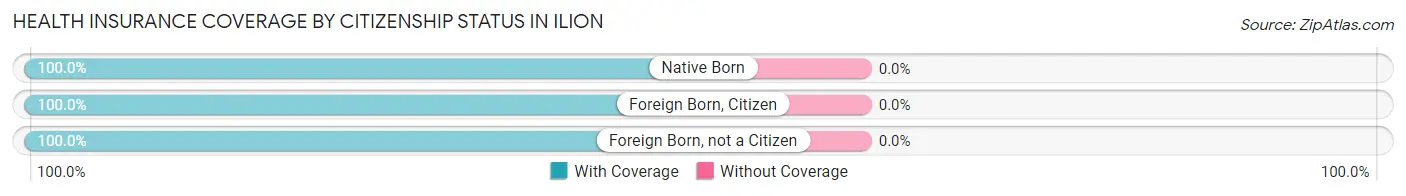
| Citizenship Status | With Coverage | Without Coverage |
| Native Born | 407 (100.0%) | 0 (0.0%) |
| Foreign Born, Citizen | 1,399 (100.0%) | 0 (0.0%) |
| Foreign Born, not a Citizen | 411 (100.0%) | 0 (0.0%) |
Health Insurance Coverage by Household Income in Ilion
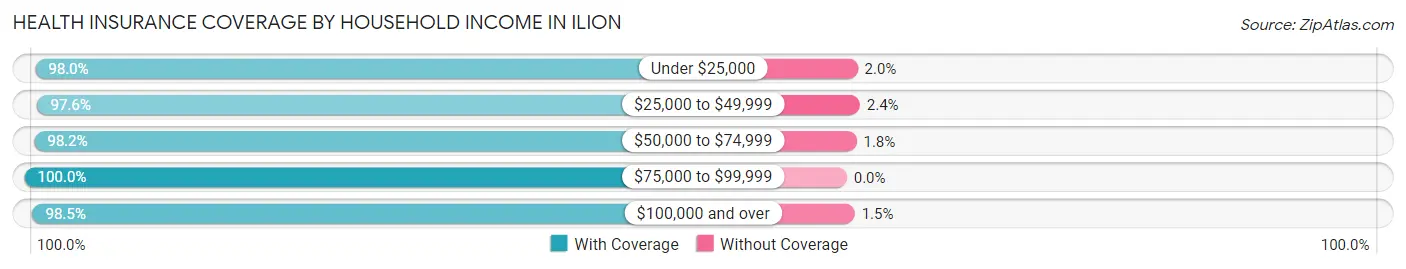
| Household Income | With Coverage | Without Coverage |
| Under $25,000 | 824 (98.0%) | 17 (2.0%) |
| $25,000 to $49,999 | 919 (97.6%) | 23 (2.4%) |
| $50,000 to $74,999 | 1,297 (98.2%) | 24 (1.8%) |
| $75,000 to $99,999 | 1,842 (100.0%) | 0 (0.0%) |
| $100,000 and over | 2,577 (98.5%) | 39 (1.5%) |
Public vs Private Health Insurance Coverage by Age in Ilion
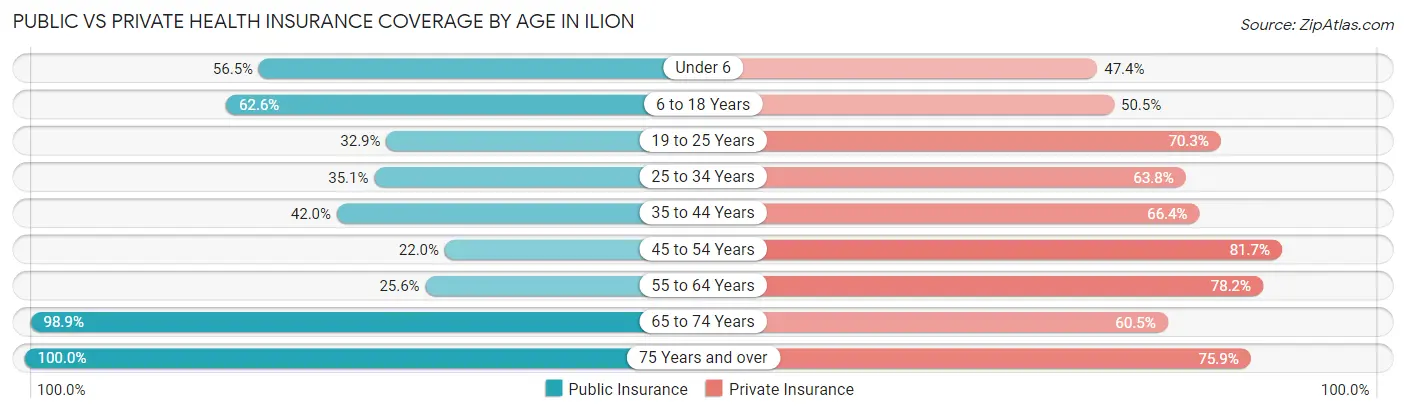
| Age Bracket | Public Insurance | Private Insurance |
| Under 6 | 230 (56.5%) | 193 (47.4%) |
| 6 to 18 Years | 876 (62.6%) | 707 (50.5%) |
| 19 to 25 Years | 135 (32.9%) | 289 (70.3%) |
| 25 to 34 Years | 379 (35.1%) | 689 (63.8%) |
| 35 to 44 Years | 280 (42.0%) | 442 (66.4%) |
| 45 to 54 Years | 248 (22.0%) | 921 (81.7%) |
| 55 to 64 Years | 266 (25.6%) | 812 (78.1%) |
| 65 to 74 Years | 803 (98.9%) | 491 (60.5%) |
| 75 Years and over | 663 (100.0%) | 503 (75.9%) |
| Total | 3,880 (51.0%) | 5,047 (66.4%) |
Disability Status by Sex by Age in Ilion
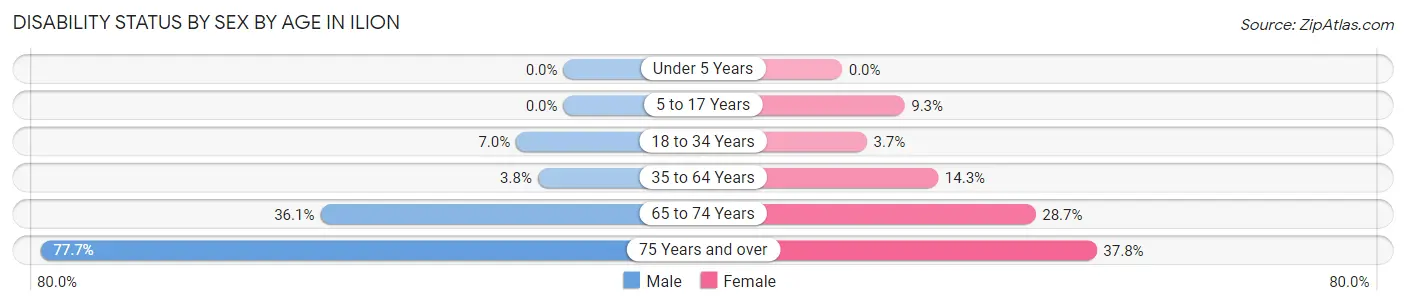
| Age Bracket | Male | Female |
| Under 5 Years | 0 (0.0%) | 0 (0.0%) |
| 5 to 17 Years | 0 (0.0%) | 77 (9.3%) |
| 18 to 34 Years | 48 (7.0%) | 31 (3.7%) |
| 35 to 64 Years | 59 (3.8%) | 183 (14.3%) |
| 65 to 74 Years | 126 (36.1%) | 133 (28.7%) |
| 75 Years and over | 139 (77.6%) | 183 (37.8%) |
Disability Class by Sex by Age in Ilion
Disability Class: Hearing Difficulty
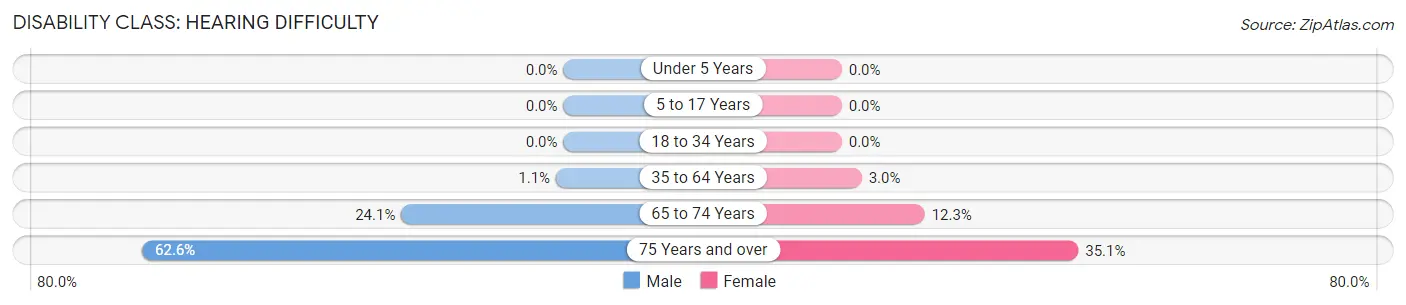
| Age Bracket | Male | Female |
| Under 5 Years | 0 (0.0%) | 0 (0.0%) |
| 5 to 17 Years | 0 (0.0%) | 0 (0.0%) |
| 18 to 34 Years | 0 (0.0%) | 0 (0.0%) |
| 35 to 64 Years | 17 (1.1%) | 38 (3.0%) |
| 65 to 74 Years | 84 (24.1%) | 57 (12.3%) |
| 75 Years and over | 112 (62.6%) | 170 (35.1%) |
Disability Class: Vision Difficulty
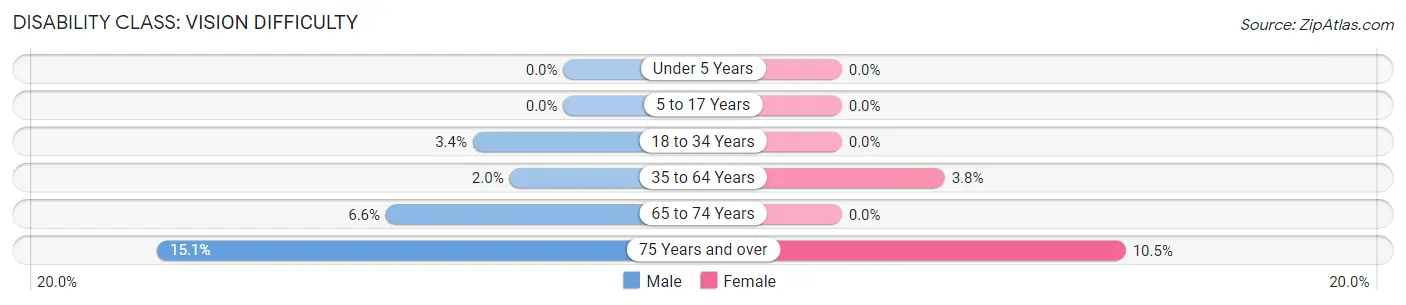
| Age Bracket | Male | Female |
| Under 5 Years | 0 (0.0%) | 0 (0.0%) |
| 5 to 17 Years | 0 (0.0%) | 0 (0.0%) |
| 18 to 34 Years | 23 (3.4%) | 0 (0.0%) |
| 35 to 64 Years | 31 (2.0%) | 49 (3.8%) |
| 65 to 74 Years | 23 (6.6%) | 0 (0.0%) |
| 75 Years and over | 27 (15.1%) | 51 (10.5%) |
Disability Class: Cognitive Difficulty
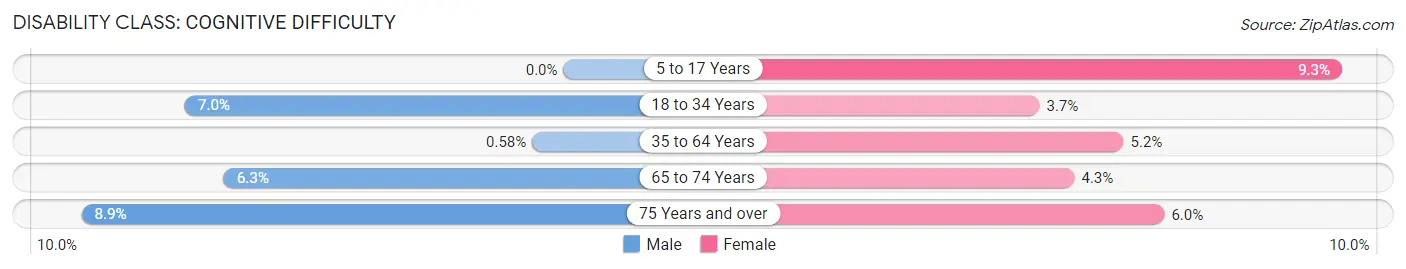
| Age Bracket | Male | Female |
| 5 to 17 Years | 0 (0.0%) | 77 (9.3%) |
| 18 to 34 Years | 48 (7.0%) | 31 (3.7%) |
| 35 to 64 Years | 9 (0.6%) | 67 (5.2%) |
| 65 to 74 Years | 22 (6.3%) | 20 (4.3%) |
| 75 Years and over | 16 (8.9%) | 29 (6.0%) |
Disability Class: Ambulatory Difficulty
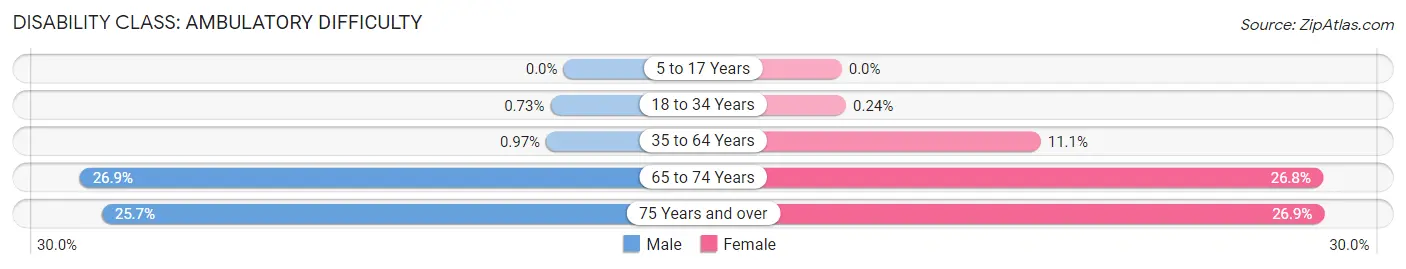
| Age Bracket | Male | Female |
| 5 to 17 Years | 0 (0.0%) | 0 (0.0%) |
| 18 to 34 Years | 5 (0.7%) | 2 (0.2%) |
| 35 to 64 Years | 15 (1.0%) | 142 (11.1%) |
| 65 to 74 Years | 94 (26.9%) | 124 (26.8%) |
| 75 Years and over | 46 (25.7%) | 130 (26.9%) |
Disability Class: Self-Care Difficulty
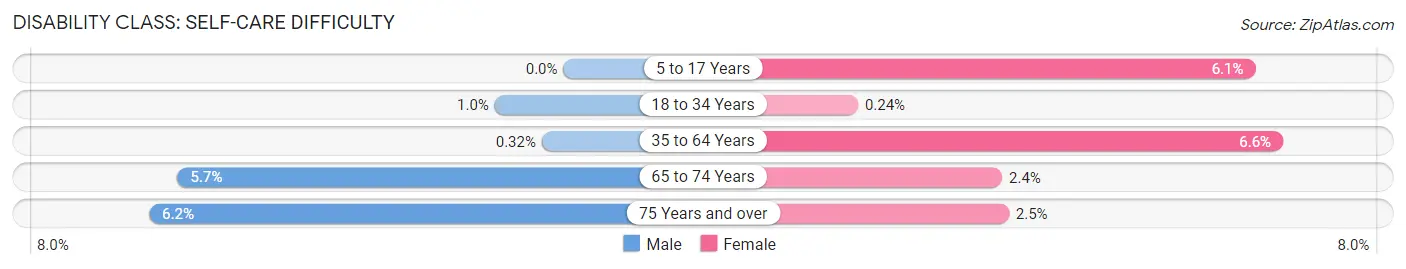
| Age Bracket | Male | Female |
| 5 to 17 Years | 0 (0.0%) | 51 (6.1%) |
| 18 to 34 Years | 7 (1.0%) | 2 (0.2%) |
| 35 to 64 Years | 5 (0.3%) | 84 (6.6%) |
| 65 to 74 Years | 20 (5.7%) | 11 (2.4%) |
| 75 Years and over | 11 (6.1%) | 12 (2.5%) |
Technology Access in Ilion
Computing Device Access in Ilion
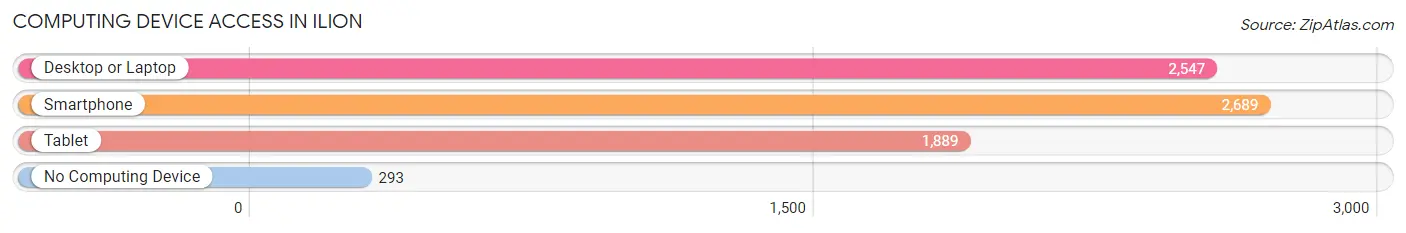
| Device Type | # Households | % Households |
| Desktop or Laptop | 2,547 | 76.3% |
| Smartphone | 2,689 | 80.5% |
| Tablet | 1,889 | 56.6% |
| No Computing Device | 293 | 8.8% |
| Total | 3,340 | 100.0% |
Internet Access in Ilion
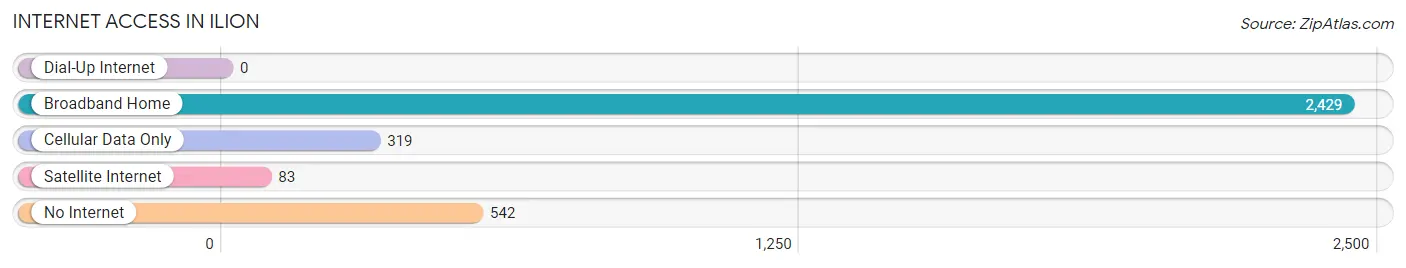
| Internet Type | # Households | % Households |
| Dial-Up Internet | 0 | 0.0% |
| Broadband Home | 2,429 | 72.7% |
| Cellular Data Only | 319 | 9.6% |
| Satellite Internet | 83 | 2.5% |
| No Internet | 542 | 16.2% |
| Total | 3,340 | 100.0% |
Ilion Summary
Ilion is a village located in Herkimer County, New York, United States. It is situated on the Mohawk River, near the foothills of the Adirondack Mountains. The population was 8,053 at the 2010 census. Ilion is part of the Utica–Rome Metropolitan Statistical Area.
History
The village of Ilion was founded in 1788 by German Palatine settlers. The name is derived from the Latin word for “town”. The village was incorporated in 1852.
In the 19th century, Ilion was an important manufacturing center, producing firearms, textiles, and other products. The Remington Arms Company was founded in Ilion in 1816 and was the largest employer in the village for many years. The company produced the first commercially successful typewriter in 1873 and the first practical typewriter in 1878.
Geography
Ilion is located at 43°02′N 75°02′W (43.037, -75.033). According to the United States Census Bureau, the village has a total area of 2.2 square miles (5.7 km2), all of it land.
Demographics
As of the census of 2010, there were 8,053 people, 3,541 households, and 2,092 families residing in the village. The population density was 3,637.7 people per square mile (1,406.2/km2). There were 3,845 housing units at an average density of 1,743.2 per square mile (672.3/km2). The racial makeup of the village was 97.2% White, 0.7% African American, 0.2% Native American, 0.5% Asian, 0.2% from other races, and 1.2% from two or more races. Hispanic or Latino of any race were 1.3% of the population.
Economy
Ilion’s economy is largely based on manufacturing. The Remington Arms Company is the largest employer in the village, with over 1,000 employees. Other major employers include the Ilion Industrial Park, which houses several small businesses, and the Ilion School District.
The village also has a number of small businesses, including restaurants, retail stores, and professional services. The village is home to several historic sites, including the Remington Arms Company Museum and the Herkimer County Historical Society.
Conclusion
Ilion is a village located in Herkimer County, New York, United States. It is situated on the Mohawk River, near the foothills of the Adirondack Mountains. The population was 8,053 at the 2010 census. Ilion is part of the Utica–Rome Metropolitan Statistical Area. The village was founded in 1788 by German Palatine settlers and was incorporated in 1852. Ilion’s economy is largely based on manufacturing, with the Remington Arms Company being the largest employer in the village. The village also has a number of small businesses, including restaurants, retail stores, and professional services. Ilion is home to several historic sites, including the Remington Arms Company Museum and the Herkimer County Historical Society.
Common Questions
What is Per Capita Income in Ilion?
Per Capita income in Ilion is $31,836.
What is the Median Family Income in Ilion?
Median Family Income in Ilion is $89,002.
What is the Median Household income in Ilion?
Median Household Income in Ilion is $71,556.
What is Income or Wage Gap in Ilion?
Income or Wage Gap in Ilion is 21.2%.
Women in Ilion earn 78.8 cents for every dollar earned by a man.
What is Inequality or Gini Index in Ilion?
Inequality or Gini Index in Ilion is 0.38.
What is the Total Population of Ilion?
Total Population of Ilion is 7,703.
What is the Total Male Population of Ilion?
Total Male Population of Ilion is 3,648.
What is the Total Female Population of Ilion?
Total Female Population of Ilion is 4,055.
What is the Ratio of Males per 100 Females in Ilion?
There are 89.96 Males per 100 Females in Ilion.
What is the Ratio of Females per 100 Males in Ilion?
There are 111.16 Females per 100 Males in Ilion.
What is the Median Population Age in Ilion?
Median Population Age in Ilion is 42.8 Years.
What is the Average Family Size in Ilion
Average Family Size in Ilion is 3.0 People.
What is the Average Household Size in Ilion
Average Household Size in Ilion is 2.3 People.
How Large is the Labor Force in Ilion?
There are 3,643 People in the Labor Forcein in Ilion.
What is the Percentage of People in the Labor Force in Ilion?
59.8% of People are in the Labor Force in Ilion.
What is the Unemployment Rate in Ilion?
Unemployment Rate in Ilion is 4.1%.