Homer, NY Map & Demographics
Homer Map
Homer Overview
$39,627
PER CAPITA INCOME
$80,192
AVG FAMILY INCOME
$65,905
AVG HOUSEHOLD INCOME
6.6%
WAGE / INCOME GAP [ % ]
93.4¢/ $1
WAGE / INCOME GAP [ $ ]
0.39
INEQUALITY / GINI INDEX
3,170
TOTAL POPULATION
1,441
MALE POPULATION
1,729
FEMALE POPULATION
83.34
MALES / 100 FEMALES
119.99
FEMALES / 100 MALES
50.2
MEDIAN AGE
2.6
AVG FAMILY SIZE
2.0
AVG HOUSEHOLD SIZE
1,828
LABOR FORCE [ PEOPLE ]
69.1%
PERCENT IN LABOR FORCE
2.0%
UNEMPLOYMENT RATE
Homer Zip Codes
Homer Area Codes
Income in Homer
Income Overview in Homer
Per Capita Income in Homer is $39,627, while median incomes of families and households are $80,192 and $65,905 respectively.
| Characteristic | Number | Measure |
| Per Capita Income | 3,170 | $39,627 |
| Median Family Income | 946 | $80,192 |
| Mean Family Income | 946 | $101,766 |
| Median Household Income | 1,536 | $65,905 |
| Mean Household Income | 1,536 | $83,540 |
| Income Deficit | 946 | $0 |
| Wage / Income Gap (%) | 3,170 | 6.63% |
| Wage / Income Gap ($) | 3,170 | 93.37¢ per $1 |
| Gini / Inequality Index | 3,170 | 0.39 |
Earnings by Sex in Homer
Average Earnings in Homer are $42,197, $43,512 for men and $40,625 for women, a difference of 6.6%.
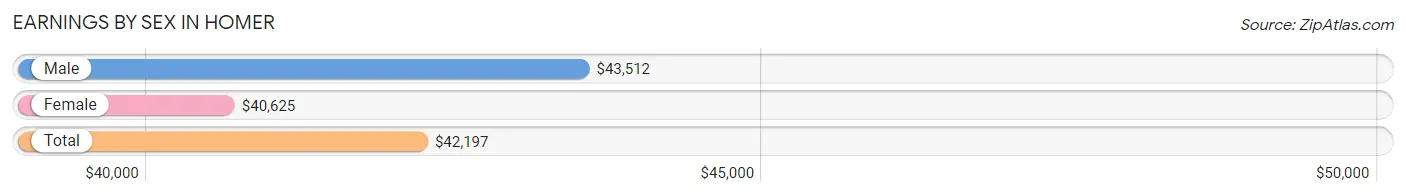
| Sex | Number | Average Earnings |
| Male | 905 (48.7%) | $43,512 |
| Female | 953 (51.3%) | $40,625 |
| Total | 1,858 (100.0%) | $42,197 |
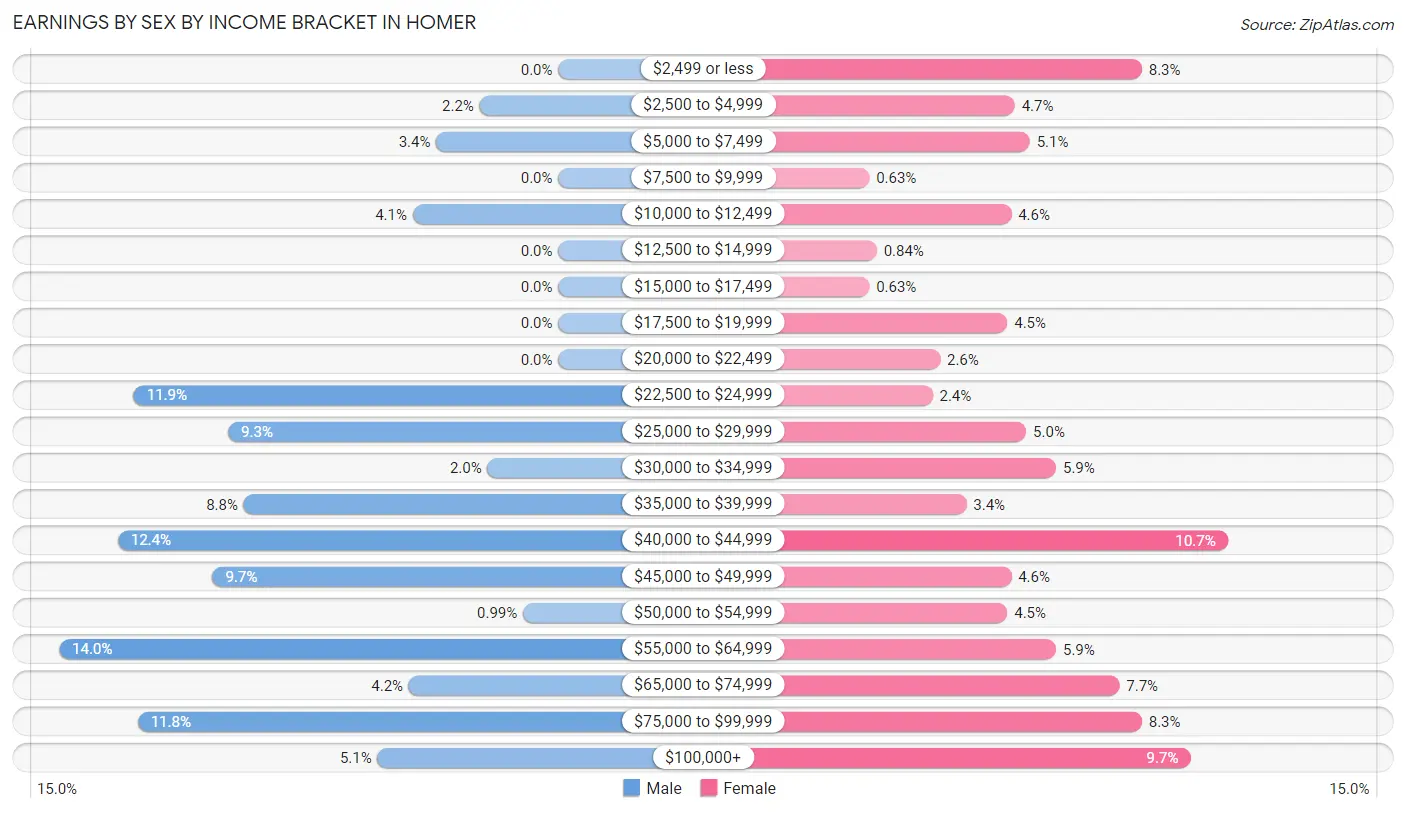
Earnings by Sex by Income Bracket in Homer
The most common earnings brackets in Homer are $55,000 to $64,999 for men (127 | 14.0%) and $40,000 to $44,999 for women (102 | 10.7%).
| Income | Male | Female |
| $2,499 or less | 0 (0.0%) | 79 (8.3%) |
| $2,500 to $4,999 | 20 (2.2%) | 45 (4.7%) |
| $5,000 to $7,499 | 31 (3.4%) | 49 (5.1%) |
| $7,500 to $9,999 | 0 (0.0%) | 6 (0.6%) |
| $10,000 to $12,499 | 37 (4.1%) | 44 (4.6%) |
| $12,500 to $14,999 | 0 (0.0%) | 8 (0.8%) |
| $15,000 to $17,499 | 0 (0.0%) | 6 (0.6%) |
| $17,500 to $19,999 | 0 (0.0%) | 43 (4.5%) |
| $20,000 to $22,499 | 0 (0.0%) | 25 (2.6%) |
| $22,500 to $24,999 | 108 (11.9%) | 23 (2.4%) |
| $25,000 to $29,999 | 84 (9.3%) | 48 (5.0%) |
| $30,000 to $34,999 | 18 (2.0%) | 56 (5.9%) |
| $35,000 to $39,999 | 80 (8.8%) | 32 (3.4%) |
| $40,000 to $44,999 | 112 (12.4%) | 102 (10.7%) |
| $45,000 to $49,999 | 88 (9.7%) | 44 (4.6%) |
| $50,000 to $54,999 | 9 (1.0%) | 43 (4.5%) |
| $55,000 to $64,999 | 127 (14.0%) | 56 (5.9%) |
| $65,000 to $74,999 | 38 (4.2%) | 73 (7.7%) |
| $75,000 to $99,999 | 107 (11.8%) | 79 (8.3%) |
| $100,000+ | 46 (5.1%) | 92 (9.7%) |
| Total | 905 (100.0%) | 953 (100.0%) |
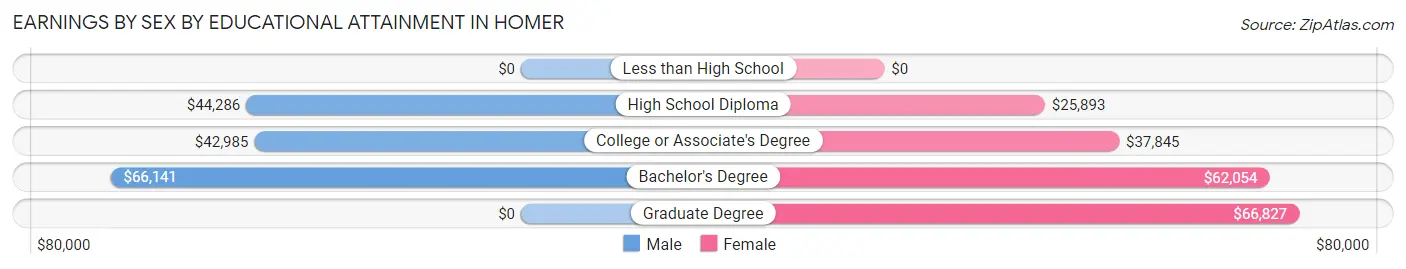
Earnings by Sex by Educational Attainment in Homer
Average earnings in Homer are $44,266 for men and $43,606 for women, a difference of 1.5%. Men with an educational attainment of bachelor's degree enjoy the highest average annual earnings of $66,141, while those with college or associate's degree education earn the least with $42,985. Women with an educational attainment of graduate degree earn the most with the average annual earnings of $66,827, while those with high school diploma education have the smallest earnings of $25,893.
| Educational Attainment | Male Income | Female Income |
| Less than High School | - | - |
| High School Diploma | $44,286 | $25,893 |
| College or Associate's Degree | $42,985 | $37,845 |
| Bachelor's Degree | $66,141 | $62,054 |
| Graduate Degree | - | - |
| Total | $44,266 | $43,606 |
Family Income in Homer
Family Income Brackets in Homer
According to the Homer family income data, there are 241 families falling into the $50,000 to $74,999 income range, which is the most common income bracket and makes up 25.5% of all families.
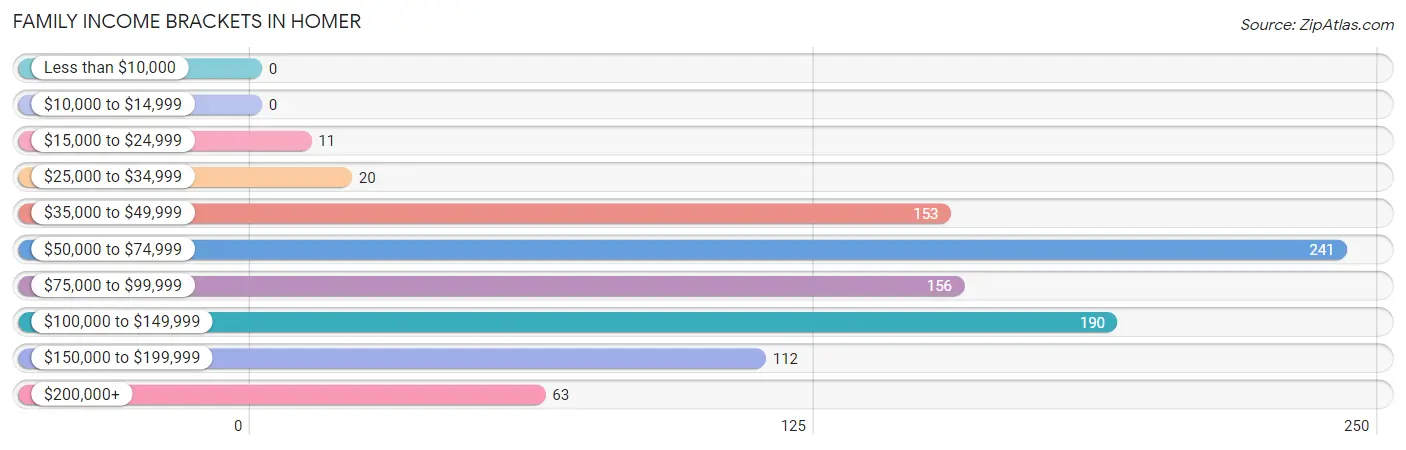
| Income Bracket | # Families | % Families |
| Less than $10,000 | 0 | 0.0% |
| $10,000 to $14,999 | 0 | 0.0% |
| $15,000 to $24,999 | 11 | 1.2% |
| $25,000 to $34,999 | 20 | 2.1% |
| $35,000 to $49,999 | 153 | 16.2% |
| $50,000 to $74,999 | 241 | 25.5% |
| $75,000 to $99,999 | 156 | 16.5% |
| $100,000 to $149,999 | 190 | 20.1% |
| $150,000 to $199,999 | 112 | 11.8% |
| $200,000+ | 63 | 6.7% |
Family Income by Famaliy Size in Homer
4-person families (169 | 17.9%) account for the highest median family income in Homer with $100,855 per family, while 2-person families (573 | 60.6%) have the highest median income of $41,264 per family member.
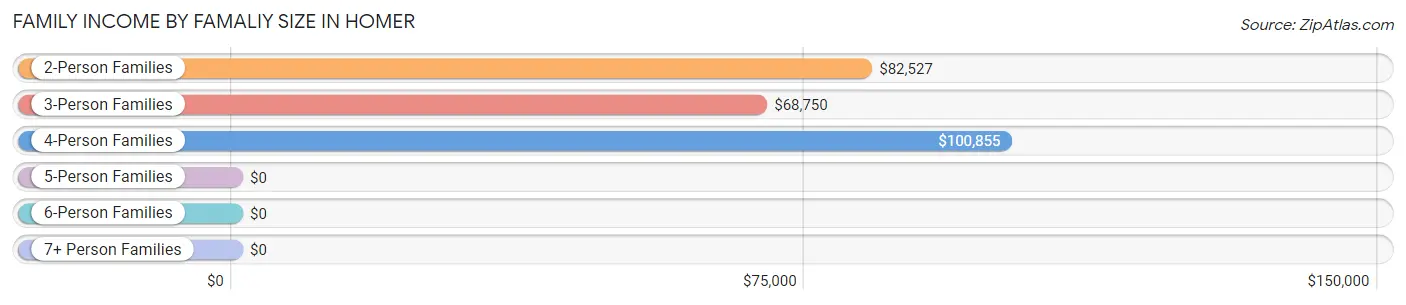
| Income Bracket | # Families | Median Income |
| 2-Person Families | 573 (60.6%) | $82,527 |
| 3-Person Families | 170 (18.0%) | $68,750 |
| 4-Person Families | 169 (17.9%) | $100,855 |
| 5-Person Families | 16 (1.7%) | $0 |
| 6-Person Families | 0 (0.0%) | $0 |
| 7+ Person Families | 18 (1.9%) | $0 |
| Total | 946 (100.0%) | $80,192 |
Family Income by Number of Earners in Homer
The median family income in Homer is $80,192, with families comprising 3+ earners (55) having the highest median family income of $168,618, while families with no earners (136) have the lowest median family income of $54,028, accounting for 5.8% and 14.4% of families, respectively.
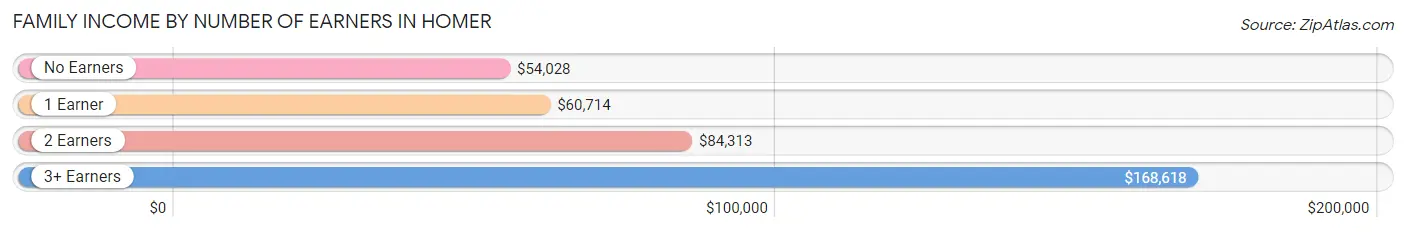
| Number of Earners | # Families | Median Income |
| No Earners | 136 (14.4%) | $54,028 |
| 1 Earner | 204 (21.6%) | $60,714 |
| 2 Earners | 551 (58.3%) | $84,313 |
| 3+ Earners | 55 (5.8%) | $168,618 |
| Total | 946 (100.0%) | $80,192 |
Household Income in Homer
Household Income Brackets in Homer
With 366 households falling in the category, the $50,000 to $74,999 income range is the most frequent in Homer, accounting for 23.8% of all households. In contrast, only 22 households (1.4%) fall into the less than $10,000 income bracket, making it the least populous group.
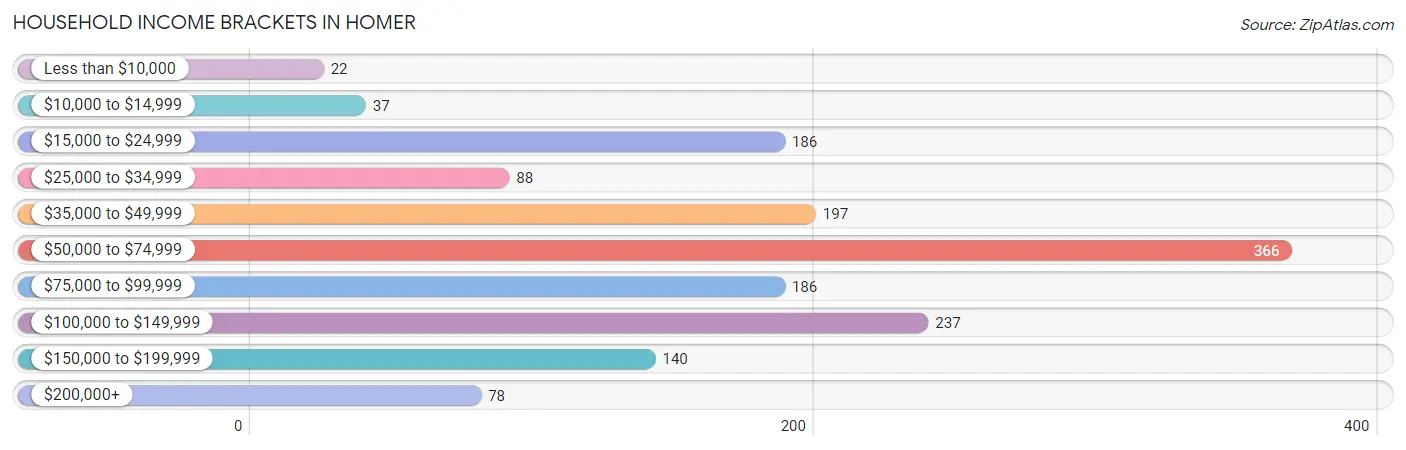
| Income Bracket | # Households | % Households |
| Less than $10,000 | 22 | 1.4% |
| $10,000 to $14,999 | 37 | 2.4% |
| $15,000 to $24,999 | 186 | 12.1% |
| $25,000 to $34,999 | 88 | 5.7% |
| $35,000 to $49,999 | 197 | 12.8% |
| $50,000 to $74,999 | 366 | 23.8% |
| $75,000 to $99,999 | 186 | 12.1% |
| $100,000 to $149,999 | 237 | 15.4% |
| $150,000 to $199,999 | 140 | 9.1% |
| $200,000+ | 78 | 5.1% |
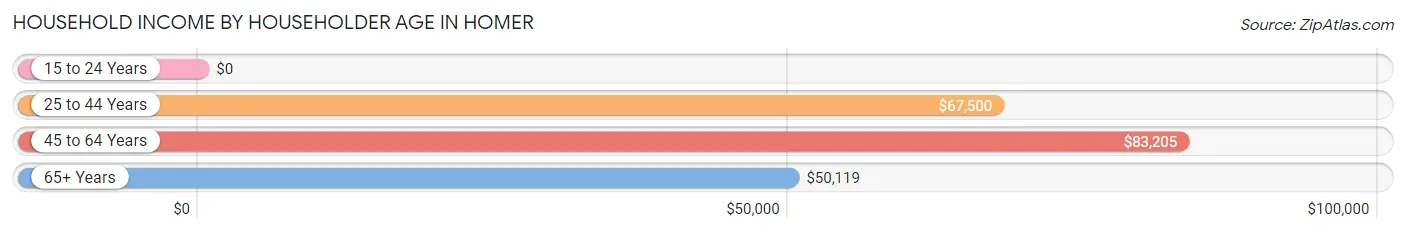
Household Income by Householder Age in Homer
The median household income in Homer is $65,905, with the highest median household income of $83,205 found in the 45 to 64 years age bracket for the primary householder. A total of 556 households (36.2%) fall into this category.
| Income Bracket | # Households | Median Income |
| 15 to 24 Years | 0 (0.0%) | $0 |
| 25 to 44 Years | 332 (21.6%) | $67,500 |
| 45 to 64 Years | 556 (36.2%) | $83,205 |
| 65+ Years | 648 (42.2%) | $50,119 |
| Total | 1,536 (100.0%) | $65,905 |
Poverty in Homer
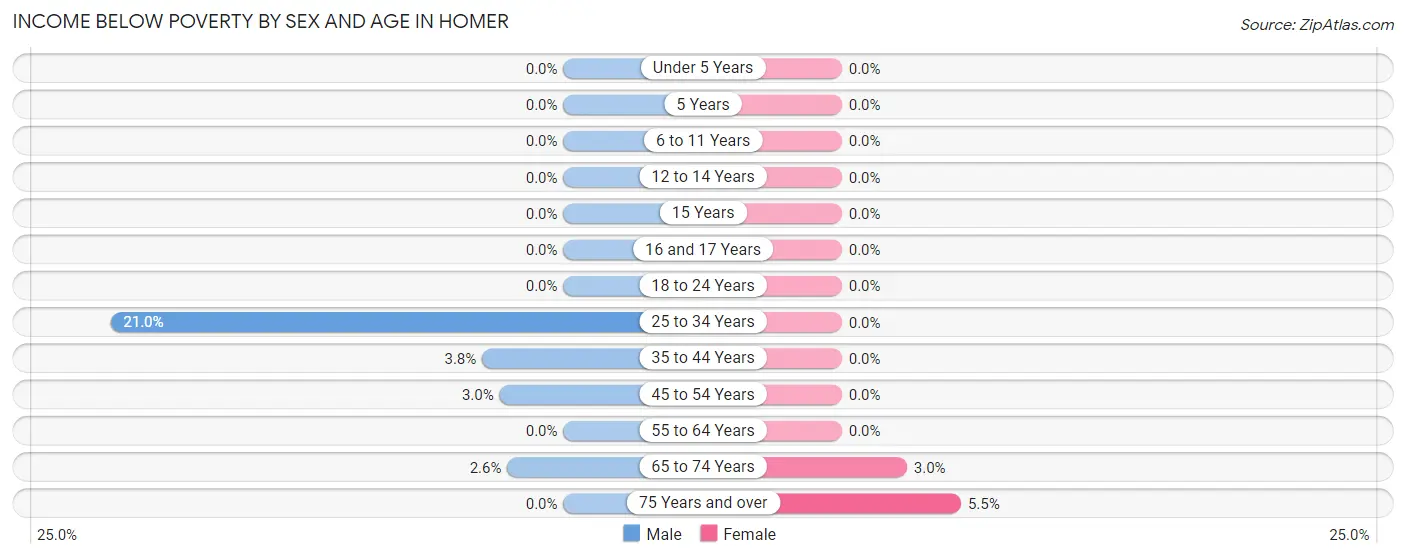
Income Below Poverty by Sex and Age in Homer
With 3.7% poverty level for males and 1.3% for females among the residents of Homer, 25 to 34 year old males and 75 year old and over females are the most vulnerable to poverty, with 37 males (21.0%) and 14 females (5.5%) in their respective age groups living below the poverty level.
| Age Bracket | Male | Female |
| Under 5 Years | 0 (0.0%) | 0 (0.0%) |
| 5 Years | 0 (0.0%) | 0 (0.0%) |
| 6 to 11 Years | 0 (0.0%) | 0 (0.0%) |
| 12 to 14 Years | 0 (0.0%) | 0 (0.0%) |
| 15 Years | 0 (0.0%) | 0 (0.0%) |
| 16 and 17 Years | 0 (0.0%) | 0 (0.0%) |
| 18 to 24 Years | 0 (0.0%) | 0 (0.0%) |
| 25 to 34 Years | 37 (21.0%) | 0 (0.0%) |
| 35 to 44 Years | 6 (3.8%) | 0 (0.0%) |
| 45 to 54 Years | 6 (3.0%) | 0 (0.0%) |
| 55 to 64 Years | 0 (0.0%) | 0 (0.0%) |
| 65 to 74 Years | 4 (2.6%) | 8 (3.0%) |
| 75 Years and over | 0 (0.0%) | 14 (5.5%) |
| Total | 53 (3.7%) | 22 (1.3%) |
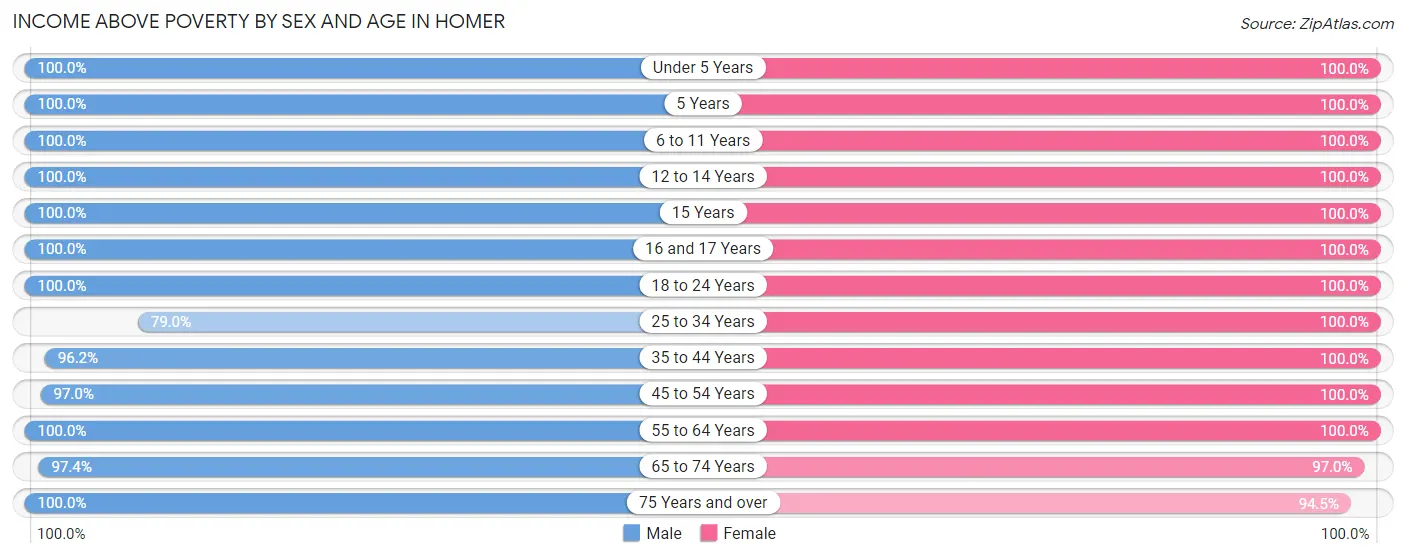
Income Above Poverty by Sex and Age in Homer
According to the poverty statistics in Homer, males aged under 5 years and females aged under 5 years are the age groups that are most secure financially, with 100.0% of males and 100.0% of females in these age groups living above the poverty line.
| Age Bracket | Male | Female |
| Under 5 Years | 70 (100.0%) | 76 (100.0%) |
| 5 Years | 19 (100.0%) | 22 (100.0%) |
| 6 to 11 Years | 102 (100.0%) | 123 (100.0%) |
| 12 to 14 Years | 29 (100.0%) | 51 (100.0%) |
| 15 Years | 13 (100.0%) | 19 (100.0%) |
| 16 and 17 Years | 11 (100.0%) | 78 (100.0%) |
| 18 to 24 Years | 34 (100.0%) | 86 (100.0%) |
| 25 to 34 Years | 139 (79.0%) | 134 (100.0%) |
| 35 to 44 Years | 153 (96.2%) | 152 (100.0%) |
| 45 to 54 Years | 197 (97.0%) | 221 (100.0%) |
| 55 to 64 Years | 280 (100.0%) | 249 (100.0%) |
| 65 to 74 Years | 150 (97.4%) | 257 (97.0%) |
| 75 Years and over | 191 (100.0%) | 239 (94.5%) |
| Total | 1,388 (96.3%) | 1,707 (98.7%) |
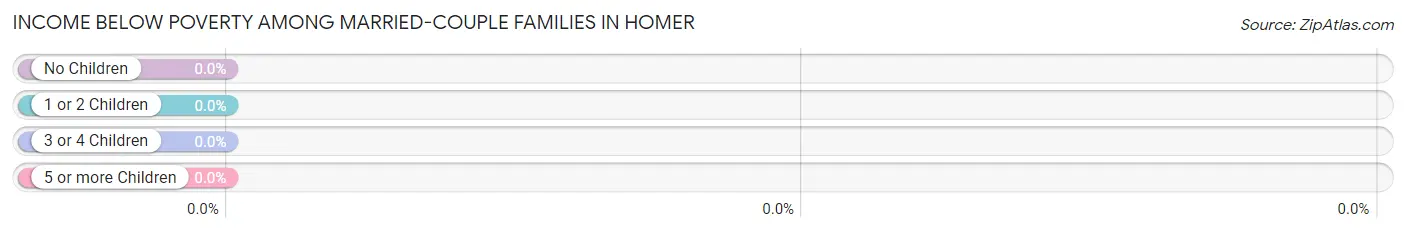
Income Below Poverty Among Married-Couple Families in Homer
| Children | Above Poverty | Below Poverty |
| No Children | 417 (100.0%) | 0 (0.0%) |
| 1 or 2 Children | 282 (100.0%) | 0 (0.0%) |
| 3 or 4 Children | 5 (100.0%) | 0 (0.0%) |
| 5 or more Children | 18 (100.0%) | 0 (0.0%) |
| Total | 722 (100.0%) | 0 (0.0%) |
Income Below Poverty Among Single-Parent Households in Homer
| Children | Single Father | Single Mother |
| No Children | 0 (0.0%) | 0 (0.0%) |
| 1 or 2 Children | 0 (0.0%) | 0 (0.0%) |
| 3 or 4 Children | 0 (0.0%) | 0 (0.0%) |
| 5 or more Children | 0 (0.0%) | 0 (0.0%) |
| Total | 0 (0.0%) | 0 (0.0%) |
Income Below Poverty Among Married-Couple vs Single-Parent Households in Homer
| Children | Married-Couple Families | Single-Parent Households |
| No Children | 0 (0.0%) | 0 (0.0%) |
| 1 or 2 Children | 0 (0.0%) | 0 (0.0%) |
| 3 or 4 Children | 0 (0.0%) | 0 (0.0%) |
| 5 or more Children | 0 (0.0%) | 0 (0.0%) |
| Total | 0 (0.0%) | 0 (0.0%) |
Race in Homer
The most populous races in Homer are White / Caucasian (2,952 | 93.1%), Asian (177 | 5.6%), and Two or more Races (32 | 1.0%).
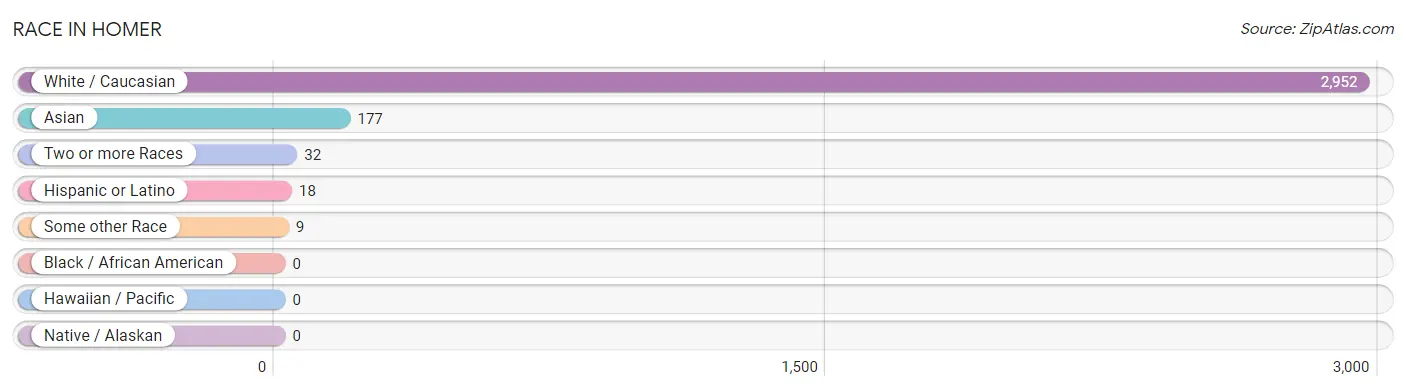
| Race | # Population | % Population |
| Asian | 177 | 5.6% |
| Black / African American | 0 | 0.0% |
| Hawaiian / Pacific | 0 | 0.0% |
| Hispanic or Latino | 18 | 0.6% |
| Native / Alaskan | 0 | 0.0% |
| White / Caucasian | 2,952 | 93.1% |
| Two or more Races | 32 | 1.0% |
| Some other Race | 9 | 0.3% |
| Total | 3,170 | 100.0% |
Ancestry in Homer
The most populous ancestries reported in Homer are English (881 | 27.8%), German (748 | 23.6%), Irish (478 | 15.1%), Italian (311 | 9.8%), and American (178 | 5.6%), together accounting for 81.9% of all Homer residents.
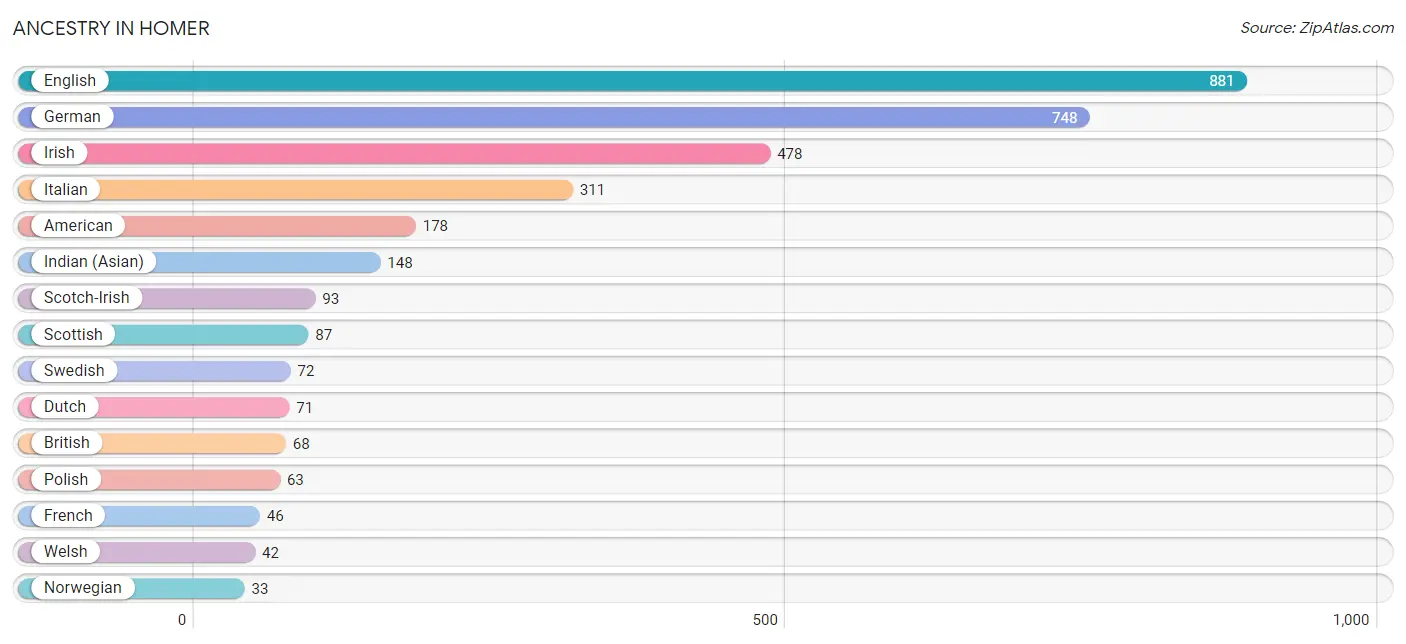
| Ancestry | # Population | % Population |
| American | 178 | 5.6% |
| Blackfeet | 7 | 0.2% |
| British | 68 | 2.1% |
| Canadian | 10 | 0.3% |
| Czech | 13 | 0.4% |
| Dominican | 11 | 0.4% |
| Dutch | 71 | 2.2% |
| English | 881 | 27.8% |
| French | 46 | 1.5% |
| French Canadian | 27 | 0.9% |
| German | 748 | 23.6% |
| Hungarian | 27 | 0.9% |
| Indian (Asian) | 148 | 4.7% |
| Irish | 478 | 15.1% |
| Italian | 311 | 9.8% |
| Lithuanian | 19 | 0.6% |
| Norwegian | 33 | 1.0% |
| Polish | 63 | 2.0% |
| Puerto Rican | 3 | 0.1% |
| Scandinavian | 9 | 0.3% |
| Scotch-Irish | 93 | 2.9% |
| Scottish | 87 | 2.7% |
| Slavic | 7 | 0.2% |
| Slovak | 5 | 0.2% |
| Swedish | 72 | 2.3% |
| Swiss | 21 | 0.7% |
| Thai | 29 | 0.9% |
| Ukrainian | 21 | 0.7% |
| Welsh | 42 | 1.3% | View All 29 Rows |
Immigrants in Homer
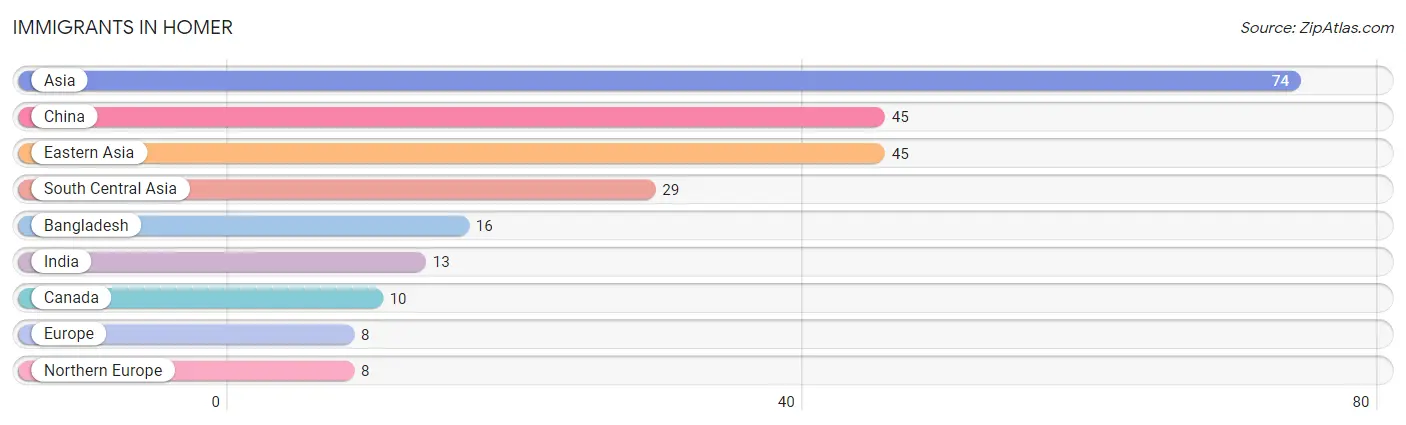
The most numerous immigrant groups reported in Homer came from Asia (74 | 2.3%), China (45 | 1.4%), Eastern Asia (45 | 1.4%), South Central Asia (29 | 0.9%), and Bangladesh (16 | 0.5%), together accounting for 6.6% of all Homer residents.
| Immigration Origin | # Population | % Population |
| Asia | 74 | 2.3% |
| Bangladesh | 16 | 0.5% |
| Canada | 10 | 0.3% |
| China | 45 | 1.4% |
| Eastern Asia | 45 | 1.4% |
| Europe | 8 | 0.3% |
| India | 13 | 0.4% |
| Northern Europe | 8 | 0.3% |
| South Central Asia | 29 | 0.9% | View All 9 Rows |
Sex and Age in Homer
Sex and Age in Homer
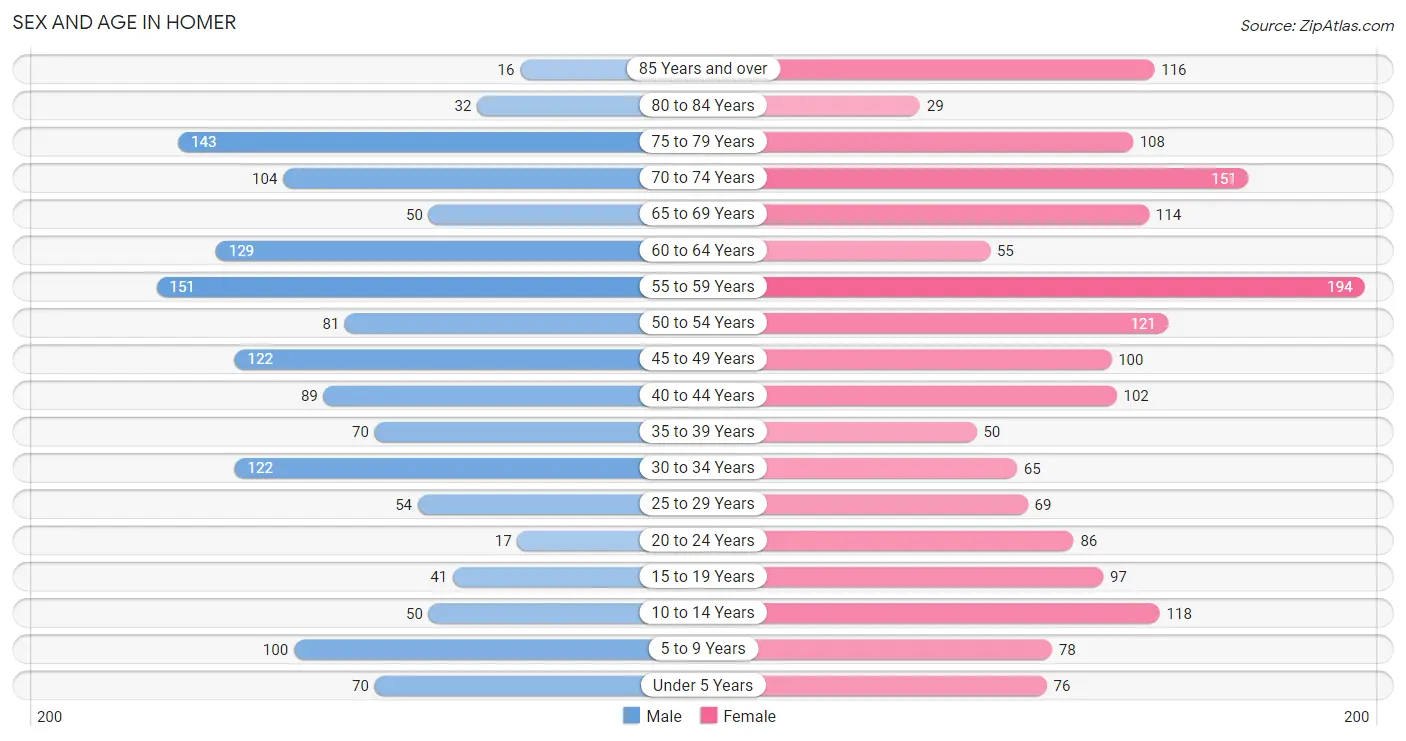
The most populous age groups in Homer are 55 to 59 Years (151 | 10.5%) for men and 55 to 59 Years (194 | 11.2%) for women.
| Age Bracket | Male | Female |
| Under 5 Years | 70 (4.9%) | 76 (4.4%) |
| 5 to 9 Years | 100 (6.9%) | 78 (4.5%) |
| 10 to 14 Years | 50 (3.5%) | 118 (6.8%) |
| 15 to 19 Years | 41 (2.9%) | 97 (5.6%) |
| 20 to 24 Years | 17 (1.2%) | 86 (5.0%) |
| 25 to 29 Years | 54 (3.7%) | 69 (4.0%) |
| 30 to 34 Years | 122 (8.5%) | 65 (3.8%) |
| 35 to 39 Years | 70 (4.9%) | 50 (2.9%) |
| 40 to 44 Years | 89 (6.2%) | 102 (5.9%) |
| 45 to 49 Years | 122 (8.5%) | 100 (5.8%) |
| 50 to 54 Years | 81 (5.6%) | 121 (7.0%) |
| 55 to 59 Years | 151 (10.5%) | 194 (11.2%) |
| 60 to 64 Years | 129 (8.9%) | 55 (3.2%) |
| 65 to 69 Years | 50 (3.5%) | 114 (6.6%) |
| 70 to 74 Years | 104 (7.2%) | 151 (8.7%) |
| 75 to 79 Years | 143 (9.9%) | 108 (6.2%) |
| 80 to 84 Years | 32 (2.2%) | 29 (1.7%) |
| 85 Years and over | 16 (1.1%) | 116 (6.7%) |
| Total | 1,441 (100.0%) | 1,729 (100.0%) |
Families and Households in Homer
Median Family Size in Homer
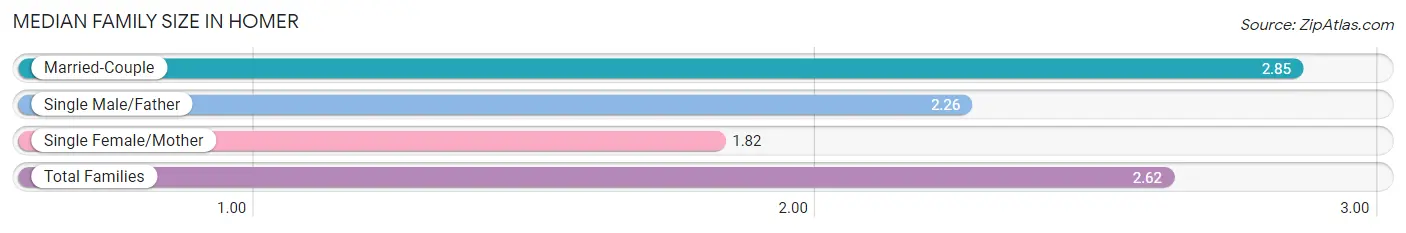
The median family size in Homer is 2.62 persons per family, with married-couple families (722 | 76.3%) accounting for the largest median family size of 2.85 persons per family. On the other hand, single female/mother families (197 | 20.8%) represent the smallest median family size with 1.82 persons per family.
| Family Type | # Families | Family Size |
| Married-Couple | 722 (76.3%) | 2.85 |
| Single Male/Father | 27 (2.9%) | 2.26 |
| Single Female/Mother | 197 (20.8%) | 1.82 |
| Total Families | 946 (100.0%) | 2.62 |
Median Household Size in Homer
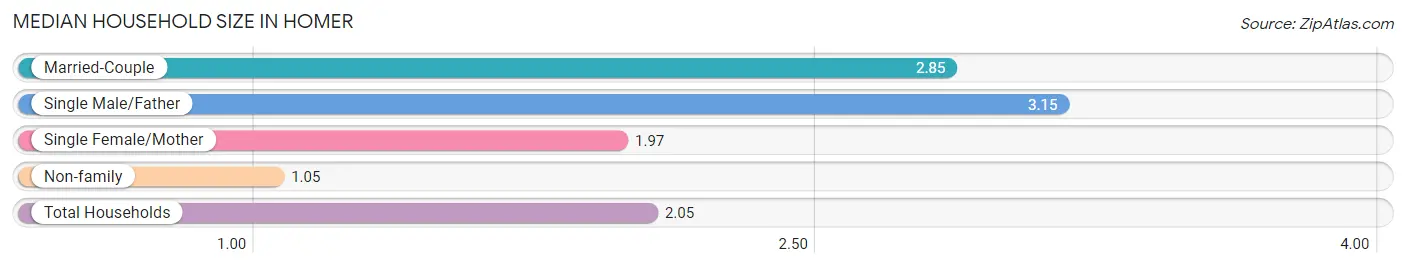
The median household size in Homer is 2.05 persons per household, with single male/father households (27 | 1.8%) accounting for the largest median household size of 3.15 persons per household. non-family households (590 | 38.4%) represent the smallest median household size with 1.05 persons per household.
| Household Type | # Households | Household Size |
| Married-Couple | 722 (47.0%) | 2.85 |
| Single Male/Father | 27 (1.8%) | 3.15 |
| Single Female/Mother | 197 (12.8%) | 1.97 |
| Non-family | 590 (38.4%) | 1.05 |
| Total Households | 1,536 (100.0%) | 2.05 |
Household Size by Marriage Status in Homer
Out of a total of 1,536 households in Homer, 946 (61.6%) are family households, while 590 (38.4%) are nonfamily households. The most numerous type of family households are 2-person households, comprising 548, and the most common type of nonfamily households are 1-person households, comprising 561.
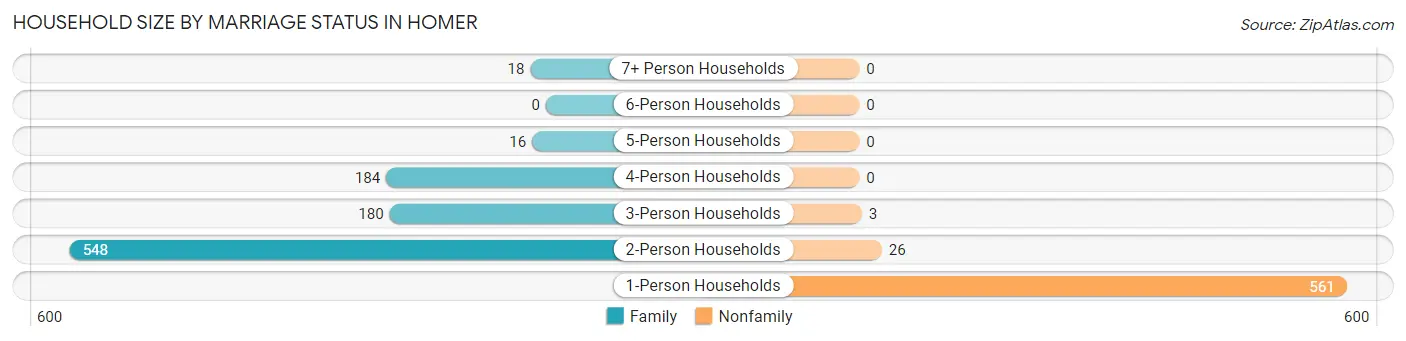
| Household Size | Family Households | Nonfamily Households |
| 1-Person Households | - | 561 (36.5%) |
| 2-Person Households | 548 (35.7%) | 26 (1.7%) |
| 3-Person Households | 180 (11.7%) | 3 (0.2%) |
| 4-Person Households | 184 (12.0%) | 0 (0.0%) |
| 5-Person Households | 16 (1.0%) | 0 (0.0%) |
| 6-Person Households | 0 (0.0%) | 0 (0.0%) |
| 7+ Person Households | 18 (1.2%) | 0 (0.0%) |
| Total | 946 (61.6%) | 590 (38.4%) |
Female Fertility in Homer
Fertility by Age in Homer
Average fertility rate in Homer is 89.0 births per 1,000 women. Women in the age bracket of 35 to 50 years have the highest fertility rate with 186.0 births per 1,000 women. Women in the age bracket of 35 to 50 years acount for 100.0% of all women with births.
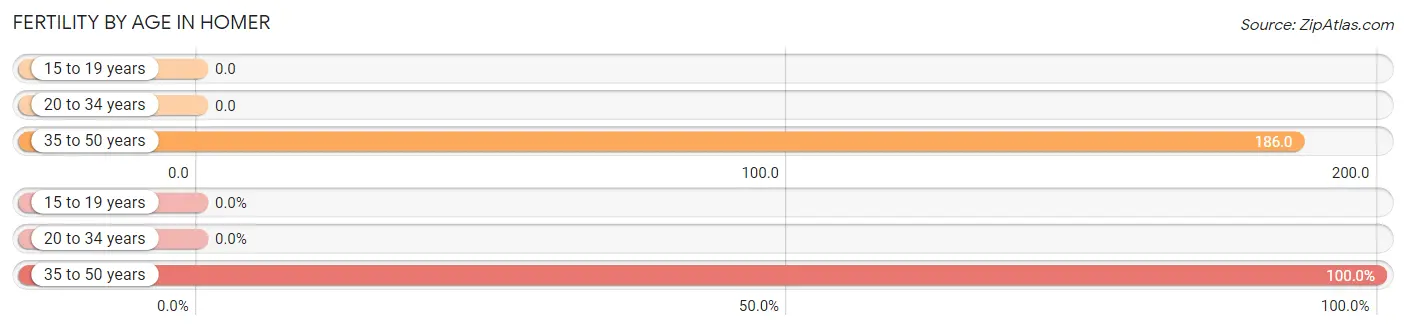
| Age Bracket | Women with Births | Births / 1,000 Women |
| 15 to 19 years | 0 (0.0%) | 0.0 |
| 20 to 34 years | 0 (0.0%) | 0.0 |
| 35 to 50 years | 54 (100.0%) | 186.0 |
| Total | 54 (100.0%) | 89.0 |
Fertility by Age by Marriage Status in Homer
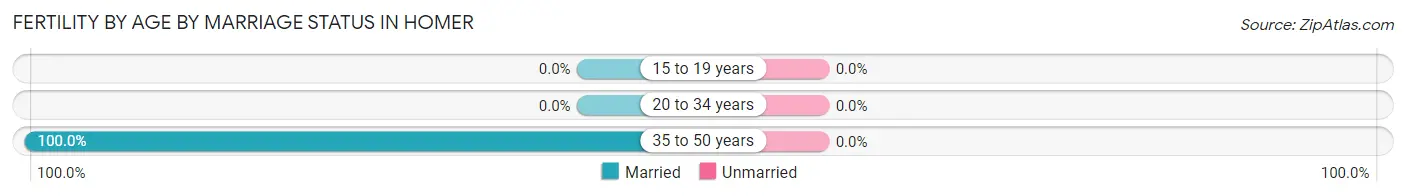
| Age Bracket | Married | Unmarried |
| 15 to 19 years | 0 (0.0%) | 0 (0.0%) |
| 20 to 34 years | 0 (0.0%) | 0 (0.0%) |
| 35 to 50 years | 54 (100.0%) | 0 (0.0%) |
| Total | 54 (100.0%) | 0 (0.0%) |
Fertility by Education in Homer
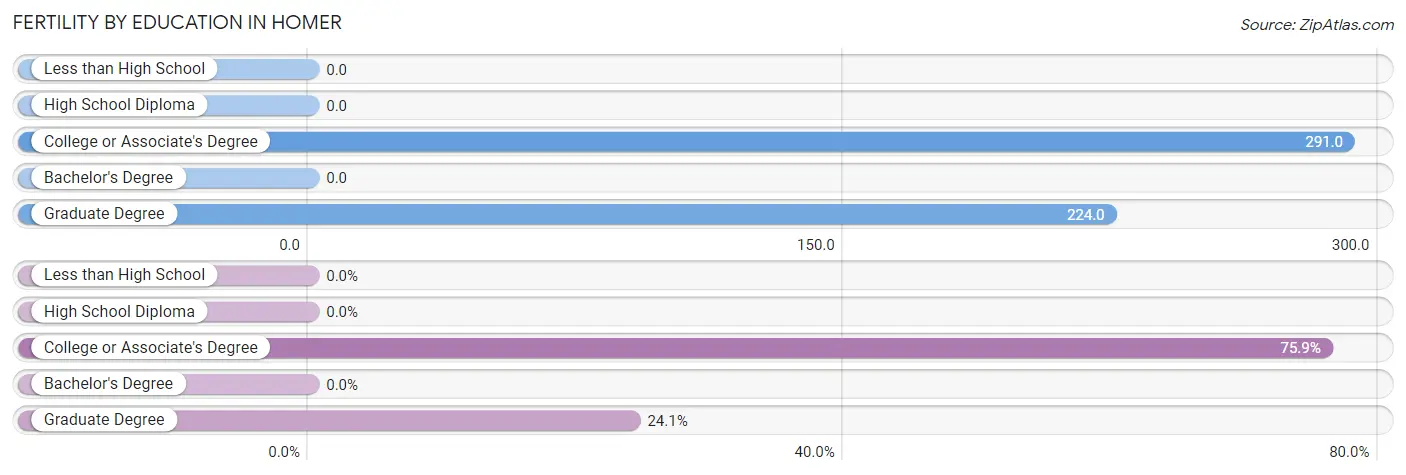
| Educational Attainment | Women with Births | Births / 1,000 Women |
| Less than High School | 0 (0.0%) | 0.0 |
| High School Diploma | 0 (0.0%) | 0.0 |
| College or Associate's Degree | 41 (75.9%) | 291.0 |
| Bachelor's Degree | 0 (0.0%) | 0.0 |
| Graduate Degree | 13 (24.1%) | 224.0 |
| Total | 54 (100.0%) | 89.0 |
Fertility by Education by Marriage Status in Homer
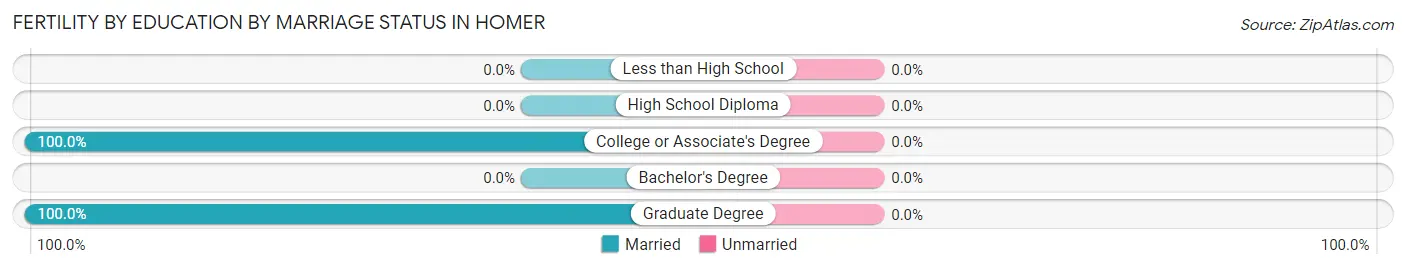
| Educational Attainment | Married | Unmarried |
| Less than High School | 0 (0.0%) | 0 (0.0%) |
| High School Diploma | 0 (0.0%) | 0 (0.0%) |
| College or Associate's Degree | 41 (100.0%) | 0 (0.0%) |
| Bachelor's Degree | 0 (0.0%) | 0 (0.0%) |
| Graduate Degree | 13 (100.0%) | 0 (0.0%) |
| Total | 54 (100.0%) | 0 (0.0%) |
Employment Characteristics in Homer
Employment by Class of Employer in Homer
Among the 1,751 employed individuals in Homer, private company employees (754 | 43.1%), state government employees (251 | 14.3%), and self-employed (not incorporated) (225 | 12.9%) make up the most common classes of employment.
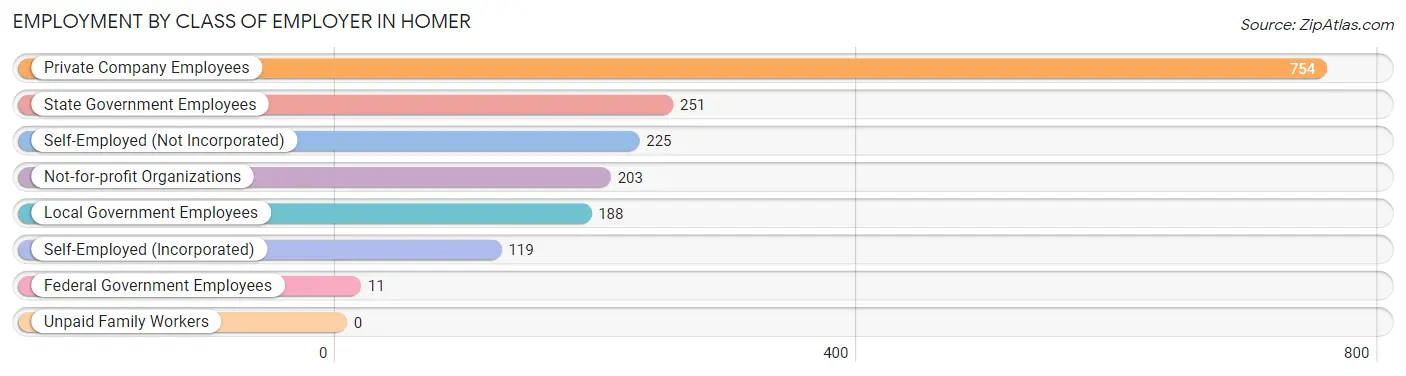
| Employer Class | # Employees | % Employees |
| Private Company Employees | 754 | 43.1% |
| Self-Employed (Incorporated) | 119 | 6.8% |
| Self-Employed (Not Incorporated) | 225 | 12.9% |
| Not-for-profit Organizations | 203 | 11.6% |
| Local Government Employees | 188 | 10.7% |
| State Government Employees | 251 | 14.3% |
| Federal Government Employees | 11 | 0.6% |
| Unpaid Family Workers | 0 | 0.0% |
| Total | 1,751 | 100.0% |
Employment Status by Age in Homer
According to the labor force statistics for Homer, out of the total population over 16 years of age (2,646), 69.1% or 1,828 individuals are in the labor force, with 2.0% or 37 of them unemployed. The age group with the highest labor force participation rate is 25 to 29 years, with 100.0% or 123 individuals in the labor force. Within the labor force, the 20 to 24 years age range has the highest percentage of unemployed individuals, with 24.7% or 20 of them being unemployed.
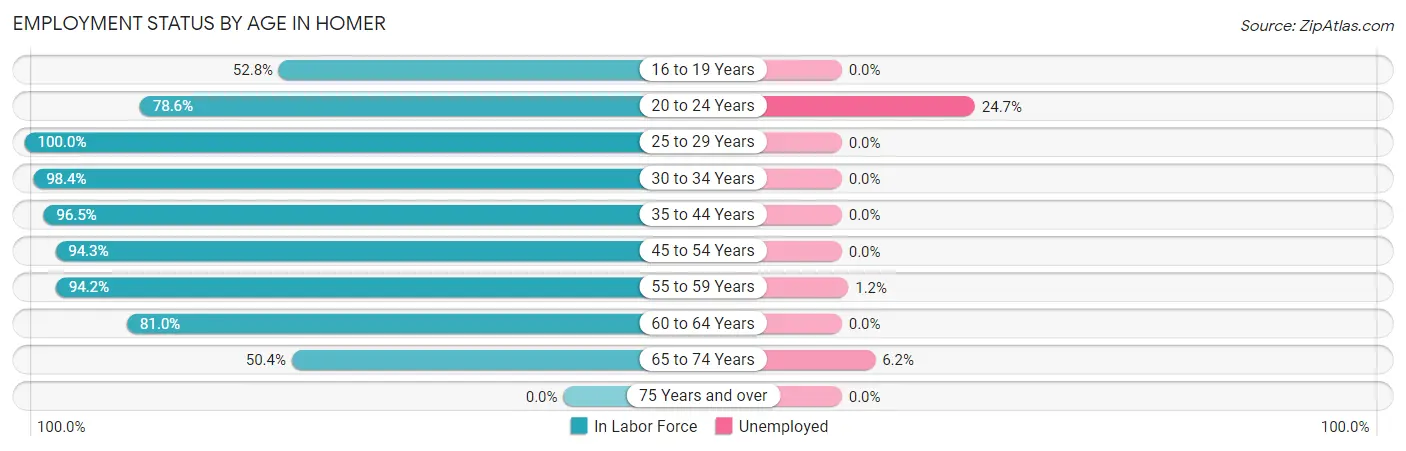
| Age Bracket | In Labor Force | Unemployed |
| 16 to 19 Years | 56 (52.8%) | 0 (0.0%) |
| 20 to 24 Years | 81 (78.6%) | 20 (24.7%) |
| 25 to 29 Years | 123 (100.0%) | 0 (0.0%) |
| 30 to 34 Years | 184 (98.4%) | 0 (0.0%) |
| 35 to 44 Years | 300 (96.5%) | 0 (0.0%) |
| 45 to 54 Years | 400 (94.3%) | 0 (0.0%) |
| 55 to 59 Years | 325 (94.2%) | 4 (1.2%) |
| 60 to 64 Years | 149 (81.0%) | 0 (0.0%) |
| 65 to 74 Years | 211 (50.4%) | 13 (6.2%) |
| 75 Years and over | 0 (0.0%) | 0 (0.0%) |
| Total | 1,828 (69.1%) | 37 (2.0%) |
Employment Status by Educational Attainment in Homer
According to labor force statistics for Homer, 94.1% of individuals (1,481) out of the total population between 25 and 64 years of age (1,574) are in the labor force, with 0.3% or 4 of them being unemployed. The group with the highest labor force participation rate are those with the educational attainment of high school diploma, with 95.4% or 309 individuals in the labor force. Within the labor force, individuals with college / associate degree education have the highest percentage of unemployment, with 0.8% or 4 of them being unemployed.
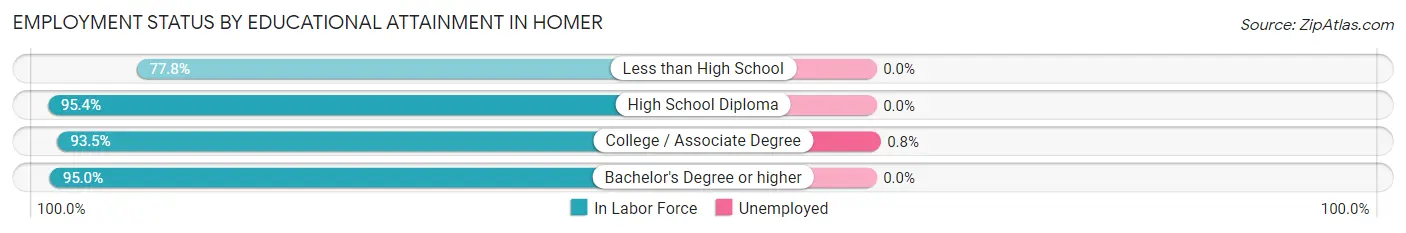
| Educational Attainment | In Labor Force | Unemployed |
| Less than High School | 35 (77.8%) | 0 (0.0%) |
| High School Diploma | 309 (95.4%) | 0 (0.0%) |
| College / Associate Degree | 504 (93.5%) | 4 (0.8%) |
| Bachelor's Degree or higher | 633 (95.0%) | 0 (0.0%) |
| Total | 1,481 (94.1%) | 5 (0.3%) |
Employment Occupations by Sex in Homer
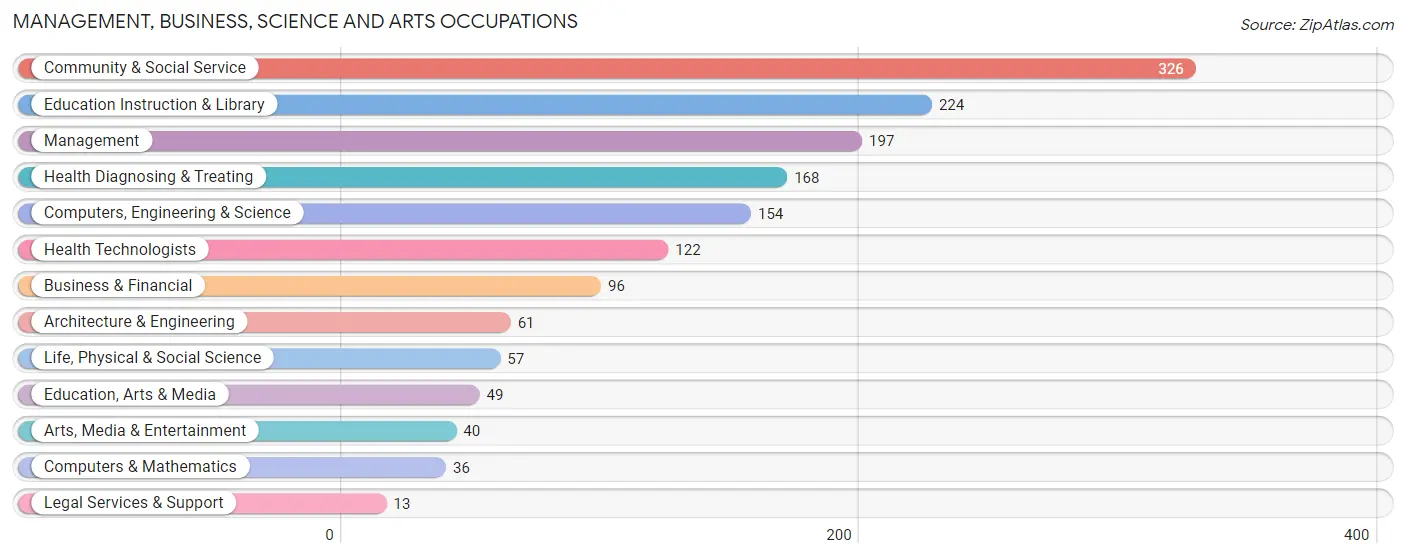
Management, Business, Science and Arts Occupations
The most common Management, Business, Science and Arts occupations in Homer are Community & Social Service (326 | 18.2%), Education Instruction & Library (224 | 12.5%), Management (197 | 11.0%), Health Diagnosing & Treating (168 | 9.4%), and Computers, Engineering & Science (154 | 8.6%).
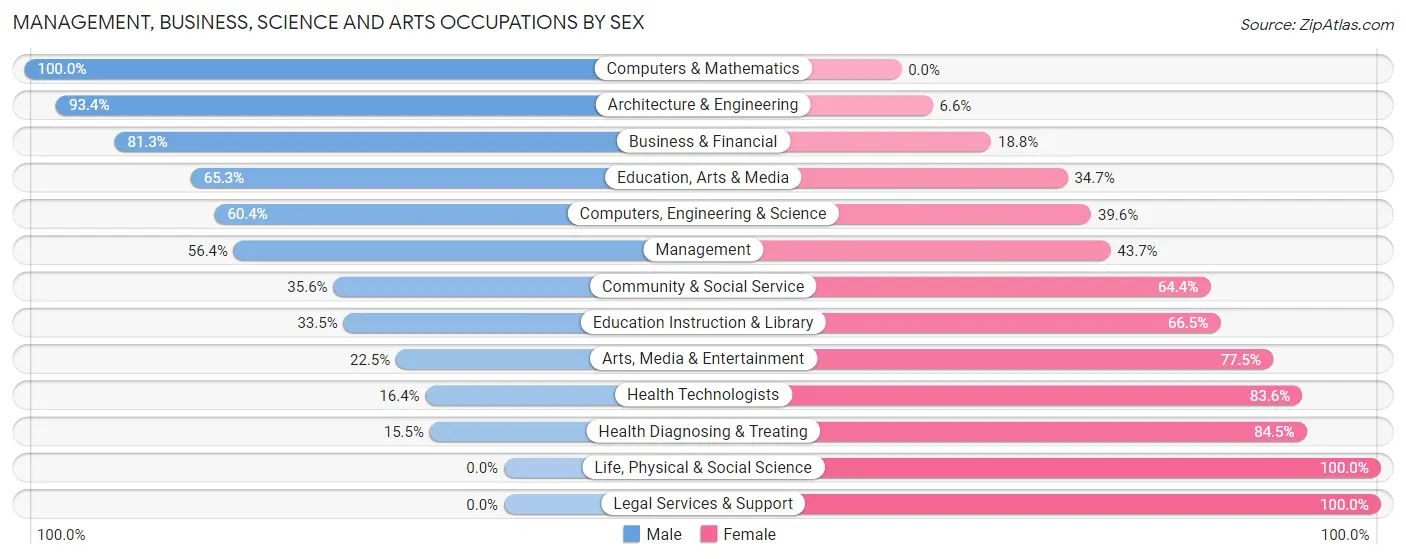
Management, Business, Science and Arts Occupations by Sex
Within the Management, Business, Science and Arts occupations in Homer, the most male-oriented occupations are Computers & Mathematics (100.0%), Architecture & Engineering (93.4%), and Business & Financial (81.2%), while the most female-oriented occupations are Life, Physical & Social Science (100.0%), Legal Services & Support (100.0%), and Health Diagnosing & Treating (84.5%).
| Occupation | Male | Female |
| Management | 111 (56.4%) | 86 (43.6%) |
| Business & Financial | 78 (81.2%) | 18 (18.8%) |
| Computers, Engineering & Science | 93 (60.4%) | 61 (39.6%) |
| Computers & Mathematics | 36 (100.0%) | 0 (0.0%) |
| Architecture & Engineering | 57 (93.4%) | 4 (6.6%) |
| Life, Physical & Social Science | 0 (0.0%) | 57 (100.0%) |
| Community & Social Service | 116 (35.6%) | 210 (64.4%) |
| Education, Arts & Media | 32 (65.3%) | 17 (34.7%) |
| Legal Services & Support | 0 (0.0%) | 13 (100.0%) |
| Education Instruction & Library | 75 (33.5%) | 149 (66.5%) |
| Arts, Media & Entertainment | 9 (22.5%) | 31 (77.5%) |
| Health Diagnosing & Treating | 26 (15.5%) | 142 (84.5%) |
| Health Technologists | 20 (16.4%) | 102 (83.6%) |
| Total (Category) | 424 (45.1%) | 517 (54.9%) |
| Total (Overall) | 897 (50.1%) | 895 (49.9%) |
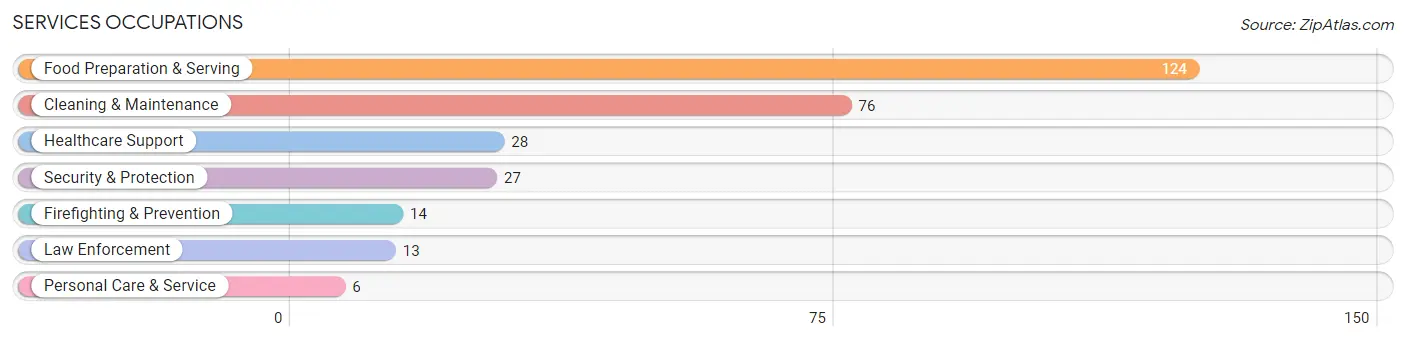
Services Occupations
The most common Services occupations in Homer are Food Preparation & Serving (124 | 6.9%), Cleaning & Maintenance (76 | 4.2%), Healthcare Support (28 | 1.6%), Security & Protection (27 | 1.5%), and Firefighting & Prevention (14 | 0.8%).
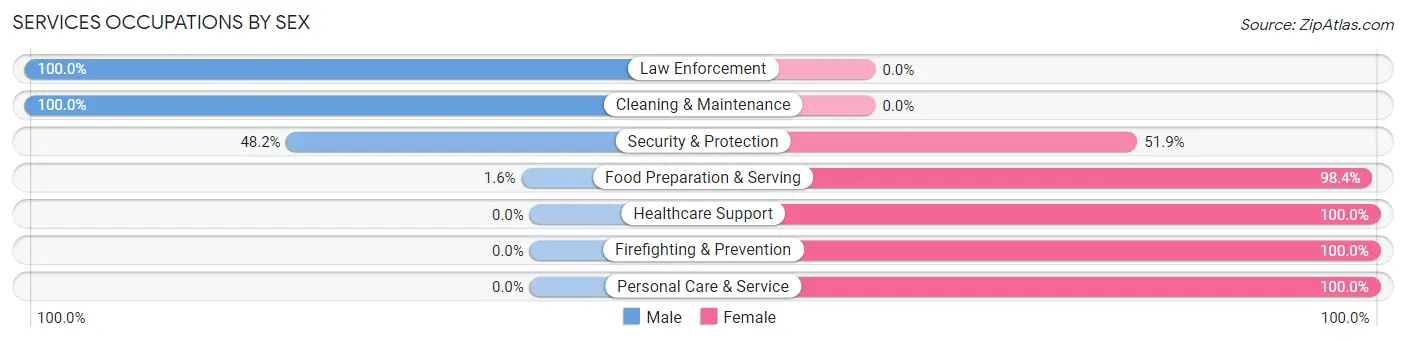
Services Occupations by Sex
Within the Services occupations in Homer, the most male-oriented occupations are Law Enforcement (100.0%), Cleaning & Maintenance (100.0%), and Security & Protection (48.1%), while the most female-oriented occupations are Healthcare Support (100.0%), Firefighting & Prevention (100.0%), and Personal Care & Service (100.0%).
| Occupation | Male | Female |
| Healthcare Support | 0 (0.0%) | 28 (100.0%) |
| Security & Protection | 13 (48.1%) | 14 (51.8%) |
| Firefighting & Prevention | 0 (0.0%) | 14 (100.0%) |
| Law Enforcement | 13 (100.0%) | 0 (0.0%) |
| Food Preparation & Serving | 2 (1.6%) | 122 (98.4%) |
| Cleaning & Maintenance | 76 (100.0%) | 0 (0.0%) |
| Personal Care & Service | 0 (0.0%) | 6 (100.0%) |
| Total (Category) | 91 (34.9%) | 170 (65.1%) |
| Total (Overall) | 897 (50.1%) | 895 (49.9%) |
Sales and Office Occupations
The most common Sales and Office occupations in Homer are Sales & Related (188 | 10.5%), and Office & Administration (135 | 7.5%).
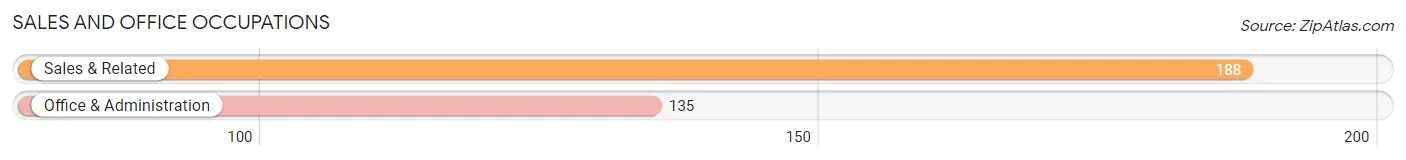
Sales and Office Occupations by Sex
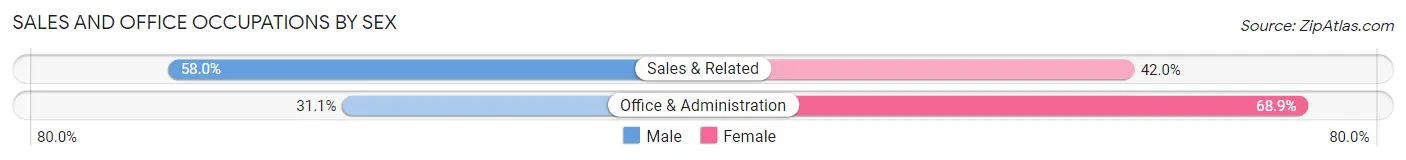
| Occupation | Male | Female |
| Sales & Related | 109 (58.0%) | 79 (42.0%) |
| Office & Administration | 42 (31.1%) | 93 (68.9%) |
| Total (Category) | 151 (46.8%) | 172 (53.2%) |
| Total (Overall) | 897 (50.1%) | 895 (49.9%) |
Natural Resources, Construction and Maintenance Occupations
The most common Natural Resources, Construction and Maintenance occupations in Homer are Construction & Extraction (144 | 8.0%), and Installation, Maintenance & Repair (26 | 1.5%).
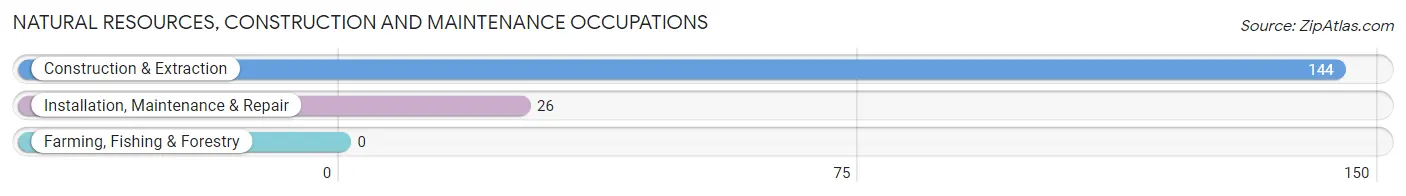
Natural Resources, Construction and Maintenance Occupations by Sex
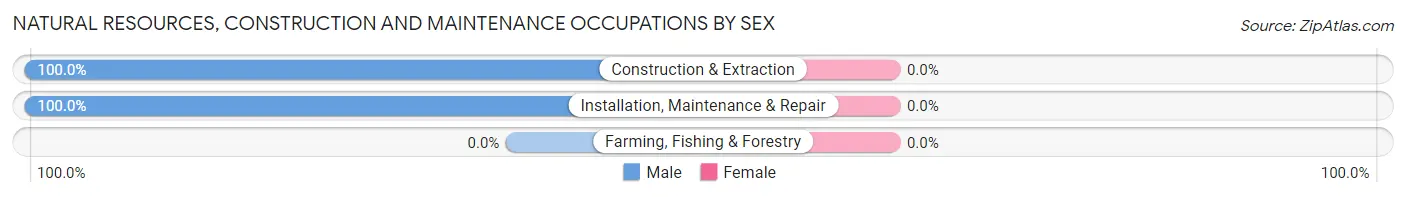
| Occupation | Male | Female |
| Farming, Fishing & Forestry | 0 (0.0%) | 0 (0.0%) |
| Construction & Extraction | 144 (100.0%) | 0 (0.0%) |
| Installation, Maintenance & Repair | 26 (100.0%) | 0 (0.0%) |
| Total (Category) | 170 (100.0%) | 0 (0.0%) |
| Total (Overall) | 897 (50.1%) | 895 (49.9%) |
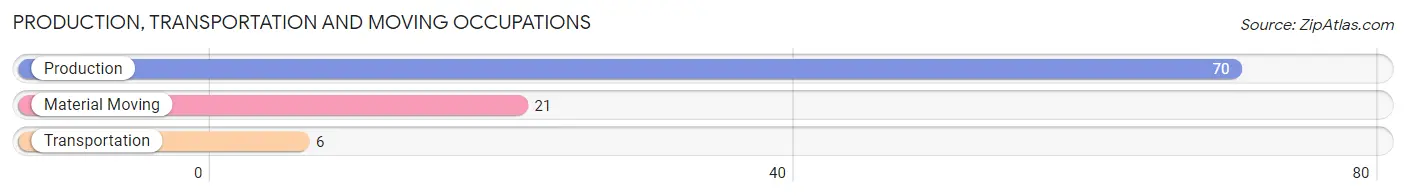
Production, Transportation and Moving Occupations
The most common Production, Transportation and Moving occupations in Homer are Production (70 | 3.9%), Material Moving (21 | 1.2%), and Transportation (6 | 0.3%).
Production, Transportation and Moving Occupations by Sex
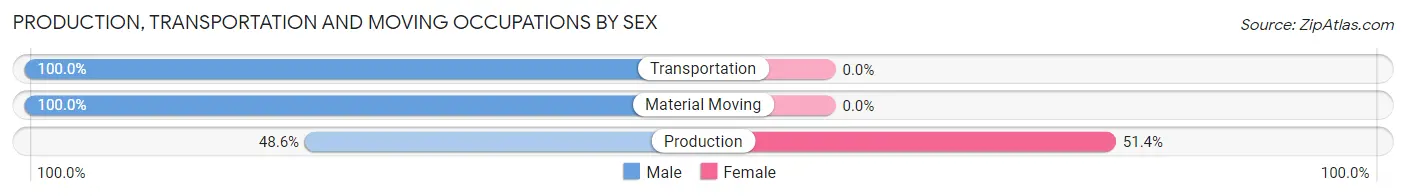
| Occupation | Male | Female |
| Production | 34 (48.6%) | 36 (51.4%) |
| Transportation | 6 (100.0%) | 0 (0.0%) |
| Material Moving | 21 (100.0%) | 0 (0.0%) |
| Total (Category) | 61 (62.9%) | 36 (37.1%) |
| Total (Overall) | 897 (50.1%) | 895 (49.9%) |
Employment Industries by Sex in Homer
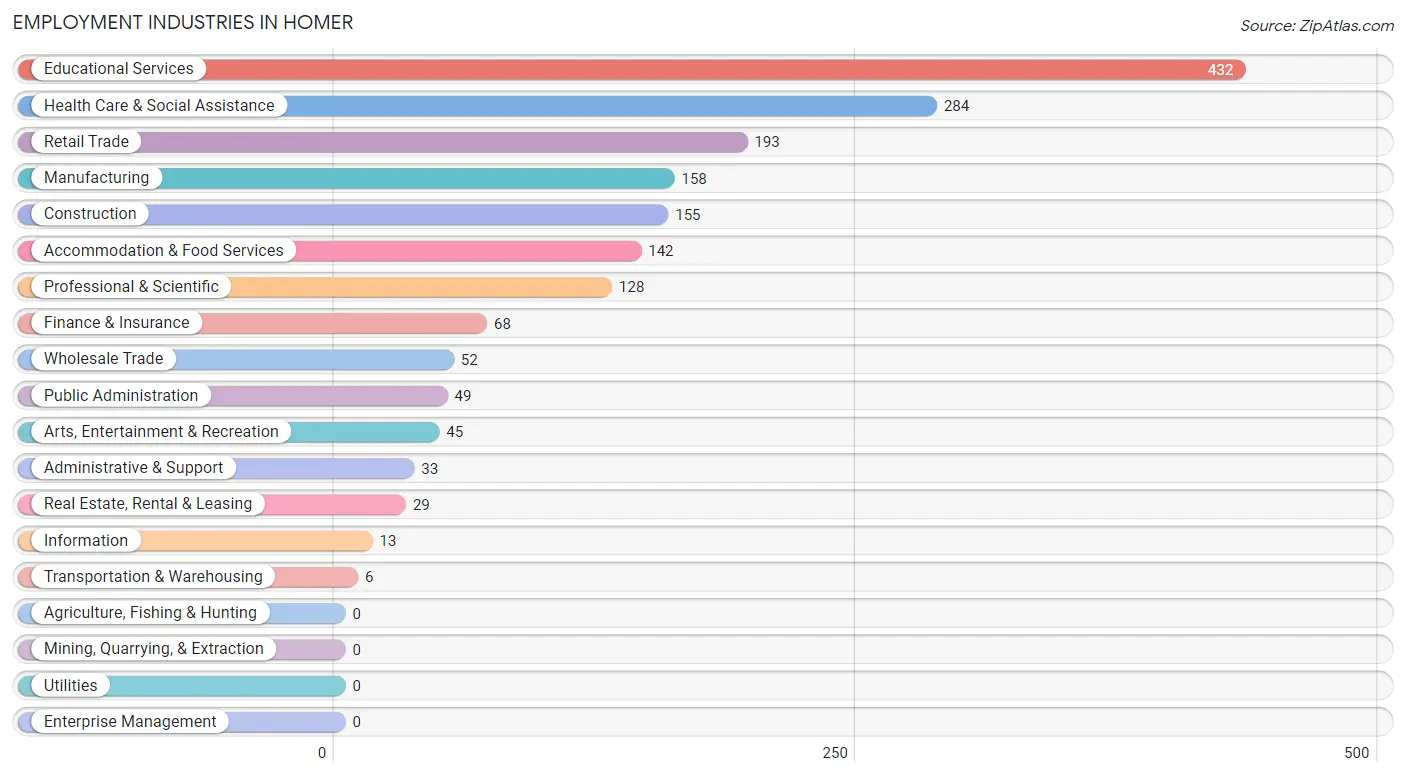
Employment Industries in Homer
The major employment industries in Homer include Educational Services (432 | 24.1%), Health Care & Social Assistance (284 | 15.9%), Retail Trade (193 | 10.8%), Manufacturing (158 | 8.8%), and Construction (155 | 8.6%).
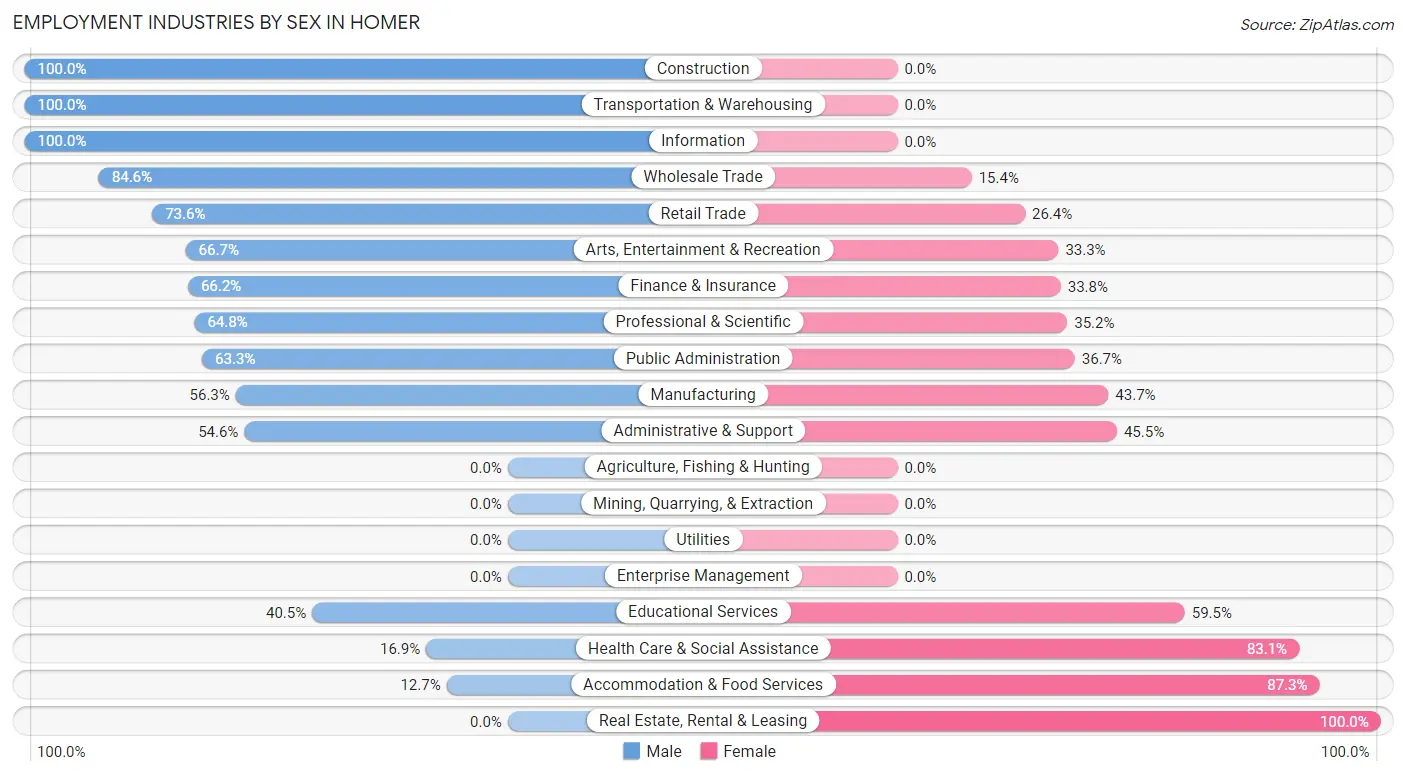
Employment Industries by Sex in Homer
The Homer industries that see more men than women are Construction (100.0%), Transportation & Warehousing (100.0%), and Information (100.0%), whereas the industries that tend to have a higher number of women are Real Estate, Rental & Leasing (100.0%), Accommodation & Food Services (87.3%), and Health Care & Social Assistance (83.1%).
| Industry | Male | Female |
| Agriculture, Fishing & Hunting | 0 (0.0%) | 0 (0.0%) |
| Mining, Quarrying, & Extraction | 0 (0.0%) | 0 (0.0%) |
| Construction | 155 (100.0%) | 0 (0.0%) |
| Manufacturing | 89 (56.3%) | 69 (43.7%) |
| Wholesale Trade | 44 (84.6%) | 8 (15.4%) |
| Retail Trade | 142 (73.6%) | 51 (26.4%) |
| Transportation & Warehousing | 6 (100.0%) | 0 (0.0%) |
| Utilities | 0 (0.0%) | 0 (0.0%) |
| Information | 13 (100.0%) | 0 (0.0%) |
| Finance & Insurance | 45 (66.2%) | 23 (33.8%) |
| Real Estate, Rental & Leasing | 0 (0.0%) | 29 (100.0%) |
| Professional & Scientific | 83 (64.8%) | 45 (35.2%) |
| Enterprise Management | 0 (0.0%) | 0 (0.0%) |
| Administrative & Support | 18 (54.5%) | 15 (45.5%) |
| Educational Services | 175 (40.5%) | 257 (59.5%) |
| Health Care & Social Assistance | 48 (16.9%) | 236 (83.1%) |
| Arts, Entertainment & Recreation | 30 (66.7%) | 15 (33.3%) |
| Accommodation & Food Services | 18 (12.7%) | 124 (87.3%) |
| Public Administration | 31 (63.3%) | 18 (36.7%) |
| Total | 897 (50.1%) | 895 (49.9%) |
Education in Homer
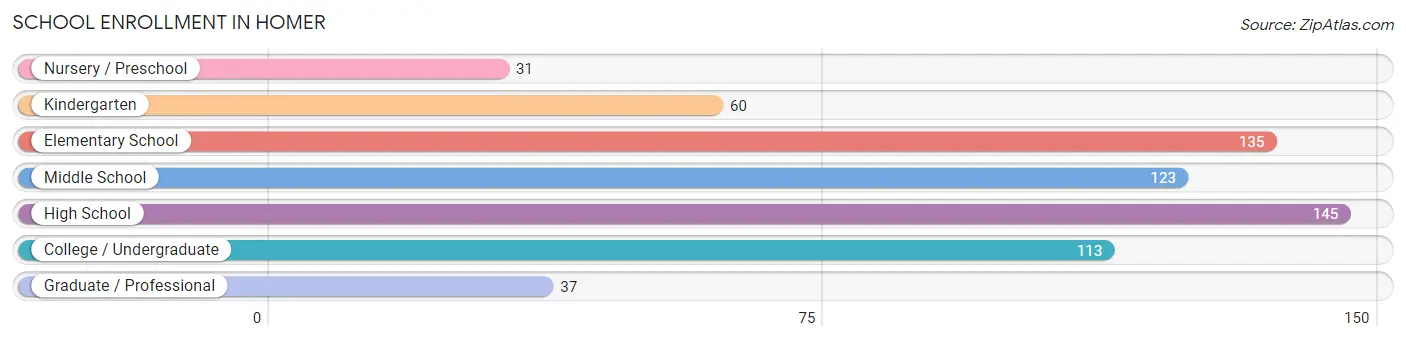
School Enrollment in Homer
The most common levels of schooling among the 644 students in Homer are high school (145 | 22.5%), elementary school (135 | 21.0%), and middle school (123 | 19.1%).
| School Level | # Students | % Students |
| Nursery / Preschool | 31 | 4.8% |
| Kindergarten | 60 | 9.3% |
| Elementary School | 135 | 21.0% |
| Middle School | 123 | 19.1% |
| High School | 145 | 22.5% |
| College / Undergraduate | 113 | 17.5% |
| Graduate / Professional | 37 | 5.8% |
| Total | 644 | 100.0% |
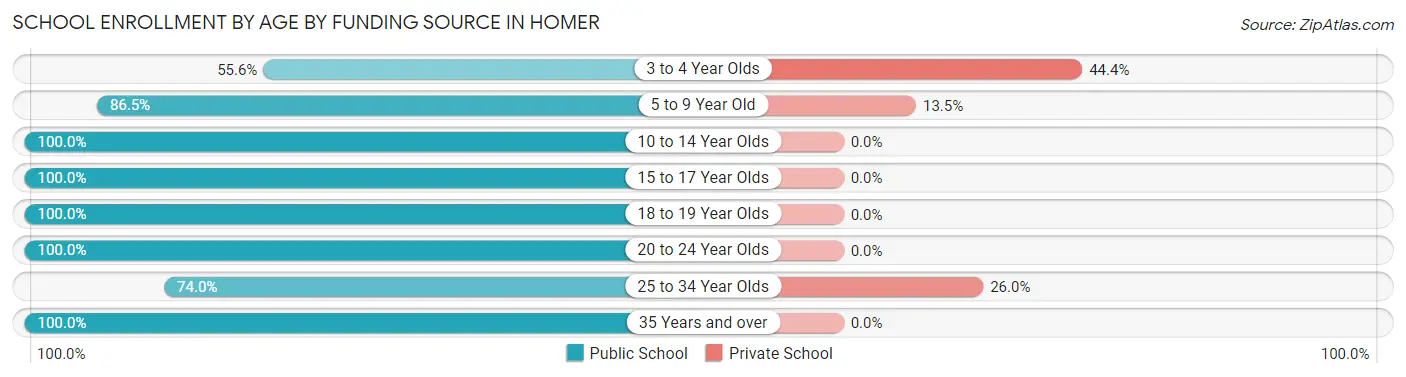
School Enrollment by Age by Funding Source in Homer
Out of a total of 644 students who are enrolled in schools in Homer, 49 (7.6%) attend a private institution, while the remaining 595 (92.4%) are enrolled in public schools. The age group of 3 to 4 year olds has the highest likelihood of being enrolled in private schools, with 12 (44.4% in the age bracket) enrolled. Conversely, the age group of 10 to 14 year olds has the lowest likelihood of being enrolled in a private school, with 168 (100.0% in the age bracket) attending a public institution.
| Age Bracket | Public School | Private School |
| 3 to 4 Year Olds | 15 (55.6%) | 12 (44.4%) |
| 5 to 9 Year Old | 154 (86.5%) | 24 (13.5%) |
| 10 to 14 Year Olds | 168 (100.0%) | 0 (0.0%) |
| 15 to 17 Year Olds | 121 (100.0%) | 0 (0.0%) |
| 18 to 19 Year Olds | 17 (100.0%) | 0 (0.0%) |
| 20 to 24 Year Olds | 37 (100.0%) | 0 (0.0%) |
| 25 to 34 Year Olds | 37 (74.0%) | 13 (26.0%) |
| 35 Years and over | 46 (100.0%) | 0 (0.0%) |
| Total | 595 (92.4%) | 49 (7.6%) |
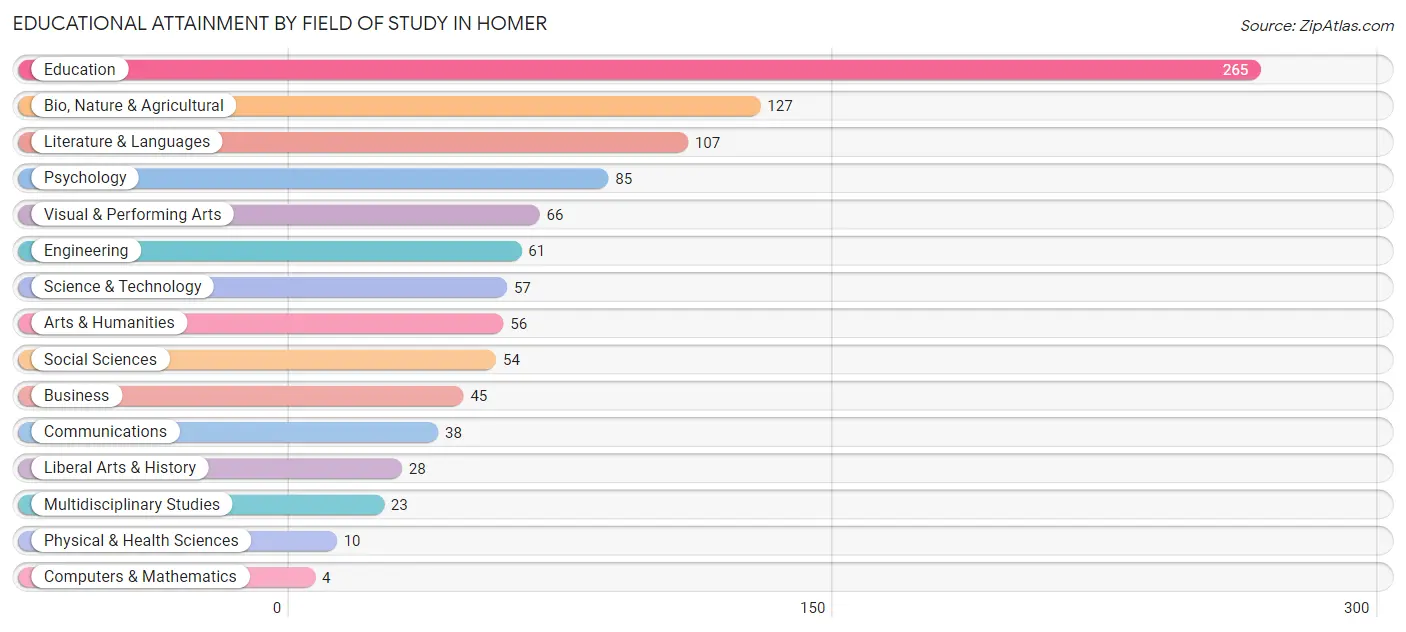
Educational Attainment by Field of Study in Homer
Education (265 | 25.8%), bio, nature & agricultural (127 | 12.4%), literature & languages (107 | 10.4%), psychology (85 | 8.3%), and visual & performing arts (66 | 6.4%) are the most common fields of study among 1,026 individuals in Homer who have obtained a bachelor's degree or higher.
| Field of Study | # Graduates | % Graduates |
| Computers & Mathematics | 4 | 0.4% |
| Bio, Nature & Agricultural | 127 | 12.4% |
| Physical & Health Sciences | 10 | 1.0% |
| Psychology | 85 | 8.3% |
| Social Sciences | 54 | 5.3% |
| Engineering | 61 | 5.9% |
| Multidisciplinary Studies | 23 | 2.2% |
| Science & Technology | 57 | 5.6% |
| Business | 45 | 4.4% |
| Education | 265 | 25.8% |
| Literature & Languages | 107 | 10.4% |
| Liberal Arts & History | 28 | 2.7% |
| Visual & Performing Arts | 66 | 6.4% |
| Communications | 38 | 3.7% |
| Arts & Humanities | 56 | 5.5% |
| Total | 1,026 | 100.0% |
Transportation & Commute in Homer
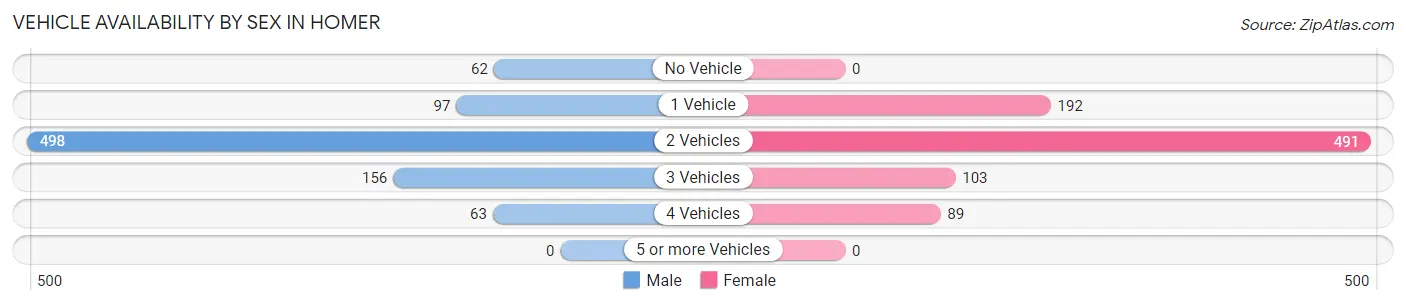
Vehicle Availability by Sex in Homer
The most prevalent vehicle ownership categories in Homer are males with 2 vehicles (498, accounting for 56.9%) and females with 2 vehicles (491, making up 56.9%).
| Vehicles Available | Male | Female |
| No Vehicle | 62 (7.1%) | 0 (0.0%) |
| 1 Vehicle | 97 (11.1%) | 192 (21.9%) |
| 2 Vehicles | 498 (56.9%) | 491 (56.1%) |
| 3 Vehicles | 156 (17.8%) | 103 (11.8%) |
| 4 Vehicles | 63 (7.2%) | 89 (10.2%) |
| 5 or more Vehicles | 0 (0.0%) | 0 (0.0%) |
| Total | 876 (100.0%) | 875 (100.0%) |
Commute Time in Homer
The most frequently occuring commute durations in Homer are 15 to 19 minutes (324 commuters, 20.0%), 20 to 24 minutes (232 commuters, 14.3%), and 10 to 14 minutes (214 commuters, 13.2%).
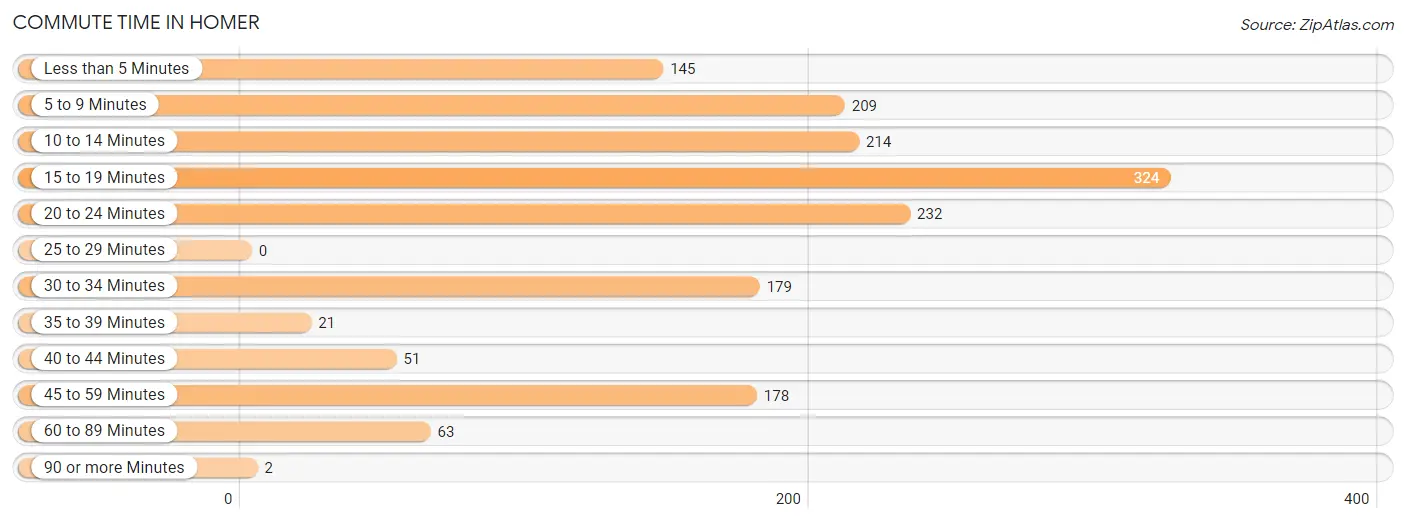
| Commute Time | # Commuters | % Commuters |
| Less than 5 Minutes | 145 | 9.0% |
| 5 to 9 Minutes | 209 | 12.9% |
| 10 to 14 Minutes | 214 | 13.2% |
| 15 to 19 Minutes | 324 | 20.0% |
| 20 to 24 Minutes | 232 | 14.3% |
| 25 to 29 Minutes | 0 | 0.0% |
| 30 to 34 Minutes | 179 | 11.1% |
| 35 to 39 Minutes | 21 | 1.3% |
| 40 to 44 Minutes | 51 | 3.2% |
| 45 to 59 Minutes | 178 | 11.0% |
| 60 to 89 Minutes | 63 | 3.9% |
| 90 or more Minutes | 2 | 0.1% |
Commute Time by Sex in Homer
The most common commute times in Homer are 20 to 24 minutes (171 commuters, 21.8%) for males and 15 to 19 minutes (180 commuters, 21.6%) for females.
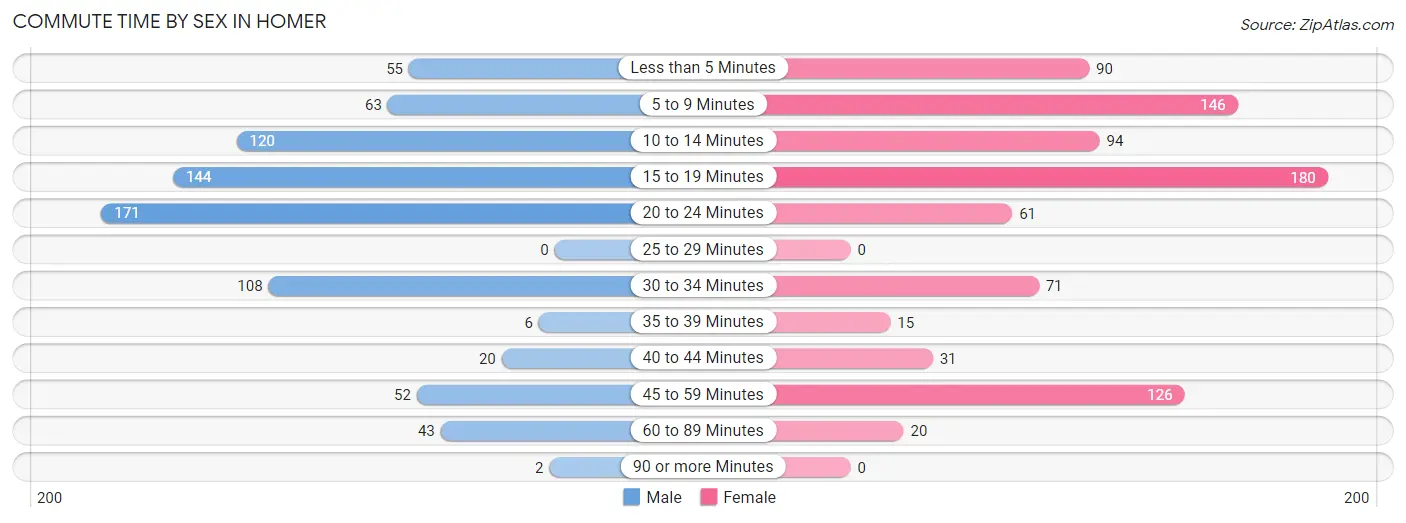
| Commute Time | Male | Female |
| Less than 5 Minutes | 55 (7.0%) | 90 (10.8%) |
| 5 to 9 Minutes | 63 (8.0%) | 146 (17.5%) |
| 10 to 14 Minutes | 120 (15.3%) | 94 (11.3%) |
| 15 to 19 Minutes | 144 (18.4%) | 180 (21.6%) |
| 20 to 24 Minutes | 171 (21.8%) | 61 (7.3%) |
| 25 to 29 Minutes | 0 (0.0%) | 0 (0.0%) |
| 30 to 34 Minutes | 108 (13.8%) | 71 (8.5%) |
| 35 to 39 Minutes | 6 (0.8%) | 15 (1.8%) |
| 40 to 44 Minutes | 20 (2.5%) | 31 (3.7%) |
| 45 to 59 Minutes | 52 (6.6%) | 126 (15.1%) |
| 60 to 89 Minutes | 43 (5.5%) | 20 (2.4%) |
| 90 or more Minutes | 2 (0.3%) | 0 (0.0%) |
Time of Departure to Work by Sex in Homer
The most frequent times of departure to work in Homer are 7:30 AM to 7:59 AM (270, 34.4%) for males and 7:30 AM to 7:59 AM (174, 20.9%) for females.
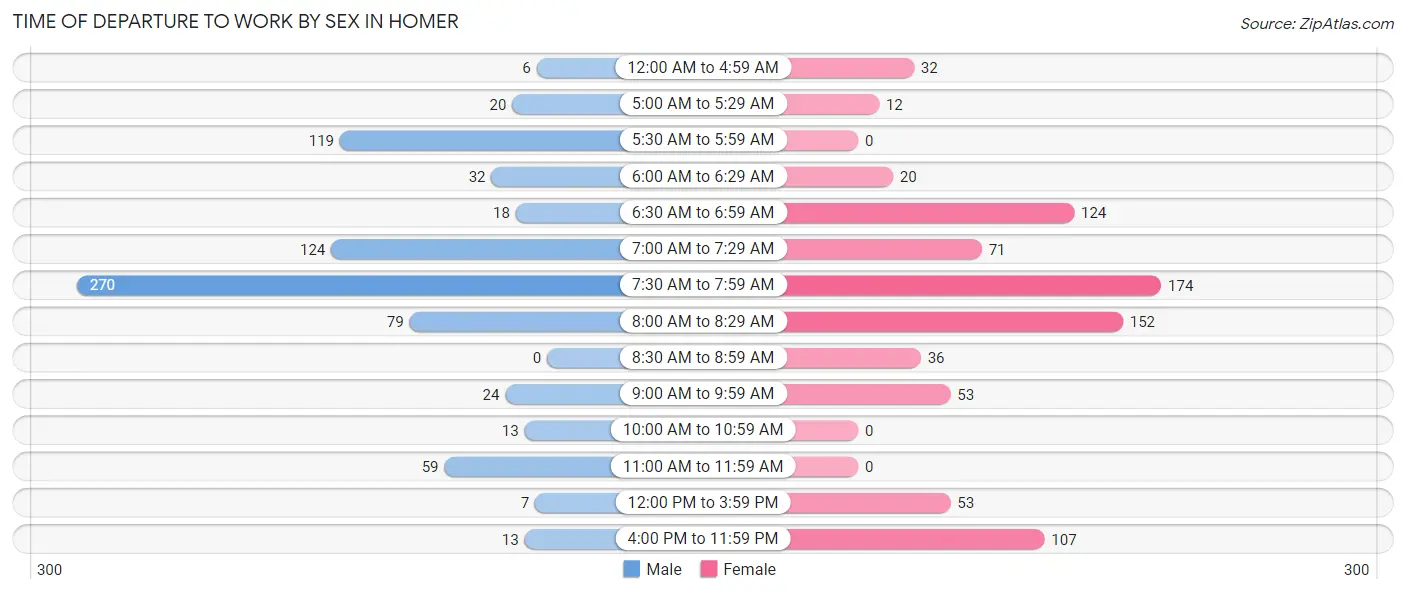
| Time of Departure | Male | Female |
| 12:00 AM to 4:59 AM | 6 (0.8%) | 32 (3.8%) |
| 5:00 AM to 5:29 AM | 20 (2.5%) | 12 (1.4%) |
| 5:30 AM to 5:59 AM | 119 (15.2%) | 0 (0.0%) |
| 6:00 AM to 6:29 AM | 32 (4.1%) | 20 (2.4%) |
| 6:30 AM to 6:59 AM | 18 (2.3%) | 124 (14.9%) |
| 7:00 AM to 7:29 AM | 124 (15.8%) | 71 (8.5%) |
| 7:30 AM to 7:59 AM | 270 (34.4%) | 174 (20.9%) |
| 8:00 AM to 8:29 AM | 79 (10.1%) | 152 (18.2%) |
| 8:30 AM to 8:59 AM | 0 (0.0%) | 36 (4.3%) |
| 9:00 AM to 9:59 AM | 24 (3.1%) | 53 (6.4%) |
| 10:00 AM to 10:59 AM | 13 (1.7%) | 0 (0.0%) |
| 11:00 AM to 11:59 AM | 59 (7.5%) | 0 (0.0%) |
| 12:00 PM to 3:59 PM | 7 (0.9%) | 53 (6.4%) |
| 4:00 PM to 11:59 PM | 13 (1.7%) | 107 (12.8%) |
| Total | 784 (100.0%) | 834 (100.0%) |
Housing Occupancy in Homer
Occupancy by Ownership in Homer
Of the total 1,536 dwellings in Homer, owner-occupied units account for 1,147 (74.7%), while renter-occupied units make up 389 (25.3%).
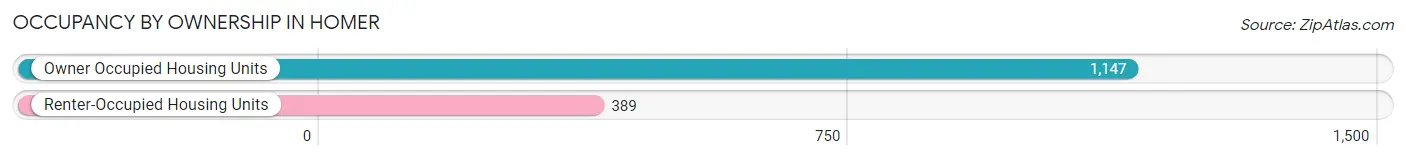
| Occupancy | # Housing Units | % Housing Units |
| Owner Occupied Housing Units | 1,147 | 74.7% |
| Renter-Occupied Housing Units | 389 | 25.3% |
| Total Occupied Housing Units | 1,536 | 100.0% |
Occupancy by Household Size in Homer
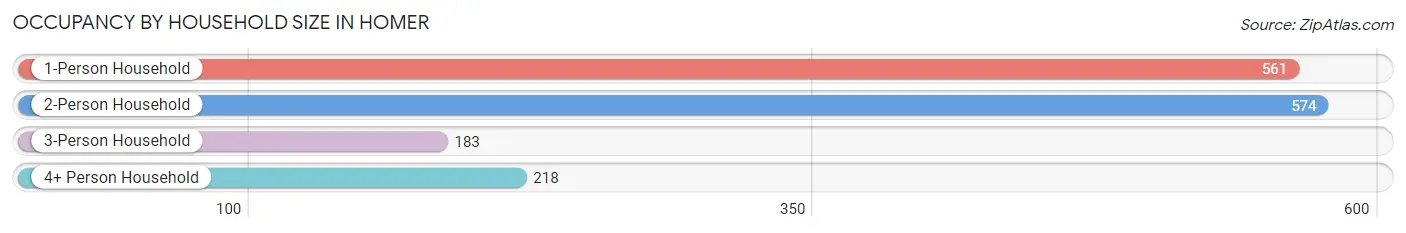
| Household Size | # Housing Units | % Housing Units |
| 1-Person Household | 561 | 36.5% |
| 2-Person Household | 574 | 37.4% |
| 3-Person Household | 183 | 11.9% |
| 4+ Person Household | 218 | 14.2% |
| Total Housing Units | 1,536 | 100.0% |
Occupancy by Ownership by Household Size in Homer
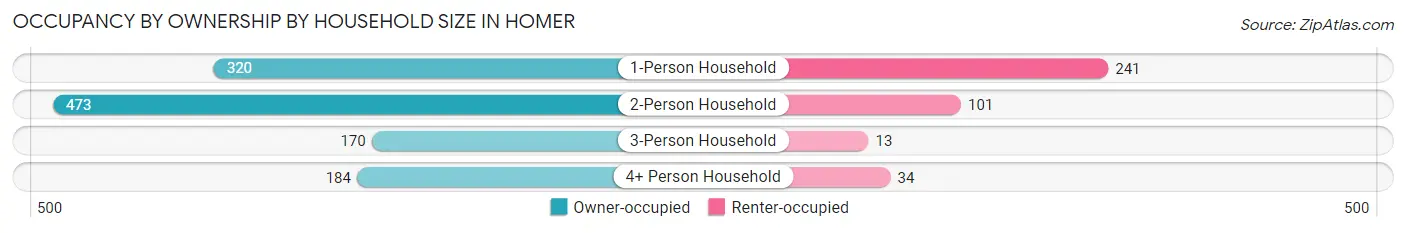
| Household Size | Owner-occupied | Renter-occupied |
| 1-Person Household | 320 (57.0%) | 241 (43.0%) |
| 2-Person Household | 473 (82.4%) | 101 (17.6%) |
| 3-Person Household | 170 (92.9%) | 13 (7.1%) |
| 4+ Person Household | 184 (84.4%) | 34 (15.6%) |
| Total Housing Units | 1,147 (74.7%) | 389 (25.3%) |
Occupancy by Educational Attainment in Homer
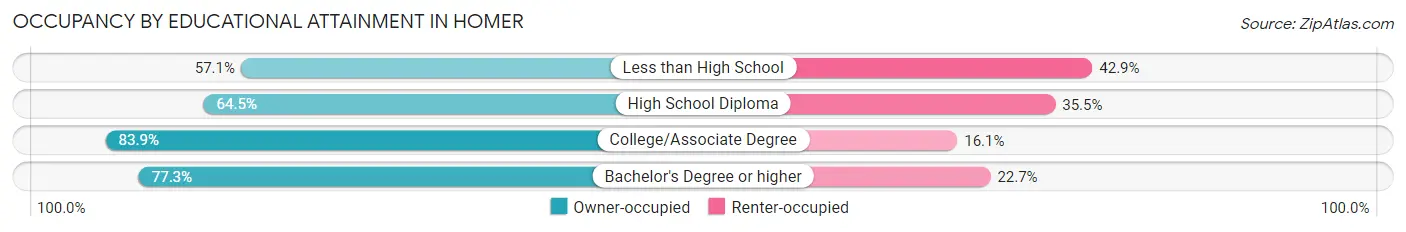
| Household Size | Owner-occupied | Renter-occupied |
| Less than High School | 40 (57.1%) | 30 (42.9%) |
| High School Diploma | 276 (64.5%) | 152 (35.5%) |
| College/Associate Degree | 360 (83.9%) | 69 (16.1%) |
| Bachelor's Degree or higher | 471 (77.3%) | 138 (22.7%) |
Occupancy by Age of Householder in Homer
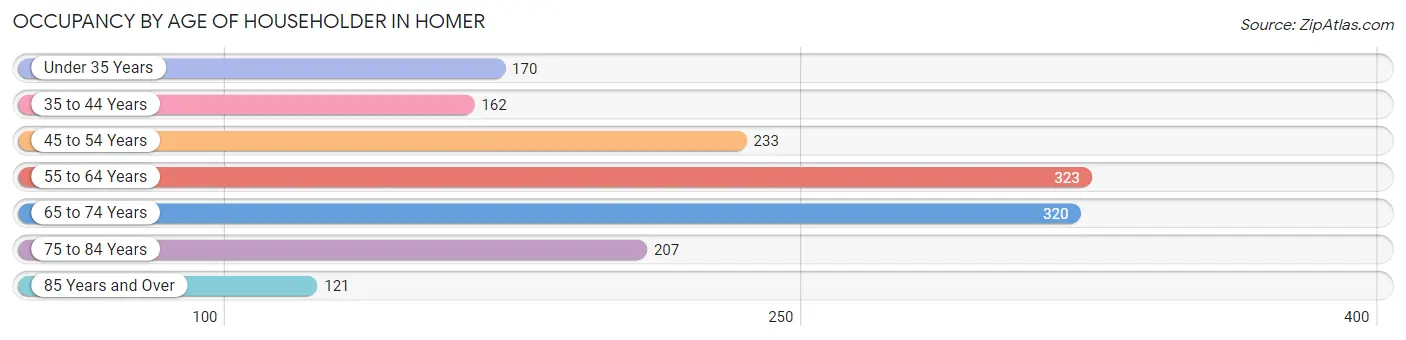
| Age Bracket | # Households | % Households |
| Under 35 Years | 170 | 11.1% |
| 35 to 44 Years | 162 | 10.5% |
| 45 to 54 Years | 233 | 15.2% |
| 55 to 64 Years | 323 | 21.0% |
| 65 to 74 Years | 320 | 20.8% |
| 75 to 84 Years | 207 | 13.5% |
| 85 Years and Over | 121 | 7.9% |
| Total | 1,536 | 100.0% |
Housing Finances in Homer
Median Income by Occupancy in Homer
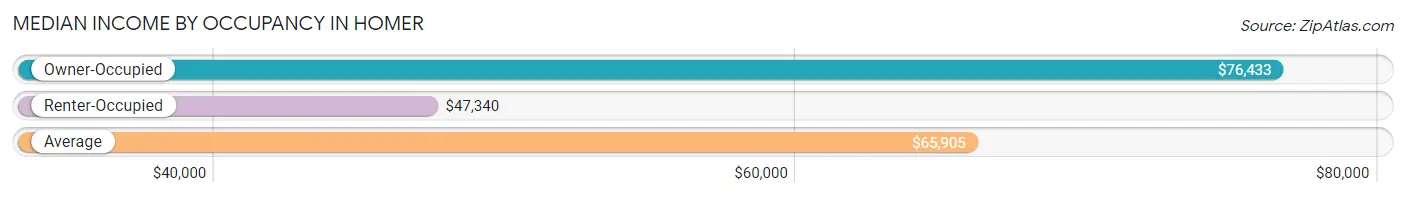
| Occupancy Type | # Households | Median Income |
| Owner-Occupied | 1,147 (74.7%) | $76,433 |
| Renter-Occupied | 389 (25.3%) | $47,340 |
| Average | 1,536 (100.0%) | $65,905 |
Occupancy by Householder Income Bracket in Homer
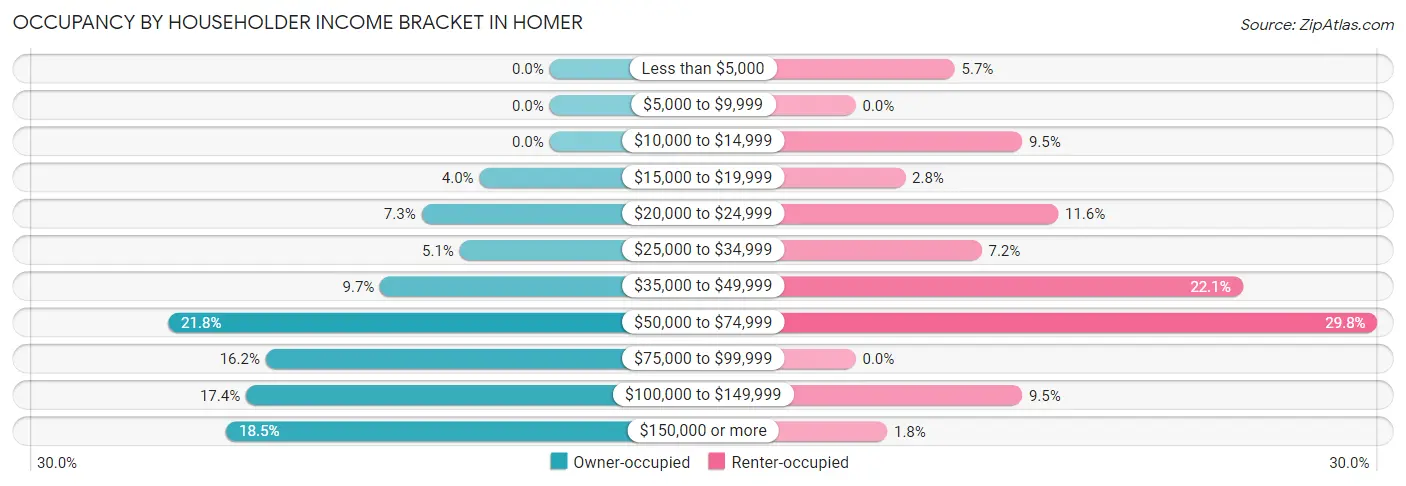
| Income Bracket | Owner-occupied | Renter-occupied |
| Less than $5,000 | 0 (0.0%) | 22 (5.7%) |
| $5,000 to $9,999 | 0 (0.0%) | 0 (0.0%) |
| $10,000 to $14,999 | 0 (0.0%) | 37 (9.5%) |
| $15,000 to $19,999 | 46 (4.0%) | 11 (2.8%) |
| $20,000 to $24,999 | 84 (7.3%) | 45 (11.6%) |
| $25,000 to $34,999 | 59 (5.1%) | 28 (7.2%) |
| $35,000 to $49,999 | 111 (9.7%) | 86 (22.1%) |
| $50,000 to $74,999 | 250 (21.8%) | 116 (29.8%) |
| $75,000 to $99,999 | 186 (16.2%) | 0 (0.0%) |
| $100,000 to $149,999 | 199 (17.3%) | 37 (9.5%) |
| $150,000 or more | 212 (18.5%) | 7 (1.8%) |
| Total | 1,147 (100.0%) | 389 (100.0%) |
Monthly Housing Cost Tiers in Homer
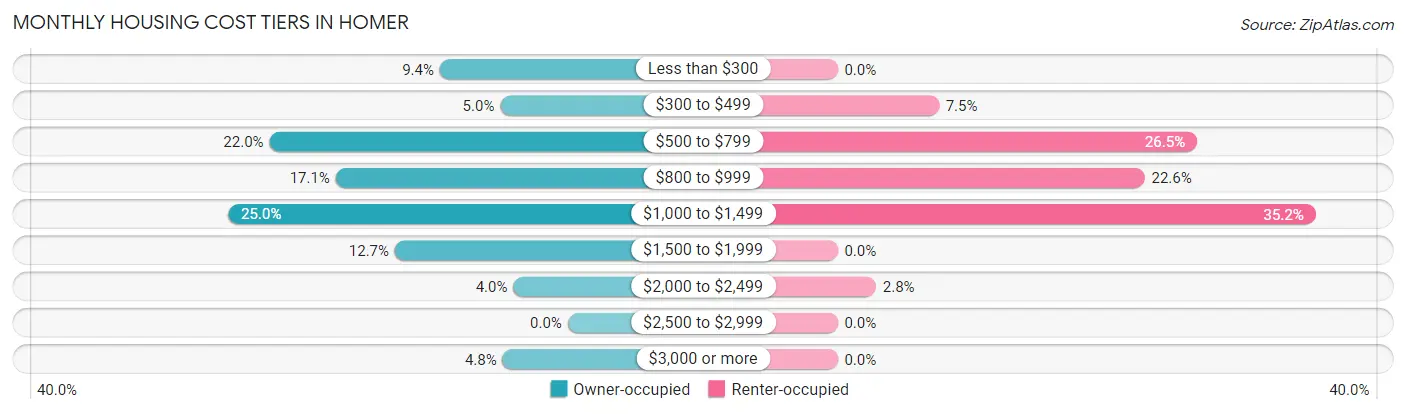
| Monthly Cost | Owner-occupied | Renter-occupied |
| Less than $300 | 108 (9.4%) | 0 (0.0%) |
| $300 to $499 | 57 (5.0%) | 29 (7.5%) |
| $500 to $799 | 252 (22.0%) | 103 (26.5%) |
| $800 to $999 | 196 (17.1%) | 88 (22.6%) |
| $1,000 to $1,499 | 287 (25.0%) | 137 (35.2%) |
| $1,500 to $1,999 | 146 (12.7%) | 0 (0.0%) |
| $2,000 to $2,499 | 46 (4.0%) | 11 (2.8%) |
| $2,500 to $2,999 | 0 (0.0%) | 0 (0.0%) |
| $3,000 or more | 55 (4.8%) | 0 (0.0%) |
| Total | 1,147 (100.0%) | 389 (100.0%) |
Physical Housing Characteristics in Homer
Housing Structures in Homer

| Structure Type | # Housing Units | % Housing Units |
| Single Unit, Detached | 1,174 | 76.4% |
| Single Unit, Attached | 27 | 1.8% |
| 2 Unit Apartments | 115 | 7.5% |
| 3 or 4 Unit Apartments | 97 | 6.3% |
| 5 to 9 Unit Apartments | 42 | 2.7% |
| 10 or more Apartments | 81 | 5.3% |
| Mobile Home / Other | 0 | 0.0% |
| Total | 1,536 | 100.0% |
Housing Structures by Occupancy in Homer
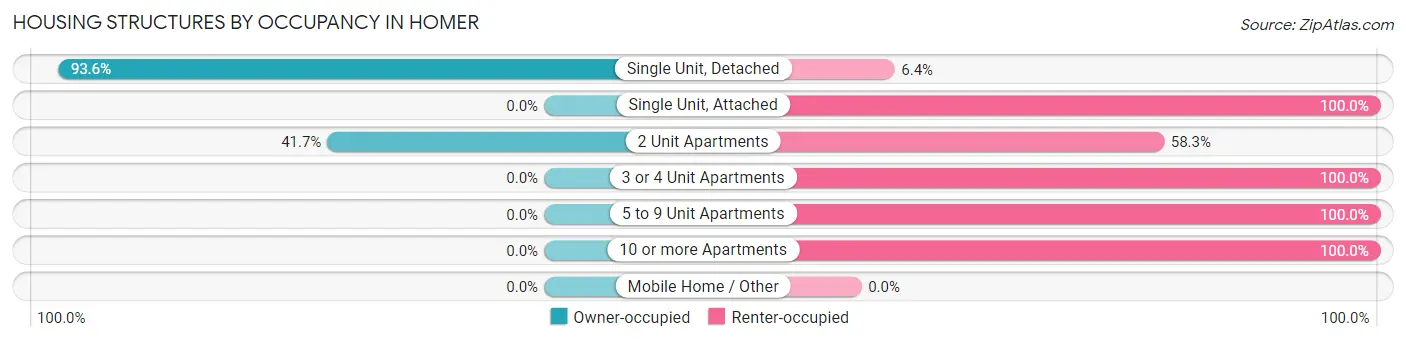
| Structure Type | Owner-occupied | Renter-occupied |
| Single Unit, Detached | 1,099 (93.6%) | 75 (6.4%) |
| Single Unit, Attached | 0 (0.0%) | 27 (100.0%) |
| 2 Unit Apartments | 48 (41.7%) | 67 (58.3%) |
| 3 or 4 Unit Apartments | 0 (0.0%) | 97 (100.0%) |
| 5 to 9 Unit Apartments | 0 (0.0%) | 42 (100.0%) |
| 10 or more Apartments | 0 (0.0%) | 81 (100.0%) |
| Mobile Home / Other | 0 (0.0%) | 0 (0.0%) |
| Total | 1,147 (74.7%) | 389 (25.3%) |
Housing Structures by Number of Rooms in Homer
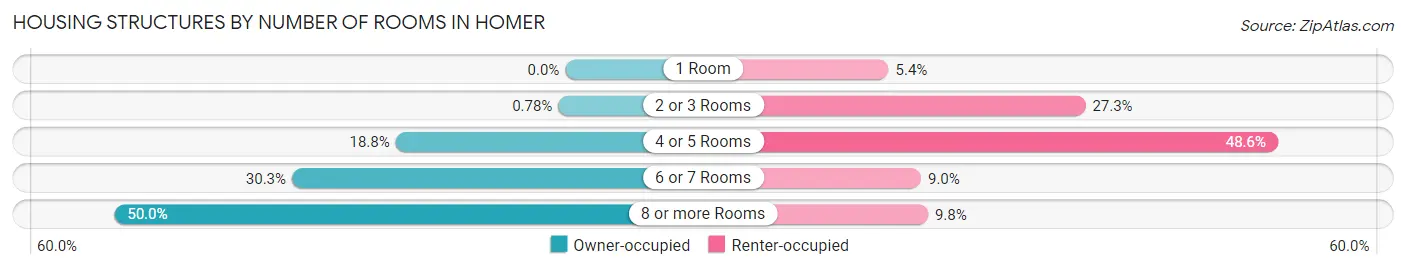
| Number of Rooms | Owner-occupied | Renter-occupied |
| 1 Room | 0 (0.0%) | 21 (5.4%) |
| 2 or 3 Rooms | 9 (0.8%) | 106 (27.3%) |
| 4 or 5 Rooms | 216 (18.8%) | 189 (48.6%) |
| 6 or 7 Rooms | 348 (30.3%) | 35 (9.0%) |
| 8 or more Rooms | 574 (50.0%) | 38 (9.8%) |
| Total | 1,147 (100.0%) | 389 (100.0%) |
Housing Structure by Heating Type in Homer
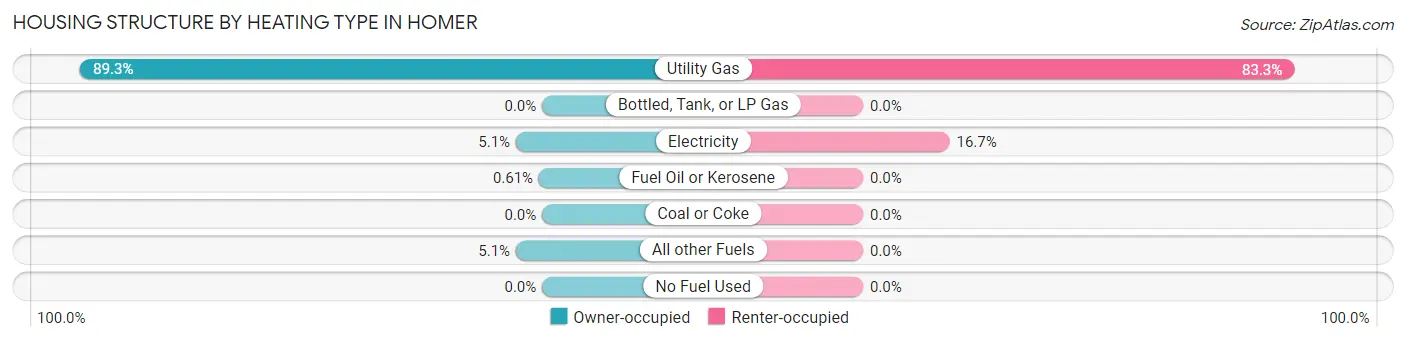
| Heating Type | Owner-occupied | Renter-occupied |
| Utility Gas | 1,024 (89.3%) | 324 (83.3%) |
| Bottled, Tank, or LP Gas | 0 (0.0%) | 0 (0.0%) |
| Electricity | 58 (5.1%) | 65 (16.7%) |
| Fuel Oil or Kerosene | 7 (0.6%) | 0 (0.0%) |
| Coal or Coke | 0 (0.0%) | 0 (0.0%) |
| All other Fuels | 58 (5.1%) | 0 (0.0%) |
| No Fuel Used | 0 (0.0%) | 0 (0.0%) |
| Total | 1,147 (100.0%) | 389 (100.0%) |
Household Vehicle Usage in Homer
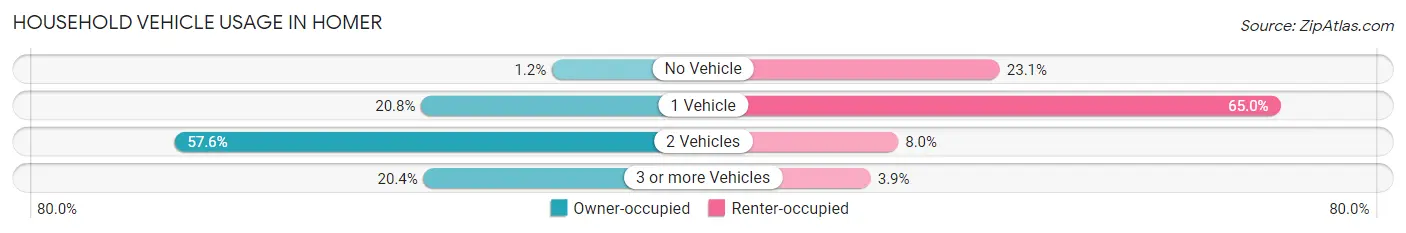
| Vehicles per Household | Owner-occupied | Renter-occupied |
| No Vehicle | 14 (1.2%) | 90 (23.1%) |
| 1 Vehicle | 238 (20.7%) | 253 (65.0%) |
| 2 Vehicles | 661 (57.6%) | 31 (8.0%) |
| 3 or more Vehicles | 234 (20.4%) | 15 (3.9%) |
| Total | 1,147 (100.0%) | 389 (100.0%) |
Real Estate & Mortgages in Homer
Real Estate and Mortgage Overview in Homer
| Characteristic | Without Mortgage | With Mortgage |
| Housing Units | 675 | 472 |
| Median Property Value | $148,700 | $154,700 |
| Median Household Income | $67,276 | $88 |
| Monthly Housing Costs | $703 | $5 |
| Real Estate Taxes | $4,829 | $20 |
Property Value by Mortgage Status in Homer
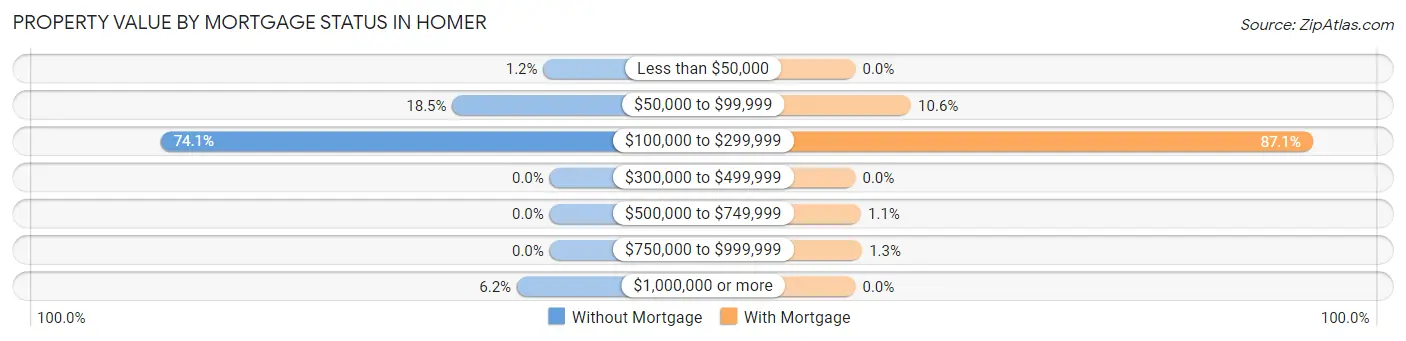
| Property Value | Without Mortgage | With Mortgage |
| Less than $50,000 | 8 (1.2%) | 0 (0.0%) |
| $50,000 to $99,999 | 125 (18.5%) | 50 (10.6%) |
| $100,000 to $299,999 | 500 (74.1%) | 411 (87.1%) |
| $300,000 to $499,999 | 0 (0.0%) | 0 (0.0%) |
| $500,000 to $749,999 | 0 (0.0%) | 5 (1.1%) |
| $750,000 to $999,999 | 0 (0.0%) | 6 (1.3%) |
| $1,000,000 or more | 42 (6.2%) | 0 (0.0%) |
| Total | 675 (100.0%) | 472 (100.0%) |
Household Income by Mortgage Status in Homer
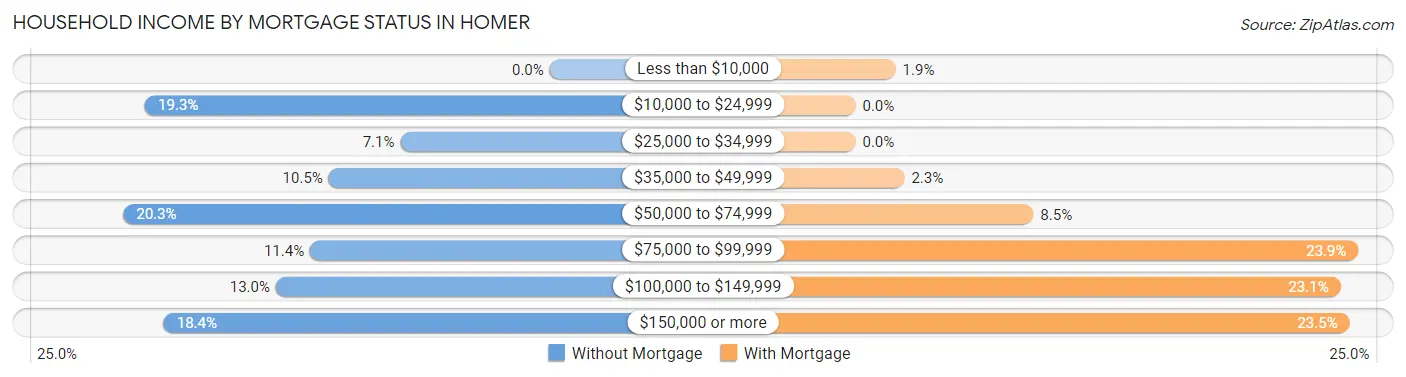
| Household Income | Without Mortgage | With Mortgage |
| Less than $10,000 | 0 (0.0%) | 9 (1.9%) |
| $10,000 to $24,999 | 130 (19.3%) | 0 (0.0%) |
| $25,000 to $34,999 | 48 (7.1%) | 0 (0.0%) |
| $35,000 to $49,999 | 71 (10.5%) | 11 (2.3%) |
| $50,000 to $74,999 | 137 (20.3%) | 40 (8.5%) |
| $75,000 to $99,999 | 77 (11.4%) | 113 (23.9%) |
| $100,000 to $149,999 | 88 (13.0%) | 109 (23.1%) |
| $150,000 or more | 124 (18.4%) | 111 (23.5%) |
| Total | 675 (100.0%) | 472 (100.0%) |
Property Value to Household Income Ratio in Homer
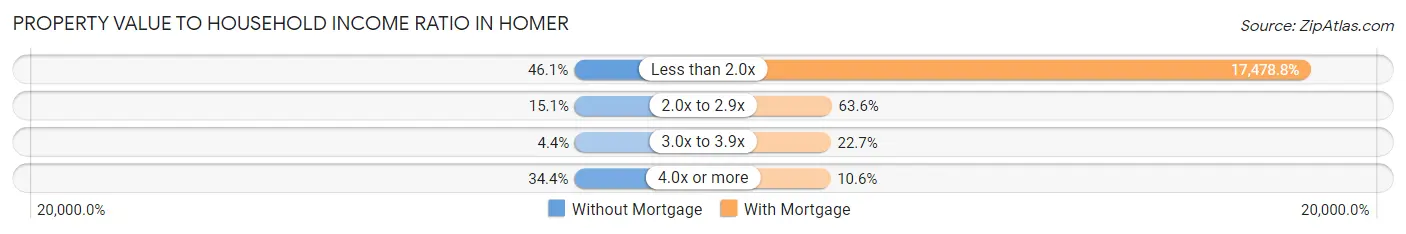
| Value-to-Income Ratio | Without Mortgage | With Mortgage |
| Less than 2.0x | 311 (46.1%) | 82,500 (17,478.8%) |
| 2.0x to 2.9x | 102 (15.1%) | 300 (63.6%) |
| 3.0x to 3.9x | 30 (4.4%) | 107 (22.7%) |
| 4.0x or more | 232 (34.4%) | 50 (10.6%) |
| Total | 675 (100.0%) | 472 (100.0%) |
Real Estate Taxes by Mortgage Status in Homer
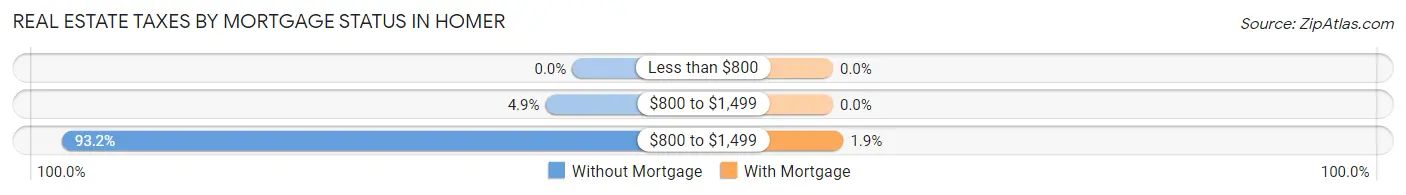
| Property Taxes | Without Mortgage | With Mortgage |
| Less than $800 | 0 (0.0%) | 0 (0.0%) |
| $800 to $1,499 | 33 (4.9%) | 0 (0.0%) |
| $800 to $1,499 | 629 (93.2%) | 9 (1.9%) |
| Total | 675 (100.0%) | 472 (100.0%) |
Health & Disability in Homer
Health Insurance Coverage by Age in Homer
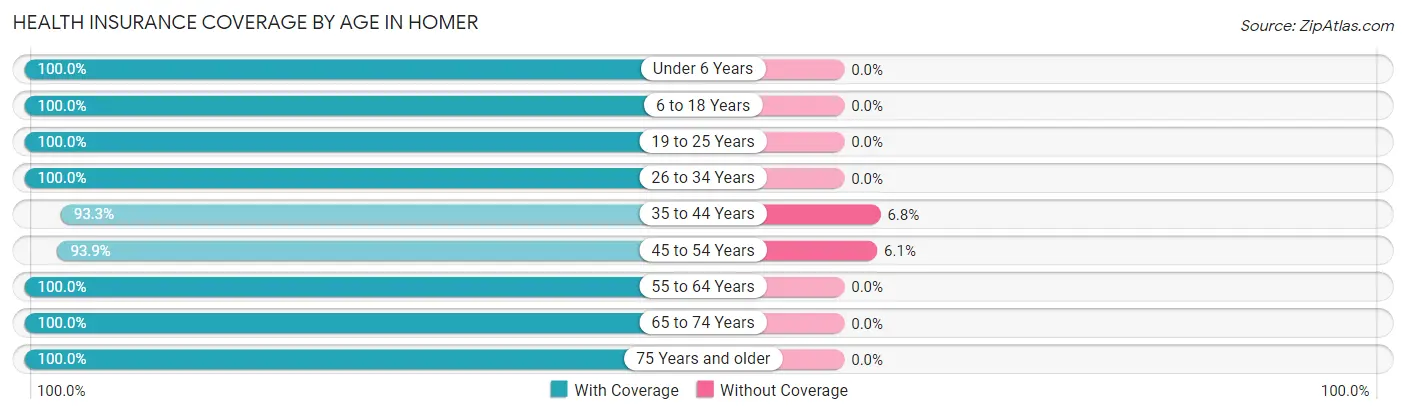
| Age Bracket | With Coverage | Without Coverage |
| Under 6 Years | 187 (100.0%) | 0 (0.0%) |
| 6 to 18 Years | 426 (100.0%) | 0 (0.0%) |
| 19 to 25 Years | 190 (100.0%) | 0 (0.0%) |
| 26 to 34 Years | 240 (100.0%) | 0 (0.0%) |
| 35 to 44 Years | 290 (93.2%) | 21 (6.8%) |
| 45 to 54 Years | 398 (93.9%) | 26 (6.1%) |
| 55 to 64 Years | 529 (100.0%) | 0 (0.0%) |
| 65 to 74 Years | 419 (100.0%) | 0 (0.0%) |
| 75 Years and older | 444 (100.0%) | 0 (0.0%) |
| Total | 3,123 (98.5%) | 47 (1.5%) |
Health Insurance Coverage by Citizenship Status in Homer
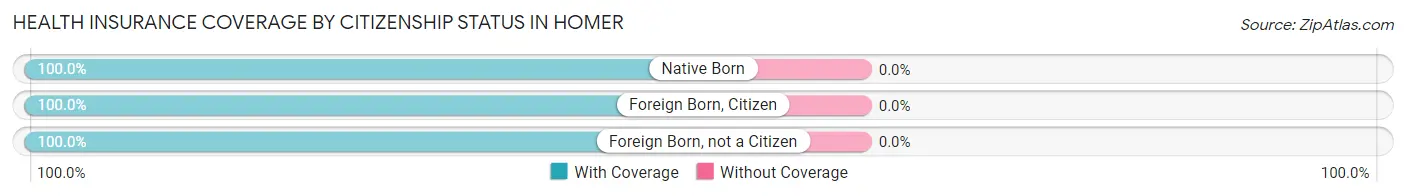
| Citizenship Status | With Coverage | Without Coverage |
| Native Born | 187 (100.0%) | 0 (0.0%) |
| Foreign Born, Citizen | 426 (100.0%) | 0 (0.0%) |
| Foreign Born, not a Citizen | 190 (100.0%) | 0 (0.0%) |
Health Insurance Coverage by Household Income in Homer
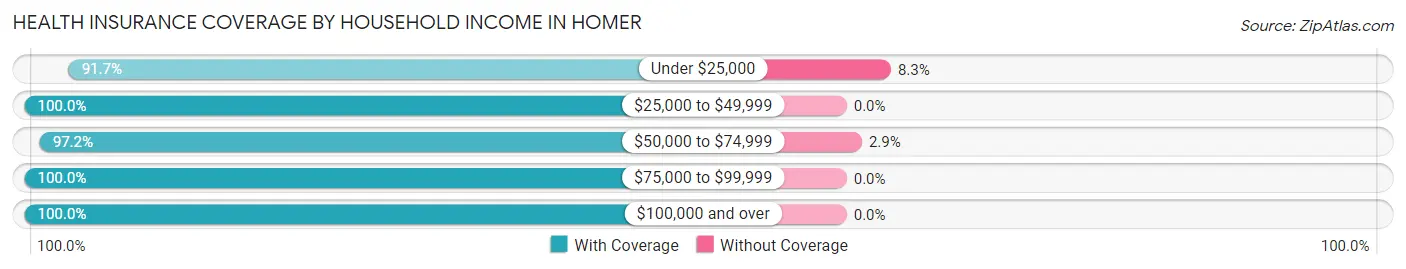
| Household Income | With Coverage | Without Coverage |
| Under $25,000 | 233 (91.7%) | 21 (8.3%) |
| $25,000 to $49,999 | 418 (100.0%) | 0 (0.0%) |
| $50,000 to $74,999 | 886 (97.2%) | 26 (2.9%) |
| $75,000 to $99,999 | 448 (100.0%) | 0 (0.0%) |
| $100,000 and over | 1,115 (100.0%) | 0 (0.0%) |
Public vs Private Health Insurance Coverage by Age in Homer
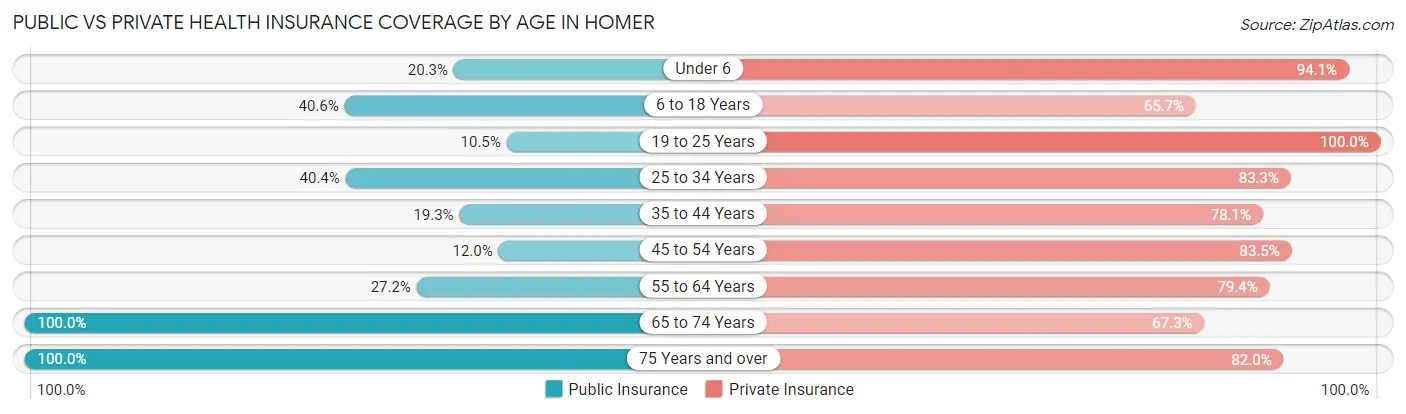
| Age Bracket | Public Insurance | Private Insurance |
| Under 6 | 38 (20.3%) | 176 (94.1%) |
| 6 to 18 Years | 173 (40.6%) | 280 (65.7%) |
| 19 to 25 Years | 20 (10.5%) | 190 (100.0%) |
| 25 to 34 Years | 97 (40.4%) | 200 (83.3%) |
| 35 to 44 Years | 60 (19.3%) | 243 (78.1%) |
| 45 to 54 Years | 51 (12.0%) | 354 (83.5%) |
| 55 to 64 Years | 144 (27.2%) | 420 (79.4%) |
| 65 to 74 Years | 419 (100.0%) | 282 (67.3%) |
| 75 Years and over | 444 (100.0%) | 364 (82.0%) |
| Total | 1,446 (45.6%) | 2,509 (79.1%) |
Disability Status by Sex by Age in Homer
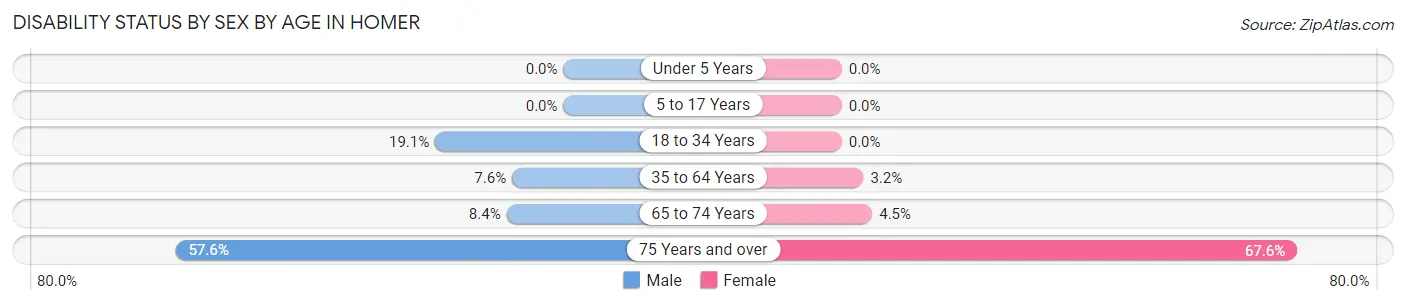
| Age Bracket | Male | Female |
| Under 5 Years | 0 (0.0%) | 0 (0.0%) |
| 5 to 17 Years | 0 (0.0%) | 0 (0.0%) |
| 18 to 34 Years | 40 (19.1%) | 0 (0.0%) |
| 35 to 64 Years | 49 (7.6%) | 20 (3.2%) |
| 65 to 74 Years | 13 (8.4%) | 12 (4.5%) |
| 75 Years and over | 110 (57.6%) | 171 (67.6%) |
Disability Class by Sex by Age in Homer
Disability Class: Hearing Difficulty
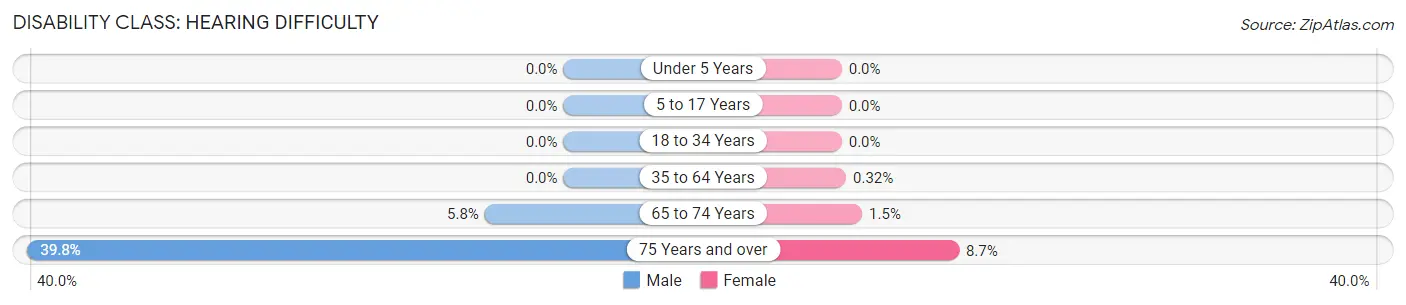
| Age Bracket | Male | Female |
| Under 5 Years | 0 (0.0%) | 0 (0.0%) |
| 5 to 17 Years | 0 (0.0%) | 0 (0.0%) |
| 18 to 34 Years | 0 (0.0%) | 0 (0.0%) |
| 35 to 64 Years | 0 (0.0%) | 2 (0.3%) |
| 65 to 74 Years | 9 (5.8%) | 4 (1.5%) |
| 75 Years and over | 76 (39.8%) | 22 (8.7%) |
Disability Class: Vision Difficulty
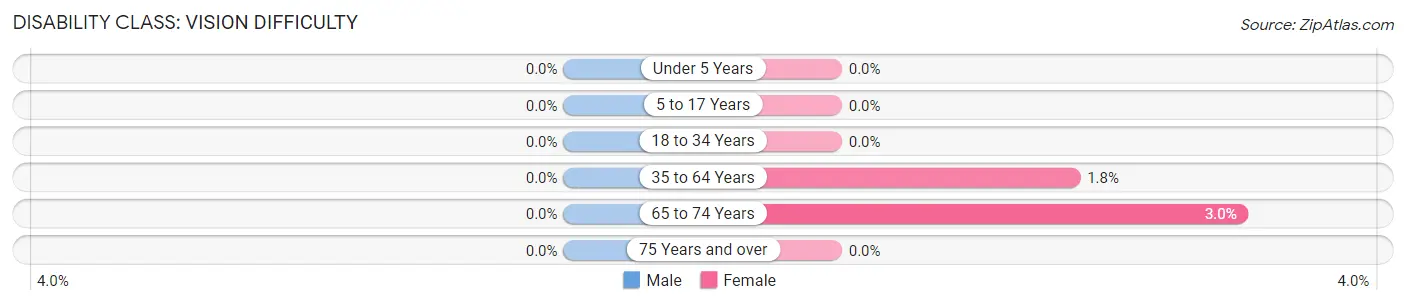
| Age Bracket | Male | Female |
| Under 5 Years | 0 (0.0%) | 0 (0.0%) |
| 5 to 17 Years | 0 (0.0%) | 0 (0.0%) |
| 18 to 34 Years | 0 (0.0%) | 0 (0.0%) |
| 35 to 64 Years | 0 (0.0%) | 11 (1.8%) |
| 65 to 74 Years | 0 (0.0%) | 8 (3.0%) |
| 75 Years and over | 0 (0.0%) | 0 (0.0%) |
Disability Class: Cognitive Difficulty
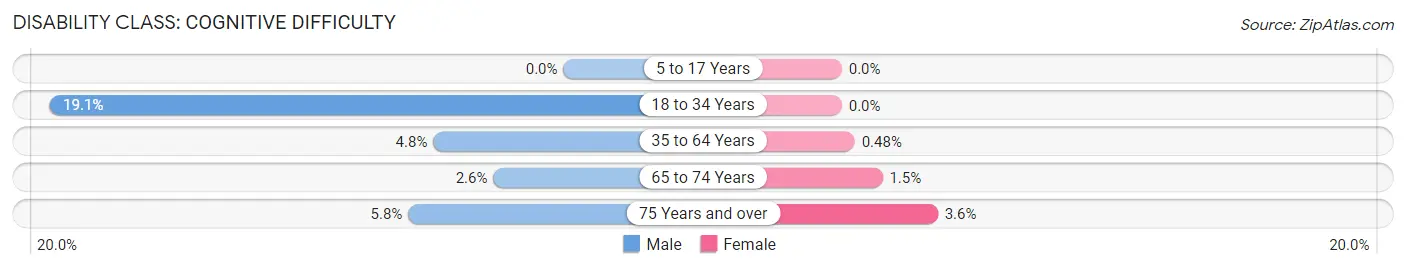
| Age Bracket | Male | Female |
| 5 to 17 Years | 0 (0.0%) | 0 (0.0%) |
| 18 to 34 Years | 40 (19.1%) | 0 (0.0%) |
| 35 to 64 Years | 31 (4.8%) | 3 (0.5%) |
| 65 to 74 Years | 4 (2.6%) | 4 (1.5%) |
| 75 Years and over | 11 (5.8%) | 9 (3.6%) |
Disability Class: Ambulatory Difficulty
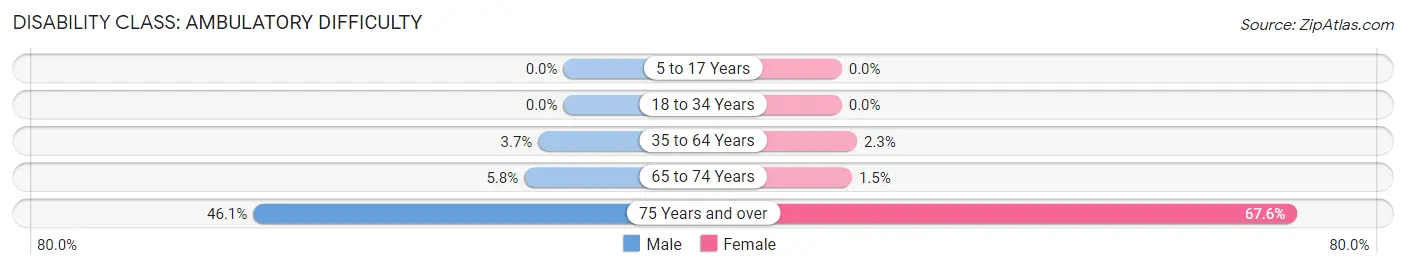
| Age Bracket | Male | Female |
| 5 to 17 Years | 0 (0.0%) | 0 (0.0%) |
| 18 to 34 Years | 0 (0.0%) | 0 (0.0%) |
| 35 to 64 Years | 24 (3.7%) | 14 (2.2%) |
| 65 to 74 Years | 9 (5.8%) | 4 (1.5%) |
| 75 Years and over | 88 (46.1%) | 171 (67.6%) |
Disability Class: Self-Care Difficulty
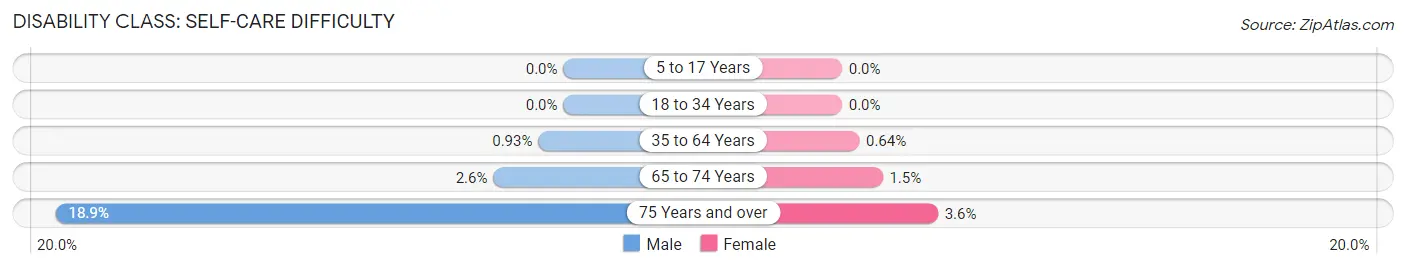
| Age Bracket | Male | Female |
| 5 to 17 Years | 0 (0.0%) | 0 (0.0%) |
| 18 to 34 Years | 0 (0.0%) | 0 (0.0%) |
| 35 to 64 Years | 6 (0.9%) | 4 (0.6%) |
| 65 to 74 Years | 4 (2.6%) | 4 (1.5%) |
| 75 Years and over | 36 (18.9%) | 9 (3.6%) |
Technology Access in Homer
Computing Device Access in Homer
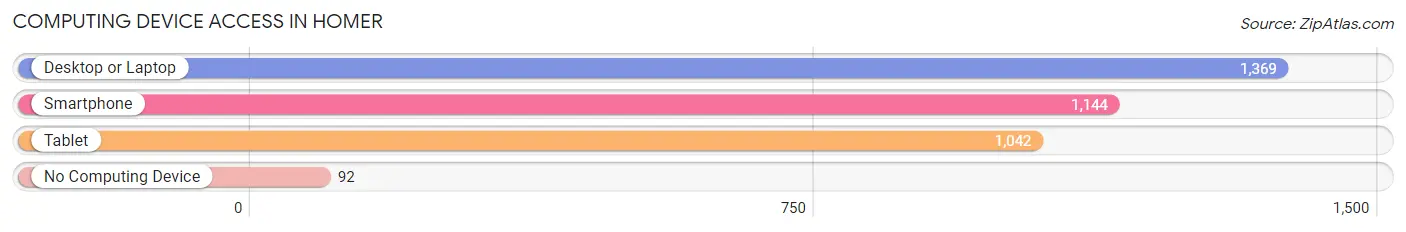
| Device Type | # Households | % Households |
| Desktop or Laptop | 1,369 | 89.1% |
| Smartphone | 1,144 | 74.5% |
| Tablet | 1,042 | 67.8% |
| No Computing Device | 92 | 6.0% |
| Total | 1,536 | 100.0% |
Internet Access in Homer
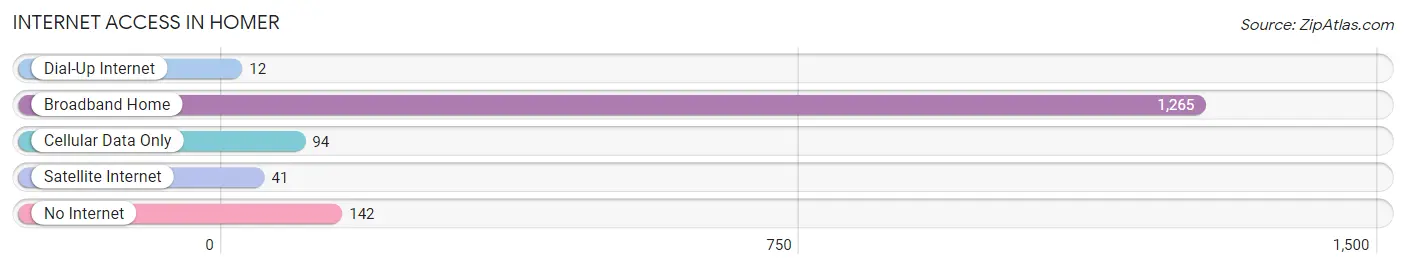
| Internet Type | # Households | % Households |
| Dial-Up Internet | 12 | 0.8% |
| Broadband Home | 1,265 | 82.4% |
| Cellular Data Only | 94 | 6.1% |
| Satellite Internet | 41 | 2.7% |
| No Internet | 142 | 9.2% |
| Total | 1,536 | 100.0% |
Homer Summary
Homer, New York is a small town located in Cortland County, in the central part of the state. It is situated on the eastern shore of Cayuga Lake, the largest of the Finger Lakes. The town was founded in 1794 and has a population of approximately 5,000 people.
Geography
Homer is located in the Finger Lakes region of New York, which is known for its rolling hills, deep valleys, and numerous lakes. The town is situated on the eastern shore of Cayuga Lake, the largest of the Finger Lakes. The lake is approximately 40 miles long and is a popular destination for fishing, boating, and swimming. The town is also home to several parks, including the Homer Town Park, which offers a variety of recreational activities, including a playground, picnic areas, and a swimming beach.
The town is bordered by the towns of Cortland, Preble, and Virgil. It is located approximately 30 miles south of Syracuse and is accessible by Interstate 81 and State Route 281.
Economy
Homer is a small town with a diverse economy. The town is home to several small businesses, including restaurants, retail stores, and professional services. The town is also home to several manufacturing companies, including a paper mill, a plastics factory, and a metal fabrication plant.
The town is also home to several farms, which produce a variety of crops, including corn, soybeans, and hay. The town is also home to several wineries, which produce a variety of wines.
Demographics
As of the 2010 census, the population of Homer was 5,094. The racial makeup of the town was 97.2% White, 0.7% African American, 0.2% Native American, 0.4% Asian, 0.1% Pacific Islander, 0.3% from other races, and 1.1% from two or more races. Hispanic or Latino of any race were 1.3% of the population.
The median household income in Homer was $45,938, and the median family income was $51,938. The per capita income for the town was $20,945. About 8.2% of families and 10.2% of the population were below the poverty line, including 14.2% of those under age 18 and 5.2% of those age 65 or over.
History
Homer was founded in 1794 by settlers from Connecticut. The town was named after Homer, the ancient Greek poet. The town was originally a farming community, but it soon developed into a manufacturing center. The town was home to several mills, including a paper mill, a plastics factory, and a metal fabrication plant.
In the late 19th century, the town became a popular tourist destination. The town was home to several resorts, including the Homer House, which was built in 1876. The town was also home to several amusement parks, including the Homer Park, which opened in 1891.
The town continued to grow throughout the 20th century. In the 1950s, the town was home to several factories, including a paper mill, a plastics factory, and a metal fabrication plant. The town also became home to several wineries, which produce a variety of wines.
Today, Homer is a small town with a diverse economy. The town is home to several small businesses, including restaurants, retail stores, and professional services. The town is also home to several farms, which produce a variety of crops, including corn, soybeans, and hay. The town is also home to several wineries, which produce a variety of wines.
Common Questions
What is Per Capita Income in Homer?
Per Capita income in Homer is $39,627.
What is the Median Family Income in Homer?
Median Family Income in Homer is $80,192.
What is the Median Household income in Homer?
Median Household Income in Homer is $65,905.
What is Income or Wage Gap in Homer?
Income or Wage Gap in Homer is 6.6%.
Women in Homer earn 93.4 cents for every dollar earned by a man.
What is Inequality or Gini Index in Homer?
Inequality or Gini Index in Homer is 0.39.
What is the Total Population of Homer?
Total Population of Homer is 3,170.
What is the Total Male Population of Homer?
Total Male Population of Homer is 1,441.
What is the Total Female Population of Homer?
Total Female Population of Homer is 1,729.
What is the Ratio of Males per 100 Females in Homer?
There are 83.34 Males per 100 Females in Homer.
What is the Ratio of Females per 100 Males in Homer?
There are 119.99 Females per 100 Males in Homer.
What is the Median Population Age in Homer?
Median Population Age in Homer is 50.2 Years.
What is the Average Family Size in Homer
Average Family Size in Homer is 2.6 People.
What is the Average Household Size in Homer
Average Household Size in Homer is 2.0 People.
How Large is the Labor Force in Homer?
There are 1,828 People in the Labor Forcein in Homer.
What is the Percentage of People in the Labor Force in Homer?
69.1% of People are in the Labor Force in Homer.
What is the Unemployment Rate in Homer?
Unemployment Rate in Homer is 2.0%.