Hilton, NY Map & Demographics
Hilton Map
Hilton Overview
$29,798
PER CAPITA INCOME
$99,792
AVG FAMILY INCOME
$75,098
AVG HOUSEHOLD INCOME
16.1%
WAGE / INCOME GAP [ % ]
83.9¢/ $1
WAGE / INCOME GAP [ $ ]
0.37
INEQUALITY / GINI INDEX
5,998
TOTAL POPULATION
2,825
MALE POPULATION
3,173
FEMALE POPULATION
89.03
MALES / 100 FEMALES
112.32
FEMALES / 100 MALES
36.9
MEDIAN AGE
3.1
AVG FAMILY SIZE
2.7
AVG HOUSEHOLD SIZE
2,990
LABOR FORCE [ PEOPLE ]
62.5%
PERCENT IN LABOR FORCE
7.6%
UNEMPLOYMENT RATE
Hilton Zip Codes
Hilton Area Codes
Income in Hilton
Income Overview in Hilton
Per Capita Income in Hilton is $29,798, while median incomes of families and households are $99,792 and $75,098 respectively.
| Characteristic | Number | Measure |
| Per Capita Income | 5,998 | $29,798 |
| Median Family Income | 1,590 | $99,792 |
| Mean Family Income | 1,590 | $92,214 |
| Median Household Income | 2,232 | $75,098 |
| Mean Household Income | 2,232 | $78,485 |
| Income Deficit | 1,590 | $0 |
| Wage / Income Gap (%) | 5,998 | 16.14% |
| Wage / Income Gap ($) | 5,998 | 83.86¢ per $1 |
| Gini / Inequality Index | 5,998 | 0.37 |
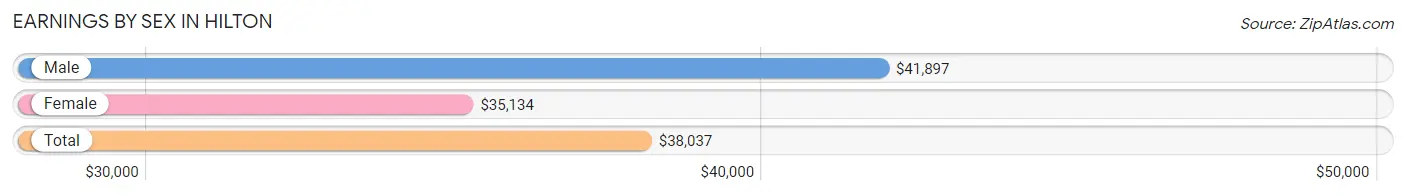
Earnings by Sex in Hilton
Average Earnings in Hilton are $38,037, $41,897 for men and $35,134 for women, a difference of 16.1%.
| Sex | Number | Average Earnings |
| Male | 1,533 (51.1%) | $41,897 |
| Female | 1,469 (48.9%) | $35,134 |
| Total | 3,002 (100.0%) | $38,037 |
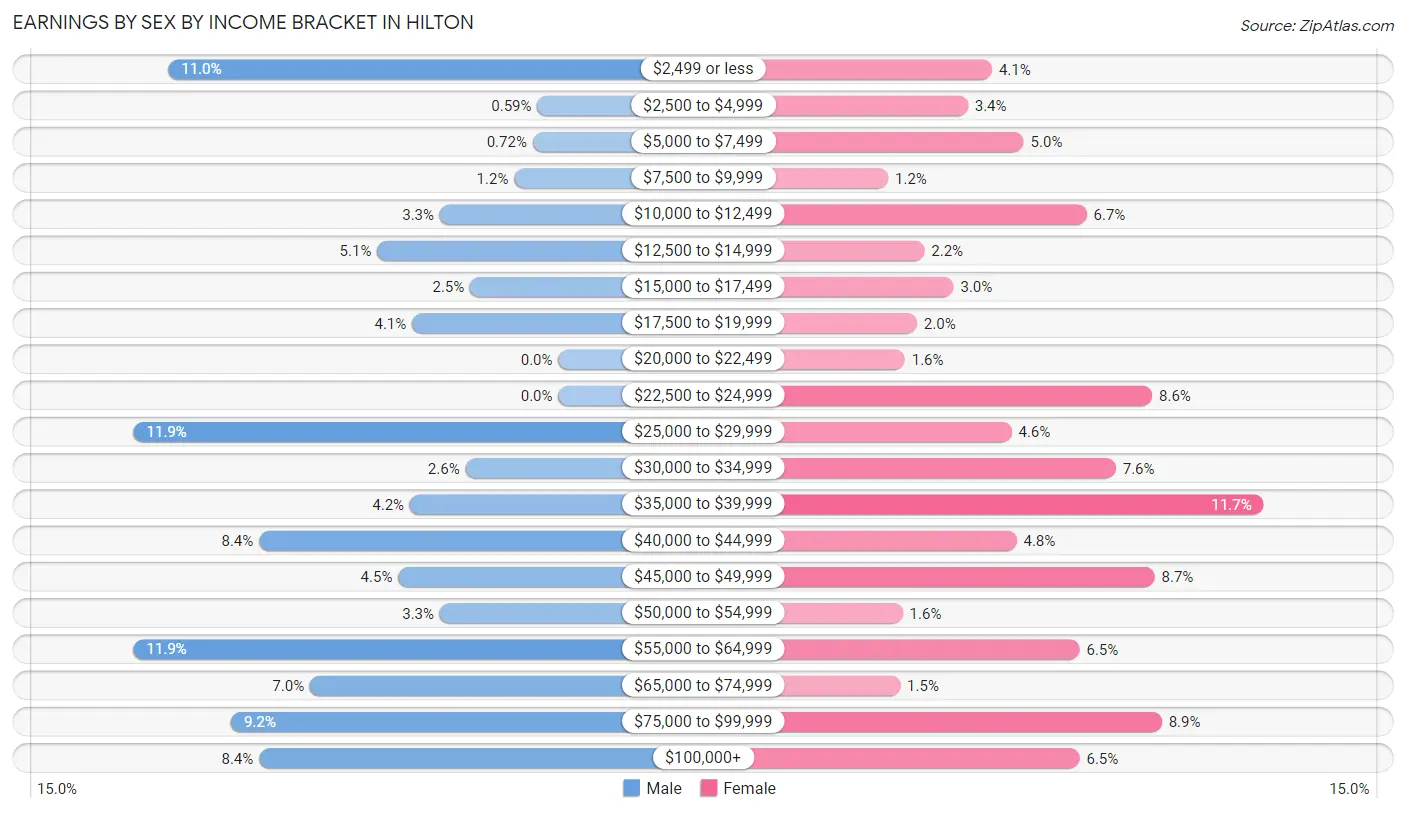
Earnings by Sex by Income Bracket in Hilton
The most common earnings brackets in Hilton are $25,000 to $29,999 for men (183 | 11.9%) and $35,000 to $39,999 for women (172 | 11.7%).
| Income | Male | Female |
| $2,499 or less | 168 (11.0%) | 60 (4.1%) |
| $2,500 to $4,999 | 9 (0.6%) | 50 (3.4%) |
| $5,000 to $7,499 | 11 (0.7%) | 73 (5.0%) |
| $7,500 to $9,999 | 19 (1.2%) | 17 (1.2%) |
| $10,000 to $12,499 | 51 (3.3%) | 99 (6.7%) |
| $12,500 to $14,999 | 78 (5.1%) | 32 (2.2%) |
| $15,000 to $17,499 | 38 (2.5%) | 44 (3.0%) |
| $17,500 to $19,999 | 63 (4.1%) | 29 (2.0%) |
| $20,000 to $22,499 | 0 (0.0%) | 24 (1.6%) |
| $22,500 to $24,999 | 0 (0.0%) | 126 (8.6%) |
| $25,000 to $29,999 | 183 (11.9%) | 68 (4.6%) |
| $30,000 to $34,999 | 40 (2.6%) | 111 (7.6%) |
| $35,000 to $39,999 | 64 (4.2%) | 172 (11.7%) |
| $40,000 to $44,999 | 129 (8.4%) | 70 (4.8%) |
| $45,000 to $49,999 | 69 (4.5%) | 127 (8.6%) |
| $50,000 to $54,999 | 51 (3.3%) | 23 (1.6%) |
| $55,000 to $64,999 | 183 (11.9%) | 96 (6.5%) |
| $65,000 to $74,999 | 107 (7.0%) | 22 (1.5%) |
| $75,000 to $99,999 | 141 (9.2%) | 130 (8.8%) |
| $100,000+ | 129 (8.4%) | 96 (6.5%) |
| Total | 1,533 (100.0%) | 1,469 (100.0%) |
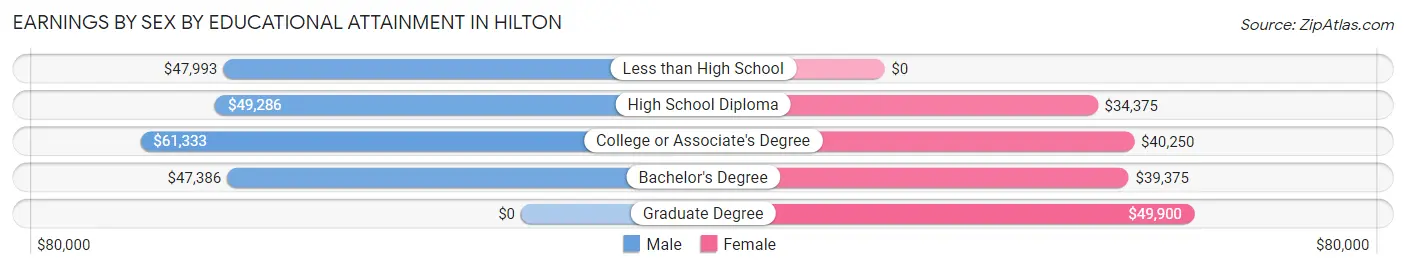
Earnings by Sex by Educational Attainment in Hilton
Average earnings in Hilton are $54,559 for men and $38,698 for women, a difference of 29.1%. Men with an educational attainment of college or associate's degree enjoy the highest average annual earnings of $61,333, while those with bachelor's degree education earn the least with $47,386. Women with an educational attainment of graduate degree earn the most with the average annual earnings of $49,900, while those with high school diploma education have the smallest earnings of $34,375.
| Educational Attainment | Male Income | Female Income |
| Less than High School | $47,993 | $0 |
| High School Diploma | $49,286 | $34,375 |
| College or Associate's Degree | $61,333 | $40,250 |
| Bachelor's Degree | $47,386 | $39,375 |
| Graduate Degree | - | - |
| Total | $54,559 | $38,698 |
Family Income in Hilton
Family Income Brackets in Hilton
According to the Hilton family income data, there are 622 families falling into the $100,000 to $149,999 income range, which is the most common income bracket and makes up 39.1% of all families. Conversely, the $10,000 to $14,999 income bracket is the least frequent group with only 17 families (1.1%) belonging to this category.
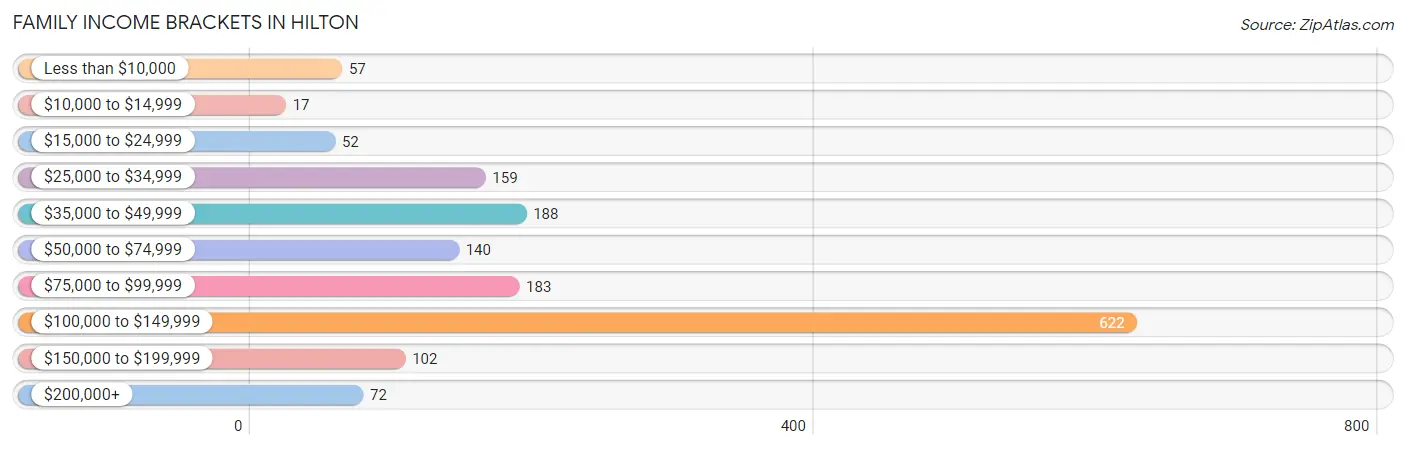
| Income Bracket | # Families | % Families |
| Less than $10,000 | 57 | 3.6% |
| $10,000 to $14,999 | 17 | 1.1% |
| $15,000 to $24,999 | 52 | 3.3% |
| $25,000 to $34,999 | 159 | 10.0% |
| $35,000 to $49,999 | 188 | 11.8% |
| $50,000 to $74,999 | 140 | 8.8% |
| $75,000 to $99,999 | 183 | 11.5% |
| $100,000 to $149,999 | 622 | 39.1% |
| $150,000 to $199,999 | 102 | 6.4% |
| $200,000+ | 72 | 4.5% |
Family Income by Famaliy Size in Hilton
4-person families (268 | 16.9%) account for the highest median family income in Hilton with $130,991 per family, while 2-person families (768 | 48.3%) have the highest median income of $37,188 per family member.
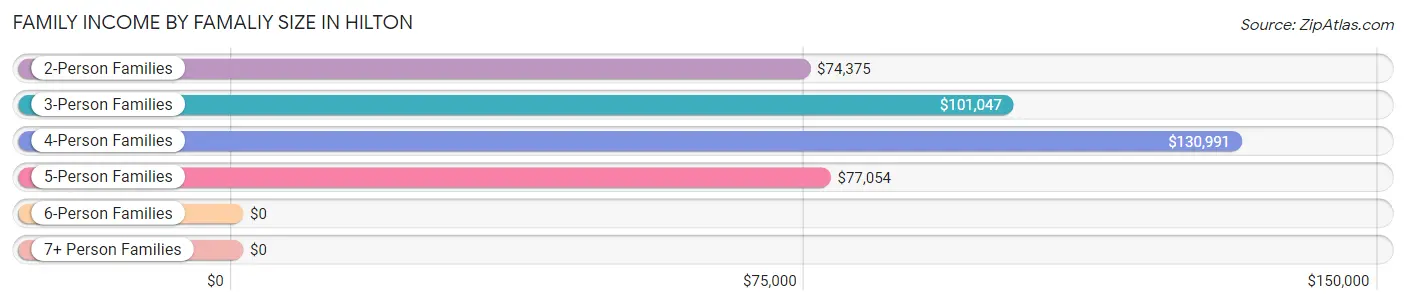
| Income Bracket | # Families | Median Income |
| 2-Person Families | 768 (48.3%) | $74,375 |
| 3-Person Families | 335 (21.1%) | $101,047 |
| 4-Person Families | 268 (16.9%) | $130,991 |
| 5-Person Families | 97 (6.1%) | $77,054 |
| 6-Person Families | 21 (1.3%) | $0 |
| 7+ Person Families | 101 (6.4%) | $0 |
| Total | 1,590 (100.0%) | $99,792 |
Family Income by Number of Earners in Hilton
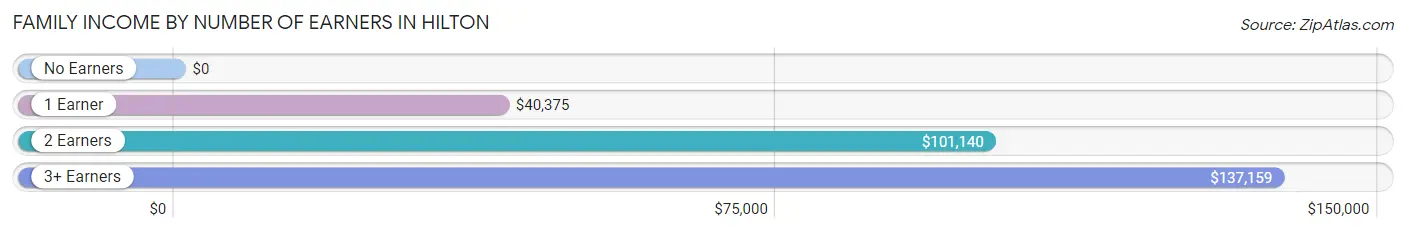
| Number of Earners | # Families | Median Income |
| No Earners | 192 (12.1%) | $0 |
| 1 Earner | 500 (31.5%) | $40,375 |
| 2 Earners | 719 (45.2%) | $101,140 |
| 3+ Earners | 179 (11.3%) | $137,159 |
| Total | 1,590 (100.0%) | $99,792 |
Household Income in Hilton
Household Income Brackets in Hilton
With 634 households falling in the category, the $100,000 to $149,999 income range is the most frequent in Hilton, accounting for 28.4% of all households. In contrast, only 42 households (1.9%) fall into the $10,000 to $14,999 income bracket, making it the least populous group.
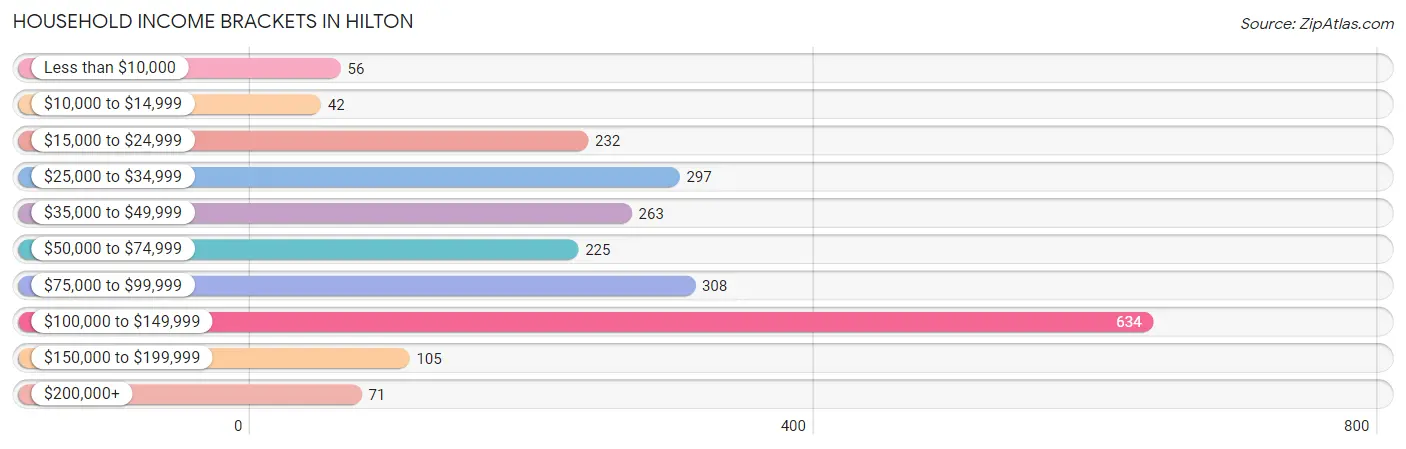
| Income Bracket | # Households | % Households |
| Less than $10,000 | 56 | 2.5% |
| $10,000 to $14,999 | 42 | 1.9% |
| $15,000 to $24,999 | 232 | 10.4% |
| $25,000 to $34,999 | 297 | 13.3% |
| $35,000 to $49,999 | 263 | 11.8% |
| $50,000 to $74,999 | 225 | 10.1% |
| $75,000 to $99,999 | 308 | 13.8% |
| $100,000 to $149,999 | 634 | 28.4% |
| $150,000 to $199,999 | 105 | 4.7% |
| $200,000+ | 71 | 3.2% |
Household Income by Householder Age in Hilton
The median household income in Hilton is $75,098, with the highest median household income of $101,316 found in the 45 to 64 years age bracket for the primary householder. A total of 877 households (39.3%) fall into this category. Meanwhile, the 15 to 24 years age bracket for the primary householder has the lowest median household income of $0, with 168 households (7.5%) in this group.
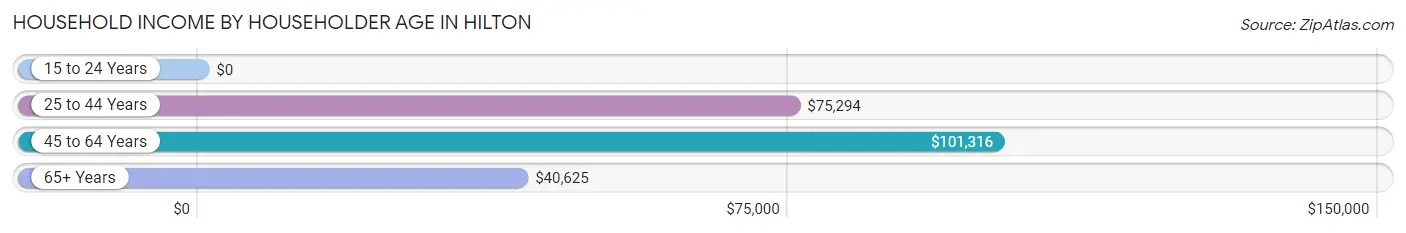
| Income Bracket | # Households | Median Income |
| 15 to 24 Years | 168 (7.5%) | $0 |
| 25 to 44 Years | 508 (22.8%) | $75,294 |
| 45 to 64 Years | 877 (39.3%) | $101,316 |
| 65+ Years | 679 (30.4%) | $40,625 |
| Total | 2,232 (100.0%) | $75,098 |
Poverty in Hilton
Income Below Poverty by Sex and Age in Hilton
With 8.1% poverty level for males and 13.7% for females among the residents of Hilton, under 5 year old males and 18 to 24 year old females are the most vulnerable to poverty, with 43 males (89.6%) and 171 females (52.0%) in their respective age groups living below the poverty level.
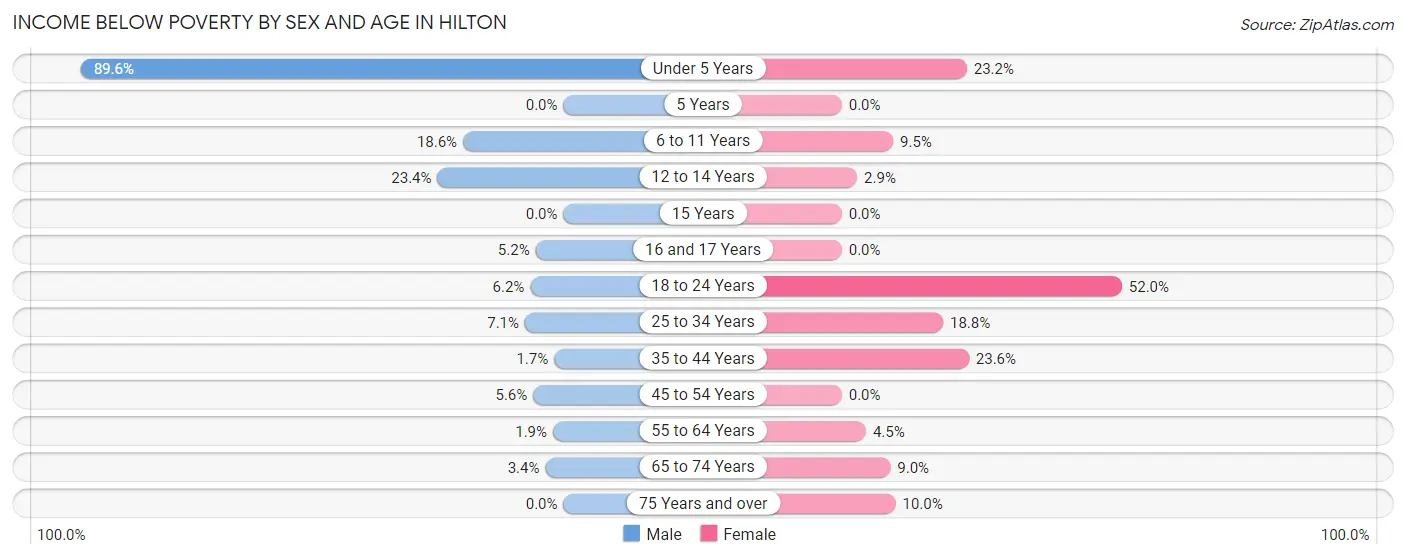
| Age Bracket | Male | Female |
| Under 5 Years | 43 (89.6%) | 42 (23.2%) |
| 5 Years | 0 (0.0%) | 0 (0.0%) |
| 6 to 11 Years | 63 (18.6%) | 6 (9.5%) |
| 12 to 14 Years | 40 (23.4%) | 9 (2.9%) |
| 15 Years | 0 (0.0%) | 0 (0.0%) |
| 16 and 17 Years | 9 (5.2%) | 0 (0.0%) |
| 18 to 24 Years | 22 (6.1%) | 171 (52.0%) |
| 25 to 34 Years | 13 (7.1%) | 53 (18.8%) |
| 35 to 44 Years | 7 (1.7%) | 79 (23.6%) |
| 45 to 54 Years | 12 (5.6%) | 0 (0.0%) |
| 55 to 64 Years | 10 (1.9%) | 23 (4.5%) |
| 65 to 74 Years | 9 (3.4%) | 21 (9.0%) |
| 75 Years and over | 0 (0.0%) | 31 (10.0%) |
| Total | 228 (8.1%) | 435 (13.7%) |
Income Above Poverty by Sex and Age in Hilton
According to the poverty statistics in Hilton, males aged 15 years and females aged 5 years are the age groups that are most secure financially, with 100.0% of males and 100.0% of females in these age groups living above the poverty line.
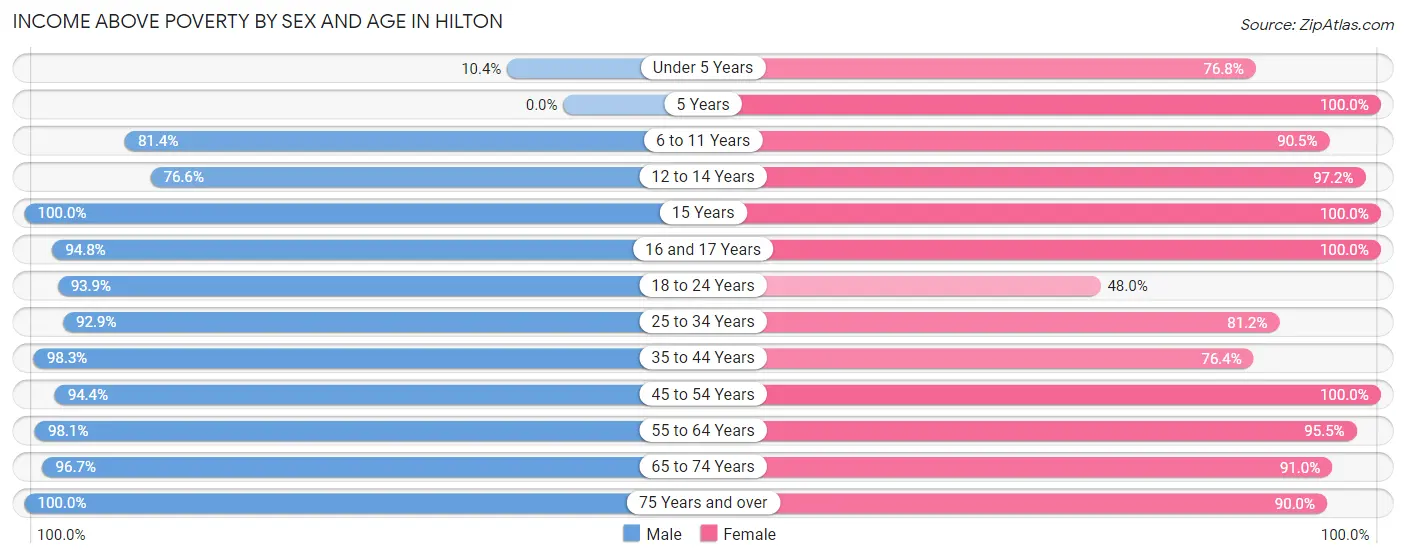
| Age Bracket | Male | Female |
| Under 5 Years | 5 (10.4%) | 139 (76.8%) |
| 5 Years | 0 (0.0%) | 36 (100.0%) |
| 6 to 11 Years | 275 (81.4%) | 57 (90.5%) |
| 12 to 14 Years | 131 (76.6%) | 307 (97.2%) |
| 15 Years | 45 (100.0%) | 16 (100.0%) |
| 16 and 17 Years | 165 (94.8%) | 203 (100.0%) |
| 18 to 24 Years | 336 (93.9%) | 158 (48.0%) |
| 25 to 34 Years | 169 (92.9%) | 229 (81.2%) |
| 35 to 44 Years | 397 (98.3%) | 256 (76.4%) |
| 45 to 54 Years | 202 (94.4%) | 356 (100.0%) |
| 55 to 64 Years | 506 (98.1%) | 489 (95.5%) |
| 65 to 74 Years | 260 (96.7%) | 212 (91.0%) |
| 75 Years and over | 106 (100.0%) | 280 (90.0%) |
| Total | 2,597 (91.9%) | 2,738 (86.3%) |
Income Below Poverty Among Married-Couple Families in Hilton
The poverty statistics for married-couple families in Hilton show that 1.4% or 15 of the total 1,087 families live below the poverty line. Families with 3 or 4 children have the highest poverty rate of 12.0%, comprising of 6 families. On the other hand, families with 1 or 2 children have the lowest poverty rate of 0.0%, which includes 0 families.
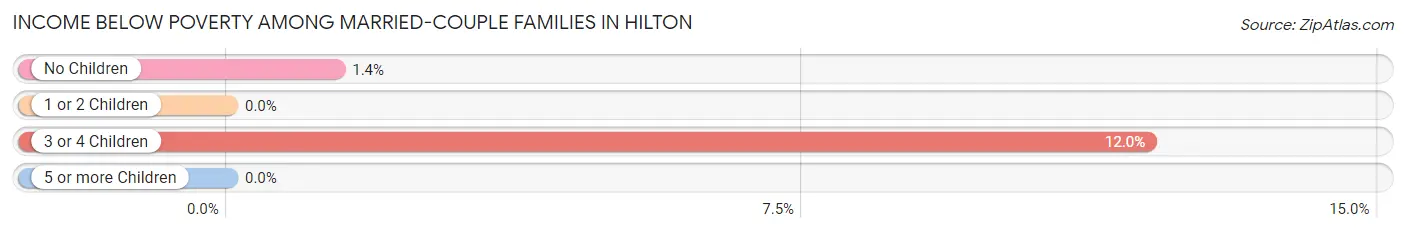
| Children | Above Poverty | Below Poverty |
| No Children | 634 (98.6%) | 9 (1.4%) |
| 1 or 2 Children | 293 (100.0%) | 0 (0.0%) |
| 3 or 4 Children | 44 (88.0%) | 6 (12.0%) |
| 5 or more Children | 101 (100.0%) | 0 (0.0%) |
| Total | 1,072 (98.6%) | 15 (1.4%) |
Income Below Poverty Among Single-Parent Households in Hilton
According to the poverty data in Hilton, 8.1% or 18 single-father households and 38.1% or 107 single-mother households are living below the poverty line. Among single-father households, those with no children have the highest poverty rate, with 8 households (13.8%) experiencing poverty. Likewise, among single-mother households, those with 3 or 4 children have the highest poverty rate, with 15 households (100.0%) falling below the poverty line.
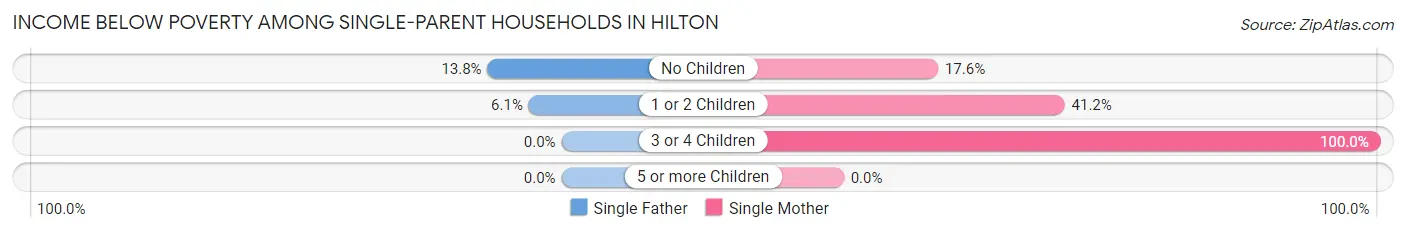
| Children | Single Father | Single Mother |
| No Children | 8 (13.8%) | 13 (17.6%) |
| 1 or 2 Children | 10 (6.1%) | 79 (41.1%) |
| 3 or 4 Children | 0 (0.0%) | 15 (100.0%) |
| 5 or more Children | 0 (0.0%) | 0 (0.0%) |
| Total | 18 (8.1%) | 107 (38.1%) |
Income Below Poverty Among Married-Couple vs Single-Parent Households in Hilton
The poverty data for Hilton shows that 15 of the married-couple family households (1.4%) and 125 of the single-parent households (24.8%) are living below the poverty level. Within the married-couple family households, those with 3 or 4 children have the highest poverty rate, with 6 households (12.0%) falling below the poverty line. Among the single-parent households, those with 3 or 4 children have the highest poverty rate, with 15 household (100.0%) living below poverty.
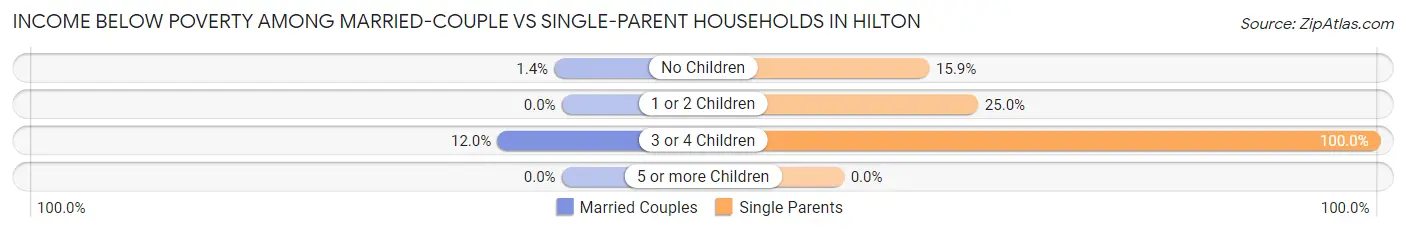
| Children | Married-Couple Families | Single-Parent Households |
| No Children | 9 (1.4%) | 21 (15.9%) |
| 1 or 2 Children | 0 (0.0%) | 89 (25.0%) |
| 3 or 4 Children | 6 (12.0%) | 15 (100.0%) |
| 5 or more Children | 0 (0.0%) | 0 (0.0%) |
| Total | 15 (1.4%) | 125 (24.8%) |
Race in Hilton
The most populous races in Hilton are White / Caucasian (5,618 | 93.7%), Black / African American (217 | 3.6%), and Hispanic or Latino (149 | 2.5%).
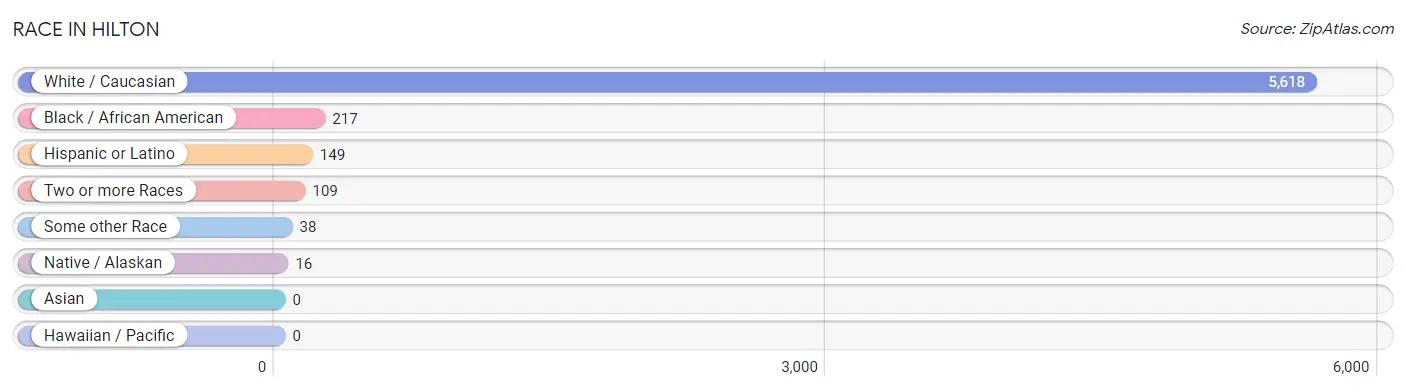
| Race | # Population | % Population |
| Asian | 0 | 0.0% |
| Black / African American | 217 | 3.6% |
| Hawaiian / Pacific | 0 | 0.0% |
| Hispanic or Latino | 149 | 2.5% |
| Native / Alaskan | 16 | 0.3% |
| White / Caucasian | 5,618 | 93.7% |
| Two or more Races | 109 | 1.8% |
| Some other Race | 38 | 0.6% |
| Total | 5,998 | 100.0% |
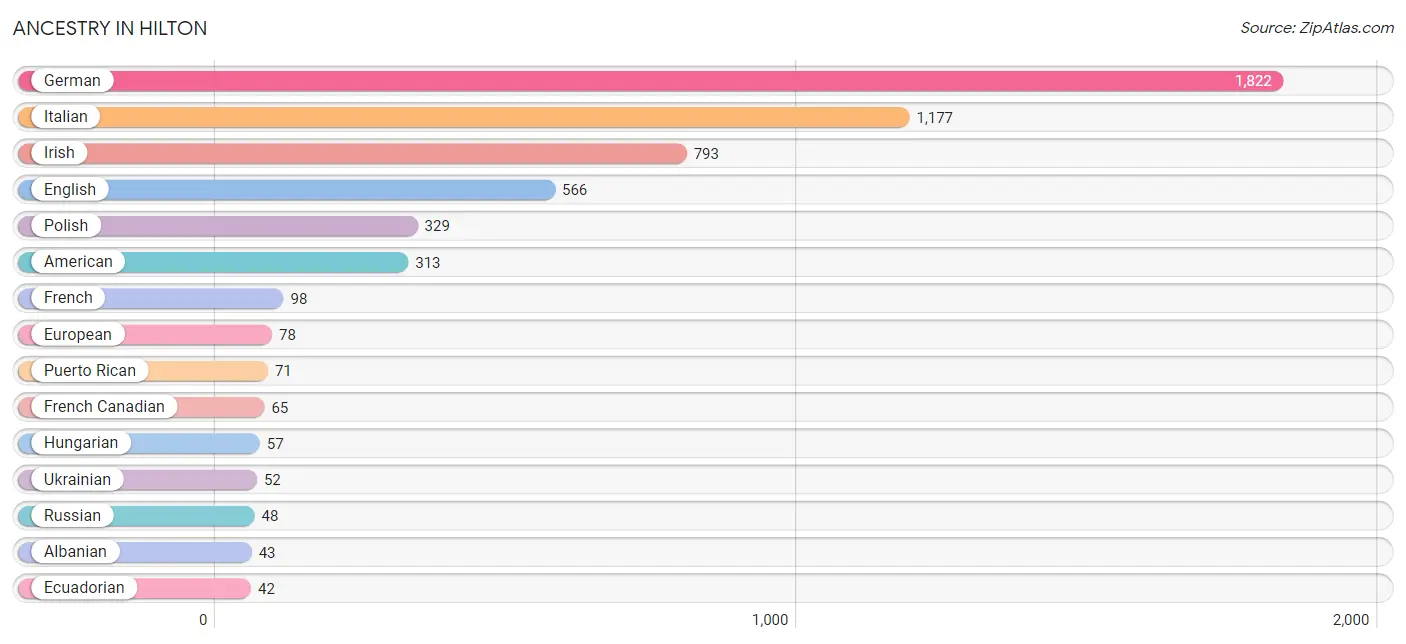
Ancestry in Hilton
The most populous ancestries reported in Hilton are German (1,822 | 30.4%), Italian (1,177 | 19.6%), Irish (793 | 13.2%), English (566 | 9.4%), and Polish (329 | 5.5%), together accounting for 78.1% of all Hilton residents.
| Ancestry | # Population | % Population |
| African | 17 | 0.3% |
| Albanian | 43 | 0.7% |
| American | 313 | 5.2% |
| Arab | 32 | 0.5% |
| Austrian | 10 | 0.2% |
| Belgian | 10 | 0.2% |
| Canadian | 14 | 0.2% |
| Cherokee | 39 | 0.6% |
| Cuban | 23 | 0.4% |
| Dominican | 13 | 0.2% |
| Dutch | 22 | 0.4% |
| Eastern European | 4 | 0.1% |
| Ecuadorian | 42 | 0.7% |
| English | 566 | 9.4% |
| European | 78 | 1.3% |
| French | 98 | 1.6% |
| French Canadian | 65 | 1.1% |
| German | 1,822 | 30.4% |
| Greek | 11 | 0.2% |
| Hungarian | 57 | 0.9% |
| Irish | 793 | 13.2% |
| Italian | 1,177 | 19.6% |
| Korean | 16 | 0.3% |
| Lebanese | 19 | 0.3% |
| Macedonian | 33 | 0.5% |
| Palestinian | 13 | 0.2% |
| Polish | 329 | 5.5% |
| Portuguese | 28 | 0.5% |
| Puerto Rican | 71 | 1.2% |
| Romanian | 14 | 0.2% |
| Russian | 48 | 0.8% |
| Scandinavian | 5 | 0.1% |
| Scottish | 19 | 0.3% |
| Slovak | 9 | 0.2% |
| South American | 42 | 0.7% |
| Subsaharan African | 17 | 0.3% |
| Swedish | 27 | 0.4% |
| Ukrainian | 52 | 0.9% | View All 38 Rows |
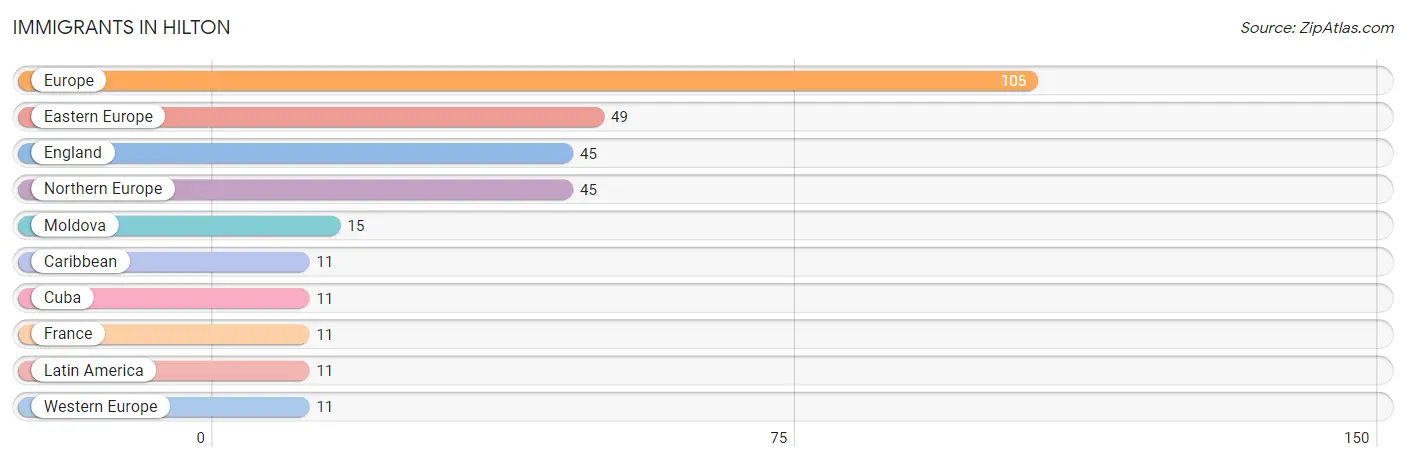
Immigrants in Hilton
The most numerous immigrant groups reported in Hilton came from Europe (105 | 1.8%), Eastern Europe (49 | 0.8%), England (45 | 0.7%), Northern Europe (45 | 0.7%), and Moldova (15 | 0.3%), together accounting for 4.3% of all Hilton residents.
| Immigration Origin | # Population | % Population |
| Caribbean | 11 | 0.2% |
| Cuba | 11 | 0.2% |
| Eastern Europe | 49 | 0.8% |
| England | 45 | 0.7% |
| Europe | 105 | 1.8% |
| France | 11 | 0.2% |
| Latin America | 11 | 0.2% |
| Moldova | 15 | 0.3% |
| Northern Europe | 45 | 0.7% |
| Western Europe | 11 | 0.2% | View All 10 Rows |
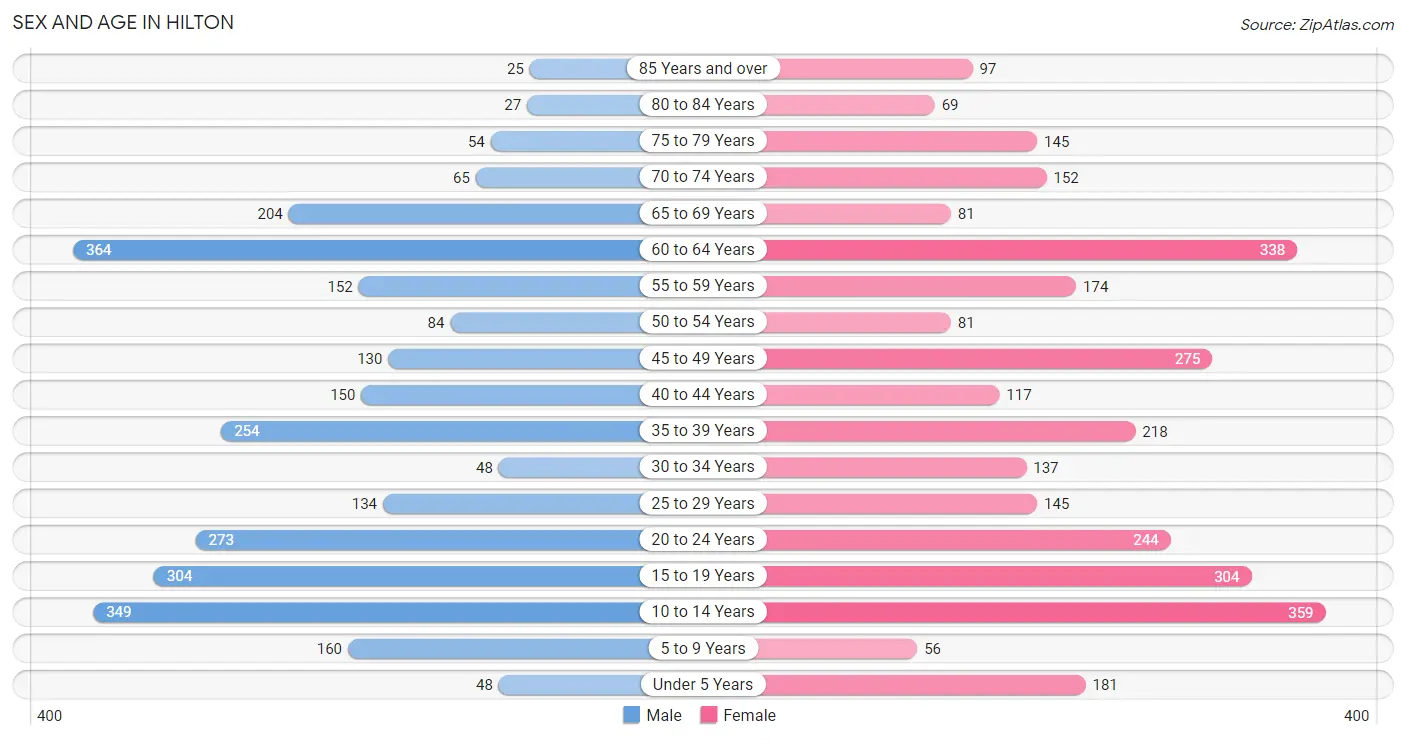
Sex and Age in Hilton
Sex and Age in Hilton
The most populous age groups in Hilton are 60 to 64 Years (364 | 12.9%) for men and 10 to 14 Years (359 | 11.3%) for women.
| Age Bracket | Male | Female |
| Under 5 Years | 48 (1.7%) | 181 (5.7%) |
| 5 to 9 Years | 160 (5.7%) | 56 (1.8%) |
| 10 to 14 Years | 349 (12.3%) | 359 (11.3%) |
| 15 to 19 Years | 304 (10.8%) | 304 (9.6%) |
| 20 to 24 Years | 273 (9.7%) | 244 (7.7%) |
| 25 to 29 Years | 134 (4.7%) | 145 (4.6%) |
| 30 to 34 Years | 48 (1.7%) | 137 (4.3%) |
| 35 to 39 Years | 254 (9.0%) | 218 (6.9%) |
| 40 to 44 Years | 150 (5.3%) | 117 (3.7%) |
| 45 to 49 Years | 130 (4.6%) | 275 (8.7%) |
| 50 to 54 Years | 84 (3.0%) | 81 (2.5%) |
| 55 to 59 Years | 152 (5.4%) | 174 (5.5%) |
| 60 to 64 Years | 364 (12.9%) | 338 (10.6%) |
| 65 to 69 Years | 204 (7.2%) | 81 (2.5%) |
| 70 to 74 Years | 65 (2.3%) | 152 (4.8%) |
| 75 to 79 Years | 54 (1.9%) | 145 (4.6%) |
| 80 to 84 Years | 27 (1.0%) | 69 (2.2%) |
| 85 Years and over | 25 (0.9%) | 97 (3.1%) |
| Total | 2,825 (100.0%) | 3,173 (100.0%) |
Families and Households in Hilton
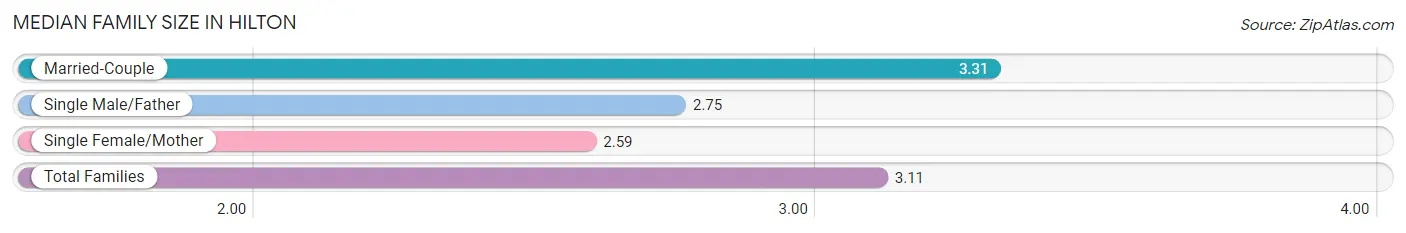
Median Family Size in Hilton
The median family size in Hilton is 3.11 persons per family, with married-couple families (1,087 | 68.4%) accounting for the largest median family size of 3.31 persons per family. On the other hand, single female/mother families (281 | 17.7%) represent the smallest median family size with 2.59 persons per family.
| Family Type | # Families | Family Size |
| Married-Couple | 1,087 (68.4%) | 3.31 |
| Single Male/Father | 222 (14.0%) | 2.75 |
| Single Female/Mother | 281 (17.7%) | 2.59 |
| Total Families | 1,590 (100.0%) | 3.11 |
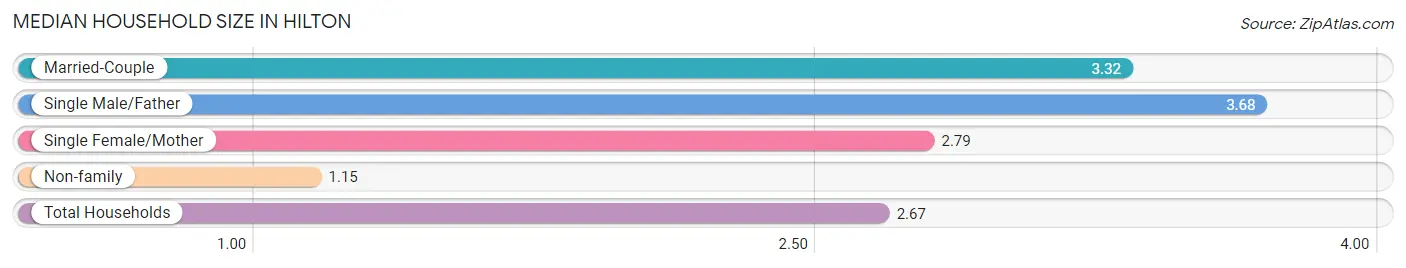
Median Household Size in Hilton
The median household size in Hilton is 2.67 persons per household, with single male/father households (222 | 10.0%) accounting for the largest median household size of 3.68 persons per household. non-family households (642 | 28.8%) represent the smallest median household size with 1.15 persons per household.
| Household Type | # Households | Household Size |
| Married-Couple | 1,087 (48.7%) | 3.32 |
| Single Male/Father | 222 (10.0%) | 3.68 |
| Single Female/Mother | 281 (12.6%) | 2.79 |
| Non-family | 642 (28.8%) | 1.15 |
| Total Households | 2,232 (100.0%) | 2.67 |
Household Size by Marriage Status in Hilton
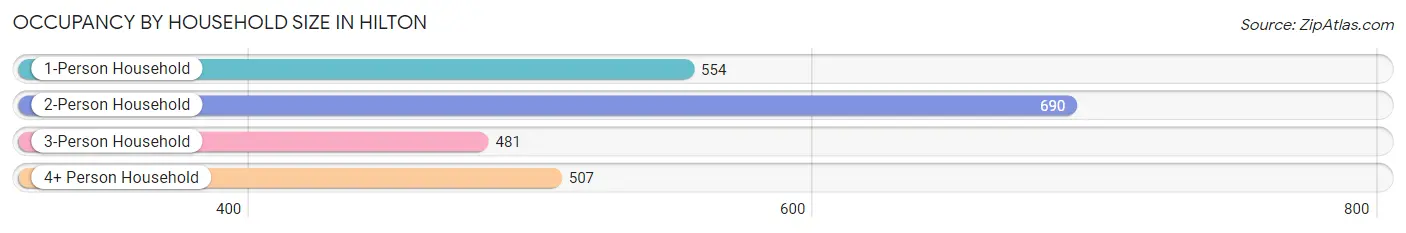
Out of a total of 2,232 households in Hilton, 1,590 (71.2%) are family households, while 642 (28.8%) are nonfamily households. The most numerous type of family households are 2-person households, comprising 602, and the most common type of nonfamily households are 1-person households, comprising 554.
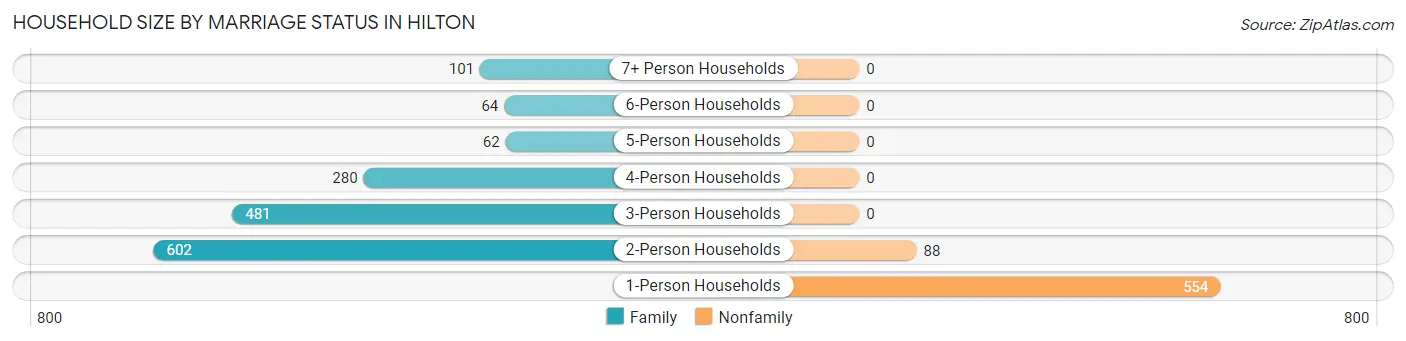
| Household Size | Family Households | Nonfamily Households |
| 1-Person Households | - | 554 (24.8%) |
| 2-Person Households | 602 (27.0%) | 88 (3.9%) |
| 3-Person Households | 481 (21.5%) | 0 (0.0%) |
| 4-Person Households | 280 (12.5%) | 0 (0.0%) |
| 5-Person Households | 62 (2.8%) | 0 (0.0%) |
| 6-Person Households | 64 (2.9%) | 0 (0.0%) |
| 7+ Person Households | 101 (4.5%) | 0 (0.0%) |
| Total | 1,590 (71.2%) | 642 (28.8%) |
Female Fertility in Hilton
Fertility by Age in Hilton
Average fertility rate in Hilton is 105.0 births per 1,000 women. Women in the age bracket of 20 to 34 years have the highest fertility rate with 260.0 births per 1,000 women. Women in the age bracket of 20 to 34 years acount for 89.5% of all women with births.
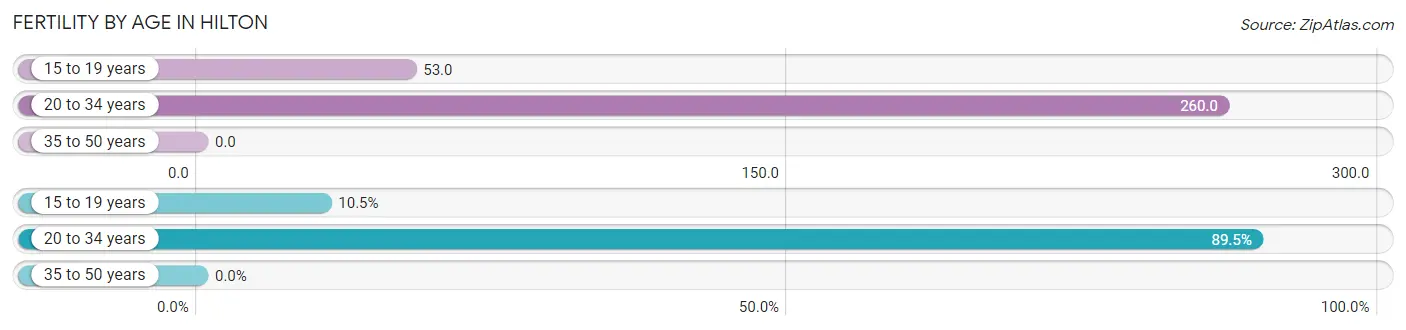
| Age Bracket | Women with Births | Births / 1,000 Women |
| 15 to 19 years | 16 (10.5%) | 53.0 |
| 20 to 34 years | 137 (89.5%) | 260.0 |
| 35 to 50 years | 0 (0.0%) | 0.0 |
| Total | 153 (100.0%) | 105.0 |
Fertility by Age by Marriage Status in Hilton
10.5% of women with births (153) in Hilton are married. The highest percentage of unmarried women with births falls into 20 to 34 years age bracket with 100.0% of them unmarried at the time of birth, while the lowest percentage of unmarried women with births belong to 15 to 19 years age bracket with 0.0% of them unmarried.
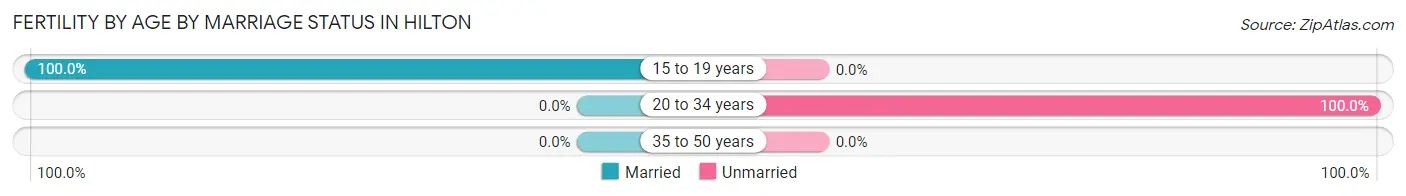
| Age Bracket | Married | Unmarried |
| 15 to 19 years | 16 (100.0%) | 0 (0.0%) |
| 20 to 34 years | 0 (0.0%) | 137 (100.0%) |
| 35 to 50 years | 0 (0.0%) | 0 (0.0%) |
| Total | 16 (10.5%) | 137 (89.5%) |
Fertility by Education in Hilton
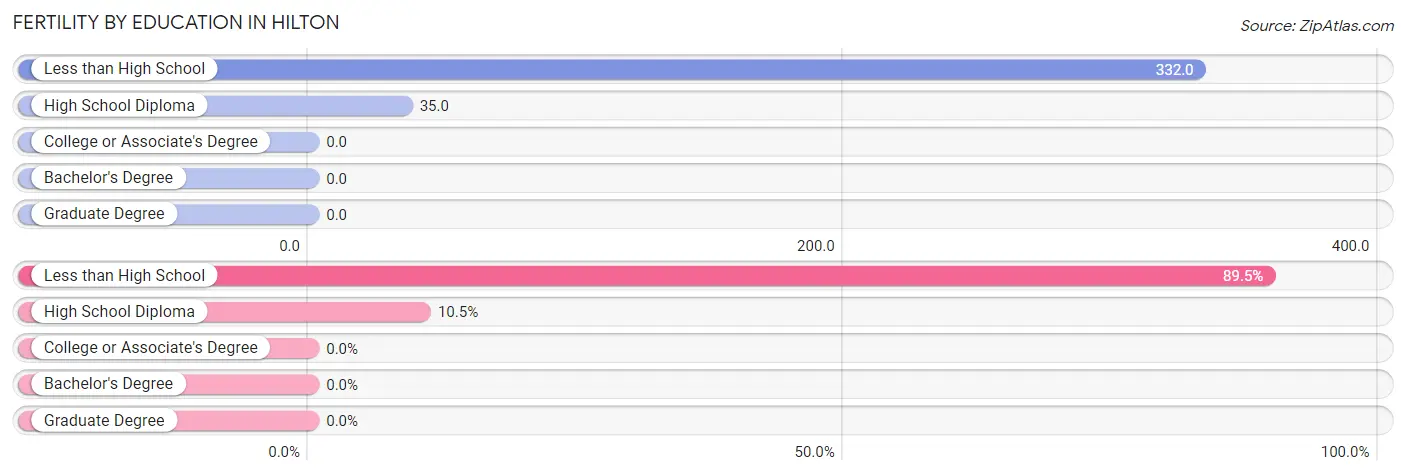
| Educational Attainment | Women with Births | Births / 1,000 Women |
| Less than High School | 137 (89.5%) | 332.0 |
| High School Diploma | 16 (10.5%) | 35.0 |
| College or Associate's Degree | 0 (0.0%) | 0.0 |
| Bachelor's Degree | 0 (0.0%) | 0.0 |
| Graduate Degree | 0 (0.0%) | 0.0 |
| Total | 153 (100.0%) | 105.0 |
Fertility by Education by Marriage Status in Hilton
89.5% of women with births in Hilton are unmarried. Women with the educational attainment of high school diploma are most likely to be married with 100.0% of them married at childbirth, while women with the educational attainment of less than high school are least likely to be married with 100.0% of them unmarried at childbirth.
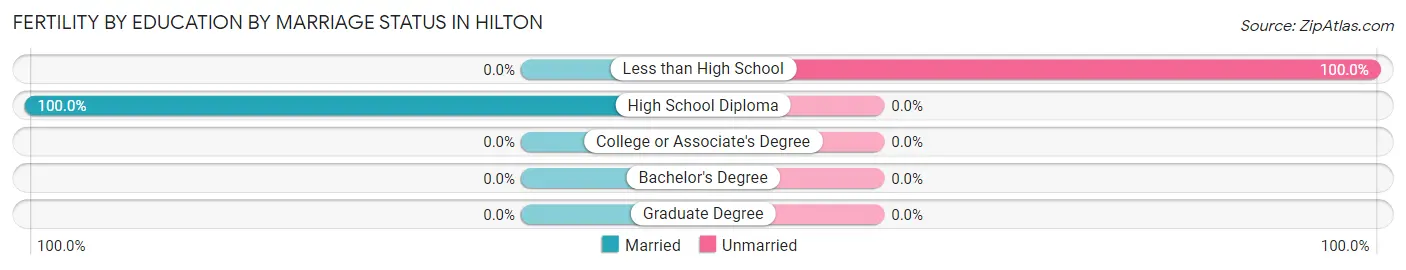
| Educational Attainment | Married | Unmarried |
| Less than High School | 0 (0.0%) | 137 (100.0%) |
| High School Diploma | 16 (100.0%) | 0 (0.0%) |
| College or Associate's Degree | 0 (0.0%) | 0 (0.0%) |
| Bachelor's Degree | 0 (0.0%) | 0 (0.0%) |
| Graduate Degree | 0 (0.0%) | 0 (0.0%) |
| Total | 16 (10.5%) | 137 (89.5%) |
Employment Characteristics in Hilton
Employment by Class of Employer in Hilton
Among the 2,730 employed individuals in Hilton, private company employees (1,960 | 71.8%), not-for-profit organizations (406 | 14.9%), and local government employees (164 | 6.0%) make up the most common classes of employment.
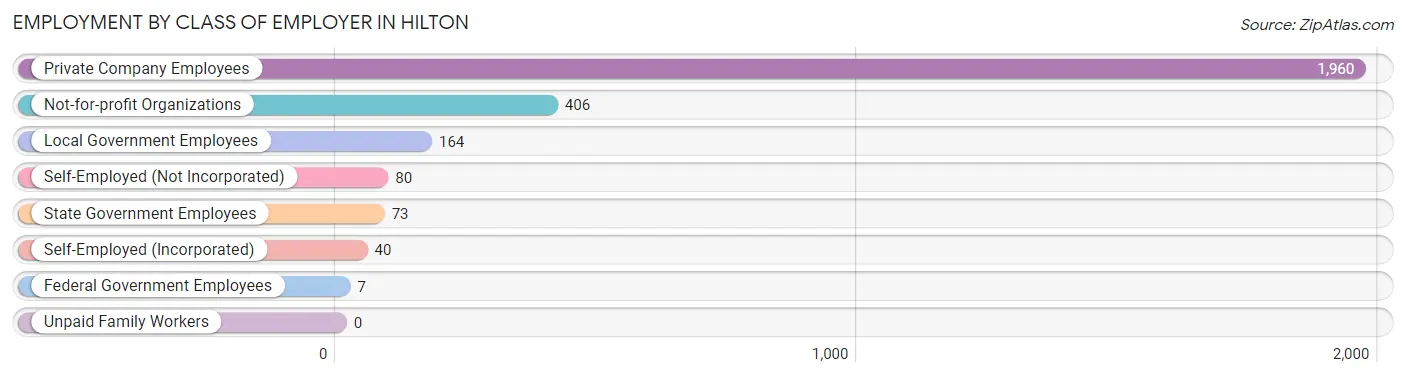
| Employer Class | # Employees | % Employees |
| Private Company Employees | 1,960 | 71.8% |
| Self-Employed (Incorporated) | 40 | 1.5% |
| Self-Employed (Not Incorporated) | 80 | 2.9% |
| Not-for-profit Organizations | 406 | 14.9% |
| Local Government Employees | 164 | 6.0% |
| State Government Employees | 73 | 2.7% |
| Federal Government Employees | 7 | 0.3% |
| Unpaid Family Workers | 0 | 0.0% |
| Total | 2,730 | 100.0% |
Employment Status by Age in Hilton
According to the labor force statistics for Hilton, out of the total population over 16 years of age (4,784), 62.5% or 2,990 individuals are in the labor force, with 7.6% or 227 of them unemployed. The age group with the highest labor force participation rate is 45 to 54 years, with 96.3% or 549 individuals in the labor force. Within the labor force, the 16 to 19 years age range has the highest percentage of unemployed individuals, with 30.1% or 110 of them being unemployed.
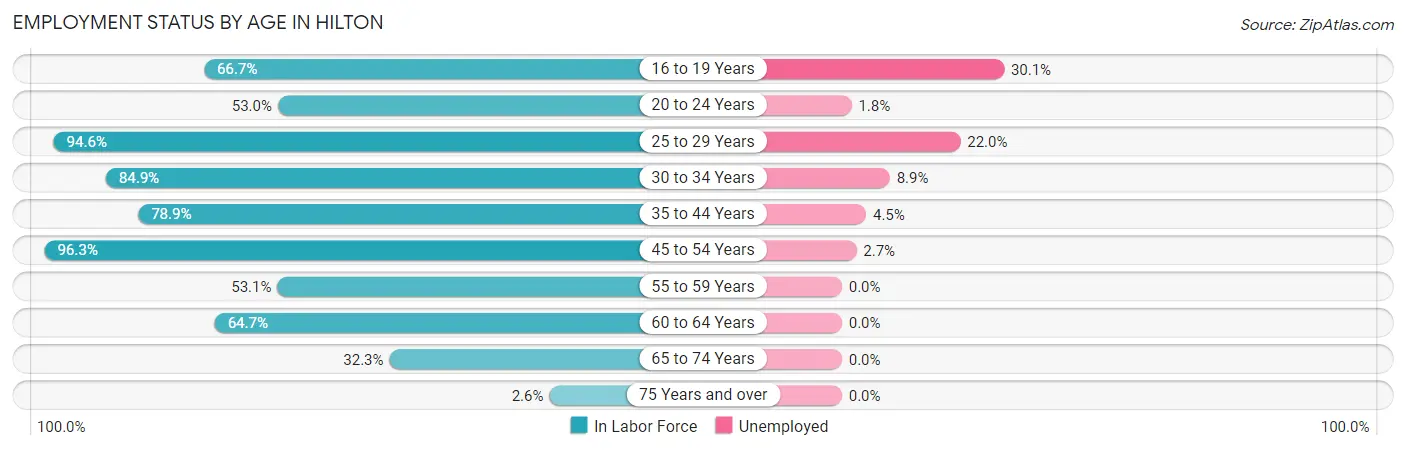
| Age Bracket | In Labor Force | Unemployed |
| 16 to 19 Years | 365 (66.7%) | 110 (30.1%) |
| 20 to 24 Years | 274 (53.0%) | 5 (1.8%) |
| 25 to 29 Years | 264 (94.6%) | 58 (22.0%) |
| 30 to 34 Years | 157 (84.9%) | 14 (8.9%) |
| 35 to 44 Years | 583 (78.9%) | 26 (4.5%) |
| 45 to 54 Years | 549 (96.3%) | 15 (2.7%) |
| 55 to 59 Years | 173 (53.1%) | 0 (0.0%) |
| 60 to 64 Years | 454 (64.7%) | 0 (0.0%) |
| 65 to 74 Years | 162 (32.3%) | 0 (0.0%) |
| 75 Years and over | 11 (2.6%) | 0 (0.0%) |
| Total | 2,990 (62.5%) | 227 (7.6%) |
Employment Status by Educational Attainment in Hilton
According to labor force statistics for Hilton, 77.8% of individuals (2,179) out of the total population between 25 and 64 years of age (2,801) are in the labor force, with 5.2% or 113 of them being unemployed. The group with the highest labor force participation rate are those with the educational attainment of bachelor's degree or higher, with 86.5% or 780 individuals in the labor force. Within the labor force, individuals with high school diploma education have the highest percentage of unemployment, with 8.4% or 65 of them being unemployed.
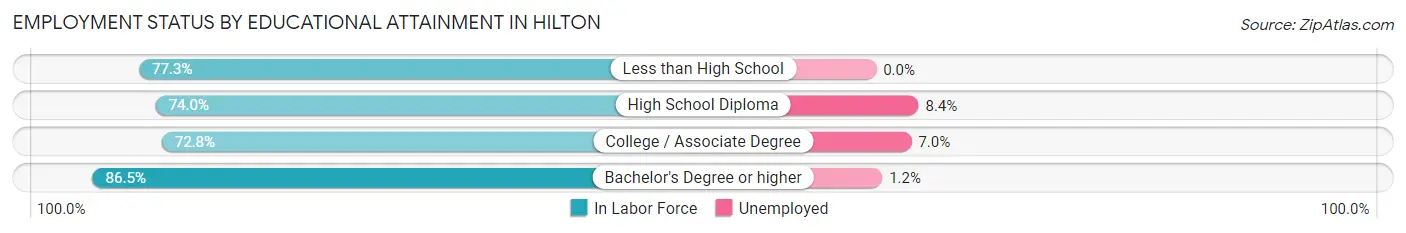
| Educational Attainment | In Labor Force | Unemployed |
| Less than High School | 75 (77.3%) | 0 (0.0%) |
| High School Diploma | 770 (74.0%) | 87 (8.4%) |
| College / Associate Degree | 555 (72.8%) | 53 (7.0%) |
| Bachelor's Degree or higher | 780 (86.5%) | 11 (1.2%) |
| Total | 2,179 (77.8%) | 146 (5.2%) |
Employment Occupations by Sex in Hilton
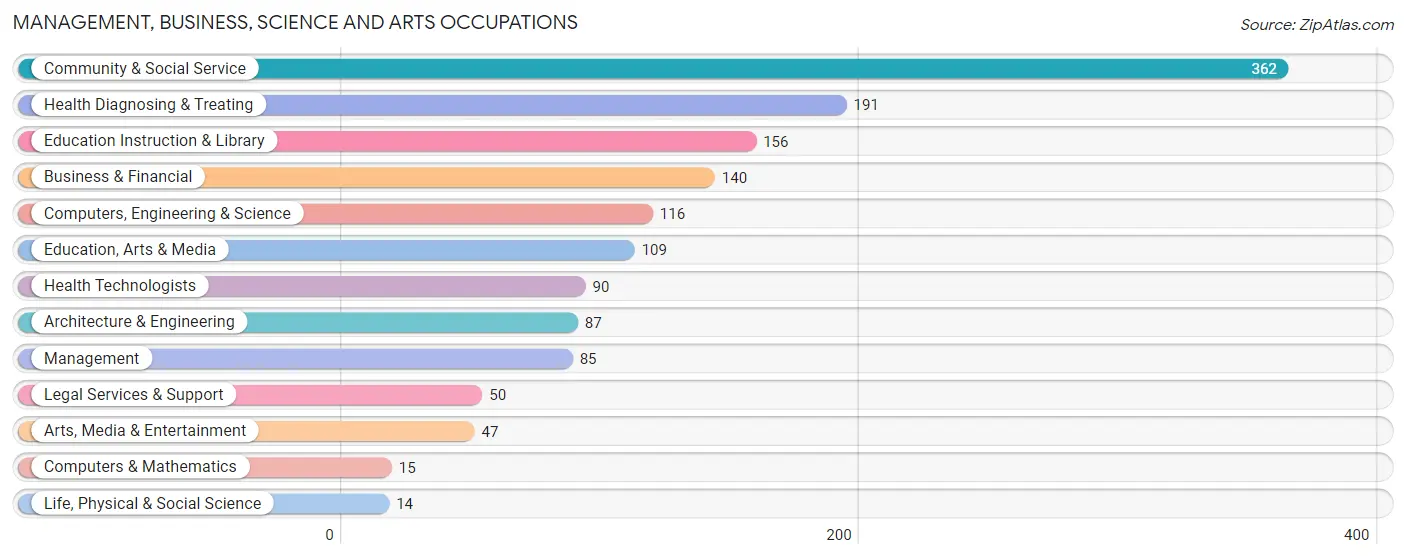
Management, Business, Science and Arts Occupations
The most common Management, Business, Science and Arts occupations in Hilton are Community & Social Service (362 | 13.1%), Health Diagnosing & Treating (191 | 6.9%), Education Instruction & Library (156 | 5.6%), Business & Financial (140 | 5.1%), and Computers, Engineering & Science (116 | 4.2%).
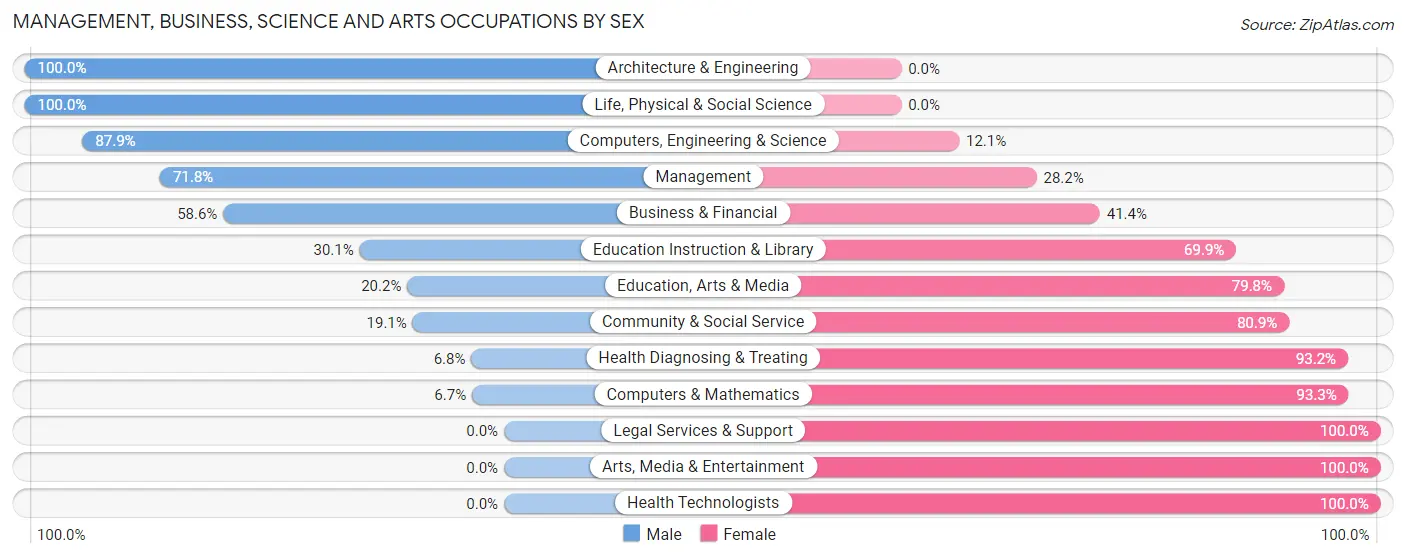
Management, Business, Science and Arts Occupations by Sex
Within the Management, Business, Science and Arts occupations in Hilton, the most male-oriented occupations are Architecture & Engineering (100.0%), Life, Physical & Social Science (100.0%), and Computers, Engineering & Science (87.9%), while the most female-oriented occupations are Legal Services & Support (100.0%), Arts, Media & Entertainment (100.0%), and Health Technologists (100.0%).
| Occupation | Male | Female |
| Management | 61 (71.8%) | 24 (28.2%) |
| Business & Financial | 82 (58.6%) | 58 (41.4%) |
| Computers, Engineering & Science | 102 (87.9%) | 14 (12.1%) |
| Computers & Mathematics | 1 (6.7%) | 14 (93.3%) |
| Architecture & Engineering | 87 (100.0%) | 0 (0.0%) |
| Life, Physical & Social Science | 14 (100.0%) | 0 (0.0%) |
| Community & Social Service | 69 (19.1%) | 293 (80.9%) |
| Education, Arts & Media | 22 (20.2%) | 87 (79.8%) |
| Legal Services & Support | 0 (0.0%) | 50 (100.0%) |
| Education Instruction & Library | 47 (30.1%) | 109 (69.9%) |
| Arts, Media & Entertainment | 0 (0.0%) | 47 (100.0%) |
| Health Diagnosing & Treating | 13 (6.8%) | 178 (93.2%) |
| Health Technologists | 0 (0.0%) | 90 (100.0%) |
| Total (Category) | 327 (36.6%) | 567 (63.4%) |
| Total (Overall) | 1,417 (51.3%) | 1,347 (48.7%) |
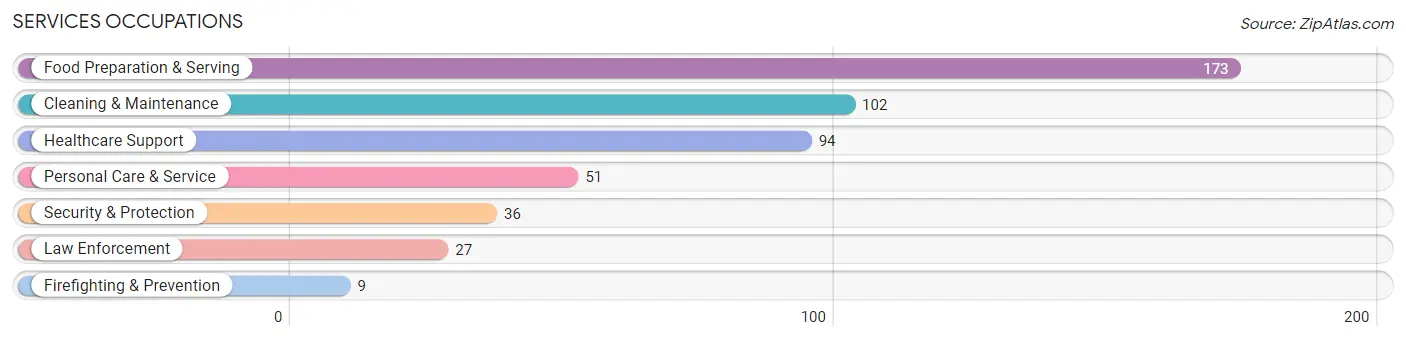
Services Occupations
The most common Services occupations in Hilton are Food Preparation & Serving (173 | 6.3%), Cleaning & Maintenance (102 | 3.7%), Healthcare Support (94 | 3.4%), Personal Care & Service (51 | 1.8%), and Security & Protection (36 | 1.3%).
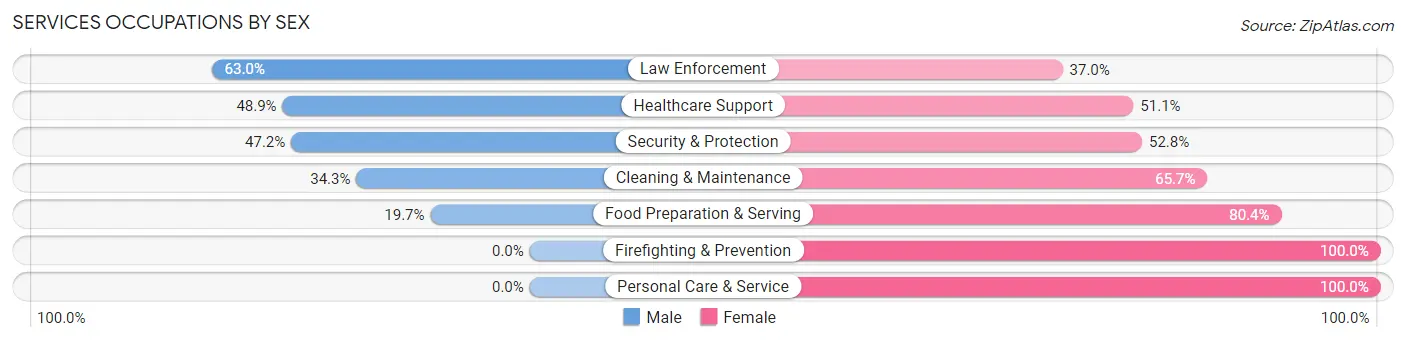
Services Occupations by Sex
Within the Services occupations in Hilton, the most male-oriented occupations are Law Enforcement (63.0%), Healthcare Support (48.9%), and Security & Protection (47.2%), while the most female-oriented occupations are Firefighting & Prevention (100.0%), Personal Care & Service (100.0%), and Food Preparation & Serving (80.3%).
| Occupation | Male | Female |
| Healthcare Support | 46 (48.9%) | 48 (51.1%) |
| Security & Protection | 17 (47.2%) | 19 (52.8%) |
| Firefighting & Prevention | 0 (0.0%) | 9 (100.0%) |
| Law Enforcement | 17 (63.0%) | 10 (37.0%) |
| Food Preparation & Serving | 34 (19.7%) | 139 (80.3%) |
| Cleaning & Maintenance | 35 (34.3%) | 67 (65.7%) |
| Personal Care & Service | 0 (0.0%) | 51 (100.0%) |
| Total (Category) | 132 (28.9%) | 324 (71.1%) |
| Total (Overall) | 1,417 (51.3%) | 1,347 (48.7%) |
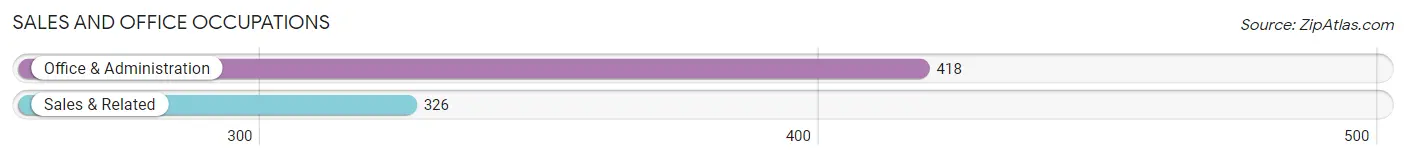
Sales and Office Occupations
The most common Sales and Office occupations in Hilton are Office & Administration (418 | 15.1%), and Sales & Related (326 | 11.8%).
Sales and Office Occupations by Sex
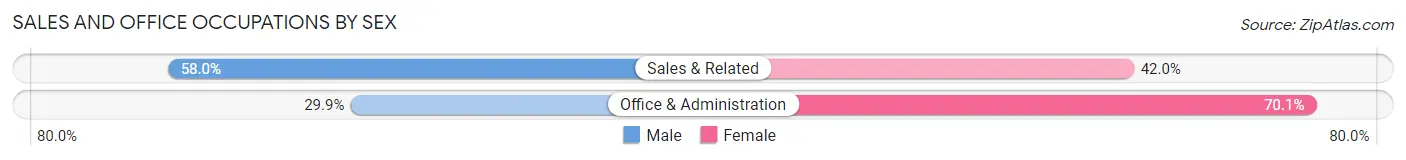
| Occupation | Male | Female |
| Sales & Related | 189 (58.0%) | 137 (42.0%) |
| Office & Administration | 125 (29.9%) | 293 (70.1%) |
| Total (Category) | 314 (42.2%) | 430 (57.8%) |
| Total (Overall) | 1,417 (51.3%) | 1,347 (48.7%) |
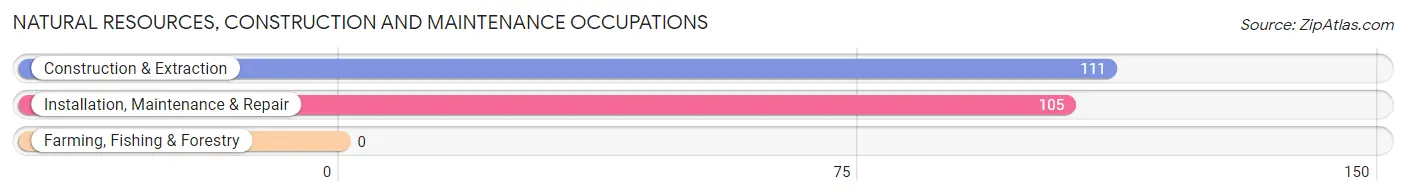
Natural Resources, Construction and Maintenance Occupations
The most common Natural Resources, Construction and Maintenance occupations in Hilton are Construction & Extraction (111 | 4.0%), and Installation, Maintenance & Repair (105 | 3.8%).
Natural Resources, Construction and Maintenance Occupations by Sex
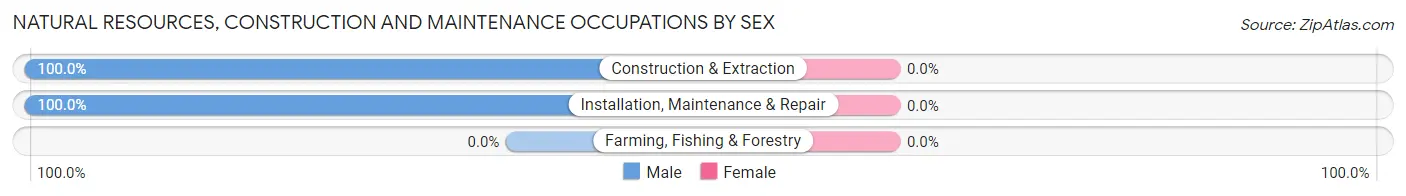
| Occupation | Male | Female |
| Farming, Fishing & Forestry | 0 (0.0%) | 0 (0.0%) |
| Construction & Extraction | 111 (100.0%) | 0 (0.0%) |
| Installation, Maintenance & Repair | 105 (100.0%) | 0 (0.0%) |
| Total (Category) | 216 (100.0%) | 0 (0.0%) |
| Total (Overall) | 1,417 (51.3%) | 1,347 (48.7%) |
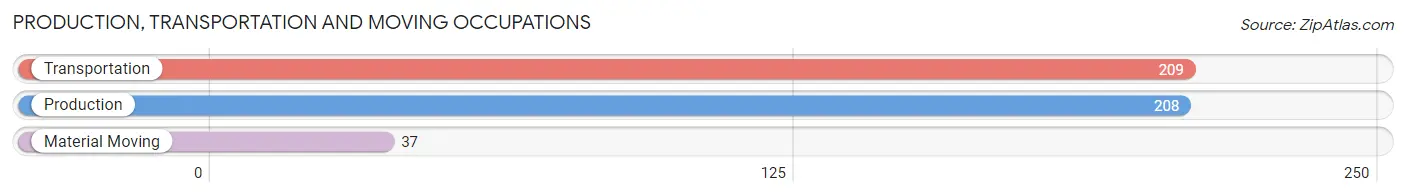
Production, Transportation and Moving Occupations
The most common Production, Transportation and Moving occupations in Hilton are Transportation (209 | 7.6%), Production (208 | 7.5%), and Material Moving (37 | 1.3%).
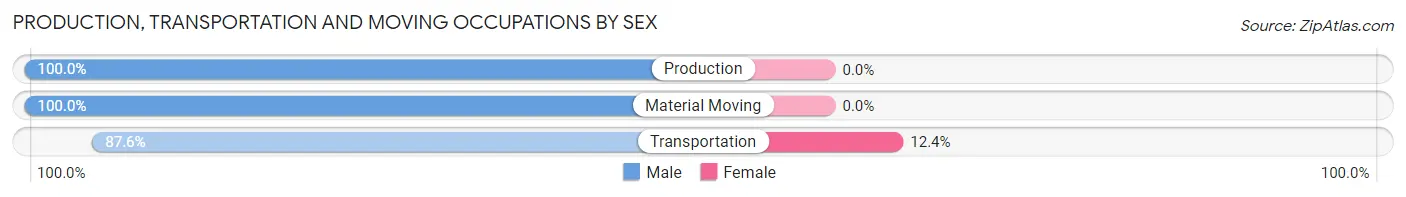
Production, Transportation and Moving Occupations by Sex
| Occupation | Male | Female |
| Production | 208 (100.0%) | 0 (0.0%) |
| Transportation | 183 (87.6%) | 26 (12.4%) |
| Material Moving | 37 (100.0%) | 0 (0.0%) |
| Total (Category) | 428 (94.3%) | 26 (5.7%) |
| Total (Overall) | 1,417 (51.3%) | 1,347 (48.7%) |
Employment Industries by Sex in Hilton
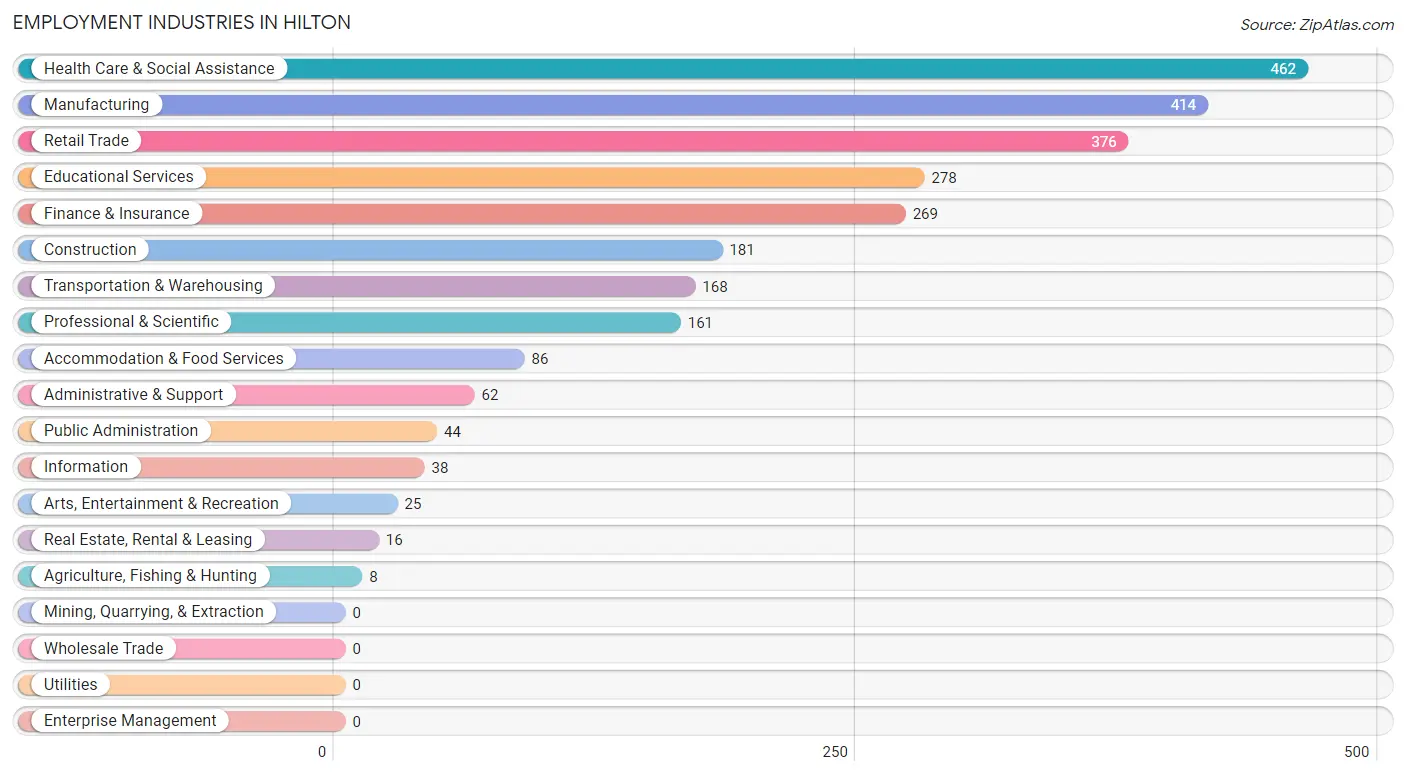
Employment Industries in Hilton
The major employment industries in Hilton include Health Care & Social Assistance (462 | 16.7%), Manufacturing (414 | 15.0%), Retail Trade (376 | 13.6%), Educational Services (278 | 10.1%), and Finance & Insurance (269 | 9.7%).
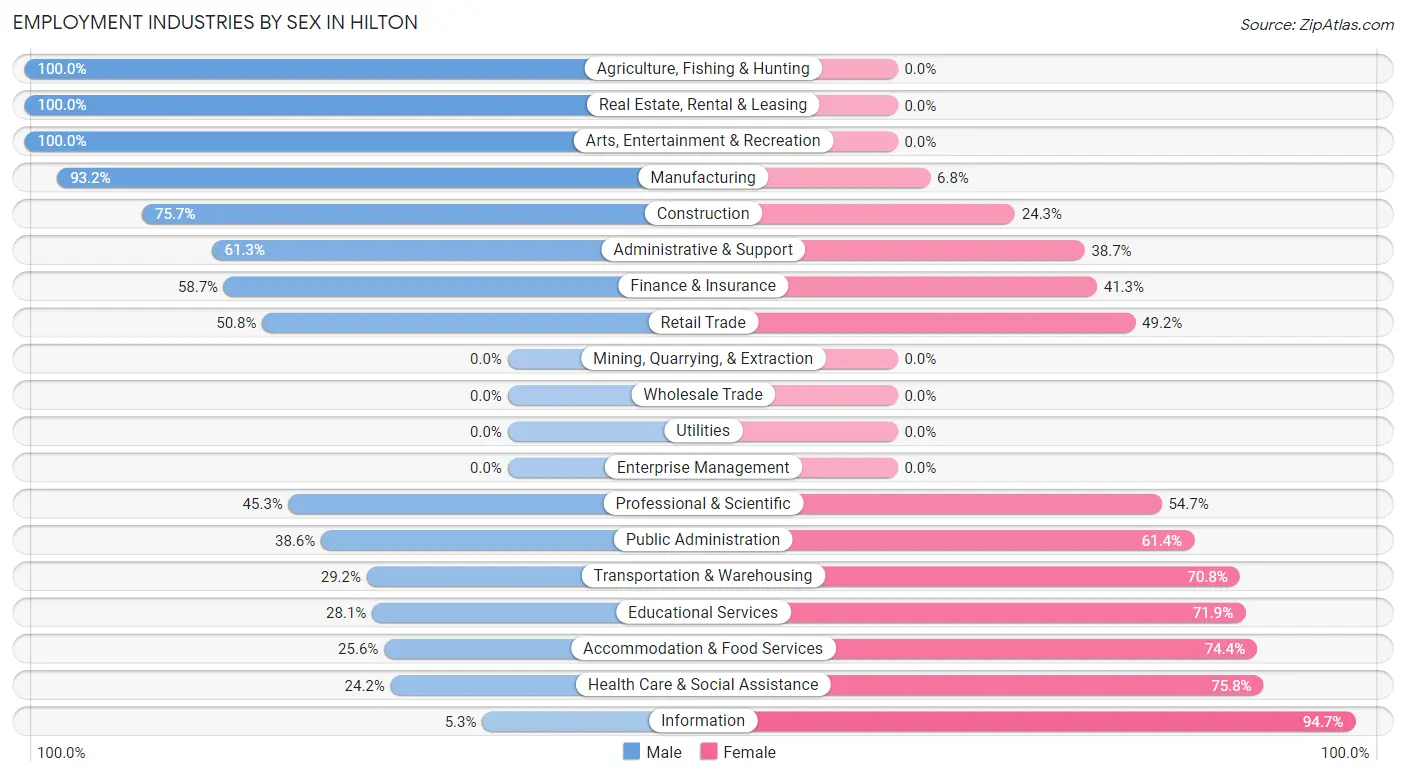
Employment Industries by Sex in Hilton
The Hilton industries that see more men than women are Agriculture, Fishing & Hunting (100.0%), Real Estate, Rental & Leasing (100.0%), and Arts, Entertainment & Recreation (100.0%), whereas the industries that tend to have a higher number of women are Information (94.7%), Health Care & Social Assistance (75.8%), and Accommodation & Food Services (74.4%).
| Industry | Male | Female |
| Agriculture, Fishing & Hunting | 8 (100.0%) | 0 (0.0%) |
| Mining, Quarrying, & Extraction | 0 (0.0%) | 0 (0.0%) |
| Construction | 137 (75.7%) | 44 (24.3%) |
| Manufacturing | 386 (93.2%) | 28 (6.8%) |
| Wholesale Trade | 0 (0.0%) | 0 (0.0%) |
| Retail Trade | 191 (50.8%) | 185 (49.2%) |
| Transportation & Warehousing | 49 (29.2%) | 119 (70.8%) |
| Utilities | 0 (0.0%) | 0 (0.0%) |
| Information | 2 (5.3%) | 36 (94.7%) |
| Finance & Insurance | 158 (58.7%) | 111 (41.3%) |
| Real Estate, Rental & Leasing | 16 (100.0%) | 0 (0.0%) |
| Professional & Scientific | 73 (45.3%) | 88 (54.7%) |
| Enterprise Management | 0 (0.0%) | 0 (0.0%) |
| Administrative & Support | 38 (61.3%) | 24 (38.7%) |
| Educational Services | 78 (28.1%) | 200 (71.9%) |
| Health Care & Social Assistance | 112 (24.2%) | 350 (75.8%) |
| Arts, Entertainment & Recreation | 25 (100.0%) | 0 (0.0%) |
| Accommodation & Food Services | 22 (25.6%) | 64 (74.4%) |
| Public Administration | 17 (38.6%) | 27 (61.4%) |
| Total | 1,417 (51.3%) | 1,347 (48.7%) |
Education in Hilton
School Enrollment in Hilton
The most common levels of schooling among the 1,790 students in Hilton are middle school (674 | 37.7%), high school (493 | 27.5%), and college / undergraduate (246 | 13.7%).
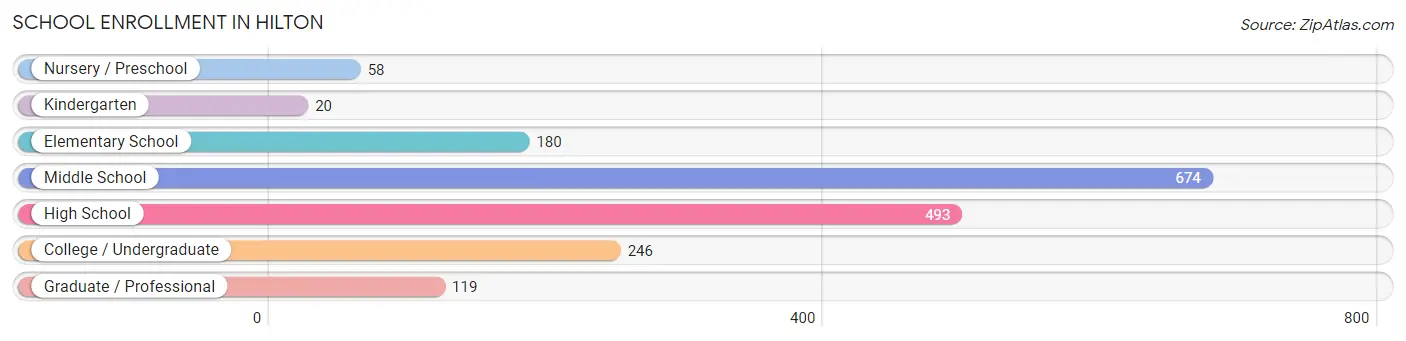
| School Level | # Students | % Students |
| Nursery / Preschool | 58 | 3.2% |
| Kindergarten | 20 | 1.1% |
| Elementary School | 180 | 10.1% |
| Middle School | 674 | 37.7% |
| High School | 493 | 27.5% |
| College / Undergraduate | 246 | 13.7% |
| Graduate / Professional | 119 | 6.7% |
| Total | 1,790 | 100.0% |
School Enrollment by Age by Funding Source in Hilton
Out of a total of 1,790 students who are enrolled in schools in Hilton, 317 (17.7%) attend a private institution, while the remaining 1,473 (82.3%) are enrolled in public schools. The age group of 3 to 4 year olds has the highest likelihood of being enrolled in private schools, with 42 (100.0% in the age bracket) enrolled. Conversely, the age group of 18 to 19 year olds has the lowest likelihood of being enrolled in a private school, with 65 (100.0% in the age bracket) attending a public institution.
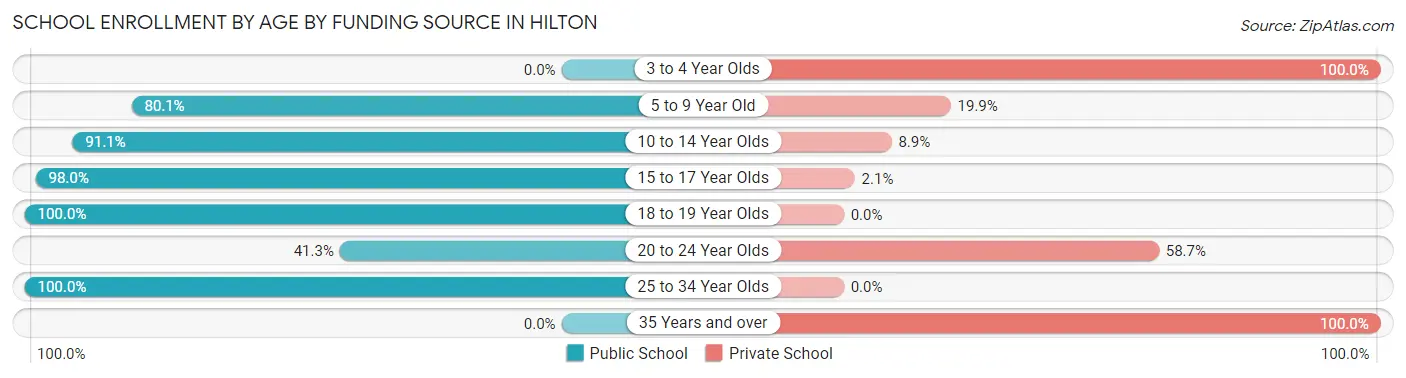
| Age Bracket | Public School | Private School |
| 3 to 4 Year Olds | 0 (0.0%) | 42 (100.0%) |
| 5 to 9 Year Old | 173 (80.1%) | 43 (19.9%) |
| 10 to 14 Year Olds | 645 (91.1%) | 63 (8.9%) |
| 15 to 17 Year Olds | 429 (98.0%) | 9 (2.1%) |
| 18 to 19 Year Olds | 65 (100.0%) | 0 (0.0%) |
| 20 to 24 Year Olds | 57 (41.3%) | 81 (58.7%) |
| 25 to 34 Year Olds | 104 (100.0%) | 0 (0.0%) |
| 35 Years and over | 0 (0.0%) | 79 (100.0%) |
| Total | 1,473 (82.3%) | 317 (17.7%) |
Educational Attainment by Field of Study in Hilton
Education (256 | 19.0%), bio, nature & agricultural (149 | 11.0%), science & technology (133 | 9.8%), engineering (122 | 9.0%), and business (113 | 8.4%) are the most common fields of study among 1,351 individuals in Hilton who have obtained a bachelor's degree or higher.
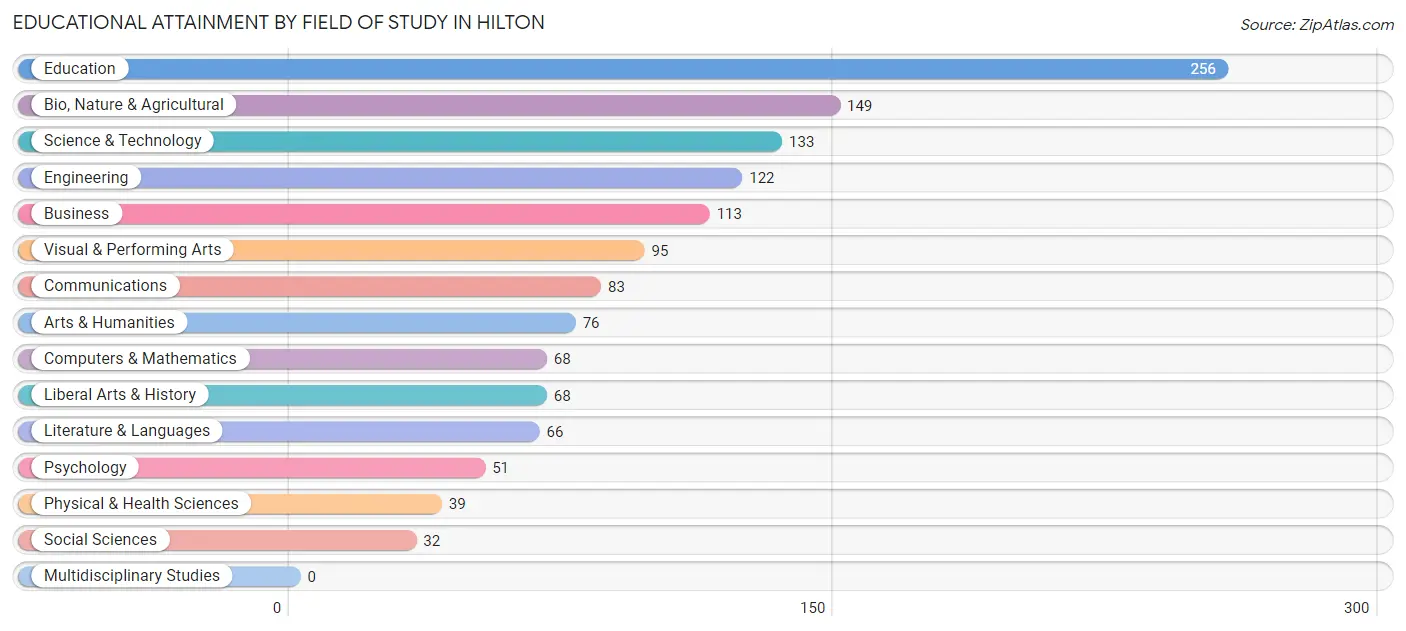
| Field of Study | # Graduates | % Graduates |
| Computers & Mathematics | 68 | 5.0% |
| Bio, Nature & Agricultural | 149 | 11.0% |
| Physical & Health Sciences | 39 | 2.9% |
| Psychology | 51 | 3.8% |
| Social Sciences | 32 | 2.4% |
| Engineering | 122 | 9.0% |
| Multidisciplinary Studies | 0 | 0.0% |
| Science & Technology | 133 | 9.8% |
| Business | 113 | 8.4% |
| Education | 256 | 19.0% |
| Literature & Languages | 66 | 4.9% |
| Liberal Arts & History | 68 | 5.0% |
| Visual & Performing Arts | 95 | 7.0% |
| Communications | 83 | 6.1% |
| Arts & Humanities | 76 | 5.6% |
| Total | 1,351 | 100.0% |
Transportation & Commute in Hilton
Vehicle Availability by Sex in Hilton
The most prevalent vehicle ownership categories in Hilton are males with 2 vehicles (500, accounting for 36.1%) and females with 2 vehicles (373, making up 37.1%).
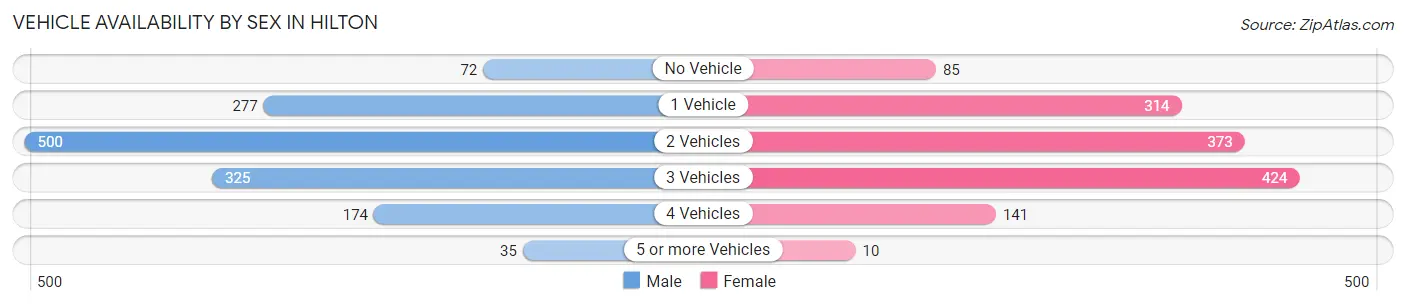
| Vehicles Available | Male | Female |
| No Vehicle | 72 (5.2%) | 85 (6.3%) |
| 1 Vehicle | 277 (20.0%) | 314 (23.3%) |
| 2 Vehicles | 500 (36.1%) | 373 (27.7%) |
| 3 Vehicles | 325 (23.5%) | 424 (31.5%) |
| 4 Vehicles | 174 (12.6%) | 141 (10.5%) |
| 5 or more Vehicles | 35 (2.5%) | 10 (0.7%) |
| Total | 1,383 (100.0%) | 1,347 (100.0%) |
Commute Time in Hilton
The most frequently occuring commute durations in Hilton are 30 to 34 minutes (456 commuters, 17.8%), 20 to 24 minutes (374 commuters, 14.6%), and 45 to 59 minutes (315 commuters, 12.3%).
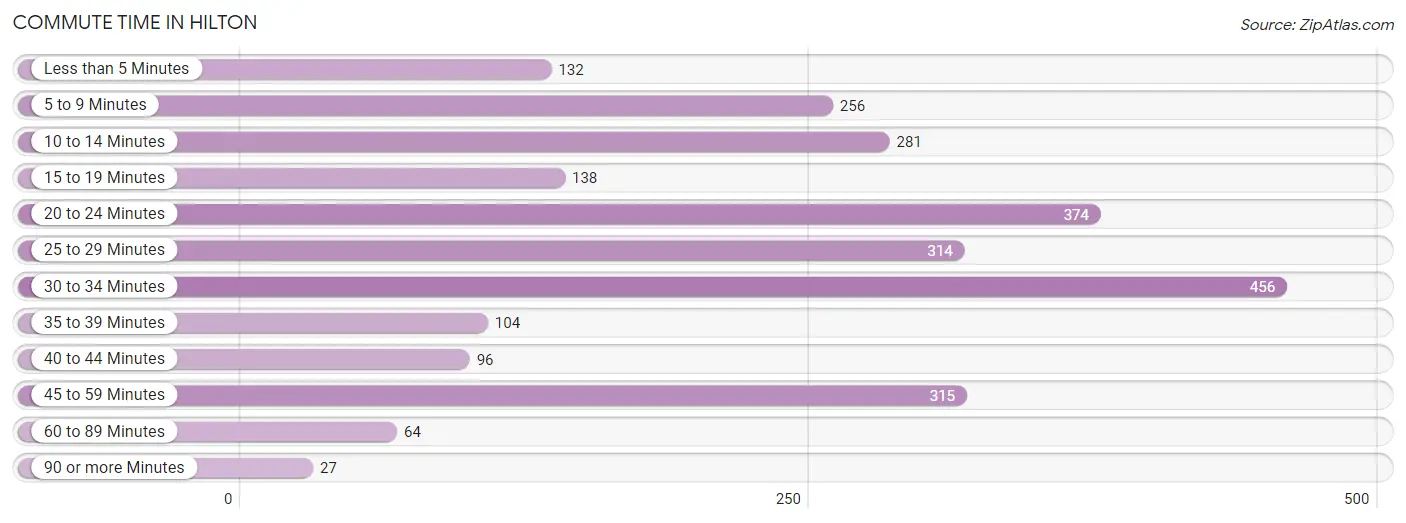
| Commute Time | # Commuters | % Commuters |
| Less than 5 Minutes | 132 | 5.2% |
| 5 to 9 Minutes | 256 | 10.0% |
| 10 to 14 Minutes | 281 | 11.0% |
| 15 to 19 Minutes | 138 | 5.4% |
| 20 to 24 Minutes | 374 | 14.6% |
| 25 to 29 Minutes | 314 | 12.3% |
| 30 to 34 Minutes | 456 | 17.8% |
| 35 to 39 Minutes | 104 | 4.1% |
| 40 to 44 Minutes | 96 | 3.7% |
| 45 to 59 Minutes | 315 | 12.3% |
| 60 to 89 Minutes | 64 | 2.5% |
| 90 or more Minutes | 27 | 1.1% |
Commute Time by Sex in Hilton
The most common commute times in Hilton are 45 to 59 minutes (289 commuters, 22.0%) for males and 5 to 9 minutes (241 commuters, 19.4%) for females.
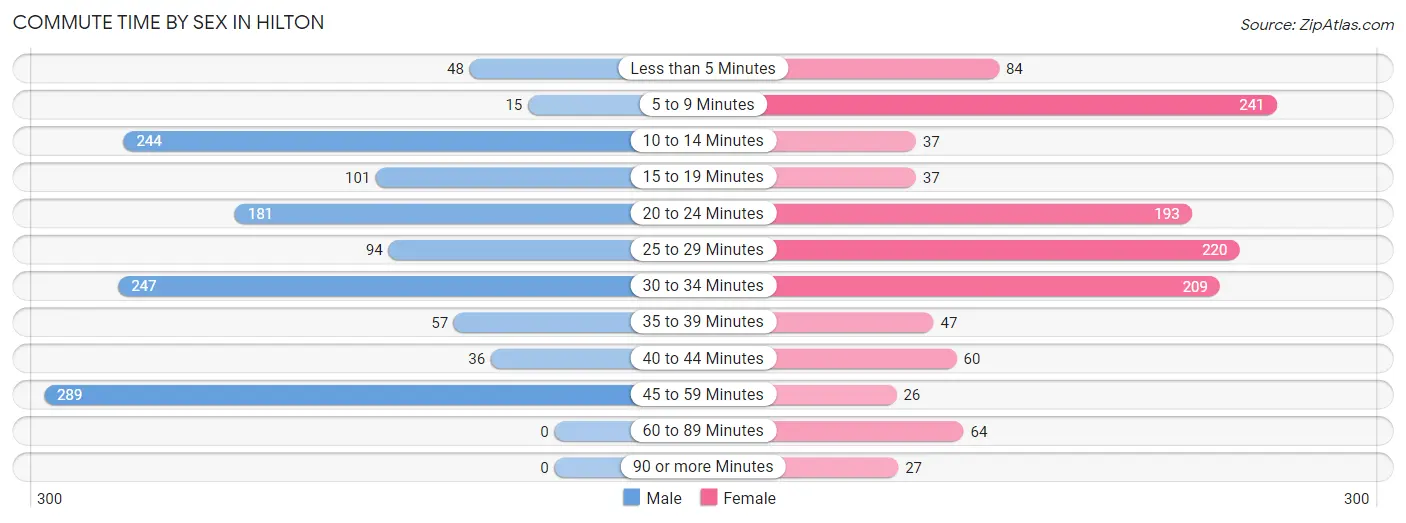
| Commute Time | Male | Female |
| Less than 5 Minutes | 48 (3.7%) | 84 (6.8%) |
| 5 to 9 Minutes | 15 (1.1%) | 241 (19.4%) |
| 10 to 14 Minutes | 244 (18.6%) | 37 (3.0%) |
| 15 to 19 Minutes | 101 (7.7%) | 37 (3.0%) |
| 20 to 24 Minutes | 181 (13.8%) | 193 (15.5%) |
| 25 to 29 Minutes | 94 (7.2%) | 220 (17.7%) |
| 30 to 34 Minutes | 247 (18.8%) | 209 (16.8%) |
| 35 to 39 Minutes | 57 (4.3%) | 47 (3.8%) |
| 40 to 44 Minutes | 36 (2.7%) | 60 (4.8%) |
| 45 to 59 Minutes | 289 (22.0%) | 26 (2.1%) |
| 60 to 89 Minutes | 0 (0.0%) | 64 (5.1%) |
| 90 or more Minutes | 0 (0.0%) | 27 (2.2%) |
Time of Departure to Work by Sex in Hilton
The most frequent times of departure to work in Hilton are 6:30 AM to 6:59 AM (287, 21.9%) for males and 7:30 AM to 7:59 AM (238, 19.1%) for females.
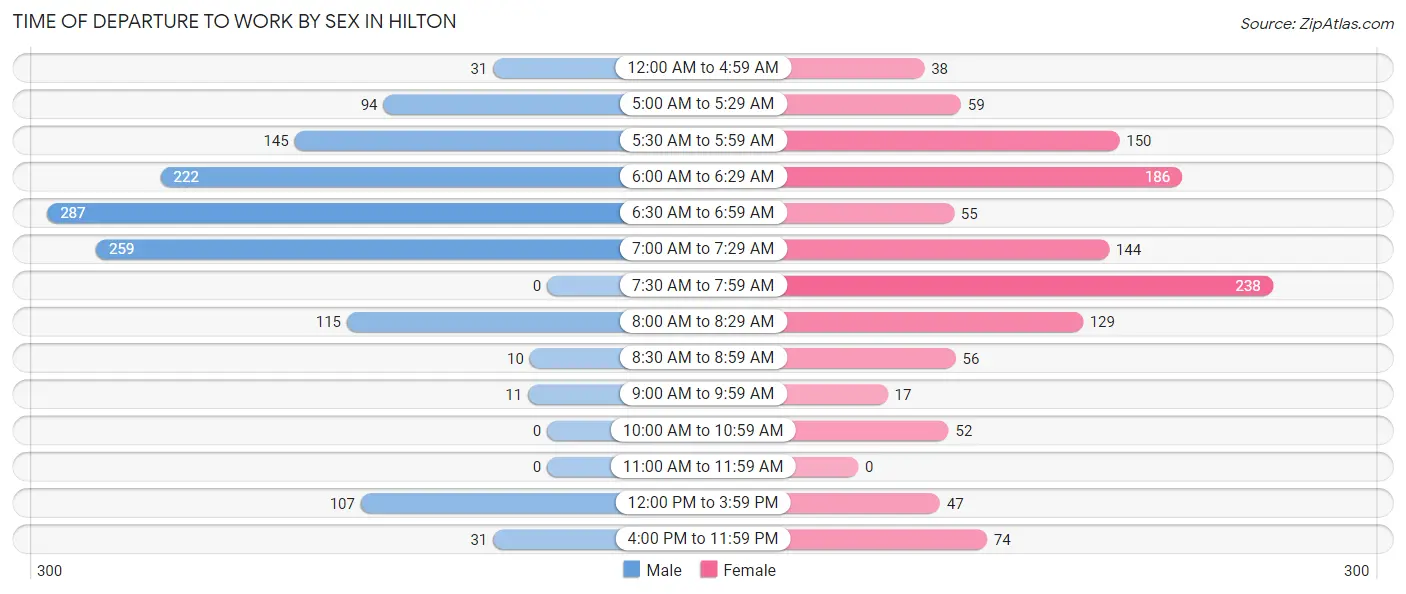
| Time of Departure | Male | Female |
| 12:00 AM to 4:59 AM | 31 (2.4%) | 38 (3.0%) |
| 5:00 AM to 5:29 AM | 94 (7.2%) | 59 (4.7%) |
| 5:30 AM to 5:59 AM | 145 (11.1%) | 150 (12.0%) |
| 6:00 AM to 6:29 AM | 222 (16.9%) | 186 (14.9%) |
| 6:30 AM to 6:59 AM | 287 (21.9%) | 55 (4.4%) |
| 7:00 AM to 7:29 AM | 259 (19.7%) | 144 (11.6%) |
| 7:30 AM to 7:59 AM | 0 (0.0%) | 238 (19.1%) |
| 8:00 AM to 8:29 AM | 115 (8.8%) | 129 (10.4%) |
| 8:30 AM to 8:59 AM | 10 (0.8%) | 56 (4.5%) |
| 9:00 AM to 9:59 AM | 11 (0.8%) | 17 (1.4%) |
| 10:00 AM to 10:59 AM | 0 (0.0%) | 52 (4.2%) |
| 11:00 AM to 11:59 AM | 0 (0.0%) | 0 (0.0%) |
| 12:00 PM to 3:59 PM | 107 (8.2%) | 47 (3.8%) |
| 4:00 PM to 11:59 PM | 31 (2.4%) | 74 (5.9%) |
| Total | 1,312 (100.0%) | 1,245 (100.0%) |
Housing Occupancy in Hilton
Occupancy by Ownership in Hilton
Of the total 2,232 dwellings in Hilton, owner-occupied units account for 1,489 (66.7%), while renter-occupied units make up 743 (33.3%).
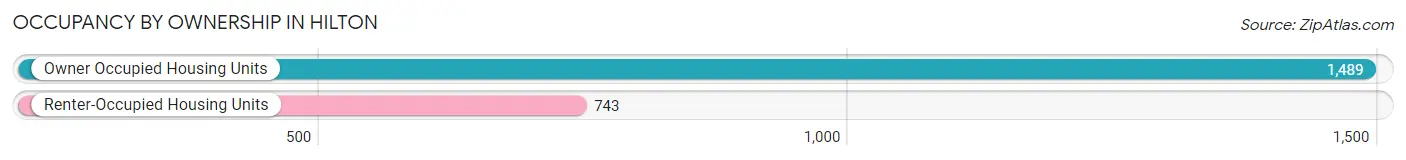
| Occupancy | # Housing Units | % Housing Units |
| Owner Occupied Housing Units | 1,489 | 66.7% |
| Renter-Occupied Housing Units | 743 | 33.3% |
| Total Occupied Housing Units | 2,232 | 100.0% |
Occupancy by Household Size in Hilton
| Household Size | # Housing Units | % Housing Units |
| 1-Person Household | 554 | 24.8% |
| 2-Person Household | 690 | 30.9% |
| 3-Person Household | 481 | 21.5% |
| 4+ Person Household | 507 | 22.7% |
| Total Housing Units | 2,232 | 100.0% |
Occupancy by Ownership by Household Size in Hilton
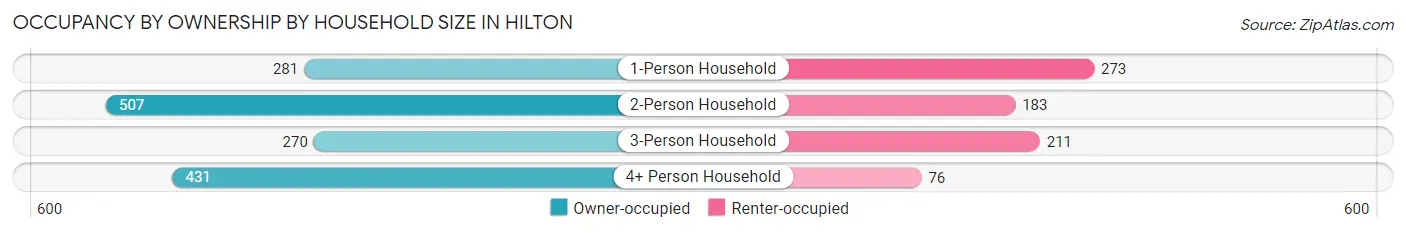
| Household Size | Owner-occupied | Renter-occupied |
| 1-Person Household | 281 (50.7%) | 273 (49.3%) |
| 2-Person Household | 507 (73.5%) | 183 (26.5%) |
| 3-Person Household | 270 (56.1%) | 211 (43.9%) |
| 4+ Person Household | 431 (85.0%) | 76 (15.0%) |
| Total Housing Units | 1,489 (66.7%) | 743 (33.3%) |
Occupancy by Educational Attainment in Hilton
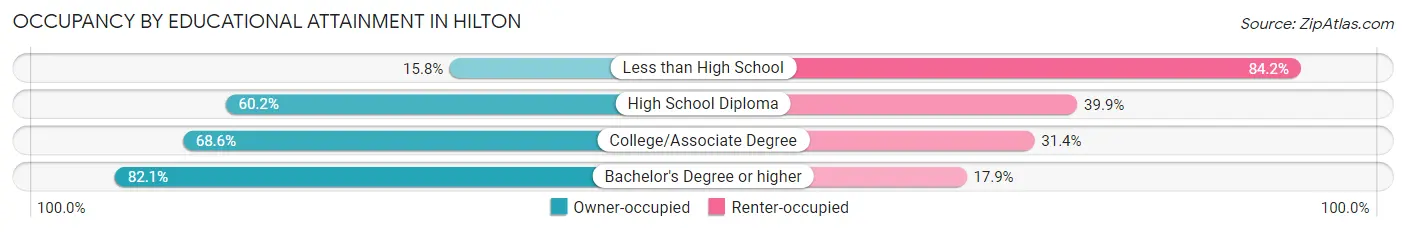
| Household Size | Owner-occupied | Renter-occupied |
| Less than High School | 19 (15.8%) | 101 (84.2%) |
| High School Diploma | 554 (60.2%) | 367 (39.9%) |
| College/Associate Degree | 315 (68.6%) | 144 (31.4%) |
| Bachelor's Degree or higher | 601 (82.1%) | 131 (17.9%) |
Occupancy by Age of Householder in Hilton
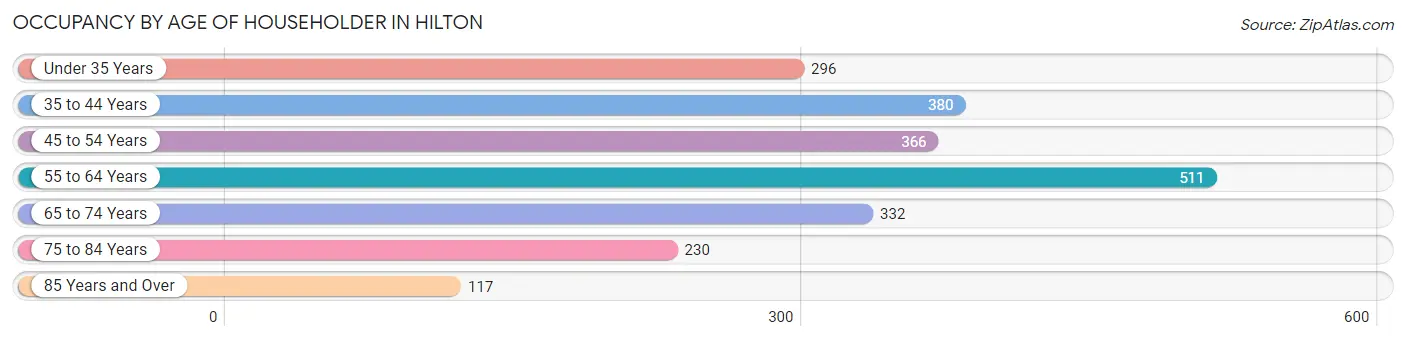
| Age Bracket | # Households | % Households |
| Under 35 Years | 296 | 13.3% |
| 35 to 44 Years | 380 | 17.0% |
| 45 to 54 Years | 366 | 16.4% |
| 55 to 64 Years | 511 | 22.9% |
| 65 to 74 Years | 332 | 14.9% |
| 75 to 84 Years | 230 | 10.3% |
| 85 Years and Over | 117 | 5.2% |
| Total | 2,232 | 100.0% |
Housing Finances in Hilton
Median Income by Occupancy in Hilton
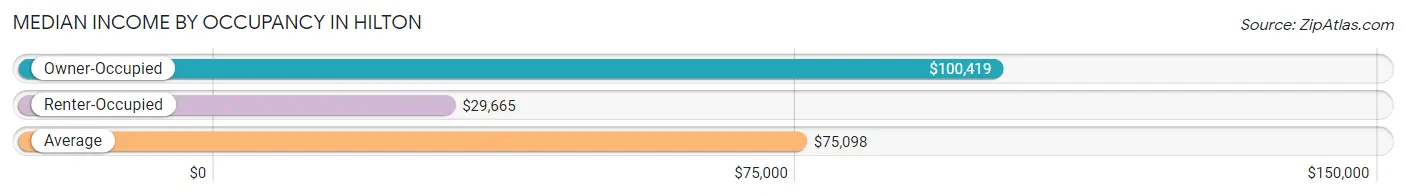
| Occupancy Type | # Households | Median Income |
| Owner-Occupied | 1,489 (66.7%) | $100,419 |
| Renter-Occupied | 743 (33.3%) | $29,665 |
| Average | 2,232 (100.0%) | $75,098 |
Occupancy by Householder Income Bracket in Hilton
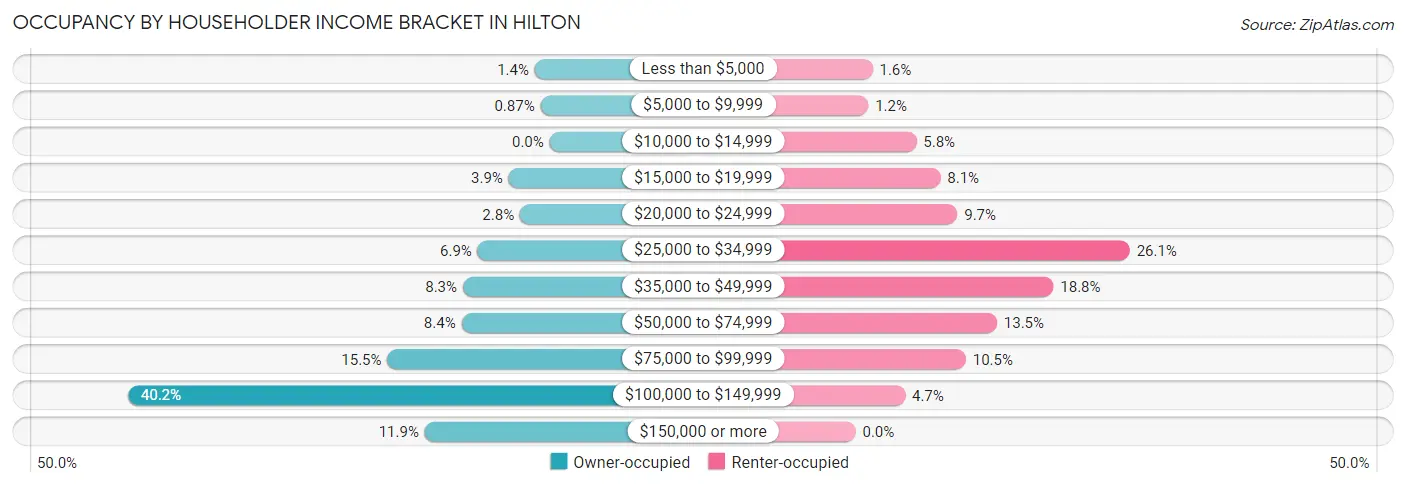
| Income Bracket | Owner-occupied | Renter-occupied |
| Less than $5,000 | 21 (1.4%) | 12 (1.6%) |
| $5,000 to $9,999 | 13 (0.9%) | 9 (1.2%) |
| $10,000 to $14,999 | 0 (0.0%) | 43 (5.8%) |
| $15,000 to $19,999 | 58 (3.9%) | 60 (8.1%) |
| $20,000 to $24,999 | 42 (2.8%) | 72 (9.7%) |
| $25,000 to $34,999 | 102 (6.9%) | 194 (26.1%) |
| $35,000 to $49,999 | 123 (8.3%) | 140 (18.8%) |
| $50,000 to $74,999 | 125 (8.4%) | 100 (13.5%) |
| $75,000 to $99,999 | 230 (15.4%) | 78 (10.5%) |
| $100,000 to $149,999 | 598 (40.2%) | 35 (4.7%) |
| $150,000 or more | 177 (11.9%) | 0 (0.0%) |
| Total | 1,489 (100.0%) | 743 (100.0%) |
Monthly Housing Cost Tiers in Hilton
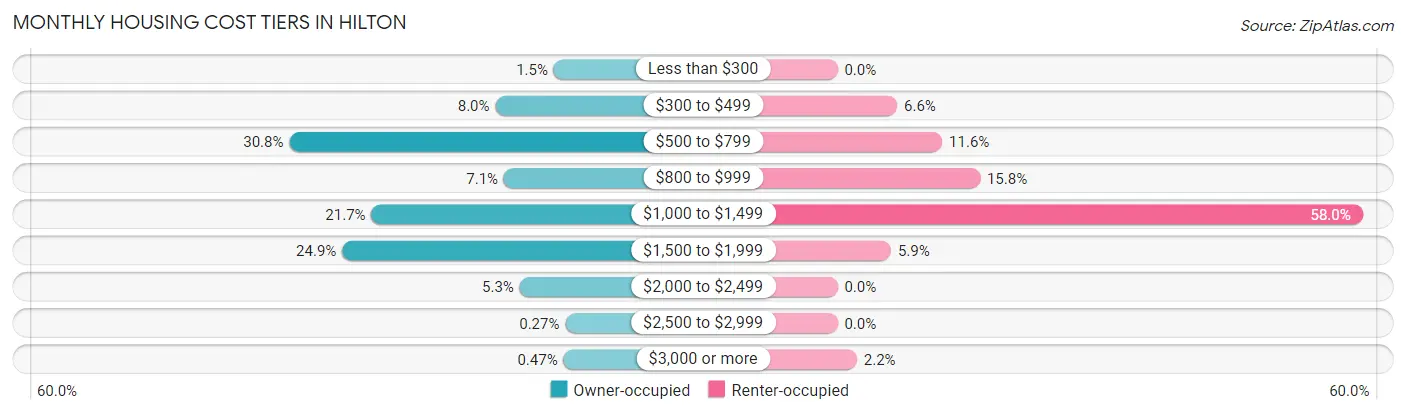
| Monthly Cost | Owner-occupied | Renter-occupied |
| Less than $300 | 23 (1.5%) | 0 (0.0%) |
| $300 to $499 | 119 (8.0%) | 49 (6.6%) |
| $500 to $799 | 458 (30.8%) | 86 (11.6%) |
| $800 to $999 | 105 (7.0%) | 117 (15.8%) |
| $1,000 to $1,499 | 323 (21.7%) | 431 (58.0%) |
| $1,500 to $1,999 | 371 (24.9%) | 44 (5.9%) |
| $2,000 to $2,499 | 79 (5.3%) | 0 (0.0%) |
| $2,500 to $2,999 | 4 (0.3%) | 0 (0.0%) |
| $3,000 or more | 7 (0.5%) | 16 (2.1%) |
| Total | 1,489 (100.0%) | 743 (100.0%) |
Physical Housing Characteristics in Hilton
Housing Structures in Hilton
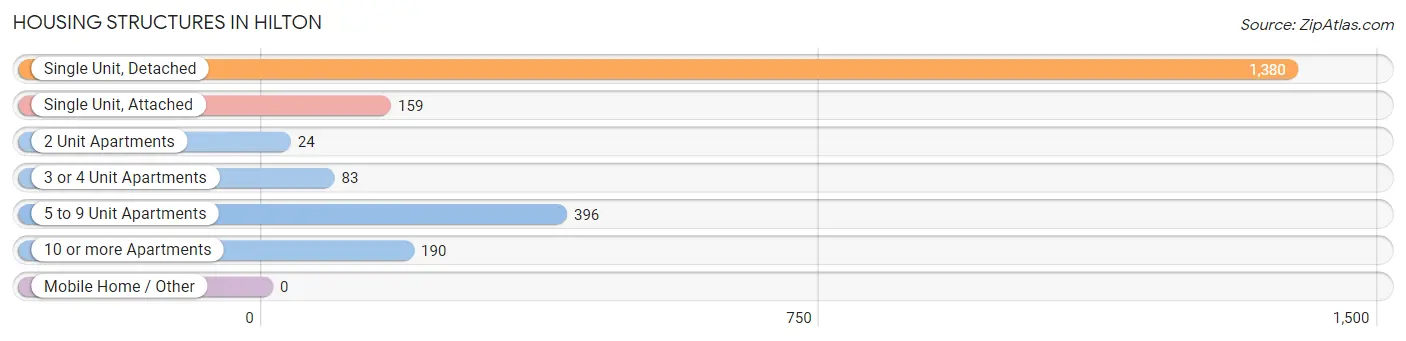
| Structure Type | # Housing Units | % Housing Units |
| Single Unit, Detached | 1,380 | 61.8% |
| Single Unit, Attached | 159 | 7.1% |
| 2 Unit Apartments | 24 | 1.1% |
| 3 or 4 Unit Apartments | 83 | 3.7% |
| 5 to 9 Unit Apartments | 396 | 17.7% |
| 10 or more Apartments | 190 | 8.5% |
| Mobile Home / Other | 0 | 0.0% |
| Total | 2,232 | 100.0% |
Housing Structures by Occupancy in Hilton
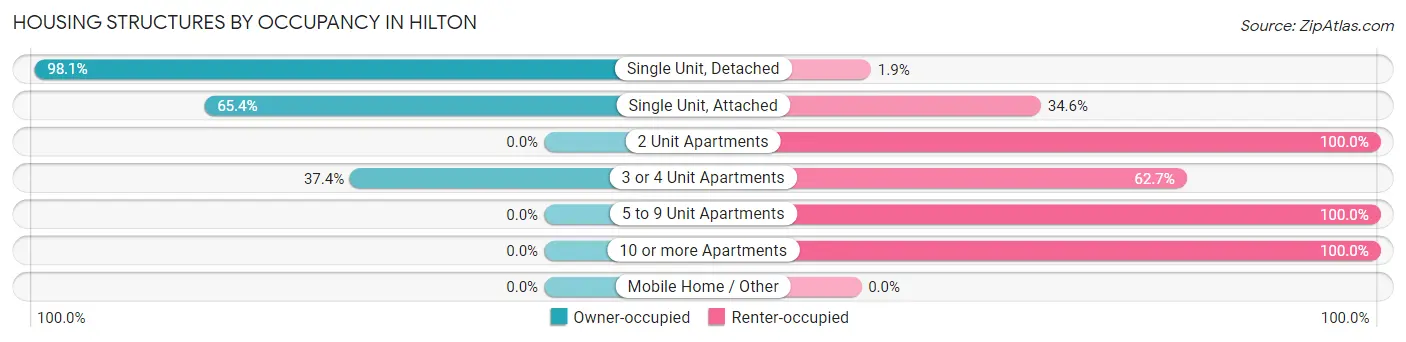
| Structure Type | Owner-occupied | Renter-occupied |
| Single Unit, Detached | 1,354 (98.1%) | 26 (1.9%) |
| Single Unit, Attached | 104 (65.4%) | 55 (34.6%) |
| 2 Unit Apartments | 0 (0.0%) | 24 (100.0%) |
| 3 or 4 Unit Apartments | 31 (37.3%) | 52 (62.6%) |
| 5 to 9 Unit Apartments | 0 (0.0%) | 396 (100.0%) |
| 10 or more Apartments | 0 (0.0%) | 190 (100.0%) |
| Mobile Home / Other | 0 (0.0%) | 0 (0.0%) |
| Total | 1,489 (66.7%) | 743 (33.3%) |
Housing Structures by Number of Rooms in Hilton
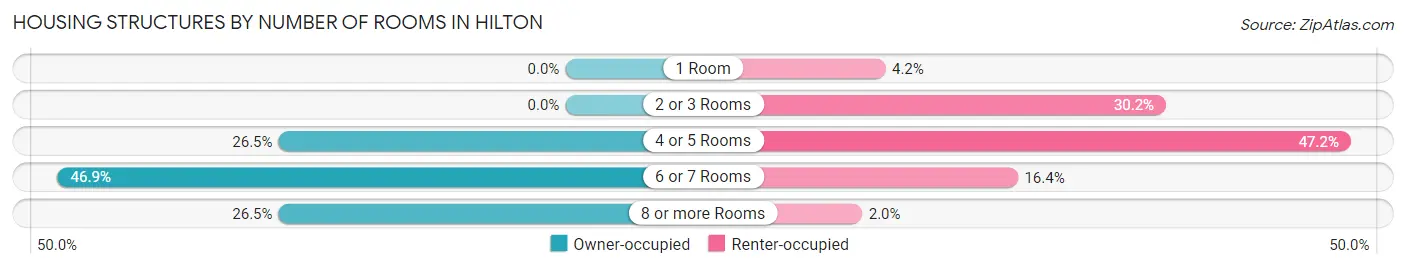
| Number of Rooms | Owner-occupied | Renter-occupied |
| 1 Room | 0 (0.0%) | 31 (4.2%) |
| 2 or 3 Rooms | 0 (0.0%) | 224 (30.1%) |
| 4 or 5 Rooms | 395 (26.5%) | 351 (47.2%) |
| 6 or 7 Rooms | 699 (46.9%) | 122 (16.4%) |
| 8 or more Rooms | 395 (26.5%) | 15 (2.0%) |
| Total | 1,489 (100.0%) | 743 (100.0%) |
Housing Structure by Heating Type in Hilton
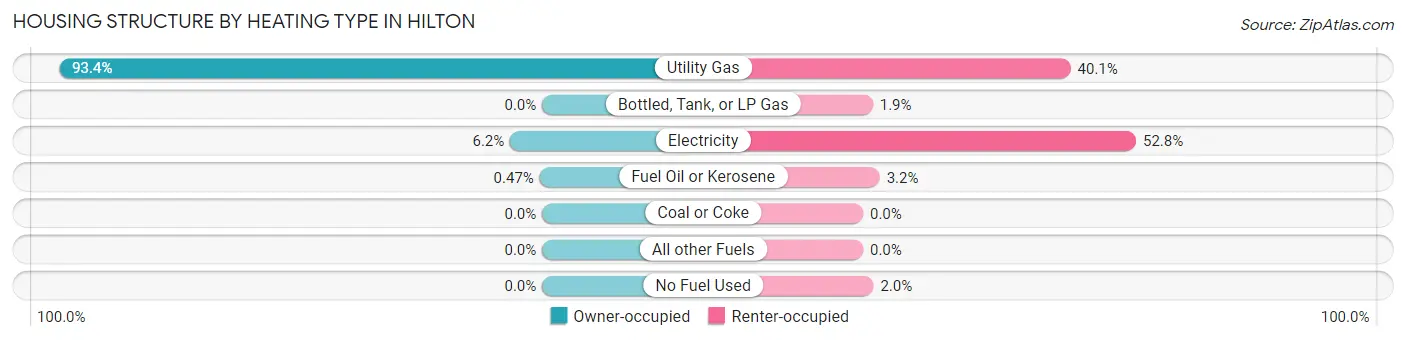
| Heating Type | Owner-occupied | Renter-occupied |
| Utility Gas | 1,390 (93.3%) | 298 (40.1%) |
| Bottled, Tank, or LP Gas | 0 (0.0%) | 14 (1.9%) |
| Electricity | 92 (6.2%) | 392 (52.8%) |
| Fuel Oil or Kerosene | 7 (0.5%) | 24 (3.2%) |
| Coal or Coke | 0 (0.0%) | 0 (0.0%) |
| All other Fuels | 0 (0.0%) | 0 (0.0%) |
| No Fuel Used | 0 (0.0%) | 15 (2.0%) |
| Total | 1,489 (100.0%) | 743 (100.0%) |
Household Vehicle Usage in Hilton
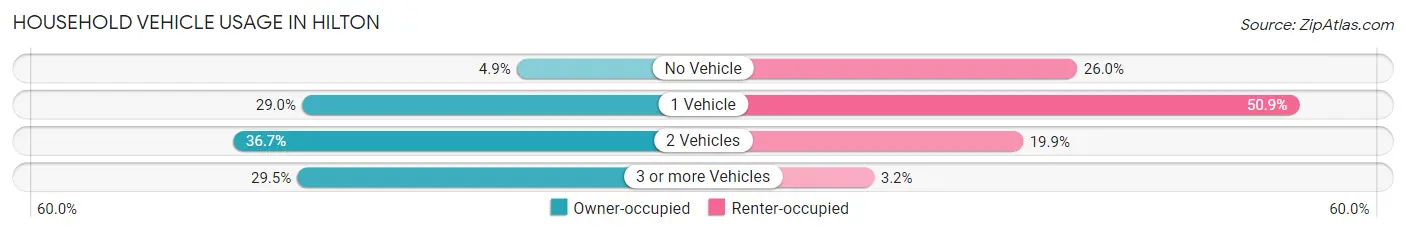
| Vehicles per Household | Owner-occupied | Renter-occupied |
| No Vehicle | 73 (4.9%) | 193 (26.0%) |
| 1 Vehicle | 431 (28.9%) | 378 (50.9%) |
| 2 Vehicles | 546 (36.7%) | 148 (19.9%) |
| 3 or more Vehicles | 439 (29.5%) | 24 (3.2%) |
| Total | 1,489 (100.0%) | 743 (100.0%) |
Real Estate & Mortgages in Hilton
Real Estate and Mortgage Overview in Hilton
| Characteristic | Without Mortgage | With Mortgage |
| Housing Units | 649 | 840 |
| Median Property Value | $148,700 | $159,900 |
| Median Household Income | $100,419 | $99 |
| Monthly Housing Costs | $637 | $7 |
| Real Estate Taxes | $4,240 | $0 |
Property Value by Mortgage Status in Hilton
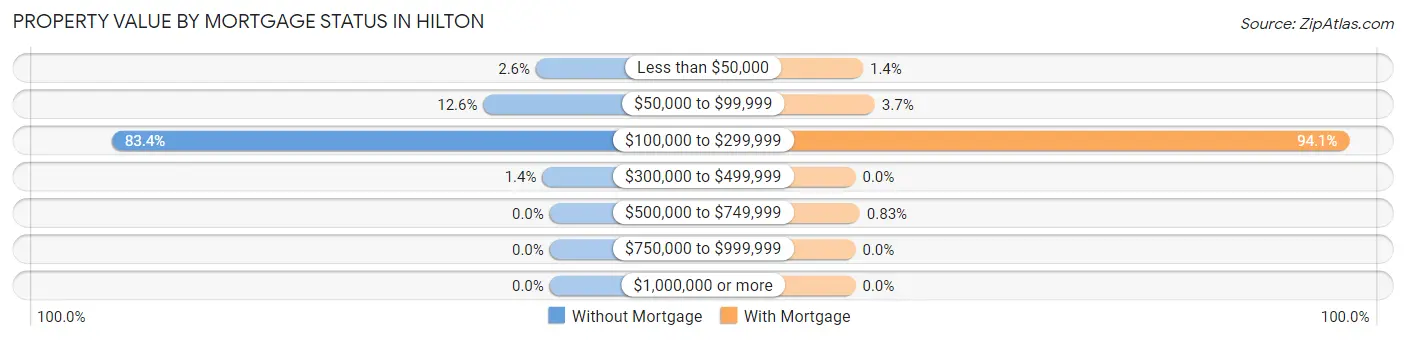
| Property Value | Without Mortgage | With Mortgage |
| Less than $50,000 | 17 (2.6%) | 12 (1.4%) |
| $50,000 to $99,999 | 82 (12.6%) | 31 (3.7%) |
| $100,000 to $299,999 | 541 (83.4%) | 790 (94.1%) |
| $300,000 to $499,999 | 9 (1.4%) | 0 (0.0%) |
| $500,000 to $749,999 | 0 (0.0%) | 7 (0.8%) |
| $750,000 to $999,999 | 0 (0.0%) | 0 (0.0%) |
| $1,000,000 or more | 0 (0.0%) | 0 (0.0%) |
| Total | 649 (100.0%) | 840 (100.0%) |
Household Income by Mortgage Status in Hilton
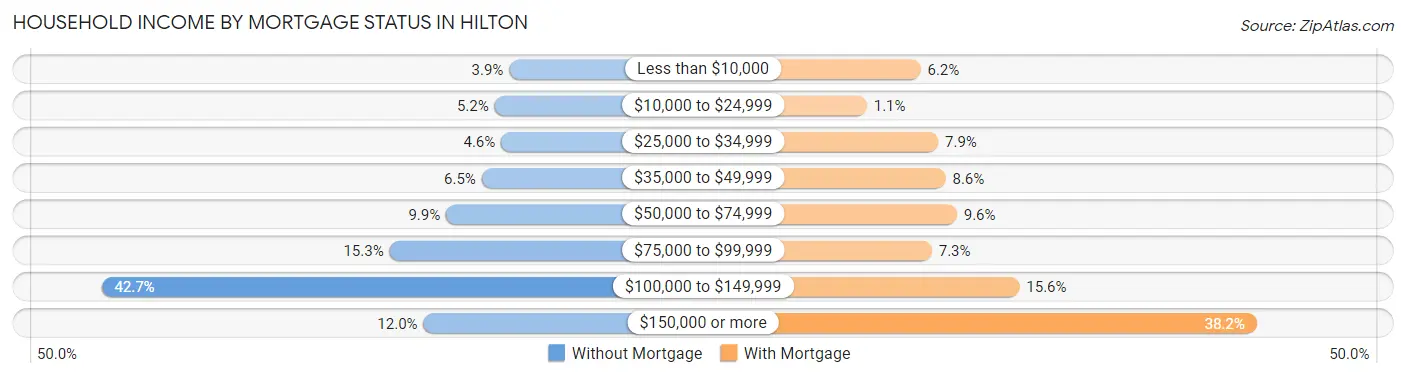
| Household Income | Without Mortgage | With Mortgage |
| Less than $10,000 | 25 (3.8%) | 52 (6.2%) |
| $10,000 to $24,999 | 34 (5.2%) | 9 (1.1%) |
| $25,000 to $34,999 | 30 (4.6%) | 66 (7.9%) |
| $35,000 to $49,999 | 42 (6.5%) | 72 (8.6%) |
| $50,000 to $74,999 | 64 (9.9%) | 81 (9.6%) |
| $75,000 to $99,999 | 99 (15.2%) | 61 (7.3%) |
| $100,000 to $149,999 | 277 (42.7%) | 131 (15.6%) |
| $150,000 or more | 78 (12.0%) | 321 (38.2%) |
| Total | 649 (100.0%) | 840 (100.0%) |
Property Value to Household Income Ratio in Hilton
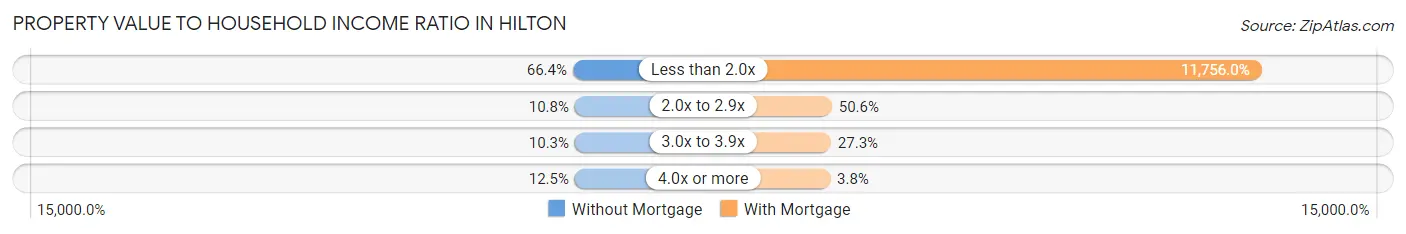
| Value-to-Income Ratio | Without Mortgage | With Mortgage |
| Less than 2.0x | 431 (66.4%) | 98,750 (11,755.9%) |
| 2.0x to 2.9x | 70 (10.8%) | 425 (50.6%) |
| 3.0x to 3.9x | 67 (10.3%) | 229 (27.3%) |
| 4.0x or more | 81 (12.5%) | 32 (3.8%) |
| Total | 649 (100.0%) | 840 (100.0%) |
Real Estate Taxes by Mortgage Status in Hilton
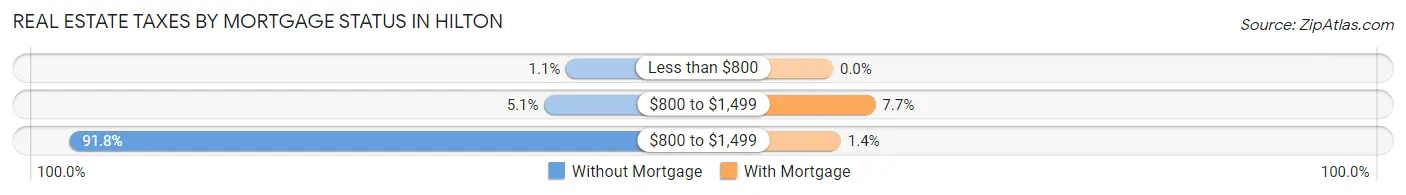
| Property Taxes | Without Mortgage | With Mortgage |
| Less than $800 | 7 (1.1%) | 0 (0.0%) |
| $800 to $1,499 | 33 (5.1%) | 65 (7.7%) |
| $800 to $1,499 | 596 (91.8%) | 12 (1.4%) |
| Total | 649 (100.0%) | 840 (100.0%) |
Health & Disability in Hilton
Health Insurance Coverage by Age in Hilton
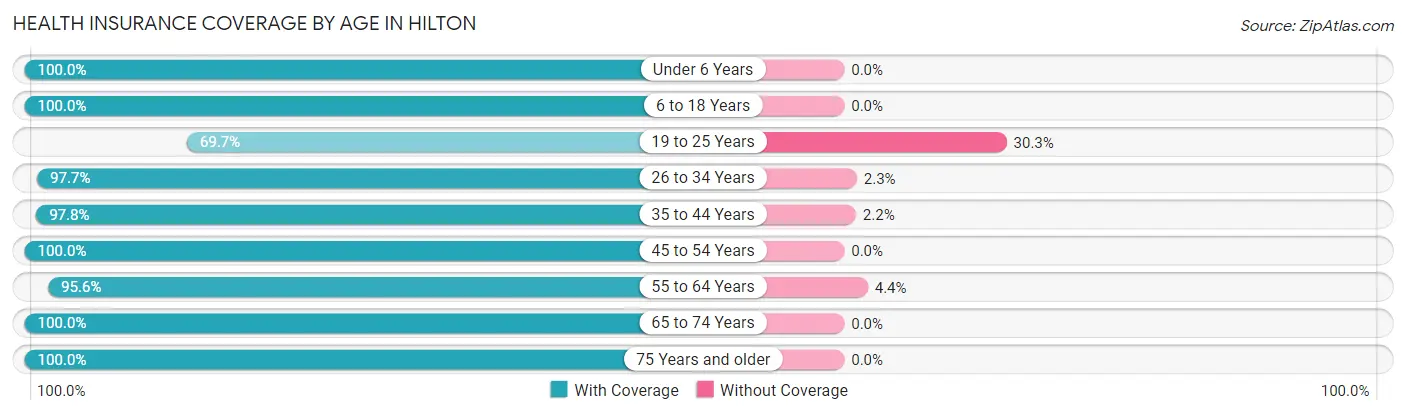
| Age Bracket | With Coverage | Without Coverage |
| Under 6 Years | 265 (100.0%) | 0 (0.0%) |
| 6 to 18 Years | 1,385 (100.0%) | 0 (0.0%) |
| 19 to 25 Years | 493 (69.7%) | 214 (30.3%) |
| 26 to 34 Years | 376 (97.7%) | 9 (2.3%) |
| 35 to 44 Years | 723 (97.8%) | 16 (2.2%) |
| 45 to 54 Years | 570 (100.0%) | 0 (0.0%) |
| 55 to 64 Years | 983 (95.6%) | 45 (4.4%) |
| 65 to 74 Years | 502 (100.0%) | 0 (0.0%) |
| 75 Years and older | 417 (100.0%) | 0 (0.0%) |
| Total | 5,714 (95.3%) | 284 (4.7%) |
Health Insurance Coverage by Citizenship Status in Hilton
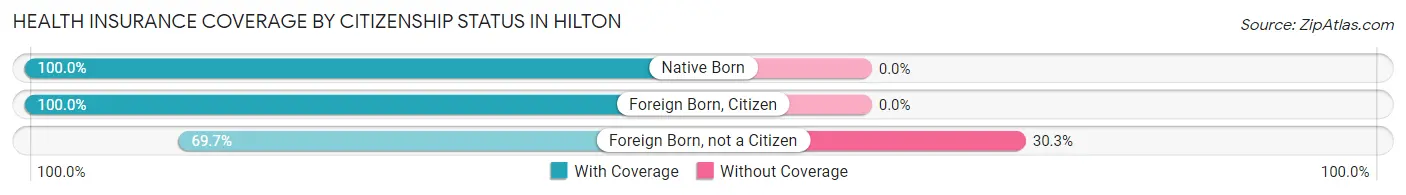
| Citizenship Status | With Coverage | Without Coverage |
| Native Born | 265 (100.0%) | 0 (0.0%) |
| Foreign Born, Citizen | 1,385 (100.0%) | 0 (0.0%) |
| Foreign Born, not a Citizen | 493 (69.7%) | 214 (30.3%) |
Health Insurance Coverage by Household Income in Hilton
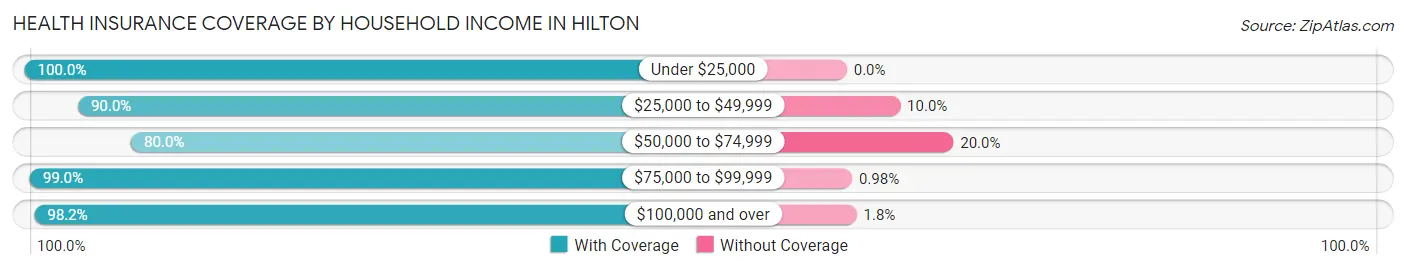
| Household Income | With Coverage | Without Coverage |
| Under $25,000 | 466 (100.0%) | 0 (0.0%) |
| $25,000 to $49,999 | 1,116 (90.0%) | 124 (10.0%) |
| $50,000 to $74,999 | 397 (80.0%) | 99 (20.0%) |
| $75,000 to $99,999 | 913 (99.0%) | 9 (1.0%) |
| $100,000 and over | 2,778 (98.2%) | 52 (1.8%) |
Public vs Private Health Insurance Coverage by Age in Hilton
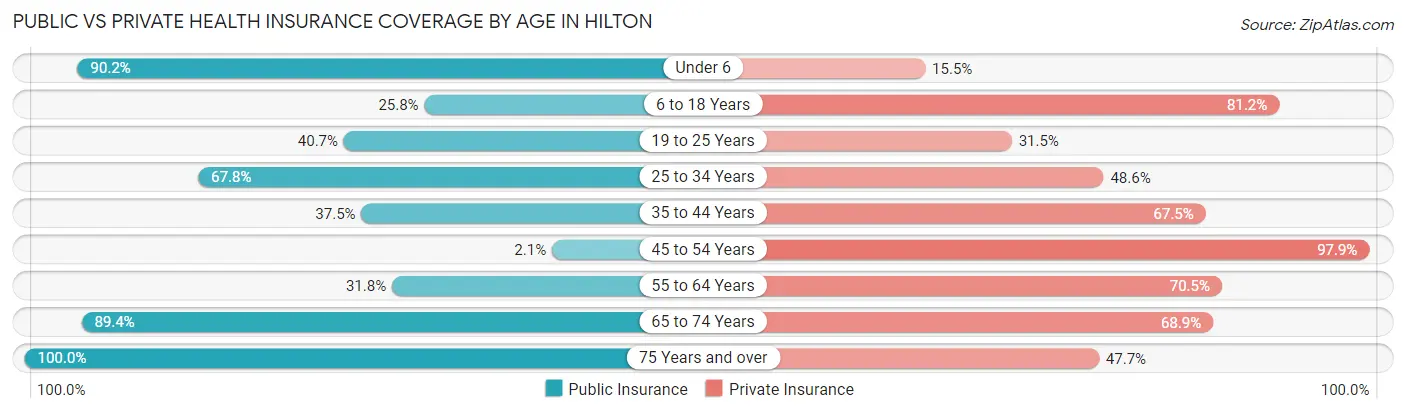
| Age Bracket | Public Insurance | Private Insurance |
| Under 6 | 239 (90.2%) | 41 (15.5%) |
| 6 to 18 Years | 357 (25.8%) | 1,124 (81.2%) |
| 19 to 25 Years | 288 (40.7%) | 223 (31.5%) |
| 25 to 34 Years | 261 (67.8%) | 187 (48.6%) |
| 35 to 44 Years | 277 (37.5%) | 499 (67.5%) |
| 45 to 54 Years | 12 (2.1%) | 558 (97.9%) |
| 55 to 64 Years | 327 (31.8%) | 725 (70.5%) |
| 65 to 74 Years | 449 (89.4%) | 346 (68.9%) |
| 75 Years and over | 417 (100.0%) | 199 (47.7%) |
| Total | 2,627 (43.8%) | 3,902 (65.1%) |
Disability Status by Sex by Age in Hilton
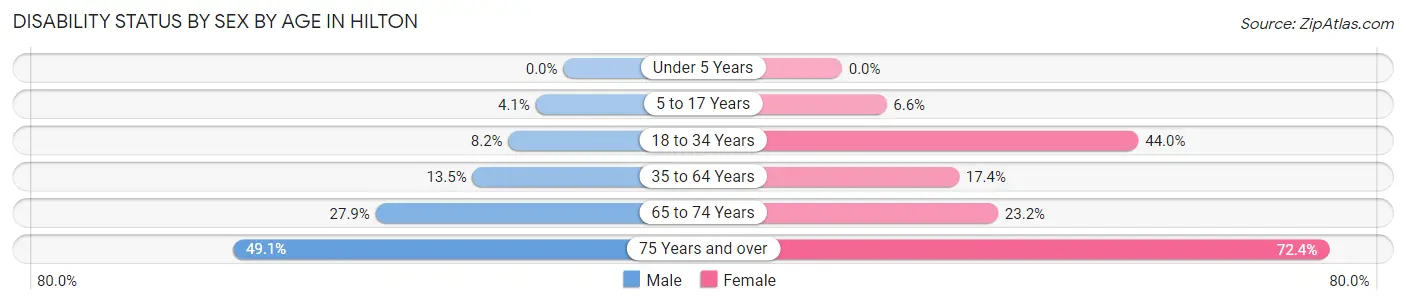
| Age Bracket | Male | Female |
| Under 5 Years | 0 (0.0%) | 0 (0.0%) |
| 5 to 17 Years | 30 (4.1%) | 42 (6.6%) |
| 18 to 34 Years | 44 (8.2%) | 269 (44.0%) |
| 35 to 64 Years | 153 (13.5%) | 209 (17.4%) |
| 65 to 74 Years | 75 (27.9%) | 54 (23.2%) |
| 75 Years and over | 52 (49.1%) | 225 (72.4%) |
Disability Class by Sex by Age in Hilton
Disability Class: Hearing Difficulty
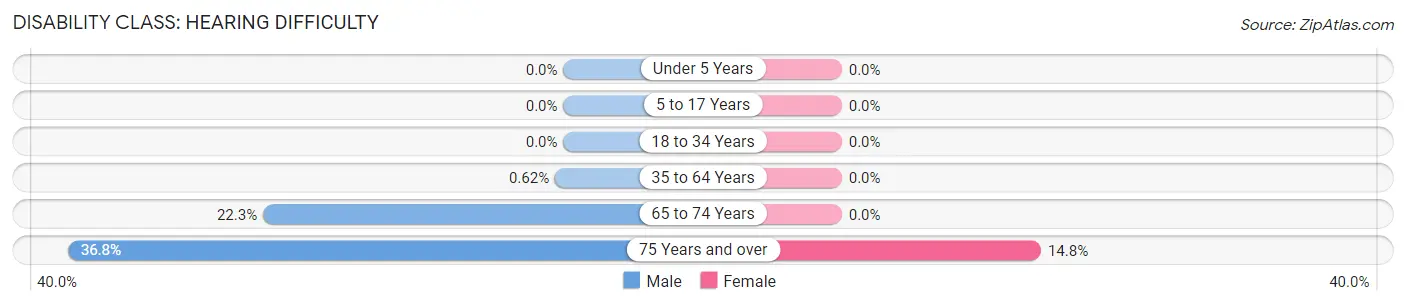
| Age Bracket | Male | Female |
| Under 5 Years | 0 (0.0%) | 0 (0.0%) |
| 5 to 17 Years | 0 (0.0%) | 0 (0.0%) |
| 18 to 34 Years | 0 (0.0%) | 0 (0.0%) |
| 35 to 64 Years | 7 (0.6%) | 0 (0.0%) |
| 65 to 74 Years | 60 (22.3%) | 0 (0.0%) |
| 75 Years and over | 39 (36.8%) | 46 (14.8%) |
Disability Class: Vision Difficulty
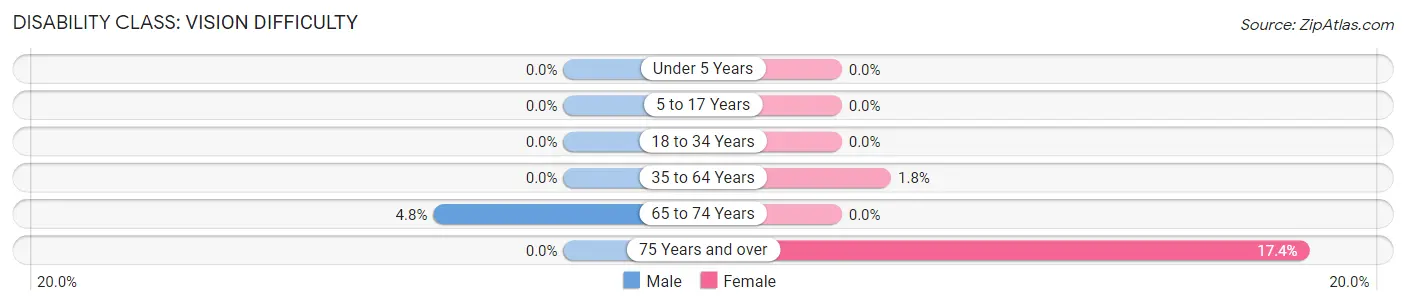
| Age Bracket | Male | Female |
| Under 5 Years | 0 (0.0%) | 0 (0.0%) |
| 5 to 17 Years | 0 (0.0%) | 0 (0.0%) |
| 18 to 34 Years | 0 (0.0%) | 0 (0.0%) |
| 35 to 64 Years | 0 (0.0%) | 22 (1.8%) |
| 65 to 74 Years | 13 (4.8%) | 0 (0.0%) |
| 75 Years and over | 0 (0.0%) | 54 (17.4%) |
Disability Class: Cognitive Difficulty
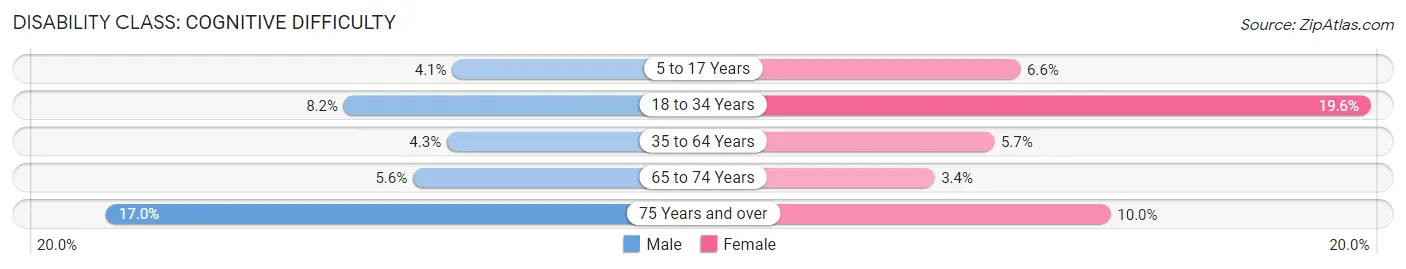
| Age Bracket | Male | Female |
| 5 to 17 Years | 30 (4.1%) | 42 (6.6%) |
| 18 to 34 Years | 44 (8.2%) | 120 (19.6%) |
| 35 to 64 Years | 49 (4.3%) | 68 (5.7%) |
| 65 to 74 Years | 15 (5.6%) | 8 (3.4%) |
| 75 Years and over | 18 (17.0%) | 31 (10.0%) |
Disability Class: Ambulatory Difficulty
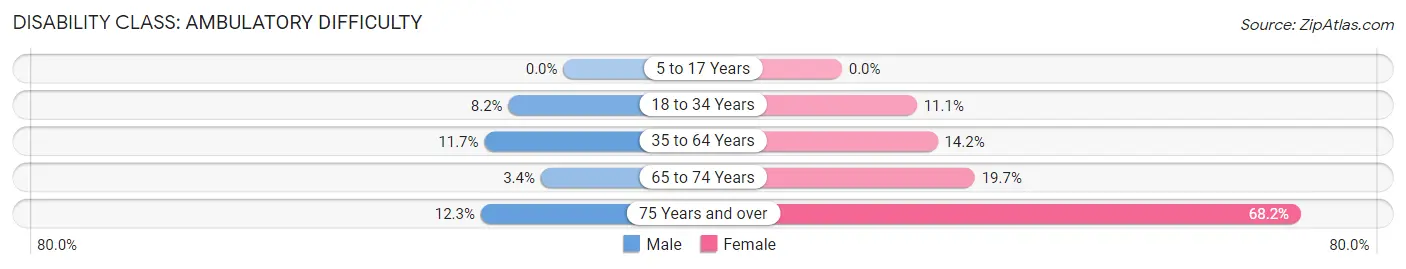
| Age Bracket | Male | Female |
| 5 to 17 Years | 0 (0.0%) | 0 (0.0%) |
| 18 to 34 Years | 44 (8.2%) | 68 (11.1%) |
| 35 to 64 Years | 133 (11.7%) | 171 (14.2%) |
| 65 to 74 Years | 9 (3.4%) | 46 (19.7%) |
| 75 Years and over | 13 (12.3%) | 212 (68.2%) |
Disability Class: Self-Care Difficulty
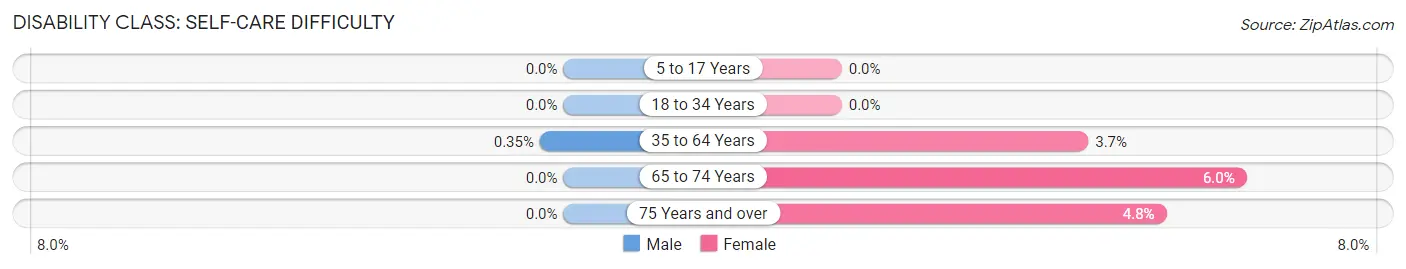
| Age Bracket | Male | Female |
| 5 to 17 Years | 0 (0.0%) | 0 (0.0%) |
| 18 to 34 Years | 0 (0.0%) | 0 (0.0%) |
| 35 to 64 Years | 4 (0.4%) | 44 (3.7%) |
| 65 to 74 Years | 0 (0.0%) | 14 (6.0%) |
| 75 Years and over | 0 (0.0%) | 15 (4.8%) |
Technology Access in Hilton
Computing Device Access in Hilton
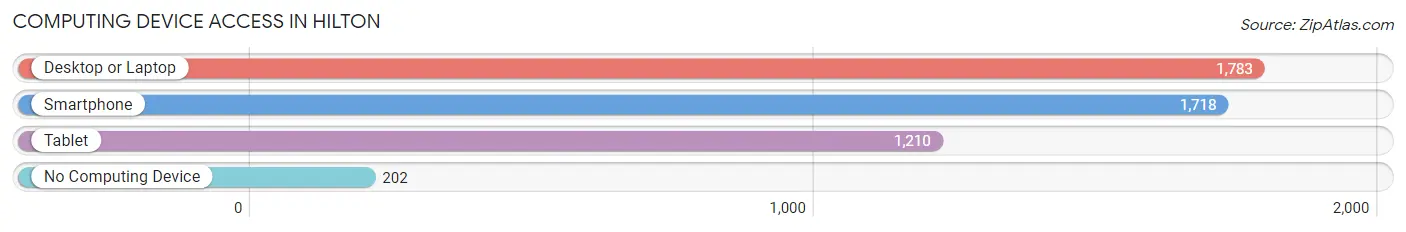
| Device Type | # Households | % Households |
| Desktop or Laptop | 1,783 | 79.9% |
| Smartphone | 1,718 | 77.0% |
| Tablet | 1,210 | 54.2% |
| No Computing Device | 202 | 9.0% |
| Total | 2,232 | 100.0% |
Internet Access in Hilton
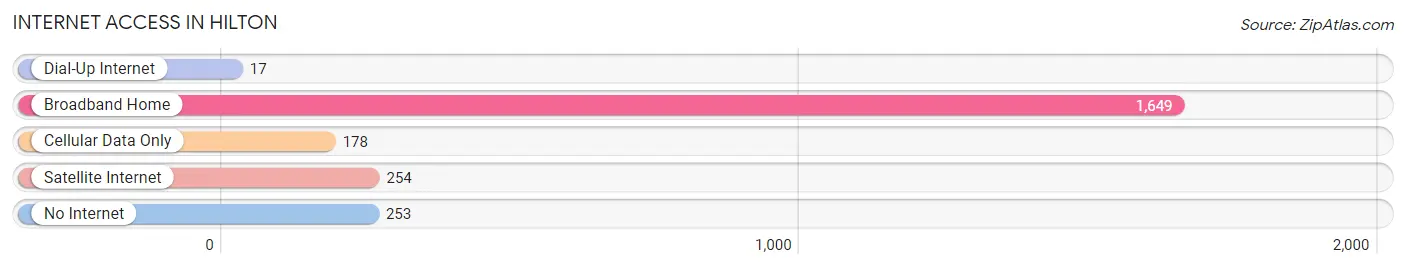
| Internet Type | # Households | % Households |
| Dial-Up Internet | 17 | 0.8% |
| Broadband Home | 1,649 | 73.9% |
| Cellular Data Only | 178 | 8.0% |
| Satellite Internet | 254 | 11.4% |
| No Internet | 253 | 11.3% |
| Total | 2,232 | 100.0% |
Hilton Summary
Hilton is a small town located in Monroe County, New York. It is situated in the western part of the county, just south of the city of Rochester. The town is bordered by the towns of Parma, Ogden, and Greece. According to the 2010 census, the population of Hilton was 12,741.
History
The area that is now Hilton was first settled in the late 1700s. The town was originally part of the town of Parma, but was separated in 1812 and incorporated as the town of Northampton. The name was changed to Hilton in 1819 in honor of the Rev. Charles Hilton, a local minister.
In the early 1800s, the town was largely agricultural, with some small-scale manufacturing. The town was home to several mills, including a grist mill, a saw mill, and a woolen mill. The town also had a tannery and a brickyard.
In the late 1800s, the town began to experience a period of growth and development. The Rochester and Syracuse Railroad was built through the town in 1882, and the town was connected to the Rochester and Eastern Electric Railway in 1891. This allowed for increased transportation and commerce in the area.
The town continued to grow in the early 1900s, and by the 1950s, the population had reached its peak of over 13,000. Since then, the population has declined slightly, but the town remains a vibrant community.
Geography
Hilton is located in western Monroe County, just south of the city of Rochester. The town is bordered by the towns of Parma, Ogden, and Greece. The town is situated on the Genesee River, which flows through the town from north to south.
The terrain of the town is generally flat, with some rolling hills in the northern part of the town. The highest point in the town is located in the northern part of the town, near the intersection of Hilton-Parma Townline Road and Hilton-Ogden Townline Road, and is approximately 860 feet above sea level.
Economy
Hilton is a largely residential community, with a few small businesses located in the town. The largest employer in the town is the Hilton Central School District, which employs over 500 people. Other major employers in the town include the Hilton Fire Department, the Hilton Police Department, and the Hilton Public Library.
The town also has a few small retail businesses, including a grocery store, a hardware store, and a few restaurants. The town also has a few small manufacturing businesses, including a printing company and a plastics manufacturer.
Demographics
According to the 2010 census, the population of Hilton was 12,741. The racial makeup of the town was 94.3% White, 2.2% African American, 0.5% Native American, 1.2% Asian, 0.1% Pacific Islander, 0.7% from other races, and 1.0% from two or more races. Hispanic or Latino of any race were 2.7% of the population.
The median household income in the town was $60,945, and the median family income was $68,917. The per capita income for the town was $27,845. About 4.3% of families and 5.7% of the population were below the poverty line, including 7.2% of those under age 18 and 4.2% of those age 65 or over.
Common Questions
What is Per Capita Income in Hilton?
Per Capita income in Hilton is $29,798.
What is the Median Family Income in Hilton?
Median Family Income in Hilton is $99,792.
What is the Median Household income in Hilton?
Median Household Income in Hilton is $75,098.
What is Income or Wage Gap in Hilton?
Income or Wage Gap in Hilton is 16.1%.
Women in Hilton earn 83.9 cents for every dollar earned by a man.
What is Inequality or Gini Index in Hilton?
Inequality or Gini Index in Hilton is 0.37.
What is the Total Population of Hilton?
Total Population of Hilton is 5,998.
What is the Total Male Population of Hilton?
Total Male Population of Hilton is 2,825.
What is the Total Female Population of Hilton?
Total Female Population of Hilton is 3,173.
What is the Ratio of Males per 100 Females in Hilton?
There are 89.03 Males per 100 Females in Hilton.
What is the Ratio of Females per 100 Males in Hilton?
There are 112.32 Females per 100 Males in Hilton.
What is the Median Population Age in Hilton?
Median Population Age in Hilton is 36.9 Years.
What is the Average Family Size in Hilton
Average Family Size in Hilton is 3.1 People.
What is the Average Household Size in Hilton
Average Household Size in Hilton is 2.7 People.
How Large is the Labor Force in Hilton?
There are 2,990 People in the Labor Forcein in Hilton.
What is the Percentage of People in the Labor Force in Hilton?
62.5% of People are in the Labor Force in Hilton.
What is the Unemployment Rate in Hilton?
Unemployment Rate in Hilton is 7.6%.