Heritage Hills, NY Map & Demographics
Heritage Hills Map
Heritage Hills Overview
$73,892
PER CAPITA INCOME
$108,958
AVG FAMILY INCOME
$87,552
AVG HOUSEHOLD INCOME
18.6%
WAGE / INCOME GAP [ % ]
81.4¢/ $1
WAGE / INCOME GAP [ $ ]
0.48
INEQUALITY / GINI INDEX
3,927
TOTAL POPULATION
1,423
MALE POPULATION
2,504
FEMALE POPULATION
56.83
MALES / 100 FEMALES
175.97
FEMALES / 100 MALES
69.3
MEDIAN AGE
2.2
AVG FAMILY SIZE
1.6
AVG HOUSEHOLD SIZE
1,240
LABOR FORCE [ PEOPLE ]
33.9%
PERCENT IN LABOR FORCE
11.4%
UNEMPLOYMENT RATE
Income in Heritage Hills
Income Overview in Heritage Hills
Per Capita Income in Heritage Hills is $73,892, while median incomes of families and households are $108,958 and $87,552 respectively.
| Characteristic | Number | Measure |
| Per Capita Income | 3,927 | $73,892 |
| Median Family Income | 846 | $108,958 |
| Mean Family Income | 846 | $166,607 |
| Median Household Income | 2,433 | $87,552 |
| Mean Household Income | 2,433 | $117,811 |
| Income Deficit | 846 | $0 |
| Wage / Income Gap (%) | 3,927 | 18.59% |
| Wage / Income Gap ($) | 3,927 | 81.41¢ per $1 |
| Gini / Inequality Index | 3,927 | 0.48 |
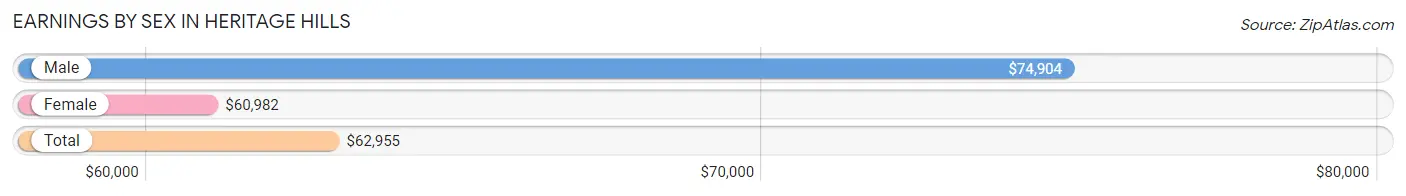
Earnings by Sex in Heritage Hills
Average Earnings in Heritage Hills are $62,955, $74,904 for men and $60,982 for women, a difference of 18.6%.
| Sex | Number | Average Earnings |
| Male | 461 (36.1%) | $74,904 |
| Female | 817 (63.9%) | $60,982 |
| Total | 1,278 (100.0%) | $62,955 |
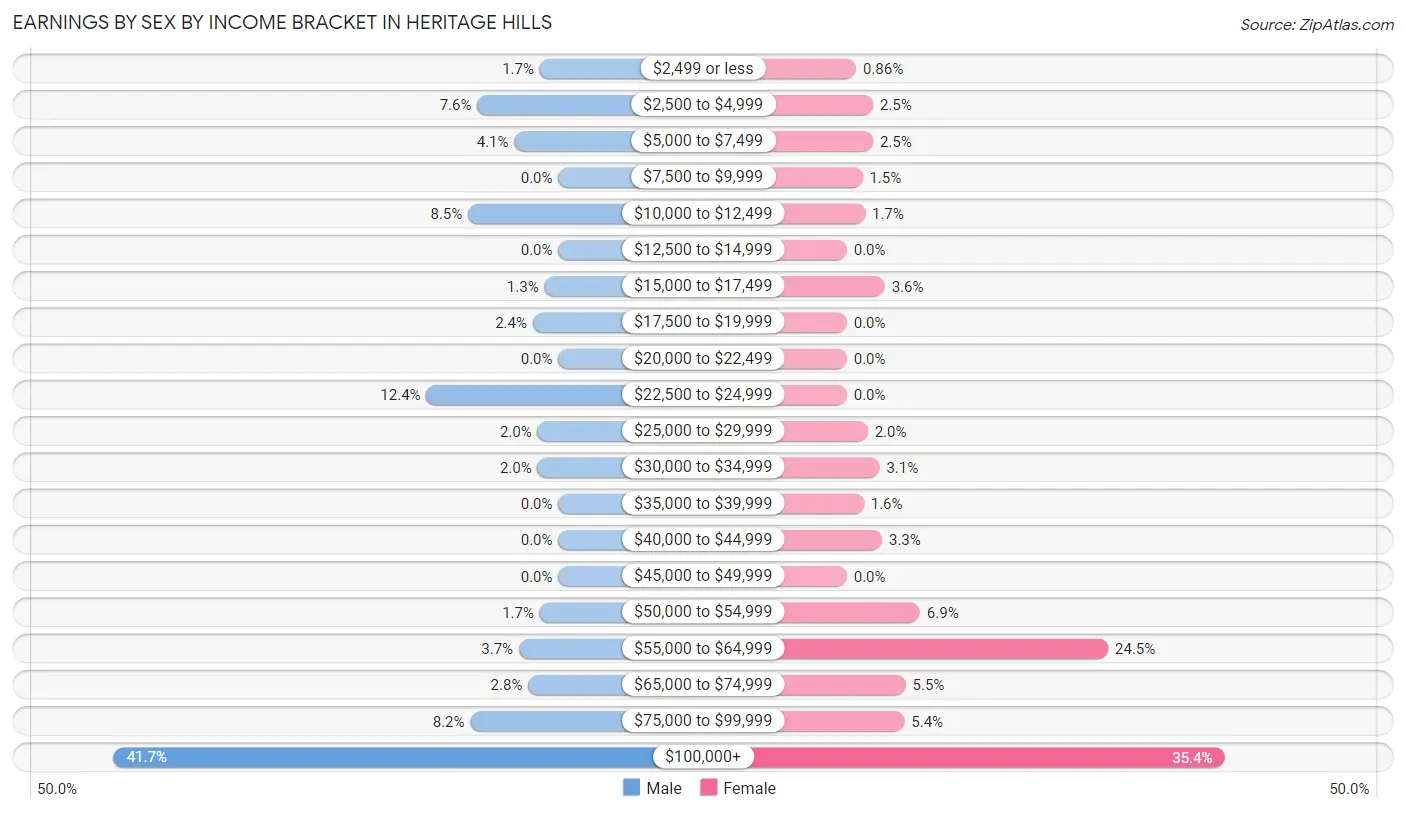
Earnings by Sex by Income Bracket in Heritage Hills
The most common earnings brackets in Heritage Hills are $100,000+ for men (192 | 41.6%) and $100,000+ for women (289 | 35.4%).
| Income | Male | Female |
| $2,499 or less | 8 (1.7%) | 7 (0.9%) |
| $2,500 to $4,999 | 35 (7.6%) | 20 (2.5%) |
| $5,000 to $7,499 | 19 (4.1%) | 20 (2.5%) |
| $7,500 to $9,999 | 0 (0.0%) | 12 (1.5%) |
| $10,000 to $12,499 | 39 (8.5%) | 14 (1.7%) |
| $12,500 to $14,999 | 0 (0.0%) | 0 (0.0%) |
| $15,000 to $17,499 | 6 (1.3%) | 29 (3.5%) |
| $17,500 to $19,999 | 11 (2.4%) | 0 (0.0%) |
| $20,000 to $22,499 | 0 (0.0%) | 0 (0.0%) |
| $22,500 to $24,999 | 57 (12.4%) | 0 (0.0%) |
| $25,000 to $29,999 | 9 (1.9%) | 16 (2.0%) |
| $30,000 to $34,999 | 9 (1.9%) | 25 (3.1%) |
| $35,000 to $39,999 | 0 (0.0%) | 13 (1.6%) |
| $40,000 to $44,999 | 0 (0.0%) | 27 (3.3%) |
| $45,000 to $49,999 | 0 (0.0%) | 0 (0.0%) |
| $50,000 to $54,999 | 8 (1.7%) | 56 (6.9%) |
| $55,000 to $64,999 | 17 (3.7%) | 200 (24.5%) |
| $65,000 to $74,999 | 13 (2.8%) | 45 (5.5%) |
| $75,000 to $99,999 | 38 (8.2%) | 44 (5.4%) |
| $100,000+ | 192 (41.6%) | 289 (35.4%) |
| Total | 461 (100.0%) | 817 (100.0%) |
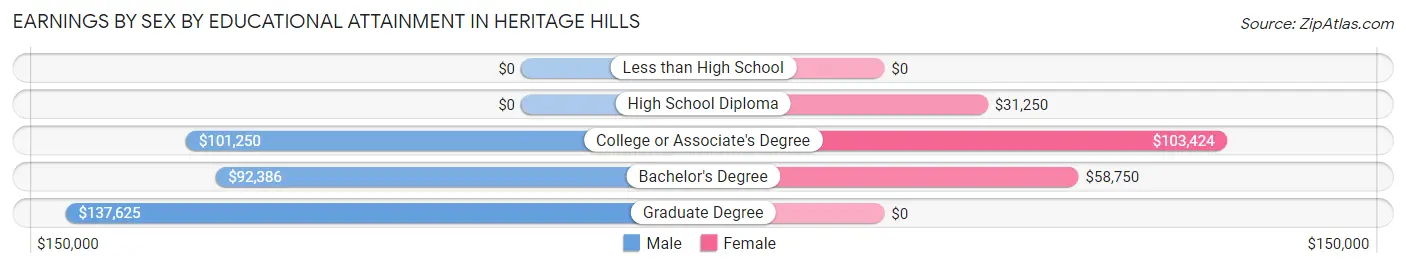
Earnings by Sex by Educational Attainment in Heritage Hills
Average earnings in Heritage Hills are $93,333 for men and $60,982 for women, a difference of 34.7%. Men with an educational attainment of graduate degree enjoy the highest average annual earnings of $137,625, while those with bachelor's degree education earn the least with $92,386. Women with an educational attainment of college or associate's degree earn the most with the average annual earnings of $103,424, while those with high school diploma education have the smallest earnings of $31,250.
| Educational Attainment | Male Income | Female Income |
| Less than High School | - | - |
| High School Diploma | - | - |
| College or Associate's Degree | $101,250 | $103,424 |
| Bachelor's Degree | $92,386 | $58,750 |
| Graduate Degree | $137,625 | $0 |
| Total | $93,333 | $60,982 |
Family Income in Heritage Hills
Family Income Brackets in Heritage Hills
According to the Heritage Hills family income data, there are 192 families falling into the $200,000+ income range, which is the most common income bracket and makes up 22.7% of all families. Conversely, the $25,000 to $34,999 income bracket is the least frequent group with only 10 families (1.2%) belonging to this category.
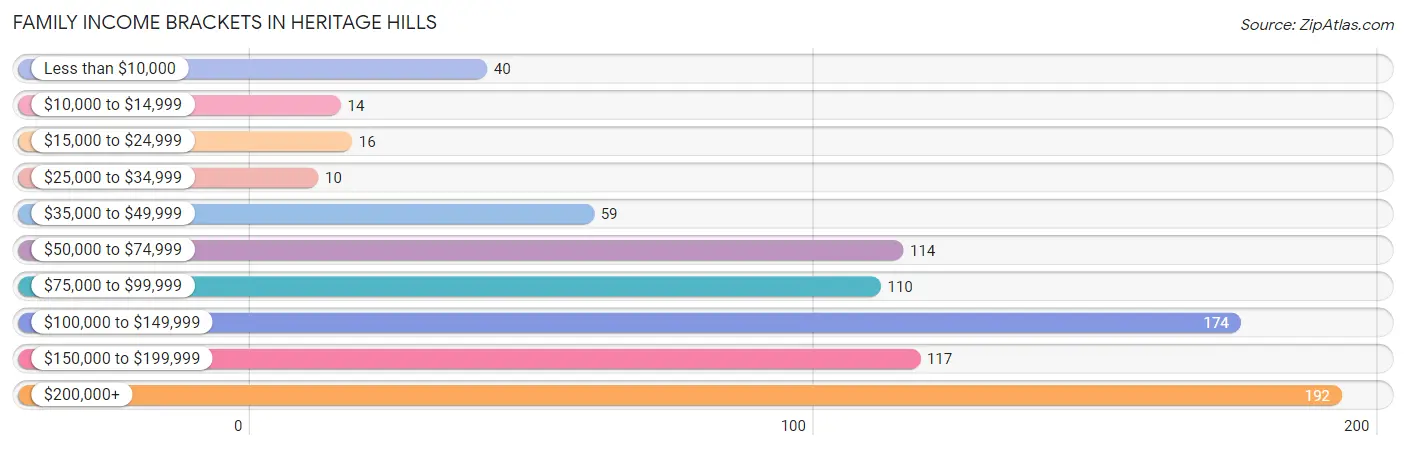
| Income Bracket | # Families | % Families |
| Less than $10,000 | 40 | 4.7% |
| $10,000 to $14,999 | 14 | 1.7% |
| $15,000 to $24,999 | 16 | 1.9% |
| $25,000 to $34,999 | 10 | 1.2% |
| $35,000 to $49,999 | 59 | 7.0% |
| $50,000 to $74,999 | 114 | 13.5% |
| $75,000 to $99,999 | 110 | 13.0% |
| $100,000 to $149,999 | 174 | 20.6% |
| $150,000 to $199,999 | 117 | 13.8% |
| $200,000+ | 192 | 22.7% |
Family Income by Famaliy Size in Heritage Hills
3-person families (168 | 19.9%) account for the highest median family income in Heritage Hills with $185,750 per family, while 3-person families (168 | 19.9%) have the highest median income of $61,917 per family member.
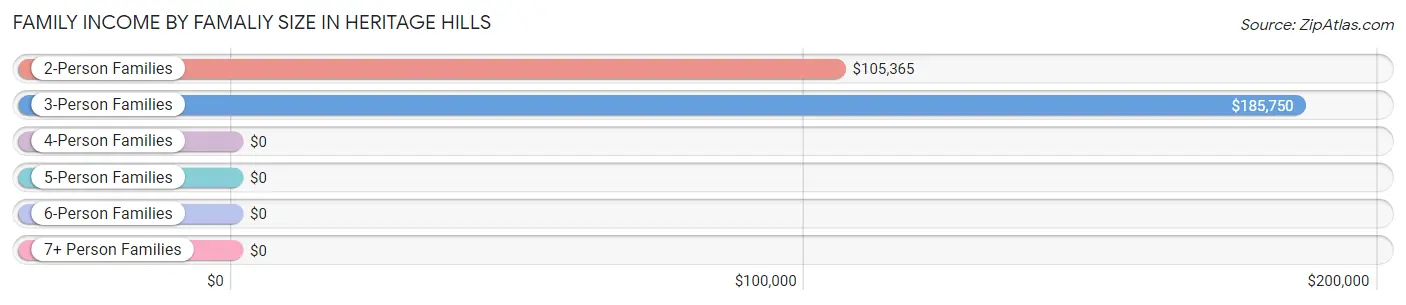
| Income Bracket | # Families | Median Income |
| 2-Person Families | 669 (79.1%) | $105,365 |
| 3-Person Families | 168 (19.9%) | $185,750 |
| 4-Person Families | 9 (1.1%) | $0 |
| 5-Person Families | 0 (0.0%) | $0 |
| 6-Person Families | 0 (0.0%) | $0 |
| 7+ Person Families | 0 (0.0%) | $0 |
| Total | 846 (100.0%) | $108,958 |
Family Income by Number of Earners in Heritage Hills
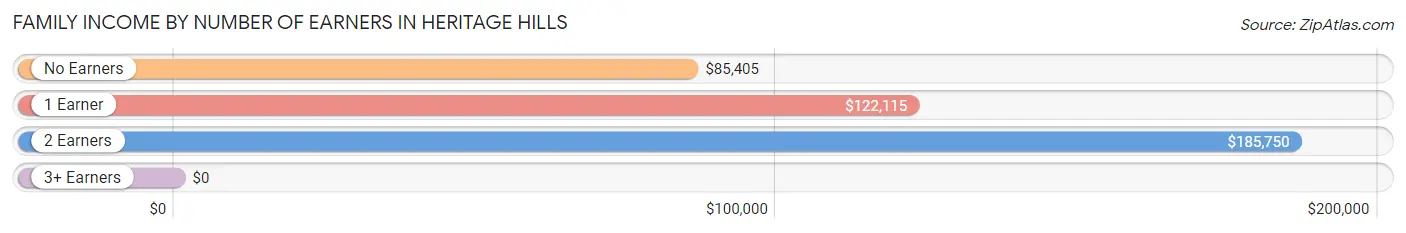
| Number of Earners | # Families | Median Income |
| No Earners | 422 (49.9%) | $85,405 |
| 1 Earner | 230 (27.2%) | $122,115 |
| 2 Earners | 176 (20.8%) | $185,750 |
| 3+ Earners | 18 (2.1%) | $0 |
| Total | 846 (100.0%) | $108,958 |
Household Income in Heritage Hills
Household Income Brackets in Heritage Hills
With 479 households falling in the category, the $100,000 to $149,999 income range is the most frequent in Heritage Hills, accounting for 19.7% of all households. In contrast, only 34 households (1.4%) fall into the $10,000 to $14,999 income bracket, making it the least populous group.
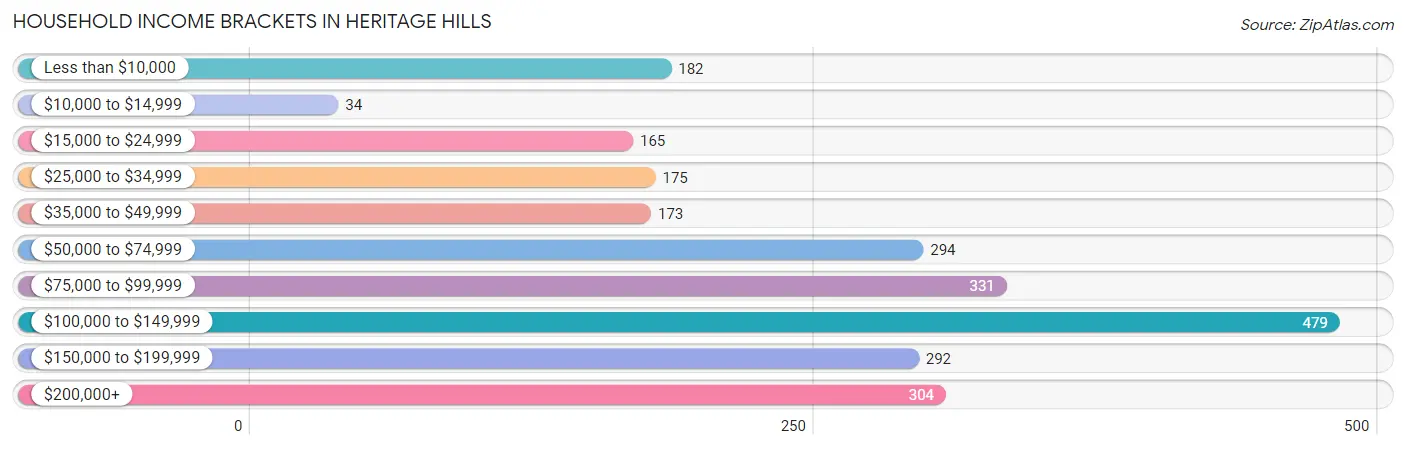
| Income Bracket | # Households | % Households |
| Less than $10,000 | 182 | 7.5% |
| $10,000 to $14,999 | 34 | 1.4% |
| $15,000 to $24,999 | 165 | 6.8% |
| $25,000 to $34,999 | 175 | 7.2% |
| $35,000 to $49,999 | 173 | 7.1% |
| $50,000 to $74,999 | 294 | 12.1% |
| $75,000 to $99,999 | 331 | 13.6% |
| $100,000 to $149,999 | 479 | 19.7% |
| $150,000 to $199,999 | 292 | 12.0% |
| $200,000+ | 304 | 12.5% |
Household Income by Householder Age in Heritage Hills
The median household income in Heritage Hills is $87,552, with the highest median household income of $250,001 found in the 25 to 44 years age bracket for the primary householder. A total of 126 households (5.2%) fall into this category.
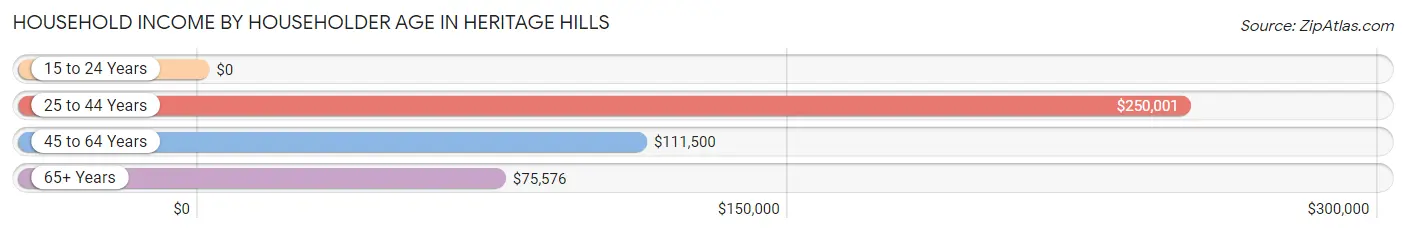
| Income Bracket | # Households | Median Income |
| 15 to 24 Years | 0 (0.0%) | $0 |
| 25 to 44 Years | 126 (5.2%) | $250,001 |
| 45 to 64 Years | 412 (16.9%) | $111,500 |
| 65+ Years | 1,895 (77.9%) | $75,576 |
| Total | 2,433 (100.0%) | $87,552 |
Poverty in Heritage Hills
Income Below Poverty by Sex and Age in Heritage Hills
With 2.8% poverty level for males and 10.3% for females among the residents of Heritage Hills, 65 to 74 year old males and 12 to 14 year old females are the most vulnerable to poverty, with 28 males (7.5%) and 38 females (88.4%) in their respective age groups living below the poverty level.
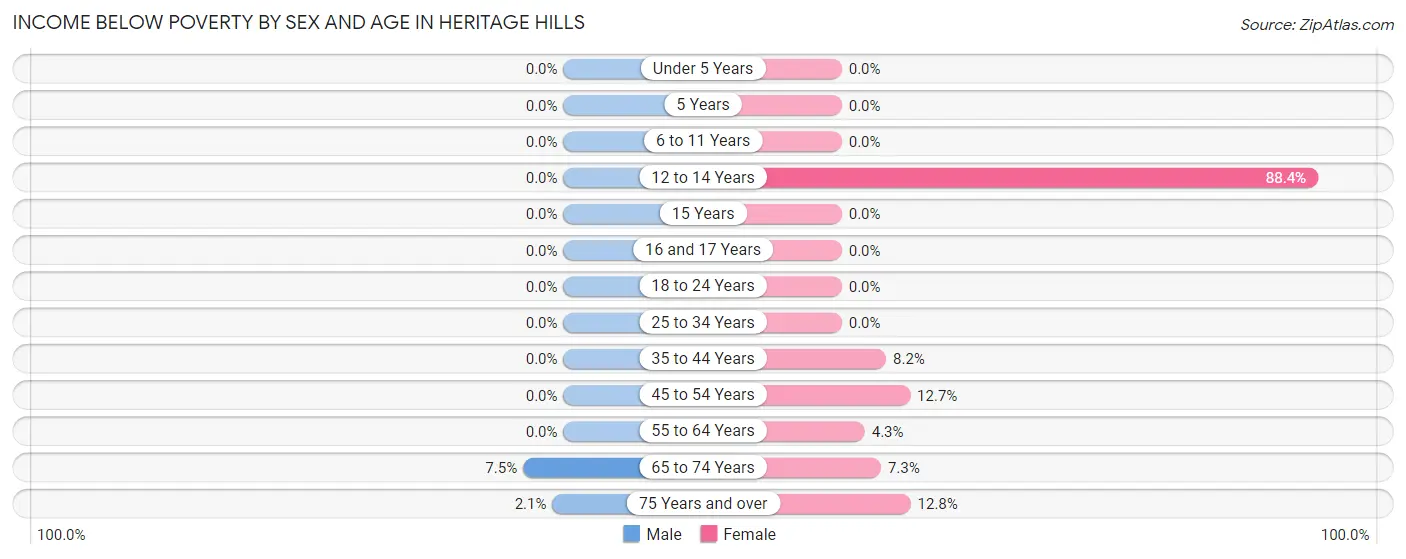
| Age Bracket | Male | Female |
| Under 5 Years | 0 (0.0%) | 0 (0.0%) |
| 5 Years | 0 (0.0%) | 0 (0.0%) |
| 6 to 11 Years | 0 (0.0%) | 0 (0.0%) |
| 12 to 14 Years | 0 (0.0%) | 38 (88.4%) |
| 15 Years | 0 (0.0%) | 0 (0.0%) |
| 16 and 17 Years | 0 (0.0%) | 0 (0.0%) |
| 18 to 24 Years | 0 (0.0%) | 0 (0.0%) |
| 25 to 34 Years | 0 (0.0%) | 0 (0.0%) |
| 35 to 44 Years | 0 (0.0%) | 12 (8.2%) |
| 45 to 54 Years | 0 (0.0%) | 17 (12.7%) |
| 55 to 64 Years | 0 (0.0%) | 20 (4.3%) |
| 65 to 74 Years | 28 (7.5%) | 37 (7.3%) |
| 75 Years and over | 10 (2.1%) | 135 (12.8%) |
| Total | 38 (2.8%) | 259 (10.3%) |
Income Above Poverty by Sex and Age in Heritage Hills
According to the poverty statistics in Heritage Hills, males aged under 5 years and females aged under 5 years are the age groups that are most secure financially, with 100.0% of males and 100.0% of females in these age groups living above the poverty line.
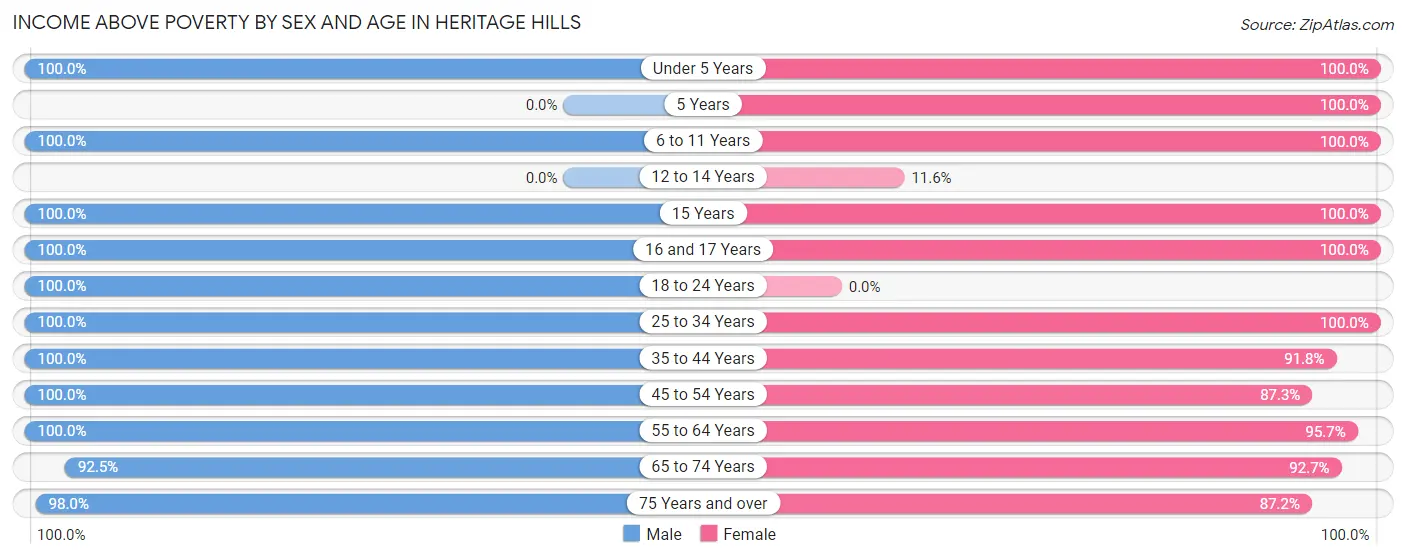
| Age Bracket | Male | Female |
| Under 5 Years | 6 (100.0%) | 64 (100.0%) |
| 5 Years | 0 (0.0%) | 13 (100.0%) |
| 6 to 11 Years | 37 (100.0%) | 12 (100.0%) |
| 12 to 14 Years | 0 (0.0%) | 5 (11.6%) |
| 15 Years | 20 (100.0%) | 27 (100.0%) |
| 16 and 17 Years | 6 (100.0%) | 11 (100.0%) |
| 18 to 24 Years | 53 (100.0%) | 0 (0.0%) |
| 25 to 34 Years | 34 (100.0%) | 20 (100.0%) |
| 35 to 44 Years | 52 (100.0%) | 134 (91.8%) |
| 45 to 54 Years | 88 (100.0%) | 117 (87.3%) |
| 55 to 64 Years | 218 (100.0%) | 448 (95.7%) |
| 65 to 74 Years | 346 (92.5%) | 472 (92.7%) |
| 75 Years and over | 477 (98.0%) | 922 (87.2%) |
| Total | 1,337 (97.2%) | 2,245 (89.7%) |
Income Below Poverty Among Married-Couple Families in Heritage Hills
The poverty statistics for married-couple families in Heritage Hills show that 4.1% or 28 of the total 679 families live below the poverty line. Families with no children have the highest poverty rate of 4.9%, comprising of 28 families. On the other hand, families with 1 or 2 children have the lowest poverty rate of 0.0%, which includes 0 families.
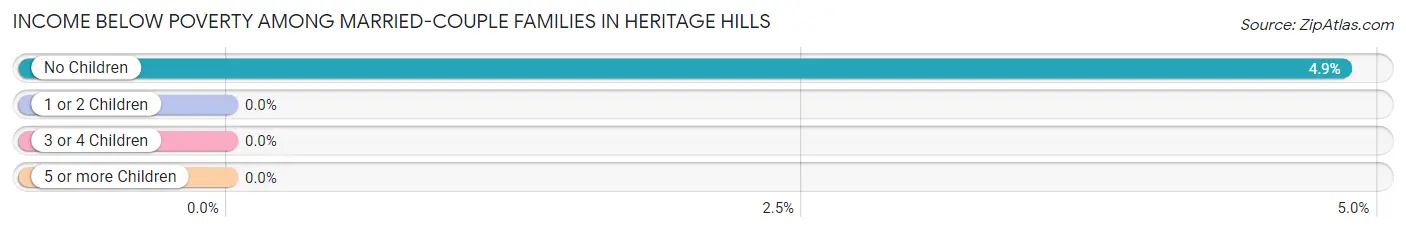
| Children | Above Poverty | Below Poverty |
| No Children | 549 (95.2%) | 28 (4.9%) |
| 1 or 2 Children | 102 (100.0%) | 0 (0.0%) |
| 3 or 4 Children | 0 (0.0%) | 0 (0.0%) |
| 5 or more Children | 0 (0.0%) | 0 (0.0%) |
| Total | 651 (95.9%) | 28 (4.1%) |
Income Below Poverty Among Single-Parent Households in Heritage Hills
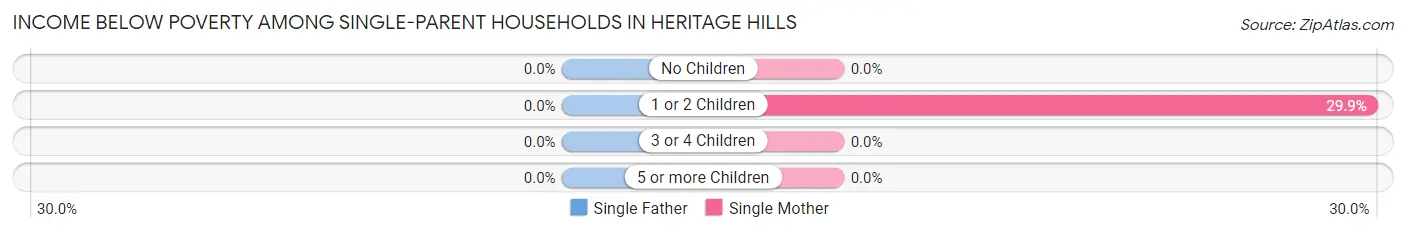
| Children | Single Father | Single Mother |
| No Children | 0 (0.0%) | 0 (0.0%) |
| 1 or 2 Children | 0 (0.0%) | 26 (29.9%) |
| 3 or 4 Children | 0 (0.0%) | 0 (0.0%) |
| 5 or more Children | 0 (0.0%) | 0 (0.0%) |
| Total | 0 (0.0%) | 26 (15.7%) |
Income Below Poverty Among Married-Couple vs Single-Parent Households in Heritage Hills
The poverty data for Heritage Hills shows that 28 of the married-couple family households (4.1%) and 26 of the single-parent households (15.6%) are living below the poverty level. Within the married-couple family households, those with no children have the highest poverty rate, with 28 households (4.9%) falling below the poverty line. Among the single-parent households, those with 1 or 2 children have the highest poverty rate, with 26 household (29.5%) living below poverty.
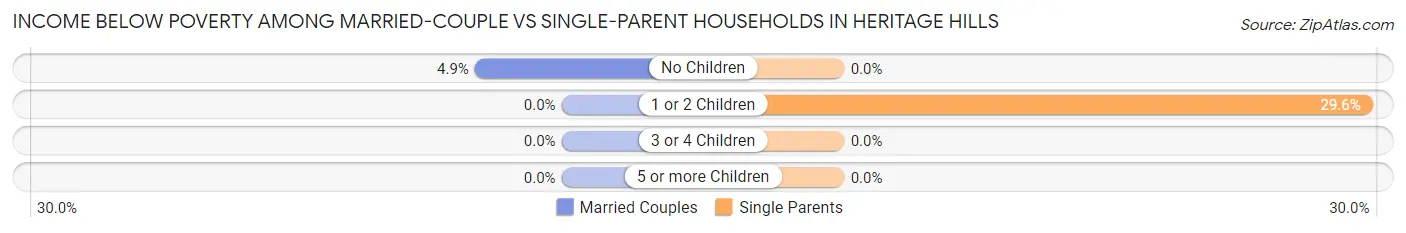
| Children | Married-Couple Families | Single-Parent Households |
| No Children | 28 (4.9%) | 0 (0.0%) |
| 1 or 2 Children | 0 (0.0%) | 26 (29.5%) |
| 3 or 4 Children | 0 (0.0%) | 0 (0.0%) |
| 5 or more Children | 0 (0.0%) | 0 (0.0%) |
| Total | 28 (4.1%) | 26 (15.6%) |
Race in Heritage Hills
The most populous races in Heritage Hills are White / Caucasian (3,701 | 94.2%), Hispanic or Latino (123 | 3.1%), and Two or more Races (81 | 2.1%).
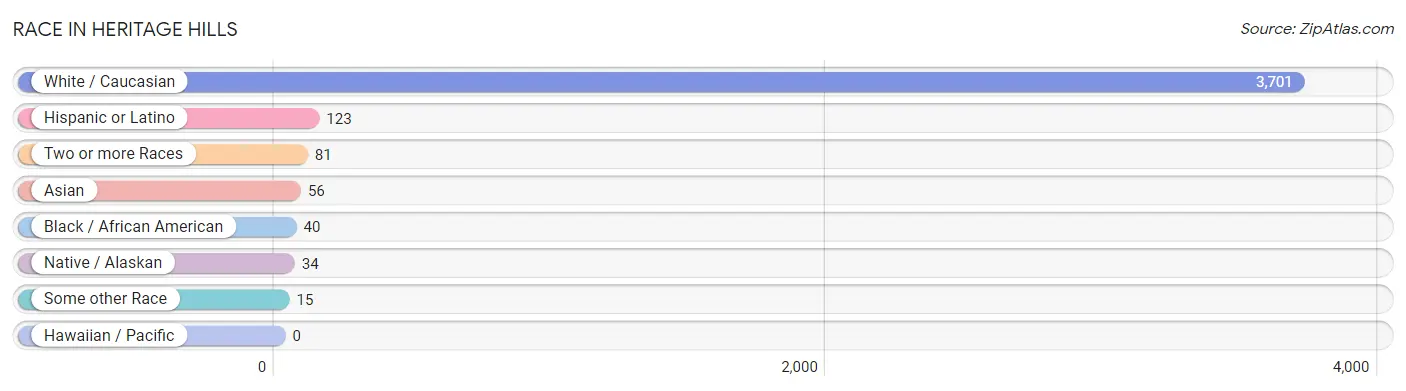
| Race | # Population | % Population |
| Asian | 56 | 1.4% |
| Black / African American | 40 | 1.0% |
| Hawaiian / Pacific | 0 | 0.0% |
| Hispanic or Latino | 123 | 3.1% |
| Native / Alaskan | 34 | 0.9% |
| White / Caucasian | 3,701 | 94.2% |
| Two or more Races | 81 | 2.1% |
| Some other Race | 15 | 0.4% |
| Total | 3,927 | 100.0% |
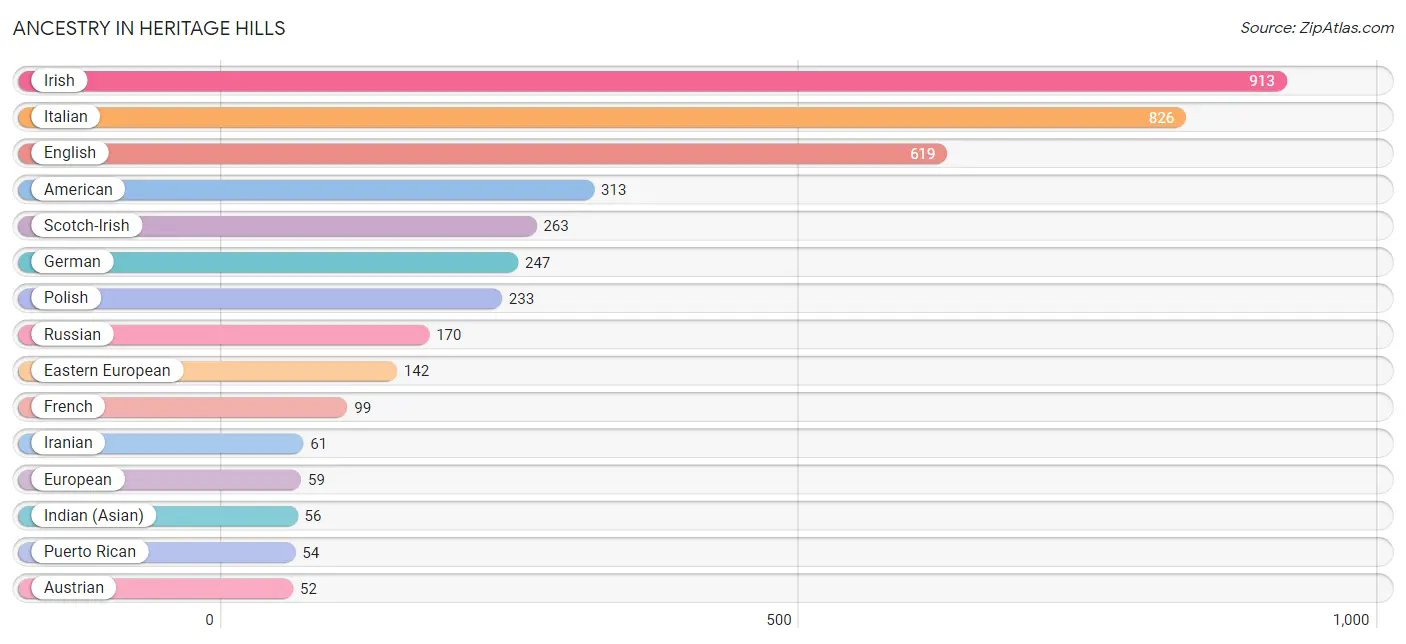
Ancestry in Heritage Hills
The most populous ancestries reported in Heritage Hills are Irish (913 | 23.3%), Italian (826 | 21.0%), English (619 | 15.8%), American (313 | 8.0%), and Scotch-Irish (263 | 6.7%), together accounting for 74.7% of all Heritage Hills residents.
| Ancestry | # Population | % Population |
| American | 313 | 8.0% |
| Austrian | 52 | 1.3% |
| British | 43 | 1.1% |
| Canadian | 29 | 0.7% |
| Cuban | 34 | 0.9% |
| Czechoslovakian | 13 | 0.3% |
| Danish | 10 | 0.3% |
| Dominican | 10 | 0.3% |
| Dutch | 13 | 0.3% |
| Eastern European | 142 | 3.6% |
| English | 619 | 15.8% |
| European | 59 | 1.5% |
| French | 99 | 2.5% |
| German | 247 | 6.3% |
| Greek | 9 | 0.2% |
| Hungarian | 16 | 0.4% |
| Indian (Asian) | 56 | 1.4% |
| Iranian | 61 | 1.5% |
| Irish | 913 | 23.3% |
| Italian | 826 | 21.0% |
| Jamaican | 12 | 0.3% |
| Lithuanian | 24 | 0.6% |
| Mexican | 8 | 0.2% |
| Polish | 233 | 5.9% |
| Portuguese | 21 | 0.5% |
| Puerto Rican | 54 | 1.4% |
| Romanian | 41 | 1.0% |
| Russian | 170 | 4.3% |
| Scotch-Irish | 263 | 6.7% |
| Scottish | 30 | 0.8% |
| Slovak | 6 | 0.2% |
| Spaniard | 17 | 0.4% |
| Swedish | 31 | 0.8% |
| Ukrainian | 22 | 0.6% | View All 34 Rows |
Immigrants in Heritage Hills
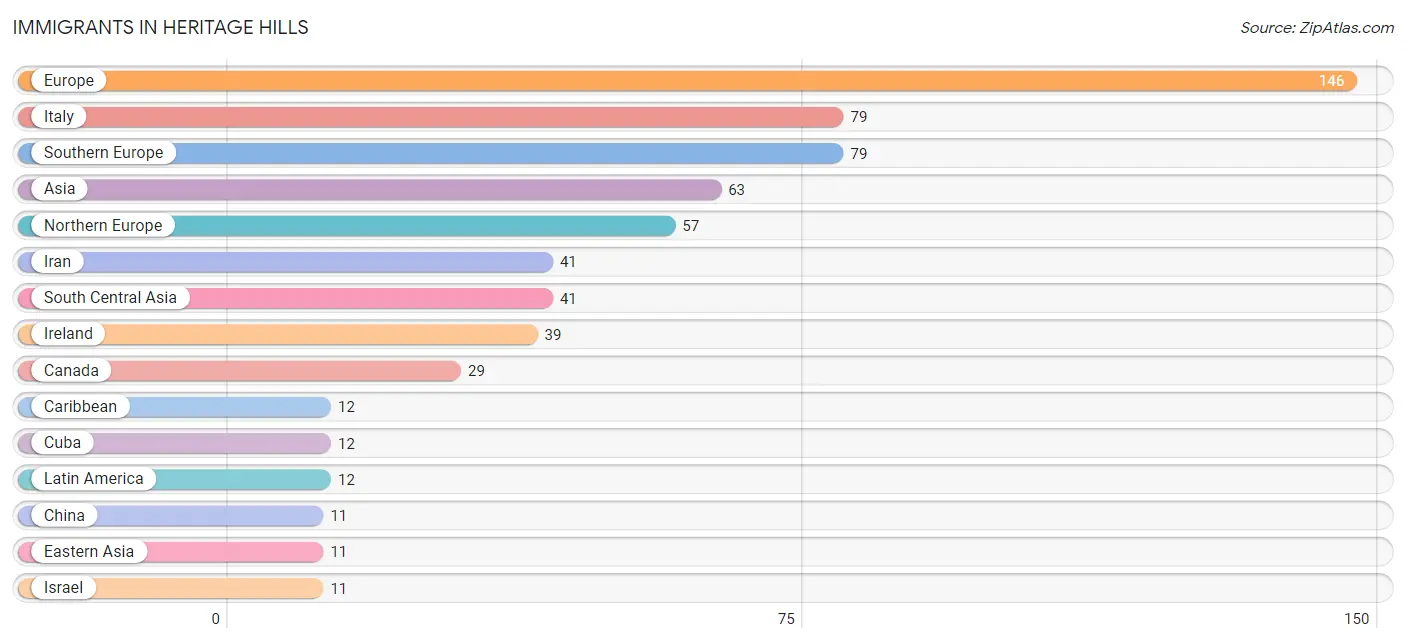
The most numerous immigrant groups reported in Heritage Hills came from Europe (146 | 3.7%), Italy (79 | 2.0%), Southern Europe (79 | 2.0%), Asia (63 | 1.6%), and Northern Europe (57 | 1.5%), together accounting for 10.8% of all Heritage Hills residents.
| Immigration Origin | # Population | % Population |
| Asia | 63 | 1.6% |
| Canada | 29 | 0.7% |
| Caribbean | 12 | 0.3% |
| China | 11 | 0.3% |
| Cuba | 12 | 0.3% |
| Eastern Asia | 11 | 0.3% |
| Eastern Europe | 10 | 0.3% |
| England | 10 | 0.3% |
| Europe | 146 | 3.7% |
| Hungary | 10 | 0.3% |
| Iran | 41 | 1.0% |
| Ireland | 39 | 1.0% |
| Israel | 11 | 0.3% |
| Italy | 79 | 2.0% |
| Latin America | 12 | 0.3% |
| Northern Europe | 57 | 1.5% |
| South Central Asia | 41 | 1.0% |
| Southern Europe | 79 | 2.0% |
| Western Asia | 11 | 0.3% | View All 19 Rows |
Sex and Age in Heritage Hills
Sex and Age in Heritage Hills
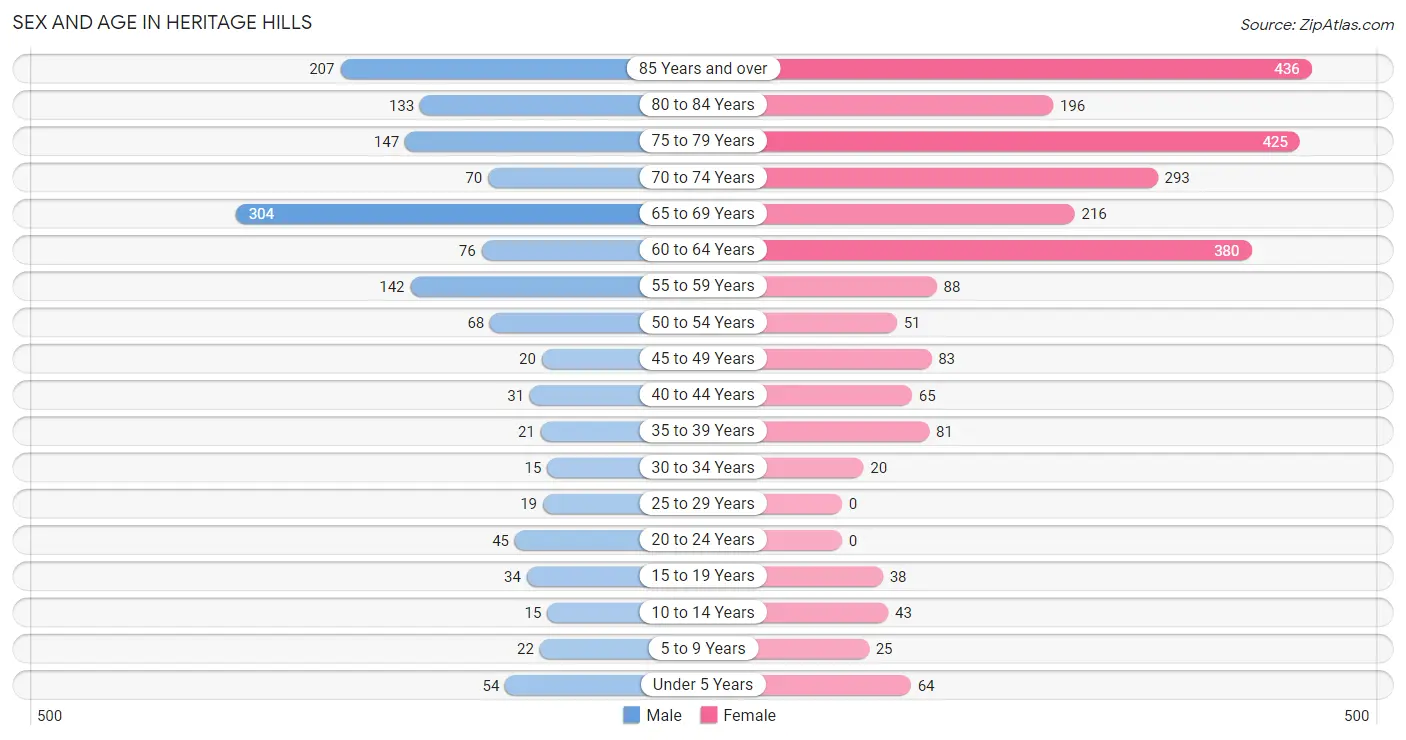
The most populous age groups in Heritage Hills are 65 to 69 Years (304 | 21.4%) for men and 85 Years and over (436 | 17.4%) for women.
| Age Bracket | Male | Female |
| Under 5 Years | 54 (3.8%) | 64 (2.6%) |
| 5 to 9 Years | 22 (1.5%) | 25 (1.0%) |
| 10 to 14 Years | 15 (1.1%) | 43 (1.7%) |
| 15 to 19 Years | 34 (2.4%) | 38 (1.5%) |
| 20 to 24 Years | 45 (3.2%) | 0 (0.0%) |
| 25 to 29 Years | 19 (1.3%) | 0 (0.0%) |
| 30 to 34 Years | 15 (1.1%) | 20 (0.8%) |
| 35 to 39 Years | 21 (1.5%) | 81 (3.2%) |
| 40 to 44 Years | 31 (2.2%) | 65 (2.6%) |
| 45 to 49 Years | 20 (1.4%) | 83 (3.3%) |
| 50 to 54 Years | 68 (4.8%) | 51 (2.0%) |
| 55 to 59 Years | 142 (10.0%) | 88 (3.5%) |
| 60 to 64 Years | 76 (5.3%) | 380 (15.2%) |
| 65 to 69 Years | 304 (21.4%) | 216 (8.6%) |
| 70 to 74 Years | 70 (4.9%) | 293 (11.7%) |
| 75 to 79 Years | 147 (10.3%) | 425 (17.0%) |
| 80 to 84 Years | 133 (9.3%) | 196 (7.8%) |
| 85 Years and over | 207 (14.5%) | 436 (17.4%) |
| Total | 1,423 (100.0%) | 2,504 (100.0%) |
Families and Households in Heritage Hills
Median Family Size in Heritage Hills
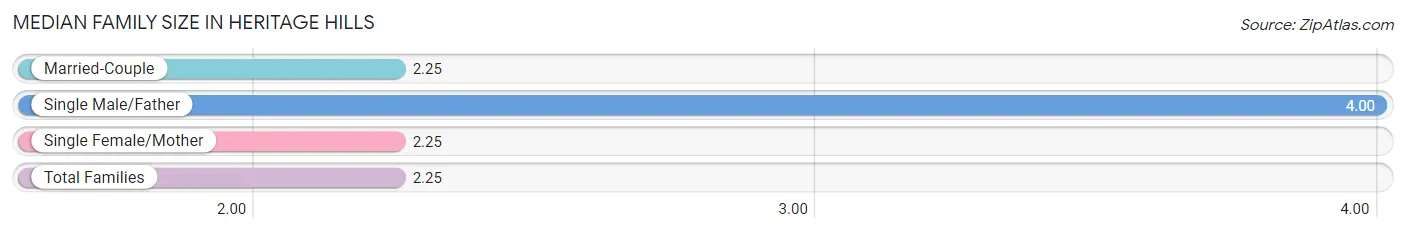
The median family size in Heritage Hills is 2.25 persons per family, with single male/father families (1 | 0.1%) accounting for the largest median family size of 4 persons per family. On the other hand, married-couple families (679 | 80.3%) represent the smallest median family size with 2.25 persons per family.
| Family Type | # Families | Family Size |
| Married-Couple | 679 (80.3%) | 2.25 |
| Single Male/Father | 1 (0.1%) | 4.00 |
| Single Female/Mother | 166 (19.6%) | 2.25 |
| Total Families | 846 (100.0%) | 2.25 |
Median Household Size in Heritage Hills
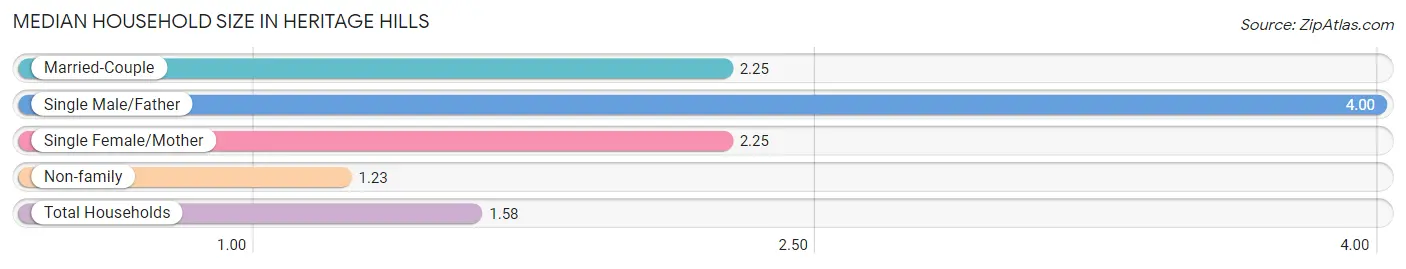
The median household size in Heritage Hills is 1.58 persons per household, with single male/father households (1 | 0.0%) accounting for the largest median household size of 4 persons per household. non-family households (1,587 | 65.2%) represent the smallest median household size with 1.23 persons per household.
| Household Type | # Households | Household Size |
| Married-Couple | 679 (27.9%) | 2.25 |
| Single Male/Father | 1 (0.0%) | 4.00 |
| Single Female/Mother | 166 (6.8%) | 2.25 |
| Non-family | 1,587 (65.2%) | 1.23 |
| Total Households | 2,433 (100.0%) | 1.58 |
Household Size by Marriage Status in Heritage Hills
Out of a total of 2,433 households in Heritage Hills, 846 (34.8%) are family households, while 1,587 (65.2%) are nonfamily households. The most numerous type of family households are 2-person households, comprising 669, and the most common type of nonfamily households are 1-person households, comprising 1,291.
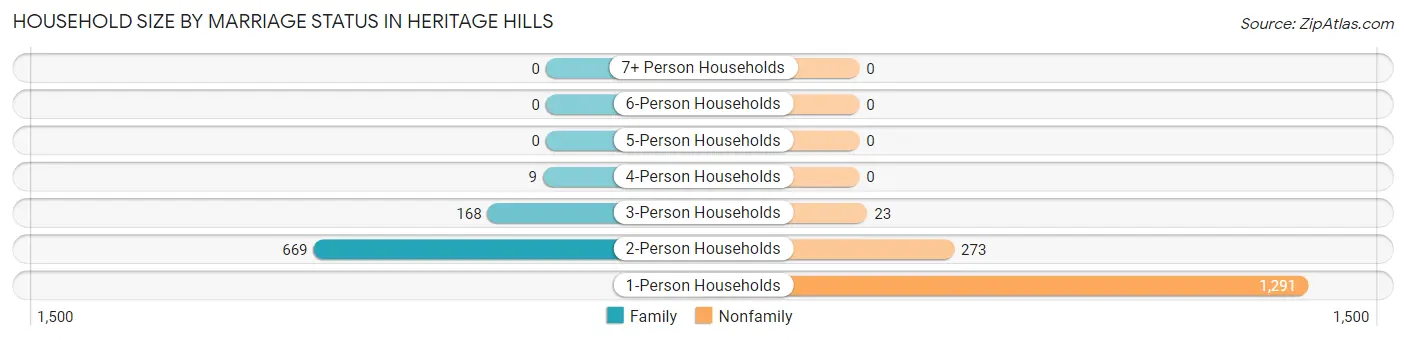
| Household Size | Family Households | Nonfamily Households |
| 1-Person Households | - | 1,291 (53.1%) |
| 2-Person Households | 669 (27.5%) | 273 (11.2%) |
| 3-Person Households | 168 (6.9%) | 23 (0.9%) |
| 4-Person Households | 9 (0.4%) | 0 (0.0%) |
| 5-Person Households | 0 (0.0%) | 0 (0.0%) |
| 6-Person Households | 0 (0.0%) | 0 (0.0%) |
| 7+ Person Households | 0 (0.0%) | 0 (0.0%) |
| Total | 846 (34.8%) | 1,587 (65.2%) |
Female Fertility in Heritage Hills
Fertility by Age in Heritage Hills
| Age Bracket | Women with Births | Births / 1,000 Women |
| 15 to 19 years | 0 (0.0%) | 0.0 |
| 20 to 34 years | 0 (0.0%) | 0.0 |
| 35 to 50 years | 0 (0.0%) | 0.0 |
| Total | 0 (0.0%) | 0.0 |
Fertility by Age by Marriage Status in Heritage Hills
| Age Bracket | Married | Unmarried |
| 15 to 19 years | 0 (0.0%) | 0 (0.0%) |
| 20 to 34 years | 0 (0.0%) | 0 (0.0%) |
| 35 to 50 years | 0 (0.0%) | 0 (0.0%) |
| Total | 0 (0.0%) | 0 (0.0%) |
Fertility by Education in Heritage Hills
| Educational Attainment | Women with Births | Births / 1,000 Women |
| Less than High School | 0 (0.0%) | 0.0 |
| High School Diploma | 0 (0.0%) | 0.0 |
| College or Associate's Degree | 0 (0.0%) | 0.0 |
| Bachelor's Degree | 0 (0.0%) | 0.0 |
| Graduate Degree | 0 (0.0%) | 0.0 |
| Total | 0 (0.0%) | 0.0 |
Fertility by Education by Marriage Status in Heritage Hills
| Educational Attainment | Married | Unmarried |
| Less than High School | 0 (0.0%) | 0 (0.0%) |
| High School Diploma | 0 (0.0%) | 0 (0.0%) |
| College or Associate's Degree | 0 (0.0%) | 0 (0.0%) |
| Bachelor's Degree | 0 (0.0%) | 0 (0.0%) |
| Graduate Degree | 0 (0.0%) | 0 (0.0%) |
| Total | 0 (0.0%) | 0 (0.0%) |
Employment Characteristics in Heritage Hills
Employment by Class of Employer in Heritage Hills
Among the 1,100 employed individuals in Heritage Hills, private company employees (605 | 55.0%), not-for-profit organizations (260 | 23.6%), and local government employees (101 | 9.2%) make up the most common classes of employment.
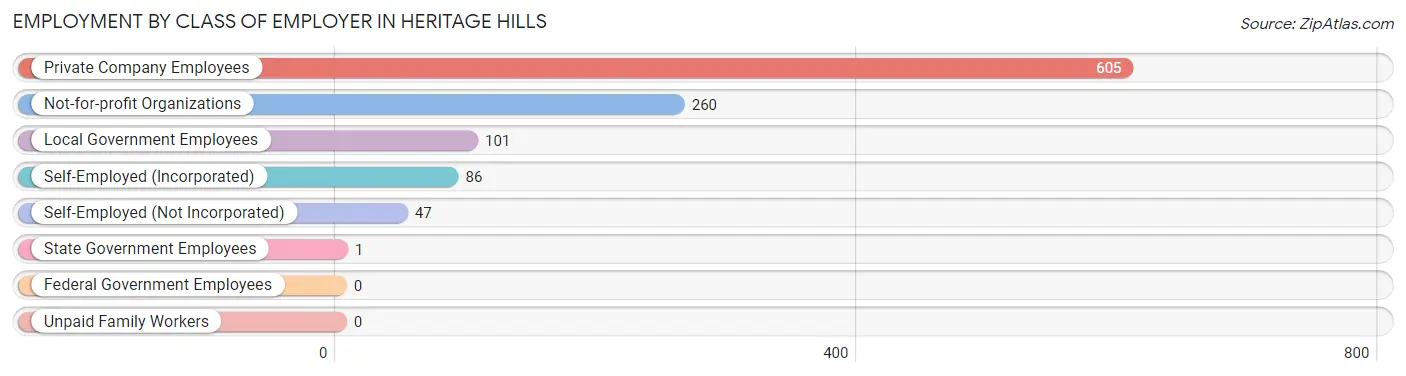
| Employer Class | # Employees | % Employees |
| Private Company Employees | 605 | 55.0% |
| Self-Employed (Incorporated) | 86 | 7.8% |
| Self-Employed (Not Incorporated) | 47 | 4.3% |
| Not-for-profit Organizations | 260 | 23.6% |
| Local Government Employees | 101 | 9.2% |
| State Government Employees | 1 | 0.1% |
| Federal Government Employees | 0 | 0.0% |
| Unpaid Family Workers | 0 | 0.0% |
| Total | 1,100 | 100.0% |
Employment Status by Age in Heritage Hills
According to the labor force statistics for Heritage Hills, out of the total population over 16 years of age (3,657), 33.9% or 1,240 individuals are in the labor force, with 11.4% or 141 of them unemployed. The age group with the highest labor force participation rate is 20 to 24 years, with 100.0% or 45 individuals in the labor force. Within the labor force, the 20 to 24 years age range has the highest percentage of unemployed individuals, with 100.0% or 45 of them being unemployed.
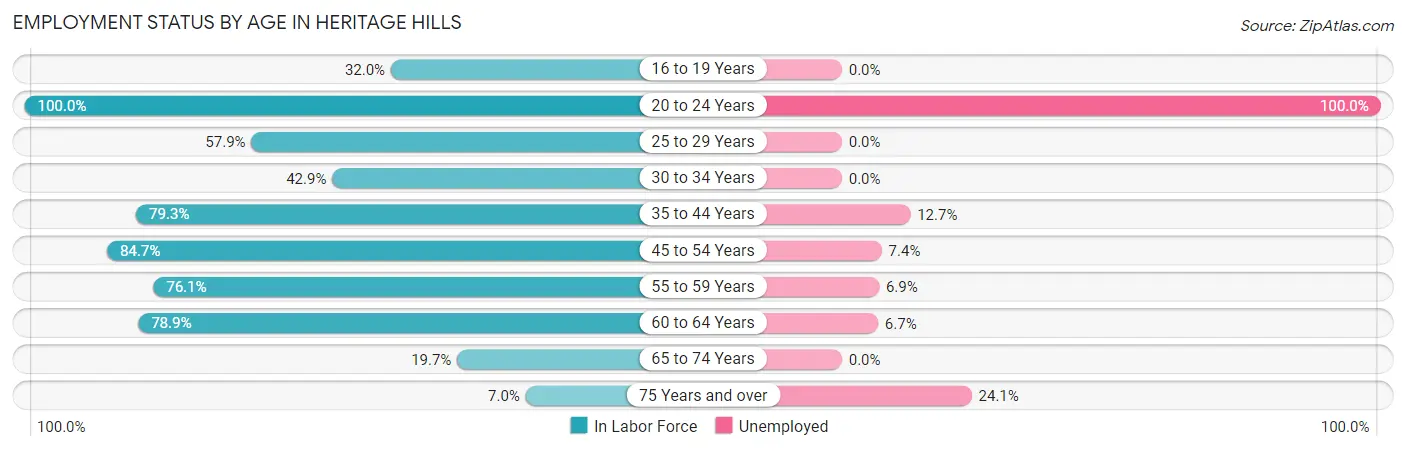
| Age Bracket | In Labor Force | Unemployed |
| 16 to 19 Years | 8 (32.0%) | 0 (0.0%) |
| 20 to 24 Years | 45 (100.0%) | 45 (100.0%) |
| 25 to 29 Years | 11 (57.9%) | 0 (0.0%) |
| 30 to 34 Years | 15 (42.9%) | 0 (0.0%) |
| 35 to 44 Years | 157 (79.3%) | 20 (12.7%) |
| 45 to 54 Years | 188 (84.7%) | 14 (7.4%) |
| 55 to 59 Years | 175 (76.1%) | 12 (6.9%) |
| 60 to 64 Years | 360 (78.9%) | 24 (6.7%) |
| 65 to 74 Years | 174 (19.7%) | 0 (0.0%) |
| 75 Years and over | 108 (7.0%) | 26 (24.1%) |
| Total | 1,240 (33.9%) | 141 (11.4%) |
Employment Status by Educational Attainment in Heritage Hills
According to labor force statistics for Heritage Hills, 78.1% of individuals (906) out of the total population between 25 and 64 years of age (1,160) are in the labor force, with 7.7% or 70 of them being unemployed. The group with the highest labor force participation rate are those with the educational attainment of bachelor's degree or higher, with 88.2% or 697 individuals in the labor force. Within the labor force, individuals with less than high school education have the highest percentage of unemployment, with 100.0% or 7 of them being unemployed.
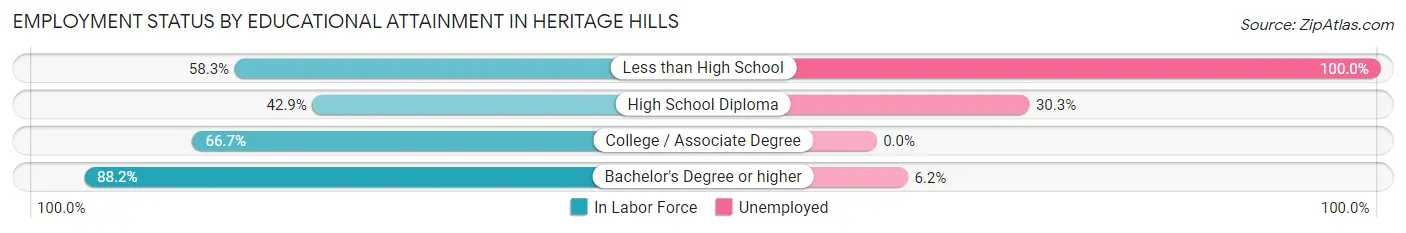
| Educational Attainment | In Labor Force | Unemployed |
| Less than High School | 7 (58.3%) | 12 (100.0%) |
| High School Diploma | 66 (42.9%) | 47 (30.3%) |
| College / Associate Degree | 136 (66.7%) | 0 (0.0%) |
| Bachelor's Degree or higher | 697 (88.2%) | 49 (6.2%) |
| Total | 906 (78.1%) | 89 (7.7%) |
Employment Occupations by Sex in Heritage Hills
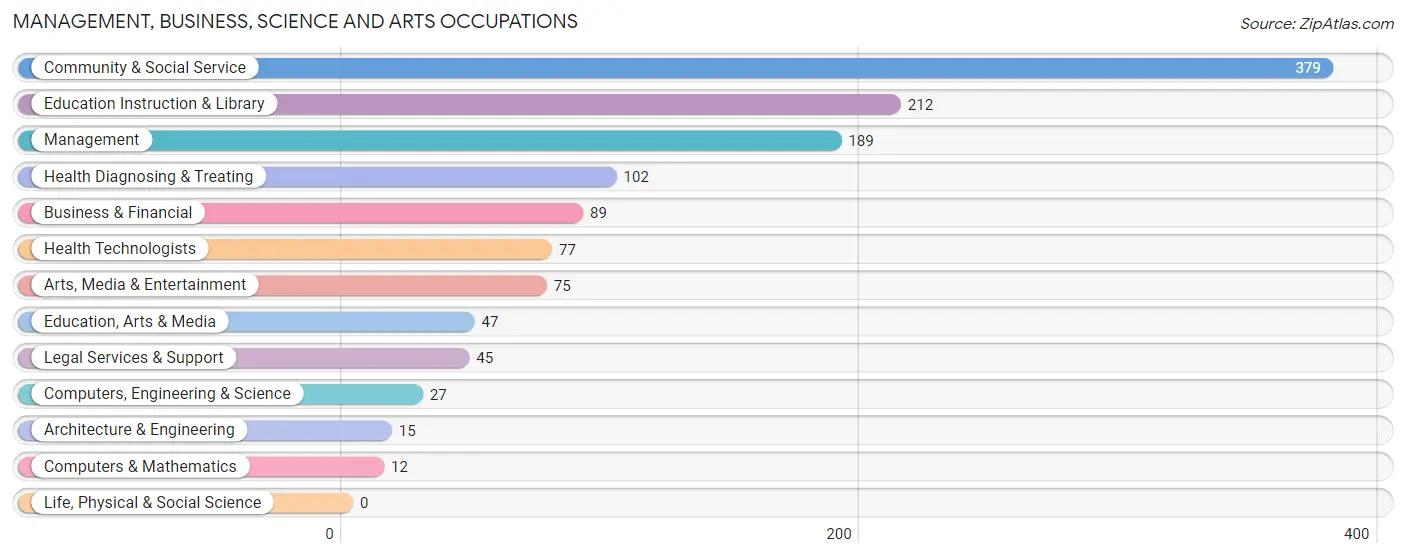
Management, Business, Science and Arts Occupations
The most common Management, Business, Science and Arts occupations in Heritage Hills are Community & Social Service (379 | 34.4%), Education Instruction & Library (212 | 19.3%), Management (189 | 17.2%), Health Diagnosing & Treating (102 | 9.3%), and Business & Financial (89 | 8.1%).
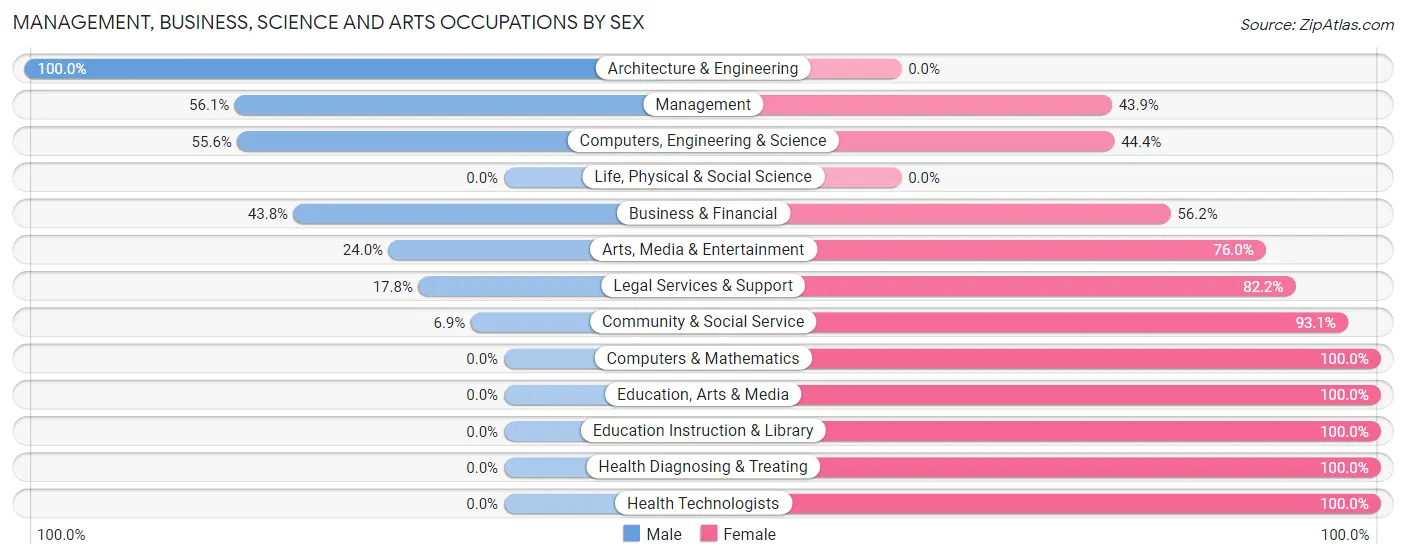
Management, Business, Science and Arts Occupations by Sex
Within the Management, Business, Science and Arts occupations in Heritage Hills, the most male-oriented occupations are Architecture & Engineering (100.0%), Management (56.1%), and Computers, Engineering & Science (55.6%), while the most female-oriented occupations are Computers & Mathematics (100.0%), Education, Arts & Media (100.0%), and Education Instruction & Library (100.0%).
| Occupation | Male | Female |
| Management | 106 (56.1%) | 83 (43.9%) |
| Business & Financial | 39 (43.8%) | 50 (56.2%) |
| Computers, Engineering & Science | 15 (55.6%) | 12 (44.4%) |
| Computers & Mathematics | 0 (0.0%) | 12 (100.0%) |
| Architecture & Engineering | 15 (100.0%) | 0 (0.0%) |
| Life, Physical & Social Science | 0 (0.0%) | 0 (0.0%) |
| Community & Social Service | 26 (6.9%) | 353 (93.1%) |
| Education, Arts & Media | 0 (0.0%) | 47 (100.0%) |
| Legal Services & Support | 8 (17.8%) | 37 (82.2%) |
| Education Instruction & Library | 0 (0.0%) | 212 (100.0%) |
| Arts, Media & Entertainment | 18 (24.0%) | 57 (76.0%) |
| Health Diagnosing & Treating | 0 (0.0%) | 102 (100.0%) |
| Health Technologists | 0 (0.0%) | 77 (100.0%) |
| Total (Category) | 186 (23.7%) | 600 (76.3%) |
| Total (Overall) | 330 (30.0%) | 770 (70.0%) |
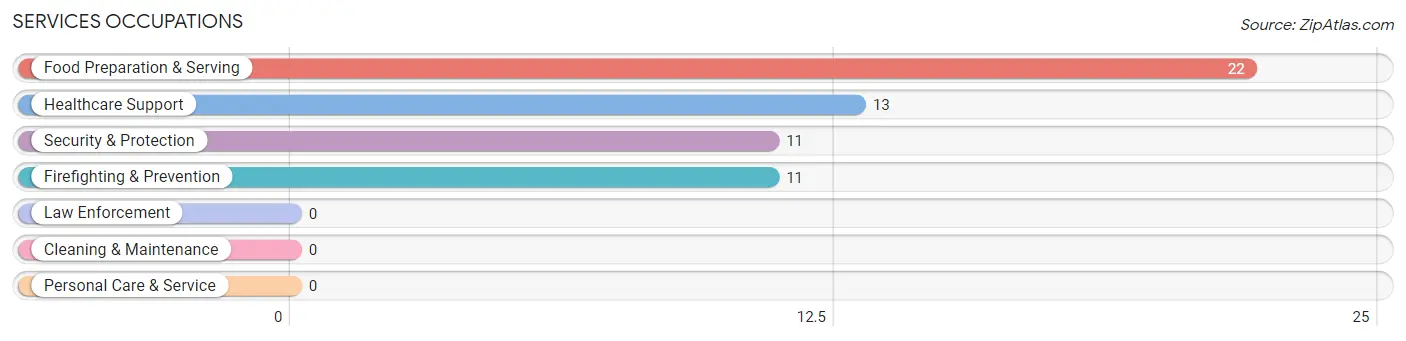
Services Occupations
The most common Services occupations in Heritage Hills are Food Preparation & Serving (22 | 2.0%), Healthcare Support (13 | 1.2%), Security & Protection (11 | 1.0%), and Firefighting & Prevention (11 | 1.0%).
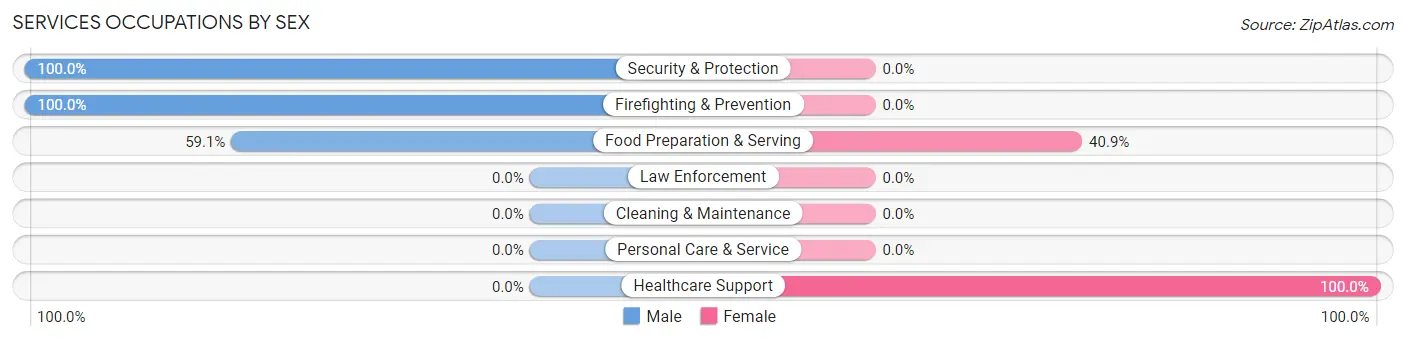
Services Occupations by Sex
Within the Services occupations in Heritage Hills, the most male-oriented occupations are Security & Protection (100.0%), Firefighting & Prevention (100.0%), and Food Preparation & Serving (59.1%), while the most female-oriented occupations are Healthcare Support (100.0%), and Food Preparation & Serving (40.9%).
| Occupation | Male | Female |
| Healthcare Support | 0 (0.0%) | 13 (100.0%) |
| Security & Protection | 11 (100.0%) | 0 (0.0%) |
| Firefighting & Prevention | 11 (100.0%) | 0 (0.0%) |
| Law Enforcement | 0 (0.0%) | 0 (0.0%) |
| Food Preparation & Serving | 13 (59.1%) | 9 (40.9%) |
| Cleaning & Maintenance | 0 (0.0%) | 0 (0.0%) |
| Personal Care & Service | 0 (0.0%) | 0 (0.0%) |
| Total (Category) | 24 (52.2%) | 22 (47.8%) |
| Total (Overall) | 330 (30.0%) | 770 (70.0%) |
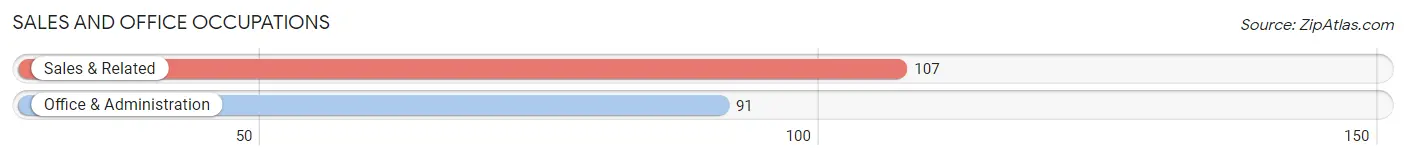
Sales and Office Occupations
The most common Sales and Office occupations in Heritage Hills are Sales & Related (107 | 9.7%), and Office & Administration (91 | 8.3%).
Sales and Office Occupations by Sex
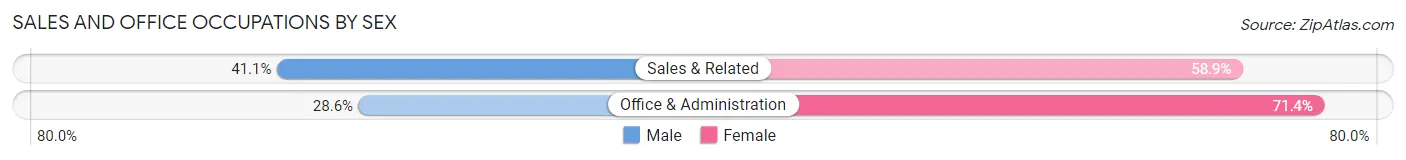
| Occupation | Male | Female |
| Sales & Related | 44 (41.1%) | 63 (58.9%) |
| Office & Administration | 26 (28.6%) | 65 (71.4%) |
| Total (Category) | 70 (35.3%) | 128 (64.6%) |
| Total (Overall) | 330 (30.0%) | 770 (70.0%) |
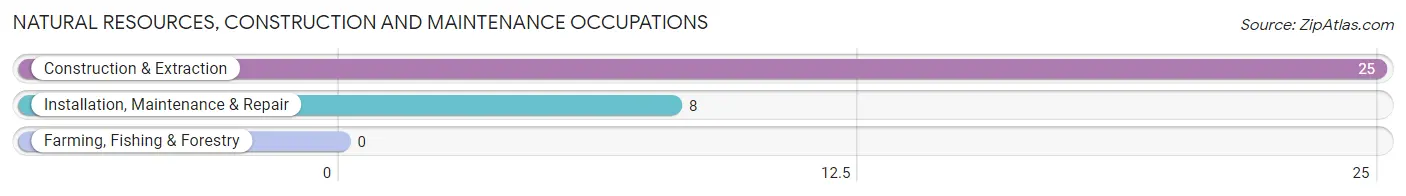
Natural Resources, Construction and Maintenance Occupations
The most common Natural Resources, Construction and Maintenance occupations in Heritage Hills are Construction & Extraction (25 | 2.3%), and Installation, Maintenance & Repair (8 | 0.7%).
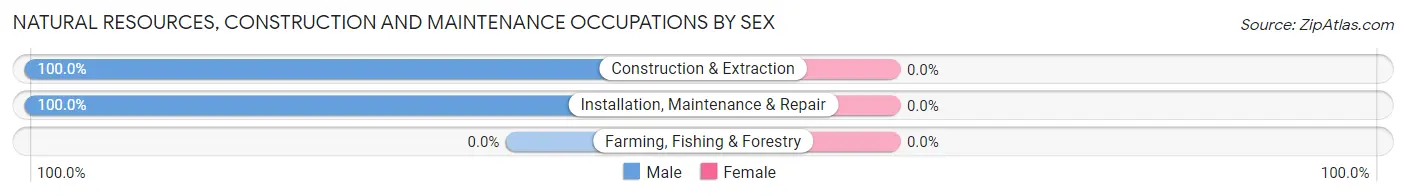
Natural Resources, Construction and Maintenance Occupations by Sex
| Occupation | Male | Female |
| Farming, Fishing & Forestry | 0 (0.0%) | 0 (0.0%) |
| Construction & Extraction | 25 (100.0%) | 0 (0.0%) |
| Installation, Maintenance & Repair | 8 (100.0%) | 0 (0.0%) |
| Total (Category) | 33 (100.0%) | 0 (0.0%) |
| Total (Overall) | 330 (30.0%) | 770 (70.0%) |
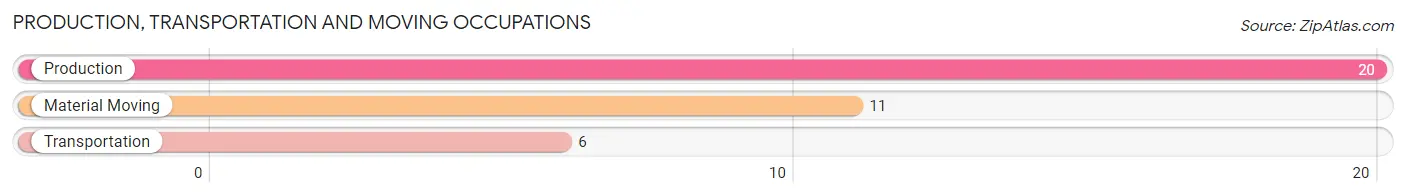
Production, Transportation and Moving Occupations
The most common Production, Transportation and Moving occupations in Heritage Hills are Production (20 | 1.8%), Material Moving (11 | 1.0%), and Transportation (6 | 0.5%).
Production, Transportation and Moving Occupations by Sex
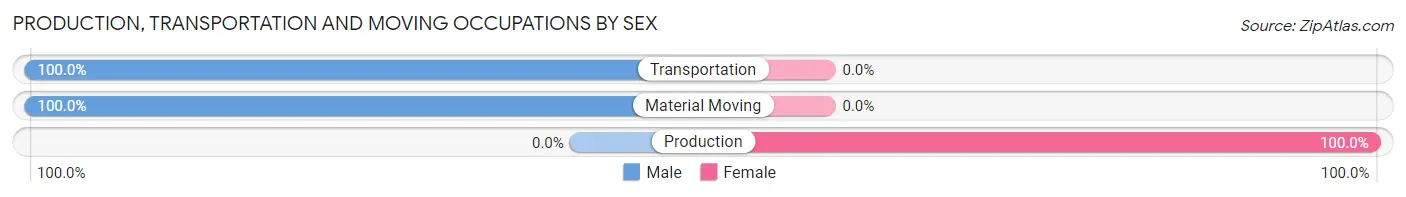
| Occupation | Male | Female |
| Production | 0 (0.0%) | 20 (100.0%) |
| Transportation | 6 (100.0%) | 0 (0.0%) |
| Material Moving | 11 (100.0%) | 0 (0.0%) |
| Total (Category) | 17 (46.0%) | 20 (54.0%) |
| Total (Overall) | 330 (30.0%) | 770 (70.0%) |
Employment Industries by Sex in Heritage Hills
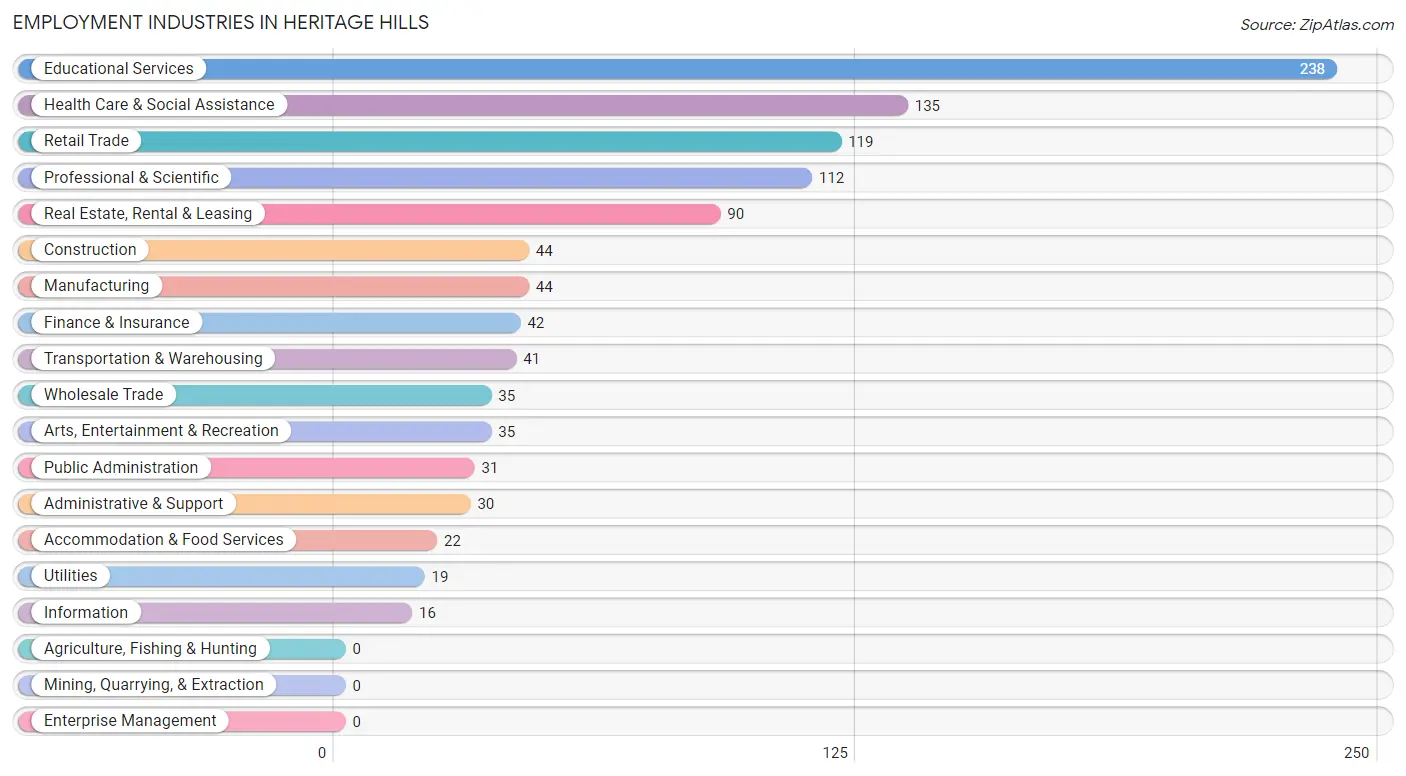
Employment Industries in Heritage Hills
The major employment industries in Heritage Hills include Educational Services (238 | 21.6%), Health Care & Social Assistance (135 | 12.3%), Retail Trade (119 | 10.8%), Professional & Scientific (112 | 10.2%), and Real Estate, Rental & Leasing (90 | 8.2%).
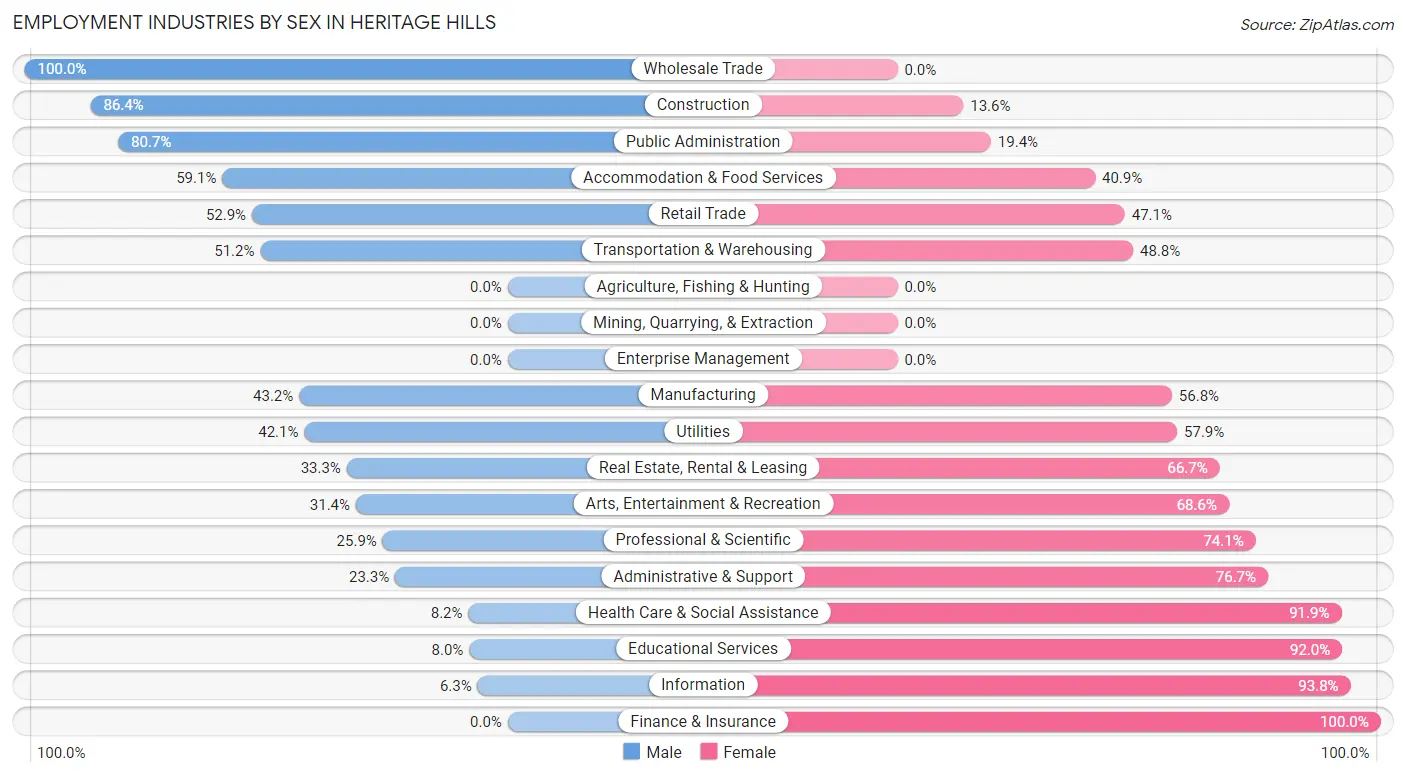
Employment Industries by Sex in Heritage Hills
The Heritage Hills industries that see more men than women are Wholesale Trade (100.0%), Construction (86.4%), and Public Administration (80.6%), whereas the industries that tend to have a higher number of women are Finance & Insurance (100.0%), Information (93.8%), and Educational Services (92.0%).
| Industry | Male | Female |
| Agriculture, Fishing & Hunting | 0 (0.0%) | 0 (0.0%) |
| Mining, Quarrying, & Extraction | 0 (0.0%) | 0 (0.0%) |
| Construction | 38 (86.4%) | 6 (13.6%) |
| Manufacturing | 19 (43.2%) | 25 (56.8%) |
| Wholesale Trade | 35 (100.0%) | 0 (0.0%) |
| Retail Trade | 63 (52.9%) | 56 (47.1%) |
| Transportation & Warehousing | 21 (51.2%) | 20 (48.8%) |
| Utilities | 8 (42.1%) | 11 (57.9%) |
| Information | 1 (6.2%) | 15 (93.8%) |
| Finance & Insurance | 0 (0.0%) | 42 (100.0%) |
| Real Estate, Rental & Leasing | 30 (33.3%) | 60 (66.7%) |
| Professional & Scientific | 29 (25.9%) | 83 (74.1%) |
| Enterprise Management | 0 (0.0%) | 0 (0.0%) |
| Administrative & Support | 7 (23.3%) | 23 (76.7%) |
| Educational Services | 19 (8.0%) | 219 (92.0%) |
| Health Care & Social Assistance | 11 (8.2%) | 124 (91.8%) |
| Arts, Entertainment & Recreation | 11 (31.4%) | 24 (68.6%) |
| Accommodation & Food Services | 13 (59.1%) | 9 (40.9%) |
| Public Administration | 25 (80.6%) | 6 (19.4%) |
| Total | 330 (30.0%) | 770 (70.0%) |
Education in Heritage Hills
School Enrollment in Heritage Hills
The most common levels of schooling among the 302 students in Heritage Hills are nursery / preschool (66 | 21.8%), high school (64 | 21.2%), and college / undergraduate (61 | 20.2%).
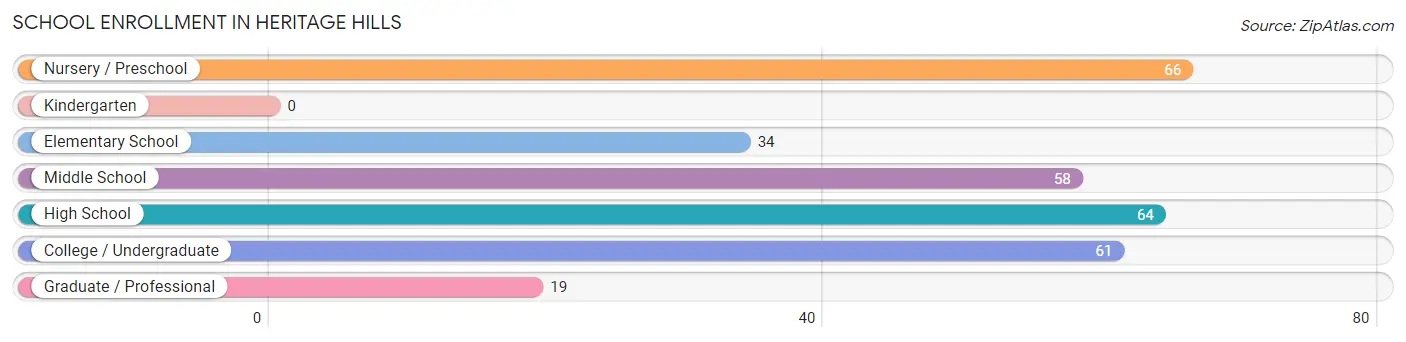
| School Level | # Students | % Students |
| Nursery / Preschool | 66 | 21.8% |
| Kindergarten | 0 | 0.0% |
| Elementary School | 34 | 11.3% |
| Middle School | 58 | 19.2% |
| High School | 64 | 21.2% |
| College / Undergraduate | 61 | 20.2% |
| Graduate / Professional | 19 | 6.3% |
| Total | 302 | 100.0% |
School Enrollment by Age by Funding Source in Heritage Hills
Out of a total of 302 students who are enrolled in schools in Heritage Hills, 60 (19.9%) attend a private institution, while the remaining 242 (80.1%) are enrolled in public schools. The age group of 18 to 19 year olds has the highest likelihood of being enrolled in private schools, with 8 (100.0% in the age bracket) enrolled. Conversely, the age group of 3 to 4 year olds has the lowest likelihood of being enrolled in a private school, with 54 (100.0% in the age bracket) attending a public institution.
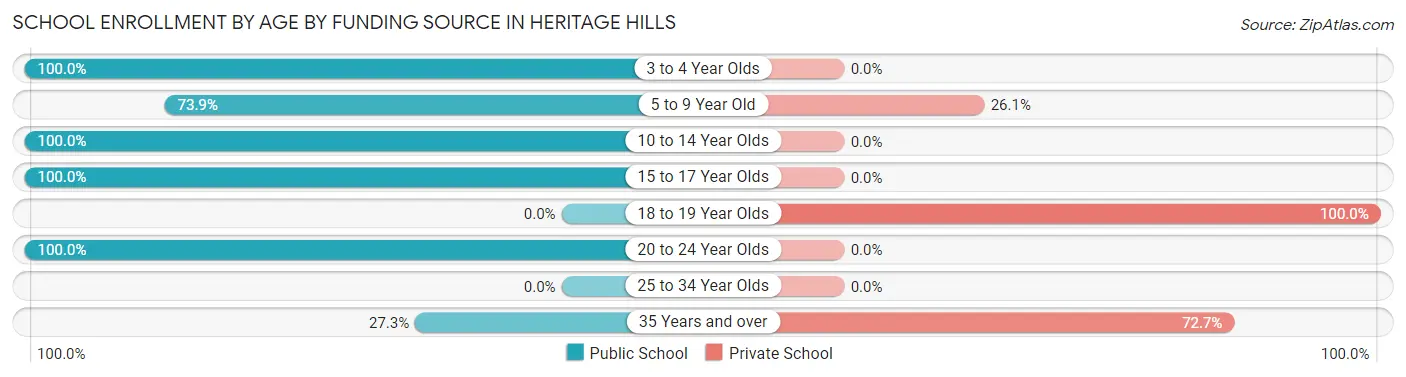
| Age Bracket | Public School | Private School |
| 3 to 4 Year Olds | 54 (100.0%) | 0 (0.0%) |
| 5 to 9 Year Old | 34 (73.9%) | 12 (26.1%) |
| 10 to 14 Year Olds | 58 (100.0%) | 0 (0.0%) |
| 15 to 17 Year Olds | 64 (100.0%) | 0 (0.0%) |
| 18 to 19 Year Olds | 0 (0.0%) | 8 (100.0%) |
| 20 to 24 Year Olds | 17 (100.0%) | 0 (0.0%) |
| 25 to 34 Year Olds | 0 (0.0%) | 0 (0.0%) |
| 35 Years and over | 15 (27.3%) | 40 (72.7%) |
| Total | 242 (80.1%) | 60 (19.9%) |
Educational Attainment by Field of Study in Heritage Hills
Education (518 | 21.6%), liberal arts & history (326 | 13.6%), business (316 | 13.2%), social sciences (229 | 9.6%), and bio, nature & agricultural (205 | 8.6%) are the most common fields of study among 2,396 individuals in Heritage Hills who have obtained a bachelor's degree or higher.
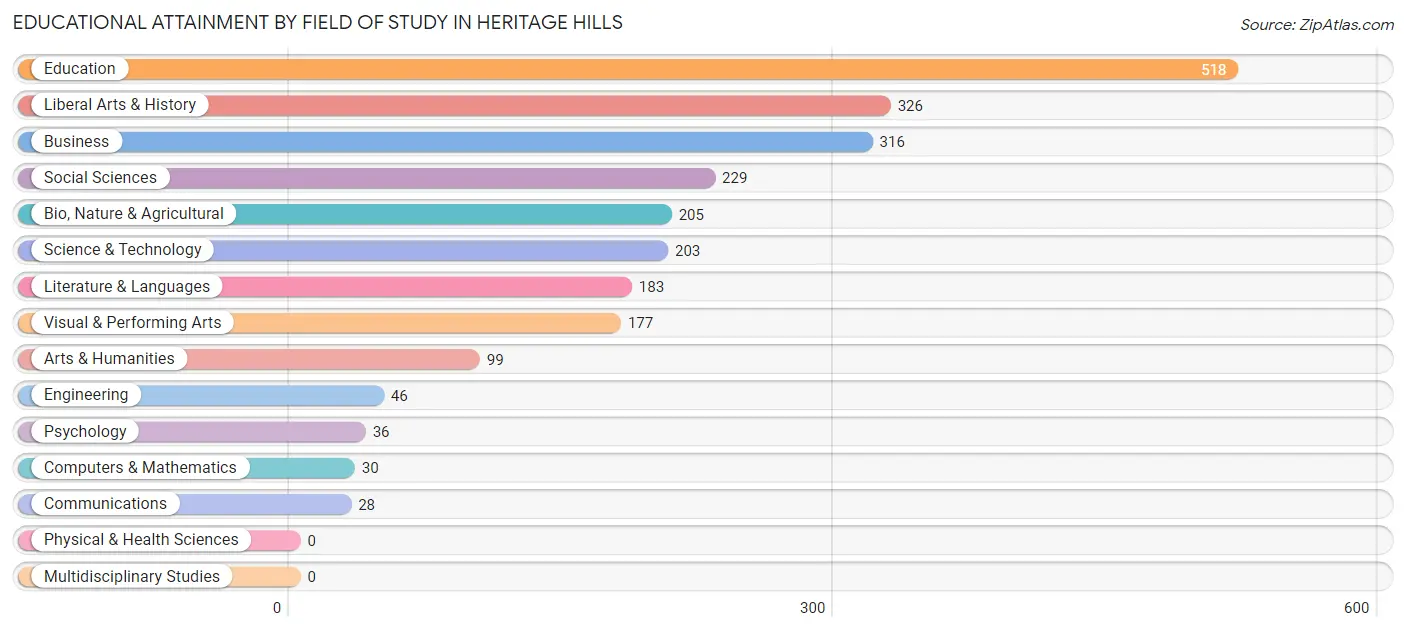
| Field of Study | # Graduates | % Graduates |
| Computers & Mathematics | 30 | 1.3% |
| Bio, Nature & Agricultural | 205 | 8.6% |
| Physical & Health Sciences | 0 | 0.0% |
| Psychology | 36 | 1.5% |
| Social Sciences | 229 | 9.6% |
| Engineering | 46 | 1.9% |
| Multidisciplinary Studies | 0 | 0.0% |
| Science & Technology | 203 | 8.5% |
| Business | 316 | 13.2% |
| Education | 518 | 21.6% |
| Literature & Languages | 183 | 7.6% |
| Liberal Arts & History | 326 | 13.6% |
| Visual & Performing Arts | 177 | 7.4% |
| Communications | 28 | 1.2% |
| Arts & Humanities | 99 | 4.1% |
| Total | 2,396 | 100.0% |
Transportation & Commute in Heritage Hills
Vehicle Availability by Sex in Heritage Hills
The most prevalent vehicle ownership categories in Heritage Hills are males with 2 vehicles (174, accounting for 52.7%) and females with 2 vehicles (470, making up 22.6%).
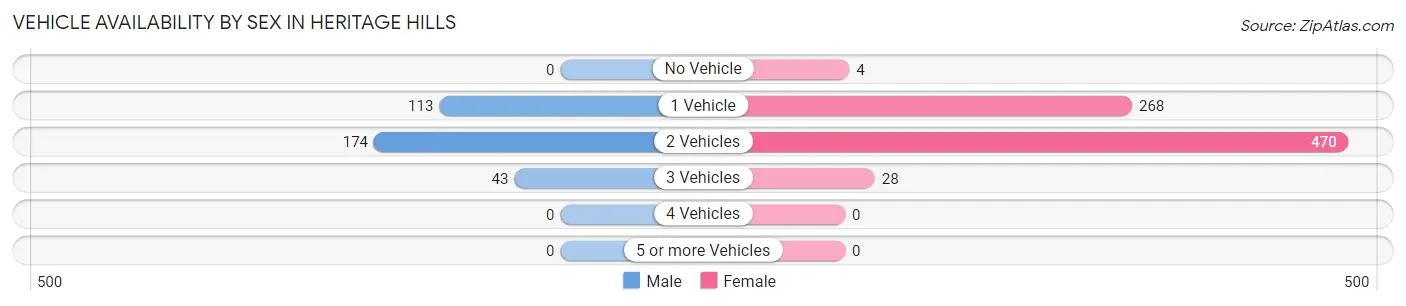
| Vehicles Available | Male | Female |
| No Vehicle | 0 (0.0%) | 4 (0.5%) |
| 1 Vehicle | 113 (34.2%) | 268 (34.8%) |
| 2 Vehicles | 174 (52.7%) | 470 (61.0%) |
| 3 Vehicles | 43 (13.0%) | 28 (3.6%) |
| 4 Vehicles | 0 (0.0%) | 0 (0.0%) |
| 5 or more Vehicles | 0 (0.0%) | 0 (0.0%) |
| Total | 330 (100.0%) | 770 (100.0%) |
Commute Time in Heritage Hills
The most frequently occuring commute durations in Heritage Hills are 90 or more minutes (190 commuters, 19.4%), 45 to 59 minutes (168 commuters, 17.1%), and 30 to 34 minutes (166 commuters, 16.9%).
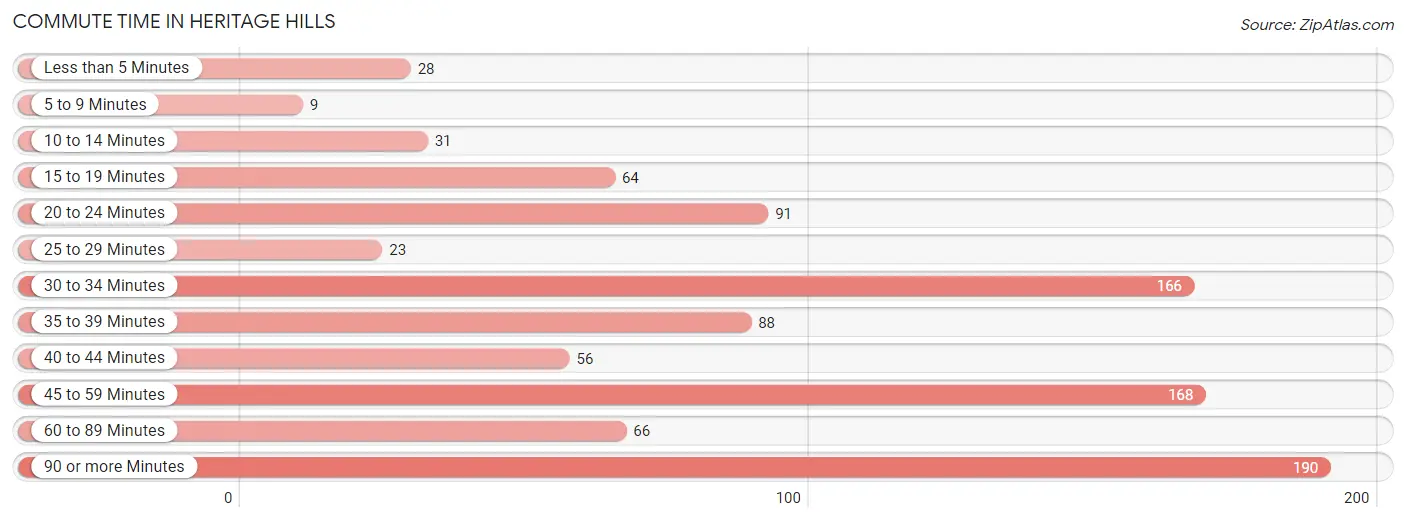
| Commute Time | # Commuters | % Commuters |
| Less than 5 Minutes | 28 | 2.9% |
| 5 to 9 Minutes | 9 | 0.9% |
| 10 to 14 Minutes | 31 | 3.2% |
| 15 to 19 Minutes | 64 | 6.5% |
| 20 to 24 Minutes | 91 | 9.3% |
| 25 to 29 Minutes | 23 | 2.4% |
| 30 to 34 Minutes | 166 | 16.9% |
| 35 to 39 Minutes | 88 | 9.0% |
| 40 to 44 Minutes | 56 | 5.7% |
| 45 to 59 Minutes | 168 | 17.1% |
| 60 to 89 Minutes | 66 | 6.7% |
| 90 or more Minutes | 190 | 19.4% |
Commute Time by Sex in Heritage Hills
The most common commute times in Heritage Hills are 30 to 34 minutes (57 commuters, 21.6%) for males and 90 or more minutes (161 commuters, 22.5%) for females.
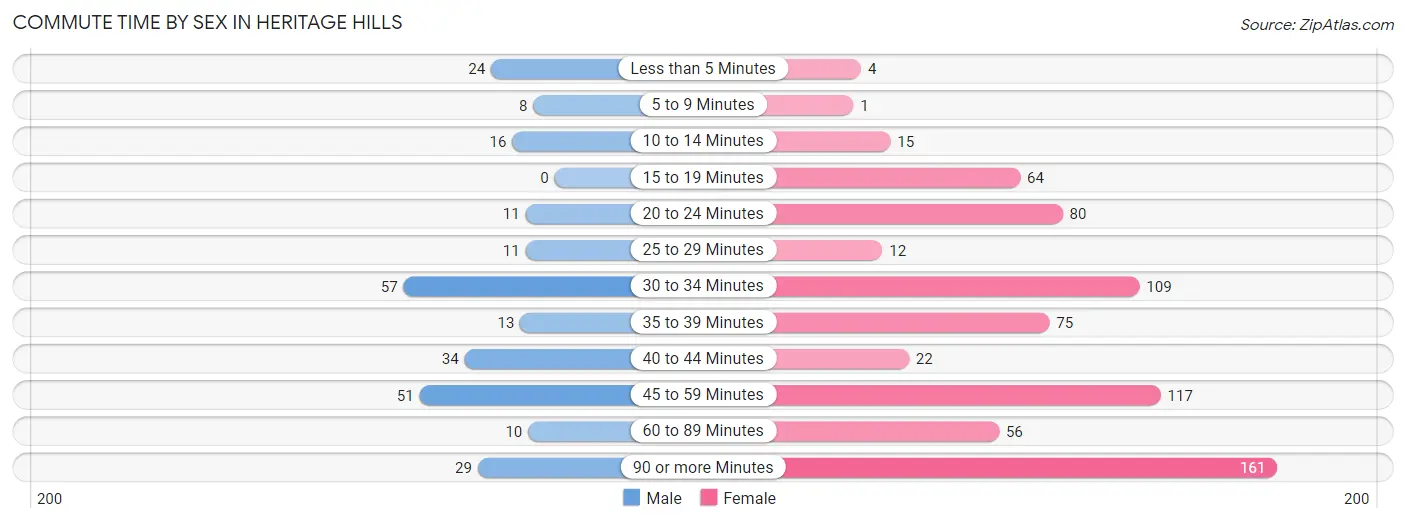
| Commute Time | Male | Female |
| Less than 5 Minutes | 24 (9.1%) | 4 (0.6%) |
| 5 to 9 Minutes | 8 (3.0%) | 1 (0.1%) |
| 10 to 14 Minutes | 16 (6.1%) | 15 (2.1%) |
| 15 to 19 Minutes | 0 (0.0%) | 64 (8.9%) |
| 20 to 24 Minutes | 11 (4.2%) | 80 (11.2%) |
| 25 to 29 Minutes | 11 (4.2%) | 12 (1.7%) |
| 30 to 34 Minutes | 57 (21.6%) | 109 (15.2%) |
| 35 to 39 Minutes | 13 (4.9%) | 75 (10.5%) |
| 40 to 44 Minutes | 34 (12.9%) | 22 (3.1%) |
| 45 to 59 Minutes | 51 (19.3%) | 117 (16.3%) |
| 60 to 89 Minutes | 10 (3.8%) | 56 (7.8%) |
| 90 or more Minutes | 29 (11.0%) | 161 (22.5%) |
Time of Departure to Work by Sex in Heritage Hills
The most frequent times of departure to work in Heritage Hills are 7:30 AM to 7:59 AM (55, 20.8%) for males and 7:00 AM to 7:29 AM (226, 31.6%) for females.
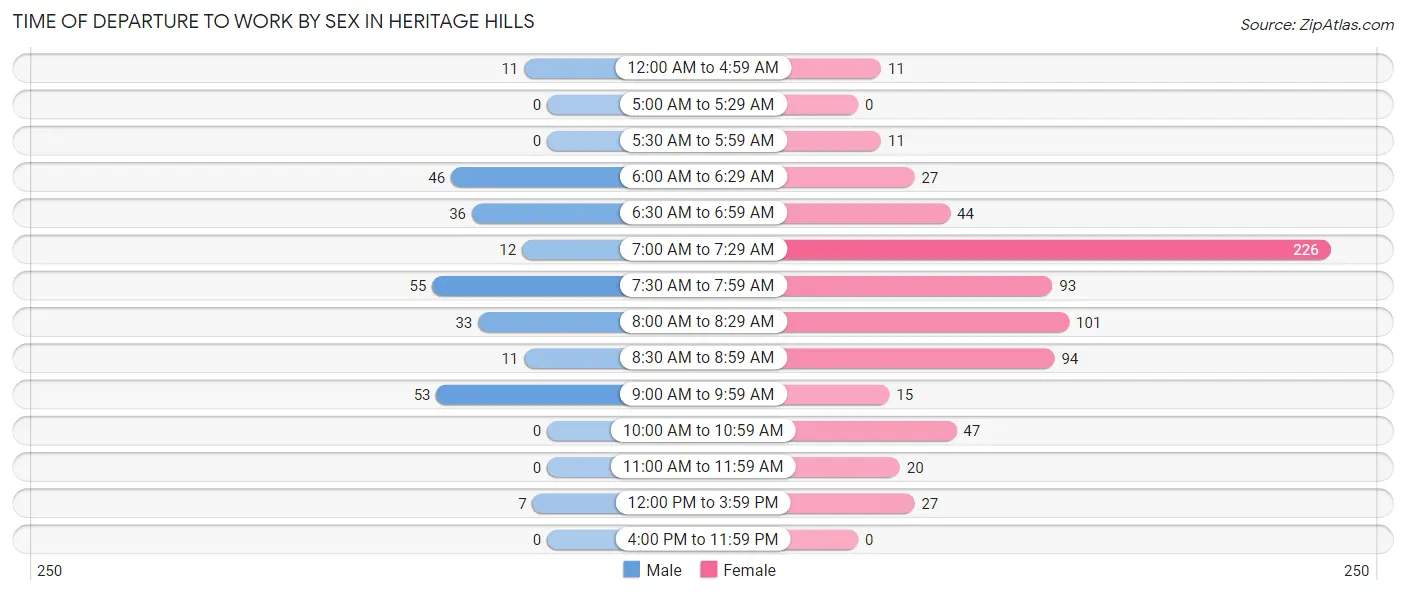
| Time of Departure | Male | Female |
| 12:00 AM to 4:59 AM | 11 (4.2%) | 11 (1.5%) |
| 5:00 AM to 5:29 AM | 0 (0.0%) | 0 (0.0%) |
| 5:30 AM to 5:59 AM | 0 (0.0%) | 11 (1.5%) |
| 6:00 AM to 6:29 AM | 46 (17.4%) | 27 (3.8%) |
| 6:30 AM to 6:59 AM | 36 (13.6%) | 44 (6.1%) |
| 7:00 AM to 7:29 AM | 12 (4.5%) | 226 (31.6%) |
| 7:30 AM to 7:59 AM | 55 (20.8%) | 93 (13.0%) |
| 8:00 AM to 8:29 AM | 33 (12.5%) | 101 (14.1%) |
| 8:30 AM to 8:59 AM | 11 (4.2%) | 94 (13.1%) |
| 9:00 AM to 9:59 AM | 53 (20.1%) | 15 (2.1%) |
| 10:00 AM to 10:59 AM | 0 (0.0%) | 47 (6.6%) |
| 11:00 AM to 11:59 AM | 0 (0.0%) | 20 (2.8%) |
| 12:00 PM to 3:59 PM | 7 (2.6%) | 27 (3.8%) |
| 4:00 PM to 11:59 PM | 0 (0.0%) | 0 (0.0%) |
| Total | 264 (100.0%) | 716 (100.0%) |
Housing Occupancy in Heritage Hills
Occupancy by Ownership in Heritage Hills
Of the total 2,433 dwellings in Heritage Hills, owner-occupied units account for 2,019 (83.0%), while renter-occupied units make up 414 (17.0%).
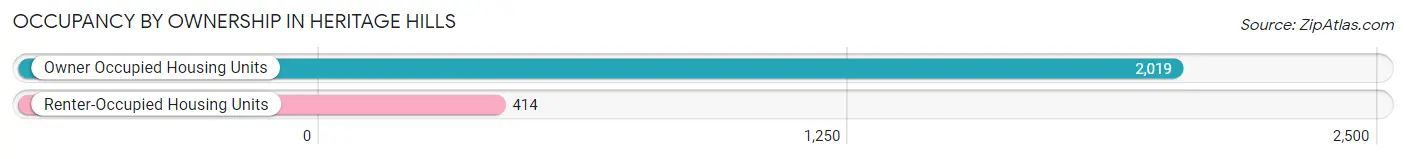
| Occupancy | # Housing Units | % Housing Units |
| Owner Occupied Housing Units | 2,019 | 83.0% |
| Renter-Occupied Housing Units | 414 | 17.0% |
| Total Occupied Housing Units | 2,433 | 100.0% |
Occupancy by Household Size in Heritage Hills
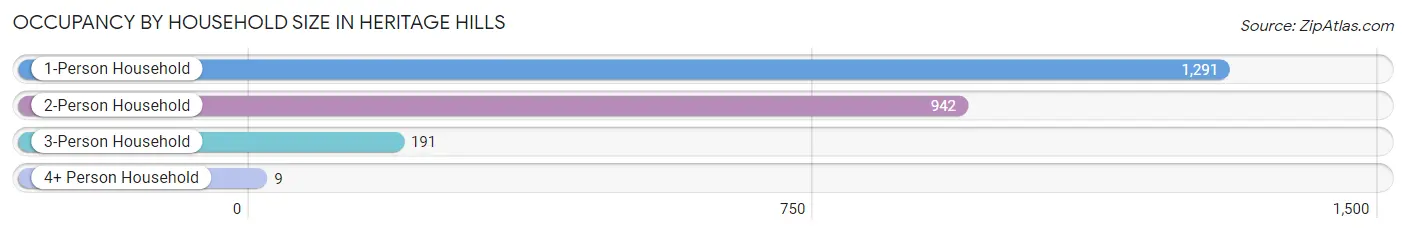
| Household Size | # Housing Units | % Housing Units |
| 1-Person Household | 1,291 | 53.1% |
| 2-Person Household | 942 | 38.7% |
| 3-Person Household | 191 | 7.9% |
| 4+ Person Household | 9 | 0.4% |
| Total Housing Units | 2,433 | 100.0% |
Occupancy by Ownership by Household Size in Heritage Hills
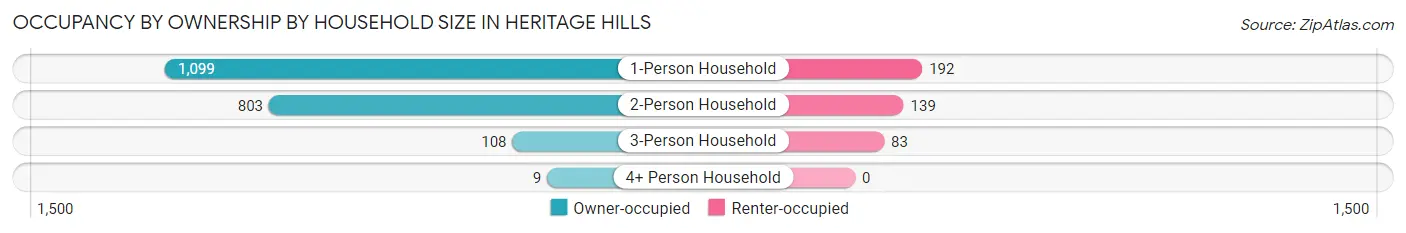
| Household Size | Owner-occupied | Renter-occupied |
| 1-Person Household | 1,099 (85.1%) | 192 (14.9%) |
| 2-Person Household | 803 (85.2%) | 139 (14.8%) |
| 3-Person Household | 108 (56.5%) | 83 (43.5%) |
| 4+ Person Household | 9 (100.0%) | 0 (0.0%) |
| Total Housing Units | 2,019 (83.0%) | 414 (17.0%) |
Occupancy by Educational Attainment in Heritage Hills
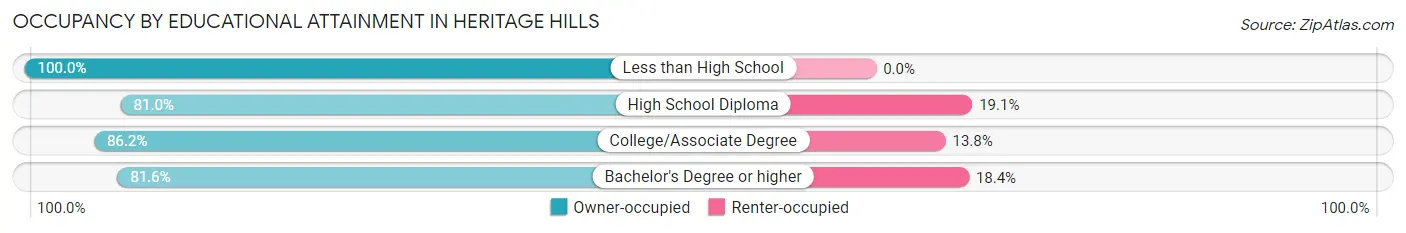
| Household Size | Owner-occupied | Renter-occupied |
| Less than High School | 30 (100.0%) | 0 (0.0%) |
| High School Diploma | 136 (80.9%) | 32 (19.1%) |
| College/Associate Degree | 539 (86.2%) | 86 (13.8%) |
| Bachelor's Degree or higher | 1,314 (81.6%) | 296 (18.4%) |
Occupancy by Age of Householder in Heritage Hills
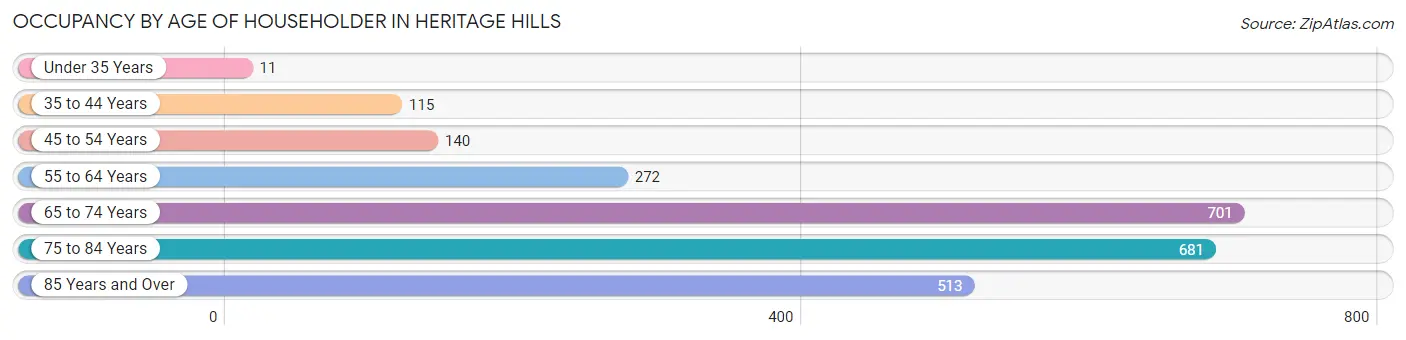
| Age Bracket | # Households | % Households |
| Under 35 Years | 11 | 0.4% |
| 35 to 44 Years | 115 | 4.7% |
| 45 to 54 Years | 140 | 5.8% |
| 55 to 64 Years | 272 | 11.2% |
| 65 to 74 Years | 701 | 28.8% |
| 75 to 84 Years | 681 | 28.0% |
| 85 Years and Over | 513 | 21.1% |
| Total | 2,433 | 100.0% |
Housing Finances in Heritage Hills
Median Income by Occupancy in Heritage Hills
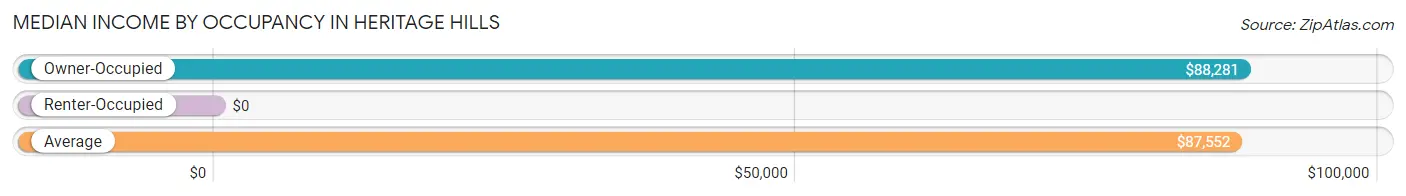
| Occupancy Type | # Households | Median Income |
| Owner-Occupied | 2,019 (83.0%) | $88,281 |
| Renter-Occupied | 414 (17.0%) | $0 |
| Average | 2,433 (100.0%) | $87,552 |
Occupancy by Householder Income Bracket in Heritage Hills
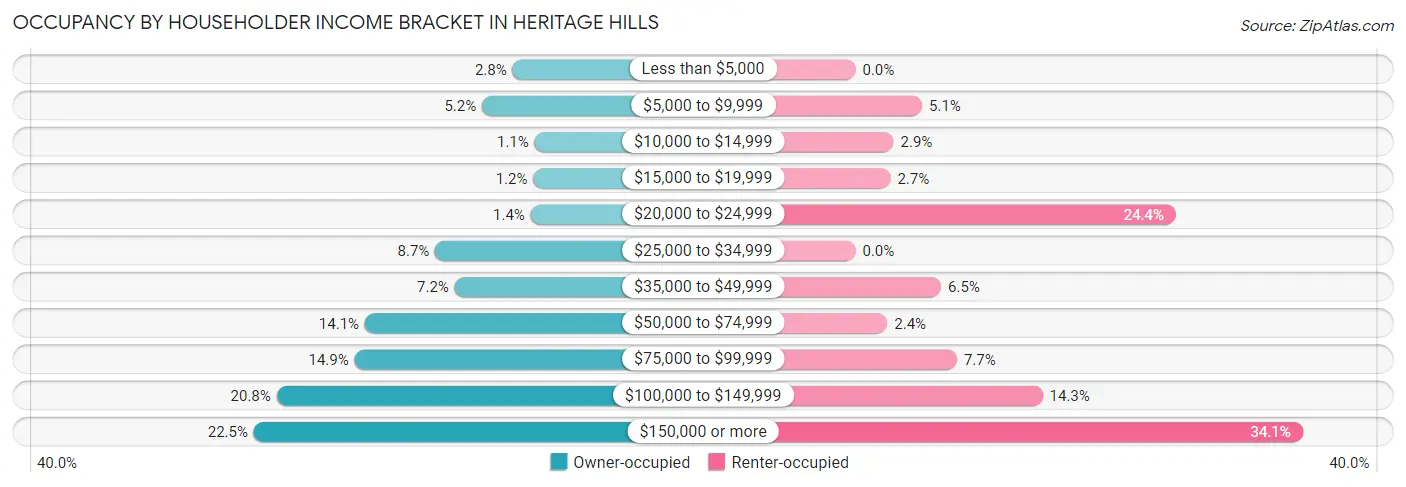
| Income Bracket | Owner-occupied | Renter-occupied |
| Less than $5,000 | 57 (2.8%) | 0 (0.0%) |
| $5,000 to $9,999 | 104 (5.1%) | 21 (5.1%) |
| $10,000 to $14,999 | 23 (1.1%) | 12 (2.9%) |
| $15,000 to $19,999 | 25 (1.2%) | 11 (2.7%) |
| $20,000 to $24,999 | 29 (1.4%) | 101 (24.4%) |
| $25,000 to $34,999 | 176 (8.7%) | 0 (0.0%) |
| $35,000 to $49,999 | 146 (7.2%) | 27 (6.5%) |
| $50,000 to $74,999 | 284 (14.1%) | 10 (2.4%) |
| $75,000 to $99,999 | 300 (14.9%) | 32 (7.7%) |
| $100,000 to $149,999 | 420 (20.8%) | 59 (14.2%) |
| $150,000 or more | 455 (22.5%) | 141 (34.1%) |
| Total | 2,019 (100.0%) | 414 (100.0%) |
Monthly Housing Cost Tiers in Heritage Hills
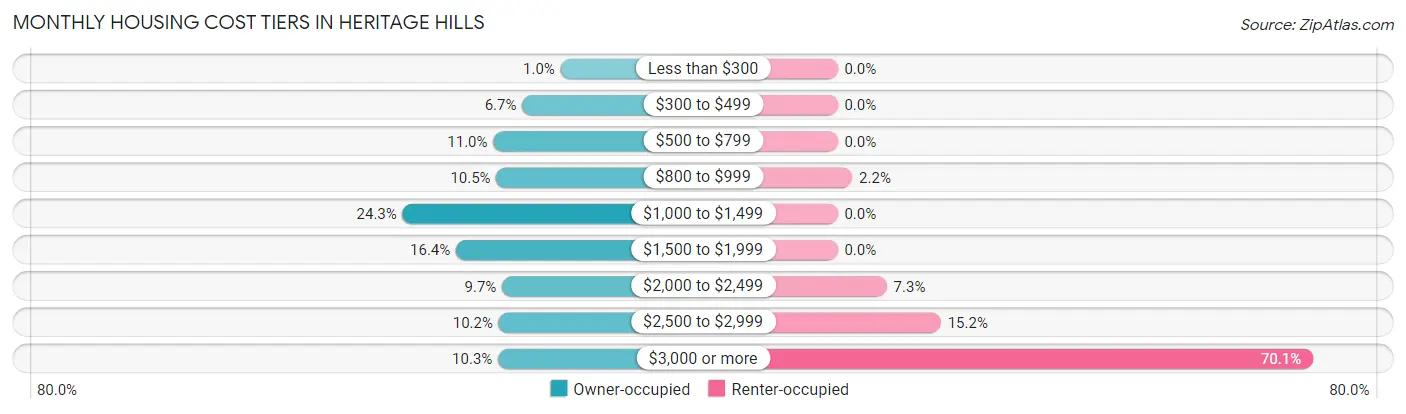
| Monthly Cost | Owner-occupied | Renter-occupied |
| Less than $300 | 21 (1.0%) | 0 (0.0%) |
| $300 to $499 | 135 (6.7%) | 0 (0.0%) |
| $500 to $799 | 221 (11.0%) | 0 (0.0%) |
| $800 to $999 | 212 (10.5%) | 9 (2.2%) |
| $1,000 to $1,499 | 491 (24.3%) | 0 (0.0%) |
| $1,500 to $1,999 | 332 (16.4%) | 0 (0.0%) |
| $2,000 to $2,499 | 195 (9.7%) | 30 (7.2%) |
| $2,500 to $2,999 | 205 (10.2%) | 63 (15.2%) |
| $3,000 or more | 207 (10.2%) | 290 (70.1%) |
| Total | 2,019 (100.0%) | 414 (100.0%) |
Physical Housing Characteristics in Heritage Hills
Housing Structures in Heritage Hills
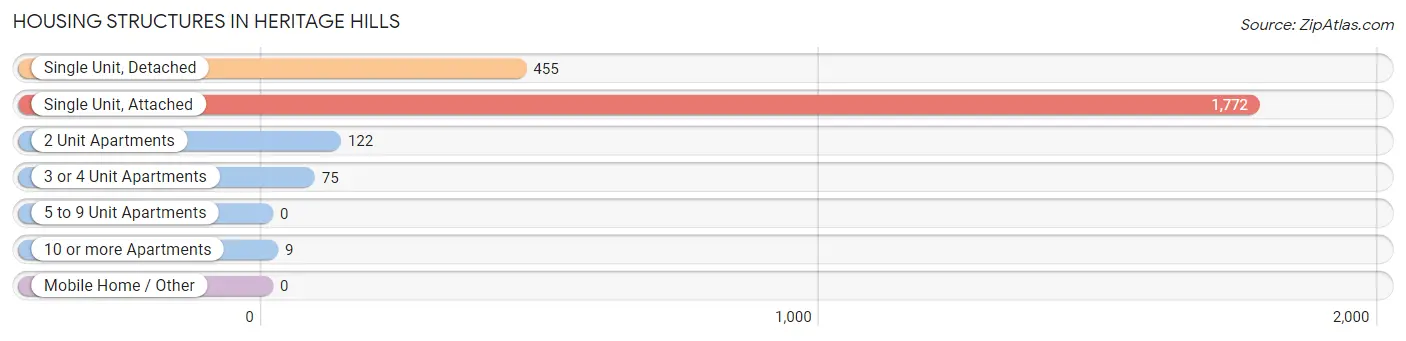
| Structure Type | # Housing Units | % Housing Units |
| Single Unit, Detached | 455 | 18.7% |
| Single Unit, Attached | 1,772 | 72.8% |
| 2 Unit Apartments | 122 | 5.0% |
| 3 or 4 Unit Apartments | 75 | 3.1% |
| 5 to 9 Unit Apartments | 0 | 0.0% |
| 10 or more Apartments | 9 | 0.4% |
| Mobile Home / Other | 0 | 0.0% |
| Total | 2,433 | 100.0% |
Housing Structures by Occupancy in Heritage Hills
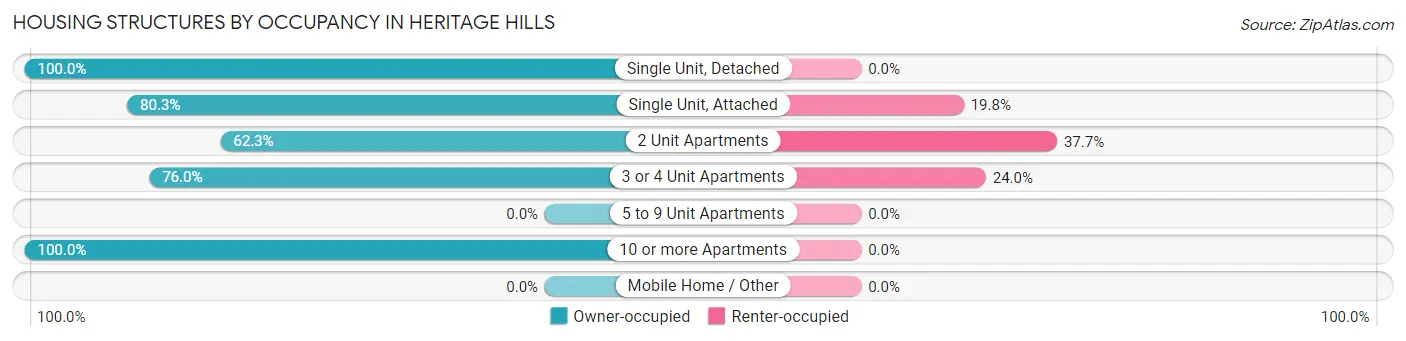
| Structure Type | Owner-occupied | Renter-occupied |
| Single Unit, Detached | 455 (100.0%) | 0 (0.0%) |
| Single Unit, Attached | 1,422 (80.2%) | 350 (19.8%) |
| 2 Unit Apartments | 76 (62.3%) | 46 (37.7%) |
| 3 or 4 Unit Apartments | 57 (76.0%) | 18 (24.0%) |
| 5 to 9 Unit Apartments | 0 (0.0%) | 0 (0.0%) |
| 10 or more Apartments | 9 (100.0%) | 0 (0.0%) |
| Mobile Home / Other | 0 (0.0%) | 0 (0.0%) |
| Total | 2,019 (83.0%) | 414 (17.0%) |
Housing Structures by Number of Rooms in Heritage Hills
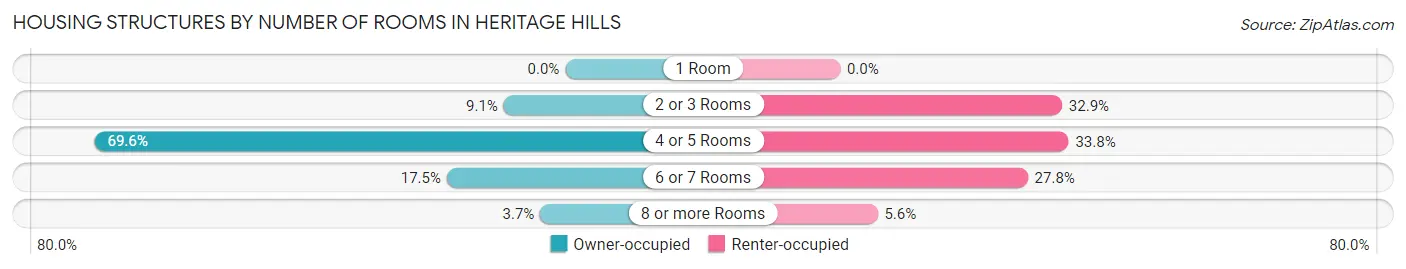
| Number of Rooms | Owner-occupied | Renter-occupied |
| 1 Room | 0 (0.0%) | 0 (0.0%) |
| 2 or 3 Rooms | 184 (9.1%) | 136 (32.9%) |
| 4 or 5 Rooms | 1,406 (69.6%) | 140 (33.8%) |
| 6 or 7 Rooms | 354 (17.5%) | 115 (27.8%) |
| 8 or more Rooms | 75 (3.7%) | 23 (5.6%) |
| Total | 2,019 (100.0%) | 414 (100.0%) |
Housing Structure by Heating Type in Heritage Hills
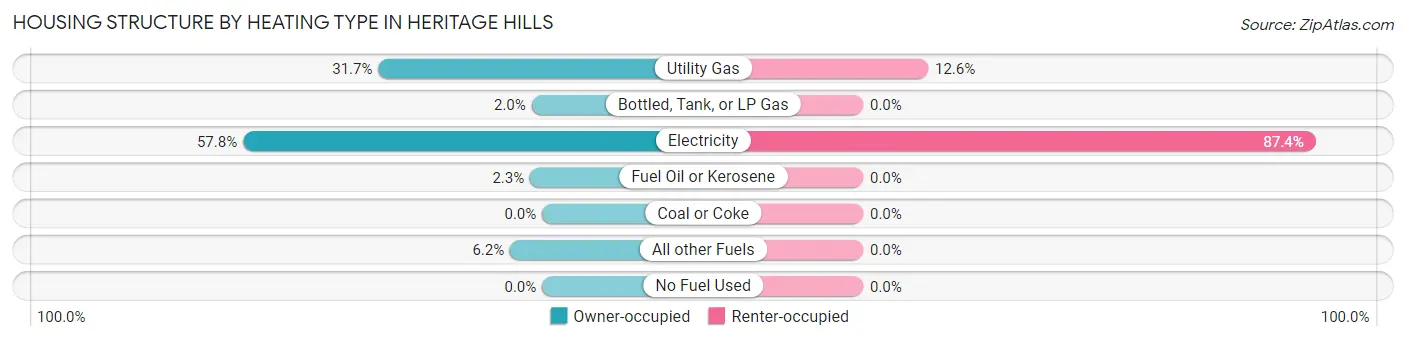
| Heating Type | Owner-occupied | Renter-occupied |
| Utility Gas | 639 (31.7%) | 52 (12.6%) |
| Bottled, Tank, or LP Gas | 41 (2.0%) | 0 (0.0%) |
| Electricity | 1,167 (57.8%) | 362 (87.4%) |
| Fuel Oil or Kerosene | 47 (2.3%) | 0 (0.0%) |
| Coal or Coke | 0 (0.0%) | 0 (0.0%) |
| All other Fuels | 125 (6.2%) | 0 (0.0%) |
| No Fuel Used | 0 (0.0%) | 0 (0.0%) |
| Total | 2,019 (100.0%) | 414 (100.0%) |
Household Vehicle Usage in Heritage Hills
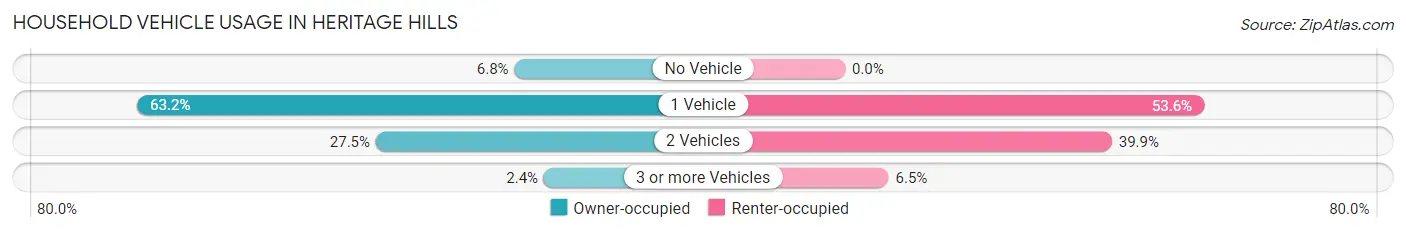
| Vehicles per Household | Owner-occupied | Renter-occupied |
| No Vehicle | 138 (6.8%) | 0 (0.0%) |
| 1 Vehicle | 1,276 (63.2%) | 222 (53.6%) |
| 2 Vehicles | 556 (27.5%) | 165 (39.9%) |
| 3 or more Vehicles | 49 (2.4%) | 27 (6.5%) |
| Total | 2,019 (100.0%) | 414 (100.0%) |
Real Estate & Mortgages in Heritage Hills
Real Estate and Mortgage Overview in Heritage Hills
| Characteristic | Without Mortgage | With Mortgage |
| Housing Units | 1,156 | 863 |
| Median Property Value | $425,900 | $431,500 |
| Median Household Income | $84,141 | $237 |
| Monthly Housing Costs | $1,060 | $177 |
| Real Estate Taxes | $3,340 | $53 |
Property Value by Mortgage Status in Heritage Hills
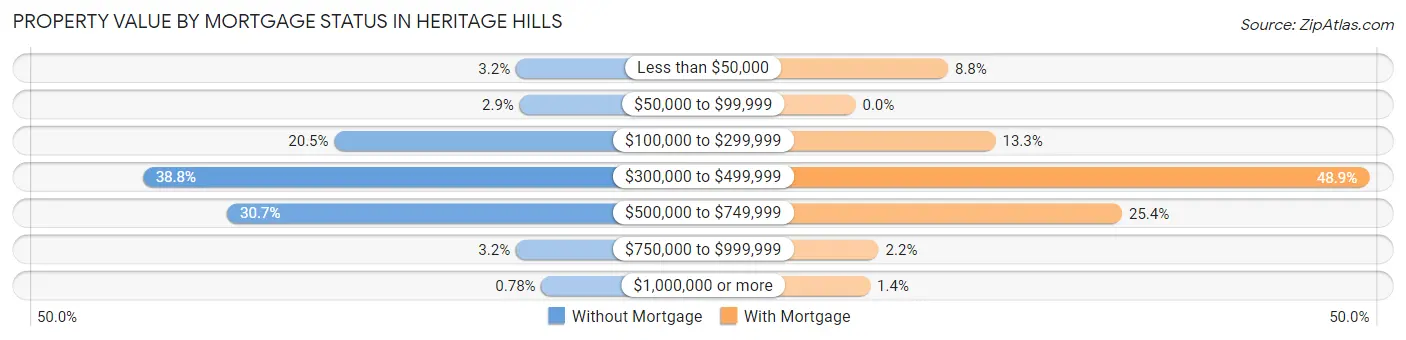
| Property Value | Without Mortgage | With Mortgage |
| Less than $50,000 | 37 (3.2%) | 76 (8.8%) |
| $50,000 to $99,999 | 33 (2.9%) | 0 (0.0%) |
| $100,000 to $299,999 | 237 (20.5%) | 115 (13.3%) |
| $300,000 to $499,999 | 448 (38.8%) | 422 (48.9%) |
| $500,000 to $749,999 | 355 (30.7%) | 219 (25.4%) |
| $750,000 to $999,999 | 37 (3.2%) | 19 (2.2%) |
| $1,000,000 or more | 9 (0.8%) | 12 (1.4%) |
| Total | 1,156 (100.0%) | 863 (100.0%) |
Household Income by Mortgage Status in Heritage Hills
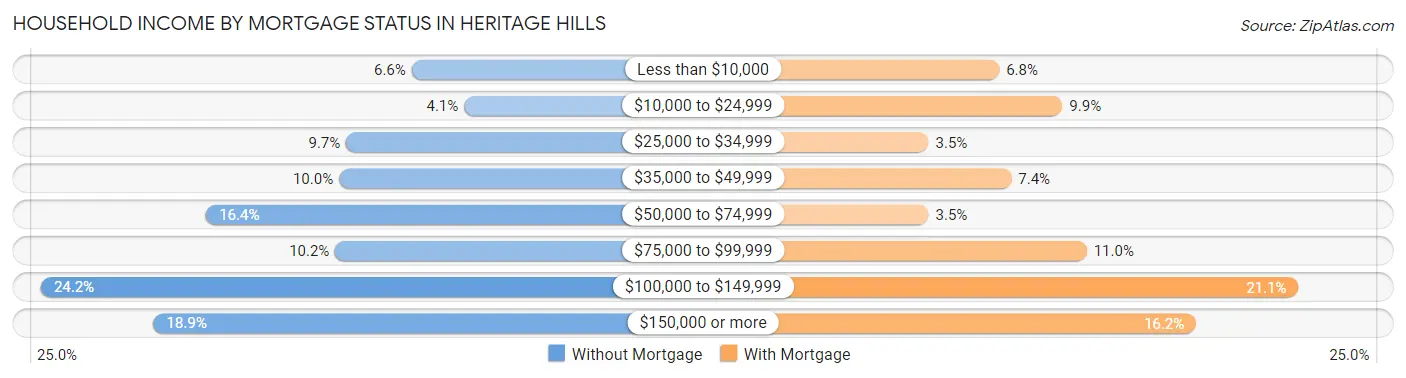
| Household Income | Without Mortgage | With Mortgage |
| Less than $10,000 | 76 (6.6%) | 59 (6.8%) |
| $10,000 to $24,999 | 47 (4.1%) | 85 (9.9%) |
| $25,000 to $34,999 | 112 (9.7%) | 30 (3.5%) |
| $35,000 to $49,999 | 116 (10.0%) | 64 (7.4%) |
| $50,000 to $74,999 | 189 (16.4%) | 30 (3.5%) |
| $75,000 to $99,999 | 118 (10.2%) | 95 (11.0%) |
| $100,000 to $149,999 | 280 (24.2%) | 182 (21.1%) |
| $150,000 or more | 218 (18.9%) | 140 (16.2%) |
| Total | 1,156 (100.0%) | 863 (100.0%) |
Property Value to Household Income Ratio in Heritage Hills
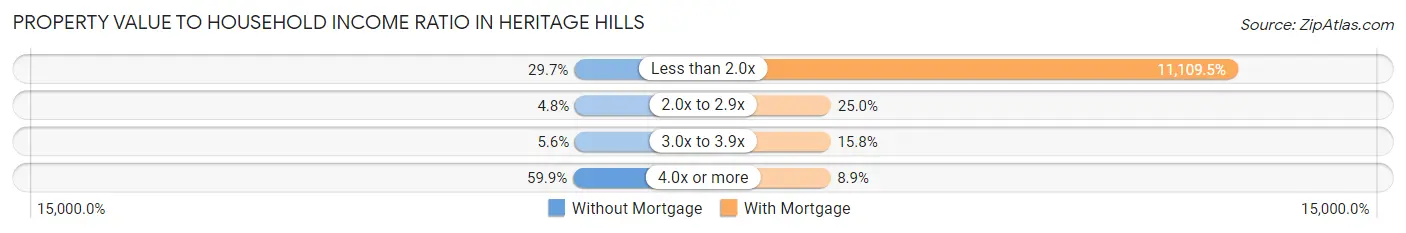
| Value-to-Income Ratio | Without Mortgage | With Mortgage |
| Less than 2.0x | 343 (29.7%) | 95,875 (11,109.5%) |
| 2.0x to 2.9x | 56 (4.8%) | 216 (25.0%) |
| 3.0x to 3.9x | 65 (5.6%) | 136 (15.8%) |
| 4.0x or more | 692 (59.9%) | 77 (8.9%) |
| Total | 1,156 (100.0%) | 863 (100.0%) |
Real Estate Taxes by Mortgage Status in Heritage Hills
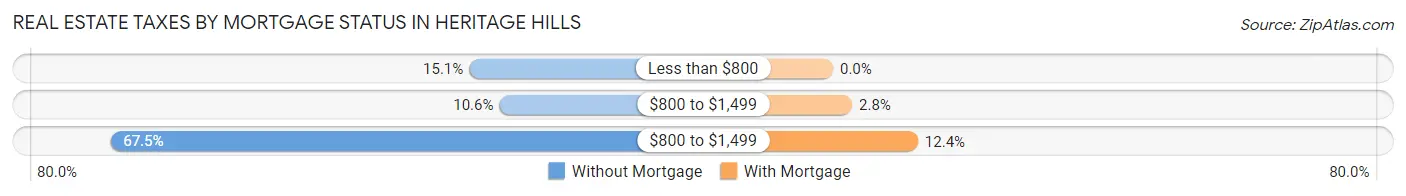
| Property Taxes | Without Mortgage | With Mortgage |
| Less than $800 | 174 (15.0%) | 0 (0.0%) |
| $800 to $1,499 | 123 (10.6%) | 24 (2.8%) |
| $800 to $1,499 | 780 (67.5%) | 107 (12.4%) |
| Total | 1,156 (100.0%) | 863 (100.0%) |
Health & Disability in Heritage Hills
Health Insurance Coverage by Age in Heritage Hills
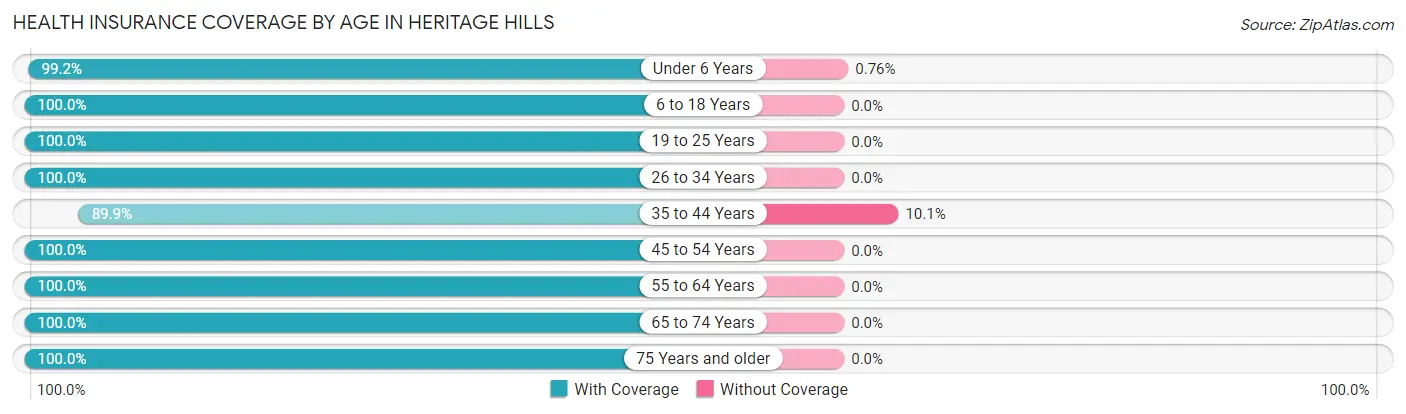
| Age Bracket | With Coverage | Without Coverage |
| Under 6 Years | 130 (99.2%) | 1 (0.8%) |
| 6 to 18 Years | 156 (100.0%) | 0 (0.0%) |
| 19 to 25 Years | 53 (100.0%) | 0 (0.0%) |
| 26 to 34 Years | 54 (100.0%) | 0 (0.0%) |
| 35 to 44 Years | 178 (89.9%) | 20 (10.1%) |
| 45 to 54 Years | 222 (100.0%) | 0 (0.0%) |
| 55 to 64 Years | 686 (100.0%) | 0 (0.0%) |
| 65 to 74 Years | 883 (100.0%) | 0 (0.0%) |
| 75 Years and older | 1,544 (100.0%) | 0 (0.0%) |
| Total | 3,906 (99.5%) | 21 (0.5%) |
Health Insurance Coverage by Citizenship Status in Heritage Hills
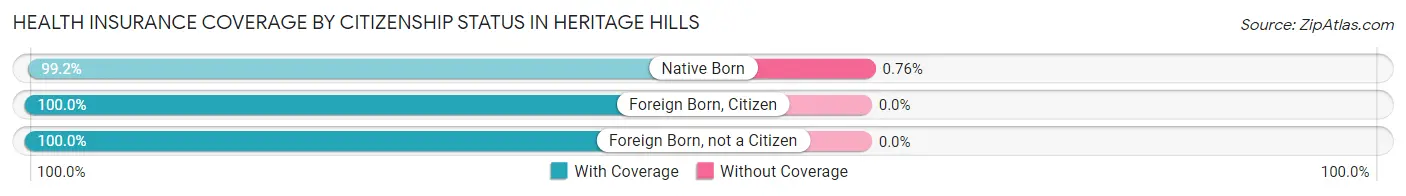
| Citizenship Status | With Coverage | Without Coverage |
| Native Born | 130 (99.2%) | 1 (0.8%) |
| Foreign Born, Citizen | 156 (100.0%) | 0 (0.0%) |
| Foreign Born, not a Citizen | 53 (100.0%) | 0 (0.0%) |
Health Insurance Coverage by Household Income in Heritage Hills
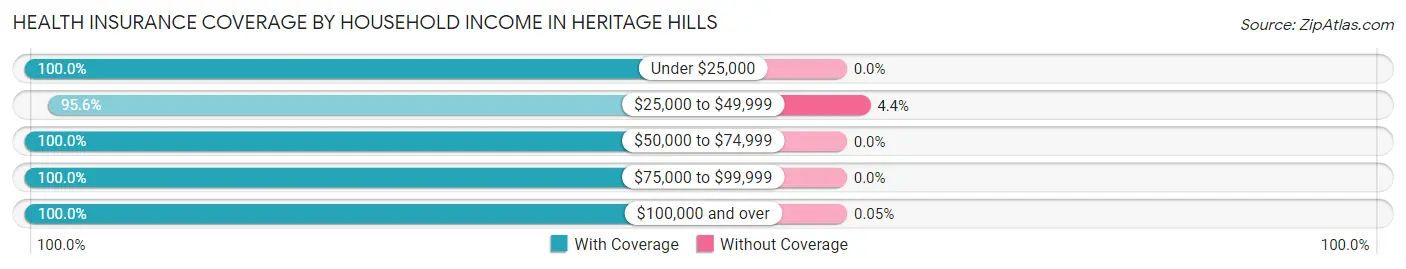
| Household Income | With Coverage | Without Coverage |
| Under $25,000 | 465 (100.0%) | 0 (0.0%) |
| $25,000 to $49,999 | 435 (95.6%) | 20 (4.4%) |
| $50,000 to $74,999 | 409 (100.0%) | 0 (0.0%) |
| $75,000 to $99,999 | 497 (100.0%) | 0 (0.0%) |
| $100,000 and over | 2,026 (100.0%) | 1 (0.1%) |
Public vs Private Health Insurance Coverage by Age in Heritage Hills
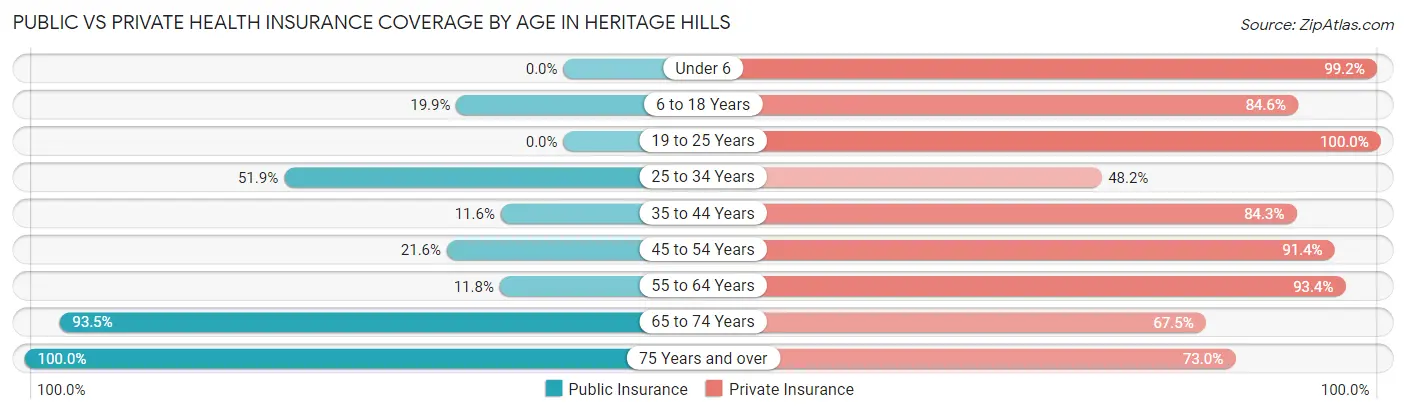
| Age Bracket | Public Insurance | Private Insurance |
| Under 6 | 0 (0.0%) | 130 (99.2%) |
| 6 to 18 Years | 31 (19.9%) | 132 (84.6%) |
| 19 to 25 Years | 0 (0.0%) | 53 (100.0%) |
| 25 to 34 Years | 28 (51.8%) | 26 (48.1%) |
| 35 to 44 Years | 23 (11.6%) | 167 (84.3%) |
| 45 to 54 Years | 48 (21.6%) | 203 (91.4%) |
| 55 to 64 Years | 81 (11.8%) | 641 (93.4%) |
| 65 to 74 Years | 826 (93.5%) | 596 (67.5%) |
| 75 Years and over | 1,544 (100.0%) | 1,127 (73.0%) |
| Total | 2,581 (65.7%) | 3,075 (78.3%) |
Disability Status by Sex by Age in Heritage Hills
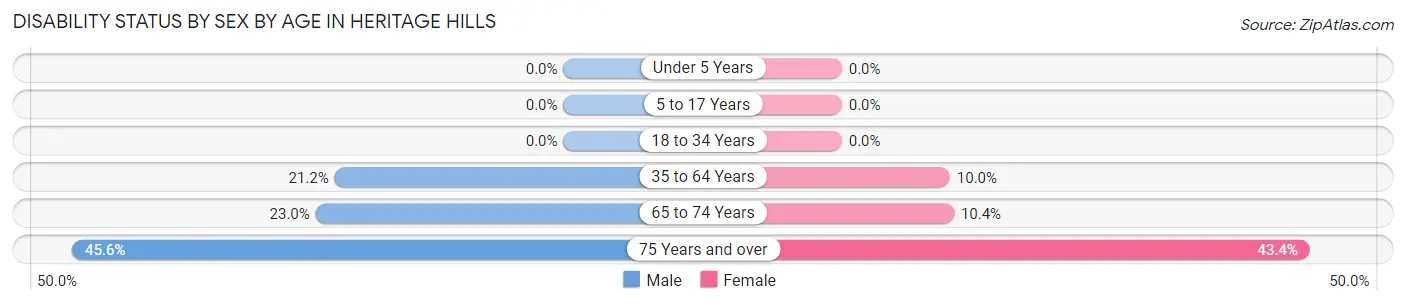
| Age Bracket | Male | Female |
| Under 5 Years | 0 (0.0%) | 0 (0.0%) |
| 5 to 17 Years | 0 (0.0%) | 0 (0.0%) |
| 18 to 34 Years | 0 (0.0%) | 0 (0.0%) |
| 35 to 64 Years | 76 (21.2%) | 75 (10.0%) |
| 65 to 74 Years | 86 (23.0%) | 53 (10.4%) |
| 75 Years and over | 222 (45.6%) | 459 (43.4%) |
Disability Class by Sex by Age in Heritage Hills
Disability Class: Hearing Difficulty
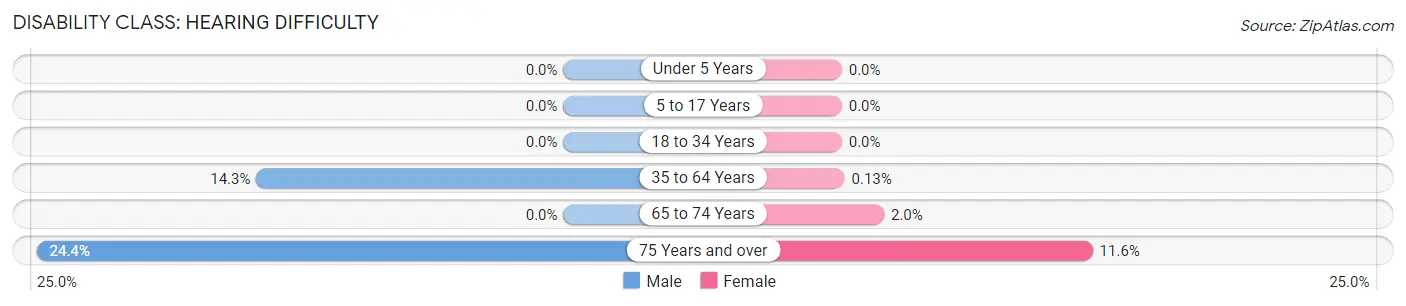
| Age Bracket | Male | Female |
| Under 5 Years | 0 (0.0%) | 0 (0.0%) |
| 5 to 17 Years | 0 (0.0%) | 0 (0.0%) |
| 18 to 34 Years | 0 (0.0%) | 0 (0.0%) |
| 35 to 64 Years | 51 (14.2%) | 1 (0.1%) |
| 65 to 74 Years | 0 (0.0%) | 10 (2.0%) |
| 75 Years and over | 119 (24.4%) | 123 (11.6%) |
Disability Class: Vision Difficulty
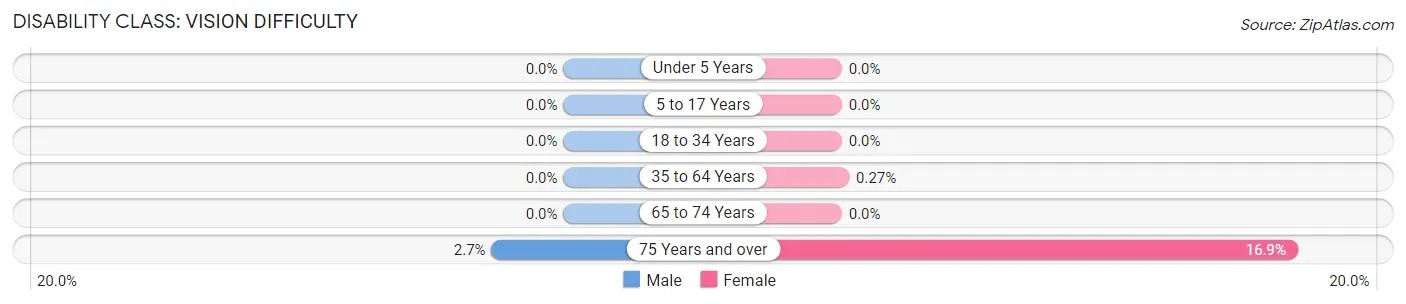
| Age Bracket | Male | Female |
| Under 5 Years | 0 (0.0%) | 0 (0.0%) |
| 5 to 17 Years | 0 (0.0%) | 0 (0.0%) |
| 18 to 34 Years | 0 (0.0%) | 0 (0.0%) |
| 35 to 64 Years | 0 (0.0%) | 2 (0.3%) |
| 65 to 74 Years | 0 (0.0%) | 0 (0.0%) |
| 75 Years and over | 13 (2.7%) | 179 (16.9%) |
Disability Class: Cognitive Difficulty
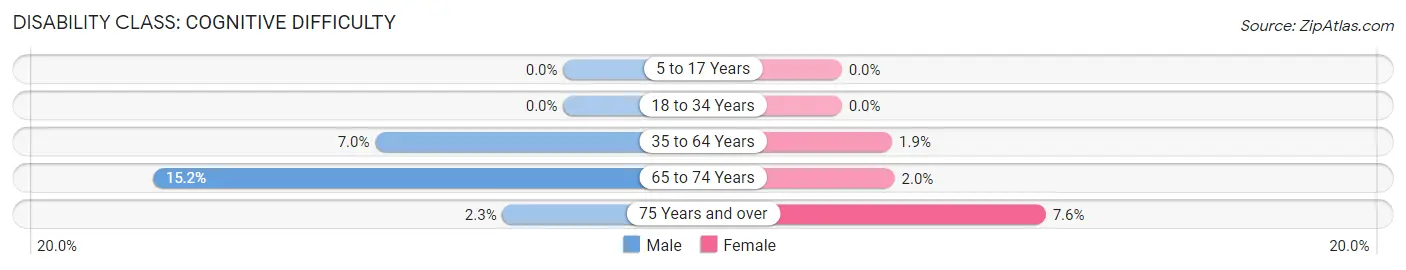
| Age Bracket | Male | Female |
| 5 to 17 Years | 0 (0.0%) | 0 (0.0%) |
| 18 to 34 Years | 0 (0.0%) | 0 (0.0%) |
| 35 to 64 Years | 25 (7.0%) | 14 (1.9%) |
| 65 to 74 Years | 57 (15.2%) | 10 (2.0%) |
| 75 Years and over | 11 (2.3%) | 80 (7.6%) |
Disability Class: Ambulatory Difficulty
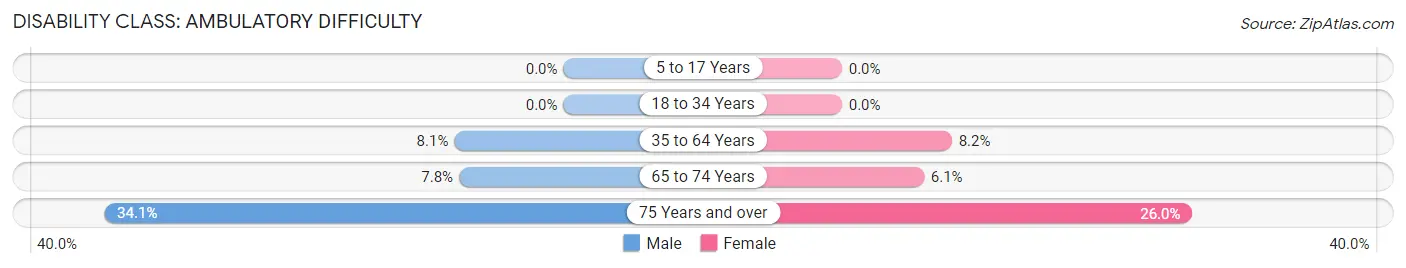
| Age Bracket | Male | Female |
| 5 to 17 Years | 0 (0.0%) | 0 (0.0%) |
| 18 to 34 Years | 0 (0.0%) | 0 (0.0%) |
| 35 to 64 Years | 29 (8.1%) | 61 (8.2%) |
| 65 to 74 Years | 29 (7.7%) | 31 (6.1%) |
| 75 Years and over | 166 (34.1%) | 275 (26.0%) |
Disability Class: Self-Care Difficulty
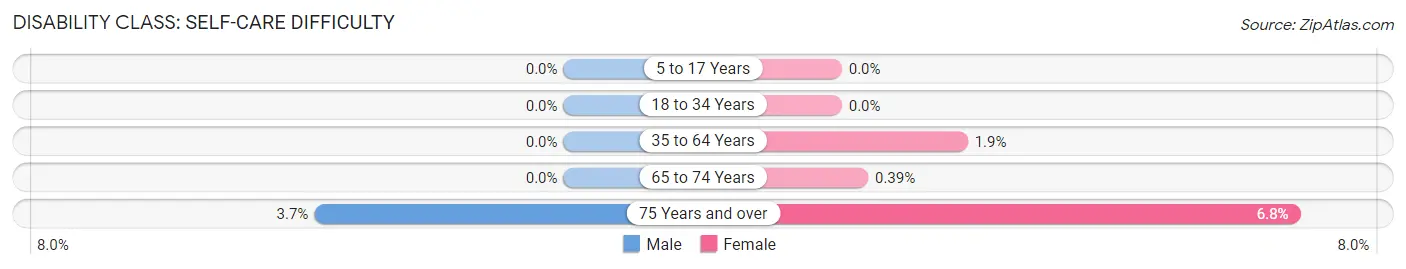
| Age Bracket | Male | Female |
| 5 to 17 Years | 0 (0.0%) | 0 (0.0%) |
| 18 to 34 Years | 0 (0.0%) | 0 (0.0%) |
| 35 to 64 Years | 0 (0.0%) | 14 (1.9%) |
| 65 to 74 Years | 0 (0.0%) | 2 (0.4%) |
| 75 Years and over | 18 (3.7%) | 72 (6.8%) |
Technology Access in Heritage Hills
Computing Device Access in Heritage Hills
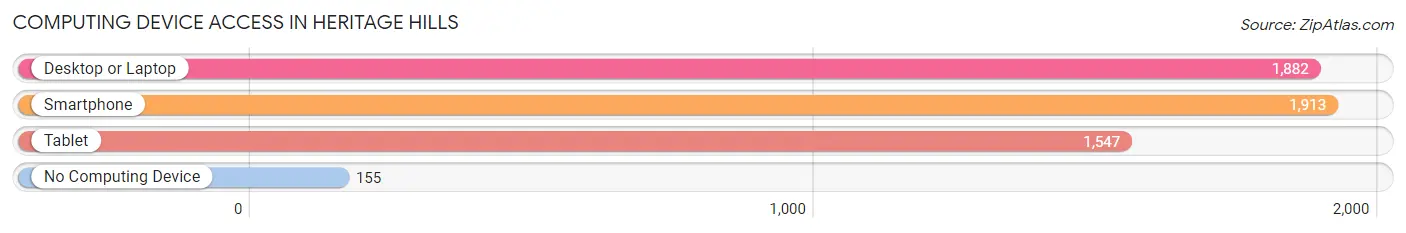
| Device Type | # Households | % Households |
| Desktop or Laptop | 1,882 | 77.3% |
| Smartphone | 1,913 | 78.6% |
| Tablet | 1,547 | 63.6% |
| No Computing Device | 155 | 6.4% |
| Total | 2,433 | 100.0% |
Internet Access in Heritage Hills
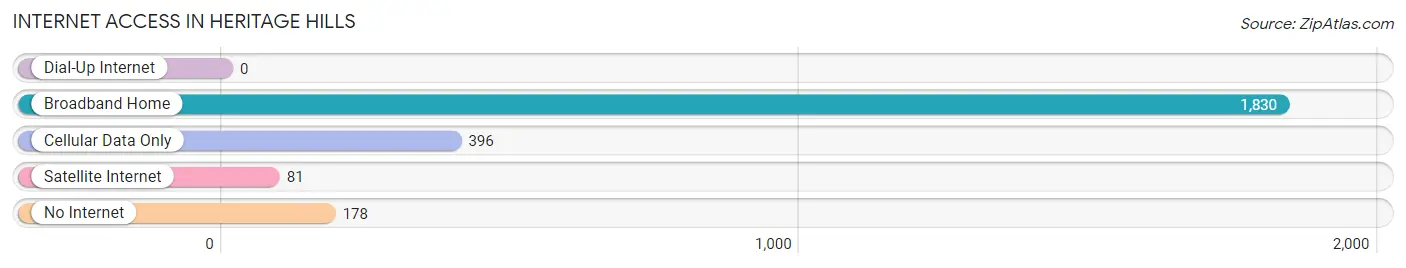
| Internet Type | # Households | % Households |
| Dial-Up Internet | 0 | 0.0% |
| Broadband Home | 1,830 | 75.2% |
| Cellular Data Only | 396 | 16.3% |
| Satellite Internet | 81 | 3.3% |
| No Internet | 178 | 7.3% |
| Total | 2,433 | 100.0% |
Heritage Hills Summary
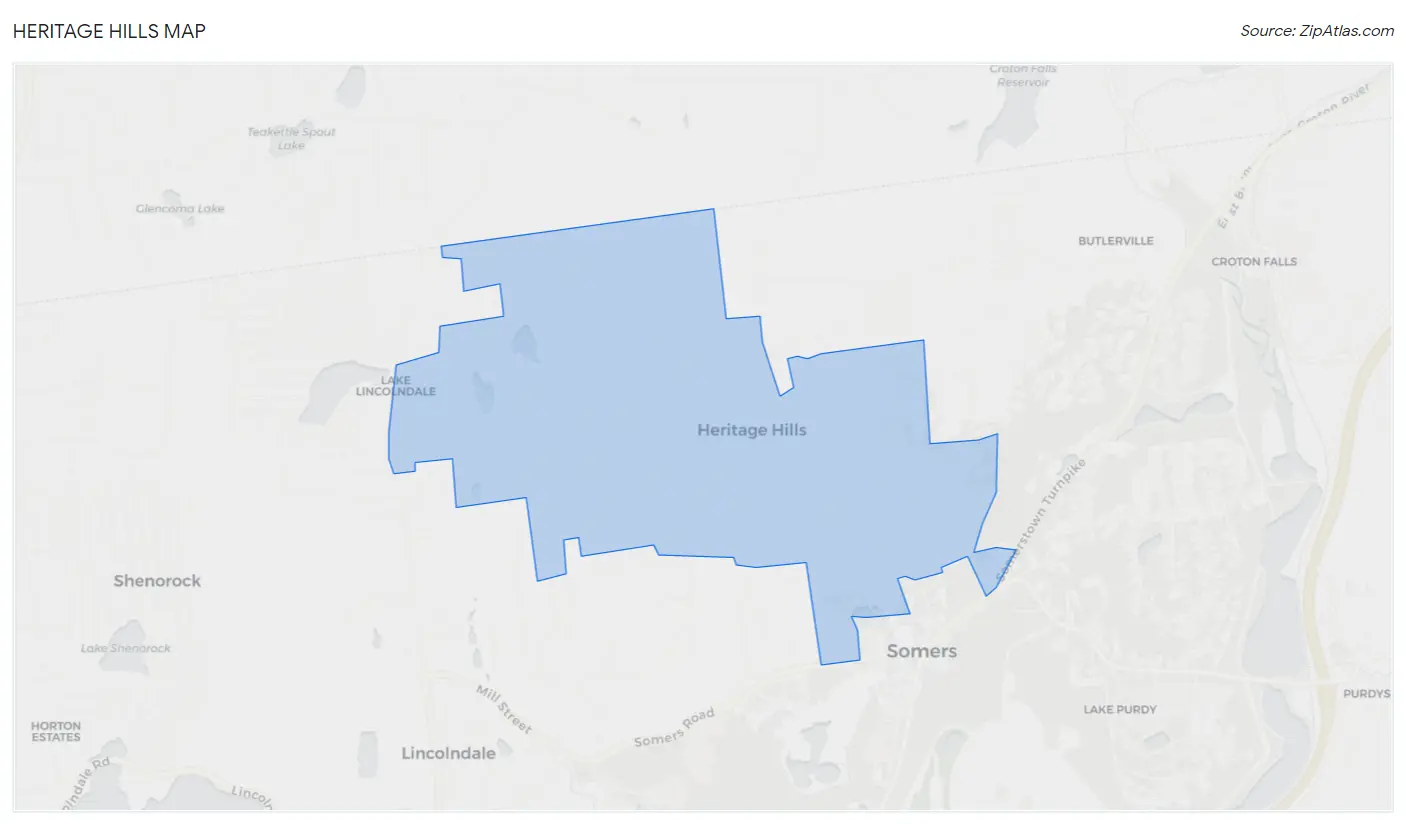
Heritage Hills is a hamlet located in the Town of Somers in Westchester County, New York. It is situated in the southeastern corner of the town, near the border of Putnam County. The hamlet is located approximately 50 miles north of New York City and is part of the New York metropolitan area.
History
Heritage Hills was originally part of the Philipse Patent, a large tract of land granted to Frederick Philipse in 1697 by the English Crown. The land was divided into two parts, the Upper and Lower Patents, and the area that is now Heritage Hills was part of the Lower Patent. The area was first settled in the late 1700s by Dutch and English settlers.
In the early 1800s, the area was known as “Hardscrabble” and was home to a small farming community. In 1845, the area was renamed “Heritage Hills” after the nearby Heritage Hill State Park. The park was established in 1845 and is the oldest state park in New York.
In the late 1800s, the area began to develop as a summer resort community. The area was popular with wealthy New Yorkers who built large estates and mansions. Many of these estates still exist today and are now part of the Heritage Hills Historic District.
Geography
Heritage Hills is located in the southeastern corner of the Town of Somers in Westchester County, New York. It is situated near the border of Putnam County. The hamlet is located approximately 50 miles north of New York City and is part of the New York metropolitan area.
The hamlet is located in the Hudson Valley region of New York and is surrounded by rolling hills and forests. The area is home to several parks and nature preserves, including the Heritage Hill State Park, the Ward Pound Ridge Reservation, and the Croton Gorge Park.
Economy
Heritage Hills is primarily a residential community and does not have a large commercial or industrial base. The hamlet is home to several small businesses, including restaurants, retail stores, and professional services.
The hamlet is also home to several corporate headquarters, including the headquarters of the PepsiCo Corporation and the IBM Corporation. The area is also home to several large estates and mansions, many of which are now part of the Heritage Hills Historic District.
Demographics
As of the 2010 census, the population of Heritage Hills was 4,845. The population is primarily white (90.2%) and the median household income is $125,000. The median age is 44.7 years and the median home value is $717,000.
The hamlet is home to several large estates and mansions, many of which are now part of the Heritage Hills Historic District. The area is also home to several corporate headquarters, including the headquarters of the PepsiCo Corporation and the IBM Corporation.
Conclusion
Heritage Hills is a hamlet located in the Town of Somers in Westchester County, New York. It is situated in the southeastern corner of the town, near the border of Putnam County. The hamlet is located approximately 50 miles north of New York City and is part of the New York metropolitan area. The area was originally part of the Philipse Patent and was first settled in the late 1700s by Dutch and English settlers. In the late 1800s, the area began to develop as a summer resort community and is now home to several large estates and mansions, many of which are now part of the Heritage Hills Historic District. The hamlet is primarily a residential community and does not have a large commercial or industrial base. The population of Heritage Hills is primarily white (90.2%) and the median household income is $125,000. The area is also home to several corporate headquarters, including the headquarters of the PepsiCo Corporation and the IBM Corporation.
Common Questions
What is Per Capita Income in Heritage Hills?
Per Capita income in Heritage Hills is $73,892.
What is the Median Family Income in Heritage Hills?
Median Family Income in Heritage Hills is $108,958.
What is the Median Household income in Heritage Hills?
Median Household Income in Heritage Hills is $87,552.
What is Income or Wage Gap in Heritage Hills?
Income or Wage Gap in Heritage Hills is 18.6%.
Women in Heritage Hills earn 81.4 cents for every dollar earned by a man.
What is Inequality or Gini Index in Heritage Hills?
Inequality or Gini Index in Heritage Hills is 0.48.
What is the Total Population of Heritage Hills?
Total Population of Heritage Hills is 3,927.
What is the Total Male Population of Heritage Hills?
Total Male Population of Heritage Hills is 1,423.
What is the Total Female Population of Heritage Hills?
Total Female Population of Heritage Hills is 2,504.
What is the Ratio of Males per 100 Females in Heritage Hills?
There are 56.83 Males per 100 Females in Heritage Hills.
What is the Ratio of Females per 100 Males in Heritage Hills?
There are 175.97 Females per 100 Males in Heritage Hills.
What is the Median Population Age in Heritage Hills?
Median Population Age in Heritage Hills is 69.3 Years.
What is the Average Family Size in Heritage Hills
Average Family Size in Heritage Hills is 2.2 People.
What is the Average Household Size in Heritage Hills
Average Household Size in Heritage Hills is 1.6 People.
How Large is the Labor Force in Heritage Hills?
There are 1,240 People in the Labor Forcein in Heritage Hills.
What is the Percentage of People in the Labor Force in Heritage Hills?
33.9% of People are in the Labor Force in Heritage Hills.
What is the Unemployment Rate in Heritage Hills?
Unemployment Rate in Heritage Hills is 11.4%.