Hemlock, NY Map & Demographics
Hemlock Map
Hemlock Overview
$33,686
PER CAPITA INCOME
$85,809
AVG FAMILY INCOME
$100,536
AVG HOUSEHOLD INCOME
2.3%
WAGE / INCOME GAP [ % ]
97.7¢/ $1
WAGE / INCOME GAP [ $ ]
0.24
INEQUALITY / GINI INDEX
668
TOTAL POPULATION
400
MALE POPULATION
268
FEMALE POPULATION
149.25
MALES / 100 FEMALES
67.00
FEMALES / 100 MALES
55.4
MEDIAN AGE
3.0
AVG FAMILY SIZE
2.9
AVG HOUSEHOLD SIZE
348
LABOR FORCE [ PEOPLE ]
58.2%
PERCENT IN LABOR FORCE
5.7%
UNEMPLOYMENT RATE
Hemlock Zip Codes
Hemlock Area Codes
Income in Hemlock
Income Overview in Hemlock
Per Capita Income in Hemlock is $33,686, while median incomes of families and households are $85,809 and $100,536 respectively.
| Characteristic | Number | Measure |
| Per Capita Income | 668 | $33,686 |
| Median Family Income | 203 | $85,809 |
| Mean Family Income | 203 | $97,353 |
| Median Household Income | 228 | $100,536 |
| Mean Household Income | 228 | $94,683 |
| Income Deficit | 203 | $0 |
| Wage / Income Gap (%) | 668 | 2.29% |
| Wage / Income Gap ($) | 668 | 97.71¢ per $1 |
| Gini / Inequality Index | 668 | 0.24 |
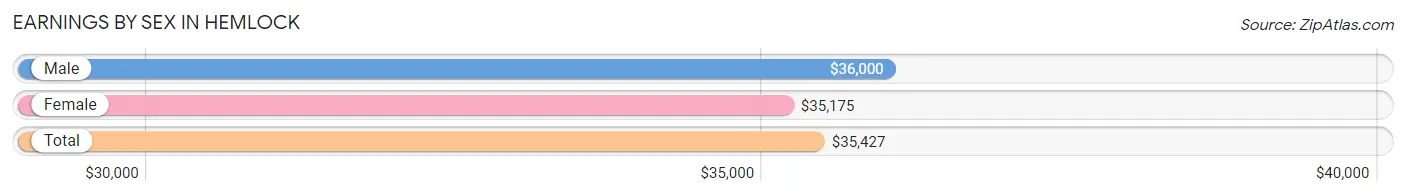
Earnings by Sex in Hemlock
Average Earnings in Hemlock are $35,427, $36,000 for men and $35,175 for women, a difference of 2.3%.
| Sex | Number | Average Earnings |
| Male | 244 (62.6%) | $36,000 |
| Female | 146 (37.4%) | $35,175 |
| Total | 390 (100.0%) | $35,427 |
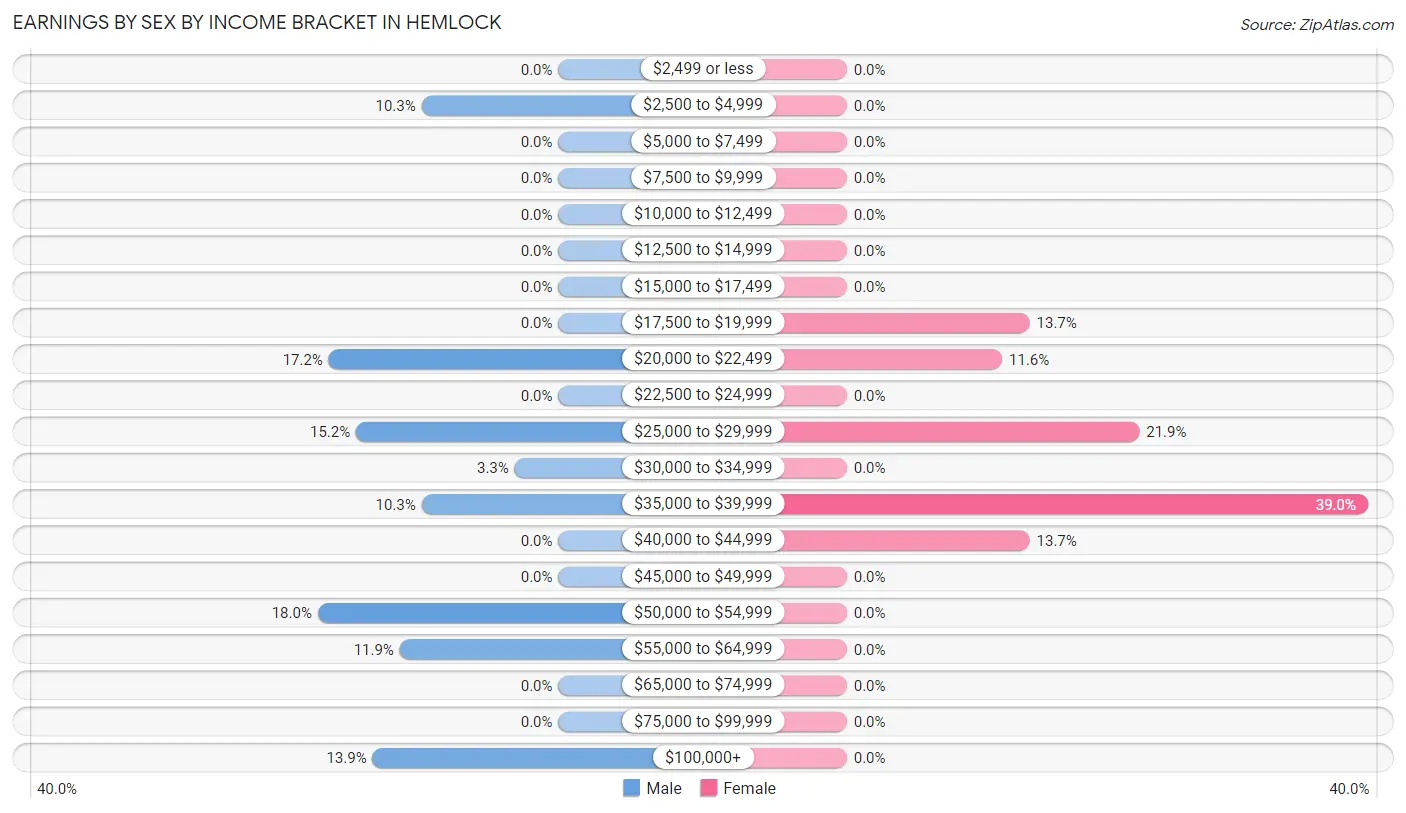
Earnings by Sex by Income Bracket in Hemlock
The most common earnings brackets in Hemlock are $50,000 to $54,999 for men (44 | 18.0%) and $35,000 to $39,999 for women (57 | 39.0%).
| Income | Male | Female |
| $2,499 or less | 0 (0.0%) | 0 (0.0%) |
| $2,500 to $4,999 | 25 (10.2%) | 0 (0.0%) |
| $5,000 to $7,499 | 0 (0.0%) | 0 (0.0%) |
| $7,500 to $9,999 | 0 (0.0%) | 0 (0.0%) |
| $10,000 to $12,499 | 0 (0.0%) | 0 (0.0%) |
| $12,500 to $14,999 | 0 (0.0%) | 0 (0.0%) |
| $15,000 to $17,499 | 0 (0.0%) | 0 (0.0%) |
| $17,500 to $19,999 | 0 (0.0%) | 20 (13.7%) |
| $20,000 to $22,499 | 42 (17.2%) | 17 (11.6%) |
| $22,500 to $24,999 | 0 (0.0%) | 0 (0.0%) |
| $25,000 to $29,999 | 37 (15.2%) | 32 (21.9%) |
| $30,000 to $34,999 | 8 (3.3%) | 0 (0.0%) |
| $35,000 to $39,999 | 25 (10.2%) | 57 (39.0%) |
| $40,000 to $44,999 | 0 (0.0%) | 20 (13.7%) |
| $45,000 to $49,999 | 0 (0.0%) | 0 (0.0%) |
| $50,000 to $54,999 | 44 (18.0%) | 0 (0.0%) |
| $55,000 to $64,999 | 29 (11.9%) | 0 (0.0%) |
| $65,000 to $74,999 | 0 (0.0%) | 0 (0.0%) |
| $75,000 to $99,999 | 0 (0.0%) | 0 (0.0%) |
| $100,000+ | 34 (13.9%) | 0 (0.0%) |
| Total | 244 (100.0%) | 146 (100.0%) |
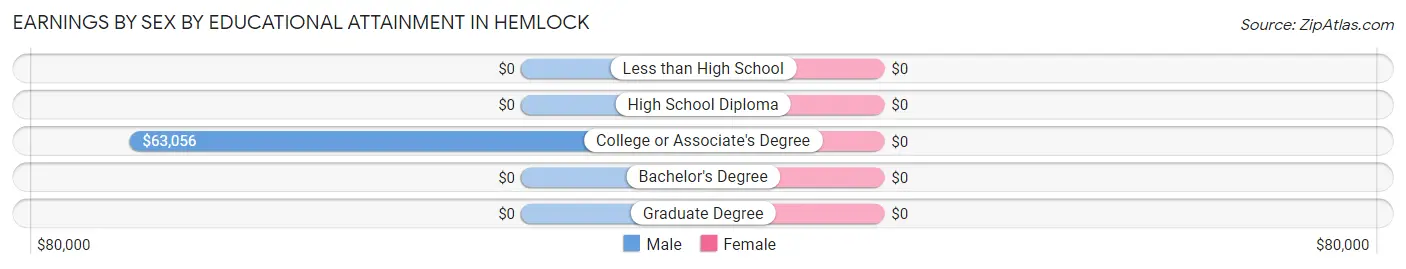
Earnings by Sex by Educational Attainment in Hemlock
| Educational Attainment | Male Income | Female Income |
| Less than High School | - | - |
| High School Diploma | - | - |
| College or Associate's Degree | $63,056 | $0 |
| Bachelor's Degree | - | - |
| Graduate Degree | - | - |
| Total | $37,250 | $35,175 |
Family Income in Hemlock
Family Income Brackets in Hemlock
According to the Hemlock family income data, there are 73 families falling into the $75,000 to $99,999 income range, which is the most common income bracket and makes up 36.0% of all families.
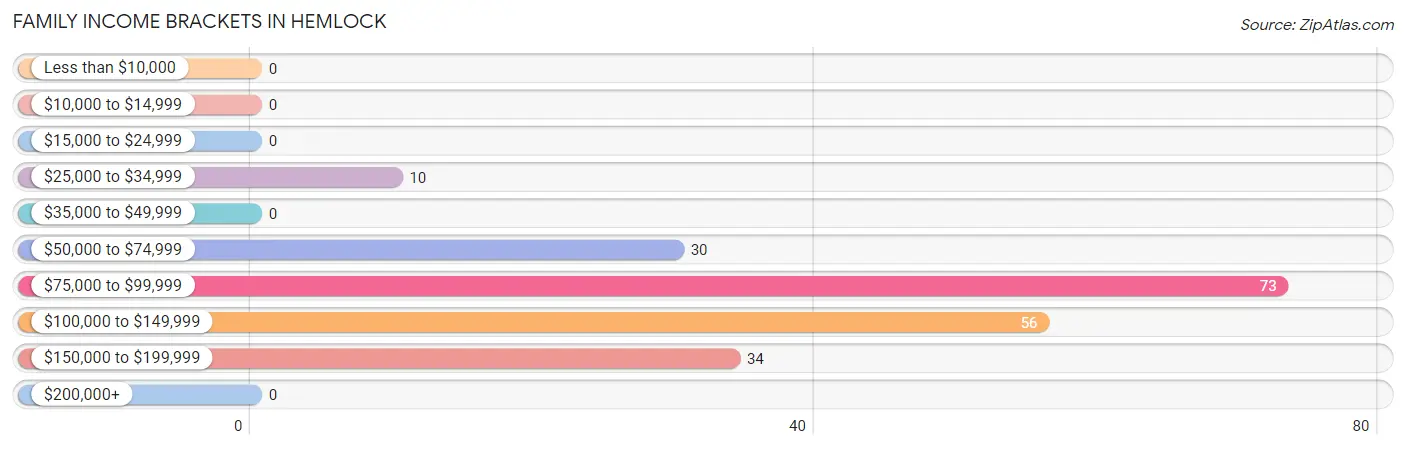
| Income Bracket | # Families | % Families |
| Less than $10,000 | 0 | 0.0% |
| $10,000 to $14,999 | 0 | 0.0% |
| $15,000 to $24,999 | 0 | 0.0% |
| $25,000 to $34,999 | 10 | 4.9% |
| $35,000 to $49,999 | 0 | 0.0% |
| $50,000 to $74,999 | 30 | 14.8% |
| $75,000 to $99,999 | 73 | 36.0% |
| $100,000 to $149,999 | 56 | 27.6% |
| $150,000 to $199,999 | 34 | 16.7% |
| $200,000+ | 0 | 0.0% |
Family Income by Famaliy Size in Hemlock
2-person families (106 | 52.2%) account for the highest median family income in Hemlock with $76,625 per family, while 2-person families (106 | 52.2%) have the highest median income of $38,312 per family member.
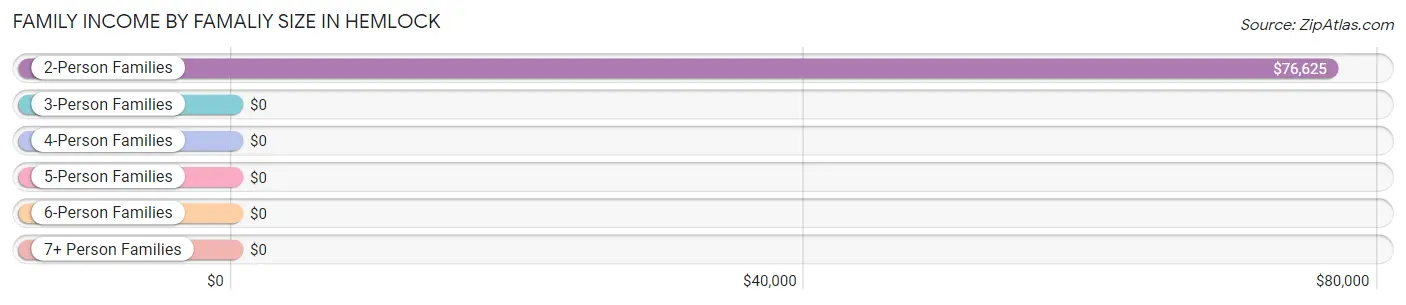
| Income Bracket | # Families | Median Income |
| 2-Person Families | 106 (52.2%) | $76,625 |
| 3-Person Families | 10 (4.9%) | $0 |
| 4-Person Families | 87 (42.9%) | $0 |
| 5-Person Families | 0 (0.0%) | $0 |
| 6-Person Families | 0 (0.0%) | $0 |
| 7+ Person Families | 0 (0.0%) | $0 |
| Total | 203 (100.0%) | $85,809 |
Family Income by Number of Earners in Hemlock
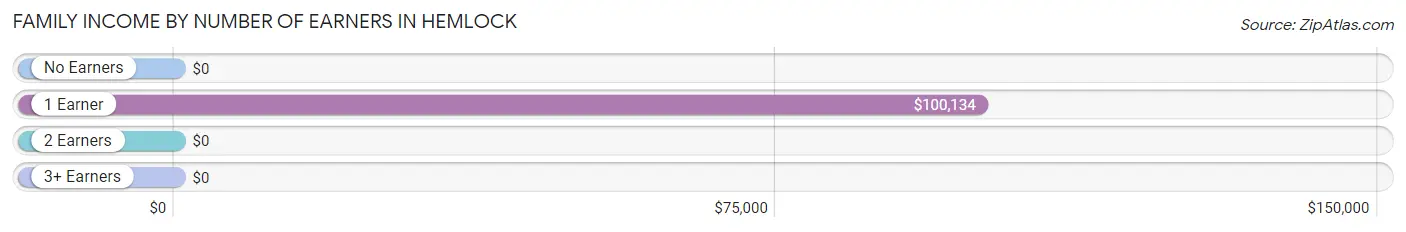
| Number of Earners | # Families | Median Income |
| No Earners | 10 (4.9%) | $0 |
| 1 Earner | 106 (52.2%) | $100,134 |
| 2 Earners | 53 (26.1%) | $0 |
| 3+ Earners | 34 (16.8%) | $0 |
| Total | 203 (100.0%) | $85,809 |
Household Income in Hemlock
Household Income Brackets in Hemlock
With 92 households falling in the category, the $100,000 to $149,999 income range is the most frequent in Hemlock, accounting for 40.4% of all households.
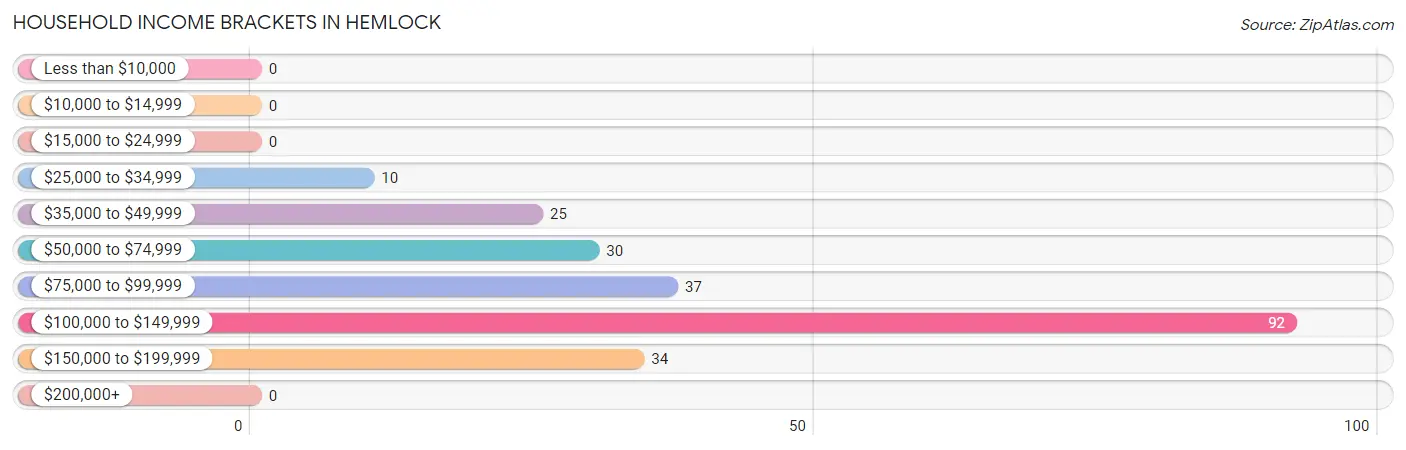
| Income Bracket | # Households | % Households |
| Less than $10,000 | 0 | 0.0% |
| $10,000 to $14,999 | 0 | 0.0% |
| $15,000 to $24,999 | 0 | 0.0% |
| $25,000 to $34,999 | 10 | 4.4% |
| $35,000 to $49,999 | 25 | 11.0% |
| $50,000 to $74,999 | 30 | 13.2% |
| $75,000 to $99,999 | 37 | 16.2% |
| $100,000 to $149,999 | 92 | 40.4% |
| $150,000 to $199,999 | 34 | 14.9% |
| $200,000+ | 0 | 0.0% |
Household Income by Householder Age in Hemlock
The median household income in Hemlock is $100,536, with the highest median household income of $100,951 found in the 45 to 64 years age bracket for the primary householder. A total of 125 households (54.8%) fall into this category.
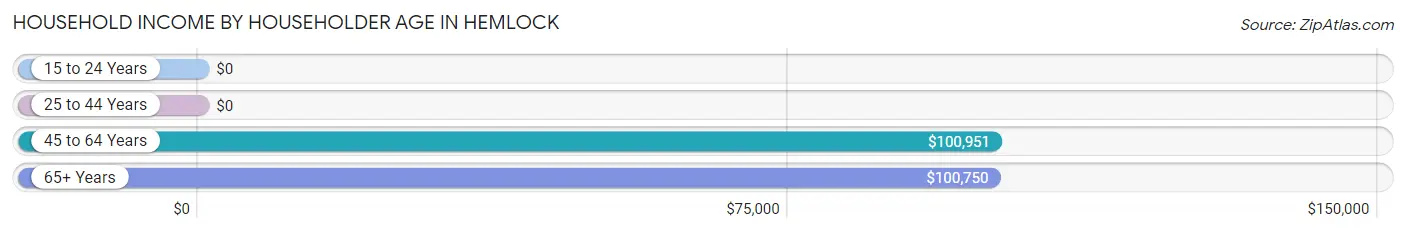
| Income Bracket | # Households | Median Income |
| 15 to 24 Years | 0 (0.0%) | $0 |
| 25 to 44 Years | 17 (7.5%) | $0 |
| 45 to 64 Years | 125 (54.8%) | $100,951 |
| 65+ Years | 86 (37.7%) | $100,750 |
| Total | 228 (100.0%) | $100,536 |
Poverty in Hemlock
Income Below Poverty by Sex and Age in Hemlock
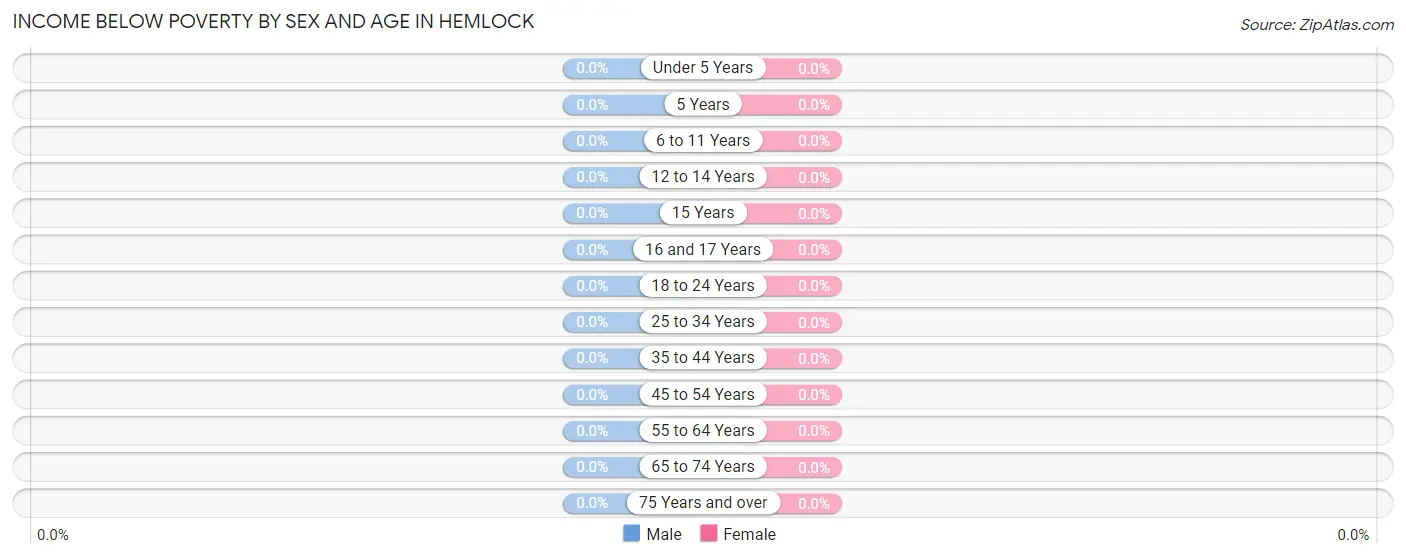
| Age Bracket | Male | Female |
| Under 5 Years | 0 (0.0%) | 0 (0.0%) |
| 5 Years | 0 (0.0%) | 0 (0.0%) |
| 6 to 11 Years | 0 (0.0%) | 0 (0.0%) |
| 12 to 14 Years | 0 (0.0%) | 0 (0.0%) |
| 15 Years | 0 (0.0%) | 0 (0.0%) |
| 16 and 17 Years | 0 (0.0%) | 0 (0.0%) |
| 18 to 24 Years | 0 (0.0%) | 0 (0.0%) |
| 25 to 34 Years | 0 (0.0%) | 0 (0.0%) |
| 35 to 44 Years | 0 (0.0%) | 0 (0.0%) |
| 45 to 54 Years | 0 (0.0%) | 0 (0.0%) |
| 55 to 64 Years | 0 (0.0%) | 0 (0.0%) |
| 65 to 74 Years | 0 (0.0%) | 0 (0.0%) |
| 75 Years and over | 0 (0.0%) | 0 (0.0%) |
| Total | 0 (0.0%) | 0 (0.0%) |
Income Above Poverty by Sex and Age in Hemlock
According to the poverty statistics in Hemlock, males aged 5 years and females aged under 5 years are the age groups that are most secure financially, with 100.0% of males and 100.0% of females in these age groups living above the poverty line.
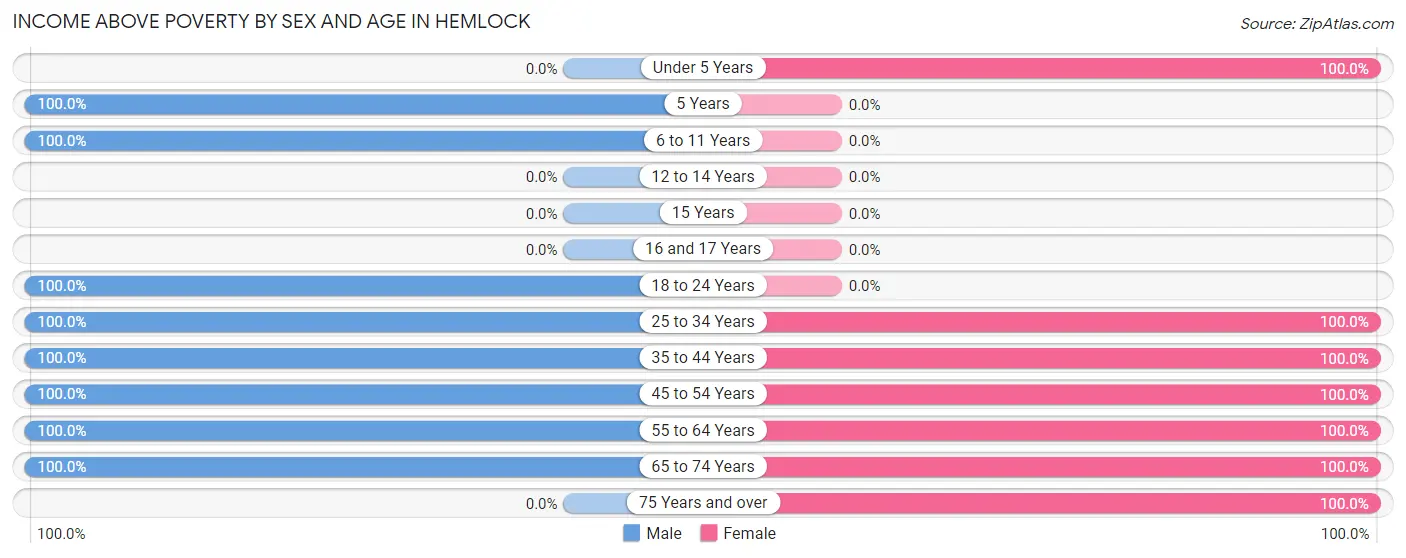
| Age Bracket | Male | Female |
| Under 5 Years | 0 (0.0%) | 14 (100.0%) |
| 5 Years | 17 (100.0%) | 0 (0.0%) |
| 6 to 11 Years | 39 (100.0%) | 0 (0.0%) |
| 12 to 14 Years | 0 (0.0%) | 0 (0.0%) |
| 15 Years | 0 (0.0%) | 0 (0.0%) |
| 16 and 17 Years | 0 (0.0%) | 0 (0.0%) |
| 18 to 24 Years | 25 (100.0%) | 0 (0.0%) |
| 25 to 34 Years | 44 (100.0%) | 17 (100.0%) |
| 35 to 44 Years | 55 (100.0%) | 32 (100.0%) |
| 45 to 54 Years | 8 (100.0%) | 57 (100.0%) |
| 55 to 64 Years | 158 (100.0%) | 54 (100.0%) |
| 65 to 74 Years | 54 (100.0%) | 84 (100.0%) |
| 75 Years and over | 0 (0.0%) | 10 (100.0%) |
| Total | 400 (100.0%) | 268 (100.0%) |
Income Below Poverty Among Married-Couple Families in Hemlock
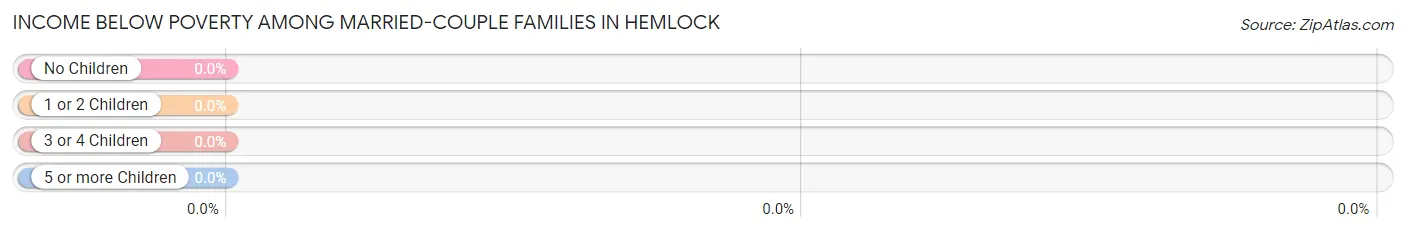
| Children | Above Poverty | Below Poverty |
| No Children | 140 (100.0%) | 0 (0.0%) |
| 1 or 2 Children | 17 (100.0%) | 0 (0.0%) |
| 3 or 4 Children | 0 (0.0%) | 0 (0.0%) |
| 5 or more Children | 0 (0.0%) | 0 (0.0%) |
| Total | 157 (100.0%) | 0 (0.0%) |
Income Below Poverty Among Single-Parent Households in Hemlock
| Children | Single Father | Single Mother |
| No Children | 0 (0.0%) | 0 (0.0%) |
| 1 or 2 Children | 0 (0.0%) | 0 (0.0%) |
| 3 or 4 Children | 0 (0.0%) | 0 (0.0%) |
| 5 or more Children | 0 (0.0%) | 0 (0.0%) |
| Total | 0 (0.0%) | 0 (0.0%) |
Income Below Poverty Among Married-Couple vs Single-Parent Households in Hemlock
| Children | Married-Couple Families | Single-Parent Households |
| No Children | 0 (0.0%) | 0 (0.0%) |
| 1 or 2 Children | 0 (0.0%) | 0 (0.0%) |
| 3 or 4 Children | 0 (0.0%) | 0 (0.0%) |
| 5 or more Children | 0 (0.0%) | 0 (0.0%) |
| Total | 0 (0.0%) | 0 (0.0%) |
Race in Hemlock
The most populous races in Hemlock are , and White / Caucasian (668 | 100.0%).
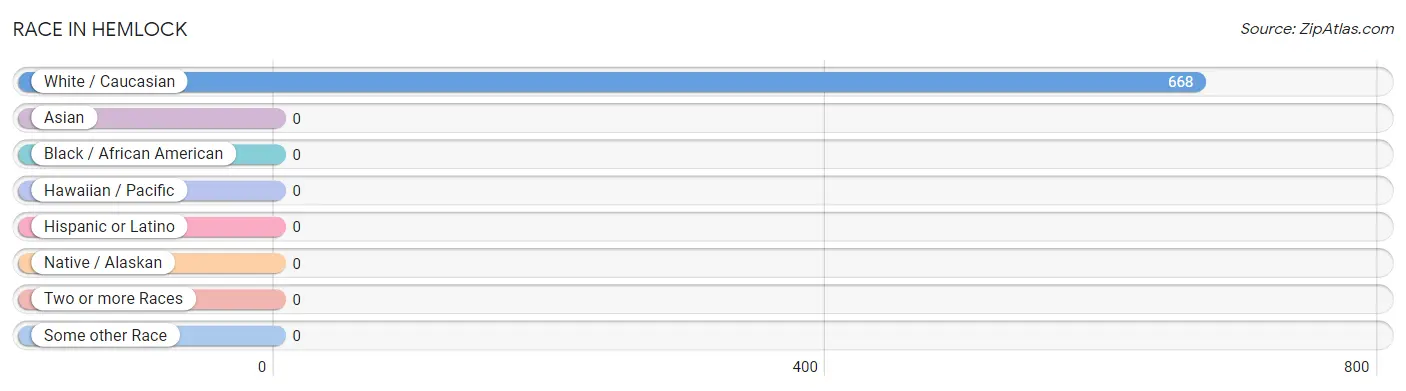
| Race | # Population | % Population |
| Asian | 0 | 0.0% |
| Black / African American | 0 | 0.0% |
| Hawaiian / Pacific | 0 | 0.0% |
| Hispanic or Latino | 0 | 0.0% |
| Native / Alaskan | 0 | 0.0% |
| White / Caucasian | 668 | 100.0% |
| Two or more Races | 0 | 0.0% |
| Some other Race | 0 | 0.0% |
| Total | 668 | 100.0% |
Ancestry in Hemlock
The most populous ancestries reported in Hemlock are English (254 | 38.0%), German (162 | 24.2%), Italian (84 | 12.6%), Irish (82 | 12.3%), and Polish (77 | 11.5%), together accounting for 98.7% of all Hemlock residents.
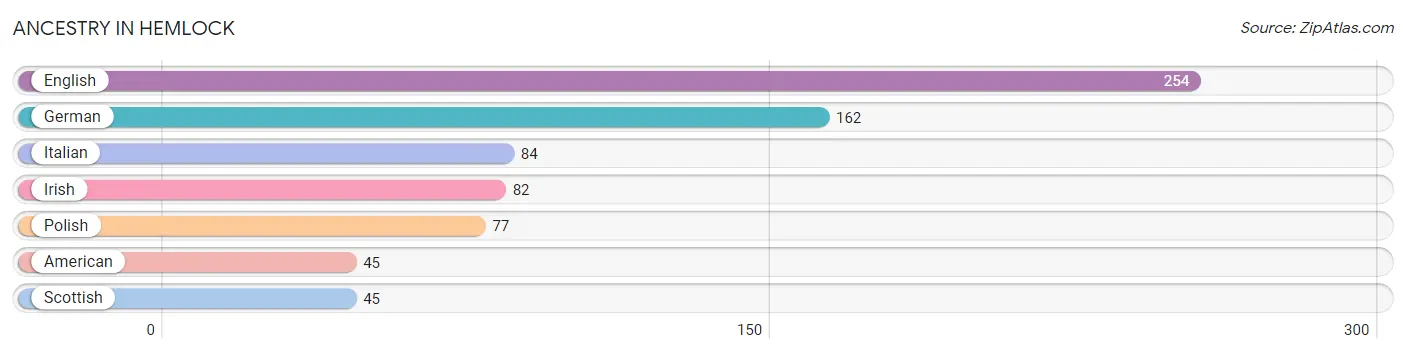
| Ancestry | # Population | % Population |
| American | 45 | 6.7% |
| English | 254 | 38.0% |
| German | 162 | 24.2% |
| Irish | 82 | 12.3% |
| Italian | 84 | 12.6% |
| Polish | 77 | 11.5% |
| Scottish | 45 | 6.7% | View All 7 Rows |
Immigrants in Hemlock

| Immigration Origin | # Population | % Population | View All 0 Rows |
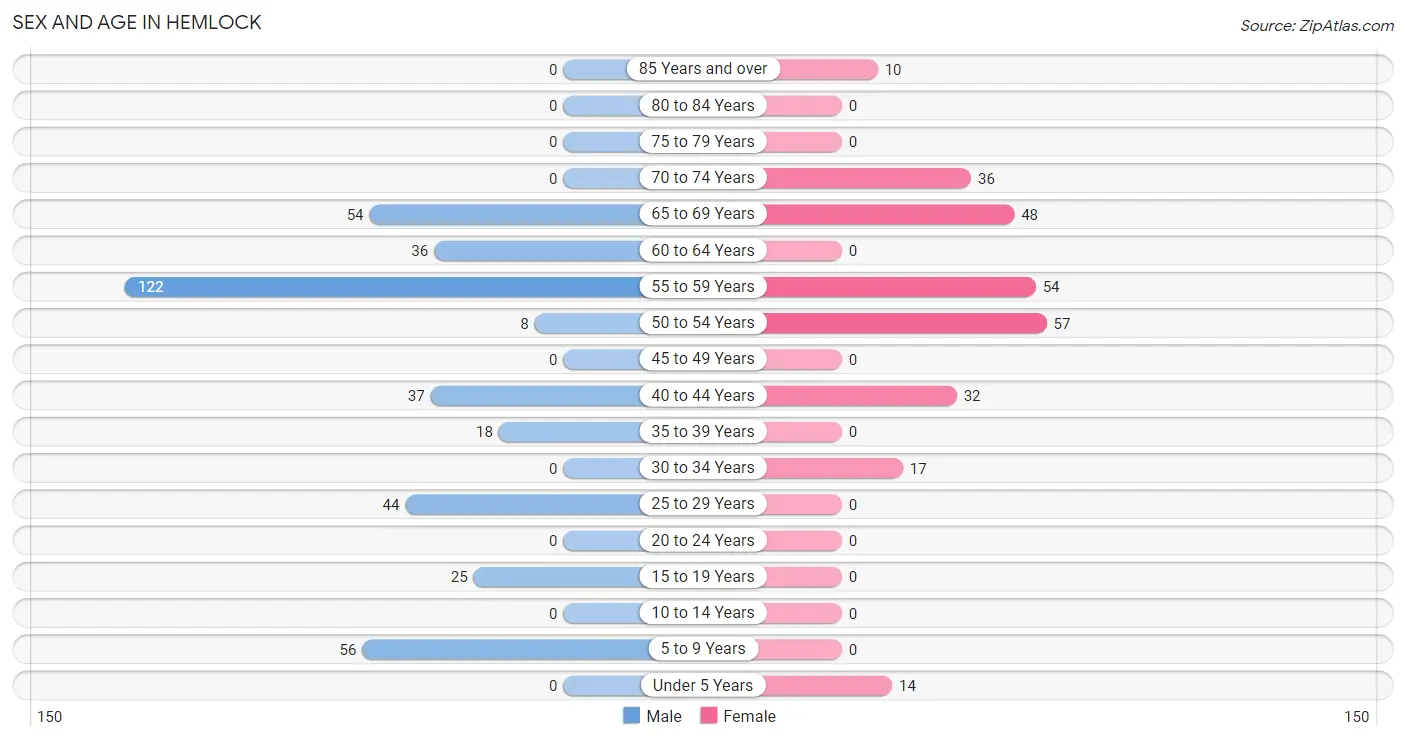
Sex and Age in Hemlock
Sex and Age in Hemlock
The most populous age groups in Hemlock are 55 to 59 Years (122 | 30.5%) for men and 50 to 54 Years (57 | 21.3%) for women.
| Age Bracket | Male | Female |
| Under 5 Years | 0 (0.0%) | 14 (5.2%) |
| 5 to 9 Years | 56 (14.0%) | 0 (0.0%) |
| 10 to 14 Years | 0 (0.0%) | 0 (0.0%) |
| 15 to 19 Years | 25 (6.2%) | 0 (0.0%) |
| 20 to 24 Years | 0 (0.0%) | 0 (0.0%) |
| 25 to 29 Years | 44 (11.0%) | 0 (0.0%) |
| 30 to 34 Years | 0 (0.0%) | 17 (6.3%) |
| 35 to 39 Years | 18 (4.5%) | 0 (0.0%) |
| 40 to 44 Years | 37 (9.2%) | 32 (11.9%) |
| 45 to 49 Years | 0 (0.0%) | 0 (0.0%) |
| 50 to 54 Years | 8 (2.0%) | 57 (21.3%) |
| 55 to 59 Years | 122 (30.5%) | 54 (20.2%) |
| 60 to 64 Years | 36 (9.0%) | 0 (0.0%) |
| 65 to 69 Years | 54 (13.5%) | 48 (17.9%) |
| 70 to 74 Years | 0 (0.0%) | 36 (13.4%) |
| 75 to 79 Years | 0 (0.0%) | 0 (0.0%) |
| 80 to 84 Years | 0 (0.0%) | 0 (0.0%) |
| 85 Years and over | 0 (0.0%) | 10 (3.7%) |
| Total | 400 (100.0%) | 268 (100.0%) |
Families and Households in Hemlock
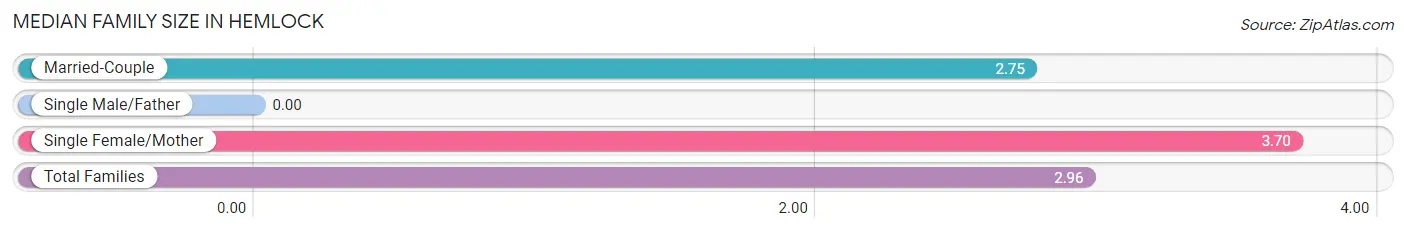
Median Family Size in Hemlock
| Family Type | # Families | Family Size |
| Married-Couple | 157 (77.3%) | 2.75 |
| Single Male/Father | 0 (0.0%) | - |
| Single Female/Mother | 46 (22.7%) | 3.70 |
| Total Families | 203 (100.0%) | 2.96 |
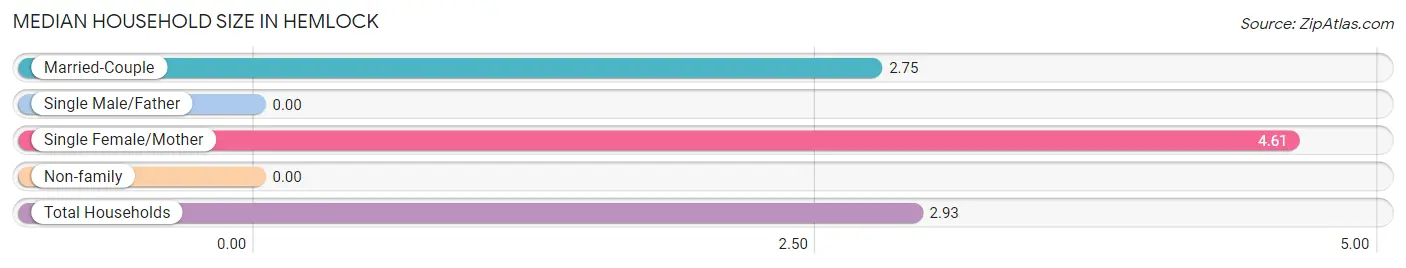
Median Household Size in Hemlock
| Household Type | # Households | Household Size |
| Married-Couple | 157 (68.9%) | 2.75 |
| Single Male/Father | 0 (0.0%) | - |
| Single Female/Mother | 46 (20.2%) | 4.61 |
| Non-family | 25 (11.0%) | - |
| Total Households | 228 (100.0%) | 2.93 |
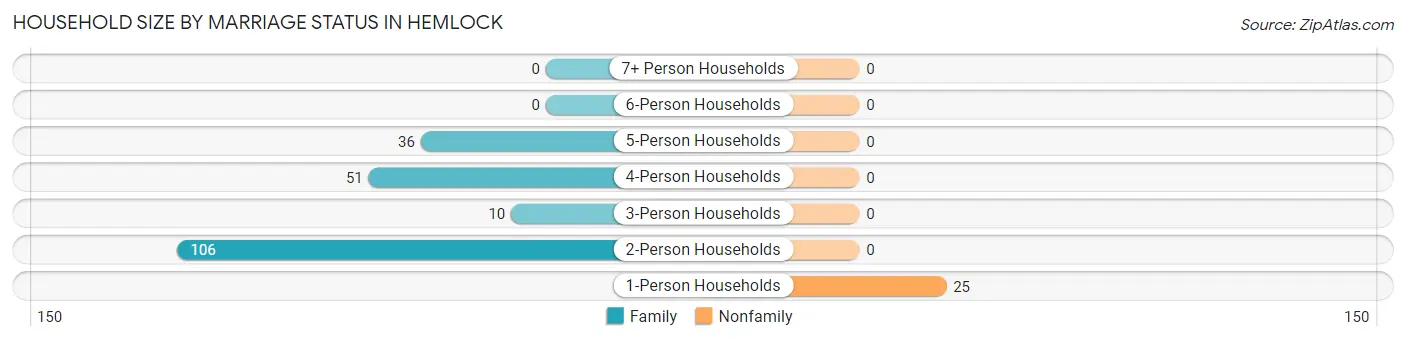
Household Size by Marriage Status in Hemlock
Out of a total of 228 households in Hemlock, 203 (89.0%) are family households, while 25 (11.0%) are nonfamily households. The most numerous type of family households are 2-person households, comprising 106, and the most common type of nonfamily households are 1-person households, comprising 25.
| Household Size | Family Households | Nonfamily Households |
| 1-Person Households | - | 25 (11.0%) |
| 2-Person Households | 106 (46.5%) | 0 (0.0%) |
| 3-Person Households | 10 (4.4%) | 0 (0.0%) |
| 4-Person Households | 51 (22.4%) | 0 (0.0%) |
| 5-Person Households | 36 (15.8%) | 0 (0.0%) |
| 6-Person Households | 0 (0.0%) | 0 (0.0%) |
| 7+ Person Households | 0 (0.0%) | 0 (0.0%) |
| Total | 203 (89.0%) | 25 (11.0%) |
Female Fertility in Hemlock
Fertility by Age in Hemlock
| Age Bracket | Women with Births | Births / 1,000 Women |
| 15 to 19 years | 0 (0.0%) | 0.0 |
| 20 to 34 years | 0 (0.0%) | 0.0 |
| 35 to 50 years | 0 (0.0%) | 0.0 |
| Total | 0 (0.0%) | 0.0 |
Fertility by Age by Marriage Status in Hemlock
| Age Bracket | Married | Unmarried |
| 15 to 19 years | 0 (0.0%) | 0 (0.0%) |
| 20 to 34 years | 0 (0.0%) | 0 (0.0%) |
| 35 to 50 years | 0 (0.0%) | 0 (0.0%) |
| Total | 0 (0.0%) | 0 (0.0%) |
Fertility by Education in Hemlock
| Educational Attainment | Women with Births | Births / 1,000 Women |
| Less than High School | 0 (0.0%) | 0.0 |
| High School Diploma | 0 (0.0%) | 0.0 |
| College or Associate's Degree | 0 (0.0%) | 0.0 |
| Bachelor's Degree | 0 (0.0%) | 0.0 |
| Graduate Degree | 0 (0.0%) | 0.0 |
| Total | 0 (0.0%) | 0.0 |
Fertility by Education by Marriage Status in Hemlock
| Educational Attainment | Married | Unmarried |
| Less than High School | 0 (0.0%) | 0 (0.0%) |
| High School Diploma | 0 (0.0%) | 0 (0.0%) |
| College or Associate's Degree | 0 (0.0%) | 0 (0.0%) |
| Bachelor's Degree | 0 (0.0%) | 0 (0.0%) |
| Graduate Degree | 0 (0.0%) | 0 (0.0%) |
| Total | 0 (0.0%) | 0 (0.0%) |
Employment Characteristics in Hemlock
Employment by Class of Employer in Hemlock
Among the 328 employed individuals in Hemlock, private company employees (254 | 77.4%), not-for-profit organizations (57 | 17.4%), and state government employees (17 | 5.2%) make up the most common classes of employment.
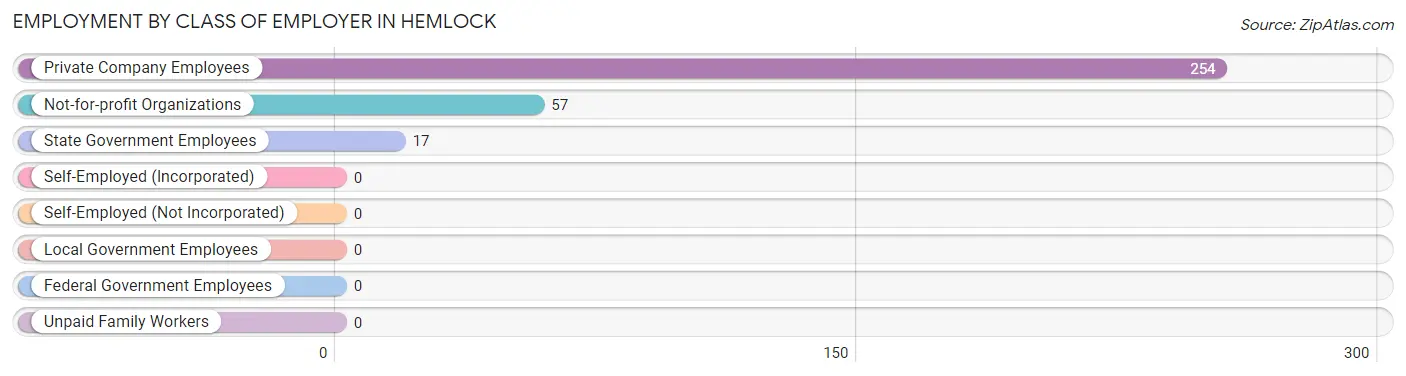
| Employer Class | # Employees | % Employees |
| Private Company Employees | 254 | 77.4% |
| Self-Employed (Incorporated) | 0 | 0.0% |
| Self-Employed (Not Incorporated) | 0 | 0.0% |
| Not-for-profit Organizations | 57 | 17.4% |
| Local Government Employees | 0 | 0.0% |
| State Government Employees | 17 | 5.2% |
| Federal Government Employees | 0 | 0.0% |
| Unpaid Family Workers | 0 | 0.0% |
| Total | 328 | 100.0% |
Employment Status by Age in Hemlock
According to the labor force statistics for Hemlock, out of the total population over 16 years of age (598), 58.2% or 348 individuals are in the labor force, with 5.7% or 20 of them unemployed. The age group with the highest labor force participation rate is 16 to 19 years, with 100.0% or 25 individuals in the labor force. Within the labor force, the 65 to 74 years age range has the highest percentage of unemployed individuals, with 100.0% or 20 of them being unemployed.
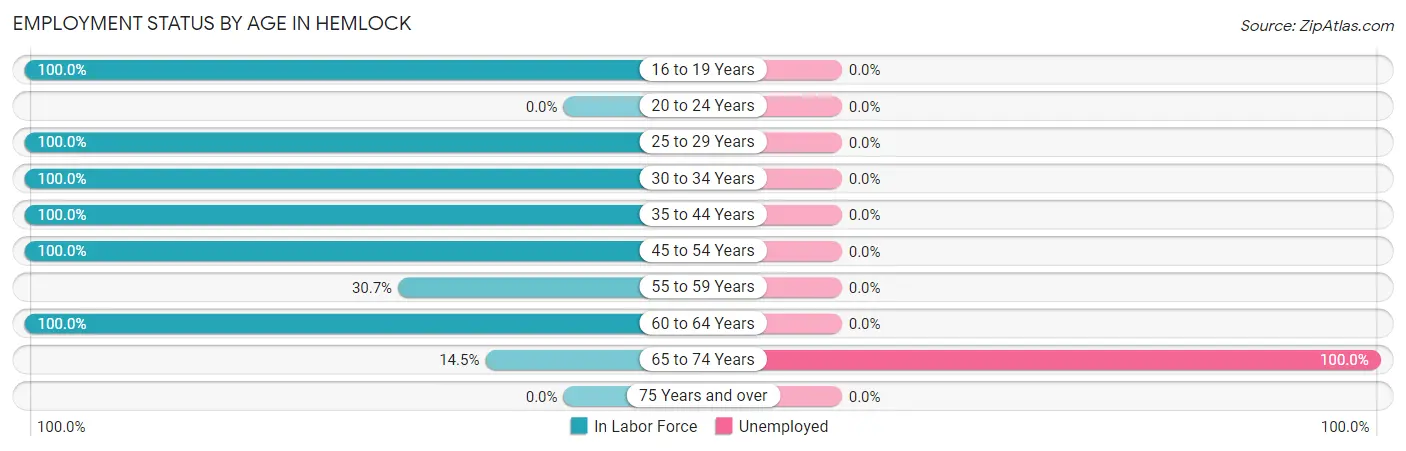
| Age Bracket | In Labor Force | Unemployed |
| 16 to 19 Years | 25 (100.0%) | 0 (0.0%) |
| 20 to 24 Years | 0 (0.0%) | 0 (0.0%) |
| 25 to 29 Years | 44 (100.0%) | 0 (0.0%) |
| 30 to 34 Years | 17 (100.0%) | 0 (0.0%) |
| 35 to 44 Years | 87 (100.0%) | 0 (0.0%) |
| 45 to 54 Years | 65 (100.0%) | 0 (0.0%) |
| 55 to 59 Years | 54 (30.7%) | 0 (0.0%) |
| 60 to 64 Years | 36 (100.0%) | 0 (0.0%) |
| 65 to 74 Years | 20 (14.5%) | 20 (100.0%) |
| 75 Years and over | 0 (0.0%) | 0 (0.0%) |
| Total | 348 (58.2%) | 20 (5.7%) |
Employment Status by Educational Attainment in Hemlock
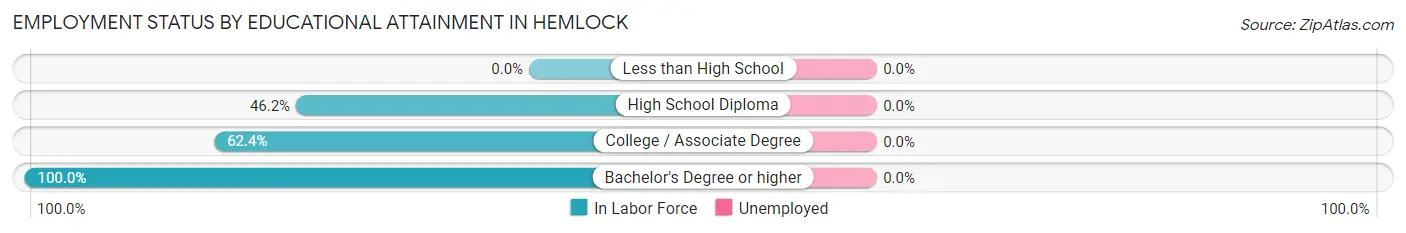
| Educational Attainment | In Labor Force | Unemployed |
| Less than High School | 0 (0.0%) | 0 (0.0%) |
| High School Diploma | 36 (46.2%) | 0 (0.0%) |
| College / Associate Degree | 133 (62.4%) | 0 (0.0%) |
| Bachelor's Degree or higher | 134 (100.0%) | 0 (0.0%) |
| Total | 303 (71.3%) | 0 (0.0%) |
Employment Occupations by Sex in Hemlock
Management, Business, Science and Arts Occupations
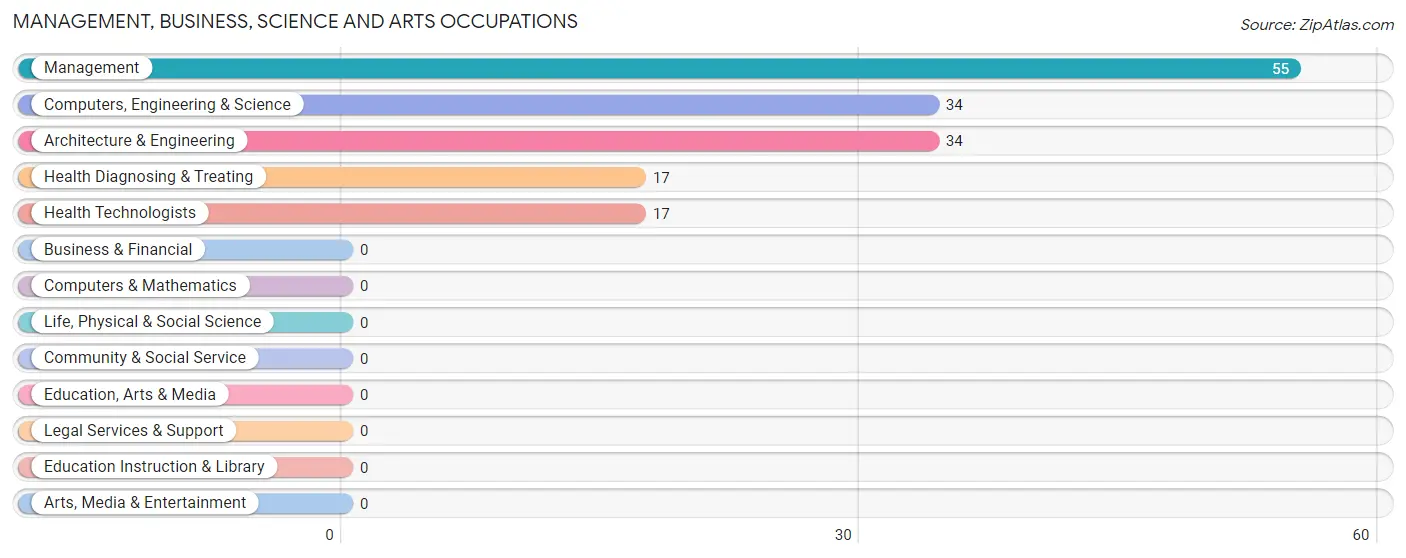
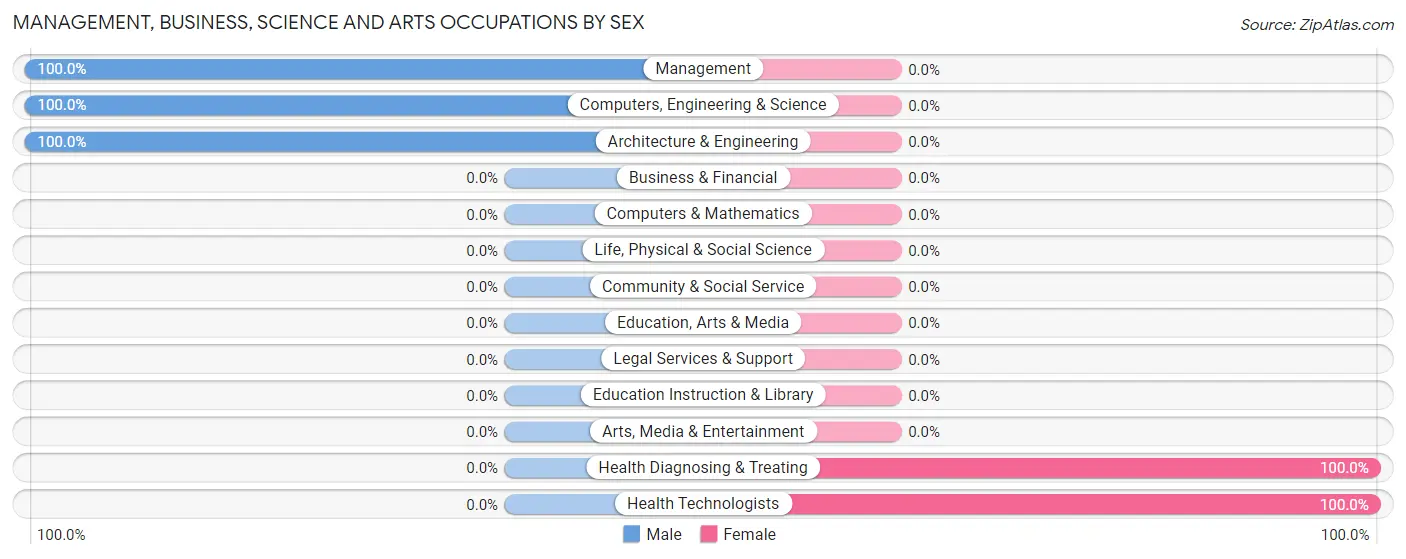
The most common Management, Business, Science and Arts occupations in Hemlock are Management (55 | 16.8%), Computers, Engineering & Science (34 | 10.4%), Architecture & Engineering (34 | 10.4%), Health Diagnosing & Treating (17 | 5.2%), and Health Technologists (17 | 5.2%).
Management, Business, Science and Arts Occupations by Sex
Within the Management, Business, Science and Arts occupations in Hemlock, the most male-oriented occupations are Management (100.0%), Computers, Engineering & Science (100.0%), and Architecture & Engineering (100.0%), while the most female-oriented occupations are Health Diagnosing & Treating (100.0%), and Health Technologists (100.0%).
| Occupation | Male | Female |
| Management | 55 (100.0%) | 0 (0.0%) |
| Business & Financial | 0 (0.0%) | 0 (0.0%) |
| Computers, Engineering & Science | 34 (100.0%) | 0 (0.0%) |
| Computers & Mathematics | 0 (0.0%) | 0 (0.0%) |
| Architecture & Engineering | 34 (100.0%) | 0 (0.0%) |
| Life, Physical & Social Science | 0 (0.0%) | 0 (0.0%) |
| Community & Social Service | 0 (0.0%) | 0 (0.0%) |
| Education, Arts & Media | 0 (0.0%) | 0 (0.0%) |
| Legal Services & Support | 0 (0.0%) | 0 (0.0%) |
| Education Instruction & Library | 0 (0.0%) | 0 (0.0%) |
| Arts, Media & Entertainment | 0 (0.0%) | 0 (0.0%) |
| Health Diagnosing & Treating | 0 (0.0%) | 17 (100.0%) |
| Health Technologists | 0 (0.0%) | 17 (100.0%) |
| Total (Category) | 89 (84.0%) | 17 (16.0%) |
| Total (Overall) | 202 (61.6%) | 126 (38.4%) |
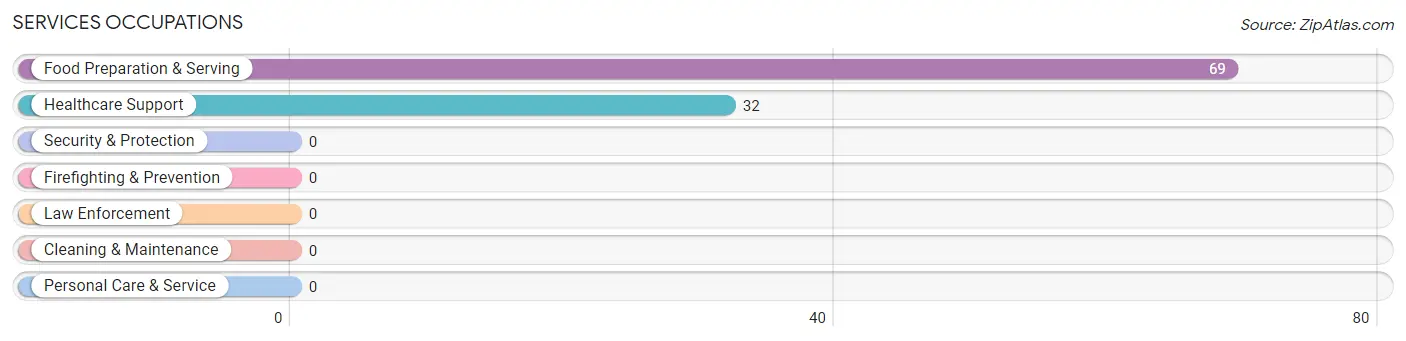
Services Occupations
The most common Services occupations in Hemlock are Food Preparation & Serving (69 | 21.0%), and Healthcare Support (32 | 9.8%).
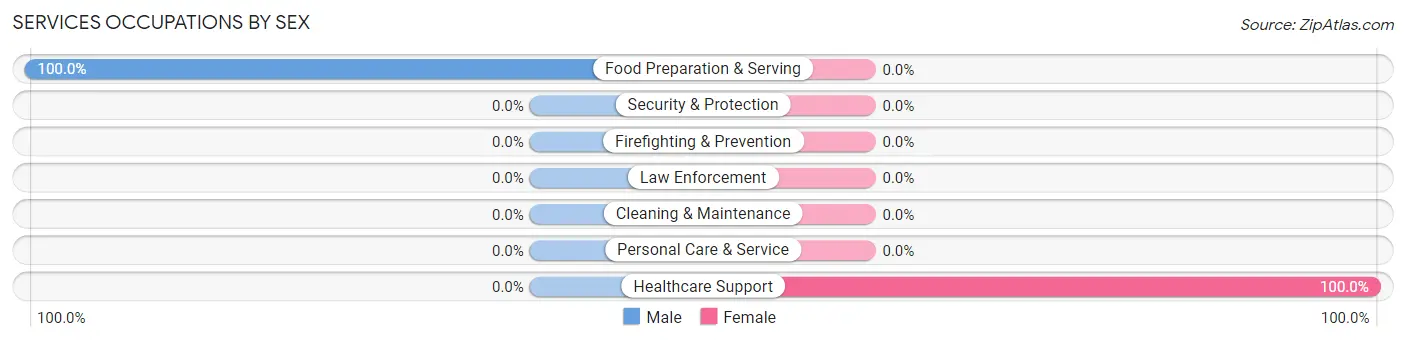
Services Occupations by Sex
| Occupation | Male | Female |
| Healthcare Support | 0 (0.0%) | 32 (100.0%) |
| Security & Protection | 0 (0.0%) | 0 (0.0%) |
| Firefighting & Prevention | 0 (0.0%) | 0 (0.0%) |
| Law Enforcement | 0 (0.0%) | 0 (0.0%) |
| Food Preparation & Serving | 69 (100.0%) | 0 (0.0%) |
| Cleaning & Maintenance | 0 (0.0%) | 0 (0.0%) |
| Personal Care & Service | 0 (0.0%) | 0 (0.0%) |
| Total (Category) | 69 (68.3%) | 32 (31.7%) |
| Total (Overall) | 202 (61.6%) | 126 (38.4%) |
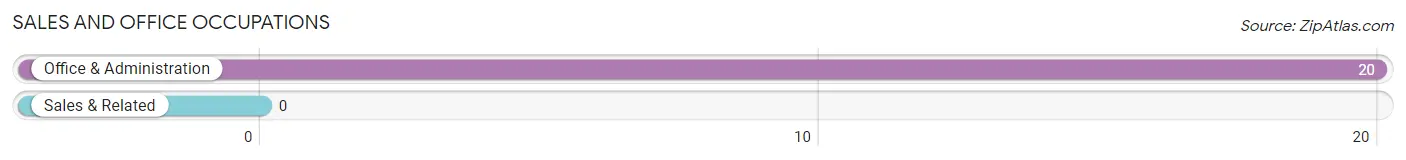
Sales and Office Occupations
The most common Sales and Office occupations in Hemlock are , and Office & Administration (20 | 6.1%).
Sales and Office Occupations by Sex
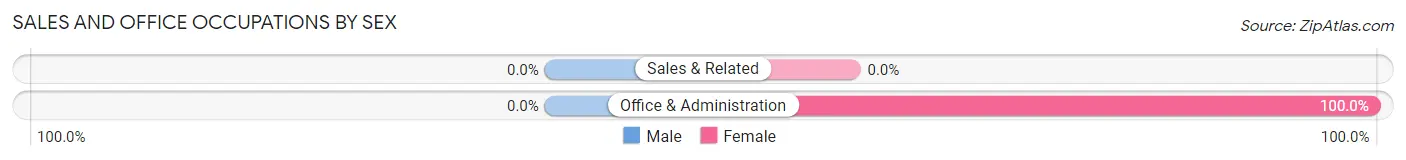
| Occupation | Male | Female |
| Sales & Related | 0 (0.0%) | 0 (0.0%) |
| Office & Administration | 0 (0.0%) | 20 (100.0%) |
| Total (Category) | 0 (0.0%) | 20 (100.0%) |
| Total (Overall) | 202 (61.6%) | 126 (38.4%) |
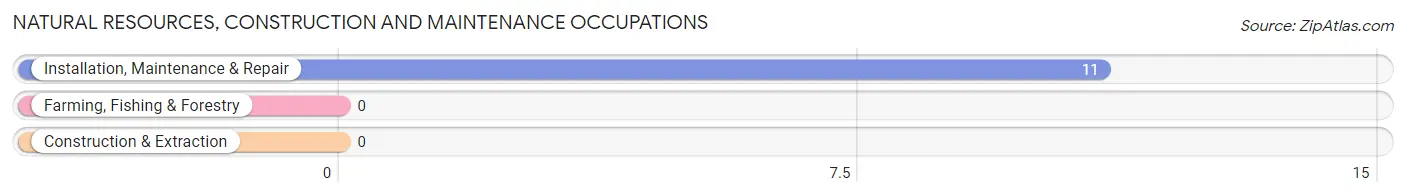
Natural Resources, Construction and Maintenance Occupations
The most common Natural Resources, Construction and Maintenance occupations in Hemlock are , and Installation, Maintenance & Repair (11 | 3.4%).
Natural Resources, Construction and Maintenance Occupations by Sex
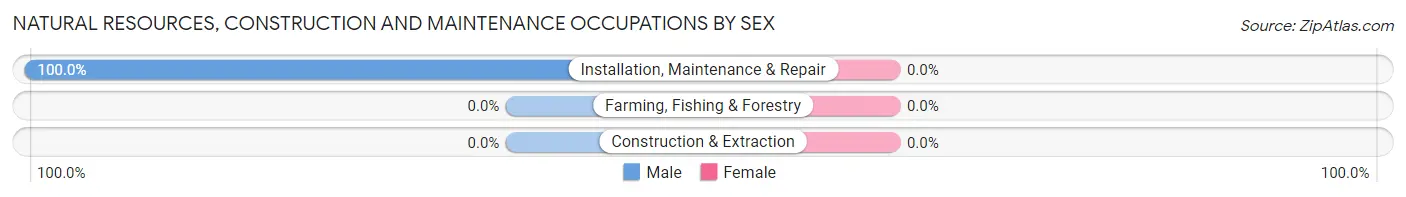
| Occupation | Male | Female |
| Farming, Fishing & Forestry | 0 (0.0%) | 0 (0.0%) |
| Construction & Extraction | 0 (0.0%) | 0 (0.0%) |
| Installation, Maintenance & Repair | 11 (100.0%) | 0 (0.0%) |
| Total (Category) | 11 (100.0%) | 0 (0.0%) |
| Total (Overall) | 202 (61.6%) | 126 (38.4%) |
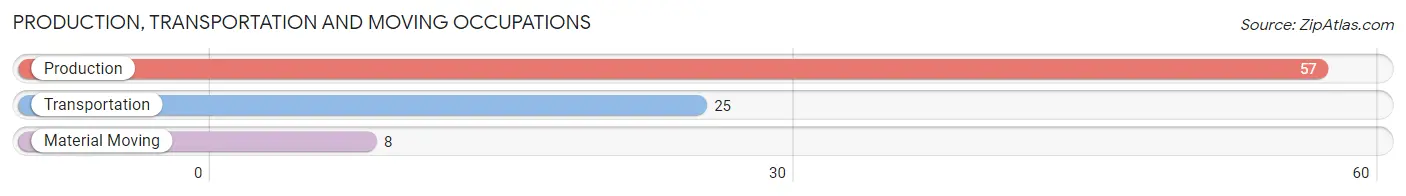
Production, Transportation and Moving Occupations
The most common Production, Transportation and Moving occupations in Hemlock are Production (57 | 17.4%), Transportation (25 | 7.6%), and Material Moving (8 | 2.4%).
Production, Transportation and Moving Occupations by Sex
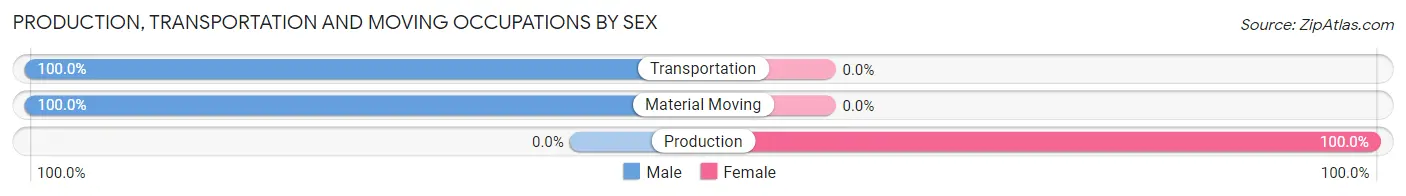
| Occupation | Male | Female |
| Production | 0 (0.0%) | 57 (100.0%) |
| Transportation | 25 (100.0%) | 0 (0.0%) |
| Material Moving | 8 (100.0%) | 0 (0.0%) |
| Total (Category) | 33 (36.7%) | 57 (63.3%) |
| Total (Overall) | 202 (61.6%) | 126 (38.4%) |
Employment Industries by Sex in Hemlock
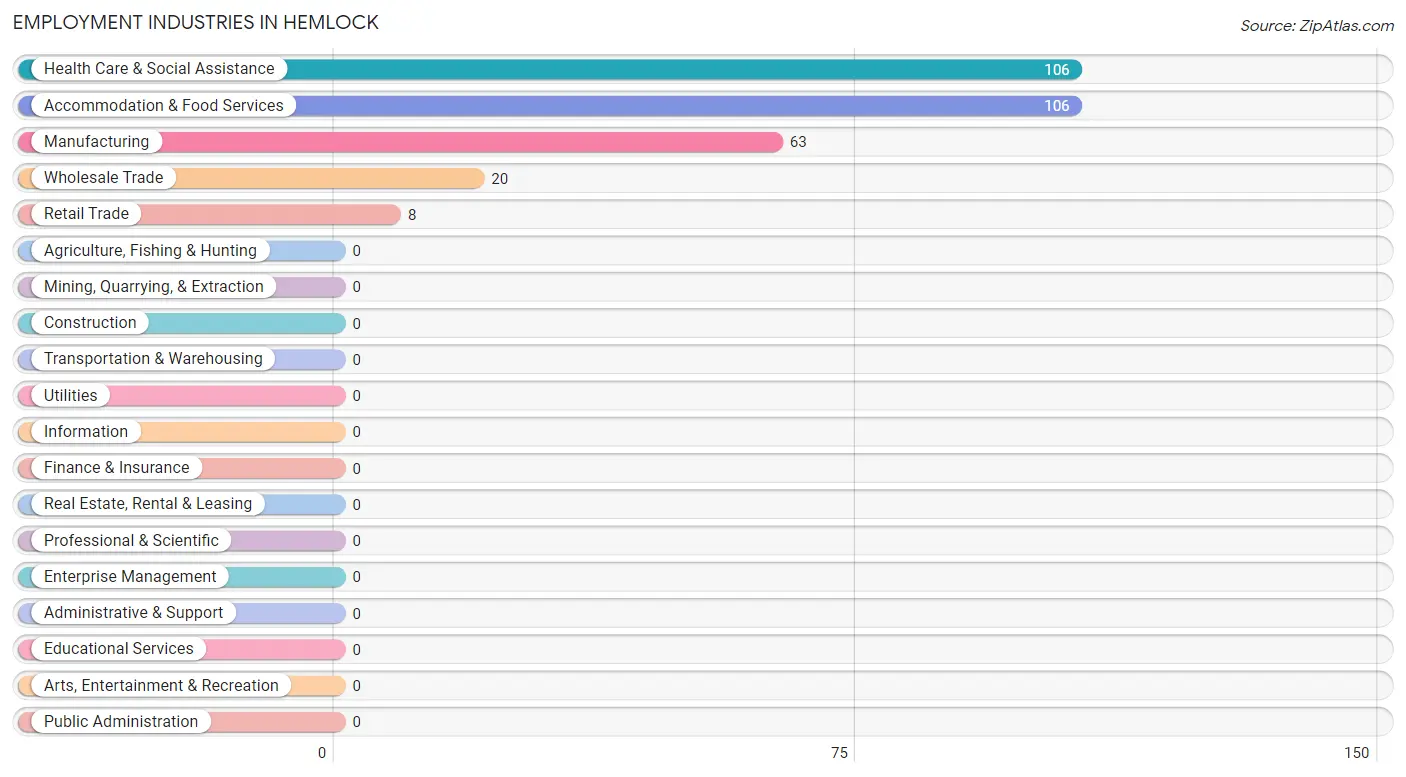
Employment Industries in Hemlock
The major employment industries in Hemlock include Health Care & Social Assistance (106 | 32.3%), Accommodation & Food Services (106 | 32.3%), Manufacturing (63 | 19.2%), Wholesale Trade (20 | 6.1%), and Retail Trade (8 | 2.4%).
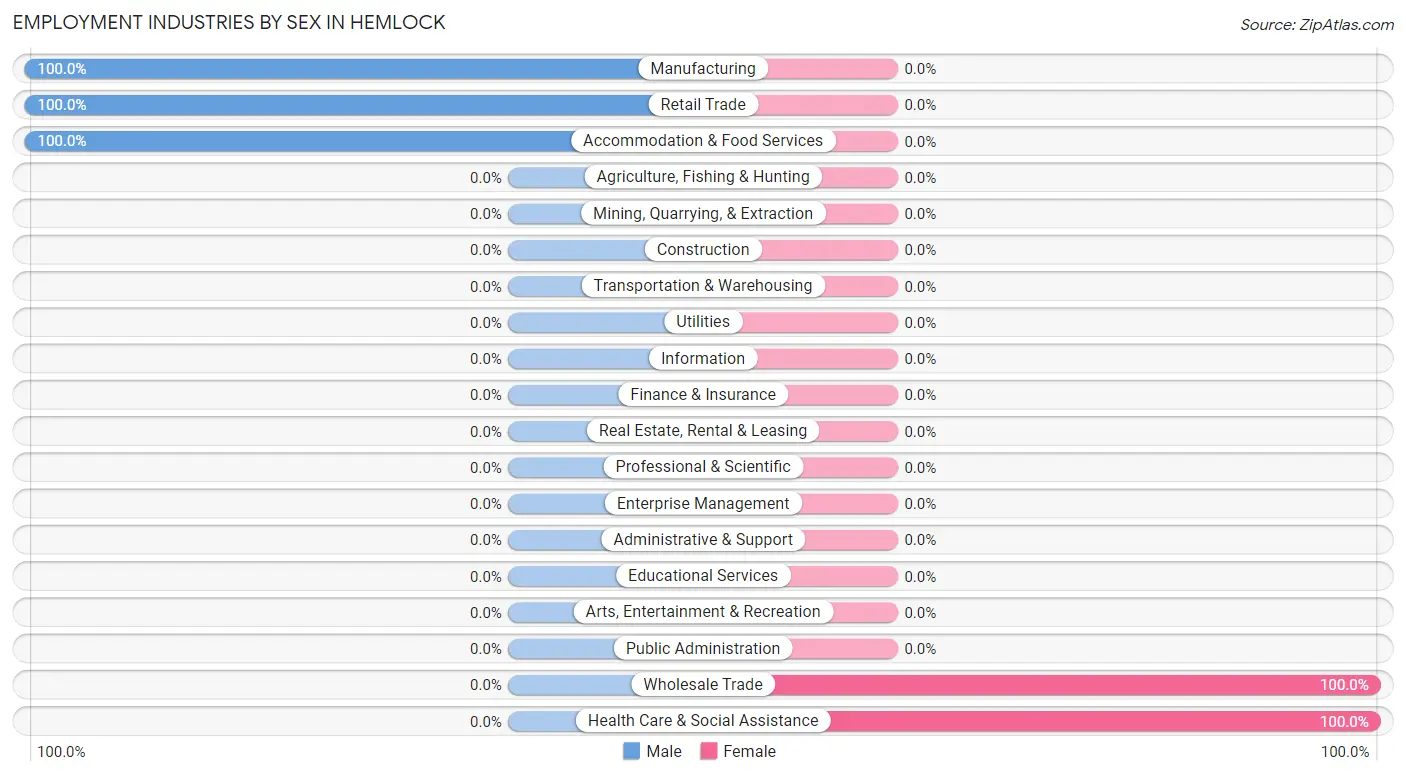
Employment Industries by Sex in Hemlock
The Hemlock industries that see more men than women are Manufacturing (100.0%), Retail Trade (100.0%), and Accommodation & Food Services (100.0%), whereas the industries that tend to have a higher number of women are Wholesale Trade (100.0%), and Health Care & Social Assistance (100.0%).
| Industry | Male | Female |
| Agriculture, Fishing & Hunting | 0 (0.0%) | 0 (0.0%) |
| Mining, Quarrying, & Extraction | 0 (0.0%) | 0 (0.0%) |
| Construction | 0 (0.0%) | 0 (0.0%) |
| Manufacturing | 63 (100.0%) | 0 (0.0%) |
| Wholesale Trade | 0 (0.0%) | 20 (100.0%) |
| Retail Trade | 8 (100.0%) | 0 (0.0%) |
| Transportation & Warehousing | 0 (0.0%) | 0 (0.0%) |
| Utilities | 0 (0.0%) | 0 (0.0%) |
| Information | 0 (0.0%) | 0 (0.0%) |
| Finance & Insurance | 0 (0.0%) | 0 (0.0%) |
| Real Estate, Rental & Leasing | 0 (0.0%) | 0 (0.0%) |
| Professional & Scientific | 0 (0.0%) | 0 (0.0%) |
| Enterprise Management | 0 (0.0%) | 0 (0.0%) |
| Administrative & Support | 0 (0.0%) | 0 (0.0%) |
| Educational Services | 0 (0.0%) | 0 (0.0%) |
| Health Care & Social Assistance | 0 (0.0%) | 106 (100.0%) |
| Arts, Entertainment & Recreation | 0 (0.0%) | 0 (0.0%) |
| Accommodation & Food Services | 106 (100.0%) | 0 (0.0%) |
| Public Administration | 0 (0.0%) | 0 (0.0%) |
| Total | 202 (61.6%) | 126 (38.4%) |
Education in Hemlock
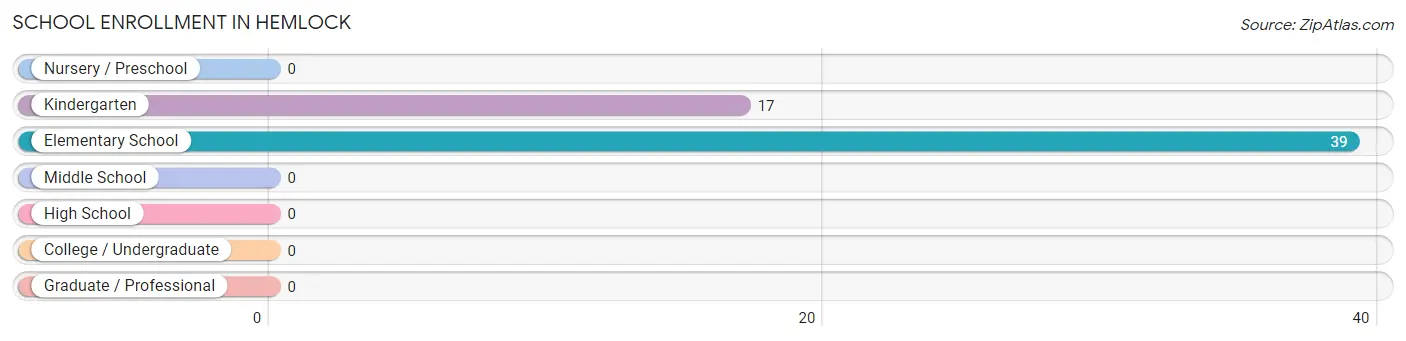
School Enrollment in Hemlock
The most common levels of schooling among the 56 students in Hemlock are elementary school (39 | 69.6%), and kindergarten (17 | 30.4%).
| School Level | # Students | % Students |
| Nursery / Preschool | 0 | 0.0% |
| Kindergarten | 17 | 30.4% |
| Elementary School | 39 | 69.6% |
| Middle School | 0 | 0.0% |
| High School | 0 | 0.0% |
| College / Undergraduate | 0 | 0.0% |
| Graduate / Professional | 0 | 0.0% |
| Total | 56 | 100.0% |
School Enrollment by Age by Funding Source in Hemlock
Out of a total of 56 students who are enrolled in schools in Hemlock, 17 (30.4%) attend a private institution, while the remaining 39 (69.6%) are enrolled in public schools. The age group of 5 to 9 year old has the highest likelihood of being enrolled in private schools, with 17 (30.4% in the age bracket) enrolled. Conversely, the age group of 5 to 9 year old has the lowest likelihood of being enrolled in a private school, with 39 (69.6% in the age bracket) attending a public institution.
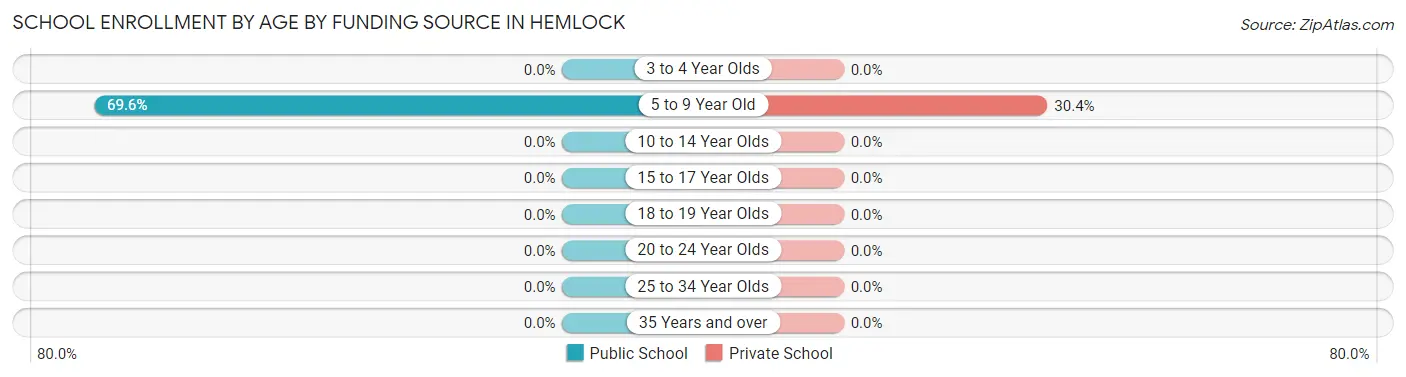
| Age Bracket | Public School | Private School |
| 3 to 4 Year Olds | 0 (0.0%) | 0 (0.0%) |
| 5 to 9 Year Old | 39 (69.6%) | 17 (30.4%) |
| 10 to 14 Year Olds | 0 (0.0%) | 0 (0.0%) |
| 15 to 17 Year Olds | 0 (0.0%) | 0 (0.0%) |
| 18 to 19 Year Olds | 0 (0.0%) | 0 (0.0%) |
| 20 to 24 Year Olds | 0 (0.0%) | 0 (0.0%) |
| 25 to 34 Year Olds | 0 (0.0%) | 0 (0.0%) |
| 35 Years and over | 0 (0.0%) | 0 (0.0%) |
| Total | 39 (69.6%) | 17 (30.4%) |
Educational Attainment by Field of Study in Hemlock
Psychology (57 | 42.5%), bio, nature & agricultural (37 | 27.6%), education (32 | 23.9%), and social sciences (8 | 6.0%) are the most common fields of study among 134 individuals in Hemlock who have obtained a bachelor's degree or higher.
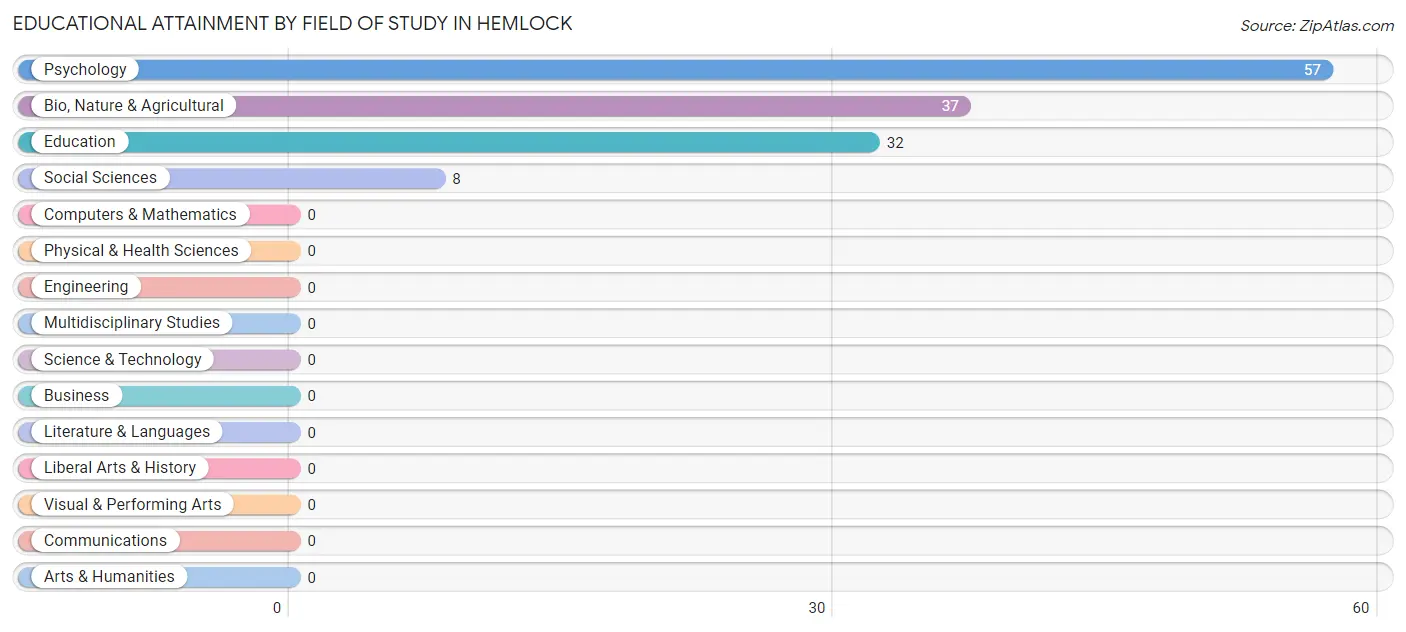
| Field of Study | # Graduates | % Graduates |
| Computers & Mathematics | 0 | 0.0% |
| Bio, Nature & Agricultural | 37 | 27.6% |
| Physical & Health Sciences | 0 | 0.0% |
| Psychology | 57 | 42.5% |
| Social Sciences | 8 | 6.0% |
| Engineering | 0 | 0.0% |
| Multidisciplinary Studies | 0 | 0.0% |
| Science & Technology | 0 | 0.0% |
| Business | 0 | 0.0% |
| Education | 32 | 23.9% |
| Literature & Languages | 0 | 0.0% |
| Liberal Arts & History | 0 | 0.0% |
| Visual & Performing Arts | 0 | 0.0% |
| Communications | 0 | 0.0% |
| Arts & Humanities | 0 | 0.0% |
| Total | 134 | 100.0% |
Transportation & Commute in Hemlock
Vehicle Availability by Sex in Hemlock
The most prevalent vehicle ownership categories in Hemlock are males with 5 or more vehicles (103, accounting for 51.0%) and females with 5 or more vehicles (0, making up 81.8%).
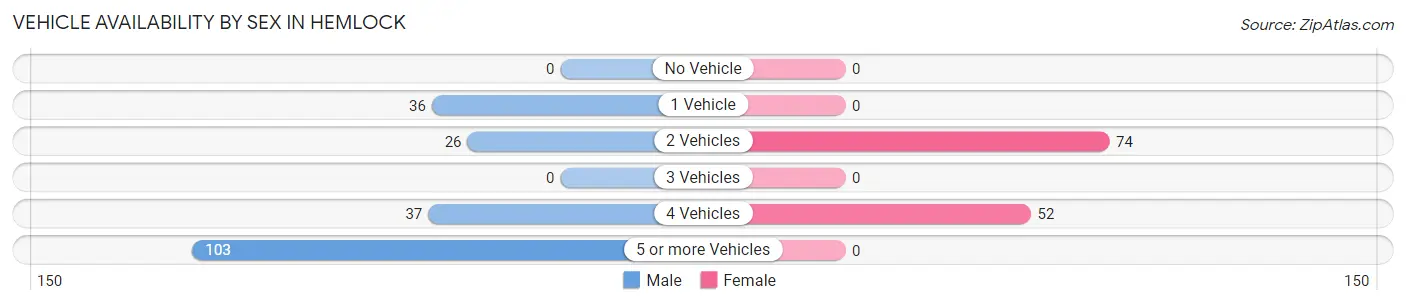
| Vehicles Available | Male | Female |
| No Vehicle | 0 (0.0%) | 0 (0.0%) |
| 1 Vehicle | 36 (17.8%) | 0 (0.0%) |
| 2 Vehicles | 26 (12.9%) | 74 (58.7%) |
| 3 Vehicles | 0 (0.0%) | 0 (0.0%) |
| 4 Vehicles | 37 (18.3%) | 52 (41.3%) |
| 5 or more Vehicles | 103 (51.0%) | 0 (0.0%) |
| Total | 202 (100.0%) | 126 (100.0%) |
Commute Time in Hemlock
The most frequently occuring commute durations in Hemlock are 40 to 44 minutes (105 commuters, 32.0%), 30 to 34 minutes (87 commuters, 26.5%), and 45 to 59 minutes (66 commuters, 20.1%).
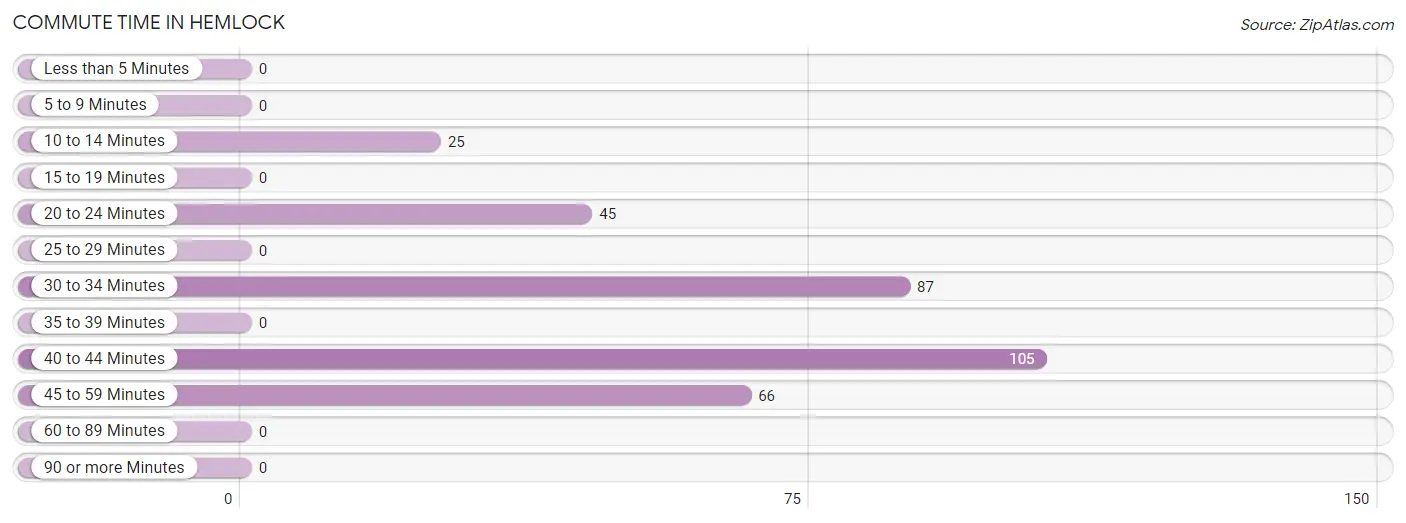
| Commute Time | # Commuters | % Commuters |
| Less than 5 Minutes | 0 | 0.0% |
| 5 to 9 Minutes | 0 | 0.0% |
| 10 to 14 Minutes | 25 | 7.6% |
| 15 to 19 Minutes | 0 | 0.0% |
| 20 to 24 Minutes | 45 | 13.7% |
| 25 to 29 Minutes | 0 | 0.0% |
| 30 to 34 Minutes | 87 | 26.5% |
| 35 to 39 Minutes | 0 | 0.0% |
| 40 to 44 Minutes | 105 | 32.0% |
| 45 to 59 Minutes | 66 | 20.1% |
| 60 to 89 Minutes | 0 | 0.0% |
| 90 or more Minutes | 0 | 0.0% |
Commute Time by Sex in Hemlock
The most common commute times in Hemlock are 30 to 34 minutes (87 commuters, 43.1%) for males and 40 to 44 minutes (94 commuters, 74.6%) for females.
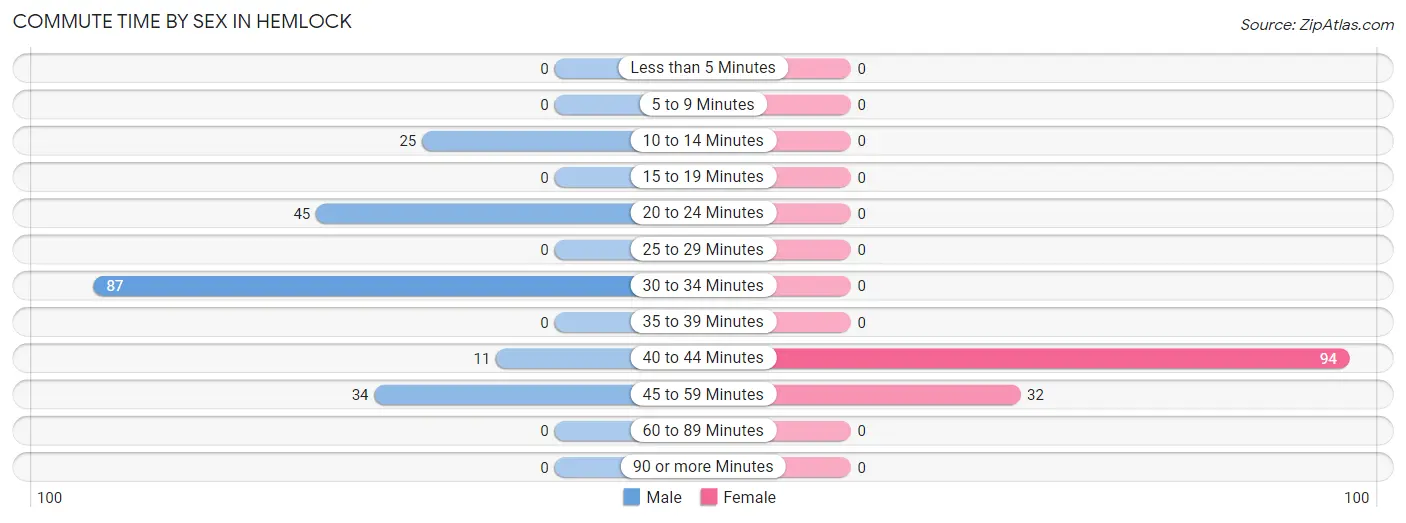
| Commute Time | Male | Female |
| Less than 5 Minutes | 0 (0.0%) | 0 (0.0%) |
| 5 to 9 Minutes | 0 (0.0%) | 0 (0.0%) |
| 10 to 14 Minutes | 25 (12.4%) | 0 (0.0%) |
| 15 to 19 Minutes | 0 (0.0%) | 0 (0.0%) |
| 20 to 24 Minutes | 45 (22.3%) | 0 (0.0%) |
| 25 to 29 Minutes | 0 (0.0%) | 0 (0.0%) |
| 30 to 34 Minutes | 87 (43.1%) | 0 (0.0%) |
| 35 to 39 Minutes | 0 (0.0%) | 0 (0.0%) |
| 40 to 44 Minutes | 11 (5.4%) | 94 (74.6%) |
| 45 to 59 Minutes | 34 (16.8%) | 32 (25.4%) |
| 60 to 89 Minutes | 0 (0.0%) | 0 (0.0%) |
| 90 or more Minutes | 0 (0.0%) | 0 (0.0%) |
Time of Departure to Work by Sex in Hemlock
The most frequent times of departure to work in Hemlock are 4:00 PM to 11:59 PM (44, 21.8%) for males and 7:00 AM to 7:29 AM (89, 70.6%) for females.
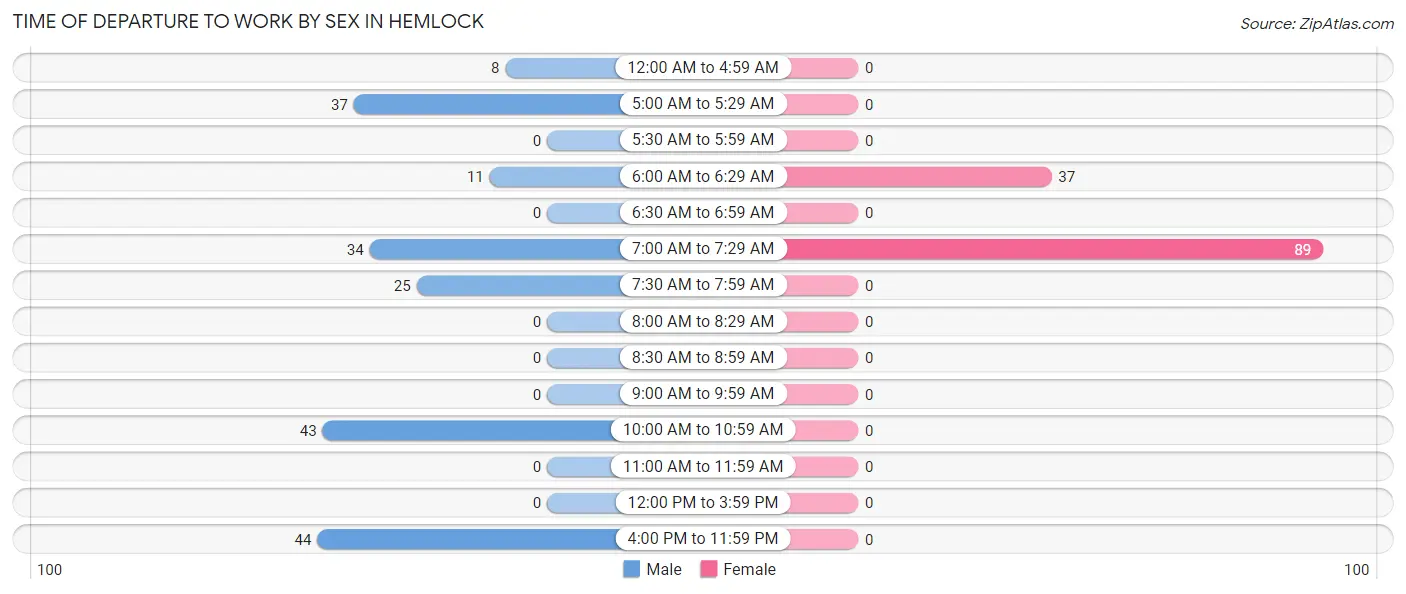
| Time of Departure | Male | Female |
| 12:00 AM to 4:59 AM | 8 (4.0%) | 0 (0.0%) |
| 5:00 AM to 5:29 AM | 37 (18.3%) | 0 (0.0%) |
| 5:30 AM to 5:59 AM | 0 (0.0%) | 0 (0.0%) |
| 6:00 AM to 6:29 AM | 11 (5.4%) | 37 (29.4%) |
| 6:30 AM to 6:59 AM | 0 (0.0%) | 0 (0.0%) |
| 7:00 AM to 7:29 AM | 34 (16.8%) | 89 (70.6%) |
| 7:30 AM to 7:59 AM | 25 (12.4%) | 0 (0.0%) |
| 8:00 AM to 8:29 AM | 0 (0.0%) | 0 (0.0%) |
| 8:30 AM to 8:59 AM | 0 (0.0%) | 0 (0.0%) |
| 9:00 AM to 9:59 AM | 0 (0.0%) | 0 (0.0%) |
| 10:00 AM to 10:59 AM | 43 (21.3%) | 0 (0.0%) |
| 11:00 AM to 11:59 AM | 0 (0.0%) | 0 (0.0%) |
| 12:00 PM to 3:59 PM | 0 (0.0%) | 0 (0.0%) |
| 4:00 PM to 11:59 PM | 44 (21.8%) | 0 (0.0%) |
| Total | 202 (100.0%) | 126 (100.0%) |
Housing Occupancy in Hemlock
Occupancy by Ownership in Hemlock
Of the total 228 dwellings in Hemlock, owner-occupied units account for 228 (100.0%), while renter-occupied units make up 0 (0.0%).
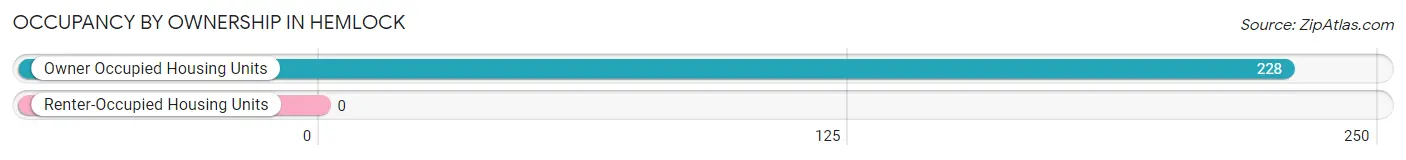
| Occupancy | # Housing Units | % Housing Units |
| Owner Occupied Housing Units | 228 | 100.0% |
| Renter-Occupied Housing Units | 0 | 0.0% |
| Total Occupied Housing Units | 228 | 100.0% |
Occupancy by Household Size in Hemlock
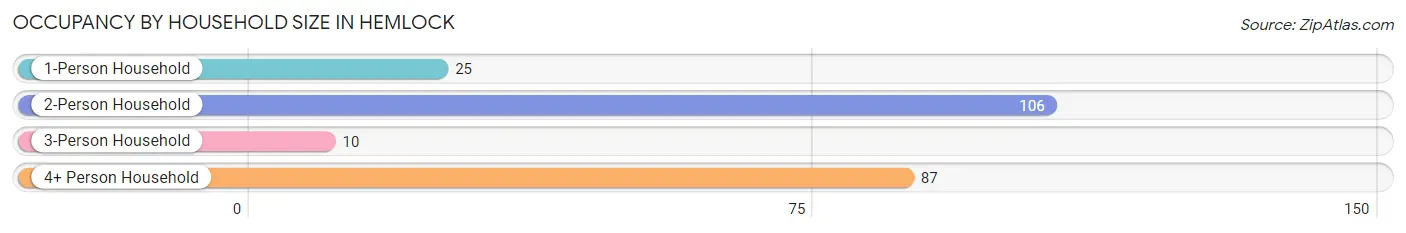
| Household Size | # Housing Units | % Housing Units |
| 1-Person Household | 25 | 11.0% |
| 2-Person Household | 106 | 46.5% |
| 3-Person Household | 10 | 4.4% |
| 4+ Person Household | 87 | 38.2% |
| Total Housing Units | 228 | 100.0% |
Occupancy by Ownership by Household Size in Hemlock
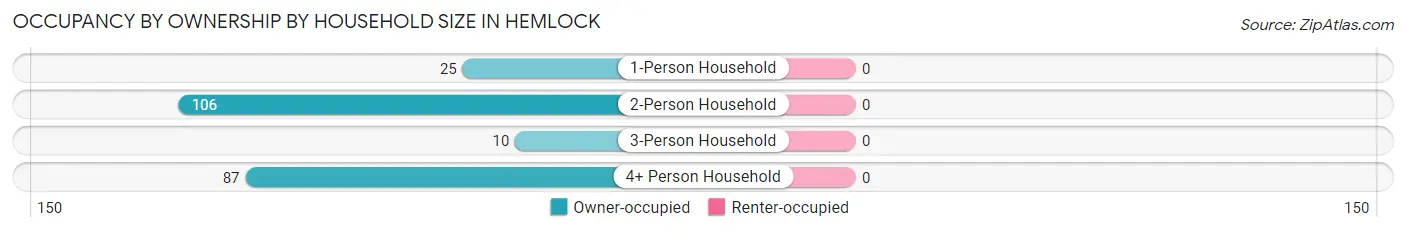
| Household Size | Owner-occupied | Renter-occupied |
| 1-Person Household | 25 (100.0%) | 0 (0.0%) |
| 2-Person Household | 106 (100.0%) | 0 (0.0%) |
| 3-Person Household | 10 (100.0%) | 0 (0.0%) |
| 4+ Person Household | 87 (100.0%) | 0 (0.0%) |
| Total Housing Units | 228 (100.0%) | 0 (0.0%) |
Occupancy by Educational Attainment in Hemlock
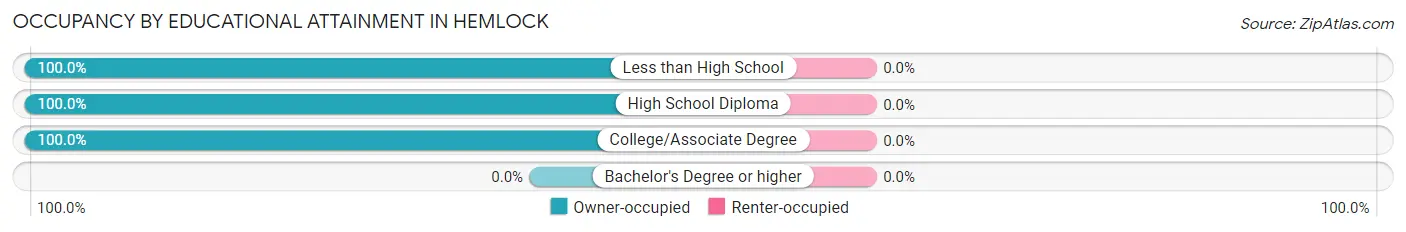
| Household Size | Owner-occupied | Renter-occupied |
| Less than High School | 10 (100.0%) | 0 (0.0%) |
| High School Diploma | 91 (100.0%) | 0 (0.0%) |
| College/Associate Degree | 127 (100.0%) | 0 (0.0%) |
| Bachelor's Degree or higher | 0 (0.0%) | 0 (0.0%) |
Occupancy by Age of Householder in Hemlock
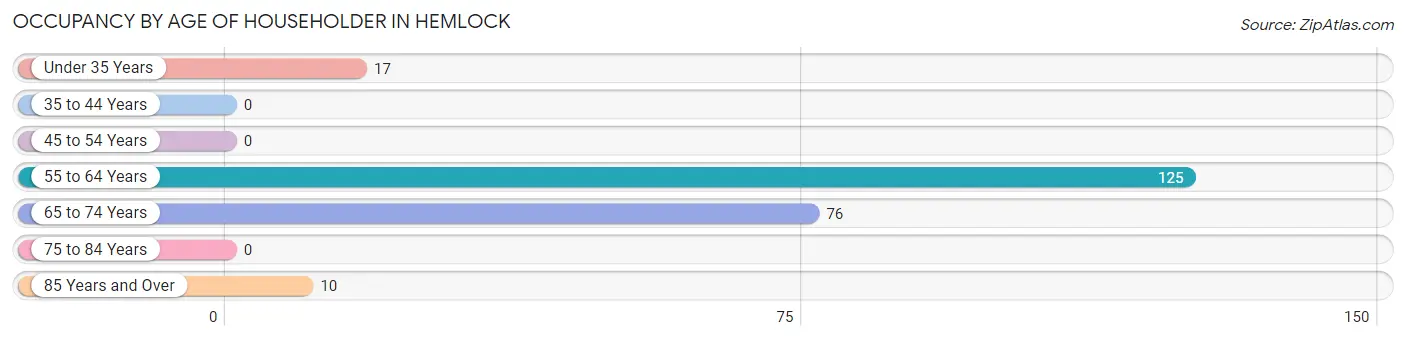
| Age Bracket | # Households | % Households |
| Under 35 Years | 17 | 7.5% |
| 35 to 44 Years | 0 | 0.0% |
| 45 to 54 Years | 0 | 0.0% |
| 55 to 64 Years | 125 | 54.8% |
| 65 to 74 Years | 76 | 33.3% |
| 75 to 84 Years | 0 | 0.0% |
| 85 Years and Over | 10 | 4.4% |
| Total | 228 | 100.0% |
Housing Finances in Hemlock
Median Income by Occupancy in Hemlock
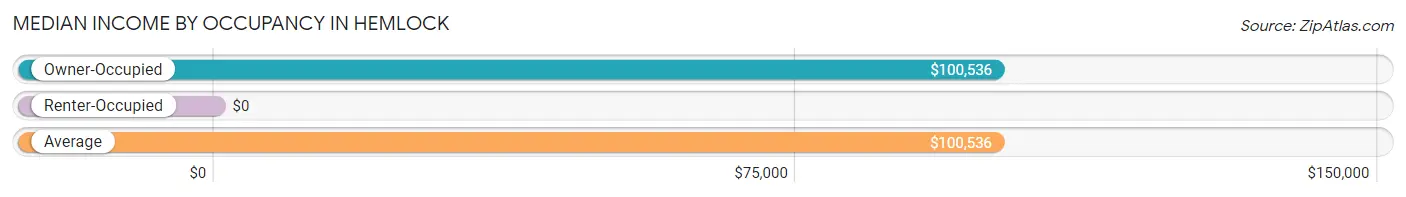
| Occupancy Type | # Households | Median Income |
| Owner-Occupied | 228 (100.0%) | $100,536 |
| Renter-Occupied | 0 (0.0%) | $0 |
| Average | 228 (100.0%) | $100,536 |
Occupancy by Householder Income Bracket in Hemlock
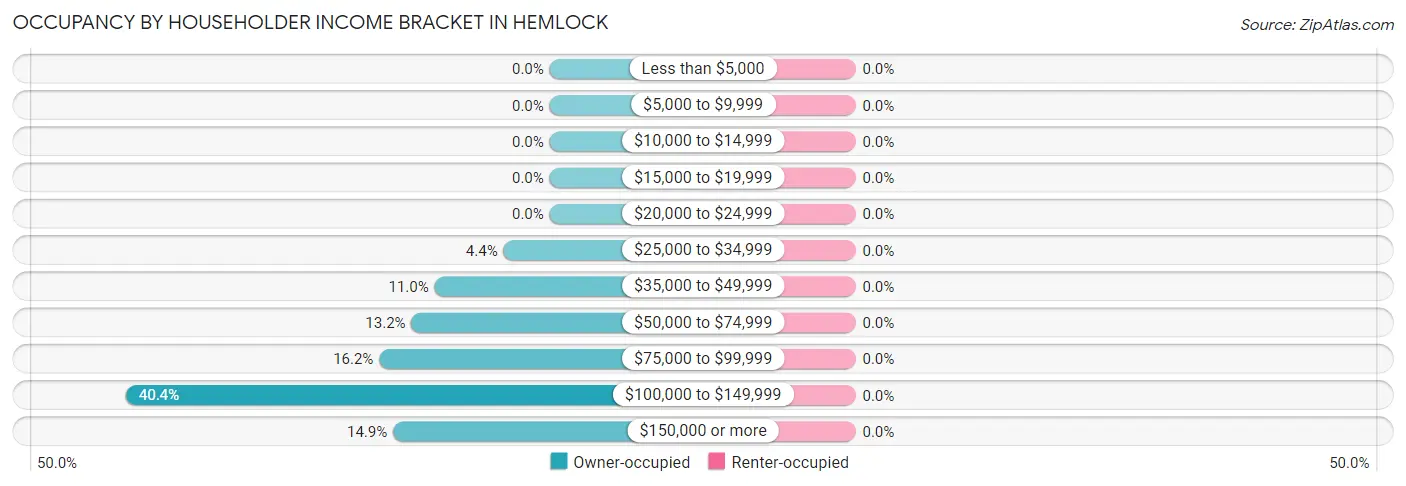
| Income Bracket | Owner-occupied | Renter-occupied |
| Less than $5,000 | 0 (0.0%) | 0 (0.0%) |
| $5,000 to $9,999 | 0 (0.0%) | 0 (0.0%) |
| $10,000 to $14,999 | 0 (0.0%) | 0 (0.0%) |
| $15,000 to $19,999 | 0 (0.0%) | 0 (0.0%) |
| $20,000 to $24,999 | 0 (0.0%) | 0 (0.0%) |
| $25,000 to $34,999 | 10 (4.4%) | 0 (0.0%) |
| $35,000 to $49,999 | 25 (11.0%) | 0 (0.0%) |
| $50,000 to $74,999 | 30 (13.2%) | 0 (0.0%) |
| $75,000 to $99,999 | 37 (16.2%) | 0 (0.0%) |
| $100,000 to $149,999 | 92 (40.4%) | 0 (0.0%) |
| $150,000 or more | 34 (14.9%) | 0 (0.0%) |
| Total | 228 (100.0%) | 0 (0.0%) |
Monthly Housing Cost Tiers in Hemlock
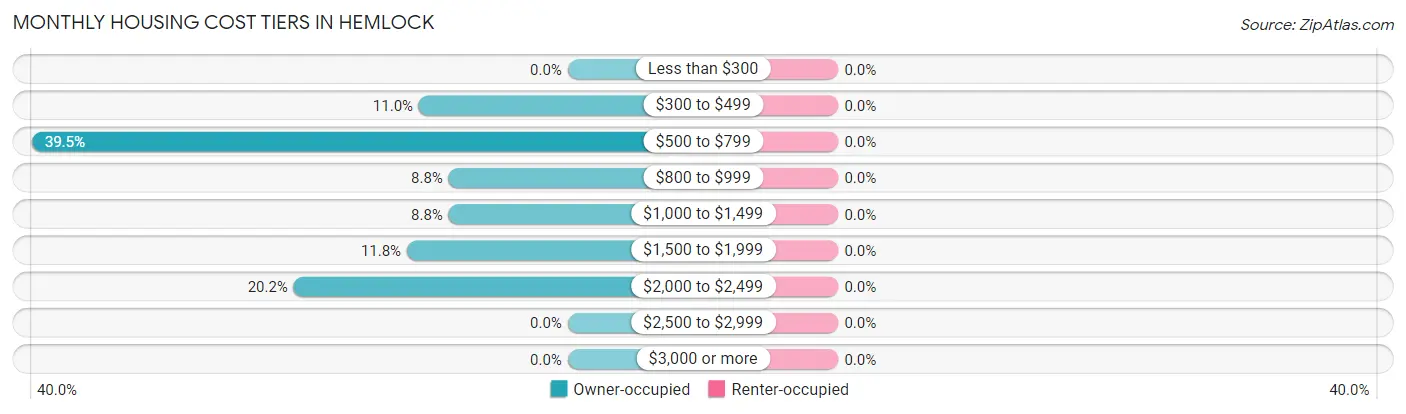
| Monthly Cost | Owner-occupied | Renter-occupied |
| Less than $300 | 0 (0.0%) | 0 (0.0%) |
| $300 to $499 | 25 (11.0%) | 0 (0.0%) |
| $500 to $799 | 90 (39.5%) | 0 (0.0%) |
| $800 to $999 | 20 (8.8%) | 0 (0.0%) |
| $1,000 to $1,499 | 20 (8.8%) | 0 (0.0%) |
| $1,500 to $1,999 | 27 (11.8%) | 0 (0.0%) |
| $2,000 to $2,499 | 46 (20.2%) | 0 (0.0%) |
| $2,500 to $2,999 | 0 (0.0%) | 0 (0.0%) |
| $3,000 or more | 0 (0.0%) | 0 (0.0%) |
| Total | 228 (100.0%) | 0 (0.0%) |
Physical Housing Characteristics in Hemlock
Housing Structures in Hemlock
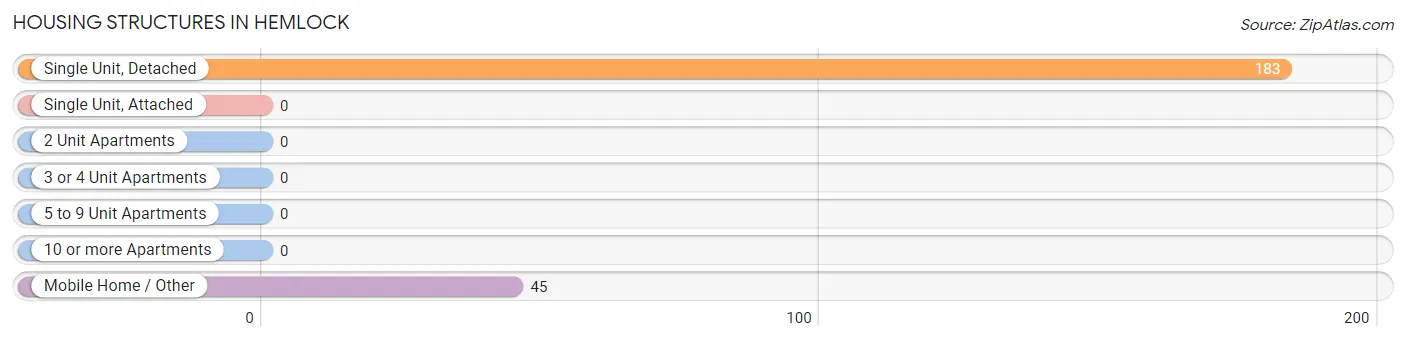
| Structure Type | # Housing Units | % Housing Units |
| Single Unit, Detached | 183 | 80.3% |
| Single Unit, Attached | 0 | 0.0% |
| 2 Unit Apartments | 0 | 0.0% |
| 3 or 4 Unit Apartments | 0 | 0.0% |
| 5 to 9 Unit Apartments | 0 | 0.0% |
| 10 or more Apartments | 0 | 0.0% |
| Mobile Home / Other | 45 | 19.7% |
| Total | 228 | 100.0% |
Housing Structures by Occupancy in Hemlock
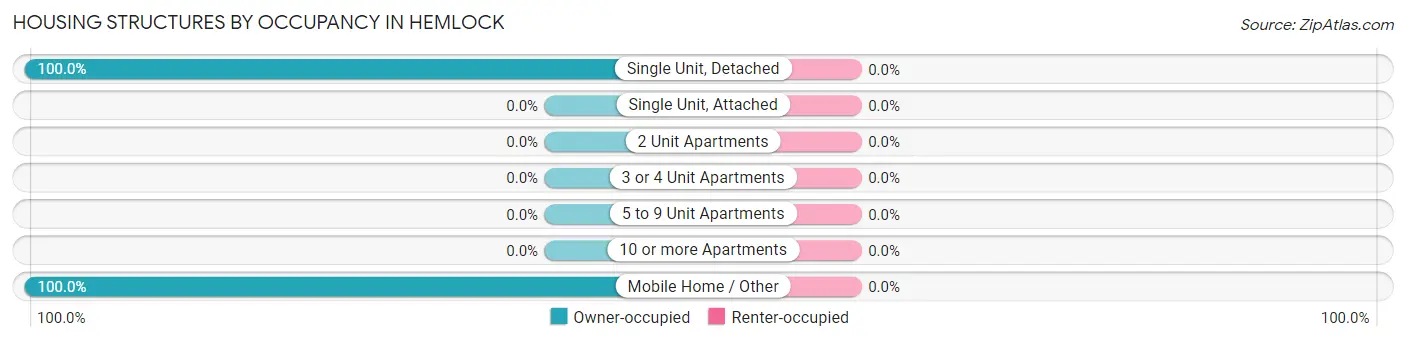
| Structure Type | Owner-occupied | Renter-occupied |
| Single Unit, Detached | 183 (100.0%) | 0 (0.0%) |
| Single Unit, Attached | 0 (0.0%) | 0 (0.0%) |
| 2 Unit Apartments | 0 (0.0%) | 0 (0.0%) |
| 3 or 4 Unit Apartments | 0 (0.0%) | 0 (0.0%) |
| 5 to 9 Unit Apartments | 0 (0.0%) | 0 (0.0%) |
| 10 or more Apartments | 0 (0.0%) | 0 (0.0%) |
| Mobile Home / Other | 45 (100.0%) | 0 (0.0%) |
| Total | 228 (100.0%) | 0 (0.0%) |
Housing Structures by Number of Rooms in Hemlock
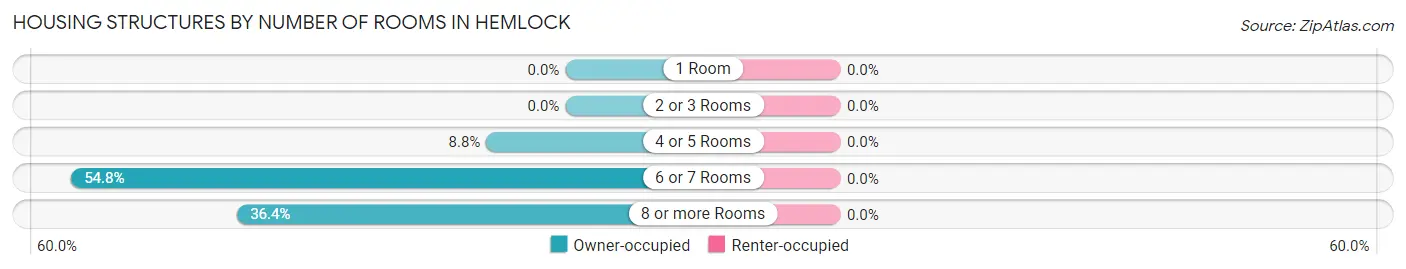
| Number of Rooms | Owner-occupied | Renter-occupied |
| 1 Room | 0 (0.0%) | 0 (0.0%) |
| 2 or 3 Rooms | 0 (0.0%) | 0 (0.0%) |
| 4 or 5 Rooms | 20 (8.8%) | 0 (0.0%) |
| 6 or 7 Rooms | 125 (54.8%) | 0 (0.0%) |
| 8 or more Rooms | 83 (36.4%) | 0 (0.0%) |
| Total | 228 (100.0%) | 0 (0.0%) |
Housing Structure by Heating Type in Hemlock
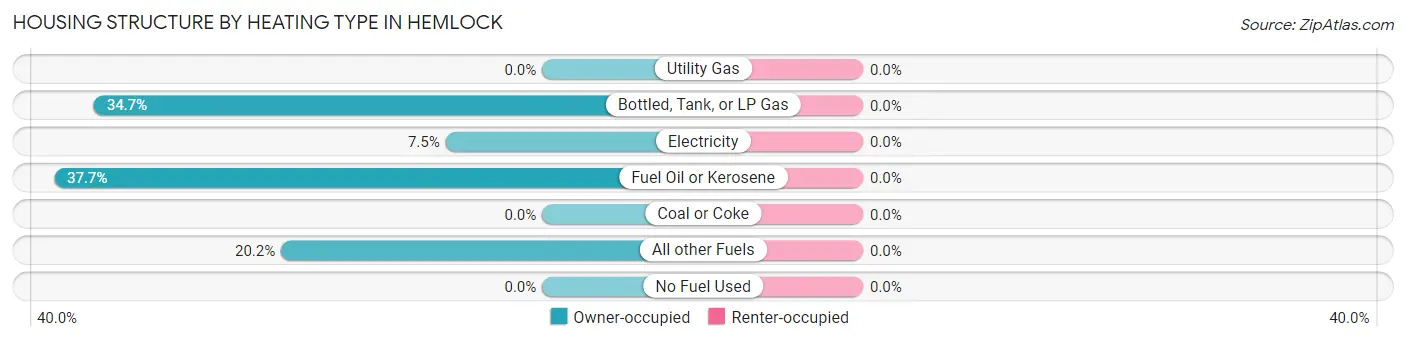
| Heating Type | Owner-occupied | Renter-occupied |
| Utility Gas | 0 (0.0%) | 0 (0.0%) |
| Bottled, Tank, or LP Gas | 79 (34.6%) | 0 (0.0%) |
| Electricity | 17 (7.5%) | 0 (0.0%) |
| Fuel Oil or Kerosene | 86 (37.7%) | 0 (0.0%) |
| Coal or Coke | 0 (0.0%) | 0 (0.0%) |
| All other Fuels | 46 (20.2%) | 0 (0.0%) |
| No Fuel Used | 0 (0.0%) | 0 (0.0%) |
| Total | 228 (100.0%) | 0 (0.0%) |
Household Vehicle Usage in Hemlock
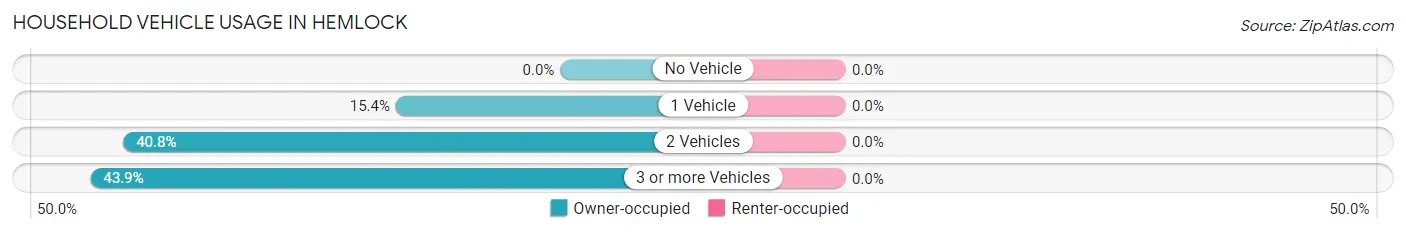
| Vehicles per Household | Owner-occupied | Renter-occupied |
| No Vehicle | 0 (0.0%) | 0 (0.0%) |
| 1 Vehicle | 35 (15.3%) | 0 (0.0%) |
| 2 Vehicles | 93 (40.8%) | 0 (0.0%) |
| 3 or more Vehicles | 100 (43.9%) | 0 (0.0%) |
| Total | 228 (100.0%) | 0 (0.0%) |
Real Estate & Mortgages in Hemlock
Real Estate and Mortgage Overview in Hemlock
| Characteristic | Without Mortgage | With Mortgage |
| Housing Units | 135 | 93 |
| Median Property Value | $159,200 | $213,100 |
| Median Household Income | $105,174 | $0 |
| Monthly Housing Costs | $615 | $0 |
| Real Estate Taxes | $2,368 | $0 |
Property Value by Mortgage Status in Hemlock
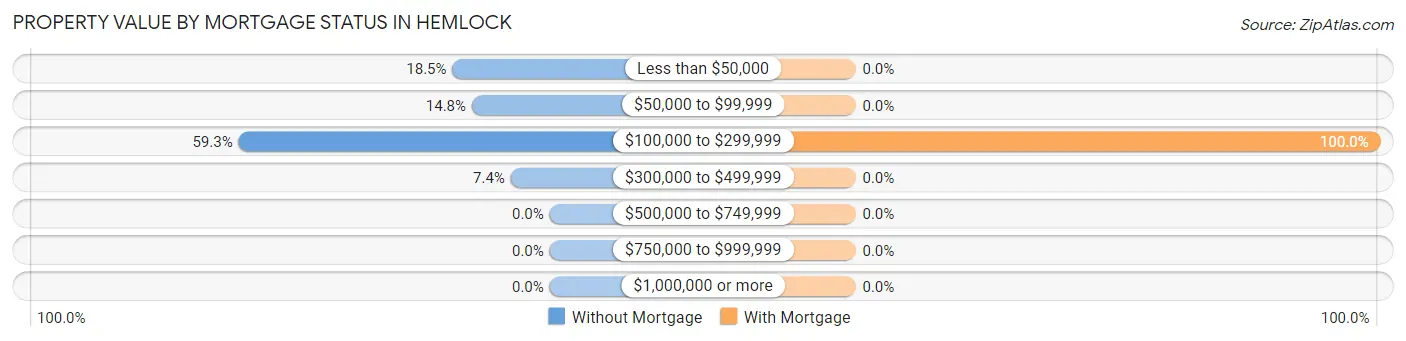
| Property Value | Without Mortgage | With Mortgage |
| Less than $50,000 | 25 (18.5%) | 0 (0.0%) |
| $50,000 to $99,999 | 20 (14.8%) | 0 (0.0%) |
| $100,000 to $299,999 | 80 (59.3%) | 93 (100.0%) |
| $300,000 to $499,999 | 10 (7.4%) | 0 (0.0%) |
| $500,000 to $749,999 | 0 (0.0%) | 0 (0.0%) |
| $750,000 to $999,999 | 0 (0.0%) | 0 (0.0%) |
| $1,000,000 or more | 0 (0.0%) | 0 (0.0%) |
| Total | 135 (100.0%) | 93 (100.0%) |
Household Income by Mortgage Status in Hemlock
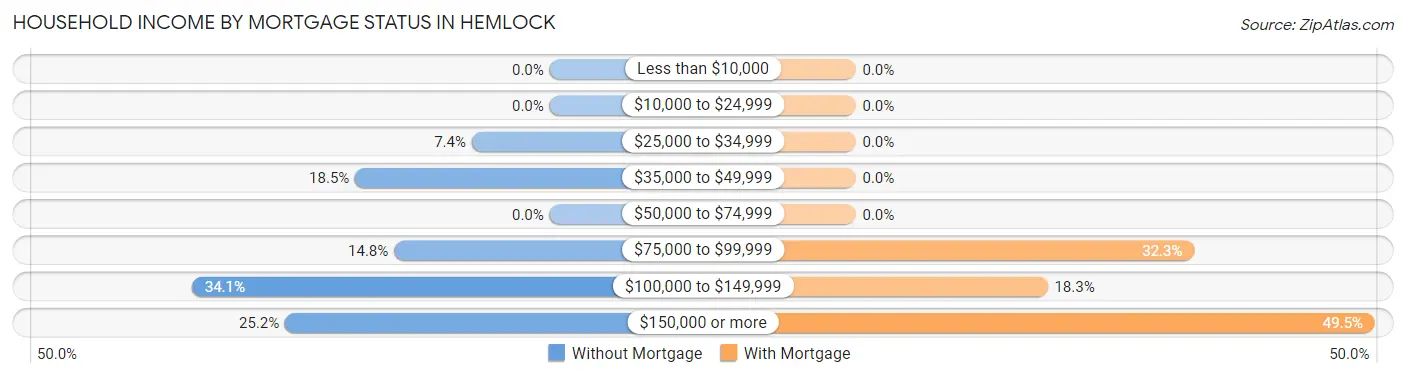
| Household Income | Without Mortgage | With Mortgage |
| Less than $10,000 | 0 (0.0%) | 0 (0.0%) |
| $10,000 to $24,999 | 0 (0.0%) | 0 (0.0%) |
| $25,000 to $34,999 | 10 (7.4%) | 0 (0.0%) |
| $35,000 to $49,999 | 25 (18.5%) | 0 (0.0%) |
| $50,000 to $74,999 | 0 (0.0%) | 0 (0.0%) |
| $75,000 to $99,999 | 20 (14.8%) | 30 (32.3%) |
| $100,000 to $149,999 | 46 (34.1%) | 17 (18.3%) |
| $150,000 or more | 34 (25.2%) | 46 (49.5%) |
| Total | 135 (100.0%) | 93 (100.0%) |
Property Value to Household Income Ratio in Hemlock
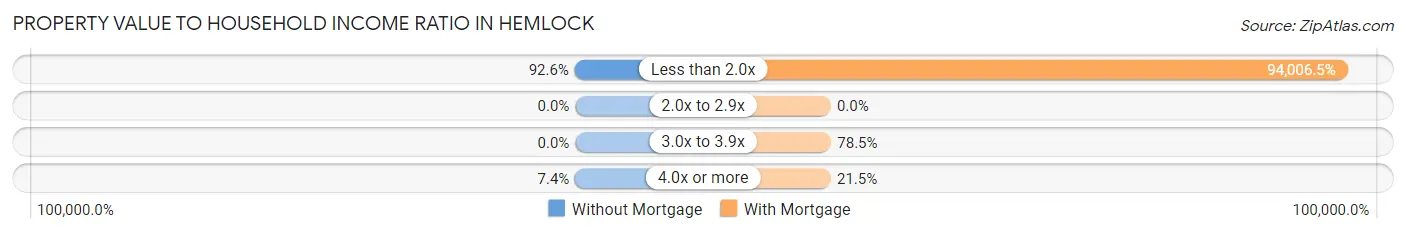
| Value-to-Income Ratio | Without Mortgage | With Mortgage |
| Less than 2.0x | 125 (92.6%) | 87,426 (94,006.4%) |
| 2.0x to 2.9x | 0 (0.0%) | 0 (0.0%) |
| 3.0x to 3.9x | 0 (0.0%) | 73 (78.5%) |
| 4.0x or more | 10 (7.4%) | 20 (21.5%) |
| Total | 135 (100.0%) | 93 (100.0%) |
Real Estate Taxes by Mortgage Status in Hemlock
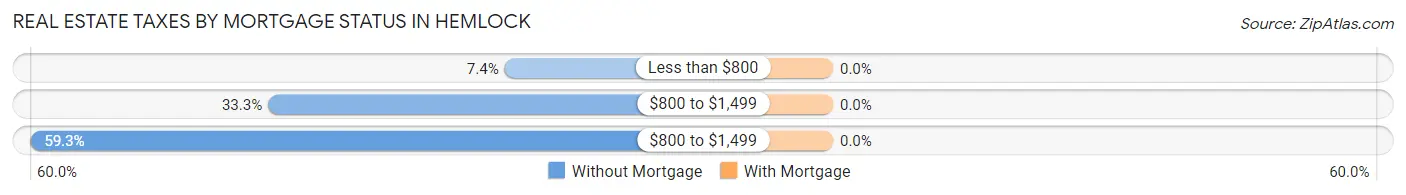
| Property Taxes | Without Mortgage | With Mortgage |
| Less than $800 | 10 (7.4%) | 0 (0.0%) |
| $800 to $1,499 | 45 (33.3%) | 0 (0.0%) |
| $800 to $1,499 | 80 (59.3%) | 0 (0.0%) |
| Total | 135 (100.0%) | 93 (100.0%) |
Health & Disability in Hemlock
Health Insurance Coverage by Age in Hemlock
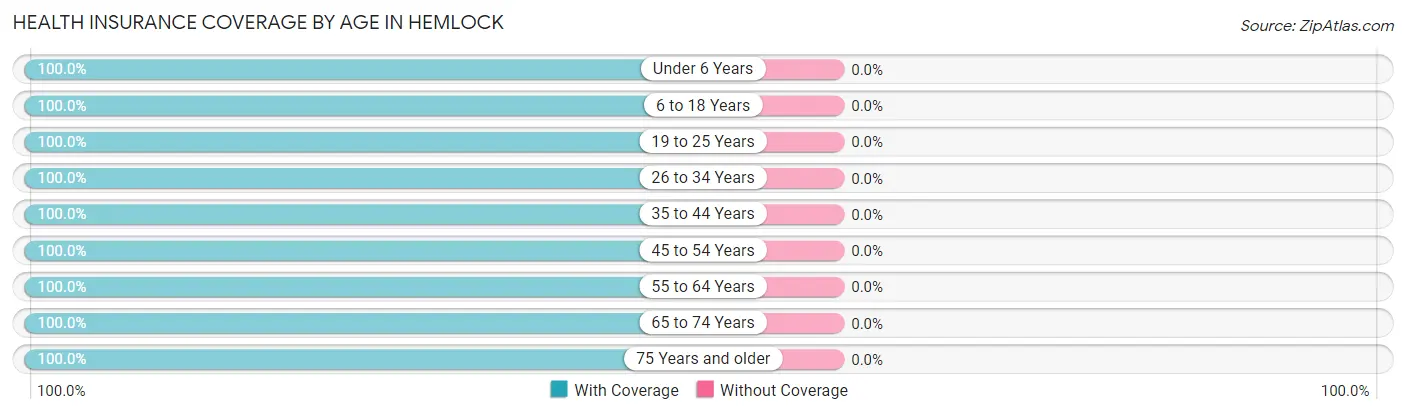
| Age Bracket | With Coverage | Without Coverage |
| Under 6 Years | 31 (100.0%) | 0 (0.0%) |
| 6 to 18 Years | 39 (100.0%) | 0 (0.0%) |
| 19 to 25 Years | 25 (100.0%) | 0 (0.0%) |
| 26 to 34 Years | 61 (100.0%) | 0 (0.0%) |
| 35 to 44 Years | 87 (100.0%) | 0 (0.0%) |
| 45 to 54 Years | 65 (100.0%) | 0 (0.0%) |
| 55 to 64 Years | 212 (100.0%) | 0 (0.0%) |
| 65 to 74 Years | 138 (100.0%) | 0 (0.0%) |
| 75 Years and older | 10 (100.0%) | 0 (0.0%) |
| Total | 668 (100.0%) | 0 (0.0%) |
Health Insurance Coverage by Citizenship Status in Hemlock
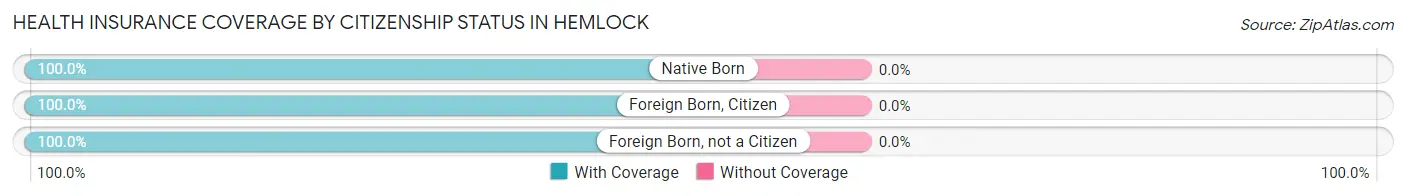
| Citizenship Status | With Coverage | Without Coverage |
| Native Born | 31 (100.0%) | 0 (0.0%) |
| Foreign Born, Citizen | 39 (100.0%) | 0 (0.0%) |
| Foreign Born, not a Citizen | 25 (100.0%) | 0 (0.0%) |
Health Insurance Coverage by Household Income in Hemlock
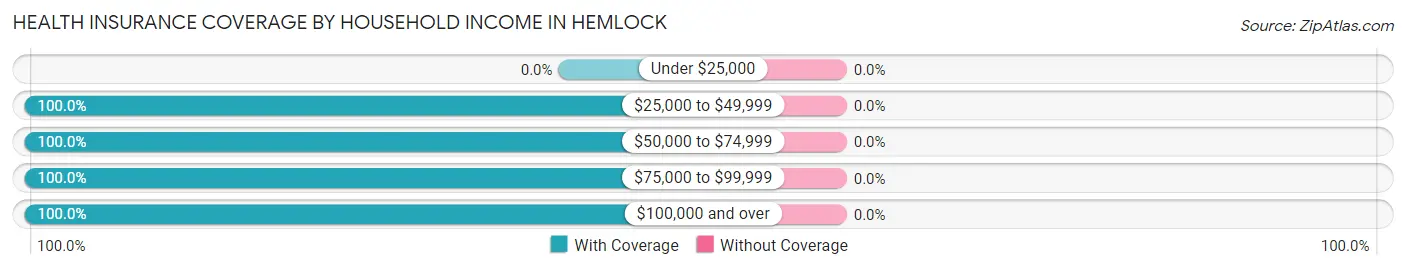
| Household Income | With Coverage | Without Coverage |
| Under $25,000 | 0 (0.0%) | 0 (0.0%) |
| $25,000 to $49,999 | 47 (100.0%) | 0 (0.0%) |
| $50,000 to $74,999 | 64 (100.0%) | 0 (0.0%) |
| $75,000 to $99,999 | 105 (100.0%) | 0 (0.0%) |
| $100,000 and over | 452 (100.0%) | 0 (0.0%) |
Public vs Private Health Insurance Coverage by Age in Hemlock
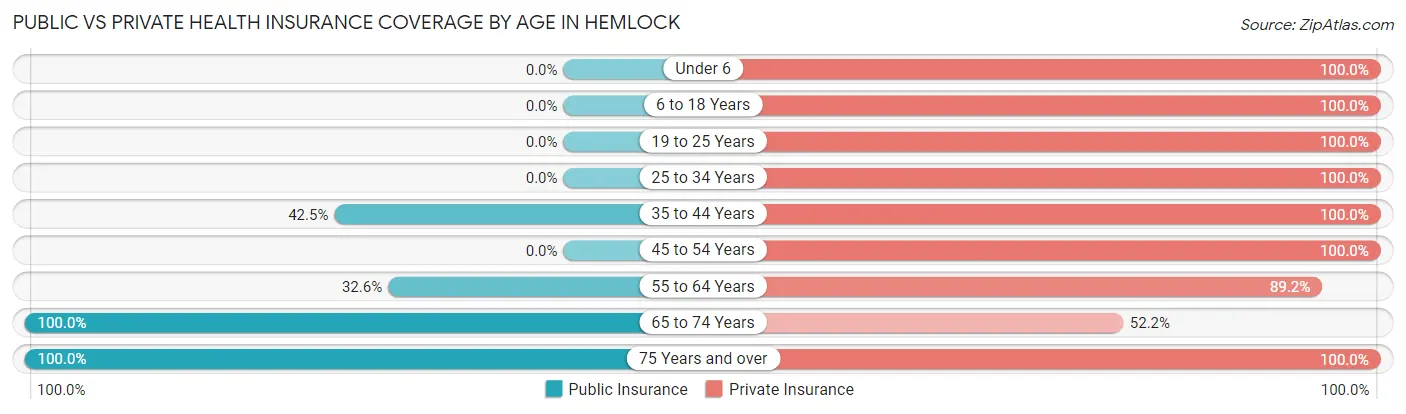
| Age Bracket | Public Insurance | Private Insurance |
| Under 6 | 0 (0.0%) | 31 (100.0%) |
| 6 to 18 Years | 0 (0.0%) | 39 (100.0%) |
| 19 to 25 Years | 0 (0.0%) | 25 (100.0%) |
| 25 to 34 Years | 0 (0.0%) | 61 (100.0%) |
| 35 to 44 Years | 37 (42.5%) | 87 (100.0%) |
| 45 to 54 Years | 0 (0.0%) | 65 (100.0%) |
| 55 to 64 Years | 69 (32.6%) | 189 (89.1%) |
| 65 to 74 Years | 138 (100.0%) | 72 (52.2%) |
| 75 Years and over | 10 (100.0%) | 10 (100.0%) |
| Total | 254 (38.0%) | 579 (86.7%) |
Disability Status by Sex by Age in Hemlock
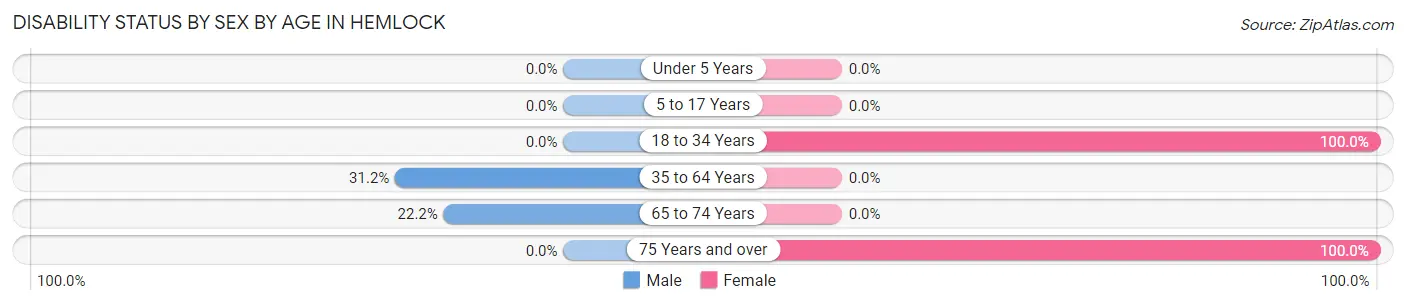
| Age Bracket | Male | Female |
| Under 5 Years | 0 (0.0%) | 0 (0.0%) |
| 5 to 17 Years | 0 (0.0%) | 0 (0.0%) |
| 18 to 34 Years | 0 (0.0%) | 17 (100.0%) |
| 35 to 64 Years | 69 (31.2%) | 0 (0.0%) |
| 65 to 74 Years | 12 (22.2%) | 0 (0.0%) |
| 75 Years and over | 0 (0.0%) | 10 (100.0%) |
Disability Class by Sex by Age in Hemlock
Disability Class: Hearing Difficulty
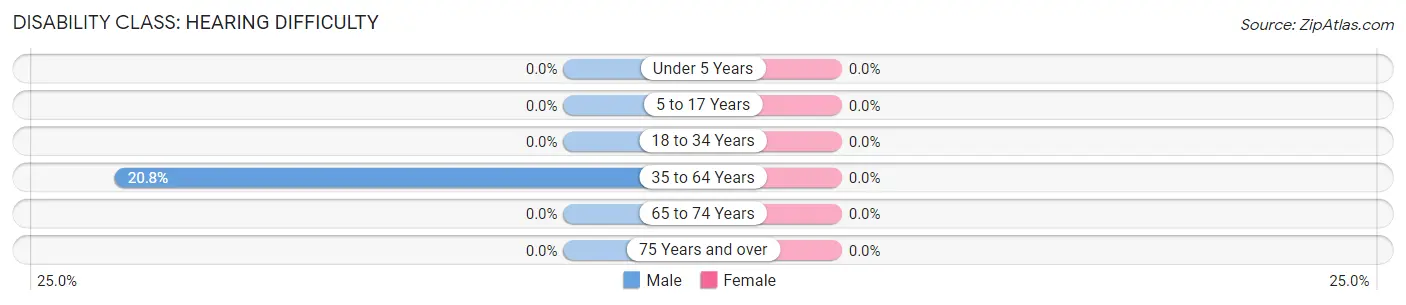
| Age Bracket | Male | Female |
| Under 5 Years | 0 (0.0%) | 0 (0.0%) |
| 5 to 17 Years | 0 (0.0%) | 0 (0.0%) |
| 18 to 34 Years | 0 (0.0%) | 0 (0.0%) |
| 35 to 64 Years | 46 (20.8%) | 0 (0.0%) |
| 65 to 74 Years | 0 (0.0%) | 0 (0.0%) |
| 75 Years and over | 0 (0.0%) | 0 (0.0%) |
Disability Class: Vision Difficulty
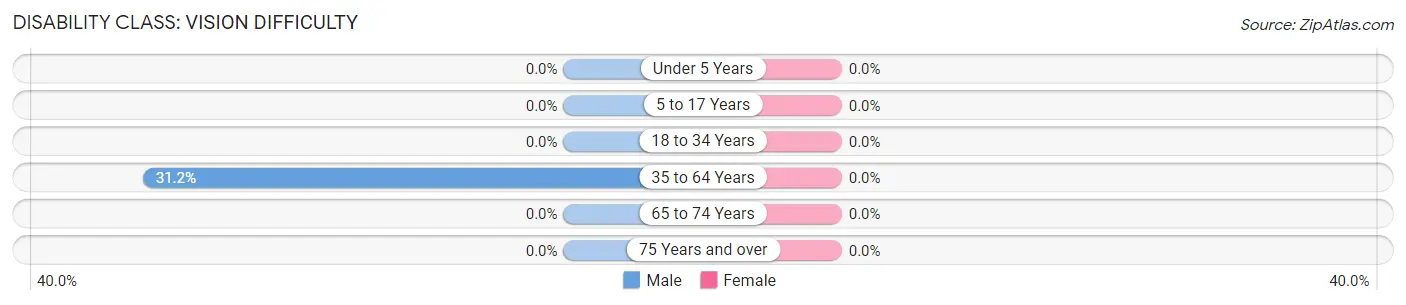
| Age Bracket | Male | Female |
| Under 5 Years | 0 (0.0%) | 0 (0.0%) |
| 5 to 17 Years | 0 (0.0%) | 0 (0.0%) |
| 18 to 34 Years | 0 (0.0%) | 0 (0.0%) |
| 35 to 64 Years | 69 (31.2%) | 0 (0.0%) |
| 65 to 74 Years | 0 (0.0%) | 0 (0.0%) |
| 75 Years and over | 0 (0.0%) | 0 (0.0%) |
Disability Class: Cognitive Difficulty
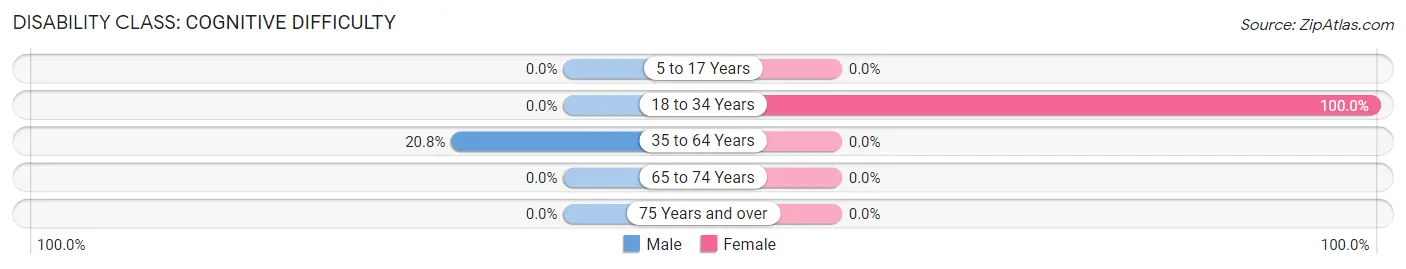
| Age Bracket | Male | Female |
| 5 to 17 Years | 0 (0.0%) | 0 (0.0%) |
| 18 to 34 Years | 0 (0.0%) | 17 (100.0%) |
| 35 to 64 Years | 46 (20.8%) | 0 (0.0%) |
| 65 to 74 Years | 0 (0.0%) | 0 (0.0%) |
| 75 Years and over | 0 (0.0%) | 0 (0.0%) |
Disability Class: Ambulatory Difficulty
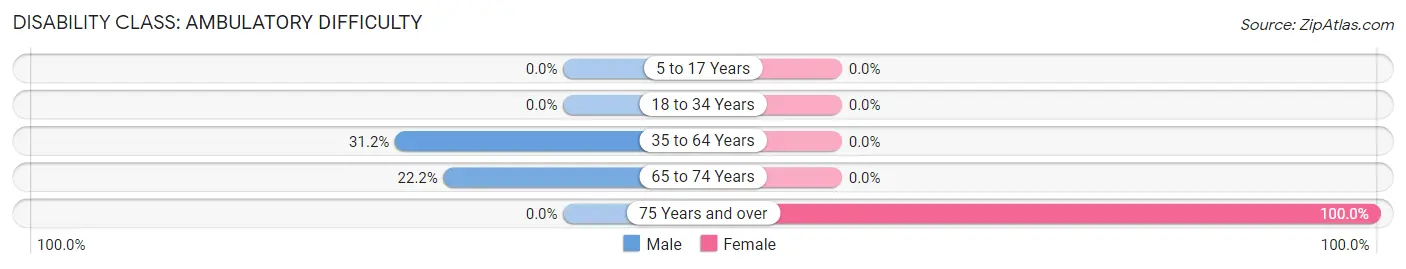
| Age Bracket | Male | Female |
| 5 to 17 Years | 0 (0.0%) | 0 (0.0%) |
| 18 to 34 Years | 0 (0.0%) | 0 (0.0%) |
| 35 to 64 Years | 69 (31.2%) | 0 (0.0%) |
| 65 to 74 Years | 12 (22.2%) | 0 (0.0%) |
| 75 Years and over | 0 (0.0%) | 10 (100.0%) |
Disability Class: Self-Care Difficulty
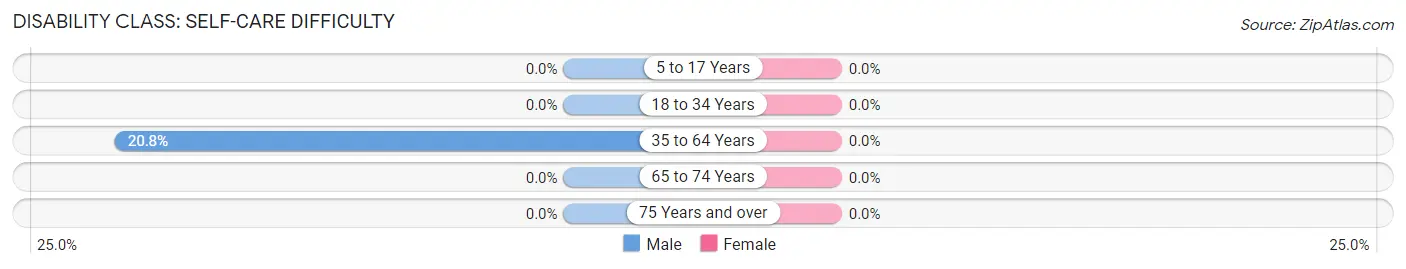
| Age Bracket | Male | Female |
| 5 to 17 Years | 0 (0.0%) | 0 (0.0%) |
| 18 to 34 Years | 0 (0.0%) | 0 (0.0%) |
| 35 to 64 Years | 46 (20.8%) | 0 (0.0%) |
| 65 to 74 Years | 0 (0.0%) | 0 (0.0%) |
| 75 Years and over | 0 (0.0%) | 0 (0.0%) |
Technology Access in Hemlock
Computing Device Access in Hemlock
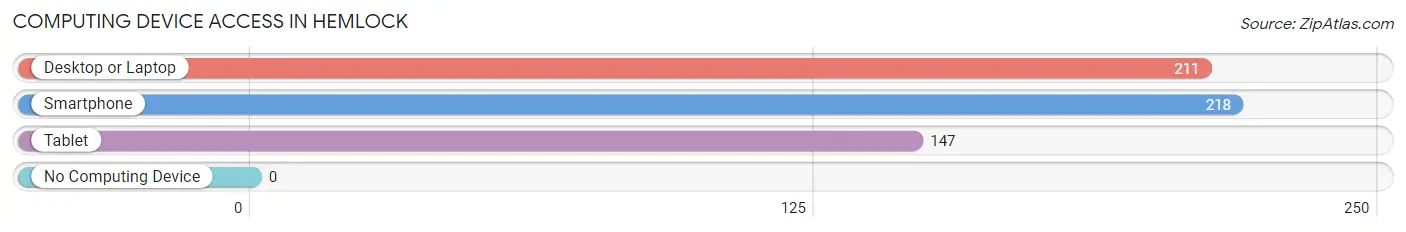
| Device Type | # Households | % Households |
| Desktop or Laptop | 211 | 92.5% |
| Smartphone | 218 | 95.6% |
| Tablet | 147 | 64.5% |
| No Computing Device | 0 | 0.0% |
| Total | 228 | 100.0% |
Internet Access in Hemlock
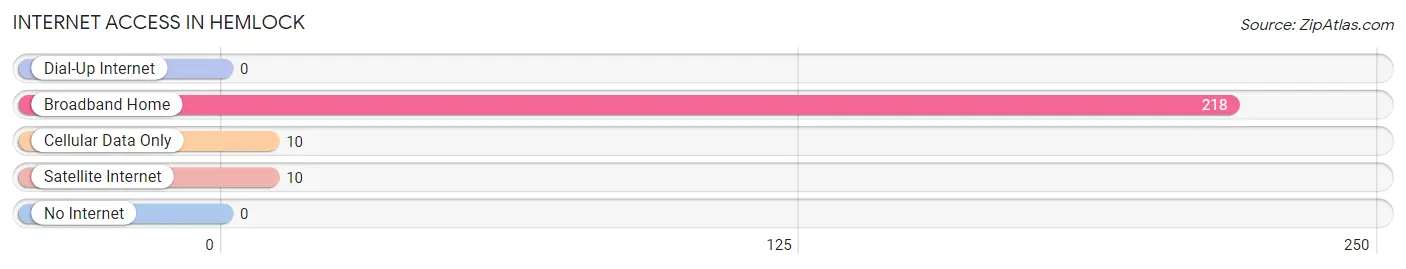
| Internet Type | # Households | % Households |
| Dial-Up Internet | 0 | 0.0% |
| Broadband Home | 218 | 95.6% |
| Cellular Data Only | 10 | 4.4% |
| Satellite Internet | 10 | 4.4% |
| No Internet | 0 | 0.0% |
| Total | 228 | 100.0% |
Hemlock Summary
Hemlock, New York is a small town located in the Finger Lakes region of New York State. It is situated in the town of Hemlock, which is part of Livingston County. The town has a population of approximately 1,500 people and is located about 25 miles south of Rochester.
History
Hemlock was first settled in 1810 by a group of settlers from Connecticut. The town was named after the hemlock trees that grew in the area. The town was officially incorporated in 1817.
In the early 19th century, Hemlock was a thriving agricultural community. The town was known for its production of apples, grapes, and other fruits. The town also had a number of mills, including a grist mill, a saw mill, and a woolen mill.
In the late 19th century, Hemlock began to experience a decline in its agricultural production. This was due to the introduction of new farming techniques and the introduction of new crops. As a result, many of the town’s residents began to look for other sources of income.
In the early 20th century, Hemlock began to experience a resurgence in its economy. This was due to the introduction of new industries, such as the manufacturing of furniture and the production of paper products. The town also experienced a growth in its population, as many people moved to the area to take advantage of the new job opportunities.
Geography
Hemlock is located in the Finger Lakes region of New York State. The town is situated in the town of Hemlock, which is part of Livingston County. The town is located about 25 miles south of Rochester.
The town is situated on the western edge of Hemlock Lake, which is the largest lake in the Finger Lakes region. The lake is a popular destination for fishing, boating, and swimming. The town is also home to several parks, including Hemlock Park and Hemlock State Forest.
Economy
Hemlock’s economy is largely based on agriculture and manufacturing. The town is known for its production of apples, grapes, and other fruits. The town also has a number of mills, including a grist mill, a saw mill, and a woolen mill.
In addition to agriculture and manufacturing, Hemlock is also home to a number of small businesses. These businesses include restaurants, retail stores, and other services. The town also has a number of tourist attractions, including the Hemlock Lake State Park and the Hemlock State Forest.
Demographics
As of the 2010 census, the population of Hemlock was 1,500. The town has a median household income of $45,000 and a median home value of $150,000. The town is predominantly white, with approximately 95% of the population being white. The town also has a small Hispanic population, with approximately 5% of the population being Hispanic.
Common Questions
What is Per Capita Income in Hemlock?
Per Capita income in Hemlock is $33,686.
What is the Median Family Income in Hemlock?
Median Family Income in Hemlock is $85,809.
What is the Median Household income in Hemlock?
Median Household Income in Hemlock is $100,536.
What is Income or Wage Gap in Hemlock?
Income or Wage Gap in Hemlock is 2.3%.
Women in Hemlock earn 97.7 cents for every dollar earned by a man.
What is Inequality or Gini Index in Hemlock?
Inequality or Gini Index in Hemlock is 0.24.
What is the Total Population of Hemlock?
Total Population of Hemlock is 668.
What is the Total Male Population of Hemlock?
Total Male Population of Hemlock is 400.
What is the Total Female Population of Hemlock?
Total Female Population of Hemlock is 268.
What is the Ratio of Males per 100 Females in Hemlock?
There are 149.25 Males per 100 Females in Hemlock.
What is the Ratio of Females per 100 Males in Hemlock?
There are 67.00 Females per 100 Males in Hemlock.
What is the Median Population Age in Hemlock?
Median Population Age in Hemlock is 55.4 Years.
What is the Average Family Size in Hemlock
Average Family Size in Hemlock is 3.0 People.
What is the Average Household Size in Hemlock
Average Household Size in Hemlock is 2.9 People.
How Large is the Labor Force in Hemlock?
There are 348 People in the Labor Forcein in Hemlock.
What is the Percentage of People in the Labor Force in Hemlock?
58.2% of People are in the Labor Force in Hemlock.
What is the Unemployment Rate in Hemlock?
Unemployment Rate in Hemlock is 5.7%.