Hawthorne, NY Map & Demographics
Hawthorne Map
Hawthorne Overview
$67,105
PER CAPITA INCOME
$168,269
AVG FAMILY INCOME
$130,816
AVG HOUSEHOLD INCOME
36.8%
WAGE / INCOME GAP [ % ]
63.2¢/ $1
WAGE / INCOME GAP [ $ ]
0.47
INEQUALITY / GINI INDEX
4,693
TOTAL POPULATION
2,344
MALE POPULATION
2,349
FEMALE POPULATION
99.79
MALES / 100 FEMALES
100.21
FEMALES / 100 MALES
47.9
MEDIAN AGE
3.3
AVG FAMILY SIZE
2.7
AVG HOUSEHOLD SIZE
2,594
LABOR FORCE [ PEOPLE ]
66.5%
PERCENT IN LABOR FORCE
6.8%
UNEMPLOYMENT RATE
Hawthorne Zip Codes
Hawthorne Area Codes
Income in Hawthorne
Income Overview in Hawthorne
Per Capita Income in Hawthorne is $67,105, while median incomes of families and households are $168,269 and $130,816 respectively.
| Characteristic | Number | Measure |
| Per Capita Income | 4,693 | $67,105 |
| Median Family Income | 1,246 | $168,269 |
| Mean Family Income | 1,246 | $218,332 |
| Median Household Income | 1,704 | $130,816 |
| Mean Household Income | 1,704 | $180,702 |
| Income Deficit | 1,246 | $0 |
| Wage / Income Gap (%) | 4,693 | 36.80% |
| Wage / Income Gap ($) | 4,693 | 63.20¢ per $1 |
| Gini / Inequality Index | 4,693 | 0.47 |
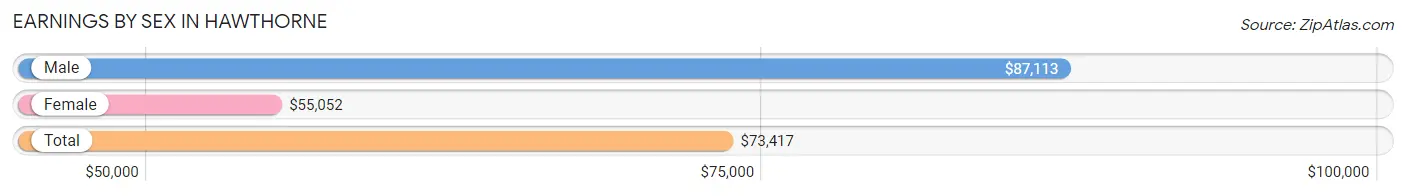
Earnings by Sex in Hawthorne
Average Earnings in Hawthorne are $73,417, $87,113 for men and $55,052 for women, a difference of 36.8%.
| Sex | Number | Average Earnings |
| Male | 1,281 (49.2%) | $87,113 |
| Female | 1,322 (50.8%) | $55,052 |
| Total | 2,603 (100.0%) | $73,417 |
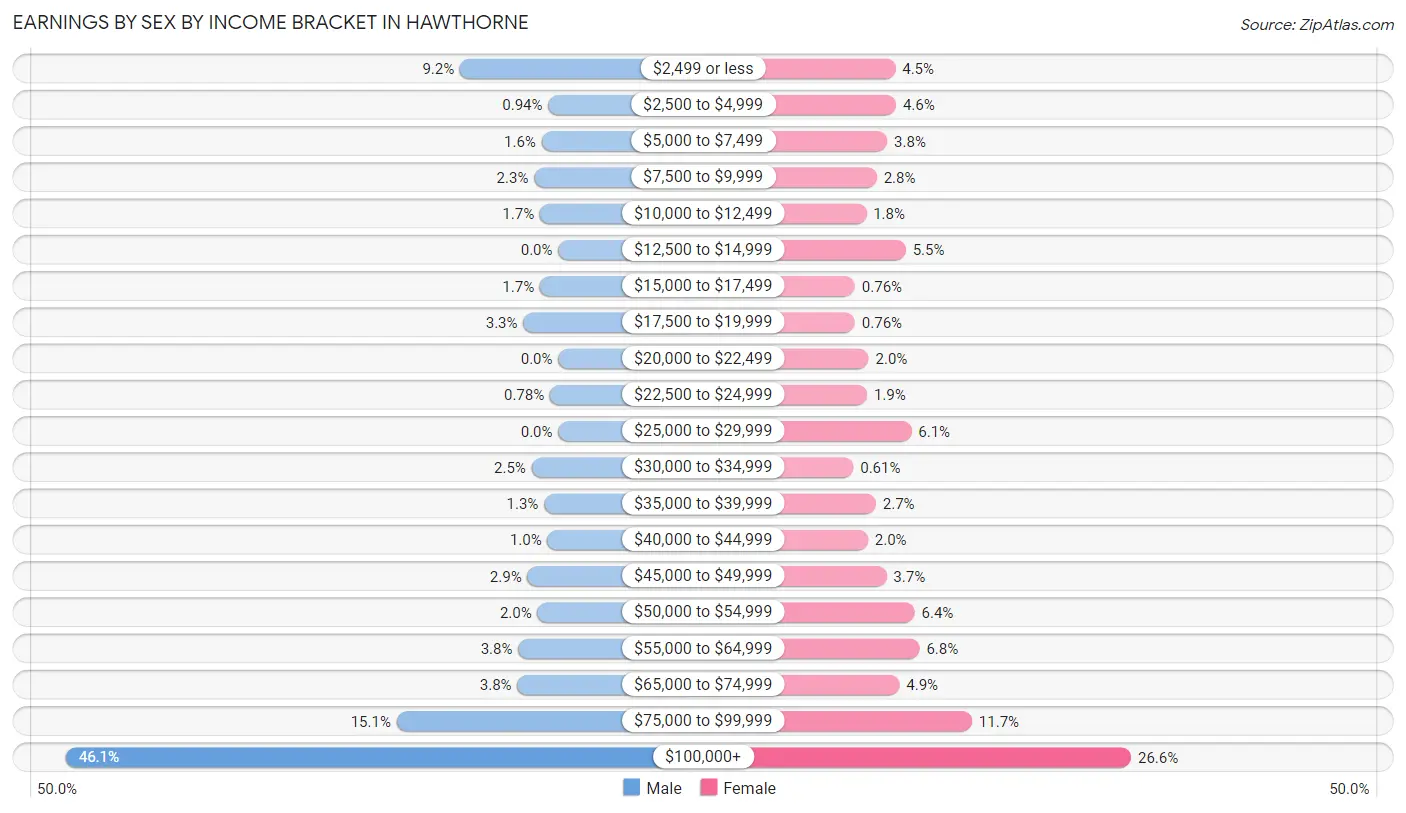
Earnings by Sex by Income Bracket in Hawthorne
The most common earnings brackets in Hawthorne are $100,000+ for men (591 | 46.1%) and $100,000+ for women (352 | 26.6%).
| Income | Male | Female |
| $2,499 or less | 118 (9.2%) | 60 (4.5%) |
| $2,500 to $4,999 | 12 (0.9%) | 61 (4.6%) |
| $5,000 to $7,499 | 20 (1.6%) | 50 (3.8%) |
| $7,500 to $9,999 | 29 (2.3%) | 37 (2.8%) |
| $10,000 to $12,499 | 22 (1.7%) | 24 (1.8%) |
| $12,500 to $14,999 | 0 (0.0%) | 73 (5.5%) |
| $15,000 to $17,499 | 22 (1.7%) | 10 (0.8%) |
| $17,500 to $19,999 | 42 (3.3%) | 10 (0.8%) |
| $20,000 to $22,499 | 0 (0.0%) | 27 (2.0%) |
| $22,500 to $24,999 | 10 (0.8%) | 25 (1.9%) |
| $25,000 to $29,999 | 0 (0.0%) | 80 (6.0%) |
| $30,000 to $34,999 | 32 (2.5%) | 8 (0.6%) |
| $35,000 to $39,999 | 17 (1.3%) | 36 (2.7%) |
| $40,000 to $44,999 | 13 (1.0%) | 26 (2.0%) |
| $45,000 to $49,999 | 37 (2.9%) | 49 (3.7%) |
| $50,000 to $54,999 | 25 (1.9%) | 84 (6.4%) |
| $55,000 to $64,999 | 48 (3.7%) | 90 (6.8%) |
| $65,000 to $74,999 | 49 (3.8%) | 65 (4.9%) |
| $75,000 to $99,999 | 194 (15.1%) | 155 (11.7%) |
| $100,000+ | 591 (46.1%) | 352 (26.6%) |
| Total | 1,281 (100.0%) | 1,322 (100.0%) |
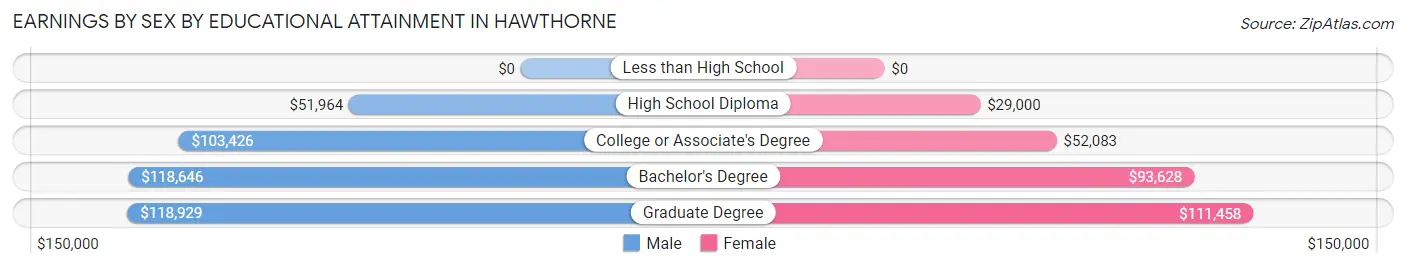
Earnings by Sex by Educational Attainment in Hawthorne
Average earnings in Hawthorne are $101,188 for men and $69,583 for women, a difference of 31.2%. Men with an educational attainment of graduate degree enjoy the highest average annual earnings of $118,929, while those with high school diploma education earn the least with $51,964. Women with an educational attainment of graduate degree earn the most with the average annual earnings of $111,458, while those with high school diploma education have the smallest earnings of $29,000.
| Educational Attainment | Male Income | Female Income |
| Less than High School | - | - |
| High School Diploma | $51,964 | $29,000 |
| College or Associate's Degree | $103,426 | $52,083 |
| Bachelor's Degree | $118,646 | $93,628 |
| Graduate Degree | $118,929 | $111,458 |
| Total | $101,188 | $69,583 |
Family Income in Hawthorne
Family Income Brackets in Hawthorne
According to the Hawthorne family income data, there are 532 families falling into the $200,000+ income range, which is the most common income bracket and makes up 42.7% of all families.
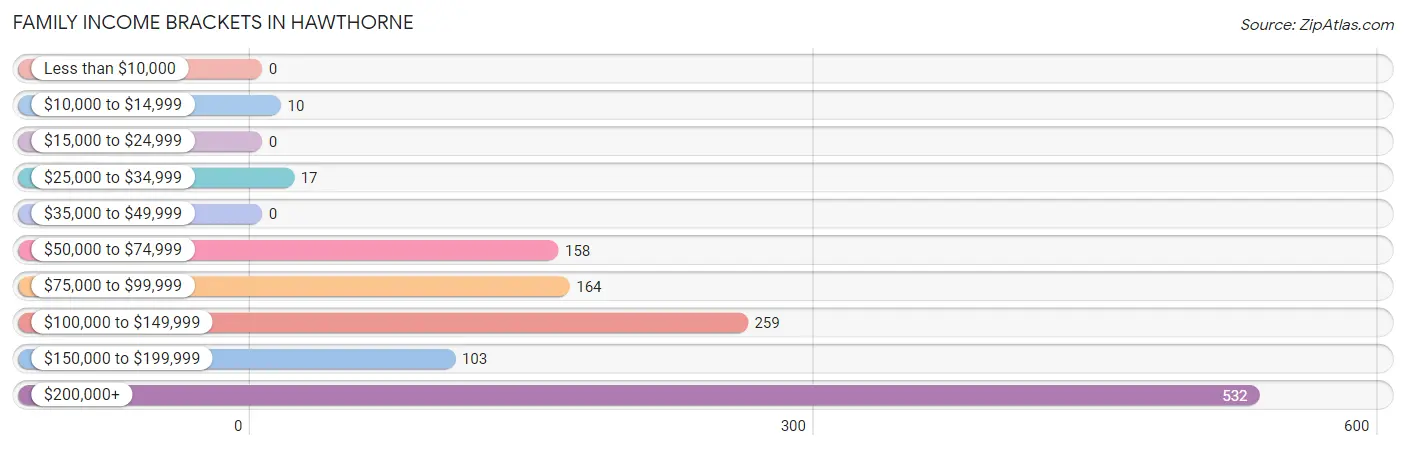
| Income Bracket | # Families | % Families |
| Less than $10,000 | 0 | 0.0% |
| $10,000 to $14,999 | 10 | 0.8% |
| $15,000 to $24,999 | 0 | 0.0% |
| $25,000 to $34,999 | 17 | 1.4% |
| $35,000 to $49,999 | 0 | 0.0% |
| $50,000 to $74,999 | 158 | 12.7% |
| $75,000 to $99,999 | 164 | 13.2% |
| $100,000 to $149,999 | 259 | 20.8% |
| $150,000 to $199,999 | 103 | 8.3% |
| $200,000+ | 532 | 42.7% |
Family Income by Famaliy Size in Hawthorne
5-person families (142 | 11.4%) account for the highest median family income in Hawthorne with $250,001 per family, while 3-person families (317 | 25.4%) have the highest median income of $68,899 per family member.
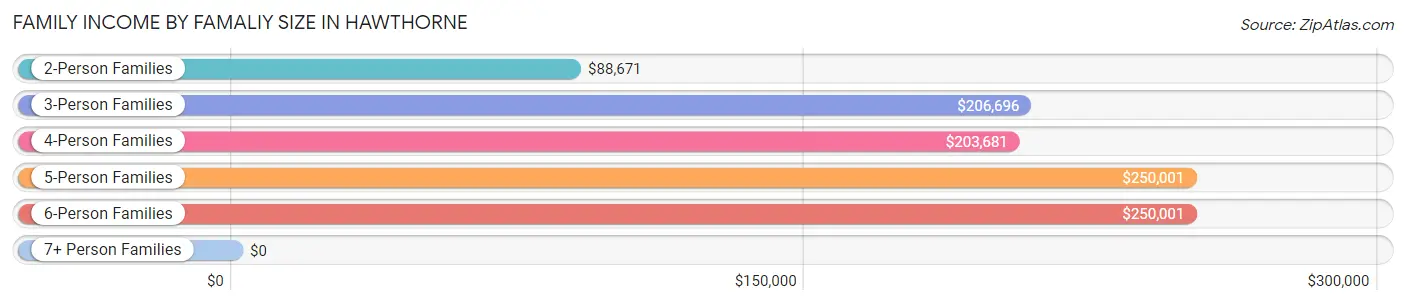
| Income Bracket | # Families | Median Income |
| 2-Person Families | 465 (37.3%) | $88,671 |
| 3-Person Families | 317 (25.4%) | $206,696 |
| 4-Person Families | 284 (22.8%) | $203,681 |
| 5-Person Families | 142 (11.4%) | $250,001 |
| 6-Person Families | 33 (2.6%) | $250,001 |
| 7+ Person Families | 5 (0.4%) | $0 |
| Total | 1,246 (100.0%) | $168,269 |
Family Income by Number of Earners in Hawthorne
The median family income in Hawthorne is $168,269, with families comprising 3+ earners (241) having the highest median family income of $250,001, while families with no earners (225) have the lowest median family income of $71,369, accounting for 19.3% and 18.1% of families, respectively.
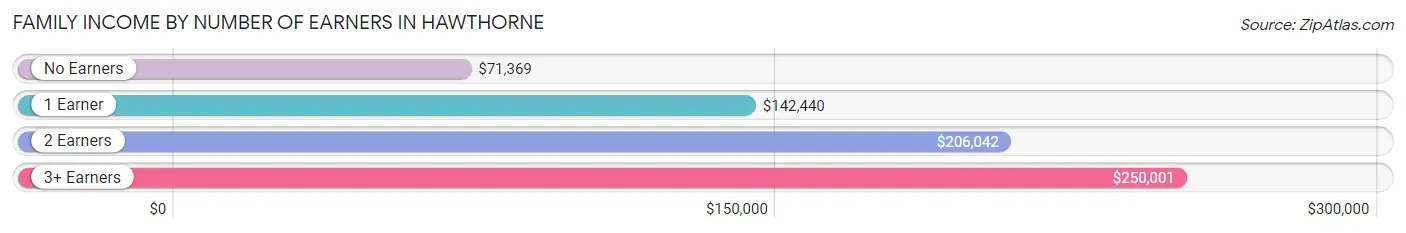
| Number of Earners | # Families | Median Income |
| No Earners | 225 (18.1%) | $71,369 |
| 1 Earner | 187 (15.0%) | $142,440 |
| 2 Earners | 593 (47.6%) | $206,042 |
| 3+ Earners | 241 (19.3%) | $250,001 |
| Total | 1,246 (100.0%) | $168,269 |
Household Income in Hawthorne
Household Income Brackets in Hawthorne
With 578 households falling in the category, the $200,000+ income range is the most frequent in Hawthorne, accounting for 33.9% of all households. In contrast, only 32 households (1.9%) fall into the $10,000 to $14,999 income bracket, making it the least populous group.
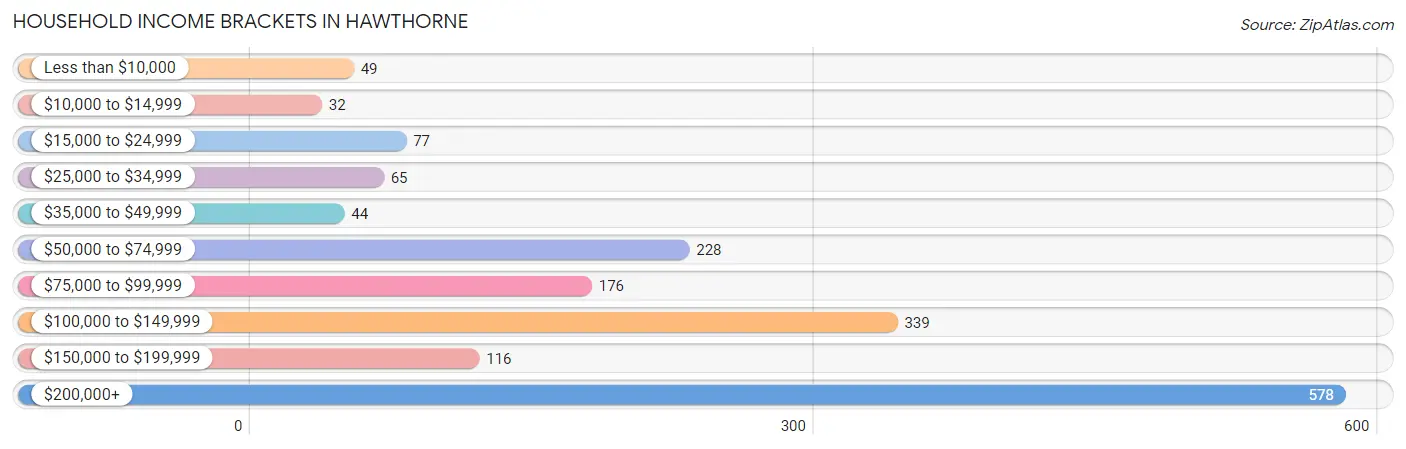
| Income Bracket | # Households | % Households |
| Less than $10,000 | 49 | 2.9% |
| $10,000 to $14,999 | 32 | 1.9% |
| $15,000 to $24,999 | 77 | 4.5% |
| $25,000 to $34,999 | 65 | 3.8% |
| $35,000 to $49,999 | 44 | 2.6% |
| $50,000 to $74,999 | 228 | 13.4% |
| $75,000 to $99,999 | 176 | 10.3% |
| $100,000 to $149,999 | 339 | 19.9% |
| $150,000 to $199,999 | 116 | 6.8% |
| $200,000+ | 578 | 33.9% |
Household Income by Householder Age in Hawthorne
The median household income in Hawthorne is $130,816, with the highest median household income of $221,429 found in the 25 to 44 years age bracket for the primary householder. A total of 370 households (21.7%) fall into this category.
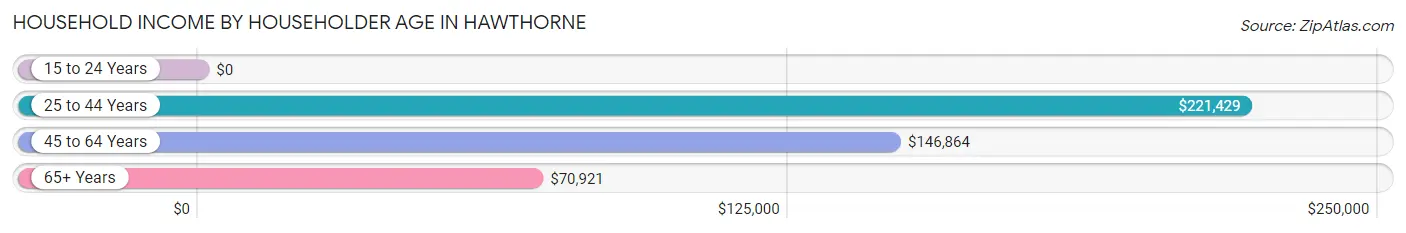
| Income Bracket | # Households | Median Income |
| 15 to 24 Years | 0 (0.0%) | $0 |
| 25 to 44 Years | 370 (21.7%) | $221,429 |
| 45 to 64 Years | 704 (41.3%) | $146,864 |
| 65+ Years | 630 (37.0%) | $70,921 |
| Total | 1,704 (100.0%) | $130,816 |
Poverty in Hawthorne
Income Below Poverty by Sex and Age in Hawthorne
With 5.3% poverty level for males and 1.7% for females among the residents of Hawthorne, 75 year old and over males and 75 year old and over females are the most vulnerable to poverty, with 37 males (15.3%) and 12 females (5.7%) in their respective age groups living below the poverty level.
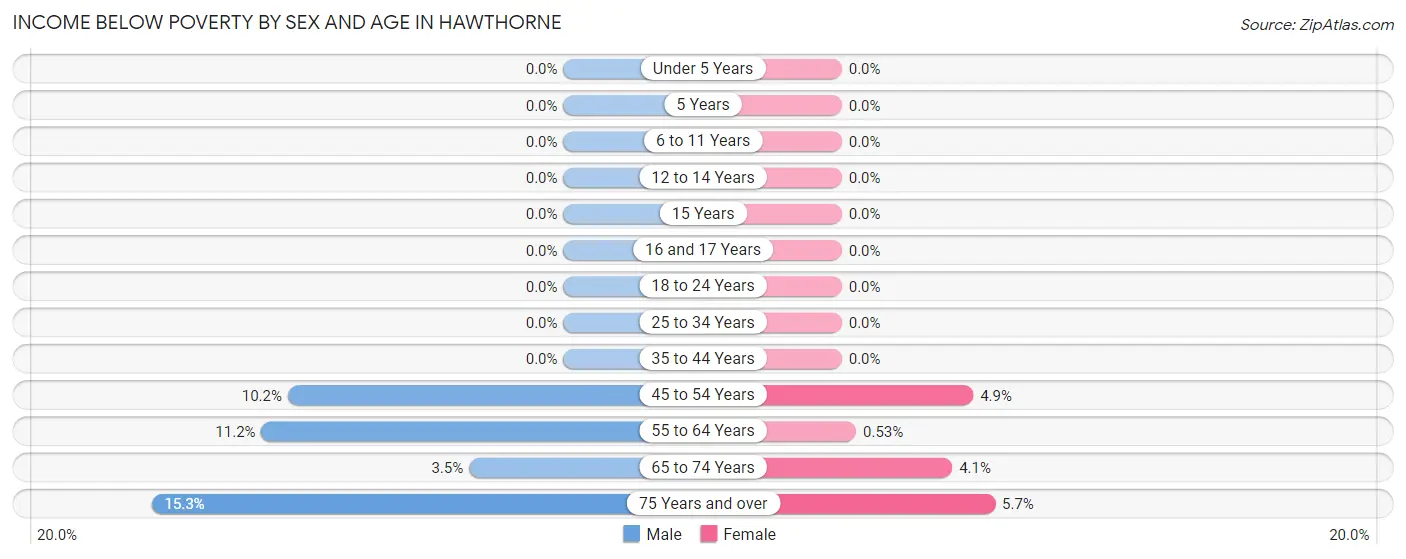
| Age Bracket | Male | Female |
| Under 5 Years | 0 (0.0%) | 0 (0.0%) |
| 5 Years | 0 (0.0%) | 0 (0.0%) |
| 6 to 11 Years | 0 (0.0%) | 0 (0.0%) |
| 12 to 14 Years | 0 (0.0%) | 0 (0.0%) |
| 15 Years | 0 (0.0%) | 0 (0.0%) |
| 16 and 17 Years | 0 (0.0%) | 0 (0.0%) |
| 18 to 24 Years | 0 (0.0%) | 0 (0.0%) |
| 25 to 34 Years | 0 (0.0%) | 0 (0.0%) |
| 35 to 44 Years | 0 (0.0%) | 0 (0.0%) |
| 45 to 54 Years | 27 (10.2%) | 14 (4.9%) |
| 55 to 64 Years | 49 (11.2%) | 2 (0.5%) |
| 65 to 74 Years | 12 (3.5%) | 12 (4.1%) |
| 75 Years and over | 37 (15.3%) | 12 (5.7%) |
| Total | 125 (5.3%) | 40 (1.7%) |
Income Above Poverty by Sex and Age in Hawthorne
According to the poverty statistics in Hawthorne, males aged under 5 years and females aged under 5 years are the age groups that are most secure financially, with 100.0% of males and 100.0% of females in these age groups living above the poverty line.
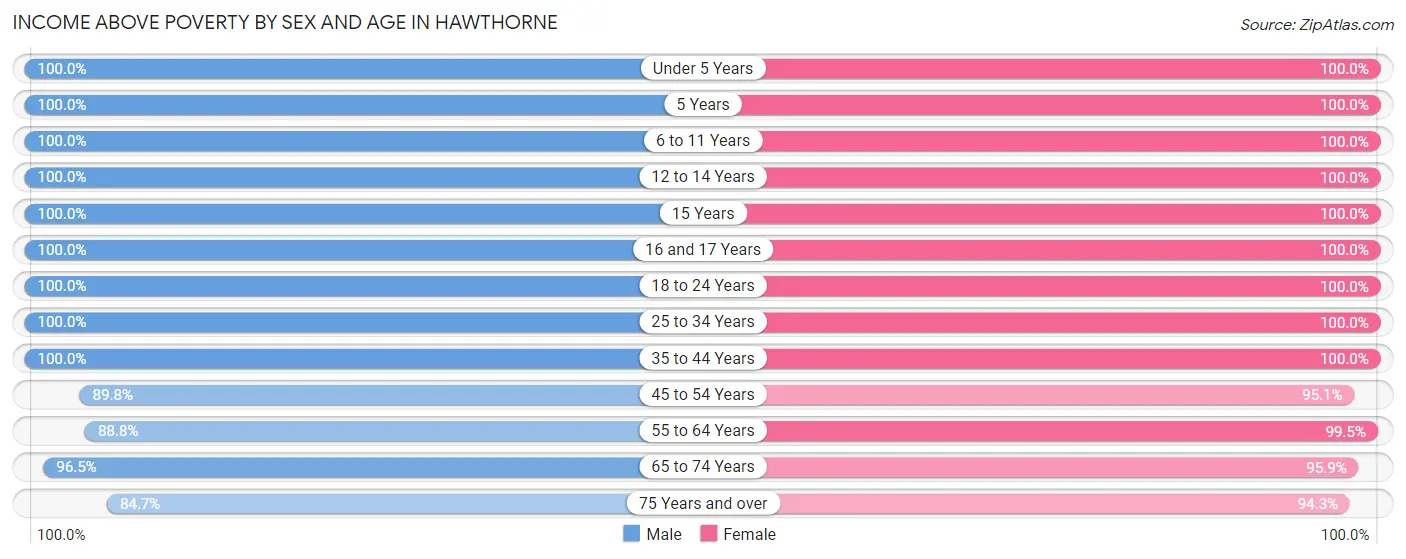
| Age Bracket | Male | Female |
| Under 5 Years | 132 (100.0%) | 144 (100.0%) |
| 5 Years | 18 (100.0%) | 21 (100.0%) |
| 6 to 11 Years | 183 (100.0%) | 106 (100.0%) |
| 12 to 14 Years | 82 (100.0%) | 73 (100.0%) |
| 15 Years | 24 (100.0%) | 9 (100.0%) |
| 16 and 17 Years | 38 (100.0%) | 42 (100.0%) |
| 18 to 24 Years | 130 (100.0%) | 300 (100.0%) |
| 25 to 34 Years | 151 (100.0%) | 205 (100.0%) |
| 35 to 44 Years | 300 (100.0%) | 282 (100.0%) |
| 45 to 54 Years | 237 (89.8%) | 273 (95.1%) |
| 55 to 64 Years | 388 (88.8%) | 374 (99.5%) |
| 65 to 74 Years | 331 (96.5%) | 281 (95.9%) |
| 75 Years and over | 205 (84.7%) | 199 (94.3%) |
| Total | 2,219 (94.7%) | 2,309 (98.3%) |
Income Below Poverty Among Married-Couple Families in Hawthorne
The poverty statistics for married-couple families in Hawthorne show that 0.9% or 10 of the total 1,112 families live below the poverty line. Families with no children have the highest poverty rate of 1.5%, comprising of 10 families. On the other hand, families with 1 or 2 children have the lowest poverty rate of 0.0%, which includes 0 families.
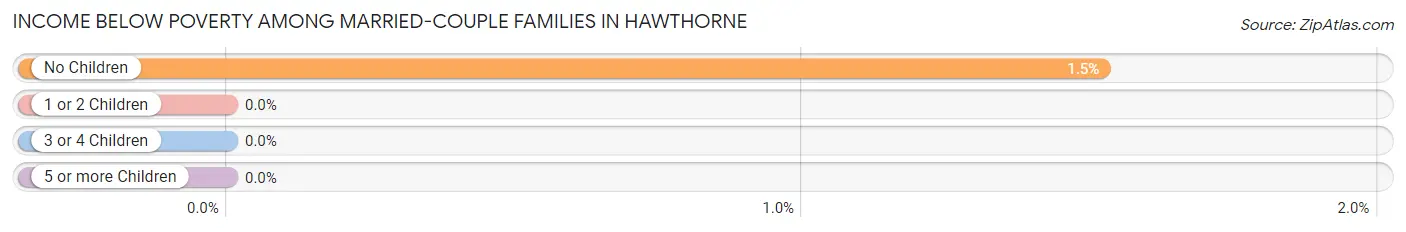
| Children | Above Poverty | Below Poverty |
| No Children | 646 (98.5%) | 10 (1.5%) |
| 1 or 2 Children | 360 (100.0%) | 0 (0.0%) |
| 3 or 4 Children | 96 (100.0%) | 0 (0.0%) |
| 5 or more Children | 0 (0.0%) | 0 (0.0%) |
| Total | 1,102 (99.1%) | 10 (0.9%) |
Income Below Poverty Among Single-Parent Households in Hawthorne
| Children | Single Father | Single Mother |
| No Children | 0 (0.0%) | 0 (0.0%) |
| 1 or 2 Children | 0 (0.0%) | 0 (0.0%) |
| 3 or 4 Children | 0 (0.0%) | 0 (0.0%) |
| 5 or more Children | 0 (0.0%) | 0 (0.0%) |
| Total | 0 (0.0%) | 0 (0.0%) |
Income Below Poverty Among Married-Couple vs Single-Parent Households in Hawthorne
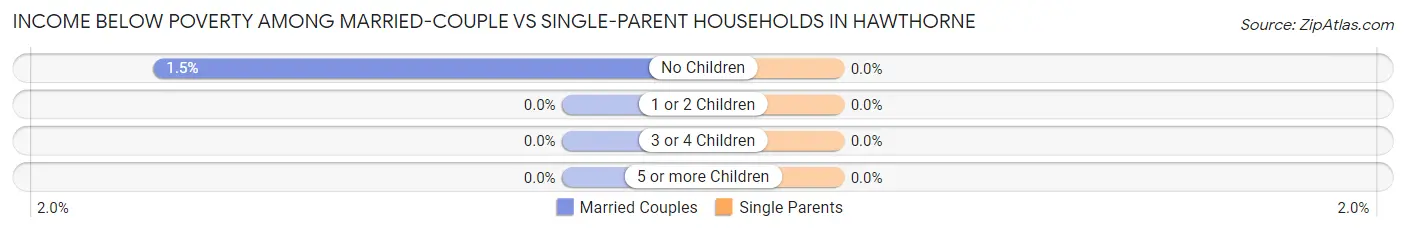
| Children | Married-Couple Families | Single-Parent Households |
| No Children | 10 (1.5%) | 0 (0.0%) |
| 1 or 2 Children | 0 (0.0%) | 0 (0.0%) |
| 3 or 4 Children | 0 (0.0%) | 0 (0.0%) |
| 5 or more Children | 0 (0.0%) | 0 (0.0%) |
| Total | 10 (0.9%) | 0 (0.0%) |
Race in Hawthorne
The most populous races in Hawthorne are White / Caucasian (4,246 | 90.5%), Asian (259 | 5.5%), and Hispanic or Latino (217 | 4.6%).
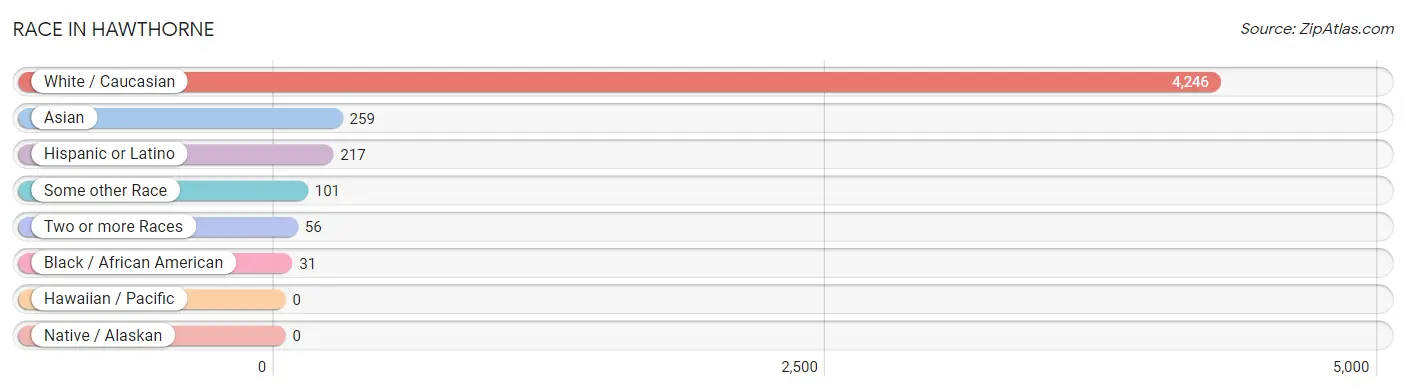
| Race | # Population | % Population |
| Asian | 259 | 5.5% |
| Black / African American | 31 | 0.7% |
| Hawaiian / Pacific | 0 | 0.0% |
| Hispanic or Latino | 217 | 4.6% |
| Native / Alaskan | 0 | 0.0% |
| White / Caucasian | 4,246 | 90.5% |
| Two or more Races | 56 | 1.2% |
| Some other Race | 101 | 2.1% |
| Total | 4,693 | 100.0% |
Ancestry in Hawthorne
The most populous ancestries reported in Hawthorne are Italian (1,766 | 37.6%), Irish (975 | 20.8%), German (434 | 9.2%), American (253 | 5.4%), and Polish (227 | 4.8%), together accounting for 77.9% of all Hawthorne residents.
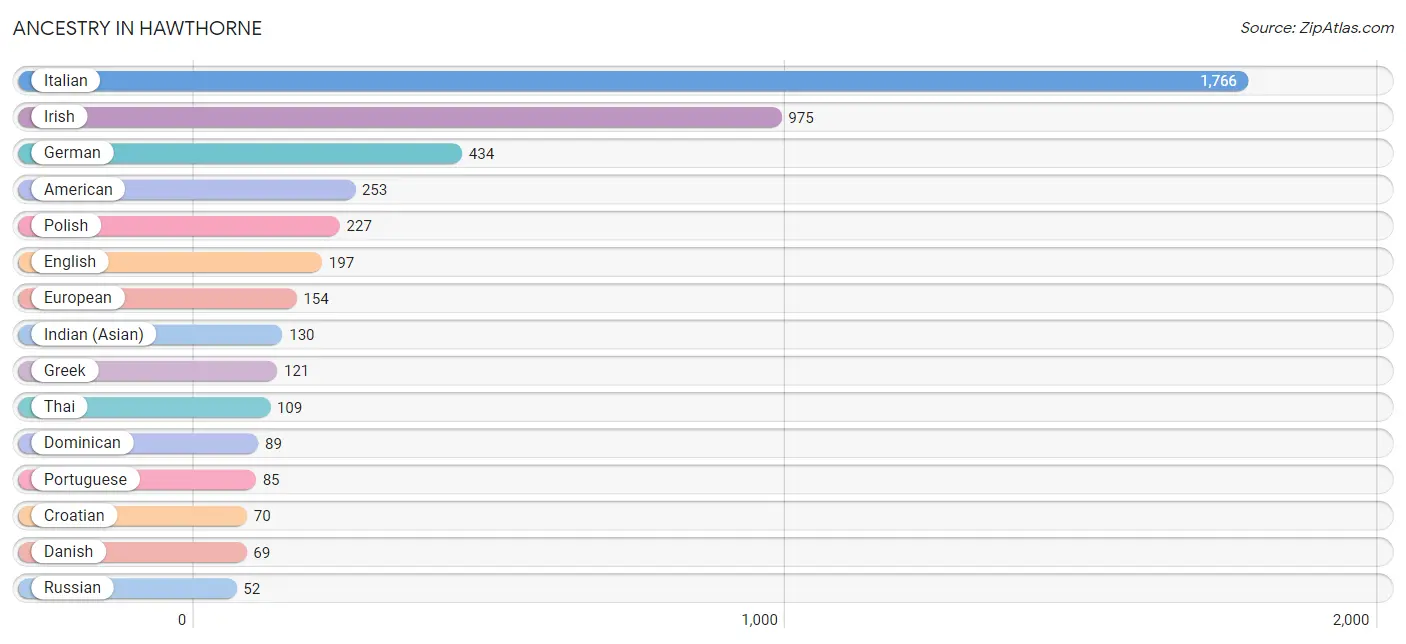
| Ancestry | # Population | % Population |
| American | 253 | 5.4% |
| Armenian | 11 | 0.2% |
| Austrian | 23 | 0.5% |
| Brazilian | 12 | 0.3% |
| British | 11 | 0.2% |
| Bulgarian | 37 | 0.8% |
| Central American | 13 | 0.3% |
| Colombian | 22 | 0.5% |
| Croatian | 70 | 1.5% |
| Czechoslovakian | 11 | 0.2% |
| Danish | 69 | 1.5% |
| Dominican | 89 | 1.9% |
| Ecuadorian | 10 | 0.2% |
| English | 197 | 4.2% |
| European | 154 | 3.3% |
| Finnish | 10 | 0.2% |
| French | 51 | 1.1% |
| French Canadian | 9 | 0.2% |
| German | 434 | 9.2% |
| Greek | 121 | 2.6% |
| Guatemalan | 13 | 0.3% |
| Hungarian | 10 | 0.2% |
| Indian (Asian) | 130 | 2.8% |
| Irish | 975 | 20.8% |
| Italian | 1,766 | 37.6% |
| Jamaican | 46 | 1.0% |
| Korean | 27 | 0.6% |
| Malaysian | 5 | 0.1% |
| Mexican | 32 | 0.7% |
| Polish | 227 | 4.8% |
| Portuguese | 85 | 1.8% |
| Puerto Rican | 27 | 0.6% |
| Russian | 52 | 1.1% |
| Scotch-Irish | 13 | 0.3% |
| Scottish | 32 | 0.7% |
| Serbian | 10 | 0.2% |
| South American | 32 | 0.7% |
| Spaniard | 24 | 0.5% |
| Swedish | 38 | 0.8% |
| Swiss | 9 | 0.2% |
| Thai | 109 | 2.3% |
| Ukrainian | 11 | 0.2% | View All 42 Rows |
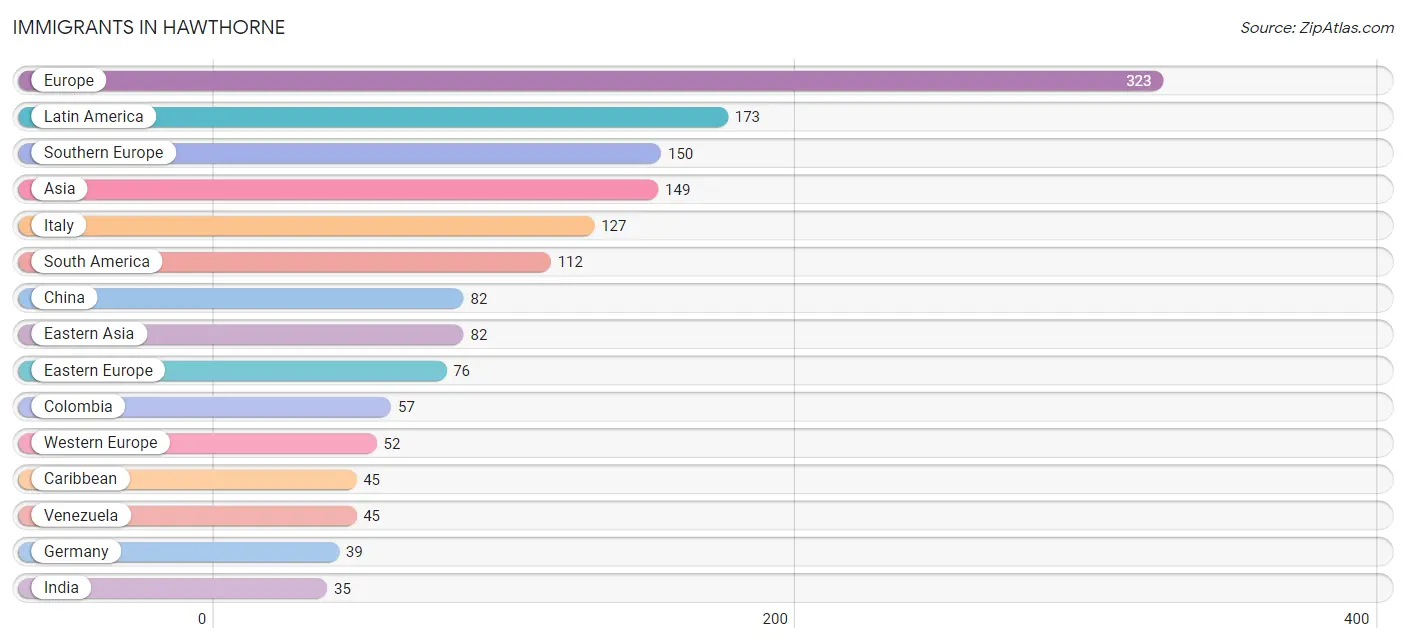
Immigrants in Hawthorne
The most numerous immigrant groups reported in Hawthorne came from Europe (323 | 6.9%), Latin America (173 | 3.7%), Southern Europe (150 | 3.2%), Asia (149 | 3.2%), and Italy (127 | 2.7%), together accounting for 19.7% of all Hawthorne residents.
| Immigration Origin | # Population | % Population |
| Asia | 149 | 3.2% |
| Bosnia and Herzegovina | 11 | 0.2% |
| Bulgaria | 22 | 0.5% |
| Canada | 13 | 0.3% |
| Caribbean | 45 | 1.0% |
| Central America | 16 | 0.3% |
| China | 82 | 1.8% |
| Colombia | 57 | 1.2% |
| Dominican Republic | 16 | 0.3% |
| Eastern Asia | 82 | 1.8% |
| Eastern Europe | 76 | 1.6% |
| Ecuador | 10 | 0.2% |
| Europe | 323 | 6.9% |
| France | 13 | 0.3% |
| Germany | 39 | 0.8% |
| Greece | 11 | 0.2% |
| Hong Kong | 9 | 0.2% |
| India | 35 | 0.7% |
| Italy | 127 | 2.7% |
| Jamaica | 29 | 0.6% |
| Laos | 5 | 0.1% |
| Latin America | 173 | 3.7% |
| Mexico | 16 | 0.3% |
| Northern Europe | 20 | 0.4% |
| Philippines | 27 | 0.6% |
| Poland | 23 | 0.5% |
| Scotland | 11 | 0.2% |
| Serbia | 20 | 0.4% |
| South America | 112 | 2.4% |
| South Central Asia | 35 | 0.7% |
| South Eastern Asia | 32 | 0.7% |
| Southern Europe | 150 | 3.2% |
| Spain | 12 | 0.3% |
| Venezuela | 45 | 1.0% |
| Western Europe | 52 | 1.1% | View All 35 Rows |
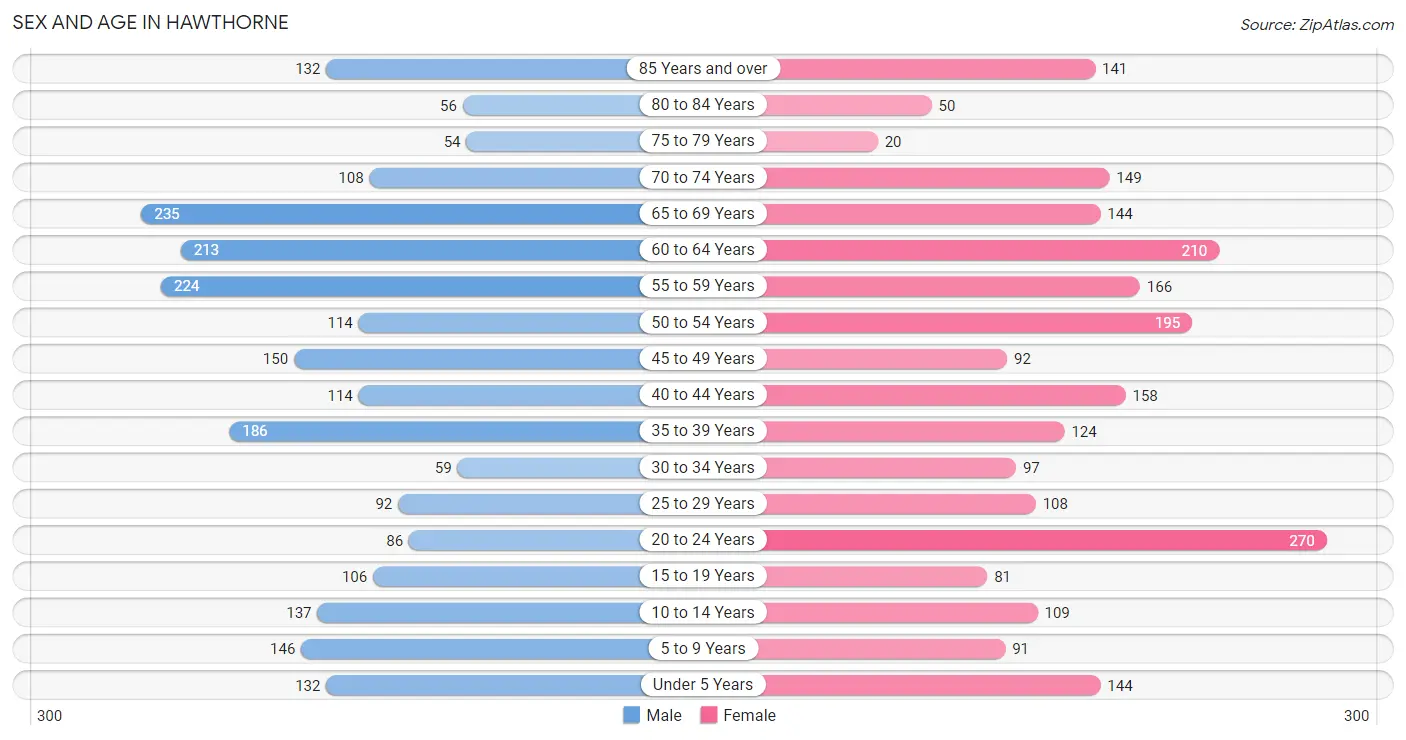
Sex and Age in Hawthorne
Sex and Age in Hawthorne
The most populous age groups in Hawthorne are 65 to 69 Years (235 | 10.0%) for men and 20 to 24 Years (270 | 11.5%) for women.
| Age Bracket | Male | Female |
| Under 5 Years | 132 (5.6%) | 144 (6.1%) |
| 5 to 9 Years | 146 (6.2%) | 91 (3.9%) |
| 10 to 14 Years | 137 (5.8%) | 109 (4.6%) |
| 15 to 19 Years | 106 (4.5%) | 81 (3.5%) |
| 20 to 24 Years | 86 (3.7%) | 270 (11.5%) |
| 25 to 29 Years | 92 (3.9%) | 108 (4.6%) |
| 30 to 34 Years | 59 (2.5%) | 97 (4.1%) |
| 35 to 39 Years | 186 (7.9%) | 124 (5.3%) |
| 40 to 44 Years | 114 (4.9%) | 158 (6.7%) |
| 45 to 49 Years | 150 (6.4%) | 92 (3.9%) |
| 50 to 54 Years | 114 (4.9%) | 195 (8.3%) |
| 55 to 59 Years | 224 (9.6%) | 166 (7.1%) |
| 60 to 64 Years | 213 (9.1%) | 210 (8.9%) |
| 65 to 69 Years | 235 (10.0%) | 144 (6.1%) |
| 70 to 74 Years | 108 (4.6%) | 149 (6.3%) |
| 75 to 79 Years | 54 (2.3%) | 20 (0.9%) |
| 80 to 84 Years | 56 (2.4%) | 50 (2.1%) |
| 85 Years and over | 132 (5.6%) | 141 (6.0%) |
| Total | 2,344 (100.0%) | 2,349 (100.0%) |
Families and Households in Hawthorne
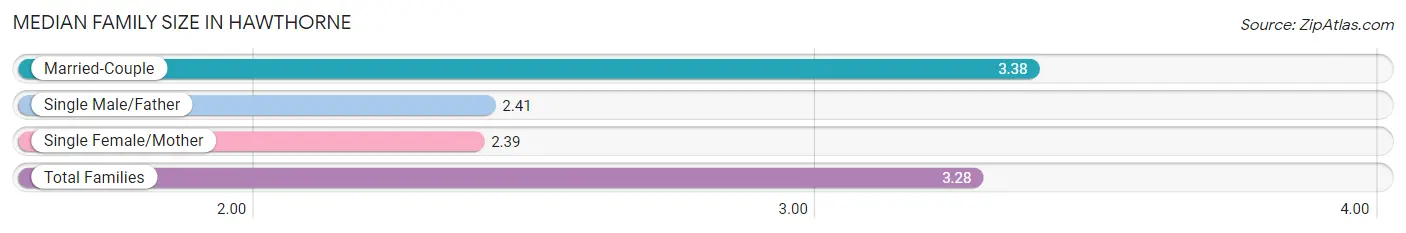
Median Family Size in Hawthorne
The median family size in Hawthorne is 3.28 persons per family, with married-couple families (1,112 | 89.2%) accounting for the largest median family size of 3.38 persons per family. On the other hand, single female/mother families (61 | 4.9%) represent the smallest median family size with 2.39 persons per family.
| Family Type | # Families | Family Size |
| Married-Couple | 1,112 (89.2%) | 3.38 |
| Single Male/Father | 73 (5.9%) | 2.41 |
| Single Female/Mother | 61 (4.9%) | 2.39 |
| Total Families | 1,246 (100.0%) | 3.28 |
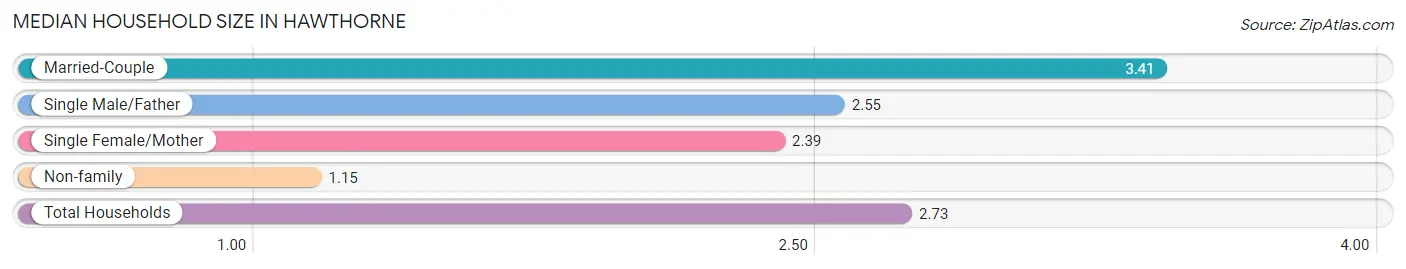
Median Household Size in Hawthorne
The median household size in Hawthorne is 2.73 persons per household, with married-couple households (1,112 | 65.3%) accounting for the largest median household size of 3.41 persons per household. non-family households (458 | 26.9%) represent the smallest median household size with 1.15 persons per household.
| Household Type | # Households | Household Size |
| Married-Couple | 1,112 (65.3%) | 3.41 |
| Single Male/Father | 73 (4.3%) | 2.55 |
| Single Female/Mother | 61 (3.6%) | 2.39 |
| Non-family | 458 (26.9%) | 1.15 |
| Total Households | 1,704 (100.0%) | 2.73 |
Household Size by Marriage Status in Hawthorne
Out of a total of 1,704 households in Hawthorne, 1,246 (73.1%) are family households, while 458 (26.9%) are nonfamily households. The most numerous type of family households are 2-person households, comprising 455, and the most common type of nonfamily households are 1-person households, comprising 392.
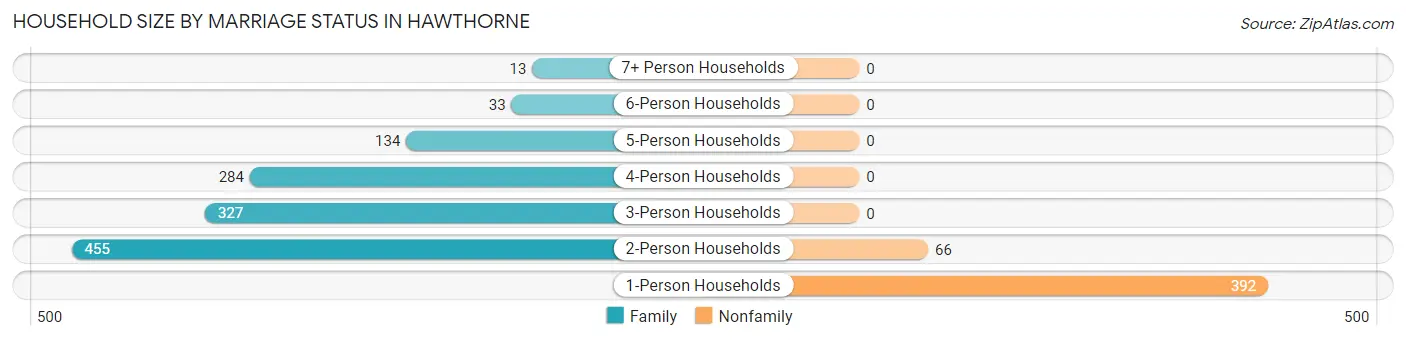
| Household Size | Family Households | Nonfamily Households |
| 1-Person Households | - | 392 (23.0%) |
| 2-Person Households | 455 (26.7%) | 66 (3.9%) |
| 3-Person Households | 327 (19.2%) | 0 (0.0%) |
| 4-Person Households | 284 (16.7%) | 0 (0.0%) |
| 5-Person Households | 134 (7.9%) | 0 (0.0%) |
| 6-Person Households | 33 (1.9%) | 0 (0.0%) |
| 7+ Person Households | 13 (0.8%) | 0 (0.0%) |
| Total | 1,246 (73.1%) | 458 (26.9%) |
Female Fertility in Hawthorne
Fertility by Age in Hawthorne
Average fertility rate in Hawthorne is 57.0 births per 1,000 women. Women in the age bracket of 35 to 50 years have the highest fertility rate with 129.0 births per 1,000 women. Women in the age bracket of 35 to 50 years acount for 100.0% of all women with births.
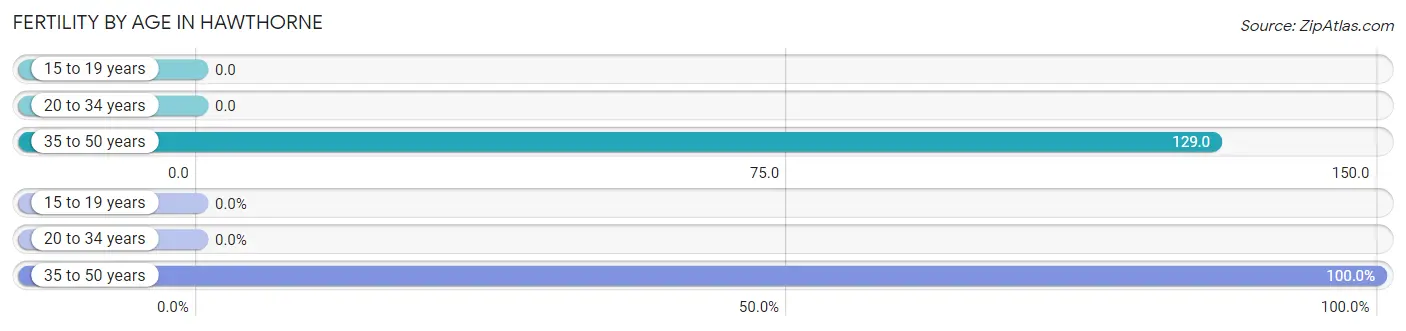
| Age Bracket | Women with Births | Births / 1,000 Women |
| 15 to 19 years | 0 (0.0%) | 0.0 |
| 20 to 34 years | 0 (0.0%) | 0.0 |
| 35 to 50 years | 57 (100.0%) | 129.0 |
| Total | 57 (100.0%) | 57.0 |
Fertility by Age by Marriage Status in Hawthorne
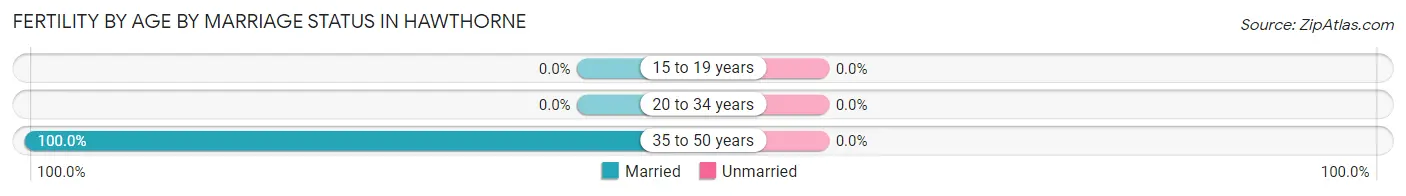
| Age Bracket | Married | Unmarried |
| 15 to 19 years | 0 (0.0%) | 0 (0.0%) |
| 20 to 34 years | 0 (0.0%) | 0 (0.0%) |
| 35 to 50 years | 57 (100.0%) | 0 (0.0%) |
| Total | 57 (100.0%) | 0 (0.0%) |
Fertility by Education in Hawthorne
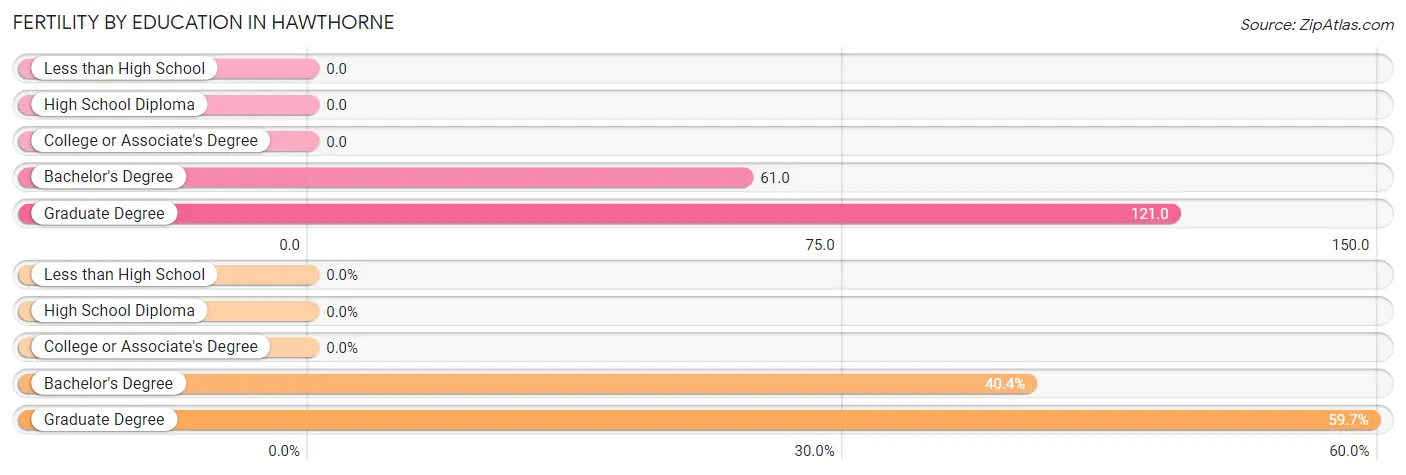
| Educational Attainment | Women with Births | Births / 1,000 Women |
| Less than High School | 0 (0.0%) | 0.0 |
| High School Diploma | 0 (0.0%) | 0.0 |
| College or Associate's Degree | 0 (0.0%) | 0.0 |
| Bachelor's Degree | 23 (40.4%) | 61.0 |
| Graduate Degree | 34 (59.7%) | 121.0 |
| Total | 57 (100.0%) | 57.0 |
Fertility by Education by Marriage Status in Hawthorne
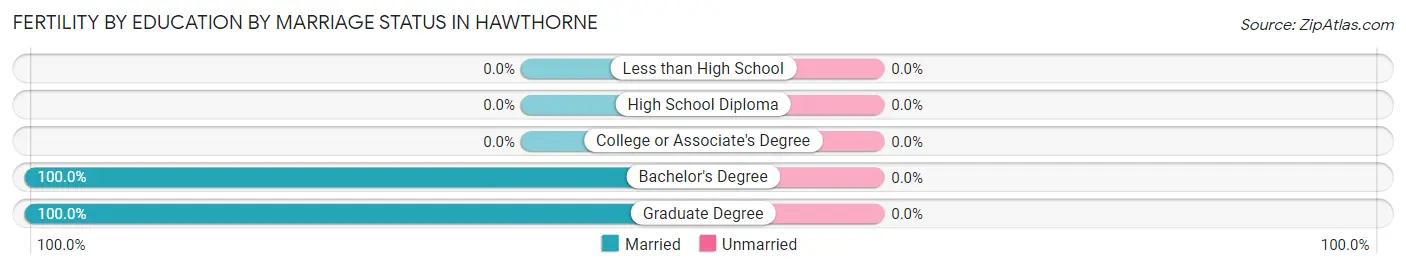
| Educational Attainment | Married | Unmarried |
| Less than High School | 0 (0.0%) | 0 (0.0%) |
| High School Diploma | 0 (0.0%) | 0 (0.0%) |
| College or Associate's Degree | 0 (0.0%) | 0 (0.0%) |
| Bachelor's Degree | 23 (100.0%) | 0 (0.0%) |
| Graduate Degree | 34 (100.0%) | 0 (0.0%) |
| Total | 57 (100.0%) | 0 (0.0%) |
Employment Characteristics in Hawthorne
Employment by Class of Employer in Hawthorne
Among the 2,394 employed individuals in Hawthorne, private company employees (1,401 | 58.5%), local government employees (476 | 19.9%), and not-for-profit organizations (156 | 6.5%) make up the most common classes of employment.
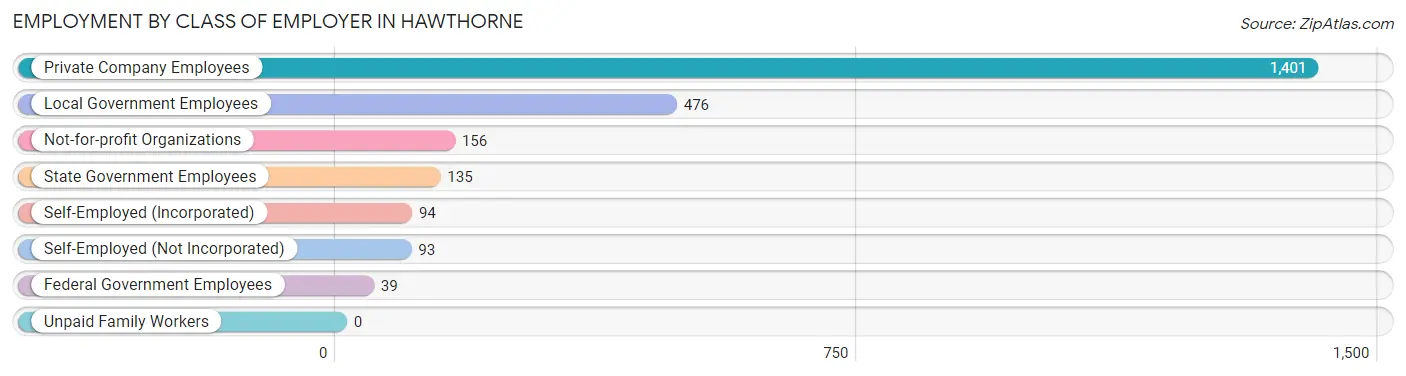
| Employer Class | # Employees | % Employees |
| Private Company Employees | 1,401 | 58.5% |
| Self-Employed (Incorporated) | 94 | 3.9% |
| Self-Employed (Not Incorporated) | 93 | 3.9% |
| Not-for-profit Organizations | 156 | 6.5% |
| Local Government Employees | 476 | 19.9% |
| State Government Employees | 135 | 5.6% |
| Federal Government Employees | 39 | 1.6% |
| Unpaid Family Workers | 0 | 0.0% |
| Total | 2,394 | 100.0% |
Employment Status by Age in Hawthorne
According to the labor force statistics for Hawthorne, out of the total population over 16 years of age (3,901), 66.5% or 2,594 individuals are in the labor force, with 6.8% or 176 of them unemployed. The age group with the highest labor force participation rate is 25 to 29 years, with 100.0% or 200 individuals in the labor force. Within the labor force, the 16 to 19 years age range has the highest percentage of unemployed individuals, with 55.1% or 27 of them being unemployed.
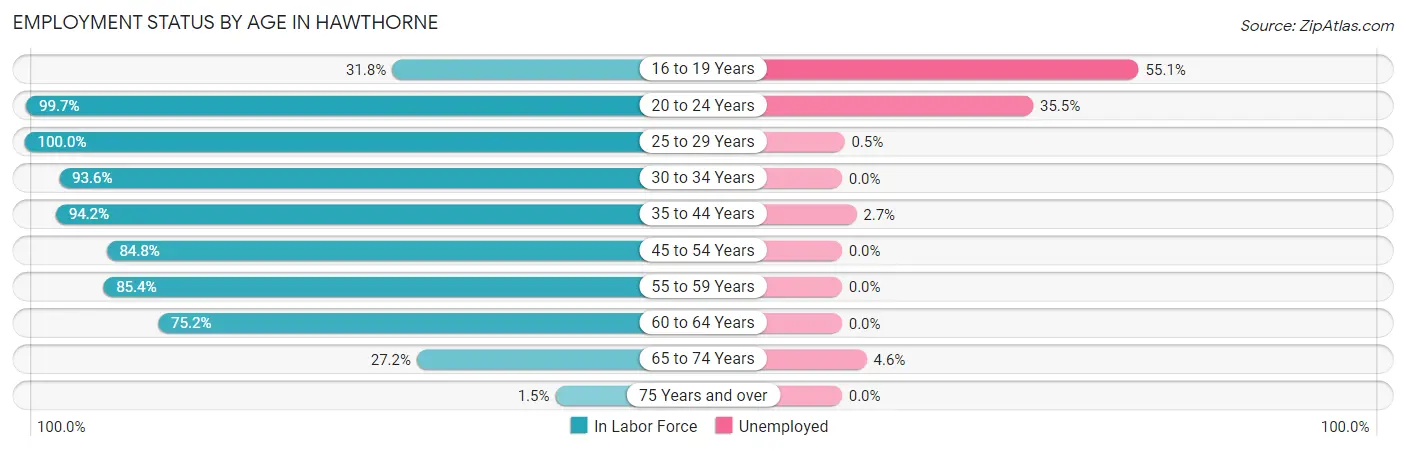
| Age Bracket | In Labor Force | Unemployed |
| 16 to 19 Years | 49 (31.8%) | 27 (55.1%) |
| 20 to 24 Years | 355 (99.7%) | 126 (35.5%) |
| 25 to 29 Years | 200 (100.0%) | 1 (0.5%) |
| 30 to 34 Years | 146 (93.6%) | 0 (0.0%) |
| 35 to 44 Years | 548 (94.2%) | 15 (2.7%) |
| 45 to 54 Years | 467 (84.8%) | 0 (0.0%) |
| 55 to 59 Years | 333 (85.4%) | 0 (0.0%) |
| 60 to 64 Years | 318 (75.2%) | 0 (0.0%) |
| 65 to 74 Years | 173 (27.2%) | 8 (4.6%) |
| 75 Years and over | 7 (1.5%) | 0 (0.0%) |
| Total | 2,594 (66.5%) | 176 (6.8%) |
Employment Status by Educational Attainment in Hawthorne
According to labor force statistics for Hawthorne, 87.4% of individuals (2,012) out of the total population between 25 and 64 years of age (2,302) are in the labor force, with 0.8% or 16 of them being unemployed. The group with the highest labor force participation rate are those with the educational attainment of bachelor's degree or higher, with 93.0% or 1,270 individuals in the labor force. Within the labor force, individuals with bachelor's degree or higher education have the highest percentage of unemployment, with 1.3% or 17 of them being unemployed.
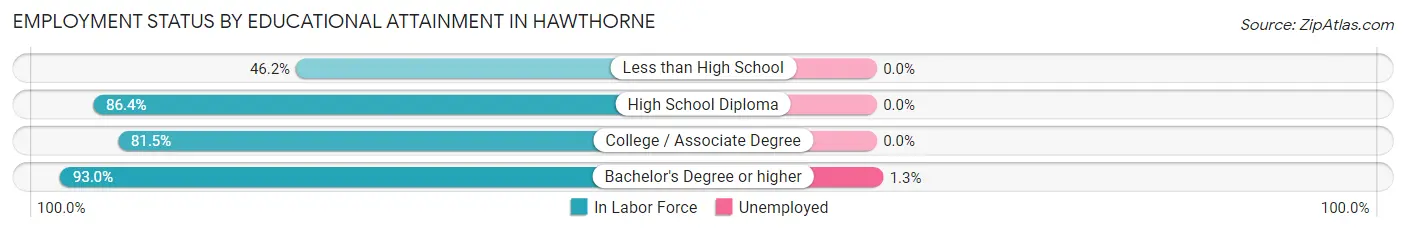
| Educational Attainment | In Labor Force | Unemployed |
| Less than High School | 49 (46.2%) | 0 (0.0%) |
| High School Diploma | 287 (86.4%) | 0 (0.0%) |
| College / Associate Degree | 406 (81.5%) | 0 (0.0%) |
| Bachelor's Degree or higher | 1,270 (93.0%) | 18 (1.3%) |
| Total | 2,012 (87.4%) | 18 (0.8%) |
Employment Occupations by Sex in Hawthorne
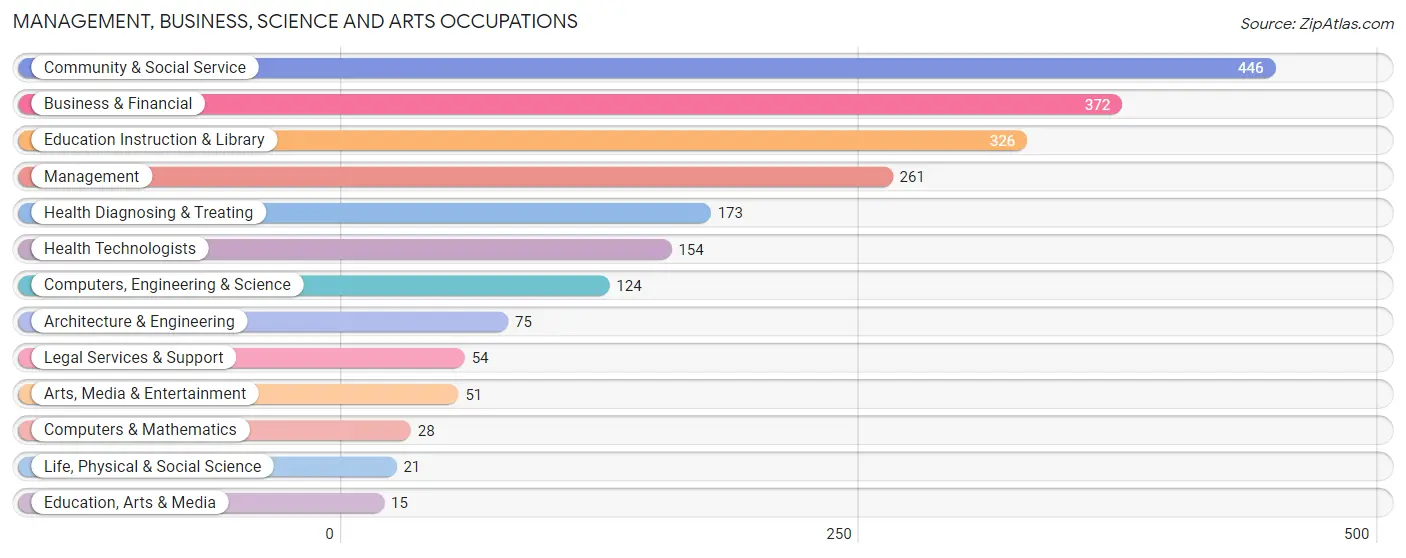
Management, Business, Science and Arts Occupations
The most common Management, Business, Science and Arts occupations in Hawthorne are Community & Social Service (446 | 18.4%), Business & Financial (372 | 15.4%), Education Instruction & Library (326 | 13.5%), Management (261 | 10.8%), and Health Diagnosing & Treating (173 | 7.1%).
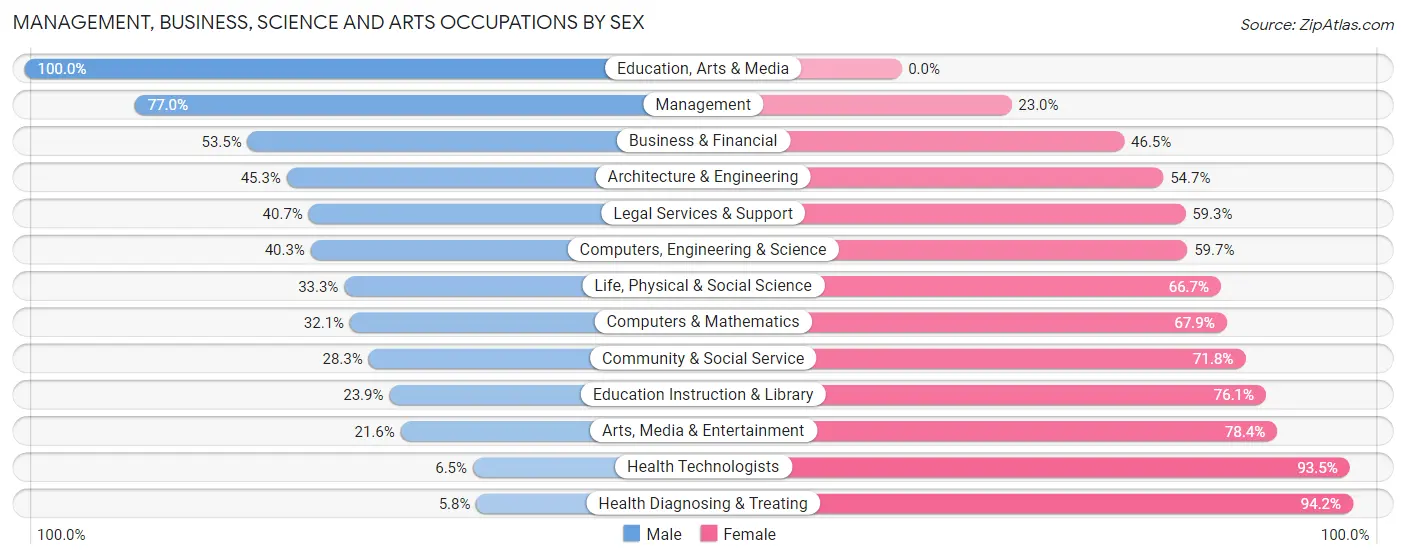
Management, Business, Science and Arts Occupations by Sex
Within the Management, Business, Science and Arts occupations in Hawthorne, the most male-oriented occupations are Education, Arts & Media (100.0%), Management (77.0%), and Business & Financial (53.5%), while the most female-oriented occupations are Health Diagnosing & Treating (94.2%), Health Technologists (93.5%), and Arts, Media & Entertainment (78.4%).
| Occupation | Male | Female |
| Management | 201 (77.0%) | 60 (23.0%) |
| Business & Financial | 199 (53.5%) | 173 (46.5%) |
| Computers, Engineering & Science | 50 (40.3%) | 74 (59.7%) |
| Computers & Mathematics | 9 (32.1%) | 19 (67.9%) |
| Architecture & Engineering | 34 (45.3%) | 41 (54.7%) |
| Life, Physical & Social Science | 7 (33.3%) | 14 (66.7%) |
| Community & Social Service | 126 (28.2%) | 320 (71.8%) |
| Education, Arts & Media | 15 (100.0%) | 0 (0.0%) |
| Legal Services & Support | 22 (40.7%) | 32 (59.3%) |
| Education Instruction & Library | 78 (23.9%) | 248 (76.1%) |
| Arts, Media & Entertainment | 11 (21.6%) | 40 (78.4%) |
| Health Diagnosing & Treating | 10 (5.8%) | 163 (94.2%) |
| Health Technologists | 10 (6.5%) | 144 (93.5%) |
| Total (Category) | 586 (42.6%) | 790 (57.4%) |
| Total (Overall) | 1,173 (48.5%) | 1,246 (51.5%) |
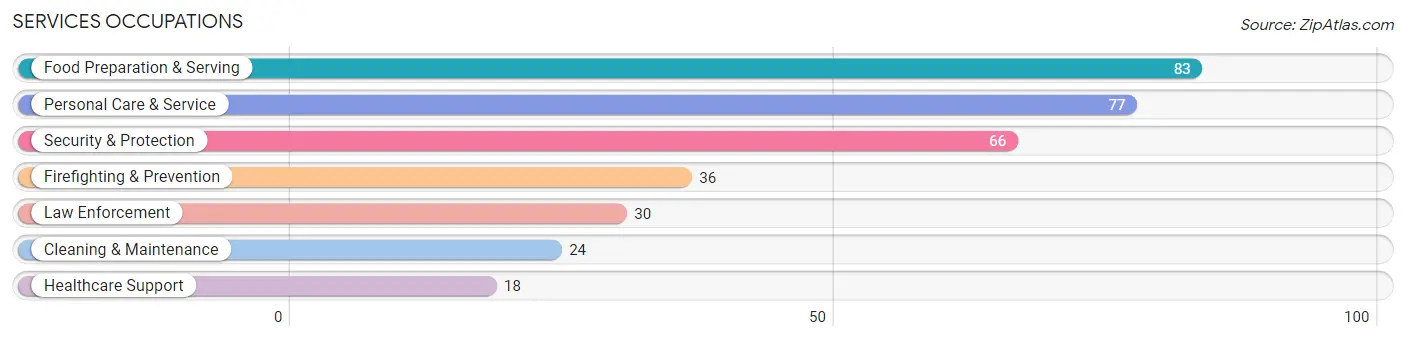
Services Occupations
The most common Services occupations in Hawthorne are Food Preparation & Serving (83 | 3.4%), Personal Care & Service (77 | 3.2%), Security & Protection (66 | 2.7%), Firefighting & Prevention (36 | 1.5%), and Law Enforcement (30 | 1.2%).
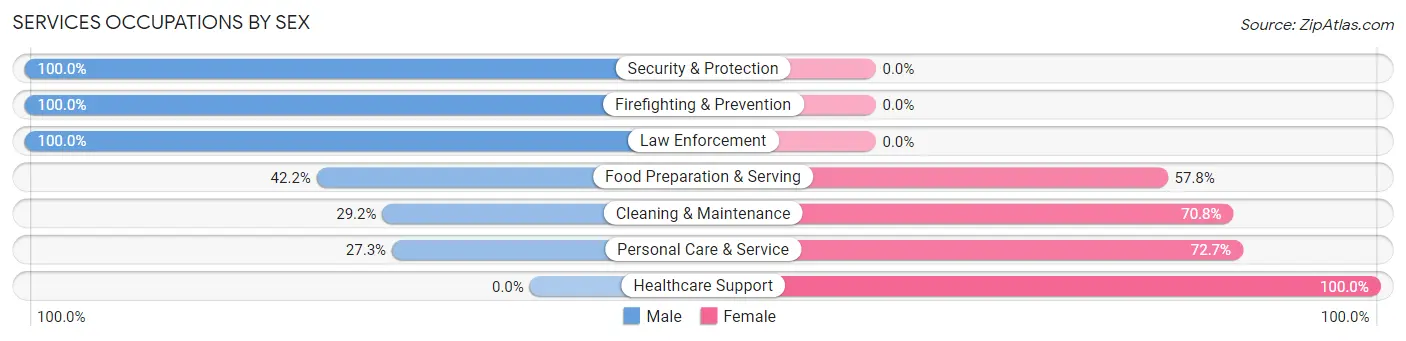
Services Occupations by Sex
Within the Services occupations in Hawthorne, the most male-oriented occupations are Security & Protection (100.0%), Firefighting & Prevention (100.0%), and Law Enforcement (100.0%), while the most female-oriented occupations are Healthcare Support (100.0%), Personal Care & Service (72.7%), and Cleaning & Maintenance (70.8%).
| Occupation | Male | Female |
| Healthcare Support | 0 (0.0%) | 18 (100.0%) |
| Security & Protection | 66 (100.0%) | 0 (0.0%) |
| Firefighting & Prevention | 36 (100.0%) | 0 (0.0%) |
| Law Enforcement | 30 (100.0%) | 0 (0.0%) |
| Food Preparation & Serving | 35 (42.2%) | 48 (57.8%) |
| Cleaning & Maintenance | 7 (29.2%) | 17 (70.8%) |
| Personal Care & Service | 21 (27.3%) | 56 (72.7%) |
| Total (Category) | 129 (48.1%) | 139 (51.9%) |
| Total (Overall) | 1,173 (48.5%) | 1,246 (51.5%) |
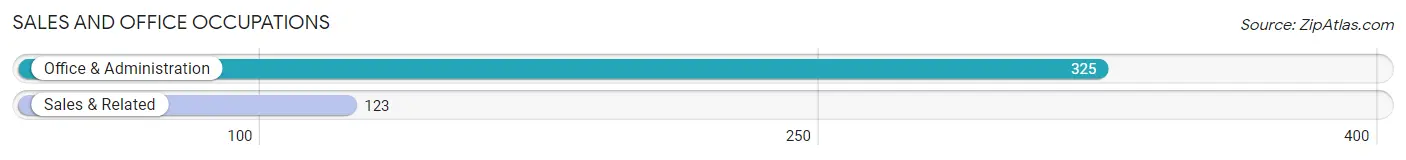
Sales and Office Occupations
The most common Sales and Office occupations in Hawthorne are Office & Administration (325 | 13.4%), and Sales & Related (123 | 5.1%).
Sales and Office Occupations by Sex
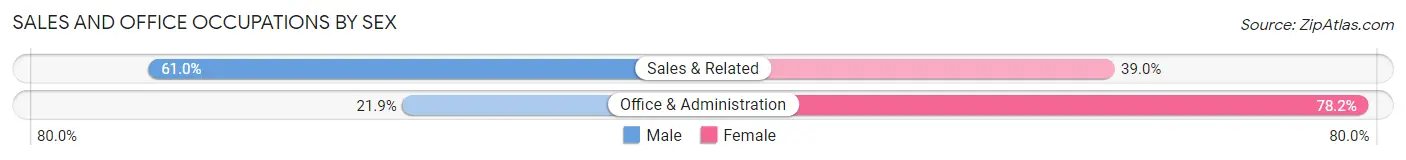
| Occupation | Male | Female |
| Sales & Related | 75 (61.0%) | 48 (39.0%) |
| Office & Administration | 71 (21.8%) | 254 (78.1%) |
| Total (Category) | 146 (32.6%) | 302 (67.4%) |
| Total (Overall) | 1,173 (48.5%) | 1,246 (51.5%) |
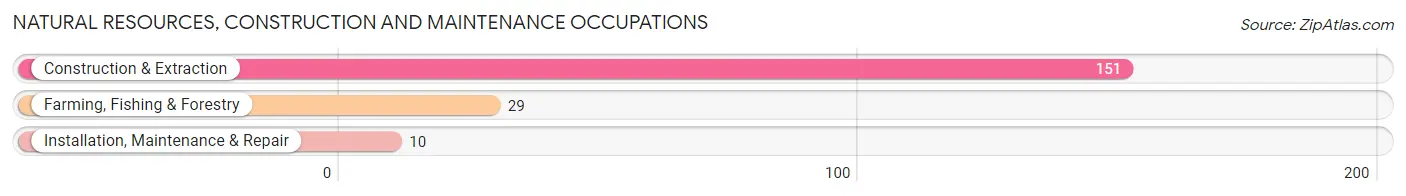
Natural Resources, Construction and Maintenance Occupations
The most common Natural Resources, Construction and Maintenance occupations in Hawthorne are Construction & Extraction (151 | 6.2%), Farming, Fishing & Forestry (29 | 1.2%), and Installation, Maintenance & Repair (10 | 0.4%).
Natural Resources, Construction and Maintenance Occupations by Sex
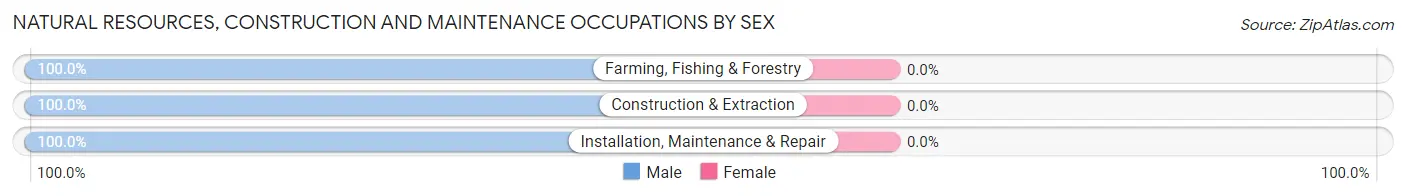
| Occupation | Male | Female |
| Farming, Fishing & Forestry | 29 (100.0%) | 0 (0.0%) |
| Construction & Extraction | 151 (100.0%) | 0 (0.0%) |
| Installation, Maintenance & Repair | 10 (100.0%) | 0 (0.0%) |
| Total (Category) | 190 (100.0%) | 0 (0.0%) |
| Total (Overall) | 1,173 (48.5%) | 1,246 (51.5%) |
Production, Transportation and Moving Occupations
The most common Production, Transportation and Moving occupations in Hawthorne are Transportation (122 | 5.0%), and Material Moving (15 | 0.6%).
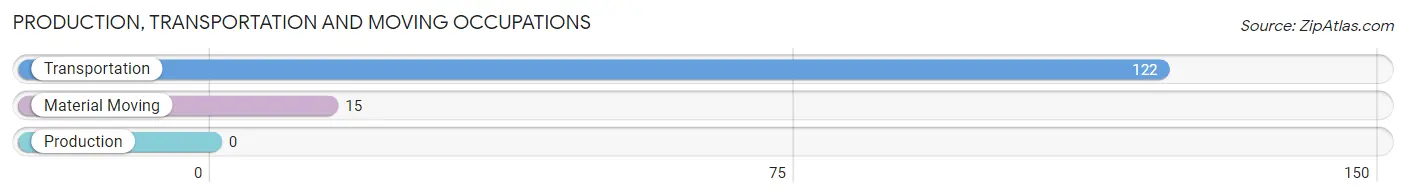
Production, Transportation and Moving Occupations by Sex
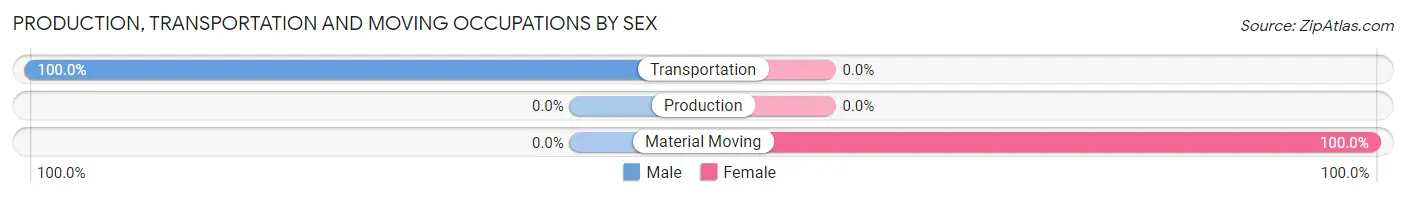
| Occupation | Male | Female |
| Production | 0 (0.0%) | 0 (0.0%) |
| Transportation | 122 (100.0%) | 0 (0.0%) |
| Material Moving | 0 (0.0%) | 15 (100.0%) |
| Total (Category) | 122 (89.0%) | 15 (11.0%) |
| Total (Overall) | 1,173 (48.5%) | 1,246 (51.5%) |
Employment Industries by Sex in Hawthorne
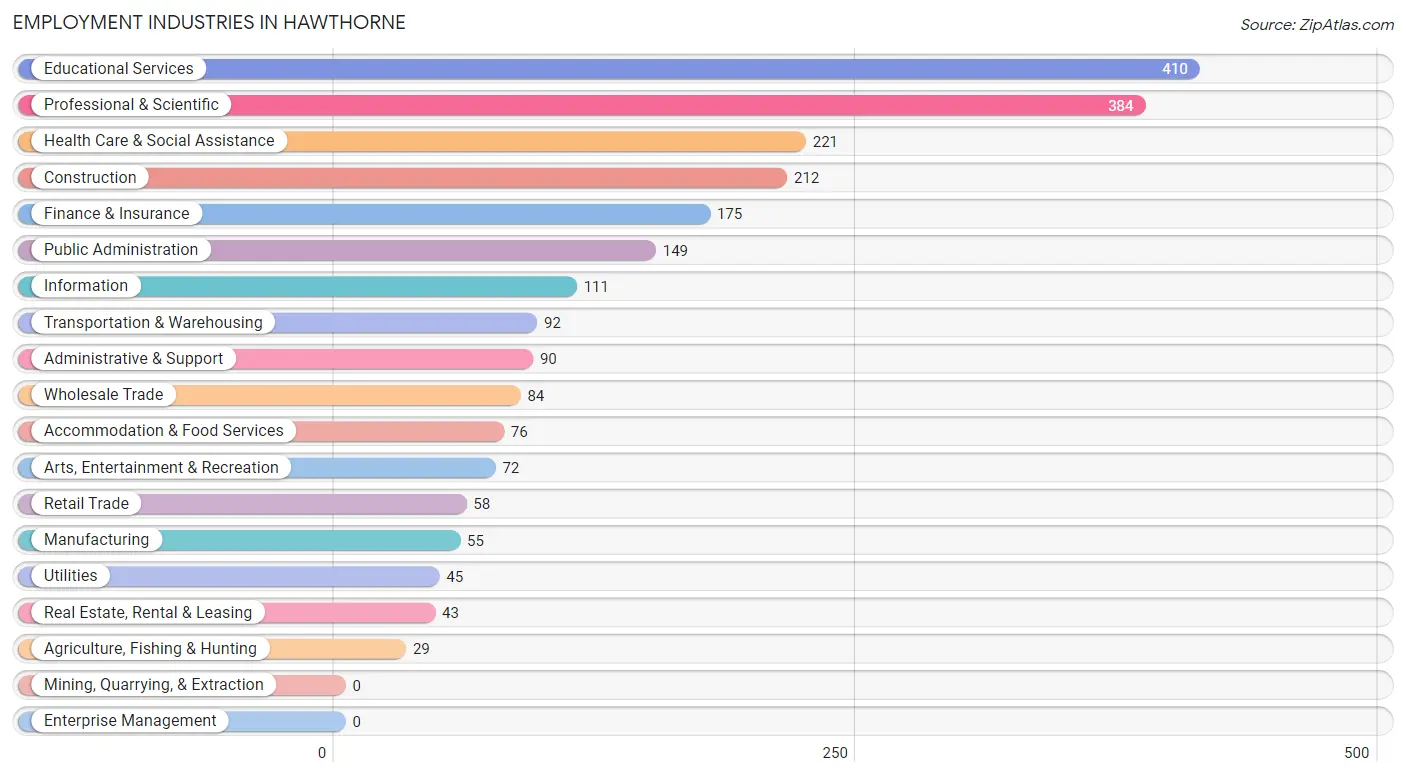
Employment Industries in Hawthorne
The major employment industries in Hawthorne include Educational Services (410 | 17.0%), Professional & Scientific (384 | 15.9%), Health Care & Social Assistance (221 | 9.1%), Construction (212 | 8.8%), and Finance & Insurance (175 | 7.2%).
Employment Industries by Sex in Hawthorne
The Hawthorne industries that see more men than women are Agriculture, Fishing & Hunting (100.0%), Transportation & Warehousing (100.0%), and Construction (92.0%), whereas the industries that tend to have a higher number of women are Retail Trade (100.0%), Utilities (100.0%), and Health Care & Social Assistance (88.2%).
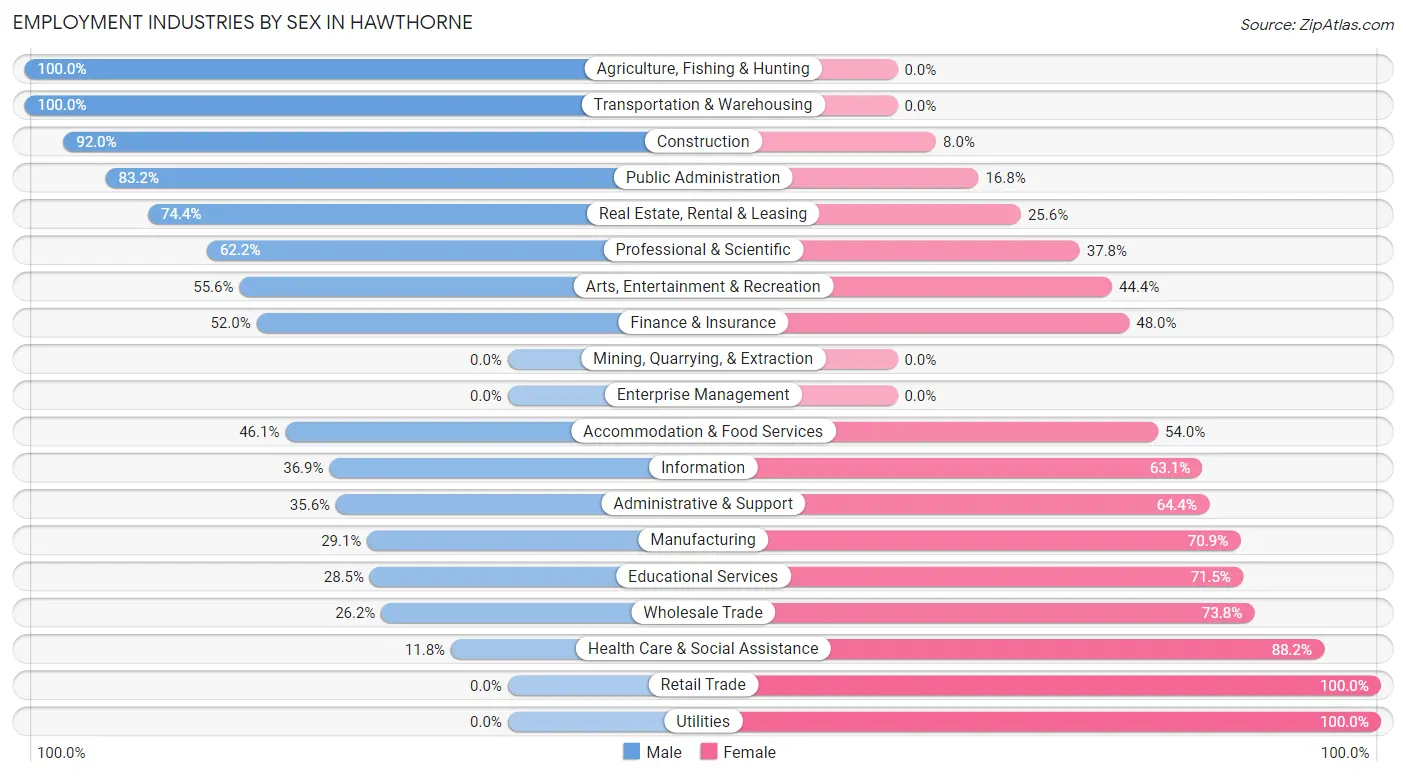
| Industry | Male | Female |
| Agriculture, Fishing & Hunting | 29 (100.0%) | 0 (0.0%) |
| Mining, Quarrying, & Extraction | 0 (0.0%) | 0 (0.0%) |
| Construction | 195 (92.0%) | 17 (8.0%) |
| Manufacturing | 16 (29.1%) | 39 (70.9%) |
| Wholesale Trade | 22 (26.2%) | 62 (73.8%) |
| Retail Trade | 0 (0.0%) | 58 (100.0%) |
| Transportation & Warehousing | 92 (100.0%) | 0 (0.0%) |
| Utilities | 0 (0.0%) | 45 (100.0%) |
| Information | 41 (36.9%) | 70 (63.1%) |
| Finance & Insurance | 91 (52.0%) | 84 (48.0%) |
| Real Estate, Rental & Leasing | 32 (74.4%) | 11 (25.6%) |
| Professional & Scientific | 239 (62.2%) | 145 (37.8%) |
| Enterprise Management | 0 (0.0%) | 0 (0.0%) |
| Administrative & Support | 32 (35.6%) | 58 (64.4%) |
| Educational Services | 117 (28.5%) | 293 (71.5%) |
| Health Care & Social Assistance | 26 (11.8%) | 195 (88.2%) |
| Arts, Entertainment & Recreation | 40 (55.6%) | 32 (44.4%) |
| Accommodation & Food Services | 35 (46.1%) | 41 (53.9%) |
| Public Administration | 124 (83.2%) | 25 (16.8%) |
| Total | 1,173 (48.5%) | 1,246 (51.5%) |
Education in Hawthorne
School Enrollment in Hawthorne
The most common levels of schooling among the 711 students in Hawthorne are high school (179 | 25.2%), elementary school (169 | 23.8%), and middle school (117 | 16.5%).
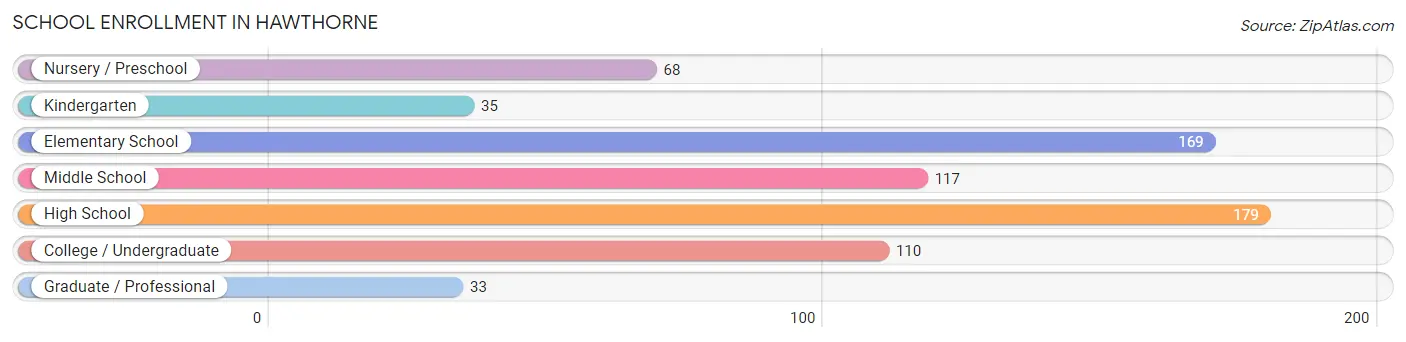
| School Level | # Students | % Students |
| Nursery / Preschool | 68 | 9.6% |
| Kindergarten | 35 | 4.9% |
| Elementary School | 169 | 23.8% |
| Middle School | 117 | 16.5% |
| High School | 179 | 25.2% |
| College / Undergraduate | 110 | 15.5% |
| Graduate / Professional | 33 | 4.6% |
| Total | 711 | 100.0% |
School Enrollment by Age by Funding Source in Hawthorne
Out of a total of 711 students who are enrolled in schools in Hawthorne, 182 (25.6%) attend a private institution, while the remaining 529 (74.4%) are enrolled in public schools. The age group of 18 to 19 year olds has the highest likelihood of being enrolled in private schools, with 45 (100.0% in the age bracket) enrolled. Conversely, the age group of 5 to 9 year old has the lowest likelihood of being enrolled in a private school, with 181 (94.8% in the age bracket) attending a public institution.
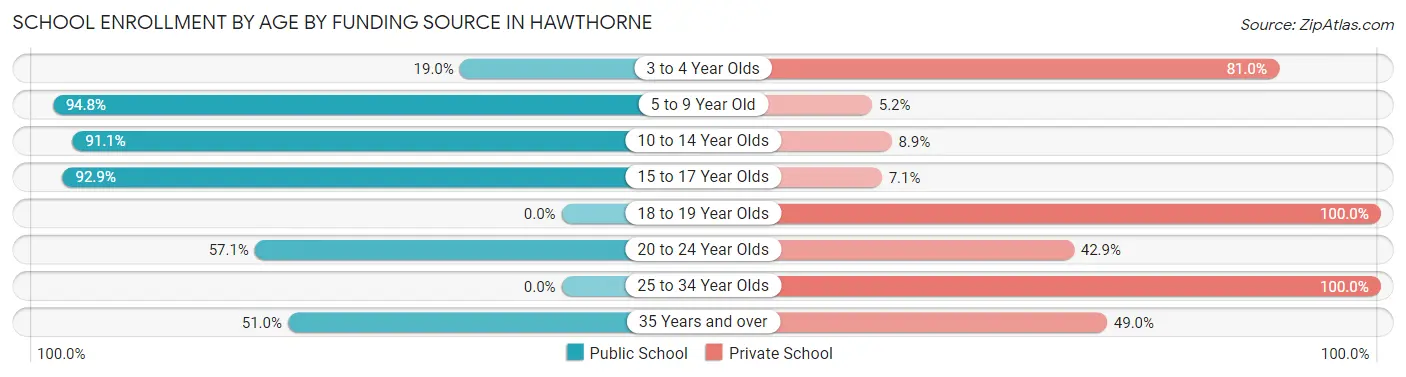
| Age Bracket | Public School | Private School |
| 3 to 4 Year Olds | 11 (19.0%) | 47 (81.0%) |
| 5 to 9 Year Old | 181 (94.8%) | 10 (5.2%) |
| 10 to 14 Year Olds | 174 (91.1%) | 17 (8.9%) |
| 15 to 17 Year Olds | 105 (92.9%) | 8 (7.1%) |
| 18 to 19 Year Olds | 0 (0.0%) | 45 (100.0%) |
| 20 to 24 Year Olds | 32 (57.1%) | 24 (42.9%) |
| 25 to 34 Year Olds | 0 (0.0%) | 6 (100.0%) |
| 35 Years and over | 26 (51.0%) | 25 (49.0%) |
| Total | 529 (74.4%) | 182 (25.6%) |
Educational Attainment by Field of Study in Hawthorne
Business (439 | 23.5%), science & technology (213 | 11.4%), literature & languages (202 | 10.8%), education (198 | 10.6%), and visual & performing arts (120 | 6.4%) are the most common fields of study among 1,864 individuals in Hawthorne who have obtained a bachelor's degree or higher.
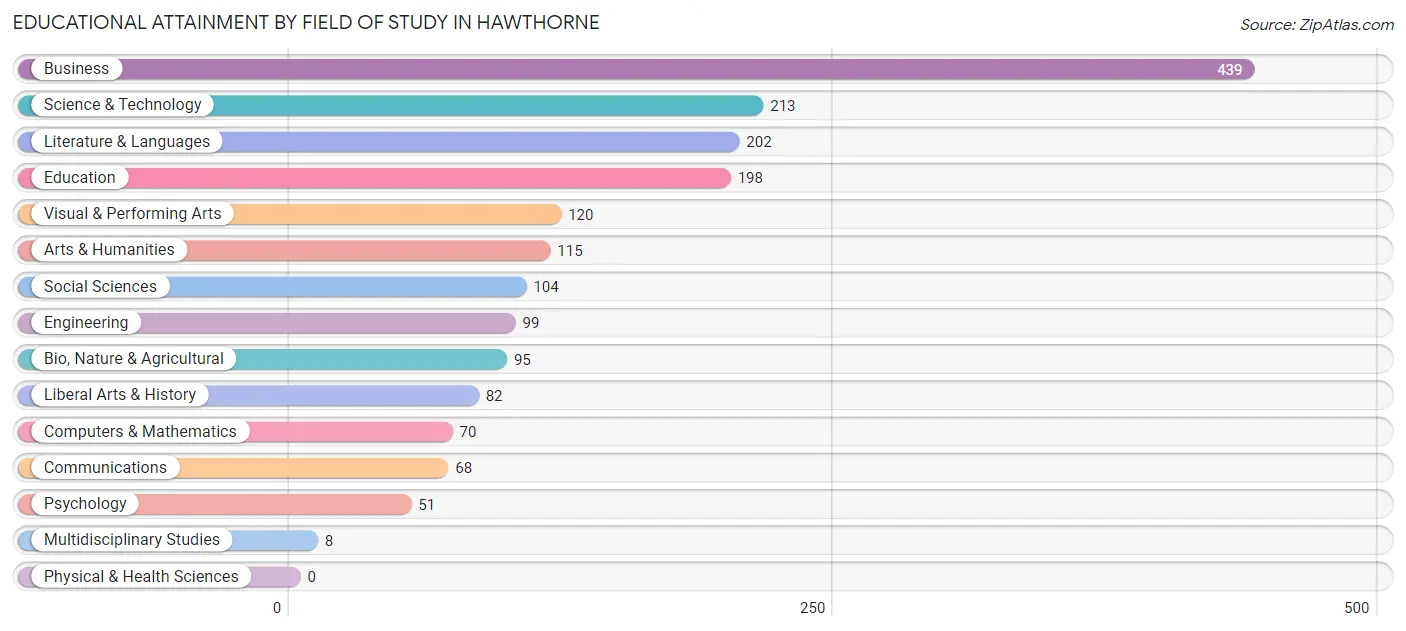
| Field of Study | # Graduates | % Graduates |
| Computers & Mathematics | 70 | 3.8% |
| Bio, Nature & Agricultural | 95 | 5.1% |
| Physical & Health Sciences | 0 | 0.0% |
| Psychology | 51 | 2.7% |
| Social Sciences | 104 | 5.6% |
| Engineering | 99 | 5.3% |
| Multidisciplinary Studies | 8 | 0.4% |
| Science & Technology | 213 | 11.4% |
| Business | 439 | 23.5% |
| Education | 198 | 10.6% |
| Literature & Languages | 202 | 10.8% |
| Liberal Arts & History | 82 | 4.4% |
| Visual & Performing Arts | 120 | 6.4% |
| Communications | 68 | 3.6% |
| Arts & Humanities | 115 | 6.2% |
| Total | 1,864 | 100.0% |
Transportation & Commute in Hawthorne
Vehicle Availability by Sex in Hawthorne
The most prevalent vehicle ownership categories in Hawthorne are males with 2 vehicles (653, accounting for 56.9%) and females with 2 vehicles (610, making up 52.4%).
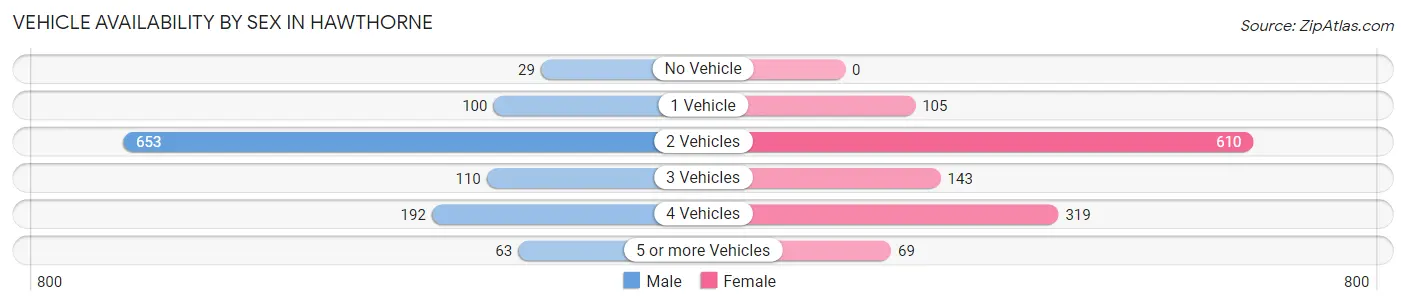
| Vehicles Available | Male | Female |
| No Vehicle | 29 (2.5%) | 0 (0.0%) |
| 1 Vehicle | 100 (8.7%) | 105 (8.4%) |
| 2 Vehicles | 653 (56.9%) | 610 (49.0%) |
| 3 Vehicles | 110 (9.6%) | 143 (11.5%) |
| 4 Vehicles | 192 (16.7%) | 319 (25.6%) |
| 5 or more Vehicles | 63 (5.5%) | 69 (5.5%) |
| Total | 1,147 (100.0%) | 1,246 (100.0%) |
Commute Time in Hawthorne
The most frequently occuring commute durations in Hawthorne are 20 to 24 minutes (408 commuters, 19.2%), 60 to 89 minutes (304 commuters, 14.3%), and 15 to 19 minutes (232 commuters, 10.9%).
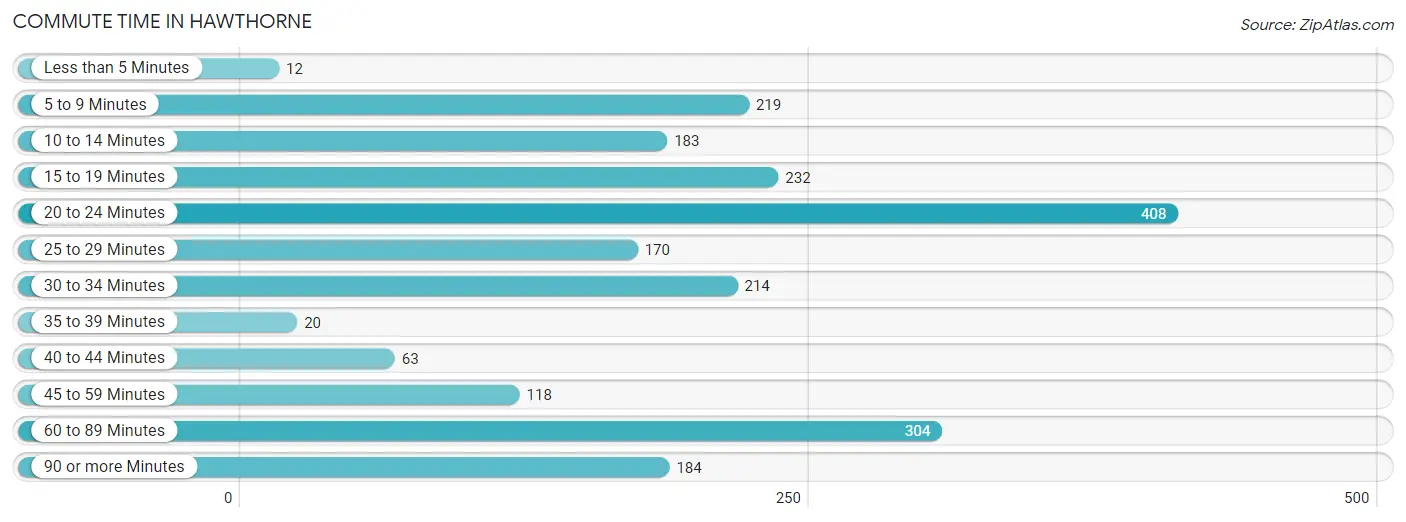
| Commute Time | # Commuters | % Commuters |
| Less than 5 Minutes | 12 | 0.6% |
| 5 to 9 Minutes | 219 | 10.3% |
| 10 to 14 Minutes | 183 | 8.6% |
| 15 to 19 Minutes | 232 | 10.9% |
| 20 to 24 Minutes | 408 | 19.2% |
| 25 to 29 Minutes | 170 | 8.0% |
| 30 to 34 Minutes | 214 | 10.1% |
| 35 to 39 Minutes | 20 | 0.9% |
| 40 to 44 Minutes | 63 | 3.0% |
| 45 to 59 Minutes | 118 | 5.6% |
| 60 to 89 Minutes | 304 | 14.3% |
| 90 or more Minutes | 184 | 8.6% |
Commute Time by Sex in Hawthorne
The most common commute times in Hawthorne are 20 to 24 minutes (230 commuters, 22.0%) for males and 30 to 34 minutes (179 commuters, 16.5%) for females.
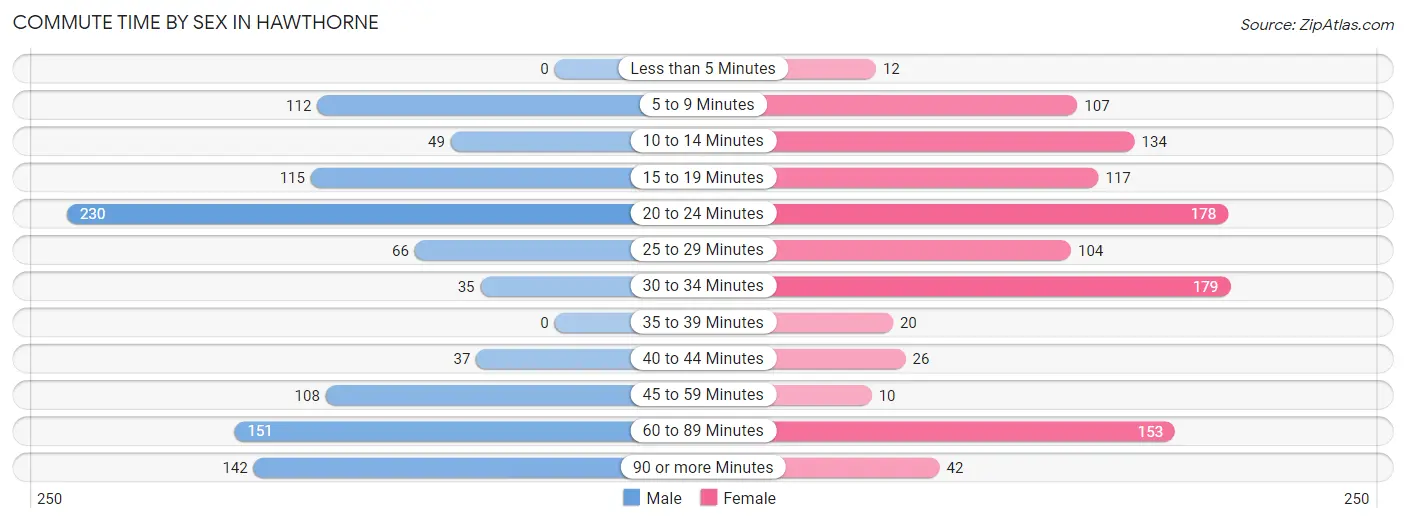
| Commute Time | Male | Female |
| Less than 5 Minutes | 0 (0.0%) | 12 (1.1%) |
| 5 to 9 Minutes | 112 (10.7%) | 107 (9.9%) |
| 10 to 14 Minutes | 49 (4.7%) | 134 (12.4%) |
| 15 to 19 Minutes | 115 (11.0%) | 117 (10.8%) |
| 20 to 24 Minutes | 230 (22.0%) | 178 (16.5%) |
| 25 to 29 Minutes | 66 (6.3%) | 104 (9.6%) |
| 30 to 34 Minutes | 35 (3.4%) | 179 (16.5%) |
| 35 to 39 Minutes | 0 (0.0%) | 20 (1.8%) |
| 40 to 44 Minutes | 37 (3.5%) | 26 (2.4%) |
| 45 to 59 Minutes | 108 (10.3%) | 10 (0.9%) |
| 60 to 89 Minutes | 151 (14.4%) | 153 (14.1%) |
| 90 or more Minutes | 142 (13.6%) | 42 (3.9%) |
Time of Departure to Work by Sex in Hawthorne
The most frequent times of departure to work in Hawthorne are 7:00 AM to 7:29 AM (249, 23.8%) for males and 7:30 AM to 7:59 AM (257, 23.7%) for females.
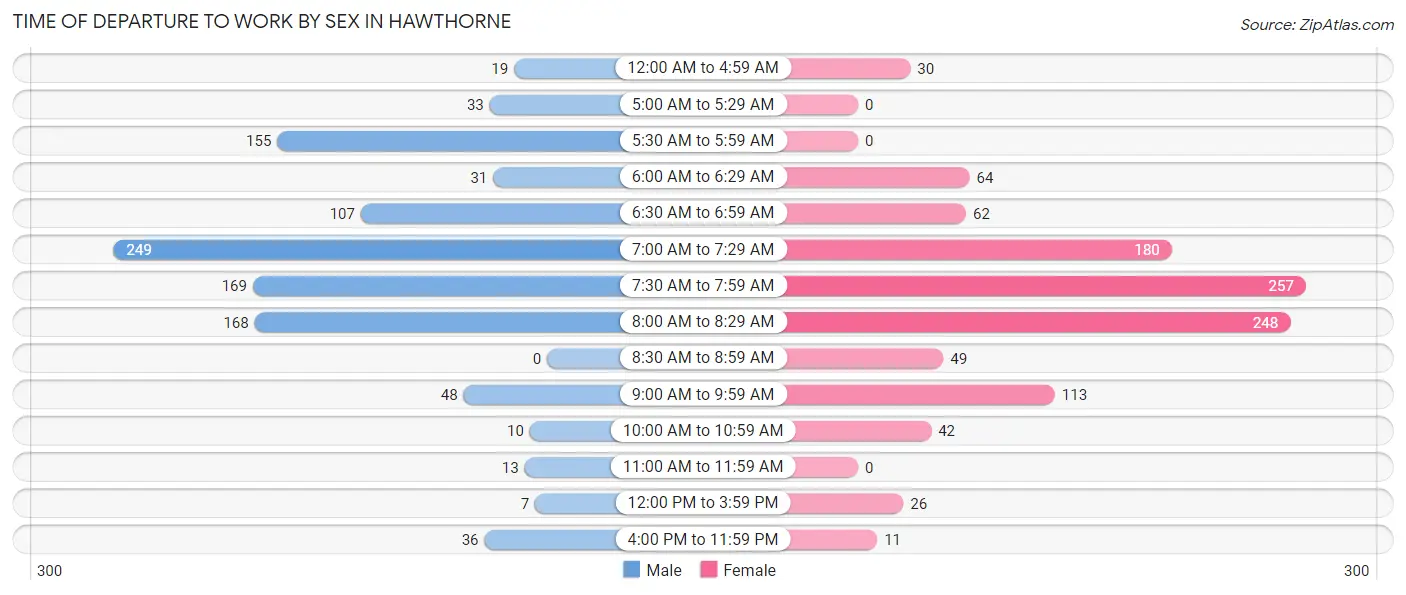
| Time of Departure | Male | Female |
| 12:00 AM to 4:59 AM | 19 (1.8%) | 30 (2.8%) |
| 5:00 AM to 5:29 AM | 33 (3.2%) | 0 (0.0%) |
| 5:30 AM to 5:59 AM | 155 (14.8%) | 0 (0.0%) |
| 6:00 AM to 6:29 AM | 31 (3.0%) | 64 (5.9%) |
| 6:30 AM to 6:59 AM | 107 (10.2%) | 62 (5.7%) |
| 7:00 AM to 7:29 AM | 249 (23.8%) | 180 (16.6%) |
| 7:30 AM to 7:59 AM | 169 (16.2%) | 257 (23.7%) |
| 8:00 AM to 8:29 AM | 168 (16.1%) | 248 (22.9%) |
| 8:30 AM to 8:59 AM | 0 (0.0%) | 49 (4.5%) |
| 9:00 AM to 9:59 AM | 48 (4.6%) | 113 (10.4%) |
| 10:00 AM to 10:59 AM | 10 (1.0%) | 42 (3.9%) |
| 11:00 AM to 11:59 AM | 13 (1.2%) | 0 (0.0%) |
| 12:00 PM to 3:59 PM | 7 (0.7%) | 26 (2.4%) |
| 4:00 PM to 11:59 PM | 36 (3.4%) | 11 (1.0%) |
| Total | 1,045 (100.0%) | 1,082 (100.0%) |
Housing Occupancy in Hawthorne
Occupancy by Ownership in Hawthorne
Of the total 1,704 dwellings in Hawthorne, owner-occupied units account for 1,505 (88.3%), while renter-occupied units make up 199 (11.7%).
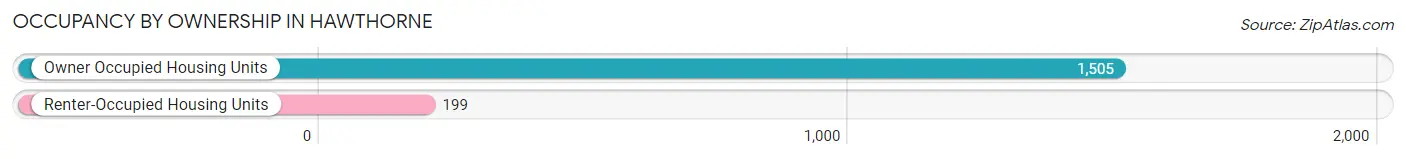
| Occupancy | # Housing Units | % Housing Units |
| Owner Occupied Housing Units | 1,505 | 88.3% |
| Renter-Occupied Housing Units | 199 | 11.7% |
| Total Occupied Housing Units | 1,704 | 100.0% |
Occupancy by Household Size in Hawthorne
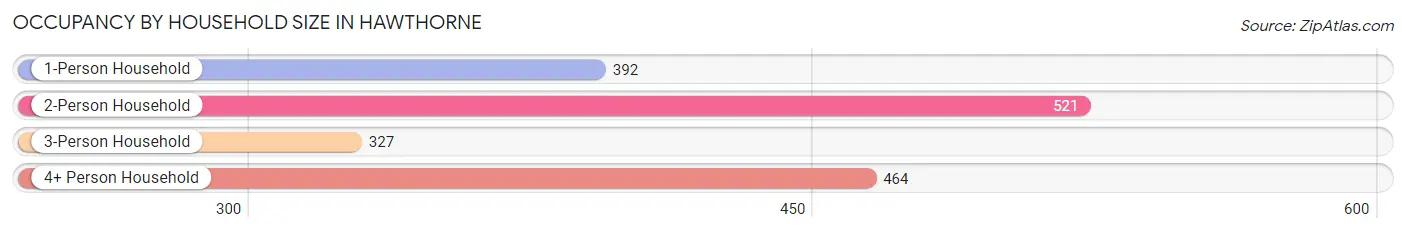
| Household Size | # Housing Units | % Housing Units |
| 1-Person Household | 392 | 23.0% |
| 2-Person Household | 521 | 30.6% |
| 3-Person Household | 327 | 19.2% |
| 4+ Person Household | 464 | 27.2% |
| Total Housing Units | 1,704 | 100.0% |
Occupancy by Ownership by Household Size in Hawthorne
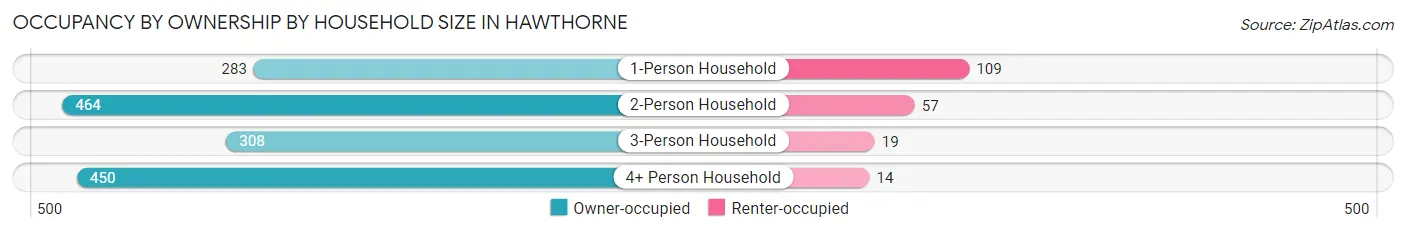
| Household Size | Owner-occupied | Renter-occupied |
| 1-Person Household | 283 (72.2%) | 109 (27.8%) |
| 2-Person Household | 464 (89.1%) | 57 (10.9%) |
| 3-Person Household | 308 (94.2%) | 19 (5.8%) |
| 4+ Person Household | 450 (97.0%) | 14 (3.0%) |
| Total Housing Units | 1,505 (88.3%) | 199 (11.7%) |
Occupancy by Educational Attainment in Hawthorne
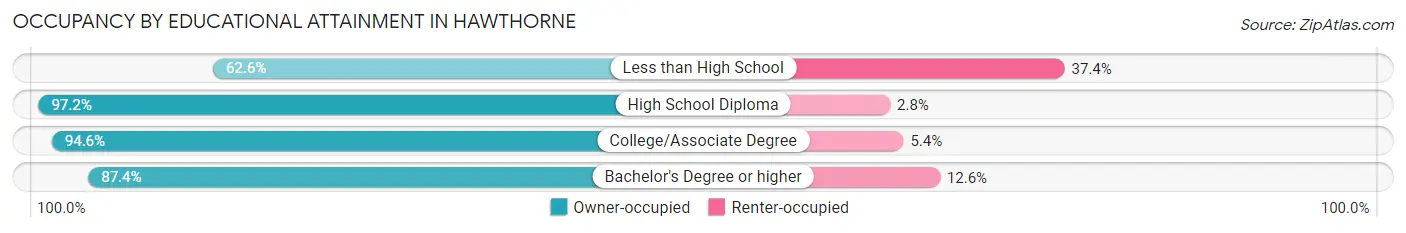
| Household Size | Owner-occupied | Renter-occupied |
| Less than High School | 109 (62.6%) | 65 (37.4%) |
| High School Diploma | 282 (97.2%) | 8 (2.8%) |
| College/Associate Degree | 402 (94.6%) | 23 (5.4%) |
| Bachelor's Degree or higher | 712 (87.4%) | 103 (12.6%) |
Occupancy by Age of Householder in Hawthorne
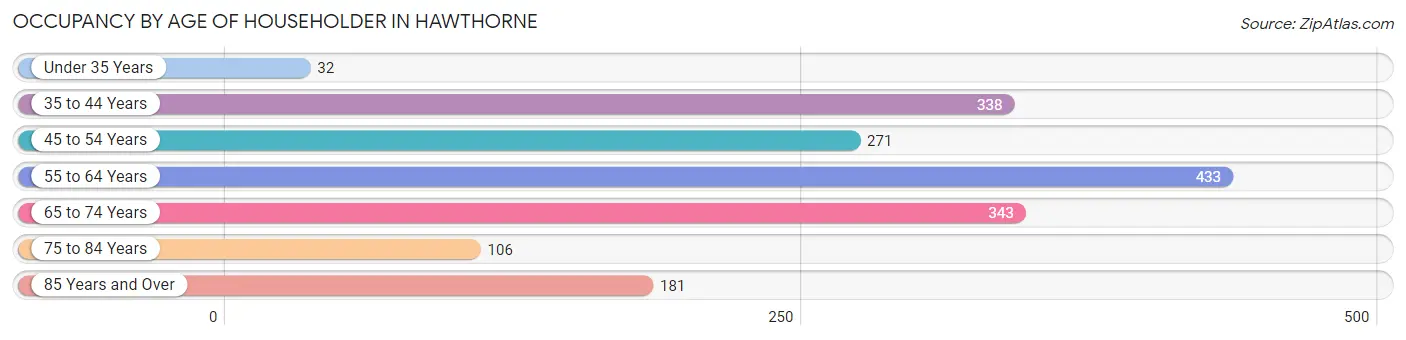
| Age Bracket | # Households | % Households |
| Under 35 Years | 32 | 1.9% |
| 35 to 44 Years | 338 | 19.8% |
| 45 to 54 Years | 271 | 15.9% |
| 55 to 64 Years | 433 | 25.4% |
| 65 to 74 Years | 343 | 20.1% |
| 75 to 84 Years | 106 | 6.2% |
| 85 Years and Over | 181 | 10.6% |
| Total | 1,704 | 100.0% |
Housing Finances in Hawthorne
Median Income by Occupancy in Hawthorne
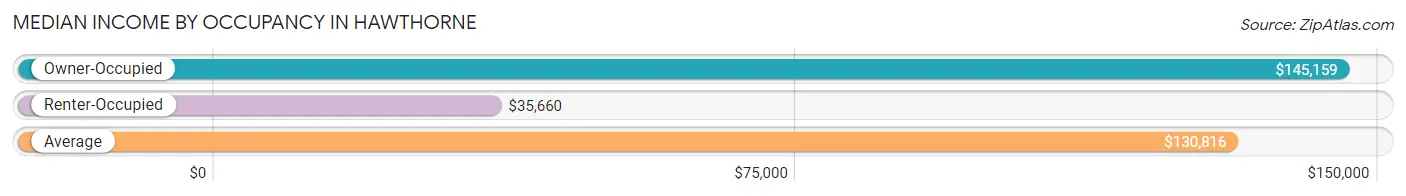
| Occupancy Type | # Households | Median Income |
| Owner-Occupied | 1,505 (88.3%) | $145,159 |
| Renter-Occupied | 199 (11.7%) | $35,660 |
| Average | 1,704 (100.0%) | $130,816 |
Occupancy by Householder Income Bracket in Hawthorne
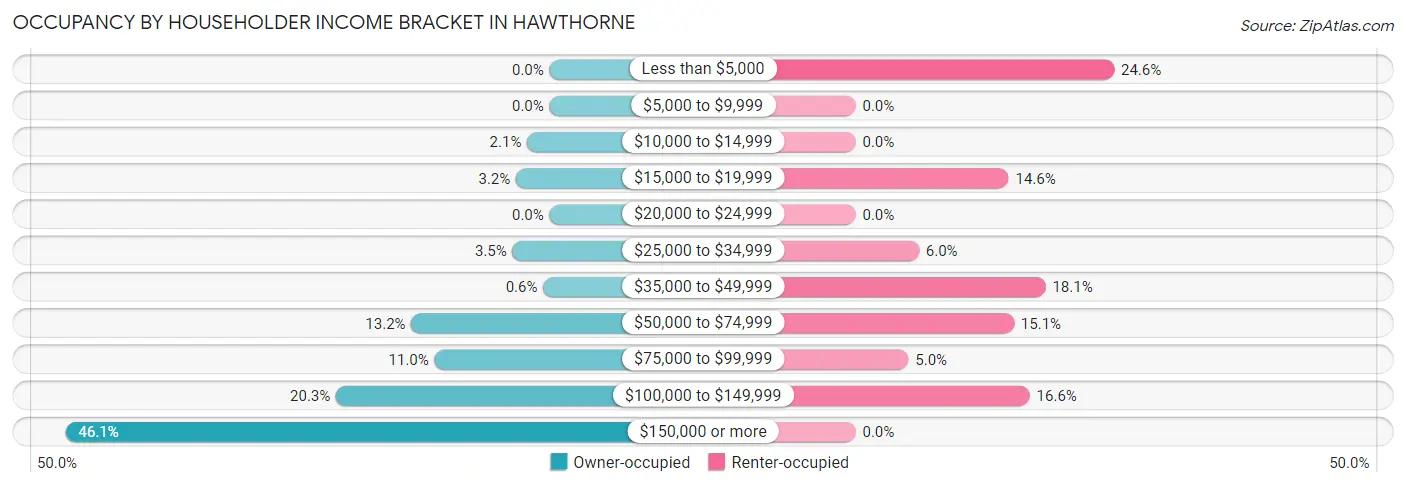
| Income Bracket | Owner-occupied | Renter-occupied |
| Less than $5,000 | 0 (0.0%) | 49 (24.6%) |
| $5,000 to $9,999 | 0 (0.0%) | 0 (0.0%) |
| $10,000 to $14,999 | 32 (2.1%) | 0 (0.0%) |
| $15,000 to $19,999 | 48 (3.2%) | 29 (14.6%) |
| $20,000 to $24,999 | 0 (0.0%) | 0 (0.0%) |
| $25,000 to $34,999 | 53 (3.5%) | 12 (6.0%) |
| $35,000 to $49,999 | 9 (0.6%) | 36 (18.1%) |
| $50,000 to $74,999 | 198 (13.2%) | 30 (15.1%) |
| $75,000 to $99,999 | 165 (11.0%) | 10 (5.0%) |
| $100,000 to $149,999 | 306 (20.3%) | 33 (16.6%) |
| $150,000 or more | 694 (46.1%) | 0 (0.0%) |
| Total | 1,505 (100.0%) | 199 (100.0%) |
Monthly Housing Cost Tiers in Hawthorne
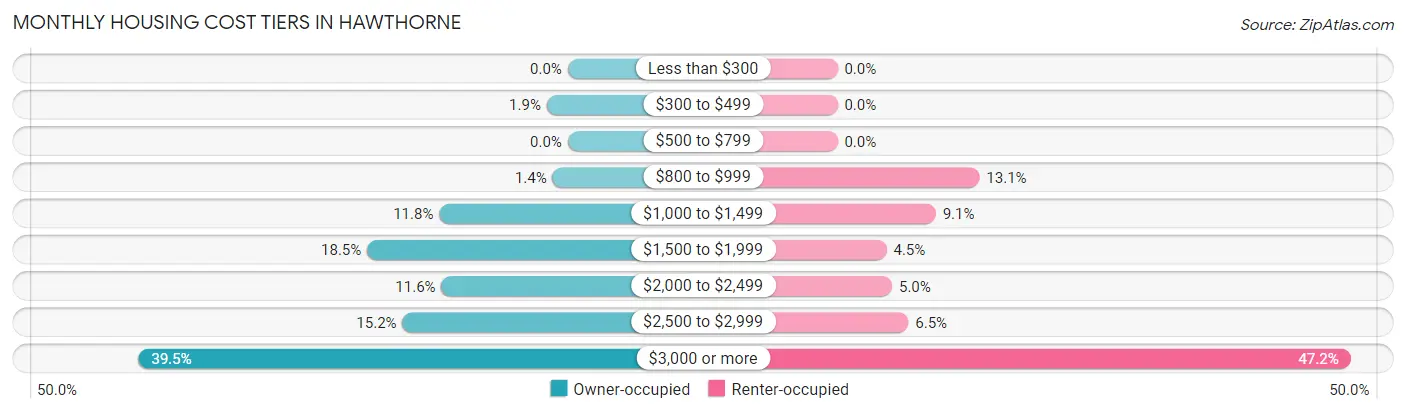
| Monthly Cost | Owner-occupied | Renter-occupied |
| Less than $300 | 0 (0.0%) | 0 (0.0%) |
| $300 to $499 | 29 (1.9%) | 0 (0.0%) |
| $500 to $799 | 0 (0.0%) | 0 (0.0%) |
| $800 to $999 | 21 (1.4%) | 26 (13.1%) |
| $1,000 to $1,499 | 178 (11.8%) | 18 (9.0%) |
| $1,500 to $1,999 | 278 (18.5%) | 9 (4.5%) |
| $2,000 to $2,499 | 175 (11.6%) | 10 (5.0%) |
| $2,500 to $2,999 | 229 (15.2%) | 13 (6.5%) |
| $3,000 or more | 595 (39.5%) | 94 (47.2%) |
| Total | 1,505 (100.0%) | 199 (100.0%) |
Physical Housing Characteristics in Hawthorne
Housing Structures in Hawthorne
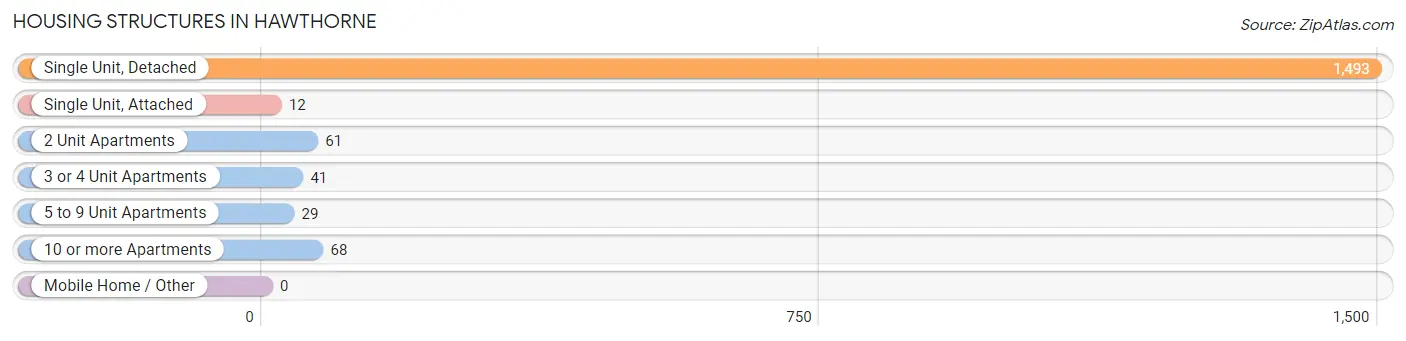
| Structure Type | # Housing Units | % Housing Units |
| Single Unit, Detached | 1,493 | 87.6% |
| Single Unit, Attached | 12 | 0.7% |
| 2 Unit Apartments | 61 | 3.6% |
| 3 or 4 Unit Apartments | 41 | 2.4% |
| 5 to 9 Unit Apartments | 29 | 1.7% |
| 10 or more Apartments | 68 | 4.0% |
| Mobile Home / Other | 0 | 0.0% |
| Total | 1,704 | 100.0% |
Housing Structures by Occupancy in Hawthorne
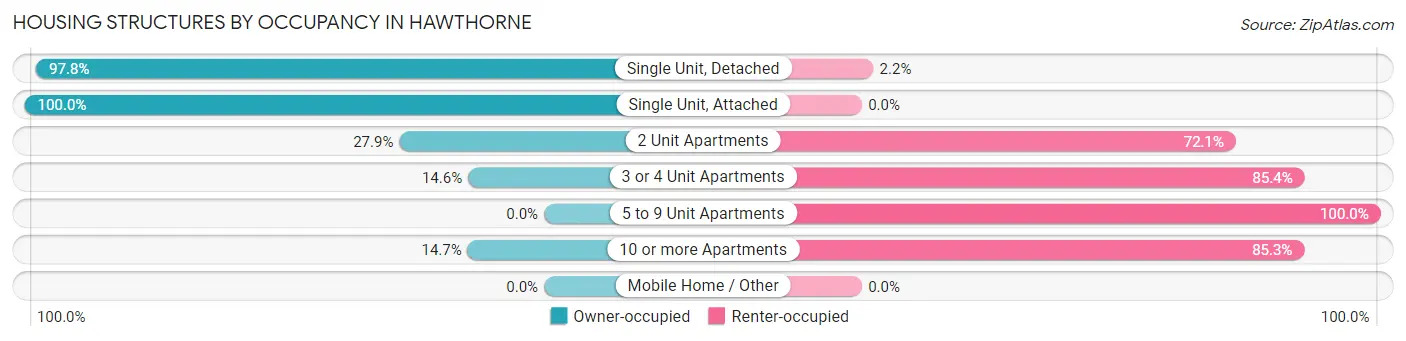
| Structure Type | Owner-occupied | Renter-occupied |
| Single Unit, Detached | 1,460 (97.8%) | 33 (2.2%) |
| Single Unit, Attached | 12 (100.0%) | 0 (0.0%) |
| 2 Unit Apartments | 17 (27.9%) | 44 (72.1%) |
| 3 or 4 Unit Apartments | 6 (14.6%) | 35 (85.4%) |
| 5 to 9 Unit Apartments | 0 (0.0%) | 29 (100.0%) |
| 10 or more Apartments | 10 (14.7%) | 58 (85.3%) |
| Mobile Home / Other | 0 (0.0%) | 0 (0.0%) |
| Total | 1,505 (88.3%) | 199 (11.7%) |
Housing Structures by Number of Rooms in Hawthorne
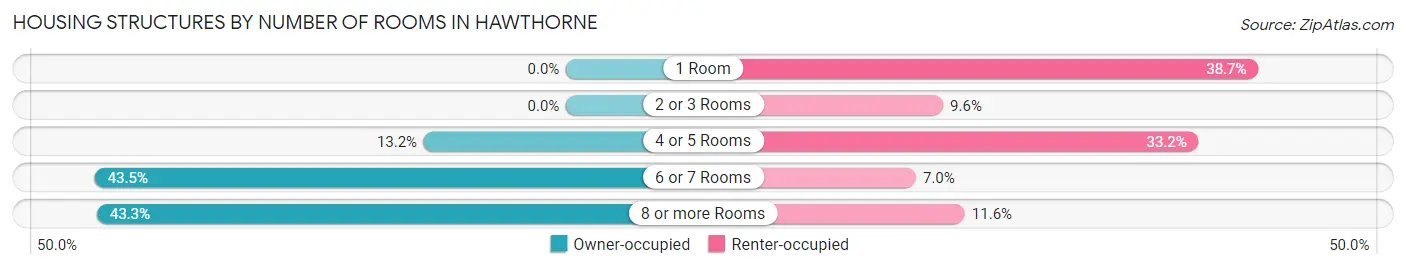
| Number of Rooms | Owner-occupied | Renter-occupied |
| 1 Room | 0 (0.0%) | 77 (38.7%) |
| 2 or 3 Rooms | 0 (0.0%) | 19 (9.6%) |
| 4 or 5 Rooms | 198 (13.2%) | 66 (33.2%) |
| 6 or 7 Rooms | 655 (43.5%) | 14 (7.0%) |
| 8 or more Rooms | 652 (43.3%) | 23 (11.6%) |
| Total | 1,505 (100.0%) | 199 (100.0%) |
Housing Structure by Heating Type in Hawthorne
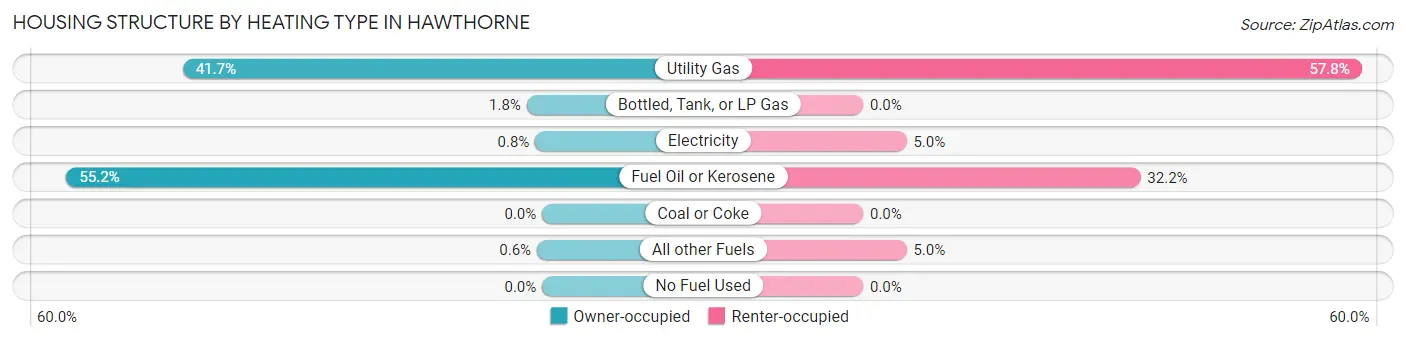
| Heating Type | Owner-occupied | Renter-occupied |
| Utility Gas | 627 (41.7%) | 115 (57.8%) |
| Bottled, Tank, or LP Gas | 27 (1.8%) | 0 (0.0%) |
| Electricity | 12 (0.8%) | 10 (5.0%) |
| Fuel Oil or Kerosene | 830 (55.1%) | 64 (32.2%) |
| Coal or Coke | 0 (0.0%) | 0 (0.0%) |
| All other Fuels | 9 (0.6%) | 10 (5.0%) |
| No Fuel Used | 0 (0.0%) | 0 (0.0%) |
| Total | 1,505 (100.0%) | 199 (100.0%) |
Household Vehicle Usage in Hawthorne
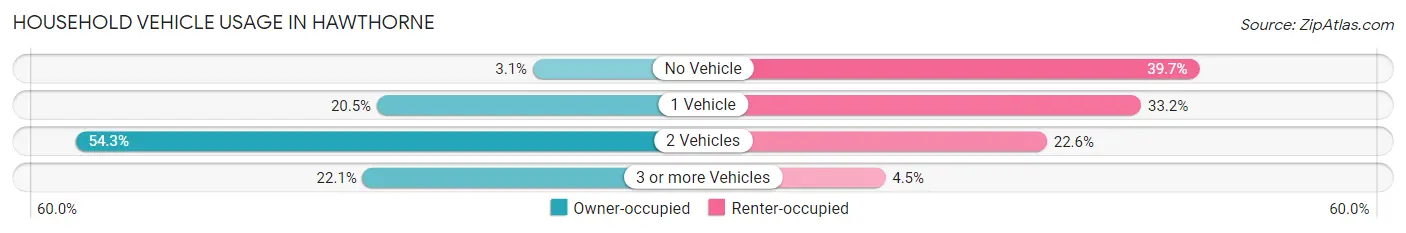
| Vehicles per Household | Owner-occupied | Renter-occupied |
| No Vehicle | 46 (3.1%) | 79 (39.7%) |
| 1 Vehicle | 309 (20.5%) | 66 (33.2%) |
| 2 Vehicles | 817 (54.3%) | 45 (22.6%) |
| 3 or more Vehicles | 333 (22.1%) | 9 (4.5%) |
| Total | 1,505 (100.0%) | 199 (100.0%) |
Real Estate & Mortgages in Hawthorne
Real Estate and Mortgage Overview in Hawthorne
| Characteristic | Without Mortgage | With Mortgage |
| Housing Units | 693 | 812 |
| Median Property Value | $646,300 | $679,000 |
| Median Household Income | $88,750 | $458 |
| Monthly Housing Costs | $1,501 | $595 |
| Real Estate Taxes | $10,001 | $12 |
Property Value by Mortgage Status in Hawthorne
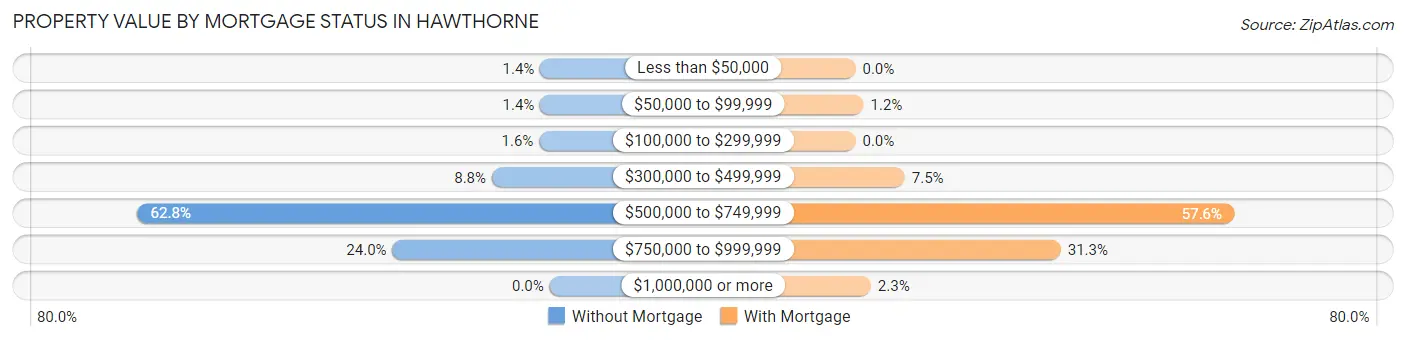
| Property Value | Without Mortgage | With Mortgage |
| Less than $50,000 | 10 (1.4%) | 0 (0.0%) |
| $50,000 to $99,999 | 10 (1.4%) | 10 (1.2%) |
| $100,000 to $299,999 | 11 (1.6%) | 0 (0.0%) |
| $300,000 to $499,999 | 61 (8.8%) | 61 (7.5%) |
| $500,000 to $749,999 | 435 (62.8%) | 468 (57.6%) |
| $750,000 to $999,999 | 166 (23.9%) | 254 (31.3%) |
| $1,000,000 or more | 0 (0.0%) | 19 (2.3%) |
| Total | 693 (100.0%) | 812 (100.0%) |
Household Income by Mortgage Status in Hawthorne
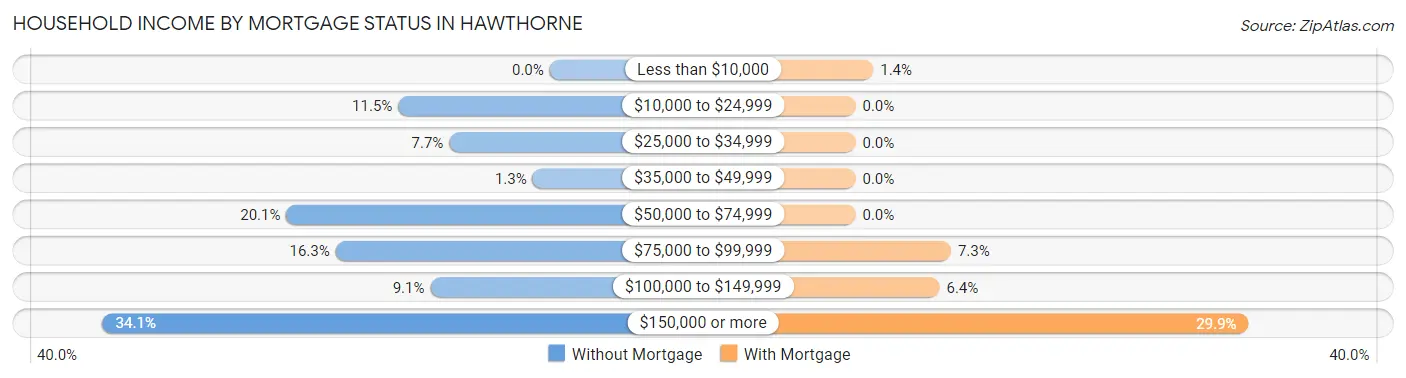
| Household Income | Without Mortgage | With Mortgage |
| Less than $10,000 | 0 (0.0%) | 11 (1.3%) |
| $10,000 to $24,999 | 80 (11.5%) | 0 (0.0%) |
| $25,000 to $34,999 | 53 (7.6%) | 0 (0.0%) |
| $35,000 to $49,999 | 9 (1.3%) | 0 (0.0%) |
| $50,000 to $74,999 | 139 (20.1%) | 0 (0.0%) |
| $75,000 to $99,999 | 113 (16.3%) | 59 (7.3%) |
| $100,000 to $149,999 | 63 (9.1%) | 52 (6.4%) |
| $150,000 or more | 236 (34.1%) | 243 (29.9%) |
| Total | 693 (100.0%) | 812 (100.0%) |
Property Value to Household Income Ratio in Hawthorne
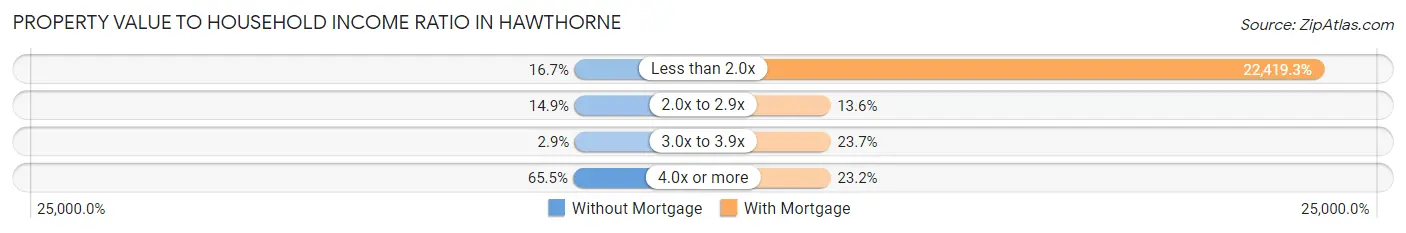
| Value-to-Income Ratio | Without Mortgage | With Mortgage |
| Less than 2.0x | 116 (16.7%) | 182,045 (22,419.3%) |
| 2.0x to 2.9x | 103 (14.9%) | 110 (13.6%) |
| 3.0x to 3.9x | 20 (2.9%) | 192 (23.6%) |
| 4.0x or more | 454 (65.5%) | 188 (23.2%) |
| Total | 693 (100.0%) | 812 (100.0%) |
Real Estate Taxes by Mortgage Status in Hawthorne
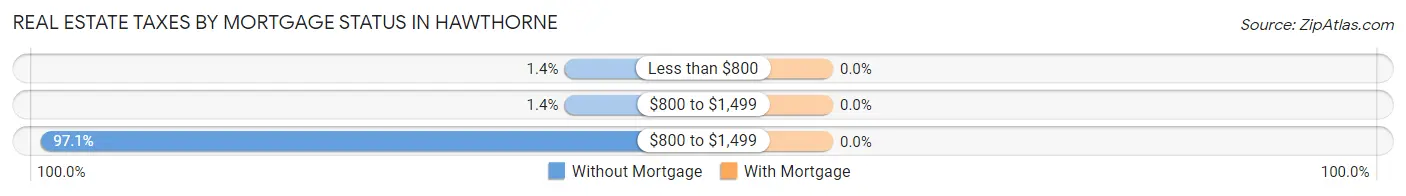
| Property Taxes | Without Mortgage | With Mortgage |
| Less than $800 | 10 (1.4%) | 0 (0.0%) |
| $800 to $1,499 | 10 (1.4%) | 0 (0.0%) |
| $800 to $1,499 | 673 (97.1%) | 0 (0.0%) |
| Total | 693 (100.0%) | 812 (100.0%) |
Health & Disability in Hawthorne
Health Insurance Coverage by Age in Hawthorne
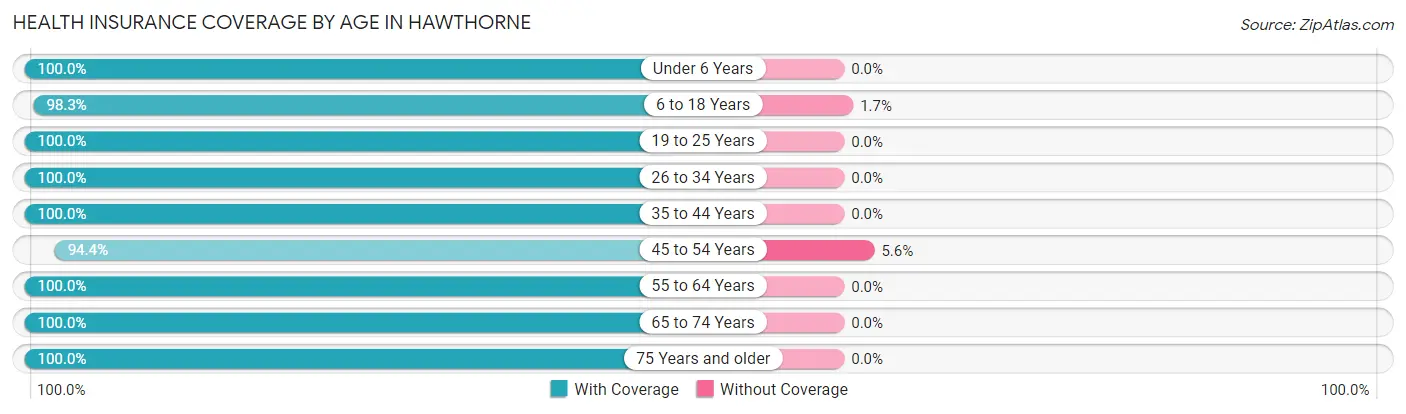
| Age Bracket | With Coverage | Without Coverage |
| Under 6 Years | 315 (100.0%) | 0 (0.0%) |
| 6 to 18 Years | 594 (98.3%) | 10 (1.7%) |
| 19 to 25 Years | 423 (100.0%) | 0 (0.0%) |
| 26 to 34 Years | 316 (100.0%) | 0 (0.0%) |
| 35 to 44 Years | 582 (100.0%) | 0 (0.0%) |
| 45 to 54 Years | 520 (94.4%) | 31 (5.6%) |
| 55 to 64 Years | 813 (100.0%) | 0 (0.0%) |
| 65 to 74 Years | 636 (100.0%) | 0 (0.0%) |
| 75 Years and older | 453 (100.0%) | 0 (0.0%) |
| Total | 4,652 (99.1%) | 41 (0.9%) |
Health Insurance Coverage by Citizenship Status in Hawthorne
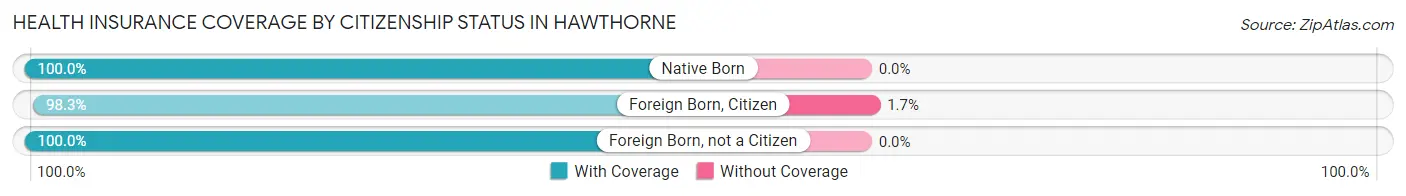
| Citizenship Status | With Coverage | Without Coverage |
| Native Born | 315 (100.0%) | 0 (0.0%) |
| Foreign Born, Citizen | 594 (98.3%) | 10 (1.7%) |
| Foreign Born, not a Citizen | 423 (100.0%) | 0 (0.0%) |
Health Insurance Coverage by Household Income in Hawthorne
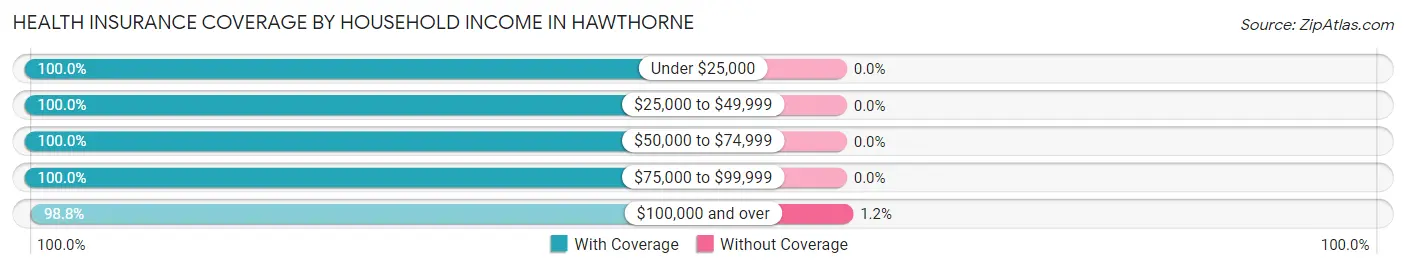
| Household Income | With Coverage | Without Coverage |
| Under $25,000 | 170 (100.0%) | 0 (0.0%) |
| $25,000 to $49,999 | 170 (100.0%) | 0 (0.0%) |
| $50,000 to $74,999 | 418 (100.0%) | 0 (0.0%) |
| $75,000 to $99,999 | 461 (100.0%) | 0 (0.0%) |
| $100,000 and over | 3,387 (98.8%) | 41 (1.2%) |
Public vs Private Health Insurance Coverage by Age in Hawthorne
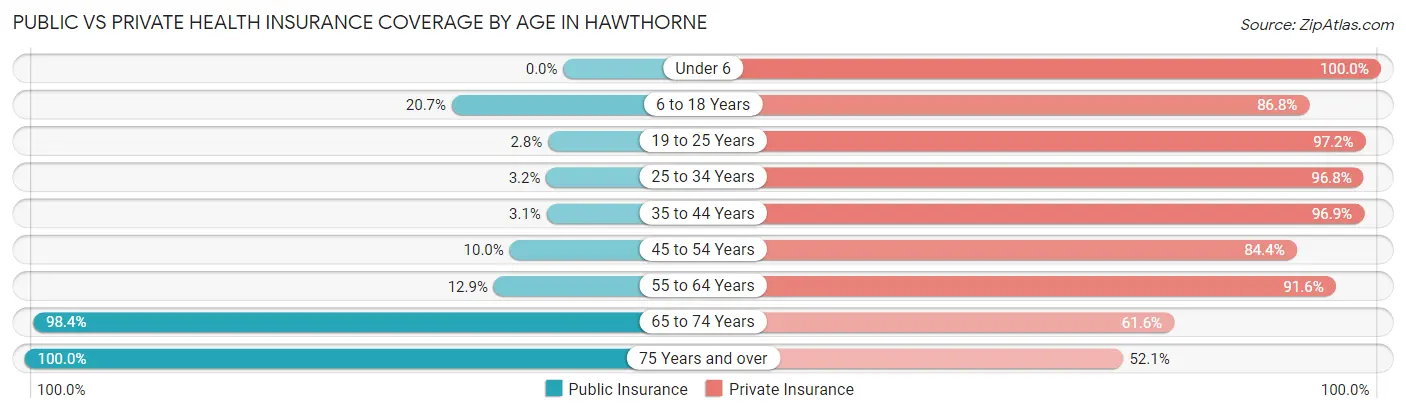
| Age Bracket | Public Insurance | Private Insurance |
| Under 6 | 0 (0.0%) | 315 (100.0%) |
| 6 to 18 Years | 125 (20.7%) | 524 (86.8%) |
| 19 to 25 Years | 12 (2.8%) | 411 (97.2%) |
| 25 to 34 Years | 10 (3.2%) | 306 (96.8%) |
| 35 to 44 Years | 18 (3.1%) | 564 (96.9%) |
| 45 to 54 Years | 55 (10.0%) | 465 (84.4%) |
| 55 to 64 Years | 105 (12.9%) | 745 (91.6%) |
| 65 to 74 Years | 626 (98.4%) | 392 (61.6%) |
| 75 Years and over | 453 (100.0%) | 236 (52.1%) |
| Total | 1,404 (29.9%) | 3,958 (84.3%) |
Disability Status by Sex by Age in Hawthorne
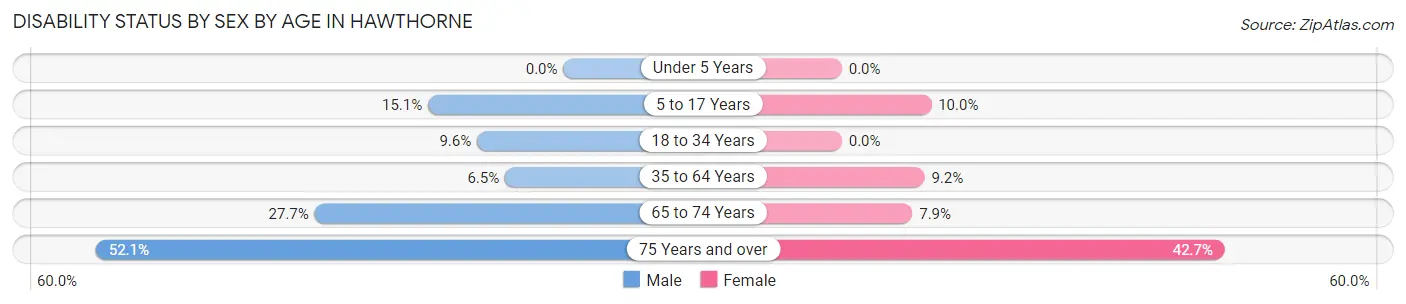
| Age Bracket | Male | Female |
| Under 5 Years | 0 (0.0%) | 0 (0.0%) |
| 5 to 17 Years | 52 (15.1%) | 25 (10.0%) |
| 18 to 34 Years | 27 (9.6%) | 0 (0.0%) |
| 35 to 64 Years | 65 (6.5%) | 87 (9.2%) |
| 65 to 74 Years | 95 (27.7%) | 23 (7.9%) |
| 75 Years and over | 126 (52.1%) | 90 (42.6%) |
Disability Class by Sex by Age in Hawthorne
Disability Class: Hearing Difficulty
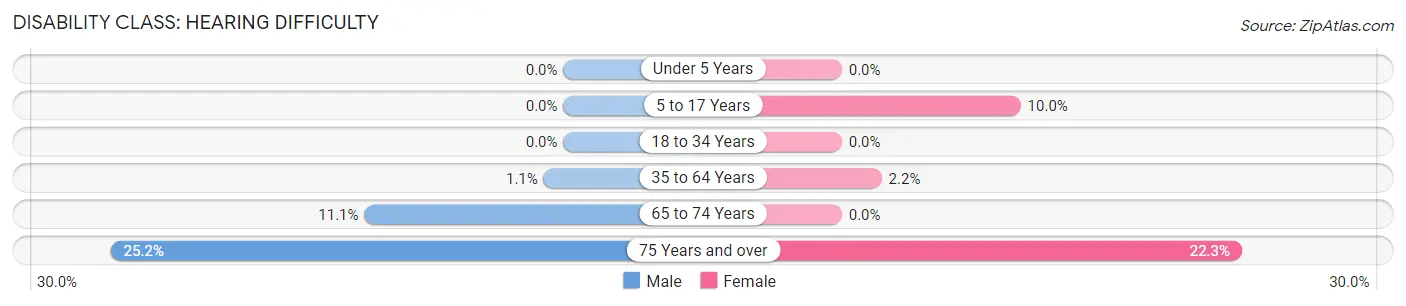
| Age Bracket | Male | Female |
| Under 5 Years | 0 (0.0%) | 0 (0.0%) |
| 5 to 17 Years | 0 (0.0%) | 25 (10.0%) |
| 18 to 34 Years | 0 (0.0%) | 0 (0.0%) |
| 35 to 64 Years | 11 (1.1%) | 21 (2.2%) |
| 65 to 74 Years | 38 (11.1%) | 0 (0.0%) |
| 75 Years and over | 61 (25.2%) | 47 (22.3%) |
Disability Class: Vision Difficulty
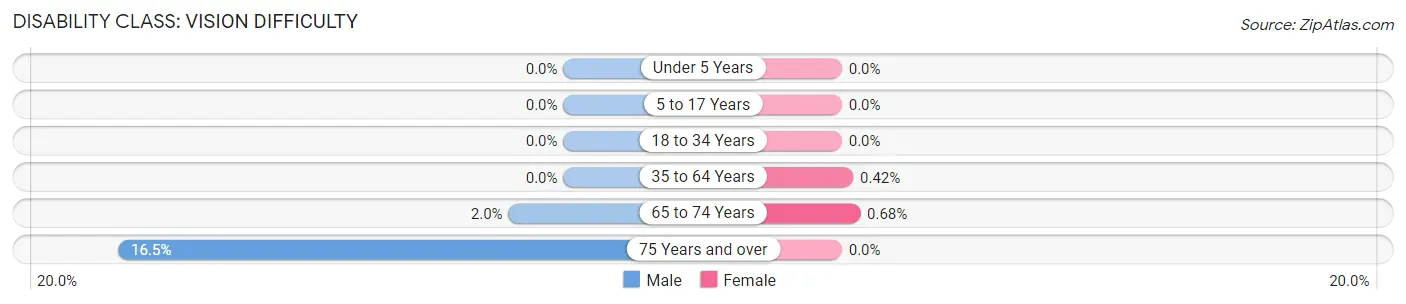
| Age Bracket | Male | Female |
| Under 5 Years | 0 (0.0%) | 0 (0.0%) |
| 5 to 17 Years | 0 (0.0%) | 0 (0.0%) |
| 18 to 34 Years | 0 (0.0%) | 0 (0.0%) |
| 35 to 64 Years | 0 (0.0%) | 4 (0.4%) |
| 65 to 74 Years | 7 (2.0%) | 2 (0.7%) |
| 75 Years and over | 40 (16.5%) | 0 (0.0%) |
Disability Class: Cognitive Difficulty
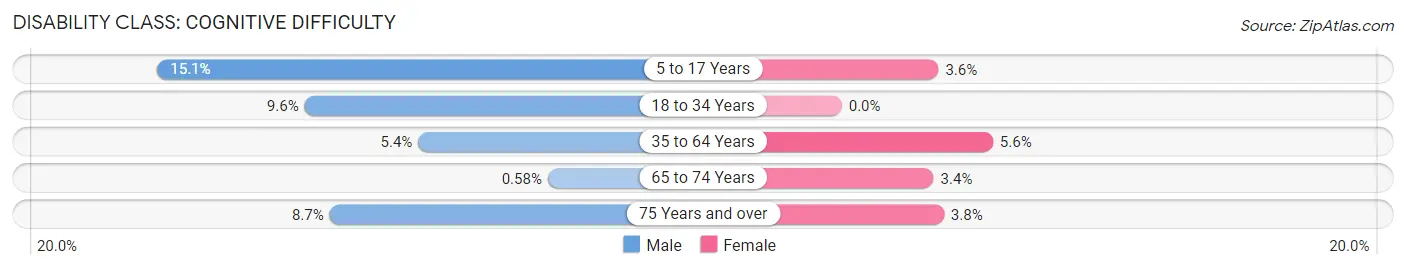
| Age Bracket | Male | Female |
| 5 to 17 Years | 52 (15.1%) | 9 (3.6%) |
| 18 to 34 Years | 27 (9.6%) | 0 (0.0%) |
| 35 to 64 Years | 54 (5.4%) | 53 (5.6%) |
| 65 to 74 Years | 2 (0.6%) | 10 (3.4%) |
| 75 Years and over | 21 (8.7%) | 8 (3.8%) |
Disability Class: Ambulatory Difficulty
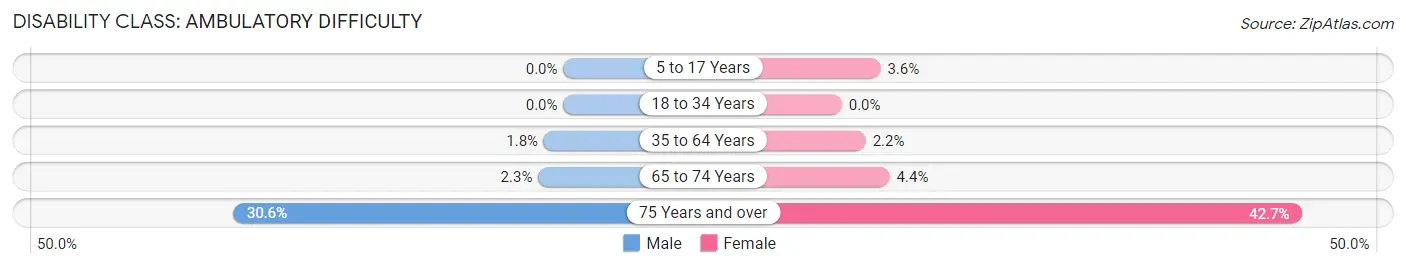
| Age Bracket | Male | Female |
| 5 to 17 Years | 0 (0.0%) | 9 (3.6%) |
| 18 to 34 Years | 0 (0.0%) | 0 (0.0%) |
| 35 to 64 Years | 18 (1.8%) | 21 (2.2%) |
| 65 to 74 Years | 8 (2.3%) | 13 (4.4%) |
| 75 Years and over | 74 (30.6%) | 90 (42.6%) |
Disability Class: Self-Care Difficulty
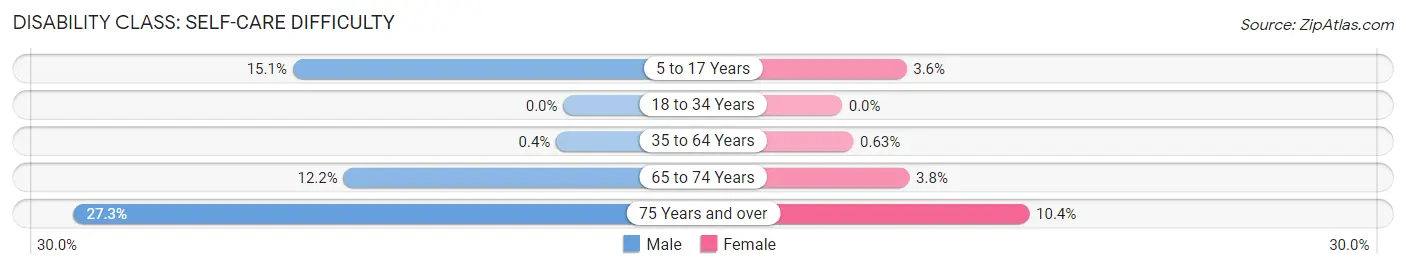
| Age Bracket | Male | Female |
| 5 to 17 Years | 52 (15.1%) | 9 (3.6%) |
| 18 to 34 Years | 0 (0.0%) | 0 (0.0%) |
| 35 to 64 Years | 4 (0.4%) | 6 (0.6%) |
| 65 to 74 Years | 42 (12.2%) | 11 (3.7%) |
| 75 Years and over | 66 (27.3%) | 22 (10.4%) |
Technology Access in Hawthorne
Computing Device Access in Hawthorne
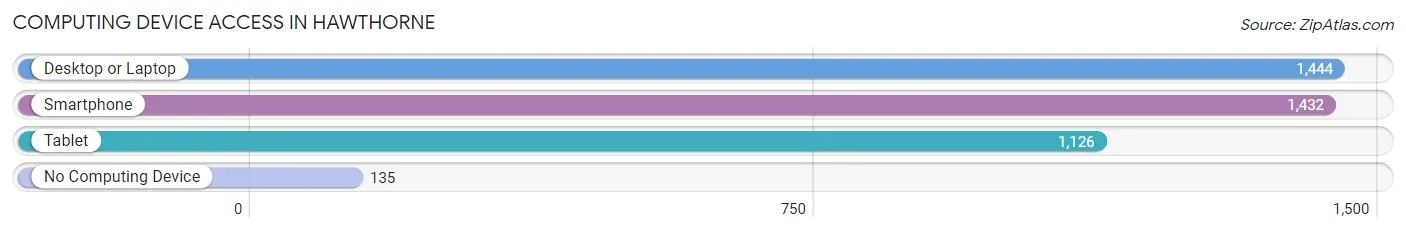
| Device Type | # Households | % Households |
| Desktop or Laptop | 1,444 | 84.7% |
| Smartphone | 1,432 | 84.0% |
| Tablet | 1,126 | 66.1% |
| No Computing Device | 135 | 7.9% |
| Total | 1,704 | 100.0% |
Internet Access in Hawthorne
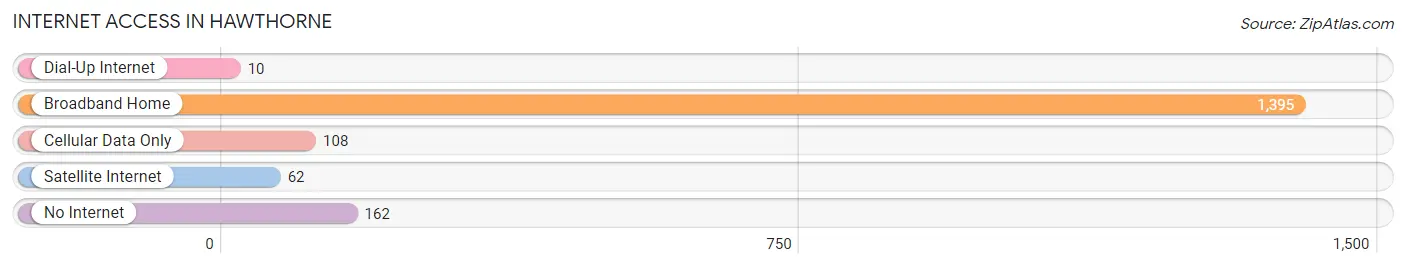
| Internet Type | # Households | % Households |
| Dial-Up Internet | 10 | 0.6% |
| Broadband Home | 1,395 | 81.9% |
| Cellular Data Only | 108 | 6.3% |
| Satellite Internet | 62 | 3.6% |
| No Internet | 162 | 9.5% |
| Total | 1,704 | 100.0% |
Hawthorne Summary
Hawthorne, NY is a small hamlet located in the town of Mount Pleasant in Westchester County, New York. It is situated about 25 miles north of New York City and is part of the New York metropolitan area. The hamlet has a population of about 5,000 people and is known for its rural charm and small-town atmosphere.
History
Hawthorne was first settled in the late 1700s by a group of Dutch settlers. The hamlet was originally known as Unionville, but was later renamed after the Hawthorne family, who were prominent landowners in the area. The hamlet was officially incorporated in 1873.
In the late 19th century, Hawthorne was a popular summer resort destination for wealthy New Yorkers. The hamlet was home to several grand hotels, including the Hawthorne Hotel, which was built in 1891 and was one of the most luxurious hotels in the area.
Geography
Hawthorne is located in the town of Mount Pleasant in Westchester County, New York. It is situated about 25 miles north of New York City and is part of the New York metropolitan area. The hamlet is bordered by the towns of North Castle, Ossining, and Yorktown.
The hamlet is situated on the banks of the Pocantico River, which flows through the area. The hamlet is also home to several small lakes, including Lake Oscawana and Lake Purdy.
Economy
The economy of Hawthorne is largely based on tourism and retail. The hamlet is home to several small businesses, including restaurants, shops, and galleries. The hamlet is also home to several large corporations, including PepsiCo, which has its headquarters in Hawthorne.
The hamlet is also home to several educational institutions, including the Hawthorne School District, which serves the hamlet and the surrounding area.
Demographics
As of the 2010 census, the population of Hawthorne was 5,000. The racial makeup of the hamlet was 87.3% White, 5.2% African American, 0.3% Native American, 2.2% Asian, and 4.9% from other races. The median household income was $76,250, and the median family income was $90,000.
The majority of the population (90.2%) was born in the United States, and the largest ancestry groups were Italian (20.2%), Irish (17.2%), and German (14.2%). The majority of the population (90.2%) spoke English as their primary language.
Conclusion
Hawthorne, NY is a small hamlet located in the town of Mount Pleasant in Westchester County, New York. It is situated about 25 miles north of New York City and is part of the New York metropolitan area. The hamlet has a population of about 5,000 people and is known for its rural charm and small-town atmosphere. The economy of Hawthorne is largely based on tourism and retail, and the hamlet is home to several small businesses, large corporations, and educational institutions. The majority of the population is White, and the largest ancestry groups are Italian, Irish, and German.
Common Questions
What is Per Capita Income in Hawthorne?
Per Capita income in Hawthorne is $67,105.
What is the Median Family Income in Hawthorne?
Median Family Income in Hawthorne is $168,269.
What is the Median Household income in Hawthorne?
Median Household Income in Hawthorne is $130,816.
What is Income or Wage Gap in Hawthorne?
Income or Wage Gap in Hawthorne is 36.8%.
Women in Hawthorne earn 63.2 cents for every dollar earned by a man.
What is Inequality or Gini Index in Hawthorne?
Inequality or Gini Index in Hawthorne is 0.47.
What is the Total Population of Hawthorne?
Total Population of Hawthorne is 4,693.
What is the Total Male Population of Hawthorne?
Total Male Population of Hawthorne is 2,344.
What is the Total Female Population of Hawthorne?
Total Female Population of Hawthorne is 2,349.
What is the Ratio of Males per 100 Females in Hawthorne?
There are 99.79 Males per 100 Females in Hawthorne.
What is the Ratio of Females per 100 Males in Hawthorne?
There are 100.21 Females per 100 Males in Hawthorne.
What is the Median Population Age in Hawthorne?
Median Population Age in Hawthorne is 47.9 Years.
What is the Average Family Size in Hawthorne
Average Family Size in Hawthorne is 3.3 People.
What is the Average Household Size in Hawthorne
Average Household Size in Hawthorne is 2.7 People.
How Large is the Labor Force in Hawthorne?
There are 2,594 People in the Labor Forcein in Hawthorne.
What is the Percentage of People in the Labor Force in Hawthorne?
66.5% of People are in the Labor Force in Hawthorne.
What is the Unemployment Rate in Hawthorne?
Unemployment Rate in Hawthorne is 6.8%.