Hamilton, NY Map & Demographics
Hamilton Map
Hamilton Overview
$23,503
PER CAPITA INCOME
$145,417
AVG FAMILY INCOME
$59,152
AVG HOUSEHOLD INCOME
37.3%
WAGE / INCOME GAP [ % ]
62.7¢/ $1
WAGE / INCOME GAP [ $ ]
0.50
INEQUALITY / GINI INDEX
3,882
TOTAL POPULATION
1,802
MALE POPULATION
2,080
FEMALE POPULATION
86.63
MALES / 100 FEMALES
115.43
FEMALES / 100 MALES
20.7
MEDIAN AGE
2.8
AVG FAMILY SIZE
1.9
AVG HOUSEHOLD SIZE
1,524
LABOR FORCE [ PEOPLE ]
41.7%
PERCENT IN LABOR FORCE
0.6%
UNEMPLOYMENT RATE
Hamilton Zip Codes
Hamilton Area Codes
Income in Hamilton
Income Overview in Hamilton
Per Capita Income in Hamilton is $23,503, while median incomes of families and households are $145,417 and $59,152 respectively.
| Characteristic | Number | Measure |
| Per Capita Income | 3,882 | $23,503 |
| Median Family Income | 329 | $145,417 |
| Mean Family Income | 329 | $162,857 |
| Median Household Income | 789 | $59,152 |
| Mean Household Income | 789 | $97,200 |
| Income Deficit | 329 | $0 |
| Wage / Income Gap (%) | 3,882 | 37.29% |
| Wage / Income Gap ($) | 3,882 | 62.71¢ per $1 |
| Gini / Inequality Index | 3,882 | 0.50 |
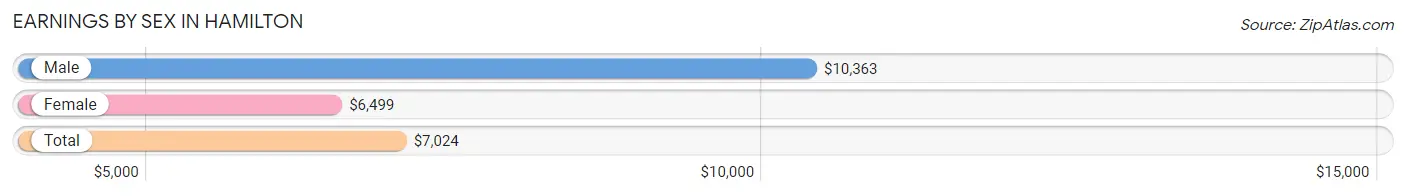
Earnings by Sex in Hamilton
Average Earnings in Hamilton are $7,024, $10,363 for men and $6,499 for women, a difference of 37.3%.
| Sex | Number | Average Earnings |
| Male | 913 (39.0%) | $10,363 |
| Female | 1,427 (61.0%) | $6,499 |
| Total | 2,340 (100.0%) | $7,024 |
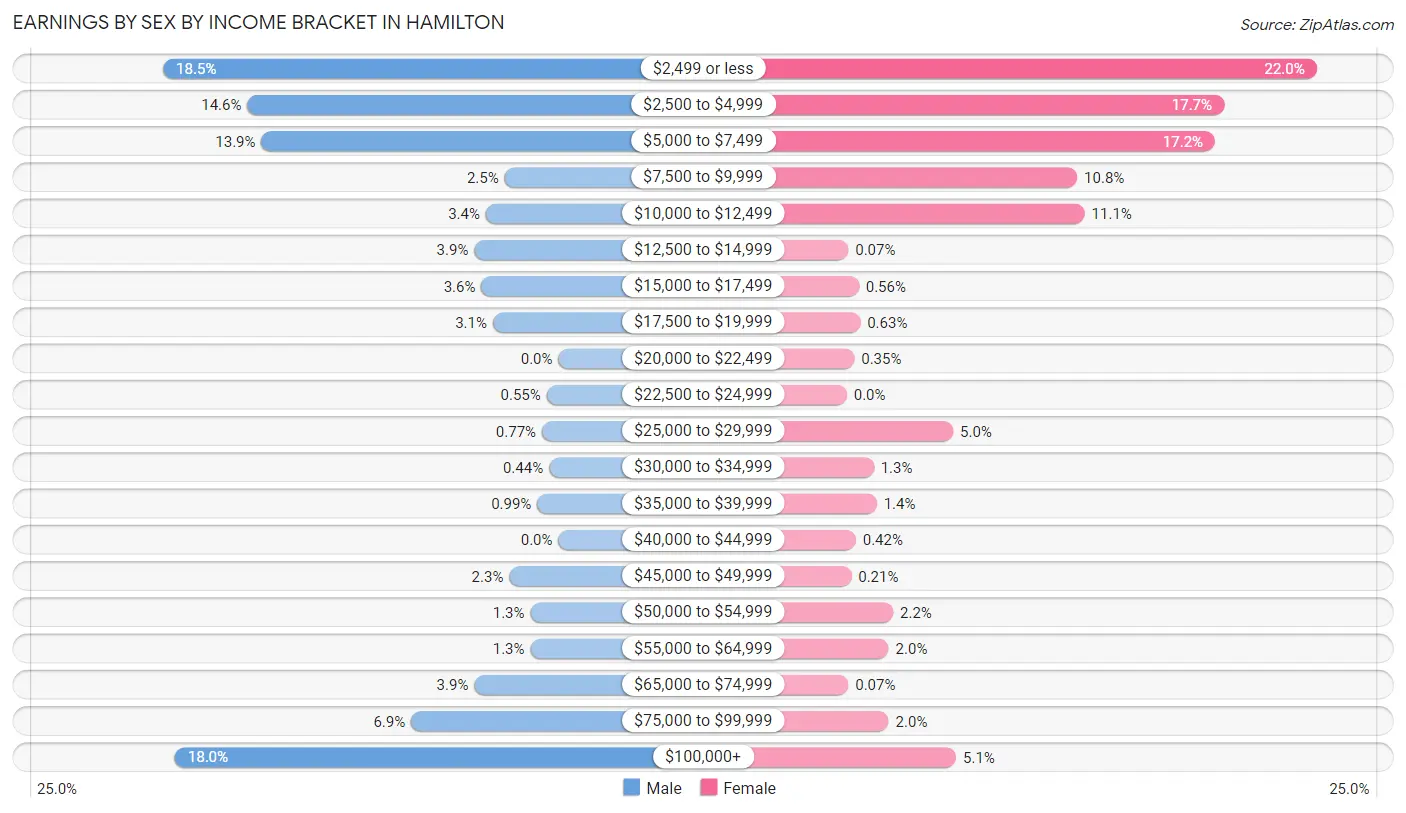
Earnings by Sex by Income Bracket in Hamilton
The most common earnings brackets in Hamilton are $2,499 or less for men (169 | 18.5%) and $2,499 or less for women (314 | 22.0%).
| Income | Male | Female |
| $2,499 or less | 169 (18.5%) | 314 (22.0%) |
| $2,500 to $4,999 | 133 (14.6%) | 252 (17.7%) |
| $5,000 to $7,499 | 127 (13.9%) | 246 (17.2%) |
| $7,500 to $9,999 | 23 (2.5%) | 154 (10.8%) |
| $10,000 to $12,499 | 31 (3.4%) | 159 (11.1%) |
| $12,500 to $14,999 | 36 (3.9%) | 1 (0.1%) |
| $15,000 to $17,499 | 33 (3.6%) | 8 (0.6%) |
| $17,500 to $19,999 | 28 (3.1%) | 9 (0.6%) |
| $20,000 to $22,499 | 0 (0.0%) | 5 (0.4%) |
| $22,500 to $24,999 | 5 (0.5%) | 0 (0.0%) |
| $25,000 to $29,999 | 7 (0.8%) | 71 (5.0%) |
| $30,000 to $34,999 | 4 (0.4%) | 18 (1.3%) |
| $35,000 to $39,999 | 9 (1.0%) | 20 (1.4%) |
| $40,000 to $44,999 | 0 (0.0%) | 6 (0.4%) |
| $45,000 to $49,999 | 21 (2.3%) | 3 (0.2%) |
| $50,000 to $54,999 | 12 (1.3%) | 31 (2.2%) |
| $55,000 to $64,999 | 12 (1.3%) | 28 (2.0%) |
| $65,000 to $74,999 | 36 (3.9%) | 1 (0.1%) |
| $75,000 to $99,999 | 63 (6.9%) | 28 (2.0%) |
| $100,000+ | 164 (18.0%) | 73 (5.1%) |
| Total | 913 (100.0%) | 1,427 (100.0%) |
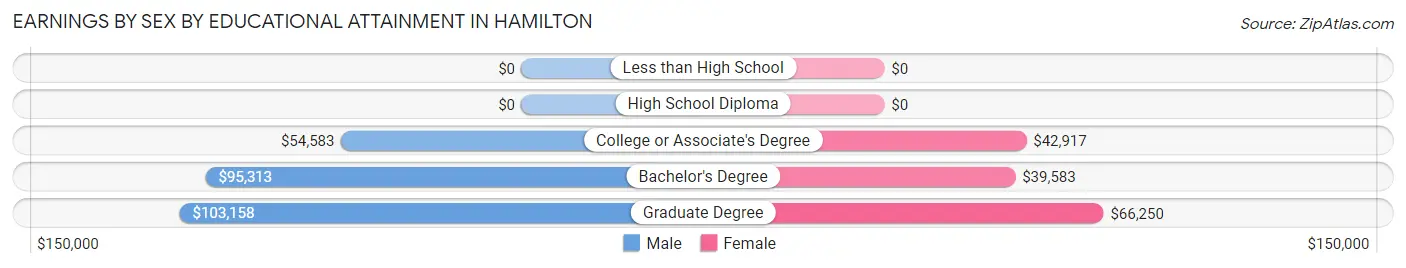
Earnings by Sex by Educational Attainment in Hamilton
Average earnings in Hamilton are $91,181 for men and $54,191 for women, a difference of 40.6%. Men with an educational attainment of graduate degree enjoy the highest average annual earnings of $103,158, while those with college or associate's degree education earn the least with $54,583. Women with an educational attainment of graduate degree earn the most with the average annual earnings of $66,250, while those with bachelor's degree education have the smallest earnings of $39,583.
| Educational Attainment | Male Income | Female Income |
| Less than High School | - | - |
| High School Diploma | - | - |
| College or Associate's Degree | $54,583 | $42,917 |
| Bachelor's Degree | $95,313 | $39,583 |
| Graduate Degree | $103,158 | $66,250 |
| Total | $91,181 | $54,191 |
Family Income in Hamilton
Family Income Brackets in Hamilton
According to the Hamilton family income data, there are 102 families falling into the $200,000+ income range, which is the most common income bracket and makes up 31.0% of all families.
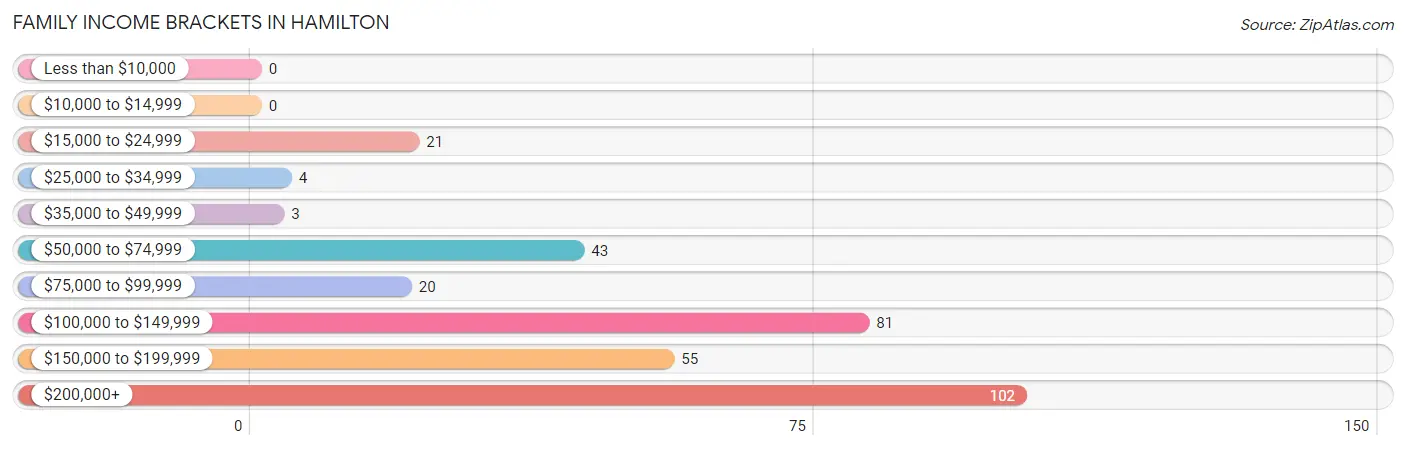
| Income Bracket | # Families | % Families |
| Less than $10,000 | 0 | 0.0% |
| $10,000 to $14,999 | 0 | 0.0% |
| $15,000 to $24,999 | 21 | 6.4% |
| $25,000 to $34,999 | 4 | 1.2% |
| $35,000 to $49,999 | 3 | 0.9% |
| $50,000 to $74,999 | 43 | 13.1% |
| $75,000 to $99,999 | 20 | 6.1% |
| $100,000 to $149,999 | 81 | 24.6% |
| $150,000 to $199,999 | 55 | 16.7% |
| $200,000+ | 102 | 31.0% |
Family Income by Famaliy Size in Hamilton
5-person families (26 | 7.9%) account for the highest median family income in Hamilton with $189,211 per family, while 2-person families (172 | 52.3%) have the highest median income of $63,750 per family member.
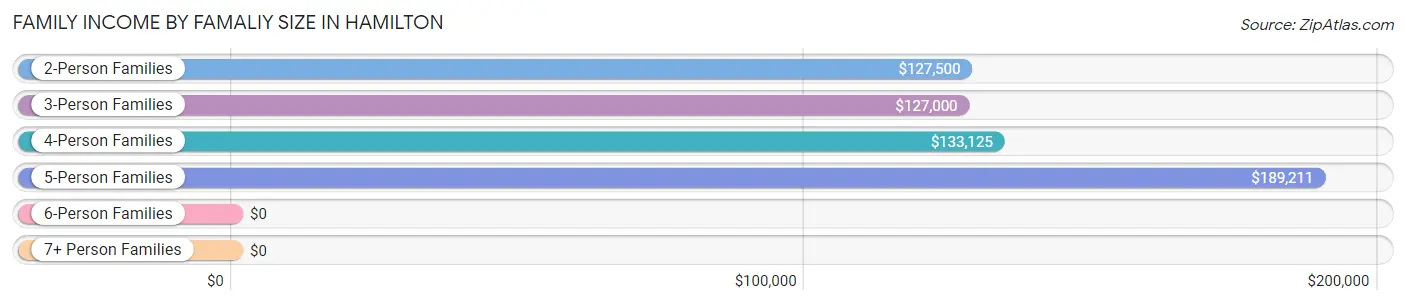
| Income Bracket | # Families | Median Income |
| 2-Person Families | 172 (52.3%) | $127,500 |
| 3-Person Families | 46 (14.0%) | $127,000 |
| 4-Person Families | 80 (24.3%) | $133,125 |
| 5-Person Families | 26 (7.9%) | $189,211 |
| 6-Person Families | 5 (1.5%) | $0 |
| 7+ Person Families | 0 (0.0%) | $0 |
| Total | 329 (100.0%) | $145,417 |
Family Income by Number of Earners in Hamilton
The median family income in Hamilton is $145,417, with families comprising 3+ earners (21) having the highest median family income of $213,750, while families with 1 earner (104) have the lowest median family income of $113,000, accounting for 6.4% and 31.6% of families, respectively.
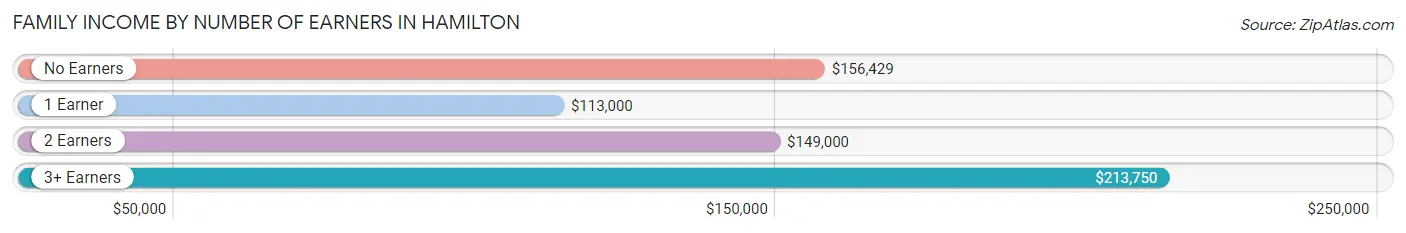
| Number of Earners | # Families | Median Income |
| No Earners | 20 (6.1%) | $156,429 |
| 1 Earner | 104 (31.6%) | $113,000 |
| 2 Earners | 184 (55.9%) | $149,000 |
| 3+ Earners | 21 (6.4%) | $213,750 |
| Total | 329 (100.0%) | $145,417 |
Household Income in Hamilton
Household Income Brackets in Hamilton
With 174 households falling in the category, the $15,000 to $24,999 income range is the most frequent in Hamilton, accounting for 22.1% of all households. In contrast, only 17 households (2.1%) fall into the $10,000 to $14,999 income bracket, making it the least populous group.
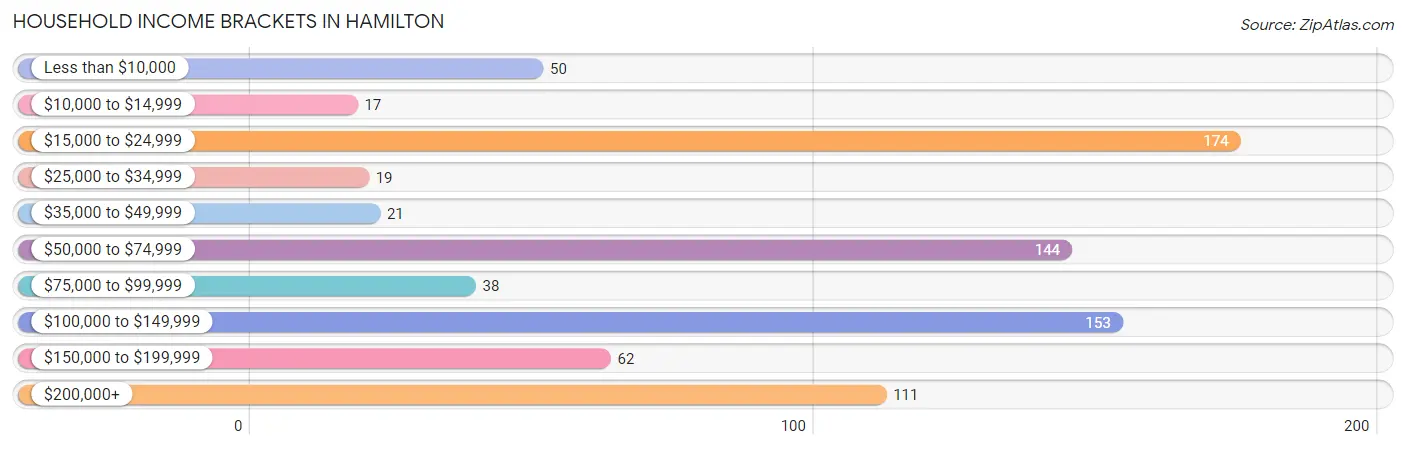
| Income Bracket | # Households | % Households |
| Less than $10,000 | 50 | 6.3% |
| $10,000 to $14,999 | 17 | 2.2% |
| $15,000 to $24,999 | 174 | 22.1% |
| $25,000 to $34,999 | 19 | 2.4% |
| $35,000 to $49,999 | 21 | 2.7% |
| $50,000 to $74,999 | 144 | 18.3% |
| $75,000 to $99,999 | 38 | 4.8% |
| $100,000 to $149,999 | 153 | 19.4% |
| $150,000 to $199,999 | 62 | 7.9% |
| $200,000+ | 111 | 14.1% |
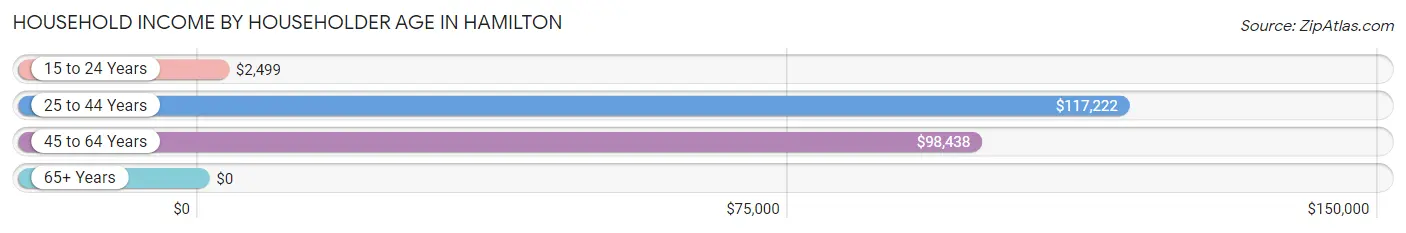
Household Income by Householder Age in Hamilton
The median household income in Hamilton is $59,152, with the highest median household income of $117,222 found in the 25 to 44 years age bracket for the primary householder. A total of 214 households (27.1%) fall into this category. Meanwhile, the 65+ years age bracket for the primary householder has the lowest median household income of $0, with 328 households (41.6%) in this group.
| Income Bracket | # Households | Median Income |
| 15 to 24 Years | 28 (3.5%) | $2,499 |
| 25 to 44 Years | 214 (27.1%) | $117,222 |
| 45 to 64 Years | 219 (27.8%) | $98,438 |
| 65+ Years | 328 (41.6%) | $0 |
| Total | 789 (100.0%) | $59,152 |
Poverty in Hamilton
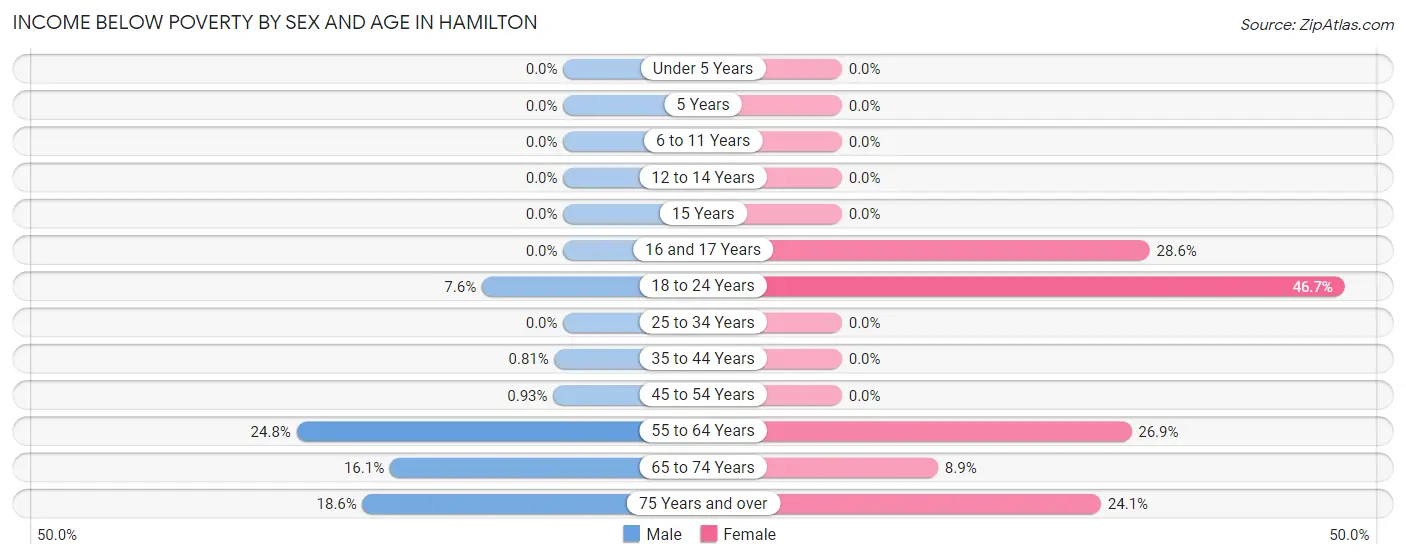
Income Below Poverty by Sex and Age in Hamilton
With 7.8% poverty level for males and 12.2% for females among the residents of Hamilton, 55 to 64 year old males and 18 to 24 year old females are the most vulnerable to poverty, with 25 males (24.7%) and 28 females (46.7%) in their respective age groups living below the poverty level.
| Age Bracket | Male | Female |
| Under 5 Years | 0 (0.0%) | 0 (0.0%) |
| 5 Years | 0 (0.0%) | 0 (0.0%) |
| 6 to 11 Years | 0 (0.0%) | 0 (0.0%) |
| 12 to 14 Years | 0 (0.0%) | 0 (0.0%) |
| 15 Years | 0 (0.0%) | 0 (0.0%) |
| 16 and 17 Years | 0 (0.0%) | 2 (28.6%) |
| 18 to 24 Years | 4 (7.5%) | 28 (46.7%) |
| 25 to 34 Years | 0 (0.0%) | 0 (0.0%) |
| 35 to 44 Years | 1 (0.8%) | 0 (0.0%) |
| 45 to 54 Years | 1 (0.9%) | 0 (0.0%) |
| 55 to 64 Years | 25 (24.7%) | 18 (26.9%) |
| 65 to 74 Years | 14 (16.1%) | 14 (8.9%) |
| 75 Years and over | 19 (18.6%) | 19 (24.0%) |
| Total | 64 (7.8%) | 81 (12.2%) |
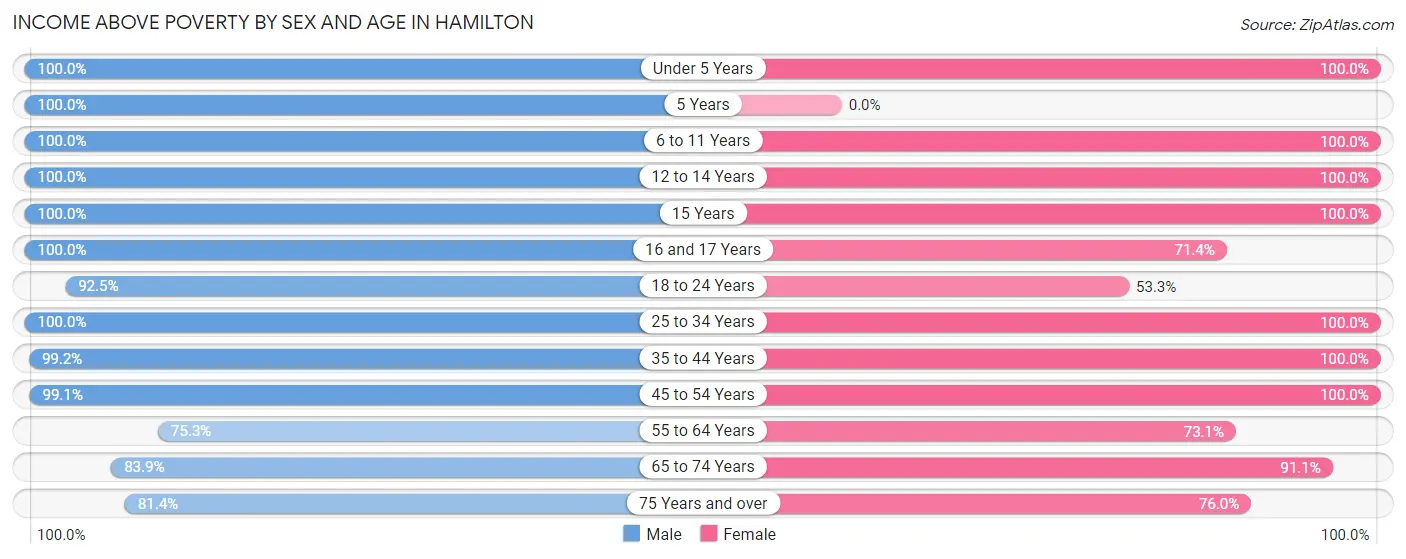
Income Above Poverty by Sex and Age in Hamilton
According to the poverty statistics in Hamilton, males aged under 5 years and females aged under 5 years are the age groups that are most secure financially, with 100.0% of males and 100.0% of females in these age groups living above the poverty line.
| Age Bracket | Male | Female |
| Under 5 Years | 6 (100.0%) | 21 (100.0%) |
| 5 Years | 44 (100.0%) | 0 (0.0%) |
| 6 to 11 Years | 73 (100.0%) | 31 (100.0%) |
| 12 to 14 Years | 6 (100.0%) | 24 (100.0%) |
| 15 Years | 11 (100.0%) | 11 (100.0%) |
| 16 and 17 Years | 25 (100.0%) | 5 (71.4%) |
| 18 to 24 Years | 49 (92.4%) | 32 (53.3%) |
| 25 to 34 Years | 85 (100.0%) | 47 (100.0%) |
| 35 to 44 Years | 122 (99.2%) | 101 (100.0%) |
| 45 to 54 Years | 107 (99.1%) | 59 (100.0%) |
| 55 to 64 Years | 76 (75.2%) | 49 (73.1%) |
| 65 to 74 Years | 73 (83.9%) | 143 (91.1%) |
| 75 Years and over | 83 (81.4%) | 60 (75.9%) |
| Total | 760 (92.2%) | 583 (87.8%) |
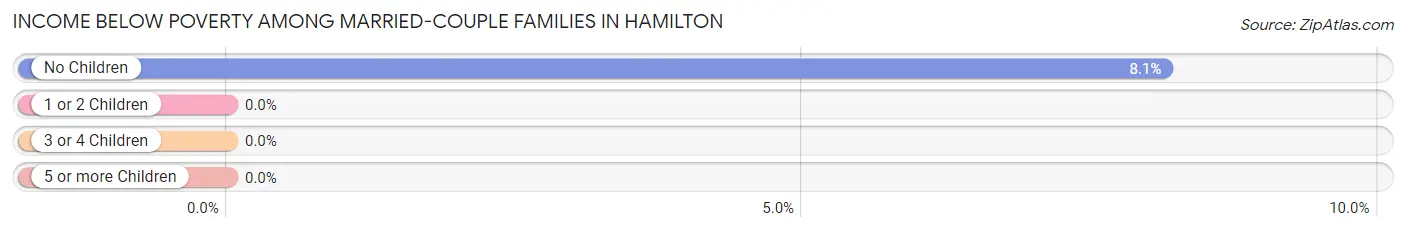
Income Below Poverty Among Married-Couple Families in Hamilton
The poverty statistics for married-couple families in Hamilton show that 4.6% or 14 of the total 306 families live below the poverty line. Families with no children have the highest poverty rate of 8.1%, comprising of 14 families. On the other hand, families with 1 or 2 children have the lowest poverty rate of 0.0%, which includes 0 families.
| Children | Above Poverty | Below Poverty |
| No Children | 158 (91.9%) | 14 (8.1%) |
| 1 or 2 Children | 109 (100.0%) | 0 (0.0%) |
| 3 or 4 Children | 25 (100.0%) | 0 (0.0%) |
| 5 or more Children | 0 (0.0%) | 0 (0.0%) |
| Total | 292 (95.4%) | 14 (4.6%) |
Income Below Poverty Among Single-Parent Households in Hamilton
| Children | Single Father | Single Mother |
| No Children | 0 (0.0%) | 0 (0.0%) |
| 1 or 2 Children | 0 (0.0%) | 0 (0.0%) |
| 3 or 4 Children | 0 (0.0%) | 0 (0.0%) |
| 5 or more Children | 0 (0.0%) | 0 (0.0%) |
| Total | 0 (0.0%) | 0 (0.0%) |
Income Below Poverty Among Married-Couple vs Single-Parent Households in Hamilton
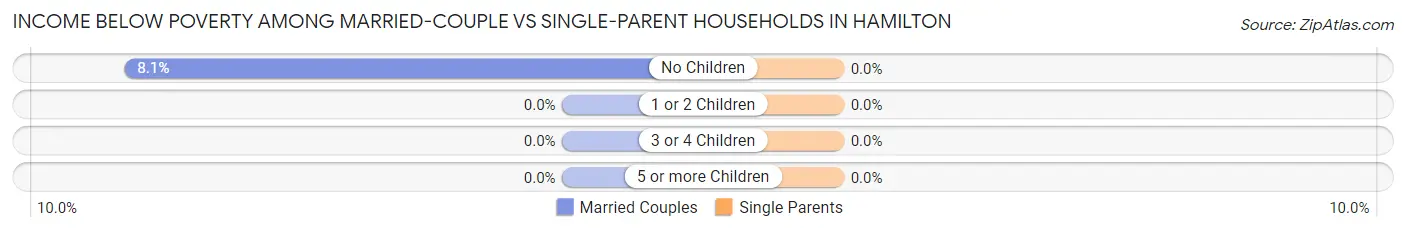
| Children | Married-Couple Families | Single-Parent Households |
| No Children | 14 (8.1%) | 0 (0.0%) |
| 1 or 2 Children | 0 (0.0%) | 0 (0.0%) |
| 3 or 4 Children | 0 (0.0%) | 0 (0.0%) |
| 5 or more Children | 0 (0.0%) | 0 (0.0%) |
| Total | 14 (4.6%) | 0 (0.0%) |
Race in Hamilton
The most populous races in Hamilton are White / Caucasian (3,248 | 83.7%), Hispanic or Latino (303 | 7.8%), and Asian (196 | 5.1%).
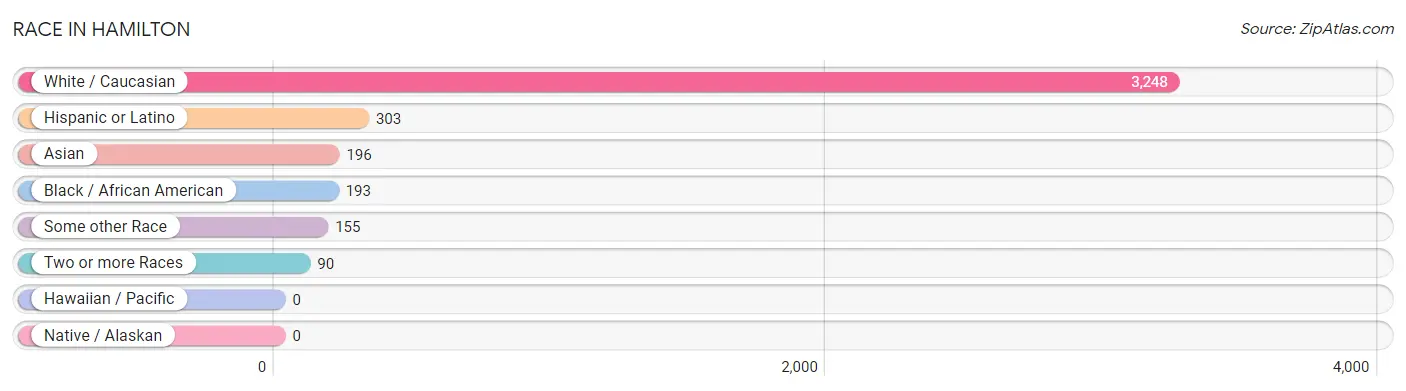
| Race | # Population | % Population |
| Asian | 196 | 5.1% |
| Black / African American | 193 | 5.0% |
| Hawaiian / Pacific | 0 | 0.0% |
| Hispanic or Latino | 303 | 7.8% |
| Native / Alaskan | 0 | 0.0% |
| White / Caucasian | 3,248 | 83.7% |
| Two or more Races | 90 | 2.3% |
| Some other Race | 155 | 4.0% |
| Total | 3,882 | 100.0% |
Ancestry in Hamilton
The most populous ancestries reported in Hamilton are Irish (380 | 9.8%), English (371 | 9.6%), American (368 | 9.5%), German (355 | 9.1%), and Italian (190 | 4.9%), together accounting for 42.9% of all Hamilton residents.
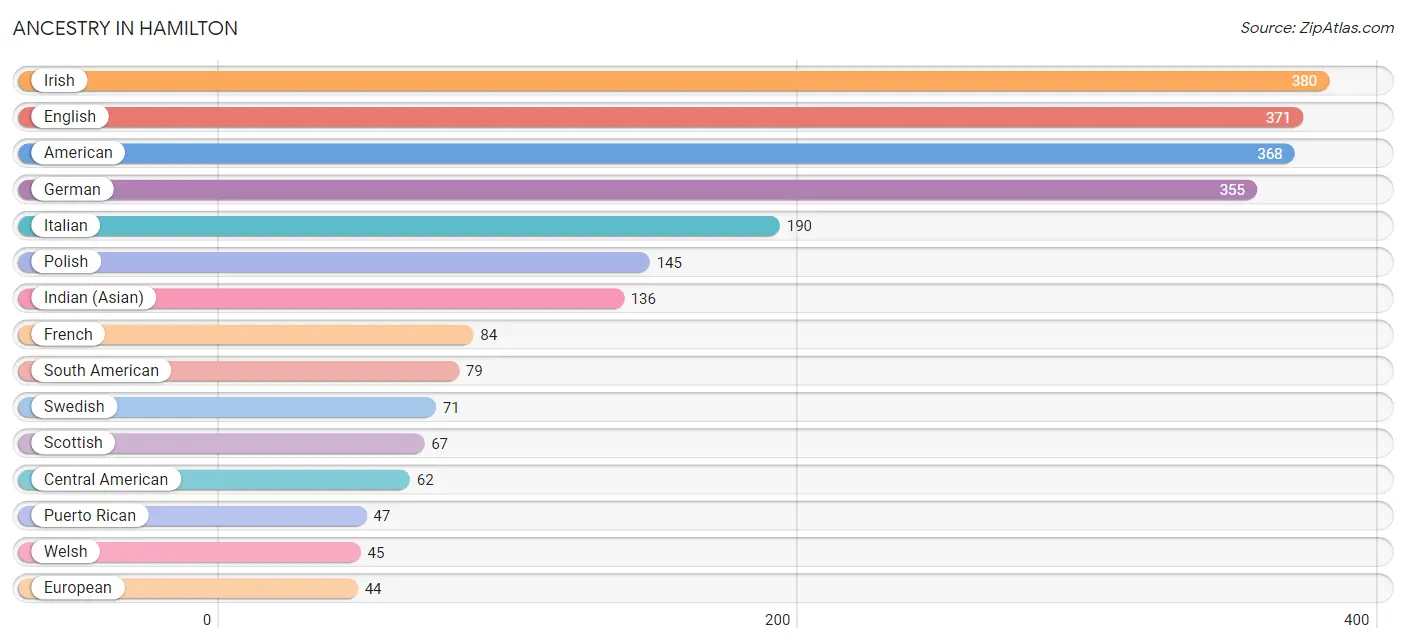
| Ancestry | # Population | % Population |
| American | 368 | 9.5% |
| Arab | 22 | 0.6% |
| Bhutanese | 5 | 0.1% |
| British | 28 | 0.7% |
| Canadian | 4 | 0.1% |
| Central American | 62 | 1.6% |
| Costa Rican | 10 | 0.3% |
| Cuban | 7 | 0.2% |
| Danish | 14 | 0.4% |
| Dutch | 31 | 0.8% |
| Eastern European | 12 | 0.3% |
| Ecuadorian | 5 | 0.1% |
| English | 371 | 9.6% |
| Ethiopian | 27 | 0.7% |
| European | 44 | 1.1% |
| Finnish | 1 | 0.0% |
| French | 84 | 2.2% |
| French Canadian | 27 | 0.7% |
| German | 355 | 9.1% |
| Ghanaian | 14 | 0.4% |
| Greek | 19 | 0.5% |
| Guatemalan | 9 | 0.2% |
| Honduran | 10 | 0.3% |
| Hungarian | 31 | 0.8% |
| Indian (Asian) | 136 | 3.5% |
| Iranian | 24 | 0.6% |
| Irish | 380 | 9.8% |
| Israeli | 5 | 0.1% |
| Italian | 190 | 4.9% |
| Jamaican | 5 | 0.1% |
| Lebanese | 16 | 0.4% |
| Lithuanian | 8 | 0.2% |
| Macedonian | 7 | 0.2% |
| Mexican | 43 | 1.1% |
| Moroccan | 6 | 0.2% |
| Norwegian | 34 | 0.9% |
| Pakistani | 10 | 0.3% |
| Paraguayan | 41 | 1.1% |
| Pennsylvania German | 5 | 0.1% |
| Polish | 145 | 3.7% |
| Portuguese | 4 | 0.1% |
| Puerto Rican | 47 | 1.2% |
| Romanian | 5 | 0.1% |
| Russian | 15 | 0.4% |
| Scandinavian | 11 | 0.3% |
| Scotch-Irish | 43 | 1.1% |
| Scottish | 67 | 1.7% |
| Serbian | 1 | 0.0% |
| South American | 79 | 2.0% |
| Spaniard | 1 | 0.0% |
| Spanish | 2 | 0.1% |
| Sri Lankan | 22 | 0.6% |
| Subsaharan African | 41 | 1.1% |
| Swedish | 71 | 1.8% |
| Swiss | 10 | 0.3% |
| Thai | 15 | 0.4% |
| Trinidadian and Tobagonian | 10 | 0.3% |
| Ukrainian | 6 | 0.2% |
| Venezuelan | 3 | 0.1% |
| Welsh | 45 | 1.2% | View All 60 Rows |
Immigrants in Hamilton
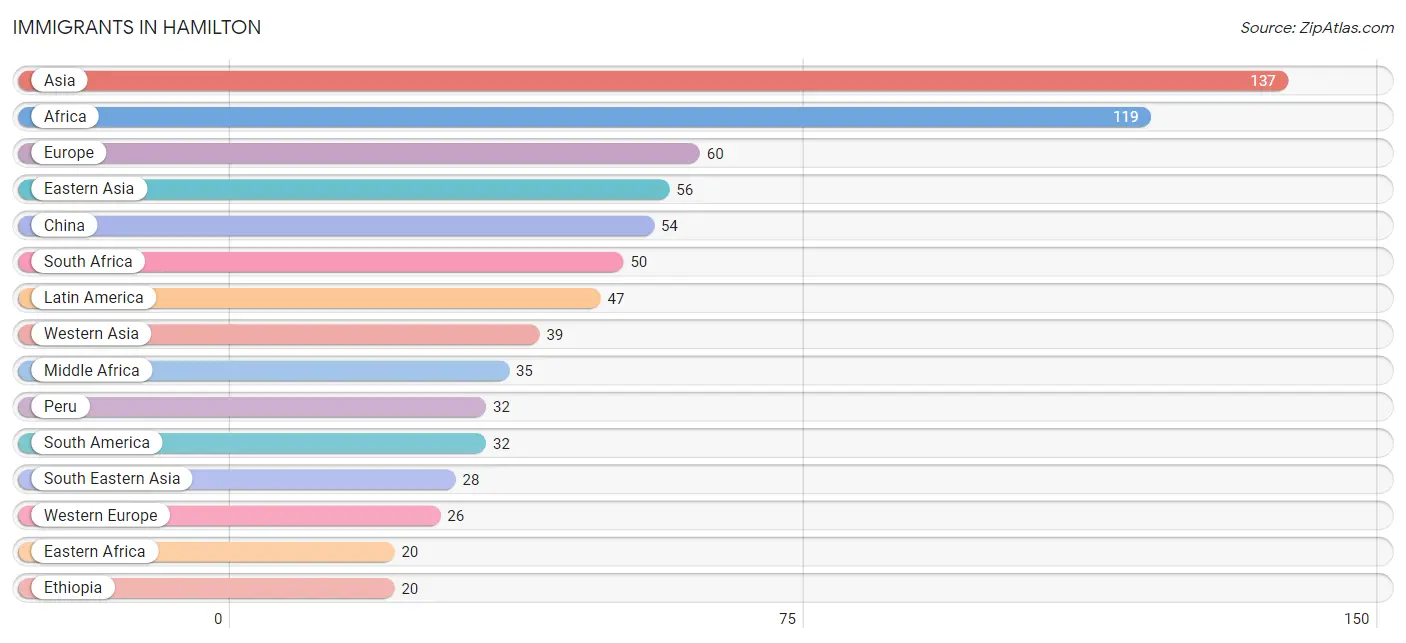
The most numerous immigrant groups reported in Hamilton came from Asia (137 | 3.5%), Africa (119 | 3.1%), Europe (60 | 1.5%), Eastern Asia (56 | 1.4%), and China (54 | 1.4%), together accounting for 11.0% of all Hamilton residents.
| Immigration Origin | # Population | % Population |
| Africa | 119 | 3.1% |
| Asia | 137 | 3.5% |
| Caribbean | 15 | 0.4% |
| China | 54 | 1.4% |
| Eastern Africa | 20 | 0.5% |
| Eastern Asia | 56 | 1.4% |
| Eastern Europe | 12 | 0.3% |
| Ethiopia | 20 | 0.5% |
| Europe | 60 | 1.5% |
| France | 16 | 0.4% |
| Germany | 10 | 0.3% |
| Ghana | 14 | 0.4% |
| India | 3 | 0.1% |
| Israel | 18 | 0.5% |
| Italy | 8 | 0.2% |
| Jamaica | 5 | 0.1% |
| Japan | 2 | 0.1% |
| Latin America | 47 | 1.2% |
| Latvia | 3 | 0.1% |
| Lebanon | 10 | 0.3% |
| Middle Africa | 35 | 0.9% |
| North Macedonia | 7 | 0.2% |
| Northern Europe | 12 | 0.3% |
| Pakistan | 11 | 0.3% |
| Peru | 32 | 0.8% |
| Poland | 2 | 0.1% |
| South Africa | 50 | 1.3% |
| South America | 32 | 0.8% |
| South Central Asia | 14 | 0.4% |
| South Eastern Asia | 28 | 0.7% |
| Southern Europe | 10 | 0.3% |
| Spain | 2 | 0.1% |
| Thailand | 10 | 0.3% |
| Trinidad and Tobago | 10 | 0.3% |
| Turkey | 10 | 0.3% |
| Vietnam | 18 | 0.5% |
| Western Africa | 14 | 0.4% |
| Western Asia | 39 | 1.0% |
| Western Europe | 26 | 0.7% | View All 39 Rows |
Sex and Age in Hamilton
Sex and Age in Hamilton
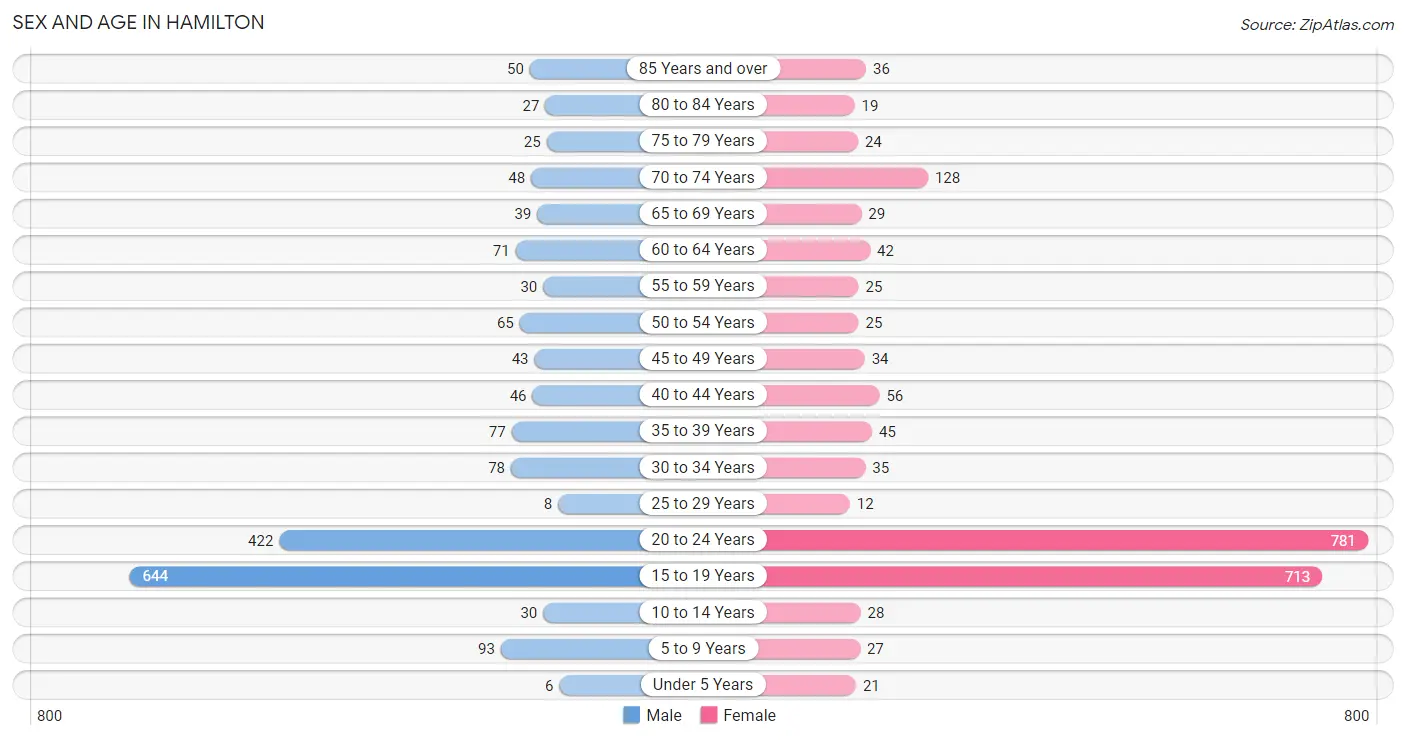
The most populous age groups in Hamilton are 15 to 19 Years (644 | 35.7%) for men and 20 to 24 Years (781 | 37.6%) for women.
| Age Bracket | Male | Female |
| Under 5 Years | 6 (0.3%) | 21 (1.0%) |
| 5 to 9 Years | 93 (5.2%) | 27 (1.3%) |
| 10 to 14 Years | 30 (1.7%) | 28 (1.3%) |
| 15 to 19 Years | 644 (35.7%) | 713 (34.3%) |
| 20 to 24 Years | 422 (23.4%) | 781 (37.6%) |
| 25 to 29 Years | 8 (0.4%) | 12 (0.6%) |
| 30 to 34 Years | 78 (4.3%) | 35 (1.7%) |
| 35 to 39 Years | 77 (4.3%) | 45 (2.2%) |
| 40 to 44 Years | 46 (2.5%) | 56 (2.7%) |
| 45 to 49 Years | 43 (2.4%) | 34 (1.6%) |
| 50 to 54 Years | 65 (3.6%) | 25 (1.2%) |
| 55 to 59 Years | 30 (1.7%) | 25 (1.2%) |
| 60 to 64 Years | 71 (3.9%) | 42 (2.0%) |
| 65 to 69 Years | 39 (2.2%) | 29 (1.4%) |
| 70 to 74 Years | 48 (2.7%) | 128 (6.1%) |
| 75 to 79 Years | 25 (1.4%) | 24 (1.1%) |
| 80 to 84 Years | 27 (1.5%) | 19 (0.9%) |
| 85 Years and over | 50 (2.8%) | 36 (1.7%) |
| Total | 1,802 (100.0%) | 2,080 (100.0%) |
Families and Households in Hamilton
Median Family Size in Hamilton
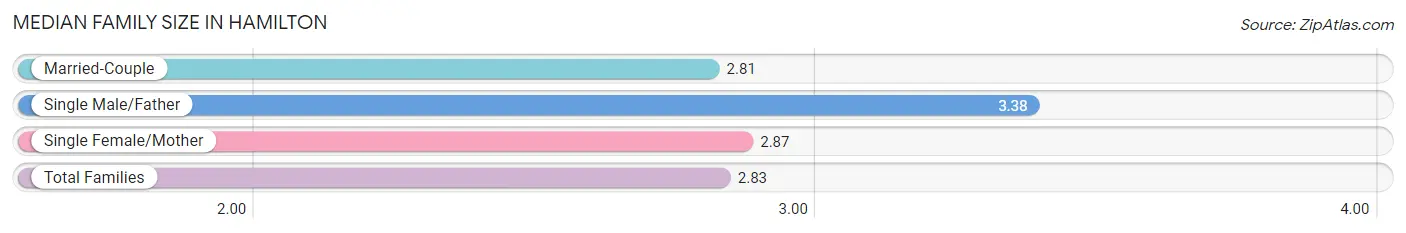
The median family size in Hamilton is 2.83 persons per family, with single male/father families (8 | 2.4%) accounting for the largest median family size of 3.38 persons per family. On the other hand, married-couple families (306 | 93.0%) represent the smallest median family size with 2.81 persons per family.
| Family Type | # Families | Family Size |
| Married-Couple | 306 (93.0%) | 2.81 |
| Single Male/Father | 8 (2.4%) | 3.38 |
| Single Female/Mother | 15 (4.6%) | 2.87 |
| Total Families | 329 (100.0%) | 2.83 |
Median Household Size in Hamilton
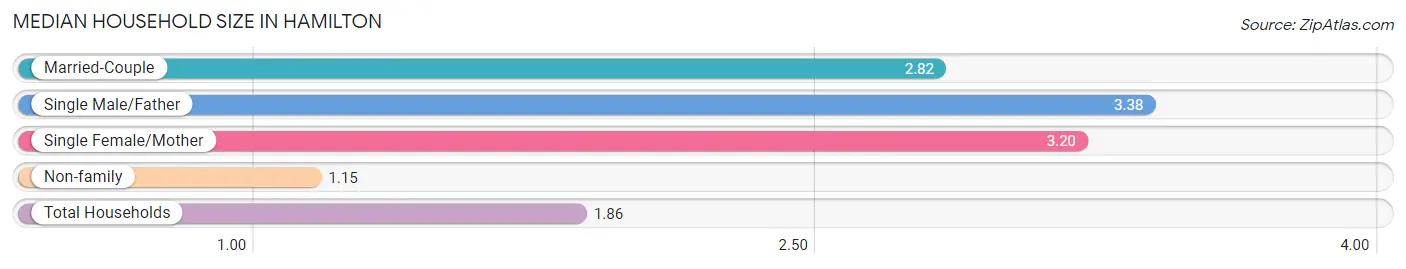
The median household size in Hamilton is 1.86 persons per household, with single male/father households (8 | 1.0%) accounting for the largest median household size of 3.38 persons per household. non-family households (460 | 58.3%) represent the smallest median household size with 1.15 persons per household.
| Household Type | # Households | Household Size |
| Married-Couple | 306 (38.8%) | 2.82 |
| Single Male/Father | 8 (1.0%) | 3.38 |
| Single Female/Mother | 15 (1.9%) | 3.20 |
| Non-family | 460 (58.3%) | 1.15 |
| Total Households | 789 (100.0%) | 1.86 |
Household Size by Marriage Status in Hamilton
Out of a total of 789 households in Hamilton, 329 (41.7%) are family households, while 460 (58.3%) are nonfamily households. The most numerous type of family households are 2-person households, comprising 172, and the most common type of nonfamily households are 1-person households, comprising 424.
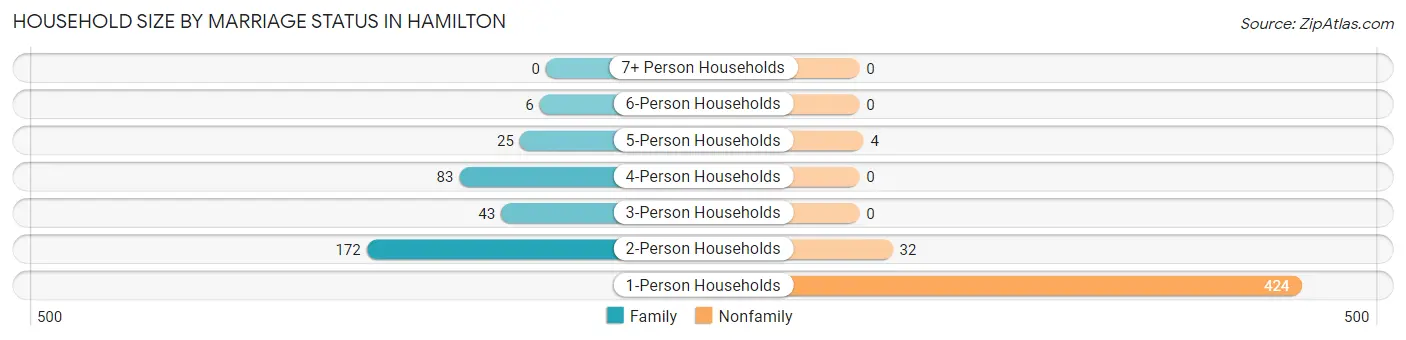
| Household Size | Family Households | Nonfamily Households |
| 1-Person Households | - | 424 (53.7%) |
| 2-Person Households | 172 (21.8%) | 32 (4.1%) |
| 3-Person Households | 43 (5.4%) | 0 (0.0%) |
| 4-Person Households | 83 (10.5%) | 0 (0.0%) |
| 5-Person Households | 25 (3.2%) | 4 (0.5%) |
| 6-Person Households | 6 (0.8%) | 0 (0.0%) |
| 7+ Person Households | 0 (0.0%) | 0 (0.0%) |
| Total | 329 (41.7%) | 460 (58.3%) |
Female Fertility in Hamilton
Fertility by Age in Hamilton
Average fertility rate in Hamilton is 11.0 births per 1,000 women. Women in the age bracket of 35 to 50 years have the highest fertility rate with 101.0 births per 1,000 women. Women in the age bracket of 35 to 50 years acount for 73.7% of all women with births.
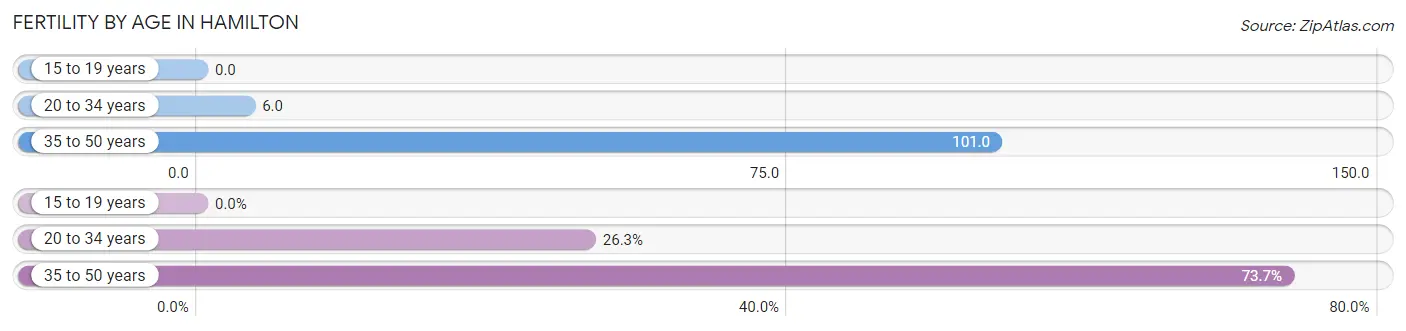
| Age Bracket | Women with Births | Births / 1,000 Women |
| 15 to 19 years | 0 (0.0%) | 0.0 |
| 20 to 34 years | 5 (26.3%) | 6.0 |
| 35 to 50 years | 14 (73.7%) | 101.0 |
| Total | 19 (100.0%) | 11.0 |
Fertility by Age by Marriage Status in Hamilton
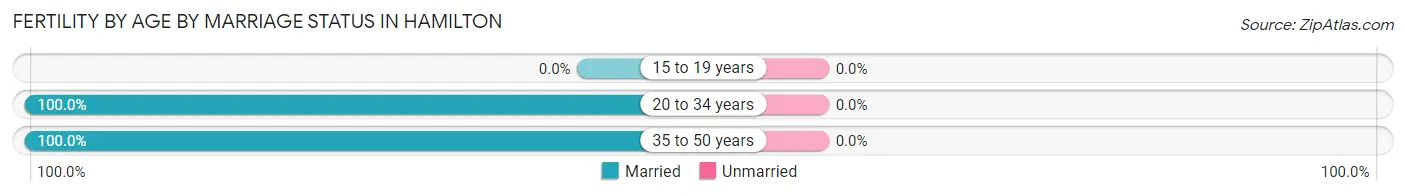
| Age Bracket | Married | Unmarried |
| 15 to 19 years | 0 (0.0%) | 0 (0.0%) |
| 20 to 34 years | 5 (100.0%) | 0 (0.0%) |
| 35 to 50 years | 14 (100.0%) | 0 (0.0%) |
| Total | 19 (100.0%) | 0 (0.0%) |
Fertility by Education in Hamilton
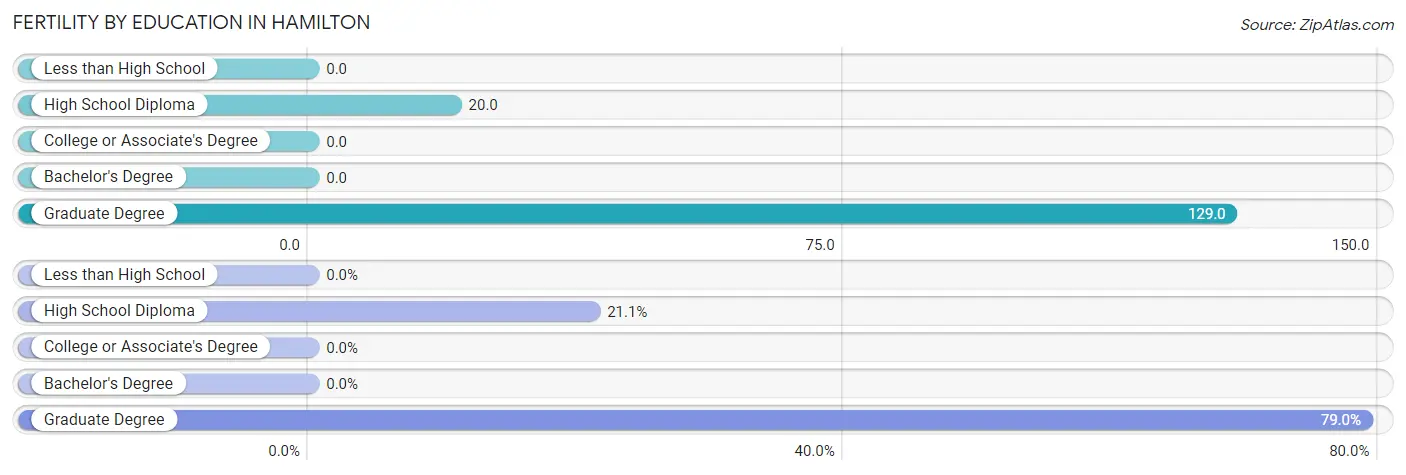
| Educational Attainment | Women with Births | Births / 1,000 Women |
| Less than High School | 0 (0.0%) | 0.0 |
| High School Diploma | 4 (21.0%) | 20.0 |
| College or Associate's Degree | 0 (0.0%) | 0.0 |
| Bachelor's Degree | 0 (0.0%) | 0.0 |
| Graduate Degree | 15 (78.9%) | 129.0 |
| Total | 19 (100.0%) | 11.0 |
Fertility by Education by Marriage Status in Hamilton
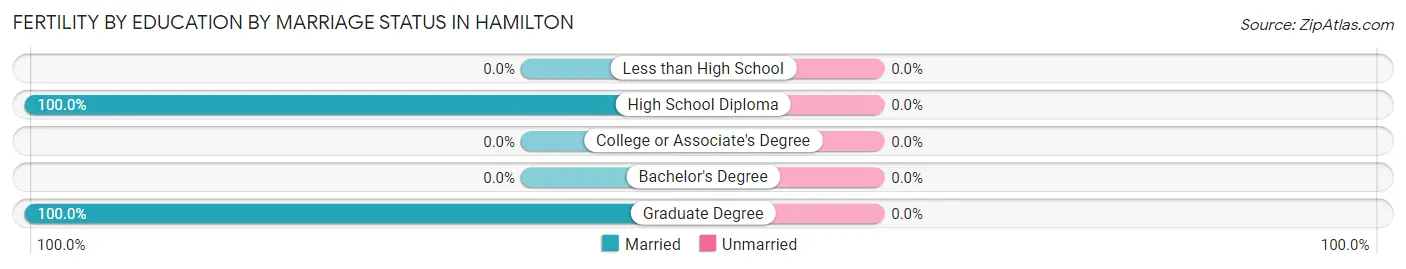
| Educational Attainment | Married | Unmarried |
| Less than High School | 0 (0.0%) | 0 (0.0%) |
| High School Diploma | 4 (100.0%) | 0 (0.0%) |
| College or Associate's Degree | 0 (0.0%) | 0 (0.0%) |
| Bachelor's Degree | 0 (0.0%) | 0 (0.0%) |
| Graduate Degree | 15 (100.0%) | 0 (0.0%) |
| Total | 19 (100.0%) | 0 (0.0%) |
Employment Characteristics in Hamilton
Employment by Class of Employer in Hamilton
Among the 1,299 employed individuals in Hamilton, private company employees (681 | 52.4%), not-for-profit organizations (326 | 25.1%), and state government employees (190 | 14.6%) make up the most common classes of employment.
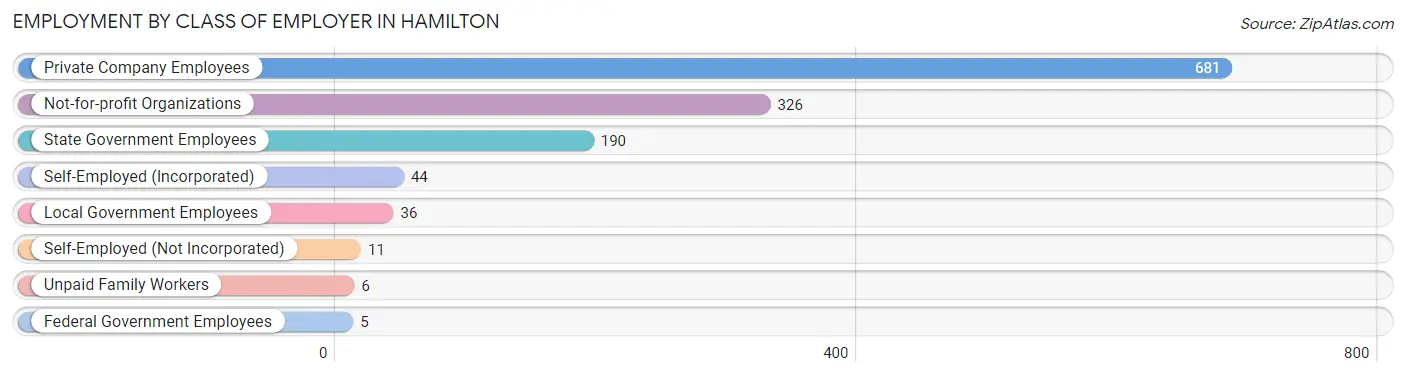
| Employer Class | # Employees | % Employees |
| Private Company Employees | 681 | 52.4% |
| Self-Employed (Incorporated) | 44 | 3.4% |
| Self-Employed (Not Incorporated) | 11 | 0.9% |
| Not-for-profit Organizations | 326 | 25.1% |
| Local Government Employees | 36 | 2.8% |
| State Government Employees | 190 | 14.6% |
| Federal Government Employees | 5 | 0.4% |
| Unpaid Family Workers | 6 | 0.5% |
| Total | 1,299 | 100.0% |
Employment Status by Age in Hamilton
According to the labor force statistics for Hamilton, out of the total population over 16 years of age (3,655), 41.7% or 1,524 individuals are in the labor force, with 0.6% or 9 of them unemployed. The age group with the highest labor force participation rate is 25 to 29 years, with 95.0% or 19 individuals in the labor force. Within the labor force, the 65 to 74 years age range has the highest percentage of unemployed individuals, with 5.8% or 4 of them being unemployed.
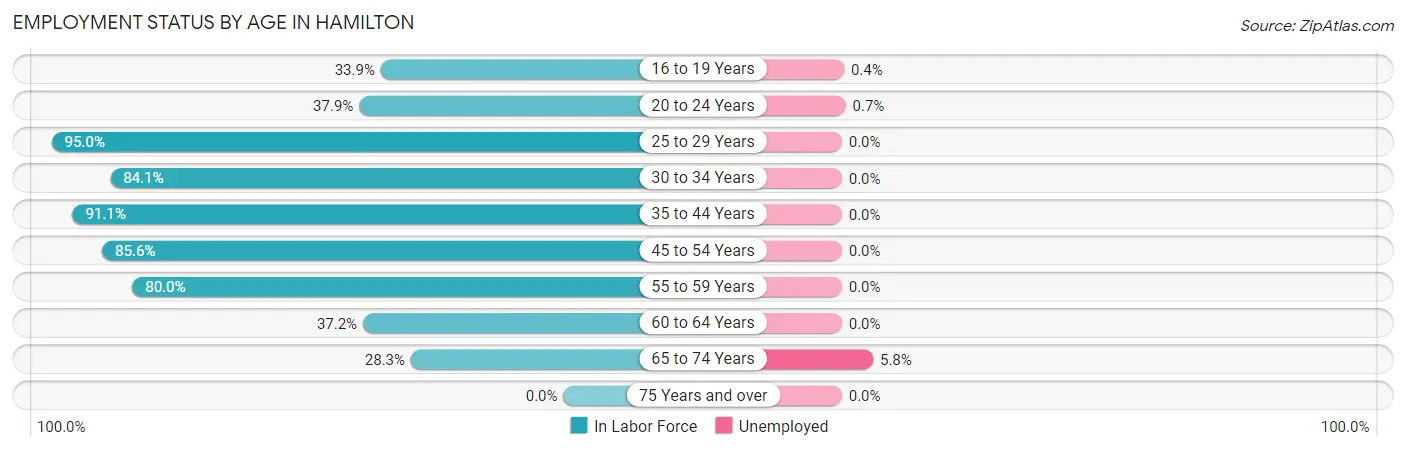
| Age Bracket | In Labor Force | Unemployed |
| 16 to 19 Years | 453 (33.9%) | 2 (0.4%) |
| 20 to 24 Years | 456 (37.9%) | 3 (0.7%) |
| 25 to 29 Years | 19 (95.0%) | 0 (0.0%) |
| 30 to 34 Years | 95 (84.1%) | 0 (0.0%) |
| 35 to 44 Years | 204 (91.1%) | 0 (0.0%) |
| 45 to 54 Years | 143 (85.6%) | 0 (0.0%) |
| 55 to 59 Years | 44 (80.0%) | 0 (0.0%) |
| 60 to 64 Years | 42 (37.2%) | 0 (0.0%) |
| 65 to 74 Years | 69 (28.3%) | 4 (5.8%) |
| 75 Years and over | 0 (0.0%) | 0 (0.0%) |
| Total | 1,524 (41.7%) | 9 (0.6%) |
Employment Status by Educational Attainment in Hamilton
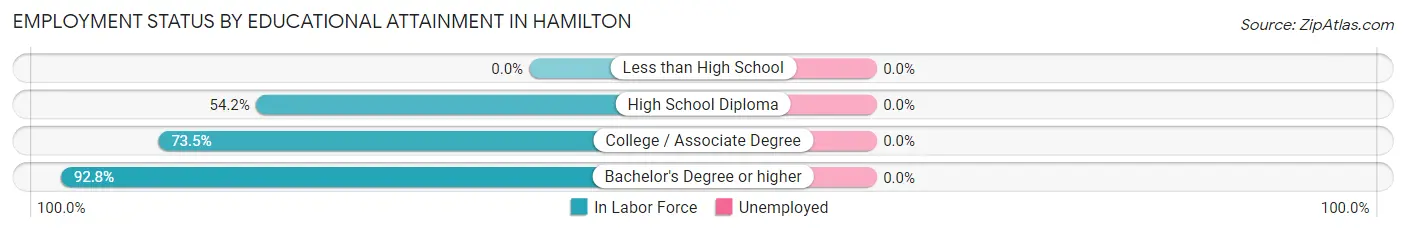
| Educational Attainment | In Labor Force | Unemployed |
| Less than High School | 0 (0.0%) | 0 (0.0%) |
| High School Diploma | 58 (54.2%) | 0 (0.0%) |
| College / Associate Degree | 100 (73.5%) | 0 (0.0%) |
| Bachelor's Degree or higher | 389 (92.8%) | 0 (0.0%) |
| Total | 547 (79.0%) | 0 (0.0%) |
Employment Occupations by Sex in Hamilton
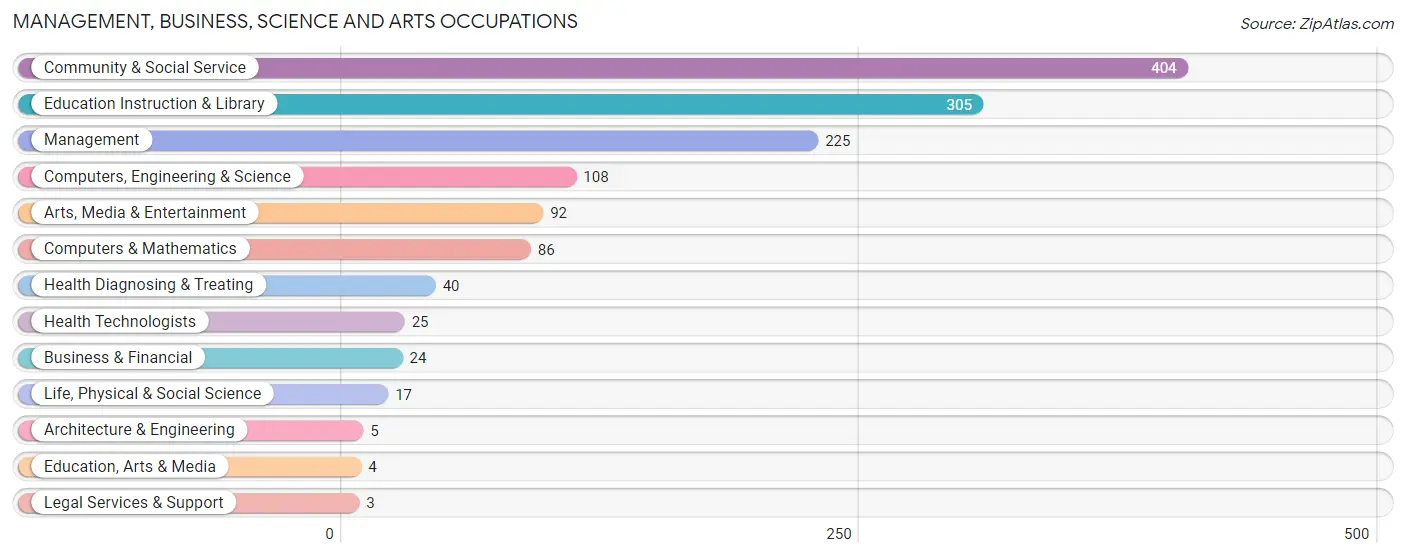
Management, Business, Science and Arts Occupations
The most common Management, Business, Science and Arts occupations in Hamilton are Community & Social Service (404 | 26.7%), Education Instruction & Library (305 | 20.1%), Management (225 | 14.8%), Computers, Engineering & Science (108 | 7.1%), and Arts, Media & Entertainment (92 | 6.1%).
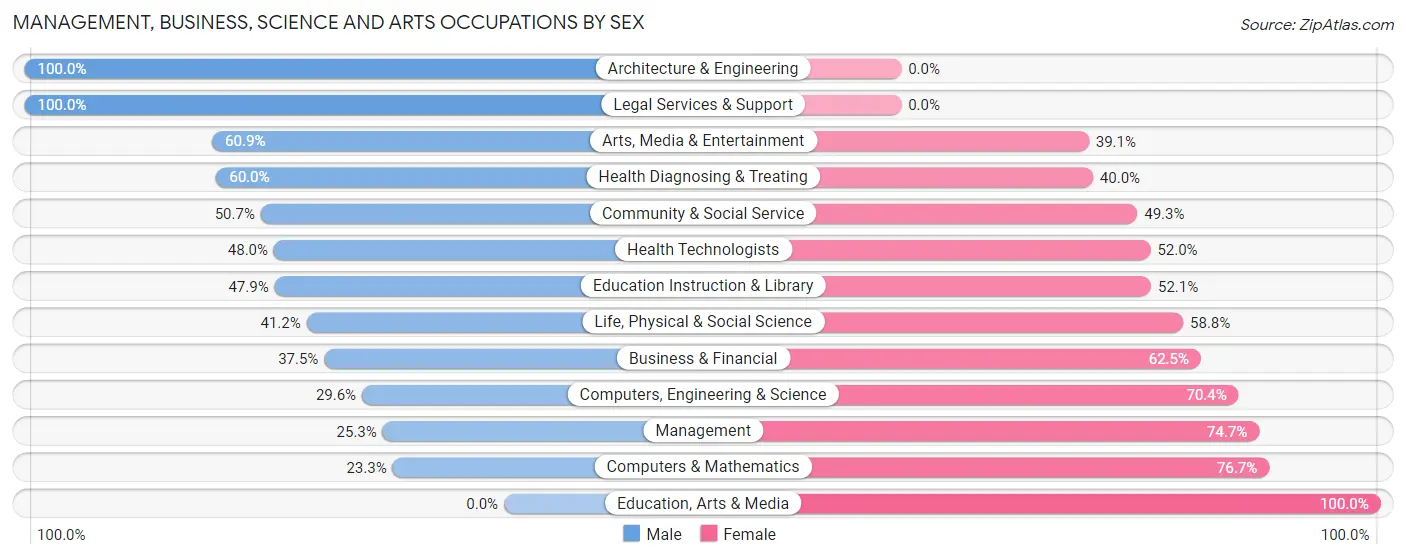
Management, Business, Science and Arts Occupations by Sex
Within the Management, Business, Science and Arts occupations in Hamilton, the most male-oriented occupations are Architecture & Engineering (100.0%), Legal Services & Support (100.0%), and Arts, Media & Entertainment (60.9%), while the most female-oriented occupations are Education, Arts & Media (100.0%), Computers & Mathematics (76.7%), and Management (74.7%).
| Occupation | Male | Female |
| Management | 57 (25.3%) | 168 (74.7%) |
| Business & Financial | 9 (37.5%) | 15 (62.5%) |
| Computers, Engineering & Science | 32 (29.6%) | 76 (70.4%) |
| Computers & Mathematics | 20 (23.3%) | 66 (76.7%) |
| Architecture & Engineering | 5 (100.0%) | 0 (0.0%) |
| Life, Physical & Social Science | 7 (41.2%) | 10 (58.8%) |
| Community & Social Service | 205 (50.7%) | 199 (49.3%) |
| Education, Arts & Media | 0 (0.0%) | 4 (100.0%) |
| Legal Services & Support | 3 (100.0%) | 0 (0.0%) |
| Education Instruction & Library | 146 (47.9%) | 159 (52.1%) |
| Arts, Media & Entertainment | 56 (60.9%) | 36 (39.1%) |
| Health Diagnosing & Treating | 24 (60.0%) | 16 (40.0%) |
| Health Technologists | 12 (48.0%) | 13 (52.0%) |
| Total (Category) | 327 (40.8%) | 474 (59.2%) |
| Total (Overall) | 492 (32.5%) | 1,024 (67.5%) |
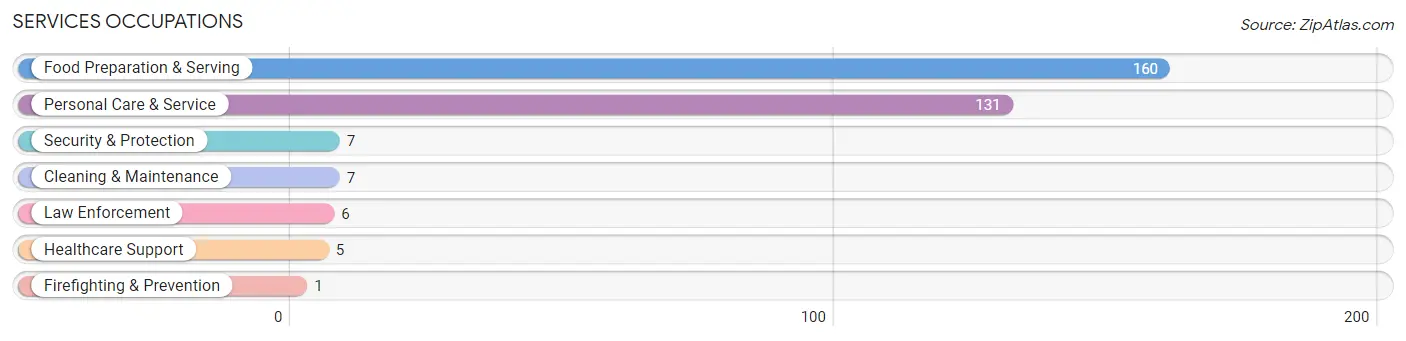
Services Occupations
The most common Services occupations in Hamilton are Food Preparation & Serving (160 | 10.5%), Personal Care & Service (131 | 8.6%), Security & Protection (7 | 0.5%), Cleaning & Maintenance (7 | 0.5%), and Law Enforcement (6 | 0.4%).
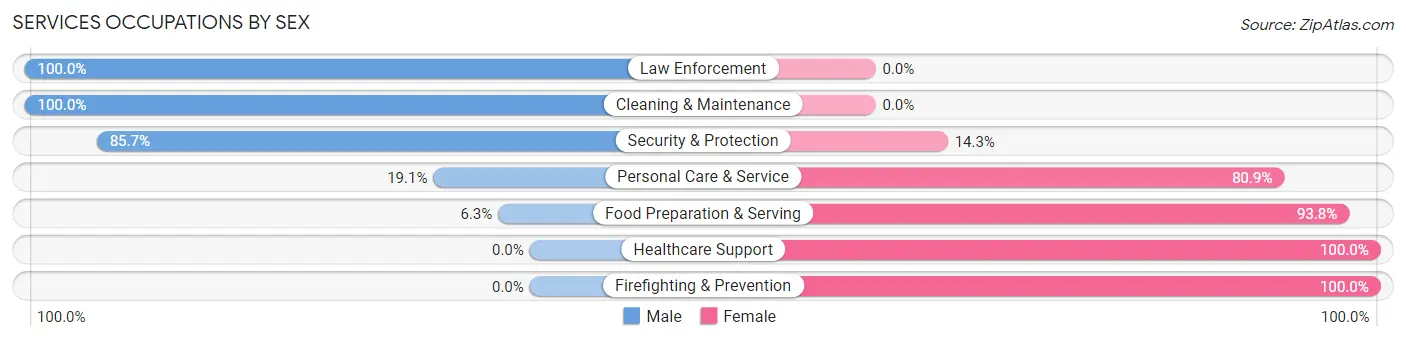
Services Occupations by Sex
Within the Services occupations in Hamilton, the most male-oriented occupations are Law Enforcement (100.0%), Cleaning & Maintenance (100.0%), and Security & Protection (85.7%), while the most female-oriented occupations are Healthcare Support (100.0%), Firefighting & Prevention (100.0%), and Food Preparation & Serving (93.8%).
| Occupation | Male | Female |
| Healthcare Support | 0 (0.0%) | 5 (100.0%) |
| Security & Protection | 6 (85.7%) | 1 (14.3%) |
| Firefighting & Prevention | 0 (0.0%) | 1 (100.0%) |
| Law Enforcement | 6 (100.0%) | 0 (0.0%) |
| Food Preparation & Serving | 10 (6.2%) | 150 (93.8%) |
| Cleaning & Maintenance | 7 (100.0%) | 0 (0.0%) |
| Personal Care & Service | 25 (19.1%) | 106 (80.9%) |
| Total (Category) | 48 (15.5%) | 262 (84.5%) |
| Total (Overall) | 492 (32.5%) | 1,024 (67.5%) |
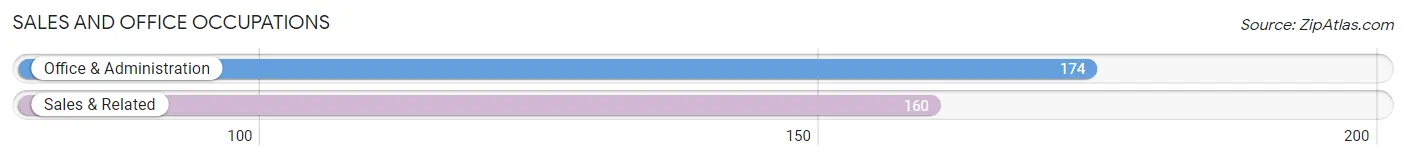
Sales and Office Occupations
The most common Sales and Office occupations in Hamilton are Office & Administration (174 | 11.5%), and Sales & Related (160 | 10.5%).
Sales and Office Occupations by Sex
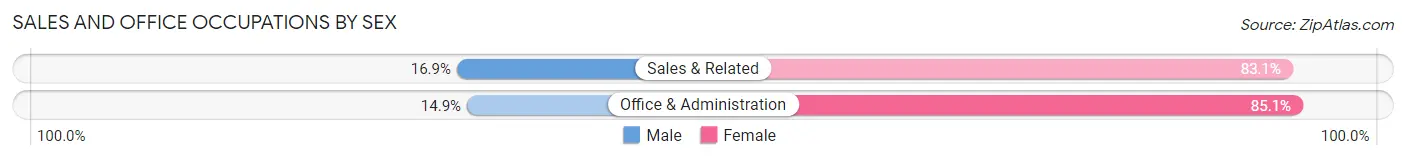
| Occupation | Male | Female |
| Sales & Related | 27 (16.9%) | 133 (83.1%) |
| Office & Administration | 26 (14.9%) | 148 (85.1%) |
| Total (Category) | 53 (15.9%) | 281 (84.1%) |
| Total (Overall) | 492 (32.5%) | 1,024 (67.5%) |
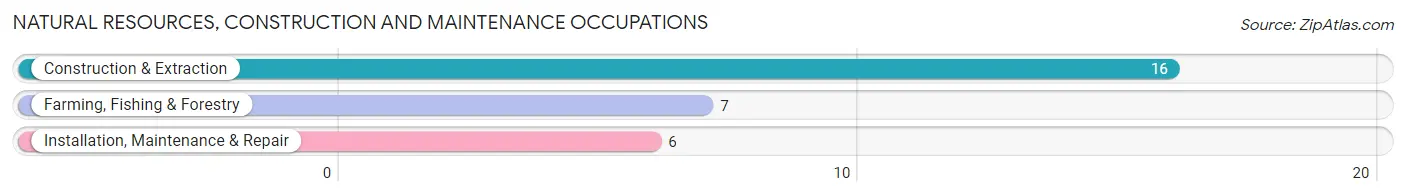
Natural Resources, Construction and Maintenance Occupations
The most common Natural Resources, Construction and Maintenance occupations in Hamilton are Construction & Extraction (16 | 1.1%), Farming, Fishing & Forestry (7 | 0.5%), and Installation, Maintenance & Repair (6 | 0.4%).
Natural Resources, Construction and Maintenance Occupations by Sex
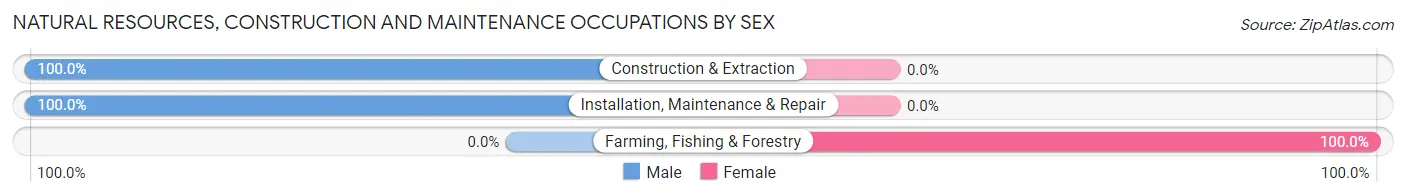
| Occupation | Male | Female |
| Farming, Fishing & Forestry | 0 (0.0%) | 7 (100.0%) |
| Construction & Extraction | 16 (100.0%) | 0 (0.0%) |
| Installation, Maintenance & Repair | 6 (100.0%) | 0 (0.0%) |
| Total (Category) | 22 (75.9%) | 7 (24.1%) |
| Total (Overall) | 492 (32.5%) | 1,024 (67.5%) |
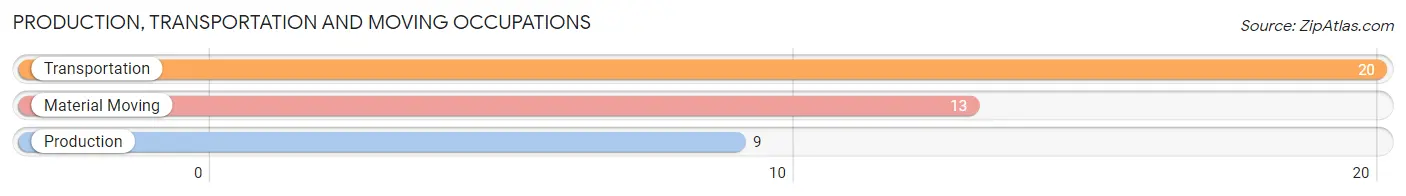
Production, Transportation and Moving Occupations
The most common Production, Transportation and Moving occupations in Hamilton are Transportation (20 | 1.3%), Material Moving (13 | 0.9%), and Production (9 | 0.6%).
Production, Transportation and Moving Occupations by Sex
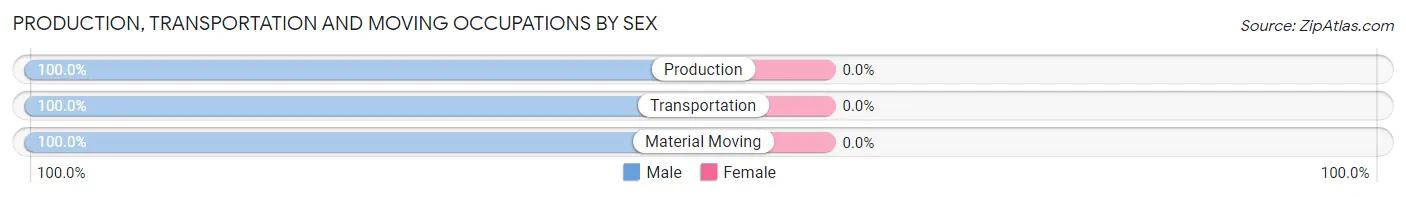
| Occupation | Male | Female |
| Production | 9 (100.0%) | 0 (0.0%) |
| Transportation | 20 (100.0%) | 0 (0.0%) |
| Material Moving | 13 (100.0%) | 0 (0.0%) |
| Total (Category) | 42 (100.0%) | 0 (0.0%) |
| Total (Overall) | 492 (32.5%) | 1,024 (67.5%) |
Employment Industries by Sex in Hamilton
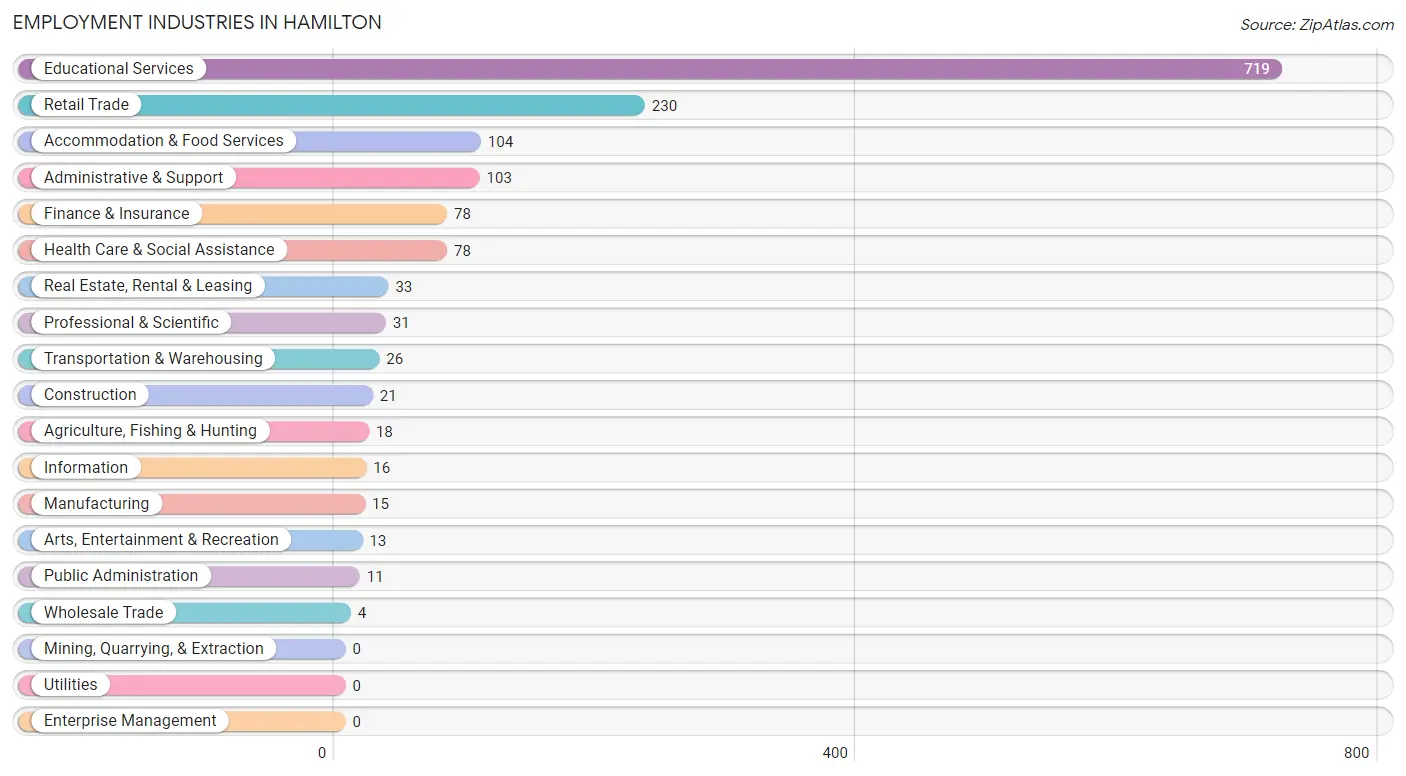
Employment Industries in Hamilton
The major employment industries in Hamilton include Educational Services (719 | 47.4%), Retail Trade (230 | 15.2%), Accommodation & Food Services (104 | 6.9%), Administrative & Support (103 | 6.8%), and Finance & Insurance (78 | 5.1%).
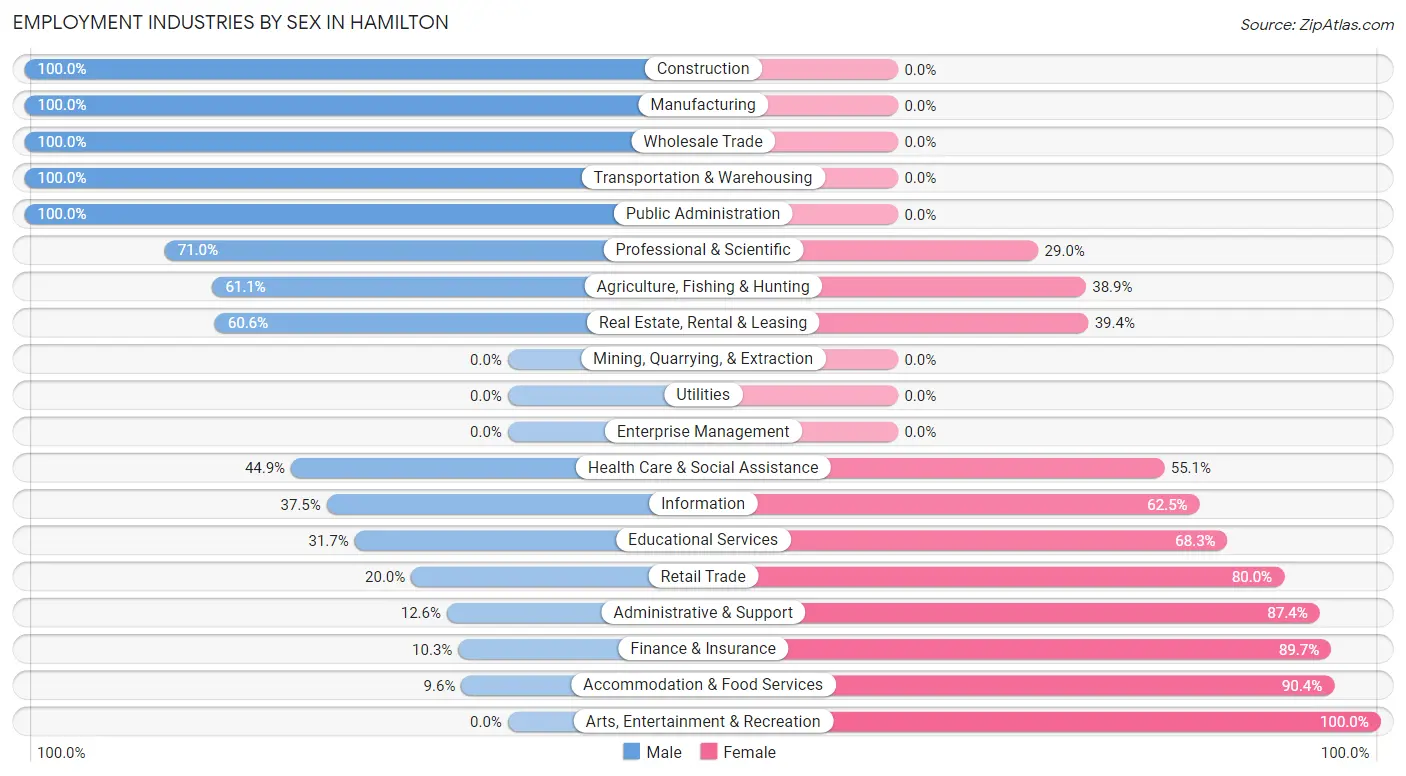
Employment Industries by Sex in Hamilton
The Hamilton industries that see more men than women are Construction (100.0%), Manufacturing (100.0%), and Wholesale Trade (100.0%), whereas the industries that tend to have a higher number of women are Arts, Entertainment & Recreation (100.0%), Accommodation & Food Services (90.4%), and Finance & Insurance (89.7%).
| Industry | Male | Female |
| Agriculture, Fishing & Hunting | 11 (61.1%) | 7 (38.9%) |
| Mining, Quarrying, & Extraction | 0 (0.0%) | 0 (0.0%) |
| Construction | 21 (100.0%) | 0 (0.0%) |
| Manufacturing | 15 (100.0%) | 0 (0.0%) |
| Wholesale Trade | 4 (100.0%) | 0 (0.0%) |
| Retail Trade | 46 (20.0%) | 184 (80.0%) |
| Transportation & Warehousing | 26 (100.0%) | 0 (0.0%) |
| Utilities | 0 (0.0%) | 0 (0.0%) |
| Information | 6 (37.5%) | 10 (62.5%) |
| Finance & Insurance | 8 (10.3%) | 70 (89.7%) |
| Real Estate, Rental & Leasing | 20 (60.6%) | 13 (39.4%) |
| Professional & Scientific | 22 (71.0%) | 9 (29.0%) |
| Enterprise Management | 0 (0.0%) | 0 (0.0%) |
| Administrative & Support | 13 (12.6%) | 90 (87.4%) |
| Educational Services | 228 (31.7%) | 491 (68.3%) |
| Health Care & Social Assistance | 35 (44.9%) | 43 (55.1%) |
| Arts, Entertainment & Recreation | 0 (0.0%) | 13 (100.0%) |
| Accommodation & Food Services | 10 (9.6%) | 94 (90.4%) |
| Public Administration | 11 (100.0%) | 0 (0.0%) |
| Total | 492 (32.5%) | 1,024 (67.5%) |
Education in Hamilton
School Enrollment in Hamilton
The most common levels of schooling among the 2,743 students in Hamilton are college / undergraduate (2,497 | 91.0%), elementary school (89 | 3.2%), and high school (73 | 2.7%).
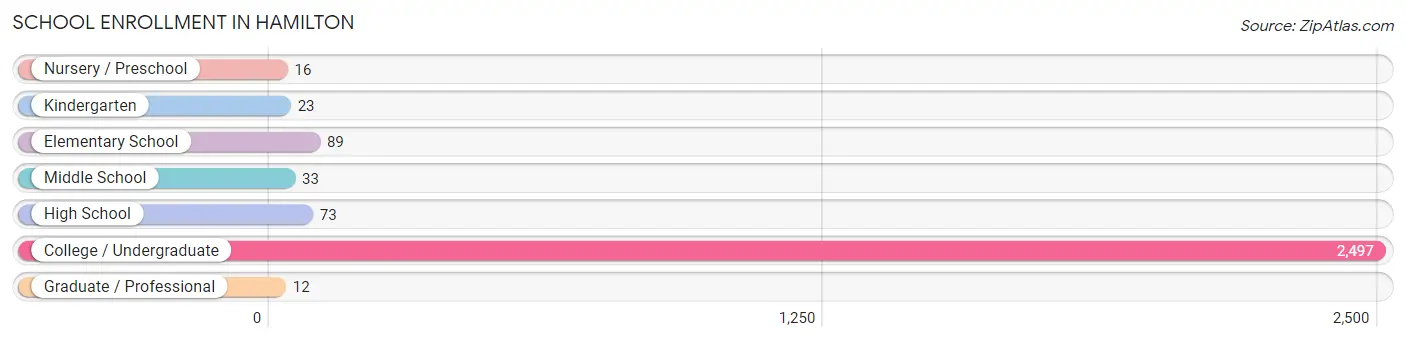
| School Level | # Students | % Students |
| Nursery / Preschool | 16 | 0.6% |
| Kindergarten | 23 | 0.8% |
| Elementary School | 89 | 3.2% |
| Middle School | 33 | 1.2% |
| High School | 73 | 2.7% |
| College / Undergraduate | 2,497 | 91.0% |
| Graduate / Professional | 12 | 0.4% |
| Total | 2,743 | 100.0% |
School Enrollment by Age by Funding Source in Hamilton
Out of a total of 2,743 students who are enrolled in schools in Hamilton, 2,140 (78.0%) attend a private institution, while the remaining 603 (22.0%) are enrolled in public schools. The age group of 25 to 34 year olds has the highest likelihood of being enrolled in private schools, with 1 (100.0% in the age bracket) enrolled. Conversely, the age group of 10 to 14 year olds has the lowest likelihood of being enrolled in a private school, with 58 (100.0% in the age bracket) attending a public institution.
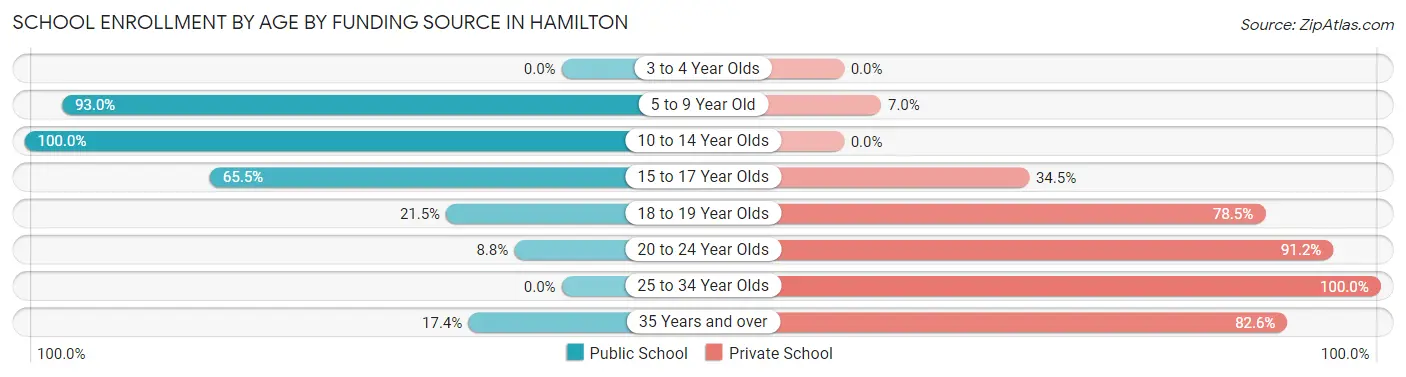
| Age Bracket | Public School | Private School |
| 3 to 4 Year Olds | 0 (0.0%) | 0 (0.0%) |
| 5 to 9 Year Old | 107 (93.0%) | 8 (7.0%) |
| 10 to 14 Year Olds | 58 (100.0%) | 0 (0.0%) |
| 15 to 17 Year Olds | 55 (65.5%) | 29 (34.5%) |
| 18 to 19 Year Olds | 274 (21.5%) | 999 (78.5%) |
| 20 to 24 Year Olds | 105 (8.8%) | 1,084 (91.2%) |
| 25 to 34 Year Olds | 0 (0.0%) | 1 (100.0%) |
| 35 Years and over | 4 (17.4%) | 19 (82.6%) |
| Total | 603 (22.0%) | 2,140 (78.0%) |
Educational Attainment by Field of Study in Hamilton
Literature & languages (126 | 17.8%), liberal arts & history (118 | 16.6%), bio, nature & agricultural (73 | 10.3%), social sciences (71 | 10.0%), and computers & mathematics (69 | 9.7%) are the most common fields of study among 709 individuals in Hamilton who have obtained a bachelor's degree or higher.
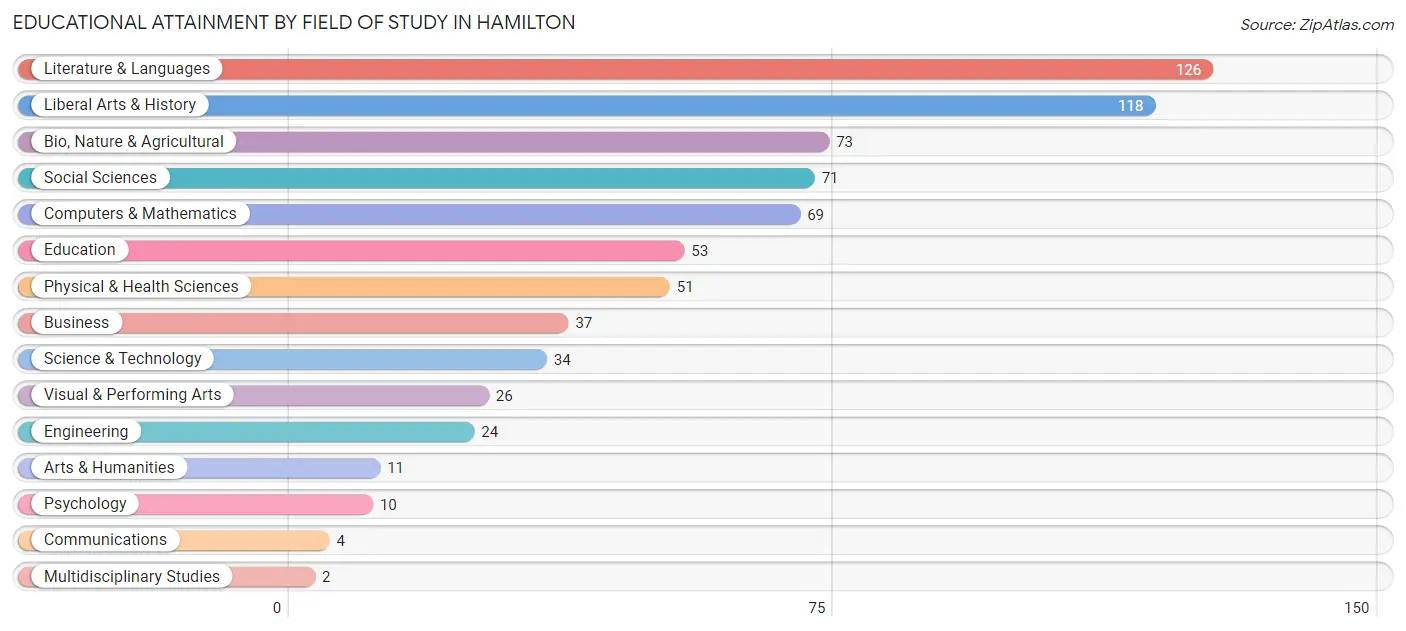
| Field of Study | # Graduates | % Graduates |
| Computers & Mathematics | 69 | 9.7% |
| Bio, Nature & Agricultural | 73 | 10.3% |
| Physical & Health Sciences | 51 | 7.2% |
| Psychology | 10 | 1.4% |
| Social Sciences | 71 | 10.0% |
| Engineering | 24 | 3.4% |
| Multidisciplinary Studies | 2 | 0.3% |
| Science & Technology | 34 | 4.8% |
| Business | 37 | 5.2% |
| Education | 53 | 7.5% |
| Literature & Languages | 126 | 17.8% |
| Liberal Arts & History | 118 | 16.6% |
| Visual & Performing Arts | 26 | 3.7% |
| Communications | 4 | 0.6% |
| Arts & Humanities | 11 | 1.5% |
| Total | 709 | 100.0% |
Transportation & Commute in Hamilton
Vehicle Availability by Sex in Hamilton
The most prevalent vehicle ownership categories in Hamilton are males with 2 vehicles (161, accounting for 43.4%) and females with 2 vehicles (130, making up 56.3%).
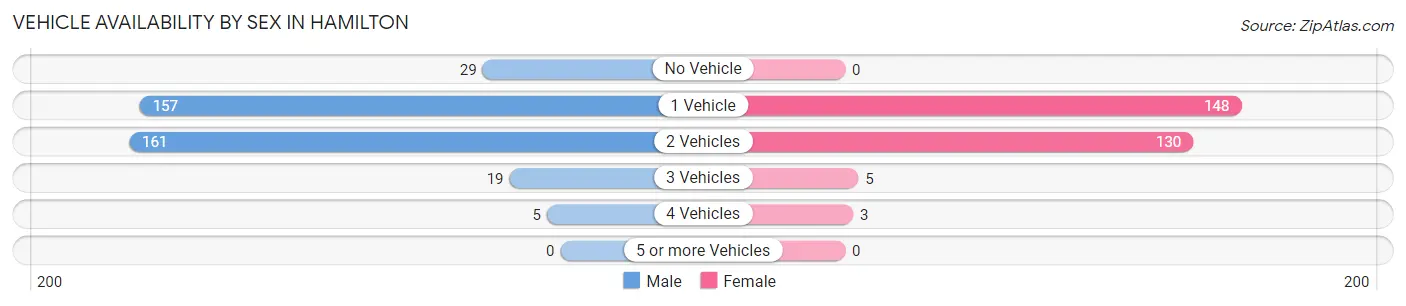
| Vehicles Available | Male | Female |
| No Vehicle | 29 (7.8%) | 0 (0.0%) |
| 1 Vehicle | 157 (42.3%) | 148 (51.7%) |
| 2 Vehicles | 161 (43.4%) | 130 (45.5%) |
| 3 Vehicles | 19 (5.1%) | 5 (1.8%) |
| 4 Vehicles | 5 (1.3%) | 3 (1.1%) |
| 5 or more Vehicles | 0 (0.0%) | 0 (0.0%) |
| Total | 371 (100.0%) | 286 (100.0%) |
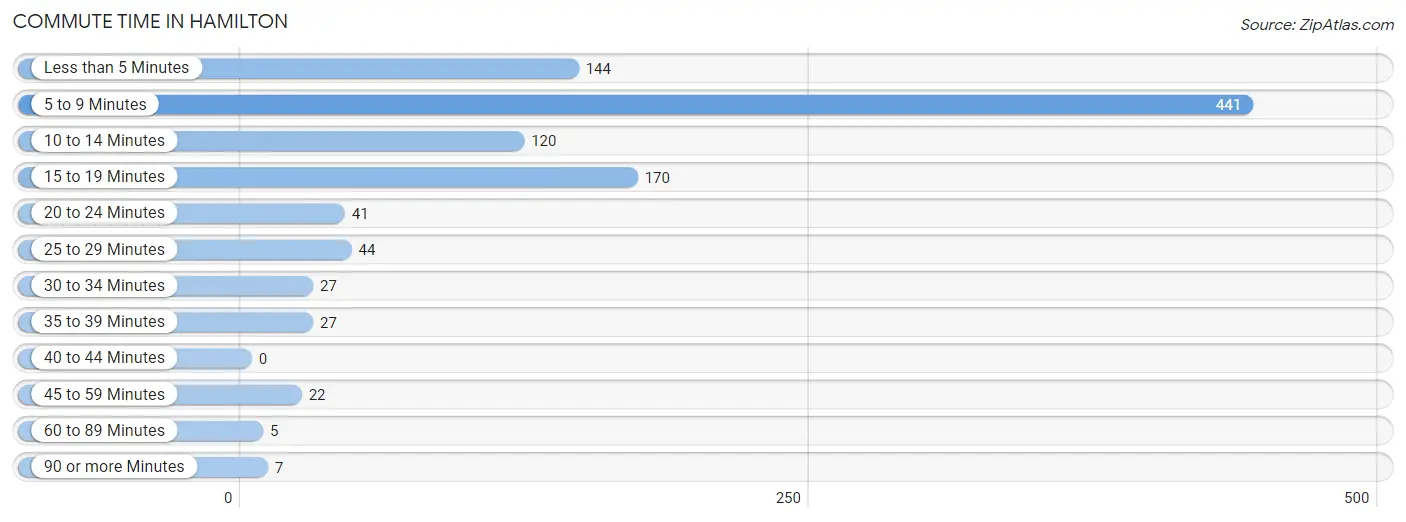
Commute Time in Hamilton
The most frequently occuring commute durations in Hamilton are 5 to 9 minutes (441 commuters, 42.1%), 15 to 19 minutes (170 commuters, 16.2%), and less than 5 minutes (144 commuters, 13.7%).
| Commute Time | # Commuters | % Commuters |
| Less than 5 Minutes | 144 | 13.7% |
| 5 to 9 Minutes | 441 | 42.1% |
| 10 to 14 Minutes | 120 | 11.5% |
| 15 to 19 Minutes | 170 | 16.2% |
| 20 to 24 Minutes | 41 | 3.9% |
| 25 to 29 Minutes | 44 | 4.2% |
| 30 to 34 Minutes | 27 | 2.6% |
| 35 to 39 Minutes | 27 | 2.6% |
| 40 to 44 Minutes | 0 | 0.0% |
| 45 to 59 Minutes | 22 | 2.1% |
| 60 to 89 Minutes | 5 | 0.5% |
| 90 or more Minutes | 7 | 0.7% |
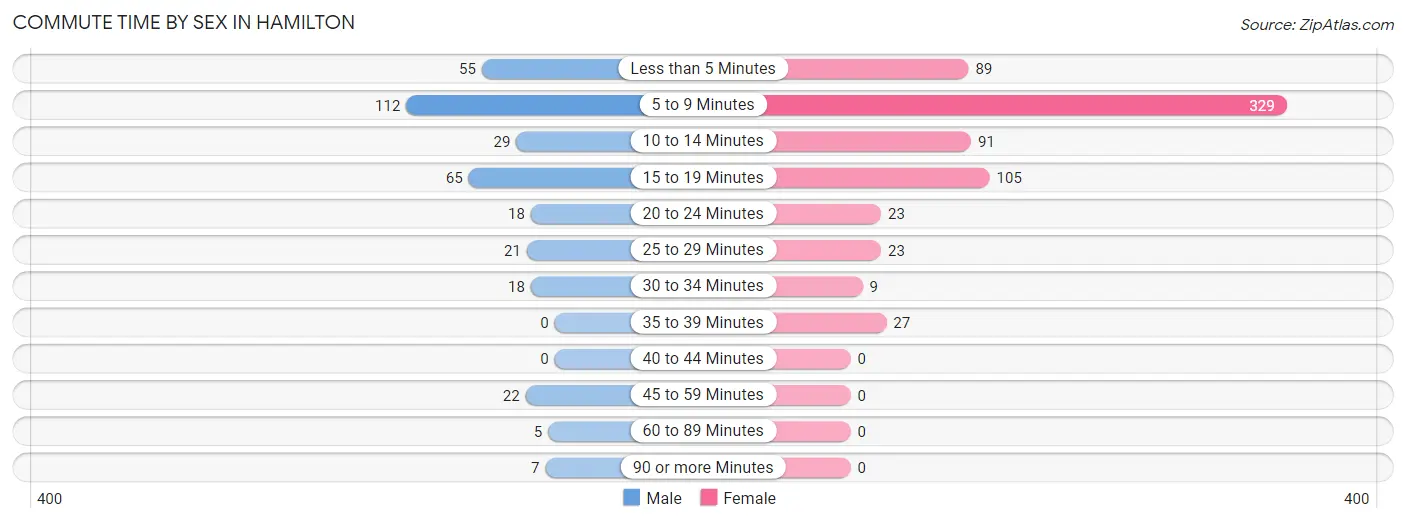
Commute Time by Sex in Hamilton
The most common commute times in Hamilton are 5 to 9 minutes (112 commuters, 31.8%) for males and 5 to 9 minutes (329 commuters, 47.3%) for females.
| Commute Time | Male | Female |
| Less than 5 Minutes | 55 (15.6%) | 89 (12.8%) |
| 5 to 9 Minutes | 112 (31.8%) | 329 (47.3%) |
| 10 to 14 Minutes | 29 (8.2%) | 91 (13.1%) |
| 15 to 19 Minutes | 65 (18.5%) | 105 (15.1%) |
| 20 to 24 Minutes | 18 (5.1%) | 23 (3.3%) |
| 25 to 29 Minutes | 21 (6.0%) | 23 (3.3%) |
| 30 to 34 Minutes | 18 (5.1%) | 9 (1.3%) |
| 35 to 39 Minutes | 0 (0.0%) | 27 (3.9%) |
| 40 to 44 Minutes | 0 (0.0%) | 0 (0.0%) |
| 45 to 59 Minutes | 22 (6.2%) | 0 (0.0%) |
| 60 to 89 Minutes | 5 (1.4%) | 0 (0.0%) |
| 90 or more Minutes | 7 (2.0%) | 0 (0.0%) |
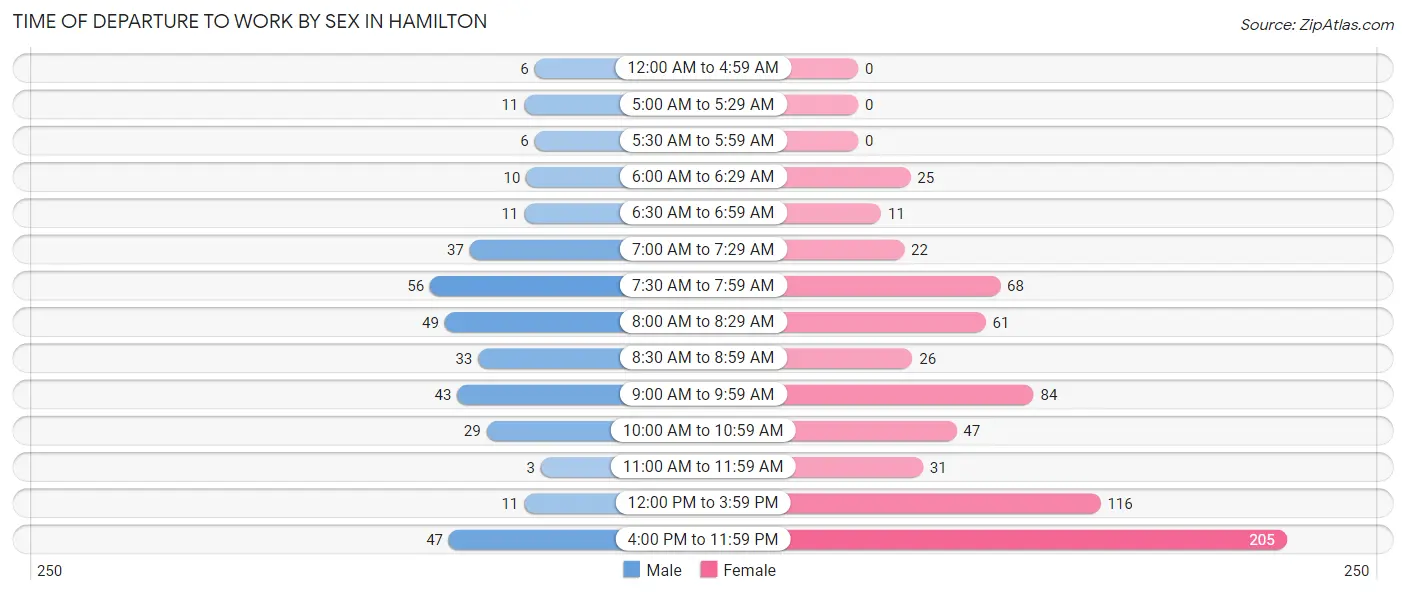
Time of Departure to Work by Sex in Hamilton
The most frequent times of departure to work in Hamilton are 7:30 AM to 7:59 AM (56, 15.9%) for males and 4:00 PM to 11:59 PM (205, 29.4%) for females.
| Time of Departure | Male | Female |
| 12:00 AM to 4:59 AM | 6 (1.7%) | 0 (0.0%) |
| 5:00 AM to 5:29 AM | 11 (3.1%) | 0 (0.0%) |
| 5:30 AM to 5:59 AM | 6 (1.7%) | 0 (0.0%) |
| 6:00 AM to 6:29 AM | 10 (2.8%) | 25 (3.6%) |
| 6:30 AM to 6:59 AM | 11 (3.1%) | 11 (1.6%) |
| 7:00 AM to 7:29 AM | 37 (10.5%) | 22 (3.2%) |
| 7:30 AM to 7:59 AM | 56 (15.9%) | 68 (9.8%) |
| 8:00 AM to 8:29 AM | 49 (13.9%) | 61 (8.8%) |
| 8:30 AM to 8:59 AM | 33 (9.4%) | 26 (3.7%) |
| 9:00 AM to 9:59 AM | 43 (12.2%) | 84 (12.1%) |
| 10:00 AM to 10:59 AM | 29 (8.2%) | 47 (6.8%) |
| 11:00 AM to 11:59 AM | 3 (0.9%) | 31 (4.4%) |
| 12:00 PM to 3:59 PM | 11 (3.1%) | 116 (16.7%) |
| 4:00 PM to 11:59 PM | 47 (13.4%) | 205 (29.4%) |
| Total | 352 (100.0%) | 696 (100.0%) |
Housing Occupancy in Hamilton
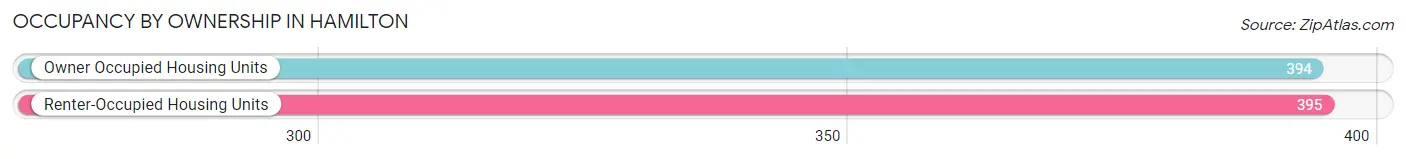
Occupancy by Ownership in Hamilton
Of the total 789 dwellings in Hamilton, owner-occupied units account for 394 (49.9%), while renter-occupied units make up 395 (50.1%).
| Occupancy | # Housing Units | % Housing Units |
| Owner Occupied Housing Units | 394 | 49.9% |
| Renter-Occupied Housing Units | 395 | 50.1% |
| Total Occupied Housing Units | 789 | 100.0% |
Occupancy by Household Size in Hamilton
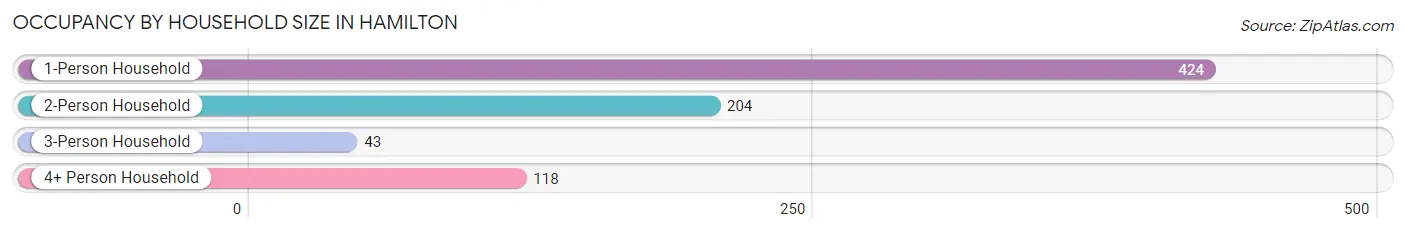
| Household Size | # Housing Units | % Housing Units |
| 1-Person Household | 424 | 53.7% |
| 2-Person Household | 204 | 25.9% |
| 3-Person Household | 43 | 5.4% |
| 4+ Person Household | 118 | 15.0% |
| Total Housing Units | 789 | 100.0% |
Occupancy by Ownership by Household Size in Hamilton
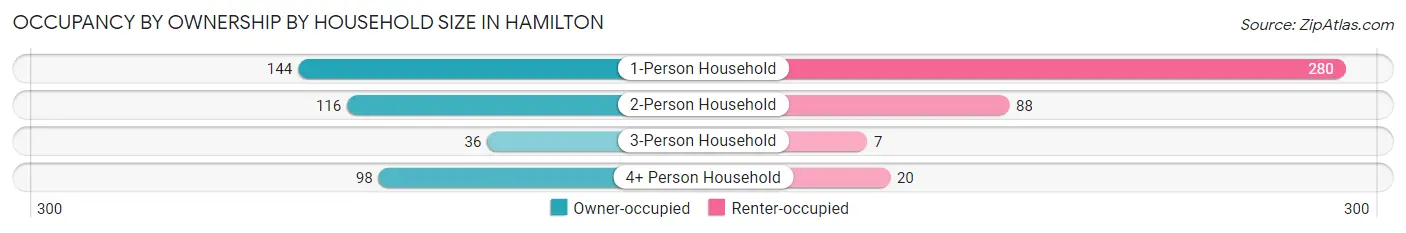
| Household Size | Owner-occupied | Renter-occupied |
| 1-Person Household | 144 (34.0%) | 280 (66.0%) |
| 2-Person Household | 116 (56.9%) | 88 (43.1%) |
| 3-Person Household | 36 (83.7%) | 7 (16.3%) |
| 4+ Person Household | 98 (83.1%) | 20 (17.0%) |
| Total Housing Units | 394 (49.9%) | 395 (50.1%) |
Occupancy by Educational Attainment in Hamilton
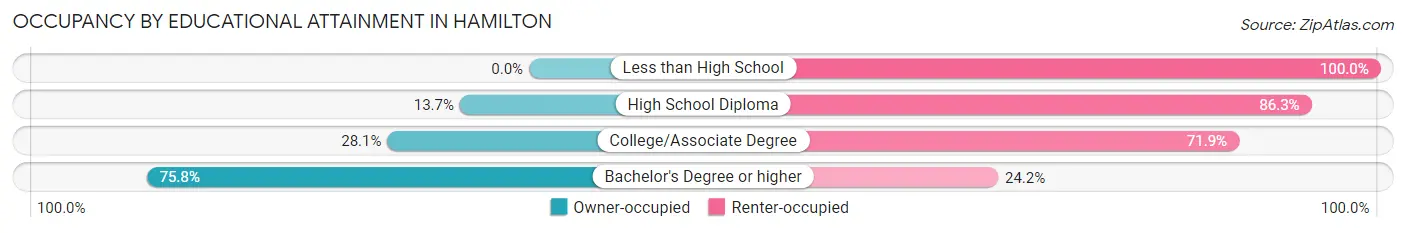
| Household Size | Owner-occupied | Renter-occupied |
| Less than High School | 0 (0.0%) | 14 (100.0%) |
| High School Diploma | 24 (13.7%) | 151 (86.3%) |
| College/Associate Degree | 50 (28.1%) | 128 (71.9%) |
| Bachelor's Degree or higher | 320 (75.8%) | 102 (24.2%) |
Occupancy by Age of Householder in Hamilton
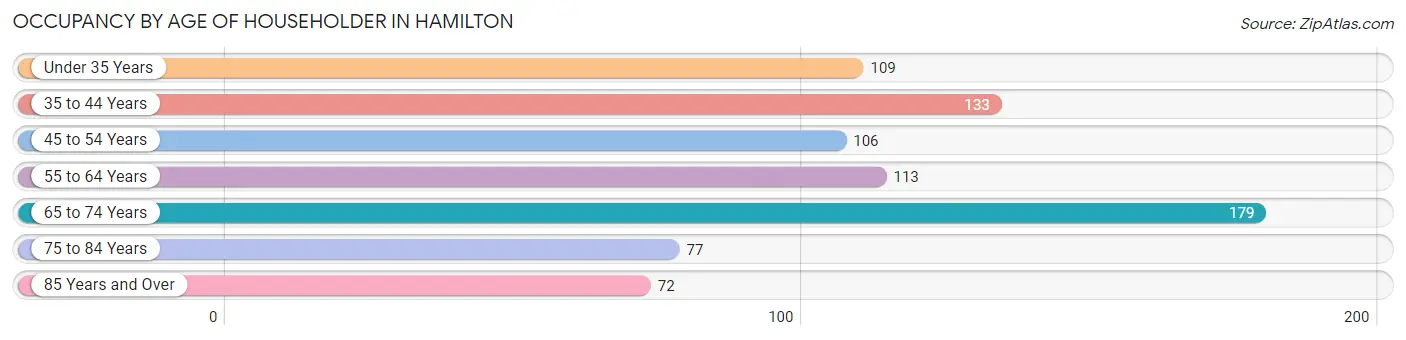
| Age Bracket | # Households | % Households |
| Under 35 Years | 109 | 13.8% |
| 35 to 44 Years | 133 | 16.9% |
| 45 to 54 Years | 106 | 13.4% |
| 55 to 64 Years | 113 | 14.3% |
| 65 to 74 Years | 179 | 22.7% |
| 75 to 84 Years | 77 | 9.8% |
| 85 Years and Over | 72 | 9.1% |
| Total | 789 | 100.0% |
Housing Finances in Hamilton
Median Income by Occupancy in Hamilton
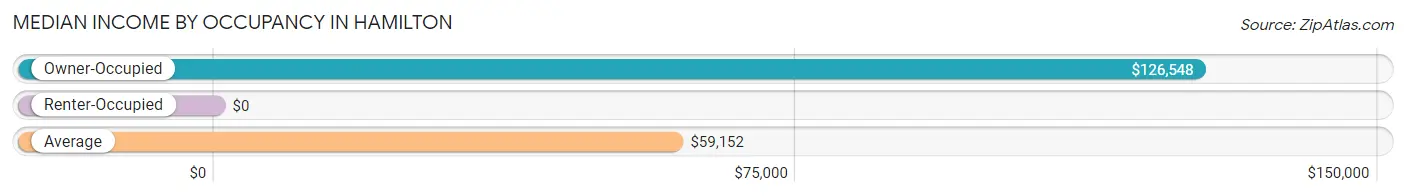
| Occupancy Type | # Households | Median Income |
| Owner-Occupied | 394 (49.9%) | $126,548 |
| Renter-Occupied | 395 (50.1%) | $0 |
| Average | 789 (100.0%) | $59,152 |
Occupancy by Householder Income Bracket in Hamilton
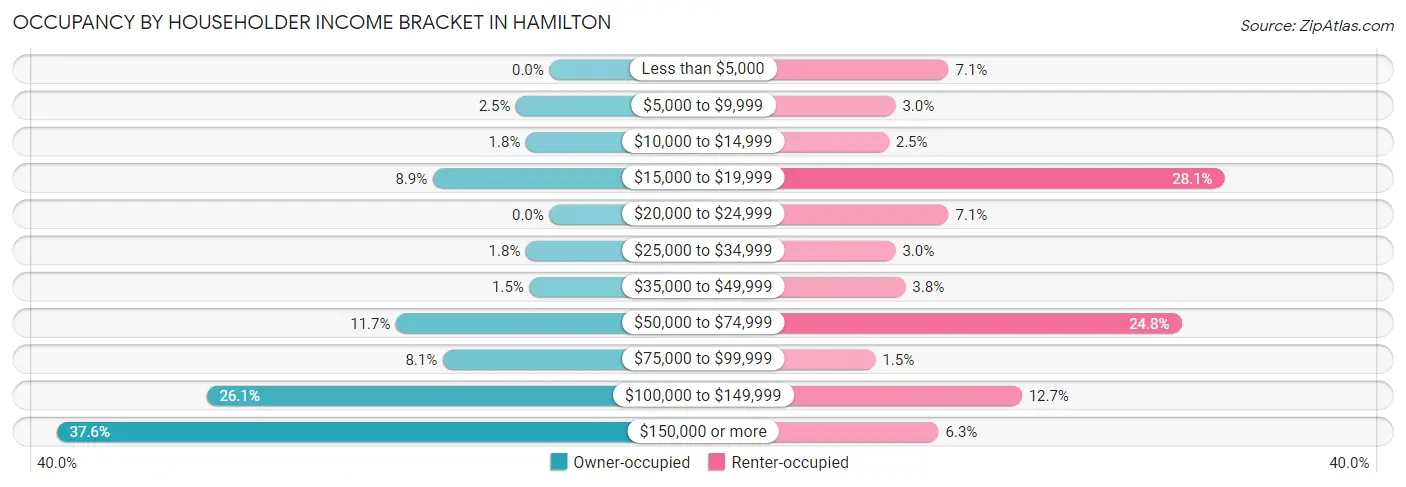
| Income Bracket | Owner-occupied | Renter-occupied |
| Less than $5,000 | 0 (0.0%) | 28 (7.1%) |
| $5,000 to $9,999 | 10 (2.5%) | 12 (3.0%) |
| $10,000 to $14,999 | 7 (1.8%) | 10 (2.5%) |
| $15,000 to $19,999 | 35 (8.9%) | 111 (28.1%) |
| $20,000 to $24,999 | 0 (0.0%) | 28 (7.1%) |
| $25,000 to $34,999 | 7 (1.8%) | 12 (3.0%) |
| $35,000 to $49,999 | 6 (1.5%) | 15 (3.8%) |
| $50,000 to $74,999 | 46 (11.7%) | 98 (24.8%) |
| $75,000 to $99,999 | 32 (8.1%) | 6 (1.5%) |
| $100,000 to $149,999 | 103 (26.1%) | 50 (12.7%) |
| $150,000 or more | 148 (37.6%) | 25 (6.3%) |
| Total | 394 (100.0%) | 395 (100.0%) |
Monthly Housing Cost Tiers in Hamilton
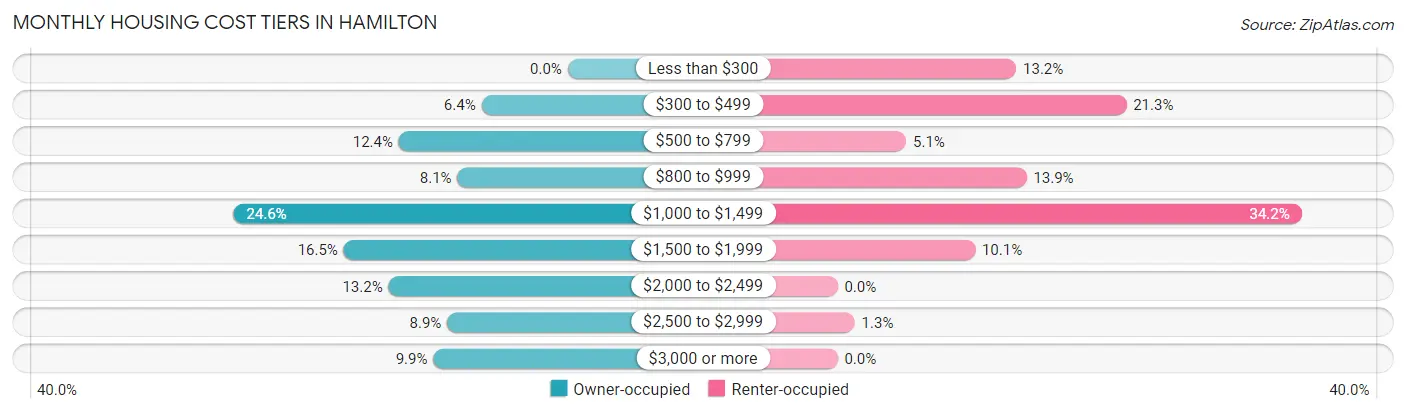
| Monthly Cost | Owner-occupied | Renter-occupied |
| Less than $300 | 0 (0.0%) | 52 (13.2%) |
| $300 to $499 | 25 (6.4%) | 84 (21.3%) |
| $500 to $799 | 49 (12.4%) | 20 (5.1%) |
| $800 to $999 | 32 (8.1%) | 55 (13.9%) |
| $1,000 to $1,499 | 97 (24.6%) | 135 (34.2%) |
| $1,500 to $1,999 | 65 (16.5%) | 40 (10.1%) |
| $2,000 to $2,499 | 52 (13.2%) | 0 (0.0%) |
| $2,500 to $2,999 | 35 (8.9%) | 5 (1.3%) |
| $3,000 or more | 39 (9.9%) | 0 (0.0%) |
| Total | 394 (100.0%) | 395 (100.0%) |
Physical Housing Characteristics in Hamilton
Housing Structures in Hamilton
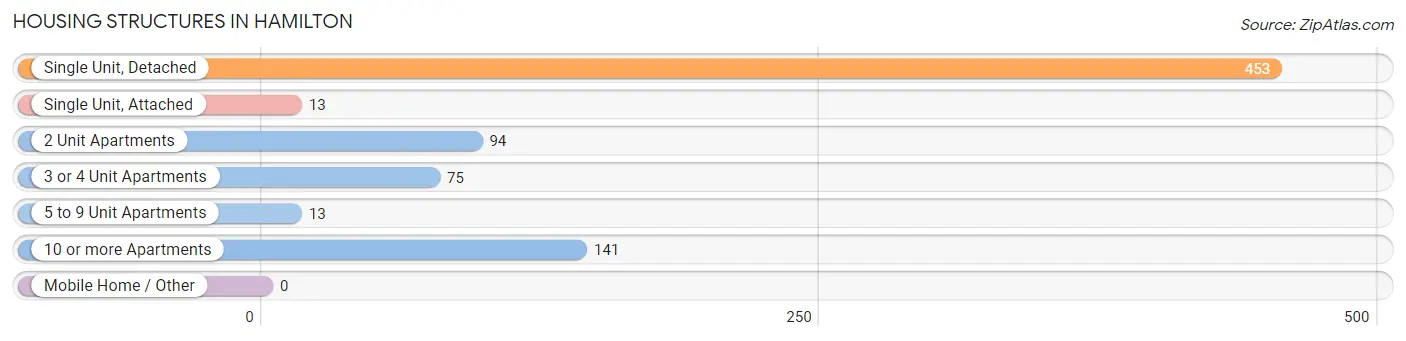
| Structure Type | # Housing Units | % Housing Units |
| Single Unit, Detached | 453 | 57.4% |
| Single Unit, Attached | 13 | 1.7% |
| 2 Unit Apartments | 94 | 11.9% |
| 3 or 4 Unit Apartments | 75 | 9.5% |
| 5 to 9 Unit Apartments | 13 | 1.7% |
| 10 or more Apartments | 141 | 17.9% |
| Mobile Home / Other | 0 | 0.0% |
| Total | 789 | 100.0% |
Housing Structures by Occupancy in Hamilton
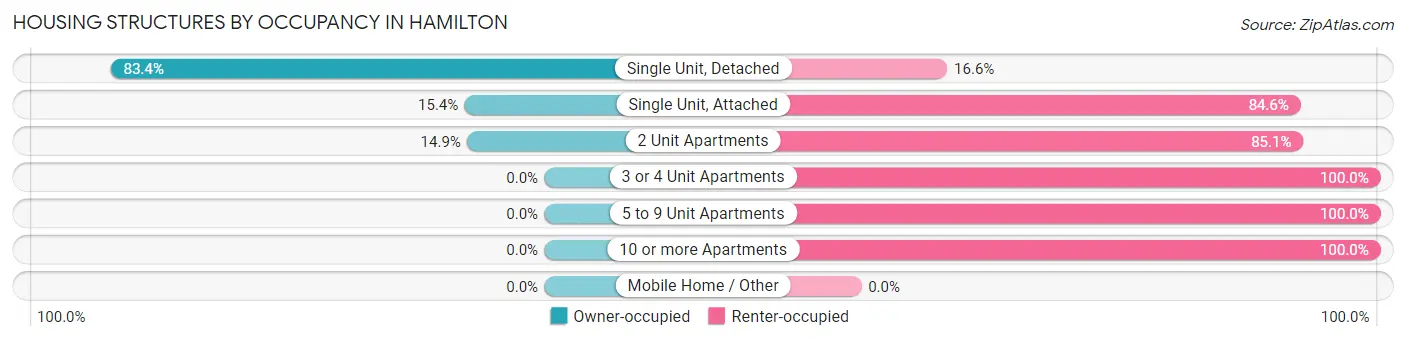
| Structure Type | Owner-occupied | Renter-occupied |
| Single Unit, Detached | 378 (83.4%) | 75 (16.6%) |
| Single Unit, Attached | 2 (15.4%) | 11 (84.6%) |
| 2 Unit Apartments | 14 (14.9%) | 80 (85.1%) |
| 3 or 4 Unit Apartments | 0 (0.0%) | 75 (100.0%) |
| 5 to 9 Unit Apartments | 0 (0.0%) | 13 (100.0%) |
| 10 or more Apartments | 0 (0.0%) | 141 (100.0%) |
| Mobile Home / Other | 0 (0.0%) | 0 (0.0%) |
| Total | 394 (49.9%) | 395 (50.1%) |
Housing Structures by Number of Rooms in Hamilton
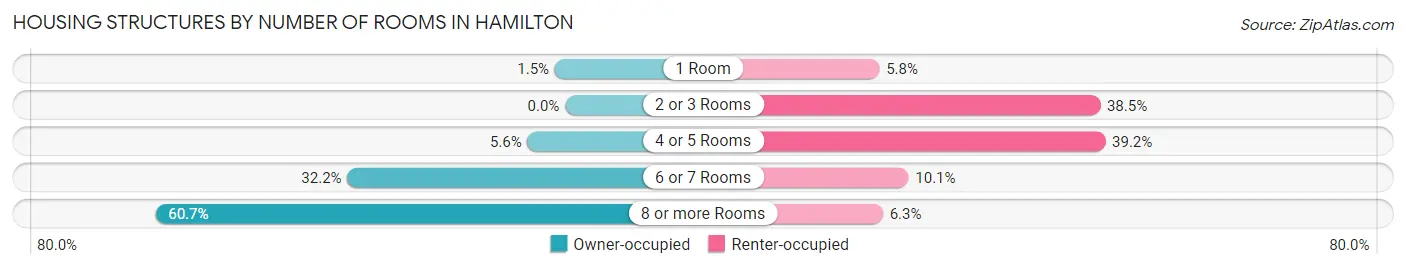
| Number of Rooms | Owner-occupied | Renter-occupied |
| 1 Room | 6 (1.5%) | 23 (5.8%) |
| 2 or 3 Rooms | 0 (0.0%) | 152 (38.5%) |
| 4 or 5 Rooms | 22 (5.6%) | 155 (39.2%) |
| 6 or 7 Rooms | 127 (32.2%) | 40 (10.1%) |
| 8 or more Rooms | 239 (60.7%) | 25 (6.3%) |
| Total | 394 (100.0%) | 395 (100.0%) |
Housing Structure by Heating Type in Hamilton
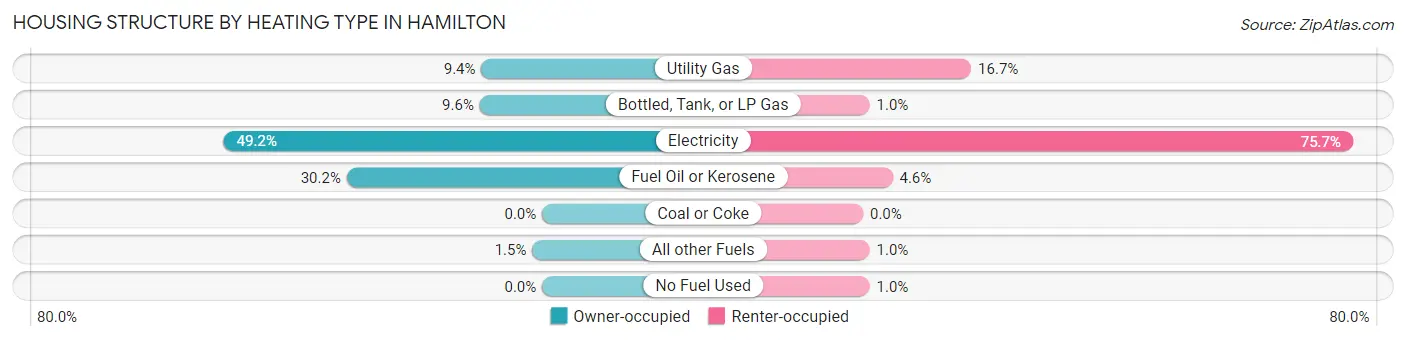
| Heating Type | Owner-occupied | Renter-occupied |
| Utility Gas | 37 (9.4%) | 66 (16.7%) |
| Bottled, Tank, or LP Gas | 38 (9.6%) | 4 (1.0%) |
| Electricity | 194 (49.2%) | 299 (75.7%) |
| Fuel Oil or Kerosene | 119 (30.2%) | 18 (4.6%) |
| Coal or Coke | 0 (0.0%) | 0 (0.0%) |
| All other Fuels | 6 (1.5%) | 4 (1.0%) |
| No Fuel Used | 0 (0.0%) | 4 (1.0%) |
| Total | 394 (100.0%) | 395 (100.0%) |
Household Vehicle Usage in Hamilton
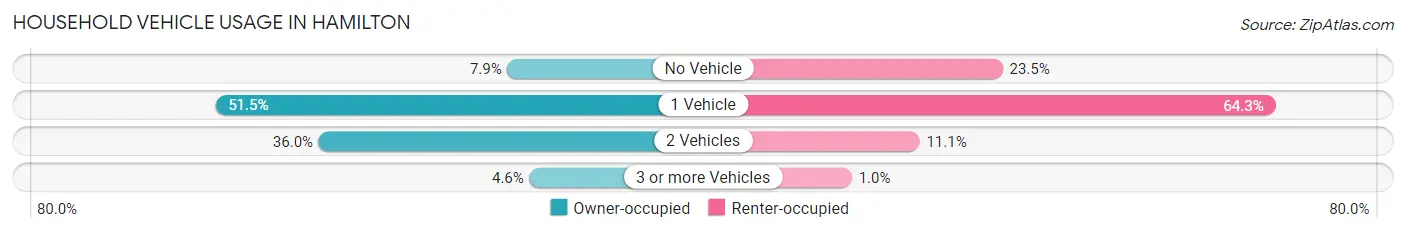
| Vehicles per Household | Owner-occupied | Renter-occupied |
| No Vehicle | 31 (7.9%) | 93 (23.5%) |
| 1 Vehicle | 203 (51.5%) | 254 (64.3%) |
| 2 Vehicles | 142 (36.0%) | 44 (11.1%) |
| 3 or more Vehicles | 18 (4.6%) | 4 (1.0%) |
| Total | 394 (100.0%) | 395 (100.0%) |
Real Estate & Mortgages in Hamilton
Real Estate and Mortgage Overview in Hamilton
| Characteristic | Without Mortgage | With Mortgage |
| Housing Units | 185 | 209 |
| Median Property Value | $253,900 | $241,400 |
| Median Household Income | $104,306 | $88 |
| Monthly Housing Costs | $914 | $39 |
| Real Estate Taxes | $7,051 | $0 |
Property Value by Mortgage Status in Hamilton
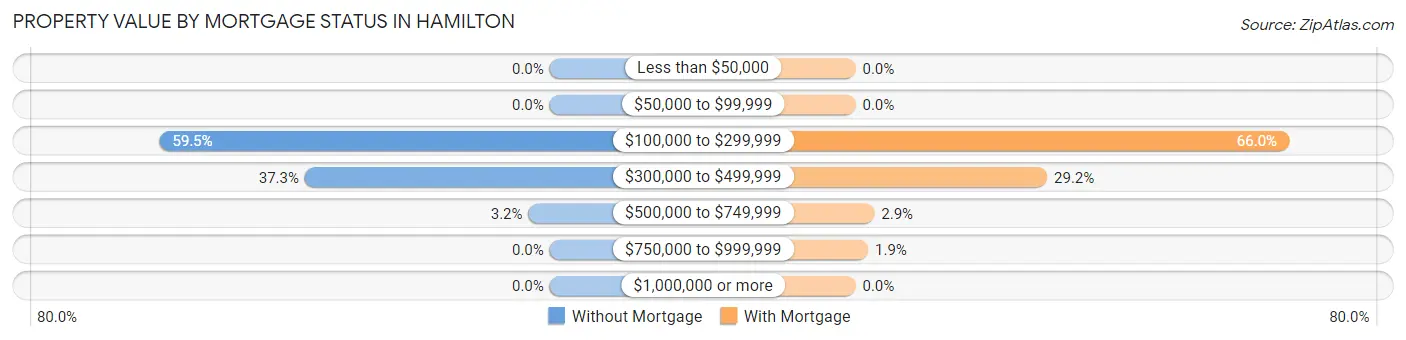
| Property Value | Without Mortgage | With Mortgage |
| Less than $50,000 | 0 (0.0%) | 0 (0.0%) |
| $50,000 to $99,999 | 0 (0.0%) | 0 (0.0%) |
| $100,000 to $299,999 | 110 (59.5%) | 138 (66.0%) |
| $300,000 to $499,999 | 69 (37.3%) | 61 (29.2%) |
| $500,000 to $749,999 | 6 (3.2%) | 6 (2.9%) |
| $750,000 to $999,999 | 0 (0.0%) | 4 (1.9%) |
| $1,000,000 or more | 0 (0.0%) | 0 (0.0%) |
| Total | 185 (100.0%) | 209 (100.0%) |
Household Income by Mortgage Status in Hamilton
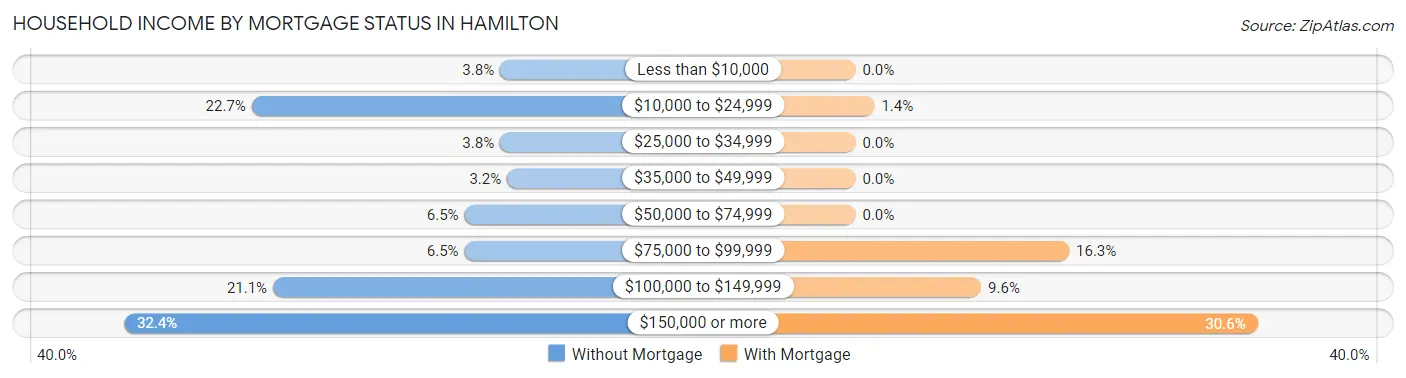
| Household Income | Without Mortgage | With Mortgage |
| Less than $10,000 | 7 (3.8%) | 0 (0.0%) |
| $10,000 to $24,999 | 42 (22.7%) | 3 (1.4%) |
| $25,000 to $34,999 | 7 (3.8%) | 0 (0.0%) |
| $35,000 to $49,999 | 6 (3.2%) | 0 (0.0%) |
| $50,000 to $74,999 | 12 (6.5%) | 0 (0.0%) |
| $75,000 to $99,999 | 12 (6.5%) | 34 (16.3%) |
| $100,000 to $149,999 | 39 (21.1%) | 20 (9.6%) |
| $150,000 or more | 60 (32.4%) | 64 (30.6%) |
| Total | 185 (100.0%) | 209 (100.0%) |
Property Value to Household Income Ratio in Hamilton
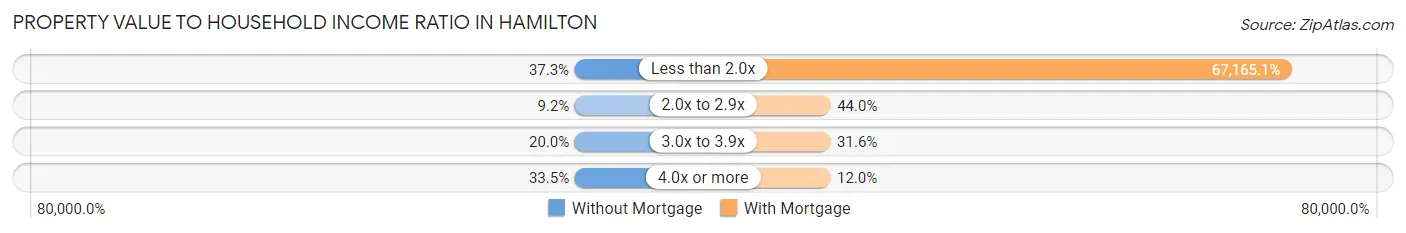
| Value-to-Income Ratio | Without Mortgage | With Mortgage |
| Less than 2.0x | 69 (37.3%) | 140,375 (67,165.1%) |
| 2.0x to 2.9x | 17 (9.2%) | 92 (44.0%) |
| 3.0x to 3.9x | 37 (20.0%) | 66 (31.6%) |
| 4.0x or more | 62 (33.5%) | 25 (12.0%) |
| Total | 185 (100.0%) | 209 (100.0%) |
Real Estate Taxes by Mortgage Status in Hamilton
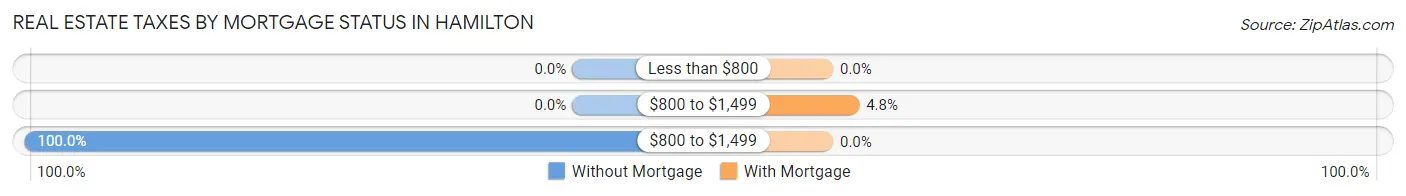
| Property Taxes | Without Mortgage | With Mortgage |
| Less than $800 | 0 (0.0%) | 0 (0.0%) |
| $800 to $1,499 | 0 (0.0%) | 10 (4.8%) |
| $800 to $1,499 | 185 (100.0%) | 0 (0.0%) |
| Total | 185 (100.0%) | 209 (100.0%) |
Health & Disability in Hamilton
Health Insurance Coverage by Age in Hamilton
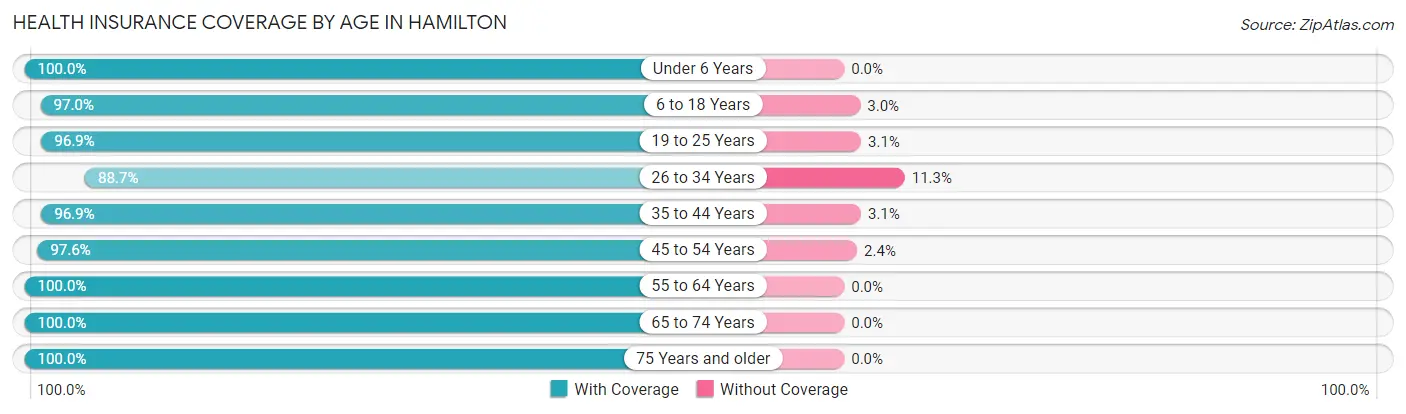
| Age Bracket | With Coverage | Without Coverage |
| Under 6 Years | 71 (100.0%) | 0 (0.0%) |
| 6 to 18 Years | 942 (97.0%) | 29 (3.0%) |
| 19 to 25 Years | 1,669 (96.9%) | 54 (3.1%) |
| 26 to 34 Years | 118 (88.7%) | 15 (11.3%) |
| 35 to 44 Years | 217 (96.9%) | 7 (3.1%) |
| 45 to 54 Years | 163 (97.6%) | 4 (2.4%) |
| 55 to 64 Years | 168 (100.0%) | 0 (0.0%) |
| 65 to 74 Years | 244 (100.0%) | 0 (0.0%) |
| 75 Years and older | 181 (100.0%) | 0 (0.0%) |
| Total | 3,773 (97.2%) | 109 (2.8%) |
Health Insurance Coverage by Citizenship Status in Hamilton
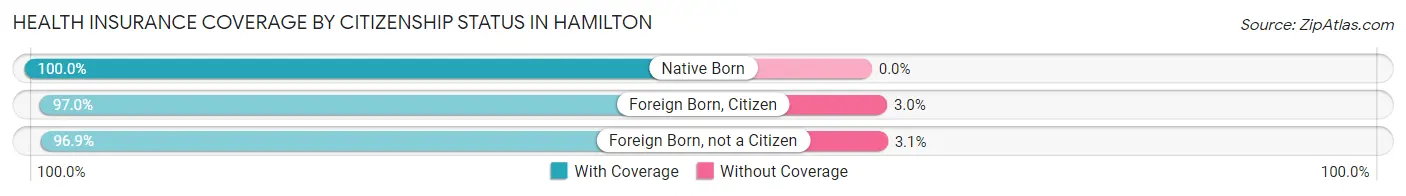
| Citizenship Status | With Coverage | Without Coverage |
| Native Born | 71 (100.0%) | 0 (0.0%) |
| Foreign Born, Citizen | 942 (97.0%) | 29 (3.0%) |
| Foreign Born, not a Citizen | 1,669 (96.9%) | 54 (3.1%) |
Health Insurance Coverage by Household Income in Hamilton
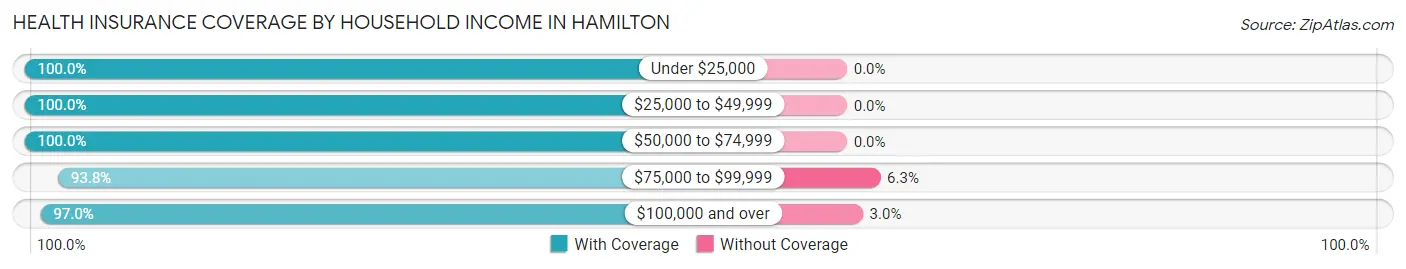
| Household Income | With Coverage | Without Coverage |
| Under $25,000 | 305 (100.0%) | 0 (0.0%) |
| $25,000 to $49,999 | 52 (100.0%) | 0 (0.0%) |
| $50,000 to $74,999 | 241 (100.0%) | 0 (0.0%) |
| $75,000 to $99,999 | 60 (93.8%) | 4 (6.2%) |
| $100,000 and over | 783 (97.0%) | 24 (3.0%) |
Public vs Private Health Insurance Coverage by Age in Hamilton
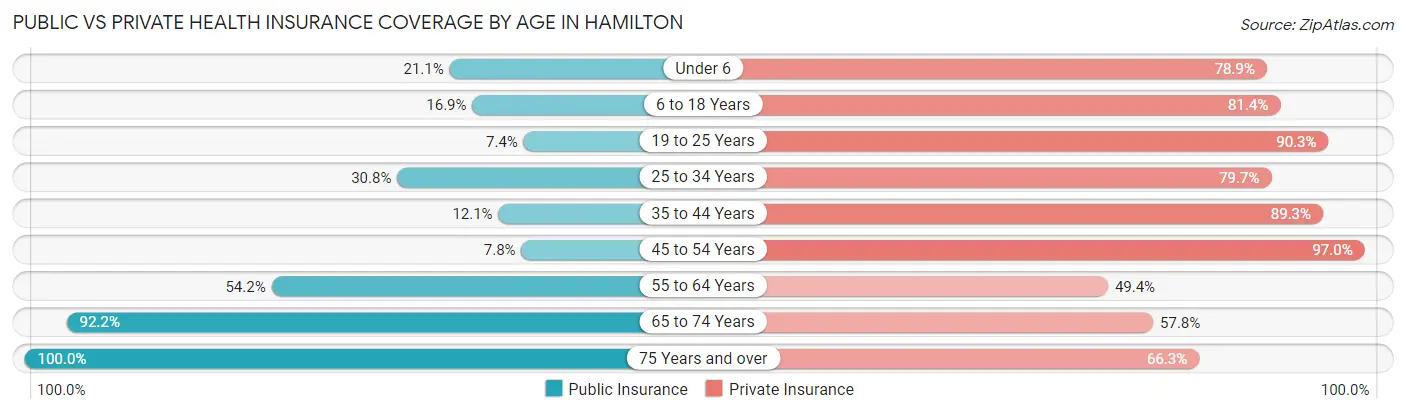
| Age Bracket | Public Insurance | Private Insurance |
| Under 6 | 15 (21.1%) | 56 (78.9%) |
| 6 to 18 Years | 164 (16.9%) | 790 (81.4%) |
| 19 to 25 Years | 127 (7.4%) | 1,556 (90.3%) |
| 25 to 34 Years | 41 (30.8%) | 106 (79.7%) |
| 35 to 44 Years | 27 (12.0%) | 200 (89.3%) |
| 45 to 54 Years | 13 (7.8%) | 162 (97.0%) |
| 55 to 64 Years | 91 (54.2%) | 83 (49.4%) |
| 65 to 74 Years | 225 (92.2%) | 141 (57.8%) |
| 75 Years and over | 181 (100.0%) | 120 (66.3%) |
| Total | 884 (22.8%) | 3,214 (82.8%) |
Disability Status by Sex by Age in Hamilton
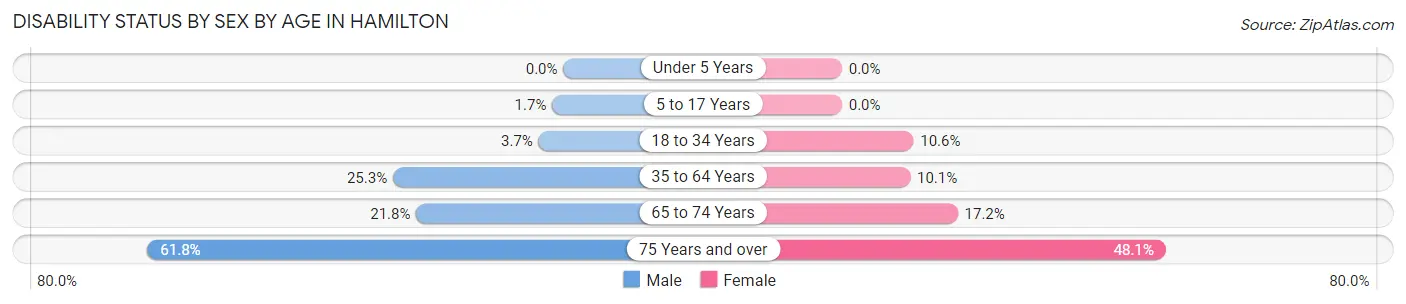
| Age Bracket | Male | Female |
| Under 5 Years | 0 (0.0%) | 0 (0.0%) |
| 5 to 17 Years | 3 (1.7%) | 0 (0.0%) |
| 18 to 34 Years | 40 (3.7%) | 161 (10.6%) |
| 35 to 64 Years | 84 (25.3%) | 23 (10.1%) |
| 65 to 74 Years | 19 (21.8%) | 27 (17.2%) |
| 75 Years and over | 63 (61.8%) | 38 (48.1%) |
Disability Class by Sex by Age in Hamilton
Disability Class: Hearing Difficulty
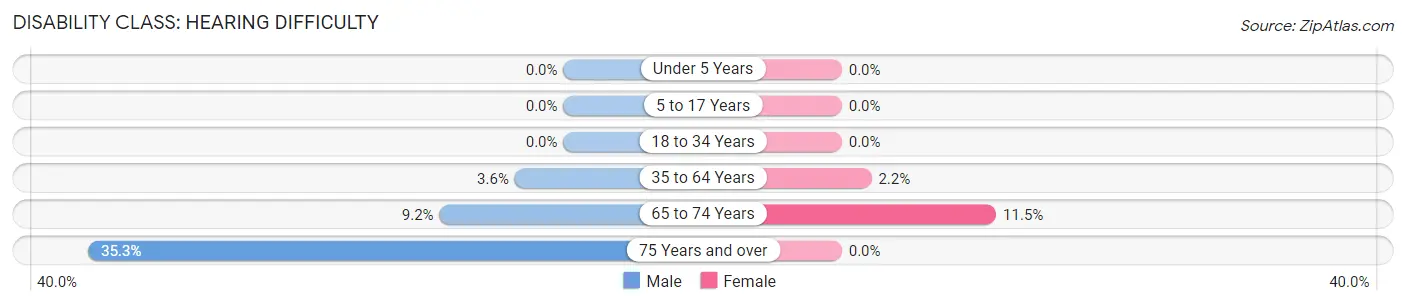
| Age Bracket | Male | Female |
| Under 5 Years | 0 (0.0%) | 0 (0.0%) |
| 5 to 17 Years | 0 (0.0%) | 0 (0.0%) |
| 18 to 34 Years | 0 (0.0%) | 0 (0.0%) |
| 35 to 64 Years | 12 (3.6%) | 5 (2.2%) |
| 65 to 74 Years | 8 (9.2%) | 18 (11.5%) |
| 75 Years and over | 36 (35.3%) | 0 (0.0%) |
Disability Class: Vision Difficulty
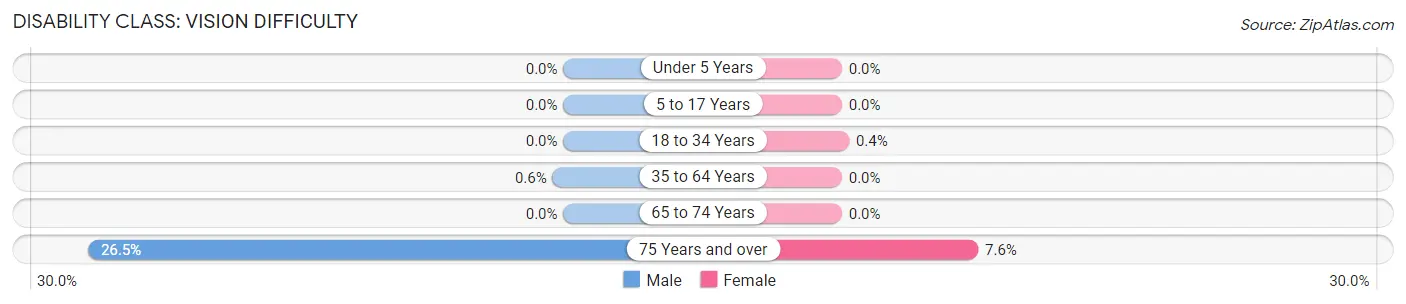
| Age Bracket | Male | Female |
| Under 5 Years | 0 (0.0%) | 0 (0.0%) |
| 5 to 17 Years | 0 (0.0%) | 0 (0.0%) |
| 18 to 34 Years | 0 (0.0%) | 6 (0.4%) |
| 35 to 64 Years | 2 (0.6%) | 0 (0.0%) |
| 65 to 74 Years | 0 (0.0%) | 0 (0.0%) |
| 75 Years and over | 27 (26.5%) | 6 (7.6%) |
Disability Class: Cognitive Difficulty
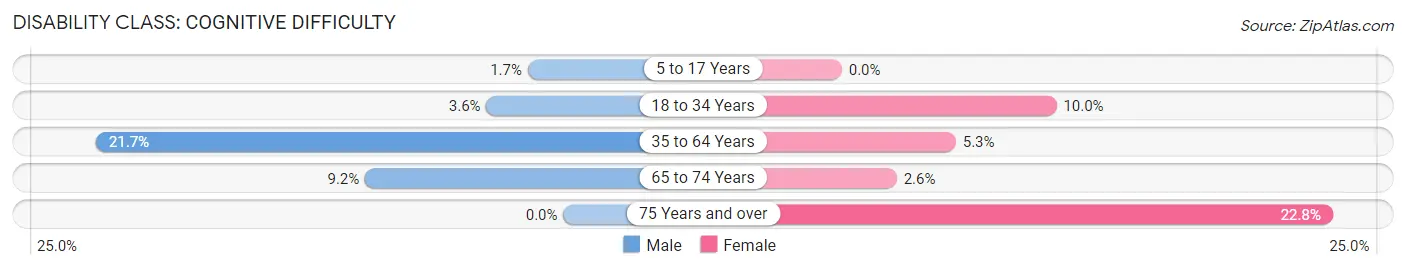
| Age Bracket | Male | Female |
| 5 to 17 Years | 3 (1.7%) | 0 (0.0%) |
| 18 to 34 Years | 39 (3.6%) | 151 (10.0%) |
| 35 to 64 Years | 72 (21.7%) | 12 (5.3%) |
| 65 to 74 Years | 8 (9.2%) | 4 (2.5%) |
| 75 Years and over | 0 (0.0%) | 18 (22.8%) |
Disability Class: Ambulatory Difficulty
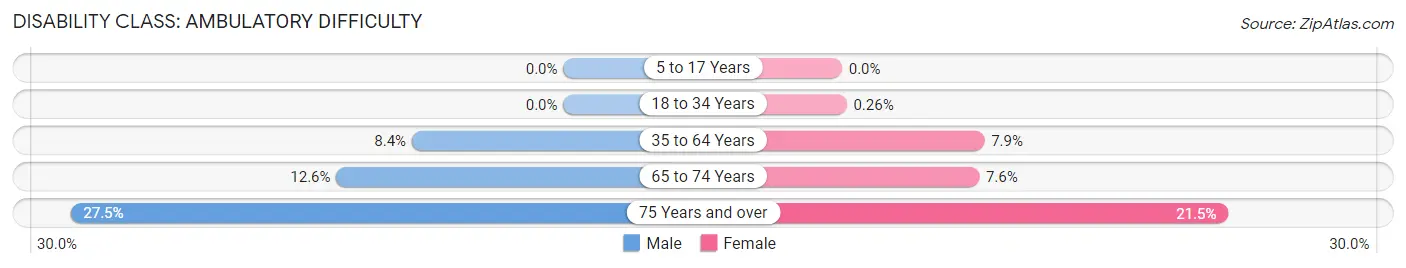
| Age Bracket | Male | Female |
| 5 to 17 Years | 0 (0.0%) | 0 (0.0%) |
| 18 to 34 Years | 0 (0.0%) | 4 (0.3%) |
| 35 to 64 Years | 28 (8.4%) | 18 (7.9%) |
| 65 to 74 Years | 11 (12.6%) | 12 (7.6%) |
| 75 Years and over | 28 (27.5%) | 17 (21.5%) |
Disability Class: Self-Care Difficulty
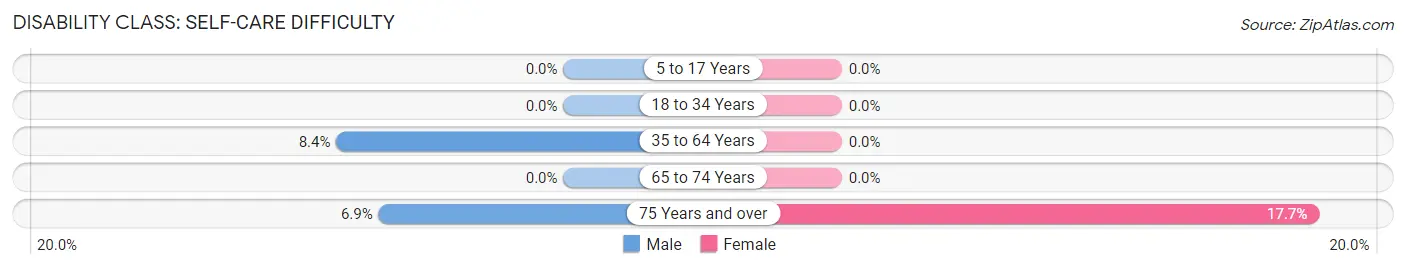
| Age Bracket | Male | Female |
| 5 to 17 Years | 0 (0.0%) | 0 (0.0%) |
| 18 to 34 Years | 0 (0.0%) | 0 (0.0%) |
| 35 to 64 Years | 28 (8.4%) | 0 (0.0%) |
| 65 to 74 Years | 0 (0.0%) | 0 (0.0%) |
| 75 Years and over | 7 (6.9%) | 14 (17.7%) |
Technology Access in Hamilton
Computing Device Access in Hamilton
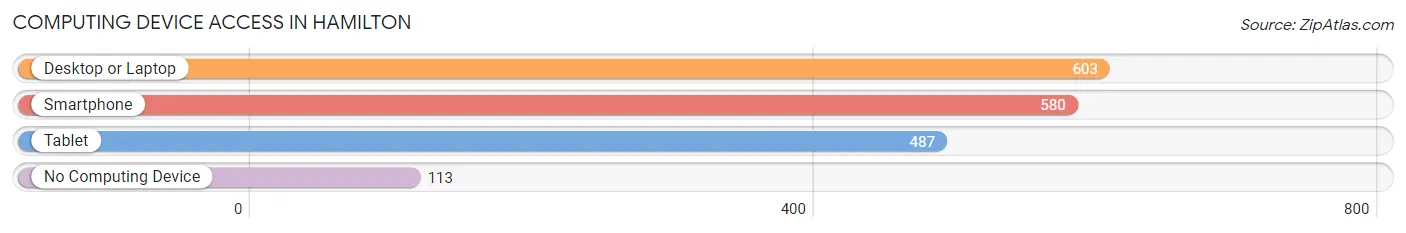
| Device Type | # Households | % Households |
| Desktop or Laptop | 603 | 76.4% |
| Smartphone | 580 | 73.5% |
| Tablet | 487 | 61.7% |
| No Computing Device | 113 | 14.3% |
| Total | 789 | 100.0% |
Internet Access in Hamilton
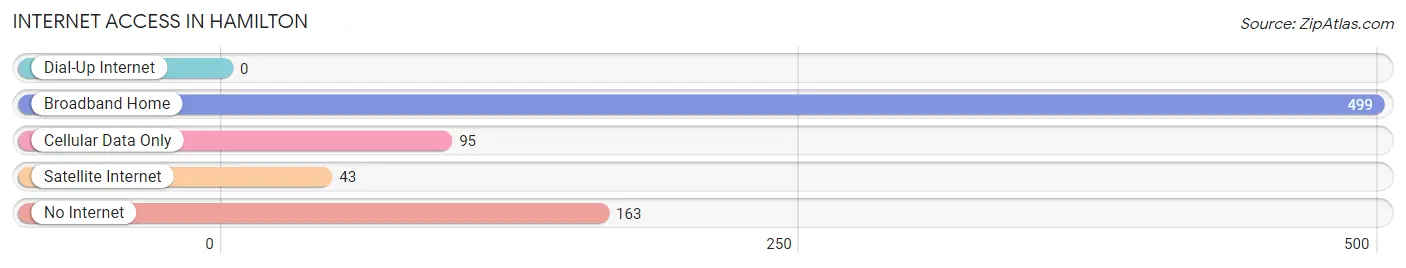
| Internet Type | # Households | % Households |
| Dial-Up Internet | 0 | 0.0% |
| Broadband Home | 499 | 63.2% |
| Cellular Data Only | 95 | 12.0% |
| Satellite Internet | 43 | 5.4% |
| No Internet | 163 | 20.7% |
| Total | 789 | 100.0% |
Hamilton Summary
Hamilton, New York is a small town located in Madison County, in the central part of the state. It is situated on the banks of the Chenango River, and is home to a population of approximately 4,500 people. The town is known for its rich history, beautiful scenery, and vibrant economy.
History
The area that is now Hamilton was first settled in 1795 by a group of settlers from Connecticut. The town was originally known as Paynes Corners, and was later renamed Hamilton in honor of Alexander Hamilton, the first Secretary of the Treasury. The town was officially incorporated in 1812.
In the early 19th century, Hamilton was a thriving agricultural community, with a variety of crops being grown in the area. The town was also home to several mills, which provided employment for many of the town’s residents.
In the late 19th century, Hamilton began to experience a period of industrialization. The town was home to several factories, including a paper mill, a tannery, and a woolen mill. These factories provided employment for many of the town’s residents, and helped to spur economic growth in the area.
Geography
Hamilton is located in the central part of New York State, in Madison County. The town is situated on the banks of the Chenango River, and is surrounded by rolling hills and lush forests. The town is located approximately 30 miles south of Syracuse, and is easily accessible by car or bus.
The town of Hamilton covers an area of approximately 4.5 square miles, and is home to a population of approximately 4,500 people. The town is served by several major highways, including Interstate 81 and US Route 20.
Economy
The economy of Hamilton is largely based on agriculture and manufacturing. The town is home to several farms, which produce a variety of crops, including corn, soybeans, and hay. The town is also home to several factories, which produce a variety of products, including paper, textiles, and furniture.
The town is also home to several small businesses, including restaurants, retail stores, and professional services. The town is also home to several educational institutions, including Colgate University and Hamilton College.
Demographics
As of the 2010 census, the population of Hamilton was 4,541. The town is predominantly white, with approximately 90% of the population identifying as such. The town is also home to a small African American population, as well as a small Hispanic population.
The median household income in Hamilton is approximately $45,000, and the median home value is approximately $150,000. The town is served by several public schools, as well as several private schools.
Hamilton is a small town with a rich history, beautiful scenery, and a vibrant economy. The town is home to a diverse population, and is a great place to live and work.
Common Questions
What is Per Capita Income in Hamilton?
Per Capita income in Hamilton is $23,503.
What is the Median Family Income in Hamilton?
Median Family Income in Hamilton is $145,417.
What is the Median Household income in Hamilton?
Median Household Income in Hamilton is $59,152.
What is Income or Wage Gap in Hamilton?
Income or Wage Gap in Hamilton is 37.3%.
Women in Hamilton earn 62.7 cents for every dollar earned by a man.
What is Inequality or Gini Index in Hamilton?
Inequality or Gini Index in Hamilton is 0.50.
What is the Total Population of Hamilton?
Total Population of Hamilton is 3,882.
What is the Total Male Population of Hamilton?
Total Male Population of Hamilton is 1,802.
What is the Total Female Population of Hamilton?
Total Female Population of Hamilton is 2,080.
What is the Ratio of Males per 100 Females in Hamilton?
There are 86.63 Males per 100 Females in Hamilton.
What is the Ratio of Females per 100 Males in Hamilton?
There are 115.43 Females per 100 Males in Hamilton.
What is the Median Population Age in Hamilton?
Median Population Age in Hamilton is 20.7 Years.
What is the Average Family Size in Hamilton
Average Family Size in Hamilton is 2.8 People.
What is the Average Household Size in Hamilton
Average Household Size in Hamilton is 1.9 People.
How Large is the Labor Force in Hamilton?
There are 1,524 People in the Labor Forcein in Hamilton.
What is the Percentage of People in the Labor Force in Hamilton?
41.7% of People are in the Labor Force in Hamilton.
What is the Unemployment Rate in Hamilton?
Unemployment Rate in Hamilton is 0.6%.