Greene, NY Map & Demographics
Greene Map
Greene Overview
$31,599
PER CAPITA INCOME
$74,464
AVG FAMILY INCOME
$54,167
AVG HOUSEHOLD INCOME
36.8%
WAGE / INCOME GAP [ % ]
63.2¢/ $1
WAGE / INCOME GAP [ $ ]
0.43
INEQUALITY / GINI INDEX
1,574
TOTAL POPULATION
713
MALE POPULATION
861
FEMALE POPULATION
82.81
MALES / 100 FEMALES
120.76
FEMALES / 100 MALES
38.9
MEDIAN AGE
2.8
AVG FAMILY SIZE
2.1
AVG HOUSEHOLD SIZE
765
LABOR FORCE [ PEOPLE ]
60.5%
PERCENT IN LABOR FORCE
7.1%
UNEMPLOYMENT RATE
Greene Zip Codes
Greene Area Codes
Income in Greene
Income Overview in Greene
Per Capita Income in Greene is $31,599, while median incomes of families and households are $74,464 and $54,167 respectively.
| Characteristic | Number | Measure |
| Per Capita Income | 1,574 | $31,599 |
| Median Family Income | 393 | $74,464 |
| Mean Family Income | 393 | $86,433 |
| Median Household Income | 748 | $54,167 |
| Mean Household Income | 748 | $65,803 |
| Income Deficit | 393 | $0 |
| Wage / Income Gap (%) | 1,574 | 36.82% |
| Wage / Income Gap ($) | 1,574 | 63.18¢ per $1 |
| Gini / Inequality Index | 1,574 | 0.43 |
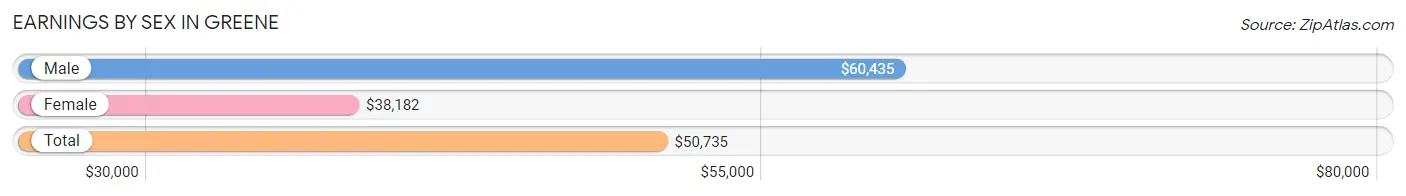
Earnings by Sex in Greene
Average Earnings in Greene are $50,735, $60,435 for men and $38,182 for women, a difference of 36.8%.
| Sex | Number | Average Earnings |
| Male | 368 (47.5%) | $60,435 |
| Female | 406 (52.4%) | $38,182 |
| Total | 774 (100.0%) | $50,735 |
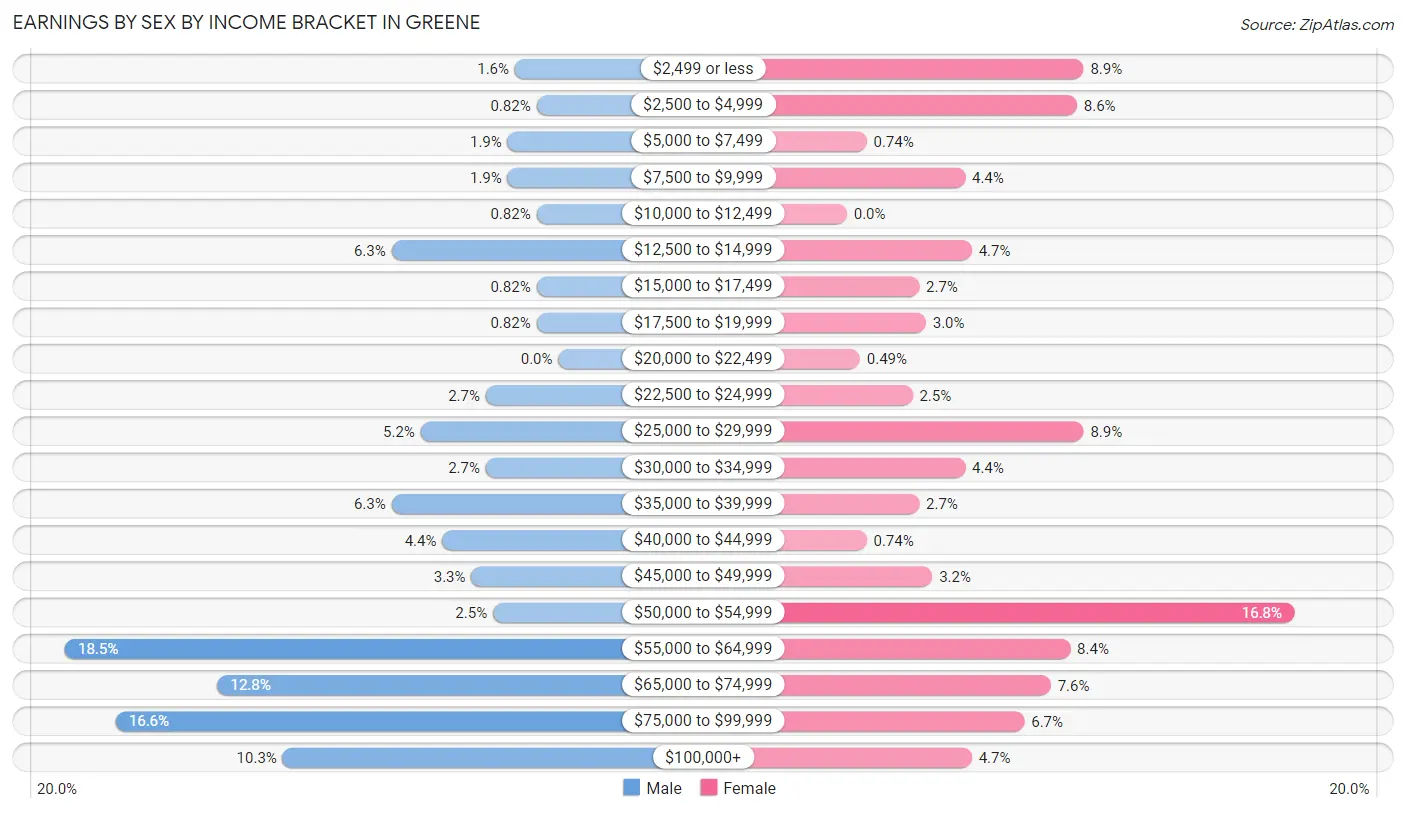
Earnings by Sex by Income Bracket in Greene
The most common earnings brackets in Greene are $55,000 to $64,999 for men (68 | 18.5%) and $50,000 to $54,999 for women (68 | 16.8%).
| Income | Male | Female |
| $2,499 or less | 6 (1.6%) | 36 (8.9%) |
| $2,500 to $4,999 | 3 (0.8%) | 35 (8.6%) |
| $5,000 to $7,499 | 7 (1.9%) | 3 (0.7%) |
| $7,500 to $9,999 | 7 (1.9%) | 18 (4.4%) |
| $10,000 to $12,499 | 3 (0.8%) | 0 (0.0%) |
| $12,500 to $14,999 | 23 (6.2%) | 19 (4.7%) |
| $15,000 to $17,499 | 3 (0.8%) | 11 (2.7%) |
| $17,500 to $19,999 | 3 (0.8%) | 12 (3.0%) |
| $20,000 to $22,499 | 0 (0.0%) | 2 (0.5%) |
| $22,500 to $24,999 | 10 (2.7%) | 10 (2.5%) |
| $25,000 to $29,999 | 19 (5.2%) | 36 (8.9%) |
| $30,000 to $34,999 | 10 (2.7%) | 18 (4.4%) |
| $35,000 to $39,999 | 23 (6.2%) | 11 (2.7%) |
| $40,000 to $44,999 | 16 (4.3%) | 3 (0.7%) |
| $45,000 to $49,999 | 12 (3.3%) | 13 (3.2%) |
| $50,000 to $54,999 | 9 (2.5%) | 68 (16.8%) |
| $55,000 to $64,999 | 68 (18.5%) | 34 (8.4%) |
| $65,000 to $74,999 | 47 (12.8%) | 31 (7.6%) |
| $75,000 to $99,999 | 61 (16.6%) | 27 (6.7%) |
| $100,000+ | 38 (10.3%) | 19 (4.7%) |
| Total | 368 (100.0%) | 406 (100.0%) |
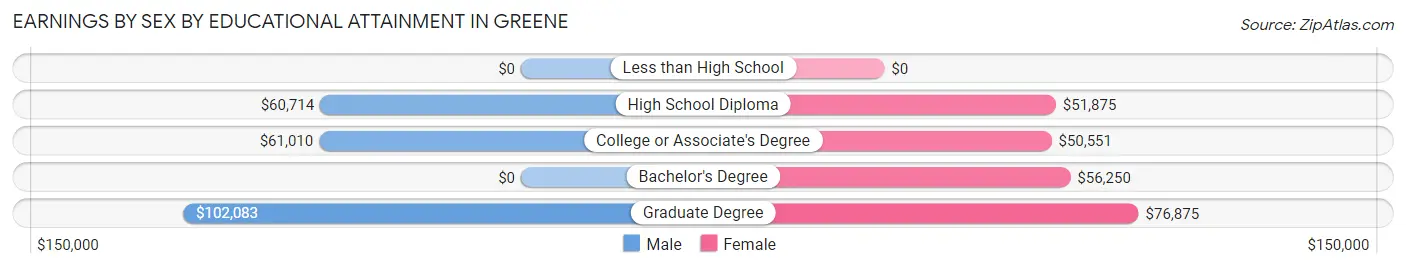
Earnings by Sex by Educational Attainment in Greene
Average earnings in Greene are $60,515 for men and $51,935 for women, a difference of 14.2%. Men with an educational attainment of graduate degree enjoy the highest average annual earnings of $102,083, while those with high school diploma education earn the least with $60,714. Women with an educational attainment of graduate degree earn the most with the average annual earnings of $76,875, while those with college or associate's degree education have the smallest earnings of $50,551.
| Educational Attainment | Male Income | Female Income |
| Less than High School | - | - |
| High School Diploma | $60,714 | $51,875 |
| College or Associate's Degree | $61,010 | $50,551 |
| Bachelor's Degree | - | - |
| Graduate Degree | $102,083 | $76,875 |
| Total | $60,515 | $51,935 |
Family Income in Greene
Family Income Brackets in Greene
According to the Greene family income data, there are 121 families falling into the $100,000 to $149,999 income range, which is the most common income bracket and makes up 30.8% of all families. Conversely, the $200,000+ income bracket is the least frequent group with only 12 families (3.0%) belonging to this category.
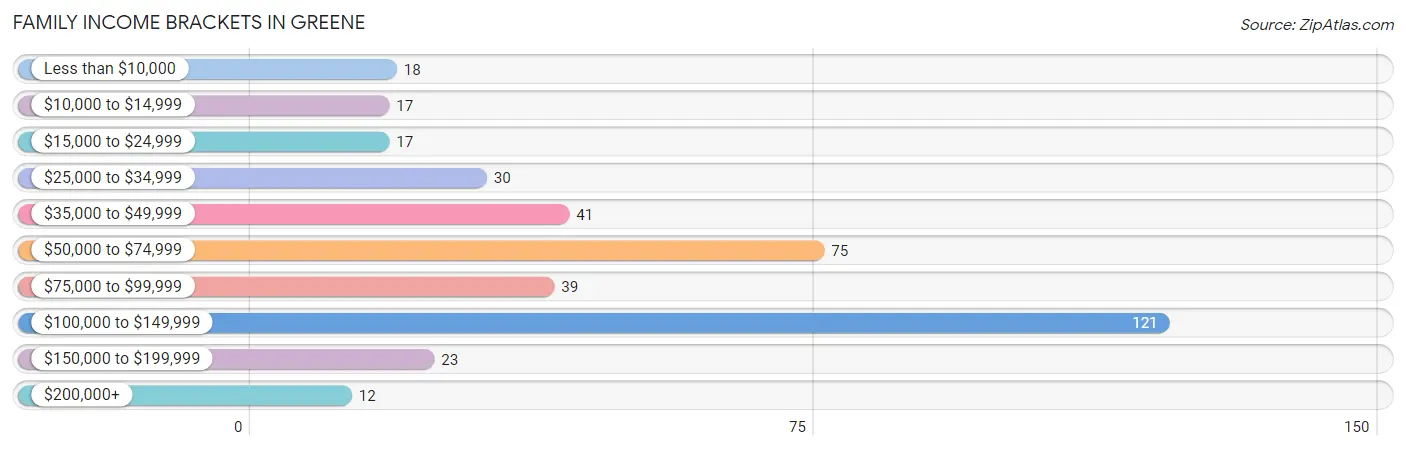
| Income Bracket | # Families | % Families |
| Less than $10,000 | 18 | 4.6% |
| $10,000 to $14,999 | 17 | 4.3% |
| $15,000 to $24,999 | 17 | 4.3% |
| $25,000 to $34,999 | 30 | 7.6% |
| $35,000 to $49,999 | 41 | 10.4% |
| $50,000 to $74,999 | 75 | 19.1% |
| $75,000 to $99,999 | 39 | 9.9% |
| $100,000 to $149,999 | 121 | 30.8% |
| $150,000 to $199,999 | 23 | 5.9% |
| $200,000+ | 12 | 3.1% |
Family Income by Famaliy Size in Greene
3-person families (115 | 29.3%) account for the highest median family income in Greene with $106,932 per family, while 3-person families (115 | 29.3%) have the highest median income of $35,644 per family member.
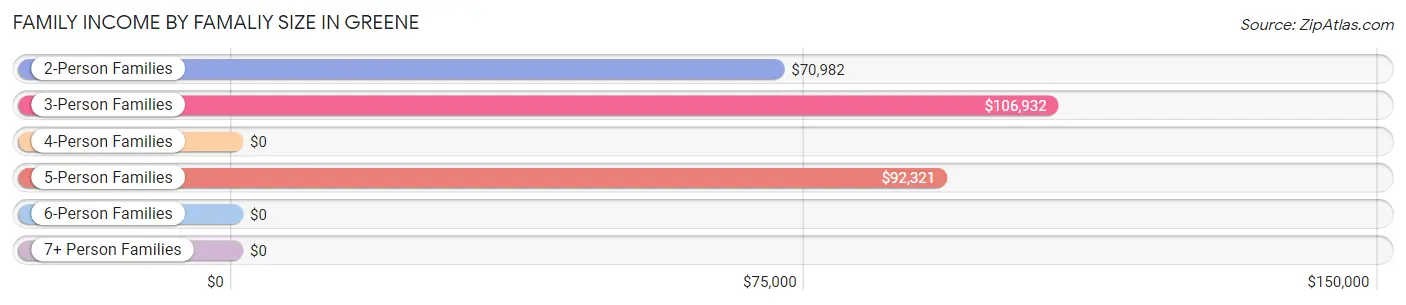
| Income Bracket | # Families | Median Income |
| 2-Person Families | 177 (45.0%) | $70,982 |
| 3-Person Families | 115 (29.3%) | $106,932 |
| 4-Person Families | 44 (11.2%) | $0 |
| 5-Person Families | 57 (14.5%) | $92,321 |
| 6-Person Families | 0 (0.0%) | $0 |
| 7+ Person Families | 0 (0.0%) | $0 |
| Total | 393 (100.0%) | $74,464 |
Family Income by Number of Earners in Greene
The median family income in Greene is $74,464, with families comprising 3+ earners (43) having the highest median family income of $124,712, while families with no earners (64) have the lowest median family income of $32,500, accounting for 10.9% and 16.3% of families, respectively.
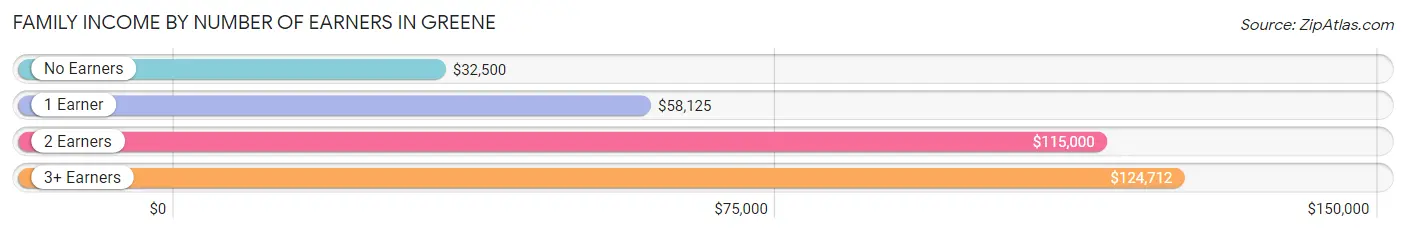
| Number of Earners | # Families | Median Income |
| No Earners | 64 (16.3%) | $32,500 |
| 1 Earner | 152 (38.7%) | $58,125 |
| 2 Earners | 134 (34.1%) | $115,000 |
| 3+ Earners | 43 (10.9%) | $124,712 |
| Total | 393 (100.0%) | $74,464 |
Household Income in Greene
Household Income Brackets in Greene
With 157 households falling in the category, the $50,000 to $74,999 income range is the most frequent in Greene, accounting for 21.0% of all households. In contrast, only 12 households (1.6%) fall into the $200,000+ income bracket, making it the least populous group.
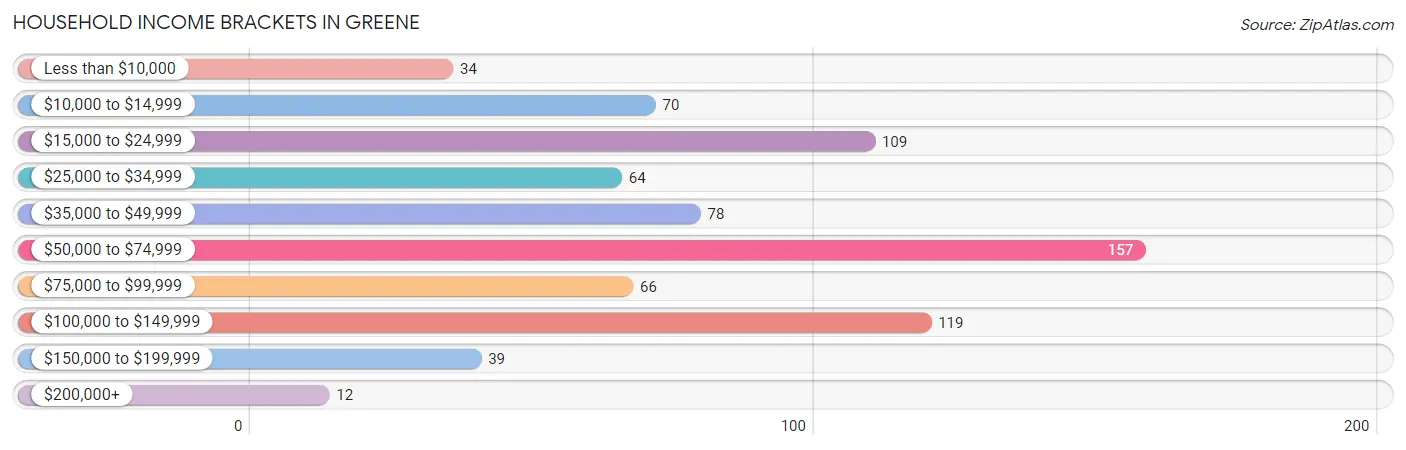
| Income Bracket | # Households | % Households |
| Less than $10,000 | 34 | 4.5% |
| $10,000 to $14,999 | 70 | 9.4% |
| $15,000 to $24,999 | 109 | 14.6% |
| $25,000 to $34,999 | 64 | 8.6% |
| $35,000 to $49,999 | 78 | 10.4% |
| $50,000 to $74,999 | 157 | 21.0% |
| $75,000 to $99,999 | 66 | 8.8% |
| $100,000 to $149,999 | 119 | 15.9% |
| $150,000 to $199,999 | 39 | 5.2% |
| $200,000+ | 12 | 1.6% |
Household Income by Householder Age in Greene
The median household income in Greene is $54,167, with the highest median household income of $69,583 found in the 45 to 64 years age bracket for the primary householder. A total of 252 households (33.7%) fall into this category. Meanwhile, the 65+ years age bracket for the primary householder has the lowest median household income of $24,792, with 261 households (34.9%) in this group.
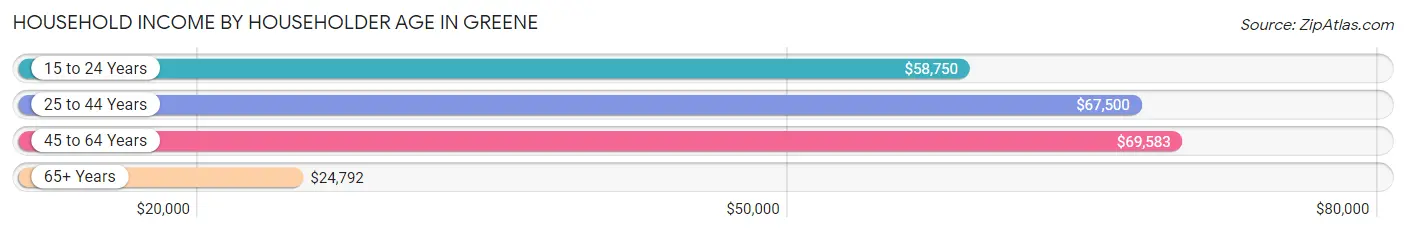
| Income Bracket | # Households | Median Income |
| 15 to 24 Years | 51 (6.8%) | $58,750 |
| 25 to 44 Years | 184 (24.6%) | $67,500 |
| 45 to 64 Years | 252 (33.7%) | $69,583 |
| 65+ Years | 261 (34.9%) | $24,792 |
| Total | 748 (100.0%) | $54,167 |
Poverty in Greene
Income Below Poverty by Sex and Age in Greene
With 14.3% poverty level for males and 14.7% for females among the residents of Greene, 5 year old males and 6 to 11 year old females are the most vulnerable to poverty, with 11 males (78.6%) and 15 females (44.1%) in their respective age groups living below the poverty level.
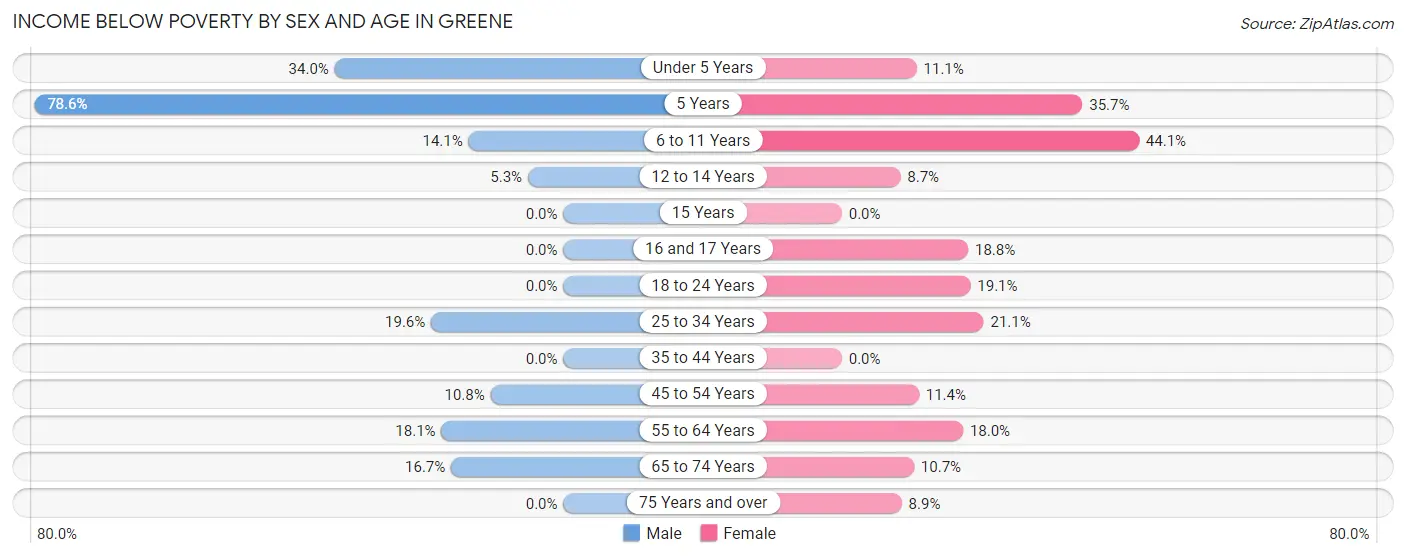
| Age Bracket | Male | Female |
| Under 5 Years | 18 (34.0%) | 4 (11.1%) |
| 5 Years | 11 (78.6%) | 10 (35.7%) |
| 6 to 11 Years | 10 (14.1%) | 15 (44.1%) |
| 12 to 14 Years | 2 (5.3%) | 2 (8.7%) |
| 15 Years | 0 (0.0%) | 0 (0.0%) |
| 16 and 17 Years | 0 (0.0%) | 9 (18.8%) |
| 18 to 24 Years | 0 (0.0%) | 21 (19.1%) |
| 25 to 34 Years | 22 (19.6%) | 12 (21.0%) |
| 35 to 44 Years | 0 (0.0%) | 0 (0.0%) |
| 45 to 54 Years | 4 (10.8%) | 8 (11.4%) |
| 55 to 64 Years | 23 (18.1%) | 25 (18.0%) |
| 65 to 74 Years | 12 (16.7%) | 9 (10.7%) |
| 75 Years and over | 0 (0.0%) | 12 (8.9%) |
| Total | 102 (14.3%) | 127 (14.7%) |
Income Above Poverty by Sex and Age in Greene
According to the poverty statistics in Greene, males aged 16 and 17 years and females aged 15 years are the age groups that are most secure financially, with 100.0% of males and 100.0% of females in these age groups living above the poverty line.
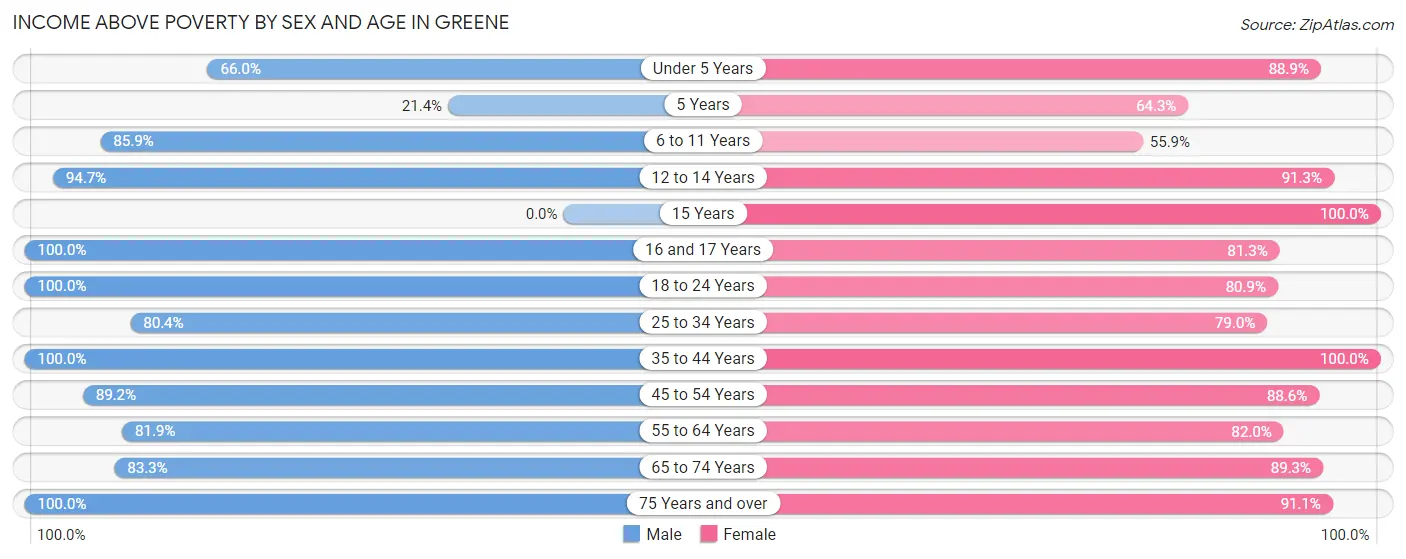
| Age Bracket | Male | Female |
| Under 5 Years | 35 (66.0%) | 32 (88.9%) |
| 5 Years | 3 (21.4%) | 18 (64.3%) |
| 6 to 11 Years | 61 (85.9%) | 19 (55.9%) |
| 12 to 14 Years | 36 (94.7%) | 21 (91.3%) |
| 15 Years | 0 (0.0%) | 12 (100.0%) |
| 16 and 17 Years | 3 (100.0%) | 39 (81.2%) |
| 18 to 24 Years | 32 (100.0%) | 89 (80.9%) |
| 25 to 34 Years | 90 (80.4%) | 45 (78.9%) |
| 35 to 44 Years | 104 (100.0%) | 85 (100.0%) |
| 45 to 54 Years | 33 (89.2%) | 62 (88.6%) |
| 55 to 64 Years | 104 (81.9%) | 114 (82.0%) |
| 65 to 74 Years | 60 (83.3%) | 75 (89.3%) |
| 75 Years and over | 50 (100.0%) | 123 (91.1%) |
| Total | 611 (85.7%) | 734 (85.3%) |
Income Below Poverty Among Married-Couple Families in Greene
The poverty statistics for married-couple families in Greene show that 2.2% or 6 of the total 270 families live below the poverty line. Families with no children have the highest poverty rate of 3.5%, comprising of 6 families. On the other hand, families with 1 or 2 children have the lowest poverty rate of 0.0%, which includes 0 families.
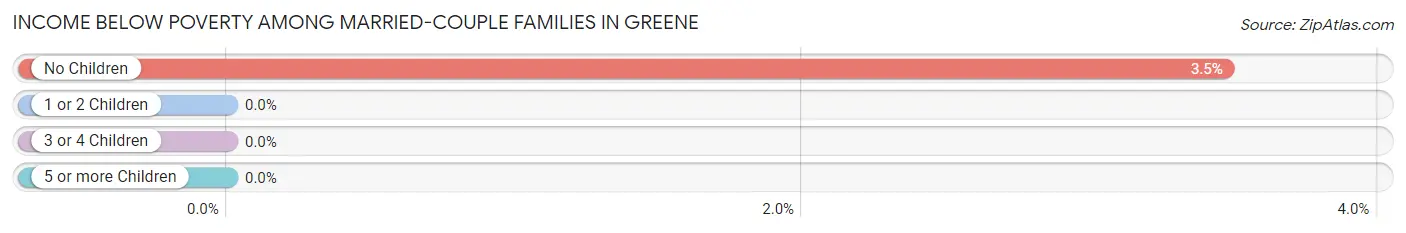
| Children | Above Poverty | Below Poverty |
| No Children | 167 (96.5%) | 6 (3.5%) |
| 1 or 2 Children | 43 (100.0%) | 0 (0.0%) |
| 3 or 4 Children | 54 (100.0%) | 0 (0.0%) |
| 5 or more Children | 0 (0.0%) | 0 (0.0%) |
| Total | 264 (97.8%) | 6 (2.2%) |
Income Below Poverty Among Single-Parent Households in Greene
According to the poverty data in Greene, 70.0% or 21 single-father households and 16.1% or 15 single-mother households are living below the poverty line. Among single-father households, those with 3 or 4 children have the highest poverty rate, with 10 households (76.9%) experiencing poverty. Likewise, among single-mother households, those with 3 or 4 children have the highest poverty rate, with 13 households (100.0%) falling below the poverty line.
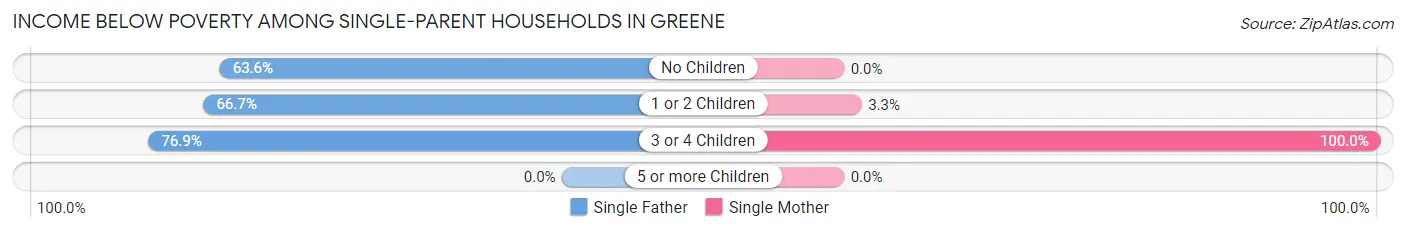
| Children | Single Father | Single Mother |
| No Children | 7 (63.6%) | 0 (0.0%) |
| 1 or 2 Children | 4 (66.7%) | 2 (3.3%) |
| 3 or 4 Children | 10 (76.9%) | 13 (100.0%) |
| 5 or more Children | 0 (0.0%) | 0 (0.0%) |
| Total | 21 (70.0%) | 15 (16.1%) |
Income Below Poverty Among Married-Couple vs Single-Parent Households in Greene
The poverty data for Greene shows that 6 of the married-couple family households (2.2%) and 36 of the single-parent households (29.3%) are living below the poverty level. Within the married-couple family households, those with no children have the highest poverty rate, with 6 households (3.5%) falling below the poverty line. Among the single-parent households, those with 3 or 4 children have the highest poverty rate, with 23 household (88.5%) living below poverty.
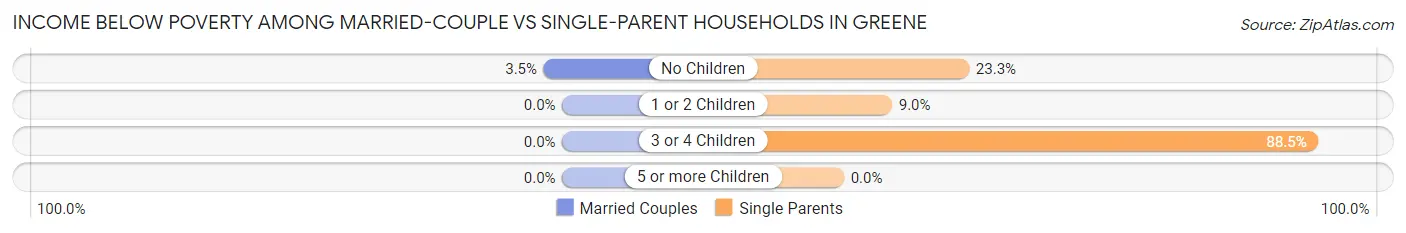
| Children | Married-Couple Families | Single-Parent Households |
| No Children | 6 (3.5%) | 7 (23.3%) |
| 1 or 2 Children | 0 (0.0%) | 6 (9.0%) |
| 3 or 4 Children | 0 (0.0%) | 23 (88.5%) |
| 5 or more Children | 0 (0.0%) | 0 (0.0%) |
| Total | 6 (2.2%) | 36 (29.3%) |
Race in Greene
The most populous races in Greene are White / Caucasian (1,519 | 96.5%), Hispanic or Latino (36 | 2.3%), and Two or more Races (28 | 1.8%).
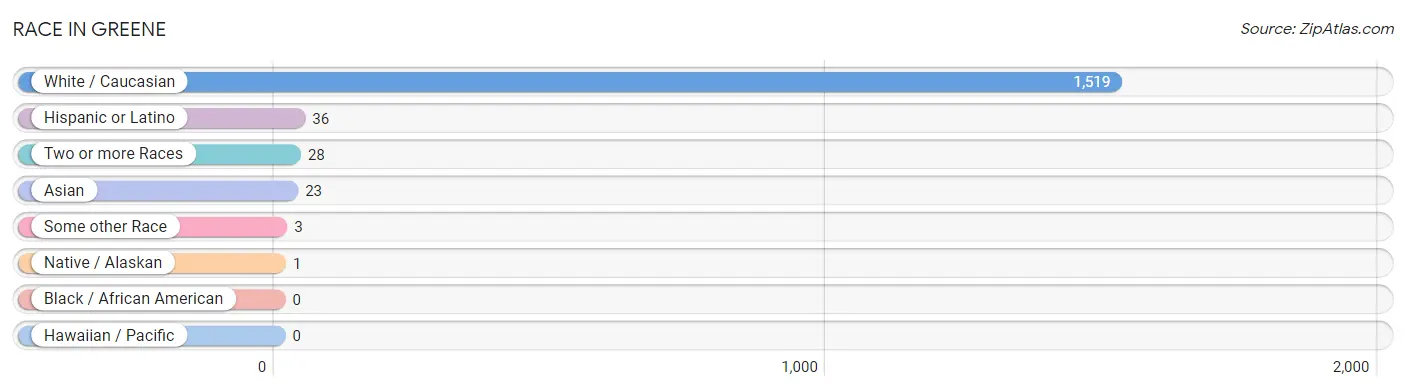
| Race | # Population | % Population |
| Asian | 23 | 1.5% |
| Black / African American | 0 | 0.0% |
| Hawaiian / Pacific | 0 | 0.0% |
| Hispanic or Latino | 36 | 2.3% |
| Native / Alaskan | 1 | 0.1% |
| White / Caucasian | 1,519 | 96.5% |
| Two or more Races | 28 | 1.8% |
| Some other Race | 3 | 0.2% |
| Total | 1,574 | 100.0% |
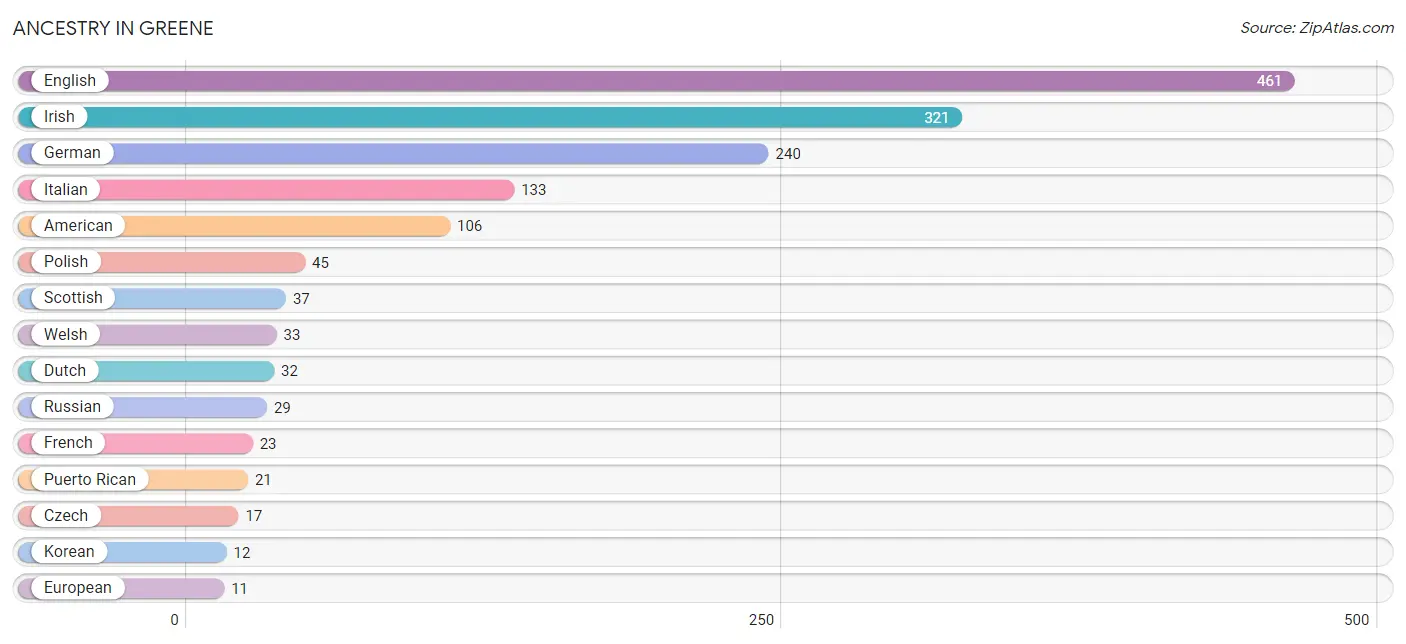
Ancestry in Greene
The most populous ancestries reported in Greene are English (461 | 29.3%), Irish (321 | 20.4%), German (240 | 15.2%), Italian (133 | 8.5%), and American (106 | 6.7%), together accounting for 80.1% of all Greene residents.
| Ancestry | # Population | % Population |
| American | 106 | 6.7% |
| Armenian | 6 | 0.4% |
| Bhutanese | 5 | 0.3% |
| British | 2 | 0.1% |
| Canadian | 2 | 0.1% |
| Colombian | 10 | 0.6% |
| Czech | 17 | 1.1% |
| Danish | 6 | 0.4% |
| Dutch | 32 | 2.0% |
| English | 461 | 29.3% |
| European | 11 | 0.7% |
| Filipino | 1 | 0.1% |
| French | 23 | 1.5% |
| French Canadian | 8 | 0.5% |
| German | 240 | 15.2% |
| Greek | 4 | 0.3% |
| Hungarian | 2 | 0.1% |
| Indian (Asian) | 6 | 0.4% |
| Irish | 321 | 20.4% |
| Italian | 133 | 8.5% |
| Korean | 12 | 0.8% |
| Mexican | 2 | 0.1% |
| Norwegian | 4 | 0.3% |
| Polish | 45 | 2.9% |
| Puerto Rican | 21 | 1.3% |
| Russian | 29 | 1.8% |
| Scotch-Irish | 4 | 0.3% |
| Scottish | 37 | 2.4% |
| Sioux | 1 | 0.1% |
| South American | 10 | 0.6% |
| Swedish | 4 | 0.3% |
| Swiss | 3 | 0.2% |
| Ukrainian | 10 | 0.6% |
| Welsh | 33 | 2.1% | View All 34 Rows |
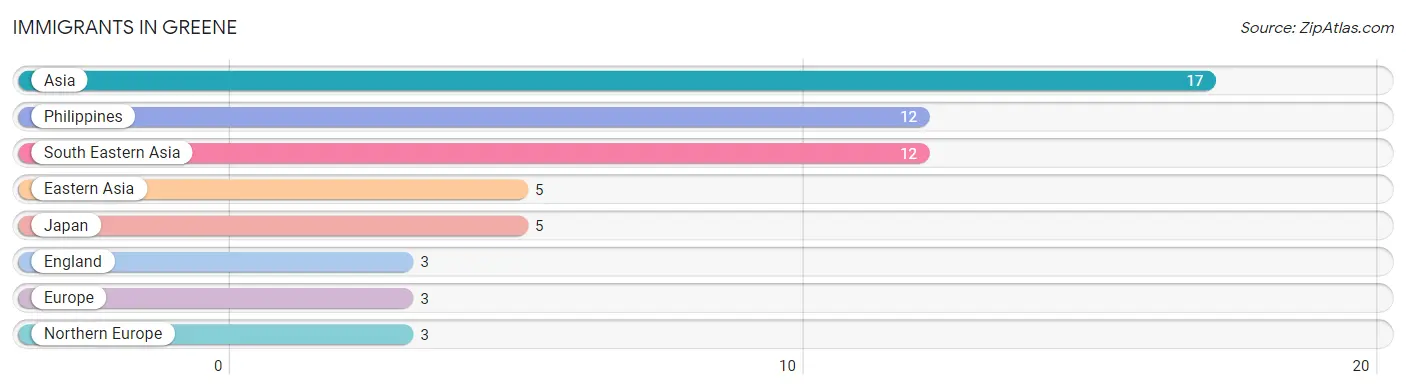
Immigrants in Greene
The most numerous immigrant groups reported in Greene came from Asia (17 | 1.1%), Philippines (12 | 0.8%), South Eastern Asia (12 | 0.8%), Eastern Asia (5 | 0.3%), and Japan (5 | 0.3%), together accounting for 3.2% of all Greene residents.
| Immigration Origin | # Population | % Population |
| Asia | 17 | 1.1% |
| Eastern Asia | 5 | 0.3% |
| England | 3 | 0.2% |
| Europe | 3 | 0.2% |
| Japan | 5 | 0.3% |
| Northern Europe | 3 | 0.2% |
| Philippines | 12 | 0.8% |
| South Eastern Asia | 12 | 0.8% | View All 8 Rows |
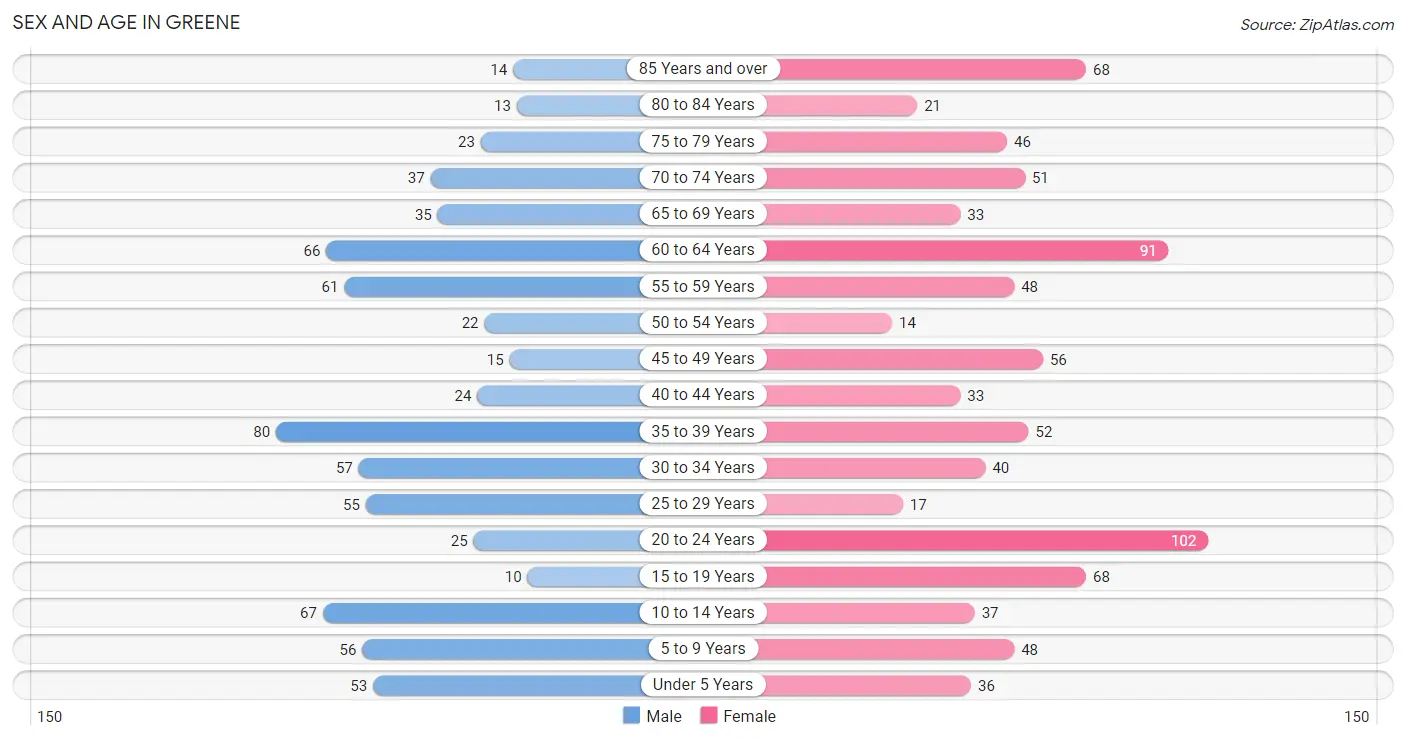
Sex and Age in Greene
Sex and Age in Greene
The most populous age groups in Greene are 35 to 39 Years (80 | 11.2%) for men and 20 to 24 Years (102 | 11.8%) for women.
| Age Bracket | Male | Female |
| Under 5 Years | 53 (7.4%) | 36 (4.2%) |
| 5 to 9 Years | 56 (7.9%) | 48 (5.6%) |
| 10 to 14 Years | 67 (9.4%) | 37 (4.3%) |
| 15 to 19 Years | 10 (1.4%) | 68 (7.9%) |
| 20 to 24 Years | 25 (3.5%) | 102 (11.8%) |
| 25 to 29 Years | 55 (7.7%) | 17 (2.0%) |
| 30 to 34 Years | 57 (8.0%) | 40 (4.6%) |
| 35 to 39 Years | 80 (11.2%) | 52 (6.0%) |
| 40 to 44 Years | 24 (3.4%) | 33 (3.8%) |
| 45 to 49 Years | 15 (2.1%) | 56 (6.5%) |
| 50 to 54 Years | 22 (3.1%) | 14 (1.6%) |
| 55 to 59 Years | 61 (8.6%) | 48 (5.6%) |
| 60 to 64 Years | 66 (9.3%) | 91 (10.6%) |
| 65 to 69 Years | 35 (4.9%) | 33 (3.8%) |
| 70 to 74 Years | 37 (5.2%) | 51 (5.9%) |
| 75 to 79 Years | 23 (3.2%) | 46 (5.3%) |
| 80 to 84 Years | 13 (1.8%) | 21 (2.4%) |
| 85 Years and over | 14 (2.0%) | 68 (7.9%) |
| Total | 713 (100.0%) | 861 (100.0%) |
Families and Households in Greene
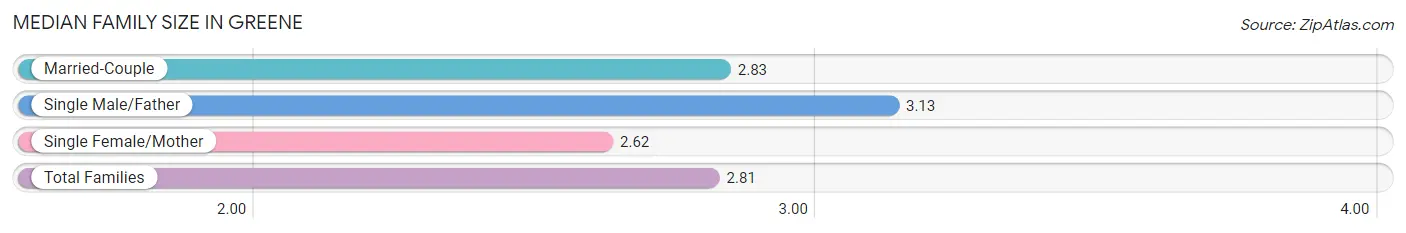
Median Family Size in Greene
The median family size in Greene is 2.81 persons per family, with single male/father families (30 | 7.6%) accounting for the largest median family size of 3.13 persons per family. On the other hand, single female/mother families (93 | 23.7%) represent the smallest median family size with 2.62 persons per family.
| Family Type | # Families | Family Size |
| Married-Couple | 270 (68.7%) | 2.83 |
| Single Male/Father | 30 (7.6%) | 3.13 |
| Single Female/Mother | 93 (23.7%) | 2.62 |
| Total Families | 393 (100.0%) | 2.81 |
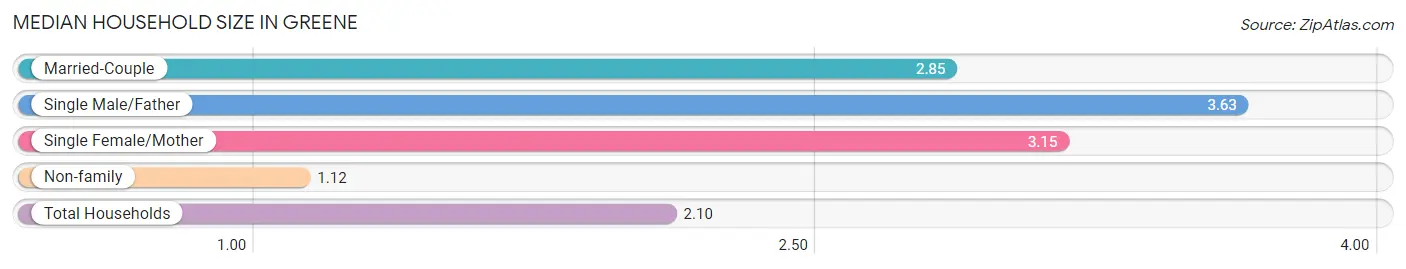
Median Household Size in Greene
The median household size in Greene is 2.10 persons per household, with single male/father households (30 | 4.0%) accounting for the largest median household size of 3.63 persons per household. non-family households (355 | 47.5%) represent the smallest median household size with 1.12 persons per household.
| Household Type | # Households | Household Size |
| Married-Couple | 270 (36.1%) | 2.85 |
| Single Male/Father | 30 (4.0%) | 3.63 |
| Single Female/Mother | 93 (12.4%) | 3.15 |
| Non-family | 355 (47.5%) | 1.12 |
| Total Households | 748 (100.0%) | 2.10 |
Household Size by Marriage Status in Greene
Out of a total of 748 households in Greene, 393 (52.5%) are family households, while 355 (47.5%) are nonfamily households. The most numerous type of family households are 2-person households, comprising 170, and the most common type of nonfamily households are 1-person households, comprising 319.
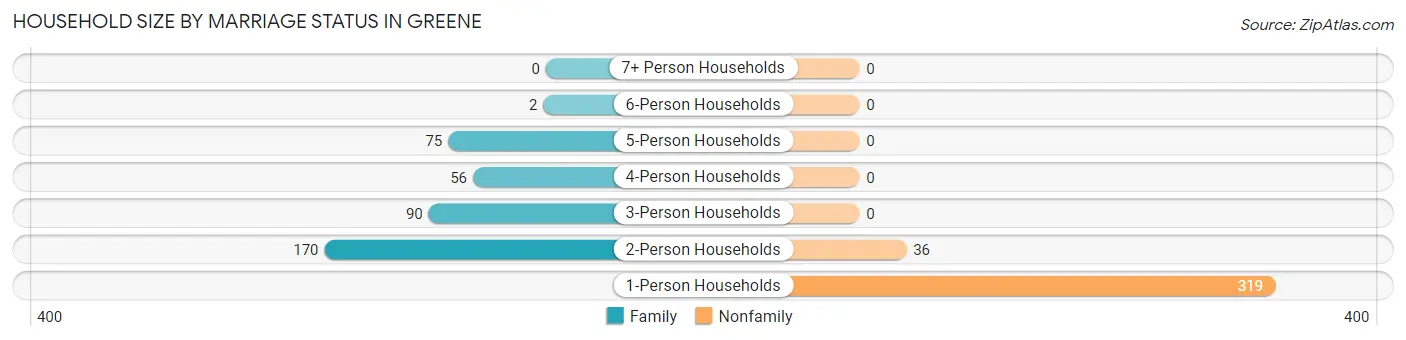
| Household Size | Family Households | Nonfamily Households |
| 1-Person Households | - | 319 (42.6%) |
| 2-Person Households | 170 (22.7%) | 36 (4.8%) |
| 3-Person Households | 90 (12.0%) | 0 (0.0%) |
| 4-Person Households | 56 (7.5%) | 0 (0.0%) |
| 5-Person Households | 75 (10.0%) | 0 (0.0%) |
| 6-Person Households | 2 (0.3%) | 0 (0.0%) |
| 7+ Person Households | 0 (0.0%) | 0 (0.0%) |
| Total | 393 (52.5%) | 355 (47.5%) |
Female Fertility in Greene
Fertility by Age in Greene
Average fertility rate in Greene is 104.0 births per 1,000 women. Women in the age bracket of 15 to 19 years have the highest fertility rate with 132.0 births per 1,000 women. Women in the age bracket of 20 to 34 years acount for 51.3% of all women with births.
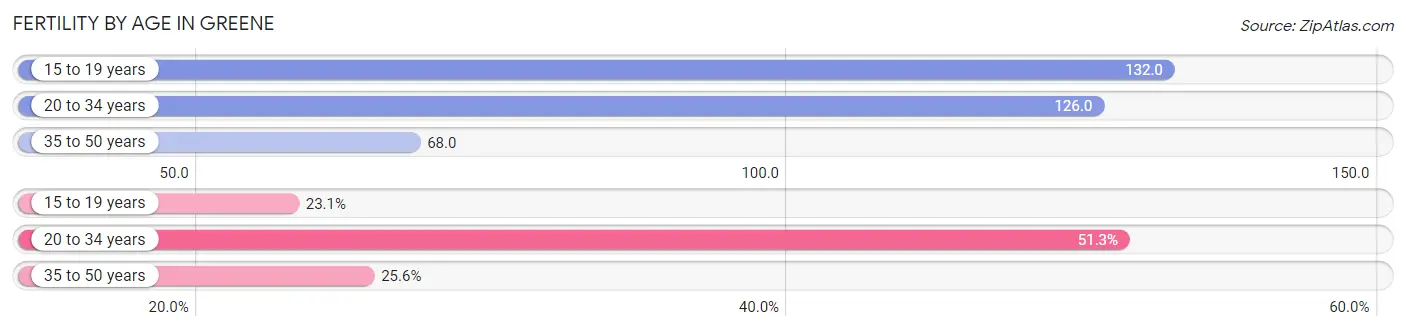
| Age Bracket | Women with Births | Births / 1,000 Women |
| 15 to 19 years | 9 (23.1%) | 132.0 |
| 20 to 34 years | 20 (51.3%) | 126.0 |
| 35 to 50 years | 10 (25.6%) | 68.0 |
| Total | 39 (100.0%) | 104.0 |
Fertility by Age by Marriage Status in Greene
33.3% of women with births (39) in Greene are married. The highest percentage of unmarried women with births falls into 15 to 19 years age bracket with 100.0% of them unmarried at the time of birth, while the lowest percentage of unmarried women with births belong to 35 to 50 years age bracket with 0.0% of them unmarried.
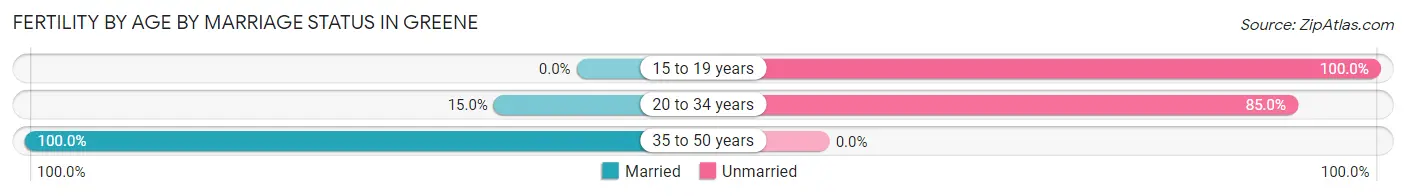
| Age Bracket | Married | Unmarried |
| 15 to 19 years | 0 (0.0%) | 9 (100.0%) |
| 20 to 34 years | 3 (15.0%) | 17 (85.0%) |
| 35 to 50 years | 10 (100.0%) | 0 (0.0%) |
| Total | 13 (33.3%) | 26 (66.7%) |
Fertility by Education in Greene
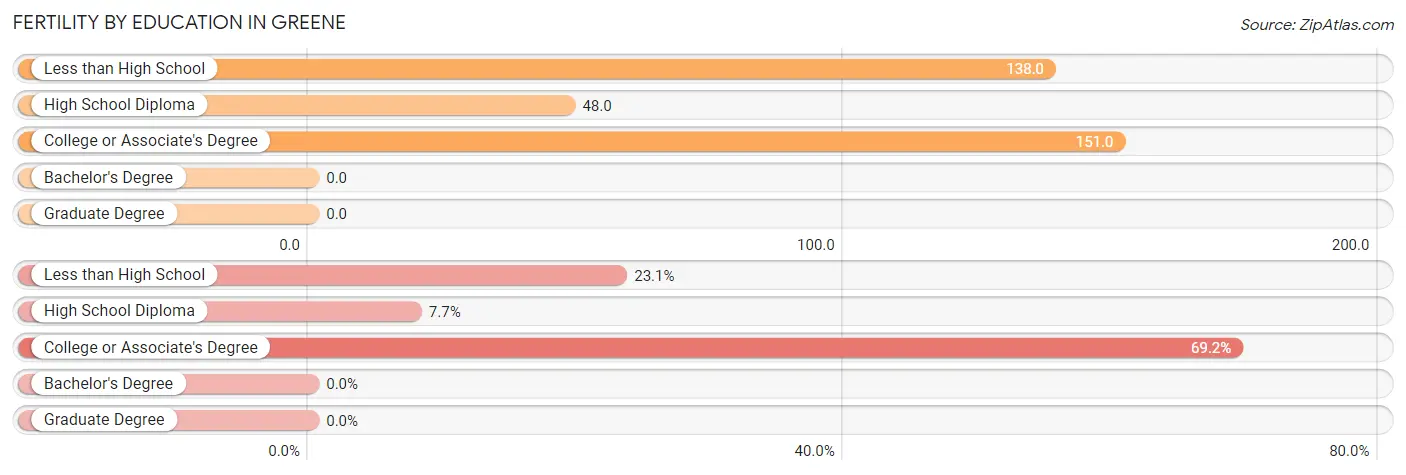
| Educational Attainment | Women with Births | Births / 1,000 Women |
| Less than High School | 9 (23.1%) | 138.0 |
| High School Diploma | 3 (7.7%) | 48.0 |
| College or Associate's Degree | 27 (69.2%) | 151.0 |
| Bachelor's Degree | 0 (0.0%) | 0.0 |
| Graduate Degree | 0 (0.0%) | 0.0 |
| Total | 39 (100.0%) | 104.0 |
Fertility by Education by Marriage Status in Greene
66.7% of women with births in Greene are unmarried. Women with the educational attainment of high school diploma are most likely to be married with 100.0% of them married at childbirth, while women with the educational attainment of less than high school are least likely to be married with 100.0% of them unmarried at childbirth.
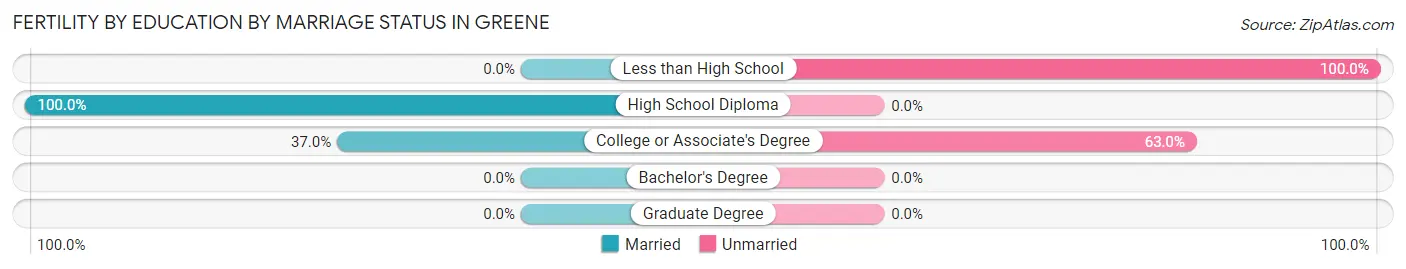
| Educational Attainment | Married | Unmarried |
| Less than High School | 0 (0.0%) | 9 (100.0%) |
| High School Diploma | 3 (100.0%) | 0 (0.0%) |
| College or Associate's Degree | 10 (37.0%) | 17 (63.0%) |
| Bachelor's Degree | 0 (0.0%) | 0 (0.0%) |
| Graduate Degree | 0 (0.0%) | 0 (0.0%) |
| Total | 13 (33.3%) | 26 (66.7%) |
Employment Characteristics in Greene
Employment by Class of Employer in Greene
Among the 689 employed individuals in Greene, private company employees (404 | 58.6%), not-for-profit organizations (80 | 11.6%), and local government employees (80 | 11.6%) make up the most common classes of employment.
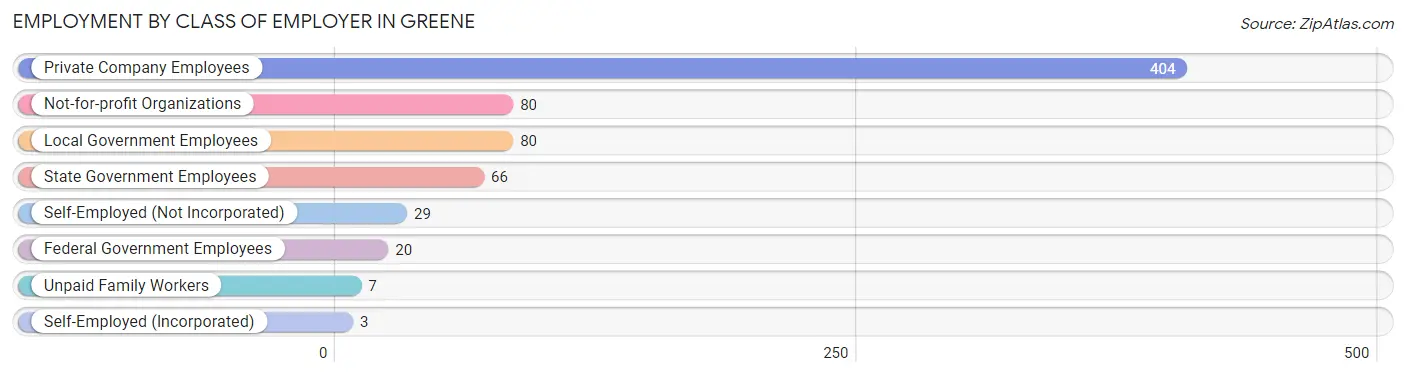
| Employer Class | # Employees | % Employees |
| Private Company Employees | 404 | 58.6% |
| Self-Employed (Incorporated) | 3 | 0.4% |
| Self-Employed (Not Incorporated) | 29 | 4.2% |
| Not-for-profit Organizations | 80 | 11.6% |
| Local Government Employees | 80 | 11.6% |
| State Government Employees | 66 | 9.6% |
| Federal Government Employees | 20 | 2.9% |
| Unpaid Family Workers | 7 | 1.0% |
| Total | 689 | 100.0% |
Employment Status by Age in Greene
According to the labor force statistics for Greene, out of the total population over 16 years of age (1,265), 60.5% or 765 individuals are in the labor force, with 7.1% or 54 of them unemployed. The age group with the highest labor force participation rate is 30 to 34 years, with 97.9% or 95 individuals in the labor force. Within the labor force, the 20 to 24 years age range has the highest percentage of unemployed individuals, with 15.7% or 18 of them being unemployed.
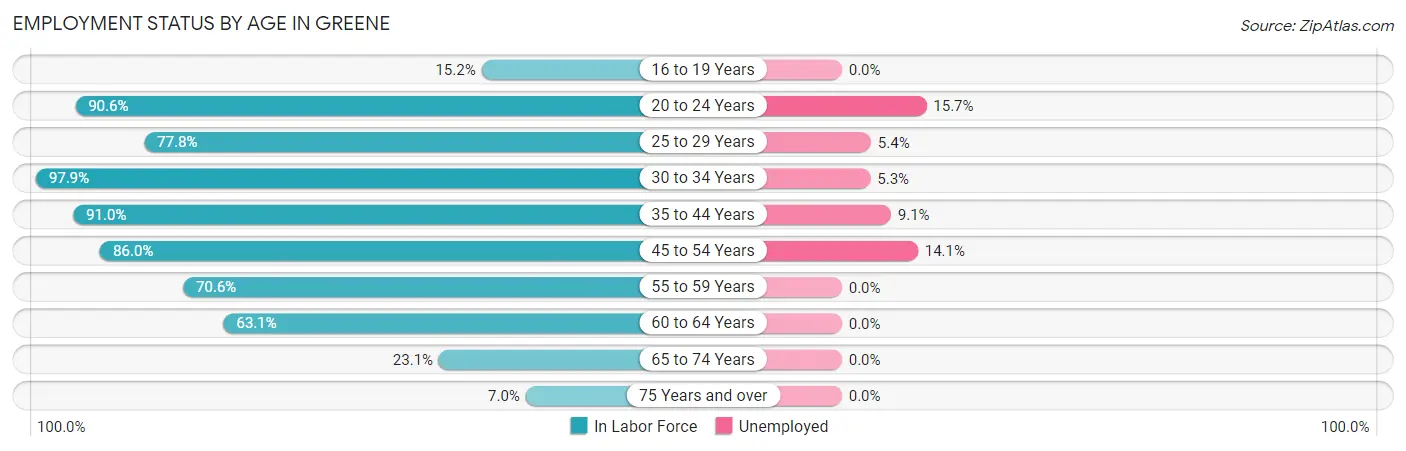
| Age Bracket | In Labor Force | Unemployed |
| 16 to 19 Years | 10 (15.2%) | 0 (0.0%) |
| 20 to 24 Years | 115 (90.6%) | 18 (15.7%) |
| 25 to 29 Years | 56 (77.8%) | 3 (5.4%) |
| 30 to 34 Years | 95 (97.9%) | 5 (5.3%) |
| 35 to 44 Years | 172 (91.0%) | 16 (9.1%) |
| 45 to 54 Years | 92 (86.0%) | 13 (14.1%) |
| 55 to 59 Years | 77 (70.6%) | 0 (0.0%) |
| 60 to 64 Years | 99 (63.1%) | 0 (0.0%) |
| 65 to 74 Years | 36 (23.1%) | 0 (0.0%) |
| 75 Years and over | 13 (7.0%) | 0 (0.0%) |
| Total | 765 (60.5%) | 54 (7.1%) |
Employment Status by Educational Attainment in Greene
According to labor force statistics for Greene, 80.8% of individuals (591) out of the total population between 25 and 64 years of age (731) are in the labor force, with 6.2% or 37 of them being unemployed. The group with the highest labor force participation rate are those with the educational attainment of bachelor's degree or higher, with 93.4% or 155 individuals in the labor force. Within the labor force, individuals with college / associate degree education have the highest percentage of unemployment, with 8.3% or 24 of them being unemployed.
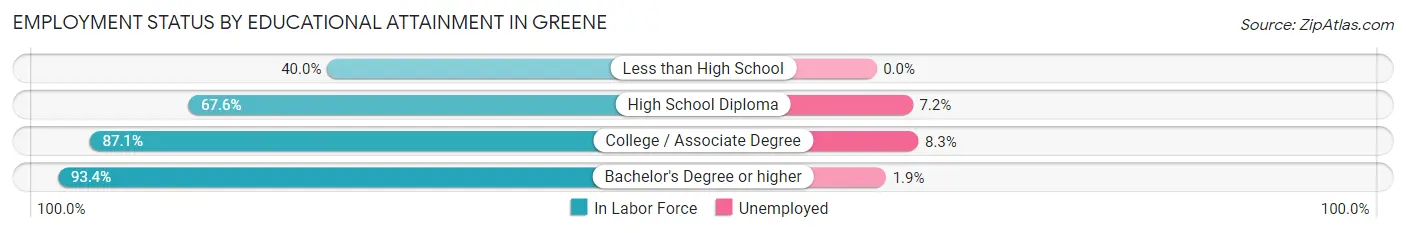
| Educational Attainment | In Labor Force | Unemployed |
| Less than High School | 14 (40.0%) | 0 (0.0%) |
| High School Diploma | 138 (67.6%) | 15 (7.2%) |
| College / Associate Degree | 284 (87.1%) | 27 (8.3%) |
| Bachelor's Degree or higher | 155 (93.4%) | 3 (1.9%) |
| Total | 591 (80.8%) | 45 (6.2%) |
Employment Occupations by Sex in Greene
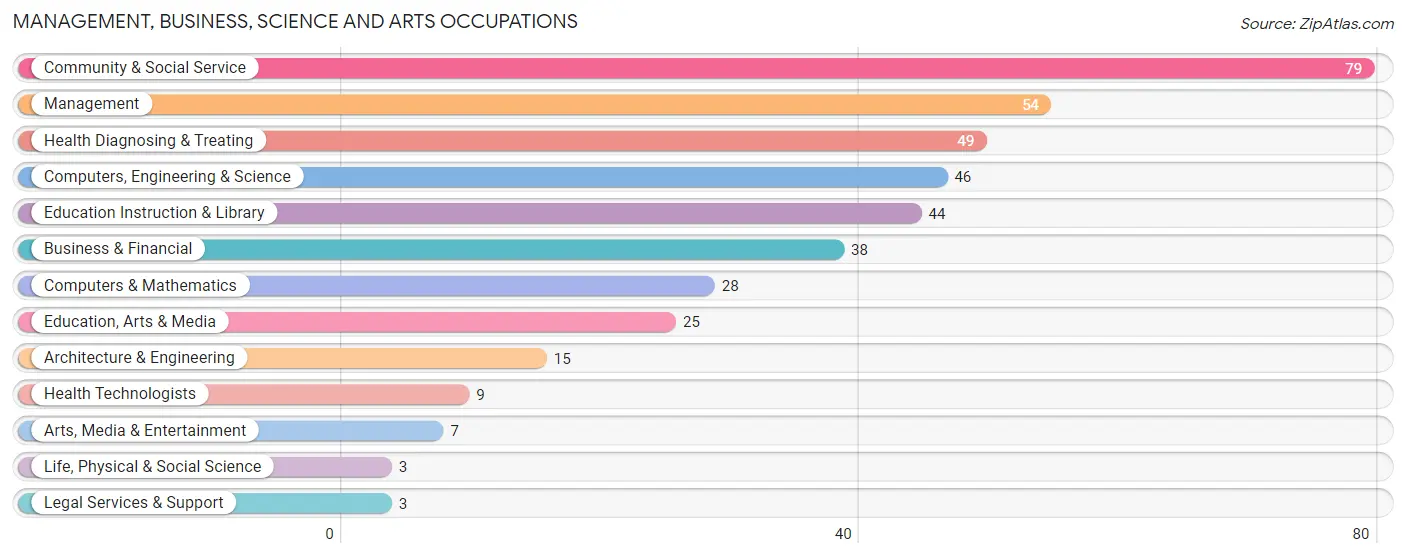
Management, Business, Science and Arts Occupations
The most common Management, Business, Science and Arts occupations in Greene are Community & Social Service (79 | 11.2%), Management (54 | 7.7%), Health Diagnosing & Treating (49 | 7.0%), Computers, Engineering & Science (46 | 6.5%), and Education Instruction & Library (44 | 6.2%).
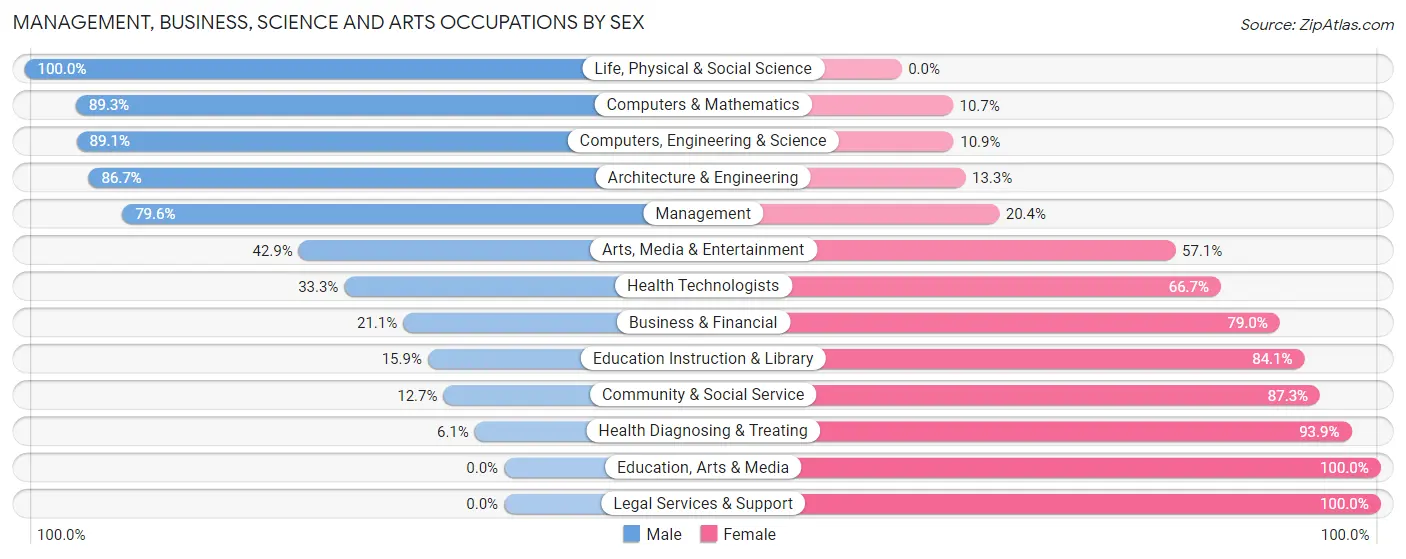
Management, Business, Science and Arts Occupations by Sex
Within the Management, Business, Science and Arts occupations in Greene, the most male-oriented occupations are Life, Physical & Social Science (100.0%), Computers & Mathematics (89.3%), and Computers, Engineering & Science (89.1%), while the most female-oriented occupations are Education, Arts & Media (100.0%), Legal Services & Support (100.0%), and Health Diagnosing & Treating (93.9%).
| Occupation | Male | Female |
| Management | 43 (79.6%) | 11 (20.4%) |
| Business & Financial | 8 (21.0%) | 30 (78.9%) |
| Computers, Engineering & Science | 41 (89.1%) | 5 (10.9%) |
| Computers & Mathematics | 25 (89.3%) | 3 (10.7%) |
| Architecture & Engineering | 13 (86.7%) | 2 (13.3%) |
| Life, Physical & Social Science | 3 (100.0%) | 0 (0.0%) |
| Community & Social Service | 10 (12.7%) | 69 (87.3%) |
| Education, Arts & Media | 0 (0.0%) | 25 (100.0%) |
| Legal Services & Support | 0 (0.0%) | 3 (100.0%) |
| Education Instruction & Library | 7 (15.9%) | 37 (84.1%) |
| Arts, Media & Entertainment | 3 (42.9%) | 4 (57.1%) |
| Health Diagnosing & Treating | 3 (6.1%) | 46 (93.9%) |
| Health Technologists | 3 (33.3%) | 6 (66.7%) |
| Total (Category) | 105 (39.5%) | 161 (60.5%) |
| Total (Overall) | 352 (50.0%) | 352 (50.0%) |
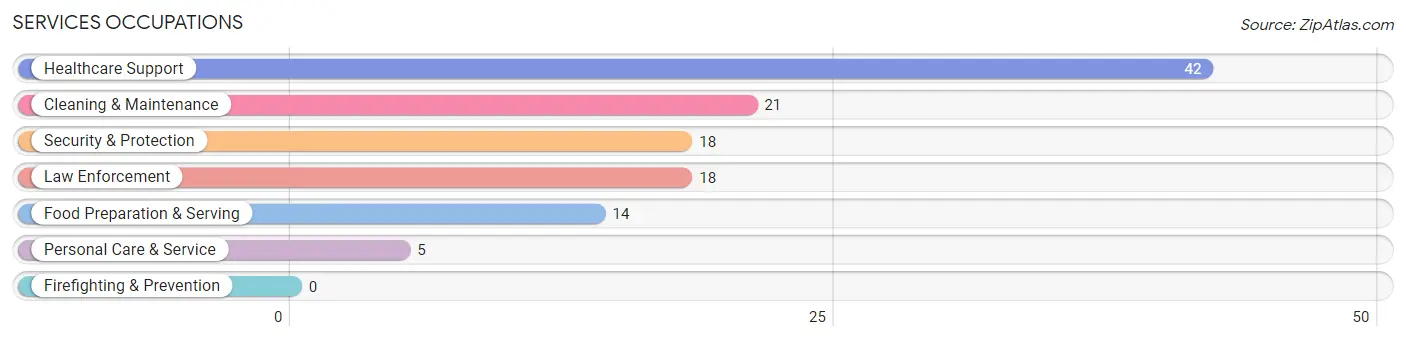
Services Occupations
The most common Services occupations in Greene are Healthcare Support (42 | 6.0%), Cleaning & Maintenance (21 | 3.0%), Security & Protection (18 | 2.6%), Law Enforcement (18 | 2.6%), and Food Preparation & Serving (14 | 2.0%).
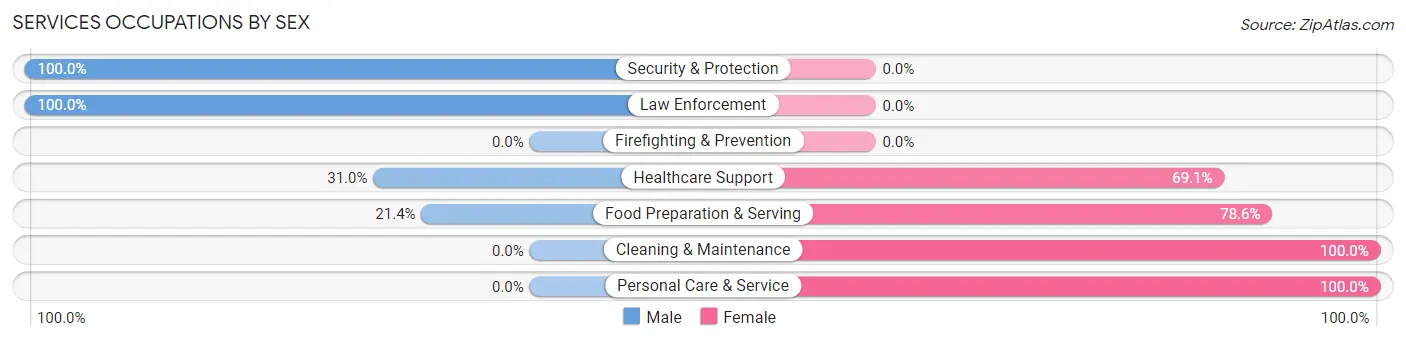
Services Occupations by Sex
Within the Services occupations in Greene, the most male-oriented occupations are Security & Protection (100.0%), Law Enforcement (100.0%), and Healthcare Support (30.9%), while the most female-oriented occupations are Cleaning & Maintenance (100.0%), Personal Care & Service (100.0%), and Food Preparation & Serving (78.6%).
| Occupation | Male | Female |
| Healthcare Support | 13 (30.9%) | 29 (69.1%) |
| Security & Protection | 18 (100.0%) | 0 (0.0%) |
| Firefighting & Prevention | 0 (0.0%) | 0 (0.0%) |
| Law Enforcement | 18 (100.0%) | 0 (0.0%) |
| Food Preparation & Serving | 3 (21.4%) | 11 (78.6%) |
| Cleaning & Maintenance | 0 (0.0%) | 21 (100.0%) |
| Personal Care & Service | 0 (0.0%) | 5 (100.0%) |
| Total (Category) | 34 (34.0%) | 66 (66.0%) |
| Total (Overall) | 352 (50.0%) | 352 (50.0%) |
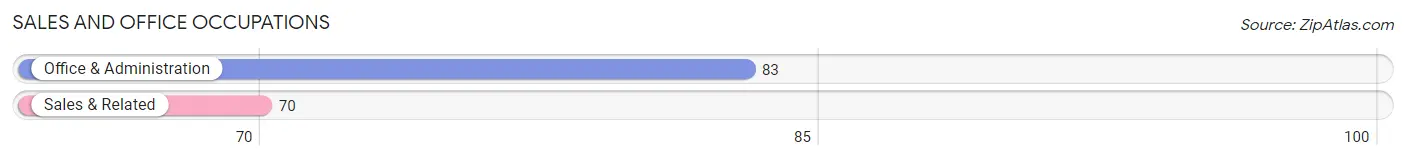
Sales and Office Occupations
The most common Sales and Office occupations in Greene are Office & Administration (83 | 11.8%), and Sales & Related (70 | 9.9%).
Sales and Office Occupations by Sex
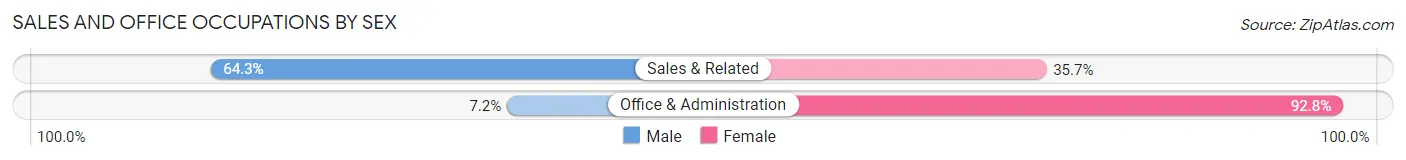
| Occupation | Male | Female |
| Sales & Related | 45 (64.3%) | 25 (35.7%) |
| Office & Administration | 6 (7.2%) | 77 (92.8%) |
| Total (Category) | 51 (33.3%) | 102 (66.7%) |
| Total (Overall) | 352 (50.0%) | 352 (50.0%) |
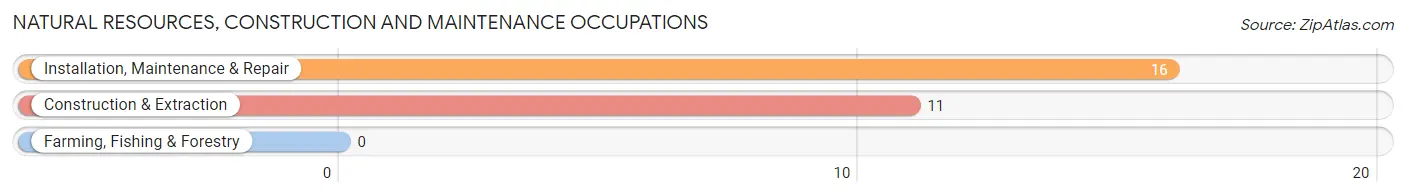
Natural Resources, Construction and Maintenance Occupations
The most common Natural Resources, Construction and Maintenance occupations in Greene are Installation, Maintenance & Repair (16 | 2.3%), and Construction & Extraction (11 | 1.6%).
Natural Resources, Construction and Maintenance Occupations by Sex
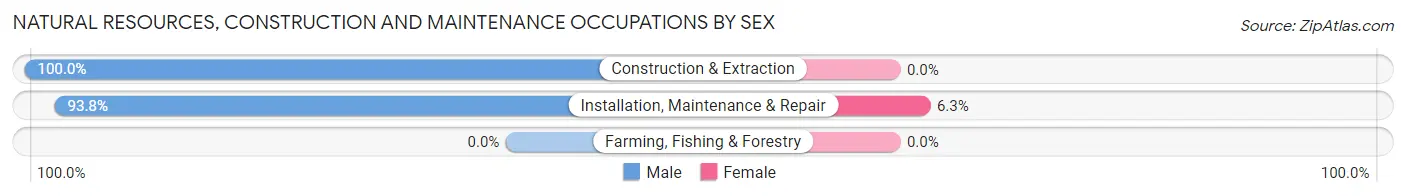
| Occupation | Male | Female |
| Farming, Fishing & Forestry | 0 (0.0%) | 0 (0.0%) |
| Construction & Extraction | 11 (100.0%) | 0 (0.0%) |
| Installation, Maintenance & Repair | 15 (93.8%) | 1 (6.2%) |
| Total (Category) | 26 (96.3%) | 1 (3.7%) |
| Total (Overall) | 352 (50.0%) | 352 (50.0%) |
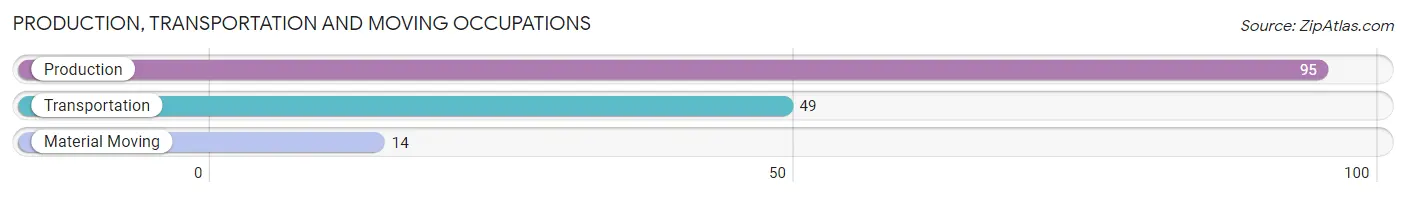
Production, Transportation and Moving Occupations
The most common Production, Transportation and Moving occupations in Greene are Production (95 | 13.5%), Transportation (49 | 7.0%), and Material Moving (14 | 2.0%).
Production, Transportation and Moving Occupations by Sex
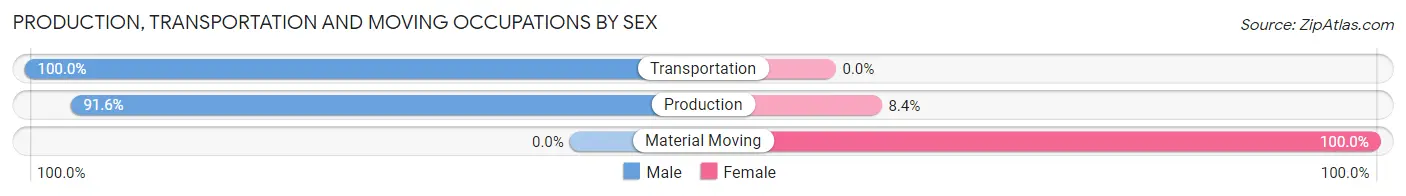
| Occupation | Male | Female |
| Production | 87 (91.6%) | 8 (8.4%) |
| Transportation | 49 (100.0%) | 0 (0.0%) |
| Material Moving | 0 (0.0%) | 14 (100.0%) |
| Total (Category) | 136 (86.1%) | 22 (13.9%) |
| Total (Overall) | 352 (50.0%) | 352 (50.0%) |
Employment Industries by Sex in Greene
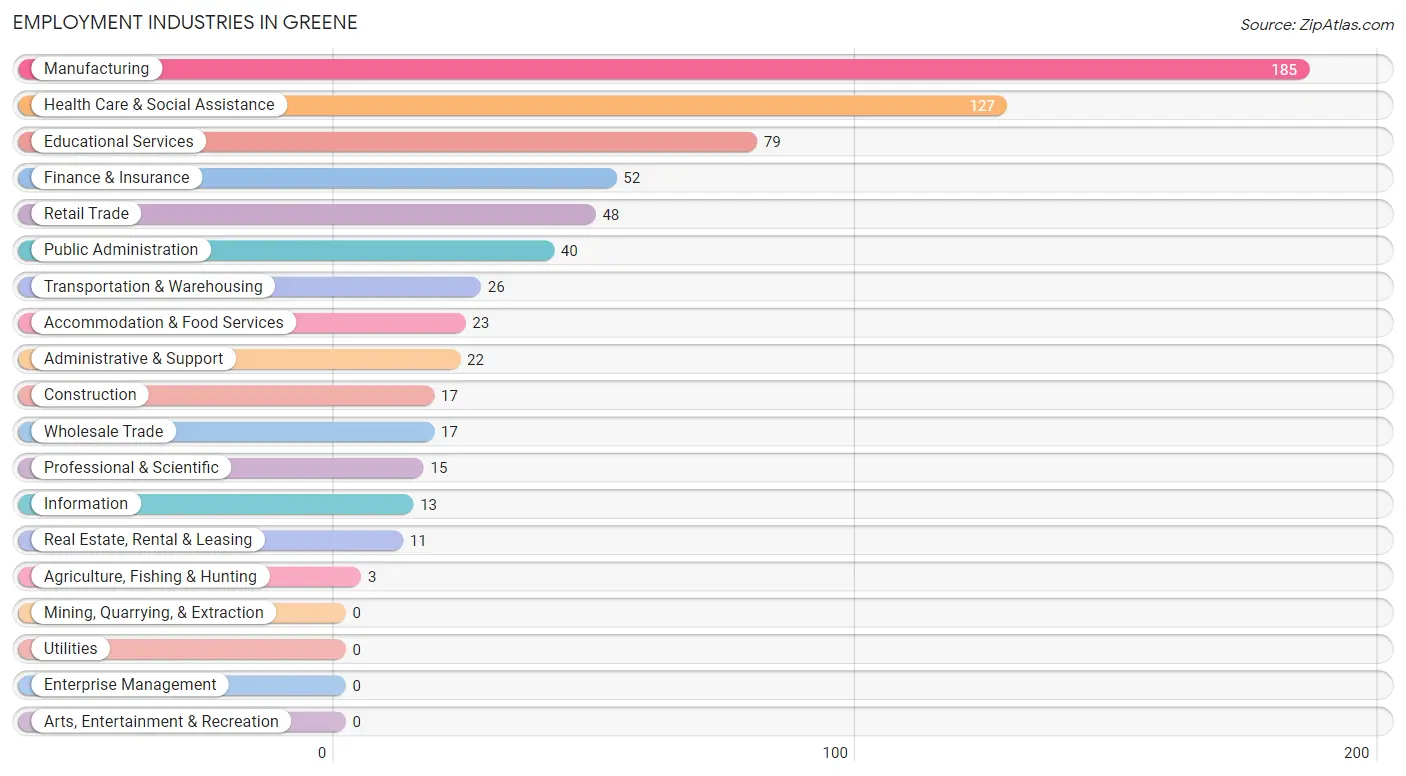
Employment Industries in Greene
The major employment industries in Greene include Manufacturing (185 | 26.3%), Health Care & Social Assistance (127 | 18.0%), Educational Services (79 | 11.2%), Finance & Insurance (52 | 7.4%), and Retail Trade (48 | 6.8%).
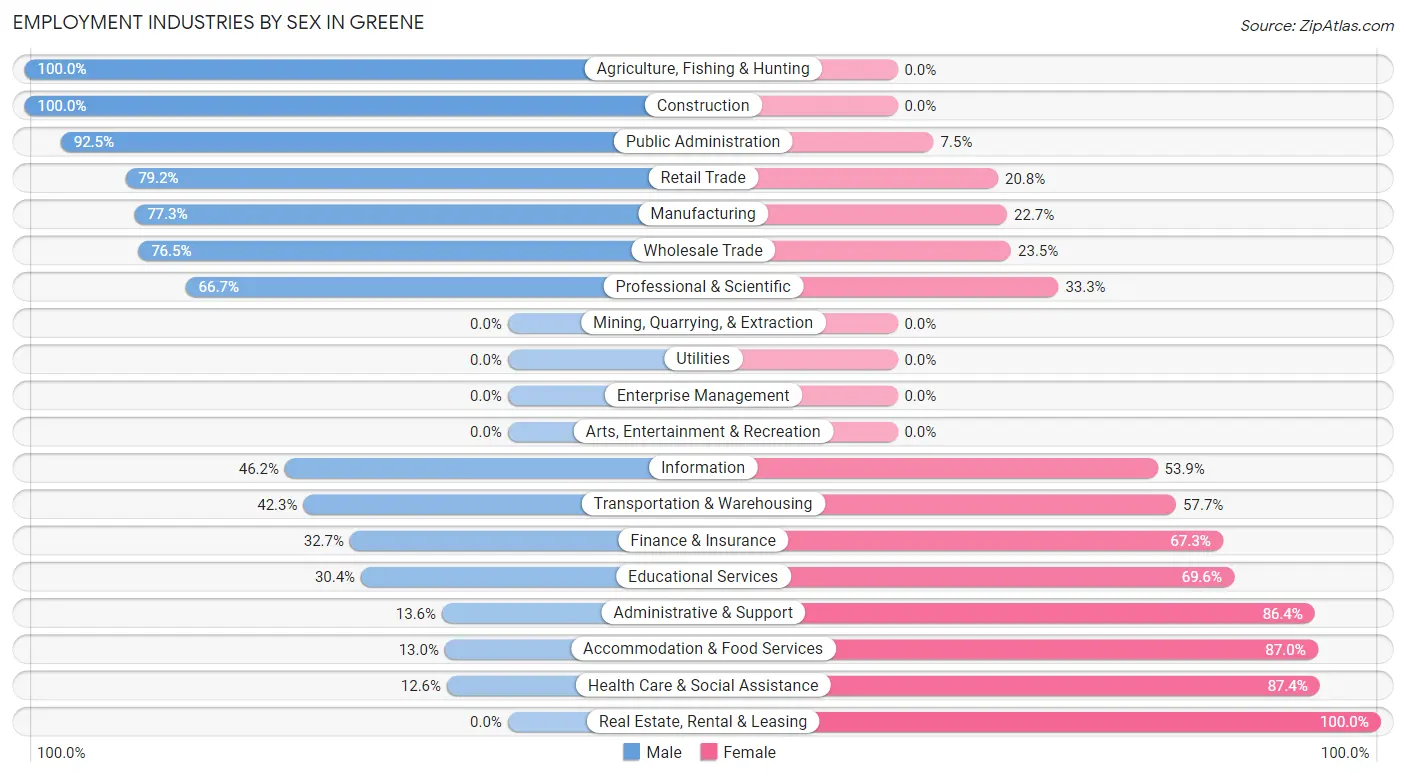
Employment Industries by Sex in Greene
The Greene industries that see more men than women are Agriculture, Fishing & Hunting (100.0%), Construction (100.0%), and Public Administration (92.5%), whereas the industries that tend to have a higher number of women are Real Estate, Rental & Leasing (100.0%), Health Care & Social Assistance (87.4%), and Accommodation & Food Services (87.0%).
| Industry | Male | Female |
| Agriculture, Fishing & Hunting | 3 (100.0%) | 0 (0.0%) |
| Mining, Quarrying, & Extraction | 0 (0.0%) | 0 (0.0%) |
| Construction | 17 (100.0%) | 0 (0.0%) |
| Manufacturing | 143 (77.3%) | 42 (22.7%) |
| Wholesale Trade | 13 (76.5%) | 4 (23.5%) |
| Retail Trade | 38 (79.2%) | 10 (20.8%) |
| Transportation & Warehousing | 11 (42.3%) | 15 (57.7%) |
| Utilities | 0 (0.0%) | 0 (0.0%) |
| Information | 6 (46.2%) | 7 (53.8%) |
| Finance & Insurance | 17 (32.7%) | 35 (67.3%) |
| Real Estate, Rental & Leasing | 0 (0.0%) | 11 (100.0%) |
| Professional & Scientific | 10 (66.7%) | 5 (33.3%) |
| Enterprise Management | 0 (0.0%) | 0 (0.0%) |
| Administrative & Support | 3 (13.6%) | 19 (86.4%) |
| Educational Services | 24 (30.4%) | 55 (69.6%) |
| Health Care & Social Assistance | 16 (12.6%) | 111 (87.4%) |
| Arts, Entertainment & Recreation | 0 (0.0%) | 0 (0.0%) |
| Accommodation & Food Services | 3 (13.0%) | 20 (87.0%) |
| Public Administration | 37 (92.5%) | 3 (7.5%) |
| Total | 352 (50.0%) | 352 (50.0%) |
Education in Greene
School Enrollment in Greene
The most common levels of schooling among the 381 students in Greene are college / undergraduate (80 | 21.0%), middle school (76 | 20.0%), and elementary school (64 | 16.8%).
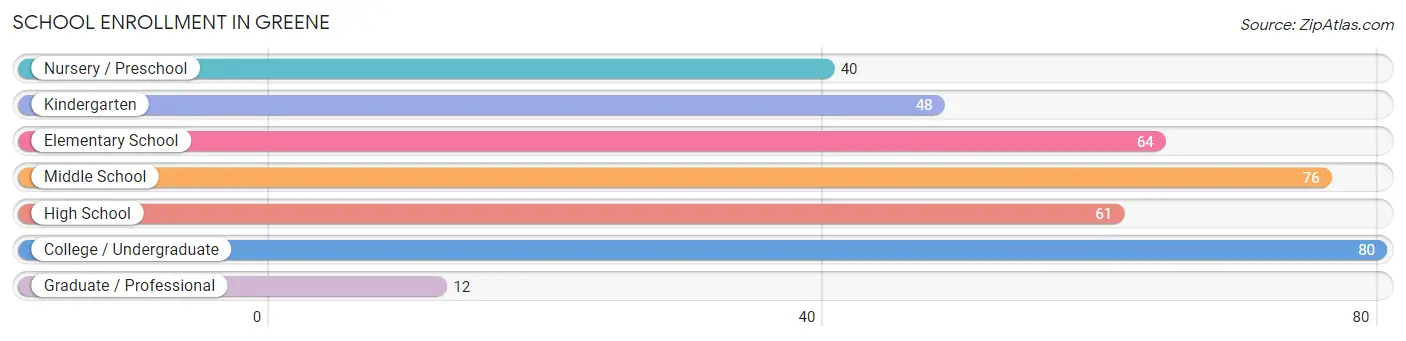
| School Level | # Students | % Students |
| Nursery / Preschool | 40 | 10.5% |
| Kindergarten | 48 | 12.6% |
| Elementary School | 64 | 16.8% |
| Middle School | 76 | 20.0% |
| High School | 61 | 16.0% |
| College / Undergraduate | 80 | 21.0% |
| Graduate / Professional | 12 | 3.2% |
| Total | 381 | 100.0% |
School Enrollment by Age by Funding Source in Greene
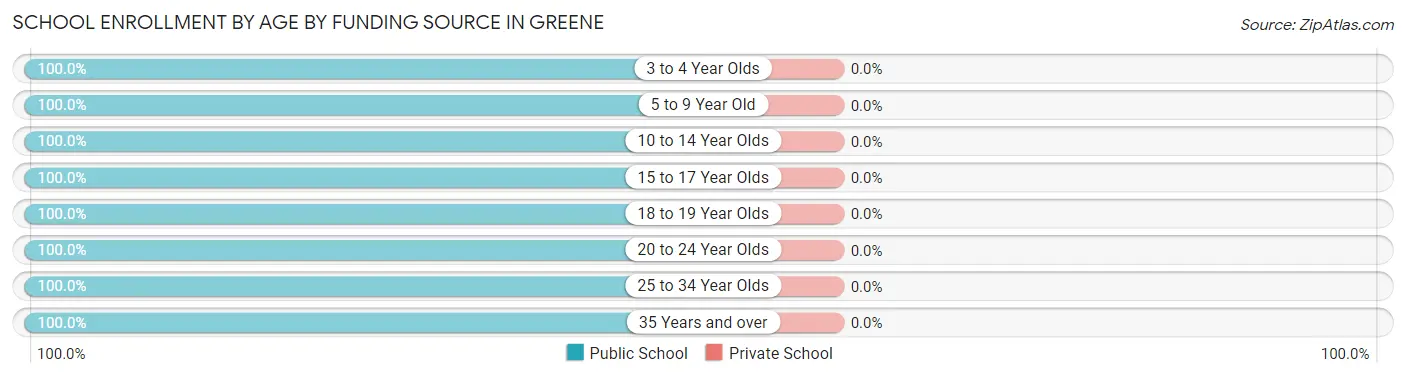
| Age Bracket | Public School | Private School |
| 3 to 4 Year Olds | 20 (100.0%) | 0 (0.0%) |
| 5 to 9 Year Old | 104 (100.0%) | 0 (0.0%) |
| 10 to 14 Year Olds | 104 (100.0%) | 0 (0.0%) |
| 15 to 17 Year Olds | 54 (100.0%) | 0 (0.0%) |
| 18 to 19 Year Olds | 10 (100.0%) | 0 (0.0%) |
| 20 to 24 Year Olds | 30 (100.0%) | 0 (0.0%) |
| 25 to 34 Year Olds | 30 (100.0%) | 0 (0.0%) |
| 35 Years and over | 29 (100.0%) | 0 (0.0%) |
| Total | 381 (100.0%) | 0 (0.0%) |
Educational Attainment by Field of Study in Greene
Education (53 | 19.9%), liberal arts & history (35 | 13.2%), business (26 | 9.8%), engineering (21 | 7.9%), and social sciences (20 | 7.5%) are the most common fields of study among 266 individuals in Greene who have obtained a bachelor's degree or higher.
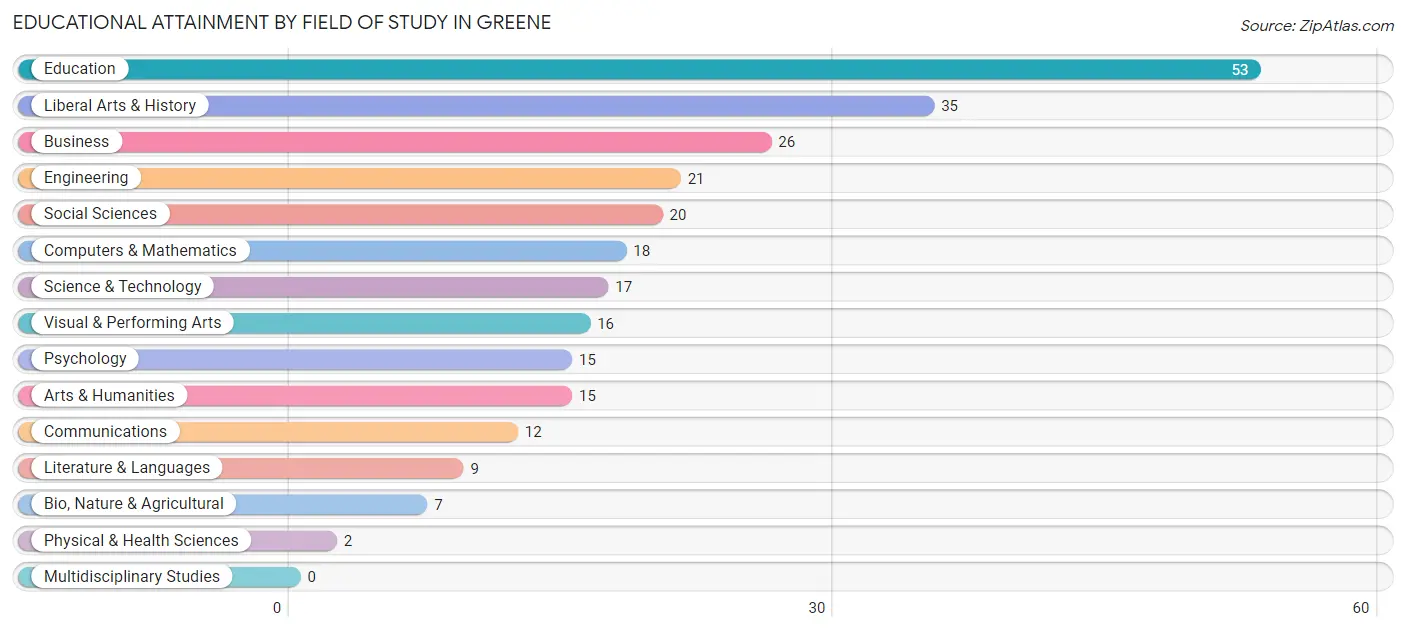
| Field of Study | # Graduates | % Graduates |
| Computers & Mathematics | 18 | 6.8% |
| Bio, Nature & Agricultural | 7 | 2.6% |
| Physical & Health Sciences | 2 | 0.7% |
| Psychology | 15 | 5.6% |
| Social Sciences | 20 | 7.5% |
| Engineering | 21 | 7.9% |
| Multidisciplinary Studies | 0 | 0.0% |
| Science & Technology | 17 | 6.4% |
| Business | 26 | 9.8% |
| Education | 53 | 19.9% |
| Literature & Languages | 9 | 3.4% |
| Liberal Arts & History | 35 | 13.2% |
| Visual & Performing Arts | 16 | 6.0% |
| Communications | 12 | 4.5% |
| Arts & Humanities | 15 | 5.6% |
| Total | 266 | 100.0% |
Transportation & Commute in Greene
Vehicle Availability by Sex in Greene
The most prevalent vehicle ownership categories in Greene are males with 2 vehicles (193, accounting for 53.9%) and females with 2 vehicles (175, making up 58.8%).
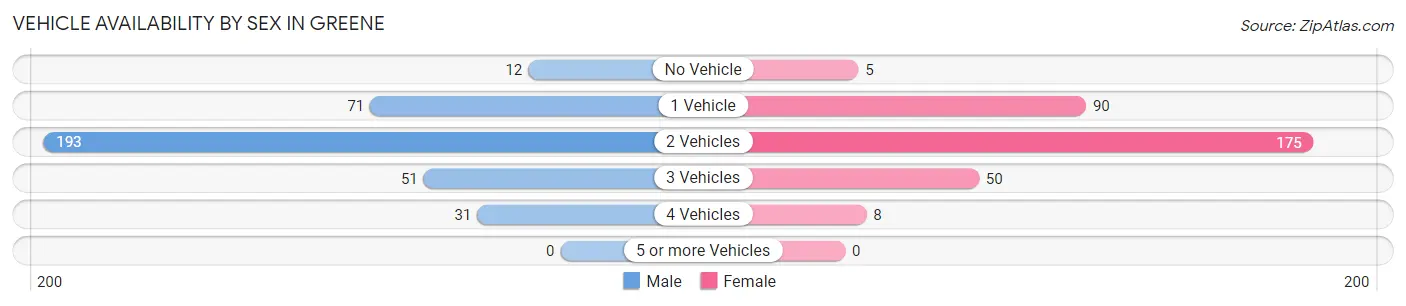
| Vehicles Available | Male | Female |
| No Vehicle | 12 (3.4%) | 5 (1.5%) |
| 1 Vehicle | 71 (19.8%) | 90 (27.4%) |
| 2 Vehicles | 193 (53.9%) | 175 (53.3%) |
| 3 Vehicles | 51 (14.2%) | 50 (15.2%) |
| 4 Vehicles | 31 (8.7%) | 8 (2.4%) |
| 5 or more Vehicles | 0 (0.0%) | 0 (0.0%) |
| Total | 358 (100.0%) | 328 (100.0%) |
Commute Time in Greene
The most frequently occuring commute durations in Greene are 5 to 9 minutes (125 commuters, 20.3%), 30 to 34 minutes (124 commuters, 20.1%), and less than 5 minutes (117 commuters, 19.0%).
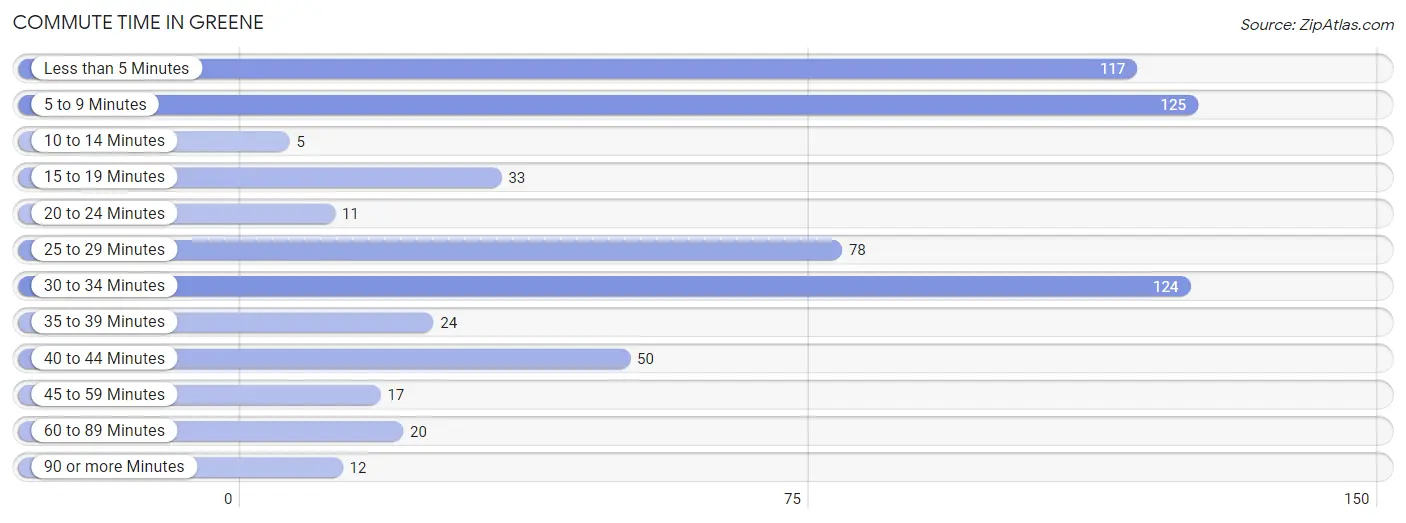
| Commute Time | # Commuters | % Commuters |
| Less than 5 Minutes | 117 | 19.0% |
| 5 to 9 Minutes | 125 | 20.3% |
| 10 to 14 Minutes | 5 | 0.8% |
| 15 to 19 Minutes | 33 | 5.4% |
| 20 to 24 Minutes | 11 | 1.8% |
| 25 to 29 Minutes | 78 | 12.7% |
| 30 to 34 Minutes | 124 | 20.1% |
| 35 to 39 Minutes | 24 | 3.9% |
| 40 to 44 Minutes | 50 | 8.1% |
| 45 to 59 Minutes | 17 | 2.8% |
| 60 to 89 Minutes | 20 | 3.3% |
| 90 or more Minutes | 12 | 1.9% |
Commute Time by Sex in Greene
The most common commute times in Greene are 5 to 9 minutes (74 commuters, 22.8%) for males and 30 to 34 minutes (69 commuters, 23.7%) for females.
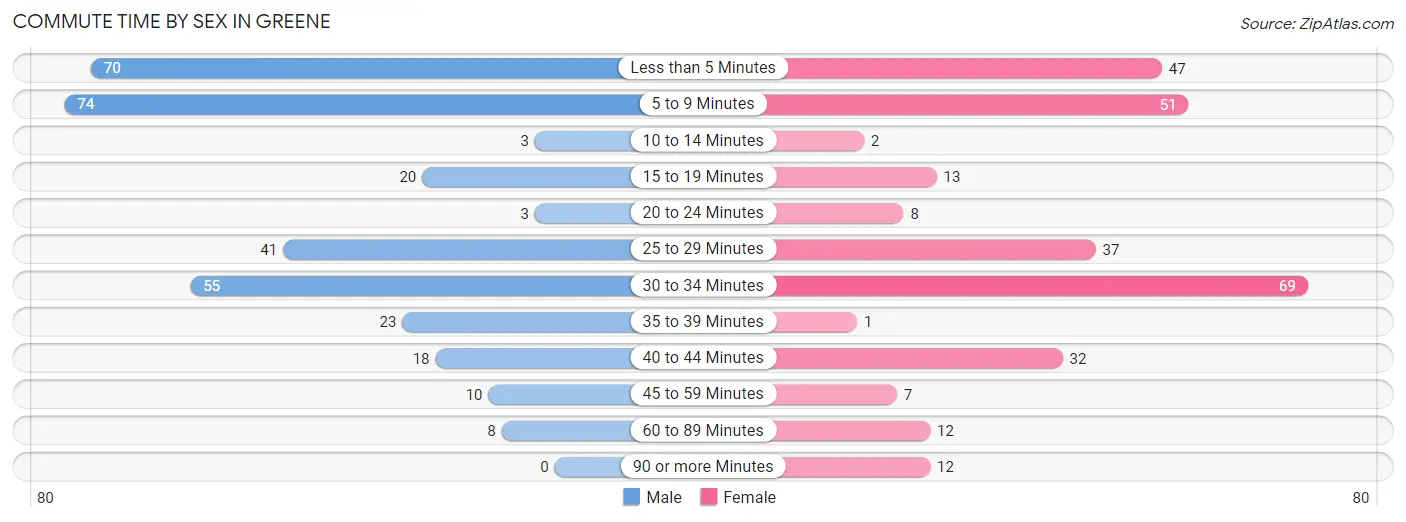
| Commute Time | Male | Female |
| Less than 5 Minutes | 70 (21.5%) | 47 (16.2%) |
| 5 to 9 Minutes | 74 (22.8%) | 51 (17.5%) |
| 10 to 14 Minutes | 3 (0.9%) | 2 (0.7%) |
| 15 to 19 Minutes | 20 (6.1%) | 13 (4.5%) |
| 20 to 24 Minutes | 3 (0.9%) | 8 (2.8%) |
| 25 to 29 Minutes | 41 (12.6%) | 37 (12.7%) |
| 30 to 34 Minutes | 55 (16.9%) | 69 (23.7%) |
| 35 to 39 Minutes | 23 (7.1%) | 1 (0.3%) |
| 40 to 44 Minutes | 18 (5.5%) | 32 (11.0%) |
| 45 to 59 Minutes | 10 (3.1%) | 7 (2.4%) |
| 60 to 89 Minutes | 8 (2.5%) | 12 (4.1%) |
| 90 or more Minutes | 0 (0.0%) | 12 (4.1%) |
Time of Departure to Work by Sex in Greene
The most frequent times of departure to work in Greene are 6:00 AM to 6:29 AM (70, 21.5%) for males and 7:00 AM to 7:29 AM (56, 19.2%) for females.
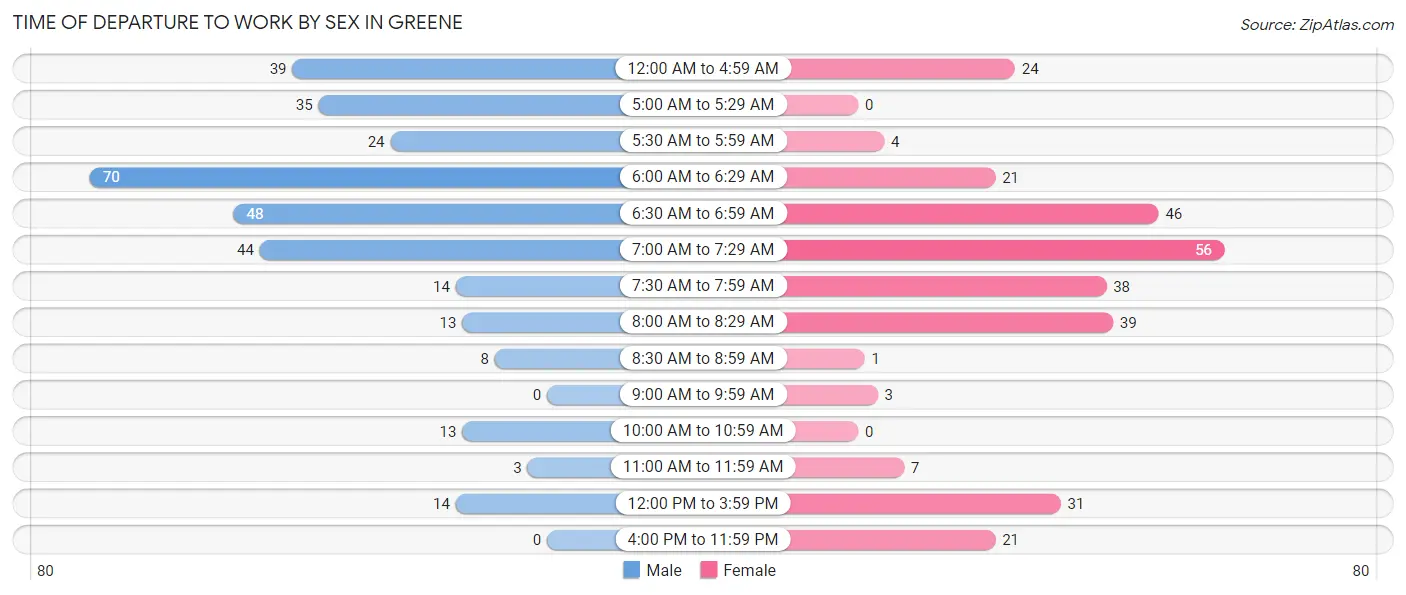
| Time of Departure | Male | Female |
| 12:00 AM to 4:59 AM | 39 (12.0%) | 24 (8.3%) |
| 5:00 AM to 5:29 AM | 35 (10.8%) | 0 (0.0%) |
| 5:30 AM to 5:59 AM | 24 (7.4%) | 4 (1.4%) |
| 6:00 AM to 6:29 AM | 70 (21.5%) | 21 (7.2%) |
| 6:30 AM to 6:59 AM | 48 (14.8%) | 46 (15.8%) |
| 7:00 AM to 7:29 AM | 44 (13.5%) | 56 (19.2%) |
| 7:30 AM to 7:59 AM | 14 (4.3%) | 38 (13.1%) |
| 8:00 AM to 8:29 AM | 13 (4.0%) | 39 (13.4%) |
| 8:30 AM to 8:59 AM | 8 (2.5%) | 1 (0.3%) |
| 9:00 AM to 9:59 AM | 0 (0.0%) | 3 (1.0%) |
| 10:00 AM to 10:59 AM | 13 (4.0%) | 0 (0.0%) |
| 11:00 AM to 11:59 AM | 3 (0.9%) | 7 (2.4%) |
| 12:00 PM to 3:59 PM | 14 (4.3%) | 31 (10.6%) |
| 4:00 PM to 11:59 PM | 0 (0.0%) | 21 (7.2%) |
| Total | 325 (100.0%) | 291 (100.0%) |
Housing Occupancy in Greene
Occupancy by Ownership in Greene
Of the total 748 dwellings in Greene, owner-occupied units account for 402 (53.7%), while renter-occupied units make up 346 (46.3%).
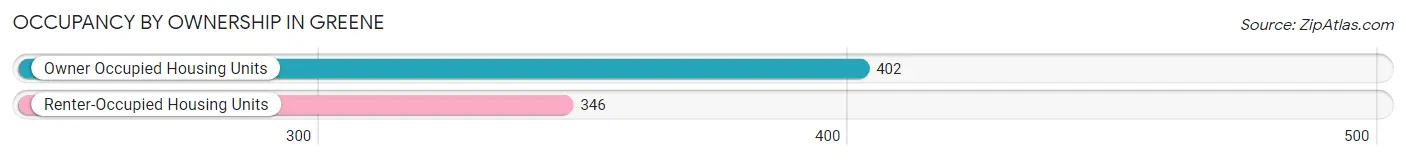
| Occupancy | # Housing Units | % Housing Units |
| Owner Occupied Housing Units | 402 | 53.7% |
| Renter-Occupied Housing Units | 346 | 46.3% |
| Total Occupied Housing Units | 748 | 100.0% |
Occupancy by Household Size in Greene
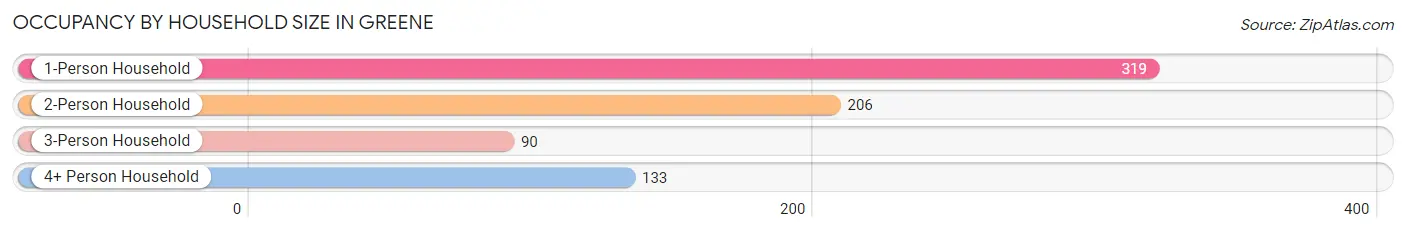
| Household Size | # Housing Units | % Housing Units |
| 1-Person Household | 319 | 42.6% |
| 2-Person Household | 206 | 27.5% |
| 3-Person Household | 90 | 12.0% |
| 4+ Person Household | 133 | 17.8% |
| Total Housing Units | 748 | 100.0% |
Occupancy by Ownership by Household Size in Greene
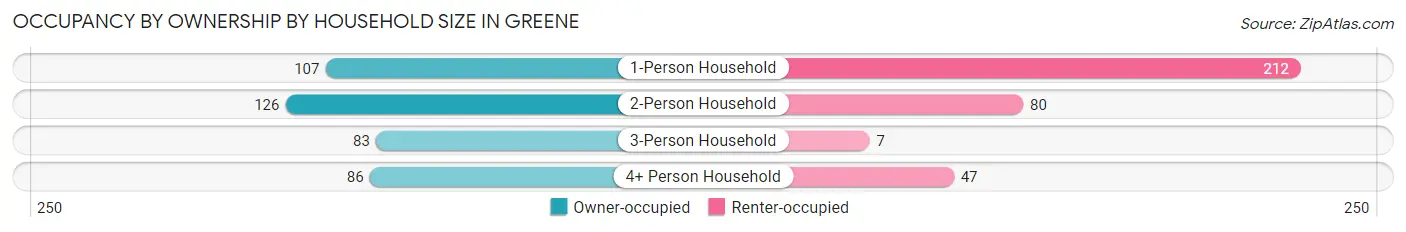
| Household Size | Owner-occupied | Renter-occupied |
| 1-Person Household | 107 (33.5%) | 212 (66.5%) |
| 2-Person Household | 126 (61.2%) | 80 (38.8%) |
| 3-Person Household | 83 (92.2%) | 7 (7.8%) |
| 4+ Person Household | 86 (64.7%) | 47 (35.3%) |
| Total Housing Units | 402 (53.7%) | 346 (46.3%) |
Occupancy by Educational Attainment in Greene
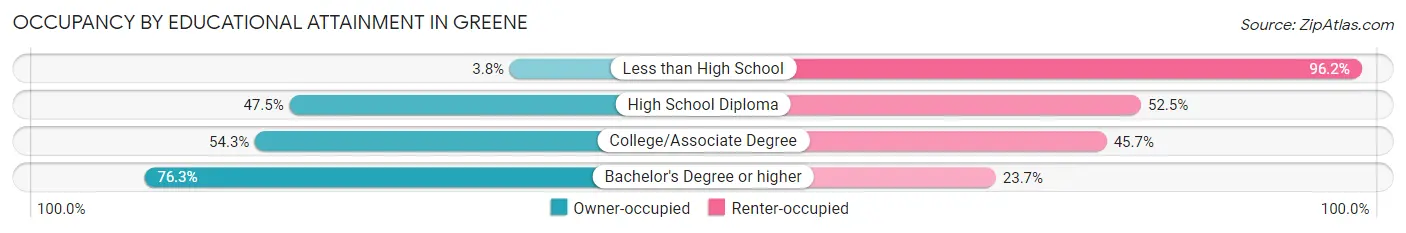
| Household Size | Owner-occupied | Renter-occupied |
| Less than High School | 2 (3.8%) | 51 (96.2%) |
| High School Diploma | 113 (47.5%) | 125 (52.5%) |
| College/Associate Degree | 152 (54.3%) | 128 (45.7%) |
| Bachelor's Degree or higher | 135 (76.3%) | 42 (23.7%) |
Occupancy by Age of Householder in Greene
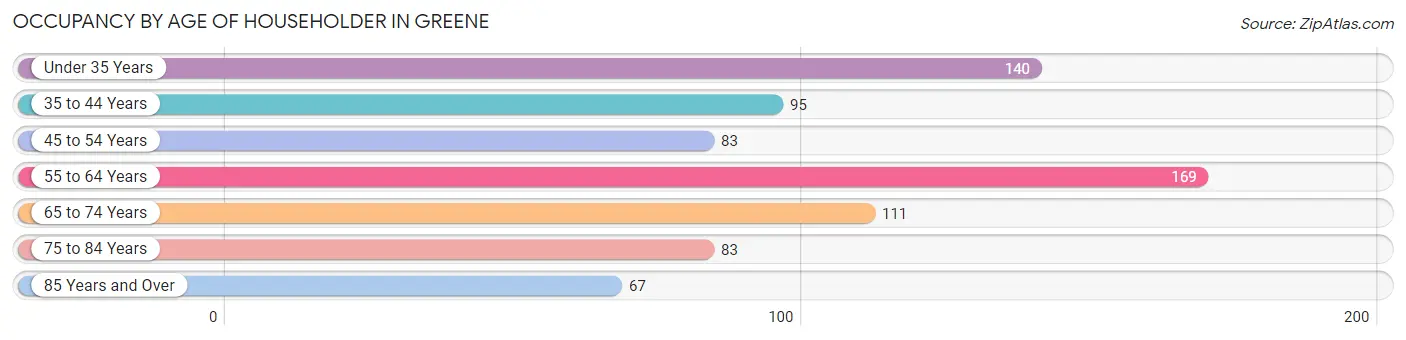
| Age Bracket | # Households | % Households |
| Under 35 Years | 140 | 18.7% |
| 35 to 44 Years | 95 | 12.7% |
| 45 to 54 Years | 83 | 11.1% |
| 55 to 64 Years | 169 | 22.6% |
| 65 to 74 Years | 111 | 14.8% |
| 75 to 84 Years | 83 | 11.1% |
| 85 Years and Over | 67 | 9.0% |
| Total | 748 | 100.0% |
Housing Finances in Greene
Median Income by Occupancy in Greene
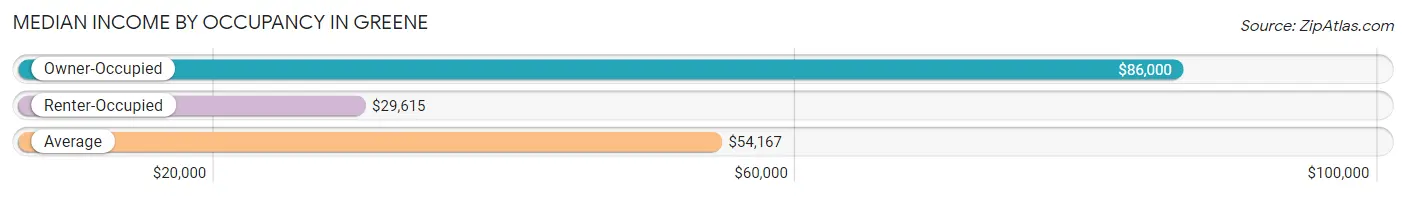
| Occupancy Type | # Households | Median Income |
| Owner-Occupied | 402 (53.7%) | $86,000 |
| Renter-Occupied | 346 (46.3%) | $29,615 |
| Average | 748 (100.0%) | $54,167 |
Occupancy by Householder Income Bracket in Greene
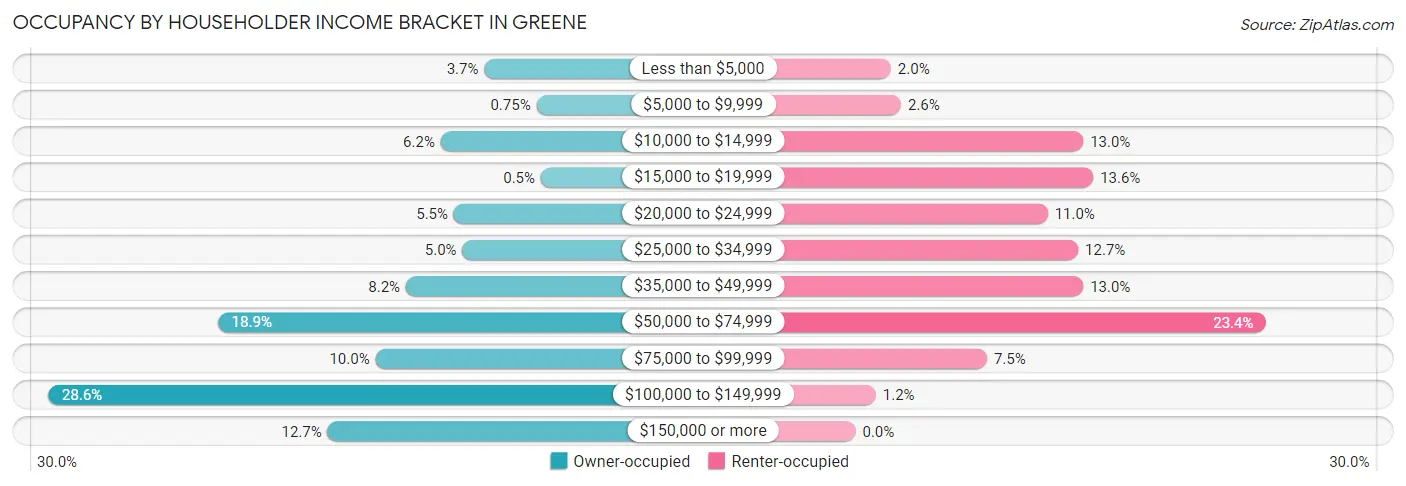
| Income Bracket | Owner-occupied | Renter-occupied |
| Less than $5,000 | 15 (3.7%) | 7 (2.0%) |
| $5,000 to $9,999 | 3 (0.7%) | 9 (2.6%) |
| $10,000 to $14,999 | 25 (6.2%) | 45 (13.0%) |
| $15,000 to $19,999 | 2 (0.5%) | 47 (13.6%) |
| $20,000 to $24,999 | 22 (5.5%) | 38 (11.0%) |
| $25,000 to $34,999 | 20 (5.0%) | 44 (12.7%) |
| $35,000 to $49,999 | 33 (8.2%) | 45 (13.0%) |
| $50,000 to $74,999 | 76 (18.9%) | 81 (23.4%) |
| $75,000 to $99,999 | 40 (10.0%) | 26 (7.5%) |
| $100,000 to $149,999 | 115 (28.6%) | 4 (1.2%) |
| $150,000 or more | 51 (12.7%) | 0 (0.0%) |
| Total | 402 (100.0%) | 346 (100.0%) |
Monthly Housing Cost Tiers in Greene
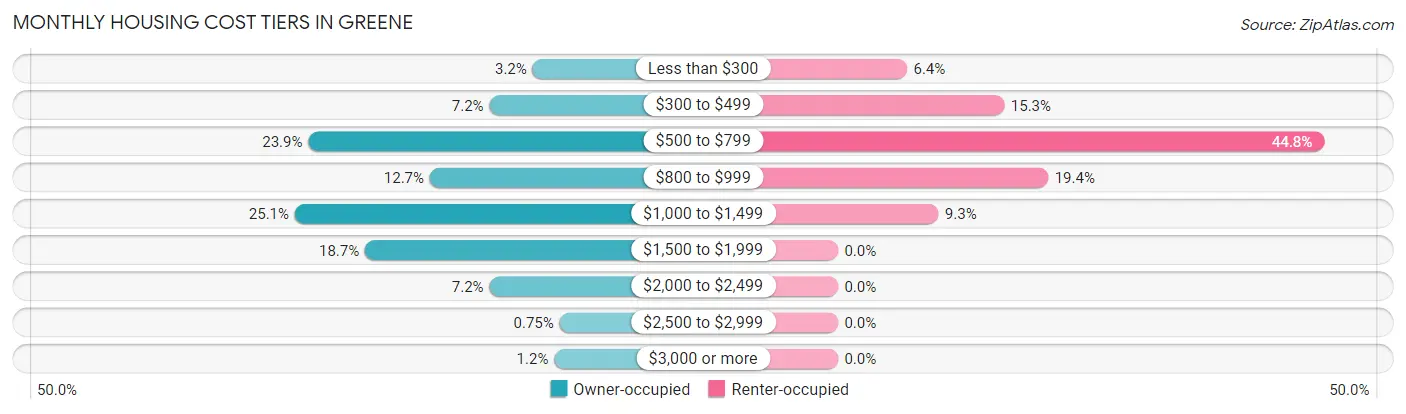
| Monthly Cost | Owner-occupied | Renter-occupied |
| Less than $300 | 13 (3.2%) | 22 (6.4%) |
| $300 to $499 | 29 (7.2%) | 53 (15.3%) |
| $500 to $799 | 96 (23.9%) | 155 (44.8%) |
| $800 to $999 | 51 (12.7%) | 67 (19.4%) |
| $1,000 to $1,499 | 101 (25.1%) | 32 (9.2%) |
| $1,500 to $1,999 | 75 (18.7%) | 0 (0.0%) |
| $2,000 to $2,499 | 29 (7.2%) | 0 (0.0%) |
| $2,500 to $2,999 | 3 (0.7%) | 0 (0.0%) |
| $3,000 or more | 5 (1.2%) | 0 (0.0%) |
| Total | 402 (100.0%) | 346 (100.0%) |
Physical Housing Characteristics in Greene
Housing Structures in Greene
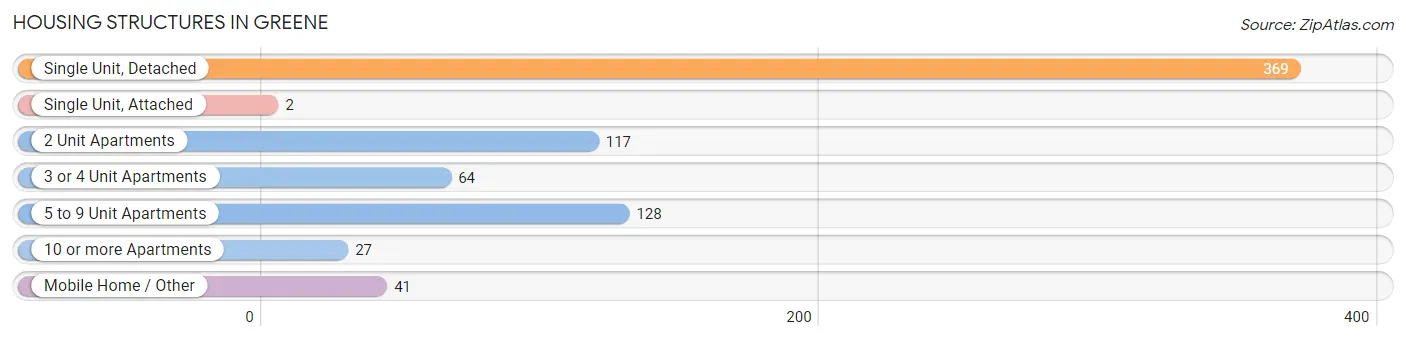
| Structure Type | # Housing Units | % Housing Units |
| Single Unit, Detached | 369 | 49.3% |
| Single Unit, Attached | 2 | 0.3% |
| 2 Unit Apartments | 117 | 15.6% |
| 3 or 4 Unit Apartments | 64 | 8.6% |
| 5 to 9 Unit Apartments | 128 | 17.1% |
| 10 or more Apartments | 27 | 3.6% |
| Mobile Home / Other | 41 | 5.5% |
| Total | 748 | 100.0% |
Housing Structures by Occupancy in Greene
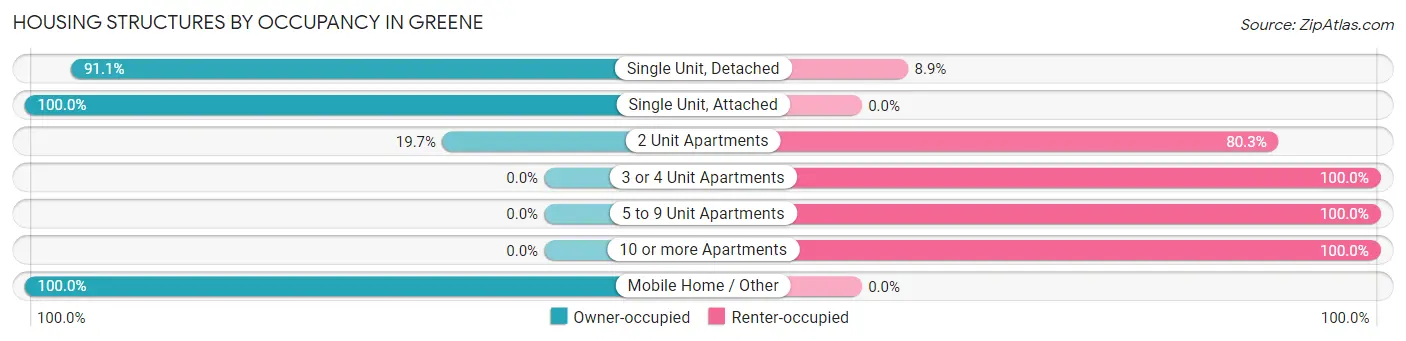
| Structure Type | Owner-occupied | Renter-occupied |
| Single Unit, Detached | 336 (91.1%) | 33 (8.9%) |
| Single Unit, Attached | 2 (100.0%) | 0 (0.0%) |
| 2 Unit Apartments | 23 (19.7%) | 94 (80.3%) |
| 3 or 4 Unit Apartments | 0 (0.0%) | 64 (100.0%) |
| 5 to 9 Unit Apartments | 0 (0.0%) | 128 (100.0%) |
| 10 or more Apartments | 0 (0.0%) | 27 (100.0%) |
| Mobile Home / Other | 41 (100.0%) | 0 (0.0%) |
| Total | 402 (53.7%) | 346 (46.3%) |
Housing Structures by Number of Rooms in Greene
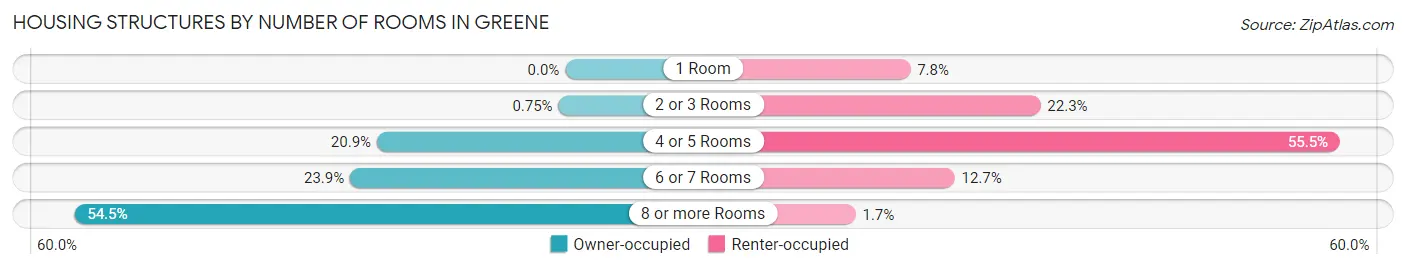
| Number of Rooms | Owner-occupied | Renter-occupied |
| 1 Room | 0 (0.0%) | 27 (7.8%) |
| 2 or 3 Rooms | 3 (0.7%) | 77 (22.3%) |
| 4 or 5 Rooms | 84 (20.9%) | 192 (55.5%) |
| 6 or 7 Rooms | 96 (23.9%) | 44 (12.7%) |
| 8 or more Rooms | 219 (54.5%) | 6 (1.7%) |
| Total | 402 (100.0%) | 346 (100.0%) |
Housing Structure by Heating Type in Greene
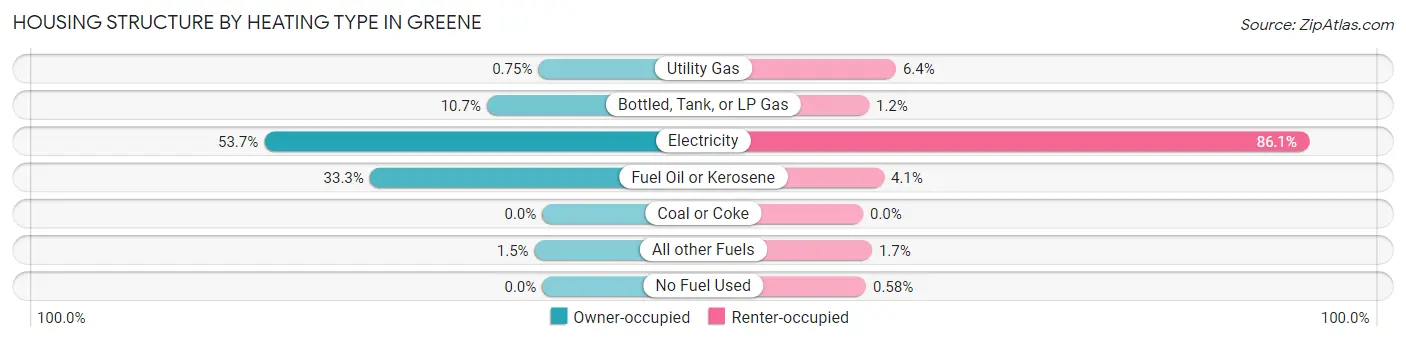
| Heating Type | Owner-occupied | Renter-occupied |
| Utility Gas | 3 (0.7%) | 22 (6.4%) |
| Bottled, Tank, or LP Gas | 43 (10.7%) | 4 (1.2%) |
| Electricity | 216 (53.7%) | 298 (86.1%) |
| Fuel Oil or Kerosene | 134 (33.3%) | 14 (4.1%) |
| Coal or Coke | 0 (0.0%) | 0 (0.0%) |
| All other Fuels | 6 (1.5%) | 6 (1.7%) |
| No Fuel Used | 0 (0.0%) | 2 (0.6%) |
| Total | 402 (100.0%) | 346 (100.0%) |
Household Vehicle Usage in Greene
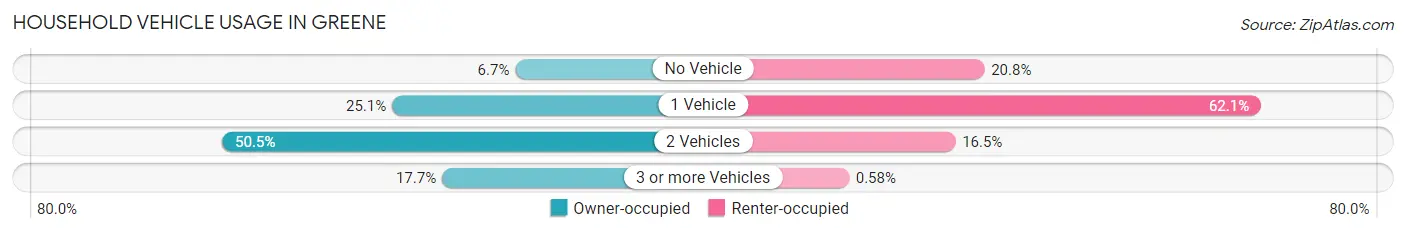
| Vehicles per Household | Owner-occupied | Renter-occupied |
| No Vehicle | 27 (6.7%) | 72 (20.8%) |
| 1 Vehicle | 101 (25.1%) | 215 (62.1%) |
| 2 Vehicles | 203 (50.5%) | 57 (16.5%) |
| 3 or more Vehicles | 71 (17.7%) | 2 (0.6%) |
| Total | 402 (100.0%) | 346 (100.0%) |
Real Estate & Mortgages in Greene
Real Estate and Mortgage Overview in Greene
| Characteristic | Without Mortgage | With Mortgage |
| Housing Units | 141 | 261 |
| Median Property Value | $144,000 | $134,600 |
| Median Household Income | $74,250 | $42 |
| Monthly Housing Costs | $577 | $0 |
| Real Estate Taxes | $3,531 | $0 |
Property Value by Mortgage Status in Greene
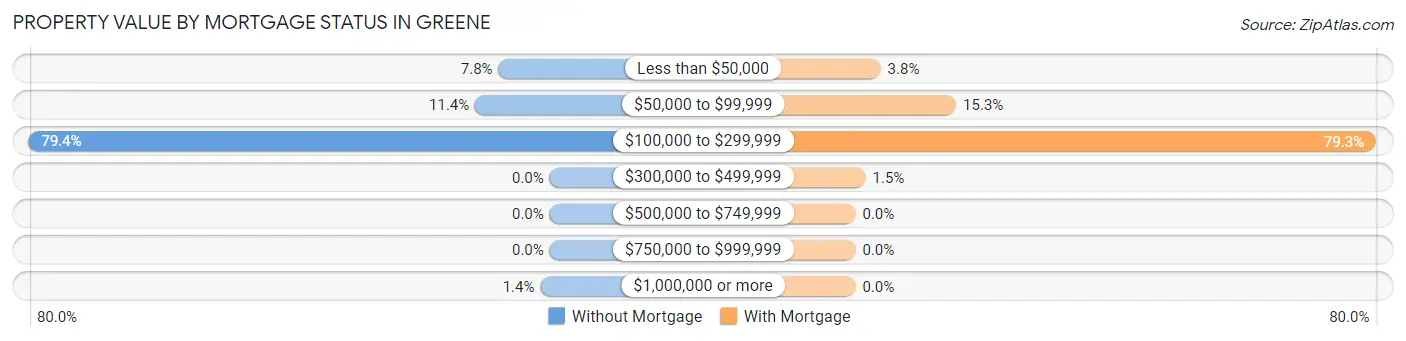
| Property Value | Without Mortgage | With Mortgage |
| Less than $50,000 | 11 (7.8%) | 10 (3.8%) |
| $50,000 to $99,999 | 16 (11.4%) | 40 (15.3%) |
| $100,000 to $299,999 | 112 (79.4%) | 207 (79.3%) |
| $300,000 to $499,999 | 0 (0.0%) | 4 (1.5%) |
| $500,000 to $749,999 | 0 (0.0%) | 0 (0.0%) |
| $750,000 to $999,999 | 0 (0.0%) | 0 (0.0%) |
| $1,000,000 or more | 2 (1.4%) | 0 (0.0%) |
| Total | 141 (100.0%) | 261 (100.0%) |
Household Income by Mortgage Status in Greene
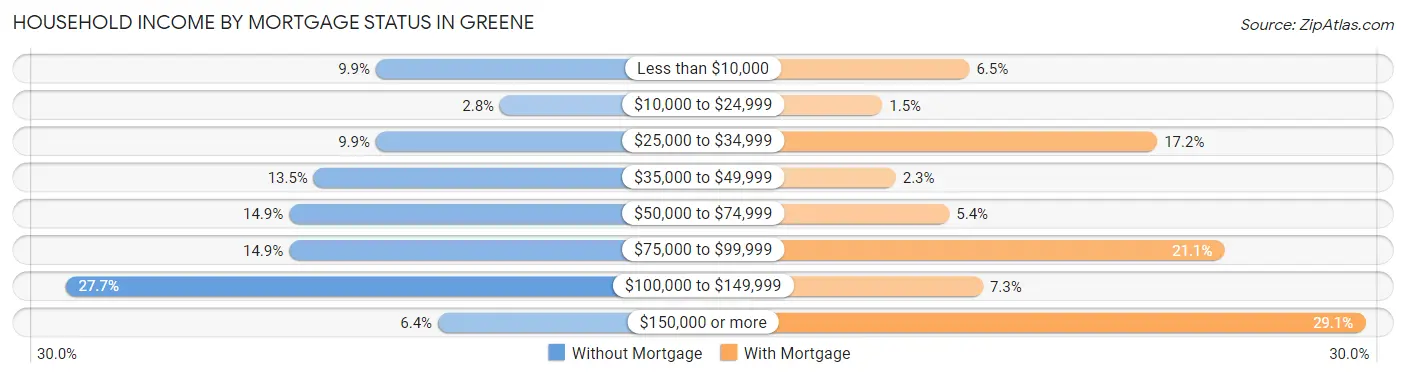
| Household Income | Without Mortgage | With Mortgage |
| Less than $10,000 | 14 (9.9%) | 17 (6.5%) |
| $10,000 to $24,999 | 4 (2.8%) | 4 (1.5%) |
| $25,000 to $34,999 | 14 (9.9%) | 45 (17.2%) |
| $35,000 to $49,999 | 19 (13.5%) | 6 (2.3%) |
| $50,000 to $74,999 | 21 (14.9%) | 14 (5.4%) |
| $75,000 to $99,999 | 21 (14.9%) | 55 (21.1%) |
| $100,000 to $149,999 | 39 (27.7%) | 19 (7.3%) |
| $150,000 or more | 9 (6.4%) | 76 (29.1%) |
| Total | 141 (100.0%) | 261 (100.0%) |
Property Value to Household Income Ratio in Greene
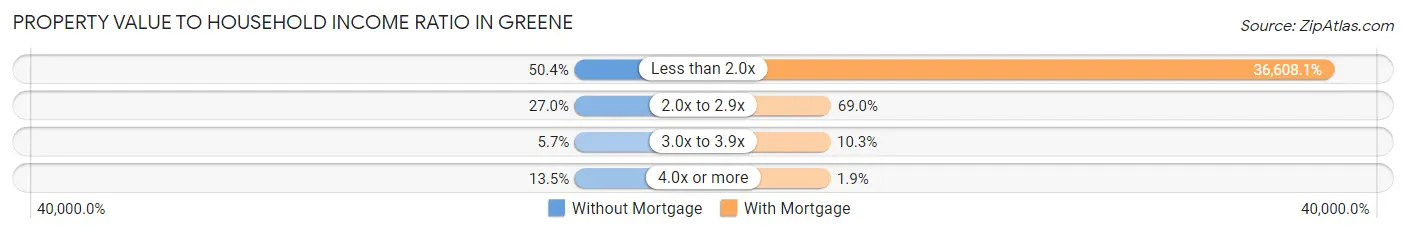
| Value-to-Income Ratio | Without Mortgage | With Mortgage |
| Less than 2.0x | 71 (50.3%) | 95,547 (36,608.0%) |
| 2.0x to 2.9x | 38 (27.0%) | 180 (69.0%) |
| 3.0x to 3.9x | 8 (5.7%) | 27 (10.3%) |
| 4.0x or more | 19 (13.5%) | 5 (1.9%) |
| Total | 141 (100.0%) | 261 (100.0%) |
Real Estate Taxes by Mortgage Status in Greene
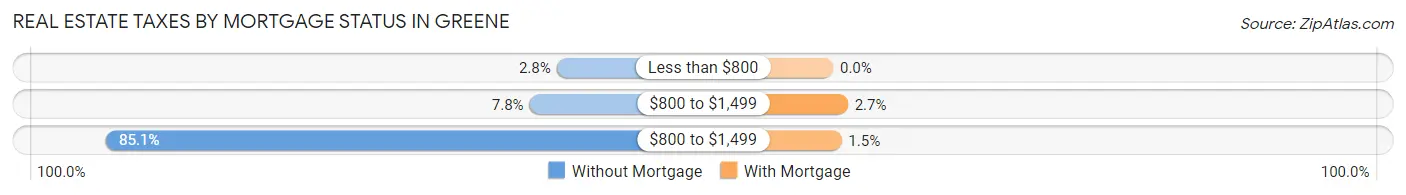
| Property Taxes | Without Mortgage | With Mortgage |
| Less than $800 | 4 (2.8%) | 0 (0.0%) |
| $800 to $1,499 | 11 (7.8%) | 7 (2.7%) |
| $800 to $1,499 | 120 (85.1%) | 4 (1.5%) |
| Total | 141 (100.0%) | 261 (100.0%) |
Health & Disability in Greene
Health Insurance Coverage by Age in Greene
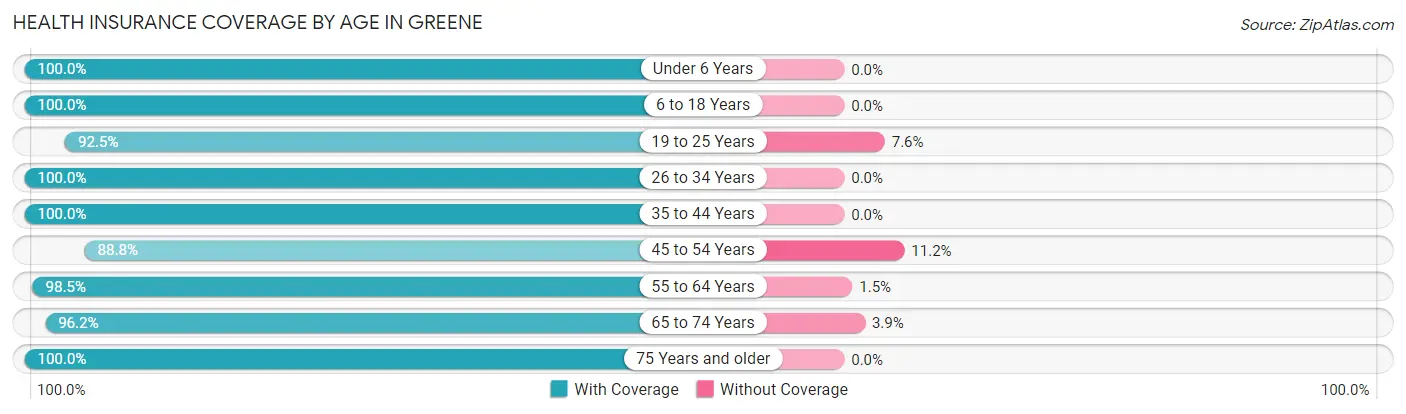
| Age Bracket | With Coverage | Without Coverage |
| Under 6 Years | 131 (100.0%) | 0 (0.0%) |
| 6 to 18 Years | 239 (100.0%) | 0 (0.0%) |
| 19 to 25 Years | 147 (92.4%) | 12 (7.5%) |
| 26 to 34 Years | 142 (100.0%) | 0 (0.0%) |
| 35 to 44 Years | 182 (100.0%) | 0 (0.0%) |
| 45 to 54 Years | 95 (88.8%) | 12 (11.2%) |
| 55 to 64 Years | 262 (98.5%) | 4 (1.5%) |
| 65 to 74 Years | 150 (96.2%) | 6 (3.8%) |
| 75 Years and older | 185 (100.0%) | 0 (0.0%) |
| Total | 1,533 (97.8%) | 34 (2.2%) |
Health Insurance Coverage by Citizenship Status in Greene
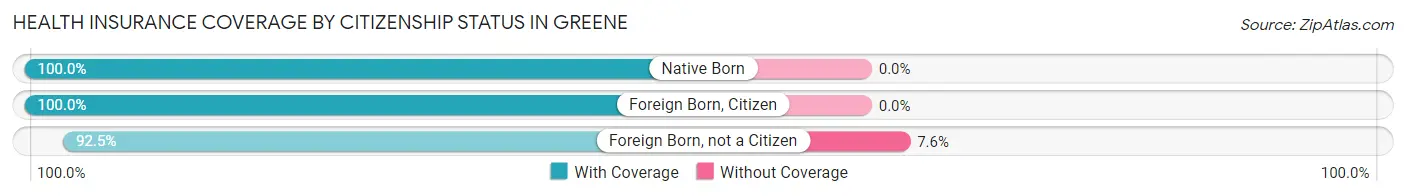
| Citizenship Status | With Coverage | Without Coverage |
| Native Born | 131 (100.0%) | 0 (0.0%) |
| Foreign Born, Citizen | 239 (100.0%) | 0 (0.0%) |
| Foreign Born, not a Citizen | 147 (92.4%) | 12 (7.5%) |
Health Insurance Coverage by Household Income in Greene
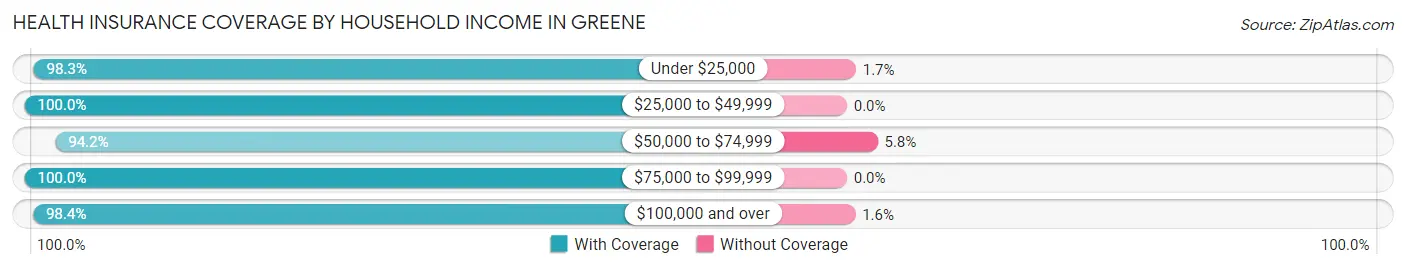
| Household Income | With Coverage | Without Coverage |
| Under $25,000 | 232 (98.3%) | 4 (1.7%) |
| $25,000 to $49,999 | 302 (100.0%) | 0 (0.0%) |
| $50,000 to $74,999 | 360 (94.2%) | 22 (5.8%) |
| $75,000 to $99,999 | 134 (100.0%) | 0 (0.0%) |
| $100,000 and over | 499 (98.4%) | 8 (1.6%) |
Public vs Private Health Insurance Coverage by Age in Greene
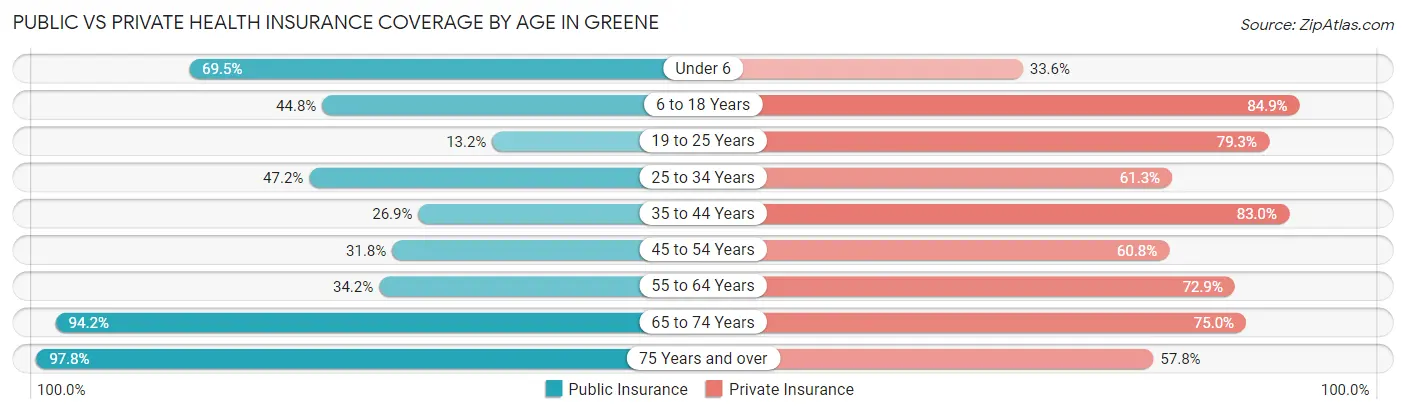
| Age Bracket | Public Insurance | Private Insurance |
| Under 6 | 91 (69.5%) | 44 (33.6%) |
| 6 to 18 Years | 107 (44.8%) | 203 (84.9%) |
| 19 to 25 Years | 21 (13.2%) | 126 (79.2%) |
| 25 to 34 Years | 67 (47.2%) | 87 (61.3%) |
| 35 to 44 Years | 49 (26.9%) | 151 (83.0%) |
| 45 to 54 Years | 34 (31.8%) | 65 (60.8%) |
| 55 to 64 Years | 91 (34.2%) | 194 (72.9%) |
| 65 to 74 Years | 147 (94.2%) | 117 (75.0%) |
| 75 Years and over | 181 (97.8%) | 107 (57.8%) |
| Total | 788 (50.3%) | 1,094 (69.8%) |
Disability Status by Sex by Age in Greene
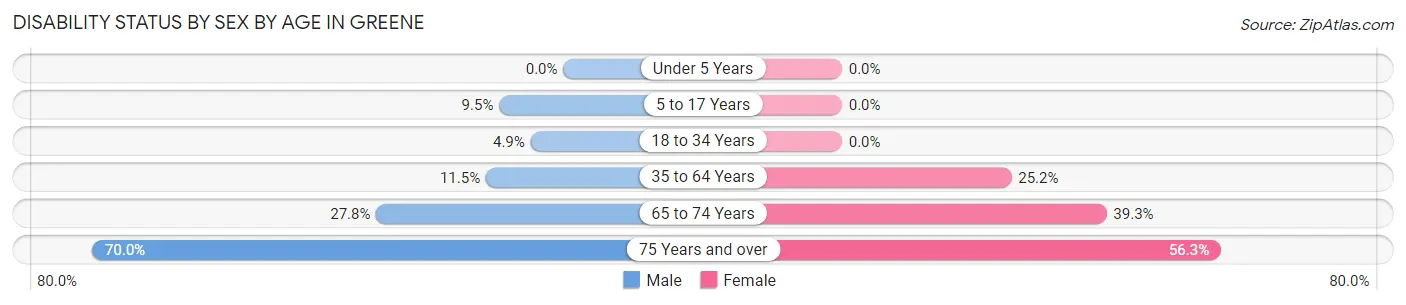
| Age Bracket | Male | Female |
| Under 5 Years | 0 (0.0%) | 0 (0.0%) |
| 5 to 17 Years | 12 (9.5%) | 0 (0.0%) |
| 18 to 34 Years | 7 (4.9%) | 0 (0.0%) |
| 35 to 64 Years | 30 (11.5%) | 74 (25.2%) |
| 65 to 74 Years | 20 (27.8%) | 33 (39.3%) |
| 75 Years and over | 35 (70.0%) | 76 (56.3%) |
Disability Class by Sex by Age in Greene
Disability Class: Hearing Difficulty
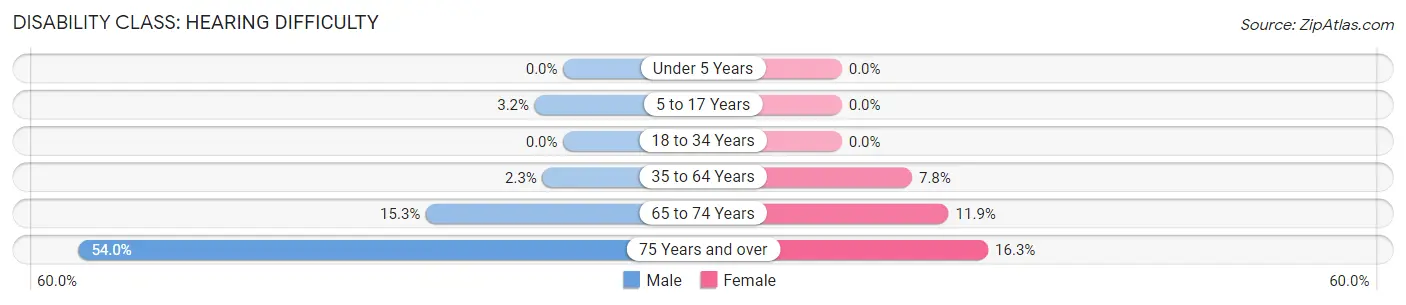
| Age Bracket | Male | Female |
| Under 5 Years | 0 (0.0%) | 0 (0.0%) |
| 5 to 17 Years | 4 (3.2%) | 0 (0.0%) |
| 18 to 34 Years | 0 (0.0%) | 0 (0.0%) |
| 35 to 64 Years | 6 (2.3%) | 23 (7.8%) |
| 65 to 74 Years | 11 (15.3%) | 10 (11.9%) |
| 75 Years and over | 27 (54.0%) | 22 (16.3%) |
Disability Class: Vision Difficulty
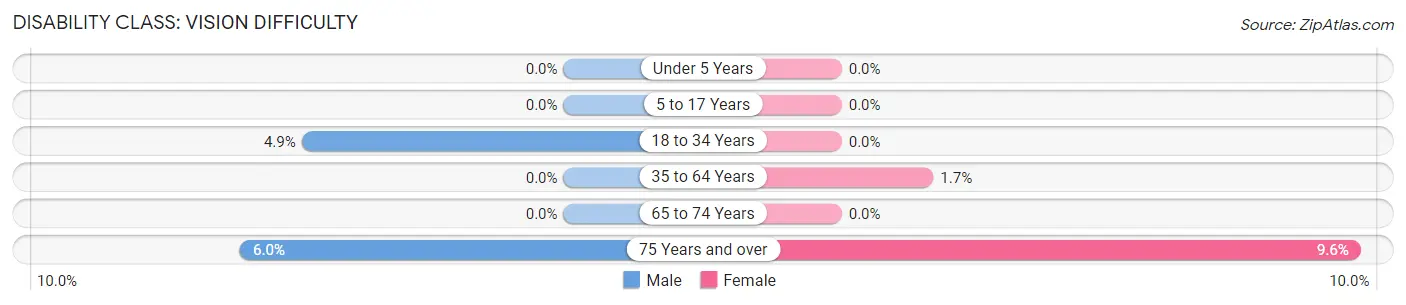
| Age Bracket | Male | Female |
| Under 5 Years | 0 (0.0%) | 0 (0.0%) |
| 5 to 17 Years | 0 (0.0%) | 0 (0.0%) |
| 18 to 34 Years | 7 (4.9%) | 0 (0.0%) |
| 35 to 64 Years | 0 (0.0%) | 5 (1.7%) |
| 65 to 74 Years | 0 (0.0%) | 0 (0.0%) |
| 75 Years and over | 3 (6.0%) | 13 (9.6%) |
Disability Class: Cognitive Difficulty
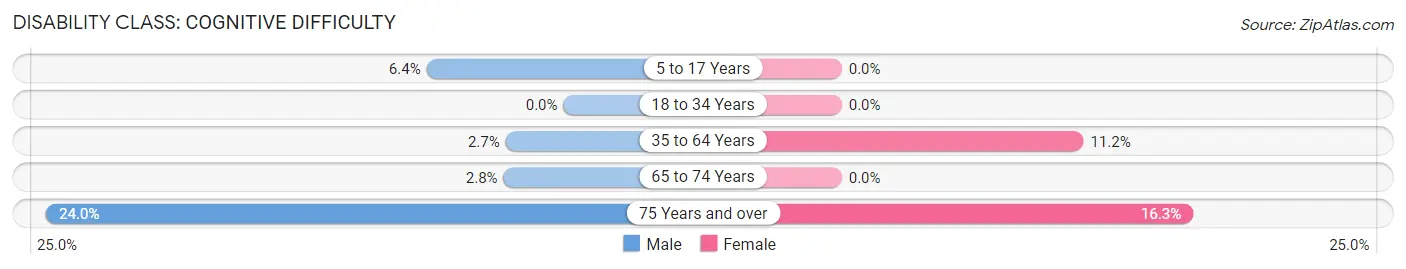
| Age Bracket | Male | Female |
| 5 to 17 Years | 8 (6.4%) | 0 (0.0%) |
| 18 to 34 Years | 0 (0.0%) | 0 (0.0%) |
| 35 to 64 Years | 7 (2.7%) | 33 (11.2%) |
| 65 to 74 Years | 2 (2.8%) | 0 (0.0%) |
| 75 Years and over | 12 (24.0%) | 22 (16.3%) |
Disability Class: Ambulatory Difficulty
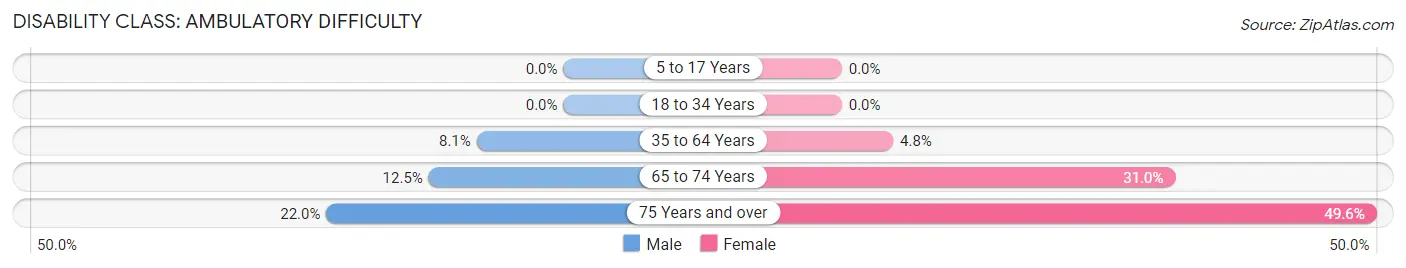
| Age Bracket | Male | Female |
| 5 to 17 Years | 0 (0.0%) | 0 (0.0%) |
| 18 to 34 Years | 0 (0.0%) | 0 (0.0%) |
| 35 to 64 Years | 21 (8.1%) | 14 (4.8%) |
| 65 to 74 Years | 9 (12.5%) | 26 (30.9%) |
| 75 Years and over | 11 (22.0%) | 67 (49.6%) |
Disability Class: Self-Care Difficulty
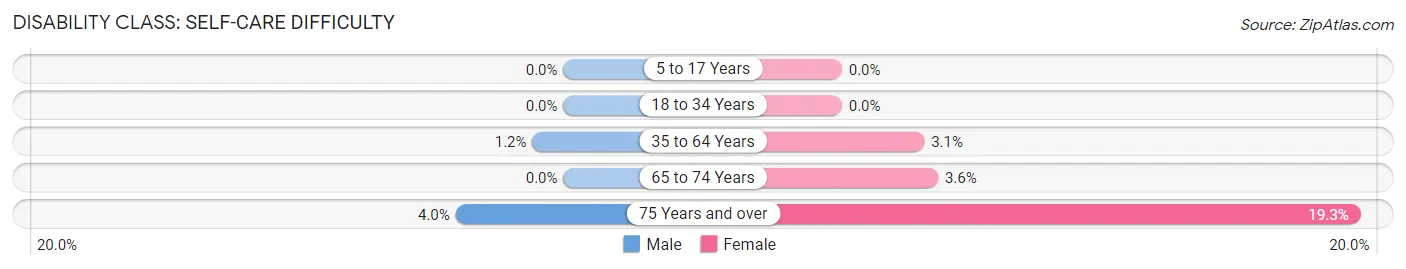
| Age Bracket | Male | Female |
| 5 to 17 Years | 0 (0.0%) | 0 (0.0%) |
| 18 to 34 Years | 0 (0.0%) | 0 (0.0%) |
| 35 to 64 Years | 3 (1.1%) | 9 (3.1%) |
| 65 to 74 Years | 0 (0.0%) | 3 (3.6%) |
| 75 Years and over | 2 (4.0%) | 26 (19.3%) |
Technology Access in Greene
Computing Device Access in Greene
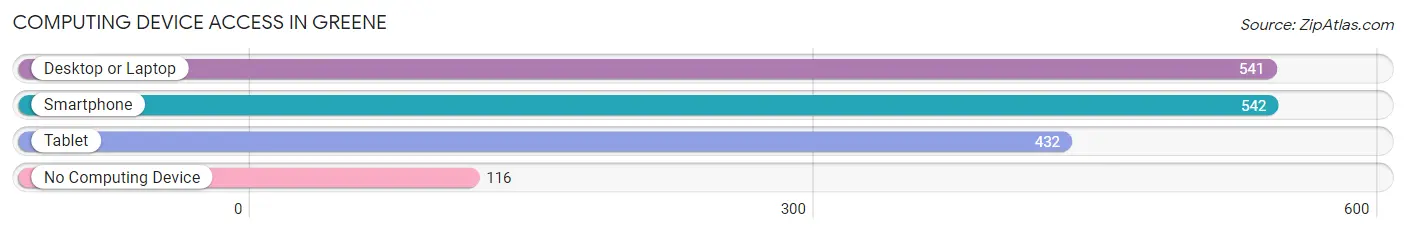
| Device Type | # Households | % Households |
| Desktop or Laptop | 541 | 72.3% |
| Smartphone | 542 | 72.5% |
| Tablet | 432 | 57.8% |
| No Computing Device | 116 | 15.5% |
| Total | 748 | 100.0% |
Internet Access in Greene
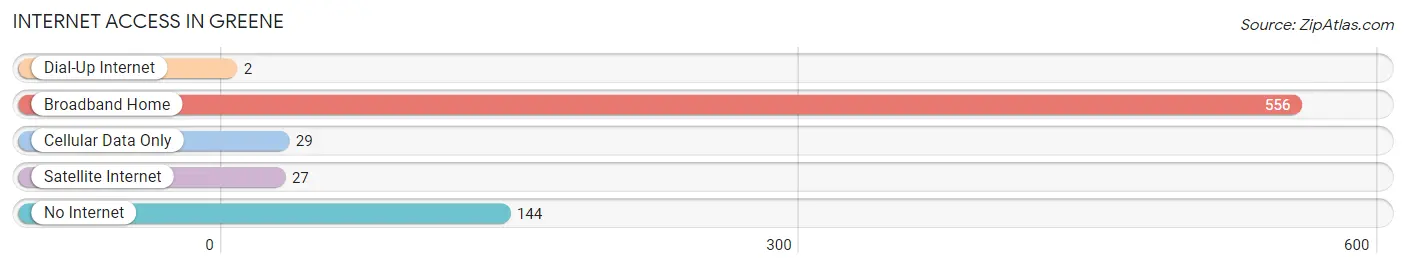
| Internet Type | # Households | % Households |
| Dial-Up Internet | 2 | 0.3% |
| Broadband Home | 556 | 74.3% |
| Cellular Data Only | 29 | 3.9% |
| Satellite Internet | 27 | 3.6% |
| No Internet | 144 | 19.3% |
| Total | 748 | 100.0% |
Greene Summary
Greene is a town located in Chenango County, New York, United States. The population was 4,845 at the 2010 census. The town is named after General Nathanael Greene, a hero of the American Revolution.
Geography
Greene is located in the south-central part of Chenango County, bordered by the towns of Coventry to the north, Oxford to the east, Smithville to the south, and Sherburne to the west. The Unadilla River flows through the town, passing through the village of Greene.
According to the United States Census Bureau, the town has a total area of 39.2sqmi, of which, 39.1sqmi of it is land and 0.1sqmi of it (0.26%) is water.
Demographics
As of the census of 2000, there were 4,845 people, 1,845 households, and 1,323 families residing in the town. The population density was 123.7 people per square mile (47.7/km^2). There were 2,039 housing units at an average density of 52.2 per square mile (20.1/km^2). The racial makeup of the town was 97.90% White, 0.37% African American, 0.17% Native American, 0.37% Asian, 0.02% Pacific Islander, 0.25% from other races, and 0.92% from two or more races. Hispanic or Latino of any race were 0.71% of the population.
There were 1,845 households, out of which 33.2% had children under the age of 18 living with them, 57.2% were married couples living together, 9.3% had a female householder with no husband present, and 29.2% were non-families. 24.2% of all households were made up of individuals, and 11.2% had someone living alone who was 65 years of age or older. The average household size was 2.60 and the average family size was 3.09.
In the town, the population was spread out, with 26.2% under the age of 18, 7.2% from 18 to 24, 28.2% from 25 to 44, 24.2% from 45 to 64, and 14.2% who were 65 years of age or older. The median age was 38 years. For every 100 females, there were 97.2 males. For every 100 females age 18 and over, there were 94.2 males.
The median income for a household in the town was $37,917, and the median income for a family was $44,844. Males had a median income of $31,917 versus $22,917 for females. The per capita income for the town was $17,845. About 6.2% of families and 8.7% of the population were below the poverty line, including 10.2% of those under age 18 and 8.2% of those age 65 or over.
Economy
Greene is a rural town with a primarily agricultural economy. The town is home to several farms, including dairy farms, beef farms, and vegetable farms. The town is also home to several small businesses, including a few restaurants, a hardware store, and a few retail stores.
The town is also home to a few manufacturing companies, including a plastics manufacturer and a metal fabrication company. The town is also home to a few small technology companies, including a software development company and a web design company.
The town is also home to a few educational institutions, including a community college and a technical school. The town is also home to a few churches, including a Methodist church, a Baptist church, and a Catholic church.
Conclusion
Greene is a small town located in Chenango County, New York. The town has a population of 4,845 as of the 2010 census. The town is primarily rural, with a primarily agricultural economy. The town is home to several farms, small businesses, manufacturing companies, technology companies, educational institutions, and churches.
Common Questions
What is Per Capita Income in Greene?
Per Capita income in Greene is $31,599.
What is the Median Family Income in Greene?
Median Family Income in Greene is $74,464.
What is the Median Household income in Greene?
Median Household Income in Greene is $54,167.
What is Income or Wage Gap in Greene?
Income or Wage Gap in Greene is 36.8%.
Women in Greene earn 63.2 cents for every dollar earned by a man.
What is Inequality or Gini Index in Greene?
Inequality or Gini Index in Greene is 0.43.
What is the Total Population of Greene?
Total Population of Greene is 1,574.
What is the Total Male Population of Greene?
Total Male Population of Greene is 713.
What is the Total Female Population of Greene?
Total Female Population of Greene is 861.
What is the Ratio of Males per 100 Females in Greene?
There are 82.81 Males per 100 Females in Greene.
What is the Ratio of Females per 100 Males in Greene?
There are 120.76 Females per 100 Males in Greene.
What is the Median Population Age in Greene?
Median Population Age in Greene is 38.9 Years.
What is the Average Family Size in Greene
Average Family Size in Greene is 2.8 People.
What is the Average Household Size in Greene
Average Household Size in Greene is 2.1 People.
How Large is the Labor Force in Greene?
There are 765 People in the Labor Forcein in Greene.
What is the Percentage of People in the Labor Force in Greene?
60.5% of People are in the Labor Force in Greene.
What is the Unemployment Rate in Greene?
Unemployment Rate in Greene is 7.1%.