Granville, NY Map & Demographics
Granville Map
Granville Overview
$25,754
PER CAPITA INCOME
$57,411
AVG FAMILY INCOME
$46,337
AVG HOUSEHOLD INCOME
30.0%
WAGE / INCOME GAP [ % ]
70.0¢/ $1
WAGE / INCOME GAP [ $ ]
0.42
INEQUALITY / GINI INDEX
2,370
TOTAL POPULATION
1,114
MALE POPULATION
1,256
FEMALE POPULATION
88.69
MALES / 100 FEMALES
112.75
FEMALES / 100 MALES
41.0
MEDIAN AGE
2.8
AVG FAMILY SIZE
2.1
AVG HOUSEHOLD SIZE
1,008
LABOR FORCE [ PEOPLE ]
52.0%
PERCENT IN LABOR FORCE
4.0%
UNEMPLOYMENT RATE
Granville Zip Codes
Granville Area Codes
Income in Granville
Income Overview in Granville
Per Capita Income in Granville is $25,754, while median incomes of families and households are $57,411 and $46,337 respectively.
| Characteristic | Number | Measure |
| Per Capita Income | 2,370 | $25,754 |
| Median Family Income | 555 | $57,411 |
| Mean Family Income | 555 | $58,719 |
| Median Household Income | 1,100 | $46,337 |
| Mean Household Income | 1,100 | $54,591 |
| Income Deficit | 555 | $0 |
| Wage / Income Gap (%) | 2,370 | 29.99% |
| Wage / Income Gap ($) | 2,370 | 70.01¢ per $1 |
| Gini / Inequality Index | 2,370 | 0.42 |
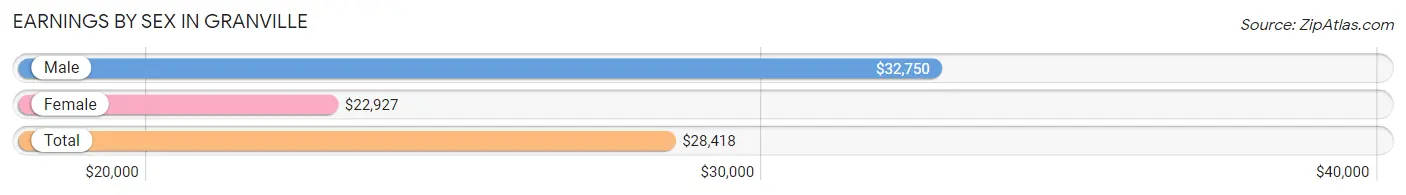
Earnings by Sex in Granville
Average Earnings in Granville are $28,418, $32,750 for men and $22,927 for women, a difference of 30.0%.
| Sex | Number | Average Earnings |
| Male | 607 (53.8%) | $32,750 |
| Female | 522 (46.2%) | $22,927 |
| Total | 1,129 (100.0%) | $28,418 |
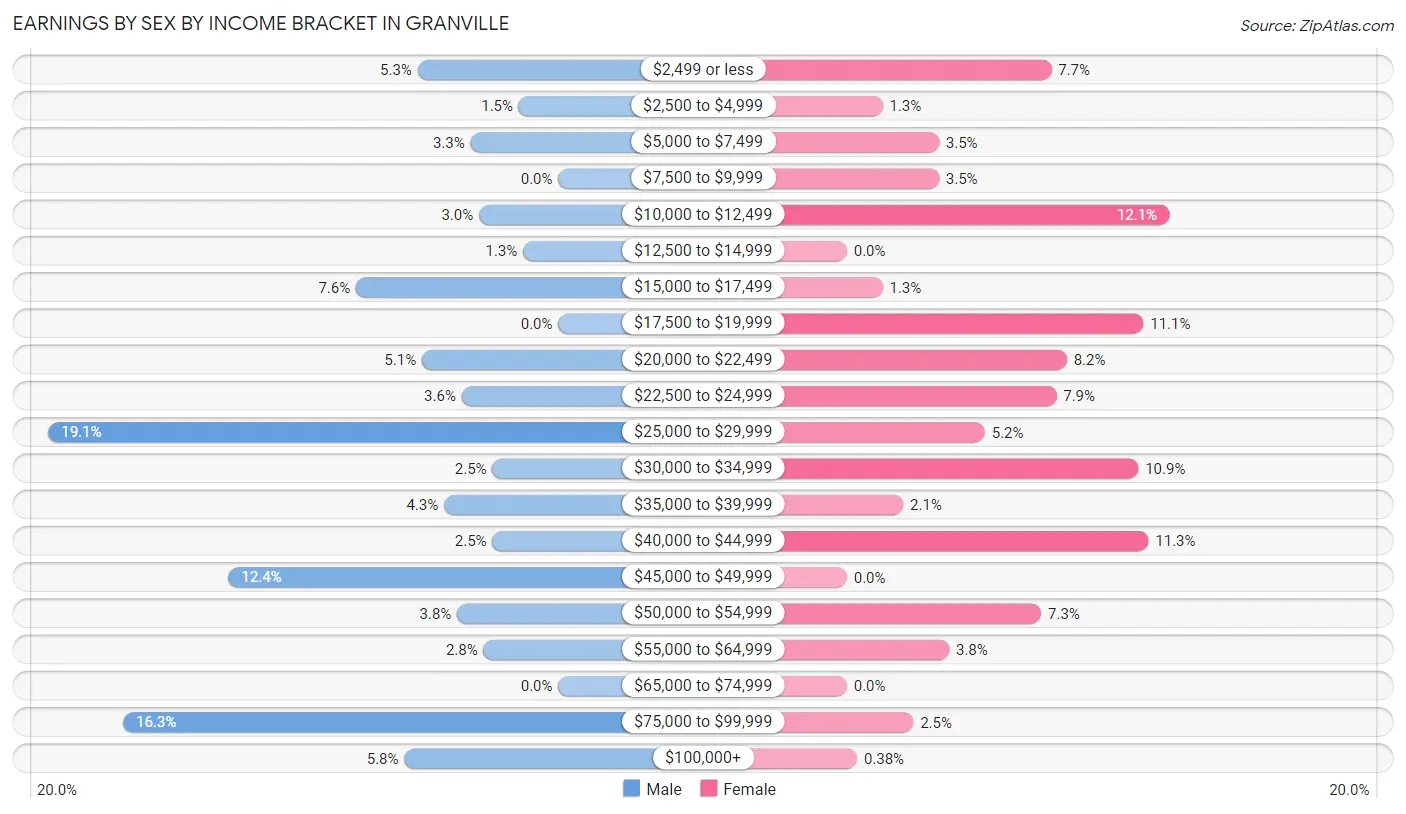
Earnings by Sex by Income Bracket in Granville
The most common earnings brackets in Granville are $25,000 to $29,999 for men (116 | 19.1%) and $10,000 to $12,499 for women (63 | 12.1%).
| Income | Male | Female |
| $2,499 or less | 32 (5.3%) | 40 (7.7%) |
| $2,500 to $4,999 | 9 (1.5%) | 7 (1.3%) |
| $5,000 to $7,499 | 20 (3.3%) | 18 (3.5%) |
| $7,500 to $9,999 | 0 (0.0%) | 18 (3.5%) |
| $10,000 to $12,499 | 18 (3.0%) | 63 (12.1%) |
| $12,500 to $14,999 | 8 (1.3%) | 0 (0.0%) |
| $15,000 to $17,499 | 46 (7.6%) | 7 (1.3%) |
| $17,500 to $19,999 | 0 (0.0%) | 58 (11.1%) |
| $20,000 to $22,499 | 31 (5.1%) | 43 (8.2%) |
| $22,500 to $24,999 | 22 (3.6%) | 41 (7.9%) |
| $25,000 to $29,999 | 116 (19.1%) | 27 (5.2%) |
| $30,000 to $34,999 | 15 (2.5%) | 57 (10.9%) |
| $35,000 to $39,999 | 26 (4.3%) | 11 (2.1%) |
| $40,000 to $44,999 | 15 (2.5%) | 59 (11.3%) |
| $45,000 to $49,999 | 75 (12.4%) | 0 (0.0%) |
| $50,000 to $54,999 | 23 (3.8%) | 38 (7.3%) |
| $55,000 to $64,999 | 17 (2.8%) | 20 (3.8%) |
| $65,000 to $74,999 | 0 (0.0%) | 0 (0.0%) |
| $75,000 to $99,999 | 99 (16.3%) | 13 (2.5%) |
| $100,000+ | 35 (5.8%) | 2 (0.4%) |
| Total | 607 (100.0%) | 522 (100.0%) |
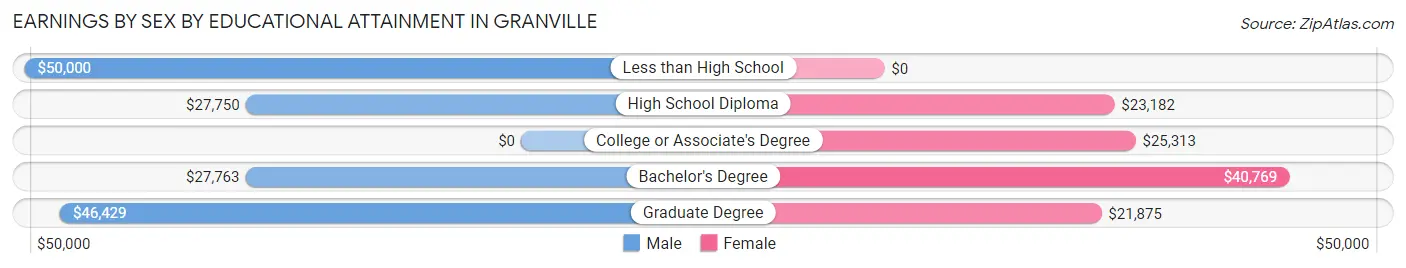
Earnings by Sex by Educational Attainment in Granville
Average earnings in Granville are $36,833 for men and $23,963 for women, a difference of 34.9%. Men with an educational attainment of less than high school enjoy the highest average annual earnings of $50,000, while those with high school diploma education earn the least with $27,750. Women with an educational attainment of bachelor's degree earn the most with the average annual earnings of $40,769, while those with graduate degree education have the smallest earnings of $21,875.
| Educational Attainment | Male Income | Female Income |
| Less than High School | $50,000 | $0 |
| High School Diploma | $27,750 | $23,182 |
| College or Associate's Degree | - | - |
| Bachelor's Degree | $27,763 | $40,769 |
| Graduate Degree | $46,429 | $21,875 |
| Total | $36,833 | $23,963 |
Family Income in Granville
Family Income Brackets in Granville
According to the Granville family income data, there are 109 families falling into the $100,000 to $149,999 income range, which is the most common income bracket and makes up 19.6% of all families.
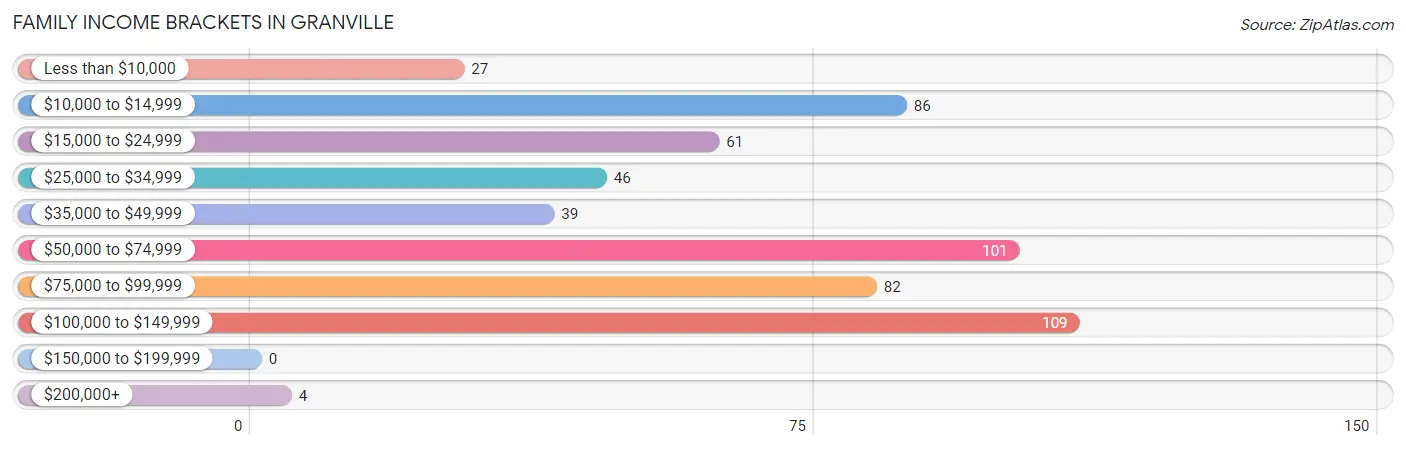
| Income Bracket | # Families | % Families |
| Less than $10,000 | 27 | 4.9% |
| $10,000 to $14,999 | 86 | 15.5% |
| $15,000 to $24,999 | 61 | 11.0% |
| $25,000 to $34,999 | 46 | 8.3% |
| $35,000 to $49,999 | 39 | 7.0% |
| $50,000 to $74,999 | 101 | 18.2% |
| $75,000 to $99,999 | 82 | 14.8% |
| $100,000 to $149,999 | 109 | 19.6% |
| $150,000 to $199,999 | 0 | 0.0% |
| $200,000+ | 4 | 0.7% |
Family Income by Famaliy Size in Granville
3-person families (83 | 14.9%) account for the highest median family income in Granville with $77,188 per family, while 2-person families (363 | 65.4%) have the highest median income of $26,375 per family member.
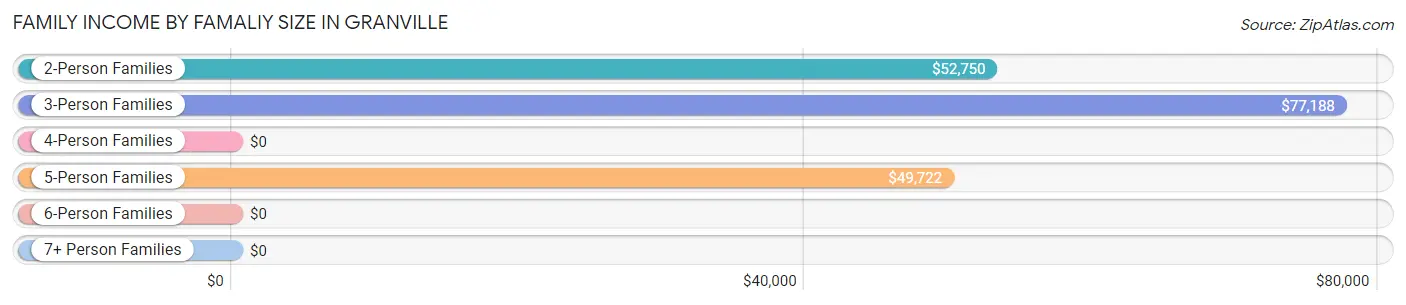
| Income Bracket | # Families | Median Income |
| 2-Person Families | 363 (65.4%) | $52,750 |
| 3-Person Families | 83 (14.9%) | $77,188 |
| 4-Person Families | 51 (9.2%) | $0 |
| 5-Person Families | 58 (10.4%) | $49,722 |
| 6-Person Families | 0 (0.0%) | $0 |
| 7+ Person Families | 0 (0.0%) | $0 |
| Total | 555 (100.0%) | $57,411 |
Family Income by Number of Earners in Granville
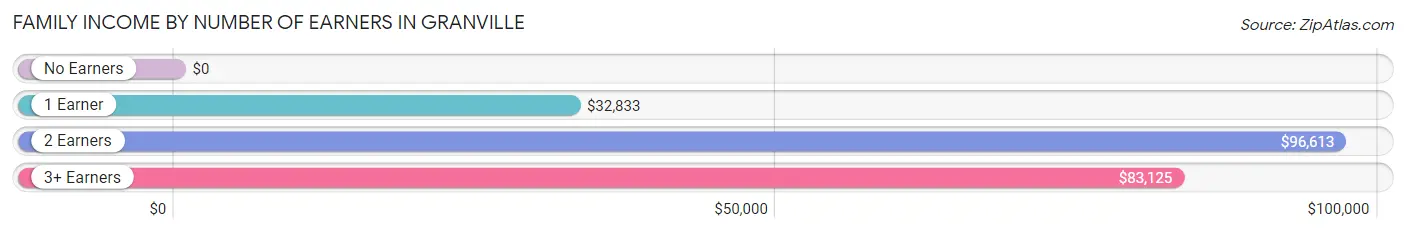
| Number of Earners | # Families | Median Income |
| No Earners | 167 (30.1%) | $0 |
| 1 Earner | 196 (35.3%) | $32,833 |
| 2 Earners | 172 (31.0%) | $96,613 |
| 3+ Earners | 20 (3.6%) | $83,125 |
| Total | 555 (100.0%) | $57,411 |
Household Income in Granville
Household Income Brackets in Granville
With 226 households falling in the category, the $50,000 to $74,999 income range is the most frequent in Granville, accounting for 20.5% of all households.
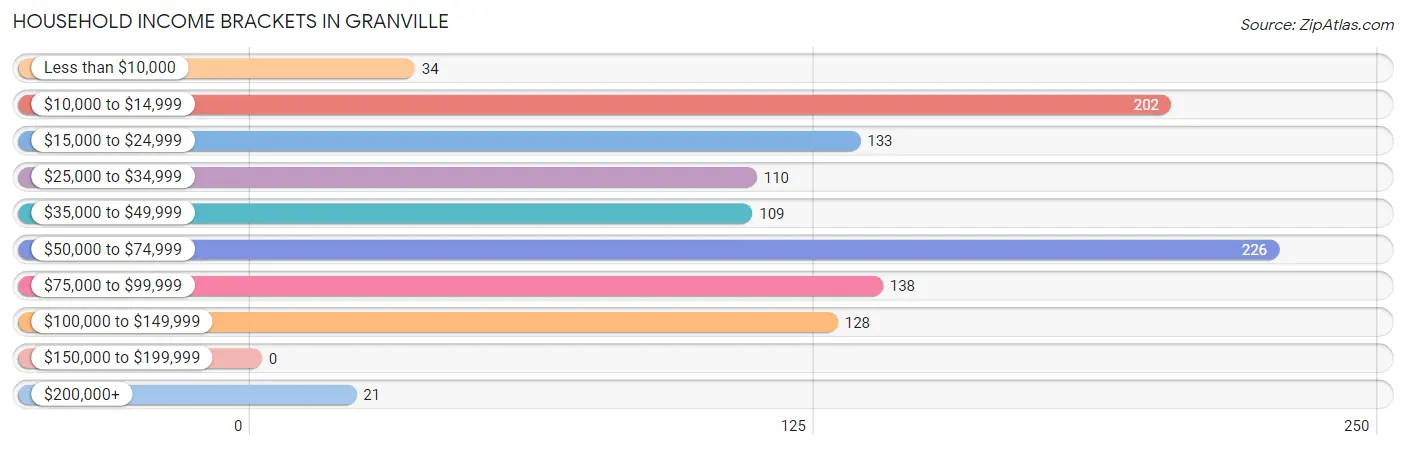
| Income Bracket | # Households | % Households |
| Less than $10,000 | 34 | 3.1% |
| $10,000 to $14,999 | 202 | 18.4% |
| $15,000 to $24,999 | 133 | 12.1% |
| $25,000 to $34,999 | 110 | 10.0% |
| $35,000 to $49,999 | 109 | 9.9% |
| $50,000 to $74,999 | 226 | 20.5% |
| $75,000 to $99,999 | 138 | 12.5% |
| $100,000 to $149,999 | 128 | 11.6% |
| $150,000 to $199,999 | 0 | 0.0% |
| $200,000+ | 21 | 1.9% |
Household Income by Householder Age in Granville
The median household income in Granville is $46,337, with the highest median household income of $70,438 found in the 45 to 64 years age bracket for the primary householder. A total of 364 households (33.1%) fall into this category. Meanwhile, the 15 to 24 years age bracket for the primary householder has the lowest median household income of $0, with 41 households (3.7%) in this group.
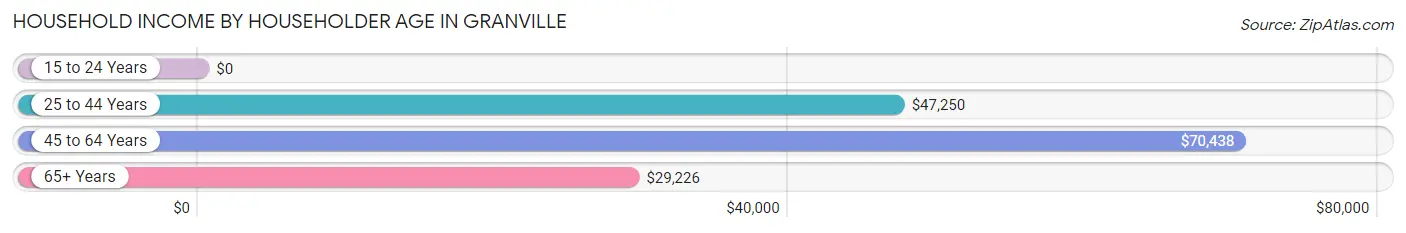
| Income Bracket | # Households | Median Income |
| 15 to 24 Years | 41 (3.7%) | $0 |
| 25 to 44 Years | 384 (34.9%) | $47,250 |
| 45 to 64 Years | 364 (33.1%) | $70,438 |
| 65+ Years | 311 (28.3%) | $29,226 |
| Total | 1,100 (100.0%) | $46,337 |
Poverty in Granville
Income Below Poverty by Sex and Age in Granville
With 21.3% poverty level for males and 29.1% for females among the residents of Granville, 5 year old males and 16 and 17 year old females are the most vulnerable to poverty, with 14 males (100.0%) and 16 females (57.1%) in their respective age groups living below the poverty level.
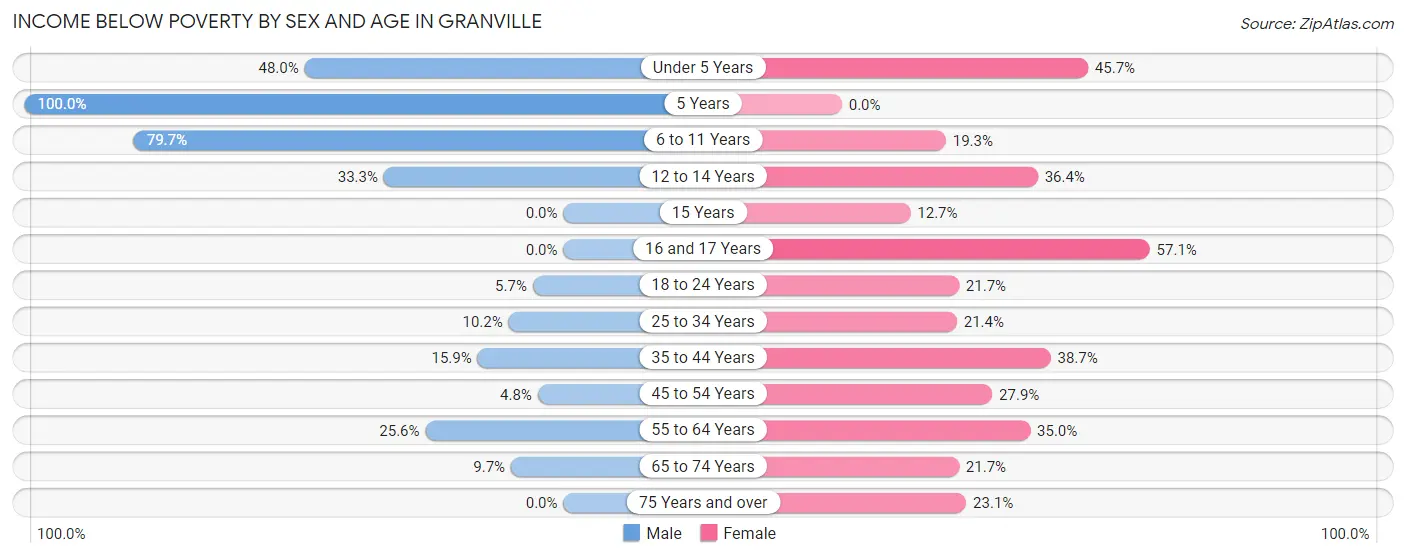
| Age Bracket | Male | Female |
| Under 5 Years | 49 (48.0%) | 37 (45.7%) |
| 5 Years | 14 (100.0%) | 0 (0.0%) |
| 6 to 11 Years | 59 (79.7%) | 11 (19.3%) |
| 12 to 14 Years | 5 (33.3%) | 8 (36.4%) |
| 15 Years | 0 (0.0%) | 7 (12.7%) |
| 16 and 17 Years | 0 (0.0%) | 16 (57.1%) |
| 18 to 24 Years | 5 (5.7%) | 15 (21.7%) |
| 25 to 34 Years | 12 (10.2%) | 41 (21.3%) |
| 35 to 44 Years | 32 (15.9%) | 74 (38.7%) |
| 45 to 54 Years | 7 (4.8%) | 36 (27.9%) |
| 55 to 64 Years | 42 (25.6%) | 65 (34.9%) |
| 65 to 74 Years | 11 (9.7%) | 25 (21.7%) |
| 75 Years and over | 0 (0.0%) | 27 (23.1%) |
| Total | 236 (21.3%) | 362 (29.1%) |
Income Above Poverty by Sex and Age in Granville
According to the poverty statistics in Granville, males aged 15 years and females aged 15 years are the age groups that are most secure financially, with 100.0% of males and 87.3% of females in these age groups living above the poverty line.
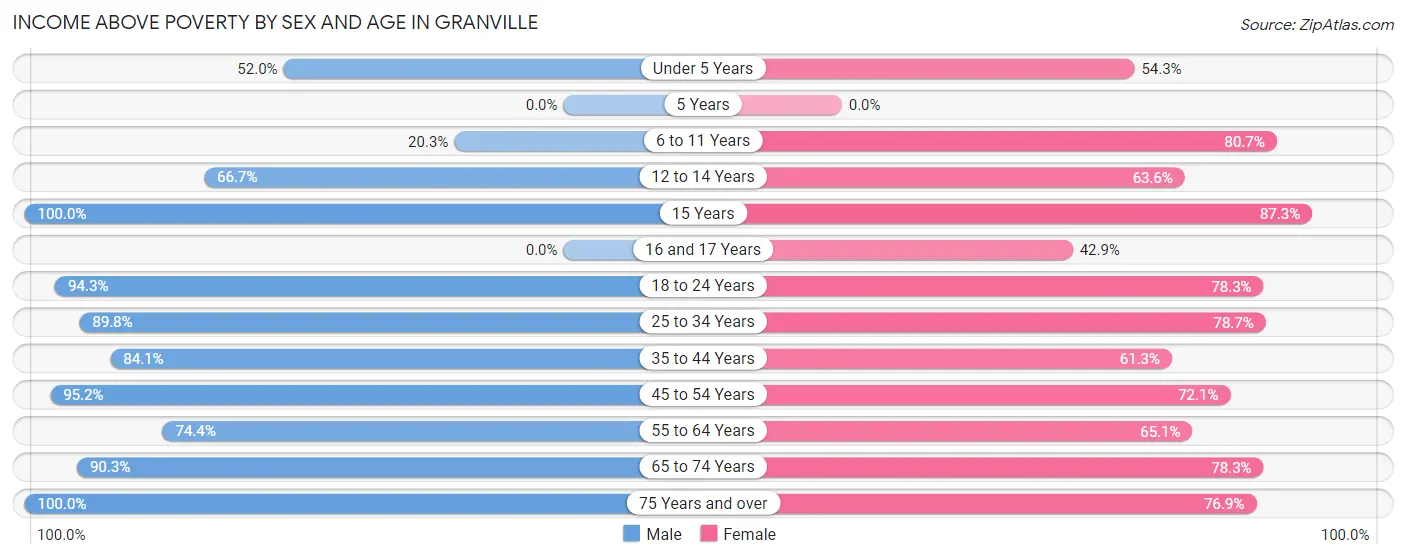
| Age Bracket | Male | Female |
| Under 5 Years | 53 (52.0%) | 44 (54.3%) |
| 5 Years | 0 (0.0%) | 0 (0.0%) |
| 6 to 11 Years | 15 (20.3%) | 46 (80.7%) |
| 12 to 14 Years | 10 (66.7%) | 14 (63.6%) |
| 15 Years | 12 (100.0%) | 48 (87.3%) |
| 16 and 17 Years | 0 (0.0%) | 12 (42.9%) |
| 18 to 24 Years | 83 (94.3%) | 54 (78.3%) |
| 25 to 34 Years | 106 (89.8%) | 151 (78.6%) |
| 35 to 44 Years | 169 (84.1%) | 117 (61.3%) |
| 45 to 54 Years | 140 (95.2%) | 93 (72.1%) |
| 55 to 64 Years | 122 (74.4%) | 121 (65.0%) |
| 65 to 74 Years | 102 (90.3%) | 90 (78.3%) |
| 75 Years and over | 59 (100.0%) | 90 (76.9%) |
| Total | 871 (78.7%) | 880 (70.9%) |
Income Below Poverty Among Married-Couple Families in Granville
The poverty statistics for married-couple families in Granville show that 11.2% or 36 of the total 323 families live below the poverty line. Families with 1 or 2 children have the highest poverty rate of 19.7%, comprising of 12 families. On the other hand, families with 3 or 4 children have the lowest poverty rate of 0.0%, which includes 0 families.
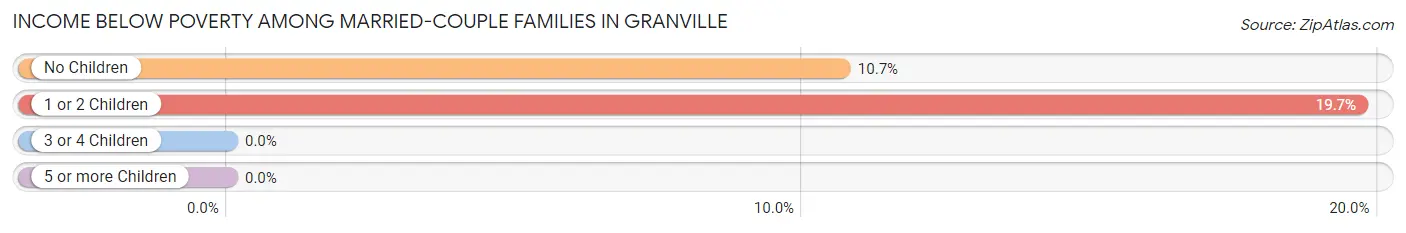
| Children | Above Poverty | Below Poverty |
| No Children | 201 (89.3%) | 24 (10.7%) |
| 1 or 2 Children | 49 (80.3%) | 12 (19.7%) |
| 3 or 4 Children | 37 (100.0%) | 0 (0.0%) |
| 5 or more Children | 0 (0.0%) | 0 (0.0%) |
| Total | 287 (88.8%) | 36 (11.2%) |
Income Below Poverty Among Single-Parent Households in Granville
According to the poverty data in Granville, 25.5% or 14 single-father households and 66.1% or 117 single-mother households are living below the poverty line. Among single-father households, those with 1 or 2 children have the highest poverty rate, with 14 households (40.0%) experiencing poverty. Likewise, among single-mother households, those with 3 or 4 children have the highest poverty rate, with 17 households (100.0%) falling below the poverty line.
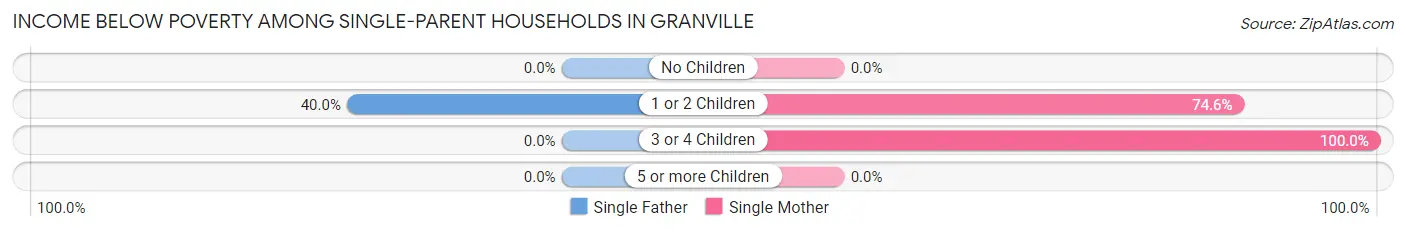
| Children | Single Father | Single Mother |
| No Children | 0 (0.0%) | 0 (0.0%) |
| 1 or 2 Children | 14 (40.0%) | 100 (74.6%) |
| 3 or 4 Children | 0 (0.0%) | 17 (100.0%) |
| 5 or more Children | 0 (0.0%) | 0 (0.0%) |
| Total | 14 (25.5%) | 117 (66.1%) |
Income Below Poverty Among Married-Couple vs Single-Parent Households in Granville
The poverty data for Granville shows that 36 of the married-couple family households (11.2%) and 131 of the single-parent households (56.5%) are living below the poverty level. Within the married-couple family households, those with 1 or 2 children have the highest poverty rate, with 12 households (19.7%) falling below the poverty line. Among the single-parent households, those with 3 or 4 children have the highest poverty rate, with 17 household (100.0%) living below poverty.
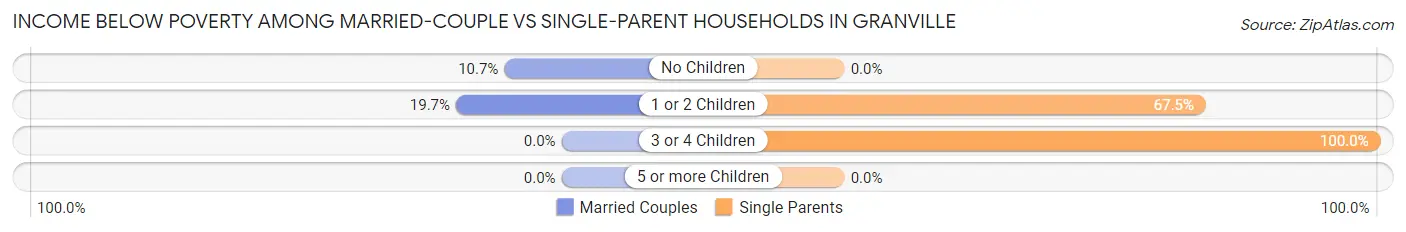
| Children | Married-Couple Families | Single-Parent Households |
| No Children | 24 (10.7%) | 0 (0.0%) |
| 1 or 2 Children | 12 (19.7%) | 114 (67.5%) |
| 3 or 4 Children | 0 (0.0%) | 17 (100.0%) |
| 5 or more Children | 0 (0.0%) | 0 (0.0%) |
| Total | 36 (11.2%) | 131 (56.5%) |
Race in Granville
The most populous races in Granville are White / Caucasian (2,335 | 98.5%), Two or more Races (28 | 1.2%), and Asian (7 | 0.3%).
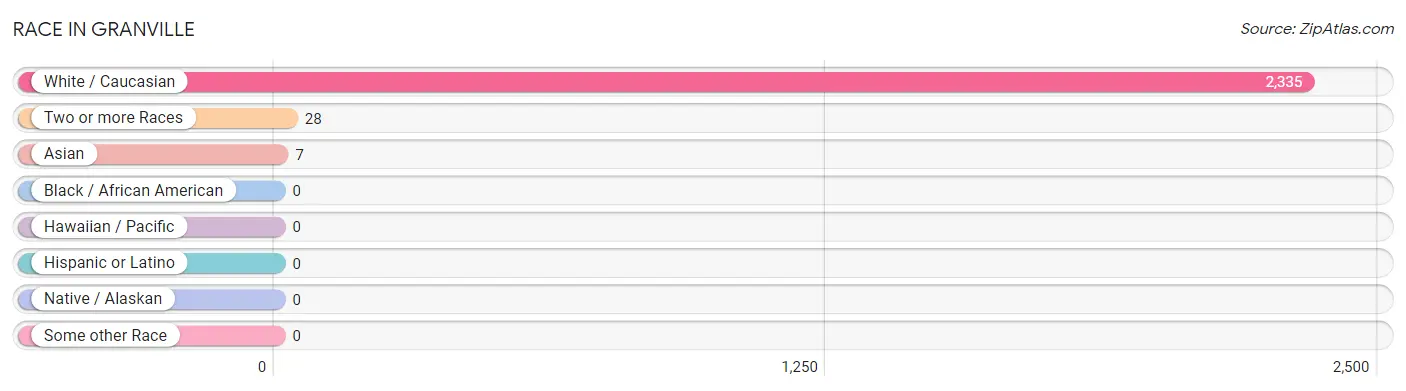
| Race | # Population | % Population |
| Asian | 7 | 0.3% |
| Black / African American | 0 | 0.0% |
| Hawaiian / Pacific | 0 | 0.0% |
| Hispanic or Latino | 0 | 0.0% |
| Native / Alaskan | 0 | 0.0% |
| White / Caucasian | 2,335 | 98.5% |
| Two or more Races | 28 | 1.2% |
| Some other Race | 0 | 0.0% |
| Total | 2,370 | 100.0% |
Ancestry in Granville
The most populous ancestries reported in Granville are Irish (338 | 14.3%), English (201 | 8.5%), American (192 | 8.1%), Welsh (182 | 7.7%), and German (177 | 7.5%), together accounting for 46.0% of all Granville residents.
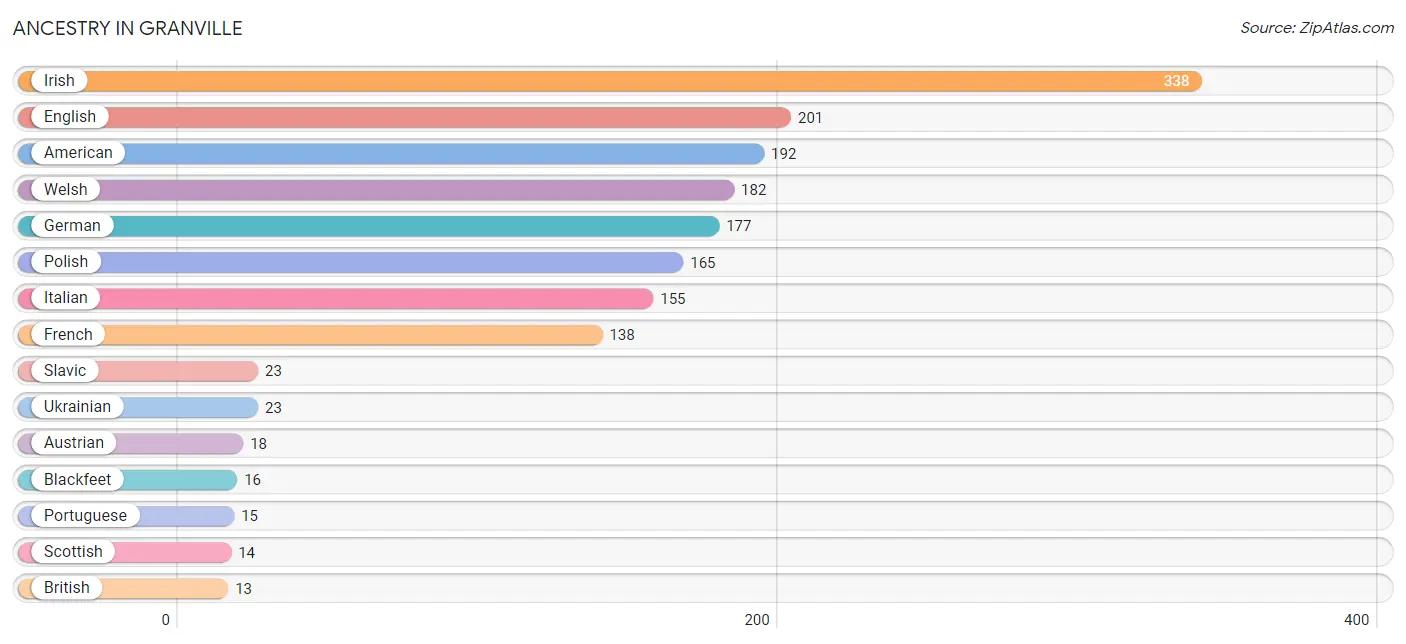
| Ancestry | # Population | % Population |
| American | 192 | 8.1% |
| Austrian | 18 | 0.8% |
| Blackfeet | 16 | 0.7% |
| British | 13 | 0.5% |
| Czech | 7 | 0.3% |
| Dutch | 6 | 0.3% |
| Eastern European | 7 | 0.3% |
| English | 201 | 8.5% |
| French | 138 | 5.8% |
| French Canadian | 13 | 0.5% |
| German | 177 | 7.5% |
| Greek | 10 | 0.4% |
| Irish | 338 | 14.3% |
| Italian | 155 | 6.5% |
| Korean | 7 | 0.3% |
| Native Hawaiian | 1 | 0.0% |
| Norwegian | 3 | 0.1% |
| Polish | 165 | 7.0% |
| Portuguese | 15 | 0.6% |
| Scotch-Irish | 4 | 0.2% |
| Scottish | 14 | 0.6% |
| Slavic | 23 | 1.0% |
| Slovak | 5 | 0.2% |
| Swedish | 5 | 0.2% |
| Swiss | 6 | 0.3% |
| Ukrainian | 23 | 1.0% |
| Welsh | 182 | 7.7% | View All 27 Rows |
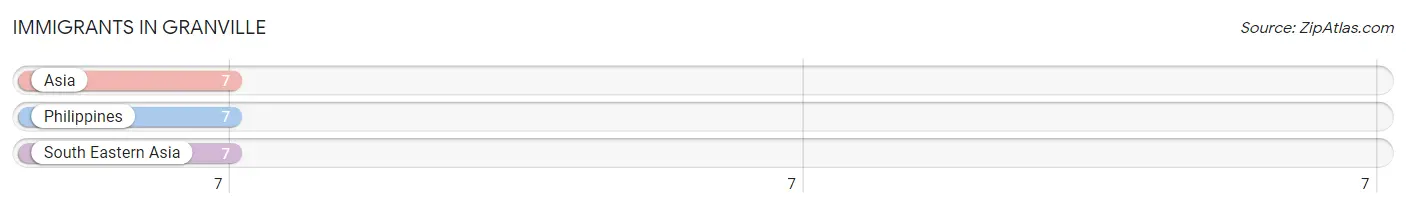
Immigrants in Granville
The most numerous immigrant groups reported in Granville came from Asia (7 | 0.3%), Philippines (7 | 0.3%), and South Eastern Asia (7 | 0.3%), together accounting for 0.9% of all Granville residents.
| Immigration Origin | # Population | % Population |
| Asia | 7 | 0.3% |
| Philippines | 7 | 0.3% |
| South Eastern Asia | 7 | 0.3% | View All 3 Rows |
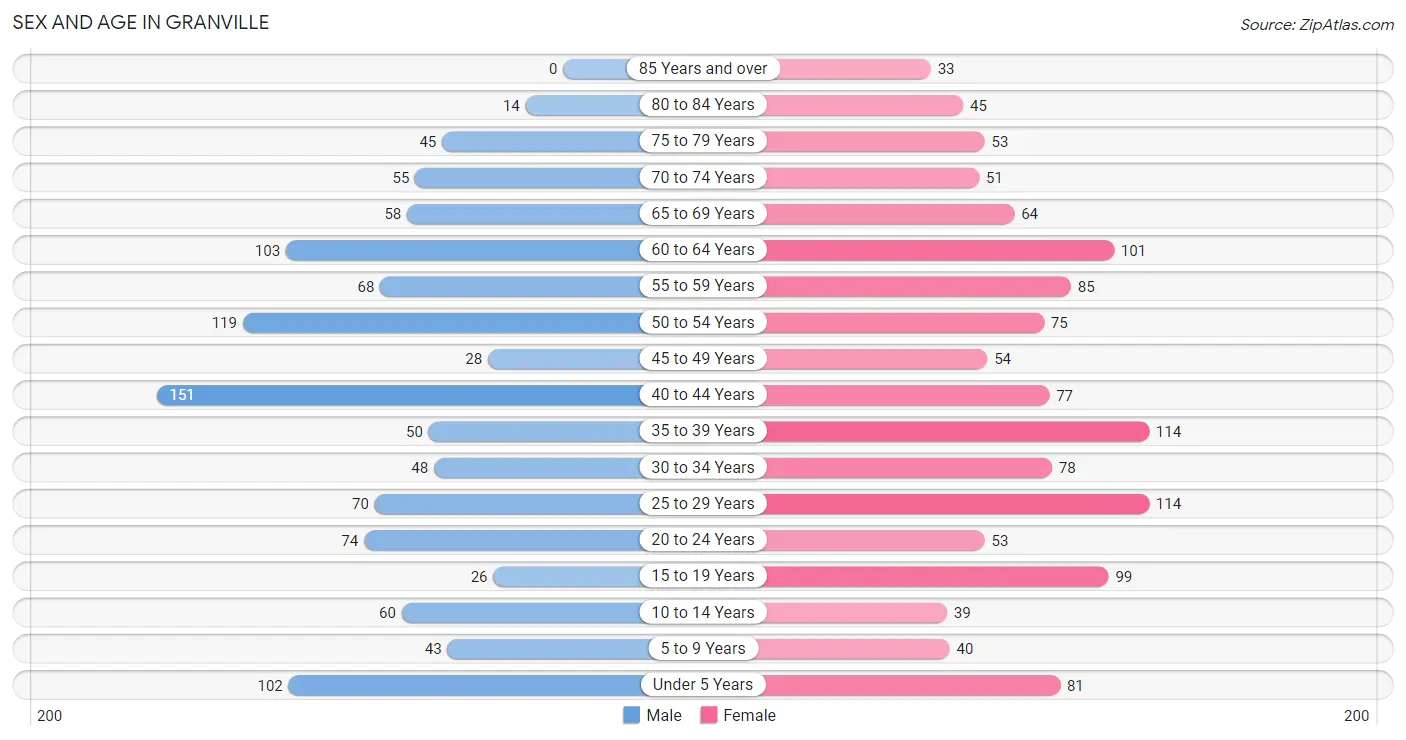
Sex and Age in Granville
Sex and Age in Granville
The most populous age groups in Granville are 40 to 44 Years (151 | 13.6%) for men and 25 to 29 Years (114 | 9.1%) for women.
| Age Bracket | Male | Female |
| Under 5 Years | 102 (9.2%) | 81 (6.5%) |
| 5 to 9 Years | 43 (3.9%) | 40 (3.2%) |
| 10 to 14 Years | 60 (5.4%) | 39 (3.1%) |
| 15 to 19 Years | 26 (2.3%) | 99 (7.9%) |
| 20 to 24 Years | 74 (6.6%) | 53 (4.2%) |
| 25 to 29 Years | 70 (6.3%) | 114 (9.1%) |
| 30 to 34 Years | 48 (4.3%) | 78 (6.2%) |
| 35 to 39 Years | 50 (4.5%) | 114 (9.1%) |
| 40 to 44 Years | 151 (13.6%) | 77 (6.1%) |
| 45 to 49 Years | 28 (2.5%) | 54 (4.3%) |
| 50 to 54 Years | 119 (10.7%) | 75 (6.0%) |
| 55 to 59 Years | 68 (6.1%) | 85 (6.8%) |
| 60 to 64 Years | 103 (9.2%) | 101 (8.0%) |
| 65 to 69 Years | 58 (5.2%) | 64 (5.1%) |
| 70 to 74 Years | 55 (4.9%) | 51 (4.1%) |
| 75 to 79 Years | 45 (4.0%) | 53 (4.2%) |
| 80 to 84 Years | 14 (1.3%) | 45 (3.6%) |
| 85 Years and over | 0 (0.0%) | 33 (2.6%) |
| Total | 1,114 (100.0%) | 1,256 (100.0%) |
Families and Households in Granville
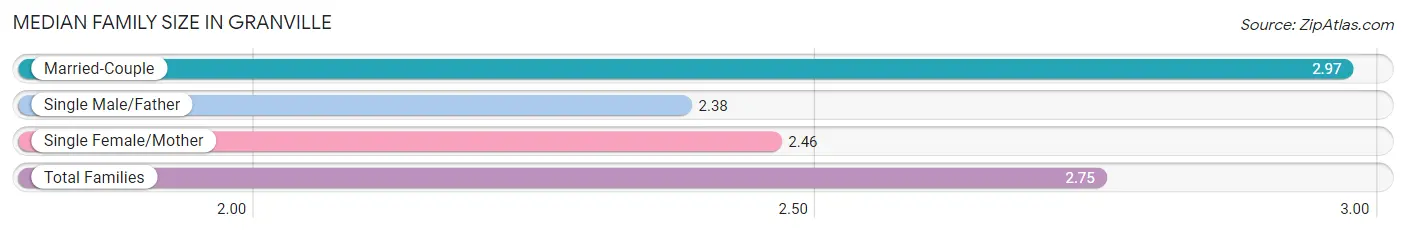
Median Family Size in Granville
The median family size in Granville is 2.75 persons per family, with married-couple families (323 | 58.2%) accounting for the largest median family size of 2.97 persons per family. On the other hand, single male/father families (55 | 9.9%) represent the smallest median family size with 2.38 persons per family.
| Family Type | # Families | Family Size |
| Married-Couple | 323 (58.2%) | 2.97 |
| Single Male/Father | 55 (9.9%) | 2.38 |
| Single Female/Mother | 177 (31.9%) | 2.46 |
| Total Families | 555 (100.0%) | 2.75 |
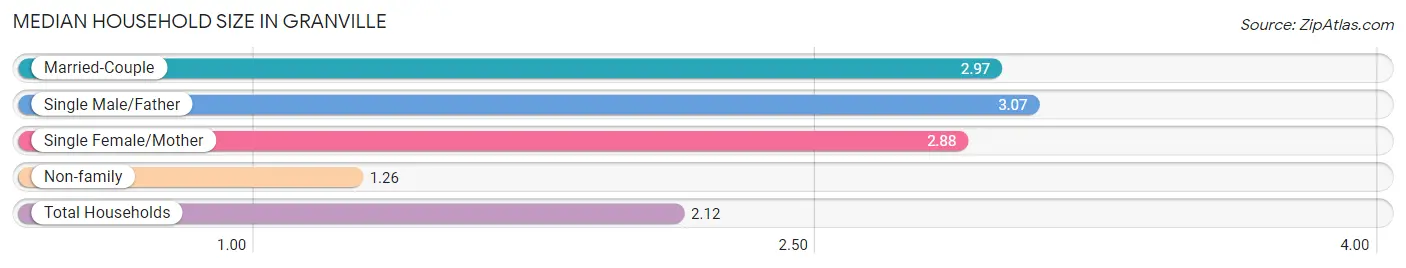
Median Household Size in Granville
The median household size in Granville is 2.12 persons per household, with single male/father households (55 | 5.0%) accounting for the largest median household size of 3.07 persons per household. non-family households (545 | 49.5%) represent the smallest median household size with 1.26 persons per household.
| Household Type | # Households | Household Size |
| Married-Couple | 323 (29.4%) | 2.97 |
| Single Male/Father | 55 (5.0%) | 3.07 |
| Single Female/Mother | 177 (16.1%) | 2.88 |
| Non-family | 545 (49.5%) | 1.26 |
| Total Households | 1,100 (100.0%) | 2.12 |
Household Size by Marriage Status in Granville
Out of a total of 1,100 households in Granville, 555 (50.4%) are family households, while 545 (49.5%) are nonfamily households. The most numerous type of family households are 2-person households, comprising 307, and the most common type of nonfamily households are 1-person households, comprising 417.
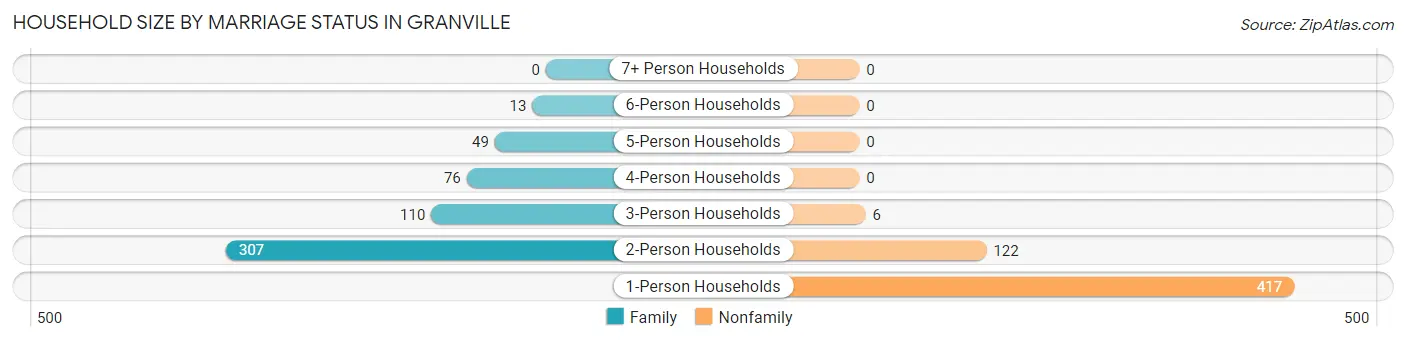
| Household Size | Family Households | Nonfamily Households |
| 1-Person Households | - | 417 (37.9%) |
| 2-Person Households | 307 (27.9%) | 122 (11.1%) |
| 3-Person Households | 110 (10.0%) | 6 (0.5%) |
| 4-Person Households | 76 (6.9%) | 0 (0.0%) |
| 5-Person Households | 49 (4.4%) | 0 (0.0%) |
| 6-Person Households | 13 (1.2%) | 0 (0.0%) |
| 7+ Person Households | 0 (0.0%) | 0 (0.0%) |
| Total | 555 (50.4%) | 545 (49.5%) |
Female Fertility in Granville
Fertility by Age in Granville
Average fertility rate in Granville is 25.0 births per 1,000 women. Women in the age bracket of 20 to 34 years have the highest fertility rate with 61.0 births per 1,000 women. Women in the age bracket of 20 to 34 years acount for 100.0% of all women with births.
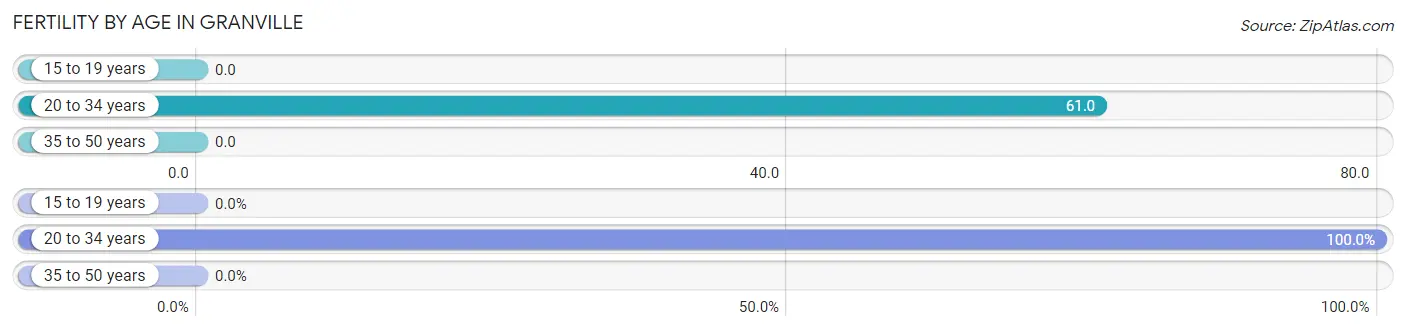
| Age Bracket | Women with Births | Births / 1,000 Women |
| 15 to 19 years | 0 (0.0%) | 0.0 |
| 20 to 34 years | 15 (100.0%) | 61.0 |
| 35 to 50 years | 0 (0.0%) | 0.0 |
| Total | 15 (100.0%) | 25.0 |
Fertility by Age by Marriage Status in Granville
46.7% of women with births (15) in Granville are married. The highest percentage of unmarried women with births falls into 20 to 34 years age bracket with 53.3% of them unmarried at the time of birth, while the lowest percentage of unmarried women with births belong to 20 to 34 years age bracket with 53.3% of them unmarried.
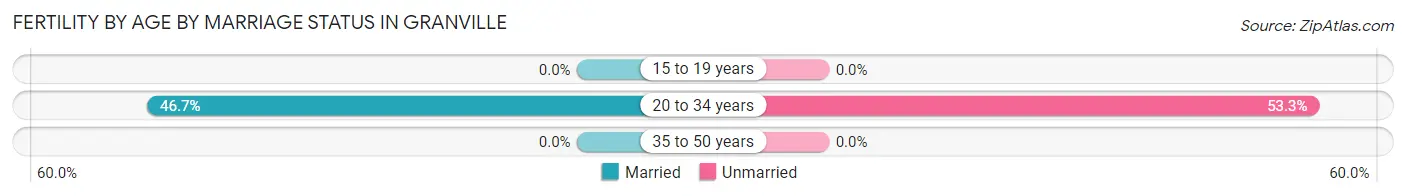
| Age Bracket | Married | Unmarried |
| 15 to 19 years | 0 (0.0%) | 0 (0.0%) |
| 20 to 34 years | 7 (46.7%) | 8 (53.3%) |
| 35 to 50 years | 0 (0.0%) | 0 (0.0%) |
| Total | 7 (46.7%) | 8 (53.3%) |
Fertility by Education in Granville
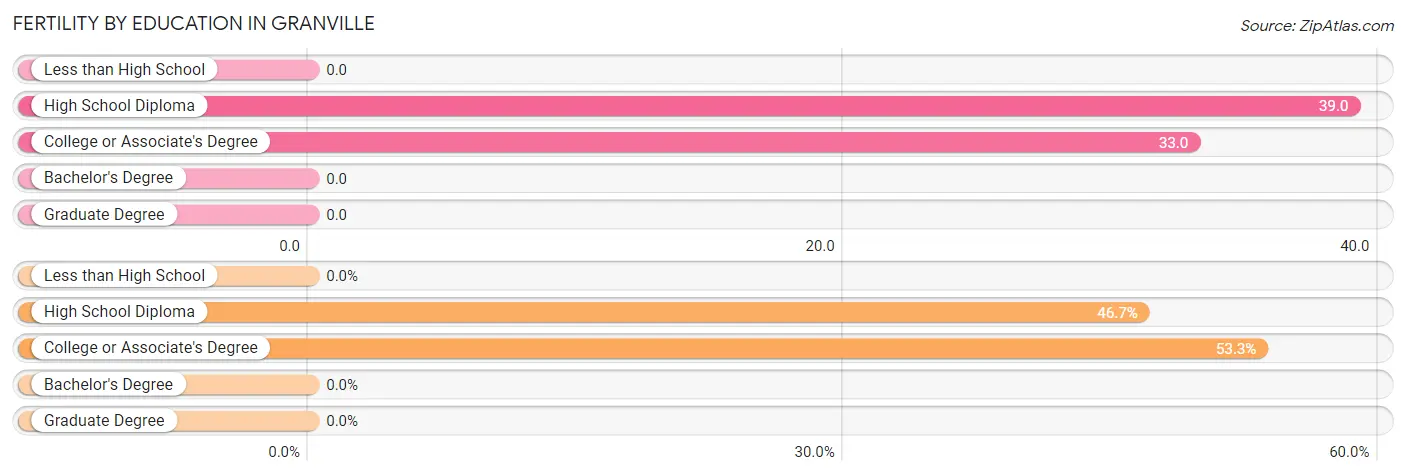
| Educational Attainment | Women with Births | Births / 1,000 Women |
| Less than High School | 0 (0.0%) | 0.0 |
| High School Diploma | 7 (46.7%) | 39.0 |
| College or Associate's Degree | 8 (53.3%) | 33.0 |
| Bachelor's Degree | 0 (0.0%) | 0.0 |
| Graduate Degree | 0 (0.0%) | 0.0 |
| Total | 15 (100.0%) | 25.0 |
Fertility by Education by Marriage Status in Granville
53.3% of women with births in Granville are unmarried. Women with the educational attainment of high school diploma are most likely to be married with 100.0% of them married at childbirth, while women with the educational attainment of college or associate's degree are least likely to be married with 100.0% of them unmarried at childbirth.
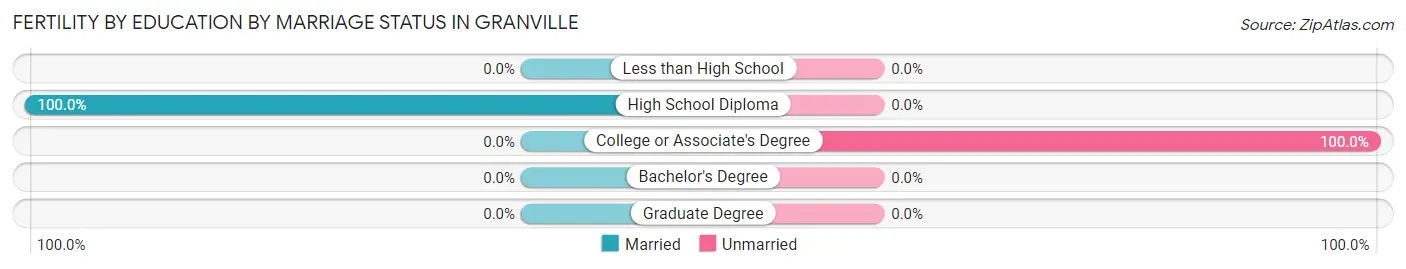
| Educational Attainment | Married | Unmarried |
| Less than High School | 0 (0.0%) | 0 (0.0%) |
| High School Diploma | 7 (100.0%) | 0 (0.0%) |
| College or Associate's Degree | 0 (0.0%) | 8 (100.0%) |
| Bachelor's Degree | 0 (0.0%) | 0 (0.0%) |
| Graduate Degree | 0 (0.0%) | 0 (0.0%) |
| Total | 7 (46.7%) | 8 (53.3%) |
Employment Characteristics in Granville
Employment by Class of Employer in Granville
Among the 941 employed individuals in Granville, private company employees (645 | 68.5%), local government employees (101 | 10.7%), and not-for-profit organizations (81 | 8.6%) make up the most common classes of employment.
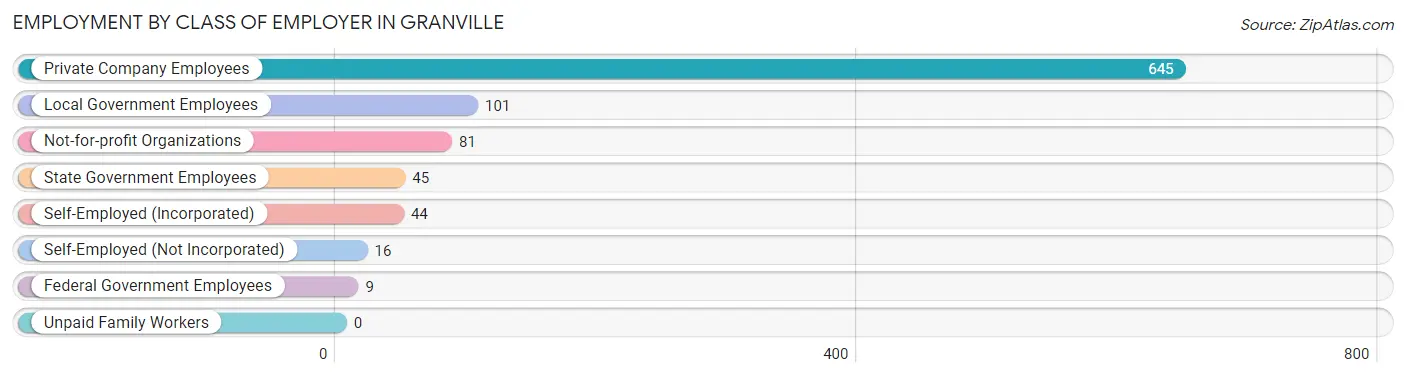
| Employer Class | # Employees | % Employees |
| Private Company Employees | 645 | 68.5% |
| Self-Employed (Incorporated) | 44 | 4.7% |
| Self-Employed (Not Incorporated) | 16 | 1.7% |
| Not-for-profit Organizations | 81 | 8.6% |
| Local Government Employees | 101 | 10.7% |
| State Government Employees | 45 | 4.8% |
| Federal Government Employees | 9 | 1.0% |
| Unpaid Family Workers | 0 | 0.0% |
| Total | 941 | 100.0% |
Employment Status by Age in Granville
According to the labor force statistics for Granville, out of the total population over 16 years of age (1,938), 52.0% or 1,008 individuals are in the labor force, with 4.0% or 40 of them unemployed. The age group with the highest labor force participation rate is 30 to 34 years, with 94.4% or 119 individuals in the labor force. Within the labor force, the 20 to 24 years age range has the highest percentage of unemployed individuals, with 25.0% or 22 of them being unemployed.
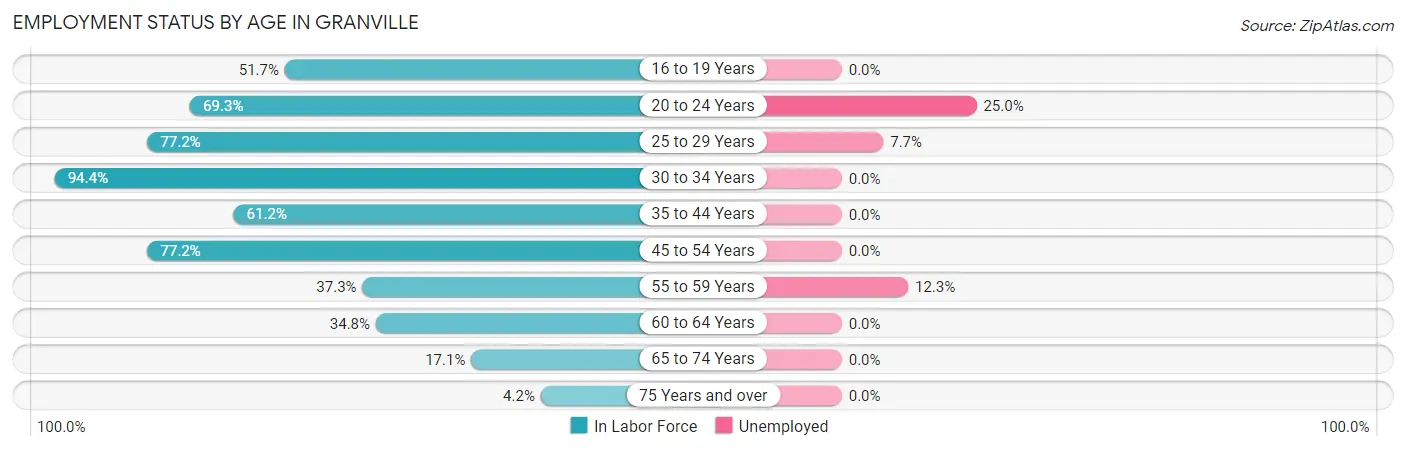
| Age Bracket | In Labor Force | Unemployed |
| 16 to 19 Years | 30 (51.7%) | 0 (0.0%) |
| 20 to 24 Years | 88 (69.3%) | 22 (25.0%) |
| 25 to 29 Years | 142 (77.2%) | 11 (7.7%) |
| 30 to 34 Years | 119 (94.4%) | 0 (0.0%) |
| 35 to 44 Years | 240 (61.2%) | 0 (0.0%) |
| 45 to 54 Years | 213 (77.2%) | 0 (0.0%) |
| 55 to 59 Years | 57 (37.3%) | 7 (12.3%) |
| 60 to 64 Years | 71 (34.8%) | 0 (0.0%) |
| 65 to 74 Years | 39 (17.1%) | 0 (0.0%) |
| 75 Years and over | 8 (4.2%) | 0 (0.0%) |
| Total | 1,008 (52.0%) | 40 (4.0%) |
Employment Status by Educational Attainment in Granville
According to labor force statistics for Granville, 63.1% of individuals (842) out of the total population between 25 and 64 years of age (1,335) are in the labor force, with 2.1% or 18 of them being unemployed. The group with the highest labor force participation rate are those with the educational attainment of bachelor's degree or higher, with 78.2% or 187 individuals in the labor force. Within the labor force, individuals with less than high school education have the highest percentage of unemployment, with 8.8% or 7 of them being unemployed.
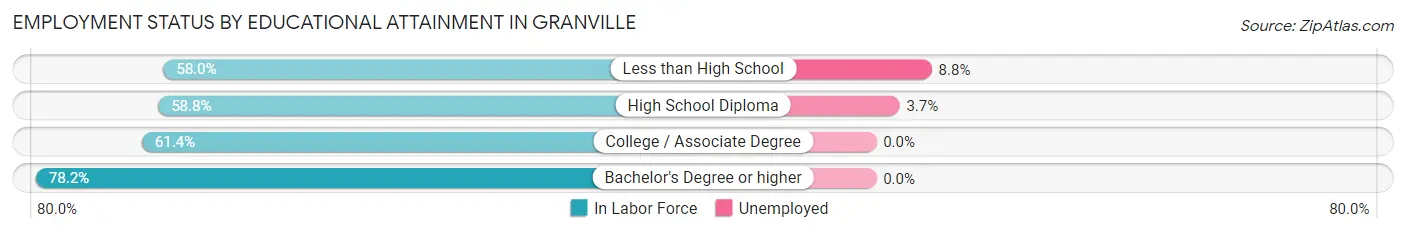
| Educational Attainment | In Labor Force | Unemployed |
| Less than High School | 80 (58.0%) | 12 (8.8%) |
| High School Diploma | 298 (58.8%) | 19 (3.7%) |
| College / Associate Degree | 277 (61.4%) | 0 (0.0%) |
| Bachelor's Degree or higher | 187 (78.2%) | 0 (0.0%) |
| Total | 842 (63.1%) | 28 (2.1%) |
Employment Occupations by Sex in Granville
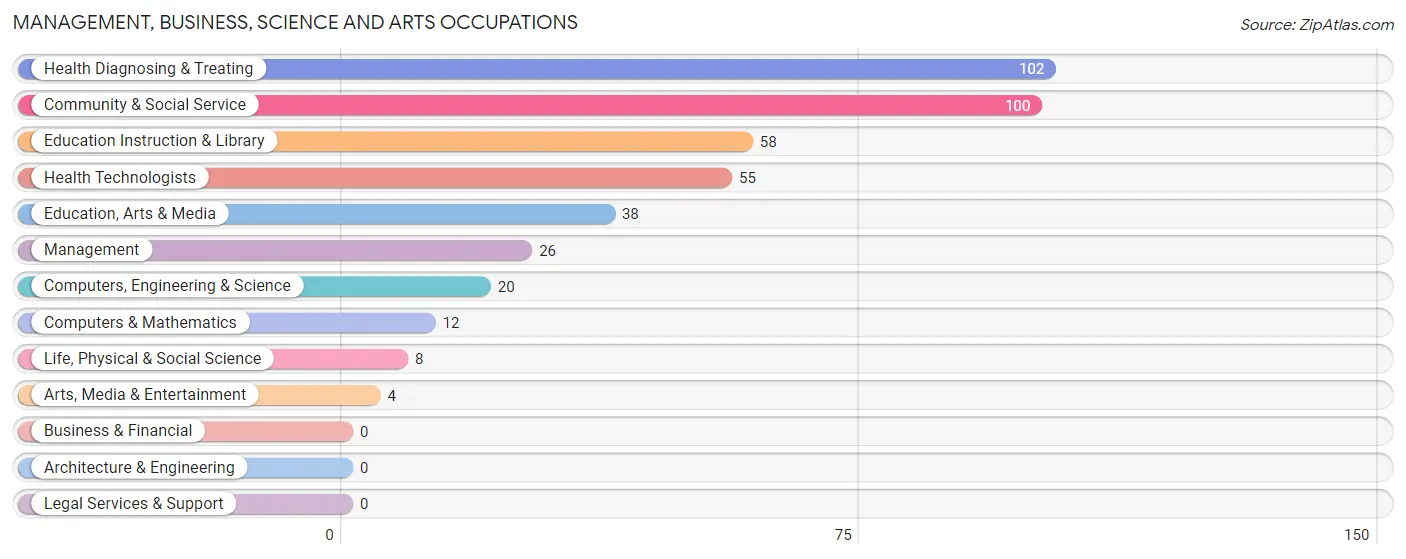
Management, Business, Science and Arts Occupations
The most common Management, Business, Science and Arts occupations in Granville are Health Diagnosing & Treating (102 | 10.5%), Community & Social Service (100 | 10.3%), Education Instruction & Library (58 | 6.0%), Health Technologists (55 | 5.7%), and Education, Arts & Media (38 | 3.9%).
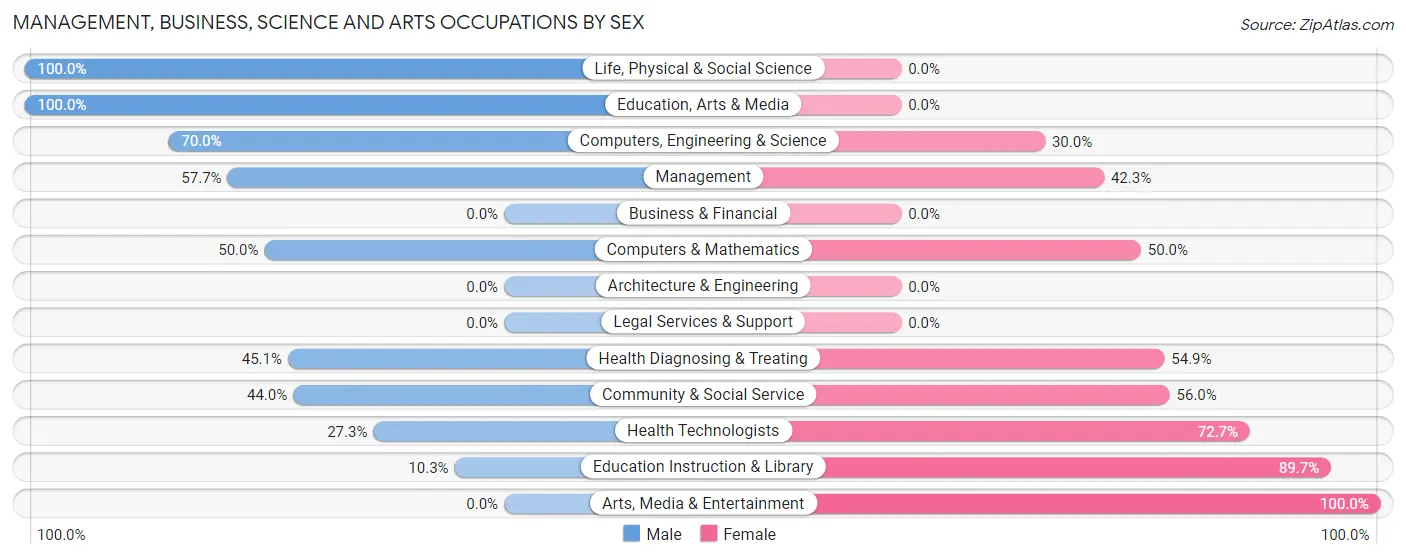
Management, Business, Science and Arts Occupations by Sex
Within the Management, Business, Science and Arts occupations in Granville, the most male-oriented occupations are Life, Physical & Social Science (100.0%), Education, Arts & Media (100.0%), and Computers, Engineering & Science (70.0%), while the most female-oriented occupations are Arts, Media & Entertainment (100.0%), Education Instruction & Library (89.7%), and Health Technologists (72.7%).
| Occupation | Male | Female |
| Management | 15 (57.7%) | 11 (42.3%) |
| Business & Financial | 0 (0.0%) | 0 (0.0%) |
| Computers, Engineering & Science | 14 (70.0%) | 6 (30.0%) |
| Computers & Mathematics | 6 (50.0%) | 6 (50.0%) |
| Architecture & Engineering | 0 (0.0%) | 0 (0.0%) |
| Life, Physical & Social Science | 8 (100.0%) | 0 (0.0%) |
| Community & Social Service | 44 (44.0%) | 56 (56.0%) |
| Education, Arts & Media | 38 (100.0%) | 0 (0.0%) |
| Legal Services & Support | 0 (0.0%) | 0 (0.0%) |
| Education Instruction & Library | 6 (10.3%) | 52 (89.7%) |
| Arts, Media & Entertainment | 0 (0.0%) | 4 (100.0%) |
| Health Diagnosing & Treating | 46 (45.1%) | 56 (54.9%) |
| Health Technologists | 15 (27.3%) | 40 (72.7%) |
| Total (Category) | 119 (48.0%) | 129 (52.0%) |
| Total (Overall) | 534 (55.2%) | 433 (44.8%) |
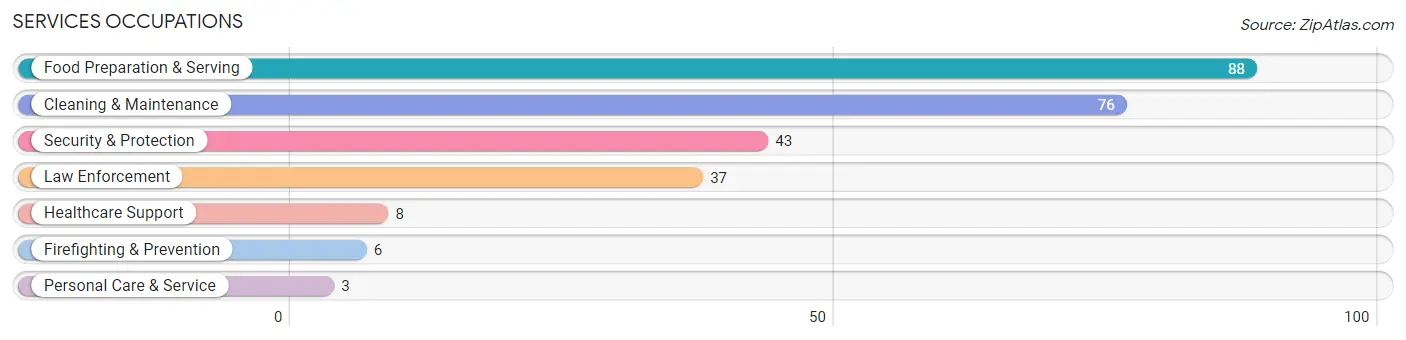
Services Occupations
The most common Services occupations in Granville are Food Preparation & Serving (88 | 9.1%), Cleaning & Maintenance (76 | 7.9%), Security & Protection (43 | 4.4%), Law Enforcement (37 | 3.8%), and Healthcare Support (8 | 0.8%).
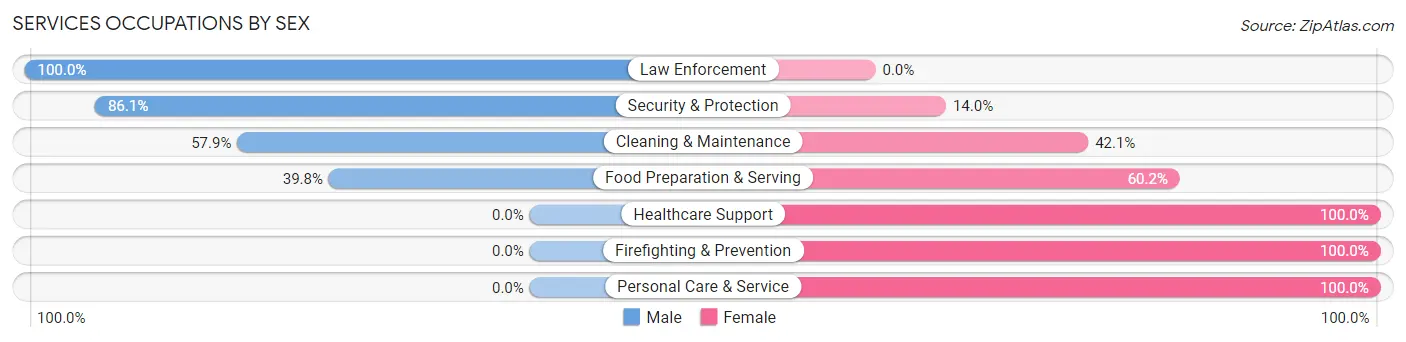
Services Occupations by Sex
Within the Services occupations in Granville, the most male-oriented occupations are Law Enforcement (100.0%), Security & Protection (86.1%), and Cleaning & Maintenance (57.9%), while the most female-oriented occupations are Healthcare Support (100.0%), Firefighting & Prevention (100.0%), and Personal Care & Service (100.0%).
| Occupation | Male | Female |
| Healthcare Support | 0 (0.0%) | 8 (100.0%) |
| Security & Protection | 37 (86.1%) | 6 (14.0%) |
| Firefighting & Prevention | 0 (0.0%) | 6 (100.0%) |
| Law Enforcement | 37 (100.0%) | 0 (0.0%) |
| Food Preparation & Serving | 35 (39.8%) | 53 (60.2%) |
| Cleaning & Maintenance | 44 (57.9%) | 32 (42.1%) |
| Personal Care & Service | 0 (0.0%) | 3 (100.0%) |
| Total (Category) | 116 (53.2%) | 102 (46.8%) |
| Total (Overall) | 534 (55.2%) | 433 (44.8%) |
Sales and Office Occupations
The most common Sales and Office occupations in Granville are Sales & Related (146 | 15.1%), and Office & Administration (111 | 11.5%).

Sales and Office Occupations by Sex
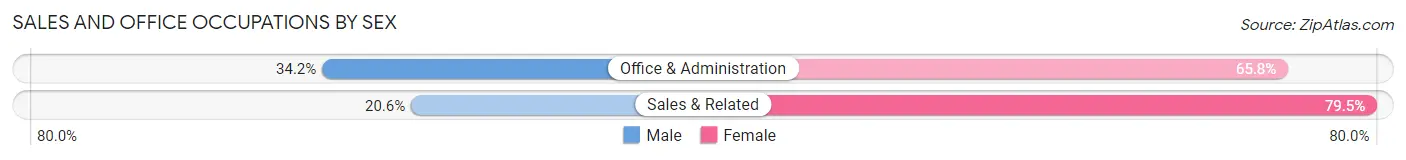
| Occupation | Male | Female |
| Sales & Related | 30 (20.5%) | 116 (79.4%) |
| Office & Administration | 38 (34.2%) | 73 (65.8%) |
| Total (Category) | 68 (26.5%) | 189 (73.5%) |
| Total (Overall) | 534 (55.2%) | 433 (44.8%) |
Natural Resources, Construction and Maintenance Occupations
The most common Natural Resources, Construction and Maintenance occupations in Granville are Construction & Extraction (48 | 5.0%), Installation, Maintenance & Repair (19 | 2.0%), and Farming, Fishing & Forestry (8 | 0.8%).

Natural Resources, Construction and Maintenance Occupations by Sex

| Occupation | Male | Female |
| Farming, Fishing & Forestry | 0 (0.0%) | 8 (100.0%) |
| Construction & Extraction | 48 (100.0%) | 0 (0.0%) |
| Installation, Maintenance & Repair | 19 (100.0%) | 0 (0.0%) |
| Total (Category) | 67 (89.3%) | 8 (10.7%) |
| Total (Overall) | 534 (55.2%) | 433 (44.8%) |
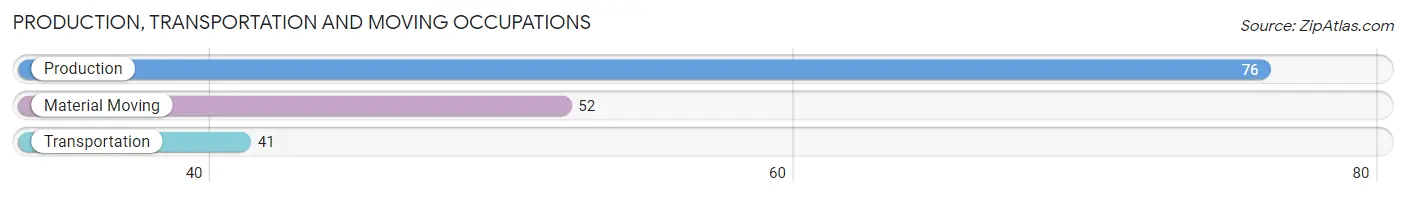
Production, Transportation and Moving Occupations
The most common Production, Transportation and Moving occupations in Granville are Production (76 | 7.9%), Material Moving (52 | 5.4%), and Transportation (41 | 4.2%).
Production, Transportation and Moving Occupations by Sex
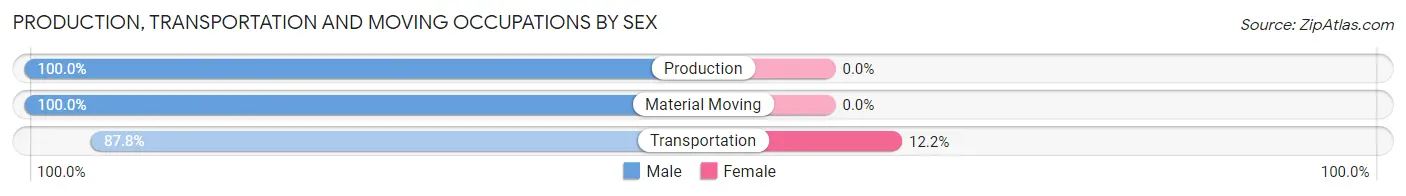
| Occupation | Male | Female |
| Production | 76 (100.0%) | 0 (0.0%) |
| Transportation | 36 (87.8%) | 5 (12.2%) |
| Material Moving | 52 (100.0%) | 0 (0.0%) |
| Total (Category) | 164 (97.0%) | 5 (3.0%) |
| Total (Overall) | 534 (55.2%) | 433 (44.8%) |
Employment Industries by Sex in Granville
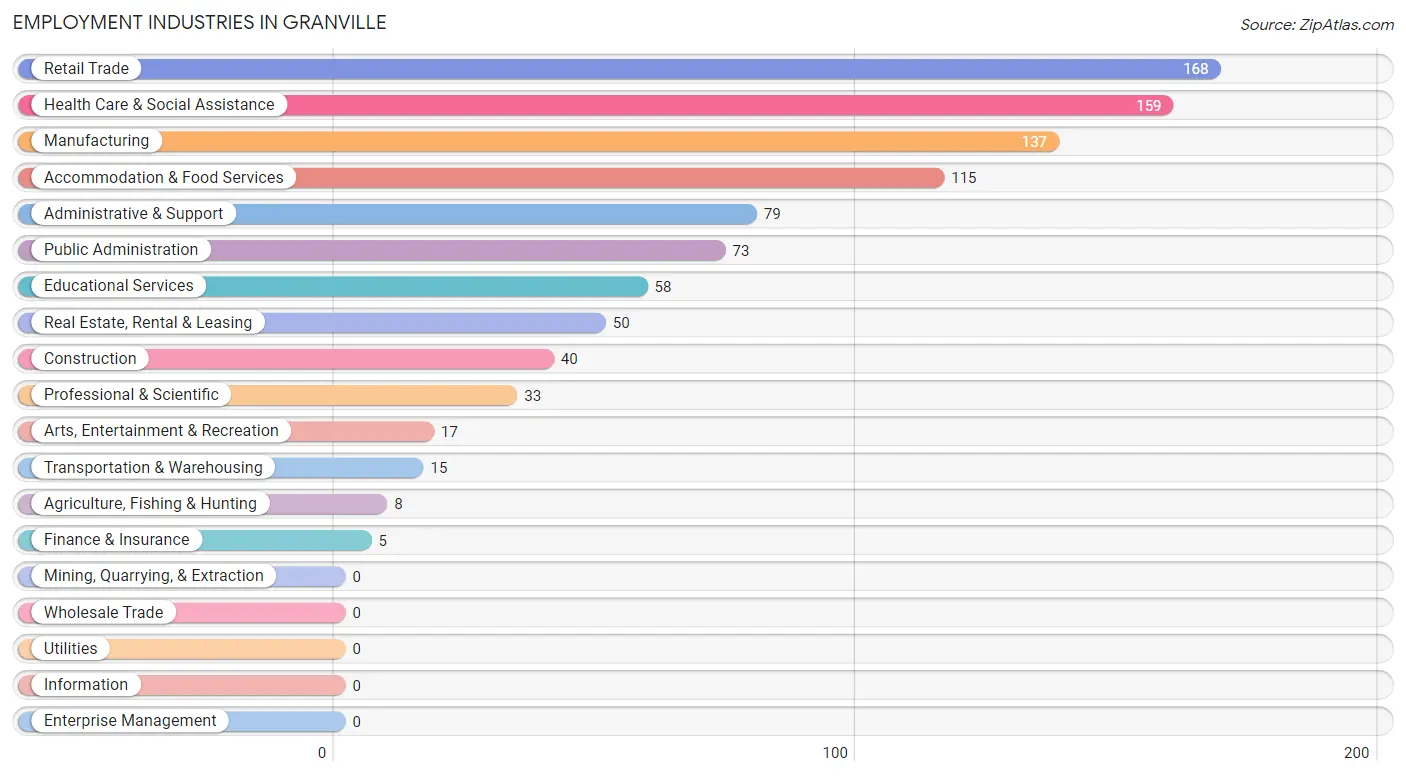
Employment Industries in Granville
The major employment industries in Granville include Retail Trade (168 | 17.4%), Health Care & Social Assistance (159 | 16.4%), Manufacturing (137 | 14.2%), Accommodation & Food Services (115 | 11.9%), and Administrative & Support (79 | 8.2%).
Employment Industries by Sex in Granville
The Granville industries that see more men than women are Construction (100.0%), Professional & Scientific (100.0%), and Public Administration (78.1%), whereas the industries that tend to have a higher number of women are Agriculture, Fishing & Hunting (100.0%), Transportation & Warehousing (100.0%), and Finance & Insurance (100.0%).
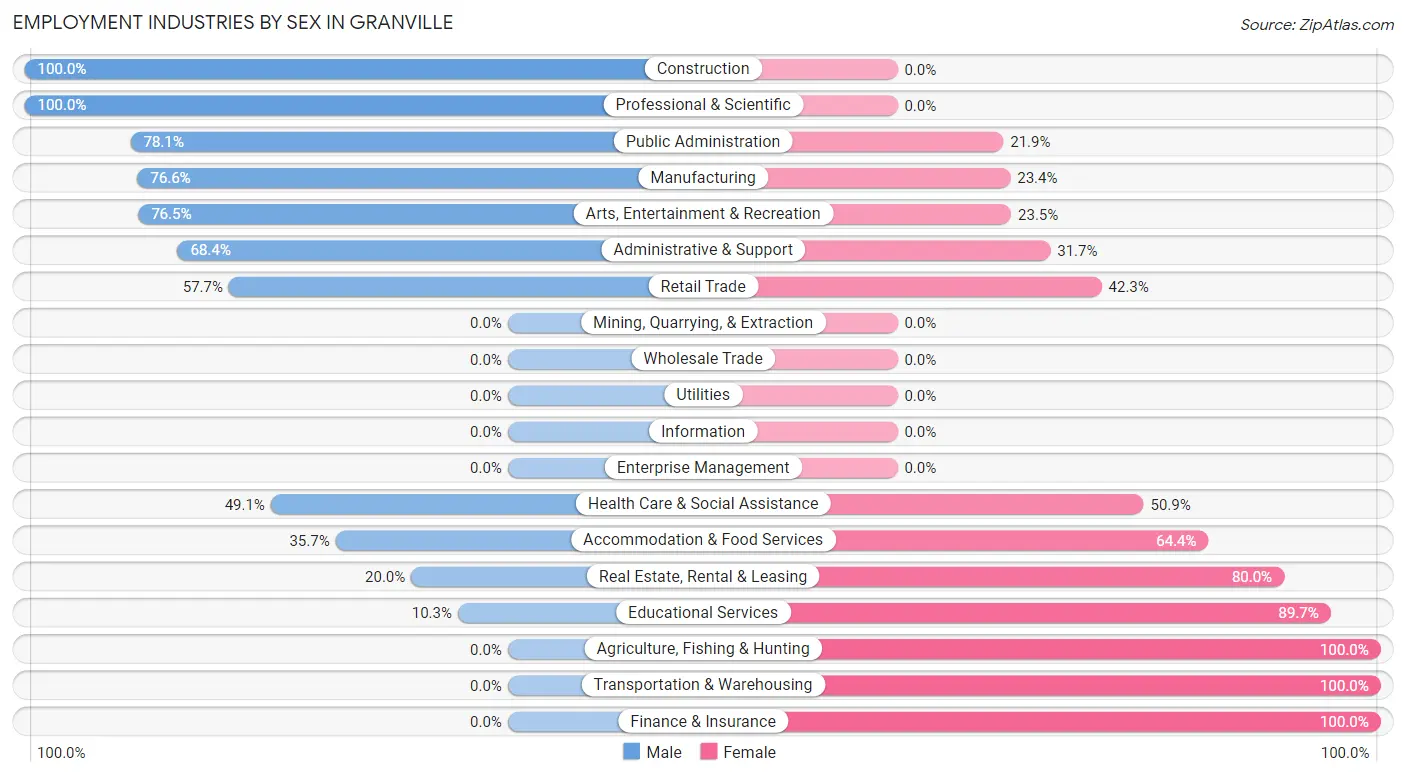
| Industry | Male | Female |
| Agriculture, Fishing & Hunting | 0 (0.0%) | 8 (100.0%) |
| Mining, Quarrying, & Extraction | 0 (0.0%) | 0 (0.0%) |
| Construction | 40 (100.0%) | 0 (0.0%) |
| Manufacturing | 105 (76.6%) | 32 (23.4%) |
| Wholesale Trade | 0 (0.0%) | 0 (0.0%) |
| Retail Trade | 97 (57.7%) | 71 (42.3%) |
| Transportation & Warehousing | 0 (0.0%) | 15 (100.0%) |
| Utilities | 0 (0.0%) | 0 (0.0%) |
| Information | 0 (0.0%) | 0 (0.0%) |
| Finance & Insurance | 0 (0.0%) | 5 (100.0%) |
| Real Estate, Rental & Leasing | 10 (20.0%) | 40 (80.0%) |
| Professional & Scientific | 33 (100.0%) | 0 (0.0%) |
| Enterprise Management | 0 (0.0%) | 0 (0.0%) |
| Administrative & Support | 54 (68.3%) | 25 (31.7%) |
| Educational Services | 6 (10.3%) | 52 (89.7%) |
| Health Care & Social Assistance | 78 (49.1%) | 81 (50.9%) |
| Arts, Entertainment & Recreation | 13 (76.5%) | 4 (23.5%) |
| Accommodation & Food Services | 41 (35.6%) | 74 (64.3%) |
| Public Administration | 57 (78.1%) | 16 (21.9%) |
| Total | 534 (55.2%) | 433 (44.8%) |
Education in Granville
School Enrollment in Granville
The most common levels of schooling among the 384 students in Granville are high school (124 | 32.3%), middle school (76 | 19.8%), and elementary school (69 | 18.0%).
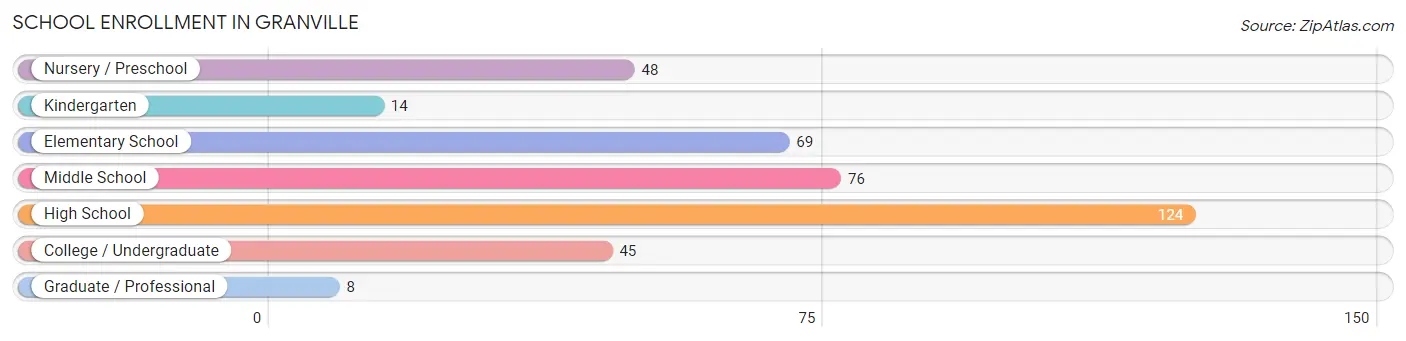
| School Level | # Students | % Students |
| Nursery / Preschool | 48 | 12.5% |
| Kindergarten | 14 | 3.6% |
| Elementary School | 69 | 18.0% |
| Middle School | 76 | 19.8% |
| High School | 124 | 32.3% |
| College / Undergraduate | 45 | 11.7% |
| Graduate / Professional | 8 | 2.1% |
| Total | 384 | 100.0% |
School Enrollment by Age by Funding Source in Granville
Out of a total of 384 students who are enrolled in schools in Granville, 58 (15.1%) attend a private institution, while the remaining 326 (84.9%) are enrolled in public schools. The age group of 35 years and over has the highest likelihood of being enrolled in private schools, with 25 (100.0% in the age bracket) enrolled. Conversely, the age group of 10 to 14 year olds has the lowest likelihood of being enrolled in a private school, with 99 (100.0% in the age bracket) attending a public institution.
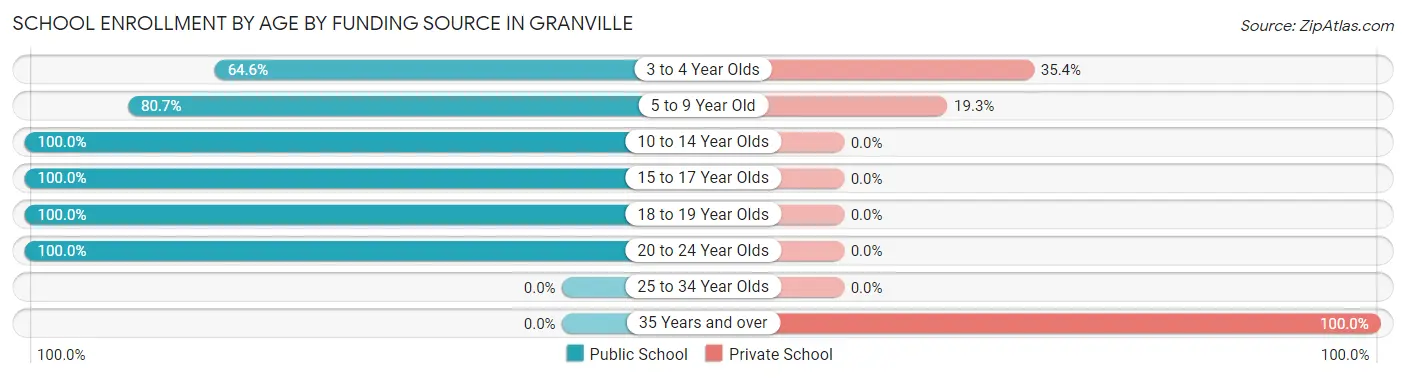
| Age Bracket | Public School | Private School |
| 3 to 4 Year Olds | 31 (64.6%) | 17 (35.4%) |
| 5 to 9 Year Old | 67 (80.7%) | 16 (19.3%) |
| 10 to 14 Year Olds | 99 (100.0%) | 0 (0.0%) |
| 15 to 17 Year Olds | 95 (100.0%) | 0 (0.0%) |
| 18 to 19 Year Olds | 30 (100.0%) | 0 (0.0%) |
| 20 to 24 Year Olds | 4 (100.0%) | 0 (0.0%) |
| 25 to 34 Year Olds | 0 (0.0%) | 0 (0.0%) |
| 35 Years and over | 0 (0.0%) | 25 (100.0%) |
| Total | 326 (84.9%) | 58 (15.1%) |
Educational Attainment by Field of Study in Granville
Bio, nature & agricultural (47 | 16.2%), engineering (38 | 13.1%), visual & performing arts (37 | 12.7%), business (29 | 10.0%), and communications (27 | 9.3%) are the most common fields of study among 291 individuals in Granville who have obtained a bachelor's degree or higher.
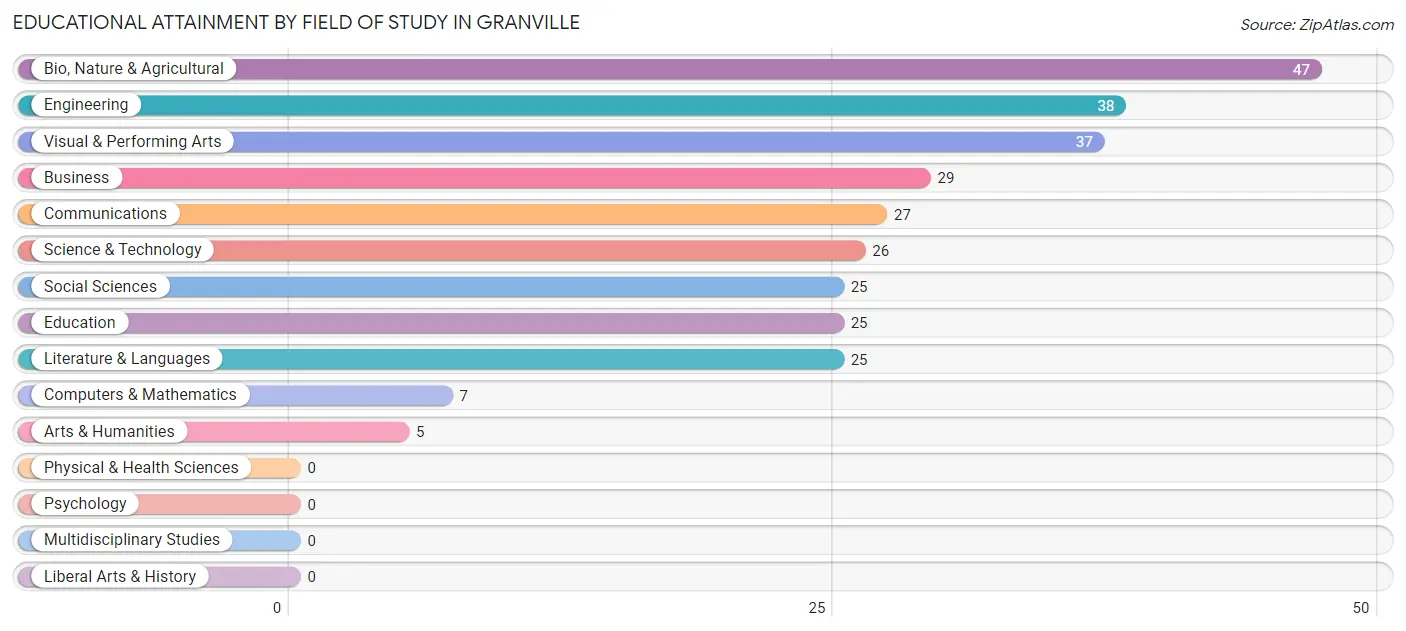
| Field of Study | # Graduates | % Graduates |
| Computers & Mathematics | 7 | 2.4% |
| Bio, Nature & Agricultural | 47 | 16.2% |
| Physical & Health Sciences | 0 | 0.0% |
| Psychology | 0 | 0.0% |
| Social Sciences | 25 | 8.6% |
| Engineering | 38 | 13.1% |
| Multidisciplinary Studies | 0 | 0.0% |
| Science & Technology | 26 | 8.9% |
| Business | 29 | 10.0% |
| Education | 25 | 8.6% |
| Literature & Languages | 25 | 8.6% |
| Liberal Arts & History | 0 | 0.0% |
| Visual & Performing Arts | 37 | 12.7% |
| Communications | 27 | 9.3% |
| Arts & Humanities | 5 | 1.7% |
| Total | 291 | 100.0% |
Transportation & Commute in Granville
Vehicle Availability by Sex in Granville
The most prevalent vehicle ownership categories in Granville are males with 2 vehicles (261, accounting for 50.5%) and females with 2 vehicles (235, making up 61.6%).
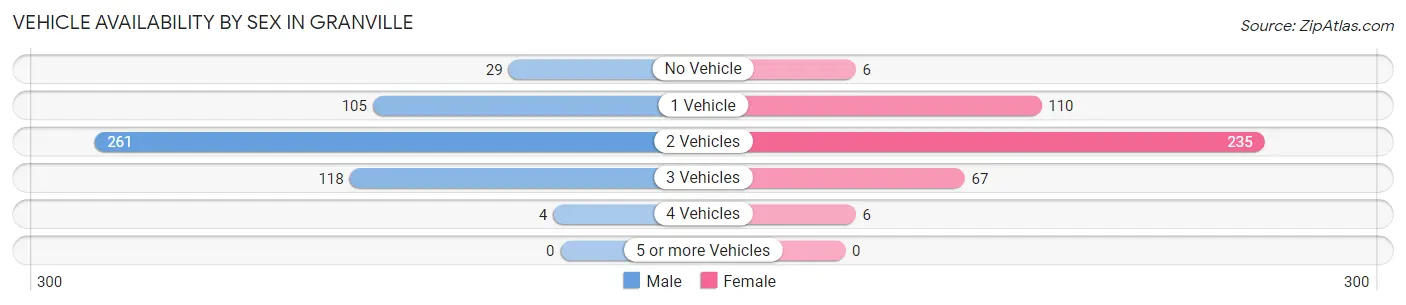
| Vehicles Available | Male | Female |
| No Vehicle | 29 (5.6%) | 6 (1.4%) |
| 1 Vehicle | 105 (20.3%) | 110 (25.9%) |
| 2 Vehicles | 261 (50.5%) | 235 (55.4%) |
| 3 Vehicles | 118 (22.8%) | 67 (15.8%) |
| 4 Vehicles | 4 (0.8%) | 6 (1.4%) |
| 5 or more Vehicles | 0 (0.0%) | 0 (0.0%) |
| Total | 517 (100.0%) | 424 (100.0%) |
Commute Time in Granville
The most frequently occuring commute durations in Granville are 35 to 39 minutes (156 commuters, 16.7%), less than 5 minutes (144 commuters, 15.4%), and 5 to 9 minutes (127 commuters, 13.6%).
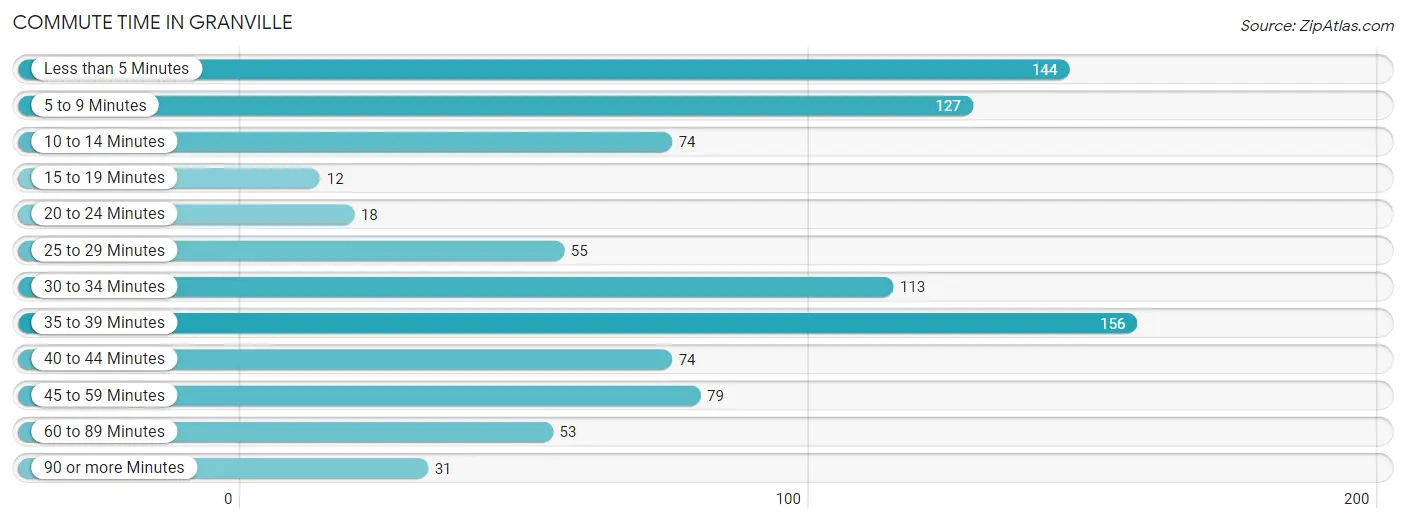
| Commute Time | # Commuters | % Commuters |
| Less than 5 Minutes | 144 | 15.4% |
| 5 to 9 Minutes | 127 | 13.6% |
| 10 to 14 Minutes | 74 | 7.9% |
| 15 to 19 Minutes | 12 | 1.3% |
| 20 to 24 Minutes | 18 | 1.9% |
| 25 to 29 Minutes | 55 | 5.9% |
| 30 to 34 Minutes | 113 | 12.1% |
| 35 to 39 Minutes | 156 | 16.7% |
| 40 to 44 Minutes | 74 | 7.9% |
| 45 to 59 Minutes | 79 | 8.4% |
| 60 to 89 Minutes | 53 | 5.7% |
| 90 or more Minutes | 31 | 3.3% |
Commute Time by Sex in Granville
The most common commute times in Granville are 35 to 39 minutes (95 commuters, 18.5%) for males and 5 to 9 minutes (121 commuters, 28.5%) for females.
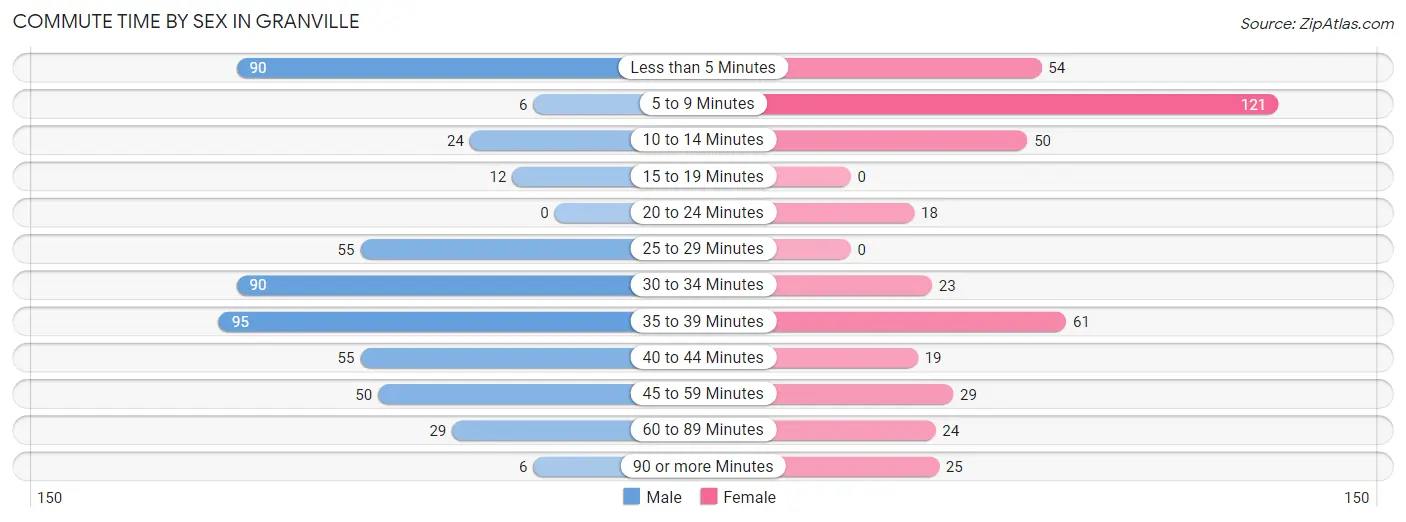
| Commute Time | Male | Female |
| Less than 5 Minutes | 90 (17.6%) | 54 (12.7%) |
| 5 to 9 Minutes | 6 (1.2%) | 121 (28.5%) |
| 10 to 14 Minutes | 24 (4.7%) | 50 (11.8%) |
| 15 to 19 Minutes | 12 (2.3%) | 0 (0.0%) |
| 20 to 24 Minutes | 0 (0.0%) | 18 (4.3%) |
| 25 to 29 Minutes | 55 (10.7%) | 0 (0.0%) |
| 30 to 34 Minutes | 90 (17.6%) | 23 (5.4%) |
| 35 to 39 Minutes | 95 (18.5%) | 61 (14.4%) |
| 40 to 44 Minutes | 55 (10.7%) | 19 (4.5%) |
| 45 to 59 Minutes | 50 (9.8%) | 29 (6.8%) |
| 60 to 89 Minutes | 29 (5.7%) | 24 (5.7%) |
| 90 or more Minutes | 6 (1.2%) | 25 (5.9%) |
Time of Departure to Work by Sex in Granville
The most frequent times of departure to work in Granville are 12:00 PM to 3:59 PM (107, 20.9%) for males and 7:30 AM to 7:59 AM (97, 22.9%) for females.
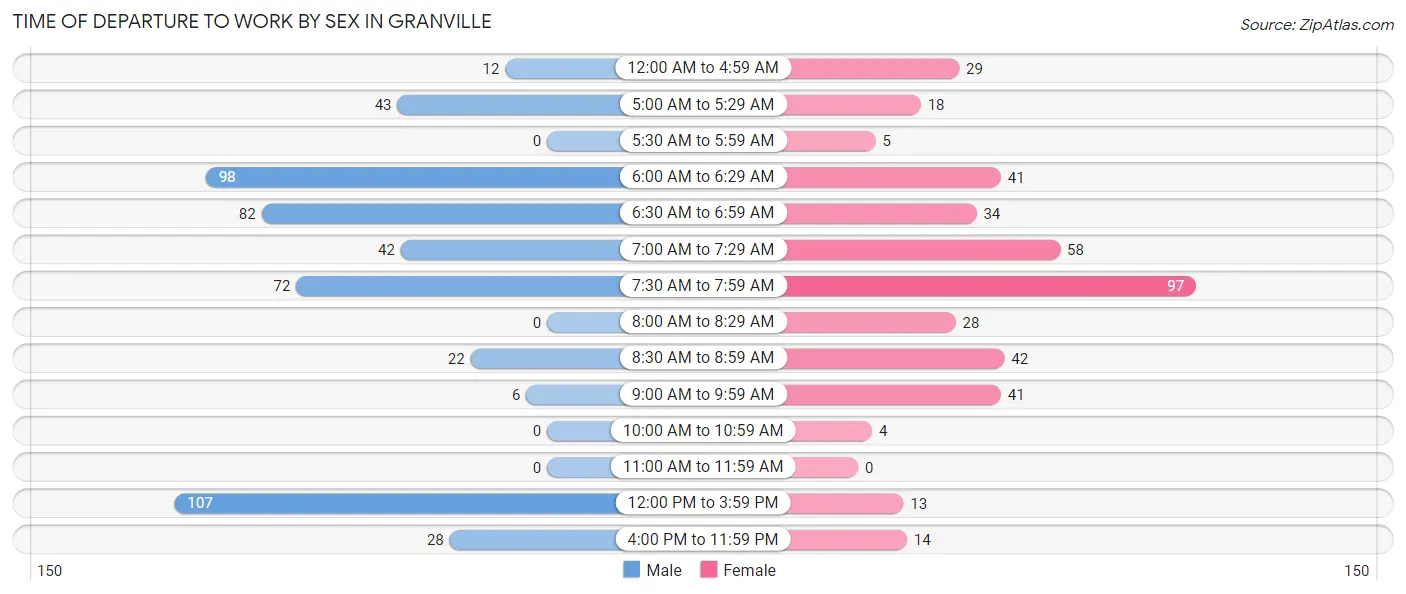
| Time of Departure | Male | Female |
| 12:00 AM to 4:59 AM | 12 (2.3%) | 29 (6.8%) |
| 5:00 AM to 5:29 AM | 43 (8.4%) | 18 (4.3%) |
| 5:30 AM to 5:59 AM | 0 (0.0%) | 5 (1.2%) |
| 6:00 AM to 6:29 AM | 98 (19.1%) | 41 (9.7%) |
| 6:30 AM to 6:59 AM | 82 (16.0%) | 34 (8.0%) |
| 7:00 AM to 7:29 AM | 42 (8.2%) | 58 (13.7%) |
| 7:30 AM to 7:59 AM | 72 (14.1%) | 97 (22.9%) |
| 8:00 AM to 8:29 AM | 0 (0.0%) | 28 (6.6%) |
| 8:30 AM to 8:59 AM | 22 (4.3%) | 42 (9.9%) |
| 9:00 AM to 9:59 AM | 6 (1.2%) | 41 (9.7%) |
| 10:00 AM to 10:59 AM | 0 (0.0%) | 4 (0.9%) |
| 11:00 AM to 11:59 AM | 0 (0.0%) | 0 (0.0%) |
| 12:00 PM to 3:59 PM | 107 (20.9%) | 13 (3.1%) |
| 4:00 PM to 11:59 PM | 28 (5.5%) | 14 (3.3%) |
| Total | 512 (100.0%) | 424 (100.0%) |
Housing Occupancy in Granville
Occupancy by Ownership in Granville
Of the total 1,100 dwellings in Granville, owner-occupied units account for 518 (47.1%), while renter-occupied units make up 582 (52.9%).
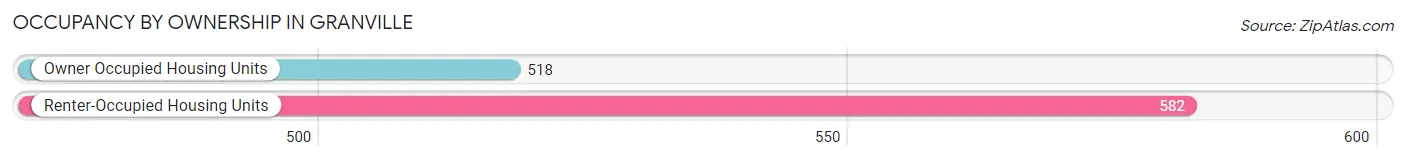
| Occupancy | # Housing Units | % Housing Units |
| Owner Occupied Housing Units | 518 | 47.1% |
| Renter-Occupied Housing Units | 582 | 52.9% |
| Total Occupied Housing Units | 1,100 | 100.0% |
Occupancy by Household Size in Granville
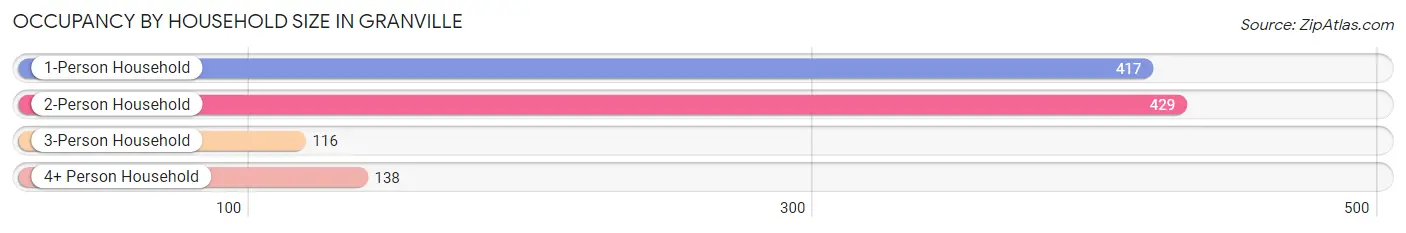
| Household Size | # Housing Units | % Housing Units |
| 1-Person Household | 417 | 37.9% |
| 2-Person Household | 429 | 39.0% |
| 3-Person Household | 116 | 10.5% |
| 4+ Person Household | 138 | 12.6% |
| Total Housing Units | 1,100 | 100.0% |
Occupancy by Ownership by Household Size in Granville
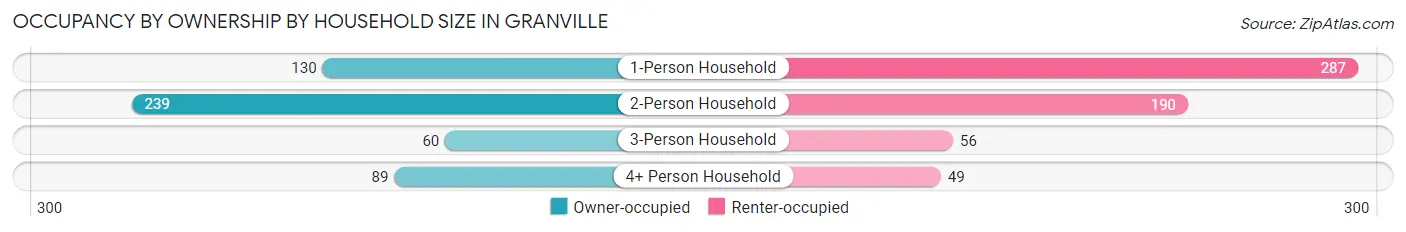
| Household Size | Owner-occupied | Renter-occupied |
| 1-Person Household | 130 (31.2%) | 287 (68.8%) |
| 2-Person Household | 239 (55.7%) | 190 (44.3%) |
| 3-Person Household | 60 (51.7%) | 56 (48.3%) |
| 4+ Person Household | 89 (64.5%) | 49 (35.5%) |
| Total Housing Units | 518 (47.1%) | 582 (52.9%) |
Occupancy by Educational Attainment in Granville
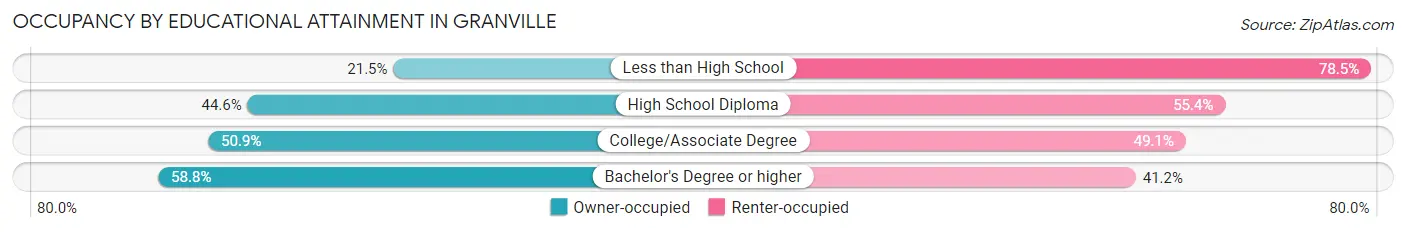
| Household Size | Owner-occupied | Renter-occupied |
| Less than High School | 20 (21.5%) | 73 (78.5%) |
| High School Diploma | 200 (44.6%) | 248 (55.4%) |
| College/Associate Degree | 198 (50.9%) | 191 (49.1%) |
| Bachelor's Degree or higher | 100 (58.8%) | 70 (41.2%) |
Occupancy by Age of Householder in Granville
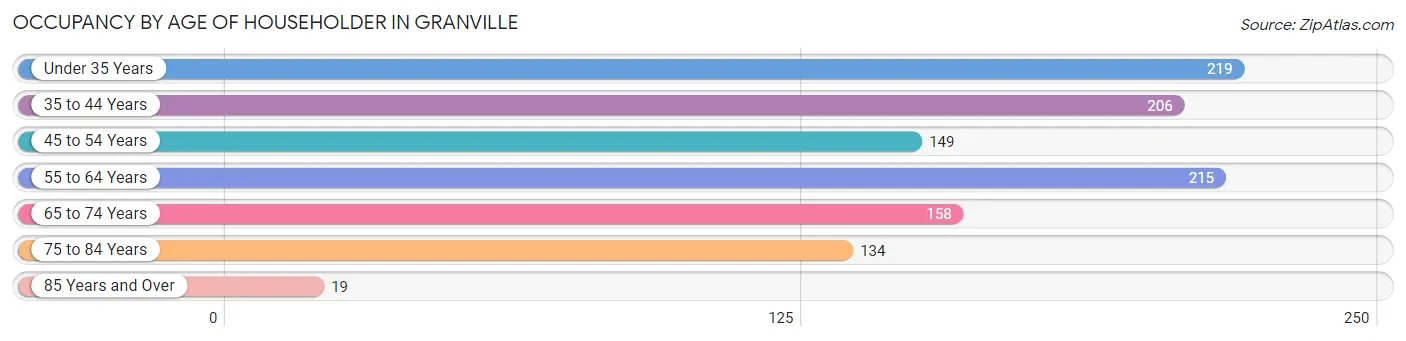
| Age Bracket | # Households | % Households |
| Under 35 Years | 219 | 19.9% |
| 35 to 44 Years | 206 | 18.7% |
| 45 to 54 Years | 149 | 13.6% |
| 55 to 64 Years | 215 | 19.6% |
| 65 to 74 Years | 158 | 14.4% |
| 75 to 84 Years | 134 | 12.2% |
| 85 Years and Over | 19 | 1.7% |
| Total | 1,100 | 100.0% |
Housing Finances in Granville
Median Income by Occupancy in Granville
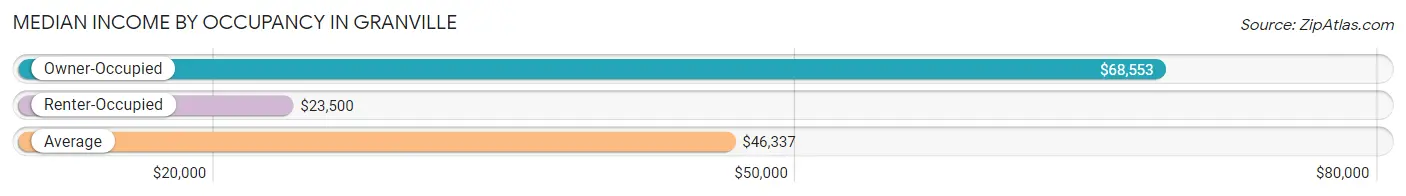
| Occupancy Type | # Households | Median Income |
| Owner-Occupied | 518 (47.1%) | $68,553 |
| Renter-Occupied | 582 (52.9%) | $23,500 |
| Average | 1,100 (100.0%) | $46,337 |
Occupancy by Householder Income Bracket in Granville
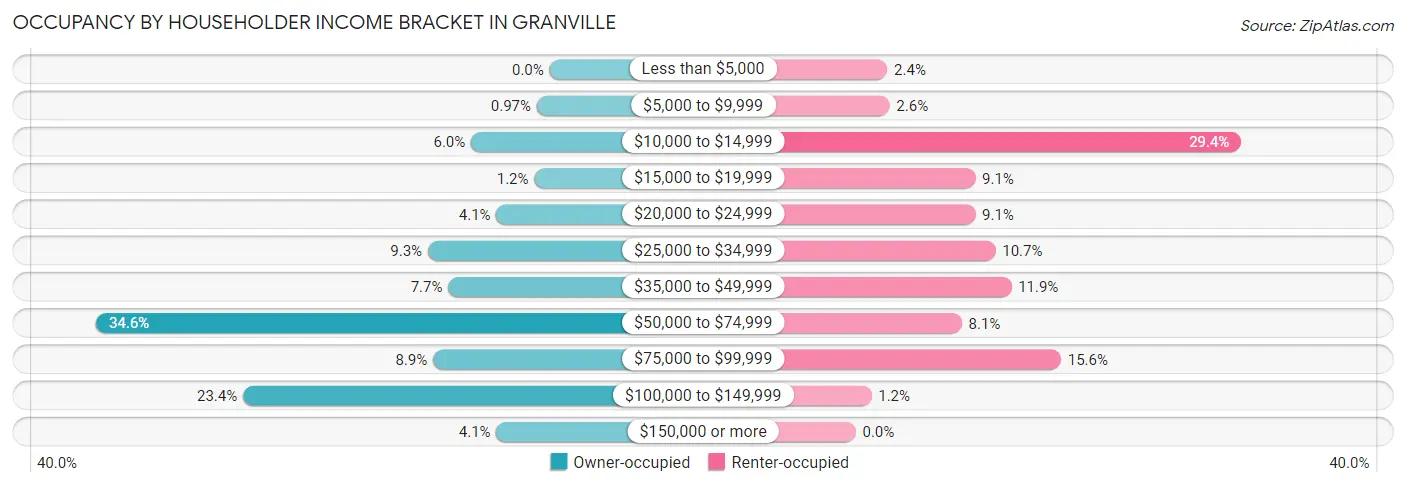
| Income Bracket | Owner-occupied | Renter-occupied |
| Less than $5,000 | 0 (0.0%) | 14 (2.4%) |
| $5,000 to $9,999 | 5 (1.0%) | 15 (2.6%) |
| $10,000 to $14,999 | 31 (6.0%) | 171 (29.4%) |
| $15,000 to $19,999 | 6 (1.2%) | 53 (9.1%) |
| $20,000 to $24,999 | 21 (4.1%) | 53 (9.1%) |
| $25,000 to $34,999 | 48 (9.3%) | 62 (10.6%) |
| $35,000 to $49,999 | 40 (7.7%) | 69 (11.9%) |
| $50,000 to $74,999 | 179 (34.6%) | 47 (8.1%) |
| $75,000 to $99,999 | 46 (8.9%) | 91 (15.6%) |
| $100,000 to $149,999 | 121 (23.4%) | 7 (1.2%) |
| $150,000 or more | 21 (4.1%) | 0 (0.0%) |
| Total | 518 (100.0%) | 582 (100.0%) |
Monthly Housing Cost Tiers in Granville
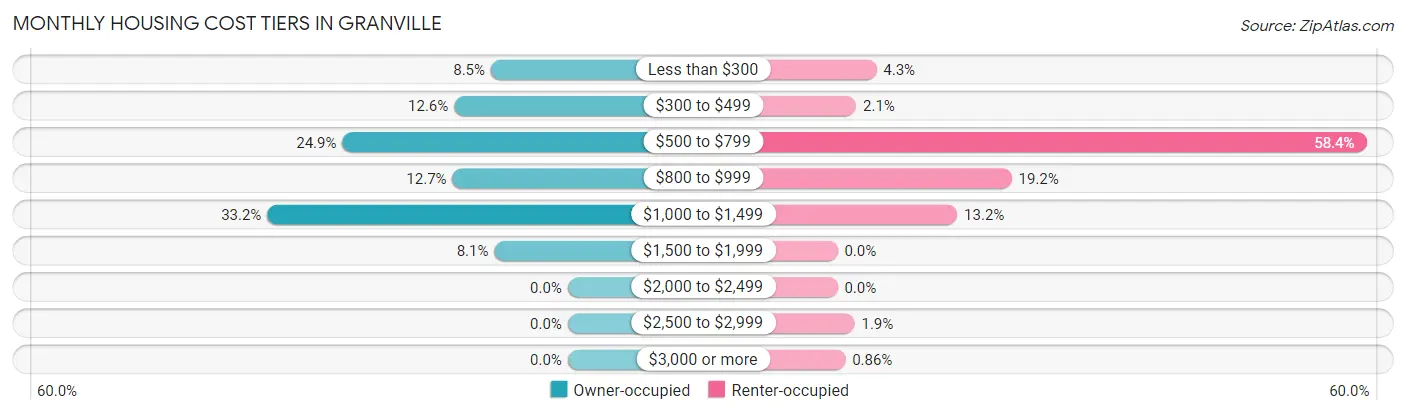
| Monthly Cost | Owner-occupied | Renter-occupied |
| Less than $300 | 44 (8.5%) | 25 (4.3%) |
| $300 to $499 | 65 (12.6%) | 12 (2.1%) |
| $500 to $799 | 129 (24.9%) | 340 (58.4%) |
| $800 to $999 | 66 (12.7%) | 112 (19.2%) |
| $1,000 to $1,499 | 172 (33.2%) | 77 (13.2%) |
| $1,500 to $1,999 | 42 (8.1%) | 0 (0.0%) |
| $2,000 to $2,499 | 0 (0.0%) | 0 (0.0%) |
| $2,500 to $2,999 | 0 (0.0%) | 11 (1.9%) |
| $3,000 or more | 0 (0.0%) | 5 (0.9%) |
| Total | 518 (100.0%) | 582 (100.0%) |
Physical Housing Characteristics in Granville
Housing Structures in Granville
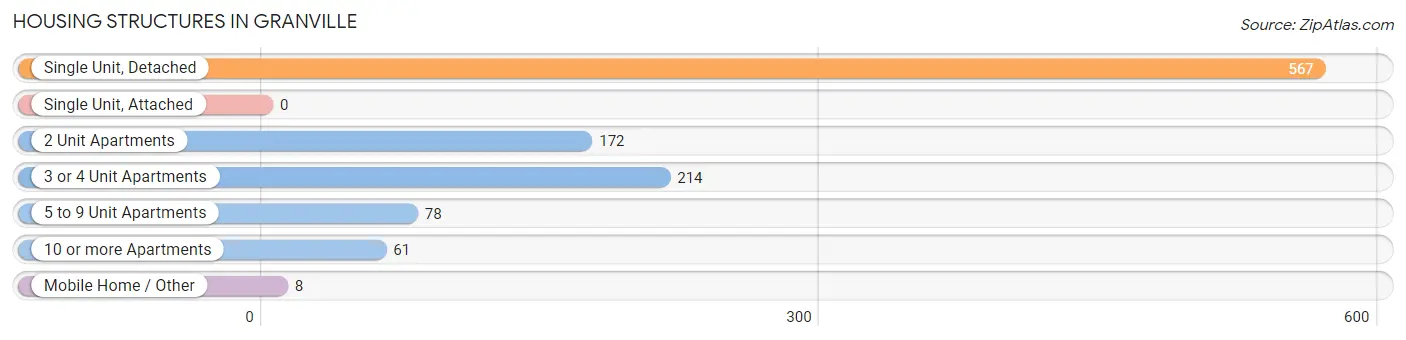
| Structure Type | # Housing Units | % Housing Units |
| Single Unit, Detached | 567 | 51.5% |
| Single Unit, Attached | 0 | 0.0% |
| 2 Unit Apartments | 172 | 15.6% |
| 3 or 4 Unit Apartments | 214 | 19.5% |
| 5 to 9 Unit Apartments | 78 | 7.1% |
| 10 or more Apartments | 61 | 5.6% |
| Mobile Home / Other | 8 | 0.7% |
| Total | 1,100 | 100.0% |
Housing Structures by Occupancy in Granville
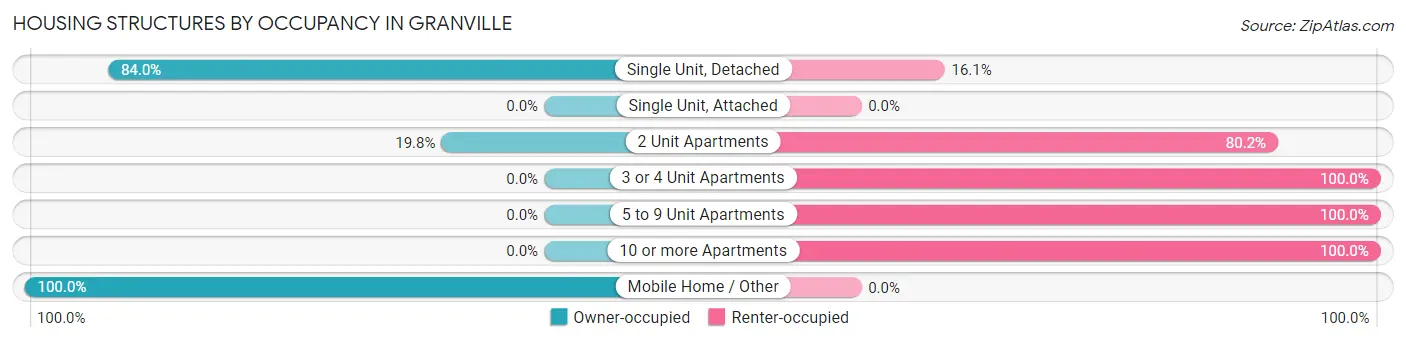
| Structure Type | Owner-occupied | Renter-occupied |
| Single Unit, Detached | 476 (84.0%) | 91 (16.1%) |
| Single Unit, Attached | 0 (0.0%) | 0 (0.0%) |
| 2 Unit Apartments | 34 (19.8%) | 138 (80.2%) |
| 3 or 4 Unit Apartments | 0 (0.0%) | 214 (100.0%) |
| 5 to 9 Unit Apartments | 0 (0.0%) | 78 (100.0%) |
| 10 or more Apartments | 0 (0.0%) | 61 (100.0%) |
| Mobile Home / Other | 8 (100.0%) | 0 (0.0%) |
| Total | 518 (47.1%) | 582 (52.9%) |
Housing Structures by Number of Rooms in Granville
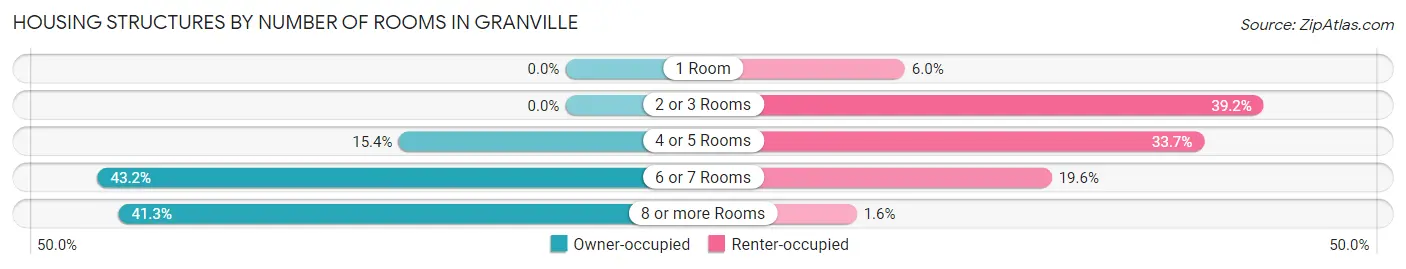
| Number of Rooms | Owner-occupied | Renter-occupied |
| 1 Room | 0 (0.0%) | 35 (6.0%) |
| 2 or 3 Rooms | 0 (0.0%) | 228 (39.2%) |
| 4 or 5 Rooms | 80 (15.4%) | 196 (33.7%) |
| 6 or 7 Rooms | 224 (43.2%) | 114 (19.6%) |
| 8 or more Rooms | 214 (41.3%) | 9 (1.5%) |
| Total | 518 (100.0%) | 582 (100.0%) |
Housing Structure by Heating Type in Granville
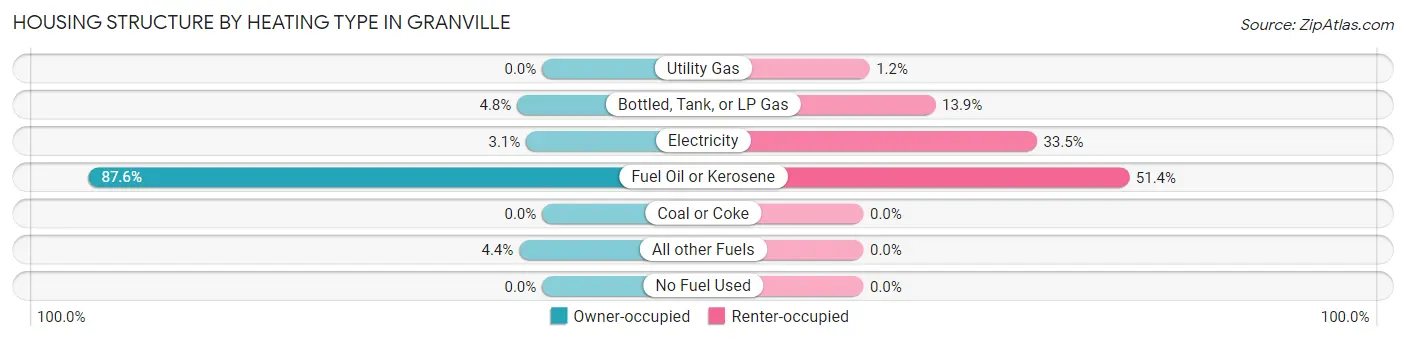
| Heating Type | Owner-occupied | Renter-occupied |
| Utility Gas | 0 (0.0%) | 7 (1.2%) |
| Bottled, Tank, or LP Gas | 25 (4.8%) | 81 (13.9%) |
| Electricity | 16 (3.1%) | 195 (33.5%) |
| Fuel Oil or Kerosene | 454 (87.6%) | 299 (51.4%) |
| Coal or Coke | 0 (0.0%) | 0 (0.0%) |
| All other Fuels | 23 (4.4%) | 0 (0.0%) |
| No Fuel Used | 0 (0.0%) | 0 (0.0%) |
| Total | 518 (100.0%) | 582 (100.0%) |
Household Vehicle Usage in Granville
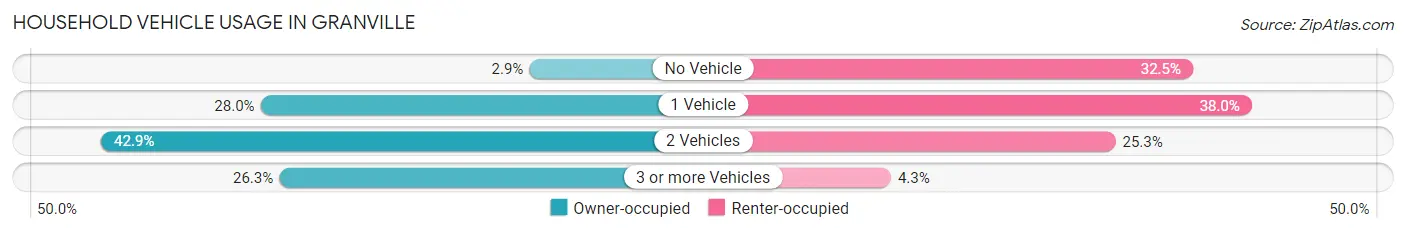
| Vehicles per Household | Owner-occupied | Renter-occupied |
| No Vehicle | 15 (2.9%) | 189 (32.5%) |
| 1 Vehicle | 145 (28.0%) | 221 (38.0%) |
| 2 Vehicles | 222 (42.9%) | 147 (25.3%) |
| 3 or more Vehicles | 136 (26.3%) | 25 (4.3%) |
| Total | 518 (100.0%) | 582 (100.0%) |
Real Estate & Mortgages in Granville
Real Estate and Mortgage Overview in Granville
| Characteristic | Without Mortgage | With Mortgage |
| Housing Units | 244 | 274 |
| Median Property Value | $115,000 | $135,500 |
| Median Household Income | $63,333 | $17 |
| Monthly Housing Costs | $562 | $0 |
| Real Estate Taxes | $2,859 | $0 |
Property Value by Mortgage Status in Granville
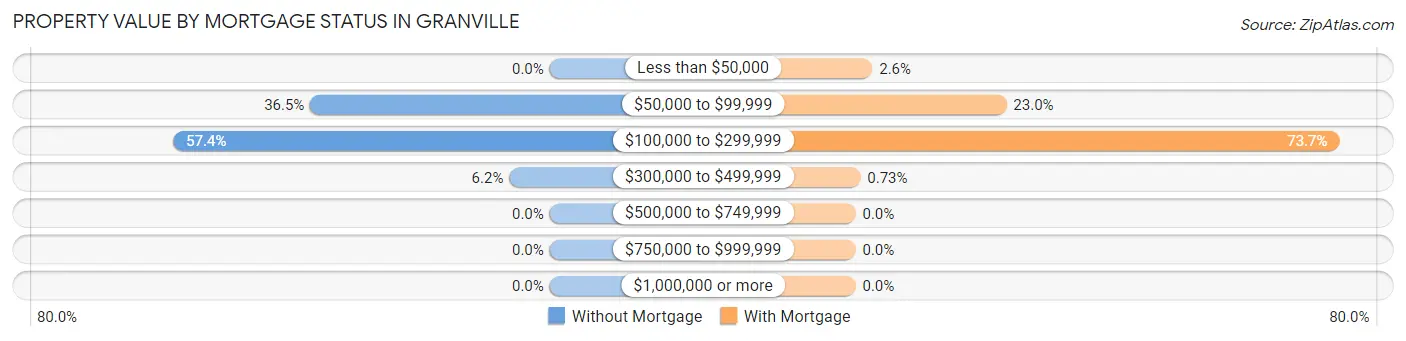
| Property Value | Without Mortgage | With Mortgage |
| Less than $50,000 | 0 (0.0%) | 7 (2.5%) |
| $50,000 to $99,999 | 89 (36.5%) | 63 (23.0%) |
| $100,000 to $299,999 | 140 (57.4%) | 202 (73.7%) |
| $300,000 to $499,999 | 15 (6.1%) | 2 (0.7%) |
| $500,000 to $749,999 | 0 (0.0%) | 0 (0.0%) |
| $750,000 to $999,999 | 0 (0.0%) | 0 (0.0%) |
| $1,000,000 or more | 0 (0.0%) | 0 (0.0%) |
| Total | 244 (100.0%) | 274 (100.0%) |
Household Income by Mortgage Status in Granville
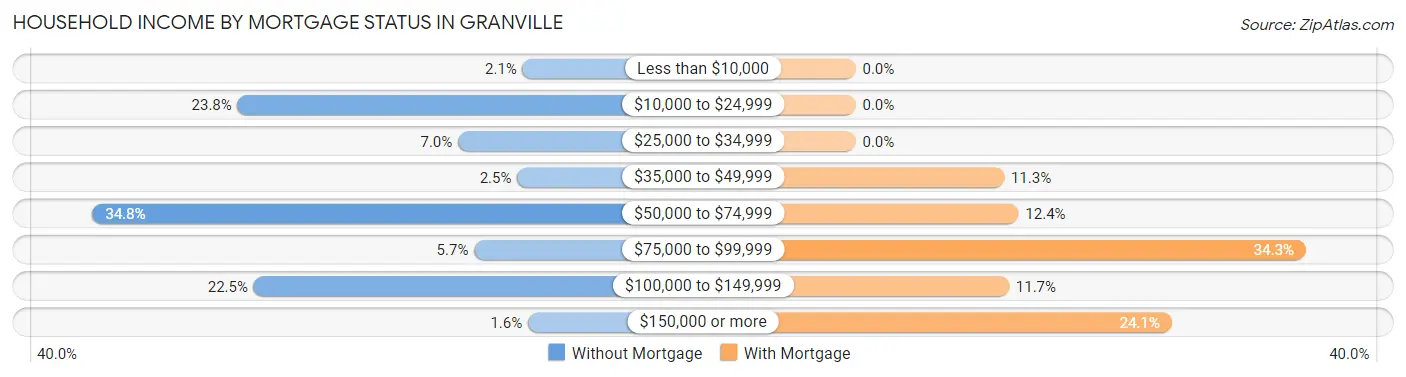
| Household Income | Without Mortgage | With Mortgage |
| Less than $10,000 | 5 (2.1%) | 0 (0.0%) |
| $10,000 to $24,999 | 58 (23.8%) | 0 (0.0%) |
| $25,000 to $34,999 | 17 (7.0%) | 0 (0.0%) |
| $35,000 to $49,999 | 6 (2.5%) | 31 (11.3%) |
| $50,000 to $74,999 | 85 (34.8%) | 34 (12.4%) |
| $75,000 to $99,999 | 14 (5.7%) | 94 (34.3%) |
| $100,000 to $149,999 | 55 (22.5%) | 32 (11.7%) |
| $150,000 or more | 4 (1.6%) | 66 (24.1%) |
| Total | 244 (100.0%) | 274 (100.0%) |
Property Value to Household Income Ratio in Granville
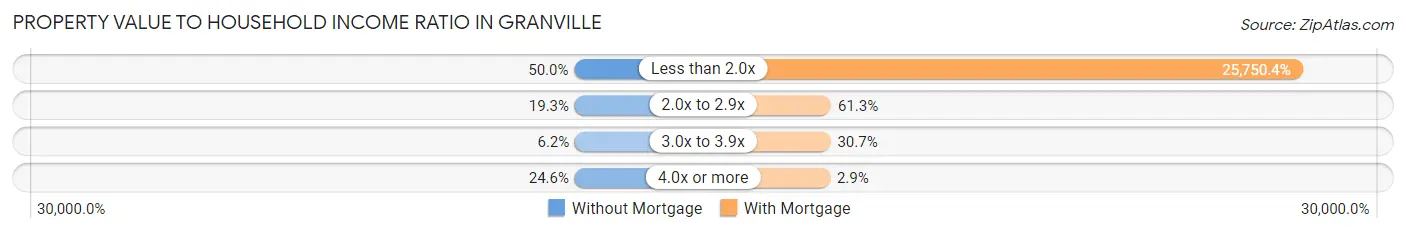
| Value-to-Income Ratio | Without Mortgage | With Mortgage |
| Less than 2.0x | 122 (50.0%) | 70,556 (25,750.4%) |
| 2.0x to 2.9x | 47 (19.3%) | 168 (61.3%) |
| 3.0x to 3.9x | 15 (6.1%) | 84 (30.7%) |
| 4.0x or more | 60 (24.6%) | 8 (2.9%) |
| Total | 244 (100.0%) | 274 (100.0%) |
Real Estate Taxes by Mortgage Status in Granville

| Property Taxes | Without Mortgage | With Mortgage |
| Less than $800 | 50 (20.5%) | 0 (0.0%) |
| $800 to $1,499 | 19 (7.8%) | 0 (0.0%) |
| $800 to $1,499 | 162 (66.4%) | 15 (5.5%) |
| Total | 244 (100.0%) | 274 (100.0%) |
Health & Disability in Granville
Health Insurance Coverage by Age in Granville
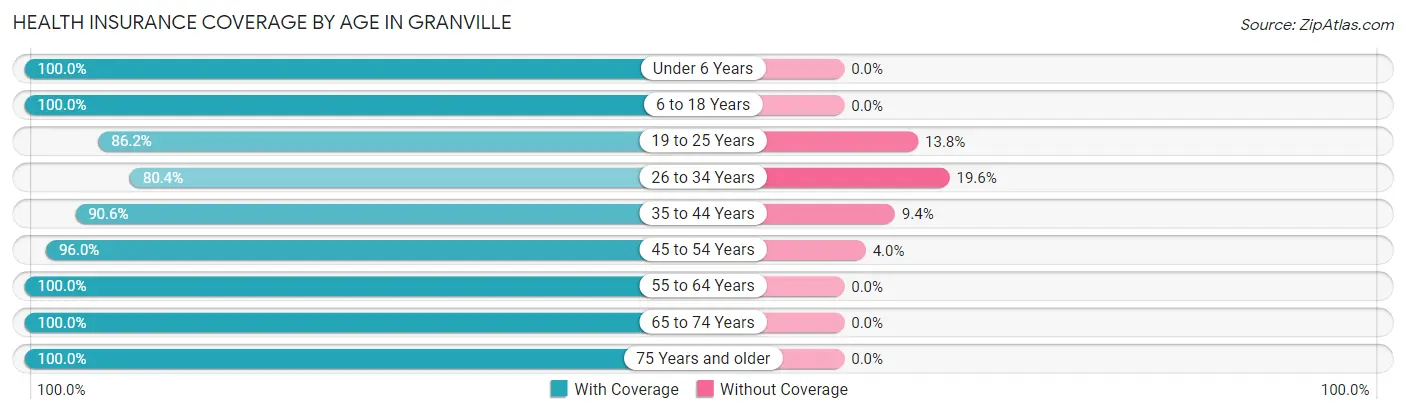
| Age Bracket | With Coverage | Without Coverage |
| Under 6 Years | 197 (100.0%) | 0 (0.0%) |
| 6 to 18 Years | 293 (100.0%) | 0 (0.0%) |
| 19 to 25 Years | 144 (86.2%) | 23 (13.8%) |
| 26 to 34 Years | 217 (80.4%) | 53 (19.6%) |
| 35 to 44 Years | 355 (90.6%) | 37 (9.4%) |
| 45 to 54 Years | 265 (96.0%) | 11 (4.0%) |
| 55 to 64 Years | 350 (100.0%) | 0 (0.0%) |
| 65 to 74 Years | 228 (100.0%) | 0 (0.0%) |
| 75 Years and older | 176 (100.0%) | 0 (0.0%) |
| Total | 2,225 (94.7%) | 124 (5.3%) |
Health Insurance Coverage by Citizenship Status in Granville

| Citizenship Status | With Coverage | Without Coverage |
| Native Born | 197 (100.0%) | 0 (0.0%) |
| Foreign Born, Citizen | 293 (100.0%) | 0 (0.0%) |
| Foreign Born, not a Citizen | 144 (86.2%) | 23 (13.8%) |
Health Insurance Coverage by Household Income in Granville
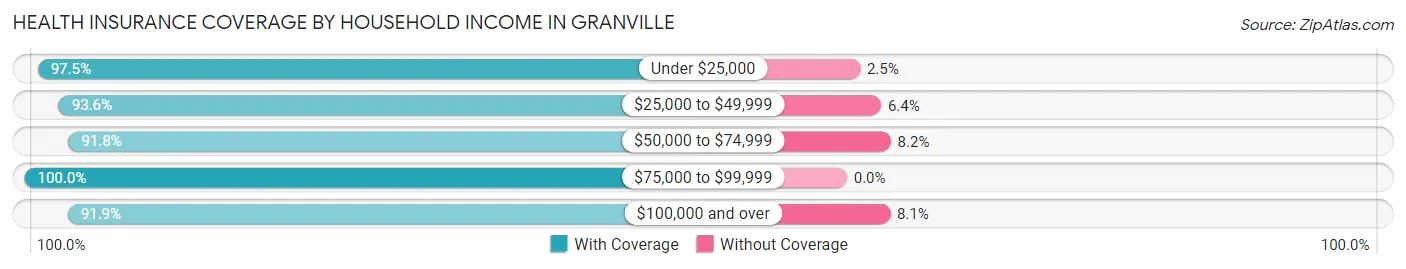
| Household Income | With Coverage | Without Coverage |
| Under $25,000 | 553 (97.5%) | 14 (2.5%) |
| $25,000 to $49,999 | 394 (93.6%) | 27 (6.4%) |
| $50,000 to $74,999 | 592 (91.8%) | 53 (8.2%) |
| $75,000 to $99,999 | 325 (100.0%) | 0 (0.0%) |
| $100,000 and over | 340 (91.9%) | 30 (8.1%) |
Public vs Private Health Insurance Coverage by Age in Granville
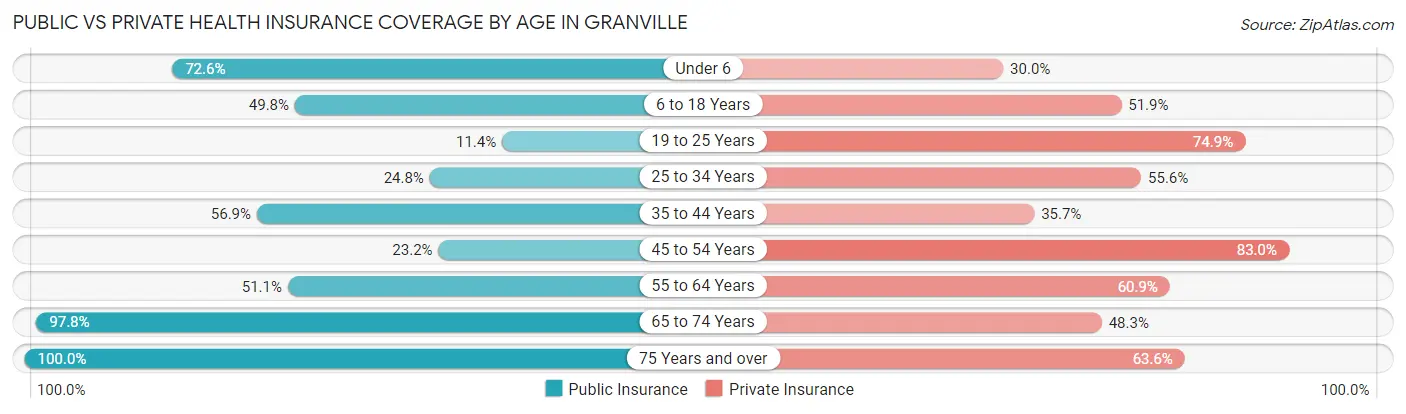
| Age Bracket | Public Insurance | Private Insurance |
| Under 6 | 143 (72.6%) | 59 (29.9%) |
| 6 to 18 Years | 146 (49.8%) | 152 (51.9%) |
| 19 to 25 Years | 19 (11.4%) | 125 (74.9%) |
| 25 to 34 Years | 67 (24.8%) | 150 (55.6%) |
| 35 to 44 Years | 223 (56.9%) | 140 (35.7%) |
| 45 to 54 Years | 64 (23.2%) | 229 (83.0%) |
| 55 to 64 Years | 179 (51.1%) | 213 (60.9%) |
| 65 to 74 Years | 223 (97.8%) | 110 (48.2%) |
| 75 Years and over | 176 (100.0%) | 112 (63.6%) |
| Total | 1,240 (52.8%) | 1,290 (54.9%) |
Disability Status by Sex by Age in Granville
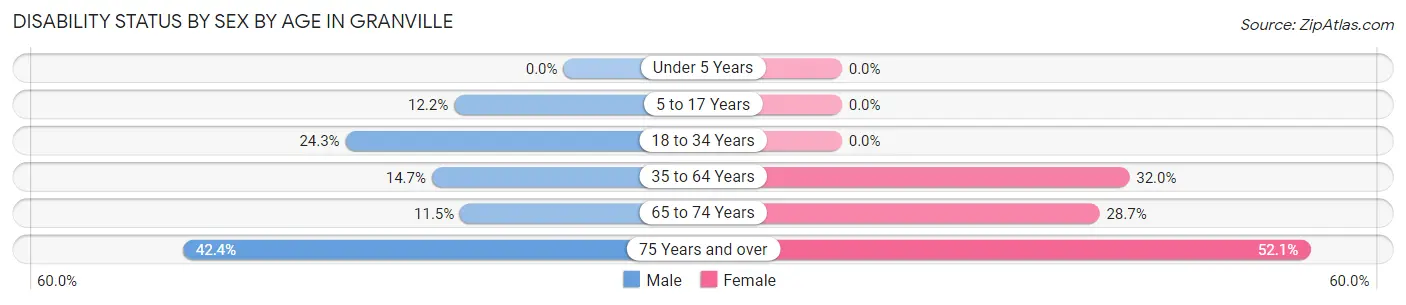
| Age Bracket | Male | Female |
| Under 5 Years | 0 (0.0%) | 0 (0.0%) |
| 5 to 17 Years | 14 (12.2%) | 0 (0.0%) |
| 18 to 34 Years | 50 (24.3%) | 0 (0.0%) |
| 35 to 64 Years | 75 (14.6%) | 162 (32.0%) |
| 65 to 74 Years | 13 (11.5%) | 33 (28.7%) |
| 75 Years and over | 25 (42.4%) | 61 (52.1%) |
Disability Class by Sex by Age in Granville
Disability Class: Hearing Difficulty
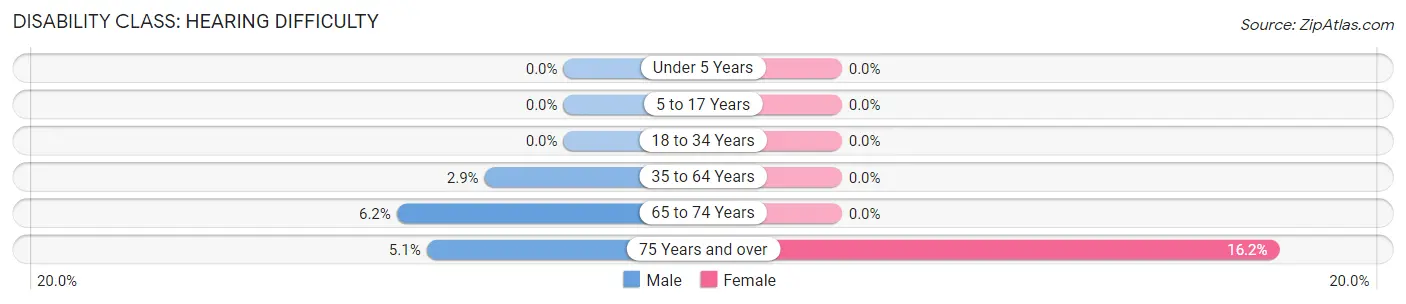
| Age Bracket | Male | Female |
| Under 5 Years | 0 (0.0%) | 0 (0.0%) |
| 5 to 17 Years | 0 (0.0%) | 0 (0.0%) |
| 18 to 34 Years | 0 (0.0%) | 0 (0.0%) |
| 35 to 64 Years | 15 (2.9%) | 0 (0.0%) |
| 65 to 74 Years | 7 (6.2%) | 0 (0.0%) |
| 75 Years and over | 3 (5.1%) | 19 (16.2%) |
Disability Class: Vision Difficulty
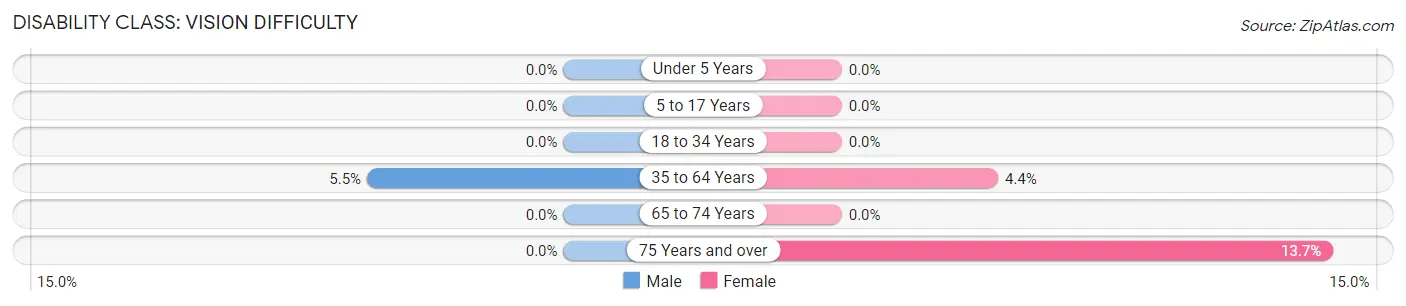
| Age Bracket | Male | Female |
| Under 5 Years | 0 (0.0%) | 0 (0.0%) |
| 5 to 17 Years | 0 (0.0%) | 0 (0.0%) |
| 18 to 34 Years | 0 (0.0%) | 0 (0.0%) |
| 35 to 64 Years | 28 (5.5%) | 22 (4.3%) |
| 65 to 74 Years | 0 (0.0%) | 0 (0.0%) |
| 75 Years and over | 0 (0.0%) | 16 (13.7%) |
Disability Class: Cognitive Difficulty
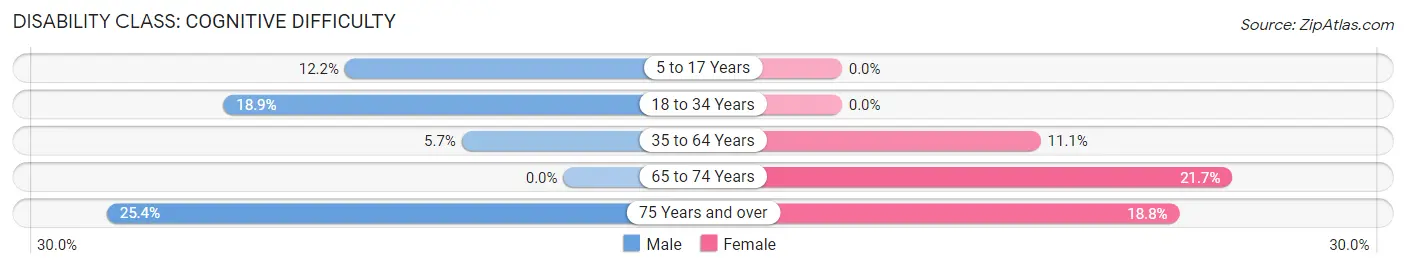
| Age Bracket | Male | Female |
| 5 to 17 Years | 14 (12.2%) | 0 (0.0%) |
| 18 to 34 Years | 39 (18.9%) | 0 (0.0%) |
| 35 to 64 Years | 29 (5.7%) | 56 (11.1%) |
| 65 to 74 Years | 0 (0.0%) | 25 (21.7%) |
| 75 Years and over | 15 (25.4%) | 22 (18.8%) |
Disability Class: Ambulatory Difficulty
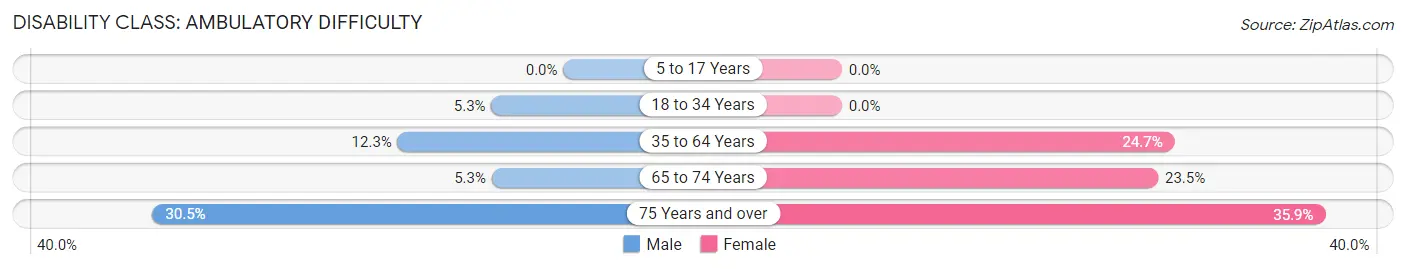
| Age Bracket | Male | Female |
| 5 to 17 Years | 0 (0.0%) | 0 (0.0%) |
| 18 to 34 Years | 11 (5.3%) | 0 (0.0%) |
| 35 to 64 Years | 63 (12.3%) | 125 (24.7%) |
| 65 to 74 Years | 6 (5.3%) | 27 (23.5%) |
| 75 Years and over | 18 (30.5%) | 42 (35.9%) |
Disability Class: Self-Care Difficulty
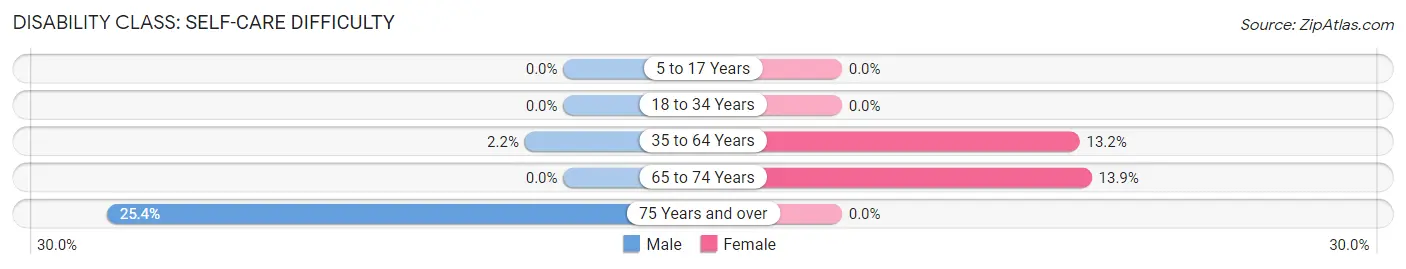
| Age Bracket | Male | Female |
| 5 to 17 Years | 0 (0.0%) | 0 (0.0%) |
| 18 to 34 Years | 0 (0.0%) | 0 (0.0%) |
| 35 to 64 Years | 11 (2.1%) | 67 (13.2%) |
| 65 to 74 Years | 0 (0.0%) | 16 (13.9%) |
| 75 Years and over | 15 (25.4%) | 0 (0.0%) |
Technology Access in Granville
Computing Device Access in Granville
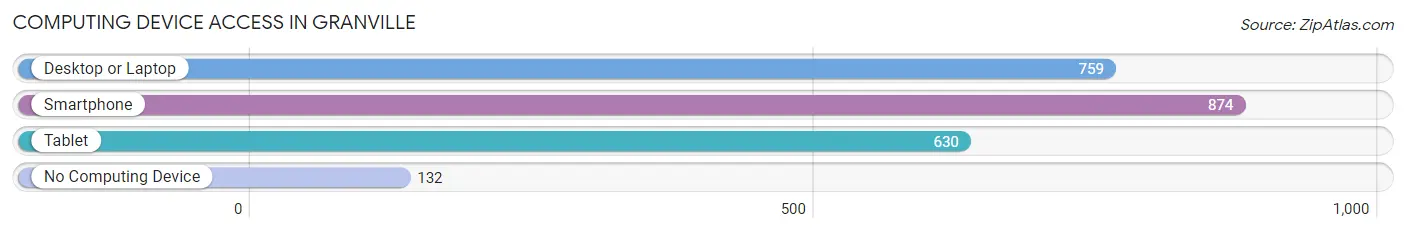
| Device Type | # Households | % Households |
| Desktop or Laptop | 759 | 69.0% |
| Smartphone | 874 | 79.4% |
| Tablet | 630 | 57.3% |
| No Computing Device | 132 | 12.0% |
| Total | 1,100 | 100.0% |
Internet Access in Granville
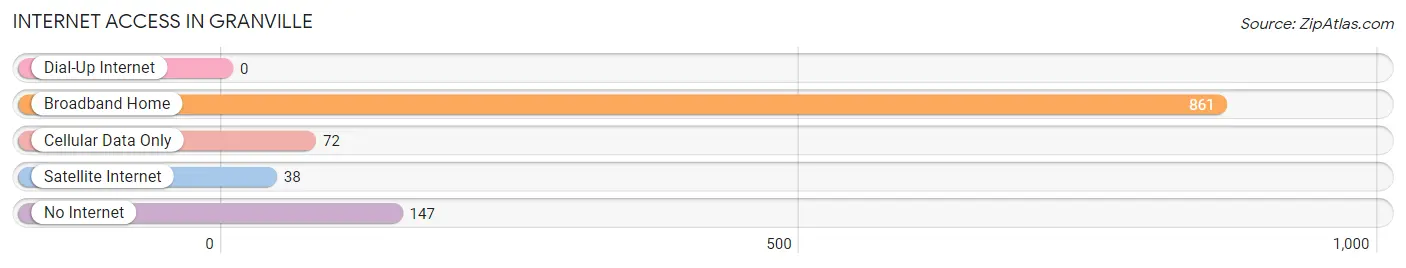
| Internet Type | # Households | % Households |
| Dial-Up Internet | 0 | 0.0% |
| Broadband Home | 861 | 78.3% |
| Cellular Data Only | 72 | 6.6% |
| Satellite Internet | 38 | 3.5% |
| No Internet | 147 | 13.4% |
| Total | 1,100 | 100.0% |
Granville Summary
Granville is a town located in Washington County, New York, United States. The population was 5,646 at the 2010 census. The town is named after Granville, Massachusetts.
Geography
Granville is located in the northwest corner of Washington County, bordered to the north by Rutland County, Vermont, to the east by the town of Whitehall, to the south by the town of Hampton, and to the west by the town of Pawlet, Vermont. According to the United States Census Bureau, the town has a total area of 43.2sqmi, of which 42.9sqmi is land and 0.3sqmi, or 0.68%, is water.
The Mettawee River a tributary of Lake Champlain flows through the town
History
Granville was first settled around 1770 The town was formed in 1786 from the town of Whitehall
Demographics
As of the census of 2000, there were 5,717 people, 2,093 households, and 1,541 families residing in the town. The population density was 133.2 people per square mile (51.4/km^2). There were 2,521 housing units at an average density of 58.6 per square mile (22.6/km^2). The racial makeup of the town was 97.90% White, 0.53% African American, 0.21% Native American, 0.21% Asian, 0.02% Pacific Islander, 0.17% from other races, and 0.96% from two or more races. Hispanic or Latino of any race were 0.63% of the population.
There were 2,093 households, out of which 35.2% had children under the age of 18 living with them, 59.2% were married couples living together, 8.7% had a female householder with no husband present, and 27.2% were non-families. 22.2% of all households were made up of individuals, and 9.7% had someone living alone who was 65 years of age or older. The average household size was 2.71 and the average family size was 3.17.
In the town, the population was spread out, with 28.2% under the age of 18, 6.7% from 18 to 24, 28.2% from 25 to 44, 24.2% from 45 to 64, and 12.7% who were 65 years of age or older. The median age was 38 years. For every 100 females, there were 97.2 males. For every 100 females age 18 and over, there were 94.2 males.
The median income for a household in the town was $41,944, and the median income for a family was $48,958. Males had a median income of $35,938 versus $25,917 for females. The per capita income for the town was $18,945. About 5.2% of families and 7.3% of the population were below the poverty line, including 8.2% of those under age 18 and 6.2% of those age 65 or over.
Economy
Granville is home to several small businesses, including a few restaurants, a grocery store, a hardware store, and a few other small shops. The town is also home to a few small manufacturing companies, including a plastics manufacturer and a metal fabrication shop. The town is also home to a few farms, which produce a variety of crops, including apples, corn, and hay.
The town is also home to a few tourist attractions, including the Granville Historical Society Museum, the Granville Grist Mill, and the Granville Country Store. The town is also home to a few parks, including the Granville Town Park, which features a playground, picnic area, and a walking trail.
Conclusion
Granville is a small town located in Washington County, New York. The town has a population of 5,646 as of the 2010 census. The town is home to several small businesses, farms, and tourist attractions. The town has a rich history and is home to a variety of cultures and backgrounds. The town has a median household income of $41,944 and a per capita income of $18,945. Granville is a great place to live and work, and offers a variety of activities and attractions for residents and visitors alike.
Common Questions
What is Per Capita Income in Granville?
Per Capita income in Granville is $25,754.
What is the Median Family Income in Granville?
Median Family Income in Granville is $57,411.
What is the Median Household income in Granville?
Median Household Income in Granville is $46,337.
What is Income or Wage Gap in Granville?
Income or Wage Gap in Granville is 30.0%.
Women in Granville earn 70.0 cents for every dollar earned by a man.
What is Inequality or Gini Index in Granville?
Inequality or Gini Index in Granville is 0.42.
What is the Total Population of Granville?
Total Population of Granville is 2,370.
What is the Total Male Population of Granville?
Total Male Population of Granville is 1,114.
What is the Total Female Population of Granville?
Total Female Population of Granville is 1,256.
What is the Ratio of Males per 100 Females in Granville?
There are 88.69 Males per 100 Females in Granville.
What is the Ratio of Females per 100 Males in Granville?
There are 112.75 Females per 100 Males in Granville.
What is the Median Population Age in Granville?
Median Population Age in Granville is 41.0 Years.
What is the Average Family Size in Granville
Average Family Size in Granville is 2.8 People.
What is the Average Household Size in Granville
Average Household Size in Granville is 2.1 People.
How Large is the Labor Force in Granville?
There are 1,008 People in the Labor Forcein in Granville.
What is the Percentage of People in the Labor Force in Granville?
52.0% of People are in the Labor Force in Granville.
What is the Unemployment Rate in Granville?
Unemployment Rate in Granville is 4.0%.