Geneseo, NY Map & Demographics
Geneseo Map
Geneseo Overview
$18,096
PER CAPITA INCOME
$71,563
AVG FAMILY INCOME
$37,701
AVG HOUSEHOLD INCOME
24.9%
WAGE / INCOME GAP [ % ]
75.1¢/ $1
WAGE / INCOME GAP [ $ ]
0.55
INEQUALITY / GINI INDEX
7,713
TOTAL POPULATION
3,153
MALE POPULATION
4,560
FEMALE POPULATION
69.14
MALES / 100 FEMALES
144.62
FEMALES / 100 MALES
21.2
MEDIAN AGE
2.6
AVG FAMILY SIZE
2.4
AVG HOUSEHOLD SIZE
3,196
LABOR FORCE [ PEOPLE ]
44.6%
PERCENT IN LABOR FORCE
7.1%
UNEMPLOYMENT RATE
Geneseo Zip Codes
Geneseo Area Codes
Income in Geneseo
Income Overview in Geneseo
Per Capita Income in Geneseo is $18,096, while median incomes of families and households are $71,563 and $37,701 respectively.
| Characteristic | Number | Measure |
| Per Capita Income | 7,713 | $18,096 |
| Median Family Income | 909 | $71,563 |
| Mean Family Income | 909 | $93,021 |
| Median Household Income | 1,883 | $37,701 |
| Mean Household Income | 1,883 | $66,234 |
| Income Deficit | 909 | $0 |
| Wage / Income Gap (%) | 7,713 | 24.91% |
| Wage / Income Gap ($) | 7,713 | 75.09¢ per $1 |
| Gini / Inequality Index | 7,713 | 0.55 |
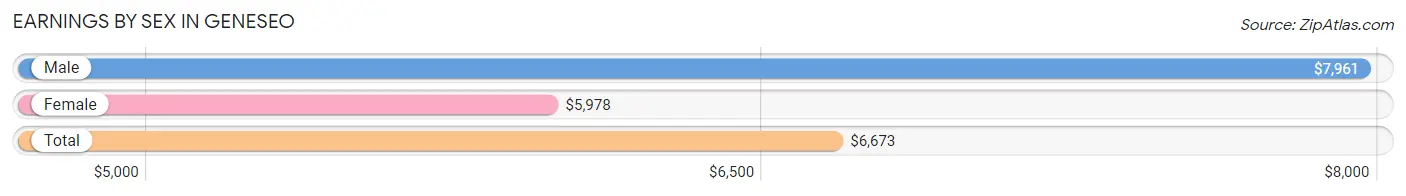
Earnings by Sex in Geneseo
Average Earnings in Geneseo are $6,673, $7,961 for men and $5,978 for women, a difference of 24.9%.
| Sex | Number | Average Earnings |
| Male | 1,797 (40.3%) | $7,961 |
| Female | 2,662 (59.7%) | $5,978 |
| Total | 4,459 (100.0%) | $6,673 |
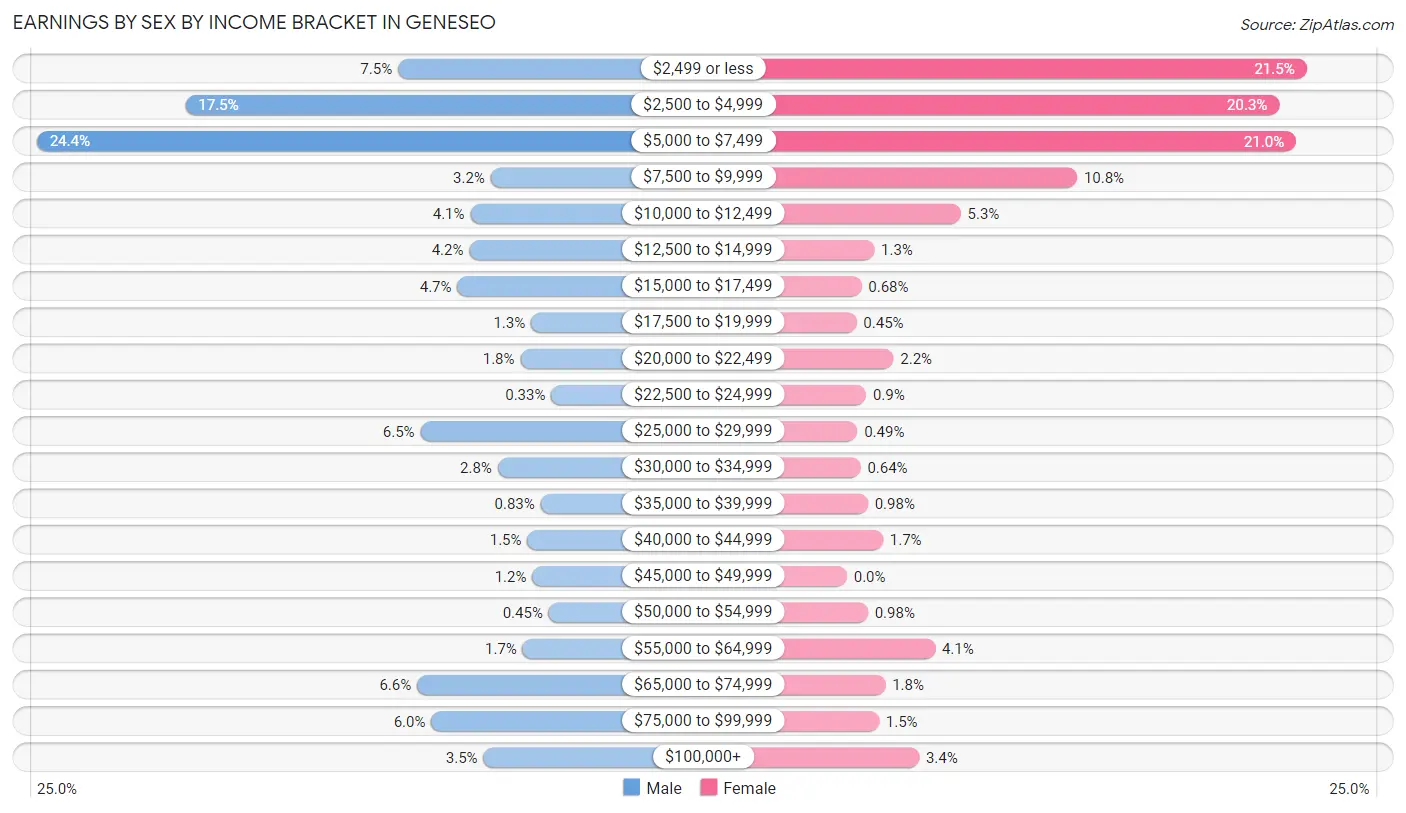
Earnings by Sex by Income Bracket in Geneseo
The most common earnings brackets in Geneseo are $5,000 to $7,499 for men (439 | 24.4%) and $2,499 or less for women (573 | 21.5%).
| Income | Male | Female |
| $2,499 or less | 135 (7.5%) | 573 (21.5%) |
| $2,500 to $4,999 | 314 (17.5%) | 539 (20.3%) |
| $5,000 to $7,499 | 439 (24.4%) | 560 (21.0%) |
| $7,500 to $9,999 | 57 (3.2%) | 287 (10.8%) |
| $10,000 to $12,499 | 74 (4.1%) | 142 (5.3%) |
| $12,500 to $14,999 | 75 (4.2%) | 34 (1.3%) |
| $15,000 to $17,499 | 85 (4.7%) | 18 (0.7%) |
| $17,500 to $19,999 | 23 (1.3%) | 12 (0.4%) |
| $20,000 to $22,499 | 32 (1.8%) | 58 (2.2%) |
| $22,500 to $24,999 | 6 (0.3%) | 24 (0.9%) |
| $25,000 to $29,999 | 116 (6.5%) | 13 (0.5%) |
| $30,000 to $34,999 | 51 (2.8%) | 17 (0.6%) |
| $35,000 to $39,999 | 15 (0.8%) | 26 (1.0%) |
| $40,000 to $44,999 | 26 (1.5%) | 45 (1.7%) |
| $45,000 to $49,999 | 22 (1.2%) | 0 (0.0%) |
| $50,000 to $54,999 | 8 (0.4%) | 26 (1.0%) |
| $55,000 to $64,999 | 30 (1.7%) | 110 (4.1%) |
| $65,000 to $74,999 | 119 (6.6%) | 48 (1.8%) |
| $75,000 to $99,999 | 107 (5.9%) | 40 (1.5%) |
| $100,000+ | 63 (3.5%) | 90 (3.4%) |
| Total | 1,797 (100.0%) | 2,662 (100.0%) |
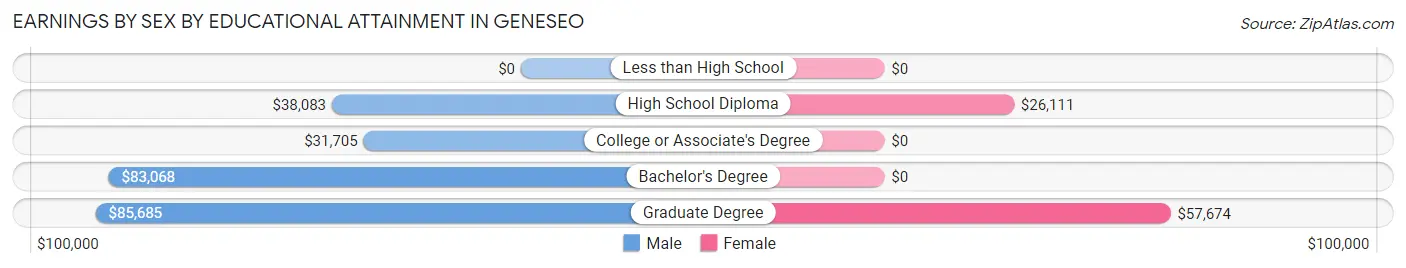
Earnings by Sex by Educational Attainment in Geneseo
Average earnings in Geneseo are $66,111 for men and $42,279 for women, a difference of 36.0%. Men with an educational attainment of graduate degree enjoy the highest average annual earnings of $85,685, while those with college or associate's degree education earn the least with $31,705. Women with an educational attainment of graduate degree earn the most with the average annual earnings of $57,674, while those with high school diploma education have the smallest earnings of $26,111.
| Educational Attainment | Male Income | Female Income |
| Less than High School | - | - |
| High School Diploma | $38,083 | $26,111 |
| College or Associate's Degree | $31,705 | $0 |
| Bachelor's Degree | $83,068 | $0 |
| Graduate Degree | $85,685 | $57,674 |
| Total | $66,111 | $42,279 |
Family Income in Geneseo
Family Income Brackets in Geneseo
According to the Geneseo family income data, there are 249 families falling into the $100,000 to $149,999 income range, which is the most common income bracket and makes up 27.4% of all families. Conversely, the $15,000 to $24,999 income bracket is the least frequent group with only 6 families (0.7%) belonging to this category.
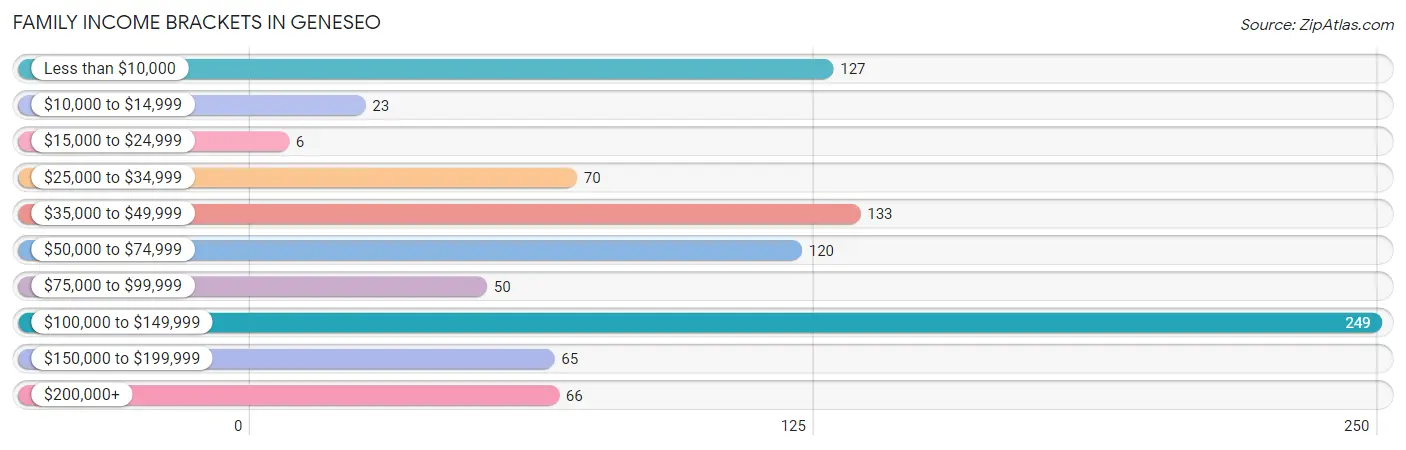
| Income Bracket | # Families | % Families |
| Less than $10,000 | 127 | 14.0% |
| $10,000 to $14,999 | 23 | 2.5% |
| $15,000 to $24,999 | 6 | 0.7% |
| $25,000 to $34,999 | 70 | 7.7% |
| $35,000 to $49,999 | 133 | 14.6% |
| $50,000 to $74,999 | 120 | 13.2% |
| $75,000 to $99,999 | 50 | 5.5% |
| $100,000 to $149,999 | 249 | 27.4% |
| $150,000 to $199,999 | 65 | 7.2% |
| $200,000+ | 66 | 7.3% |
Family Income by Famaliy Size in Geneseo
5-person families (50 | 5.5%) account for the highest median family income in Geneseo with $131,346 per family, while 2-person families (488 | 53.7%) have the highest median income of $33,828 per family member.
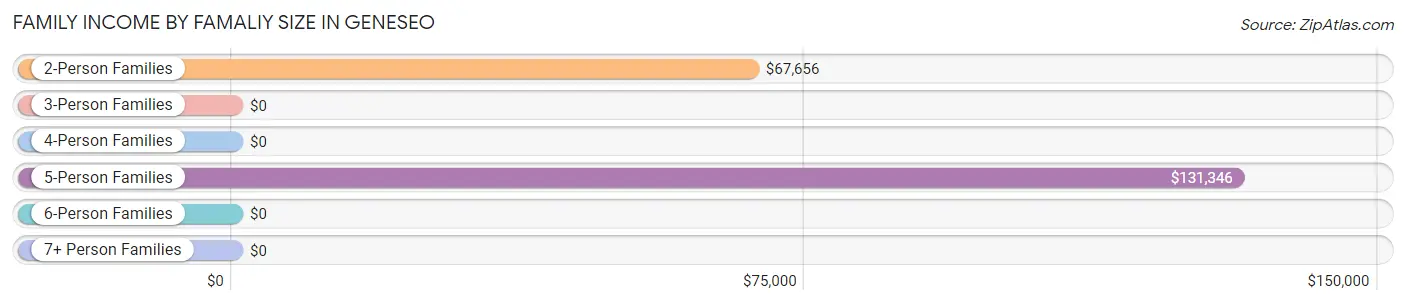
| Income Bracket | # Families | Median Income |
| 2-Person Families | 488 (53.7%) | $67,656 |
| 3-Person Families | 287 (31.6%) | $0 |
| 4-Person Families | 58 (6.4%) | $0 |
| 5-Person Families | 50 (5.5%) | $131,346 |
| 6-Person Families | 16 (1.8%) | $0 |
| 7+ Person Families | 10 (1.1%) | $0 |
| Total | 909 (100.0%) | $71,563 |
Family Income by Number of Earners in Geneseo
The median family income in Geneseo is $71,563, with families comprising 3+ earners (112) having the highest median family income of $141,284, while families with 1 earner (242) have the lowest median family income of $39,255, accounting for 12.3% and 26.6% of families, respectively.
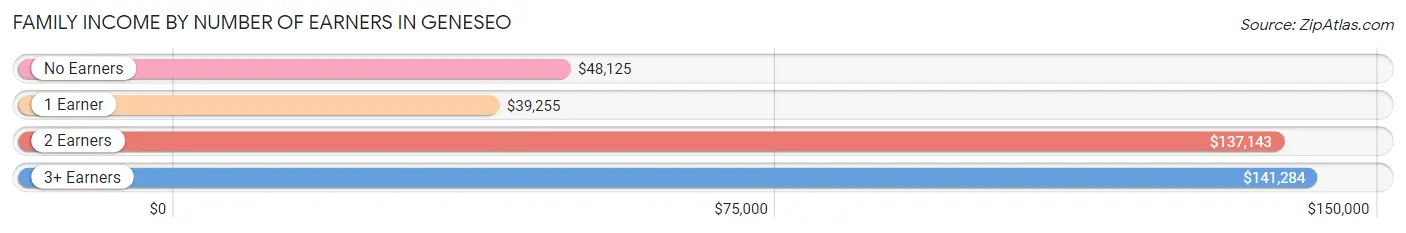
| Number of Earners | # Families | Median Income |
| No Earners | 313 (34.4%) | $48,125 |
| 1 Earner | 242 (26.6%) | $39,255 |
| 2 Earners | 242 (26.6%) | $137,143 |
| 3+ Earners | 112 (12.3%) | $141,284 |
| Total | 909 (100.0%) | $71,563 |
Household Income in Geneseo
Household Income Brackets in Geneseo
With 301 households falling in the category, the $100,000 to $149,999 income range is the most frequent in Geneseo, accounting for 16.0% of all households. In contrast, only 56 households (3.0%) fall into the $75,000 to $99,999 income bracket, making it the least populous group.
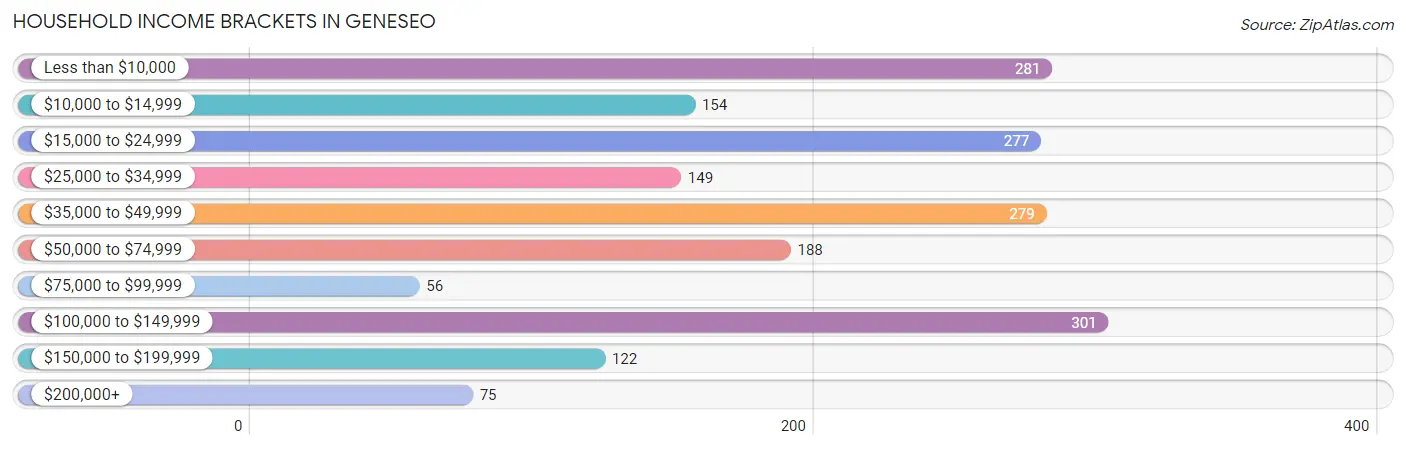
| Income Bracket | # Households | % Households |
| Less than $10,000 | 281 | 14.9% |
| $10,000 to $14,999 | 154 | 8.2% |
| $15,000 to $24,999 | 277 | 14.7% |
| $25,000 to $34,999 | 149 | 7.9% |
| $35,000 to $49,999 | 279 | 14.8% |
| $50,000 to $74,999 | 188 | 10.0% |
| $75,000 to $99,999 | 56 | 3.0% |
| $100,000 to $149,999 | 301 | 16.0% |
| $150,000 to $199,999 | 122 | 6.5% |
| $200,000+ | 75 | 4.0% |
Household Income by Householder Age in Geneseo
The median household income in Geneseo is $37,701, with the highest median household income of $67,902 found in the 65+ years age bracket for the primary householder. A total of 441 households (23.4%) fall into this category. Meanwhile, the 25 to 44 years age bracket for the primary householder has the lowest median household income of $0, with 456 households (24.2%) in this group.
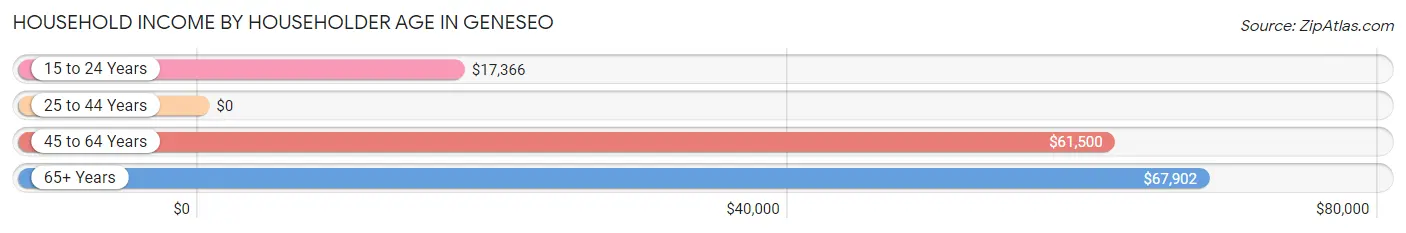
| Income Bracket | # Households | Median Income |
| 15 to 24 Years | 526 (27.9%) | $17,366 |
| 25 to 44 Years | 456 (24.2%) | $0 |
| 45 to 64 Years | 460 (24.4%) | $61,500 |
| 65+ Years | 441 (23.4%) | $67,902 |
| Total | 1,883 (100.0%) | $37,701 |
Poverty in Geneseo
Income Below Poverty by Sex and Age in Geneseo
With 31.2% poverty level for males and 45.7% for females among the residents of Geneseo, 18 to 24 year old males and 5 year old females are the most vulnerable to poverty, with 469 males (61.6%) and 64 females (85.3%) in their respective age groups living below the poverty level.
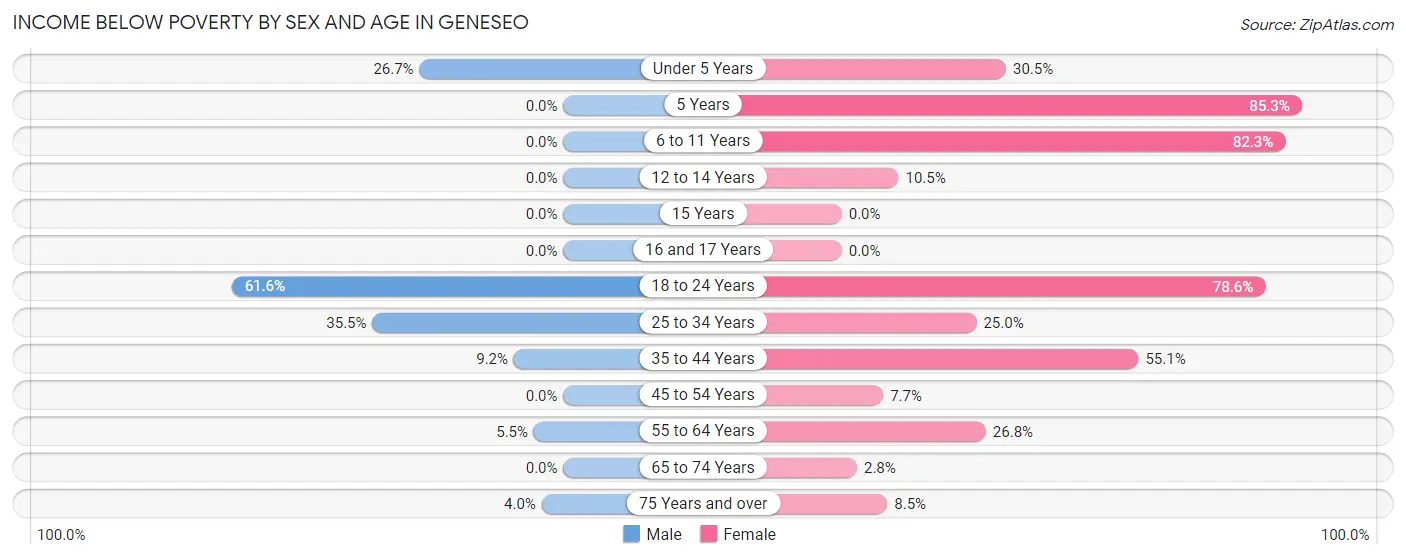
| Age Bracket | Male | Female |
| Under 5 Years | 39 (26.7%) | 25 (30.5%) |
| 5 Years | 0 (0.0%) | 64 (85.3%) |
| 6 to 11 Years | 0 (0.0%) | 65 (82.3%) |
| 12 to 14 Years | 0 (0.0%) | 6 (10.5%) |
| 15 Years | 0 (0.0%) | 0 (0.0%) |
| 16 and 17 Years | 0 (0.0%) | 0 (0.0%) |
| 18 to 24 Years | 469 (61.6%) | 825 (78.6%) |
| 25 to 34 Years | 67 (35.4%) | 58 (25.0%) |
| 35 to 44 Years | 9 (9.2%) | 76 (55.1%) |
| 45 to 54 Years | 0 (0.0%) | 18 (7.7%) |
| 55 to 64 Years | 7 (5.5%) | 61 (26.8%) |
| 65 to 74 Years | 0 (0.0%) | 7 (2.8%) |
| 75 Years and over | 8 (4.0%) | 12 (8.5%) |
| Total | 599 (31.2%) | 1,217 (45.7%) |
Income Above Poverty by Sex and Age in Geneseo
According to the poverty statistics in Geneseo, males aged 5 years and females aged 15 years are the age groups that are most secure financially, with 100.0% of males and 100.0% of females in these age groups living above the poverty line.
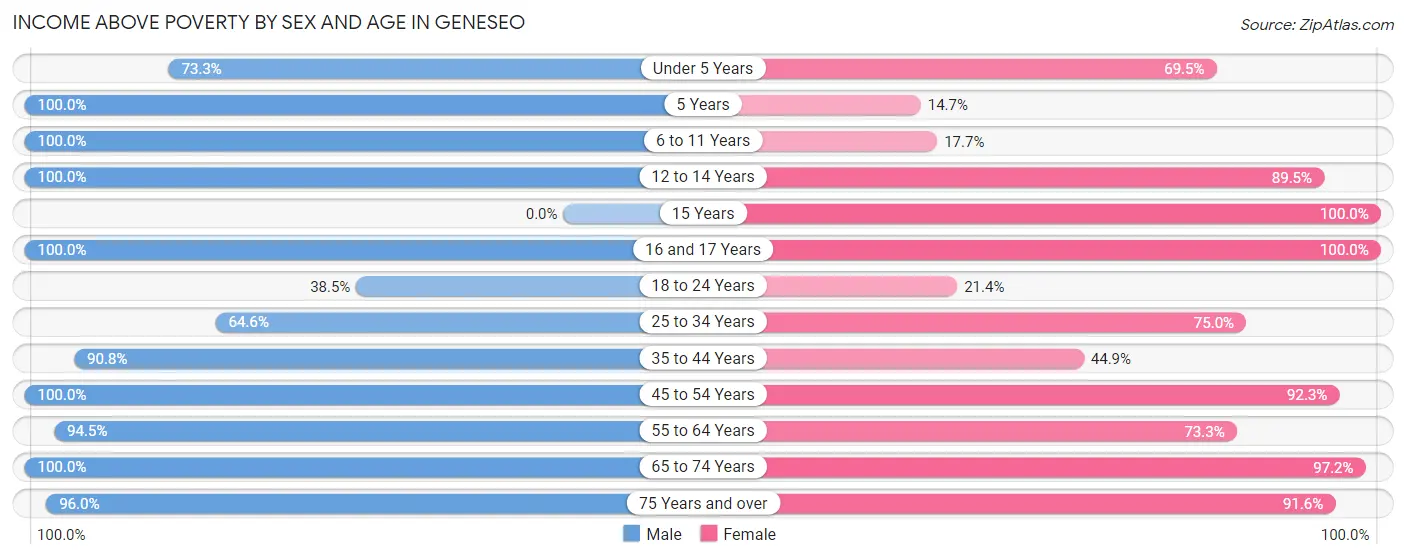
| Age Bracket | Male | Female |
| Under 5 Years | 107 (73.3%) | 57 (69.5%) |
| 5 Years | 19 (100.0%) | 11 (14.7%) |
| 6 to 11 Years | 45 (100.0%) | 14 (17.7%) |
| 12 to 14 Years | 22 (100.0%) | 51 (89.5%) |
| 15 Years | 0 (0.0%) | 23 (100.0%) |
| 16 and 17 Years | 14 (100.0%) | 78 (100.0%) |
| 18 to 24 Years | 293 (38.5%) | 225 (21.4%) |
| 25 to 34 Years | 122 (64.5%) | 174 (75.0%) |
| 35 to 44 Years | 89 (90.8%) | 62 (44.9%) |
| 45 to 54 Years | 135 (100.0%) | 216 (92.3%) |
| 55 to 64 Years | 121 (94.5%) | 167 (73.3%) |
| 65 to 74 Years | 162 (100.0%) | 240 (97.2%) |
| 75 Years and over | 191 (96.0%) | 130 (91.5%) |
| Total | 1,320 (68.8%) | 1,448 (54.3%) |
Income Below Poverty Among Married-Couple Families in Geneseo
The poverty statistics for married-couple families in Geneseo show that 1.1% or 7 of the total 667 families live below the poverty line. Families with no children have the highest poverty rate of 1.6%, comprising of 7 families. On the other hand, families with 1 or 2 children have the lowest poverty rate of 0.0%, which includes 0 families.
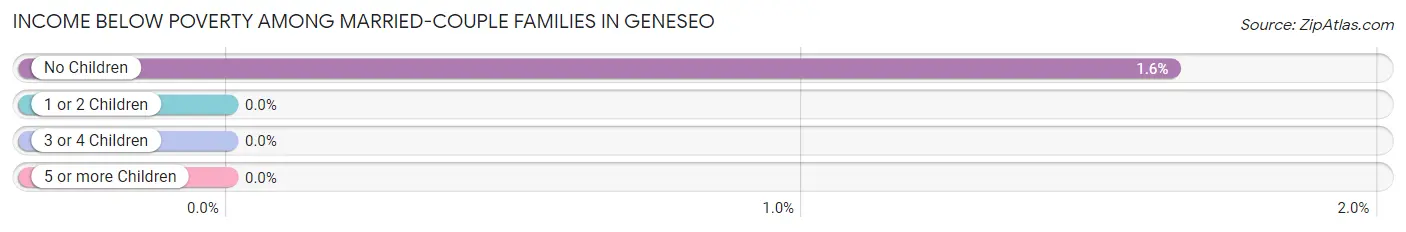
| Children | Above Poverty | Below Poverty |
| No Children | 420 (98.4%) | 7 (1.6%) |
| 1 or 2 Children | 211 (100.0%) | 0 (0.0%) |
| 3 or 4 Children | 29 (100.0%) | 0 (0.0%) |
| 5 or more Children | 0 (0.0%) | 0 (0.0%) |
| Total | 660 (99.0%) | 7 (1.1%) |
Income Below Poverty Among Single-Parent Households in Geneseo
According to the poverty data in Geneseo, 28.6% or 8 single-father households and 63.1% or 135 single-mother households are living below the poverty line. Among single-father households, those with 1 or 2 children have the highest poverty rate, with 8 households (100.0%) experiencing poverty. Likewise, among single-mother households, those with 3 or 4 children have the highest poverty rate, with 6 households (100.0%) falling below the poverty line.
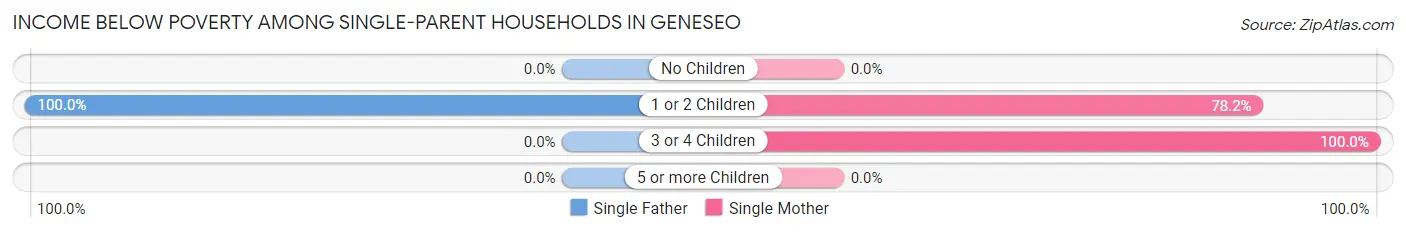
| Children | Single Father | Single Mother |
| No Children | 0 (0.0%) | 0 (0.0%) |
| 1 or 2 Children | 8 (100.0%) | 129 (78.2%) |
| 3 or 4 Children | 0 (0.0%) | 6 (100.0%) |
| 5 or more Children | 0 (0.0%) | 0 (0.0%) |
| Total | 8 (28.6%) | 135 (63.1%) |
Income Below Poverty Among Married-Couple vs Single-Parent Households in Geneseo
The poverty data for Geneseo shows that 7 of the married-couple family households (1.1%) and 143 of the single-parent households (59.1%) are living below the poverty level. Within the married-couple family households, those with no children have the highest poverty rate, with 7 households (1.6%) falling below the poverty line. Among the single-parent households, those with 3 or 4 children have the highest poverty rate, with 6 household (100.0%) living below poverty.
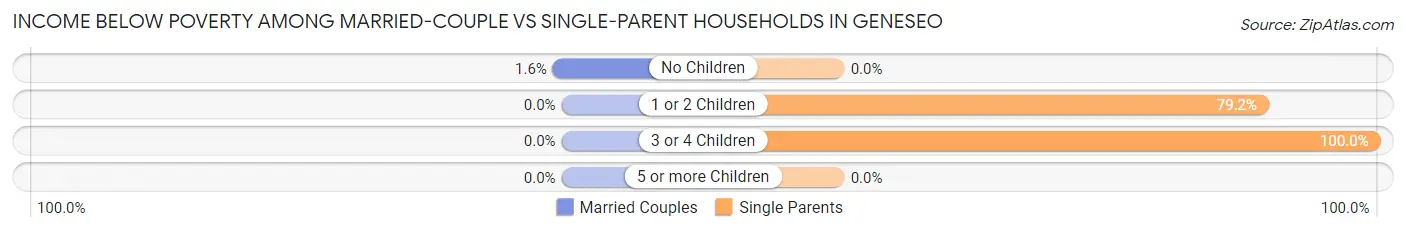
| Children | Married-Couple Families | Single-Parent Households |
| No Children | 7 (1.6%) | 0 (0.0%) |
| 1 or 2 Children | 0 (0.0%) | 137 (79.2%) |
| 3 or 4 Children | 0 (0.0%) | 6 (100.0%) |
| 5 or more Children | 0 (0.0%) | 0 (0.0%) |
| Total | 7 (1.1%) | 143 (59.1%) |
Race in Geneseo
The most populous races in Geneseo are White / Caucasian (6,827 | 88.5%), Hispanic or Latino (476 | 6.2%), and Black / African American (279 | 3.6%).
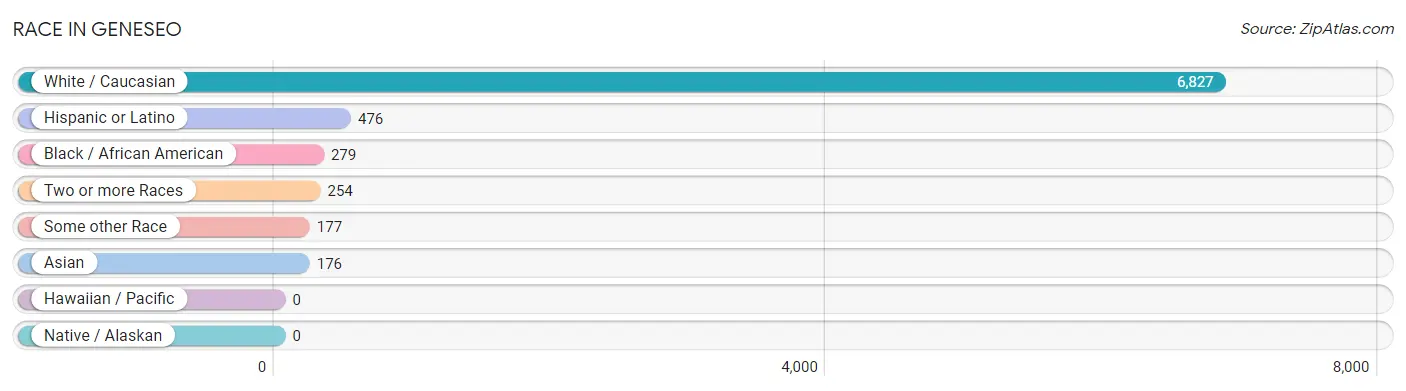
| Race | # Population | % Population |
| Asian | 176 | 2.3% |
| Black / African American | 279 | 3.6% |
| Hawaiian / Pacific | 0 | 0.0% |
| Hispanic or Latino | 476 | 6.2% |
| Native / Alaskan | 0 | 0.0% |
| White / Caucasian | 6,827 | 88.5% |
| Two or more Races | 254 | 3.3% |
| Some other Race | 177 | 2.3% |
| Total | 7,713 | 100.0% |
Ancestry in Geneseo
The most populous ancestries reported in Geneseo are Irish (1,272 | 16.5%), Italian (1,269 | 16.5%), German (887 | 11.5%), English (741 | 9.6%), and French (224 | 2.9%), together accounting for 57.0% of all Geneseo residents.
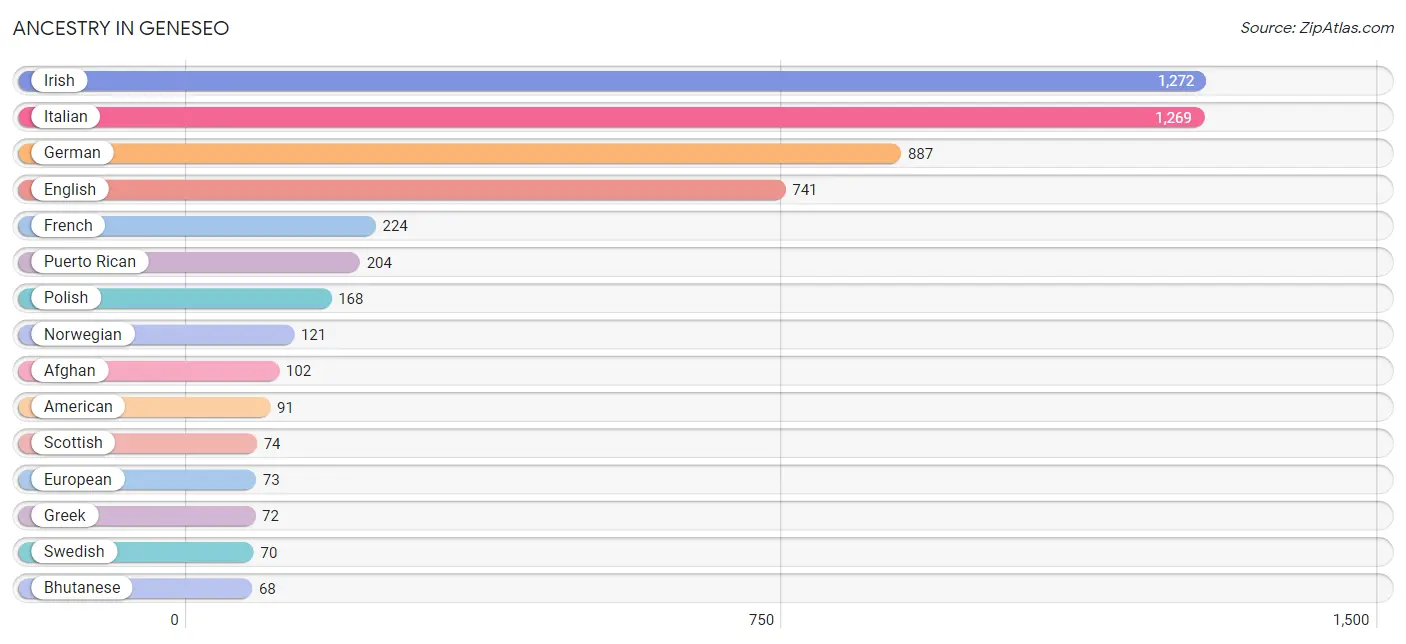
| Ancestry | # Population | % Population |
| Afghan | 102 | 1.3% |
| African | 24 | 0.3% |
| American | 91 | 1.2% |
| Arab | 43 | 0.6% |
| Argentinean | 4 | 0.1% |
| Armenian | 6 | 0.1% |
| Austrian | 65 | 0.8% |
| Bhutanese | 68 | 0.9% |
| British | 6 | 0.1% |
| Burmese | 53 | 0.7% |
| Central American | 20 | 0.3% |
| Central American Indian | 9 | 0.1% |
| Cherokee | 1 | 0.0% |
| Colombian | 5 | 0.1% |
| Cuban | 15 | 0.2% |
| Czechoslovakian | 6 | 0.1% |
| Dominican | 6 | 0.1% |
| Dutch | 37 | 0.5% |
| Eastern European | 11 | 0.1% |
| English | 741 | 9.6% |
| Estonian | 14 | 0.2% |
| European | 73 | 0.9% |
| French | 224 | 2.9% |
| French Canadian | 57 | 0.7% |
| German | 887 | 11.5% |
| Greek | 72 | 0.9% |
| Hungarian | 11 | 0.1% |
| Indian (Asian) | 27 | 0.4% |
| Irish | 1,272 | 16.5% |
| Italian | 1,269 | 16.5% |
| Jamaican | 1 | 0.0% |
| Jordanian | 4 | 0.1% |
| Korean | 4 | 0.1% |
| Mexican | 17 | 0.2% |
| Norwegian | 121 | 1.6% |
| Panamanian | 20 | 0.3% |
| Paraguayan | 6 | 0.1% |
| Polish | 168 | 2.2% |
| Portuguese | 44 | 0.6% |
| Puerto Rican | 204 | 2.6% |
| Russian | 49 | 0.6% |
| Scotch-Irish | 50 | 0.6% |
| Scottish | 74 | 1.0% |
| South American | 22 | 0.3% |
| Spaniard | 49 | 0.6% |
| Subsaharan African | 24 | 0.3% |
| Swedish | 70 | 0.9% |
| Syrian | 32 | 0.4% |
| Thai | 17 | 0.2% |
| Turkish | 33 | 0.4% |
| Ukrainian | 32 | 0.4% |
| Vietnamese | 13 | 0.2% |
| Welsh | 61 | 0.8% |
| West Indian | 4 | 0.1% | View All 54 Rows |
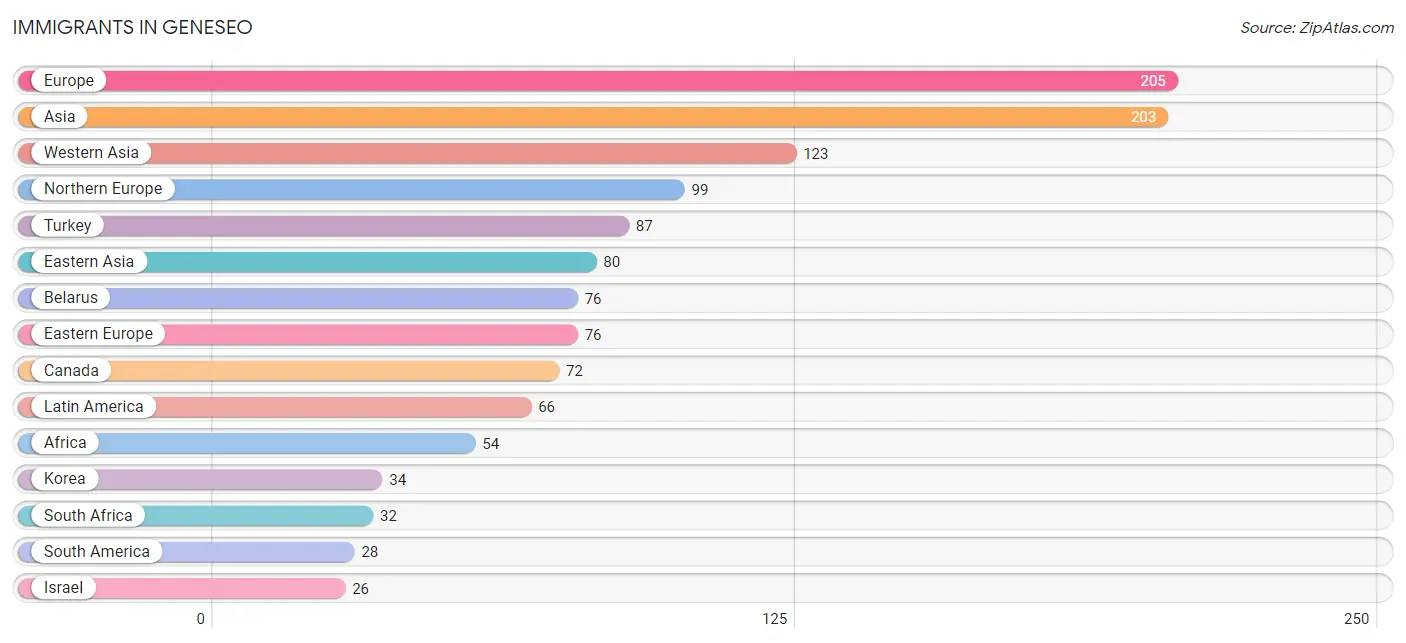
Immigrants in Geneseo
The most numerous immigrant groups reported in Geneseo came from Europe (205 | 2.7%), Asia (203 | 2.6%), Western Asia (123 | 1.6%), Northern Europe (99 | 1.3%), and Turkey (87 | 1.1%), together accounting for 9.3% of all Geneseo residents.
| Immigration Origin | # Population | % Population |
| Africa | 54 | 0.7% |
| Asia | 203 | 2.6% |
| Belarus | 76 | 1.0% |
| Canada | 72 | 0.9% |
| Caribbean | 24 | 0.3% |
| Central America | 14 | 0.2% |
| China | 20 | 0.3% |
| Eastern Africa | 8 | 0.1% |
| Eastern Asia | 80 | 1.0% |
| Eastern Europe | 76 | 1.0% |
| Ecuador | 15 | 0.2% |
| Ethiopia | 8 | 0.1% |
| Europe | 205 | 2.7% |
| Germany | 15 | 0.2% |
| Greece | 15 | 0.2% |
| Israel | 26 | 0.3% |
| Jamaica | 24 | 0.3% |
| Japan | 26 | 0.3% |
| Jordan | 4 | 0.1% |
| Korea | 34 | 0.4% |
| Latin America | 66 | 0.9% |
| Mexico | 14 | 0.2% |
| Middle Africa | 14 | 0.2% |
| Northern Europe | 99 | 1.3% |
| Norway | 10 | 0.1% |
| Peru | 13 | 0.2% |
| South Africa | 32 | 0.4% |
| South America | 28 | 0.4% |
| Southern Europe | 15 | 0.2% |
| Turkey | 87 | 1.1% |
| Western Asia | 123 | 1.6% |
| Western Europe | 15 | 0.2% | View All 32 Rows |
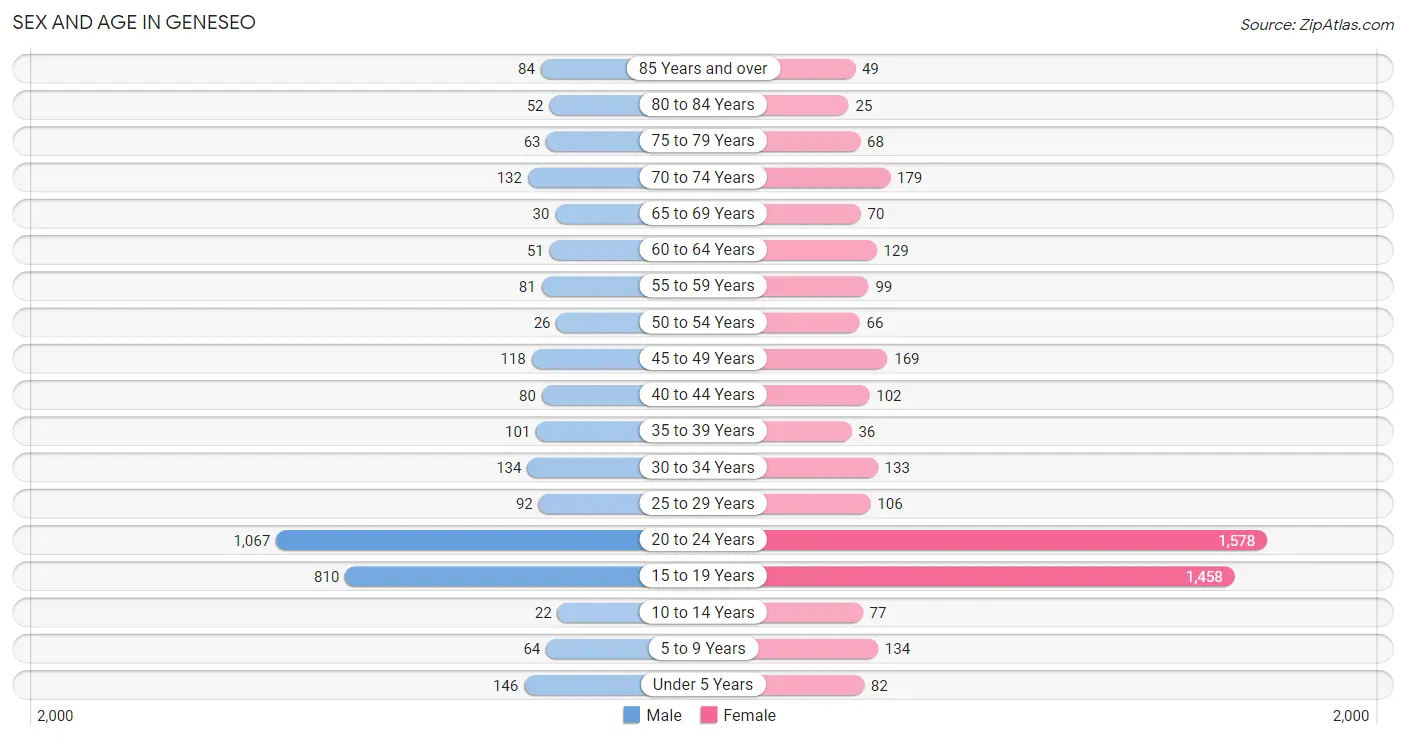
Sex and Age in Geneseo
Sex and Age in Geneseo
The most populous age groups in Geneseo are 20 to 24 Years (1,067 | 33.8%) for men and 20 to 24 Years (1,578 | 34.6%) for women.
| Age Bracket | Male | Female |
| Under 5 Years | 146 (4.6%) | 82 (1.8%) |
| 5 to 9 Years | 64 (2.0%) | 134 (2.9%) |
| 10 to 14 Years | 22 (0.7%) | 77 (1.7%) |
| 15 to 19 Years | 810 (25.7%) | 1,458 (32.0%) |
| 20 to 24 Years | 1,067 (33.8%) | 1,578 (34.6%) |
| 25 to 29 Years | 92 (2.9%) | 106 (2.3%) |
| 30 to 34 Years | 134 (4.3%) | 133 (2.9%) |
| 35 to 39 Years | 101 (3.2%) | 36 (0.8%) |
| 40 to 44 Years | 80 (2.5%) | 102 (2.2%) |
| 45 to 49 Years | 118 (3.7%) | 169 (3.7%) |
| 50 to 54 Years | 26 (0.8%) | 66 (1.5%) |
| 55 to 59 Years | 81 (2.6%) | 99 (2.2%) |
| 60 to 64 Years | 51 (1.6%) | 129 (2.8%) |
| 65 to 69 Years | 30 (0.9%) | 70 (1.5%) |
| 70 to 74 Years | 132 (4.2%) | 179 (3.9%) |
| 75 to 79 Years | 63 (2.0%) | 68 (1.5%) |
| 80 to 84 Years | 52 (1.7%) | 25 (0.5%) |
| 85 Years and over | 84 (2.7%) | 49 (1.1%) |
| Total | 3,153 (100.0%) | 4,560 (100.0%) |
Families and Households in Geneseo
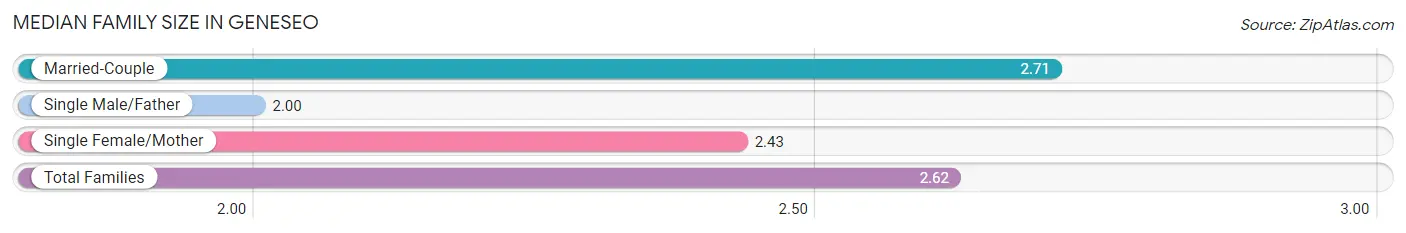
Median Family Size in Geneseo
The median family size in Geneseo is 2.62 persons per family, with married-couple families (667 | 73.4%) accounting for the largest median family size of 2.71 persons per family. On the other hand, single male/father families (28 | 3.1%) represent the smallest median family size with 2.00 persons per family.
| Family Type | # Families | Family Size |
| Married-Couple | 667 (73.4%) | 2.71 |
| Single Male/Father | 28 (3.1%) | 2.00 |
| Single Female/Mother | 214 (23.5%) | 2.43 |
| Total Families | 909 (100.0%) | 2.62 |
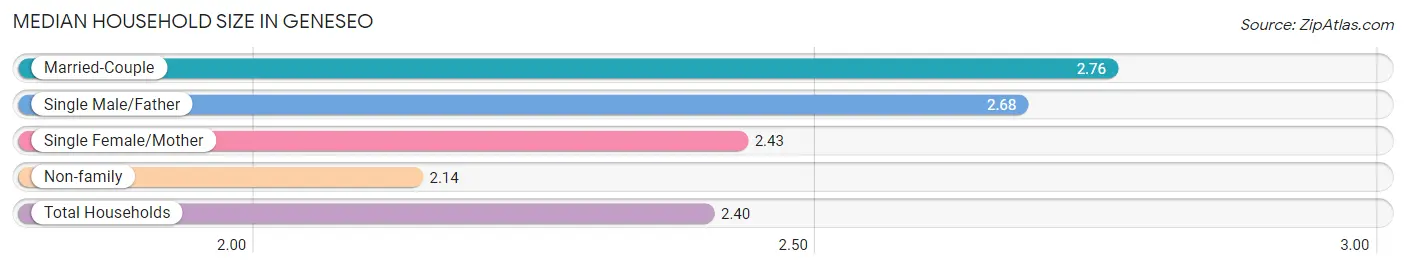
Median Household Size in Geneseo
The median household size in Geneseo is 2.40 persons per household, with married-couple households (667 | 35.4%) accounting for the largest median household size of 2.76 persons per household. non-family households (974 | 51.7%) represent the smallest median household size with 2.14 persons per household.
| Household Type | # Households | Household Size |
| Married-Couple | 667 (35.4%) | 2.76 |
| Single Male/Father | 28 (1.5%) | 2.68 |
| Single Female/Mother | 214 (11.4%) | 2.43 |
| Non-family | 974 (51.7%) | 2.14 |
| Total Households | 1,883 (100.0%) | 2.40 |
Household Size by Marriage Status in Geneseo
Out of a total of 1,883 households in Geneseo, 909 (48.3%) are family households, while 974 (51.7%) are nonfamily households. The most numerous type of family households are 2-person households, comprising 463, and the most common type of nonfamily households are 1-person households, comprising 559.
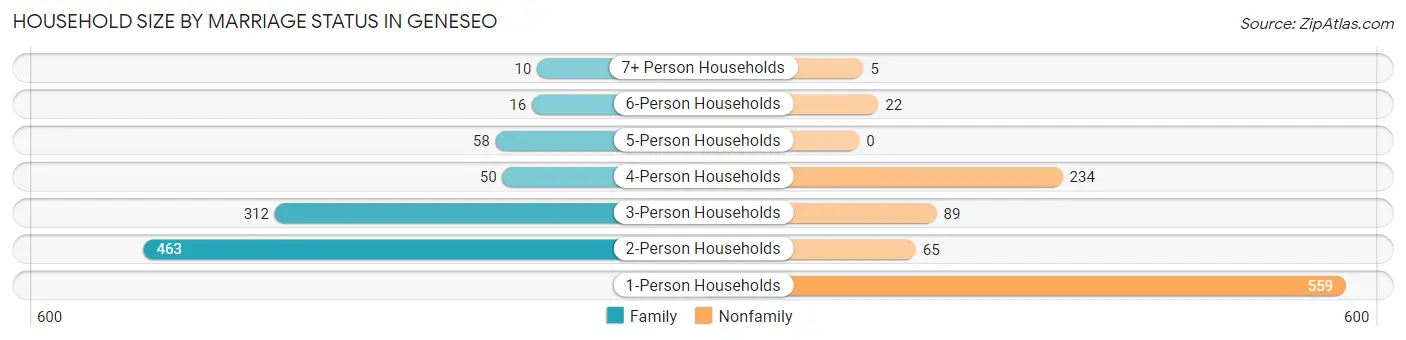
| Household Size | Family Households | Nonfamily Households |
| 1-Person Households | - | 559 (29.7%) |
| 2-Person Households | 463 (24.6%) | 65 (3.5%) |
| 3-Person Households | 312 (16.6%) | 89 (4.7%) |
| 4-Person Households | 50 (2.7%) | 234 (12.4%) |
| 5-Person Households | 58 (3.1%) | 0 (0.0%) |
| 6-Person Households | 16 (0.9%) | 22 (1.2%) |
| 7+ Person Households | 10 (0.5%) | 5 (0.3%) |
| Total | 909 (48.3%) | 974 (51.7%) |
Female Fertility in Geneseo
Fertility by Age in Geneseo
Average fertility rate in Geneseo is 30.0 births per 1,000 women. Women in the age bracket of 35 to 50 years have the highest fertility rate with 184.0 births per 1,000 women. Women in the age bracket of 35 to 50 years acount for 58.3% of all women with births.
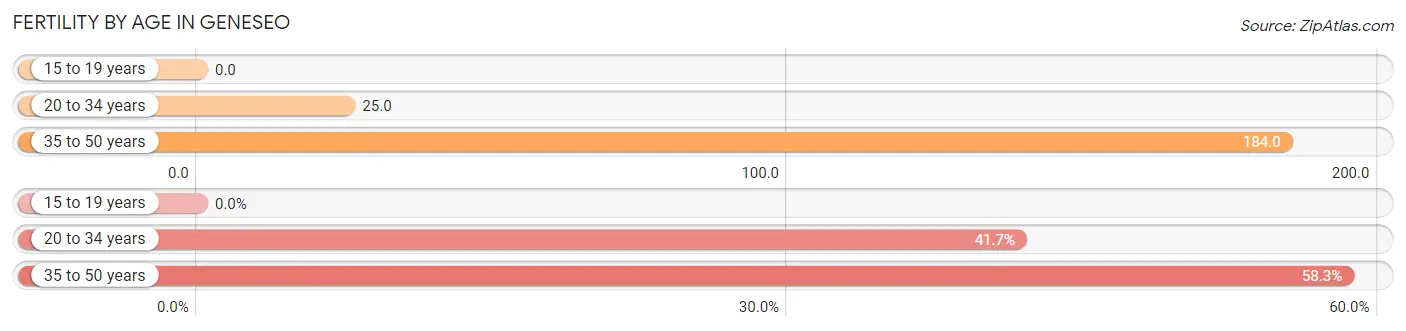
| Age Bracket | Women with Births | Births / 1,000 Women |
| 15 to 19 years | 0 (0.0%) | 0.0 |
| 20 to 34 years | 45 (41.7%) | 25.0 |
| 35 to 50 years | 63 (58.3%) | 184.0 |
| Total | 108 (100.0%) | 30.0 |
Fertility by Age by Marriage Status in Geneseo
32.4% of women with births (108) in Geneseo are married. The highest percentage of unmarried women with births falls into 35 to 50 years age bracket with 100.0% of them unmarried at the time of birth, while the lowest percentage of unmarried women with births belong to 20 to 34 years age bracket with 22.2% of them unmarried.
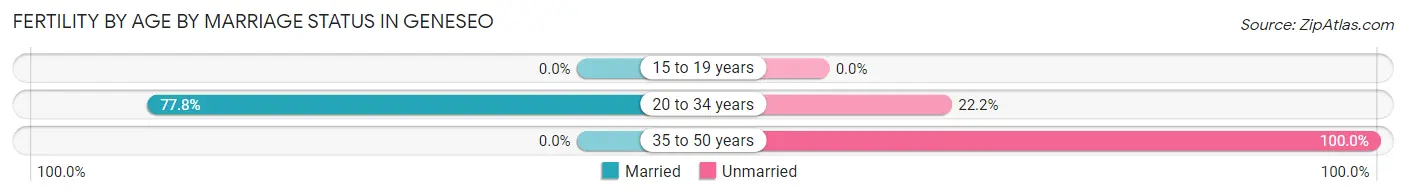
| Age Bracket | Married | Unmarried |
| 15 to 19 years | 0 (0.0%) | 0 (0.0%) |
| 20 to 34 years | 35 (77.8%) | 10 (22.2%) |
| 35 to 50 years | 0 (0.0%) | 63 (100.0%) |
| Total | 35 (32.4%) | 73 (67.6%) |
Fertility by Education in Geneseo
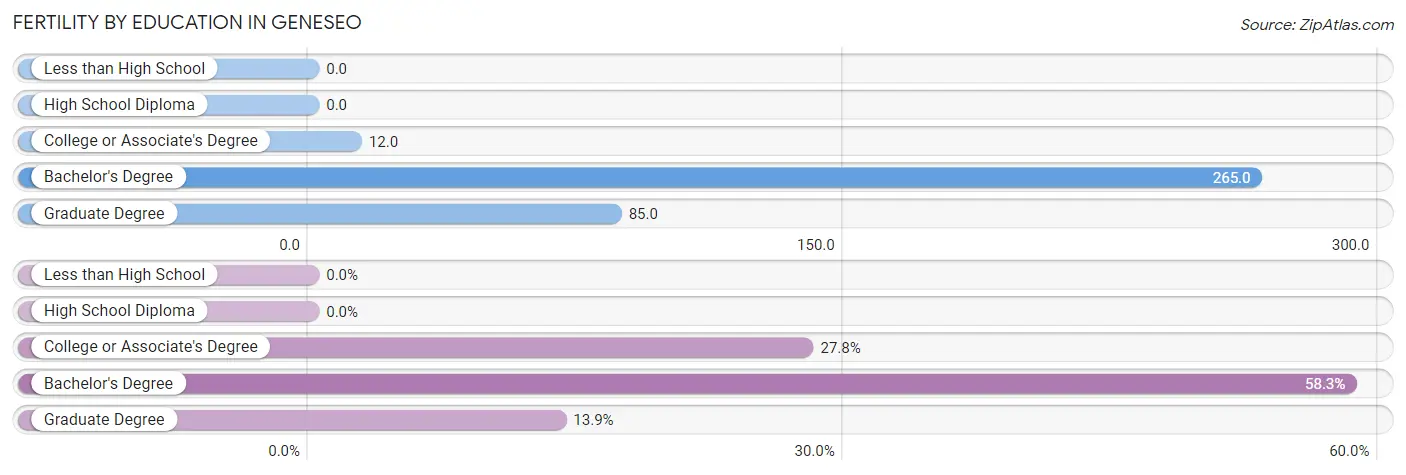
| Educational Attainment | Women with Births | Births / 1,000 Women |
| Less than High School | 0 (0.0%) | 0.0 |
| High School Diploma | 0 (0.0%) | 0.0 |
| College or Associate's Degree | 30 (27.8%) | 12.0 |
| Bachelor's Degree | 63 (58.3%) | 265.0 |
| Graduate Degree | 15 (13.9%) | 85.0 |
| Total | 108 (100.0%) | 30.0 |
Fertility by Education by Marriage Status in Geneseo
67.6% of women with births in Geneseo are unmarried. Women with the educational attainment of graduate degree are most likely to be married with 100.0% of them married at childbirth, while women with the educational attainment of bachelor's degree are least likely to be married with 100.0% of them unmarried at childbirth.
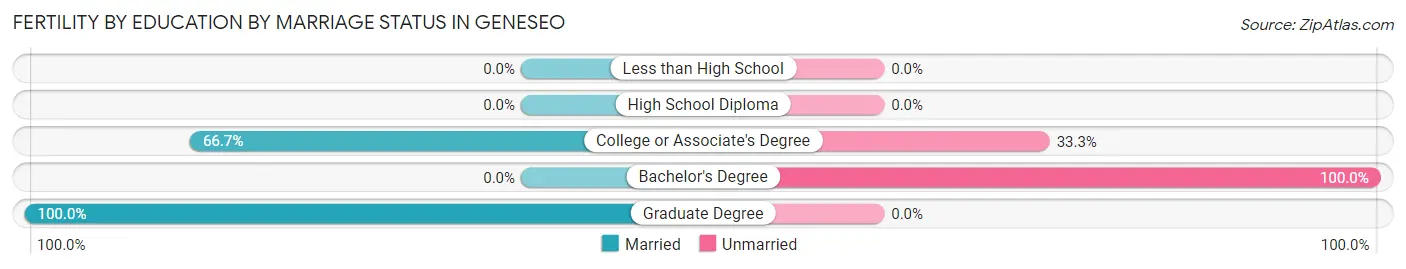
| Educational Attainment | Married | Unmarried |
| Less than High School | 0 (0.0%) | 0 (0.0%) |
| High School Diploma | 0 (0.0%) | 0 (0.0%) |
| College or Associate's Degree | 20 (66.7%) | 10 (33.3%) |
| Bachelor's Degree | 0 (0.0%) | 63 (100.0%) |
| Graduate Degree | 15 (100.0%) | 0 (0.0%) |
| Total | 35 (32.4%) | 73 (67.6%) |
Employment Characteristics in Geneseo
Employment by Class of Employer in Geneseo
Among the 2,878 employed individuals in Geneseo, private company employees (1,443 | 50.1%), state government employees (658 | 22.9%), and not-for-profit organizations (377 | 13.1%) make up the most common classes of employment.
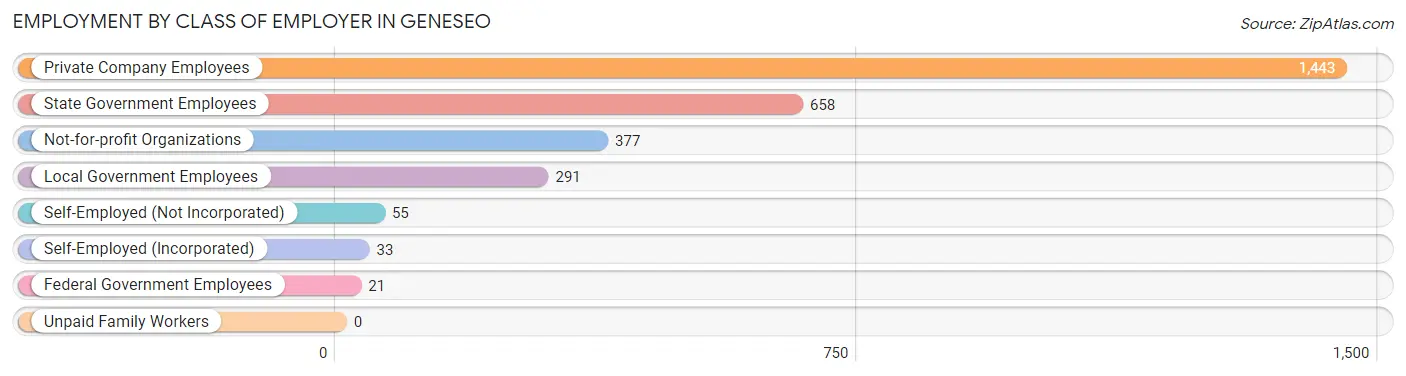
| Employer Class | # Employees | % Employees |
| Private Company Employees | 1,443 | 50.1% |
| Self-Employed (Incorporated) | 33 | 1.1% |
| Self-Employed (Not Incorporated) | 55 | 1.9% |
| Not-for-profit Organizations | 377 | 13.1% |
| Local Government Employees | 291 | 10.1% |
| State Government Employees | 658 | 22.9% |
| Federal Government Employees | 21 | 0.7% |
| Unpaid Family Workers | 0 | 0.0% |
| Total | 2,878 | 100.0% |
Employment Status by Age in Geneseo
According to the labor force statistics for Geneseo, out of the total population over 16 years of age (7,165), 44.6% or 3,196 individuals are in the labor force, with 7.1% or 227 of them unemployed. The age group with the highest labor force participation rate is 30 to 34 years, with 92.5% or 247 individuals in the labor force. Within the labor force, the 16 to 19 years age range has the highest percentage of unemployed individuals, with 11.8% or 91 of them being unemployed.
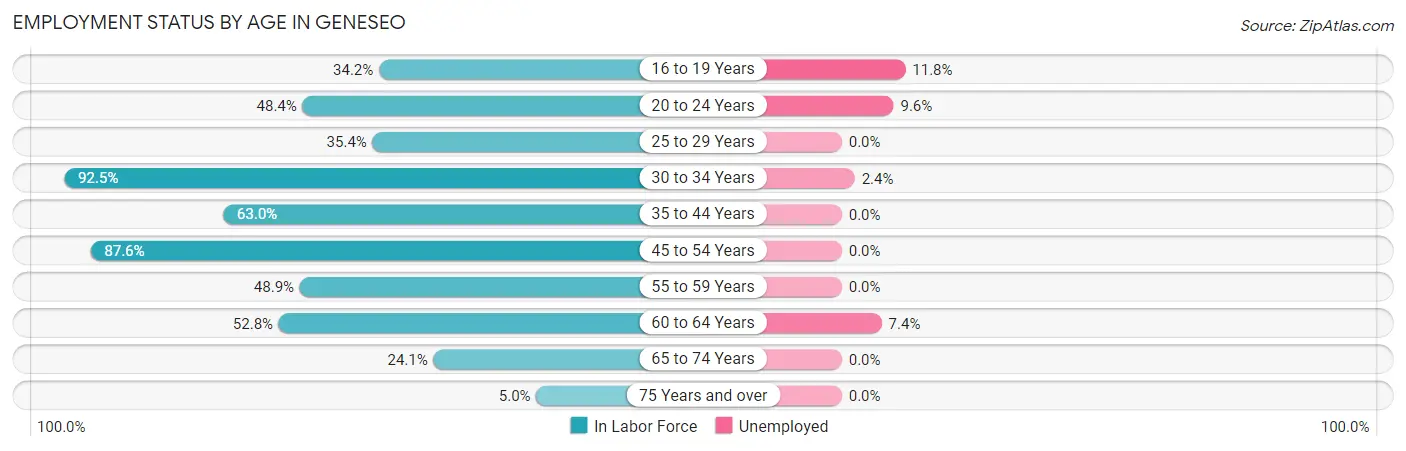
| Age Bracket | In Labor Force | Unemployed |
| 16 to 19 Years | 768 (34.2%) | 91 (11.8%) |
| 20 to 24 Years | 1,280 (48.4%) | 123 (9.6%) |
| 25 to 29 Years | 70 (35.4%) | 0 (0.0%) |
| 30 to 34 Years | 247 (92.5%) | 6 (2.4%) |
| 35 to 44 Years | 201 (63.0%) | 0 (0.0%) |
| 45 to 54 Years | 332 (87.6%) | 0 (0.0%) |
| 55 to 59 Years | 88 (48.9%) | 0 (0.0%) |
| 60 to 64 Years | 95 (52.8%) | 7 (7.4%) |
| 65 to 74 Years | 99 (24.1%) | 0 (0.0%) |
| 75 Years and over | 17 (5.0%) | 0 (0.0%) |
| Total | 3,196 (44.6%) | 227 (7.1%) |
Employment Status by Educational Attainment in Geneseo
According to labor force statistics for Geneseo, 67.8% of individuals (1,033) out of the total population between 25 and 64 years of age (1,523) are in the labor force, with 1.3% or 13 of them being unemployed. The group with the highest labor force participation rate are those with the educational attainment of bachelor's degree or higher, with 80.9% or 615 individuals in the labor force. Within the labor force, individuals with high school diploma education have the highest percentage of unemployment, with 5.3% or 6 of them being unemployed.
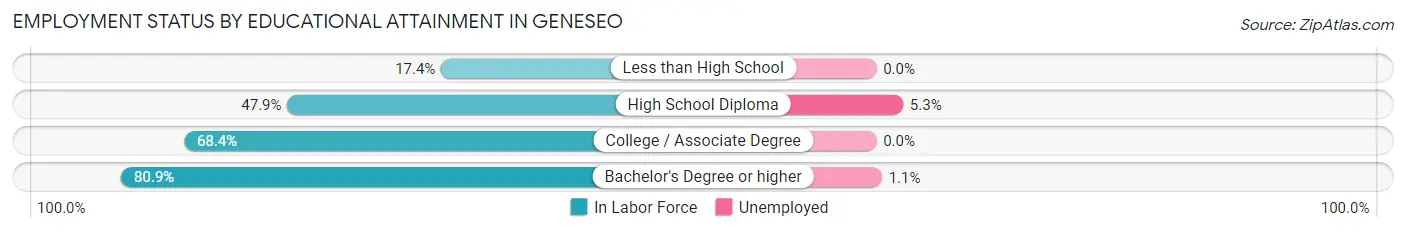
| Educational Attainment | In Labor Force | Unemployed |
| Less than High School | 19 (17.4%) | 0 (0.0%) |
| High School Diploma | 113 (47.9%) | 13 (5.3%) |
| College / Associate Degree | 286 (68.4%) | 0 (0.0%) |
| Bachelor's Degree or higher | 615 (80.9%) | 8 (1.1%) |
| Total | 1,033 (67.8%) | 20 (1.3%) |
Employment Occupations by Sex in Geneseo
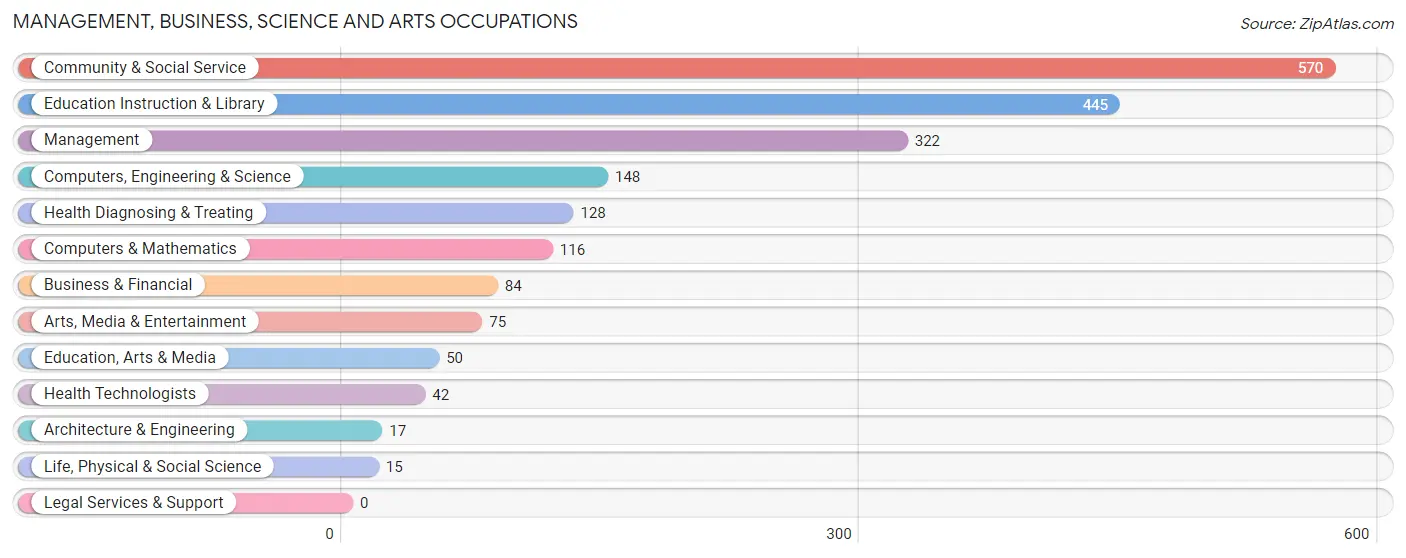
Management, Business, Science and Arts Occupations
The most common Management, Business, Science and Arts occupations in Geneseo are Community & Social Service (570 | 19.2%), Education Instruction & Library (445 | 15.0%), Management (322 | 10.8%), Computers, Engineering & Science (148 | 5.0%), and Health Diagnosing & Treating (128 | 4.3%).
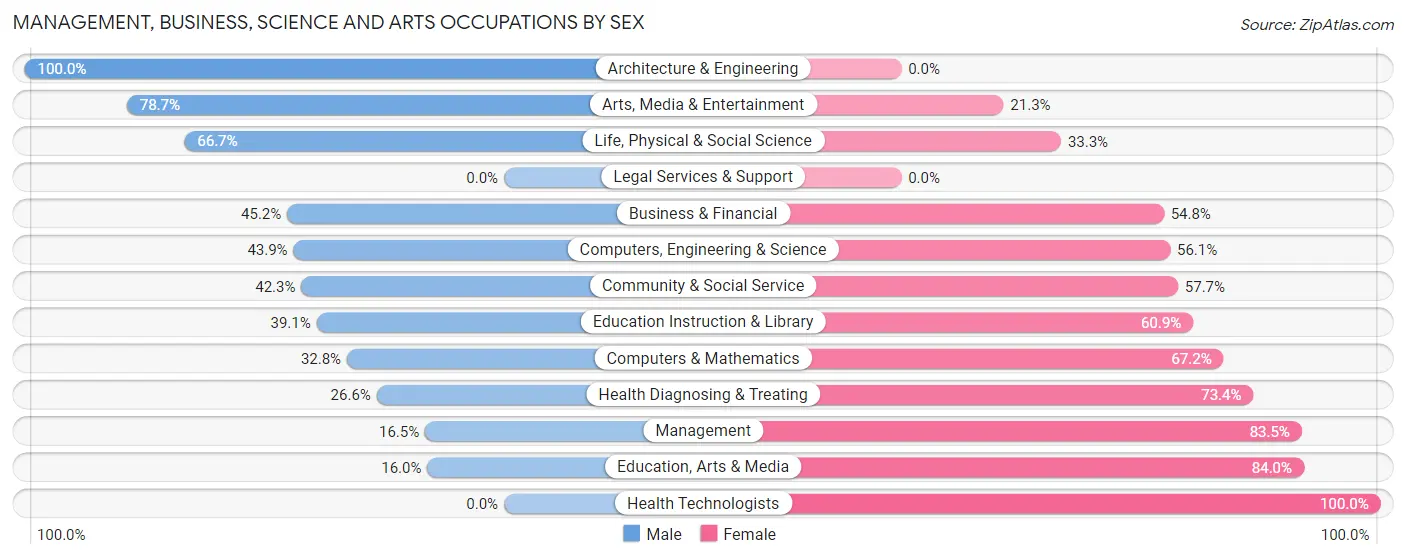
Management, Business, Science and Arts Occupations by Sex
Within the Management, Business, Science and Arts occupations in Geneseo, the most male-oriented occupations are Architecture & Engineering (100.0%), Arts, Media & Entertainment (78.7%), and Life, Physical & Social Science (66.7%), while the most female-oriented occupations are Health Technologists (100.0%), Education, Arts & Media (84.0%), and Management (83.5%).
| Occupation | Male | Female |
| Management | 53 (16.5%) | 269 (83.5%) |
| Business & Financial | 38 (45.2%) | 46 (54.8%) |
| Computers, Engineering & Science | 65 (43.9%) | 83 (56.1%) |
| Computers & Mathematics | 38 (32.8%) | 78 (67.2%) |
| Architecture & Engineering | 17 (100.0%) | 0 (0.0%) |
| Life, Physical & Social Science | 10 (66.7%) | 5 (33.3%) |
| Community & Social Service | 241 (42.3%) | 329 (57.7%) |
| Education, Arts & Media | 8 (16.0%) | 42 (84.0%) |
| Legal Services & Support | 0 (0.0%) | 0 (0.0%) |
| Education Instruction & Library | 174 (39.1%) | 271 (60.9%) |
| Arts, Media & Entertainment | 59 (78.7%) | 16 (21.3%) |
| Health Diagnosing & Treating | 34 (26.6%) | 94 (73.4%) |
| Health Technologists | 0 (0.0%) | 42 (100.0%) |
| Total (Category) | 431 (34.4%) | 821 (65.6%) |
| Total (Overall) | 1,163 (39.2%) | 1,806 (60.8%) |
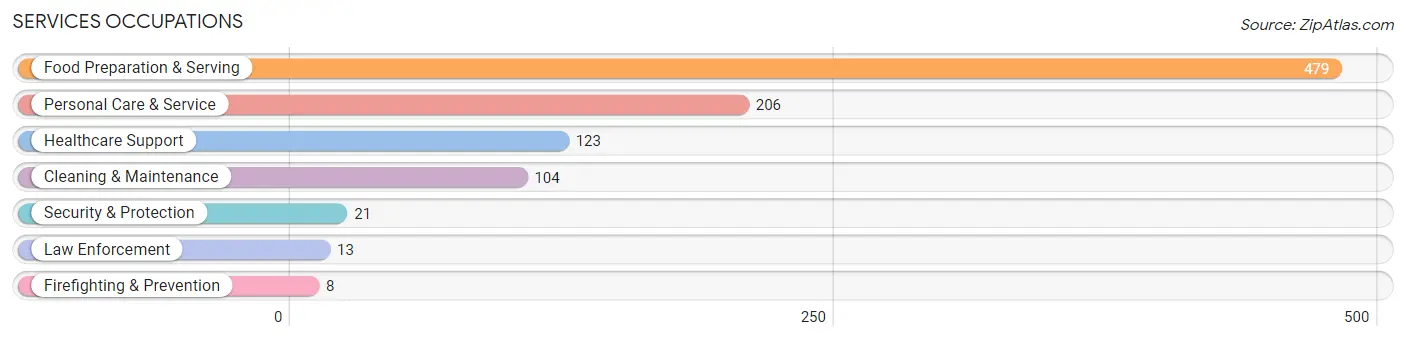
Services Occupations
The most common Services occupations in Geneseo are Food Preparation & Serving (479 | 16.1%), Personal Care & Service (206 | 6.9%), Healthcare Support (123 | 4.1%), Cleaning & Maintenance (104 | 3.5%), and Security & Protection (21 | 0.7%).
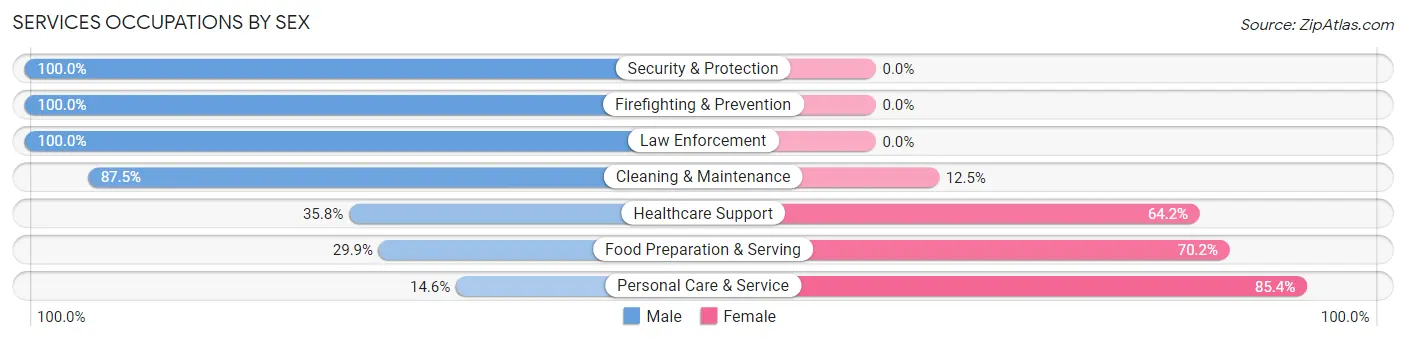
Services Occupations by Sex
Within the Services occupations in Geneseo, the most male-oriented occupations are Security & Protection (100.0%), Firefighting & Prevention (100.0%), and Law Enforcement (100.0%), while the most female-oriented occupations are Personal Care & Service (85.4%), Food Preparation & Serving (70.2%), and Healthcare Support (64.2%).
| Occupation | Male | Female |
| Healthcare Support | 44 (35.8%) | 79 (64.2%) |
| Security & Protection | 21 (100.0%) | 0 (0.0%) |
| Firefighting & Prevention | 8 (100.0%) | 0 (0.0%) |
| Law Enforcement | 13 (100.0%) | 0 (0.0%) |
| Food Preparation & Serving | 143 (29.8%) | 336 (70.2%) |
| Cleaning & Maintenance | 91 (87.5%) | 13 (12.5%) |
| Personal Care & Service | 30 (14.6%) | 176 (85.4%) |
| Total (Category) | 329 (35.3%) | 604 (64.7%) |
| Total (Overall) | 1,163 (39.2%) | 1,806 (60.8%) |
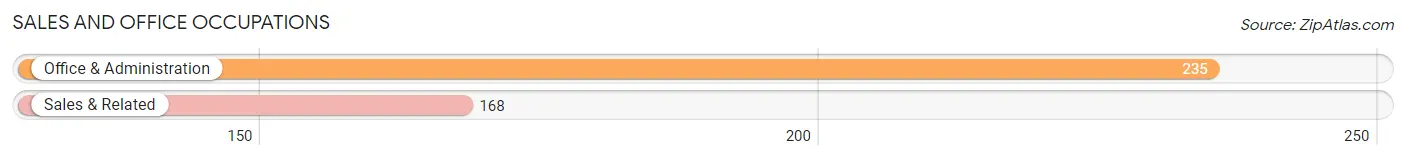
Sales and Office Occupations
The most common Sales and Office occupations in Geneseo are Office & Administration (235 | 7.9%), and Sales & Related (168 | 5.7%).
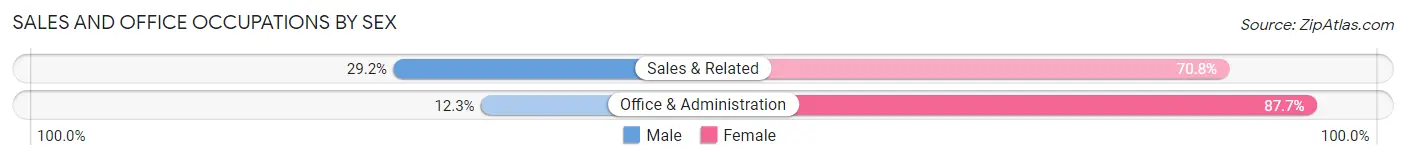
Sales and Office Occupations by Sex
| Occupation | Male | Female |
| Sales & Related | 49 (29.2%) | 119 (70.8%) |
| Office & Administration | 29 (12.3%) | 206 (87.7%) |
| Total (Category) | 78 (19.4%) | 325 (80.6%) |
| Total (Overall) | 1,163 (39.2%) | 1,806 (60.8%) |
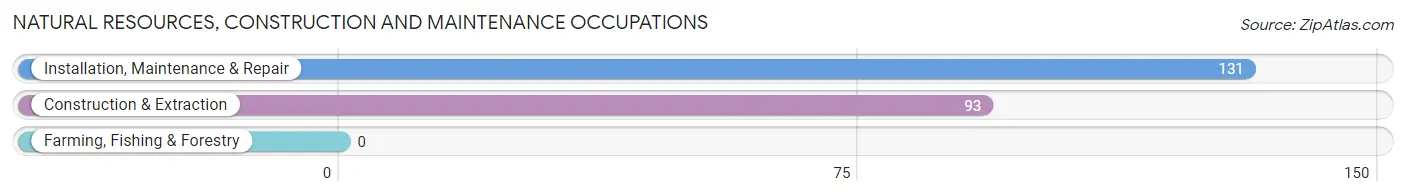
Natural Resources, Construction and Maintenance Occupations
The most common Natural Resources, Construction and Maintenance occupations in Geneseo are Installation, Maintenance & Repair (131 | 4.4%), and Construction & Extraction (93 | 3.1%).
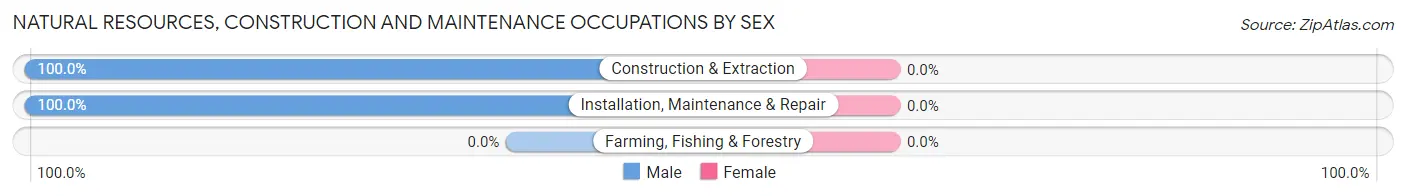
Natural Resources, Construction and Maintenance Occupations by Sex
| Occupation | Male | Female |
| Farming, Fishing & Forestry | 0 (0.0%) | 0 (0.0%) |
| Construction & Extraction | 93 (100.0%) | 0 (0.0%) |
| Installation, Maintenance & Repair | 131 (100.0%) | 0 (0.0%) |
| Total (Category) | 224 (100.0%) | 0 (0.0%) |
| Total (Overall) | 1,163 (39.2%) | 1,806 (60.8%) |
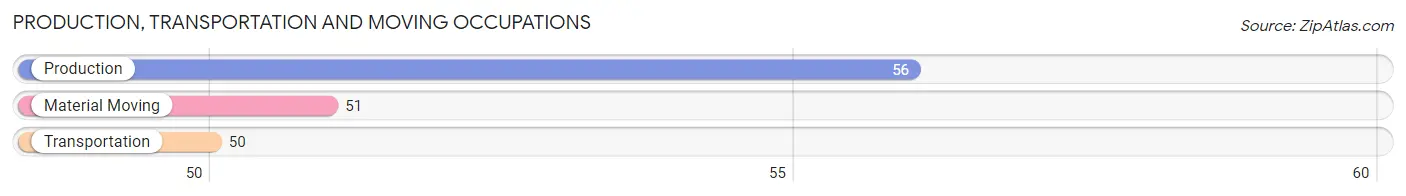
Production, Transportation and Moving Occupations
The most common Production, Transportation and Moving occupations in Geneseo are Production (56 | 1.9%), Material Moving (51 | 1.7%), and Transportation (50 | 1.7%).
Production, Transportation and Moving Occupations by Sex
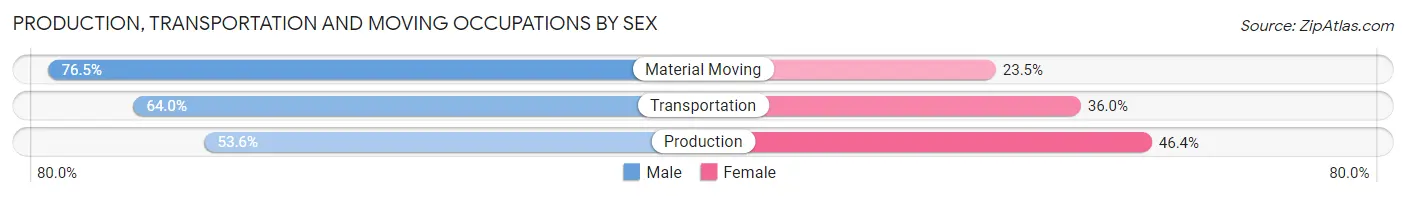
| Occupation | Male | Female |
| Production | 30 (53.6%) | 26 (46.4%) |
| Transportation | 32 (64.0%) | 18 (36.0%) |
| Material Moving | 39 (76.5%) | 12 (23.5%) |
| Total (Category) | 101 (64.3%) | 56 (35.7%) |
| Total (Overall) | 1,163 (39.2%) | 1,806 (60.8%) |
Employment Industries by Sex in Geneseo
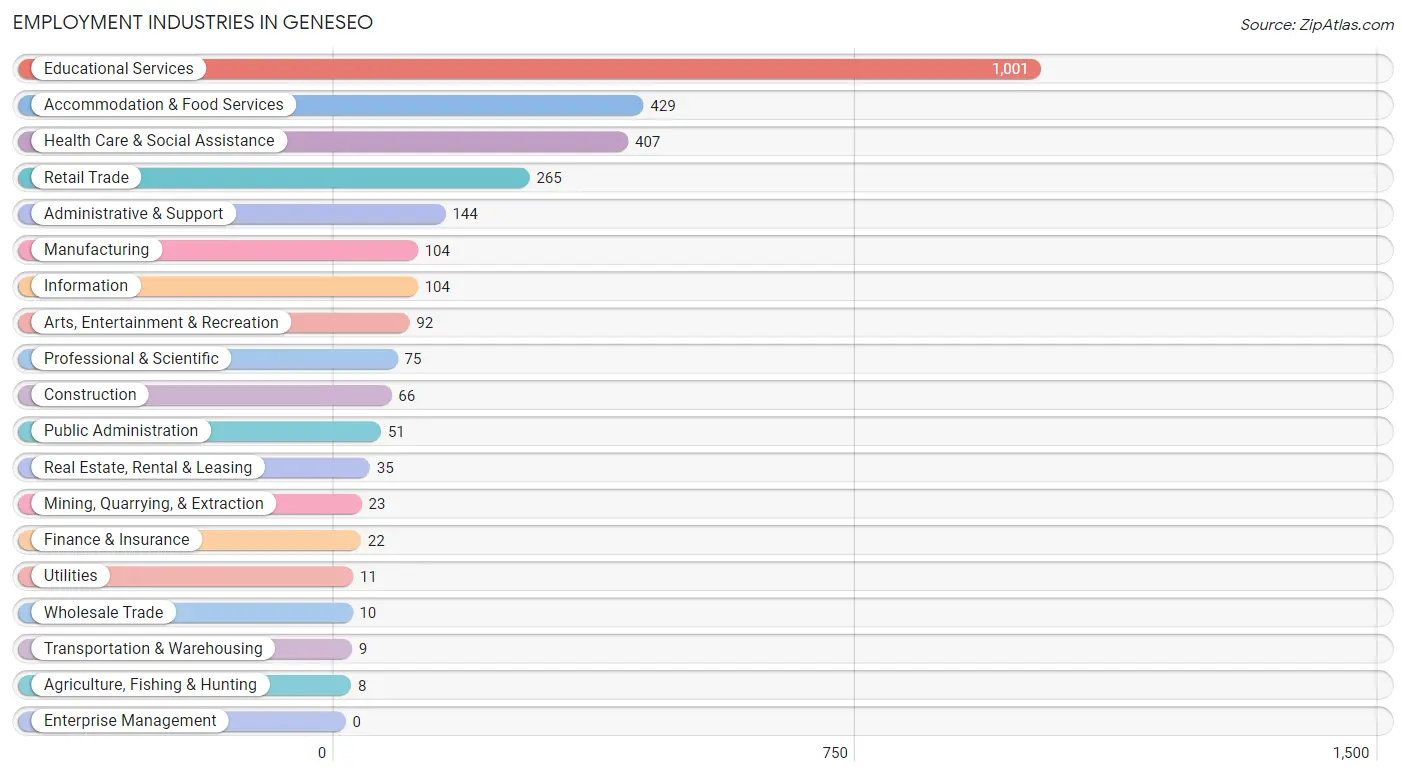
Employment Industries in Geneseo
The major employment industries in Geneseo include Educational Services (1,001 | 33.7%), Accommodation & Food Services (429 | 14.4%), Health Care & Social Assistance (407 | 13.7%), Retail Trade (265 | 8.9%), and Administrative & Support (144 | 4.9%).
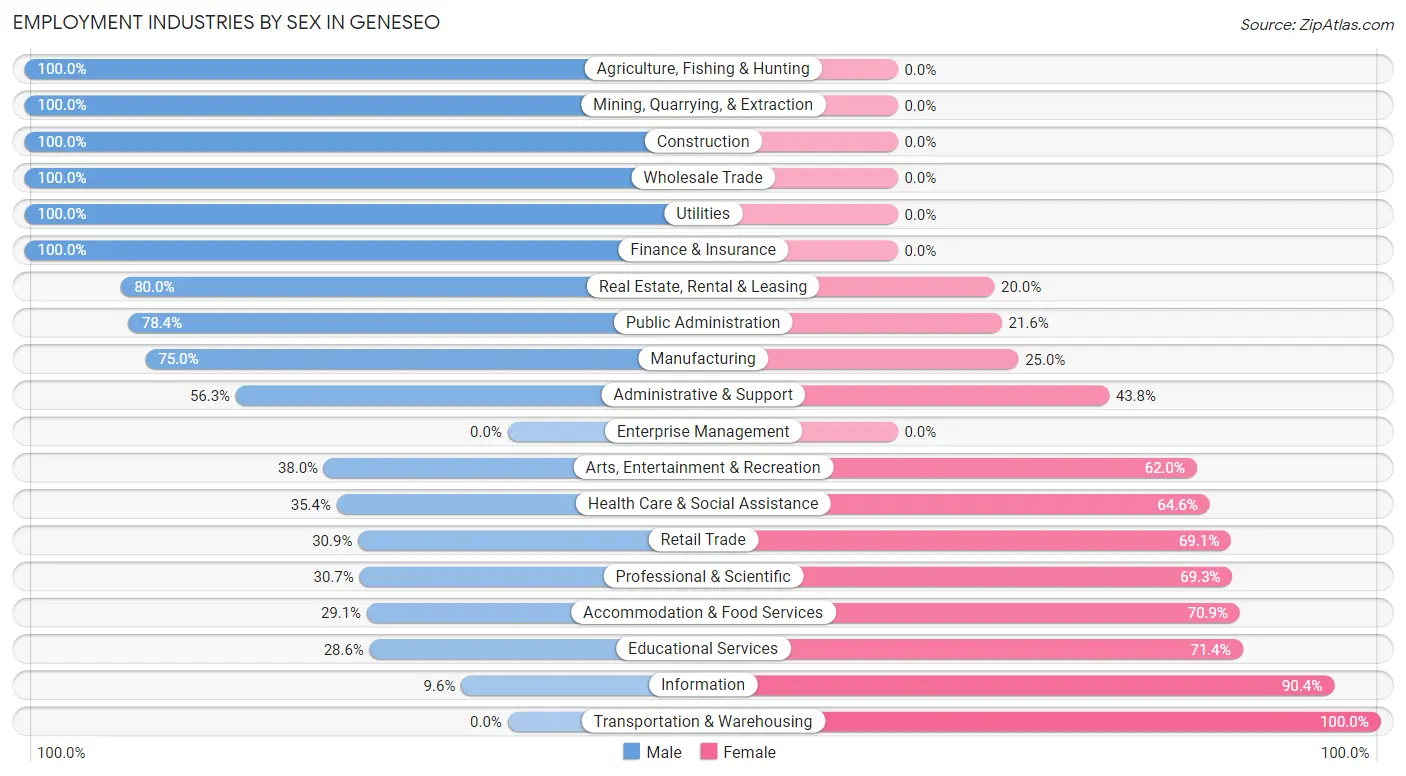
Employment Industries by Sex in Geneseo
The Geneseo industries that see more men than women are Agriculture, Fishing & Hunting (100.0%), Mining, Quarrying, & Extraction (100.0%), and Construction (100.0%), whereas the industries that tend to have a higher number of women are Transportation & Warehousing (100.0%), Information (90.4%), and Educational Services (71.4%).
| Industry | Male | Female |
| Agriculture, Fishing & Hunting | 8 (100.0%) | 0 (0.0%) |
| Mining, Quarrying, & Extraction | 23 (100.0%) | 0 (0.0%) |
| Construction | 66 (100.0%) | 0 (0.0%) |
| Manufacturing | 78 (75.0%) | 26 (25.0%) |
| Wholesale Trade | 10 (100.0%) | 0 (0.0%) |
| Retail Trade | 82 (30.9%) | 183 (69.1%) |
| Transportation & Warehousing | 0 (0.0%) | 9 (100.0%) |
| Utilities | 11 (100.0%) | 0 (0.0%) |
| Information | 10 (9.6%) | 94 (90.4%) |
| Finance & Insurance | 22 (100.0%) | 0 (0.0%) |
| Real Estate, Rental & Leasing | 28 (80.0%) | 7 (20.0%) |
| Professional & Scientific | 23 (30.7%) | 52 (69.3%) |
| Enterprise Management | 0 (0.0%) | 0 (0.0%) |
| Administrative & Support | 81 (56.2%) | 63 (43.8%) |
| Educational Services | 286 (28.6%) | 715 (71.4%) |
| Health Care & Social Assistance | 144 (35.4%) | 263 (64.6%) |
| Arts, Entertainment & Recreation | 35 (38.0%) | 57 (62.0%) |
| Accommodation & Food Services | 125 (29.1%) | 304 (70.9%) |
| Public Administration | 40 (78.4%) | 11 (21.6%) |
| Total | 1,163 (39.2%) | 1,806 (60.8%) |
Education in Geneseo
School Enrollment in Geneseo
The most common levels of schooling among the 5,031 students in Geneseo are college / undergraduate (4,486 | 89.2%), high school (160 | 3.2%), and graduate / professional (116 | 2.3%).
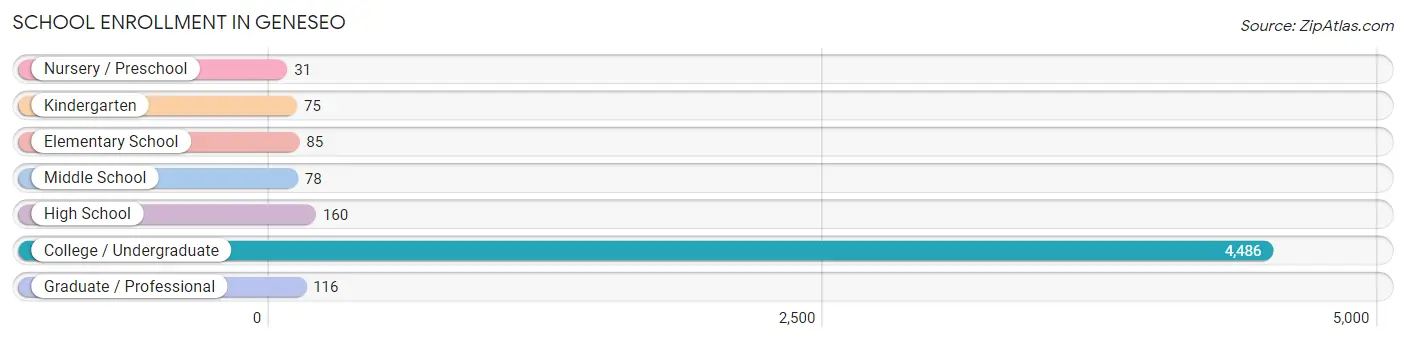
| School Level | # Students | % Students |
| Nursery / Preschool | 31 | 0.6% |
| Kindergarten | 75 | 1.5% |
| Elementary School | 85 | 1.7% |
| Middle School | 78 | 1.5% |
| High School | 160 | 3.2% |
| College / Undergraduate | 4,486 | 89.2% |
| Graduate / Professional | 116 | 2.3% |
| Total | 5,031 | 100.0% |
School Enrollment by Age by Funding Source in Geneseo
Out of a total of 5,031 students who are enrolled in schools in Geneseo, 619 (12.3%) attend a private institution, while the remaining 4,412 (87.7%) are enrolled in public schools. The age group of 3 to 4 year olds has the highest likelihood of being enrolled in private schools, with 31 (100.0% in the age bracket) enrolled. Conversely, the age group of 5 to 9 year old has the lowest likelihood of being enrolled in a private school, with 160 (100.0% in the age bracket) attending a public institution.
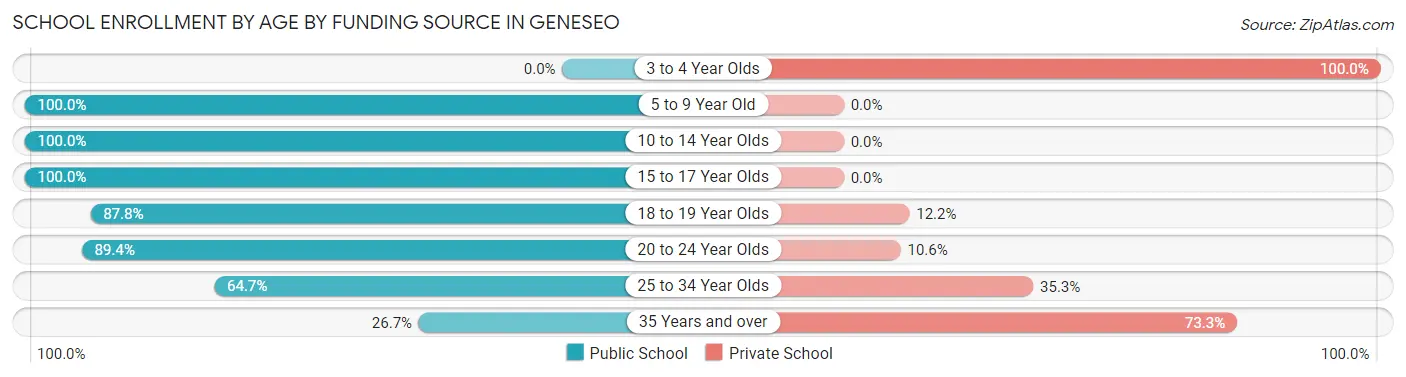
| Age Bracket | Public School | Private School |
| 3 to 4 Year Olds | 0 (0.0%) | 31 (100.0%) |
| 5 to 9 Year Old | 160 (100.0%) | 0 (0.0%) |
| 10 to 14 Year Olds | 99 (100.0%) | 0 (0.0%) |
| 15 to 17 Year Olds | 137 (100.0%) | 0 (0.0%) |
| 18 to 19 Year Olds | 1,859 (87.8%) | 259 (12.2%) |
| 20 to 24 Year Olds | 2,100 (89.4%) | 249 (10.6%) |
| 25 to 34 Year Olds | 33 (64.7%) | 18 (35.3%) |
| 35 Years and over | 23 (26.7%) | 63 (73.3%) |
| Total | 4,412 (87.7%) | 619 (12.3%) |
Educational Attainment by Field of Study in Geneseo
Education (282 | 22.7%), liberal arts & history (130 | 10.5%), visual & performing arts (129 | 10.4%), science & technology (118 | 9.5%), and social sciences (109 | 8.8%) are the most common fields of study among 1,240 individuals in Geneseo who have obtained a bachelor's degree or higher.
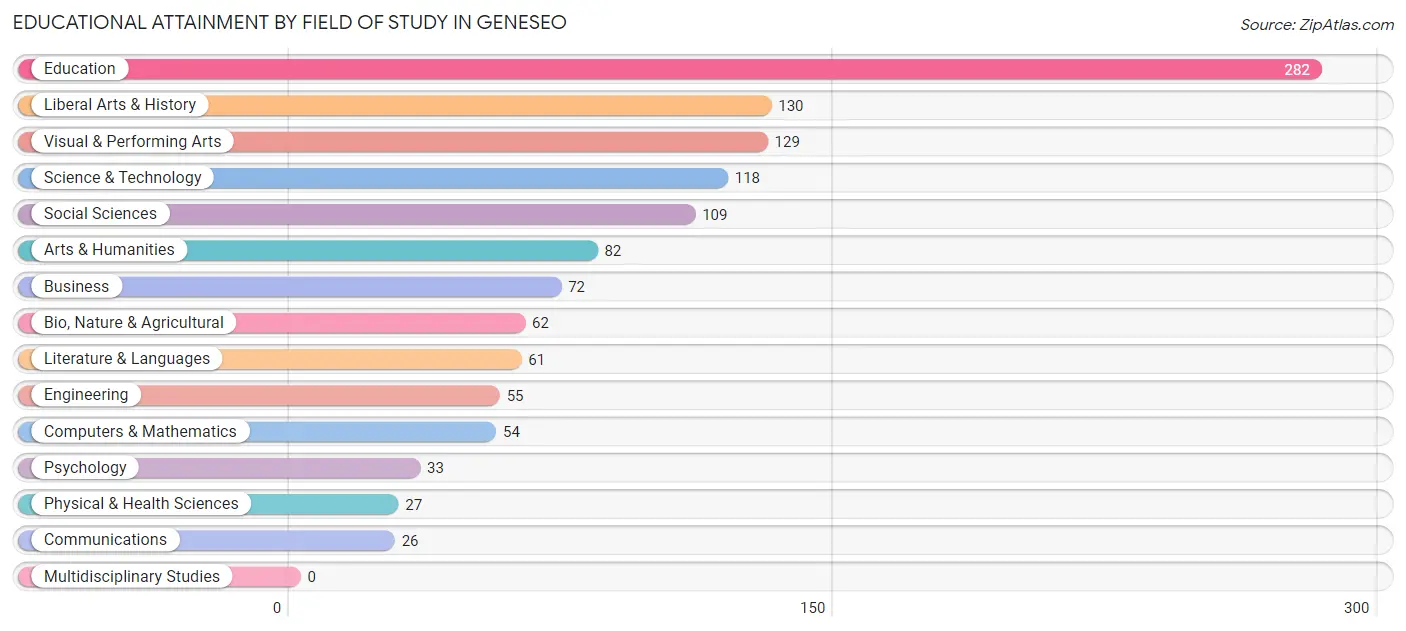
| Field of Study | # Graduates | % Graduates |
| Computers & Mathematics | 54 | 4.3% |
| Bio, Nature & Agricultural | 62 | 5.0% |
| Physical & Health Sciences | 27 | 2.2% |
| Psychology | 33 | 2.7% |
| Social Sciences | 109 | 8.8% |
| Engineering | 55 | 4.4% |
| Multidisciplinary Studies | 0 | 0.0% |
| Science & Technology | 118 | 9.5% |
| Business | 72 | 5.8% |
| Education | 282 | 22.7% |
| Literature & Languages | 61 | 4.9% |
| Liberal Arts & History | 130 | 10.5% |
| Visual & Performing Arts | 129 | 10.4% |
| Communications | 26 | 2.1% |
| Arts & Humanities | 82 | 6.6% |
| Total | 1,240 | 100.0% |
Transportation & Commute in Geneseo
Vehicle Availability by Sex in Geneseo
The most prevalent vehicle ownership categories in Geneseo are males with 2 vehicles (327, accounting for 38.6%) and females with 2 vehicles (393, making up 30.3%).
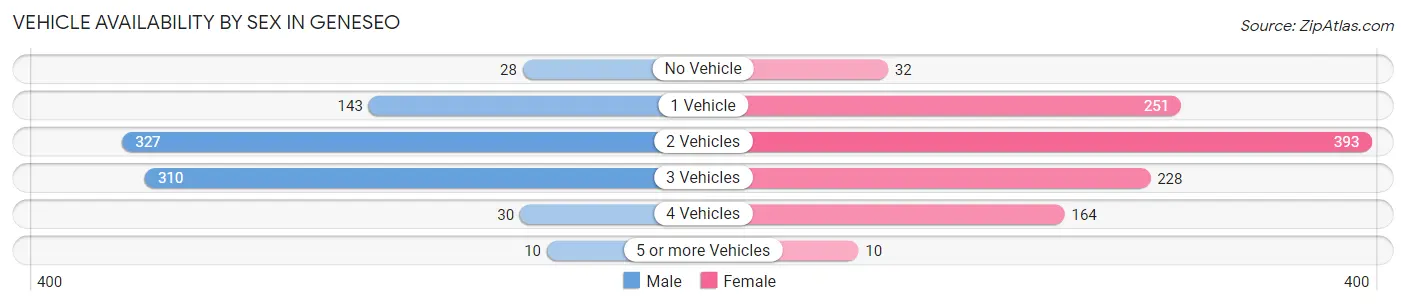
| Vehicles Available | Male | Female |
| No Vehicle | 28 (3.3%) | 32 (3.0%) |
| 1 Vehicle | 143 (16.9%) | 251 (23.3%) |
| 2 Vehicles | 327 (38.6%) | 393 (36.5%) |
| 3 Vehicles | 310 (36.6%) | 228 (21.1%) |
| 4 Vehicles | 30 (3.5%) | 164 (15.2%) |
| 5 or more Vehicles | 10 (1.2%) | 10 (0.9%) |
| Total | 848 (100.0%) | 1,078 (100.0%) |
Commute Time in Geneseo
The most frequently occuring commute durations in Geneseo are 5 to 9 minutes (725 commuters, 27.8%), 10 to 14 minutes (528 commuters, 20.3%), and less than 5 minutes (382 commuters, 14.7%).
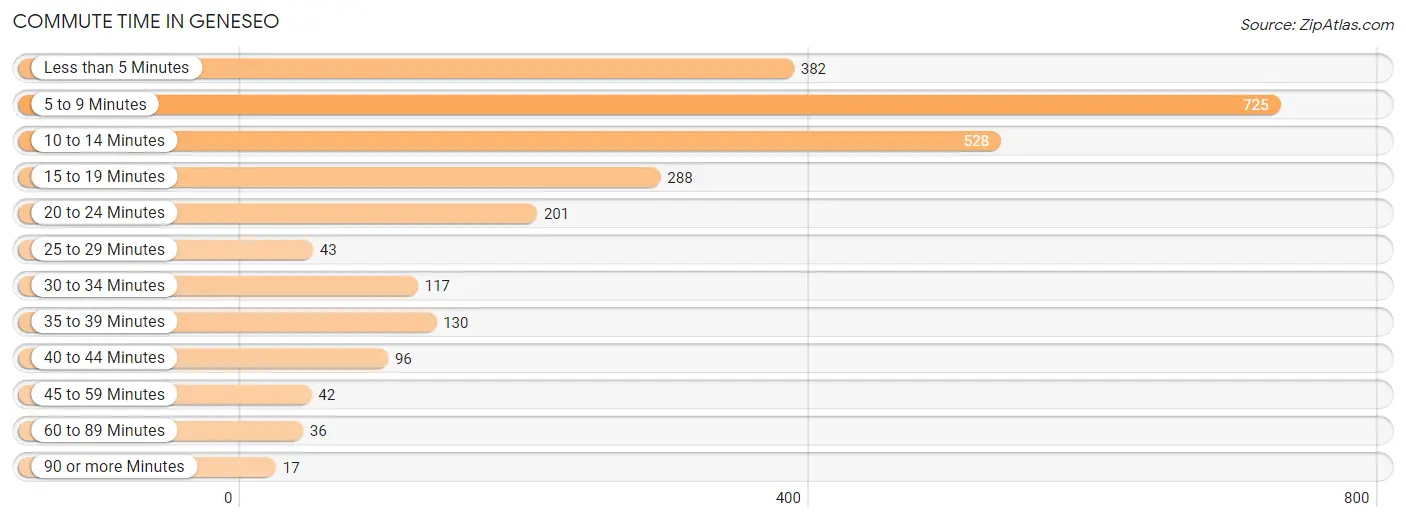
| Commute Time | # Commuters | % Commuters |
| Less than 5 Minutes | 382 | 14.7% |
| 5 to 9 Minutes | 725 | 27.8% |
| 10 to 14 Minutes | 528 | 20.3% |
| 15 to 19 Minutes | 288 | 11.1% |
| 20 to 24 Minutes | 201 | 7.7% |
| 25 to 29 Minutes | 43 | 1.7% |
| 30 to 34 Minutes | 117 | 4.5% |
| 35 to 39 Minutes | 130 | 5.0% |
| 40 to 44 Minutes | 96 | 3.7% |
| 45 to 59 Minutes | 42 | 1.6% |
| 60 to 89 Minutes | 36 | 1.4% |
| 90 or more Minutes | 17 | 0.6% |
Commute Time by Sex in Geneseo
The most common commute times in Geneseo are 10 to 14 minutes (305 commuters, 28.2%) for males and 5 to 9 minutes (503 commuters, 33.0%) for females.
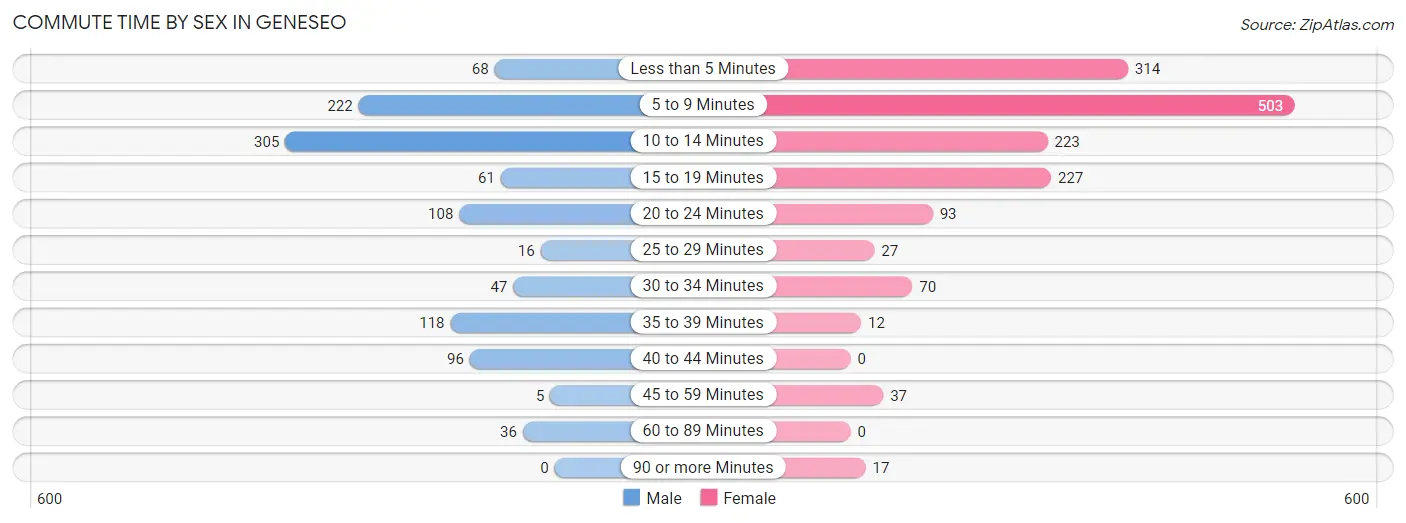
| Commute Time | Male | Female |
| Less than 5 Minutes | 68 (6.3%) | 314 (20.6%) |
| 5 to 9 Minutes | 222 (20.5%) | 503 (33.0%) |
| 10 to 14 Minutes | 305 (28.2%) | 223 (14.6%) |
| 15 to 19 Minutes | 61 (5.6%) | 227 (14.9%) |
| 20 to 24 Minutes | 108 (10.0%) | 93 (6.1%) |
| 25 to 29 Minutes | 16 (1.5%) | 27 (1.8%) |
| 30 to 34 Minutes | 47 (4.3%) | 70 (4.6%) |
| 35 to 39 Minutes | 118 (10.9%) | 12 (0.8%) |
| 40 to 44 Minutes | 96 (8.9%) | 0 (0.0%) |
| 45 to 59 Minutes | 5 (0.5%) | 37 (2.4%) |
| 60 to 89 Minutes | 36 (3.3%) | 0 (0.0%) |
| 90 or more Minutes | 0 (0.0%) | 17 (1.1%) |
Time of Departure to Work by Sex in Geneseo
The most frequent times of departure to work in Geneseo are 4:00 PM to 11:59 PM (183, 16.9%) for males and 9:00 AM to 9:59 AM (358, 23.5%) for females.
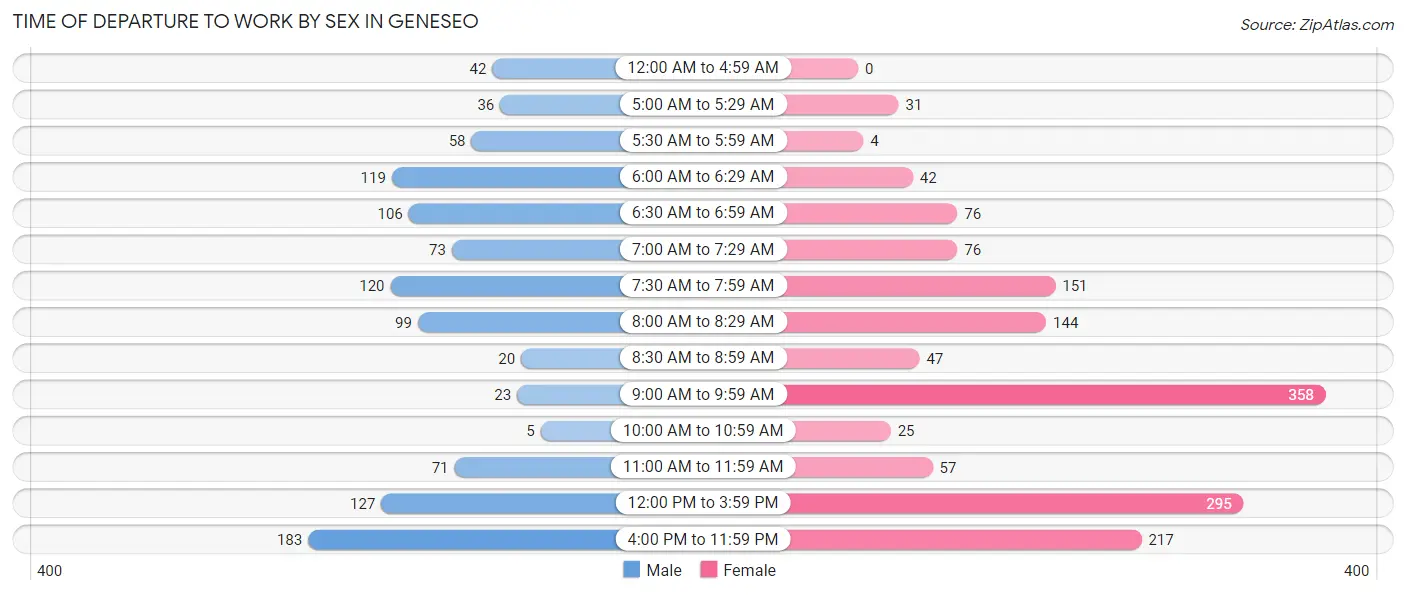
| Time of Departure | Male | Female |
| 12:00 AM to 4:59 AM | 42 (3.9%) | 0 (0.0%) |
| 5:00 AM to 5:29 AM | 36 (3.3%) | 31 (2.0%) |
| 5:30 AM to 5:59 AM | 58 (5.4%) | 4 (0.3%) |
| 6:00 AM to 6:29 AM | 119 (11.0%) | 42 (2.8%) |
| 6:30 AM to 6:59 AM | 106 (9.8%) | 76 (5.0%) |
| 7:00 AM to 7:29 AM | 73 (6.8%) | 76 (5.0%) |
| 7:30 AM to 7:59 AM | 120 (11.1%) | 151 (9.9%) |
| 8:00 AM to 8:29 AM | 99 (9.1%) | 144 (9.5%) |
| 8:30 AM to 8:59 AM | 20 (1.8%) | 47 (3.1%) |
| 9:00 AM to 9:59 AM | 23 (2.1%) | 358 (23.5%) |
| 10:00 AM to 10:59 AM | 5 (0.5%) | 25 (1.6%) |
| 11:00 AM to 11:59 AM | 71 (6.6%) | 57 (3.7%) |
| 12:00 PM to 3:59 PM | 127 (11.7%) | 295 (19.4%) |
| 4:00 PM to 11:59 PM | 183 (16.9%) | 217 (14.2%) |
| Total | 1,082 (100.0%) | 1,523 (100.0%) |
Housing Occupancy in Geneseo
Occupancy by Ownership in Geneseo
Of the total 1,883 dwellings in Geneseo, owner-occupied units account for 742 (39.4%), while renter-occupied units make up 1,141 (60.6%).
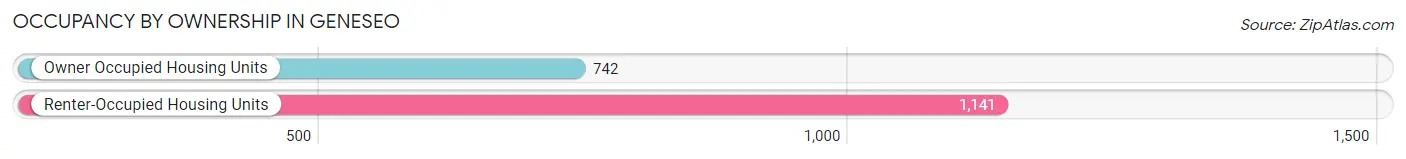
| Occupancy | # Housing Units | % Housing Units |
| Owner Occupied Housing Units | 742 | 39.4% |
| Renter-Occupied Housing Units | 1,141 | 60.6% |
| Total Occupied Housing Units | 1,883 | 100.0% |
Occupancy by Household Size in Geneseo
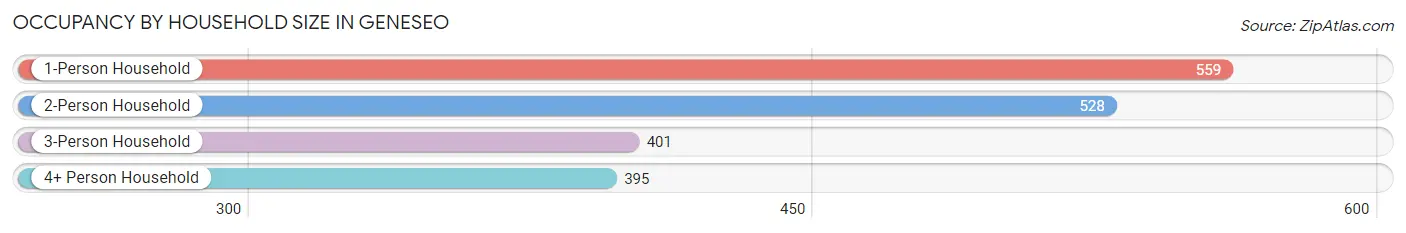
| Household Size | # Housing Units | % Housing Units |
| 1-Person Household | 559 | 29.7% |
| 2-Person Household | 528 | 28.0% |
| 3-Person Household | 401 | 21.3% |
| 4+ Person Household | 395 | 21.0% |
| Total Housing Units | 1,883 | 100.0% |
Occupancy by Ownership by Household Size in Geneseo
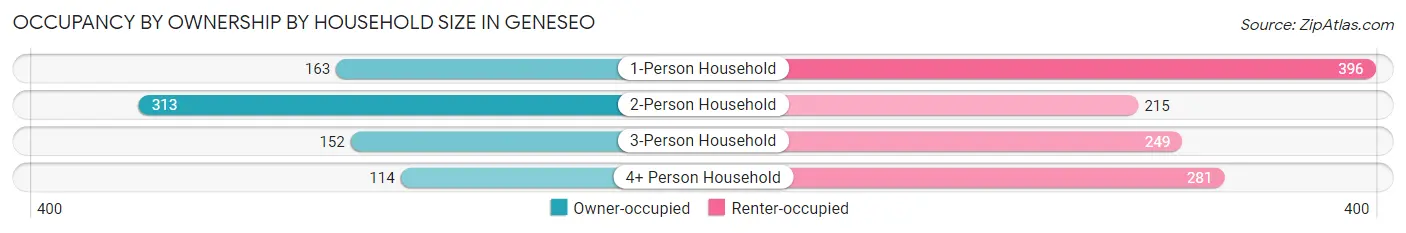
| Household Size | Owner-occupied | Renter-occupied |
| 1-Person Household | 163 (29.2%) | 396 (70.8%) |
| 2-Person Household | 313 (59.3%) | 215 (40.7%) |
| 3-Person Household | 152 (37.9%) | 249 (62.1%) |
| 4+ Person Household | 114 (28.9%) | 281 (71.1%) |
| Total Housing Units | 742 (39.4%) | 1,141 (60.6%) |
Occupancy by Educational Attainment in Geneseo
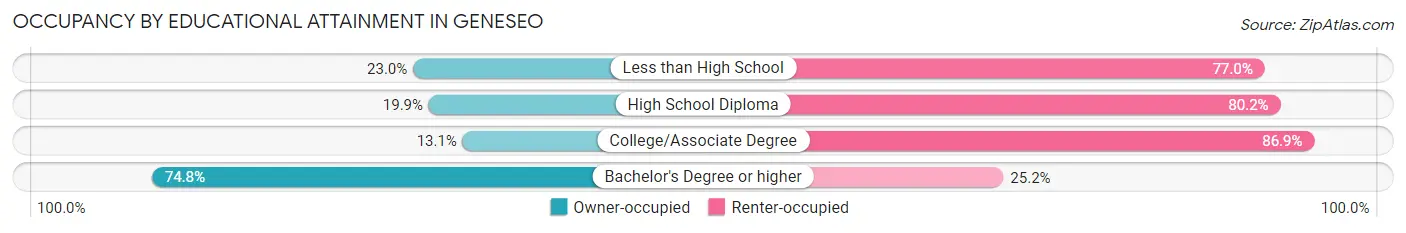
| Household Size | Owner-occupied | Renter-occupied |
| Less than High School | 17 (23.0%) | 57 (77.0%) |
| High School Diploma | 54 (19.9%) | 218 (80.1%) |
| College/Associate Degree | 102 (13.1%) | 674 (86.9%) |
| Bachelor's Degree or higher | 569 (74.8%) | 192 (25.2%) |
Occupancy by Age of Householder in Geneseo
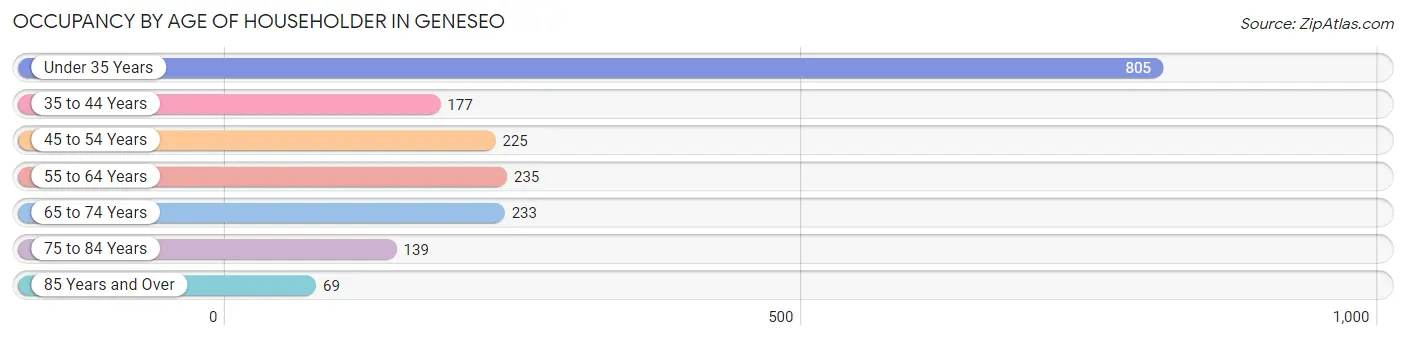
| Age Bracket | # Households | % Households |
| Under 35 Years | 805 | 42.7% |
| 35 to 44 Years | 177 | 9.4% |
| 45 to 54 Years | 225 | 11.9% |
| 55 to 64 Years | 235 | 12.5% |
| 65 to 74 Years | 233 | 12.4% |
| 75 to 84 Years | 139 | 7.4% |
| 85 Years and Over | 69 | 3.7% |
| Total | 1,883 | 100.0% |
Housing Finances in Geneseo
Median Income by Occupancy in Geneseo
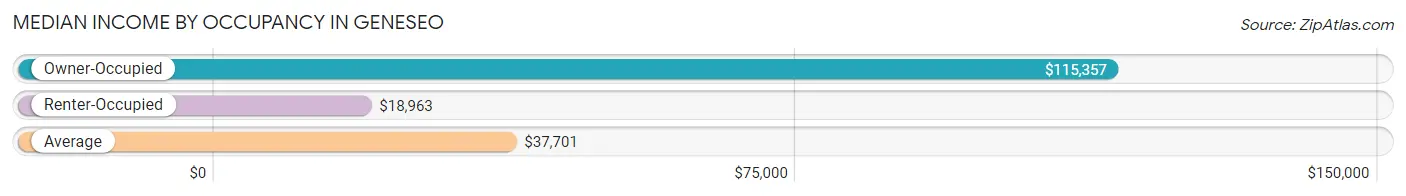
| Occupancy Type | # Households | Median Income |
| Owner-Occupied | 742 (39.4%) | $115,357 |
| Renter-Occupied | 1,141 (60.6%) | $18,963 |
| Average | 1,883 (100.0%) | $37,701 |
Occupancy by Householder Income Bracket in Geneseo
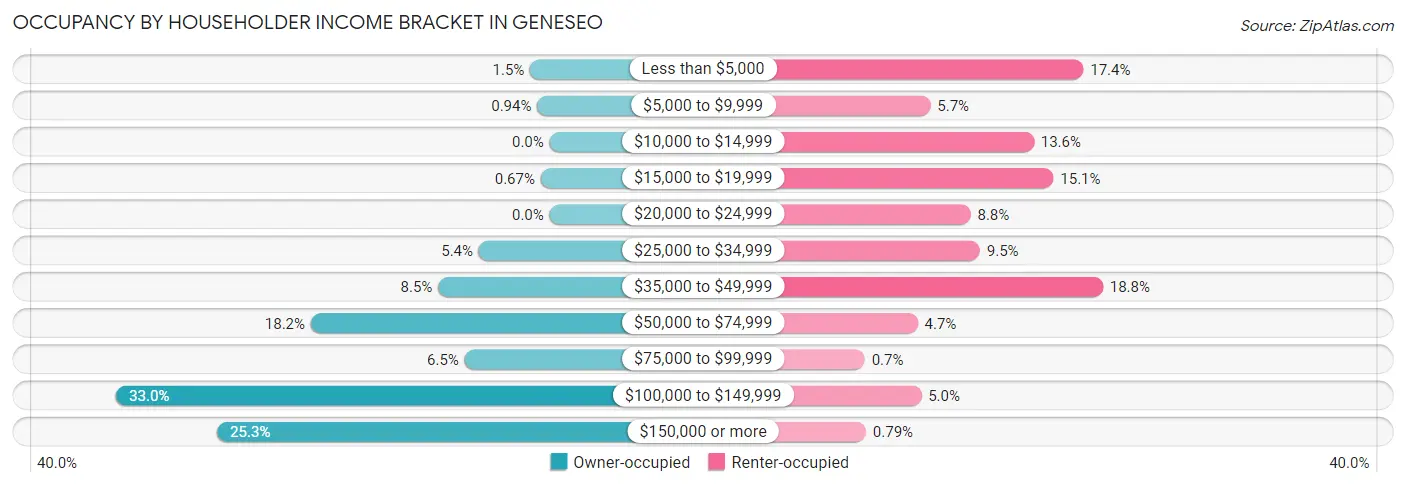
| Income Bracket | Owner-occupied | Renter-occupied |
| Less than $5,000 | 11 (1.5%) | 198 (17.3%) |
| $5,000 to $9,999 | 7 (0.9%) | 65 (5.7%) |
| $10,000 to $14,999 | 0 (0.0%) | 155 (13.6%) |
| $15,000 to $19,999 | 5 (0.7%) | 172 (15.1%) |
| $20,000 to $24,999 | 0 (0.0%) | 100 (8.8%) |
| $25,000 to $34,999 | 40 (5.4%) | 108 (9.5%) |
| $35,000 to $49,999 | 63 (8.5%) | 215 (18.8%) |
| $50,000 to $74,999 | 135 (18.2%) | 54 (4.7%) |
| $75,000 to $99,999 | 48 (6.5%) | 8 (0.7%) |
| $100,000 to $149,999 | 245 (33.0%) | 57 (5.0%) |
| $150,000 or more | 188 (25.3%) | 9 (0.8%) |
| Total | 742 (100.0%) | 1,141 (100.0%) |
Monthly Housing Cost Tiers in Geneseo
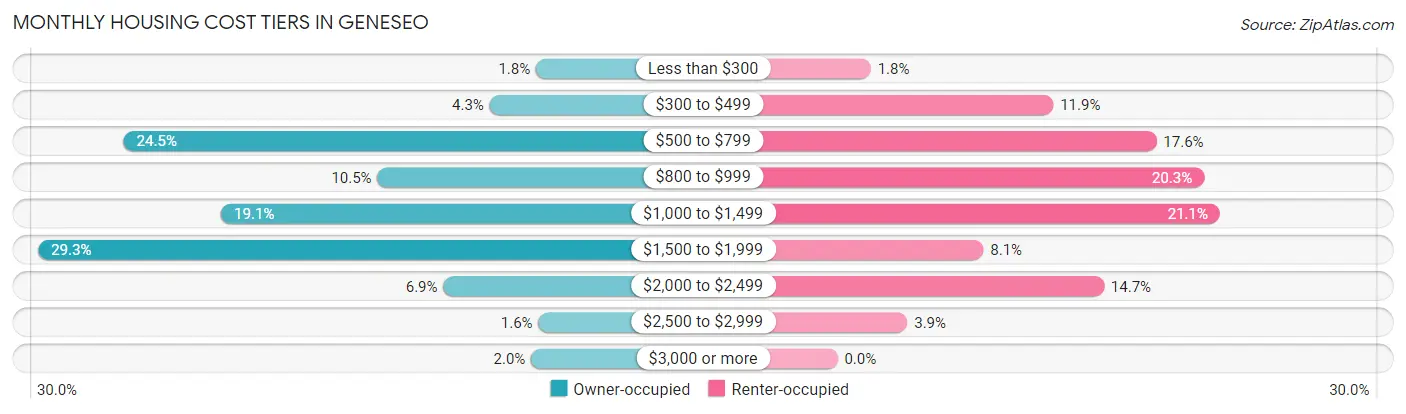
| Monthly Cost | Owner-occupied | Renter-occupied |
| Less than $300 | 13 (1.8%) | 21 (1.8%) |
| $300 to $499 | 32 (4.3%) | 136 (11.9%) |
| $500 to $799 | 182 (24.5%) | 201 (17.6%) |
| $800 to $999 | 78 (10.5%) | 231 (20.3%) |
| $1,000 to $1,499 | 142 (19.1%) | 241 (21.1%) |
| $1,500 to $1,999 | 217 (29.2%) | 92 (8.1%) |
| $2,000 to $2,499 | 51 (6.9%) | 168 (14.7%) |
| $2,500 to $2,999 | 12 (1.6%) | 44 (3.9%) |
| $3,000 or more | 15 (2.0%) | 0 (0.0%) |
| Total | 742 (100.0%) | 1,141 (100.0%) |
Physical Housing Characteristics in Geneseo
Housing Structures in Geneseo
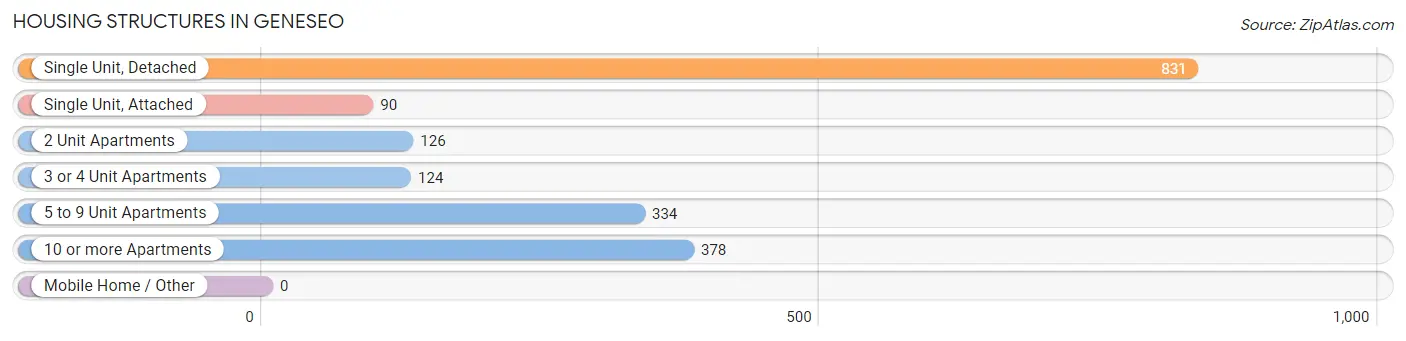
| Structure Type | # Housing Units | % Housing Units |
| Single Unit, Detached | 831 | 44.1% |
| Single Unit, Attached | 90 | 4.8% |
| 2 Unit Apartments | 126 | 6.7% |
| 3 or 4 Unit Apartments | 124 | 6.6% |
| 5 to 9 Unit Apartments | 334 | 17.7% |
| 10 or more Apartments | 378 | 20.1% |
| Mobile Home / Other | 0 | 0.0% |
| Total | 1,883 | 100.0% |
Housing Structures by Occupancy in Geneseo
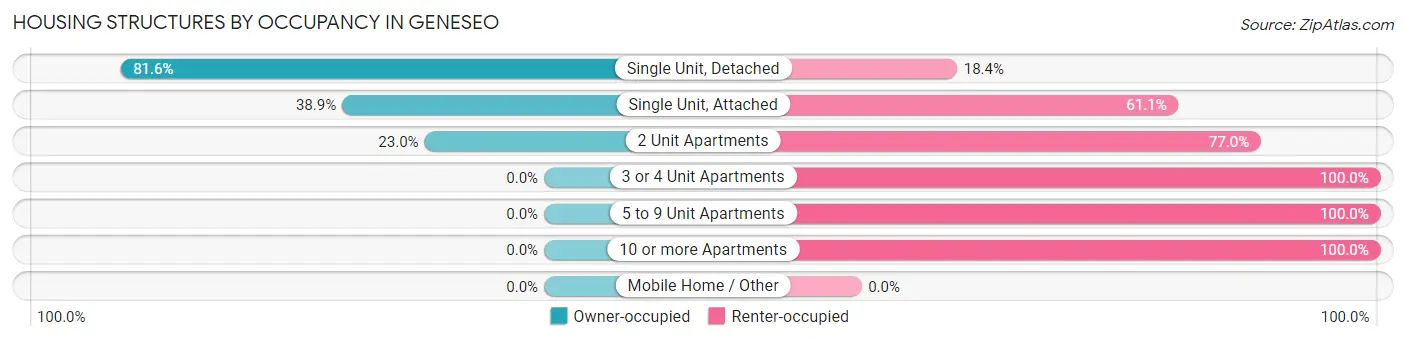
| Structure Type | Owner-occupied | Renter-occupied |
| Single Unit, Detached | 678 (81.6%) | 153 (18.4%) |
| Single Unit, Attached | 35 (38.9%) | 55 (61.1%) |
| 2 Unit Apartments | 29 (23.0%) | 97 (77.0%) |
| 3 or 4 Unit Apartments | 0 (0.0%) | 124 (100.0%) |
| 5 to 9 Unit Apartments | 0 (0.0%) | 334 (100.0%) |
| 10 or more Apartments | 0 (0.0%) | 378 (100.0%) |
| Mobile Home / Other | 0 (0.0%) | 0 (0.0%) |
| Total | 742 (39.4%) | 1,141 (60.6%) |
Housing Structures by Number of Rooms in Geneseo
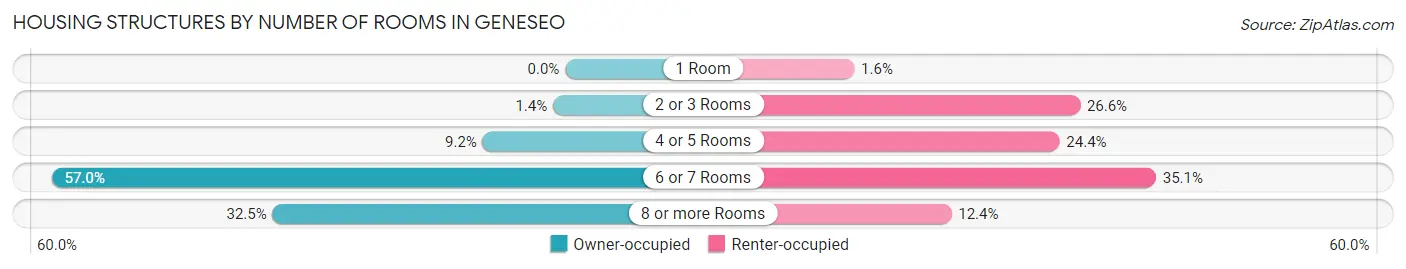
| Number of Rooms | Owner-occupied | Renter-occupied |
| 1 Room | 0 (0.0%) | 18 (1.6%) |
| 2 or 3 Rooms | 10 (1.3%) | 304 (26.6%) |
| 4 or 5 Rooms | 68 (9.2%) | 278 (24.4%) |
| 6 or 7 Rooms | 423 (57.0%) | 400 (35.1%) |
| 8 or more Rooms | 241 (32.5%) | 141 (12.4%) |
| Total | 742 (100.0%) | 1,141 (100.0%) |
Housing Structure by Heating Type in Geneseo
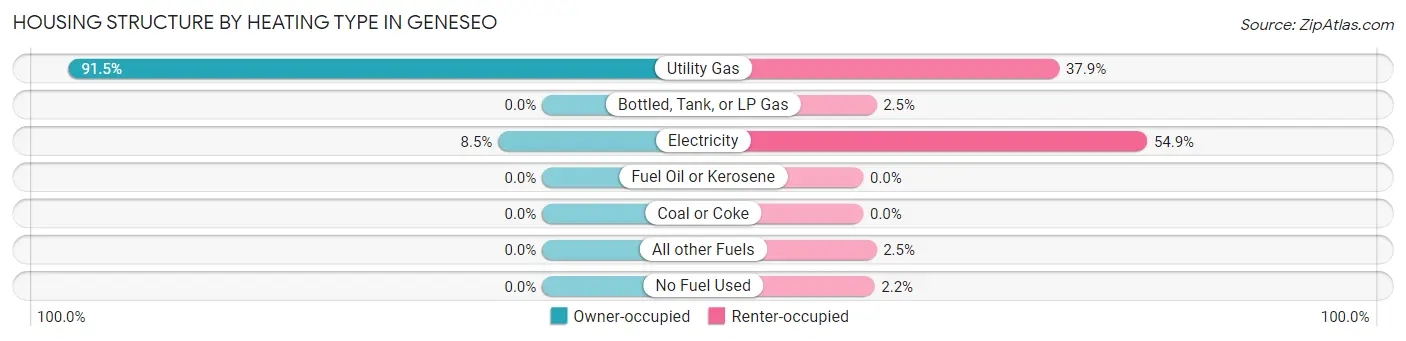
| Heating Type | Owner-occupied | Renter-occupied |
| Utility Gas | 679 (91.5%) | 432 (37.9%) |
| Bottled, Tank, or LP Gas | 0 (0.0%) | 29 (2.5%) |
| Electricity | 63 (8.5%) | 626 (54.9%) |
| Fuel Oil or Kerosene | 0 (0.0%) | 0 (0.0%) |
| Coal or Coke | 0 (0.0%) | 0 (0.0%) |
| All other Fuels | 0 (0.0%) | 29 (2.5%) |
| No Fuel Used | 0 (0.0%) | 25 (2.2%) |
| Total | 742 (100.0%) | 1,141 (100.0%) |
Household Vehicle Usage in Geneseo
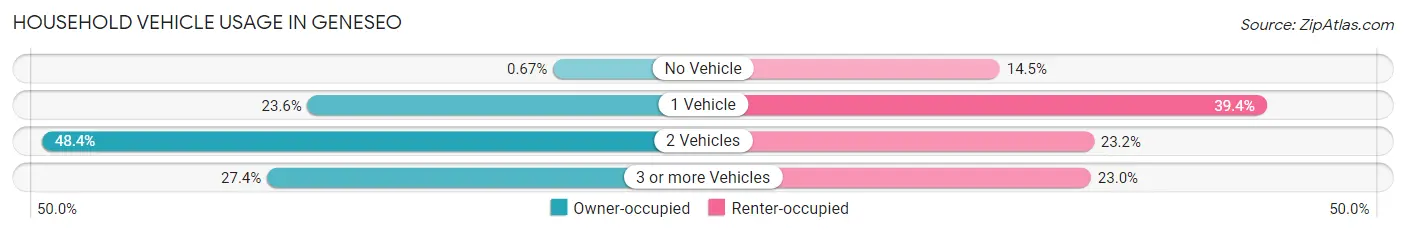
| Vehicles per Household | Owner-occupied | Renter-occupied |
| No Vehicle | 5 (0.7%) | 165 (14.5%) |
| 1 Vehicle | 175 (23.6%) | 449 (39.4%) |
| 2 Vehicles | 359 (48.4%) | 265 (23.2%) |
| 3 or more Vehicles | 203 (27.4%) | 262 (23.0%) |
| Total | 742 (100.0%) | 1,141 (100.0%) |
Real Estate & Mortgages in Geneseo
Real Estate and Mortgage Overview in Geneseo
| Characteristic | Without Mortgage | With Mortgage |
| Housing Units | 312 | 430 |
| Median Property Value | $206,900 | $194,600 |
| Median Household Income | $73,214 | $116 |
| Monthly Housing Costs | $683 | $15 |
| Real Estate Taxes | $4,300 | $74 |
Property Value by Mortgage Status in Geneseo
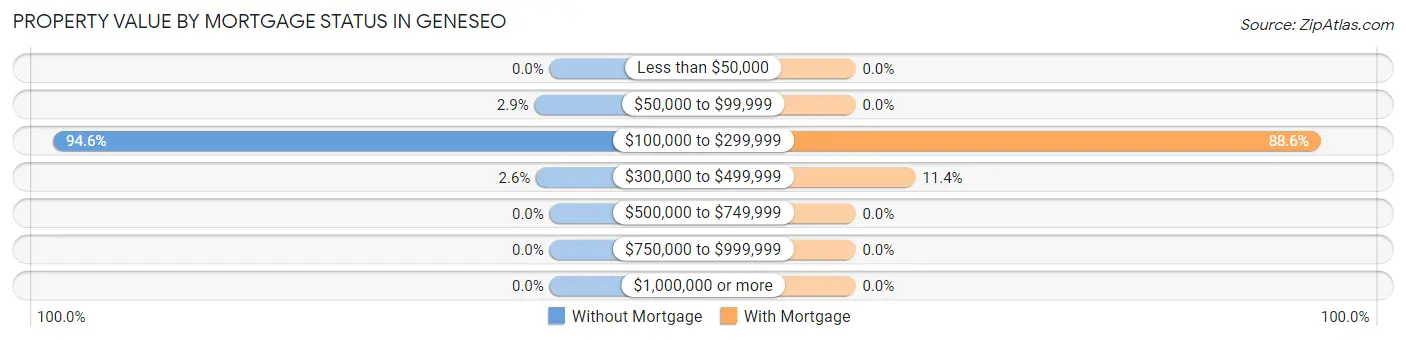
| Property Value | Without Mortgage | With Mortgage |
| Less than $50,000 | 0 (0.0%) | 0 (0.0%) |
| $50,000 to $99,999 | 9 (2.9%) | 0 (0.0%) |
| $100,000 to $299,999 | 295 (94.6%) | 381 (88.6%) |
| $300,000 to $499,999 | 8 (2.6%) | 49 (11.4%) |
| $500,000 to $749,999 | 0 (0.0%) | 0 (0.0%) |
| $750,000 to $999,999 | 0 (0.0%) | 0 (0.0%) |
| $1,000,000 or more | 0 (0.0%) | 0 (0.0%) |
| Total | 312 (100.0%) | 430 (100.0%) |
Household Income by Mortgage Status in Geneseo
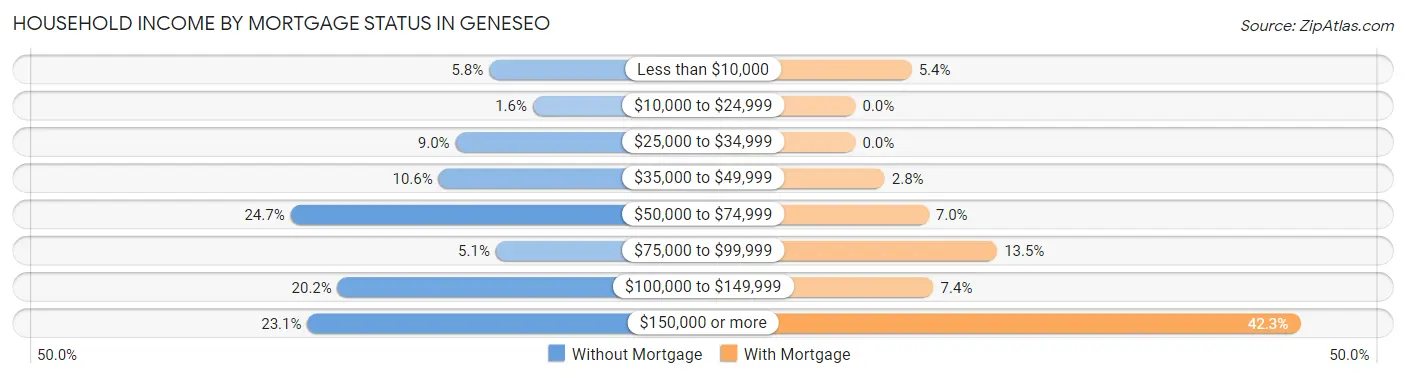
| Household Income | Without Mortgage | With Mortgage |
| Less than $10,000 | 18 (5.8%) | 23 (5.3%) |
| $10,000 to $24,999 | 5 (1.6%) | 0 (0.0%) |
| $25,000 to $34,999 | 28 (9.0%) | 0 (0.0%) |
| $35,000 to $49,999 | 33 (10.6%) | 12 (2.8%) |
| $50,000 to $74,999 | 77 (24.7%) | 30 (7.0%) |
| $75,000 to $99,999 | 16 (5.1%) | 58 (13.5%) |
| $100,000 to $149,999 | 63 (20.2%) | 32 (7.4%) |
| $150,000 or more | 72 (23.1%) | 182 (42.3%) |
| Total | 312 (100.0%) | 430 (100.0%) |
Property Value to Household Income Ratio in Geneseo
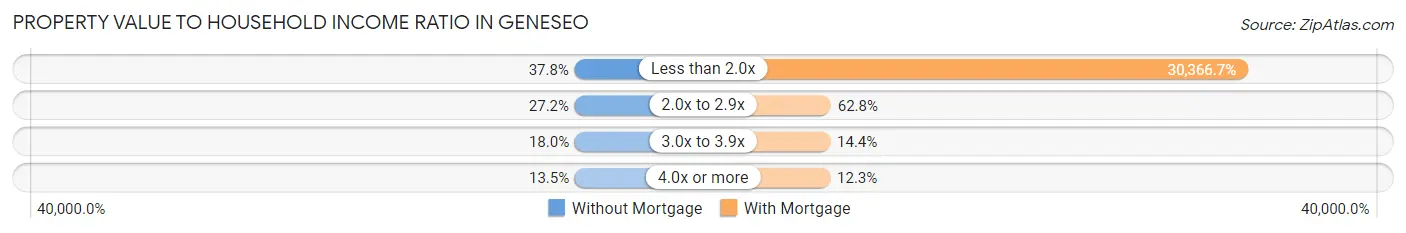
| Value-to-Income Ratio | Without Mortgage | With Mortgage |
| Less than 2.0x | 118 (37.8%) | 130,577 (30,366.7%) |
| 2.0x to 2.9x | 85 (27.2%) | 270 (62.8%) |
| 3.0x to 3.9x | 56 (17.9%) | 62 (14.4%) |
| 4.0x or more | 42 (13.5%) | 53 (12.3%) |
| Total | 312 (100.0%) | 430 (100.0%) |
Real Estate Taxes by Mortgage Status in Geneseo
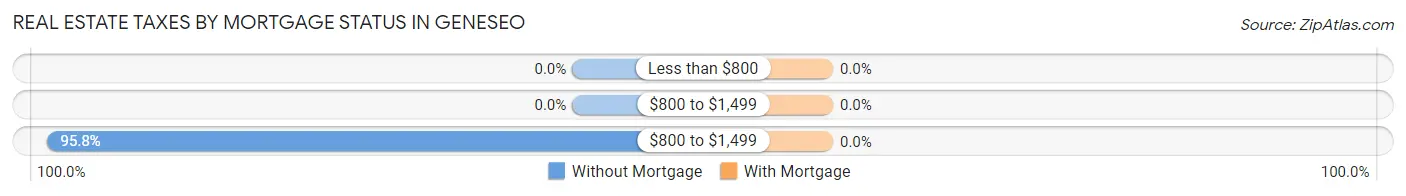
| Property Taxes | Without Mortgage | With Mortgage |
| Less than $800 | 0 (0.0%) | 0 (0.0%) |
| $800 to $1,499 | 0 (0.0%) | 0 (0.0%) |
| $800 to $1,499 | 299 (95.8%) | 0 (0.0%) |
| Total | 312 (100.0%) | 430 (100.0%) |
Health & Disability in Geneseo
Health Insurance Coverage by Age in Geneseo
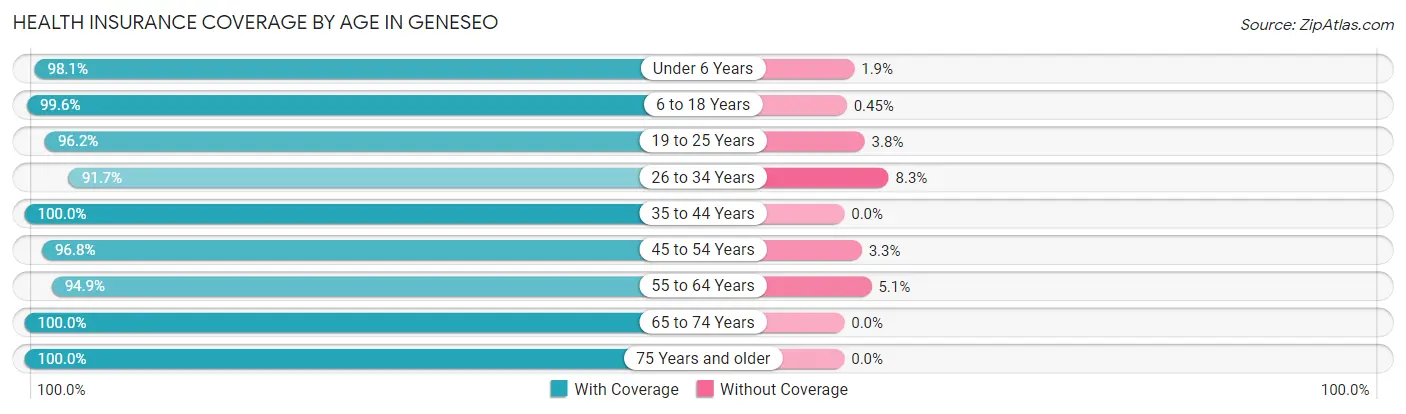
| Age Bracket | With Coverage | Without Coverage |
| Under 6 Years | 316 (98.1%) | 6 (1.9%) |
| 6 to 18 Years | 1,338 (99.6%) | 6 (0.4%) |
| 19 to 25 Years | 3,644 (96.2%) | 144 (3.8%) |
| 26 to 34 Years | 400 (91.7%) | 36 (8.3%) |
| 35 to 44 Years | 236 (100.0%) | 0 (0.0%) |
| 45 to 54 Years | 357 (96.8%) | 12 (3.3%) |
| 55 to 64 Years | 338 (94.9%) | 18 (5.1%) |
| 65 to 74 Years | 409 (100.0%) | 0 (0.0%) |
| 75 Years and older | 341 (100.0%) | 0 (0.0%) |
| Total | 7,379 (97.1%) | 222 (2.9%) |
Health Insurance Coverage by Citizenship Status in Geneseo
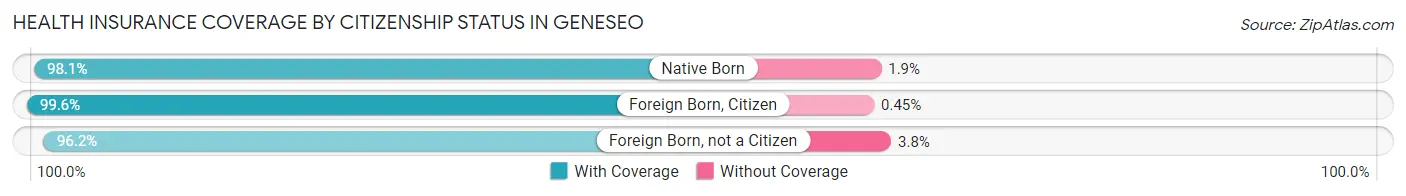
| Citizenship Status | With Coverage | Without Coverage |
| Native Born | 316 (98.1%) | 6 (1.9%) |
| Foreign Born, Citizen | 1,338 (99.6%) | 6 (0.4%) |
| Foreign Born, not a Citizen | 3,644 (96.2%) | 144 (3.8%) |
Health Insurance Coverage by Household Income in Geneseo
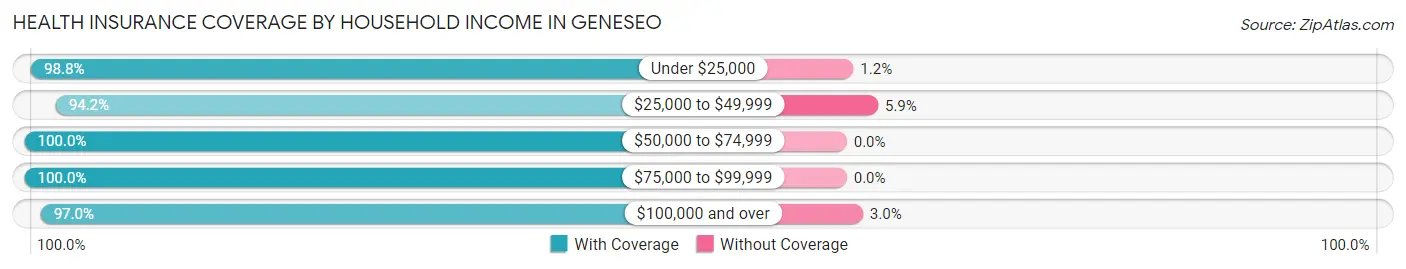
| Household Income | With Coverage | Without Coverage |
| Under $25,000 | 1,513 (98.8%) | 19 (1.2%) |
| $25,000 to $49,999 | 950 (94.2%) | 59 (5.9%) |
| $50,000 to $74,999 | 476 (100.0%) | 0 (0.0%) |
| $75,000 to $99,999 | 151 (100.0%) | 0 (0.0%) |
| $100,000 and over | 1,315 (97.0%) | 41 (3.0%) |
Public vs Private Health Insurance Coverage by Age in Geneseo
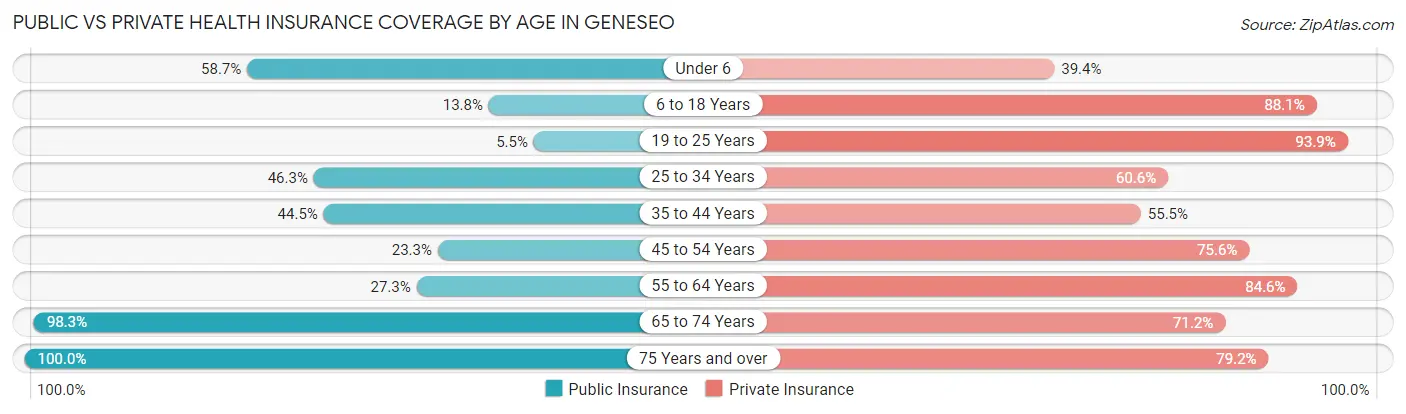
| Age Bracket | Public Insurance | Private Insurance |
| Under 6 | 189 (58.7%) | 127 (39.4%) |
| 6 to 18 Years | 186 (13.8%) | 1,184 (88.1%) |
| 19 to 25 Years | 208 (5.5%) | 3,556 (93.9%) |
| 25 to 34 Years | 202 (46.3%) | 264 (60.6%) |
| 35 to 44 Years | 105 (44.5%) | 131 (55.5%) |
| 45 to 54 Years | 86 (23.3%) | 279 (75.6%) |
| 55 to 64 Years | 97 (27.3%) | 301 (84.6%) |
| 65 to 74 Years | 402 (98.3%) | 291 (71.2%) |
| 75 Years and over | 341 (100.0%) | 270 (79.2%) |
| Total | 1,816 (23.9%) | 6,403 (84.2%) |
Disability Status by Sex by Age in Geneseo
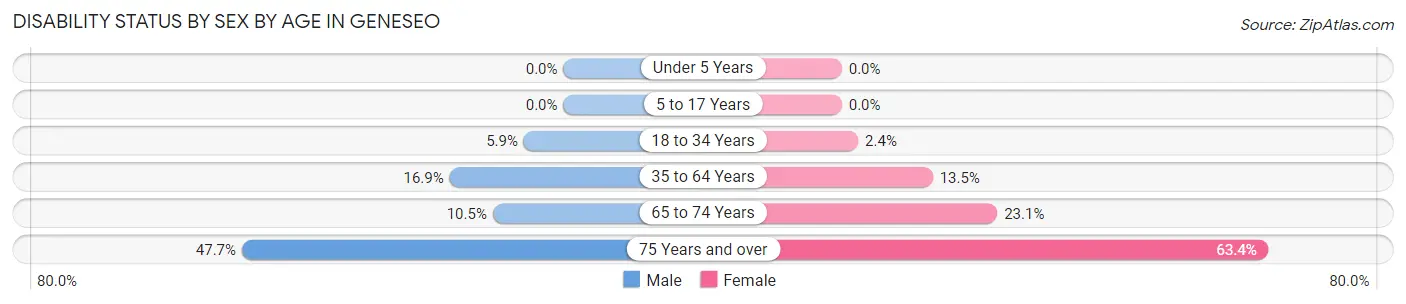
| Age Bracket | Male | Female |
| Under 5 Years | 0 (0.0%) | 0 (0.0%) |
| 5 to 17 Years | 0 (0.0%) | 0 (0.0%) |
| 18 to 34 Years | 121 (5.9%) | 77 (2.4%) |
| 35 to 64 Years | 61 (16.9%) | 81 (13.5%) |
| 65 to 74 Years | 17 (10.5%) | 57 (23.1%) |
| 75 Years and over | 95 (47.7%) | 90 (63.4%) |
Disability Class by Sex by Age in Geneseo
Disability Class: Hearing Difficulty
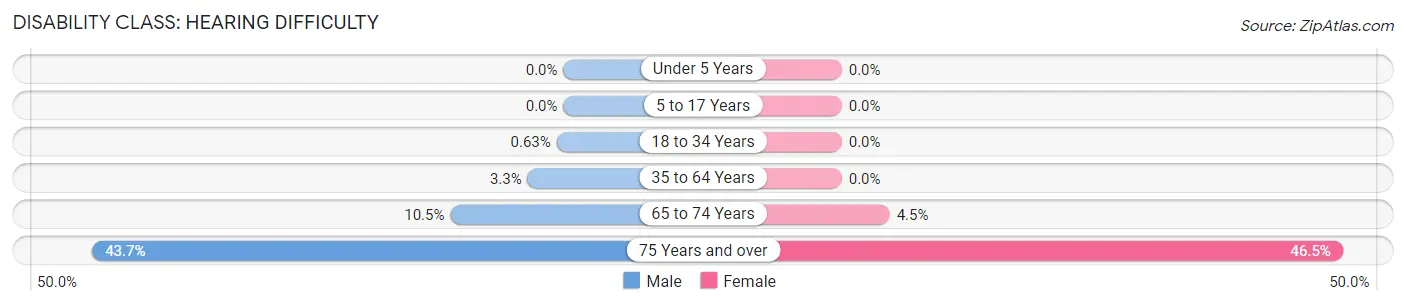
| Age Bracket | Male | Female |
| Under 5 Years | 0 (0.0%) | 0 (0.0%) |
| 5 to 17 Years | 0 (0.0%) | 0 (0.0%) |
| 18 to 34 Years | 13 (0.6%) | 0 (0.0%) |
| 35 to 64 Years | 12 (3.3%) | 0 (0.0%) |
| 65 to 74 Years | 17 (10.5%) | 11 (4.4%) |
| 75 Years and over | 87 (43.7%) | 66 (46.5%) |
Disability Class: Vision Difficulty
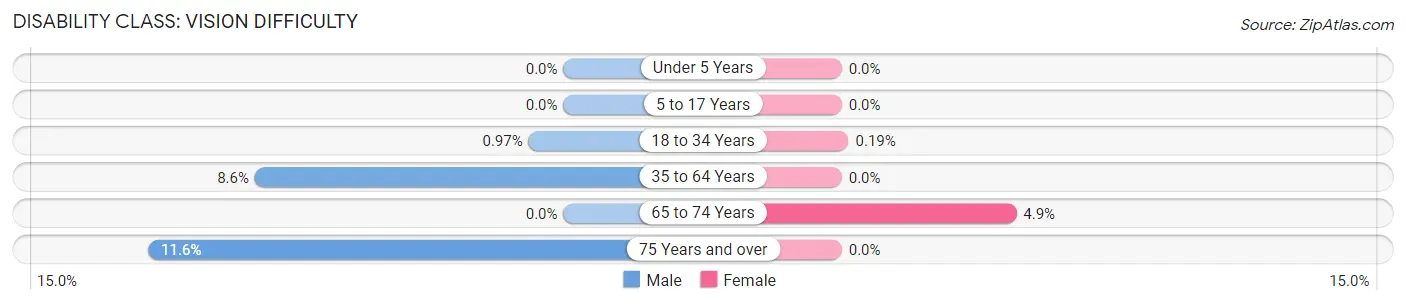
| Age Bracket | Male | Female |
| Under 5 Years | 0 (0.0%) | 0 (0.0%) |
| 5 to 17 Years | 0 (0.0%) | 0 (0.0%) |
| 18 to 34 Years | 20 (1.0%) | 6 (0.2%) |
| 35 to 64 Years | 31 (8.6%) | 0 (0.0%) |
| 65 to 74 Years | 0 (0.0%) | 12 (4.9%) |
| 75 Years and over | 23 (11.6%) | 0 (0.0%) |
Disability Class: Cognitive Difficulty
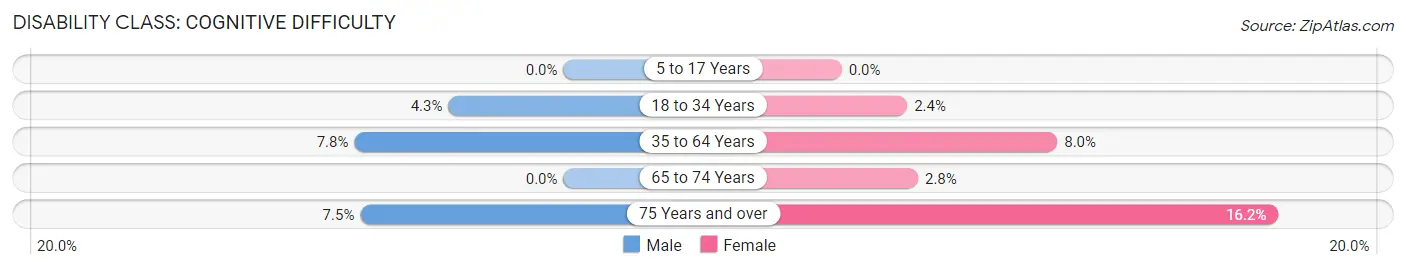
| Age Bracket | Male | Female |
| 5 to 17 Years | 0 (0.0%) | 0 (0.0%) |
| 18 to 34 Years | 88 (4.3%) | 77 (2.4%) |
| 35 to 64 Years | 28 (7.8%) | 48 (8.0%) |
| 65 to 74 Years | 0 (0.0%) | 7 (2.8%) |
| 75 Years and over | 15 (7.5%) | 23 (16.2%) |
Disability Class: Ambulatory Difficulty
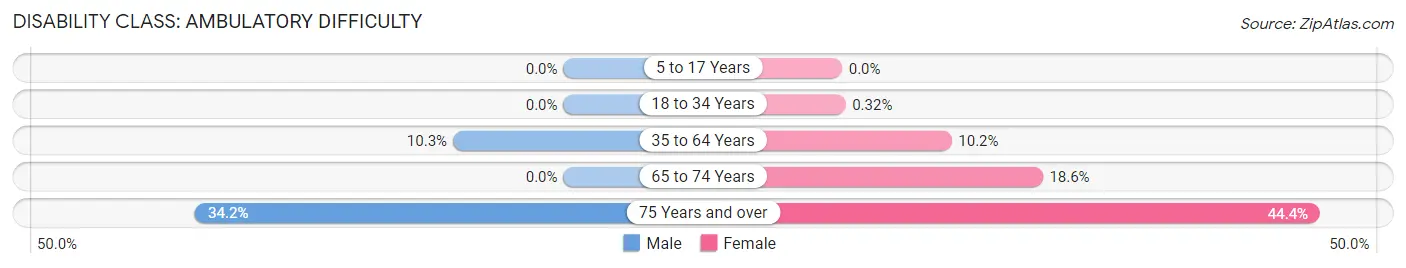
| Age Bracket | Male | Female |
| 5 to 17 Years | 0 (0.0%) | 0 (0.0%) |
| 18 to 34 Years | 0 (0.0%) | 10 (0.3%) |
| 35 to 64 Years | 37 (10.2%) | 61 (10.2%) |
| 65 to 74 Years | 0 (0.0%) | 46 (18.6%) |
| 75 Years and over | 68 (34.2%) | 63 (44.4%) |
Disability Class: Self-Care Difficulty
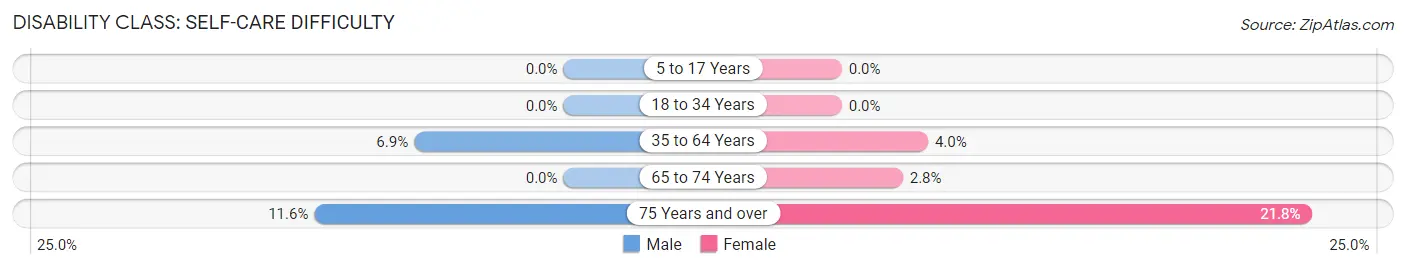
| Age Bracket | Male | Female |
| 5 to 17 Years | 0 (0.0%) | 0 (0.0%) |
| 18 to 34 Years | 0 (0.0%) | 0 (0.0%) |
| 35 to 64 Years | 25 (6.9%) | 24 (4.0%) |
| 65 to 74 Years | 0 (0.0%) | 7 (2.8%) |
| 75 Years and over | 23 (11.6%) | 31 (21.8%) |
Technology Access in Geneseo
Computing Device Access in Geneseo
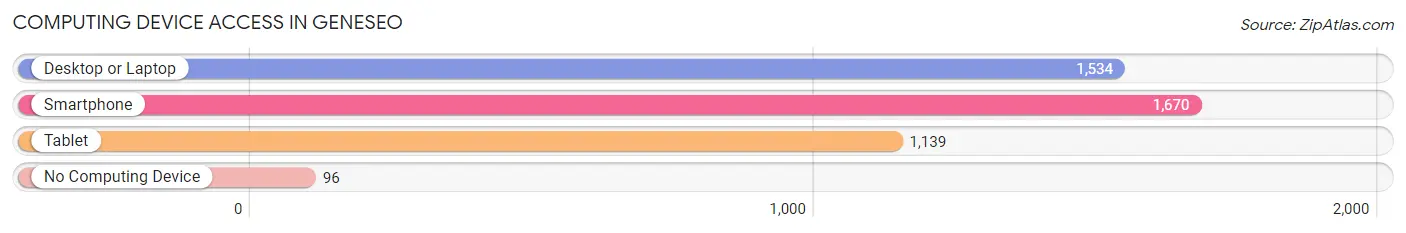
| Device Type | # Households | % Households |
| Desktop or Laptop | 1,534 | 81.5% |
| Smartphone | 1,670 | 88.7% |
| Tablet | 1,139 | 60.5% |
| No Computing Device | 96 | 5.1% |
| Total | 1,883 | 100.0% |
Internet Access in Geneseo
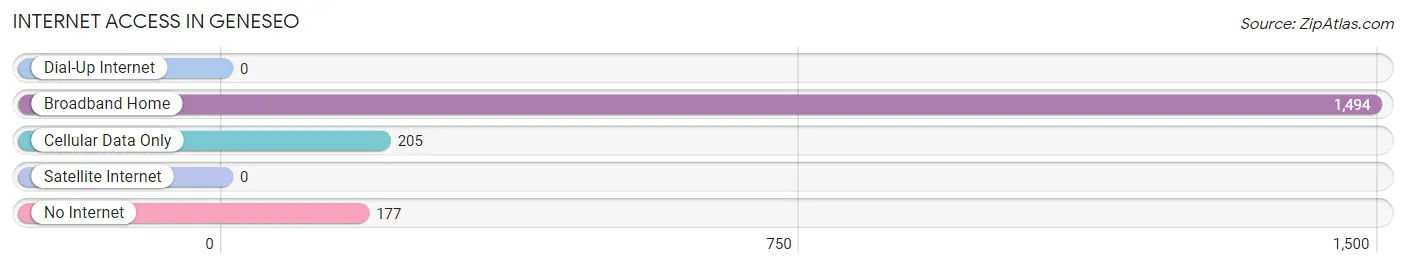
| Internet Type | # Households | % Households |
| Dial-Up Internet | 0 | 0.0% |
| Broadband Home | 1,494 | 79.3% |
| Cellular Data Only | 205 | 10.9% |
| Satellite Internet | 0 | 0.0% |
| No Internet | 177 | 9.4% |
| Total | 1,883 | 100.0% |
Geneseo Summary
Geneseo, NY is a small village located in Livingston County, New York. It is situated in the Finger Lakes region of the state, and is part of the Rochester Metropolitan Statistical Area. The village has a population of 8,444 as of the 2010 census, and is the home of the State University of New York at Geneseo.
History
The area that is now Geneseo was originally inhabited by the Seneca Nation of the Iroquois Confederacy. The first European settlers arrived in the area in 1790, and the village was officially incorporated in 1832. The village was named after the Genesee River, which flows through the area.
The village was an important stop on the Underground Railroad, and was home to several prominent abolitionists. In the mid-19th century, the village was a center of the temperance movement, and was the site of the first Women’s Rights Convention in 1848.
Geography
Geneseo is located in the Finger Lakes region of New York, and is situated on the Genesee River. The village is located approximately 25 miles south of Rochester, and is bordered by the towns of Leicester, Groveland, and Mount Morris. The village has a total area of 2.2 square miles, all of which is land.
The village is located in a hilly region, and is surrounded by several small lakes and ponds. The highest point in the village is the summit of Geneseo Hill, which has an elevation of 1,092 feet.
Economy
The economy of Geneseo is largely driven by the State University of New York at Geneseo, which is the largest employer in the village. Other major employers in the village include Genesee Valley BOCES, Geneseo Central School District, and Geneseo Central School District.
The village is also home to several small businesses, including restaurants, retail stores, and professional services. The village is also home to several wineries, and is a popular destination for wine tourism.
Demographics
As of the 2010 census, the population of Geneseo was 8,444. The racial makeup of the village was 94.2% White, 2.2% African American, 0.4% Native American, 1.3% Asian, 0.1% Pacific Islander, 0.7% from other races, and 1.1% from two or more races. Hispanic or Latino of any race were 2.7% of the population.
The median household income in Geneseo was $50,945, and the median family income was $63,917. The per capita income for the village was $25,845. About 8.2% of families and 14.2% of the population were below the poverty line, including 15.3% of those under age 18 and 6.2% of those age 65 or over.
Common Questions
What is Per Capita Income in Geneseo?
Per Capita income in Geneseo is $18,096.
What is the Median Family Income in Geneseo?
Median Family Income in Geneseo is $71,563.
What is the Median Household income in Geneseo?
Median Household Income in Geneseo is $37,701.
What is Income or Wage Gap in Geneseo?
Income or Wage Gap in Geneseo is 24.9%.
Women in Geneseo earn 75.1 cents for every dollar earned by a man.
What is Inequality or Gini Index in Geneseo?
Inequality or Gini Index in Geneseo is 0.55.
What is the Total Population of Geneseo?
Total Population of Geneseo is 7,713.
What is the Total Male Population of Geneseo?
Total Male Population of Geneseo is 3,153.
What is the Total Female Population of Geneseo?
Total Female Population of Geneseo is 4,560.
What is the Ratio of Males per 100 Females in Geneseo?
There are 69.14 Males per 100 Females in Geneseo.
What is the Ratio of Females per 100 Males in Geneseo?
There are 144.62 Females per 100 Males in Geneseo.
What is the Median Population Age in Geneseo?
Median Population Age in Geneseo is 21.2 Years.
What is the Average Family Size in Geneseo
Average Family Size in Geneseo is 2.6 People.
What is the Average Household Size in Geneseo
Average Household Size in Geneseo is 2.4 People.
How Large is the Labor Force in Geneseo?
There are 3,196 People in the Labor Forcein in Geneseo.
What is the Percentage of People in the Labor Force in Geneseo?
44.6% of People are in the Labor Force in Geneseo.
What is the Unemployment Rate in Geneseo?
Unemployment Rate in Geneseo is 7.1%.