Galway, NY Map & Demographics
Galway Map
Galway Overview
$24,826
PER CAPITA INCOME
$64,000
AVG FAMILY INCOME
$56,667
AVG HOUSEHOLD INCOME
0.36
INEQUALITY / GINI INDEX
174
TOTAL POPULATION
67
MALE POPULATION
107
FEMALE POPULATION
62.62
MALES / 100 FEMALES
159.70
FEMALES / 100 MALES
38.2
MEDIAN AGE
3.0
AVG FAMILY SIZE
2.4
AVG HOUSEHOLD SIZE
75
LABOR FORCE [ PEOPLE ]
60.0%
PERCENT IN LABOR FORCE
2.7%
UNEMPLOYMENT RATE
Galway Zip Codes
Galway Area Codes
Income in Galway
Income Overview in Galway
Per Capita Income in Galway is $24,826, while median incomes of families and households are $64,000 and $56,667 respectively.
| Characteristic | Number | Measure |
| Per Capita Income | 174 | $24,826 |
| Median Family Income | 48 | $64,000 |
| Mean Family Income | 48 | $60,829 |
| Median Household Income | 74 | $56,667 |
| Mean Household Income | 74 | $55,778 |
| Income Deficit | 48 | $0 |
| Wage / Income Gap (%) | 174 | 0.00% |
| Wage / Income Gap ($) | 174 | 100.00¢ per $1 |
| Gini / Inequality Index | 174 | 0.36 |
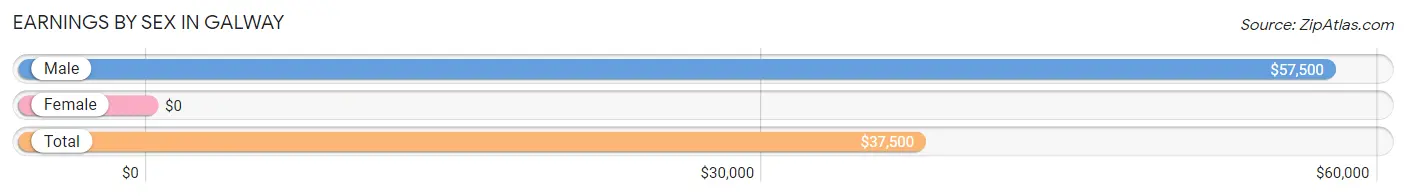
Earnings by Sex in Galway
| Sex | Number | Average Earnings |
| Male | 42 (52.5%) | $57,500 |
| Female | 38 (47.5%) | $0 |
| Total | 80 (100.0%) | $37,500 |
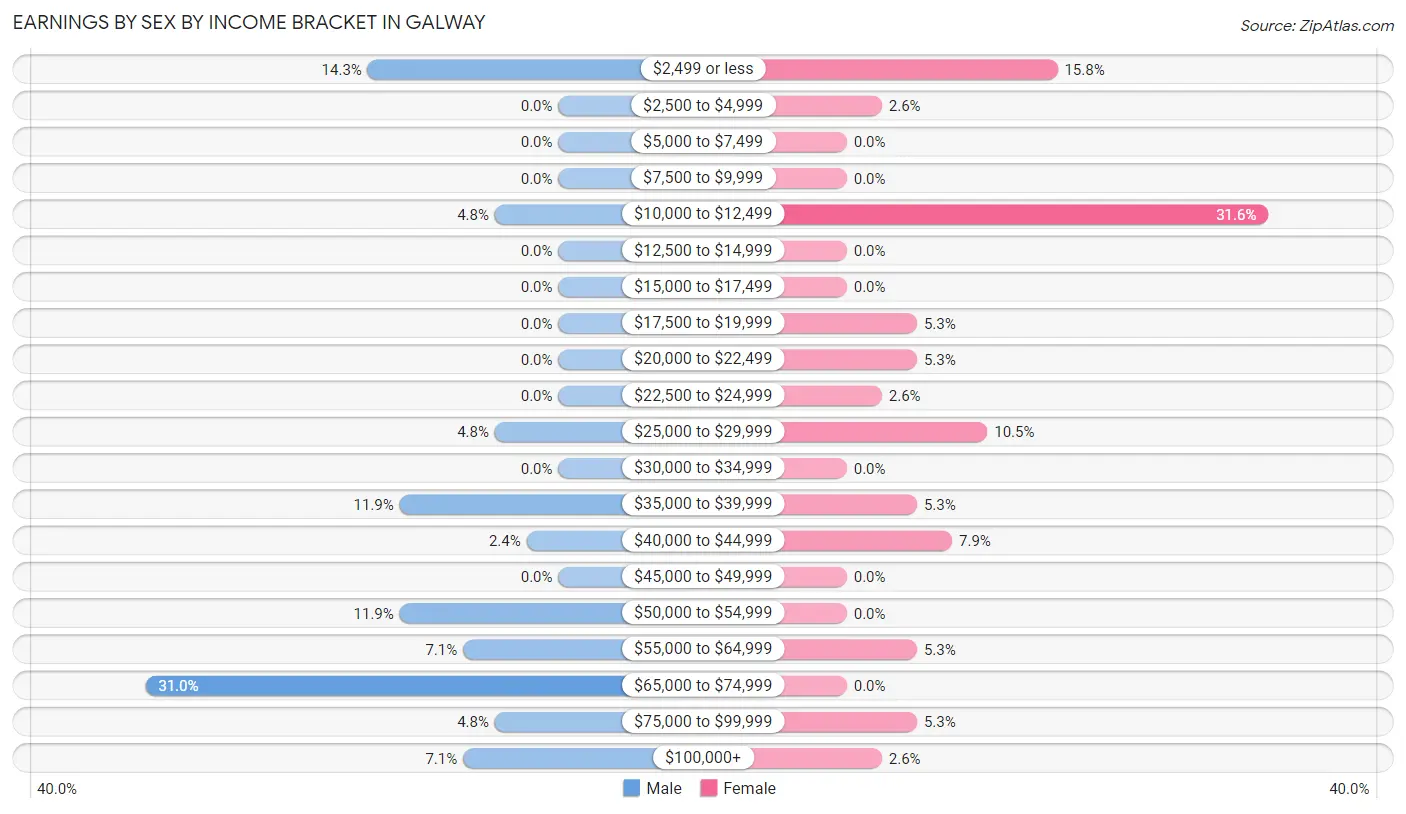
Earnings by Sex by Income Bracket in Galway
The most common earnings brackets in Galway are $65,000 to $74,999 for men (13 | 30.9%) and $10,000 to $12,499 for women (12 | 31.6%).
| Income | Male | Female |
| $2,499 or less | 6 (14.3%) | 6 (15.8%) |
| $2,500 to $4,999 | 0 (0.0%) | 1 (2.6%) |
| $5,000 to $7,499 | 0 (0.0%) | 0 (0.0%) |
| $7,500 to $9,999 | 0 (0.0%) | 0 (0.0%) |
| $10,000 to $12,499 | 2 (4.8%) | 12 (31.6%) |
| $12,500 to $14,999 | 0 (0.0%) | 0 (0.0%) |
| $15,000 to $17,499 | 0 (0.0%) | 0 (0.0%) |
| $17,500 to $19,999 | 0 (0.0%) | 2 (5.3%) |
| $20,000 to $22,499 | 0 (0.0%) | 2 (5.3%) |
| $22,500 to $24,999 | 0 (0.0%) | 1 (2.6%) |
| $25,000 to $29,999 | 2 (4.8%) | 4 (10.5%) |
| $30,000 to $34,999 | 0 (0.0%) | 0 (0.0%) |
| $35,000 to $39,999 | 5 (11.9%) | 2 (5.3%) |
| $40,000 to $44,999 | 1 (2.4%) | 3 (7.9%) |
| $45,000 to $49,999 | 0 (0.0%) | 0 (0.0%) |
| $50,000 to $54,999 | 5 (11.9%) | 0 (0.0%) |
| $55,000 to $64,999 | 3 (7.1%) | 2 (5.3%) |
| $65,000 to $74,999 | 13 (30.9%) | 0 (0.0%) |
| $75,000 to $99,999 | 2 (4.8%) | 2 (5.3%) |
| $100,000+ | 3 (7.1%) | 1 (2.6%) |
| Total | 42 (100.0%) | 38 (100.0%) |
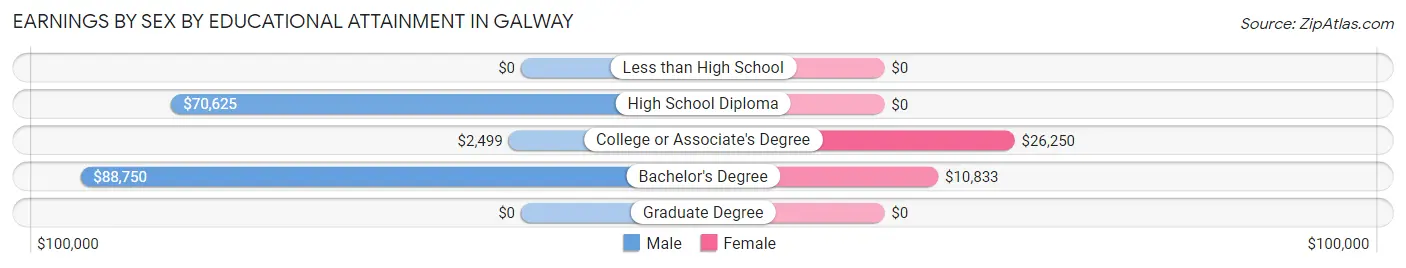
Earnings by Sex by Educational Attainment in Galway
Average earnings in Galway are $57,500 for men and $18,125 for women, a difference of 68.5%. Men with an educational attainment of bachelor's degree enjoy the highest average annual earnings of $88,750, while those with college or associate's degree education earn the least with $2,499. Women with an educational attainment of college or associate's degree earn the most with the average annual earnings of $26,250, while those with bachelor's degree education have the smallest earnings of $10,833.
| Educational Attainment | Male Income | Female Income |
| Less than High School | - | - |
| High School Diploma | $70,625 | $0 |
| College or Associate's Degree | $2,499 | $26,250 |
| Bachelor's Degree | $88,750 | $10,833 |
| Graduate Degree | - | - |
| Total | $57,500 | $18,125 |
Family Income in Galway
Family Income Brackets in Galway
According to the Galway family income data, there are 13 families falling into the $75,000 to $99,999 income range, which is the most common income bracket and makes up 27.1% of all families.
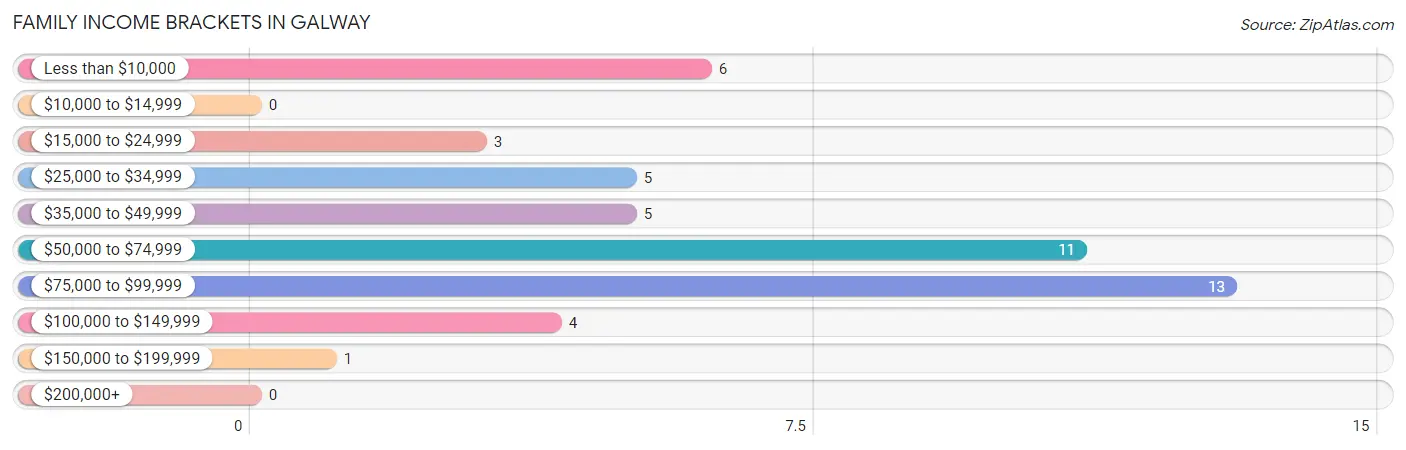
| Income Bracket | # Families | % Families |
| Less than $10,000 | 6 | 12.5% |
| $10,000 to $14,999 | 0 | 0.0% |
| $15,000 to $24,999 | 3 | 6.3% |
| $25,000 to $34,999 | 5 | 10.4% |
| $35,000 to $49,999 | 5 | 10.4% |
| $50,000 to $74,999 | 11 | 22.9% |
| $75,000 to $99,999 | 13 | 27.1% |
| $100,000 to $149,999 | 4 | 8.3% |
| $150,000 to $199,999 | 1 | 2.1% |
| $200,000+ | 0 | 0.0% |
Family Income by Famaliy Size in Galway
2-person families (27 | 56.2%) account for the highest median family income in Galway with $72,188 per family, while 2-person families (27 | 56.2%) have the highest median income of $36,094 per family member.
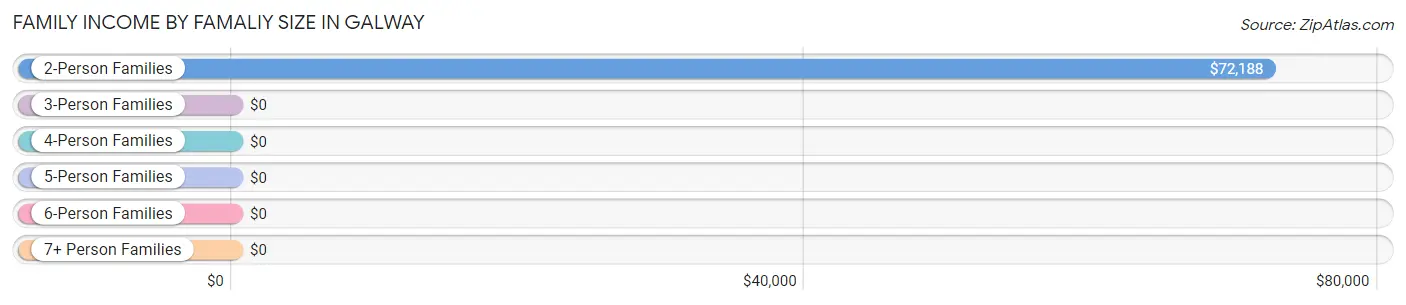
| Income Bracket | # Families | Median Income |
| 2-Person Families | 27 (56.2%) | $72,188 |
| 3-Person Families | 6 (12.5%) | $0 |
| 4-Person Families | 7 (14.6%) | $0 |
| 5-Person Families | 7 (14.6%) | $0 |
| 6-Person Families | 1 (2.1%) | $0 |
| 7+ Person Families | 0 (0.0%) | $0 |
| Total | 48 (100.0%) | $64,000 |
Family Income by Number of Earners in Galway
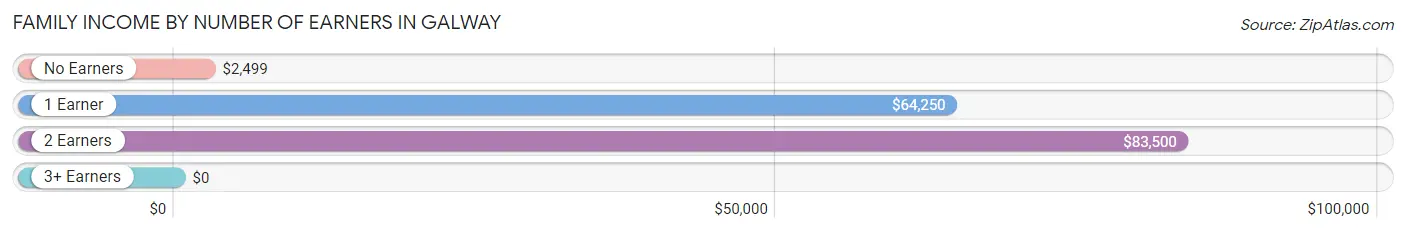
| Number of Earners | # Families | Median Income |
| No Earners | 10 (20.8%) | $2,499 |
| 1 Earner | 29 (60.4%) | $64,250 |
| 2 Earners | 8 (16.7%) | $83,500 |
| 3+ Earners | 1 (2.1%) | $0 |
| Total | 48 (100.0%) | $64,000 |
Household Income in Galway
Household Income Brackets in Galway
With 19 households falling in the category, the $50,000 to $74,999 income range is the most frequent in Galway, accounting for 25.7% of all households.
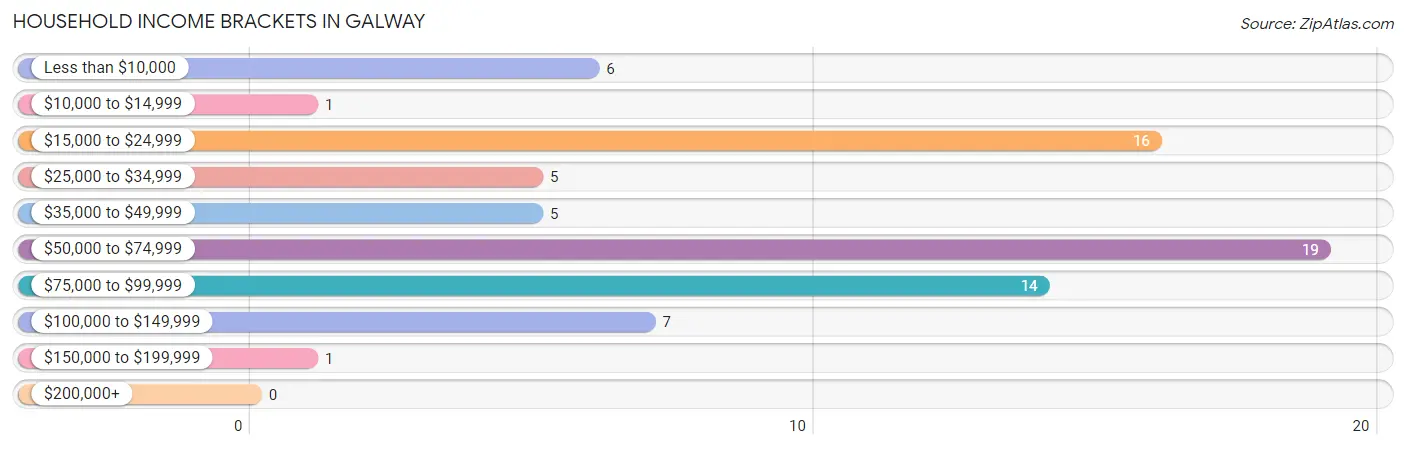
| Income Bracket | # Households | % Households |
| Less than $10,000 | 6 | 8.1% |
| $10,000 to $14,999 | 1 | 1.4% |
| $15,000 to $24,999 | 16 | 21.6% |
| $25,000 to $34,999 | 5 | 6.8% |
| $35,000 to $49,999 | 5 | 6.8% |
| $50,000 to $74,999 | 19 | 25.7% |
| $75,000 to $99,999 | 14 | 18.9% |
| $100,000 to $149,999 | 7 | 9.5% |
| $150,000 to $199,999 | 1 | 1.4% |
| $200,000+ | 0 | 0.0% |
Household Income by Householder Age in Galway
The median household income in Galway is $56,667, with the highest median household income of $72,031 found in the 45 to 64 years age bracket for the primary householder. A total of 21 households (28.4%) fall into this category.
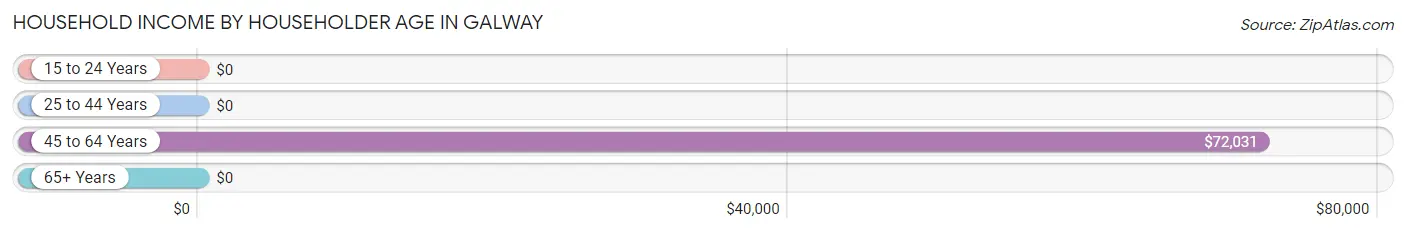
| Income Bracket | # Households | Median Income |
| 15 to 24 Years | 0 (0.0%) | $0 |
| 25 to 44 Years | 17 (23.0%) | $0 |
| 45 to 64 Years | 21 (28.4%) | $72,031 |
| 65+ Years | 36 (48.6%) | $0 |
| Total | 74 (100.0%) | $56,667 |
Poverty in Galway
Income Below Poverty by Sex and Age in Galway
With 14.9% poverty level for males and 17.8% for females among the residents of Galway, under 5 year old males and 12 to 14 year old females are the most vulnerable to poverty, with 6 males (75.0%) and 5 females (41.7%) in their respective age groups living below the poverty level.
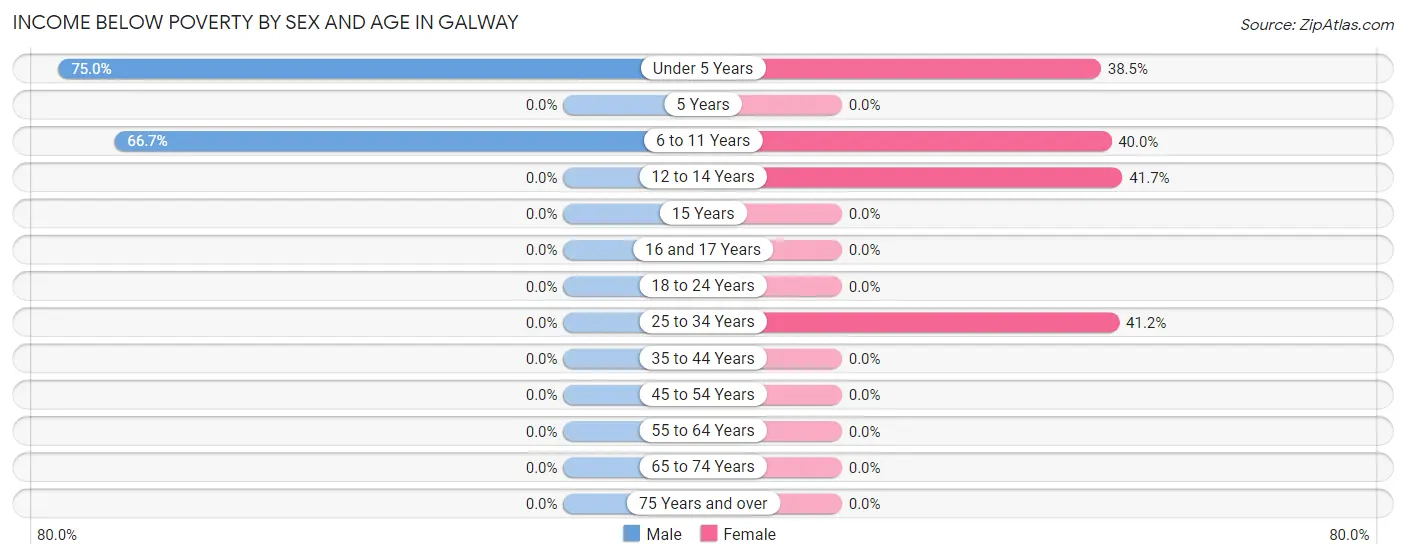
| Age Bracket | Male | Female |
| Under 5 Years | 6 (75.0%) | 5 (38.5%) |
| 5 Years | 0 (0.0%) | 0 (0.0%) |
| 6 to 11 Years | 4 (66.7%) | 2 (40.0%) |
| 12 to 14 Years | 0 (0.0%) | 5 (41.7%) |
| 15 Years | 0 (0.0%) | 0 (0.0%) |
| 16 and 17 Years | 0 (0.0%) | 0 (0.0%) |
| 18 to 24 Years | 0 (0.0%) | 0 (0.0%) |
| 25 to 34 Years | 0 (0.0%) | 7 (41.2%) |
| 35 to 44 Years | 0 (0.0%) | 0 (0.0%) |
| 45 to 54 Years | 0 (0.0%) | 0 (0.0%) |
| 55 to 64 Years | 0 (0.0%) | 0 (0.0%) |
| 65 to 74 Years | 0 (0.0%) | 0 (0.0%) |
| 75 Years and over | 0 (0.0%) | 0 (0.0%) |
| Total | 10 (14.9%) | 19 (17.8%) |
Income Above Poverty by Sex and Age in Galway
According to the poverty statistics in Galway, males aged 15 years and females aged 5 years are the age groups that are most secure financially, with 100.0% of males and 100.0% of females in these age groups living above the poverty line.
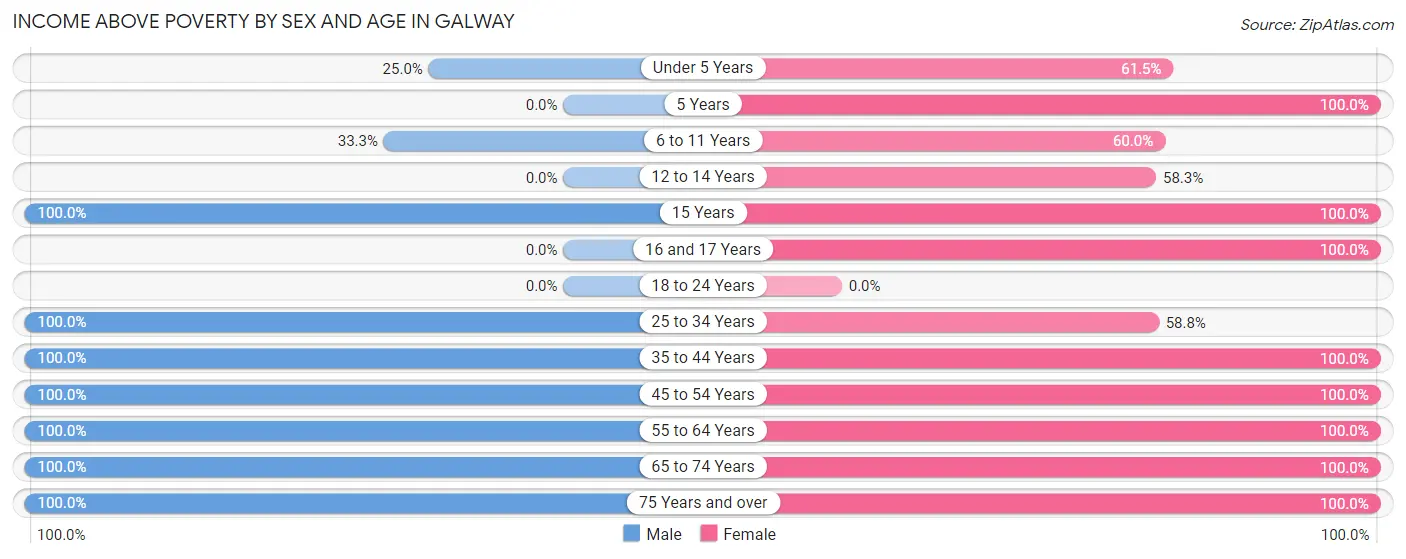
| Age Bracket | Male | Female |
| Under 5 Years | 2 (25.0%) | 8 (61.5%) |
| 5 Years | 0 (0.0%) | 1 (100.0%) |
| 6 to 11 Years | 2 (33.3%) | 3 (60.0%) |
| 12 to 14 Years | 0 (0.0%) | 7 (58.3%) |
| 15 Years | 2 (100.0%) | 2 (100.0%) |
| 16 and 17 Years | 0 (0.0%) | 3 (100.0%) |
| 18 to 24 Years | 0 (0.0%) | 0 (0.0%) |
| 25 to 34 Years | 9 (100.0%) | 10 (58.8%) |
| 35 to 44 Years | 11 (100.0%) | 2 (100.0%) |
| 45 to 54 Years | 5 (100.0%) | 7 (100.0%) |
| 55 to 64 Years | 12 (100.0%) | 15 (100.0%) |
| 65 to 74 Years | 12 (100.0%) | 19 (100.0%) |
| 75 Years and over | 2 (100.0%) | 11 (100.0%) |
| Total | 57 (85.1%) | 88 (82.2%) |
Income Below Poverty Among Married-Couple Families in Galway
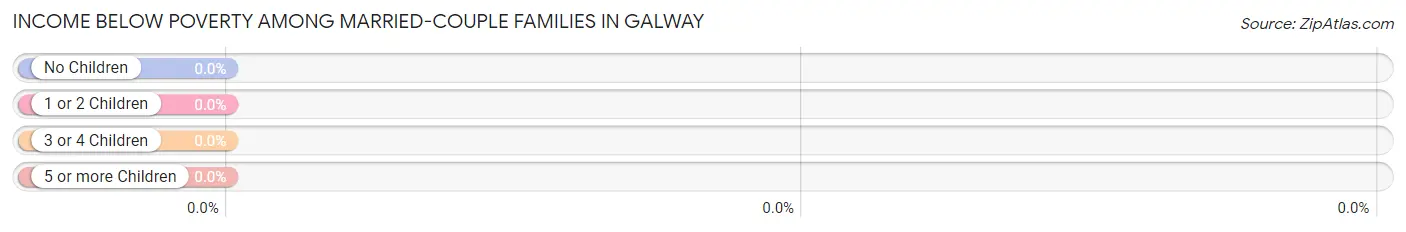
| Children | Above Poverty | Below Poverty |
| No Children | 17 (100.0%) | 0 (0.0%) |
| 1 or 2 Children | 9 (100.0%) | 0 (0.0%) |
| 3 or 4 Children | 1 (100.0%) | 0 (0.0%) |
| 5 or more Children | 0 (0.0%) | 0 (0.0%) |
| Total | 27 (100.0%) | 0 (0.0%) |
Income Below Poverty Among Single-Parent Households in Galway
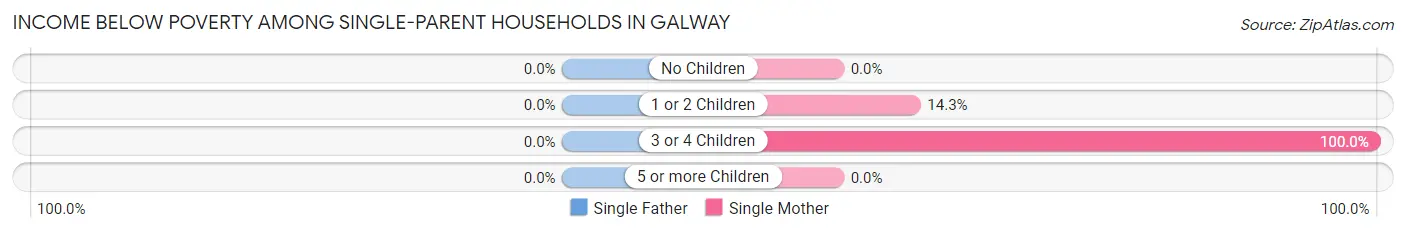
| Children | Single Father | Single Mother |
| No Children | 0 (0.0%) | 0 (0.0%) |
| 1 or 2 Children | 0 (0.0%) | 1 (14.3%) |
| 3 or 4 Children | 0 (0.0%) | 6 (100.0%) |
| 5 or more Children | 0 (0.0%) | 0 (0.0%) |
| Total | 0 (0.0%) | 7 (35.0%) |
Income Below Poverty Among Married-Couple vs Single-Parent Households in Galway
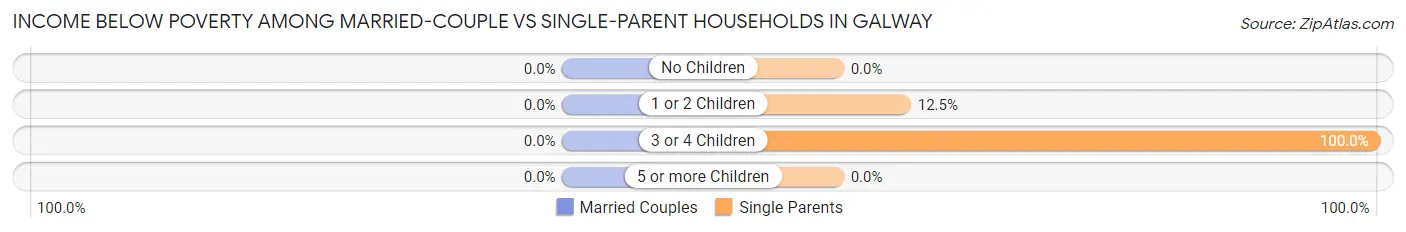
| Children | Married-Couple Families | Single-Parent Households |
| No Children | 0 (0.0%) | 0 (0.0%) |
| 1 or 2 Children | 0 (0.0%) | 1 (12.5%) |
| 3 or 4 Children | 0 (0.0%) | 6 (100.0%) |
| 5 or more Children | 0 (0.0%) | 0 (0.0%) |
| Total | 0 (0.0%) | 7 (33.3%) |
Race in Galway
The most populous races in Galway are , and White / Caucasian (174 | 100.0%).
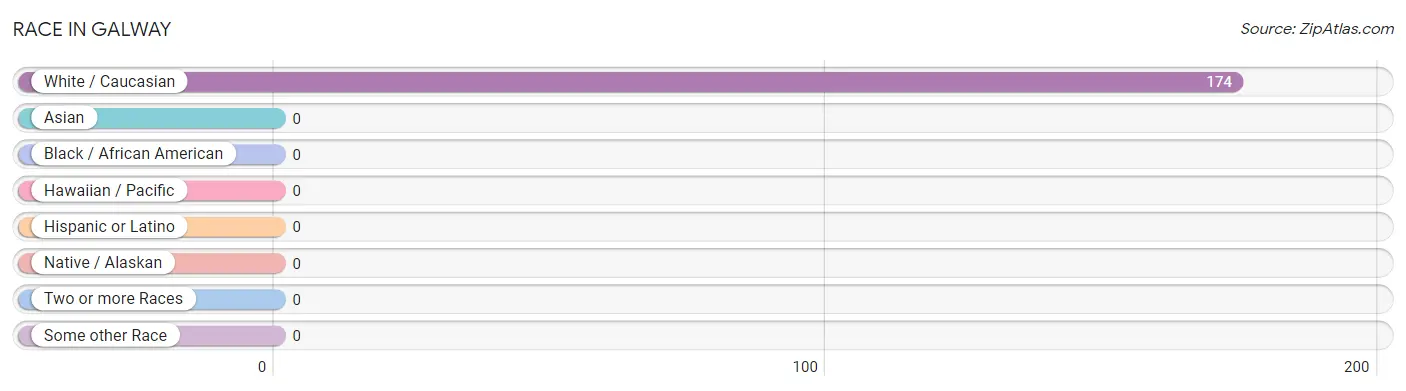
| Race | # Population | % Population |
| Asian | 0 | 0.0% |
| Black / African American | 0 | 0.0% |
| Hawaiian / Pacific | 0 | 0.0% |
| Hispanic or Latino | 0 | 0.0% |
| Native / Alaskan | 0 | 0.0% |
| White / Caucasian | 174 | 100.0% |
| Two or more Races | 0 | 0.0% |
| Some other Race | 0 | 0.0% |
| Total | 174 | 100.0% |
Ancestry in Galway
The most populous ancestries reported in Galway are English (64 | 36.8%), Irish (51 | 29.3%), Italian (34 | 19.5%), American (29 | 16.7%), and German (19 | 10.9%), together accounting for 113.2% of all Galway residents.
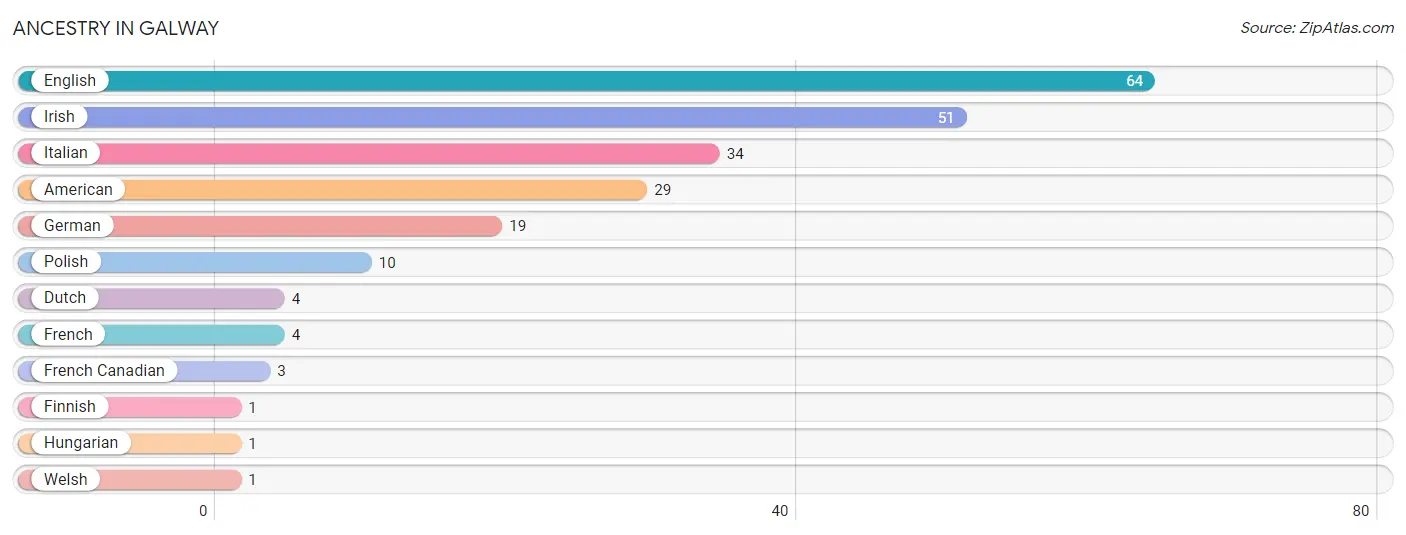
| Ancestry | # Population | % Population |
| American | 29 | 16.7% |
| Dutch | 4 | 2.3% |
| English | 64 | 36.8% |
| Finnish | 1 | 0.6% |
| French | 4 | 2.3% |
| French Canadian | 3 | 1.7% |
| German | 19 | 10.9% |
| Hungarian | 1 | 0.6% |
| Irish | 51 | 29.3% |
| Italian | 34 | 19.5% |
| Polish | 10 | 5.8% |
| Welsh | 1 | 0.6% | View All 12 Rows |
Immigrants in Galway

| Immigration Origin | # Population | % Population | View All 0 Rows |
Sex and Age in Galway
Sex and Age in Galway
The most populous age groups in Galway are 35 to 39 Years (11 | 16.4%) for men and 65 to 69 Years (18 | 16.8%) for women.
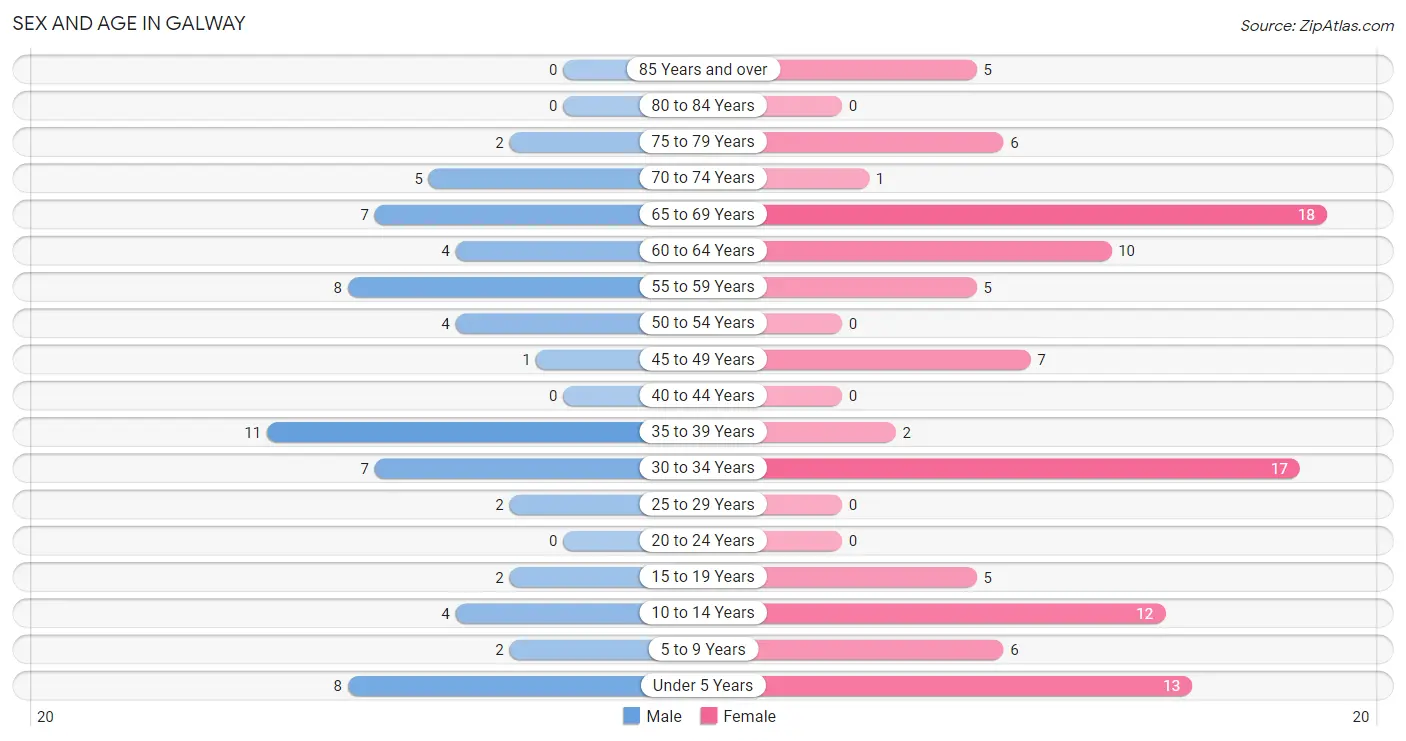
| Age Bracket | Male | Female |
| Under 5 Years | 8 (11.9%) | 13 (12.1%) |
| 5 to 9 Years | 2 (3.0%) | 6 (5.6%) |
| 10 to 14 Years | 4 (6.0%) | 12 (11.2%) |
| 15 to 19 Years | 2 (3.0%) | 5 (4.7%) |
| 20 to 24 Years | 0 (0.0%) | 0 (0.0%) |
| 25 to 29 Years | 2 (3.0%) | 0 (0.0%) |
| 30 to 34 Years | 7 (10.4%) | 17 (15.9%) |
| 35 to 39 Years | 11 (16.4%) | 2 (1.9%) |
| 40 to 44 Years | 0 (0.0%) | 0 (0.0%) |
| 45 to 49 Years | 1 (1.5%) | 7 (6.5%) |
| 50 to 54 Years | 4 (6.0%) | 0 (0.0%) |
| 55 to 59 Years | 8 (11.9%) | 5 (4.7%) |
| 60 to 64 Years | 4 (6.0%) | 10 (9.3%) |
| 65 to 69 Years | 7 (10.4%) | 18 (16.8%) |
| 70 to 74 Years | 5 (7.5%) | 1 (0.9%) |
| 75 to 79 Years | 2 (3.0%) | 6 (5.6%) |
| 80 to 84 Years | 0 (0.0%) | 0 (0.0%) |
| 85 Years and over | 0 (0.0%) | 5 (4.7%) |
| Total | 67 (100.0%) | 107 (100.0%) |
Families and Households in Galway
Median Family Size in Galway
The median family size in Galway is 3.02 persons per family, with single male/father families (1 | 2.1%) accounting for the largest median family size of 8 persons per family. On the other hand, married-couple families (27 | 56.2%) represent the smallest median family size with 2.89 persons per family.
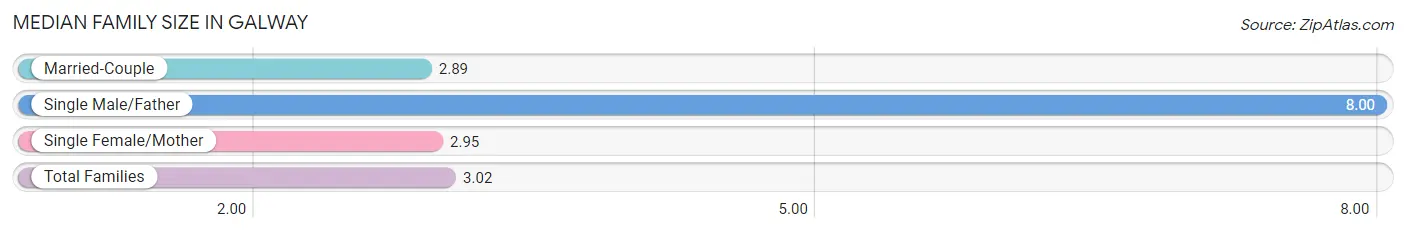
| Family Type | # Families | Family Size |
| Married-Couple | 27 (56.2%) | 2.89 |
| Single Male/Father | 1 (2.1%) | 8.00 |
| Single Female/Mother | 20 (41.7%) | 2.95 |
| Total Families | 48 (100.0%) | 3.02 |
Median Household Size in Galway
The median household size in Galway is 2.35 persons per household, with single male/father households (1 | 1.3%) accounting for the largest median household size of 8 persons per household. non-family households (26 | 35.1%) represent the smallest median household size with 1.12 persons per household.
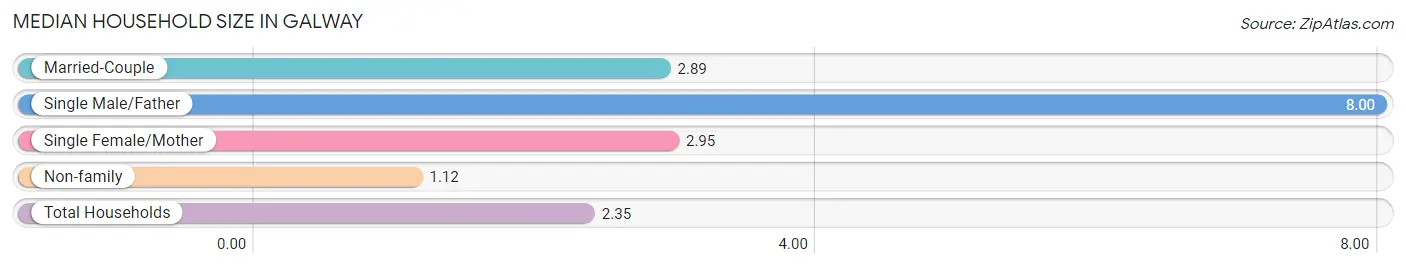
| Household Type | # Households | Household Size |
| Married-Couple | 27 (36.5%) | 2.89 |
| Single Male/Father | 1 (1.3%) | 8.00 |
| Single Female/Mother | 20 (27.0%) | 2.95 |
| Non-family | 26 (35.1%) | 1.12 |
| Total Households | 74 (100.0%) | 2.35 |
Household Size by Marriage Status in Galway
Out of a total of 74 households in Galway, 48 (64.9%) are family households, while 26 (35.1%) are nonfamily households. The most numerous type of family households are 2-person households, comprising 27, and the most common type of nonfamily households are 1-person households, comprising 23.
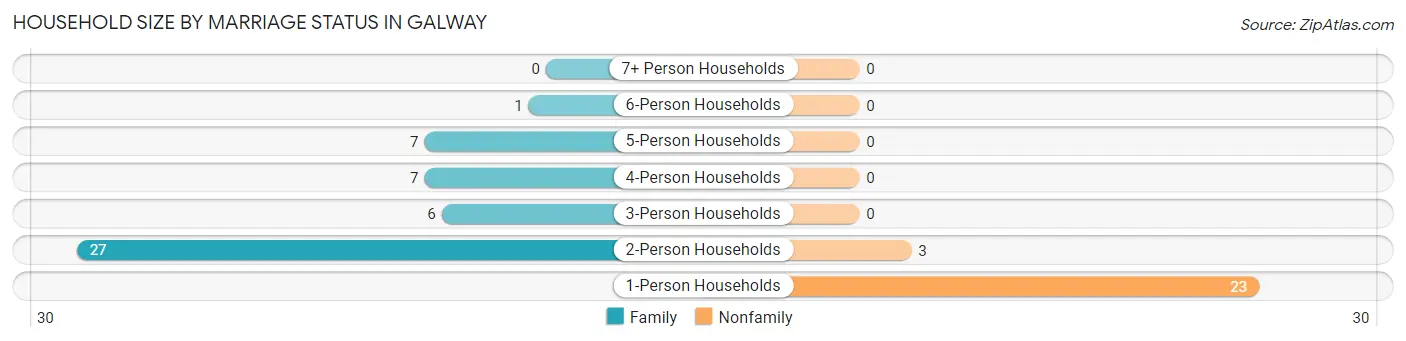
| Household Size | Family Households | Nonfamily Households |
| 1-Person Households | - | 23 (31.1%) |
| 2-Person Households | 27 (36.5%) | 3 (4.1%) |
| 3-Person Households | 6 (8.1%) | 0 (0.0%) |
| 4-Person Households | 7 (9.5%) | 0 (0.0%) |
| 5-Person Households | 7 (9.5%) | 0 (0.0%) |
| 6-Person Households | 1 (1.3%) | 0 (0.0%) |
| 7+ Person Households | 0 (0.0%) | 0 (0.0%) |
| Total | 48 (64.9%) | 26 (35.1%) |
Female Fertility in Galway
Fertility by Age in Galway
Average fertility rate in Galway is 65.0 births per 1,000 women. Women in the age bracket of 20 to 34 years have the highest fertility rate with 118.0 births per 1,000 women. Women in the age bracket of 20 to 34 years acount for 100.0% of all women with births.
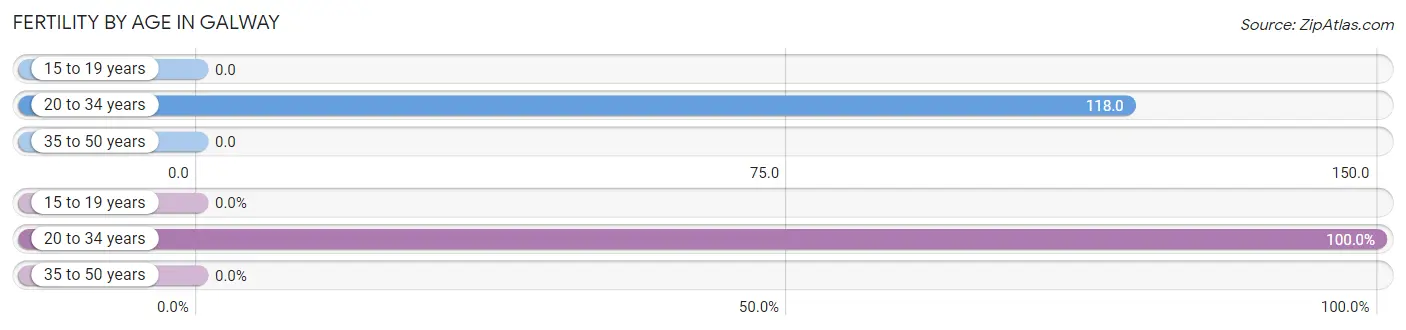
| Age Bracket | Women with Births | Births / 1,000 Women |
| 15 to 19 years | 0 (0.0%) | 0.0 |
| 20 to 34 years | 2 (100.0%) | 118.0 |
| 35 to 50 years | 0 (0.0%) | 0.0 |
| Total | 2 (100.0%) | 65.0 |
Fertility by Age by Marriage Status in Galway
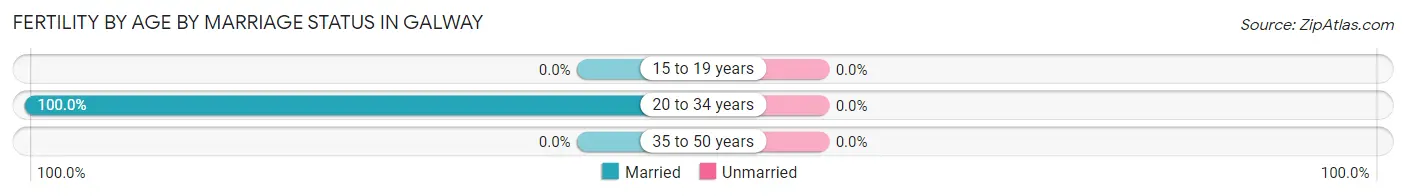
| Age Bracket | Married | Unmarried |
| 15 to 19 years | 0 (0.0%) | 0 (0.0%) |
| 20 to 34 years | 2 (100.0%) | 0 (0.0%) |
| 35 to 50 years | 0 (0.0%) | 0 (0.0%) |
| Total | 2 (100.0%) | 0 (0.0%) |
Fertility by Education in Galway
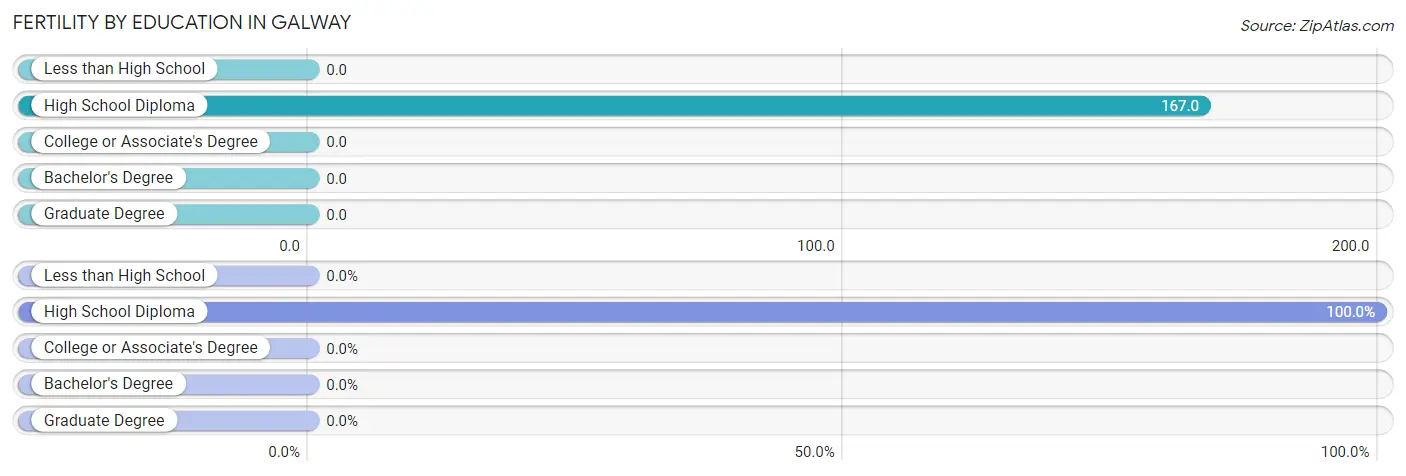
| Educational Attainment | Women with Births | Births / 1,000 Women |
| Less than High School | 0 (0.0%) | 0.0 |
| High School Diploma | 2 (100.0%) | 167.0 |
| College or Associate's Degree | 0 (0.0%) | 0.0 |
| Bachelor's Degree | 0 (0.0%) | 0.0 |
| Graduate Degree | 0 (0.0%) | 0.0 |
| Total | 2 (100.0%) | 65.0 |
Fertility by Education by Marriage Status in Galway
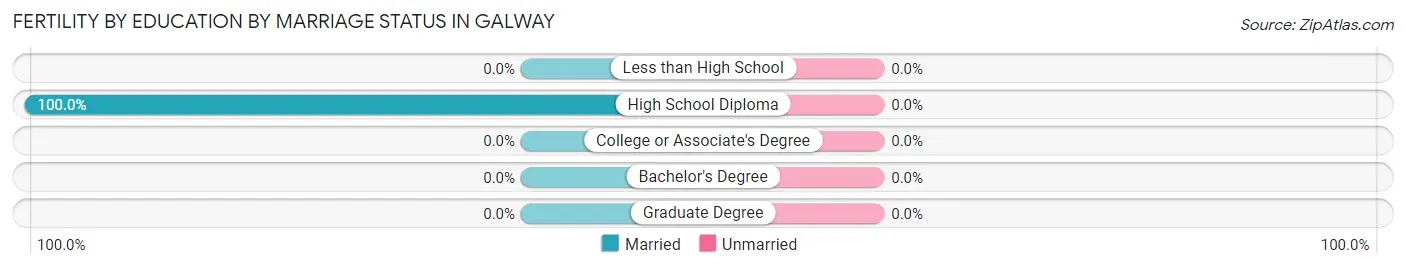
| Educational Attainment | Married | Unmarried |
| Less than High School | 0 (0.0%) | 0 (0.0%) |
| High School Diploma | 2 (100.0%) | 0 (0.0%) |
| College or Associate's Degree | 0 (0.0%) | 0 (0.0%) |
| Bachelor's Degree | 0 (0.0%) | 0 (0.0%) |
| Graduate Degree | 0 (0.0%) | 0 (0.0%) |
| Total | 2 (100.0%) | 0 (0.0%) |
Employment Characteristics in Galway
Employment by Class of Employer in Galway
Among the 73 employed individuals in Galway, private company employees (23 | 31.5%), local government employees (18 | 24.7%), and self-employed (not incorporated) (14 | 19.2%) make up the most common classes of employment.
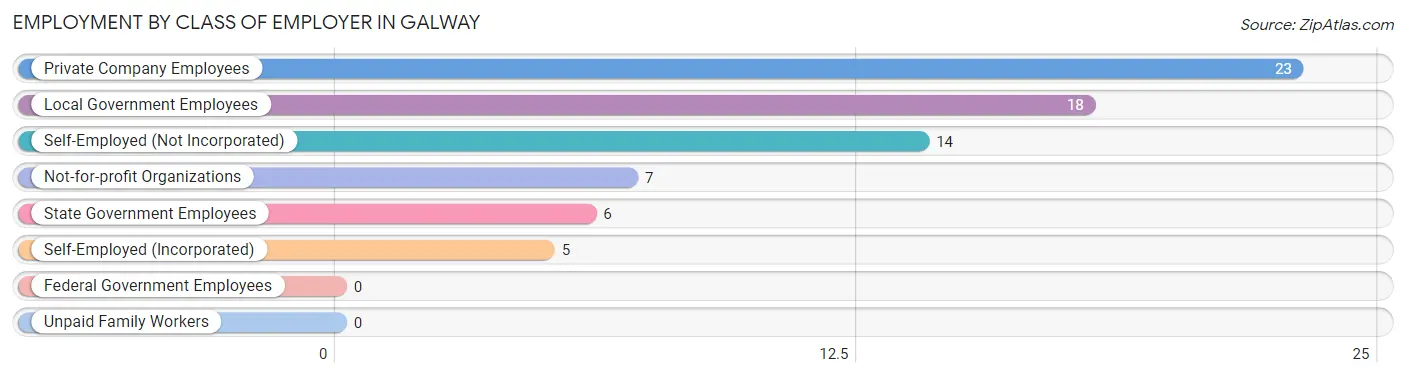
| Employer Class | # Employees | % Employees |
| Private Company Employees | 23 | 31.5% |
| Self-Employed (Incorporated) | 5 | 6.9% |
| Self-Employed (Not Incorporated) | 14 | 19.2% |
| Not-for-profit Organizations | 7 | 9.6% |
| Local Government Employees | 18 | 24.7% |
| State Government Employees | 6 | 8.2% |
| Federal Government Employees | 0 | 0.0% |
| Unpaid Family Workers | 0 | 0.0% |
| Total | 73 | 100.0% |
Employment Status by Age in Galway
According to the labor force statistics for Galway, out of the total population over 16 years of age (125), 60.0% or 75 individuals are in the labor force, with 2.7% or 2 of them unemployed. The age group with the highest labor force participation rate is 25 to 29 years, with 100.0% or 2 individuals in the labor force. Within the labor force, the 30 to 34 years age range has the highest percentage of unemployed individuals, with 28.6% or 2 of them being unemployed.
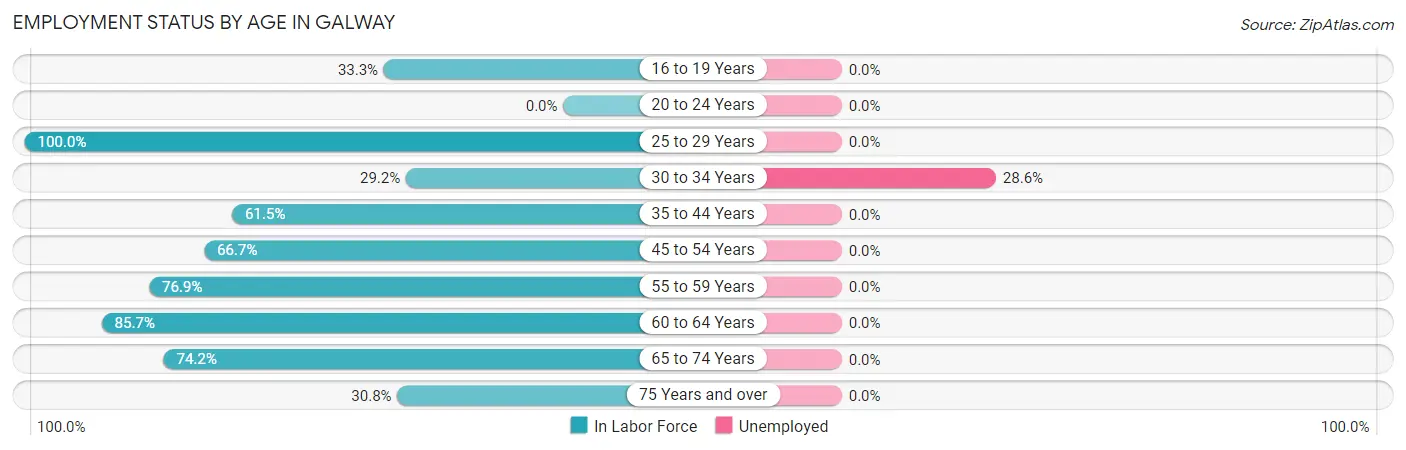
| Age Bracket | In Labor Force | Unemployed |
| 16 to 19 Years | 1 (33.3%) | 0 (0.0%) |
| 20 to 24 Years | 0 (0.0%) | 0 (0.0%) |
| 25 to 29 Years | 2 (100.0%) | 0 (0.0%) |
| 30 to 34 Years | 7 (29.2%) | 2 (28.6%) |
| 35 to 44 Years | 8 (61.5%) | 0 (0.0%) |
| 45 to 54 Years | 8 (66.7%) | 0 (0.0%) |
| 55 to 59 Years | 10 (76.9%) | 0 (0.0%) |
| 60 to 64 Years | 12 (85.7%) | 0 (0.0%) |
| 65 to 74 Years | 23 (74.2%) | 0 (0.0%) |
| 75 Years and over | 4 (30.8%) | 0 (0.0%) |
| Total | 75 (60.0%) | 2 (2.7%) |
Employment Status by Educational Attainment in Galway
According to labor force statistics for Galway, 60.3% of individuals (47) out of the total population between 25 and 64 years of age (78) are in the labor force, with 4.3% or 2 of them being unemployed. The group with the highest labor force participation rate are those with the educational attainment of bachelor's degree or higher, with 80.0% or 16 individuals in the labor force. Within the labor force, individuals with college / associate degree education have the highest percentage of unemployment, with 10.5% or 2 of them being unemployed.
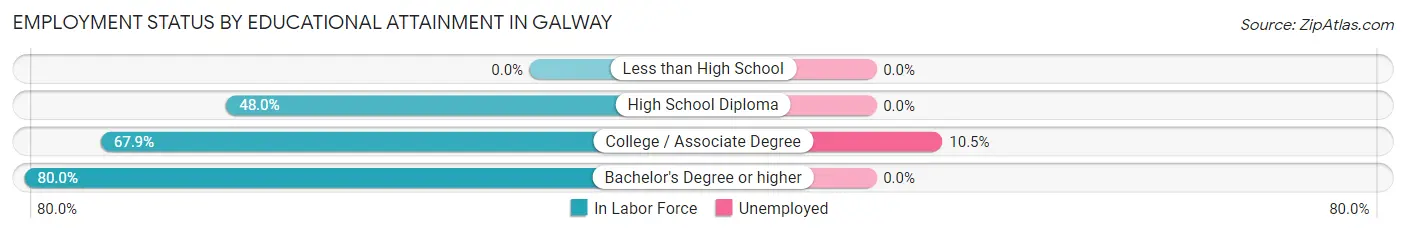
| Educational Attainment | In Labor Force | Unemployed |
| Less than High School | 0 (0.0%) | 0 (0.0%) |
| High School Diploma | 12 (48.0%) | 0 (0.0%) |
| College / Associate Degree | 19 (67.9%) | 3 (10.5%) |
| Bachelor's Degree or higher | 16 (80.0%) | 0 (0.0%) |
| Total | 47 (60.3%) | 3 (4.3%) |
Employment Occupations by Sex in Galway
Management, Business, Science and Arts Occupations
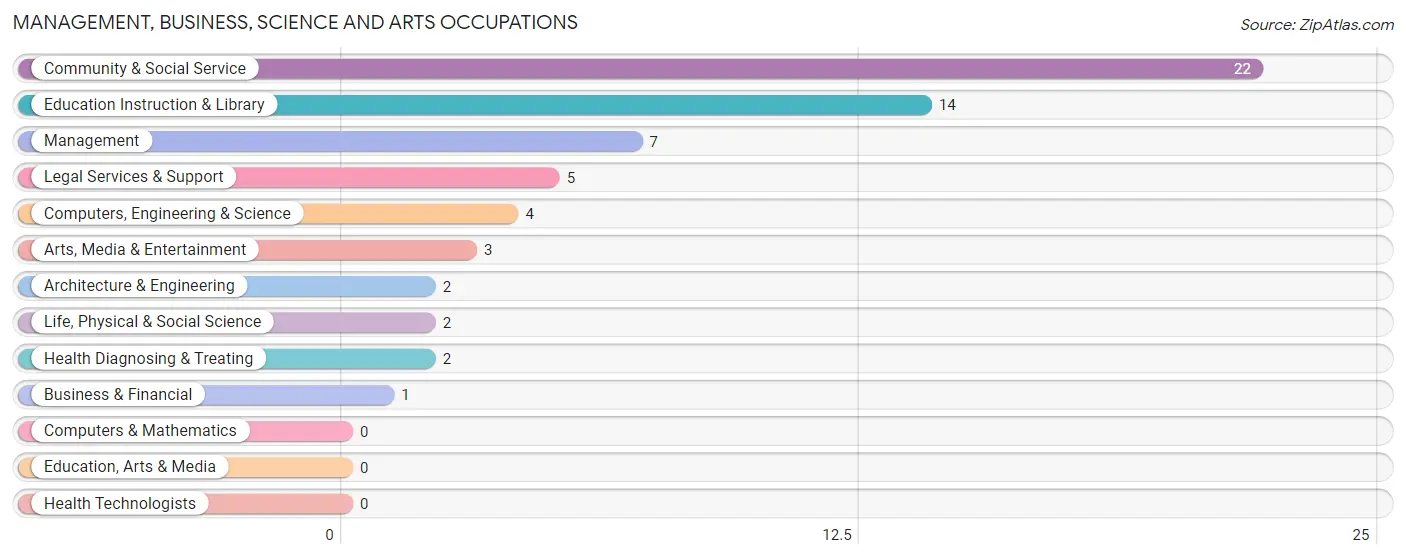
The most common Management, Business, Science and Arts occupations in Galway are Community & Social Service (22 | 30.1%), Education Instruction & Library (14 | 19.2%), Management (7 | 9.6%), Legal Services & Support (5 | 6.9%), and Computers, Engineering & Science (4 | 5.5%).
Management, Business, Science and Arts Occupations by Sex
Within the Management, Business, Science and Arts occupations in Galway, the most male-oriented occupations are Life, Physical & Social Science (100.0%), Legal Services & Support (100.0%), and Arts, Media & Entertainment (100.0%), while the most female-oriented occupations are Business & Financial (100.0%), Architecture & Engineering (100.0%), and Education Instruction & Library (100.0%).
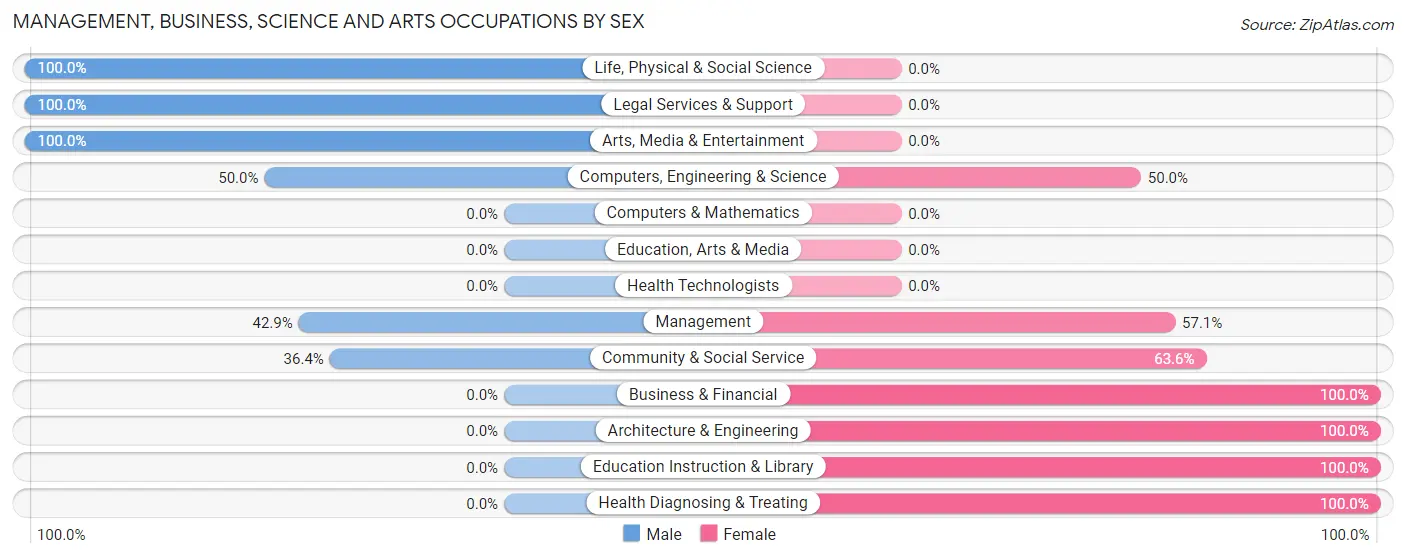
| Occupation | Male | Female |
| Management | 3 (42.9%) | 4 (57.1%) |
| Business & Financial | 0 (0.0%) | 1 (100.0%) |
| Computers, Engineering & Science | 2 (50.0%) | 2 (50.0%) |
| Computers & Mathematics | 0 (0.0%) | 0 (0.0%) |
| Architecture & Engineering | 0 (0.0%) | 2 (100.0%) |
| Life, Physical & Social Science | 2 (100.0%) | 0 (0.0%) |
| Community & Social Service | 8 (36.4%) | 14 (63.6%) |
| Education, Arts & Media | 0 (0.0%) | 0 (0.0%) |
| Legal Services & Support | 5 (100.0%) | 0 (0.0%) |
| Education Instruction & Library | 0 (0.0%) | 14 (100.0%) |
| Arts, Media & Entertainment | 3 (100.0%) | 0 (0.0%) |
| Health Diagnosing & Treating | 0 (0.0%) | 2 (100.0%) |
| Health Technologists | 0 (0.0%) | 0 (0.0%) |
| Total (Category) | 13 (36.1%) | 23 (63.9%) |
| Total (Overall) | 35 (47.9%) | 38 (52.0%) |
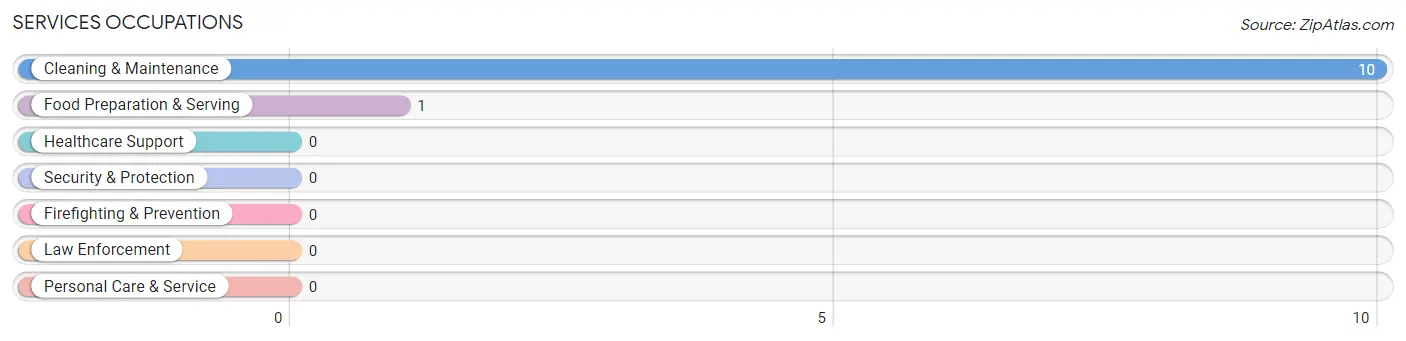
Services Occupations
The most common Services occupations in Galway are Cleaning & Maintenance (10 | 13.7%), and Food Preparation & Serving (1 | 1.4%).
Services Occupations by Sex
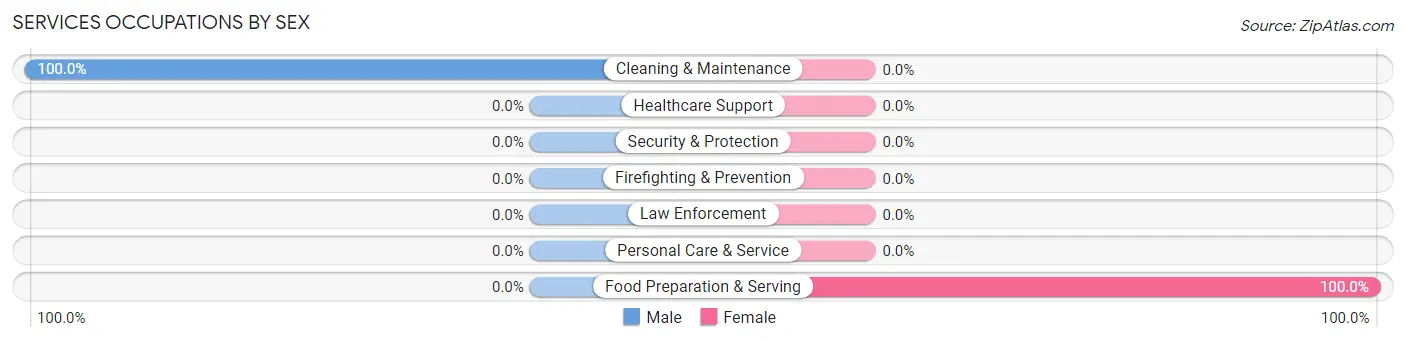
| Occupation | Male | Female |
| Healthcare Support | 0 (0.0%) | 0 (0.0%) |
| Security & Protection | 0 (0.0%) | 0 (0.0%) |
| Firefighting & Prevention | 0 (0.0%) | 0 (0.0%) |
| Law Enforcement | 0 (0.0%) | 0 (0.0%) |
| Food Preparation & Serving | 0 (0.0%) | 1 (100.0%) |
| Cleaning & Maintenance | 10 (100.0%) | 0 (0.0%) |
| Personal Care & Service | 0 (0.0%) | 0 (0.0%) |
| Total (Category) | 10 (90.9%) | 1 (9.1%) |
| Total (Overall) | 35 (47.9%) | 38 (52.0%) |
Sales and Office Occupations
The most common Sales and Office occupations in Galway are , and Office & Administration (13 | 17.8%).

Sales and Office Occupations by Sex

| Occupation | Male | Female |
| Sales & Related | 0 (0.0%) | 0 (0.0%) |
| Office & Administration | 2 (15.4%) | 11 (84.6%) |
| Total (Category) | 2 (15.4%) | 11 (84.6%) |
| Total (Overall) | 35 (47.9%) | 38 (52.0%) |
Natural Resources, Construction and Maintenance Occupations
The most common Natural Resources, Construction and Maintenance occupations in Galway are , and Installation, Maintenance & Repair (2 | 2.7%).
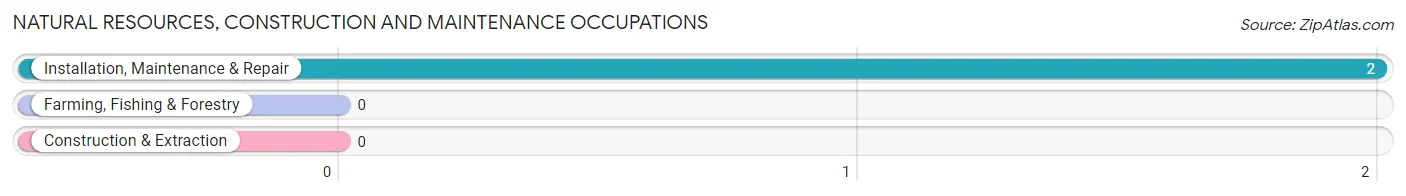
Natural Resources, Construction and Maintenance Occupations by Sex
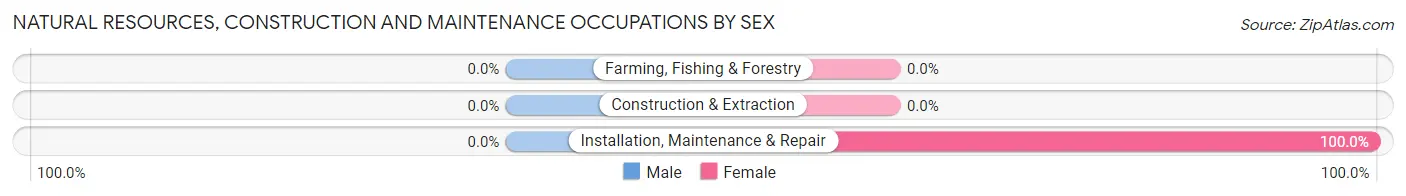
| Occupation | Male | Female |
| Farming, Fishing & Forestry | 0 (0.0%) | 0 (0.0%) |
| Construction & Extraction | 0 (0.0%) | 0 (0.0%) |
| Installation, Maintenance & Repair | 0 (0.0%) | 2 (100.0%) |
| Total (Category) | 0 (0.0%) | 2 (100.0%) |
| Total (Overall) | 35 (47.9%) | 38 (52.0%) |
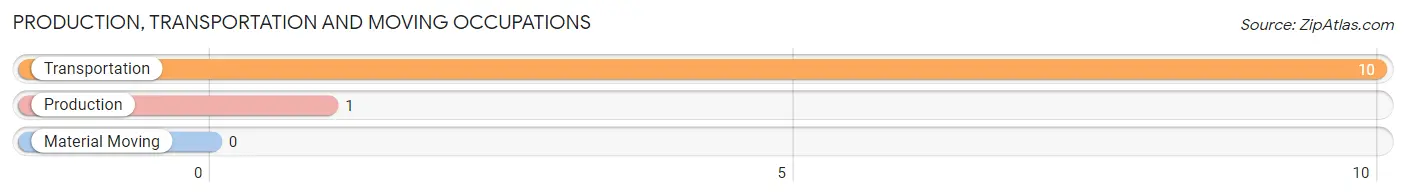
Production, Transportation and Moving Occupations
The most common Production, Transportation and Moving occupations in Galway are Transportation (10 | 13.7%), and Production (1 | 1.4%).
Production, Transportation and Moving Occupations by Sex
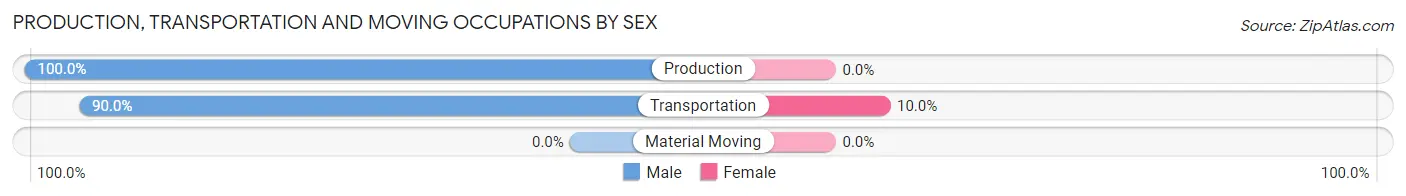
| Occupation | Male | Female |
| Production | 1 (100.0%) | 0 (0.0%) |
| Transportation | 9 (90.0%) | 1 (10.0%) |
| Material Moving | 0 (0.0%) | 0 (0.0%) |
| Total (Category) | 10 (90.9%) | 1 (9.1%) |
| Total (Overall) | 35 (47.9%) | 38 (52.0%) |
Employment Industries by Sex in Galway
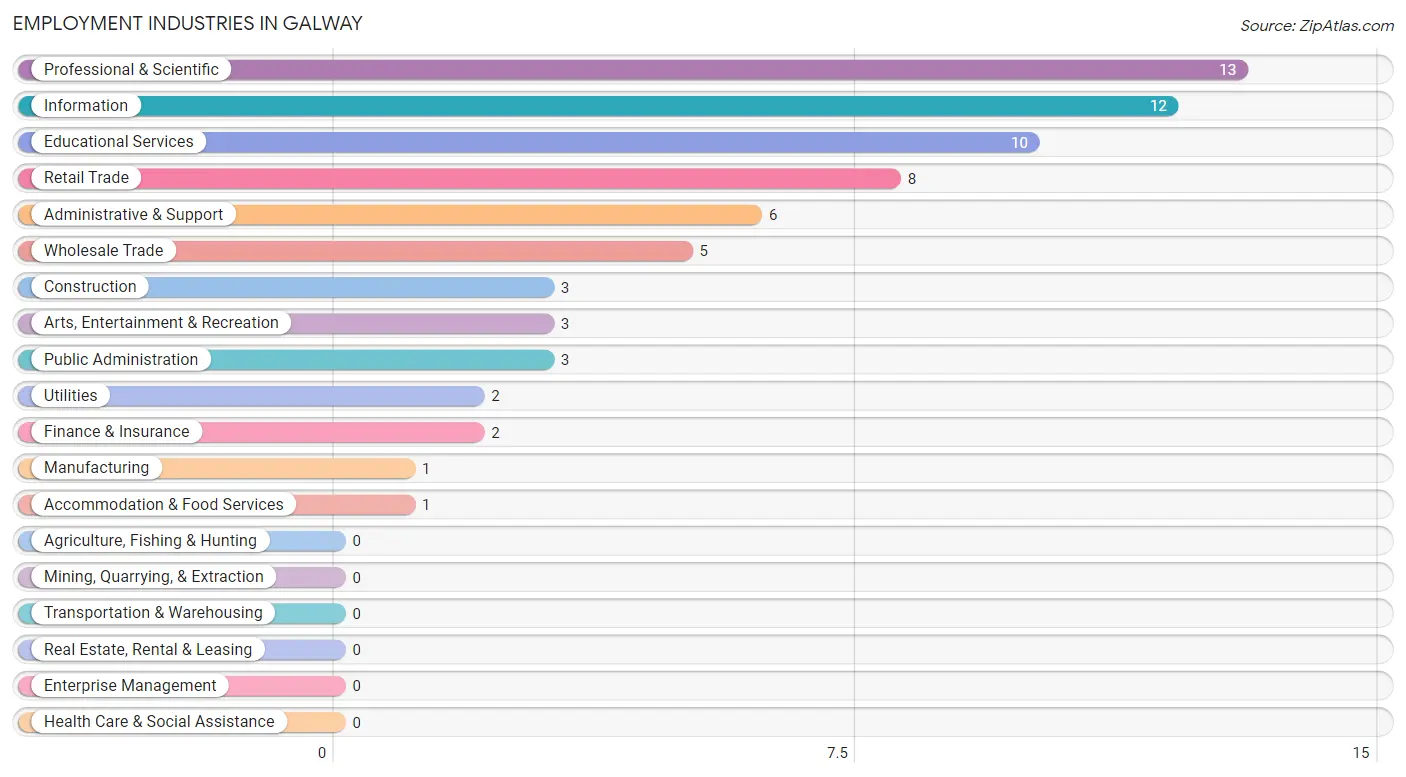
Employment Industries in Galway
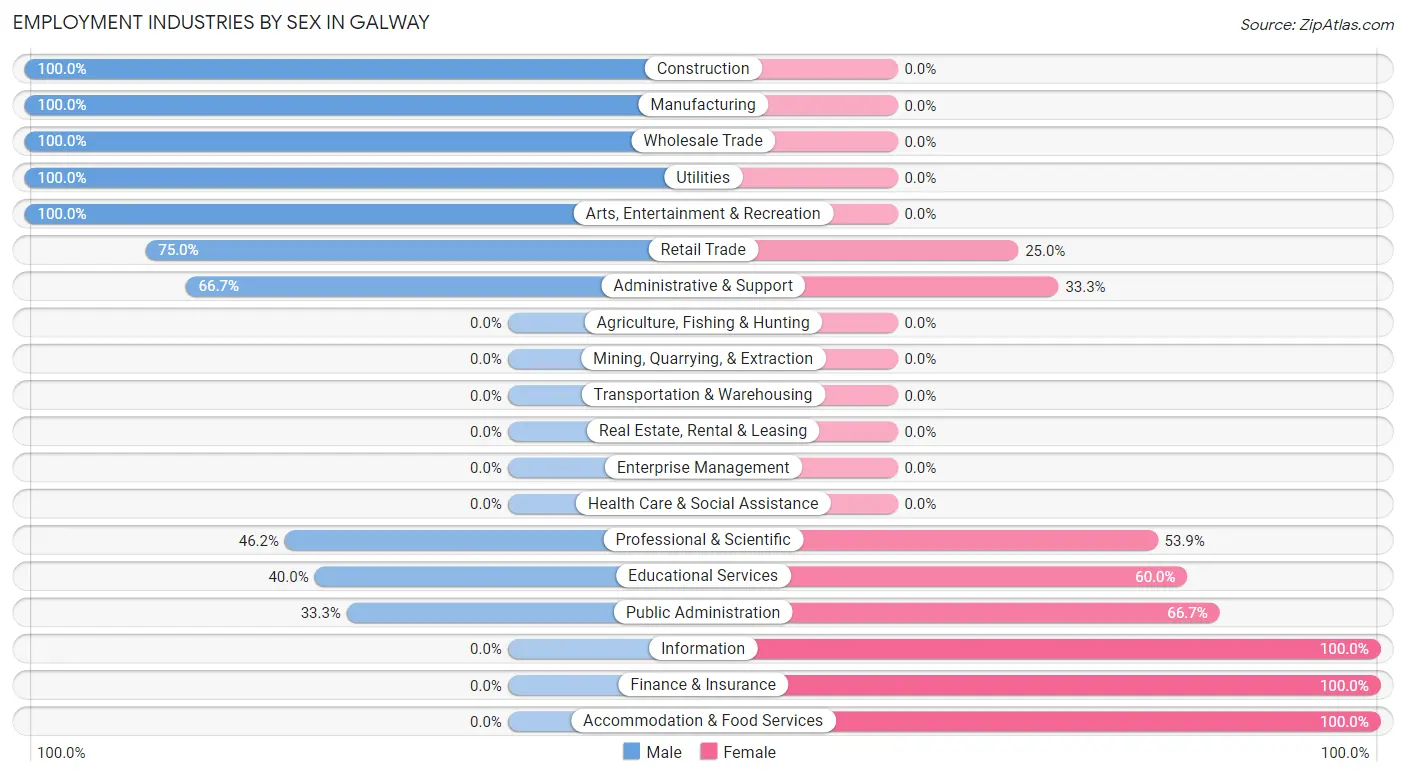
The major employment industries in Galway include Professional & Scientific (13 | 17.8%), Information (12 | 16.4%), Educational Services (10 | 13.7%), Retail Trade (8 | 11.0%), and Administrative & Support (6 | 8.2%).
Employment Industries by Sex in Galway
The Galway industries that see more men than women are Construction (100.0%), Manufacturing (100.0%), and Wholesale Trade (100.0%), whereas the industries that tend to have a higher number of women are Information (100.0%), Finance & Insurance (100.0%), and Accommodation & Food Services (100.0%).
| Industry | Male | Female |
| Agriculture, Fishing & Hunting | 0 (0.0%) | 0 (0.0%) |
| Mining, Quarrying, & Extraction | 0 (0.0%) | 0 (0.0%) |
| Construction | 3 (100.0%) | 0 (0.0%) |
| Manufacturing | 1 (100.0%) | 0 (0.0%) |
| Wholesale Trade | 5 (100.0%) | 0 (0.0%) |
| Retail Trade | 6 (75.0%) | 2 (25.0%) |
| Transportation & Warehousing | 0 (0.0%) | 0 (0.0%) |
| Utilities | 2 (100.0%) | 0 (0.0%) |
| Information | 0 (0.0%) | 12 (100.0%) |
| Finance & Insurance | 0 (0.0%) | 2 (100.0%) |
| Real Estate, Rental & Leasing | 0 (0.0%) | 0 (0.0%) |
| Professional & Scientific | 6 (46.2%) | 7 (53.8%) |
| Enterprise Management | 0 (0.0%) | 0 (0.0%) |
| Administrative & Support | 4 (66.7%) | 2 (33.3%) |
| Educational Services | 4 (40.0%) | 6 (60.0%) |
| Health Care & Social Assistance | 0 (0.0%) | 0 (0.0%) |
| Arts, Entertainment & Recreation | 3 (100.0%) | 0 (0.0%) |
| Accommodation & Food Services | 0 (0.0%) | 1 (100.0%) |
| Public Administration | 1 (33.3%) | 2 (66.7%) |
| Total | 35 (47.9%) | 38 (52.0%) |
Education in Galway
School Enrollment in Galway
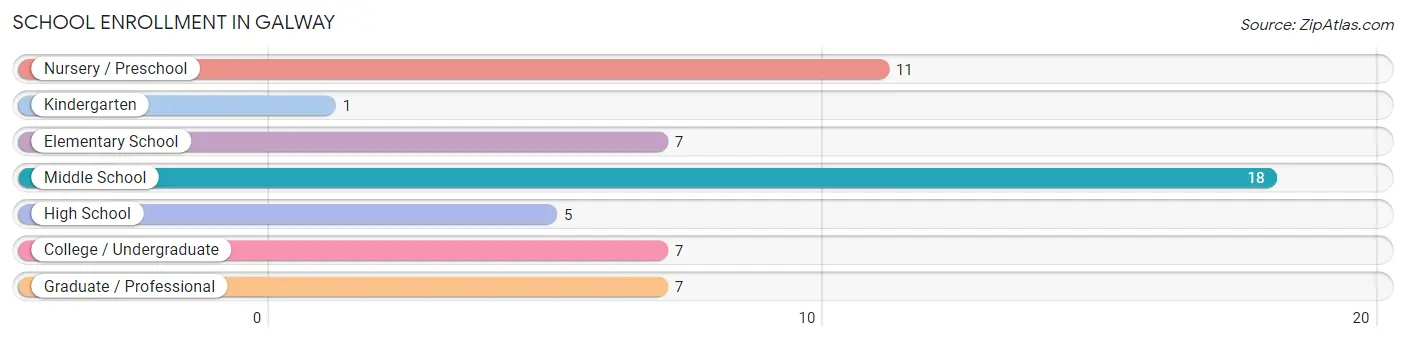
The most common levels of schooling among the 56 students in Galway are middle school (18 | 32.1%), nursery / preschool (11 | 19.6%), and elementary school (7 | 12.5%).
| School Level | # Students | % Students |
| Nursery / Preschool | 11 | 19.6% |
| Kindergarten | 1 | 1.8% |
| Elementary School | 7 | 12.5% |
| Middle School | 18 | 32.1% |
| High School | 5 | 8.9% |
| College / Undergraduate | 7 | 12.5% |
| Graduate / Professional | 7 | 12.5% |
| Total | 56 | 100.0% |
School Enrollment by Age by Funding Source in Galway
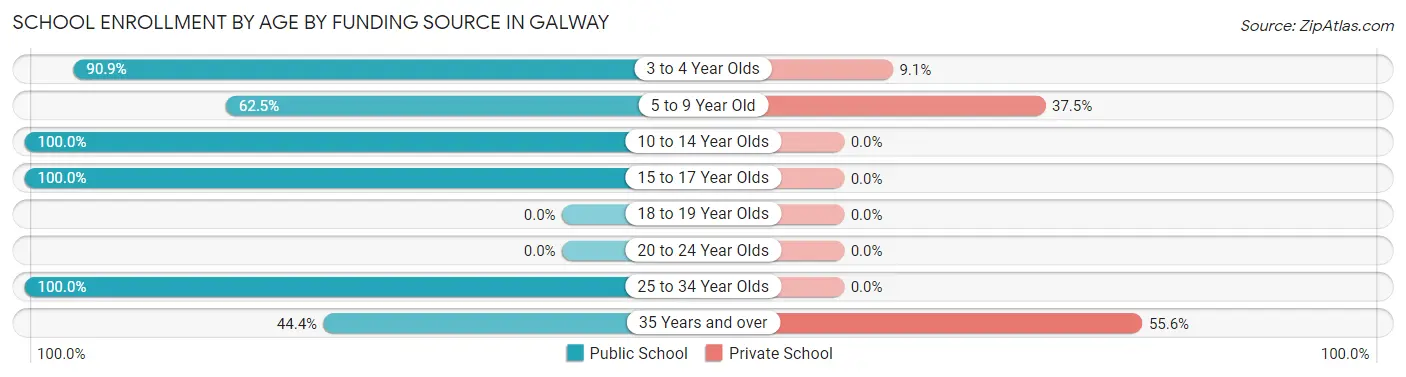
Out of a total of 56 students who are enrolled in schools in Galway, 9 (16.1%) attend a private institution, while the remaining 47 (83.9%) are enrolled in public schools. The age group of 35 years and over has the highest likelihood of being enrolled in private schools, with 5 (55.6% in the age bracket) enrolled. Conversely, the age group of 10 to 14 year olds has the lowest likelihood of being enrolled in a private school, with 16 (100.0% in the age bracket) attending a public institution.
| Age Bracket | Public School | Private School |
| 3 to 4 Year Olds | 10 (90.9%) | 1 (9.1%) |
| 5 to 9 Year Old | 5 (62.5%) | 3 (37.5%) |
| 10 to 14 Year Olds | 16 (100.0%) | 0 (0.0%) |
| 15 to 17 Year Olds | 7 (100.0%) | 0 (0.0%) |
| 18 to 19 Year Olds | 0 (0.0%) | 0 (0.0%) |
| 20 to 24 Year Olds | 0 (0.0%) | 0 (0.0%) |
| 25 to 34 Year Olds | 5 (100.0%) | 0 (0.0%) |
| 35 Years and over | 4 (44.4%) | 5 (55.6%) |
| Total | 47 (83.9%) | 9 (16.1%) |
Educational Attainment by Field of Study in Galway
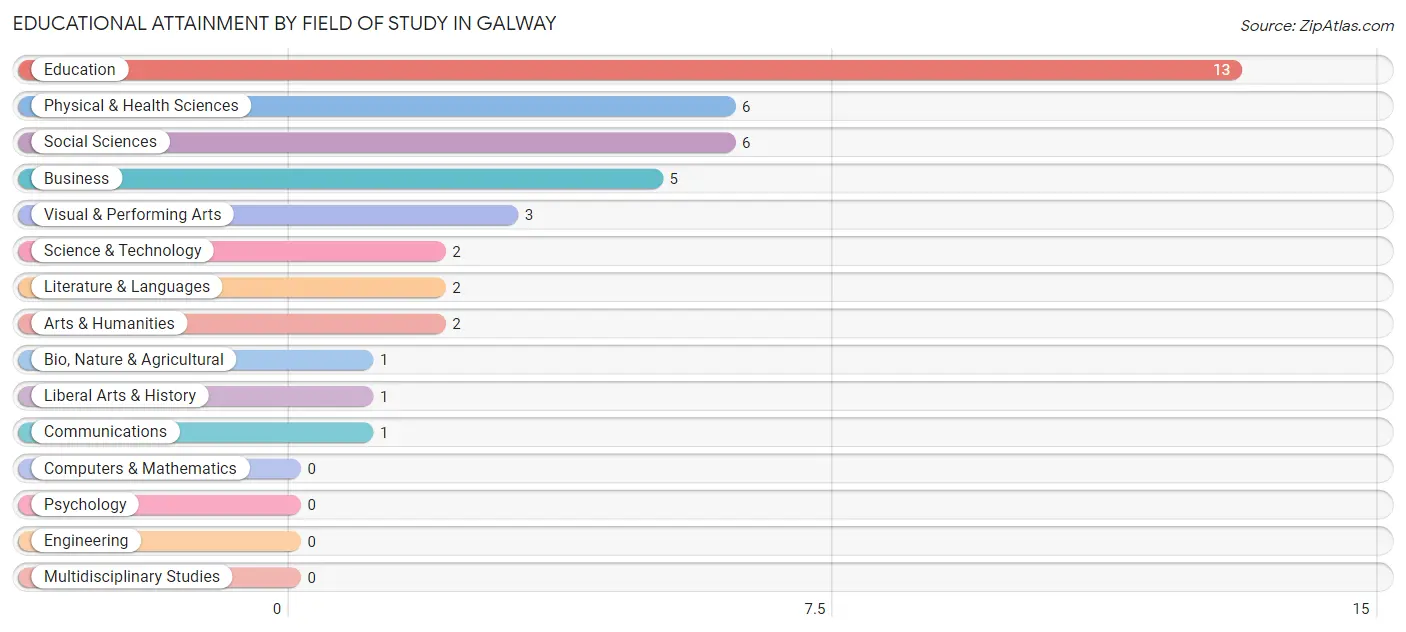
Education (13 | 30.9%), physical & health sciences (6 | 14.3%), social sciences (6 | 14.3%), business (5 | 11.9%), and visual & performing arts (3 | 7.1%) are the most common fields of study among 42 individuals in Galway who have obtained a bachelor's degree or higher.
| Field of Study | # Graduates | % Graduates |
| Computers & Mathematics | 0 | 0.0% |
| Bio, Nature & Agricultural | 1 | 2.4% |
| Physical & Health Sciences | 6 | 14.3% |
| Psychology | 0 | 0.0% |
| Social Sciences | 6 | 14.3% |
| Engineering | 0 | 0.0% |
| Multidisciplinary Studies | 0 | 0.0% |
| Science & Technology | 2 | 4.8% |
| Business | 5 | 11.9% |
| Education | 13 | 30.9% |
| Literature & Languages | 2 | 4.8% |
| Liberal Arts & History | 1 | 2.4% |
| Visual & Performing Arts | 3 | 7.1% |
| Communications | 1 | 2.4% |
| Arts & Humanities | 2 | 4.8% |
| Total | 42 | 100.0% |
Transportation & Commute in Galway
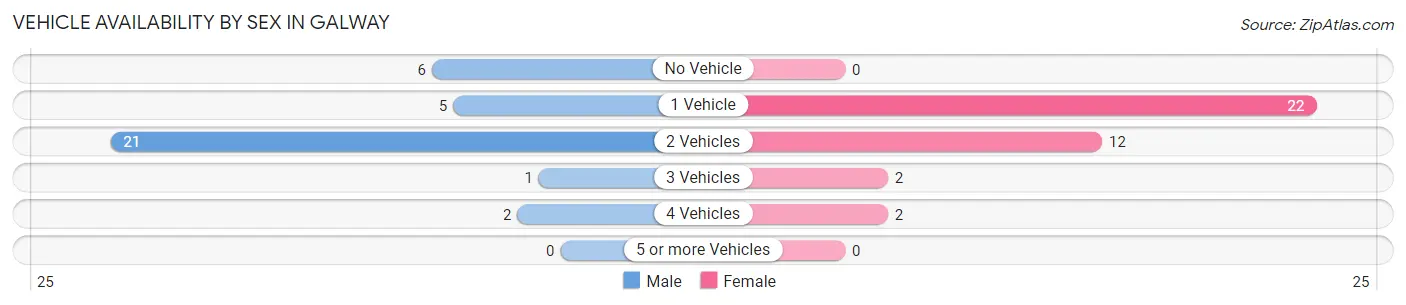
Vehicle Availability by Sex in Galway
The most prevalent vehicle ownership categories in Galway are males with 2 vehicles (21, accounting for 60.0%) and females with 2 vehicles (12, making up 55.3%).
| Vehicles Available | Male | Female |
| No Vehicle | 6 (17.1%) | 0 (0.0%) |
| 1 Vehicle | 5 (14.3%) | 22 (57.9%) |
| 2 Vehicles | 21 (60.0%) | 12 (31.6%) |
| 3 Vehicles | 1 (2.9%) | 2 (5.3%) |
| 4 Vehicles | 2 (5.7%) | 2 (5.3%) |
| 5 or more Vehicles | 0 (0.0%) | 0 (0.0%) |
| Total | 35 (100.0%) | 38 (100.0%) |
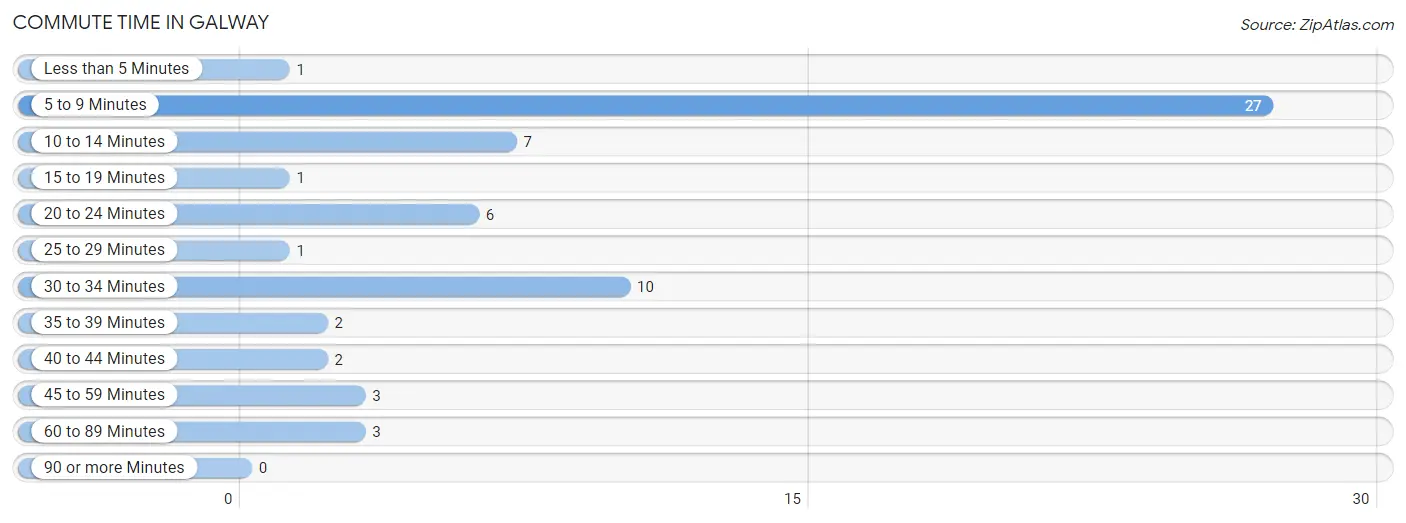
Commute Time in Galway
The most frequently occuring commute durations in Galway are 5 to 9 minutes (27 commuters, 42.9%), 30 to 34 minutes (10 commuters, 15.9%), and 10 to 14 minutes (7 commuters, 11.1%).
| Commute Time | # Commuters | % Commuters |
| Less than 5 Minutes | 1 | 1.6% |
| 5 to 9 Minutes | 27 | 42.9% |
| 10 to 14 Minutes | 7 | 11.1% |
| 15 to 19 Minutes | 1 | 1.6% |
| 20 to 24 Minutes | 6 | 9.5% |
| 25 to 29 Minutes | 1 | 1.6% |
| 30 to 34 Minutes | 10 | 15.9% |
| 35 to 39 Minutes | 2 | 3.2% |
| 40 to 44 Minutes | 2 | 3.2% |
| 45 to 59 Minutes | 3 | 4.8% |
| 60 to 89 Minutes | 3 | 4.8% |
| 90 or more Minutes | 0 | 0.0% |
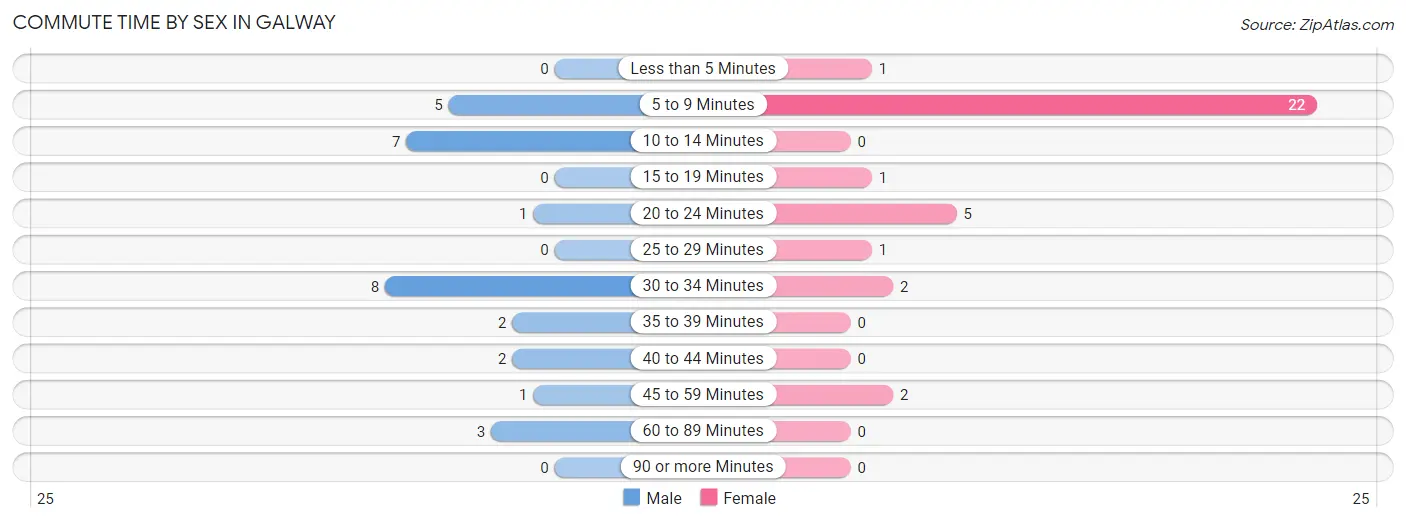
Commute Time by Sex in Galway
The most common commute times in Galway are 30 to 34 minutes (8 commuters, 27.6%) for males and 5 to 9 minutes (22 commuters, 64.7%) for females.
| Commute Time | Male | Female |
| Less than 5 Minutes | 0 (0.0%) | 1 (2.9%) |
| 5 to 9 Minutes | 5 (17.2%) | 22 (64.7%) |
| 10 to 14 Minutes | 7 (24.1%) | 0 (0.0%) |
| 15 to 19 Minutes | 0 (0.0%) | 1 (2.9%) |
| 20 to 24 Minutes | 1 (3.5%) | 5 (14.7%) |
| 25 to 29 Minutes | 0 (0.0%) | 1 (2.9%) |
| 30 to 34 Minutes | 8 (27.6%) | 2 (5.9%) |
| 35 to 39 Minutes | 2 (6.9%) | 0 (0.0%) |
| 40 to 44 Minutes | 2 (6.9%) | 0 (0.0%) |
| 45 to 59 Minutes | 1 (3.5%) | 2 (5.9%) |
| 60 to 89 Minutes | 3 (10.3%) | 0 (0.0%) |
| 90 or more Minutes | 0 (0.0%) | 0 (0.0%) |
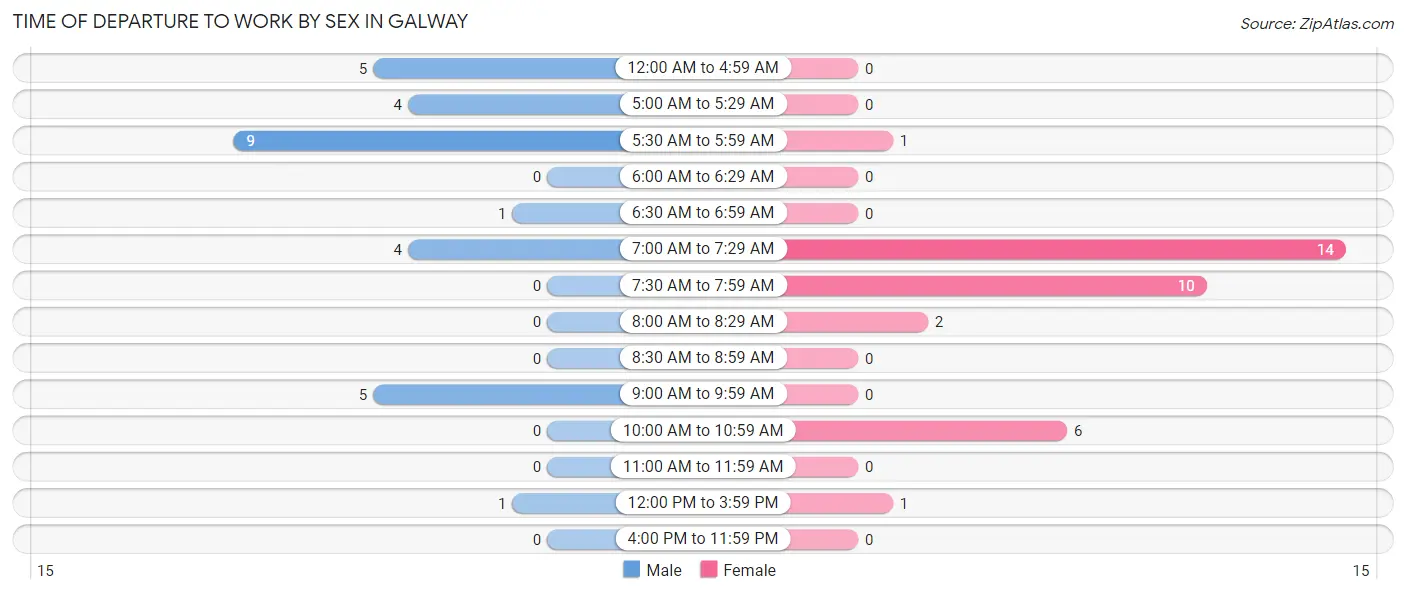
Time of Departure to Work by Sex in Galway
The most frequent times of departure to work in Galway are 5:30 AM to 5:59 AM (9, 31.0%) for males and 7:00 AM to 7:29 AM (14, 41.2%) for females.
| Time of Departure | Male | Female |
| 12:00 AM to 4:59 AM | 5 (17.2%) | 0 (0.0%) |
| 5:00 AM to 5:29 AM | 4 (13.8%) | 0 (0.0%) |
| 5:30 AM to 5:59 AM | 9 (31.0%) | 1 (2.9%) |
| 6:00 AM to 6:29 AM | 0 (0.0%) | 0 (0.0%) |
| 6:30 AM to 6:59 AM | 1 (3.5%) | 0 (0.0%) |
| 7:00 AM to 7:29 AM | 4 (13.8%) | 14 (41.2%) |
| 7:30 AM to 7:59 AM | 0 (0.0%) | 10 (29.4%) |
| 8:00 AM to 8:29 AM | 0 (0.0%) | 2 (5.9%) |
| 8:30 AM to 8:59 AM | 0 (0.0%) | 0 (0.0%) |
| 9:00 AM to 9:59 AM | 5 (17.2%) | 0 (0.0%) |
| 10:00 AM to 10:59 AM | 0 (0.0%) | 6 (17.6%) |
| 11:00 AM to 11:59 AM | 0 (0.0%) | 0 (0.0%) |
| 12:00 PM to 3:59 PM | 1 (3.5%) | 1 (2.9%) |
| 4:00 PM to 11:59 PM | 0 (0.0%) | 0 (0.0%) |
| Total | 29 (100.0%) | 34 (100.0%) |
Housing Occupancy in Galway
Occupancy by Ownership in Galway
Of the total 74 dwellings in Galway, owner-occupied units account for 37 (50.0%), while renter-occupied units make up 37 (50.0%).
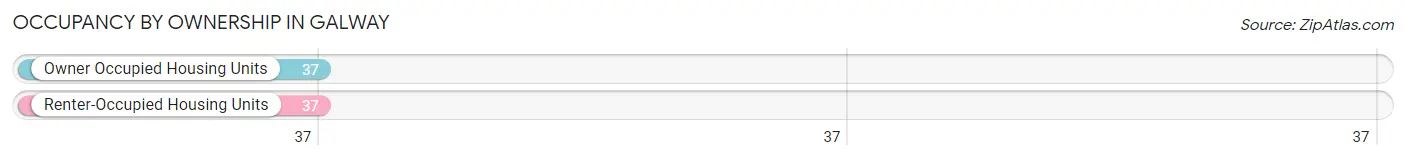
| Occupancy | # Housing Units | % Housing Units |
| Owner Occupied Housing Units | 37 | 50.0% |
| Renter-Occupied Housing Units | 37 | 50.0% |
| Total Occupied Housing Units | 74 | 100.0% |
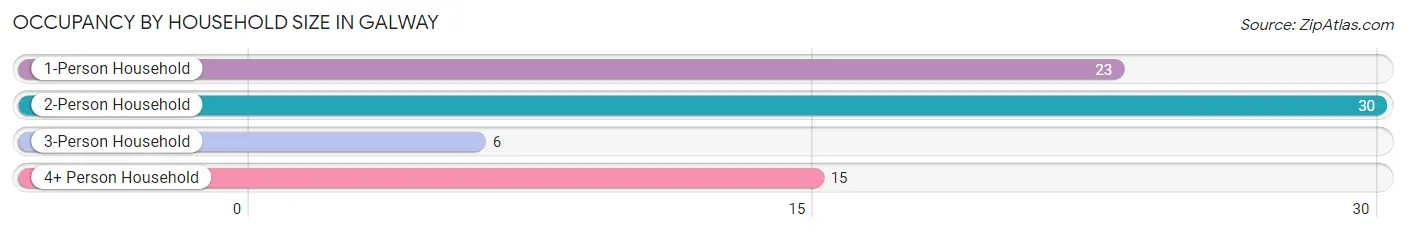
Occupancy by Household Size in Galway
| Household Size | # Housing Units | % Housing Units |
| 1-Person Household | 23 | 31.1% |
| 2-Person Household | 30 | 40.5% |
| 3-Person Household | 6 | 8.1% |
| 4+ Person Household | 15 | 20.3% |
| Total Housing Units | 74 | 100.0% |
Occupancy by Ownership by Household Size in Galway
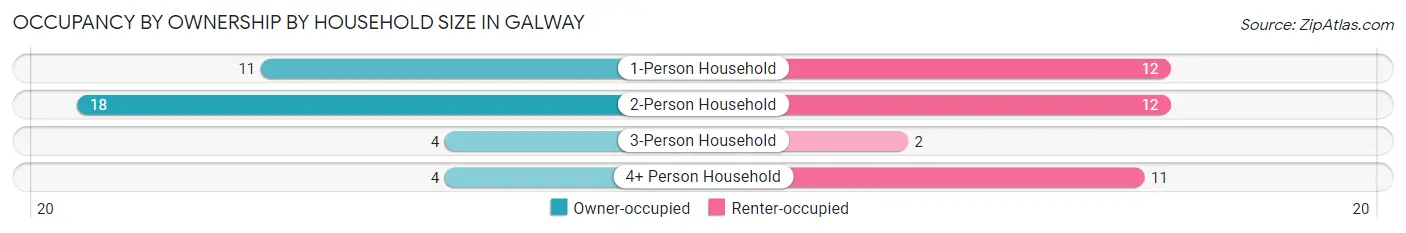
| Household Size | Owner-occupied | Renter-occupied |
| 1-Person Household | 11 (47.8%) | 12 (52.2%) |
| 2-Person Household | 18 (60.0%) | 12 (40.0%) |
| 3-Person Household | 4 (66.7%) | 2 (33.3%) |
| 4+ Person Household | 4 (26.7%) | 11 (73.3%) |
| Total Housing Units | 37 (50.0%) | 37 (50.0%) |
Occupancy by Educational Attainment in Galway
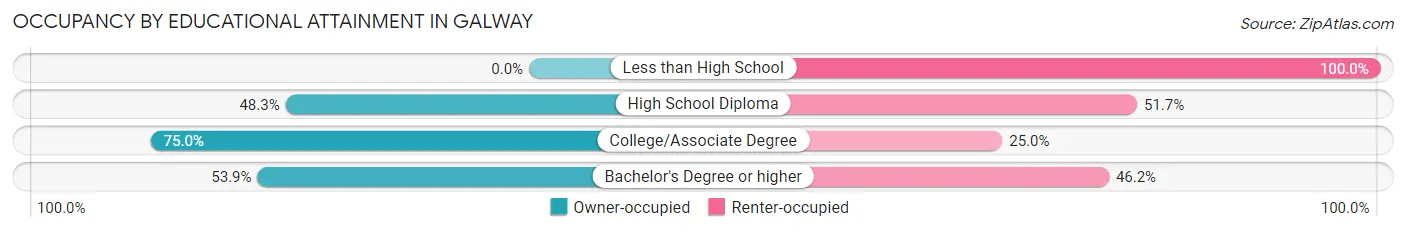
| Household Size | Owner-occupied | Renter-occupied |
| Less than High School | 0 (0.0%) | 7 (100.0%) |
| High School Diploma | 14 (48.3%) | 15 (51.7%) |
| College/Associate Degree | 9 (75.0%) | 3 (25.0%) |
| Bachelor's Degree or higher | 14 (53.8%) | 12 (46.2%) |
Occupancy by Age of Householder in Galway
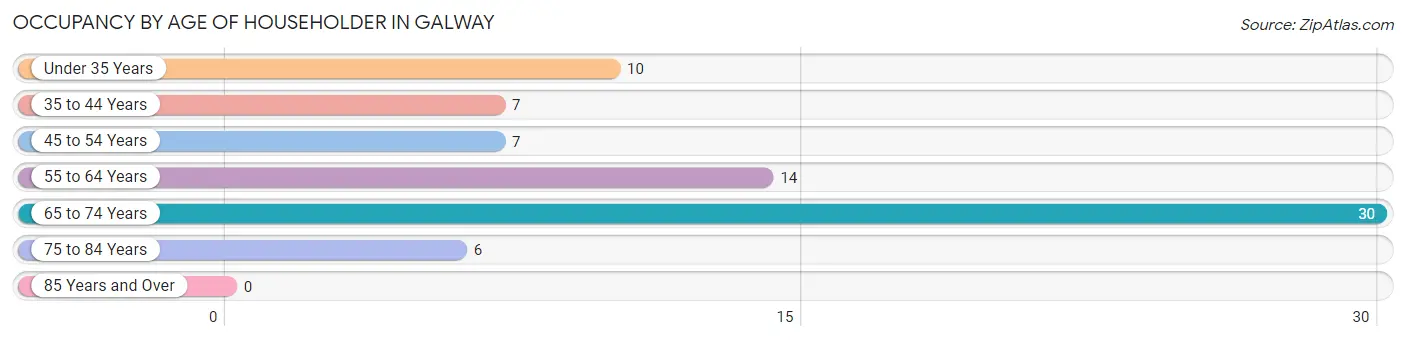
| Age Bracket | # Households | % Households |
| Under 35 Years | 10 | 13.5% |
| 35 to 44 Years | 7 | 9.5% |
| 45 to 54 Years | 7 | 9.5% |
| 55 to 64 Years | 14 | 18.9% |
| 65 to 74 Years | 30 | 40.5% |
| 75 to 84 Years | 6 | 8.1% |
| 85 Years and Over | 0 | 0.0% |
| Total | 74 | 100.0% |
Housing Finances in Galway
Median Income by Occupancy in Galway
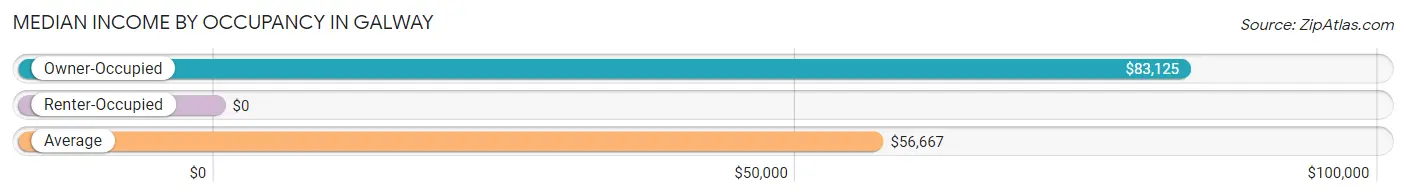
| Occupancy Type | # Households | Median Income |
| Owner-Occupied | 37 (50.0%) | $83,125 |
| Renter-Occupied | 37 (50.0%) | $0 |
| Average | 74 (100.0%) | $56,667 |
Occupancy by Householder Income Bracket in Galway
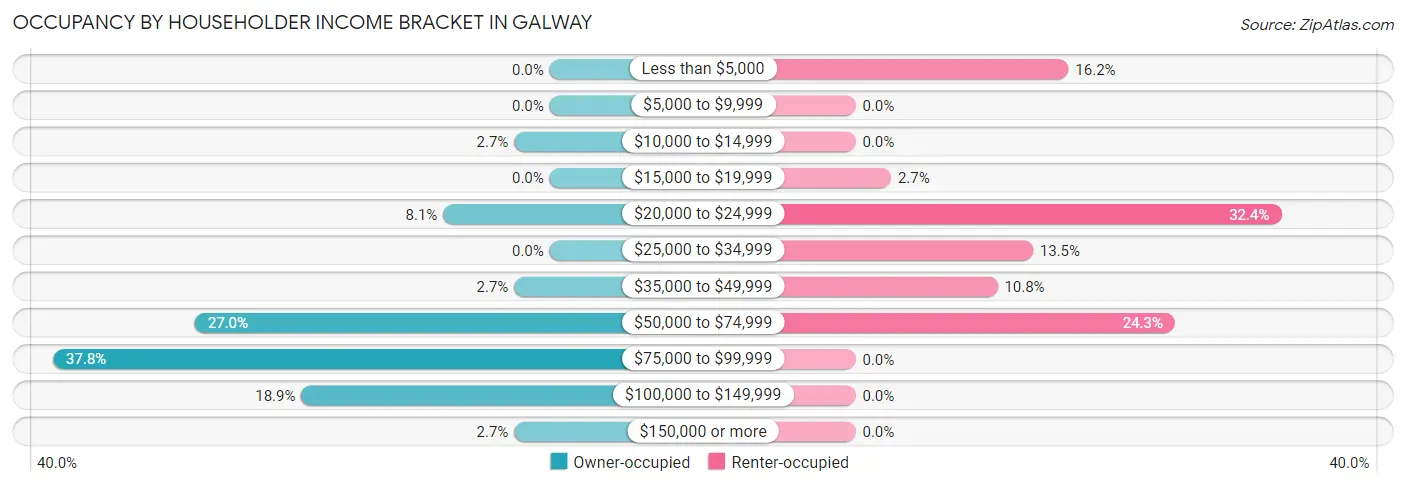
| Income Bracket | Owner-occupied | Renter-occupied |
| Less than $5,000 | 0 (0.0%) | 6 (16.2%) |
| $5,000 to $9,999 | 0 (0.0%) | 0 (0.0%) |
| $10,000 to $14,999 | 1 (2.7%) | 0 (0.0%) |
| $15,000 to $19,999 | 0 (0.0%) | 1 (2.7%) |
| $20,000 to $24,999 | 3 (8.1%) | 12 (32.4%) |
| $25,000 to $34,999 | 0 (0.0%) | 5 (13.5%) |
| $35,000 to $49,999 | 1 (2.7%) | 4 (10.8%) |
| $50,000 to $74,999 | 10 (27.0%) | 9 (24.3%) |
| $75,000 to $99,999 | 14 (37.8%) | 0 (0.0%) |
| $100,000 to $149,999 | 7 (18.9%) | 0 (0.0%) |
| $150,000 or more | 1 (2.7%) | 0 (0.0%) |
| Total | 37 (100.0%) | 37 (100.0%) |
Monthly Housing Cost Tiers in Galway
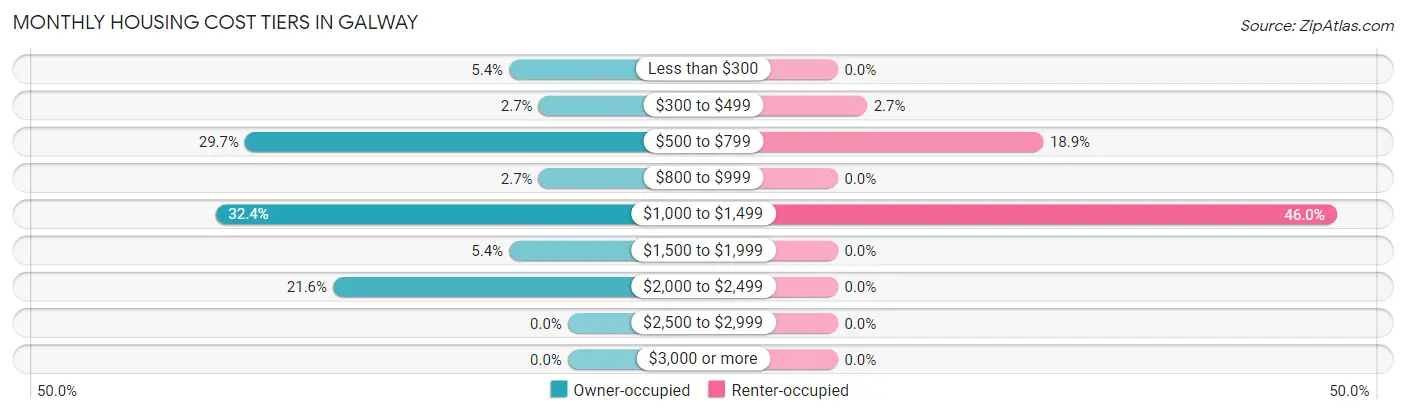
| Monthly Cost | Owner-occupied | Renter-occupied |
| Less than $300 | 2 (5.4%) | 0 (0.0%) |
| $300 to $499 | 1 (2.7%) | 1 (2.7%) |
| $500 to $799 | 11 (29.7%) | 7 (18.9%) |
| $800 to $999 | 1 (2.7%) | 0 (0.0%) |
| $1,000 to $1,499 | 12 (32.4%) | 17 (46.0%) |
| $1,500 to $1,999 | 2 (5.4%) | 0 (0.0%) |
| $2,000 to $2,499 | 8 (21.6%) | 0 (0.0%) |
| $2,500 to $2,999 | 0 (0.0%) | 0 (0.0%) |
| $3,000 or more | 0 (0.0%) | 0 (0.0%) |
| Total | 37 (100.0%) | 37 (100.0%) |
Physical Housing Characteristics in Galway
Housing Structures in Galway
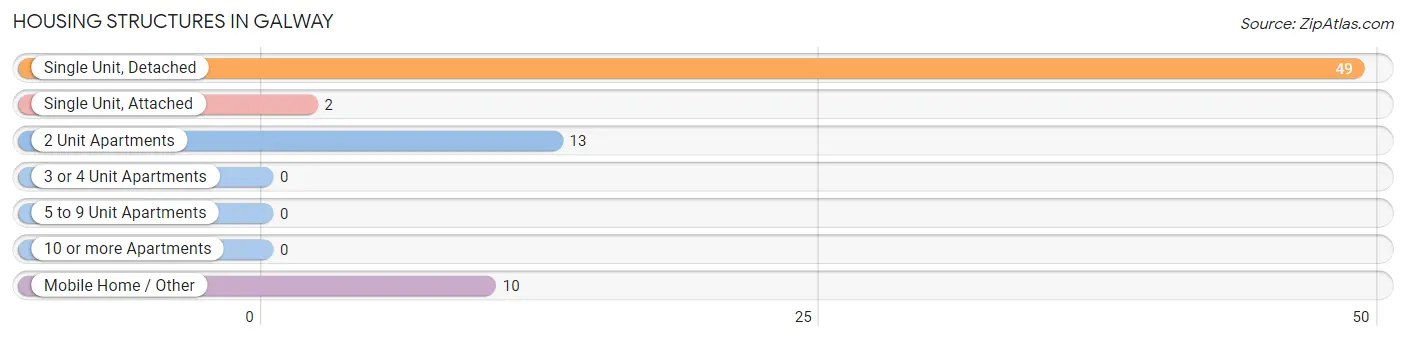
| Structure Type | # Housing Units | % Housing Units |
| Single Unit, Detached | 49 | 66.2% |
| Single Unit, Attached | 2 | 2.7% |
| 2 Unit Apartments | 13 | 17.6% |
| 3 or 4 Unit Apartments | 0 | 0.0% |
| 5 to 9 Unit Apartments | 0 | 0.0% |
| 10 or more Apartments | 0 | 0.0% |
| Mobile Home / Other | 10 | 13.5% |
| Total | 74 | 100.0% |
Housing Structures by Occupancy in Galway
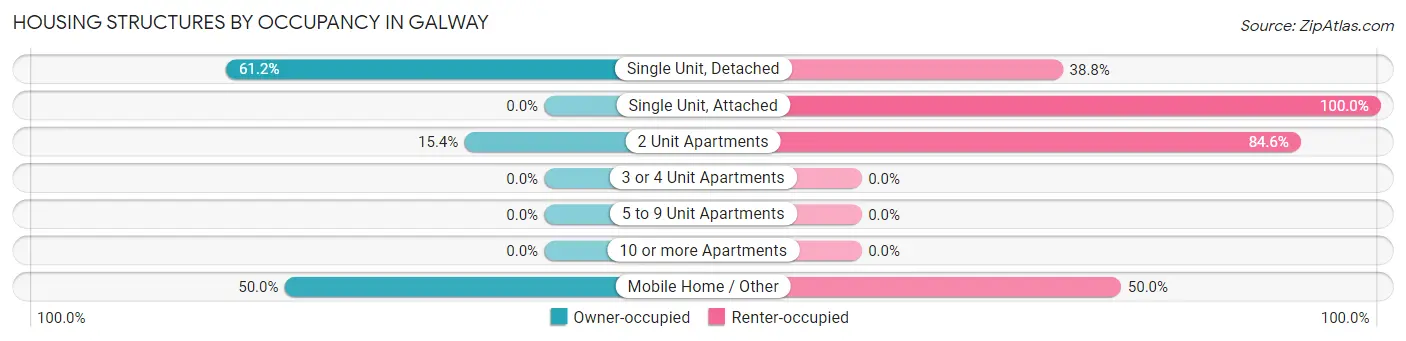
| Structure Type | Owner-occupied | Renter-occupied |
| Single Unit, Detached | 30 (61.2%) | 19 (38.8%) |
| Single Unit, Attached | 0 (0.0%) | 2 (100.0%) |
| 2 Unit Apartments | 2 (15.4%) | 11 (84.6%) |
| 3 or 4 Unit Apartments | 0 (0.0%) | 0 (0.0%) |
| 5 to 9 Unit Apartments | 0 (0.0%) | 0 (0.0%) |
| 10 or more Apartments | 0 (0.0%) | 0 (0.0%) |
| Mobile Home / Other | 5 (50.0%) | 5 (50.0%) |
| Total | 37 (50.0%) | 37 (50.0%) |
Housing Structures by Number of Rooms in Galway
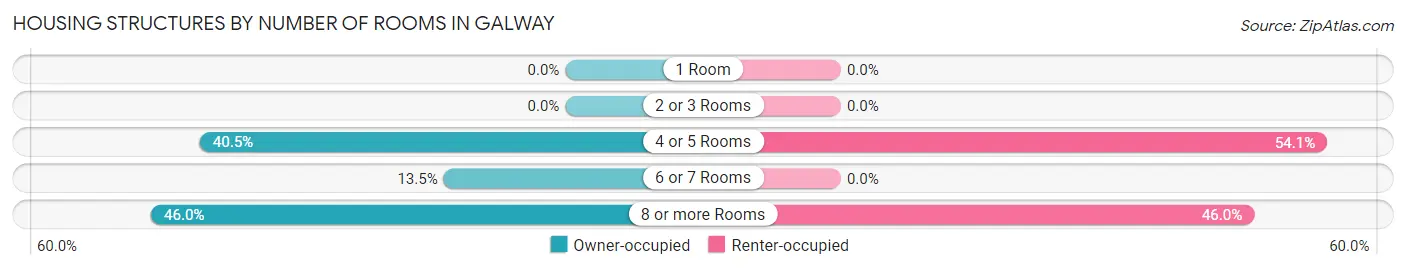
| Number of Rooms | Owner-occupied | Renter-occupied |
| 1 Room | 0 (0.0%) | 0 (0.0%) |
| 2 or 3 Rooms | 0 (0.0%) | 0 (0.0%) |
| 4 or 5 Rooms | 15 (40.5%) | 20 (54.0%) |
| 6 or 7 Rooms | 5 (13.5%) | 0 (0.0%) |
| 8 or more Rooms | 17 (46.0%) | 17 (46.0%) |
| Total | 37 (100.0%) | 37 (100.0%) |
Housing Structure by Heating Type in Galway
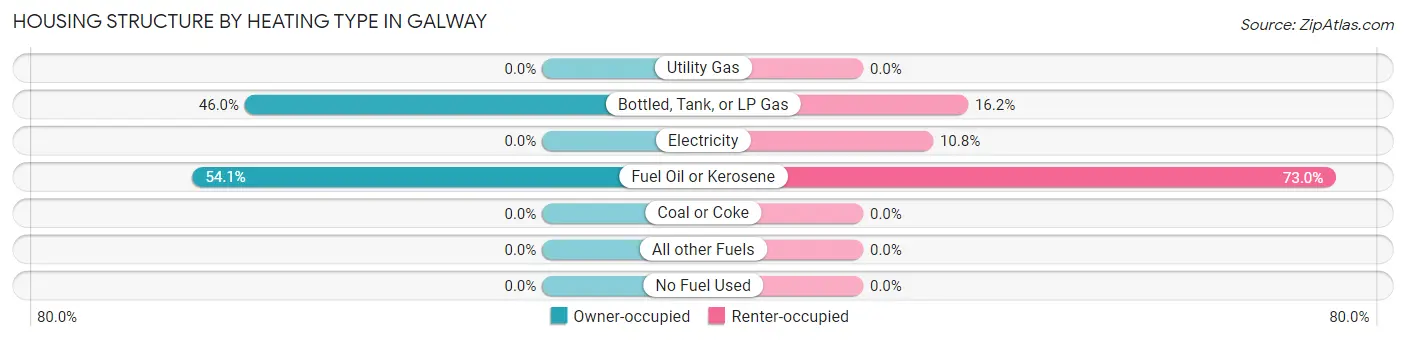
| Heating Type | Owner-occupied | Renter-occupied |
| Utility Gas | 0 (0.0%) | 0 (0.0%) |
| Bottled, Tank, or LP Gas | 17 (46.0%) | 6 (16.2%) |
| Electricity | 0 (0.0%) | 4 (10.8%) |
| Fuel Oil or Kerosene | 20 (54.0%) | 27 (73.0%) |
| Coal or Coke | 0 (0.0%) | 0 (0.0%) |
| All other Fuels | 0 (0.0%) | 0 (0.0%) |
| No Fuel Used | 0 (0.0%) | 0 (0.0%) |
| Total | 37 (100.0%) | 37 (100.0%) |
Household Vehicle Usage in Galway
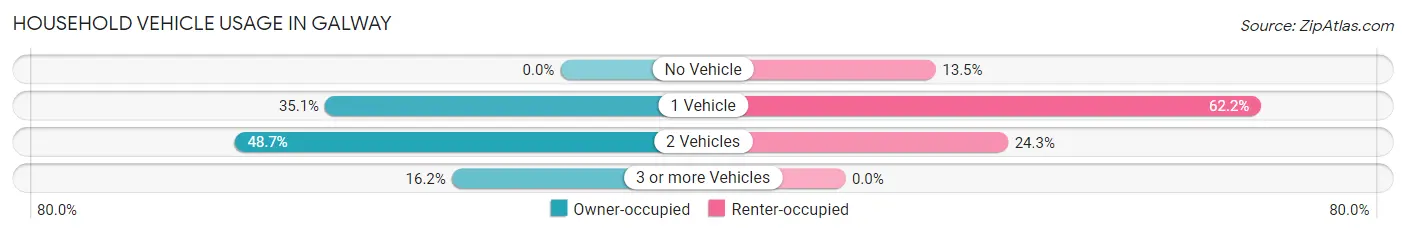
| Vehicles per Household | Owner-occupied | Renter-occupied |
| No Vehicle | 0 (0.0%) | 5 (13.5%) |
| 1 Vehicle | 13 (35.1%) | 23 (62.2%) |
| 2 Vehicles | 18 (48.6%) | 9 (24.3%) |
| 3 or more Vehicles | 6 (16.2%) | 0 (0.0%) |
| Total | 37 (100.0%) | 37 (100.0%) |
Real Estate & Mortgages in Galway
Real Estate and Mortgage Overview in Galway
| Characteristic | Without Mortgage | With Mortgage |
| Housing Units | 19 | 18 |
| Median Property Value | $182,500 | $233,300 |
| Median Household Income | $83,958 | $1 |
| Monthly Housing Costs | $710 | $0 |
| Real Estate Taxes | $6,000 | $0 |
Property Value by Mortgage Status in Galway
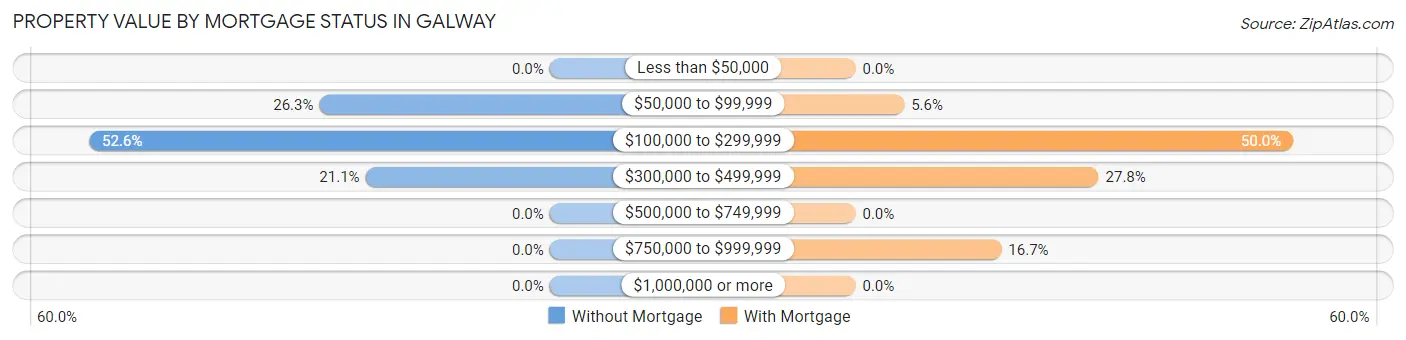
| Property Value | Without Mortgage | With Mortgage |
| Less than $50,000 | 0 (0.0%) | 0 (0.0%) |
| $50,000 to $99,999 | 5 (26.3%) | 1 (5.6%) |
| $100,000 to $299,999 | 10 (52.6%) | 9 (50.0%) |
| $300,000 to $499,999 | 4 (21.0%) | 5 (27.8%) |
| $500,000 to $749,999 | 0 (0.0%) | 0 (0.0%) |
| $750,000 to $999,999 | 0 (0.0%) | 3 (16.7%) |
| $1,000,000 or more | 0 (0.0%) | 0 (0.0%) |
| Total | 19 (100.0%) | 18 (100.0%) |
Household Income by Mortgage Status in Galway
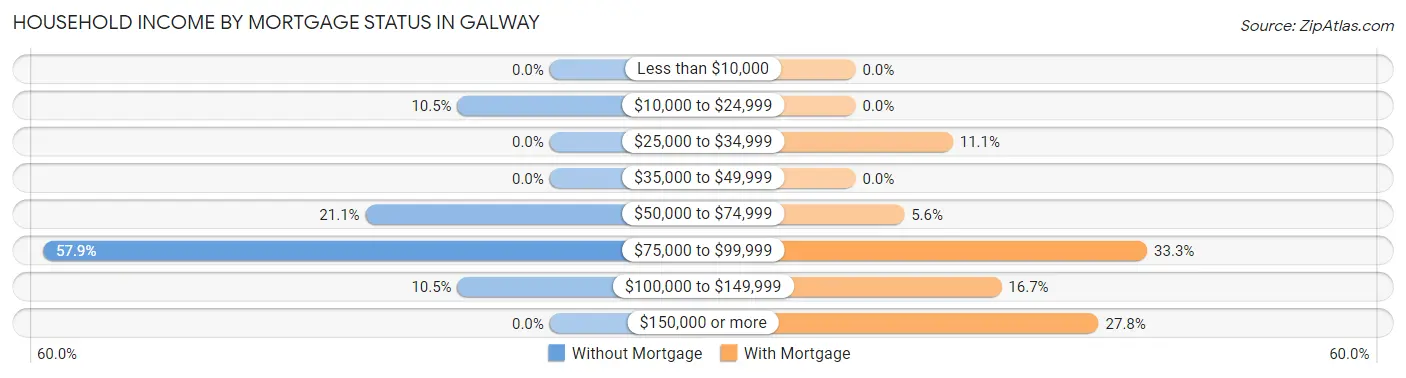
| Household Income | Without Mortgage | With Mortgage |
| Less than $10,000 | 0 (0.0%) | 0 (0.0%) |
| $10,000 to $24,999 | 2 (10.5%) | 0 (0.0%) |
| $25,000 to $34,999 | 0 (0.0%) | 2 (11.1%) |
| $35,000 to $49,999 | 0 (0.0%) | 0 (0.0%) |
| $50,000 to $74,999 | 4 (21.0%) | 1 (5.6%) |
| $75,000 to $99,999 | 11 (57.9%) | 6 (33.3%) |
| $100,000 to $149,999 | 2 (10.5%) | 3 (16.7%) |
| $150,000 or more | 0 (0.0%) | 5 (27.8%) |
| Total | 19 (100.0%) | 18 (100.0%) |
Property Value to Household Income Ratio in Galway
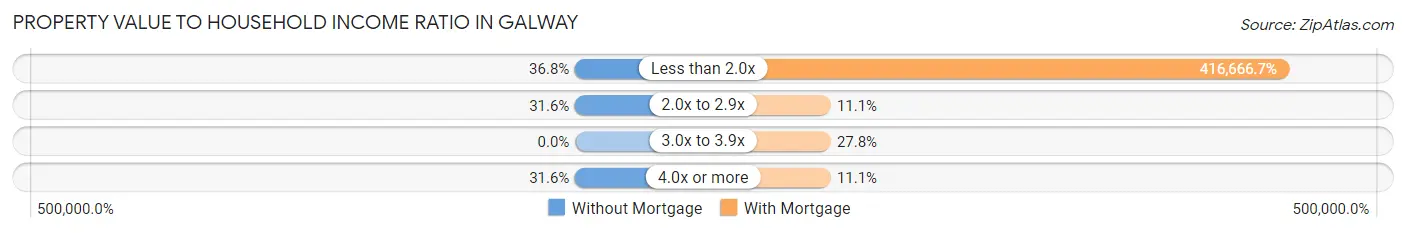
| Value-to-Income Ratio | Without Mortgage | With Mortgage |
| Less than 2.0x | 7 (36.8%) | 75,000 (416,666.7%) |
| 2.0x to 2.9x | 6 (31.6%) | 2 (11.1%) |
| 3.0x to 3.9x | 0 (0.0%) | 5 (27.8%) |
| 4.0x or more | 6 (31.6%) | 2 (11.1%) |
| Total | 19 (100.0%) | 18 (100.0%) |
Real Estate Taxes by Mortgage Status in Galway
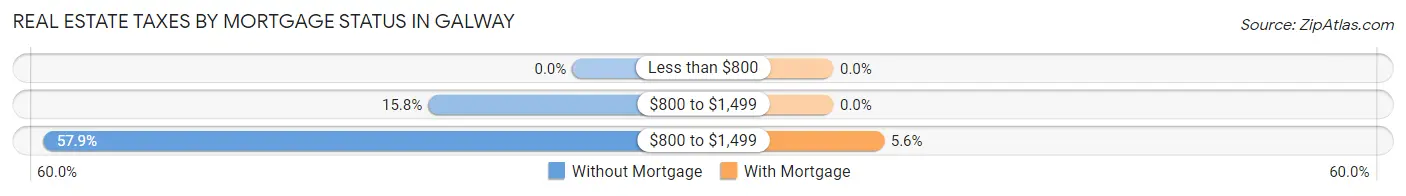
| Property Taxes | Without Mortgage | With Mortgage |
| Less than $800 | 0 (0.0%) | 0 (0.0%) |
| $800 to $1,499 | 3 (15.8%) | 0 (0.0%) |
| $800 to $1,499 | 11 (57.9%) | 1 (5.6%) |
| Total | 19 (100.0%) | 18 (100.0%) |
Health & Disability in Galway
Health Insurance Coverage by Age in Galway
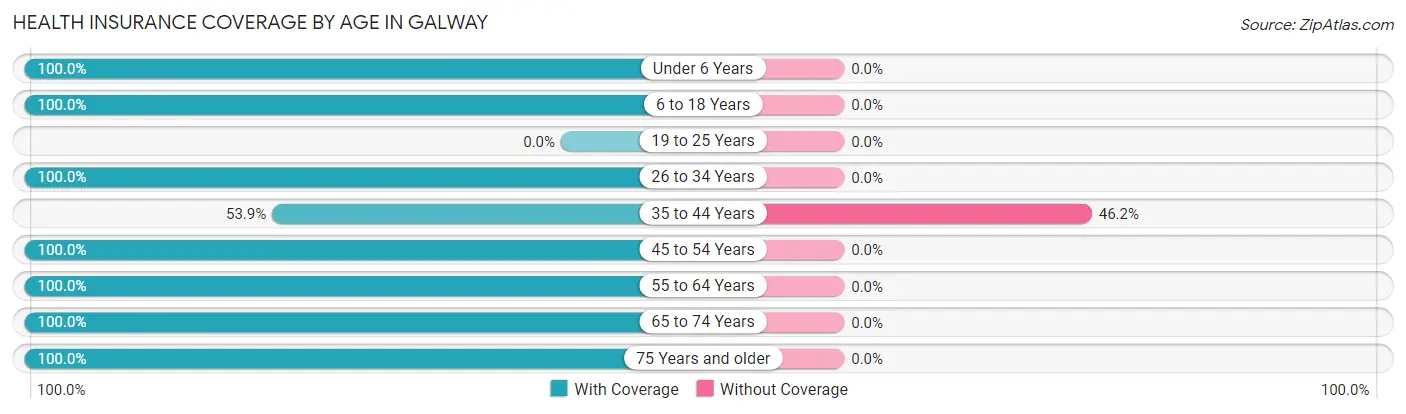
| Age Bracket | With Coverage | Without Coverage |
| Under 6 Years | 22 (100.0%) | 0 (0.0%) |
| 6 to 18 Years | 30 (100.0%) | 0 (0.0%) |
| 19 to 25 Years | 0 (0.0%) | 0 (0.0%) |
| 26 to 34 Years | 26 (100.0%) | 0 (0.0%) |
| 35 to 44 Years | 7 (53.8%) | 6 (46.2%) |
| 45 to 54 Years | 12 (100.0%) | 0 (0.0%) |
| 55 to 64 Years | 27 (100.0%) | 0 (0.0%) |
| 65 to 74 Years | 31 (100.0%) | 0 (0.0%) |
| 75 Years and older | 13 (100.0%) | 0 (0.0%) |
| Total | 168 (96.6%) | 6 (3.5%) |
Health Insurance Coverage by Citizenship Status in Galway
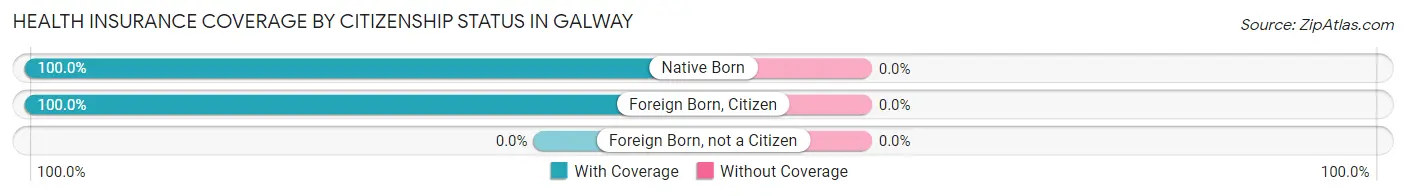
| Citizenship Status | With Coverage | Without Coverage |
| Native Born | 22 (100.0%) | 0 (0.0%) |
| Foreign Born, Citizen | 30 (100.0%) | 0 (0.0%) |
| Foreign Born, not a Citizen | 0 (0.0%) | 0 (0.0%) |
Health Insurance Coverage by Household Income in Galway
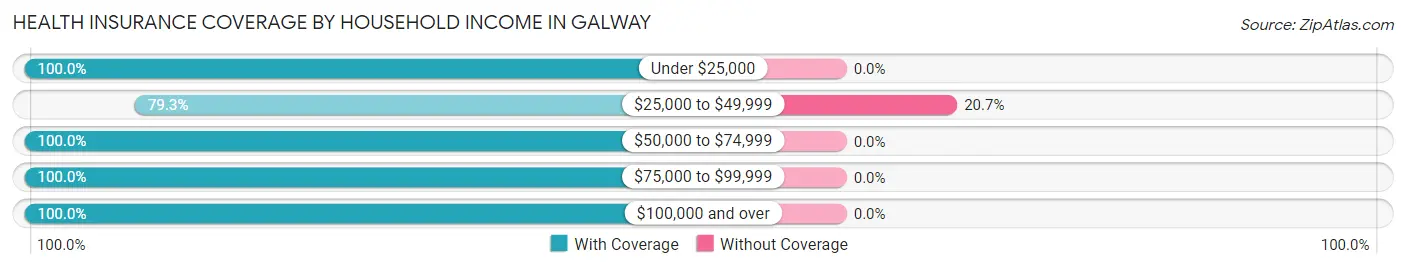
| Household Income | With Coverage | Without Coverage |
| Under $25,000 | 47 (100.0%) | 0 (0.0%) |
| $25,000 to $49,999 | 23 (79.3%) | 6 (20.7%) |
| $50,000 to $74,999 | 43 (100.0%) | 0 (0.0%) |
| $75,000 to $99,999 | 29 (100.0%) | 0 (0.0%) |
| $100,000 and over | 26 (100.0%) | 0 (0.0%) |
Public vs Private Health Insurance Coverage by Age in Galway
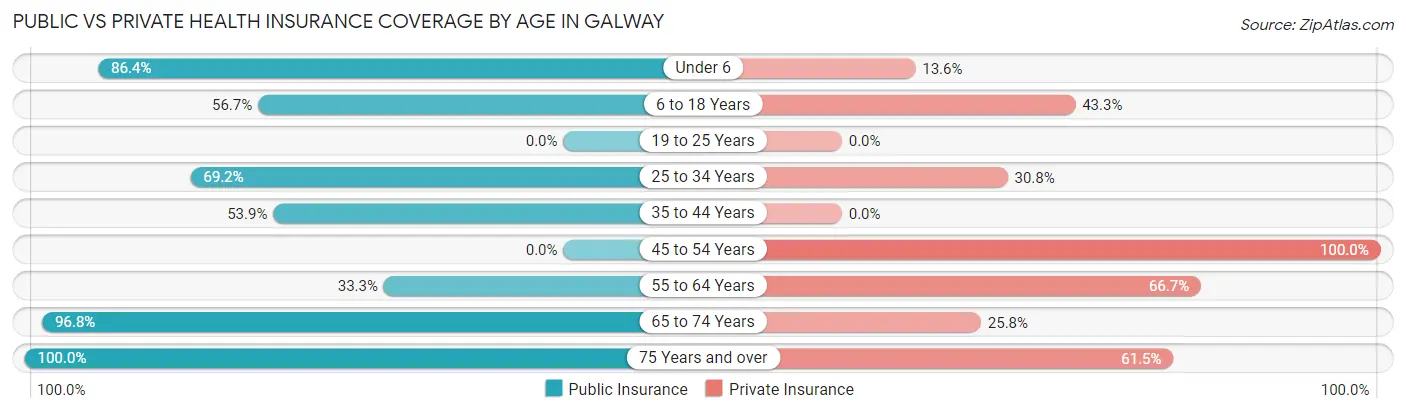
| Age Bracket | Public Insurance | Private Insurance |
| Under 6 | 19 (86.4%) | 3 (13.6%) |
| 6 to 18 Years | 17 (56.7%) | 13 (43.3%) |
| 19 to 25 Years | 0 (0.0%) | 0 (0.0%) |
| 25 to 34 Years | 18 (69.2%) | 8 (30.8%) |
| 35 to 44 Years | 7 (53.8%) | 0 (0.0%) |
| 45 to 54 Years | 0 (0.0%) | 12 (100.0%) |
| 55 to 64 Years | 9 (33.3%) | 18 (66.7%) |
| 65 to 74 Years | 30 (96.8%) | 8 (25.8%) |
| 75 Years and over | 13 (100.0%) | 8 (61.5%) |
| Total | 113 (64.9%) | 70 (40.2%) |
Disability Status by Sex by Age in Galway
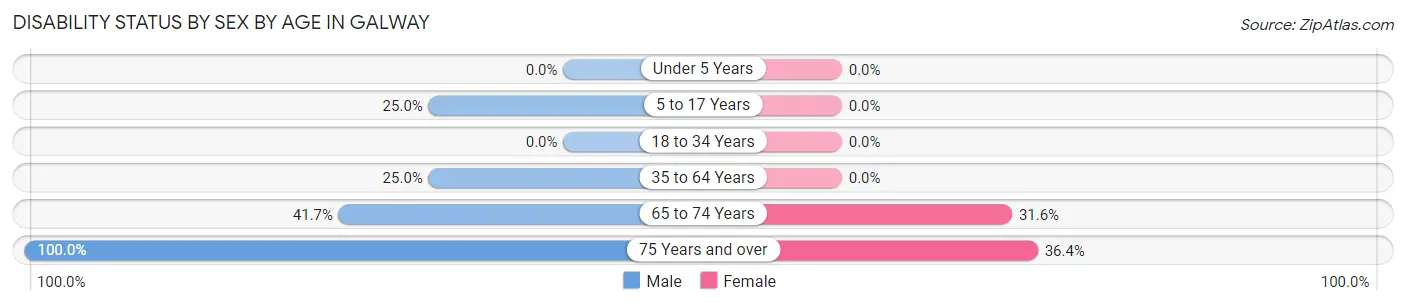
| Age Bracket | Male | Female |
| Under 5 Years | 0 (0.0%) | 0 (0.0%) |
| 5 to 17 Years | 2 (25.0%) | 0 (0.0%) |
| 18 to 34 Years | 0 (0.0%) | 0 (0.0%) |
| 35 to 64 Years | 7 (25.0%) | 0 (0.0%) |
| 65 to 74 Years | 5 (41.7%) | 6 (31.6%) |
| 75 Years and over | 2 (100.0%) | 4 (36.4%) |
Disability Class by Sex by Age in Galway
Disability Class: Hearing Difficulty
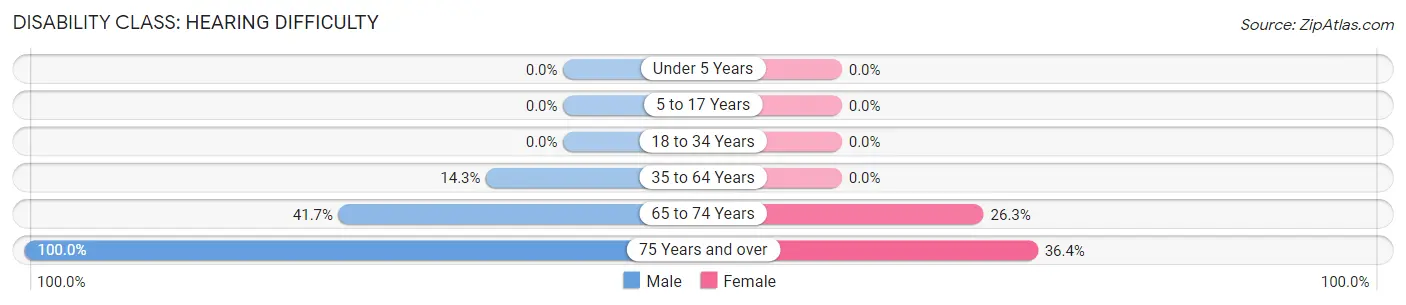
| Age Bracket | Male | Female |
| Under 5 Years | 0 (0.0%) | 0 (0.0%) |
| 5 to 17 Years | 0 (0.0%) | 0 (0.0%) |
| 18 to 34 Years | 0 (0.0%) | 0 (0.0%) |
| 35 to 64 Years | 4 (14.3%) | 0 (0.0%) |
| 65 to 74 Years | 5 (41.7%) | 5 (26.3%) |
| 75 Years and over | 2 (100.0%) | 4 (36.4%) |
Disability Class: Vision Difficulty
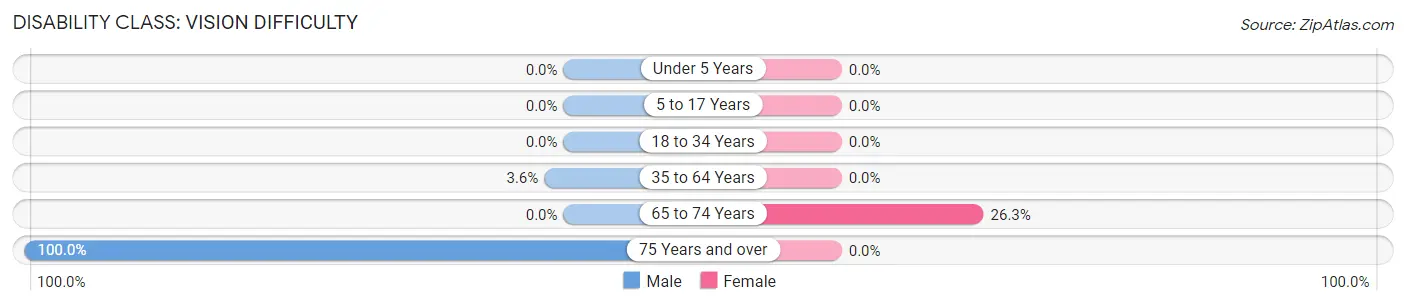
| Age Bracket | Male | Female |
| Under 5 Years | 0 (0.0%) | 0 (0.0%) |
| 5 to 17 Years | 0 (0.0%) | 0 (0.0%) |
| 18 to 34 Years | 0 (0.0%) | 0 (0.0%) |
| 35 to 64 Years | 1 (3.6%) | 0 (0.0%) |
| 65 to 74 Years | 0 (0.0%) | 5 (26.3%) |
| 75 Years and over | 2 (100.0%) | 0 (0.0%) |
Disability Class: Cognitive Difficulty
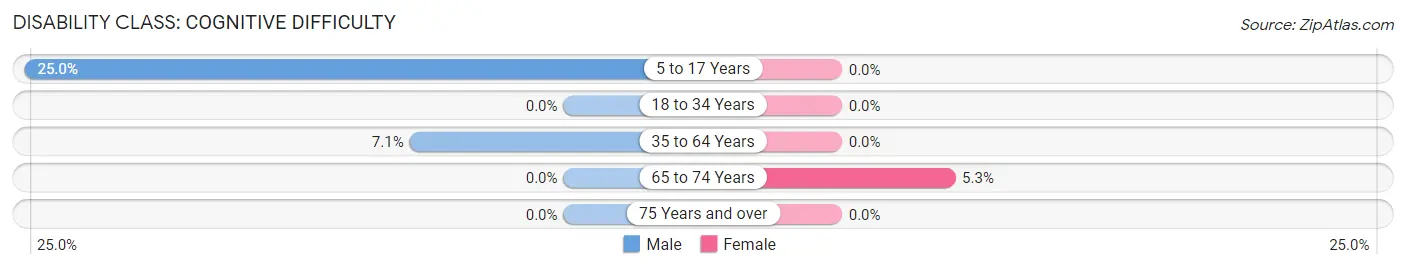
| Age Bracket | Male | Female |
| 5 to 17 Years | 2 (25.0%) | 0 (0.0%) |
| 18 to 34 Years | 0 (0.0%) | 0 (0.0%) |
| 35 to 64 Years | 2 (7.1%) | 0 (0.0%) |
| 65 to 74 Years | 0 (0.0%) | 1 (5.3%) |
| 75 Years and over | 0 (0.0%) | 0 (0.0%) |
Disability Class: Ambulatory Difficulty
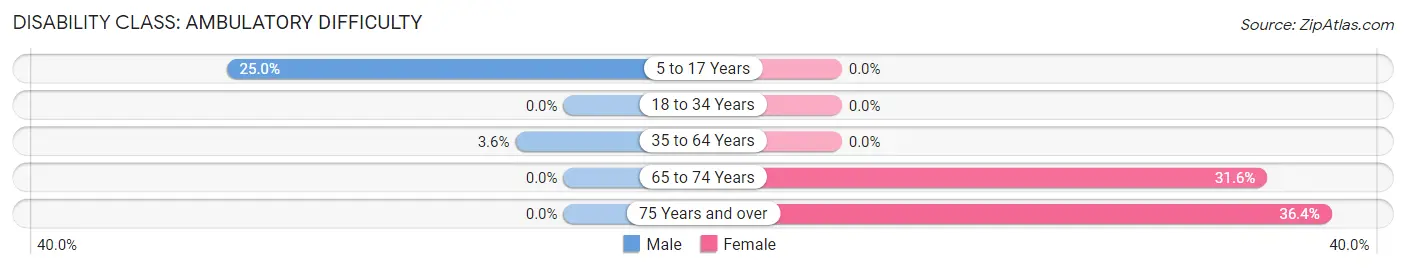
| Age Bracket | Male | Female |
| 5 to 17 Years | 2 (25.0%) | 0 (0.0%) |
| 18 to 34 Years | 0 (0.0%) | 0 (0.0%) |
| 35 to 64 Years | 1 (3.6%) | 0 (0.0%) |
| 65 to 74 Years | 0 (0.0%) | 6 (31.6%) |
| 75 Years and over | 0 (0.0%) | 4 (36.4%) |
Disability Class: Self-Care Difficulty
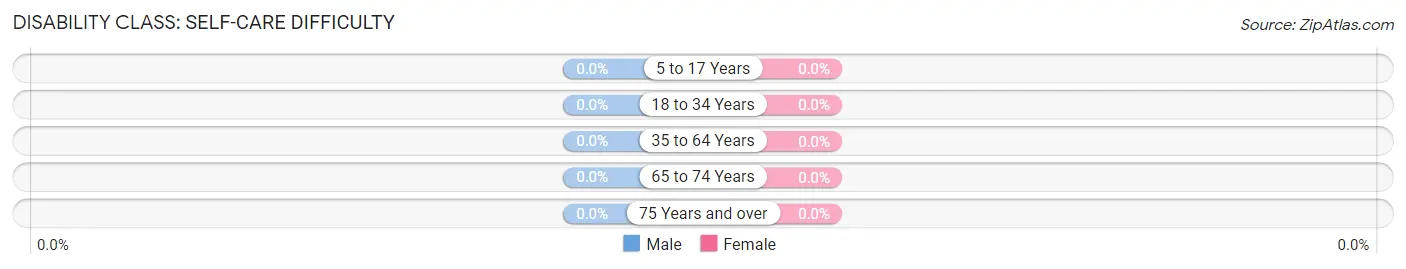
| Age Bracket | Male | Female |
| 5 to 17 Years | 0 (0.0%) | 0 (0.0%) |
| 18 to 34 Years | 0 (0.0%) | 0 (0.0%) |
| 35 to 64 Years | 0 (0.0%) | 0 (0.0%) |
| 65 to 74 Years | 0 (0.0%) | 0 (0.0%) |
| 75 Years and over | 0 (0.0%) | 0 (0.0%) |
Technology Access in Galway
Computing Device Access in Galway
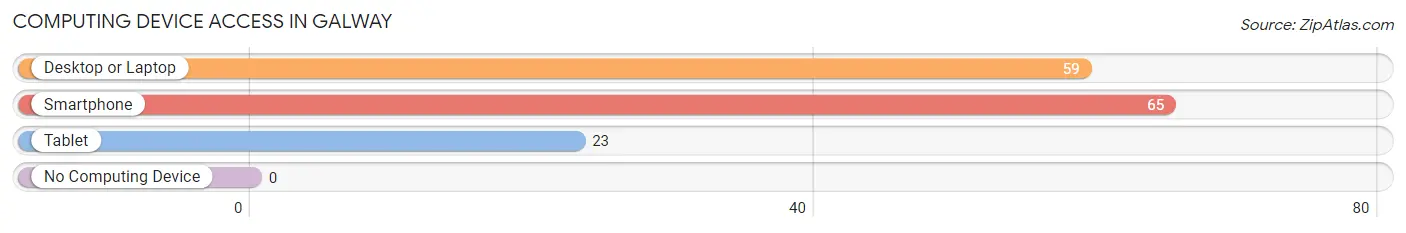
| Device Type | # Households | % Households |
| Desktop or Laptop | 59 | 79.7% |
| Smartphone | 65 | 87.8% |
| Tablet | 23 | 31.1% |
| No Computing Device | 0 | 0.0% |
| Total | 74 | 100.0% |
Internet Access in Galway
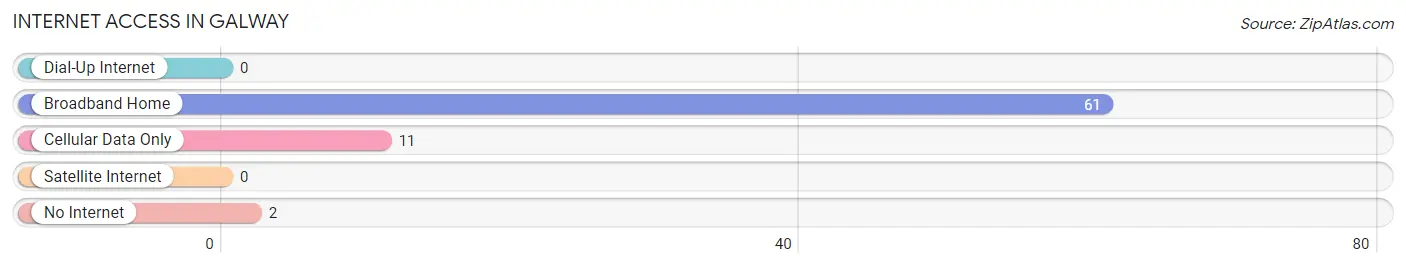
| Internet Type | # Households | % Households |
| Dial-Up Internet | 0 | 0.0% |
| Broadband Home | 61 | 82.4% |
| Cellular Data Only | 11 | 14.9% |
| Satellite Internet | 0 | 0.0% |
| No Internet | 2 | 2.7% |
| Total | 74 | 100.0% |
Galway Summary
Galway, New York is a small town located in Saratoga County, New York. It is situated in the foothills of the Adirondack Mountains and is part of the Glens Falls Metropolitan Statistical Area. The town was founded in 1792 and has a population of approximately 2,000 people.
Geography
Galway is located in the foothills of the Adirondack Mountains in Saratoga County, New York. It is situated on the eastern edge of the Adirondack Park and is bordered by the towns of Providence, Day, and Charlton. The town is located approximately 25 miles west of Albany and is part of the Glens Falls Metropolitan Statistical Area. The town is home to several small lakes, including Galway Lake, which is the largest lake in the town. The town is also home to several small streams, including the Galway Creek, which flows through the town.
History
Galway was first settled in 1792 by a group of settlers from Connecticut. The town was originally known as “Galway” after the town of Galway in Ireland. The town was officially incorporated in 1818. During the 19th century, the town was a major producer of lumber and was home to several sawmills. The town was also home to several small farms and was a popular destination for hunters and fishermen.
In the late 19th century, the town began to experience a decline in population as many of the residents moved away to larger cities. The town was also affected by the Great Depression, which caused many of the businesses in the town to close. The town experienced a resurgence in the late 20th century, as many of the residents returned to the area and new businesses opened.
Economy
Galway’s economy is largely based on tourism and agriculture. The town is home to several small farms, which produce a variety of crops, including corn, hay, and vegetables. The town is also home to several small businesses, including restaurants, retail stores, and a variety of other services. The town is also home to several small manufacturing companies, which produce a variety of products, including furniture, clothing, and electronics.
Demographics
As of the 2010 census, the population of Galway was 2,000 people. The town is predominantly white, with approximately 95% of the population being white. The median household income in the town is $50,000, and the median home value is $150,000. The town is home to several small churches, including the Galway United Methodist Church and the Galway Presbyterian Church.
Galway is a small town with a rich history and a vibrant economy. The town is home to several small businesses, farms, and churches, and is a popular destination for tourists and outdoor enthusiasts. The town is also home to a diverse population, with a variety of ethnic backgrounds and religious beliefs. Galway is a great place to live, work, and play, and is a great example of a small town in the Adirondack Mountains.
Common Questions
What is Per Capita Income in Galway?
Per Capita income in Galway is $24,826.
What is the Median Family Income in Galway?
Median Family Income in Galway is $64,000.
What is the Median Household income in Galway?
Median Household Income in Galway is $56,667.
What is Inequality or Gini Index in Galway?
Inequality or Gini Index in Galway is 0.36.
What is the Total Population of Galway?
Total Population of Galway is 174.
What is the Total Male Population of Galway?
Total Male Population of Galway is 67.
What is the Total Female Population of Galway?
Total Female Population of Galway is 107.
What is the Ratio of Males per 100 Females in Galway?
There are 62.62 Males per 100 Females in Galway.
What is the Ratio of Females per 100 Males in Galway?
There are 159.70 Females per 100 Males in Galway.
What is the Median Population Age in Galway?
Median Population Age in Galway is 38.2 Years.
What is the Average Family Size in Galway
Average Family Size in Galway is 3.0 People.
What is the Average Household Size in Galway
Average Household Size in Galway is 2.4 People.
How Large is the Labor Force in Galway?
There are 75 People in the Labor Forcein in Galway.
What is the Percentage of People in the Labor Force in Galway?
60.0% of People are in the Labor Force in Galway.
What is the Unemployment Rate in Galway?
Unemployment Rate in Galway is 2.7%.