Fulton, NY Map & Demographics
Fulton Map
Fulton Overview
$26,639
PER CAPITA INCOME
$56,230
AVG FAMILY INCOME
$51,243
AVG HOUSEHOLD INCOME
23.7%
WAGE / INCOME GAP [ % ]
76.3¢/ $1
WAGE / INCOME GAP [ $ ]
$11,392
FAMILY INCOME DEFICIT
0.44
INEQUALITY / GINI INDEX
11,381
TOTAL POPULATION
5,723
MALE POPULATION
5,658
FEMALE POPULATION
101.15
MALES / 100 FEMALES
98.86
FEMALES / 100 MALES
33.7
MEDIAN AGE
2.8
AVG FAMILY SIZE
2.4
AVG HOUSEHOLD SIZE
5,263
LABOR FORCE [ PEOPLE ]
59.9%
PERCENT IN LABOR FORCE
9.0%
UNEMPLOYMENT RATE
Fulton Zip Codes
Fulton Area Codes
Income in Fulton
Income Overview in Fulton
Per Capita Income in Fulton is $26,639, while median incomes of families and households are $56,230 and $51,243 respectively.
| Characteristic | Number | Measure |
| Per Capita Income | 11,381 | $26,639 |
| Median Family Income | 2,960 | $56,230 |
| Mean Family Income | 2,960 | $68,528 |
| Median Household Income | 4,792 | $51,243 |
| Mean Household Income | 4,792 | $62,873 |
| Income Deficit | 2,960 | $11,392 |
| Wage / Income Gap (%) | 11,381 | 23.68% |
| Wage / Income Gap ($) | 11,381 | 76.32¢ per $1 |
| Gini / Inequality Index | 11,381 | 0.44 |
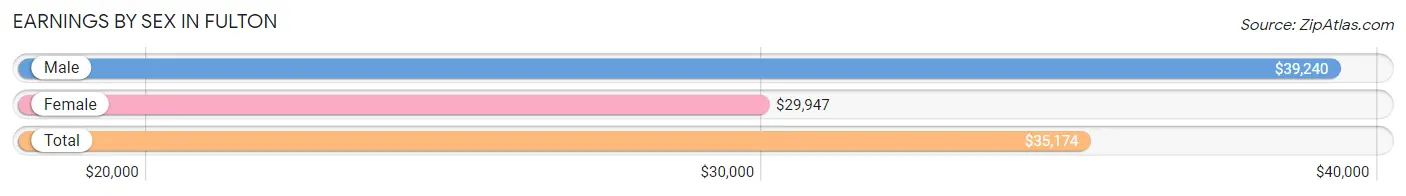
Earnings by Sex in Fulton
Average Earnings in Fulton are $35,174, $39,240 for men and $29,947 for women, a difference of 23.7%.
| Sex | Number | Average Earnings |
| Male | 2,791 (51.2%) | $39,240 |
| Female | 2,663 (48.8%) | $29,947 |
| Total | 5,454 (100.0%) | $35,174 |
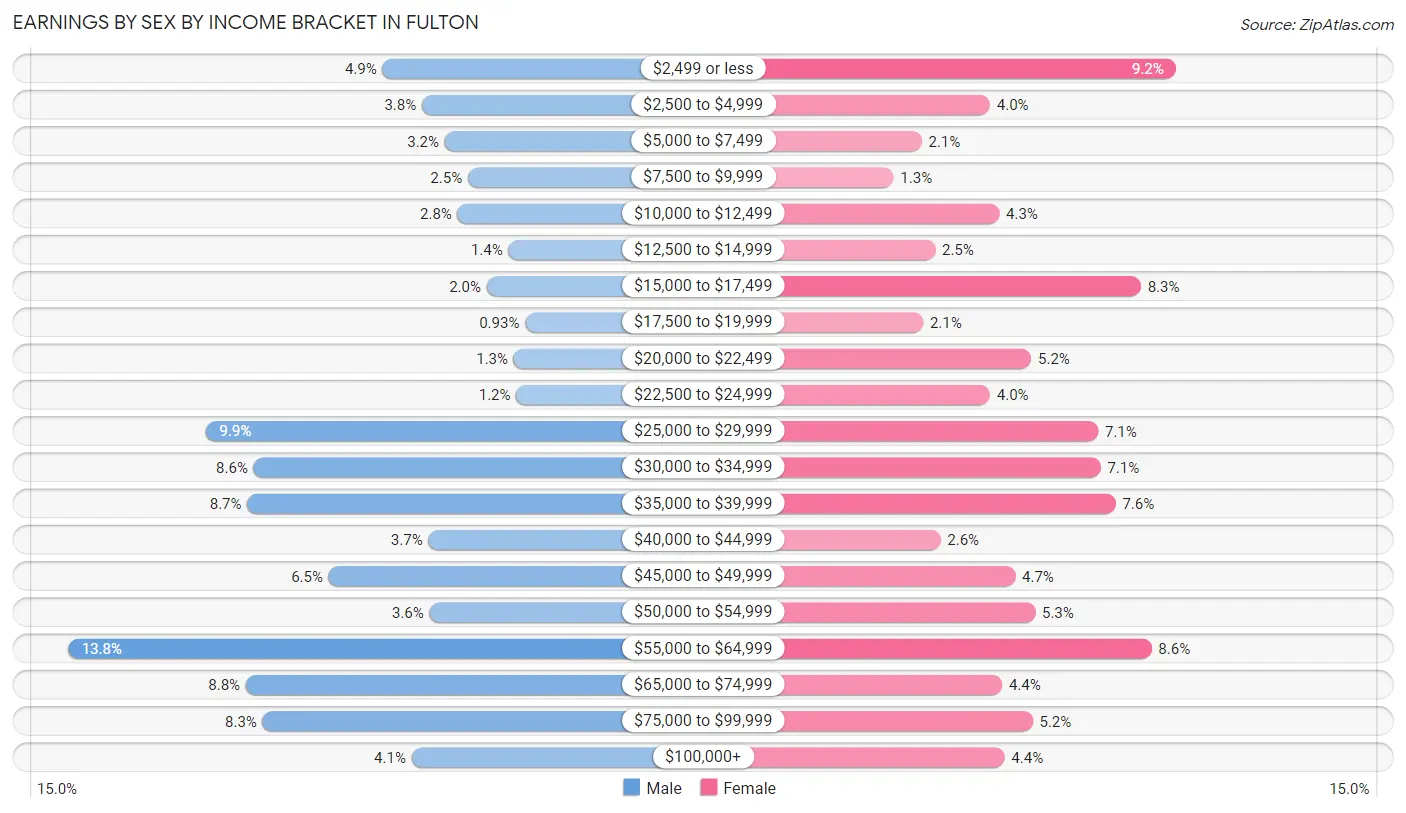
Earnings by Sex by Income Bracket in Fulton
The most common earnings brackets in Fulton are $55,000 to $64,999 for men (384 | 13.8%) and $2,499 or less for women (246 | 9.2%).
| Income | Male | Female |
| $2,499 or less | 138 (4.9%) | 246 (9.2%) |
| $2,500 to $4,999 | 107 (3.8%) | 107 (4.0%) |
| $5,000 to $7,499 | 89 (3.2%) | 56 (2.1%) |
| $7,500 to $9,999 | 71 (2.5%) | 35 (1.3%) |
| $10,000 to $12,499 | 79 (2.8%) | 114 (4.3%) |
| $12,500 to $14,999 | 39 (1.4%) | 66 (2.5%) |
| $15,000 to $17,499 | 56 (2.0%) | 220 (8.3%) |
| $17,500 to $19,999 | 26 (0.9%) | 57 (2.1%) |
| $20,000 to $22,499 | 35 (1.3%) | 138 (5.2%) |
| $22,500 to $24,999 | 33 (1.2%) | 107 (4.0%) |
| $25,000 to $29,999 | 276 (9.9%) | 188 (7.1%) |
| $30,000 to $34,999 | 239 (8.6%) | 190 (7.1%) |
| $35,000 to $39,999 | 244 (8.7%) | 201 (7.5%) |
| $40,000 to $44,999 | 102 (3.6%) | 70 (2.6%) |
| $45,000 to $49,999 | 180 (6.5%) | 126 (4.7%) |
| $50,000 to $54,999 | 101 (3.6%) | 141 (5.3%) |
| $55,000 to $64,999 | 384 (13.8%) | 228 (8.6%) |
| $65,000 to $74,999 | 245 (8.8%) | 116 (4.4%) |
| $75,000 to $99,999 | 232 (8.3%) | 139 (5.2%) |
| $100,000+ | 115 (4.1%) | 118 (4.4%) |
| Total | 2,791 (100.0%) | 2,663 (100.0%) |
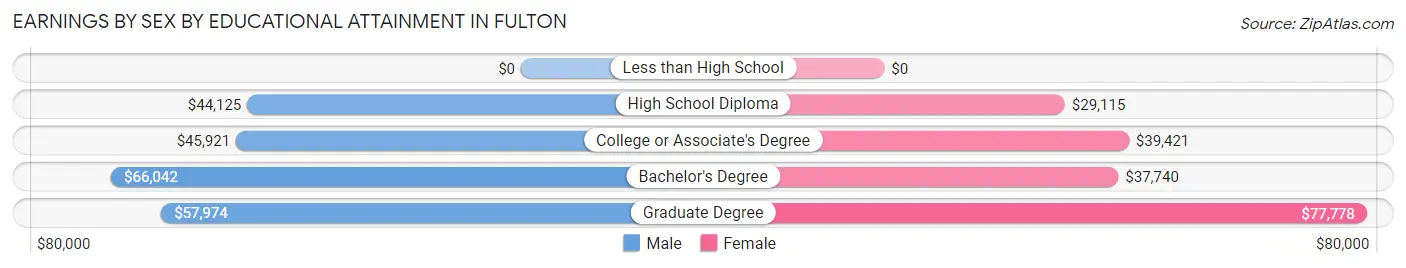
Earnings by Sex by Educational Attainment in Fulton
Average earnings in Fulton are $45,725 for men and $36,319 for women, a difference of 20.6%. Men with an educational attainment of bachelor's degree enjoy the highest average annual earnings of $66,042, while those with high school diploma education earn the least with $44,125. Women with an educational attainment of graduate degree earn the most with the average annual earnings of $77,778, while those with high school diploma education have the smallest earnings of $29,115.
| Educational Attainment | Male Income | Female Income |
| Less than High School | - | - |
| High School Diploma | $44,125 | $29,115 |
| College or Associate's Degree | $45,921 | $39,421 |
| Bachelor's Degree | $66,042 | $37,740 |
| Graduate Degree | $57,974 | $77,778 |
| Total | $45,725 | $36,319 |
Family Income in Fulton
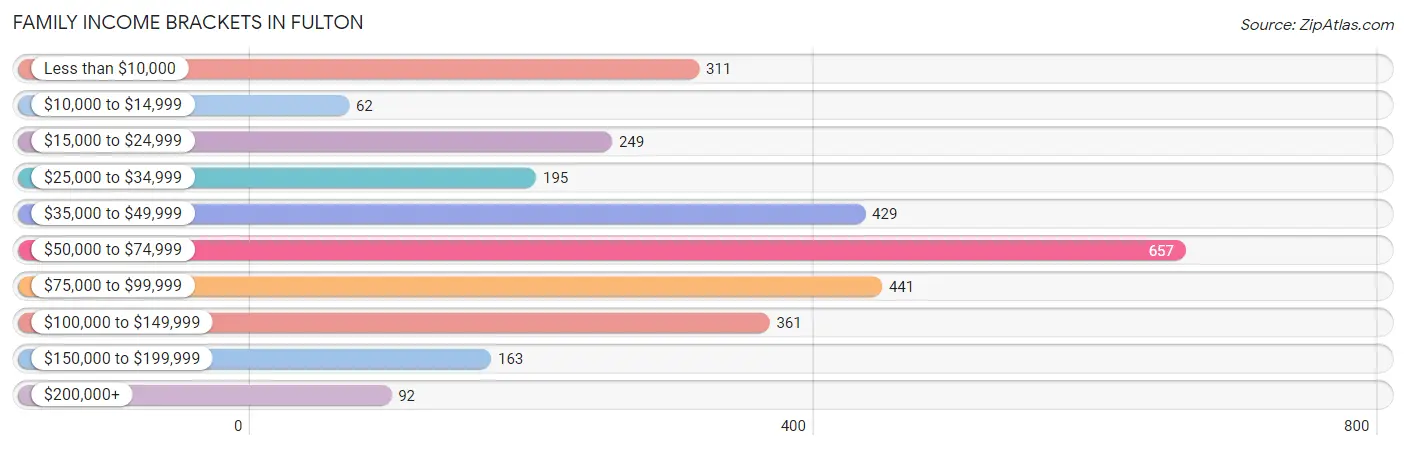
Family Income Brackets in Fulton
According to the Fulton family income data, there are 657 families falling into the $50,000 to $74,999 income range, which is the most common income bracket and makes up 22.2% of all families. Conversely, the $10,000 to $14,999 income bracket is the least frequent group with only 62 families (2.1%) belonging to this category.
| Income Bracket | # Families | % Families |
| Less than $10,000 | 311 | 10.5% |
| $10,000 to $14,999 | 62 | 2.1% |
| $15,000 to $24,999 | 249 | 8.4% |
| $25,000 to $34,999 | 195 | 6.6% |
| $35,000 to $49,999 | 429 | 14.5% |
| $50,000 to $74,999 | 657 | 22.2% |
| $75,000 to $99,999 | 441 | 14.9% |
| $100,000 to $149,999 | 361 | 12.2% |
| $150,000 to $199,999 | 163 | 5.5% |
| $200,000+ | 92 | 3.1% |
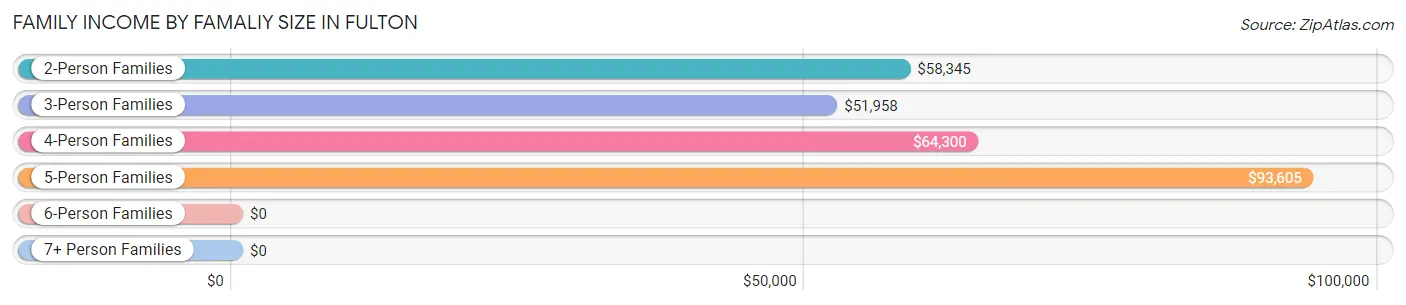
Family Income by Famaliy Size in Fulton
5-person families (148 | 5.0%) account for the highest median family income in Fulton with $93,605 per family, while 2-person families (1,274 | 43.0%) have the highest median income of $29,172 per family member.
| Income Bracket | # Families | Median Income |
| 2-Person Families | 1,274 (43.0%) | $58,345 |
| 3-Person Families | 933 (31.5%) | $51,958 |
| 4-Person Families | 508 (17.2%) | $64,300 |
| 5-Person Families | 148 (5.0%) | $93,605 |
| 6-Person Families | 97 (3.3%) | $0 |
| 7+ Person Families | 0 (0.0%) | $0 |
| Total | 2,960 (100.0%) | $56,230 |
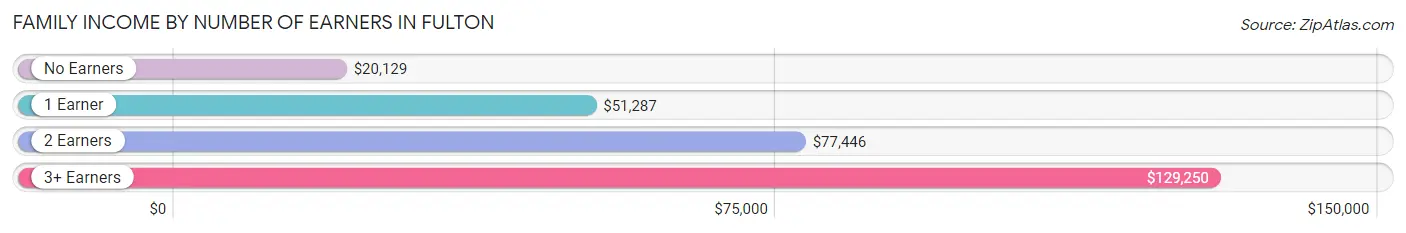
Family Income by Number of Earners in Fulton
The median family income in Fulton is $56,230, with families comprising 3+ earners (291) having the highest median family income of $129,250, while families with no earners (694) have the lowest median family income of $20,129, accounting for 9.8% and 23.4% of families, respectively.
| Number of Earners | # Families | Median Income |
| No Earners | 694 (23.4%) | $20,129 |
| 1 Earner | 1,173 (39.6%) | $51,287 |
| 2 Earners | 802 (27.1%) | $77,446 |
| 3+ Earners | 291 (9.8%) | $129,250 |
| Total | 2,960 (100.0%) | $56,230 |
Household Income in Fulton
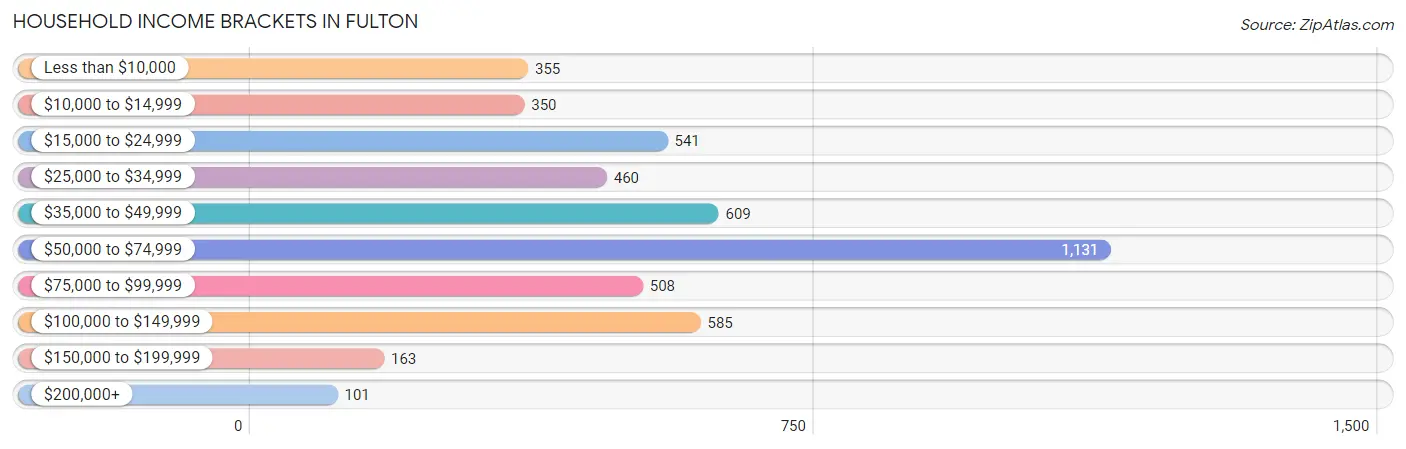
Household Income Brackets in Fulton
With 1,131 households falling in the category, the $50,000 to $74,999 income range is the most frequent in Fulton, accounting for 23.6% of all households. In contrast, only 101 households (2.1%) fall into the $200,000+ income bracket, making it the least populous group.
| Income Bracket | # Households | % Households |
| Less than $10,000 | 355 | 7.4% |
| $10,000 to $14,999 | 350 | 7.3% |
| $15,000 to $24,999 | 541 | 11.3% |
| $25,000 to $34,999 | 460 | 9.6% |
| $35,000 to $49,999 | 609 | 12.7% |
| $50,000 to $74,999 | 1,131 | 23.6% |
| $75,000 to $99,999 | 508 | 10.6% |
| $100,000 to $149,999 | 585 | 12.2% |
| $150,000 to $199,999 | 163 | 3.4% |
| $200,000+ | 101 | 2.1% |
Household Income by Householder Age in Fulton
The median household income in Fulton is $51,243, with the highest median household income of $62,317 found in the 45 to 64 years age bracket for the primary householder. A total of 1,656 households (34.6%) fall into this category. Meanwhile, the 65+ years age bracket for the primary householder has the lowest median household income of $31,504, with 1,199 households (25.0%) in this group.
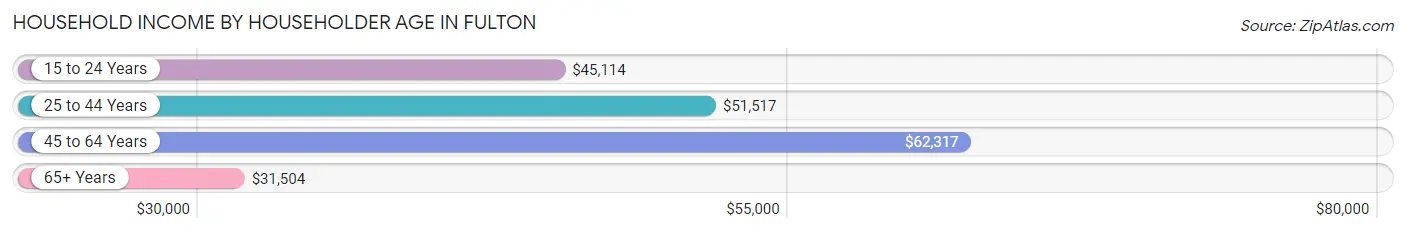
| Income Bracket | # Households | Median Income |
| 15 to 24 Years | 312 (6.5%) | $45,114 |
| 25 to 44 Years | 1,625 (33.9%) | $51,517 |
| 45 to 64 Years | 1,656 (34.6%) | $62,317 |
| 65+ Years | 1,199 (25.0%) | $31,504 |
| Total | 4,792 (100.0%) | $51,243 |
Poverty in Fulton
Income Below Poverty by Sex and Age in Fulton
With 21.9% poverty level for males and 26.0% for females among the residents of Fulton, 6 to 11 year old males and 6 to 11 year old females are the most vulnerable to poverty, with 232 males (49.3%) and 112 females (39.9%) in their respective age groups living below the poverty level.
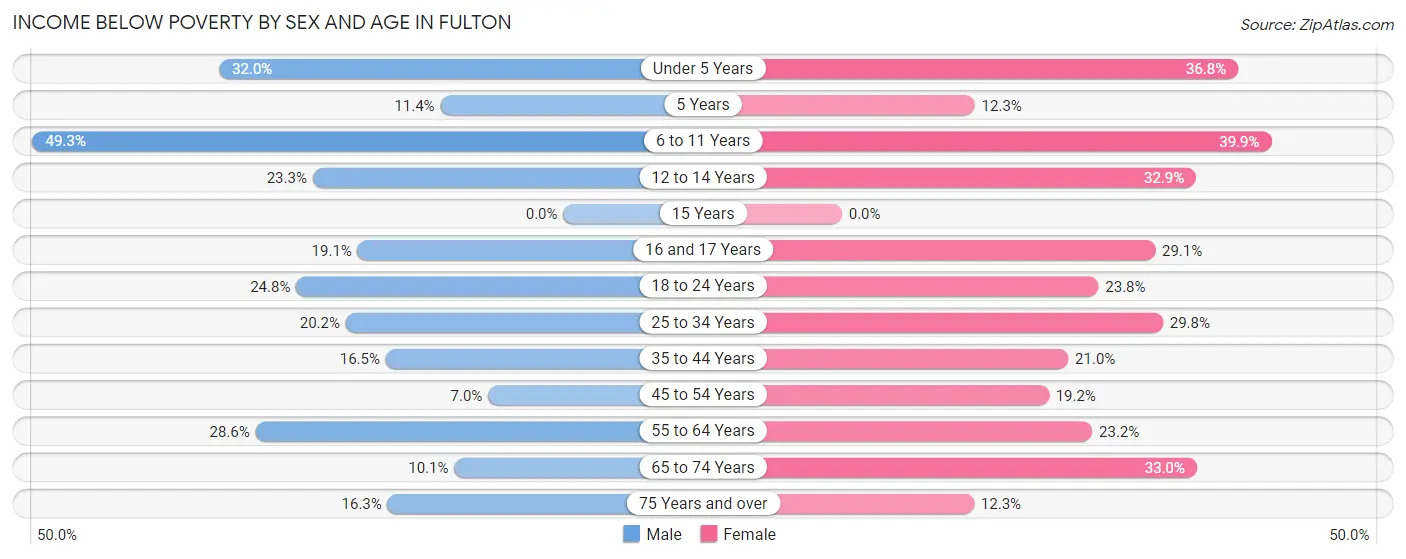
| Age Bracket | Male | Female |
| Under 5 Years | 147 (32.0%) | 139 (36.8%) |
| 5 Years | 17 (11.4%) | 9 (12.3%) |
| 6 to 11 Years | 232 (49.3%) | 112 (39.9%) |
| 12 to 14 Years | 60 (23.3%) | 122 (32.9%) |
| 15 Years | 0 (0.0%) | 0 (0.0%) |
| 16 and 17 Years | 21 (19.1%) | 25 (29.1%) |
| 18 to 24 Years | 176 (24.8%) | 145 (23.8%) |
| 25 to 34 Years | 166 (20.2%) | 258 (29.8%) |
| 35 to 44 Years | 86 (16.5%) | 158 (21.0%) |
| 45 to 54 Years | 50 (7.0%) | 110 (19.2%) |
| 55 to 64 Years | 208 (28.6%) | 148 (23.2%) |
| 65 to 74 Years | 42 (10.1%) | 171 (33.0%) |
| 75 Years and over | 38 (16.3%) | 51 (12.3%) |
| Total | 1,243 (21.9%) | 1,448 (26.0%) |
Income Above Poverty by Sex and Age in Fulton
According to the poverty statistics in Fulton, males aged 15 years and females aged 15 years are the age groups that are most secure financially, with 100.0% of males and 100.0% of females in these age groups living above the poverty line.
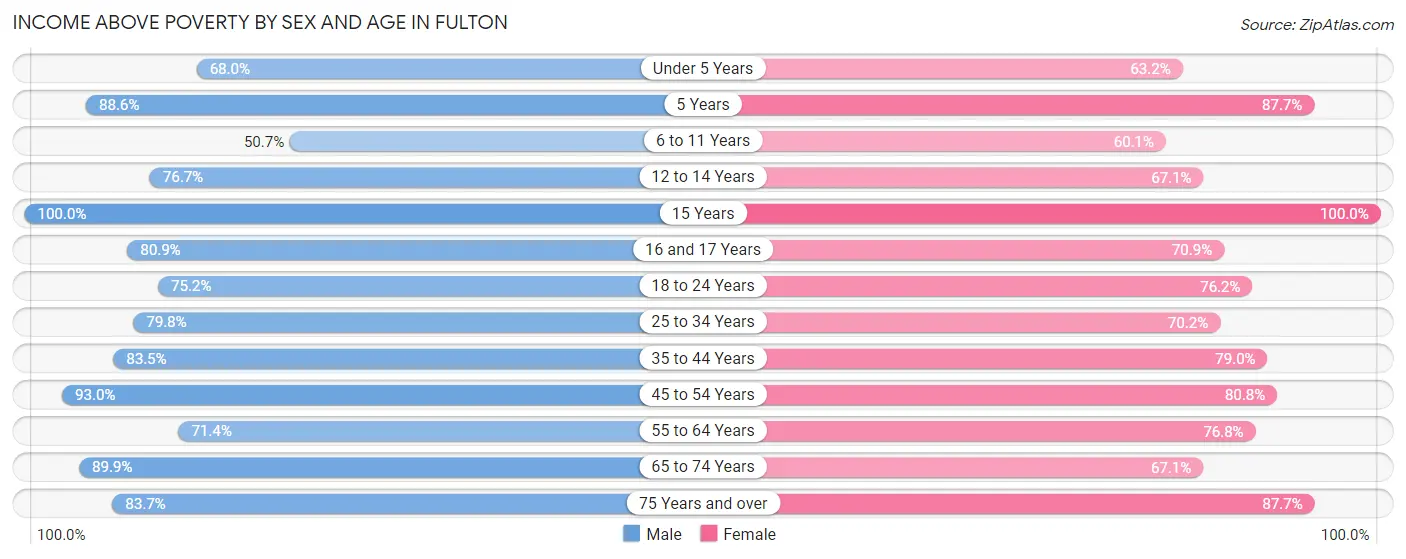
| Age Bracket | Male | Female |
| Under 5 Years | 313 (68.0%) | 239 (63.2%) |
| 5 Years | 132 (88.6%) | 64 (87.7%) |
| 6 to 11 Years | 239 (50.7%) | 169 (60.1%) |
| 12 to 14 Years | 198 (76.7%) | 249 (67.1%) |
| 15 Years | 78 (100.0%) | 19 (100.0%) |
| 16 and 17 Years | 89 (80.9%) | 61 (70.9%) |
| 18 to 24 Years | 534 (75.2%) | 464 (76.2%) |
| 25 to 34 Years | 656 (79.8%) | 608 (70.2%) |
| 35 to 44 Years | 436 (83.5%) | 594 (79.0%) |
| 45 to 54 Years | 666 (93.0%) | 463 (80.8%) |
| 55 to 64 Years | 520 (71.4%) | 489 (76.8%) |
| 65 to 74 Years | 373 (89.9%) | 348 (67.0%) |
| 75 Years and over | 195 (83.7%) | 365 (87.7%) |
| Total | 4,429 (78.1%) | 4,132 (74.1%) |
Income Below Poverty Among Married-Couple Families in Fulton
The poverty statistics for married-couple families in Fulton show that 3.8% or 56 of the total 1,487 families live below the poverty line. Families with 3 or 4 children have the highest poverty rate of 13.2%, comprising of 15 families. On the other hand, families with no children have the lowest poverty rate of 2.0%, which includes 17 families.
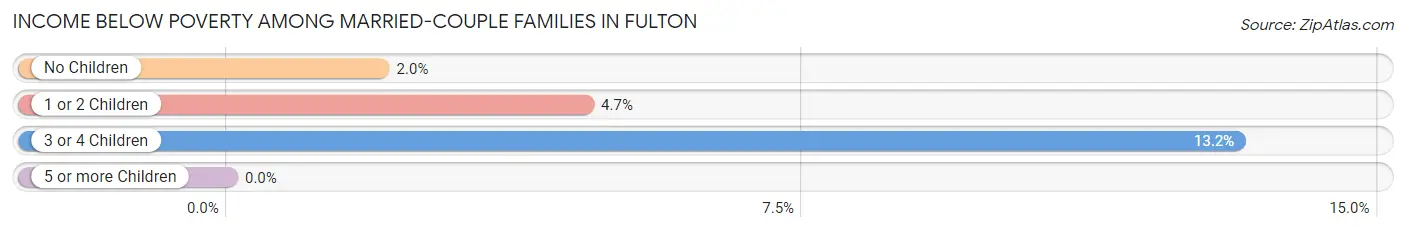
| Children | Above Poverty | Below Poverty |
| No Children | 840 (98.0%) | 17 (2.0%) |
| 1 or 2 Children | 492 (95.4%) | 24 (4.6%) |
| 3 or 4 Children | 99 (86.8%) | 15 (13.2%) |
| 5 or more Children | 0 (0.0%) | 0 (0.0%) |
| Total | 1,431 (96.2%) | 56 (3.8%) |
Income Below Poverty Among Single-Parent Households in Fulton
According to the poverty data in Fulton, 16.7% or 66 single-father households and 44.7% or 481 single-mother households are living below the poverty line. Among single-father households, those with 3 or 4 children have the highest poverty rate, with 7 households (43.8%) experiencing poverty. Likewise, among single-mother households, those with 5 or more children have the highest poverty rate, with 29 households (100.0%) falling below the poverty line.
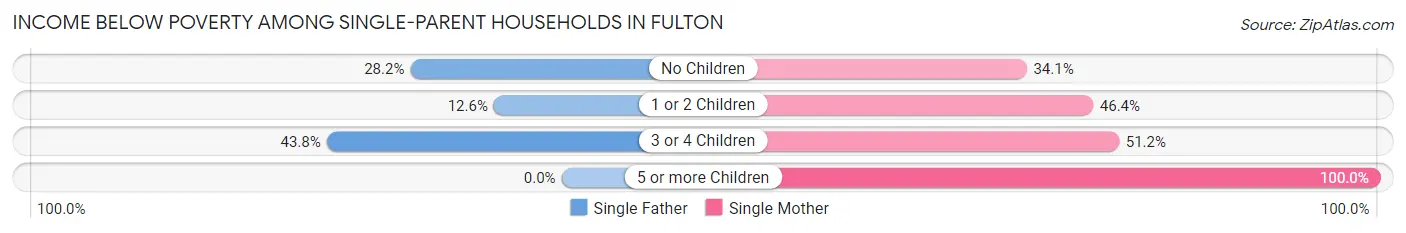
| Children | Single Father | Single Mother |
| No Children | 20 (28.2%) | 111 (34.1%) |
| 1 or 2 Children | 39 (12.6%) | 279 (46.4%) |
| 3 or 4 Children | 7 (43.8%) | 62 (51.2%) |
| 5 or more Children | 0 (0.0%) | 29 (100.0%) |
| Total | 66 (16.7%) | 481 (44.7%) |
Income Below Poverty Among Married-Couple vs Single-Parent Households in Fulton
The poverty data for Fulton shows that 56 of the married-couple family households (3.8%) and 547 of the single-parent households (37.1%) are living below the poverty level. Within the married-couple family households, those with 3 or 4 children have the highest poverty rate, with 15 households (13.2%) falling below the poverty line. Among the single-parent households, those with 5 or more children have the highest poverty rate, with 29 household (100.0%) living below poverty.
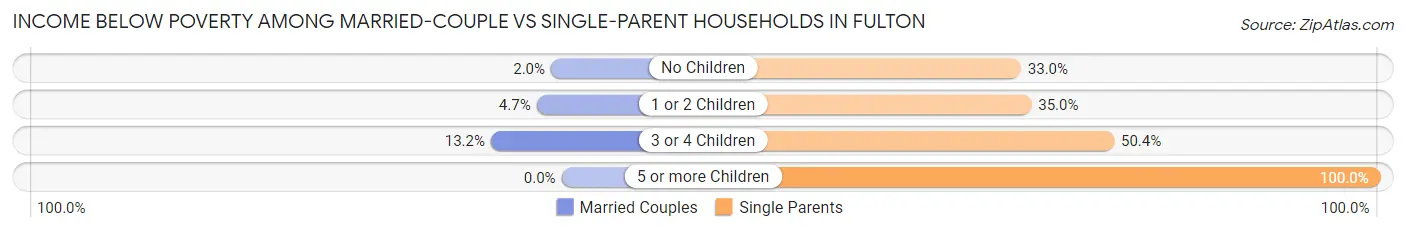
| Children | Married-Couple Families | Single-Parent Households |
| No Children | 17 (2.0%) | 131 (33.0%) |
| 1 or 2 Children | 24 (4.6%) | 318 (34.9%) |
| 3 or 4 Children | 15 (13.2%) | 69 (50.4%) |
| 5 or more Children | 0 (0.0%) | 29 (100.0%) |
| Total | 56 (3.8%) | 547 (37.1%) |
Race in Fulton
The most populous races in Fulton are White / Caucasian (10,578 | 92.9%), Hispanic or Latino (432 | 3.8%), and Two or more Races (408 | 3.6%).
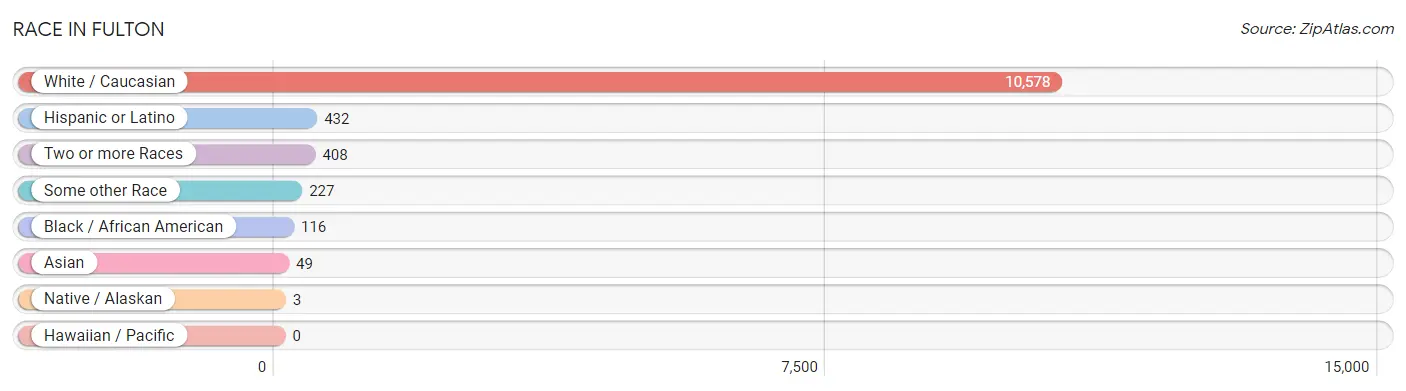
| Race | # Population | % Population |
| Asian | 49 | 0.4% |
| Black / African American | 116 | 1.0% |
| Hawaiian / Pacific | 0 | 0.0% |
| Hispanic or Latino | 432 | 3.8% |
| Native / Alaskan | 3 | 0.0% |
| White / Caucasian | 10,578 | 92.9% |
| Two or more Races | 408 | 3.6% |
| Some other Race | 227 | 2.0% |
| Total | 11,381 | 100.0% |
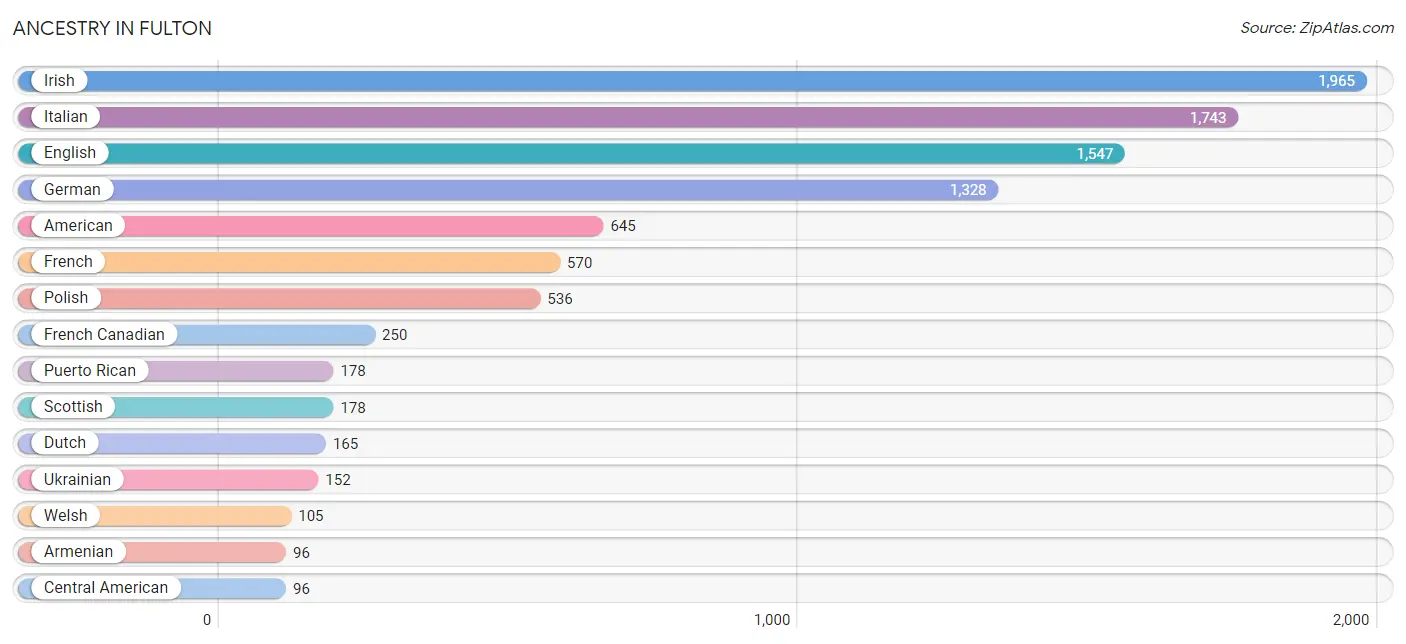
Ancestry in Fulton
The most populous ancestries reported in Fulton are Irish (1,965 | 17.3%), Italian (1,743 | 15.3%), English (1,547 | 13.6%), German (1,328 | 11.7%), and American (645 | 5.7%), together accounting for 63.5% of all Fulton residents.
| Ancestry | # Population | % Population |
| American | 645 | 5.7% |
| Arab | 68 | 0.6% |
| Armenian | 96 | 0.8% |
| Blackfeet | 1 | 0.0% |
| British | 22 | 0.2% |
| Burmese | 5 | 0.0% |
| Canadian | 41 | 0.4% |
| Central American | 96 | 0.8% |
| Central American Indian | 13 | 0.1% |
| Cherokee | 20 | 0.2% |
| Danish | 31 | 0.3% |
| Dominican | 30 | 0.3% |
| Dutch | 165 | 1.5% |
| Eastern European | 25 | 0.2% |
| English | 1,547 | 13.6% |
| European | 12 | 0.1% |
| French | 570 | 5.0% |
| French Canadian | 250 | 2.2% |
| German | 1,328 | 11.7% |
| Guatemalan | 96 | 0.8% |
| Irish | 1,965 | 17.3% |
| Iroquois | 77 | 0.7% |
| Italian | 1,743 | 15.3% |
| Korean | 40 | 0.4% |
| Lebanese | 26 | 0.2% |
| Liberian | 15 | 0.1% |
| Lithuanian | 3 | 0.0% |
| Maltese | 11 | 0.1% |
| Mexican | 38 | 0.3% |
| Norwegian | 63 | 0.5% |
| Pakistani | 34 | 0.3% |
| Palestinian | 35 | 0.3% |
| Pennsylvania German | 37 | 0.3% |
| Polish | 536 | 4.7% |
| Portuguese | 13 | 0.1% |
| Puerto Rican | 178 | 1.6% |
| Russian | 8 | 0.1% |
| Scandinavian | 10 | 0.1% |
| Scotch-Irish | 23 | 0.2% |
| Scottish | 178 | 1.6% |
| Slovak | 32 | 0.3% |
| Subsaharan African | 15 | 0.1% |
| Swedish | 42 | 0.4% |
| Syrian | 7 | 0.1% |
| Thai | 7 | 0.1% |
| Ukrainian | 152 | 1.3% |
| Welsh | 105 | 0.9% | View All 47 Rows |
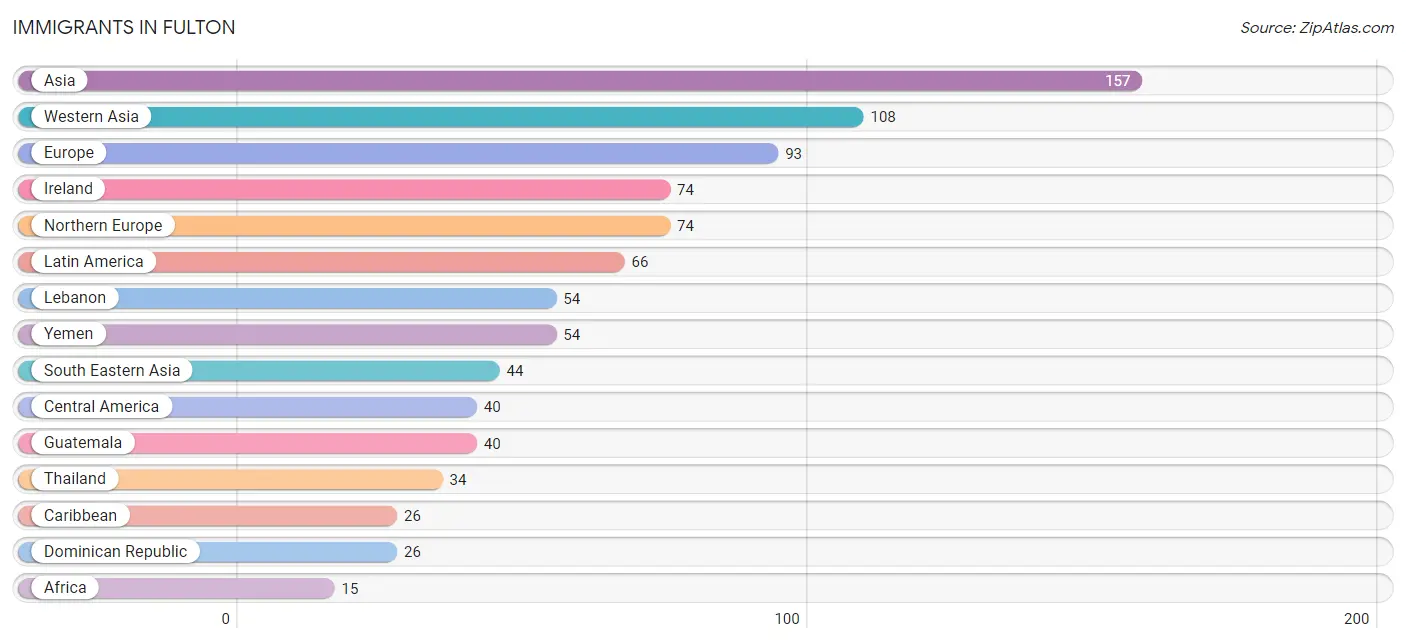
Immigrants in Fulton
The most numerous immigrant groups reported in Fulton came from Asia (157 | 1.4%), Western Asia (108 | 0.9%), Europe (93 | 0.8%), Ireland (74 | 0.6%), and Northern Europe (74 | 0.6%), together accounting for 4.4% of all Fulton residents.
| Immigration Origin | # Population | % Population |
| Africa | 15 | 0.1% |
| Asia | 157 | 1.4% |
| Australia | 7 | 0.1% |
| Caribbean | 26 | 0.2% |
| Central America | 40 | 0.4% |
| Dominican Republic | 26 | 0.2% |
| Eastern Asia | 5 | 0.0% |
| Europe | 93 | 0.8% |
| Germany | 8 | 0.1% |
| Guatemala | 40 | 0.4% |
| Ireland | 74 | 0.6% |
| Korea | 5 | 0.0% |
| Latin America | 66 | 0.6% |
| Lebanon | 54 | 0.5% |
| Liberia | 15 | 0.1% |
| Northern Europe | 74 | 0.6% |
| Oceania | 7 | 0.1% |
| Philippines | 10 | 0.1% |
| Portugal | 11 | 0.1% |
| South Eastern Asia | 44 | 0.4% |
| Southern Europe | 11 | 0.1% |
| Thailand | 34 | 0.3% |
| Western Africa | 15 | 0.1% |
| Western Asia | 108 | 0.9% |
| Western Europe | 8 | 0.1% |
| Yemen | 54 | 0.5% | View All 26 Rows |
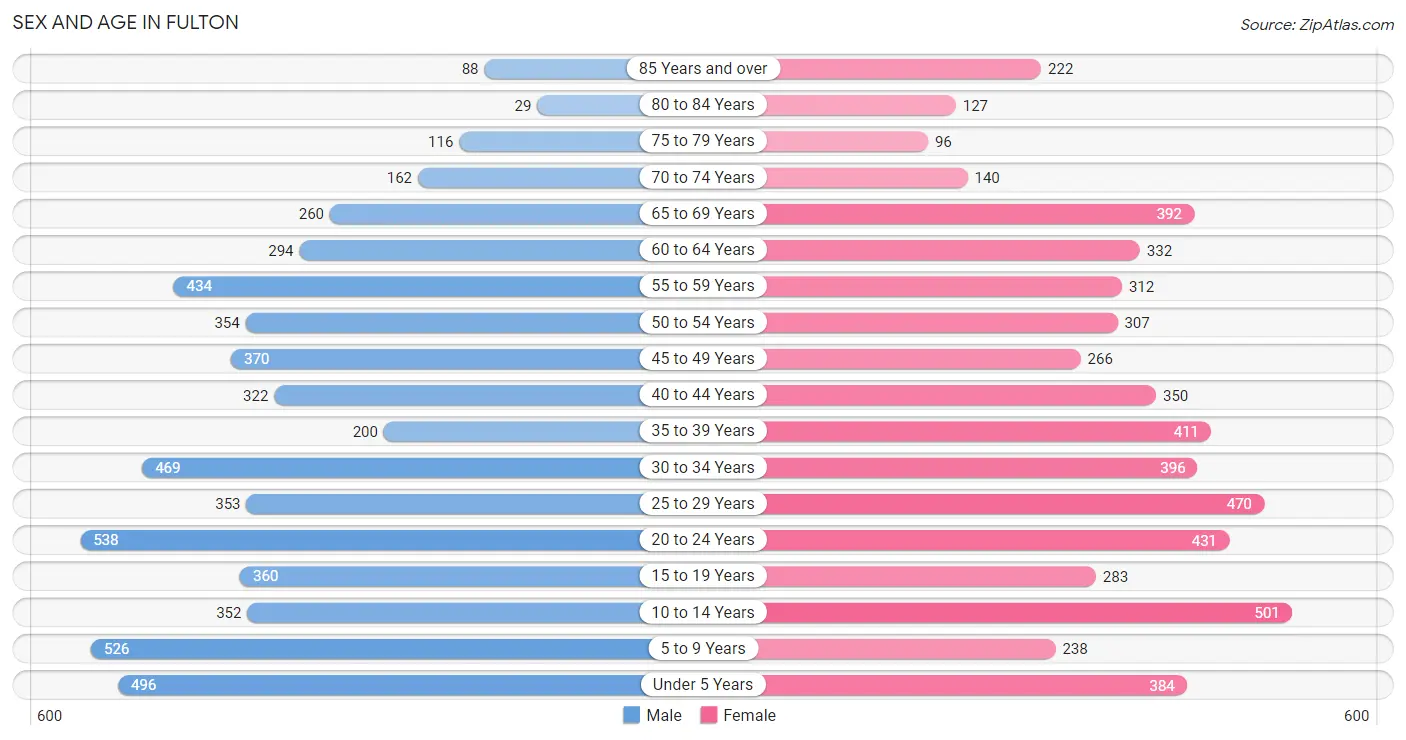
Sex and Age in Fulton
Sex and Age in Fulton
The most populous age groups in Fulton are 20 to 24 Years (538 | 9.4%) for men and 10 to 14 Years (501 | 8.8%) for women.
| Age Bracket | Male | Female |
| Under 5 Years | 496 (8.7%) | 384 (6.8%) |
| 5 to 9 Years | 526 (9.2%) | 238 (4.2%) |
| 10 to 14 Years | 352 (6.1%) | 501 (8.8%) |
| 15 to 19 Years | 360 (6.3%) | 283 (5.0%) |
| 20 to 24 Years | 538 (9.4%) | 431 (7.6%) |
| 25 to 29 Years | 353 (6.2%) | 470 (8.3%) |
| 30 to 34 Years | 469 (8.2%) | 396 (7.0%) |
| 35 to 39 Years | 200 (3.5%) | 411 (7.3%) |
| 40 to 44 Years | 322 (5.6%) | 350 (6.2%) |
| 45 to 49 Years | 370 (6.5%) | 266 (4.7%) |
| 50 to 54 Years | 354 (6.2%) | 307 (5.4%) |
| 55 to 59 Years | 434 (7.6%) | 312 (5.5%) |
| 60 to 64 Years | 294 (5.1%) | 332 (5.9%) |
| 65 to 69 Years | 260 (4.5%) | 392 (6.9%) |
| 70 to 74 Years | 162 (2.8%) | 140 (2.5%) |
| 75 to 79 Years | 116 (2.0%) | 96 (1.7%) |
| 80 to 84 Years | 29 (0.5%) | 127 (2.2%) |
| 85 Years and over | 88 (1.5%) | 222 (3.9%) |
| Total | 5,723 (100.0%) | 5,658 (100.0%) |
Families and Households in Fulton
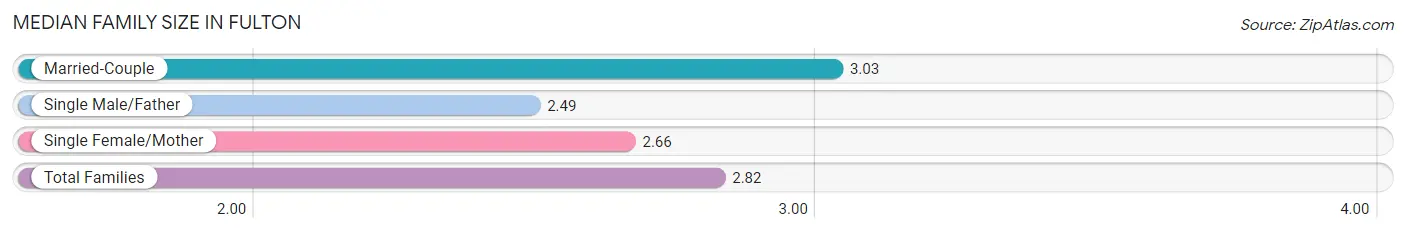
Median Family Size in Fulton
The median family size in Fulton is 2.82 persons per family, with married-couple families (1,487 | 50.2%) accounting for the largest median family size of 3.03 persons per family. On the other hand, single male/father families (396 | 13.4%) represent the smallest median family size with 2.49 persons per family.
| Family Type | # Families | Family Size |
| Married-Couple | 1,487 (50.2%) | 3.03 |
| Single Male/Father | 396 (13.4%) | 2.49 |
| Single Female/Mother | 1,077 (36.4%) | 2.66 |
| Total Families | 2,960 (100.0%) | 2.82 |
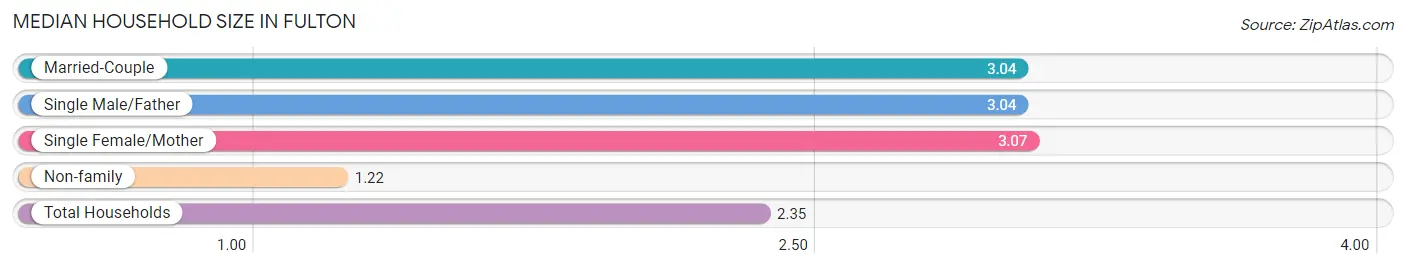
Median Household Size in Fulton
The median household size in Fulton is 2.35 persons per household, with single female/mother households (1,077 | 22.5%) accounting for the largest median household size of 3.07 persons per household. non-family households (1,832 | 38.2%) represent the smallest median household size with 1.22 persons per household.
| Household Type | # Households | Household Size |
| Married-Couple | 1,487 (31.0%) | 3.04 |
| Single Male/Father | 396 (8.3%) | 3.04 |
| Single Female/Mother | 1,077 (22.5%) | 3.07 |
| Non-family | 1,832 (38.2%) | 1.22 |
| Total Households | 4,792 (100.0%) | 2.35 |
Household Size by Marriage Status in Fulton
Out of a total of 4,792 households in Fulton, 2,960 (61.8%) are family households, while 1,832 (38.2%) are nonfamily households. The most numerous type of family households are 2-person households, comprising 1,035, and the most common type of nonfamily households are 1-person households, comprising 1,502.
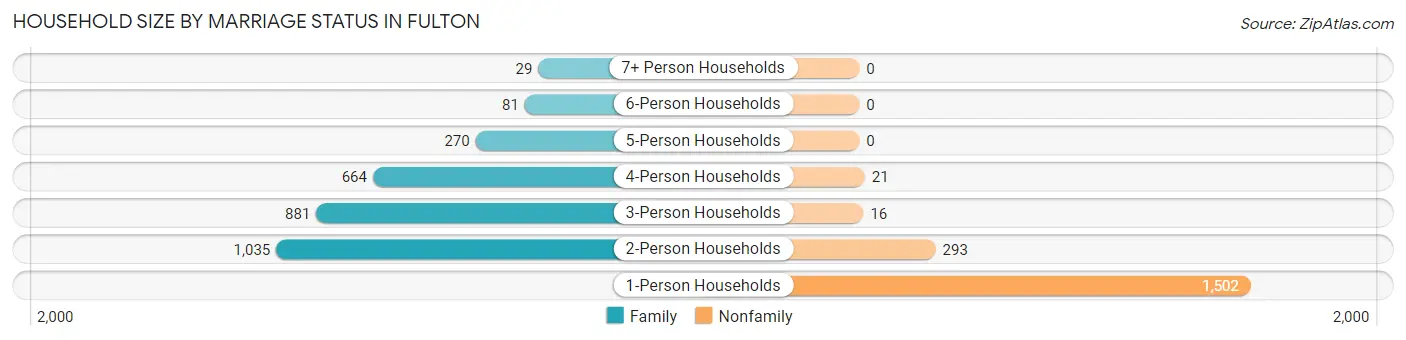
| Household Size | Family Households | Nonfamily Households |
| 1-Person Households | - | 1,502 (31.3%) |
| 2-Person Households | 1,035 (21.6%) | 293 (6.1%) |
| 3-Person Households | 881 (18.4%) | 16 (0.3%) |
| 4-Person Households | 664 (13.9%) | 21 (0.4%) |
| 5-Person Households | 270 (5.6%) | 0 (0.0%) |
| 6-Person Households | 81 (1.7%) | 0 (0.0%) |
| 7+ Person Households | 29 (0.6%) | 0 (0.0%) |
| Total | 2,960 (61.8%) | 1,832 (38.2%) |
Female Fertility in Fulton
Fertility by Age in Fulton
Average fertility rate in Fulton is 50.0 births per 1,000 women. Women in the age bracket of 20 to 34 years have the highest fertility rate with 60.0 births per 1,000 women. Women in the age bracket of 20 to 34 years acount for 58.7% of all women with births.
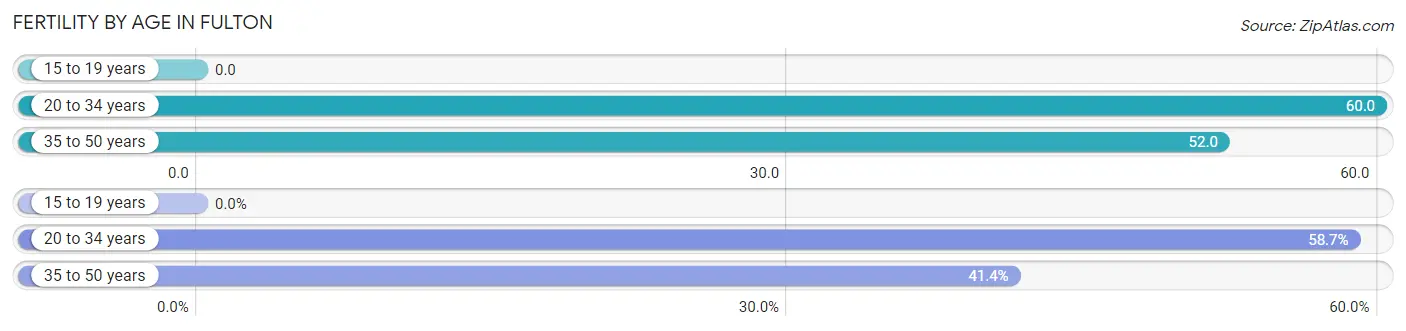
| Age Bracket | Women with Births | Births / 1,000 Women |
| 15 to 19 years | 0 (0.0%) | 0.0 |
| 20 to 34 years | 78 (58.7%) | 60.0 |
| 35 to 50 years | 55 (41.3%) | 52.0 |
| Total | 133 (100.0%) | 50.0 |
Fertility by Age by Marriage Status in Fulton
5.3% of women with births (133) in Fulton are married. The highest percentage of unmarried women with births falls into 35 to 50 years age bracket with 100.0% of them unmarried at the time of birth, while the lowest percentage of unmarried women with births belong to 20 to 34 years age bracket with 91.0% of them unmarried.
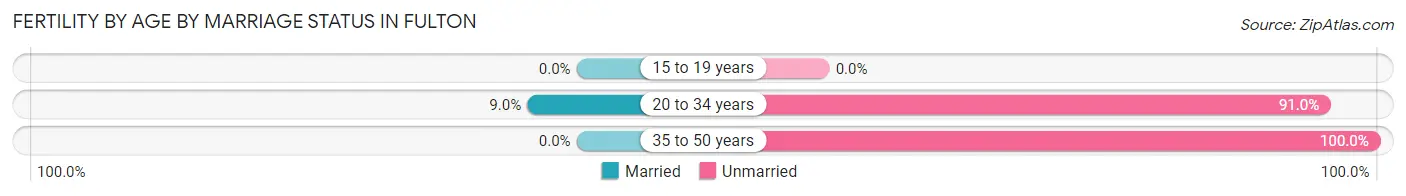
| Age Bracket | Married | Unmarried |
| 15 to 19 years | 0 (0.0%) | 0 (0.0%) |
| 20 to 34 years | 7 (9.0%) | 71 (91.0%) |
| 35 to 50 years | 0 (0.0%) | 55 (100.0%) |
| Total | 7 (5.3%) | 126 (94.7%) |
Fertility by Education in Fulton
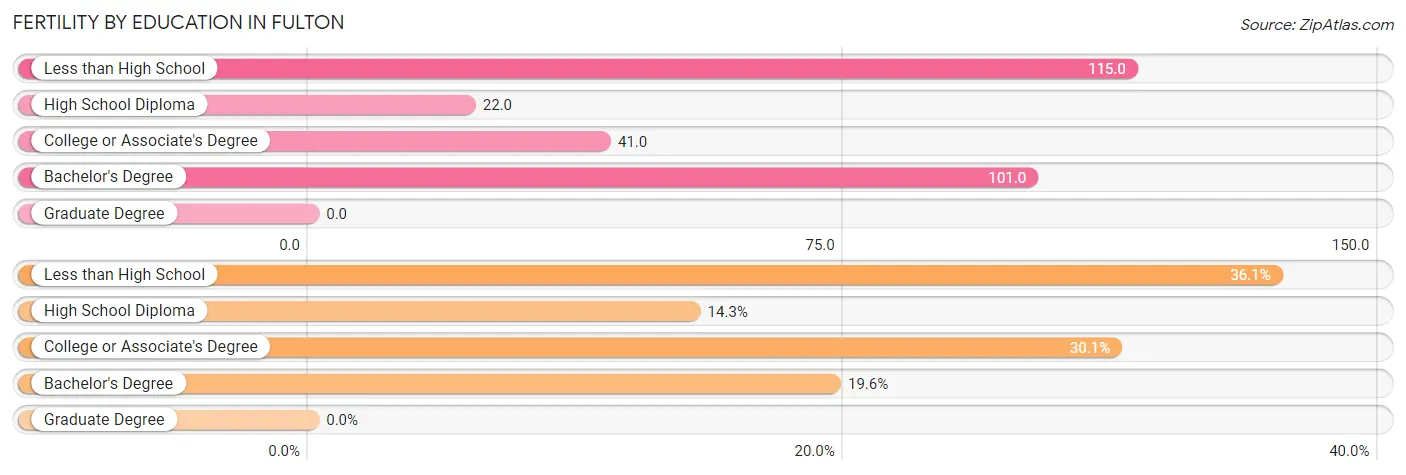
| Educational Attainment | Women with Births | Births / 1,000 Women |
| Less than High School | 48 (36.1%) | 115.0 |
| High School Diploma | 19 (14.3%) | 22.0 |
| College or Associate's Degree | 40 (30.1%) | 41.0 |
| Bachelor's Degree | 26 (19.6%) | 101.0 |
| Graduate Degree | 0 (0.0%) | 0.0 |
| Total | 133 (100.0%) | 50.0 |
Fertility by Education by Marriage Status in Fulton
94.7% of women with births in Fulton are unmarried. Women with the educational attainment of high school diploma are most likely to be married with 36.8% of them married at childbirth, while women with the educational attainment of less than high school are least likely to be married with 100.0% of them unmarried at childbirth.
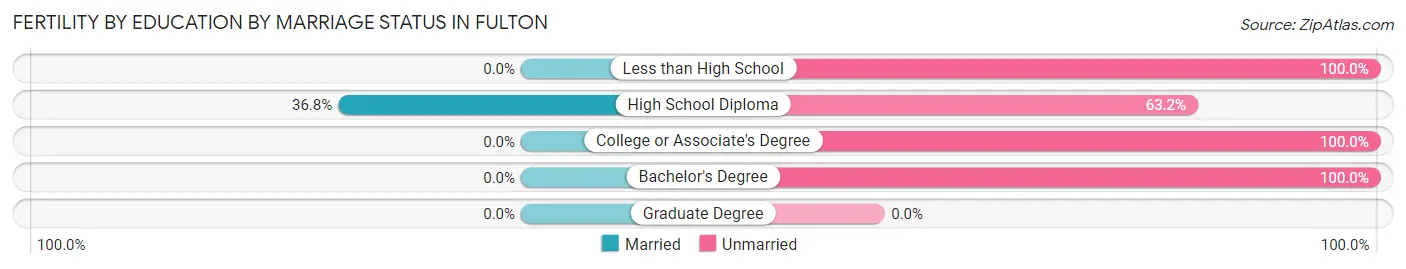
| Educational Attainment | Married | Unmarried |
| Less than High School | 0 (0.0%) | 48 (100.0%) |
| High School Diploma | 7 (36.8%) | 12 (63.2%) |
| College or Associate's Degree | 0 (0.0%) | 40 (100.0%) |
| Bachelor's Degree | 0 (0.0%) | 26 (100.0%) |
| Graduate Degree | 0 (0.0%) | 0 (0.0%) |
| Total | 7 (5.3%) | 126 (94.7%) |
Employment Characteristics in Fulton
Employment by Class of Employer in Fulton
Among the 4,765 employed individuals in Fulton, private company employees (3,289 | 69.0%), local government employees (481 | 10.1%), and not-for-profit organizations (427 | 9.0%) make up the most common classes of employment.
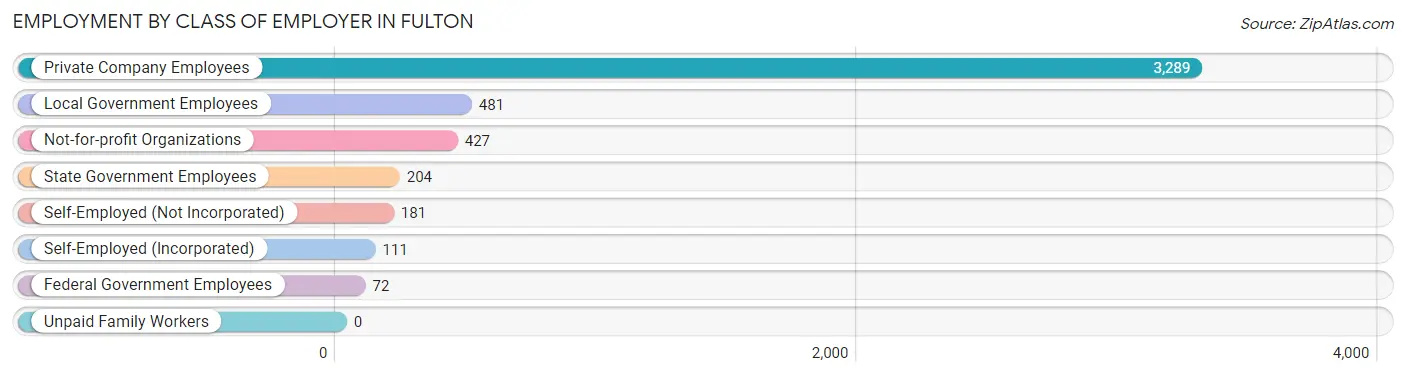
| Employer Class | # Employees | % Employees |
| Private Company Employees | 3,289 | 69.0% |
| Self-Employed (Incorporated) | 111 | 2.3% |
| Self-Employed (Not Incorporated) | 181 | 3.8% |
| Not-for-profit Organizations | 427 | 9.0% |
| Local Government Employees | 481 | 10.1% |
| State Government Employees | 204 | 4.3% |
| Federal Government Employees | 72 | 1.5% |
| Unpaid Family Workers | 0 | 0.0% |
| Total | 4,765 | 100.0% |
Employment Status by Age in Fulton
According to the labor force statistics for Fulton, out of the total population over 16 years of age (8,787), 59.9% or 5,263 individuals are in the labor force, with 9.0% or 474 of them unemployed. The age group with the highest labor force participation rate is 45 to 54 years, with 84.7% or 1,099 individuals in the labor force. Within the labor force, the 16 to 19 years age range has the highest percentage of unemployed individuals, with 33.1% or 104 of them being unemployed.
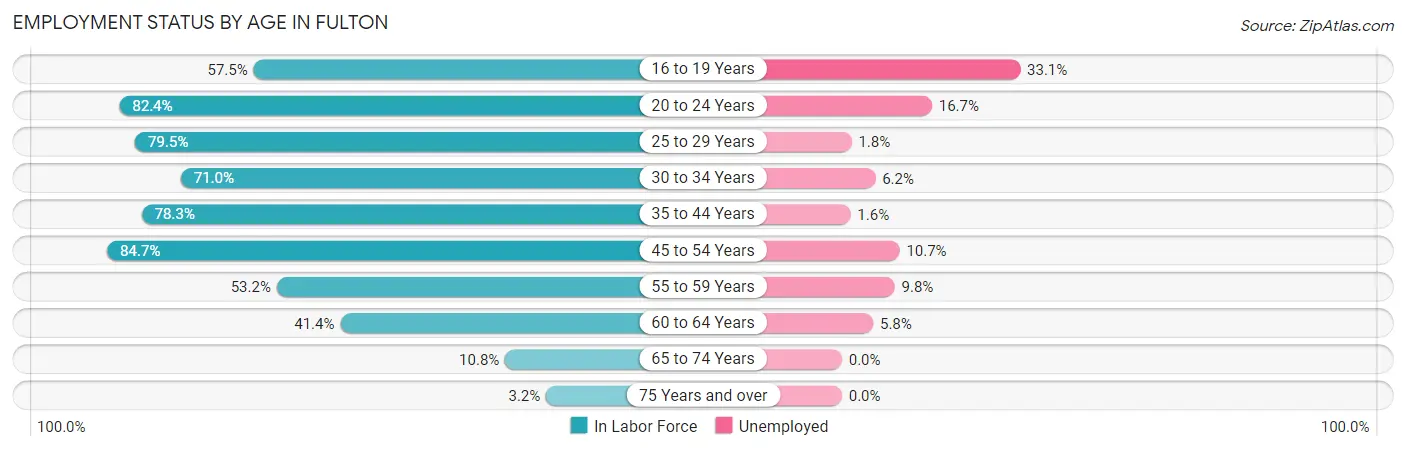
| Age Bracket | In Labor Force | Unemployed |
| 16 to 19 Years | 314 (57.5%) | 104 (33.1%) |
| 20 to 24 Years | 798 (82.4%) | 133 (16.7%) |
| 25 to 29 Years | 654 (79.5%) | 12 (1.8%) |
| 30 to 34 Years | 614 (71.0%) | 38 (6.2%) |
| 35 to 44 Years | 1,005 (78.3%) | 16 (1.6%) |
| 45 to 54 Years | 1,099 (84.7%) | 118 (10.7%) |
| 55 to 59 Years | 397 (53.2%) | 39 (9.8%) |
| 60 to 64 Years | 259 (41.4%) | 15 (5.8%) |
| 65 to 74 Years | 103 (10.8%) | 0 (0.0%) |
| 75 Years and over | 22 (3.2%) | 0 (0.0%) |
| Total | 5,263 (59.9%) | 474 (9.0%) |
Employment Status by Educational Attainment in Fulton
According to labor force statistics for Fulton, 71.4% of individuals (4,027) out of the total population between 25 and 64 years of age (5,640) are in the labor force, with 5.9% or 238 of them being unemployed. The group with the highest labor force participation rate are those with the educational attainment of bachelor's degree or higher, with 86.1% or 731 individuals in the labor force. Within the labor force, individuals with high school diploma education have the highest percentage of unemployment, with 10.3% or 148 of them being unemployed.
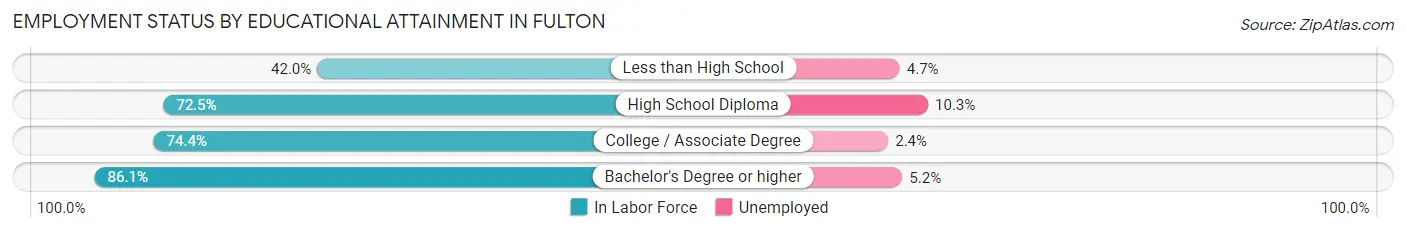
| Educational Attainment | In Labor Force | Unemployed |
| Less than High School | 298 (42.0%) | 33 (4.7%) |
| High School Diploma | 1,441 (72.5%) | 205 (10.3%) |
| College / Associate Degree | 1,559 (74.4%) | 50 (2.4%) |
| Bachelor's Degree or higher | 731 (86.1%) | 44 (5.2%) |
| Total | 4,027 (71.4%) | 333 (5.9%) |
Employment Occupations by Sex in Fulton
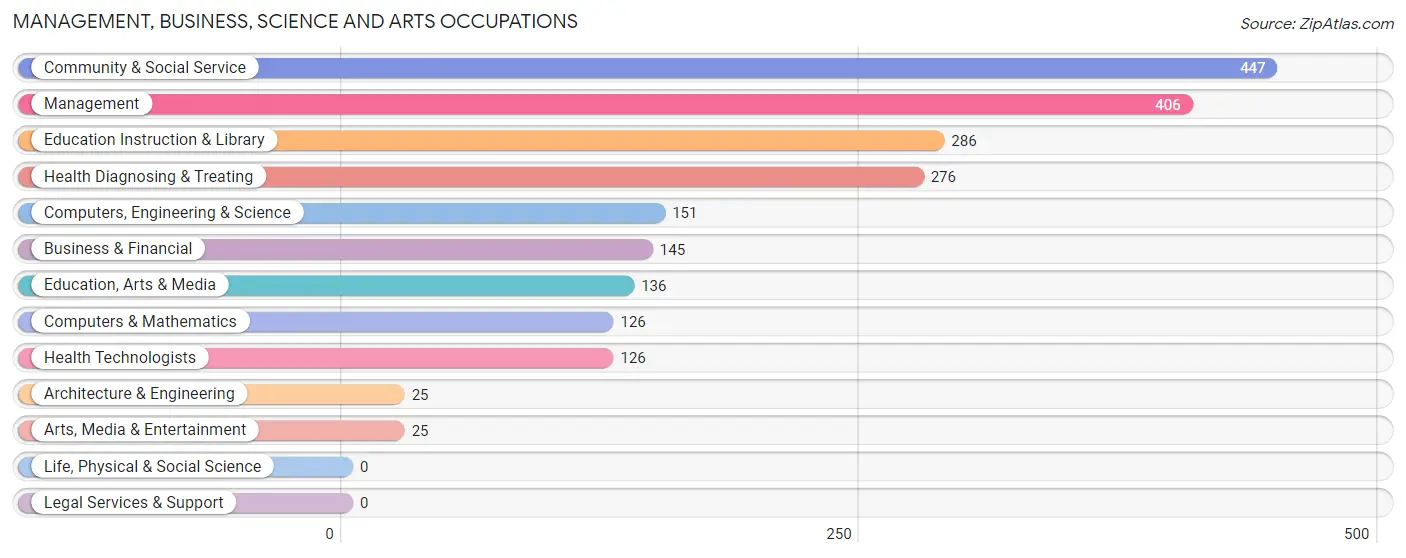
Management, Business, Science and Arts Occupations
The most common Management, Business, Science and Arts occupations in Fulton are Community & Social Service (447 | 9.4%), Management (406 | 8.5%), Education Instruction & Library (286 | 6.0%), Health Diagnosing & Treating (276 | 5.8%), and Computers, Engineering & Science (151 | 3.2%).
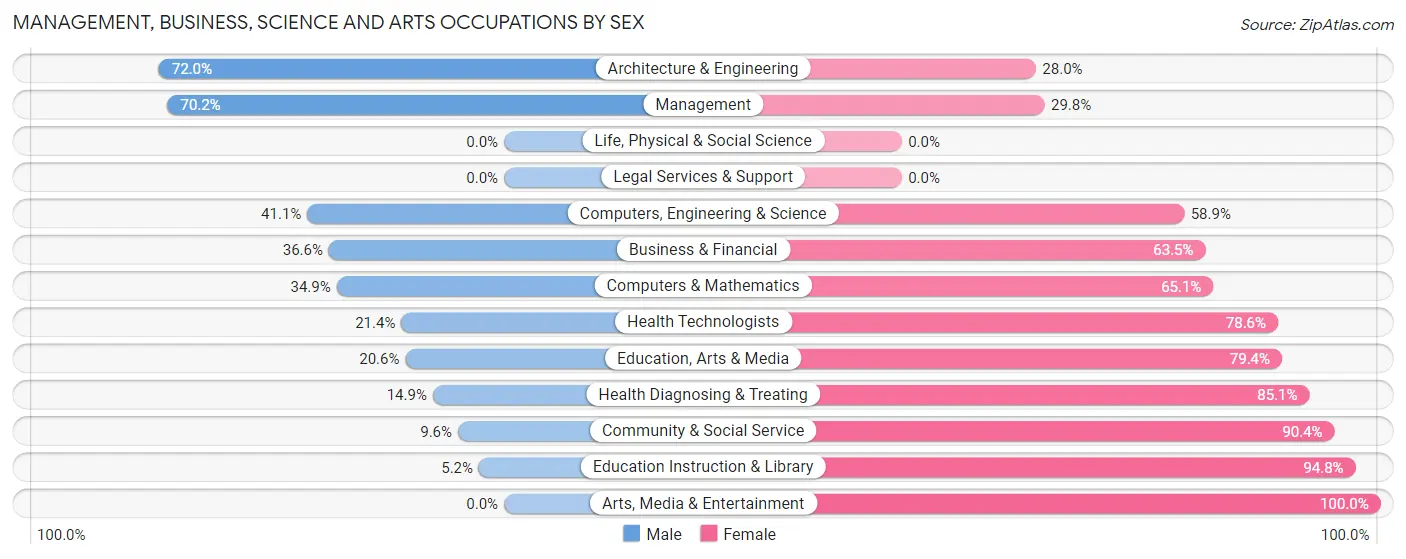
Management, Business, Science and Arts Occupations by Sex
Within the Management, Business, Science and Arts occupations in Fulton, the most male-oriented occupations are Architecture & Engineering (72.0%), Management (70.2%), and Computers, Engineering & Science (41.1%), while the most female-oriented occupations are Arts, Media & Entertainment (100.0%), Education Instruction & Library (94.8%), and Community & Social Service (90.4%).
| Occupation | Male | Female |
| Management | 285 (70.2%) | 121 (29.8%) |
| Business & Financial | 53 (36.5%) | 92 (63.4%) |
| Computers, Engineering & Science | 62 (41.1%) | 89 (58.9%) |
| Computers & Mathematics | 44 (34.9%) | 82 (65.1%) |
| Architecture & Engineering | 18 (72.0%) | 7 (28.0%) |
| Life, Physical & Social Science | 0 (0.0%) | 0 (0.0%) |
| Community & Social Service | 43 (9.6%) | 404 (90.4%) |
| Education, Arts & Media | 28 (20.6%) | 108 (79.4%) |
| Legal Services & Support | 0 (0.0%) | 0 (0.0%) |
| Education Instruction & Library | 15 (5.2%) | 271 (94.8%) |
| Arts, Media & Entertainment | 0 (0.0%) | 25 (100.0%) |
| Health Diagnosing & Treating | 41 (14.9%) | 235 (85.1%) |
| Health Technologists | 27 (21.4%) | 99 (78.6%) |
| Total (Category) | 484 (34.0%) | 941 (66.0%) |
| Total (Overall) | 2,421 (50.7%) | 2,350 (49.3%) |
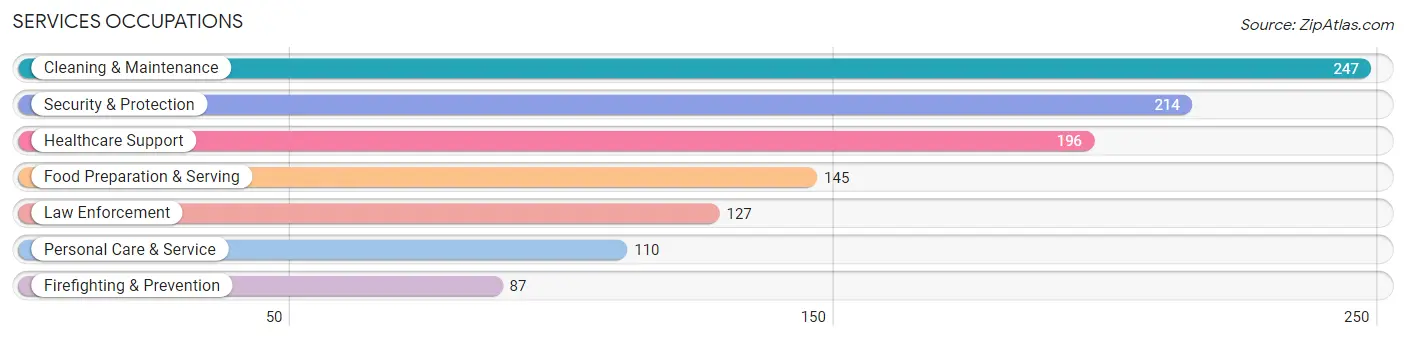
Services Occupations
The most common Services occupations in Fulton are Cleaning & Maintenance (247 | 5.2%), Security & Protection (214 | 4.5%), Healthcare Support (196 | 4.1%), Food Preparation & Serving (145 | 3.0%), and Law Enforcement (127 | 2.7%).
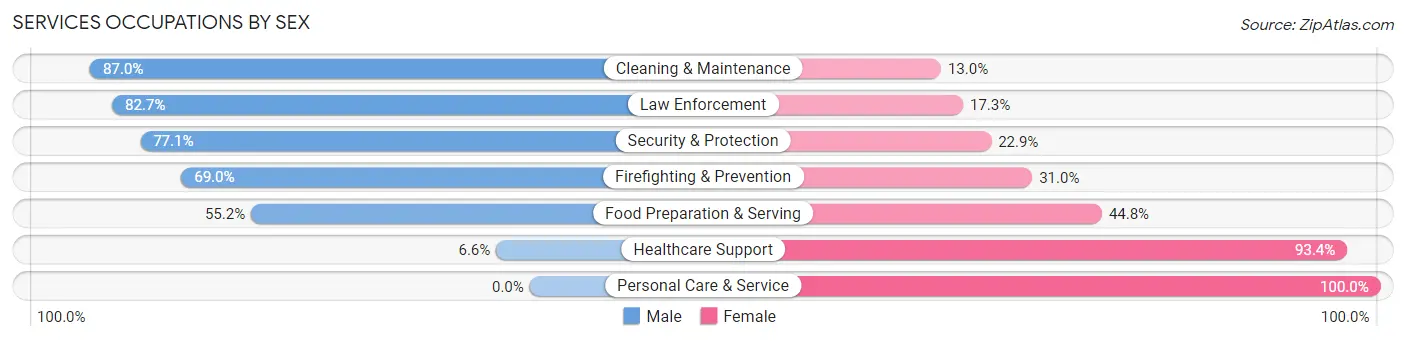
Services Occupations by Sex
Within the Services occupations in Fulton, the most male-oriented occupations are Cleaning & Maintenance (87.0%), Law Enforcement (82.7%), and Security & Protection (77.1%), while the most female-oriented occupations are Personal Care & Service (100.0%), Healthcare Support (93.4%), and Food Preparation & Serving (44.8%).
| Occupation | Male | Female |
| Healthcare Support | 13 (6.6%) | 183 (93.4%) |
| Security & Protection | 165 (77.1%) | 49 (22.9%) |
| Firefighting & Prevention | 60 (69.0%) | 27 (31.0%) |
| Law Enforcement | 105 (82.7%) | 22 (17.3%) |
| Food Preparation & Serving | 80 (55.2%) | 65 (44.8%) |
| Cleaning & Maintenance | 215 (87.0%) | 32 (13.0%) |
| Personal Care & Service | 0 (0.0%) | 110 (100.0%) |
| Total (Category) | 473 (51.9%) | 439 (48.1%) |
| Total (Overall) | 2,421 (50.7%) | 2,350 (49.3%) |
Sales and Office Occupations
The most common Sales and Office occupations in Fulton are Office & Administration (521 | 10.9%), and Sales & Related (478 | 10.0%).
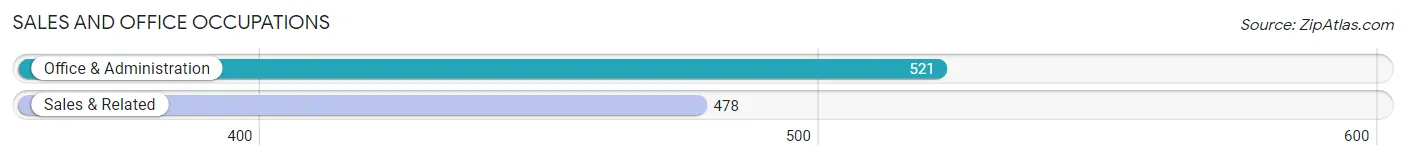
Sales and Office Occupations by Sex
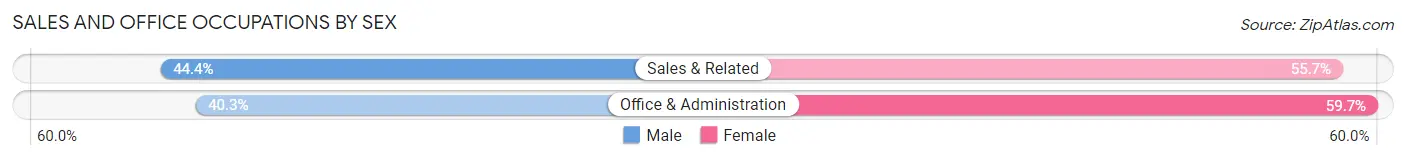
| Occupation | Male | Female |
| Sales & Related | 212 (44.4%) | 266 (55.6%) |
| Office & Administration | 210 (40.3%) | 311 (59.7%) |
| Total (Category) | 422 (42.2%) | 577 (57.8%) |
| Total (Overall) | 2,421 (50.7%) | 2,350 (49.3%) |
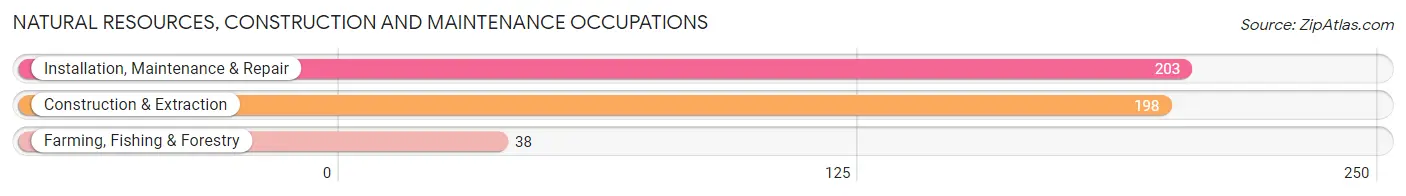
Natural Resources, Construction and Maintenance Occupations
The most common Natural Resources, Construction and Maintenance occupations in Fulton are Installation, Maintenance & Repair (203 | 4.3%), Construction & Extraction (198 | 4.2%), and Farming, Fishing & Forestry (38 | 0.8%).
Natural Resources, Construction and Maintenance Occupations by Sex
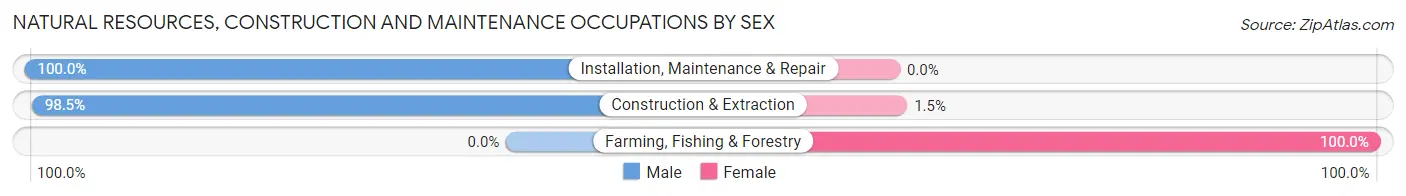
| Occupation | Male | Female |
| Farming, Fishing & Forestry | 0 (0.0%) | 38 (100.0%) |
| Construction & Extraction | 195 (98.5%) | 3 (1.5%) |
| Installation, Maintenance & Repair | 203 (100.0%) | 0 (0.0%) |
| Total (Category) | 398 (90.7%) | 41 (9.3%) |
| Total (Overall) | 2,421 (50.7%) | 2,350 (49.3%) |
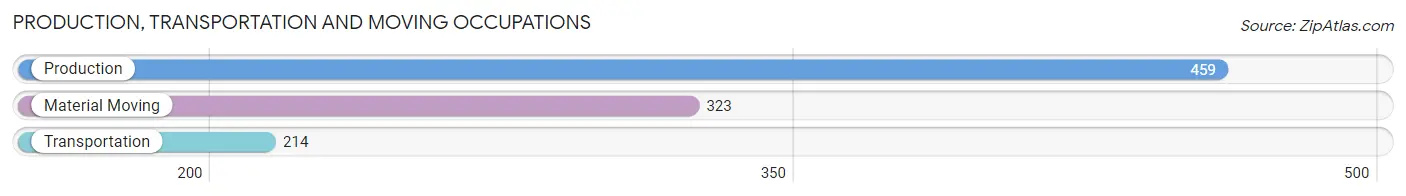
Production, Transportation and Moving Occupations
The most common Production, Transportation and Moving occupations in Fulton are Production (459 | 9.6%), Material Moving (323 | 6.8%), and Transportation (214 | 4.5%).
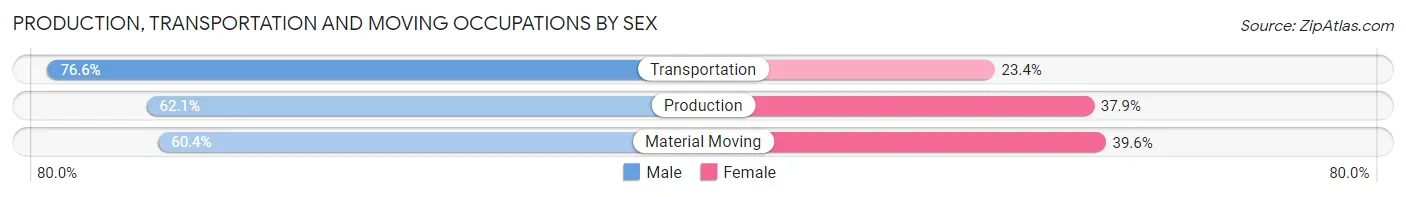
Production, Transportation and Moving Occupations by Sex
| Occupation | Male | Female |
| Production | 285 (62.1%) | 174 (37.9%) |
| Transportation | 164 (76.6%) | 50 (23.4%) |
| Material Moving | 195 (60.4%) | 128 (39.6%) |
| Total (Category) | 644 (64.7%) | 352 (35.3%) |
| Total (Overall) | 2,421 (50.7%) | 2,350 (49.3%) |
Employment Industries by Sex in Fulton
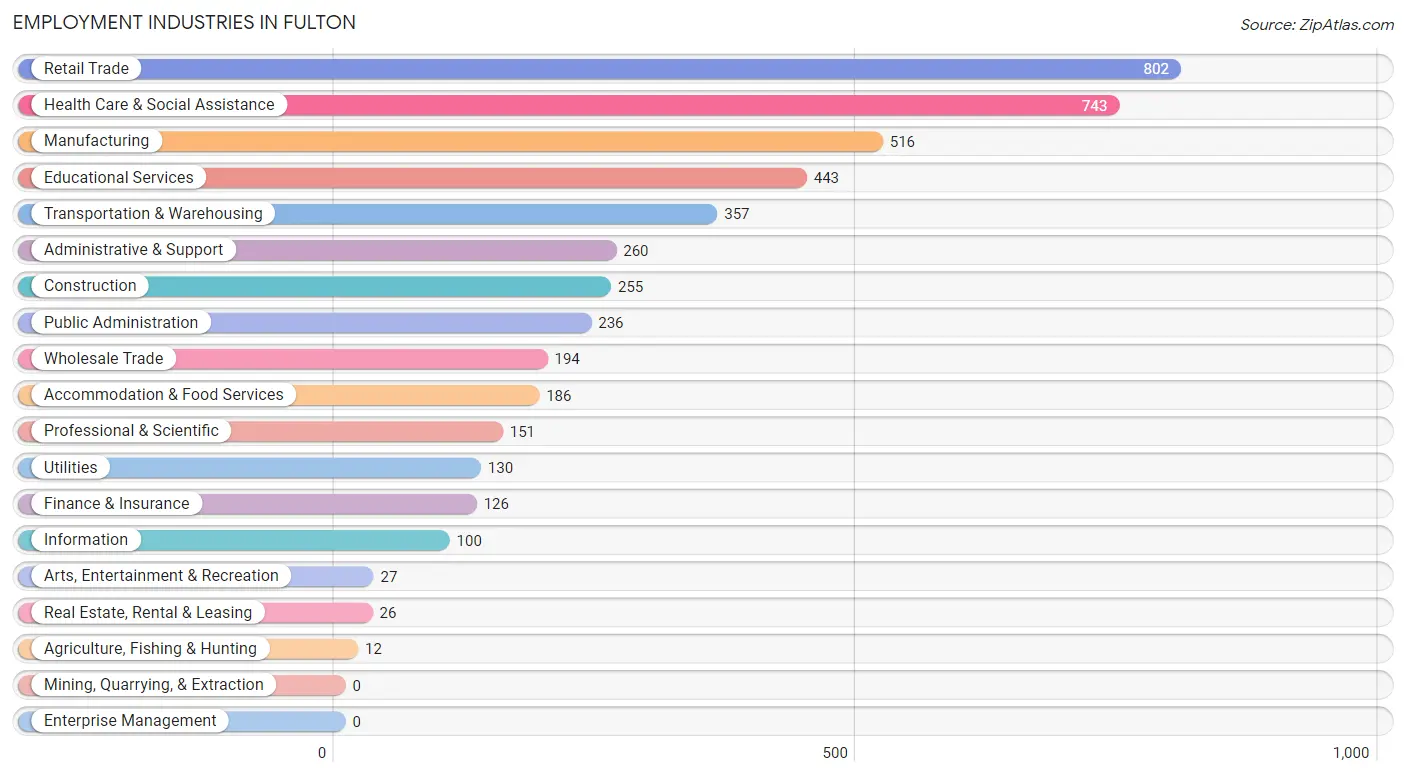
Employment Industries in Fulton
The major employment industries in Fulton include Retail Trade (802 | 16.8%), Health Care & Social Assistance (743 | 15.6%), Manufacturing (516 | 10.8%), Educational Services (443 | 9.3%), and Transportation & Warehousing (357 | 7.5%).
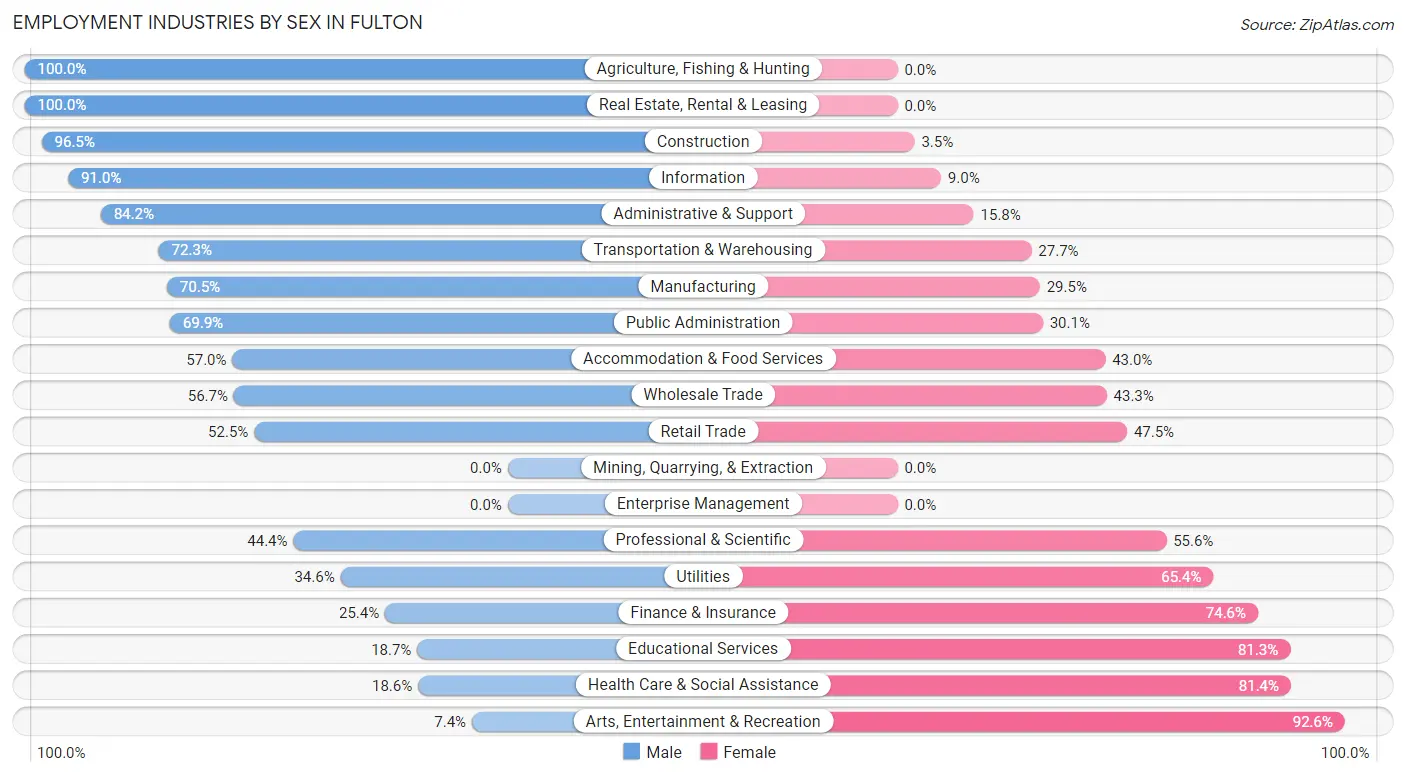
Employment Industries by Sex in Fulton
The Fulton industries that see more men than women are Agriculture, Fishing & Hunting (100.0%), Real Estate, Rental & Leasing (100.0%), and Construction (96.5%), whereas the industries that tend to have a higher number of women are Arts, Entertainment & Recreation (92.6%), Health Care & Social Assistance (81.4%), and Educational Services (81.3%).
| Industry | Male | Female |
| Agriculture, Fishing & Hunting | 12 (100.0%) | 0 (0.0%) |
| Mining, Quarrying, & Extraction | 0 (0.0%) | 0 (0.0%) |
| Construction | 246 (96.5%) | 9 (3.5%) |
| Manufacturing | 364 (70.5%) | 152 (29.5%) |
| Wholesale Trade | 110 (56.7%) | 84 (43.3%) |
| Retail Trade | 421 (52.5%) | 381 (47.5%) |
| Transportation & Warehousing | 258 (72.3%) | 99 (27.7%) |
| Utilities | 45 (34.6%) | 85 (65.4%) |
| Information | 91 (91.0%) | 9 (9.0%) |
| Finance & Insurance | 32 (25.4%) | 94 (74.6%) |
| Real Estate, Rental & Leasing | 26 (100.0%) | 0 (0.0%) |
| Professional & Scientific | 67 (44.4%) | 84 (55.6%) |
| Enterprise Management | 0 (0.0%) | 0 (0.0%) |
| Administrative & Support | 219 (84.2%) | 41 (15.8%) |
| Educational Services | 83 (18.7%) | 360 (81.3%) |
| Health Care & Social Assistance | 138 (18.6%) | 605 (81.4%) |
| Arts, Entertainment & Recreation | 2 (7.4%) | 25 (92.6%) |
| Accommodation & Food Services | 106 (57.0%) | 80 (43.0%) |
| Public Administration | 165 (69.9%) | 71 (30.1%) |
| Total | 2,421 (50.7%) | 2,350 (49.3%) |
Education in Fulton
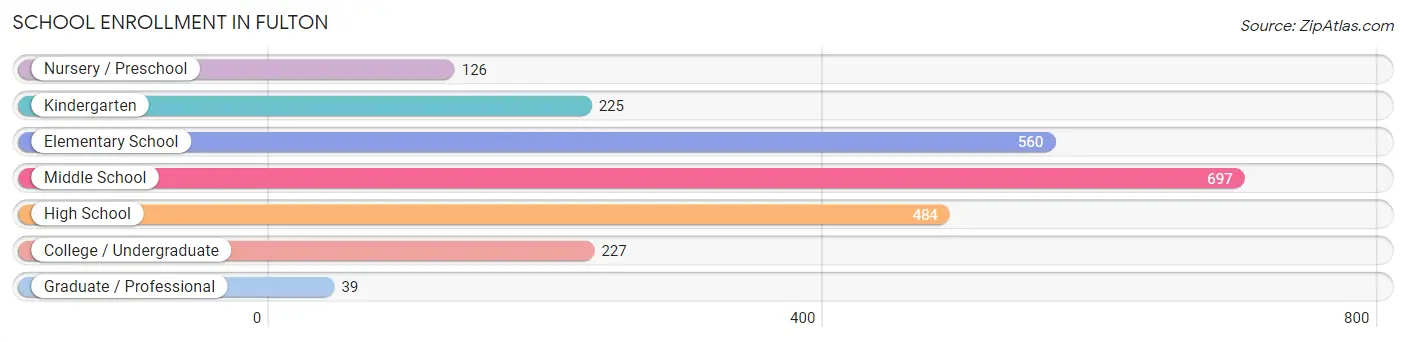
School Enrollment in Fulton
The most common levels of schooling among the 2,358 students in Fulton are middle school (697 | 29.6%), elementary school (560 | 23.7%), and high school (484 | 20.5%).
| School Level | # Students | % Students |
| Nursery / Preschool | 126 | 5.3% |
| Kindergarten | 225 | 9.5% |
| Elementary School | 560 | 23.7% |
| Middle School | 697 | 29.6% |
| High School | 484 | 20.5% |
| College / Undergraduate | 227 | 9.6% |
| Graduate / Professional | 39 | 1.7% |
| Total | 2,358 | 100.0% |
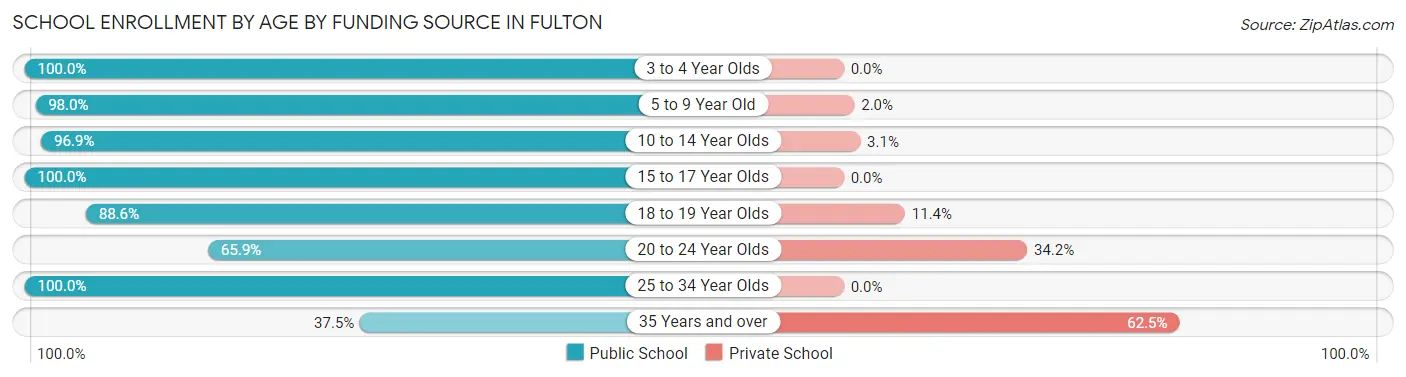
School Enrollment by Age by Funding Source in Fulton
Out of a total of 2,358 students who are enrolled in schools in Fulton, 120 (5.1%) attend a private institution, while the remaining 2,238 (94.9%) are enrolled in public schools. The age group of 35 years and over has the highest likelihood of being enrolled in private schools, with 25 (62.5% in the age bracket) enrolled. Conversely, the age group of 3 to 4 year olds has the lowest likelihood of being enrolled in a private school, with 108 (100.0% in the age bracket) attending a public institution.
| Age Bracket | Public School | Private School |
| 3 to 4 Year Olds | 108 (100.0%) | 0 (0.0%) |
| 5 to 9 Year Old | 741 (98.0%) | 15 (2.0%) |
| 10 to 14 Year Olds | 820 (96.9%) | 26 (3.1%) |
| 15 to 17 Year Olds | 288 (100.0%) | 0 (0.0%) |
| 18 to 19 Year Olds | 101 (88.6%) | 13 (11.4%) |
| 20 to 24 Year Olds | 81 (65.8%) | 42 (34.2%) |
| 25 to 34 Year Olds | 83 (100.0%) | 0 (0.0%) |
| 35 Years and over | 15 (37.5%) | 25 (62.5%) |
| Total | 2,238 (94.9%) | 120 (5.1%) |
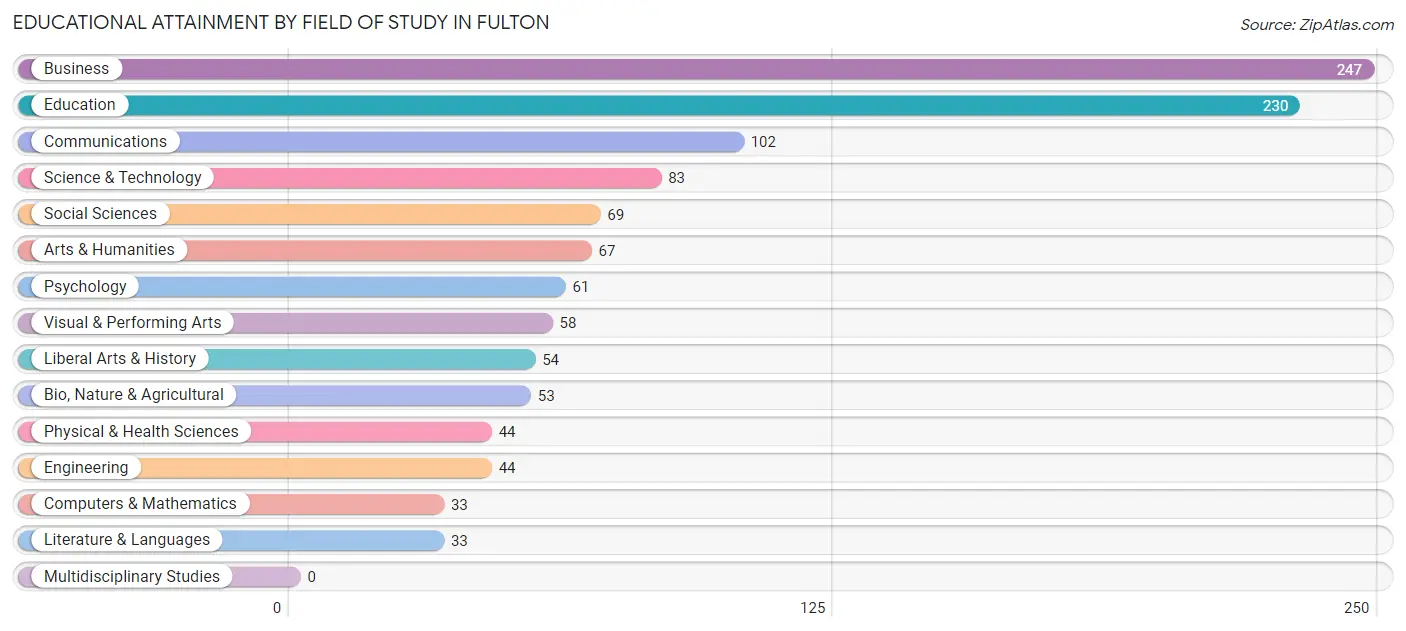
Educational Attainment by Field of Study in Fulton
Business (247 | 21.0%), education (230 | 19.5%), communications (102 | 8.7%), science & technology (83 | 7.0%), and social sciences (69 | 5.9%) are the most common fields of study among 1,178 individuals in Fulton who have obtained a bachelor's degree or higher.
| Field of Study | # Graduates | % Graduates |
| Computers & Mathematics | 33 | 2.8% |
| Bio, Nature & Agricultural | 53 | 4.5% |
| Physical & Health Sciences | 44 | 3.7% |
| Psychology | 61 | 5.2% |
| Social Sciences | 69 | 5.9% |
| Engineering | 44 | 3.7% |
| Multidisciplinary Studies | 0 | 0.0% |
| Science & Technology | 83 | 7.0% |
| Business | 247 | 21.0% |
| Education | 230 | 19.5% |
| Literature & Languages | 33 | 2.8% |
| Liberal Arts & History | 54 | 4.6% |
| Visual & Performing Arts | 58 | 4.9% |
| Communications | 102 | 8.7% |
| Arts & Humanities | 67 | 5.7% |
| Total | 1,178 | 100.0% |
Transportation & Commute in Fulton
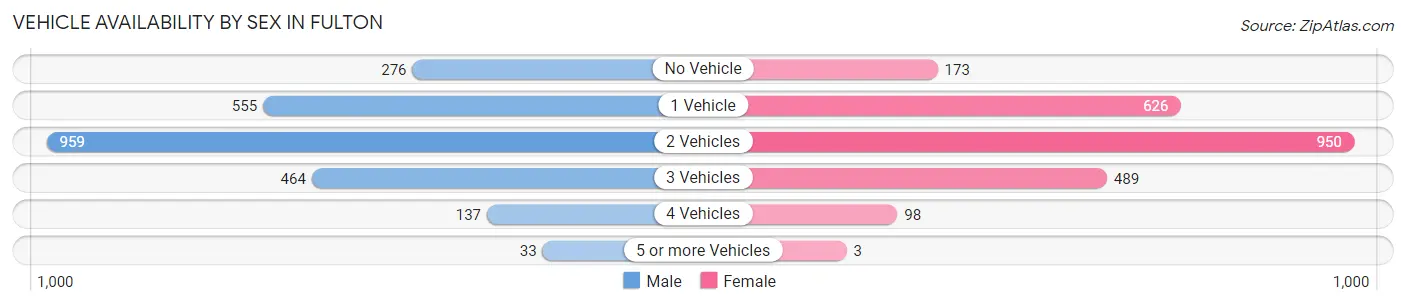
Vehicle Availability by Sex in Fulton
The most prevalent vehicle ownership categories in Fulton are males with 2 vehicles (959, accounting for 39.6%) and females with 2 vehicles (950, making up 41.0%).
| Vehicles Available | Male | Female |
| No Vehicle | 276 (11.4%) | 173 (7.4%) |
| 1 Vehicle | 555 (22.9%) | 626 (26.8%) |
| 2 Vehicles | 959 (39.6%) | 950 (40.6%) |
| 3 Vehicles | 464 (19.1%) | 489 (20.9%) |
| 4 Vehicles | 137 (5.7%) | 98 (4.2%) |
| 5 or more Vehicles | 33 (1.4%) | 3 (0.1%) |
| Total | 2,424 (100.0%) | 2,339 (100.0%) |
Commute Time in Fulton
The most frequently occuring commute durations in Fulton are 5 to 9 minutes (873 commuters, 19.3%), 30 to 34 minutes (681 commuters, 15.0%), and 25 to 29 minutes (577 commuters, 12.7%).
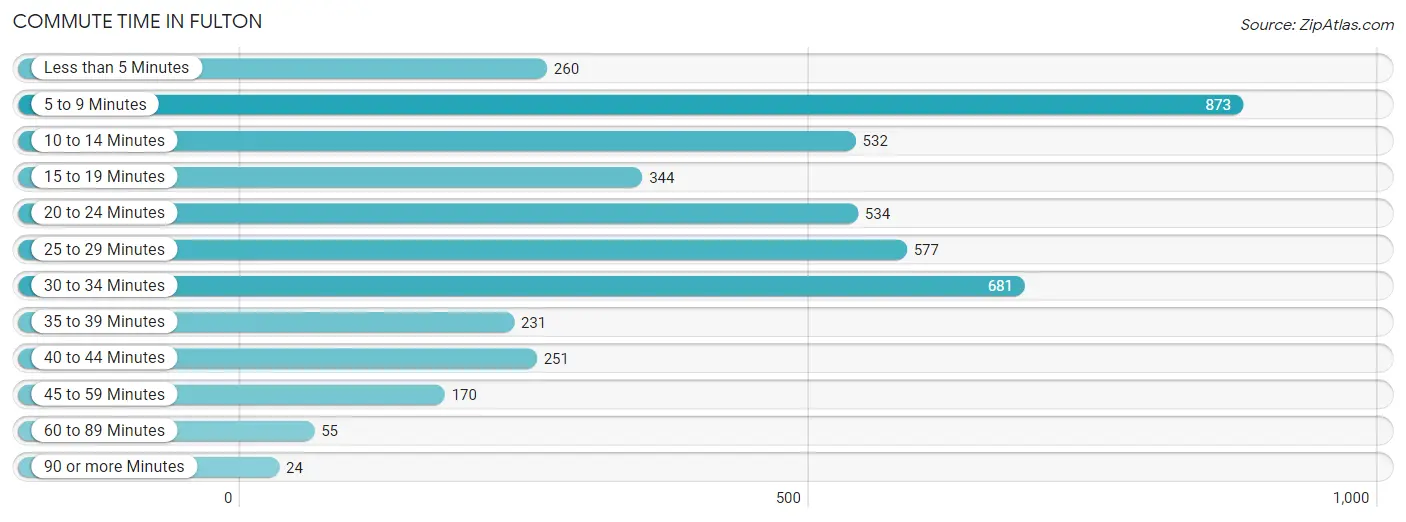
| Commute Time | # Commuters | % Commuters |
| Less than 5 Minutes | 260 | 5.7% |
| 5 to 9 Minutes | 873 | 19.3% |
| 10 to 14 Minutes | 532 | 11.7% |
| 15 to 19 Minutes | 344 | 7.6% |
| 20 to 24 Minutes | 534 | 11.8% |
| 25 to 29 Minutes | 577 | 12.7% |
| 30 to 34 Minutes | 681 | 15.0% |
| 35 to 39 Minutes | 231 | 5.1% |
| 40 to 44 Minutes | 251 | 5.5% |
| 45 to 59 Minutes | 170 | 3.7% |
| 60 to 89 Minutes | 55 | 1.2% |
| 90 or more Minutes | 24 | 0.5% |
Commute Time by Sex in Fulton
The most common commute times in Fulton are 5 to 9 minutes (370 commuters, 15.6%) for males and 5 to 9 minutes (503 commuters, 23.2%) for females.
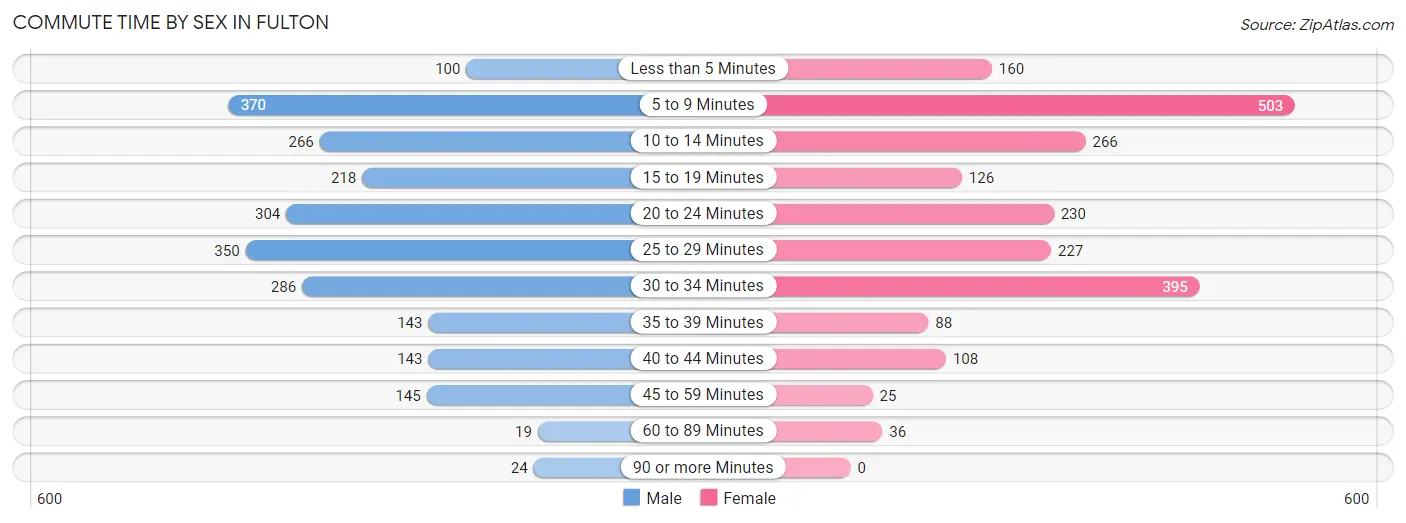
| Commute Time | Male | Female |
| Less than 5 Minutes | 100 (4.2%) | 160 (7.4%) |
| 5 to 9 Minutes | 370 (15.6%) | 503 (23.2%) |
| 10 to 14 Minutes | 266 (11.2%) | 266 (12.3%) |
| 15 to 19 Minutes | 218 (9.2%) | 126 (5.8%) |
| 20 to 24 Minutes | 304 (12.8%) | 230 (10.6%) |
| 25 to 29 Minutes | 350 (14.8%) | 227 (10.5%) |
| 30 to 34 Minutes | 286 (12.1%) | 395 (18.2%) |
| 35 to 39 Minutes | 143 (6.0%) | 88 (4.1%) |
| 40 to 44 Minutes | 143 (6.0%) | 108 (5.0%) |
| 45 to 59 Minutes | 145 (6.1%) | 25 (1.2%) |
| 60 to 89 Minutes | 19 (0.8%) | 36 (1.7%) |
| 90 or more Minutes | 24 (1.0%) | 0 (0.0%) |
Time of Departure to Work by Sex in Fulton
The most frequent times of departure to work in Fulton are 6:00 AM to 6:29 AM (403, 17.0%) for males and 7:00 AM to 7:29 AM (435, 20.1%) for females.
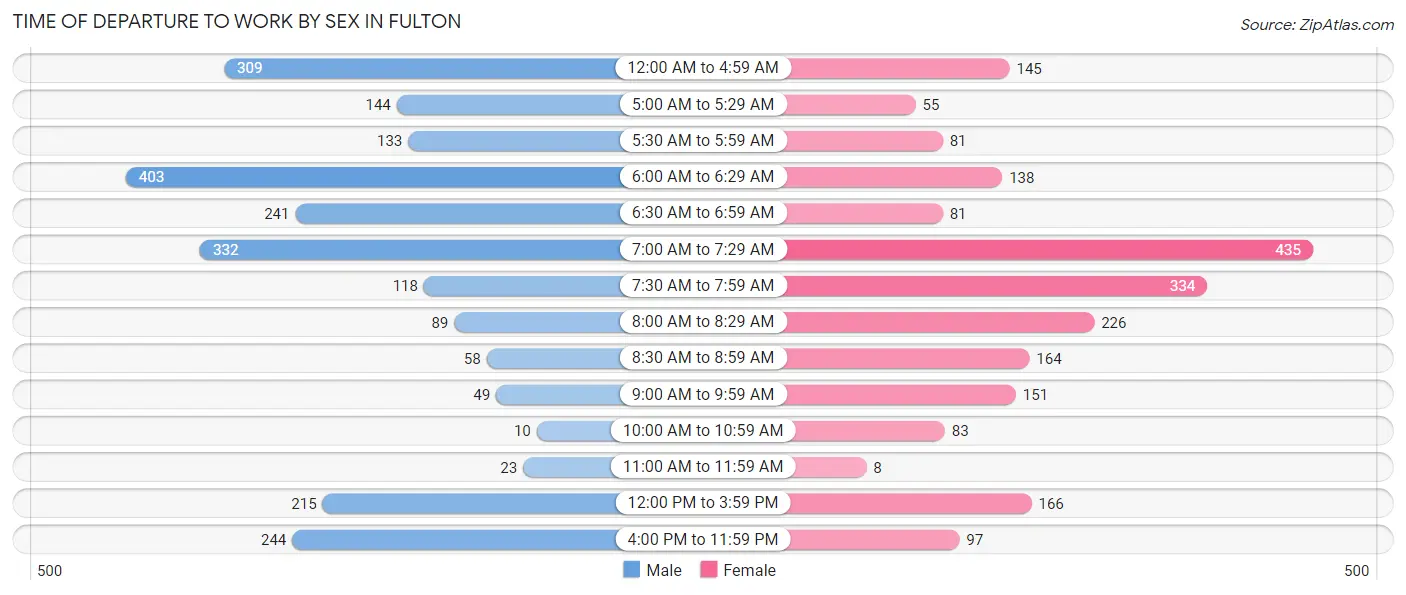
| Time of Departure | Male | Female |
| 12:00 AM to 4:59 AM | 309 (13.1%) | 145 (6.7%) |
| 5:00 AM to 5:29 AM | 144 (6.1%) | 55 (2.5%) |
| 5:30 AM to 5:59 AM | 133 (5.6%) | 81 (3.7%) |
| 6:00 AM to 6:29 AM | 403 (17.0%) | 138 (6.4%) |
| 6:30 AM to 6:59 AM | 241 (10.2%) | 81 (3.7%) |
| 7:00 AM to 7:29 AM | 332 (14.0%) | 435 (20.1%) |
| 7:30 AM to 7:59 AM | 118 (5.0%) | 334 (15.4%) |
| 8:00 AM to 8:29 AM | 89 (3.8%) | 226 (10.4%) |
| 8:30 AM to 8:59 AM | 58 (2.5%) | 164 (7.6%) |
| 9:00 AM to 9:59 AM | 49 (2.1%) | 151 (7.0%) |
| 10:00 AM to 10:59 AM | 10 (0.4%) | 83 (3.8%) |
| 11:00 AM to 11:59 AM | 23 (1.0%) | 8 (0.4%) |
| 12:00 PM to 3:59 PM | 215 (9.1%) | 166 (7.7%) |
| 4:00 PM to 11:59 PM | 244 (10.3%) | 97 (4.5%) |
| Total | 2,368 (100.0%) | 2,164 (100.0%) |
Housing Occupancy in Fulton
Occupancy by Ownership in Fulton
Of the total 4,792 dwellings in Fulton, owner-occupied units account for 2,532 (52.8%), while renter-occupied units make up 2,260 (47.2%).
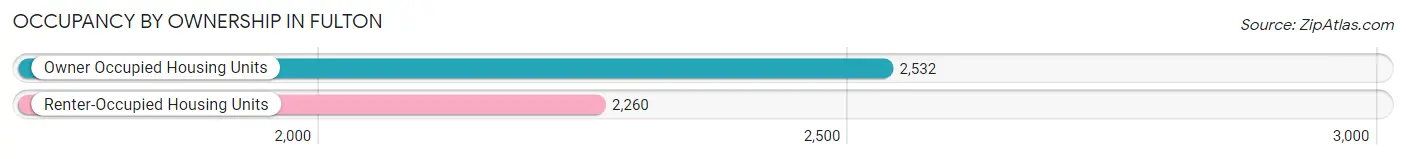
| Occupancy | # Housing Units | % Housing Units |
| Owner Occupied Housing Units | 2,532 | 52.8% |
| Renter-Occupied Housing Units | 2,260 | 47.2% |
| Total Occupied Housing Units | 4,792 | 100.0% |
Occupancy by Household Size in Fulton
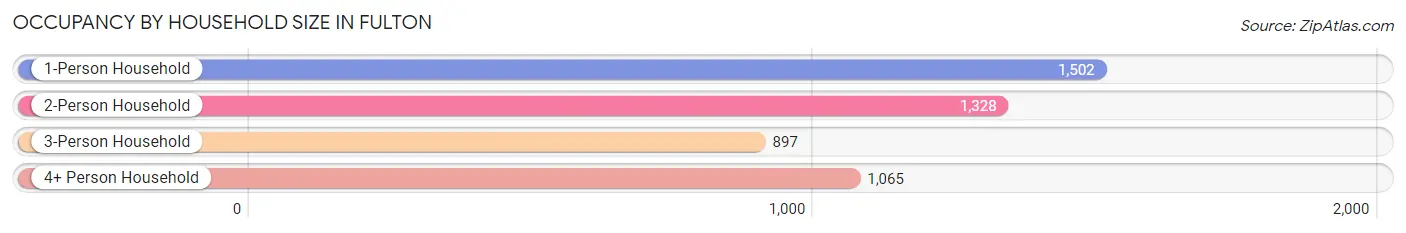
| Household Size | # Housing Units | % Housing Units |
| 1-Person Household | 1,502 | 31.3% |
| 2-Person Household | 1,328 | 27.7% |
| 3-Person Household | 897 | 18.7% |
| 4+ Person Household | 1,065 | 22.2% |
| Total Housing Units | 4,792 | 100.0% |
Occupancy by Ownership by Household Size in Fulton
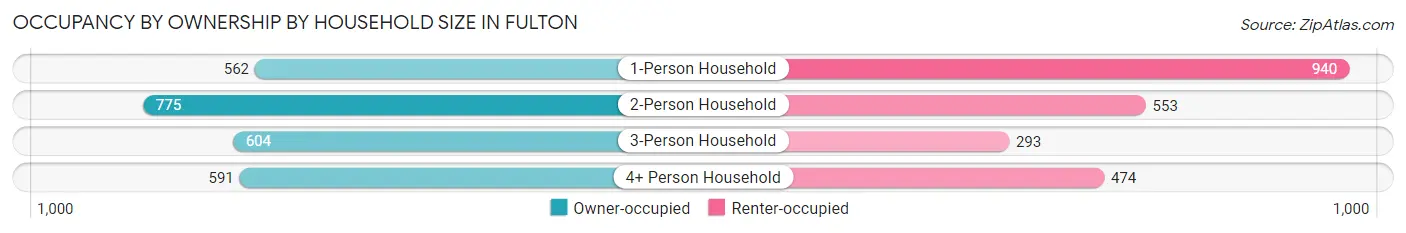
| Household Size | Owner-occupied | Renter-occupied |
| 1-Person Household | 562 (37.4%) | 940 (62.6%) |
| 2-Person Household | 775 (58.4%) | 553 (41.6%) |
| 3-Person Household | 604 (67.3%) | 293 (32.7%) |
| 4+ Person Household | 591 (55.5%) | 474 (44.5%) |
| Total Housing Units | 2,532 (52.8%) | 2,260 (47.2%) |
Occupancy by Educational Attainment in Fulton
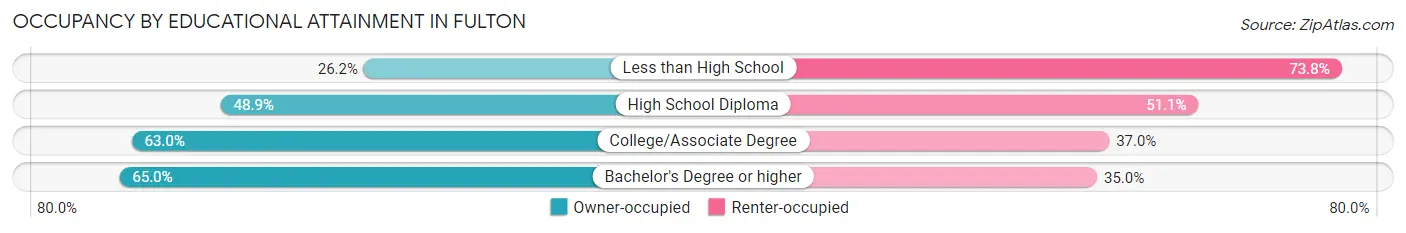
| Household Size | Owner-occupied | Renter-occupied |
| Less than High School | 175 (26.2%) | 493 (73.8%) |
| High School Diploma | 892 (48.9%) | 932 (51.1%) |
| College/Associate Degree | 957 (63.0%) | 561 (37.0%) |
| Bachelor's Degree or higher | 508 (65.0%) | 274 (35.0%) |
Occupancy by Age of Householder in Fulton
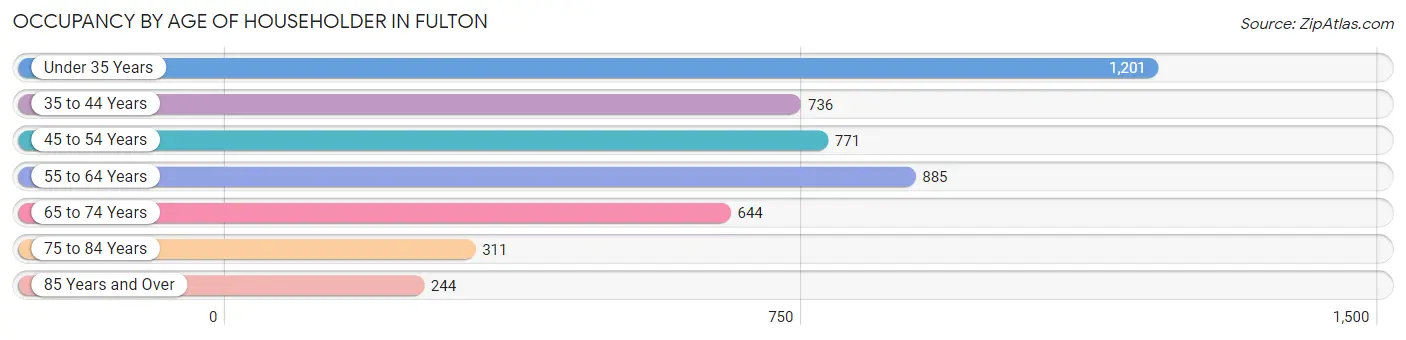
| Age Bracket | # Households | % Households |
| Under 35 Years | 1,201 | 25.1% |
| 35 to 44 Years | 736 | 15.4% |
| 45 to 54 Years | 771 | 16.1% |
| 55 to 64 Years | 885 | 18.5% |
| 65 to 74 Years | 644 | 13.4% |
| 75 to 84 Years | 311 | 6.5% |
| 85 Years and Over | 244 | 5.1% |
| Total | 4,792 | 100.0% |
Housing Finances in Fulton
Median Income by Occupancy in Fulton
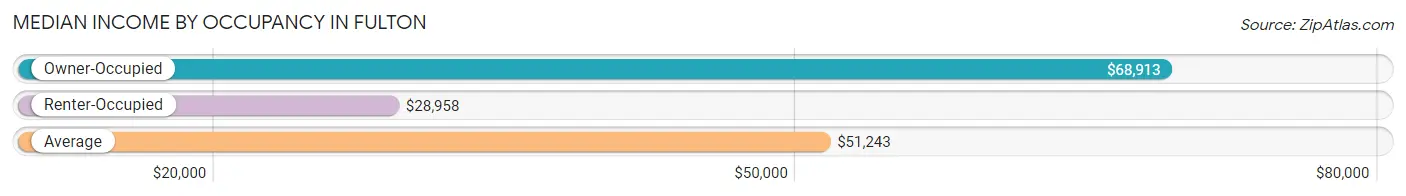
| Occupancy Type | # Households | Median Income |
| Owner-Occupied | 2,532 (52.8%) | $68,913 |
| Renter-Occupied | 2,260 (47.2%) | $28,958 |
| Average | 4,792 (100.0%) | $51,243 |
Occupancy by Householder Income Bracket in Fulton
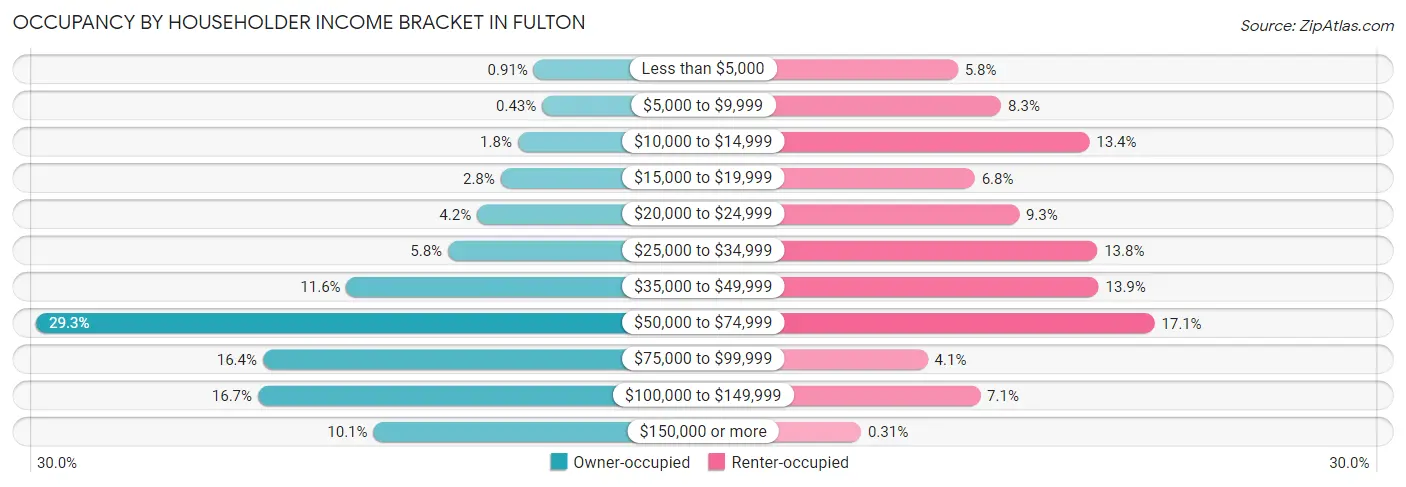
| Income Bracket | Owner-occupied | Renter-occupied |
| Less than $5,000 | 23 (0.9%) | 132 (5.8%) |
| $5,000 to $9,999 | 11 (0.4%) | 188 (8.3%) |
| $10,000 to $14,999 | 46 (1.8%) | 302 (13.4%) |
| $15,000 to $19,999 | 71 (2.8%) | 154 (6.8%) |
| $20,000 to $24,999 | 105 (4.2%) | 211 (9.3%) |
| $25,000 to $34,999 | 147 (5.8%) | 312 (13.8%) |
| $35,000 to $49,999 | 294 (11.6%) | 314 (13.9%) |
| $50,000 to $74,999 | 743 (29.3%) | 386 (17.1%) |
| $75,000 to $99,999 | 415 (16.4%) | 93 (4.1%) |
| $100,000 to $149,999 | 422 (16.7%) | 161 (7.1%) |
| $150,000 or more | 255 (10.1%) | 7 (0.3%) |
| Total | 2,532 (100.0%) | 2,260 (100.0%) |
Monthly Housing Cost Tiers in Fulton
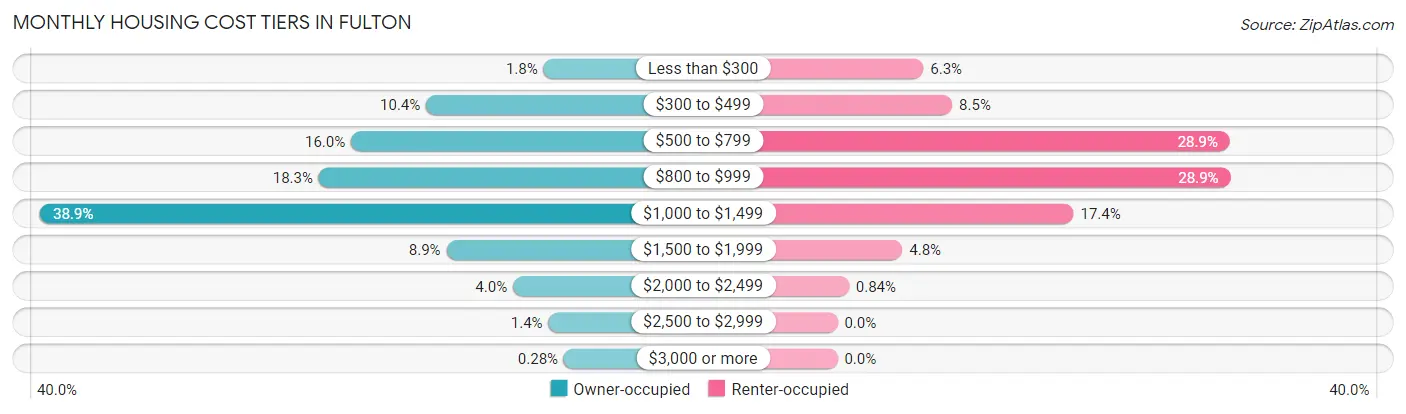
| Monthly Cost | Owner-occupied | Renter-occupied |
| Less than $300 | 45 (1.8%) | 143 (6.3%) |
| $300 to $499 | 264 (10.4%) | 191 (8.5%) |
| $500 to $799 | 404 (16.0%) | 653 (28.9%) |
| $800 to $999 | 464 (18.3%) | 654 (28.9%) |
| $1,000 to $1,499 | 984 (38.9%) | 393 (17.4%) |
| $1,500 to $1,999 | 226 (8.9%) | 108 (4.8%) |
| $2,000 to $2,499 | 102 (4.0%) | 19 (0.8%) |
| $2,500 to $2,999 | 36 (1.4%) | 0 (0.0%) |
| $3,000 or more | 7 (0.3%) | 0 (0.0%) |
| Total | 2,532 (100.0%) | 2,260 (100.0%) |
Physical Housing Characteristics in Fulton
Housing Structures in Fulton
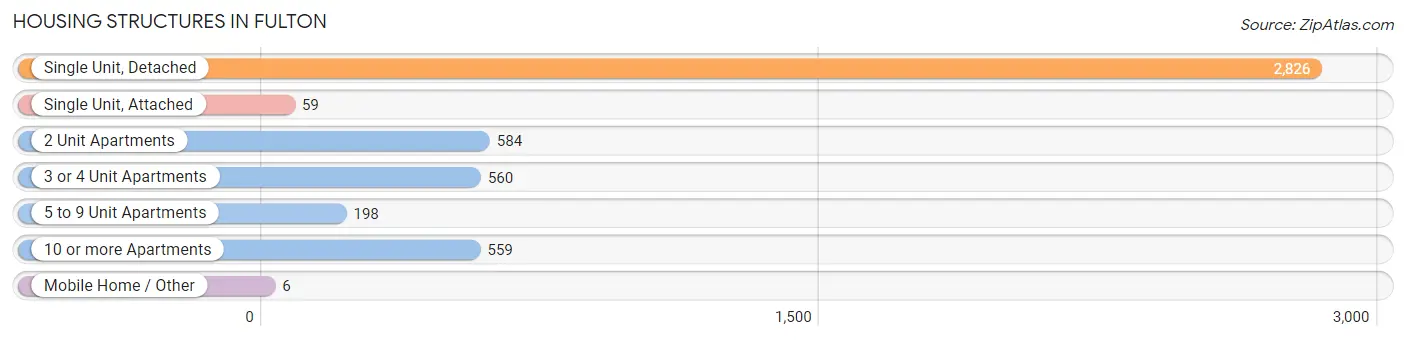
| Structure Type | # Housing Units | % Housing Units |
| Single Unit, Detached | 2,826 | 59.0% |
| Single Unit, Attached | 59 | 1.2% |
| 2 Unit Apartments | 584 | 12.2% |
| 3 or 4 Unit Apartments | 560 | 11.7% |
| 5 to 9 Unit Apartments | 198 | 4.1% |
| 10 or more Apartments | 559 | 11.7% |
| Mobile Home / Other | 6 | 0.1% |
| Total | 4,792 | 100.0% |
Housing Structures by Occupancy in Fulton
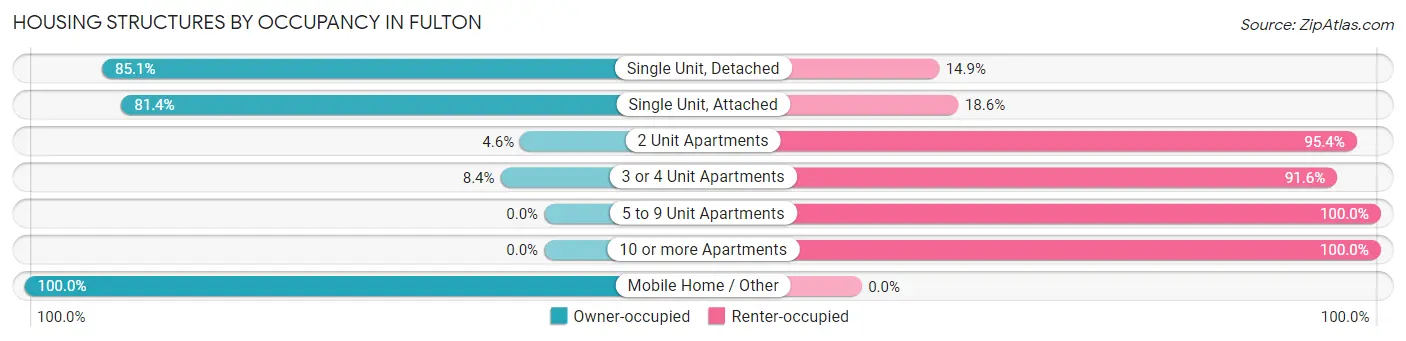
| Structure Type | Owner-occupied | Renter-occupied |
| Single Unit, Detached | 2,404 (85.1%) | 422 (14.9%) |
| Single Unit, Attached | 48 (81.4%) | 11 (18.6%) |
| 2 Unit Apartments | 27 (4.6%) | 557 (95.4%) |
| 3 or 4 Unit Apartments | 47 (8.4%) | 513 (91.6%) |
| 5 to 9 Unit Apartments | 0 (0.0%) | 198 (100.0%) |
| 10 or more Apartments | 0 (0.0%) | 559 (100.0%) |
| Mobile Home / Other | 6 (100.0%) | 0 (0.0%) |
| Total | 2,532 (52.8%) | 2,260 (47.2%) |
Housing Structures by Number of Rooms in Fulton
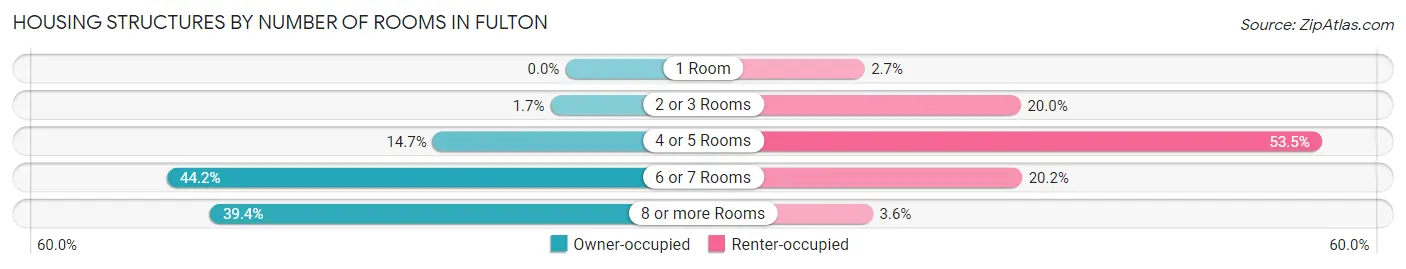
| Number of Rooms | Owner-occupied | Renter-occupied |
| 1 Room | 0 (0.0%) | 61 (2.7%) |
| 2 or 3 Rooms | 42 (1.7%) | 453 (20.0%) |
| 4 or 5 Rooms | 373 (14.7%) | 1,208 (53.4%) |
| 6 or 7 Rooms | 1,119 (44.2%) | 456 (20.2%) |
| 8 or more Rooms | 998 (39.4%) | 82 (3.6%) |
| Total | 2,532 (100.0%) | 2,260 (100.0%) |
Housing Structure by Heating Type in Fulton
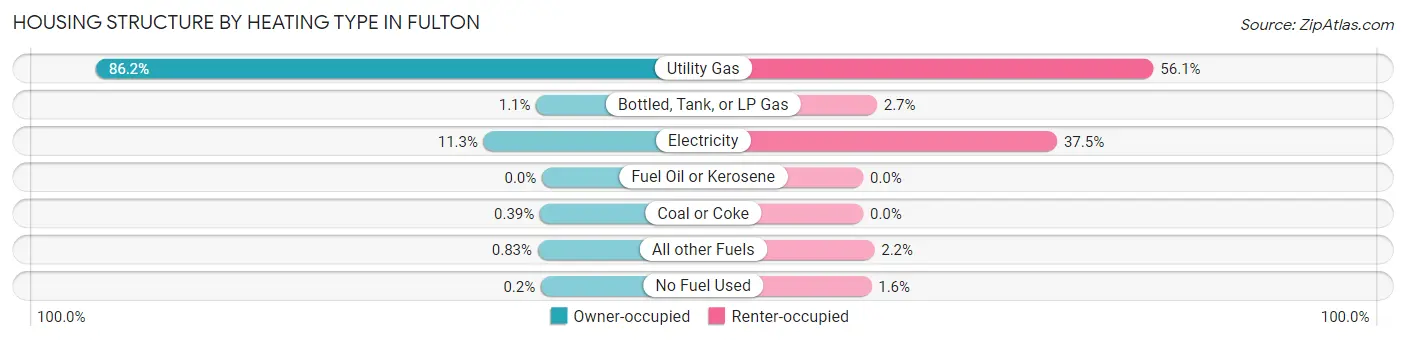
| Heating Type | Owner-occupied | Renter-occupied |
| Utility Gas | 2,183 (86.2%) | 1,268 (56.1%) |
| Bottled, Tank, or LP Gas | 28 (1.1%) | 60 (2.6%) |
| Electricity | 285 (11.3%) | 847 (37.5%) |
| Fuel Oil or Kerosene | 0 (0.0%) | 0 (0.0%) |
| Coal or Coke | 10 (0.4%) | 0 (0.0%) |
| All other Fuels | 21 (0.8%) | 49 (2.2%) |
| No Fuel Used | 5 (0.2%) | 36 (1.6%) |
| Total | 2,532 (100.0%) | 2,260 (100.0%) |
Household Vehicle Usage in Fulton
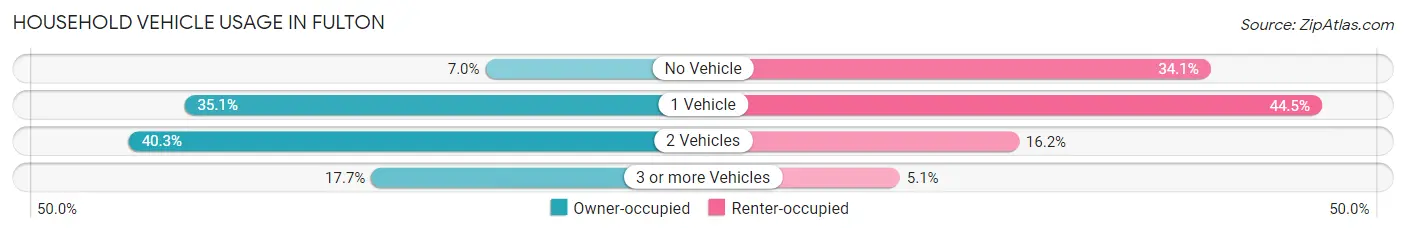
| Vehicles per Household | Owner-occupied | Renter-occupied |
| No Vehicle | 177 (7.0%) | 771 (34.1%) |
| 1 Vehicle | 888 (35.1%) | 1,006 (44.5%) |
| 2 Vehicles | 1,020 (40.3%) | 367 (16.2%) |
| 3 or more Vehicles | 447 (17.6%) | 116 (5.1%) |
| Total | 2,532 (100.0%) | 2,260 (100.0%) |
Real Estate & Mortgages in Fulton
Real Estate and Mortgage Overview in Fulton
| Characteristic | Without Mortgage | With Mortgage |
| Housing Units | 790 | 1,742 |
| Median Property Value | $86,000 | $93,800 |
| Median Household Income | $57,321 | $198 |
| Monthly Housing Costs | $560 | $7 |
| Real Estate Taxes | $2,711 | $49 |
Property Value by Mortgage Status in Fulton
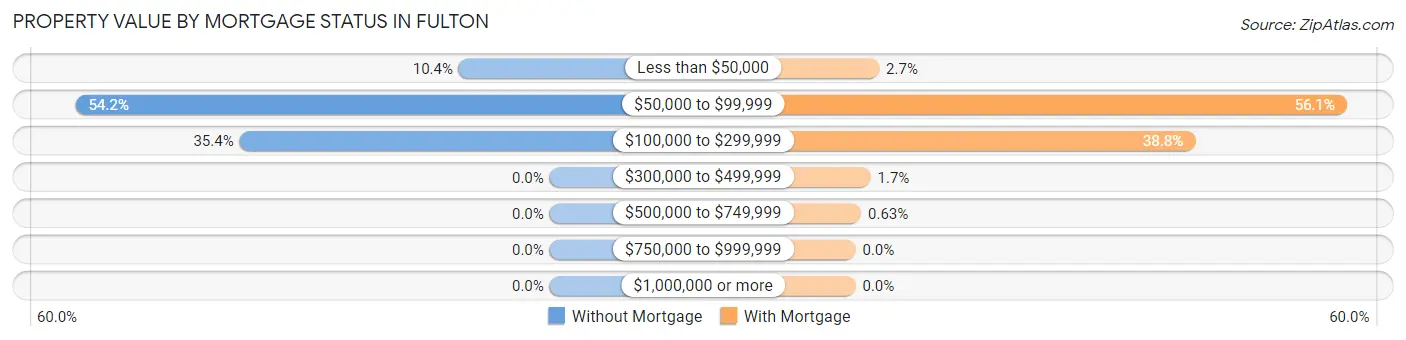
| Property Value | Without Mortgage | With Mortgage |
| Less than $50,000 | 82 (10.4%) | 47 (2.7%) |
| $50,000 to $99,999 | 428 (54.2%) | 978 (56.1%) |
| $100,000 to $299,999 | 280 (35.4%) | 676 (38.8%) |
| $300,000 to $499,999 | 0 (0.0%) | 30 (1.7%) |
| $500,000 to $749,999 | 0 (0.0%) | 11 (0.6%) |
| $750,000 to $999,999 | 0 (0.0%) | 0 (0.0%) |
| $1,000,000 or more | 0 (0.0%) | 0 (0.0%) |
| Total | 790 (100.0%) | 1,742 (100.0%) |
Household Income by Mortgage Status in Fulton
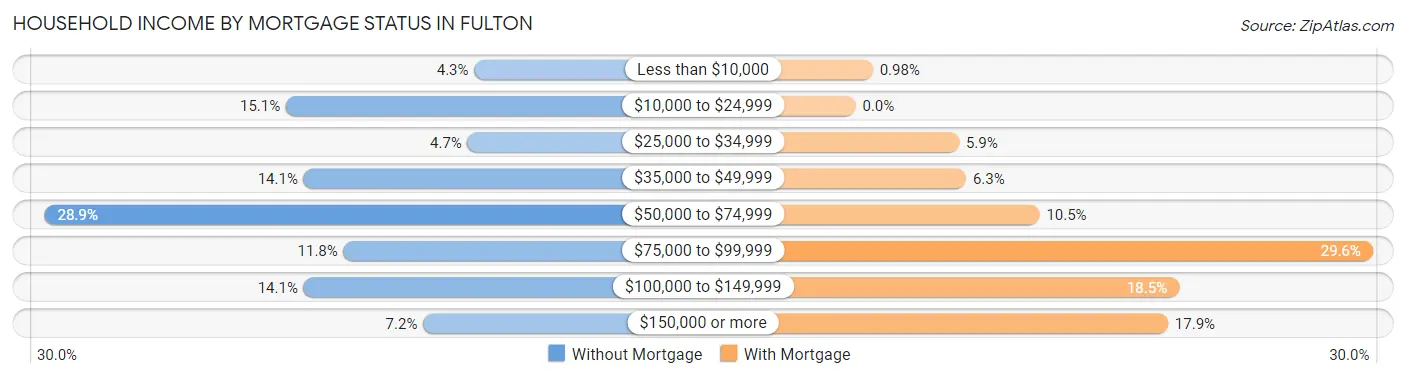
| Household Income | Without Mortgage | With Mortgage |
| Less than $10,000 | 34 (4.3%) | 17 (1.0%) |
| $10,000 to $24,999 | 119 (15.1%) | 0 (0.0%) |
| $25,000 to $34,999 | 37 (4.7%) | 103 (5.9%) |
| $35,000 to $49,999 | 111 (14.1%) | 110 (6.3%) |
| $50,000 to $74,999 | 228 (28.9%) | 183 (10.5%) |
| $75,000 to $99,999 | 93 (11.8%) | 515 (29.6%) |
| $100,000 to $149,999 | 111 (14.1%) | 322 (18.5%) |
| $150,000 or more | 57 (7.2%) | 311 (17.8%) |
| Total | 790 (100.0%) | 1,742 (100.0%) |
Property Value to Household Income Ratio in Fulton
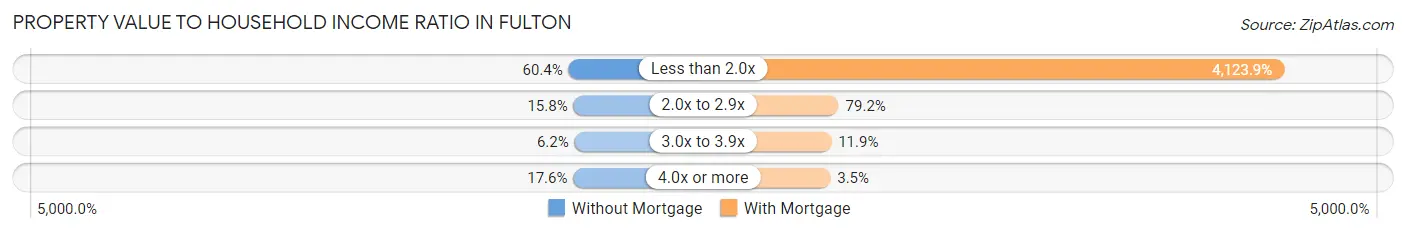
| Value-to-Income Ratio | Without Mortgage | With Mortgage |
| Less than 2.0x | 477 (60.4%) | 71,839 (4,123.9%) |
| 2.0x to 2.9x | 125 (15.8%) | 1,380 (79.2%) |
| 3.0x to 3.9x | 49 (6.2%) | 207 (11.9%) |
| 4.0x or more | 139 (17.6%) | 61 (3.5%) |
| Total | 790 (100.0%) | 1,742 (100.0%) |
Real Estate Taxes by Mortgage Status in Fulton

| Property Taxes | Without Mortgage | With Mortgage |
| Less than $800 | 35 (4.4%) | 0 (0.0%) |
| $800 to $1,499 | 99 (12.5%) | 10 (0.6%) |
| $800 to $1,499 | 642 (81.3%) | 58 (3.3%) |
| Total | 790 (100.0%) | 1,742 (100.0%) |
Health & Disability in Fulton
Health Insurance Coverage by Age in Fulton
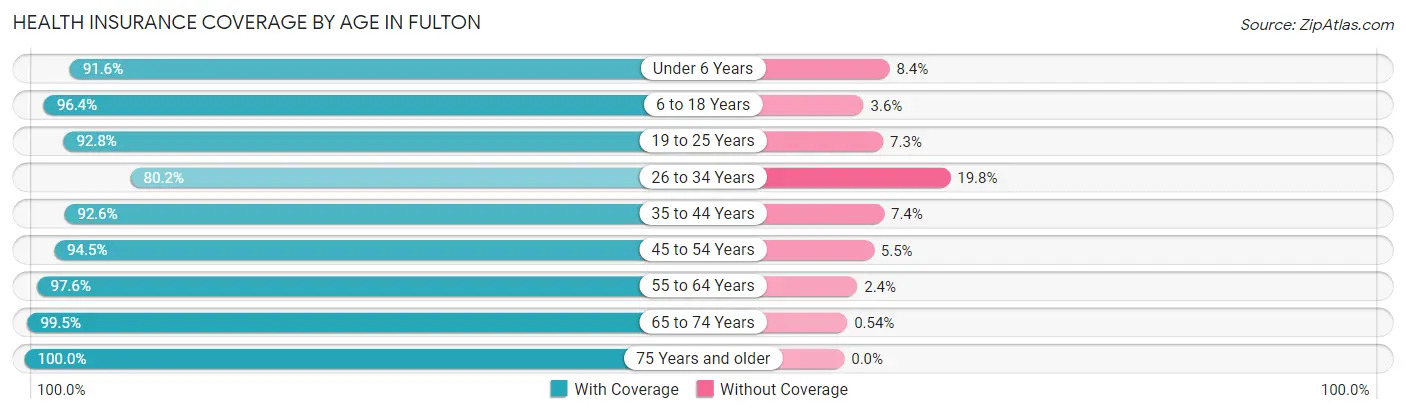
| Age Bracket | With Coverage | Without Coverage |
| Under 6 Years | 1,009 (91.6%) | 93 (8.4%) |
| 6 to 18 Years | 1,849 (96.4%) | 69 (3.6%) |
| 19 to 25 Years | 1,215 (92.7%) | 95 (7.2%) |
| 26 to 34 Years | 1,177 (80.2%) | 290 (19.8%) |
| 35 to 44 Years | 1,162 (92.6%) | 93 (7.4%) |
| 45 to 54 Years | 1,218 (94.5%) | 71 (5.5%) |
| 55 to 64 Years | 1,332 (97.6%) | 33 (2.4%) |
| 65 to 74 Years | 929 (99.5%) | 5 (0.5%) |
| 75 Years and older | 649 (100.0%) | 0 (0.0%) |
| Total | 10,540 (93.4%) | 749 (6.6%) |
Health Insurance Coverage by Citizenship Status in Fulton
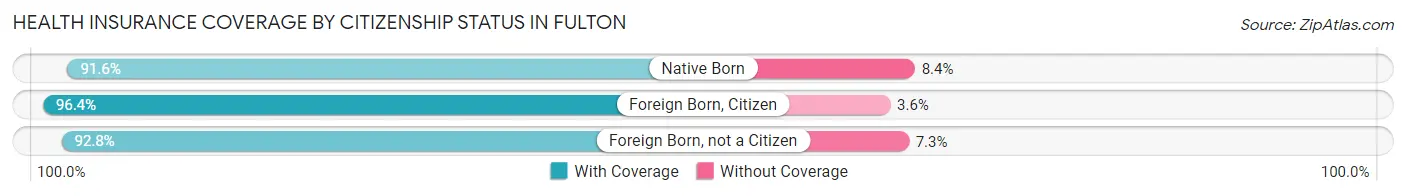
| Citizenship Status | With Coverage | Without Coverage |
| Native Born | 1,009 (91.6%) | 93 (8.4%) |
| Foreign Born, Citizen | 1,849 (96.4%) | 69 (3.6%) |
| Foreign Born, not a Citizen | 1,215 (92.7%) | 95 (7.2%) |
Health Insurance Coverage by Household Income in Fulton
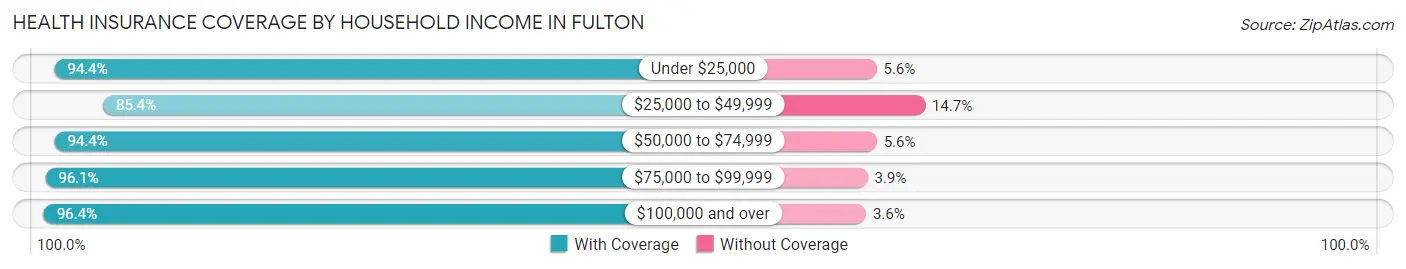
| Household Income | With Coverage | Without Coverage |
| Under $25,000 | 2,102 (94.4%) | 124 (5.6%) |
| $25,000 to $49,999 | 1,841 (85.4%) | 316 (14.6%) |
| $50,000 to $74,999 | 2,731 (94.4%) | 162 (5.6%) |
| $75,000 to $99,999 | 1,411 (96.1%) | 57 (3.9%) |
| $100,000 and over | 2,416 (96.4%) | 90 (3.6%) |
Public vs Private Health Insurance Coverage by Age in Fulton
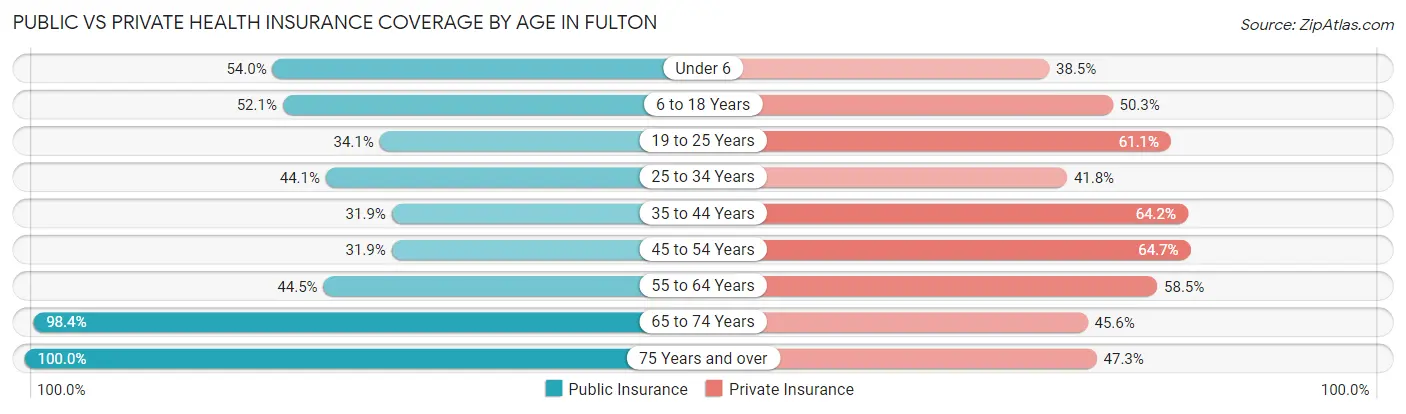
| Age Bracket | Public Insurance | Private Insurance |
| Under 6 | 595 (54.0%) | 424 (38.5%) |
| 6 to 18 Years | 999 (52.1%) | 964 (50.3%) |
| 19 to 25 Years | 447 (34.1%) | 800 (61.1%) |
| 25 to 34 Years | 647 (44.1%) | 613 (41.8%) |
| 35 to 44 Years | 400 (31.9%) | 806 (64.2%) |
| 45 to 54 Years | 411 (31.9%) | 834 (64.7%) |
| 55 to 64 Years | 608 (44.5%) | 799 (58.5%) |
| 65 to 74 Years | 919 (98.4%) | 426 (45.6%) |
| 75 Years and over | 649 (100.0%) | 307 (47.3%) |
| Total | 5,675 (50.3%) | 5,973 (52.9%) |
Disability Status by Sex by Age in Fulton
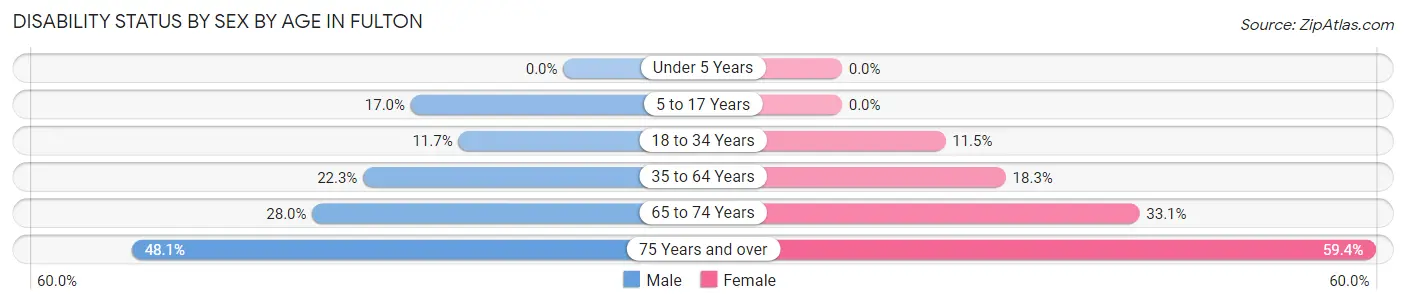
| Age Bracket | Male | Female |
| Under 5 Years | 0 (0.0%) | 0 (0.0%) |
| 5 to 17 Years | 181 (17.0%) | 0 (0.0%) |
| 18 to 34 Years | 179 (11.7%) | 170 (11.5%) |
| 35 to 64 Years | 434 (22.3%) | 358 (18.2%) |
| 65 to 74 Years | 116 (28.0%) | 172 (33.1%) |
| 75 Years and over | 112 (48.1%) | 247 (59.4%) |
Disability Class by Sex by Age in Fulton
Disability Class: Hearing Difficulty
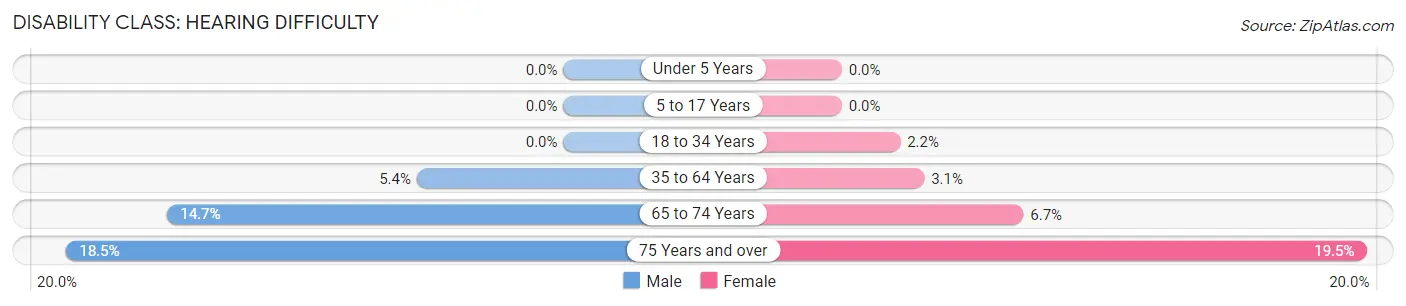
| Age Bracket | Male | Female |
| Under 5 Years | 0 (0.0%) | 0 (0.0%) |
| 5 to 17 Years | 0 (0.0%) | 0 (0.0%) |
| 18 to 34 Years | 0 (0.0%) | 32 (2.2%) |
| 35 to 64 Years | 106 (5.4%) | 60 (3.1%) |
| 65 to 74 Years | 61 (14.7%) | 35 (6.7%) |
| 75 Years and over | 43 (18.4%) | 81 (19.5%) |
Disability Class: Vision Difficulty
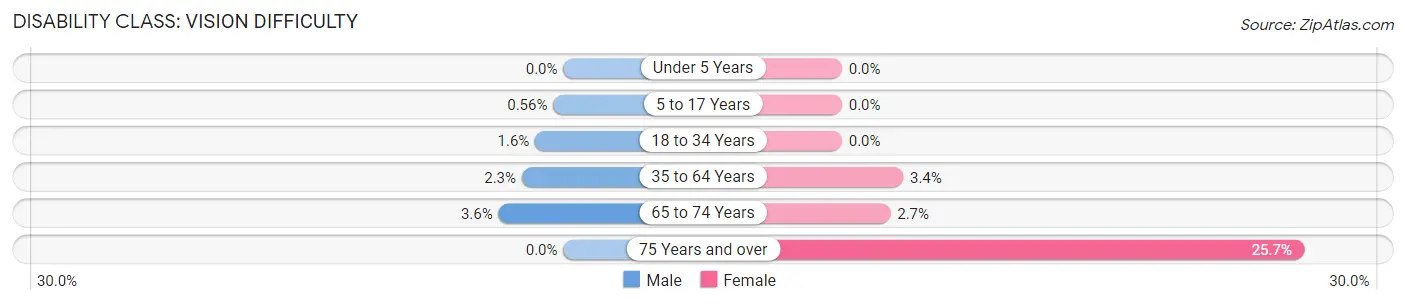
| Age Bracket | Male | Female |
| Under 5 Years | 0 (0.0%) | 0 (0.0%) |
| 5 to 17 Years | 6 (0.6%) | 0 (0.0%) |
| 18 to 34 Years | 24 (1.6%) | 0 (0.0%) |
| 35 to 64 Years | 45 (2.3%) | 67 (3.4%) |
| 65 to 74 Years | 15 (3.6%) | 14 (2.7%) |
| 75 Years and over | 0 (0.0%) | 107 (25.7%) |
Disability Class: Cognitive Difficulty
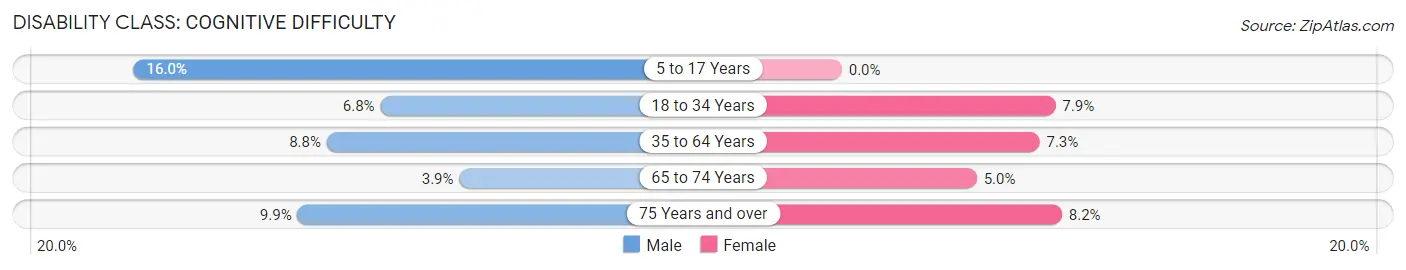
| Age Bracket | Male | Female |
| 5 to 17 Years | 170 (16.0%) | 0 (0.0%) |
| 18 to 34 Years | 104 (6.8%) | 117 (7.9%) |
| 35 to 64 Years | 171 (8.8%) | 144 (7.3%) |
| 65 to 74 Years | 16 (3.9%) | 26 (5.0%) |
| 75 Years and over | 23 (9.9%) | 34 (8.2%) |
Disability Class: Ambulatory Difficulty
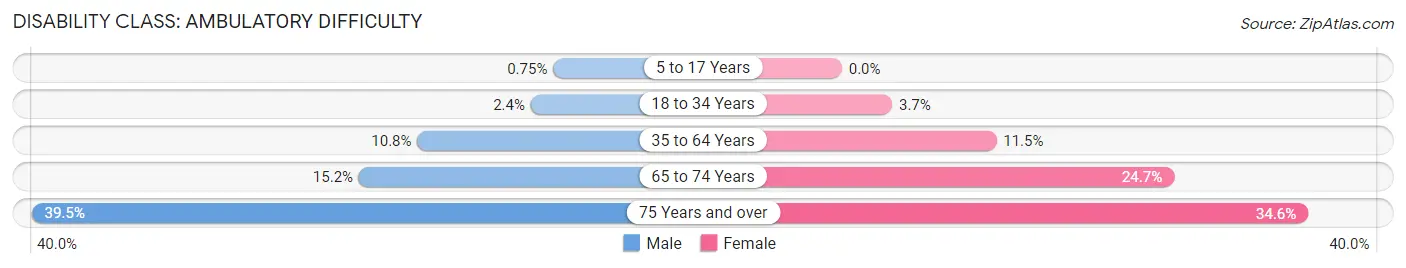
| Age Bracket | Male | Female |
| 5 to 17 Years | 8 (0.7%) | 0 (0.0%) |
| 18 to 34 Years | 37 (2.4%) | 55 (3.7%) |
| 35 to 64 Years | 211 (10.8%) | 225 (11.5%) |
| 65 to 74 Years | 63 (15.2%) | 128 (24.7%) |
| 75 Years and over | 92 (39.5%) | 144 (34.6%) |
Disability Class: Self-Care Difficulty
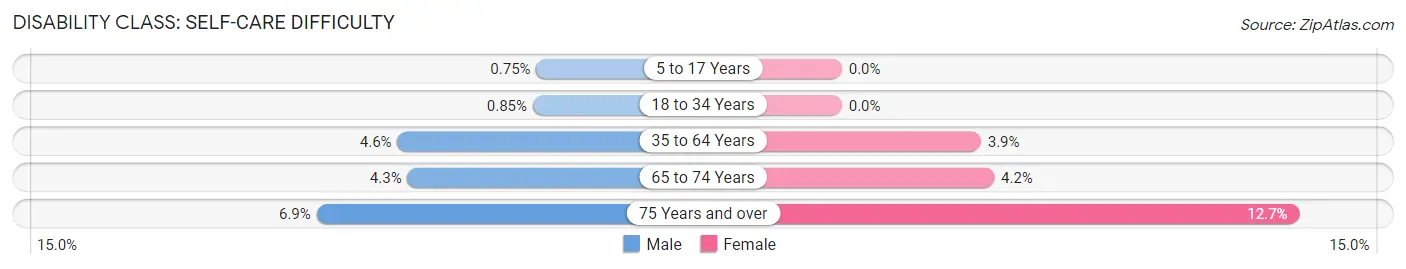
| Age Bracket | Male | Female |
| 5 to 17 Years | 8 (0.7%) | 0 (0.0%) |
| 18 to 34 Years | 13 (0.9%) | 0 (0.0%) |
| 35 to 64 Years | 90 (4.6%) | 76 (3.9%) |
| 65 to 74 Years | 18 (4.3%) | 22 (4.2%) |
| 75 Years and over | 16 (6.9%) | 53 (12.7%) |
Technology Access in Fulton
Computing Device Access in Fulton
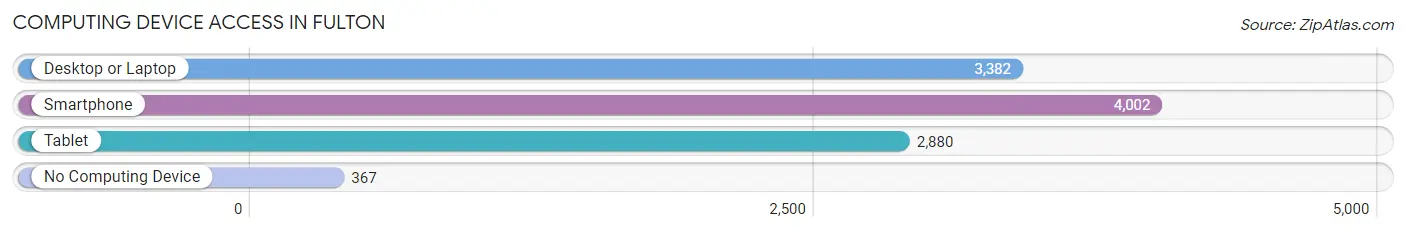
| Device Type | # Households | % Households |
| Desktop or Laptop | 3,382 | 70.6% |
| Smartphone | 4,002 | 83.5% |
| Tablet | 2,880 | 60.1% |
| No Computing Device | 367 | 7.7% |
| Total | 4,792 | 100.0% |
Internet Access in Fulton
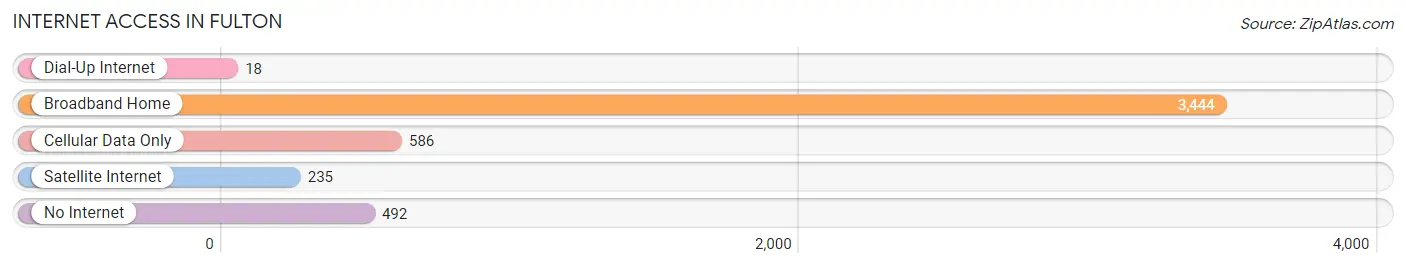
| Internet Type | # Households | % Households |
| Dial-Up Internet | 18 | 0.4% |
| Broadband Home | 3,444 | 71.9% |
| Cellular Data Only | 586 | 12.2% |
| Satellite Internet | 235 | 4.9% |
| No Internet | 492 | 10.3% |
| Total | 4,792 | 100.0% |
Fulton Summary
Fulton, New York is a city located in Oswego County, New York, United States. The population was 11,896 at the 2010 census. It is the county seat of Oswego County. The city is named after Robert Fulton, the inventor of the steamboat.
History
Fulton was first settled in 1789 by William Chappell, a Revolutionary War veteran. The village was incorporated in 1817 and was named after Robert Fulton, the inventor of the steamboat. The village was the site of the first steamboat to travel the Erie Canal in 1807.
In 1853, the village was incorporated as a city. The city was a major industrial center in the 19th century, with several factories producing textiles, paper, and other products. The city was also a major transportation hub, with the Erie Canal and the New York Central Railroad running through it.
In the 20th century, the city's economy shifted to a more service-oriented one, with the closure of many of the factories. The city is now home to several educational institutions, including the State University of New York at Oswego and Cayuga Community College.
Geography
Fulton is located at 43°20'25" North, 76°20'45" West (43.340278, -76.345833). According to the United States Census Bureau, the city has a total area of 4.2 square miles (10.8 km2), all of it land.
The city is located on the eastern shore of Lake Ontario, and is bordered by the towns of Granby and Volney to the north, the town of Oswego to the east, and the town of Scriba to the south.
Economy
Fulton's economy is largely based on services, with the largest employers being the State University of New York at Oswego, Cayuga Community College, and the Oswego County government. The city is also home to several manufacturing companies, including Nestle Purina PetCare, which produces pet food, and the Fulton Companies, which produces paper products.
The city is also home to several retail stores including Walmart Target and Lowe s
Demographics
As of the 2010 census, there were 11,896 people, 4,845 households, and 2,845 families residing in the city. The population density was 2,845.2 people per square mile (1,098.7/km2). There were 5,093 housing units at an average density of 1,219.2 per square mile (470.2/km2). The racial makeup of the city was 94.2% White, 2.2% African American, 0.3% Native American, 0.9% Asian, 0.1% Pacific Islander, 0.7% from other races, and 1.6% from two or more races. Hispanic or Latino of any race were 2.7% of the population.
There were 4,845 households, out of which 28.2% had children under the age of 18 living with them, 41.2% were married couples living together, 14.2% had a female householder with no husband present, and 39.7% were non-families. 32.2% of all households were made up of individuals, and 13.2% had someone living alone who was 65 years of age or older. The average household size was 2.35 and the average family size was 2.94.
In the city, the population was spread out, with 23.2% under the age of 18, 11.2% from 18 to 24, 27.2% from 25 to 44, 22.2% from 45 to 64, and 16.2% who were 65 years of age or older. The median age was 36 years. For every 100 females, there were 91.2 males. For every 100 females age 18 and over, there were 87.7 males.
The median income for a household in the city was $33,917, and the median income for a family was $41,917. Males had a median income of $31,917 versus $25,917 for females. The per capita income for the city was $17,917. About 11.2% of families and 14.2% of the population were below the poverty line, including 19.2% of those under age 18 and 8.2% of those age 65 or over.
Common Questions
What is Per Capita Income in Fulton?
Per Capita income in Fulton is $26,639.
What is the Median Family Income in Fulton?
Median Family Income in Fulton is $56,230.
What is the Median Household income in Fulton?
Median Household Income in Fulton is $51,243.
What is Income or Wage Gap in Fulton?
Income or Wage Gap in Fulton is 23.7%.
Women in Fulton earn 76.3 cents for every dollar earned by a man.
What is Family Income Deficit in Fulton?
Family Income Deficit in Fulton is $11,392.
Families that are below poverty line in Fulton earn $11,392 less on average than the poverty threshold level.
What is Inequality or Gini Index in Fulton?
Inequality or Gini Index in Fulton is 0.44.
What is the Total Population of Fulton?
Total Population of Fulton is 11,381.
What is the Total Male Population of Fulton?
Total Male Population of Fulton is 5,723.
What is the Total Female Population of Fulton?
Total Female Population of Fulton is 5,658.
What is the Ratio of Males per 100 Females in Fulton?
There are 101.15 Males per 100 Females in Fulton.
What is the Ratio of Females per 100 Males in Fulton?
There are 98.86 Females per 100 Males in Fulton.
What is the Median Population Age in Fulton?
Median Population Age in Fulton is 33.7 Years.
What is the Average Family Size in Fulton
Average Family Size in Fulton is 2.8 People.
What is the Average Household Size in Fulton
Average Household Size in Fulton is 2.4 People.
How Large is the Labor Force in Fulton?
There are 5,263 People in the Labor Forcein in Fulton.
What is the Percentage of People in the Labor Force in Fulton?
59.9% of People are in the Labor Force in Fulton.
What is the Unemployment Rate in Fulton?
Unemployment Rate in Fulton is 9.0%.