Fort Plain, NY Map & Demographics
Fort Plain Map
Fort Plain Overview
$23,724
PER CAPITA INCOME
$52,361
AVG FAMILY INCOME
$39,016
AVG HOUSEHOLD INCOME
0.2%
WAGE / INCOME GAP [ % ]
99.8¢/ $1
WAGE / INCOME GAP [ $ ]
$13,423
FAMILY INCOME DEFICIT
0.42
INEQUALITY / GINI INDEX
2,015
TOTAL POPULATION
950
MALE POPULATION
1,065
FEMALE POPULATION
89.20
MALES / 100 FEMALES
112.11
FEMALES / 100 MALES
42.5
MEDIAN AGE
3.2
AVG FAMILY SIZE
2.6
AVG HOUSEHOLD SIZE
1,000
LABOR FORCE [ PEOPLE ]
61.7%
PERCENT IN LABOR FORCE
6.8%
UNEMPLOYMENT RATE
Fort Plain Zip Codes
Fort Plain Area Codes
Income in Fort Plain
Income Overview in Fort Plain
Per Capita Income in Fort Plain is $23,724, while median incomes of families and households are $52,361 and $39,016 respectively.
| Characteristic | Number | Measure |
| Per Capita Income | 2,015 | $23,724 |
| Median Family Income | 457 | $52,361 |
| Mean Family Income | 457 | $63,723 |
| Median Household Income | 768 | $39,016 |
| Mean Household Income | 768 | $56,966 |
| Income Deficit | 457 | $13,423 |
| Wage / Income Gap (%) | 2,015 | 0.21% |
| Wage / Income Gap ($) | 2,015 | 99.79¢ per $1 |
| Gini / Inequality Index | 2,015 | 0.42 |
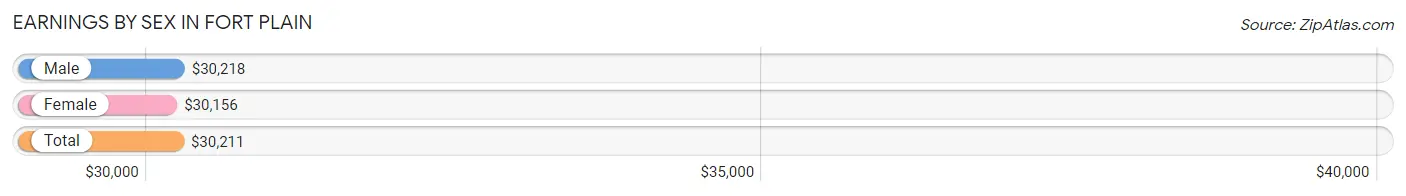
Earnings by Sex in Fort Plain
Average Earnings in Fort Plain are $30,211, $30,218 for men and $30,156 for women, a difference of 0.2%.
| Sex | Number | Average Earnings |
| Male | 533 (51.3%) | $30,218 |
| Female | 505 (48.6%) | $30,156 |
| Total | 1,038 (100.0%) | $30,211 |
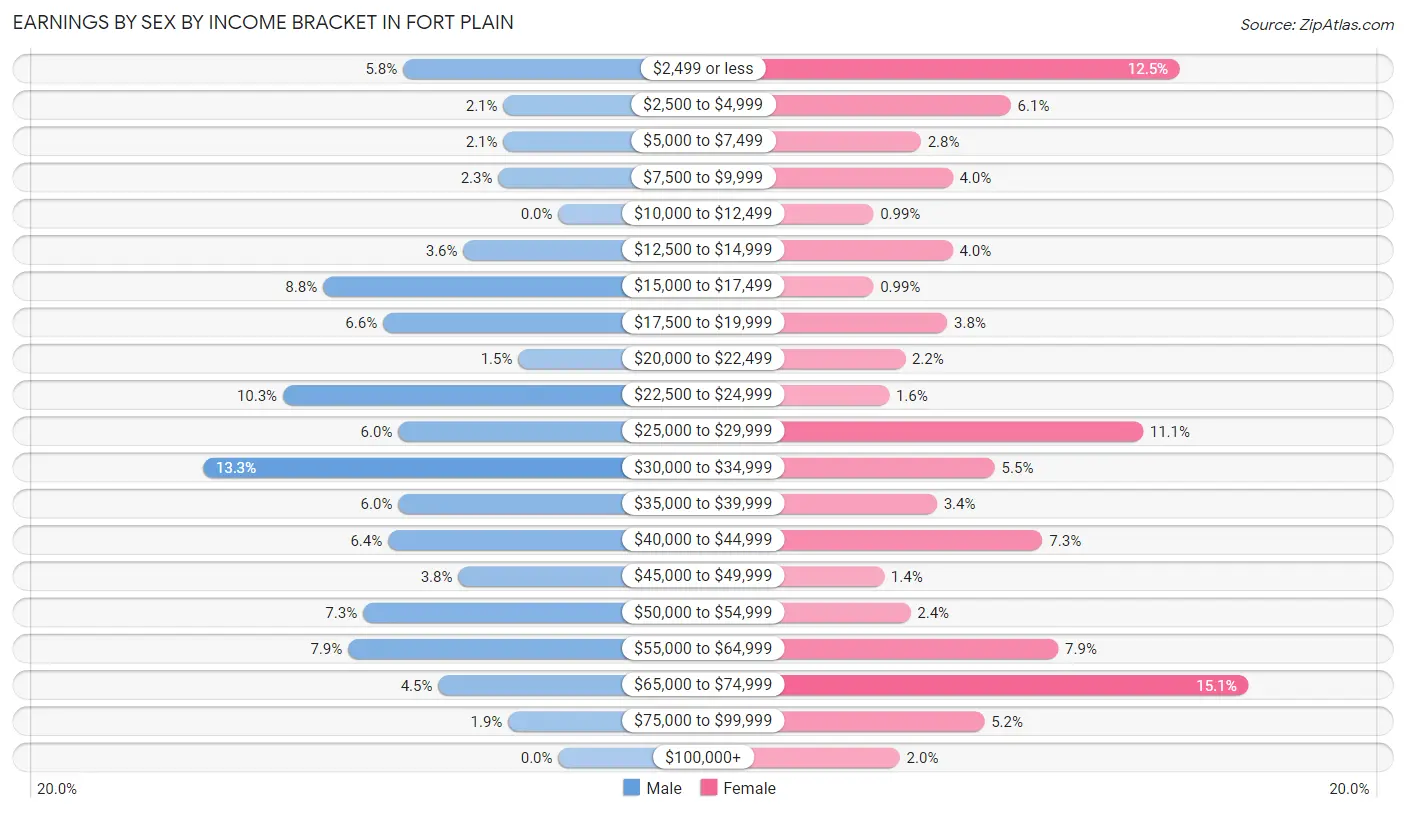
Earnings by Sex by Income Bracket in Fort Plain
The most common earnings brackets in Fort Plain are $30,000 to $34,999 for men (71 | 13.3%) and $65,000 to $74,999 for women (76 | 15.0%).
| Income | Male | Female |
| $2,499 or less | 31 (5.8%) | 63 (12.5%) |
| $2,500 to $4,999 | 11 (2.1%) | 31 (6.1%) |
| $5,000 to $7,499 | 11 (2.1%) | 14 (2.8%) |
| $7,500 to $9,999 | 12 (2.2%) | 20 (4.0%) |
| $10,000 to $12,499 | 0 (0.0%) | 5 (1.0%) |
| $12,500 to $14,999 | 19 (3.6%) | 20 (4.0%) |
| $15,000 to $17,499 | 47 (8.8%) | 5 (1.0%) |
| $17,500 to $19,999 | 35 (6.6%) | 19 (3.8%) |
| $20,000 to $22,499 | 8 (1.5%) | 11 (2.2%) |
| $22,500 to $24,999 | 55 (10.3%) | 8 (1.6%) |
| $25,000 to $29,999 | 32 (6.0%) | 56 (11.1%) |
| $30,000 to $34,999 | 71 (13.3%) | 28 (5.5%) |
| $35,000 to $39,999 | 32 (6.0%) | 17 (3.4%) |
| $40,000 to $44,999 | 34 (6.4%) | 37 (7.3%) |
| $45,000 to $49,999 | 20 (3.7%) | 7 (1.4%) |
| $50,000 to $54,999 | 39 (7.3%) | 12 (2.4%) |
| $55,000 to $64,999 | 42 (7.9%) | 40 (7.9%) |
| $65,000 to $74,999 | 24 (4.5%) | 76 (15.0%) |
| $75,000 to $99,999 | 10 (1.9%) | 26 (5.1%) |
| $100,000+ | 0 (0.0%) | 10 (2.0%) |
| Total | 533 (100.0%) | 505 (100.0%) |
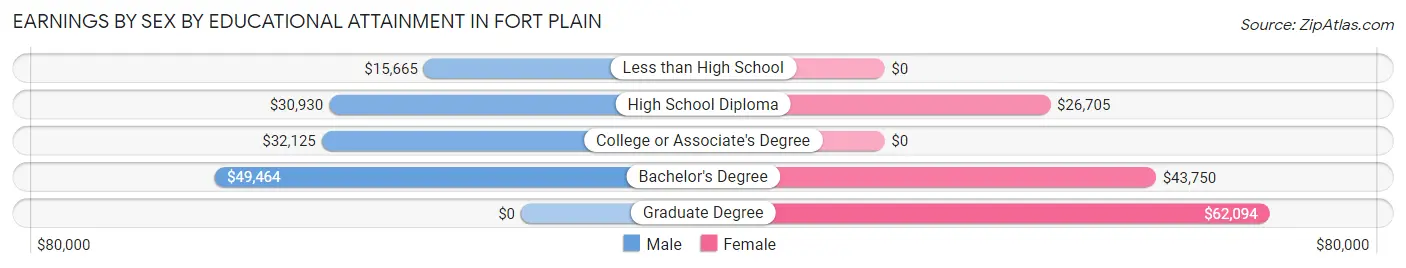
Earnings by Sex by Educational Attainment in Fort Plain
Average earnings in Fort Plain are $30,139 for men and $39,632 for women, a difference of 23.9%. Men with an educational attainment of bachelor's degree enjoy the highest average annual earnings of $49,464, while those with less than high school education earn the least with $15,665. Women with an educational attainment of graduate degree earn the most with the average annual earnings of $62,094, while those with high school diploma education have the smallest earnings of $26,705.
| Educational Attainment | Male Income | Female Income |
| Less than High School | $15,665 | $0 |
| High School Diploma | $30,930 | $26,705 |
| College or Associate's Degree | $32,125 | $0 |
| Bachelor's Degree | $49,464 | $43,750 |
| Graduate Degree | - | - |
| Total | $30,139 | $39,632 |
Family Income in Fort Plain
Family Income Brackets in Fort Plain
According to the Fort Plain family income data, there are 88 families falling into the $100,000 to $149,999 income range, which is the most common income bracket and makes up 19.3% of all families. Conversely, the $10,000 to $14,999 income bracket is the least frequent group with only 5 families (1.1%) belonging to this category.
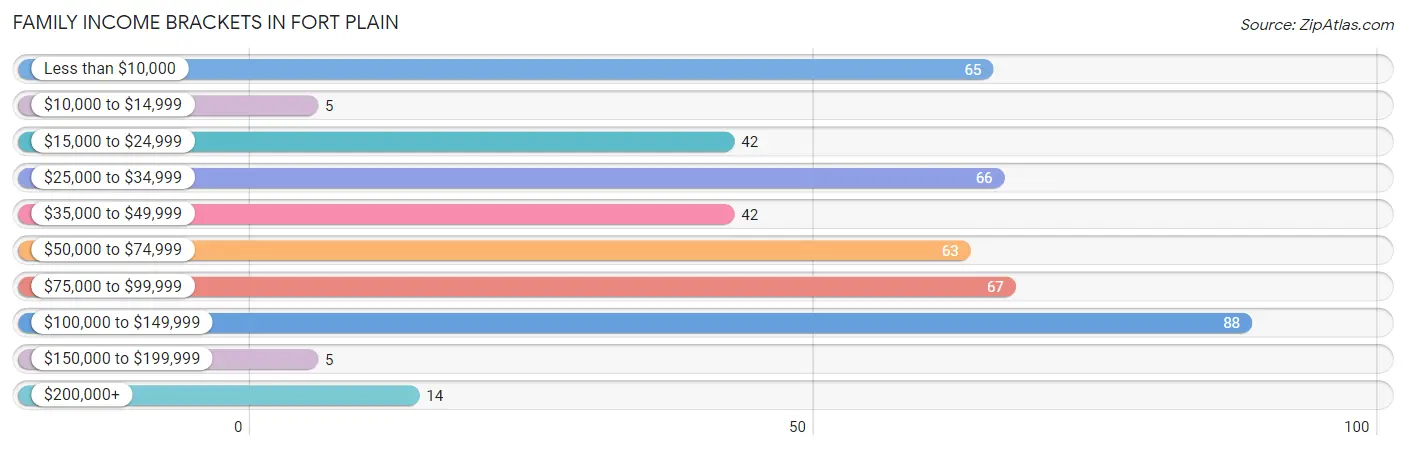
| Income Bracket | # Families | % Families |
| Less than $10,000 | 65 | 14.2% |
| $10,000 to $14,999 | 5 | 1.1% |
| $15,000 to $24,999 | 42 | 9.2% |
| $25,000 to $34,999 | 66 | 14.4% |
| $35,000 to $49,999 | 42 | 9.2% |
| $50,000 to $74,999 | 63 | 13.8% |
| $75,000 to $99,999 | 67 | 14.7% |
| $100,000 to $149,999 | 88 | 19.3% |
| $150,000 to $199,999 | 5 | 1.1% |
| $200,000+ | 14 | 3.1% |
Family Income by Famaliy Size in Fort Plain
3-person families (191 | 41.8%) account for the highest median family income in Fort Plain with $91,375 per family, while 3-person families (191 | 41.8%) have the highest median income of $30,458 per family member.
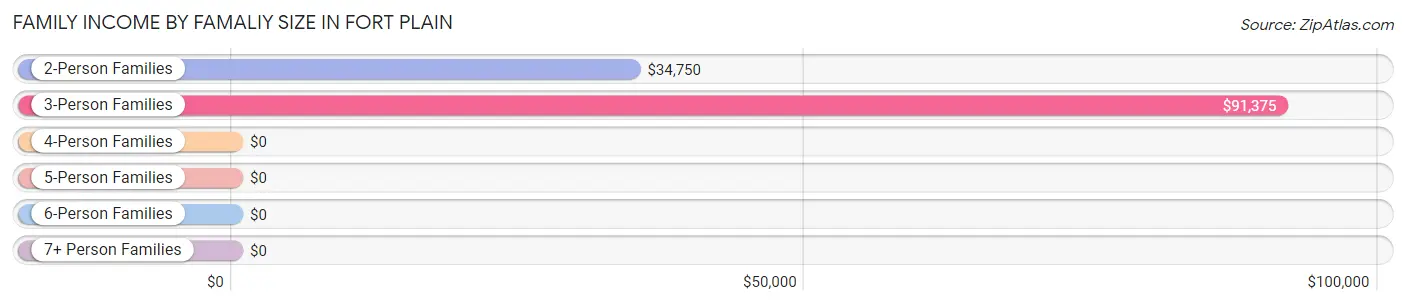
| Income Bracket | # Families | Median Income |
| 2-Person Families | 199 (43.5%) | $34,750 |
| 3-Person Families | 191 (41.8%) | $91,375 |
| 4-Person Families | 49 (10.7%) | $0 |
| 5-Person Families | 18 (3.9%) | $0 |
| 6-Person Families | 0 (0.0%) | $0 |
| 7+ Person Families | 0 (0.0%) | $0 |
| Total | 457 (100.0%) | $52,361 |
Family Income by Number of Earners in Fort Plain
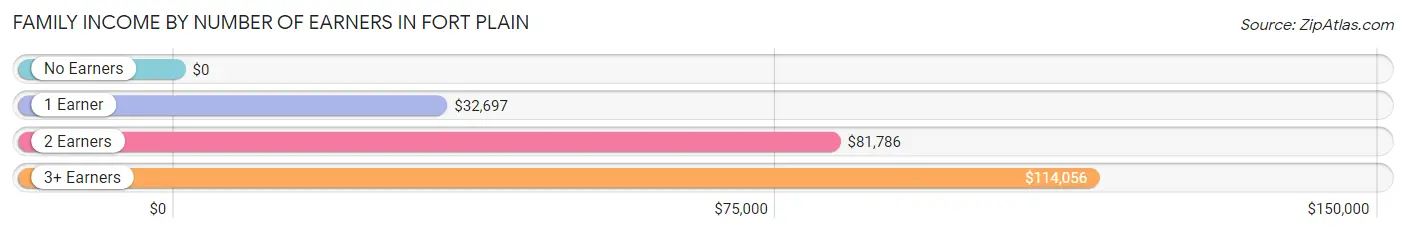
| Number of Earners | # Families | Median Income |
| No Earners | 54 (11.8%) | $0 |
| 1 Earner | 219 (47.9%) | $32,697 |
| 2 Earners | 122 (26.7%) | $81,786 |
| 3+ Earners | 62 (13.6%) | $114,056 |
| Total | 457 (100.0%) | $52,361 |
Household Income in Fort Plain
Household Income Brackets in Fort Plain
With 152 households falling in the category, the $15,000 to $24,999 income range is the most frequent in Fort Plain, accounting for 19.8% of all households. In contrast, only 13 households (1.7%) fall into the $150,000 to $199,999 income bracket, making it the least populous group.
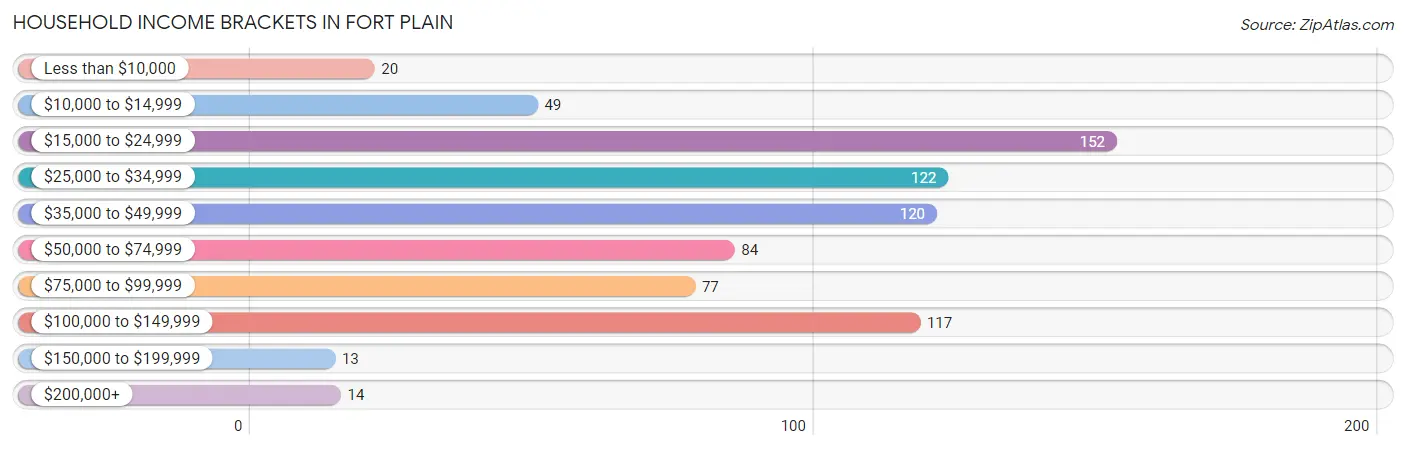
| Income Bracket | # Households | % Households |
| Less than $10,000 | 20 | 2.6% |
| $10,000 to $14,999 | 49 | 6.4% |
| $15,000 to $24,999 | 152 | 19.8% |
| $25,000 to $34,999 | 122 | 15.9% |
| $35,000 to $49,999 | 120 | 15.6% |
| $50,000 to $74,999 | 84 | 10.9% |
| $75,000 to $99,999 | 77 | 10.0% |
| $100,000 to $149,999 | 117 | 15.2% |
| $150,000 to $199,999 | 13 | 1.7% |
| $200,000+ | 14 | 1.8% |
Household Income by Householder Age in Fort Plain
The median household income in Fort Plain is $39,016, with the highest median household income of $39,347 found in the 25 to 44 years age bracket for the primary householder. A total of 173 households (22.5%) fall into this category. Meanwhile, the 15 to 24 years age bracket for the primary householder has the lowest median household income of $0, with 30 households (3.9%) in this group.
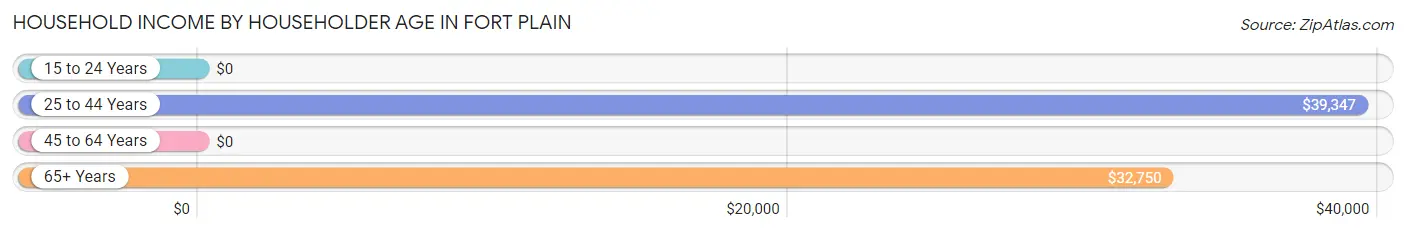
| Income Bracket | # Households | Median Income |
| 15 to 24 Years | 30 (3.9%) | $0 |
| 25 to 44 Years | 173 (22.5%) | $39,347 |
| 45 to 64 Years | 352 (45.8%) | $0 |
| 65+ Years | 213 (27.7%) | $32,750 |
| Total | 768 (100.0%) | $39,016 |
Poverty in Fort Plain
Income Below Poverty by Sex and Age in Fort Plain
With 21.0% poverty level for males and 27.9% for females among the residents of Fort Plain, under 5 year old males and 15 year old females are the most vulnerable to poverty, with 55 males (79.7%) and 25 females (100.0%) in their respective age groups living below the poverty level.
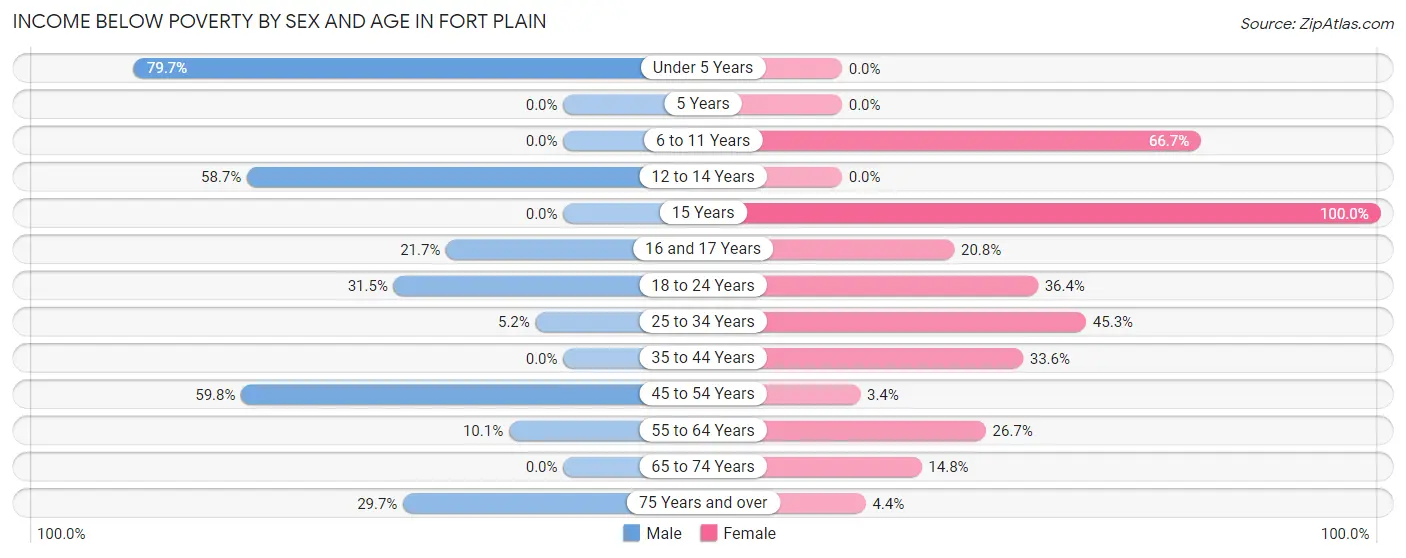
| Age Bracket | Male | Female |
| Under 5 Years | 55 (79.7%) | 0 (0.0%) |
| 5 Years | 0 (0.0%) | 0 (0.0%) |
| 6 to 11 Years | 0 (0.0%) | 82 (66.7%) |
| 12 to 14 Years | 27 (58.7%) | 0 (0.0%) |
| 15 Years | 0 (0.0%) | 25 (100.0%) |
| 16 and 17 Years | 5 (21.7%) | 5 (20.8%) |
| 18 to 24 Years | 17 (31.5%) | 40 (36.4%) |
| 25 to 34 Years | 7 (5.1%) | 29 (45.3%) |
| 35 to 44 Years | 0 (0.0%) | 43 (33.6%) |
| 45 to 54 Years | 55 (59.8%) | 5 (3.4%) |
| 55 to 64 Years | 23 (10.1%) | 47 (26.7%) |
| 65 to 74 Years | 0 (0.0%) | 17 (14.8%) |
| 75 Years and over | 11 (29.7%) | 4 (4.4%) |
| Total | 200 (21.0%) | 297 (27.9%) |
Income Above Poverty by Sex and Age in Fort Plain
According to the poverty statistics in Fort Plain, males aged 6 to 11 years and females aged under 5 years are the age groups that are most secure financially, with 100.0% of males and 100.0% of females in these age groups living above the poverty line.
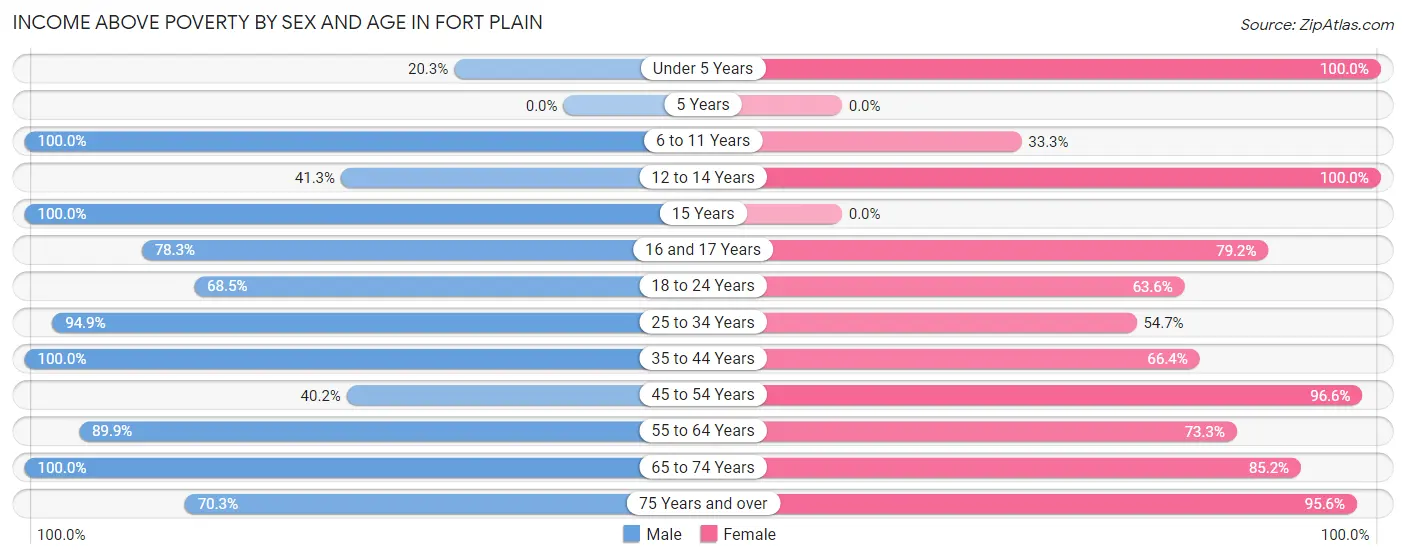
| Age Bracket | Male | Female |
| Under 5 Years | 14 (20.3%) | 44 (100.0%) |
| 5 Years | 0 (0.0%) | 0 (0.0%) |
| 6 to 11 Years | 59 (100.0%) | 41 (33.3%) |
| 12 to 14 Years | 19 (41.3%) | 17 (100.0%) |
| 15 Years | 12 (100.0%) | 0 (0.0%) |
| 16 and 17 Years | 18 (78.3%) | 19 (79.2%) |
| 18 to 24 Years | 37 (68.5%) | 70 (63.6%) |
| 25 to 34 Years | 129 (94.9%) | 35 (54.7%) |
| 35 to 44 Years | 123 (100.0%) | 85 (66.4%) |
| 45 to 54 Years | 37 (40.2%) | 143 (96.6%) |
| 55 to 64 Years | 205 (89.9%) | 129 (73.3%) |
| 65 to 74 Years | 71 (100.0%) | 98 (85.2%) |
| 75 Years and over | 26 (70.3%) | 87 (95.6%) |
| Total | 750 (78.9%) | 768 (72.1%) |
Income Below Poverty Among Married-Couple Families in Fort Plain
The poverty statistics for married-couple families in Fort Plain show that 7.2% or 19 of the total 263 families live below the poverty line. Families with no children have the highest poverty rate of 9.4%, comprising of 19 families. On the other hand, families with 1 or 2 children have the lowest poverty rate of 0.0%, which includes 0 families.
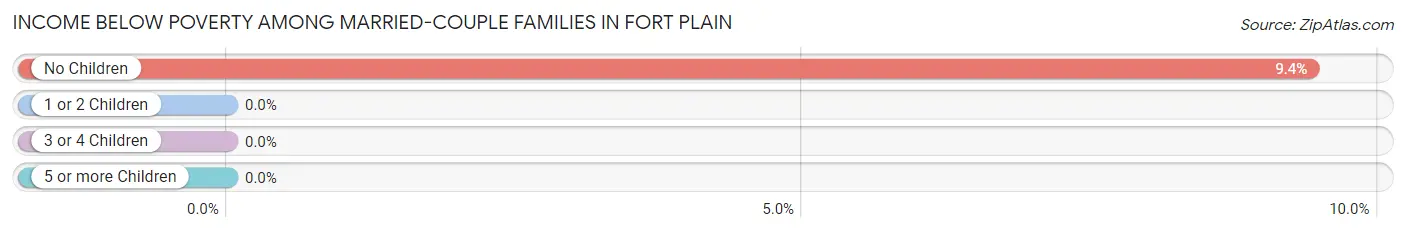
| Children | Above Poverty | Below Poverty |
| No Children | 183 (90.6%) | 19 (9.4%) |
| 1 or 2 Children | 53 (100.0%) | 0 (0.0%) |
| 3 or 4 Children | 8 (100.0%) | 0 (0.0%) |
| 5 or more Children | 0 (0.0%) | 0 (0.0%) |
| Total | 244 (92.8%) | 19 (7.2%) |
Income Below Poverty Among Single-Parent Households in Fort Plain
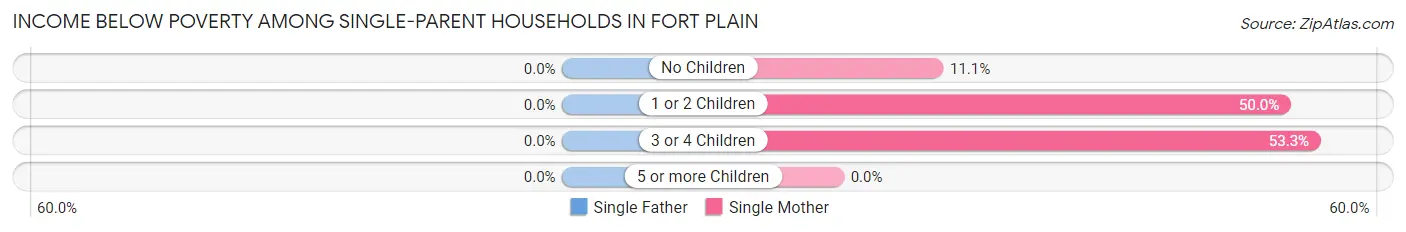
| Children | Single Father | Single Mother |
| No Children | 0 (0.0%) | 3 (11.1%) |
| 1 or 2 Children | 0 (0.0%) | 60 (50.0%) |
| 3 or 4 Children | 0 (0.0%) | 8 (53.3%) |
| 5 or more Children | 0 (0.0%) | 0 (0.0%) |
| Total | 0 (0.0%) | 71 (43.8%) |
Income Below Poverty Among Married-Couple vs Single-Parent Households in Fort Plain
The poverty data for Fort Plain shows that 19 of the married-couple family households (7.2%) and 71 of the single-parent households (36.6%) are living below the poverty level. Within the married-couple family households, those with no children have the highest poverty rate, with 19 households (9.4%) falling below the poverty line. Among the single-parent households, those with 3 or 4 children have the highest poverty rate, with 8 household (53.3%) living below poverty.
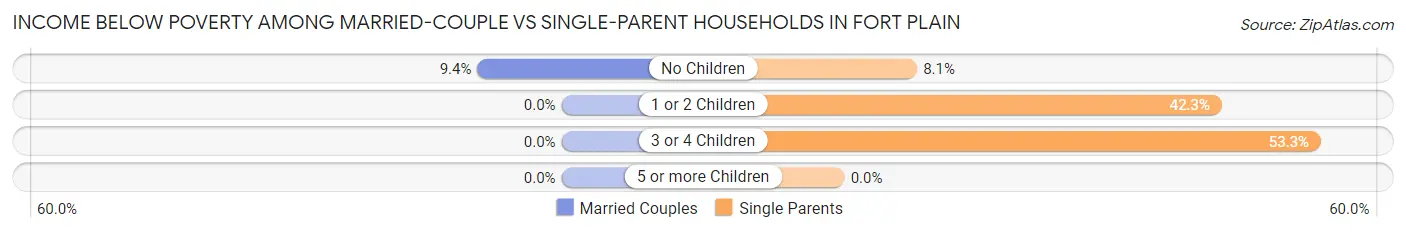
| Children | Married-Couple Families | Single-Parent Households |
| No Children | 19 (9.4%) | 3 (8.1%) |
| 1 or 2 Children | 0 (0.0%) | 60 (42.2%) |
| 3 or 4 Children | 0 (0.0%) | 8 (53.3%) |
| 5 or more Children | 0 (0.0%) | 0 (0.0%) |
| Total | 19 (7.2%) | 71 (36.6%) |
Race in Fort Plain
The most populous races in Fort Plain are White / Caucasian (1,919 | 95.2%), Hispanic or Latino (96 | 4.8%), and Black / African American (53 | 2.6%).
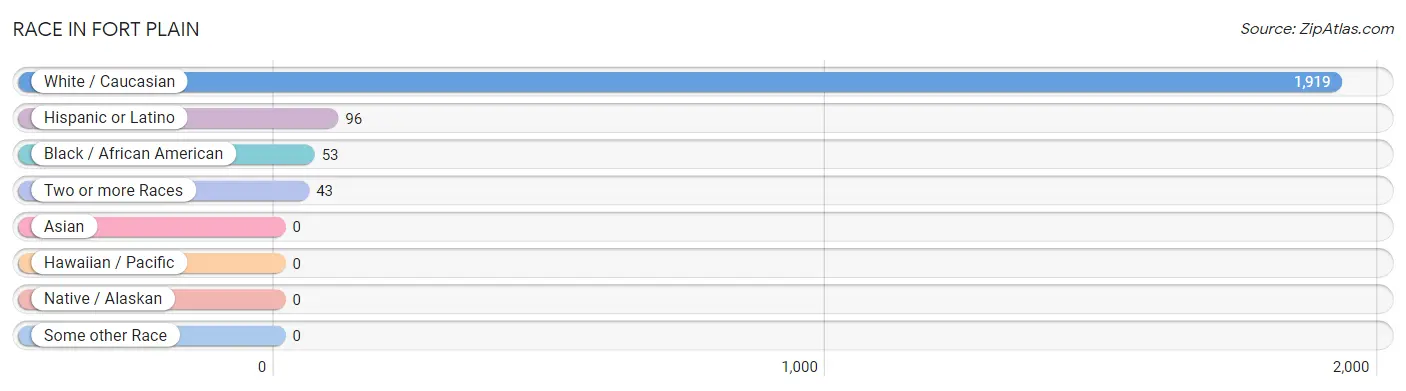
| Race | # Population | % Population |
| Asian | 0 | 0.0% |
| Black / African American | 53 | 2.6% |
| Hawaiian / Pacific | 0 | 0.0% |
| Hispanic or Latino | 96 | 4.8% |
| Native / Alaskan | 0 | 0.0% |
| White / Caucasian | 1,919 | 95.2% |
| Two or more Races | 43 | 2.1% |
| Some other Race | 0 | 0.0% |
| Total | 2,015 | 100.0% |
Ancestry in Fort Plain
The most populous ancestries reported in Fort Plain are German (555 | 27.5%), Italian (360 | 17.9%), Irish (307 | 15.2%), English (266 | 13.2%), and Dutch (205 | 10.2%), together accounting for 84.0% of all Fort Plain residents.
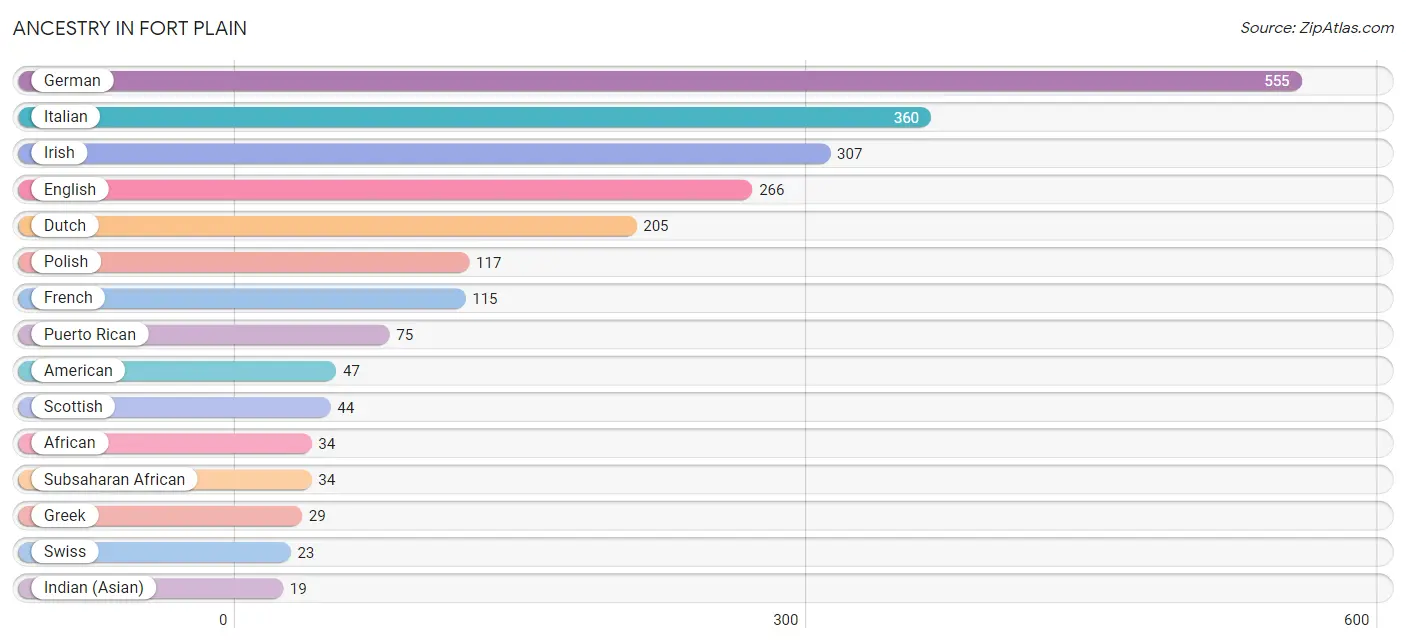
| Ancestry | # Population | % Population |
| African | 34 | 1.7% |
| American | 47 | 2.3% |
| Dutch | 205 | 10.2% |
| English | 266 | 13.2% |
| European | 11 | 0.5% |
| French | 115 | 5.7% |
| French Canadian | 2 | 0.1% |
| German | 555 | 27.5% |
| Greek | 29 | 1.4% |
| Hungarian | 6 | 0.3% |
| Indian (Asian) | 19 | 0.9% |
| Irish | 307 | 15.2% |
| Italian | 360 | 17.9% |
| Mexican | 7 | 0.4% |
| Polish | 117 | 5.8% |
| Puerto Rican | 75 | 3.7% |
| Russian | 11 | 0.5% |
| Scandinavian | 6 | 0.3% |
| Scotch-Irish | 8 | 0.4% |
| Scottish | 44 | 2.2% |
| Spaniard | 7 | 0.4% |
| Spanish | 7 | 0.4% |
| Subsaharan African | 34 | 1.7% |
| Swedish | 19 | 0.9% |
| Swiss | 23 | 1.1% |
| Ukrainian | 11 | 0.5% |
| Welsh | 19 | 0.9% | View All 27 Rows |
Immigrants in Fort Plain
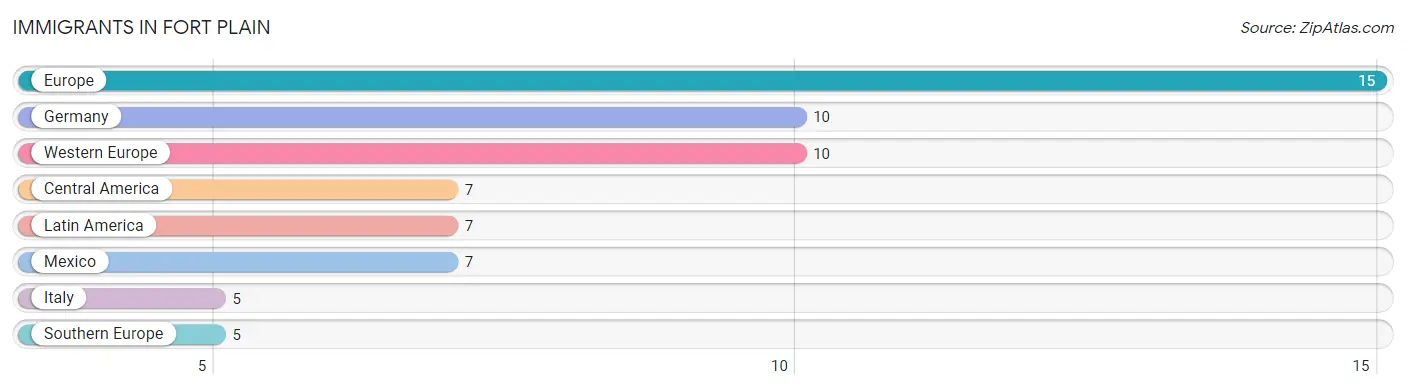
The most numerous immigrant groups reported in Fort Plain came from Europe (15 | 0.7%), Germany (10 | 0.5%), Western Europe (10 | 0.5%), Central America (7 | 0.4%), and Latin America (7 | 0.4%), together accounting for 2.4% of all Fort Plain residents.
| Immigration Origin | # Population | % Population |
| Central America | 7 | 0.4% |
| Europe | 15 | 0.7% |
| Germany | 10 | 0.5% |
| Italy | 5 | 0.3% |
| Latin America | 7 | 0.4% |
| Mexico | 7 | 0.4% |
| Southern Europe | 5 | 0.3% |
| Western Europe | 10 | 0.5% | View All 8 Rows |
Sex and Age in Fort Plain
Sex and Age in Fort Plain
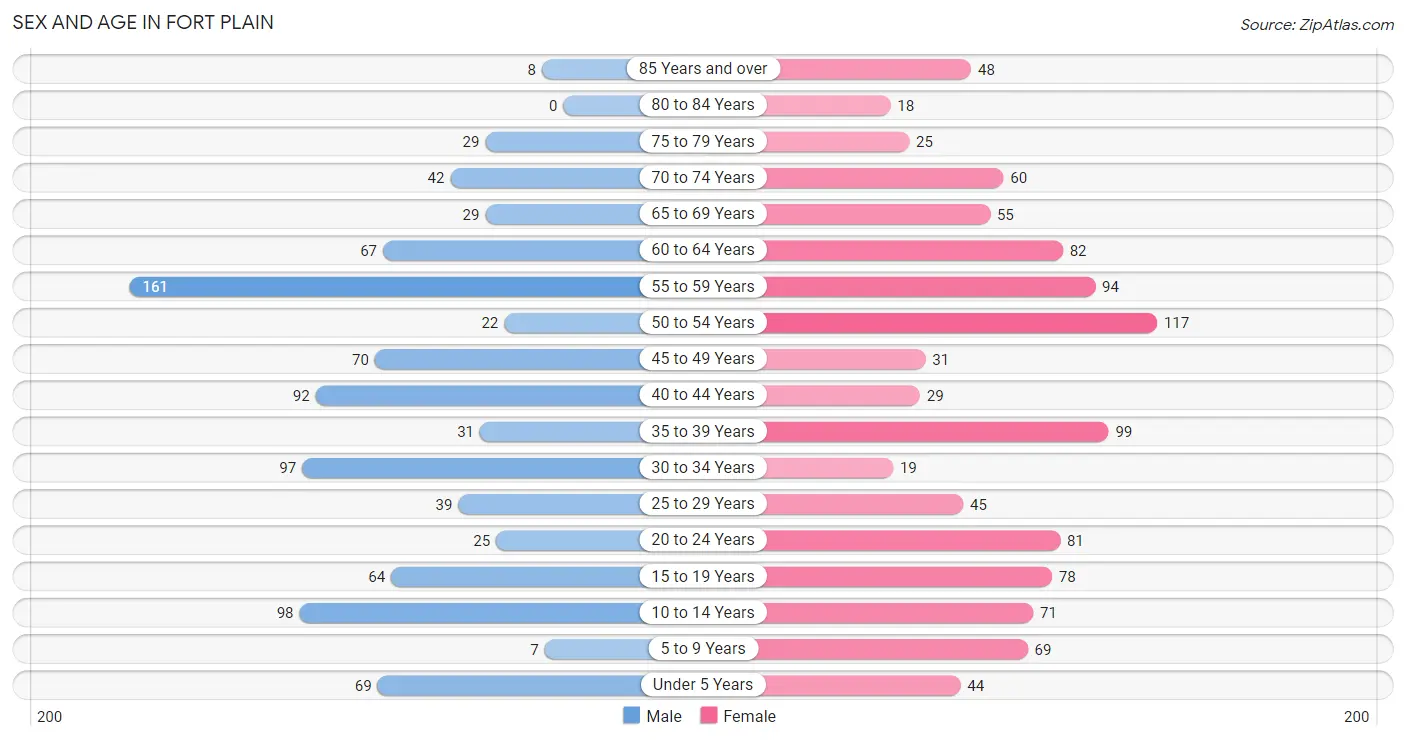
The most populous age groups in Fort Plain are 55 to 59 Years (161 | 17.0%) for men and 50 to 54 Years (117 | 11.0%) for women.
| Age Bracket | Male | Female |
| Under 5 Years | 69 (7.3%) | 44 (4.1%) |
| 5 to 9 Years | 7 (0.7%) | 69 (6.5%) |
| 10 to 14 Years | 98 (10.3%) | 71 (6.7%) |
| 15 to 19 Years | 64 (6.7%) | 78 (7.3%) |
| 20 to 24 Years | 25 (2.6%) | 81 (7.6%) |
| 25 to 29 Years | 39 (4.1%) | 45 (4.2%) |
| 30 to 34 Years | 97 (10.2%) | 19 (1.8%) |
| 35 to 39 Years | 31 (3.3%) | 99 (9.3%) |
| 40 to 44 Years | 92 (9.7%) | 29 (2.7%) |
| 45 to 49 Years | 70 (7.4%) | 31 (2.9%) |
| 50 to 54 Years | 22 (2.3%) | 117 (11.0%) |
| 55 to 59 Years | 161 (17.0%) | 94 (8.8%) |
| 60 to 64 Years | 67 (7.0%) | 82 (7.7%) |
| 65 to 69 Years | 29 (3.0%) | 55 (5.2%) |
| 70 to 74 Years | 42 (4.4%) | 60 (5.6%) |
| 75 to 79 Years | 29 (3.0%) | 25 (2.4%) |
| 80 to 84 Years | 0 (0.0%) | 18 (1.7%) |
| 85 Years and over | 8 (0.8%) | 48 (4.5%) |
| Total | 950 (100.0%) | 1,065 (100.0%) |
Families and Households in Fort Plain
Median Family Size in Fort Plain
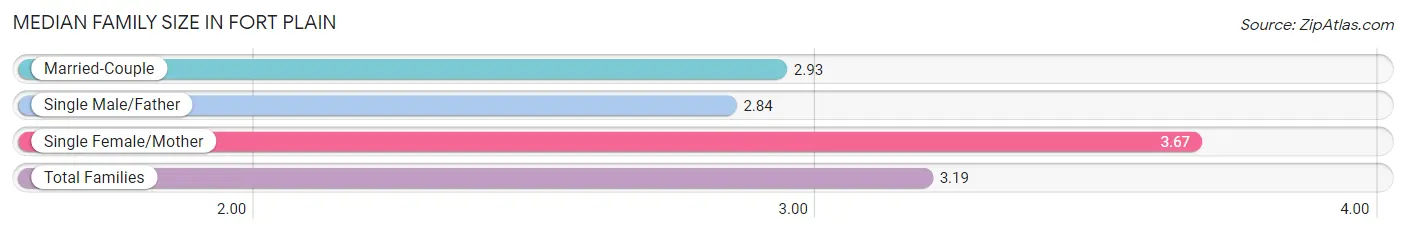
The median family size in Fort Plain is 3.19 persons per family, with single female/mother families (162 | 35.4%) accounting for the largest median family size of 3.67 persons per family. On the other hand, single male/father families (32 | 7.0%) represent the smallest median family size with 2.84 persons per family.
| Family Type | # Families | Family Size |
| Married-Couple | 263 (57.6%) | 2.93 |
| Single Male/Father | 32 (7.0%) | 2.84 |
| Single Female/Mother | 162 (35.4%) | 3.67 |
| Total Families | 457 (100.0%) | 3.19 |
Median Household Size in Fort Plain
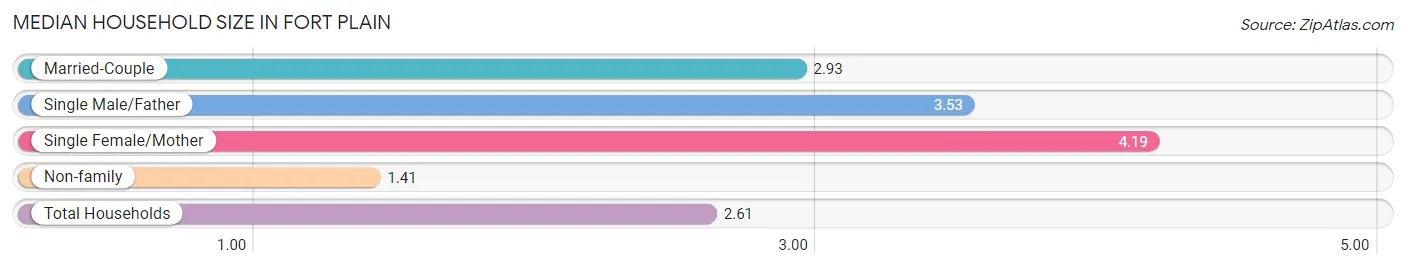
The median household size in Fort Plain is 2.61 persons per household, with single female/mother households (162 | 21.1%) accounting for the largest median household size of 4.19 persons per household. non-family households (311 | 40.5%) represent the smallest median household size with 1.41 persons per household.
| Household Type | # Households | Household Size |
| Married-Couple | 263 (34.2%) | 2.93 |
| Single Male/Father | 32 (4.2%) | 3.53 |
| Single Female/Mother | 162 (21.1%) | 4.19 |
| Non-family | 311 (40.5%) | 1.41 |
| Total Households | 768 (100.0%) | 2.61 |
Household Size by Marriage Status in Fort Plain
Out of a total of 768 households in Fort Plain, 457 (59.5%) are family households, while 311 (40.5%) are nonfamily households. The most numerous type of family households are 2-person households, comprising 171, and the most common type of nonfamily households are 1-person households, comprising 231.
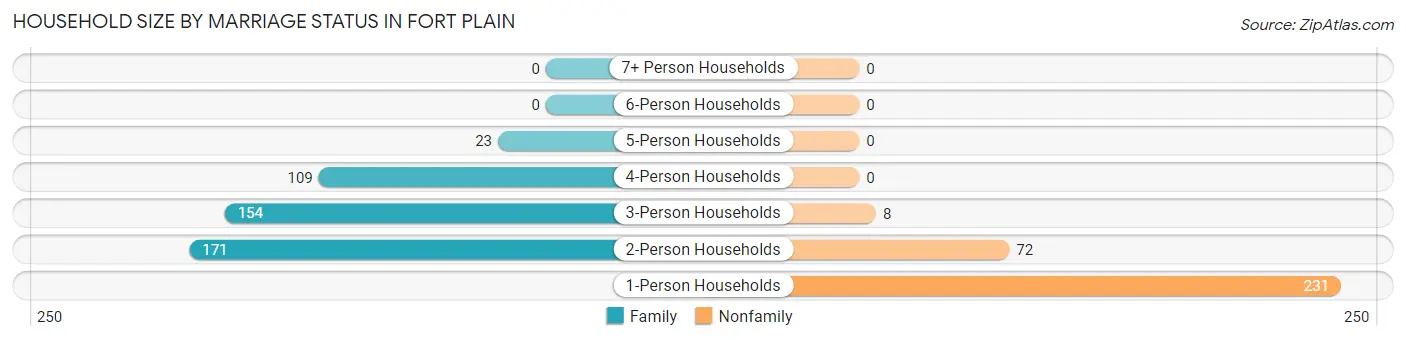
| Household Size | Family Households | Nonfamily Households |
| 1-Person Households | - | 231 (30.1%) |
| 2-Person Households | 171 (22.3%) | 72 (9.4%) |
| 3-Person Households | 154 (20.1%) | 8 (1.0%) |
| 4-Person Households | 109 (14.2%) | 0 (0.0%) |
| 5-Person Households | 23 (3.0%) | 0 (0.0%) |
| 6-Person Households | 0 (0.0%) | 0 (0.0%) |
| 7+ Person Households | 0 (0.0%) | 0 (0.0%) |
| Total | 457 (59.5%) | 311 (40.5%) |
Female Fertility in Fort Plain
Fertility by Age in Fort Plain
Average fertility rate in Fort Plain is 81.0 births per 1,000 women. Women in the age bracket of 20 to 34 years have the highest fertility rate with 228.0 births per 1,000 women. Women in the age bracket of 20 to 34 years acount for 100.0% of all women with births.
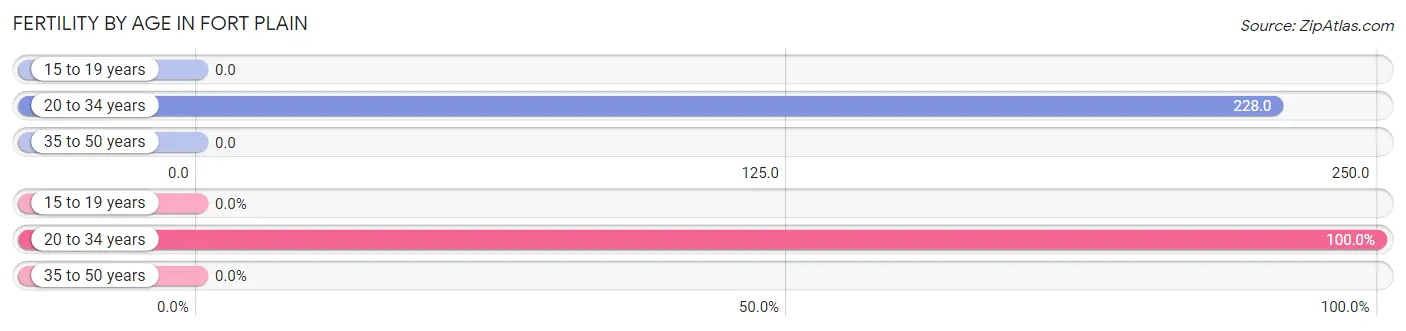
| Age Bracket | Women with Births | Births / 1,000 Women |
| 15 to 19 years | 0 (0.0%) | 0.0 |
| 20 to 34 years | 33 (100.0%) | 228.0 |
| 35 to 50 years | 0 (0.0%) | 0.0 |
| Total | 33 (100.0%) | 81.0 |
Fertility by Age by Marriage Status in Fort Plain
78.8% of women with births (33) in Fort Plain are married. The highest percentage of unmarried women with births falls into 20 to 34 years age bracket with 21.2% of them unmarried at the time of birth, while the lowest percentage of unmarried women with births belong to 20 to 34 years age bracket with 21.2% of them unmarried.
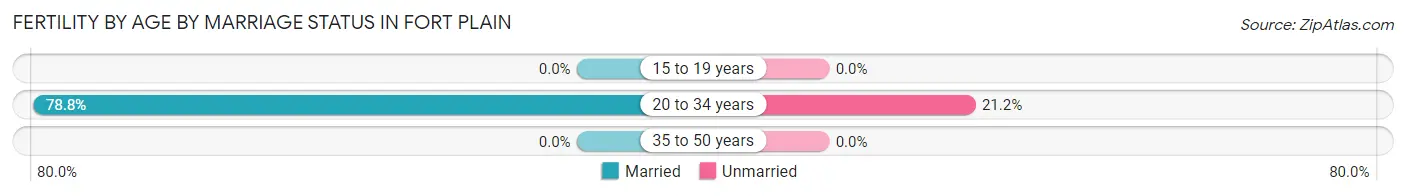
| Age Bracket | Married | Unmarried |
| 15 to 19 years | 0 (0.0%) | 0 (0.0%) |
| 20 to 34 years | 26 (78.8%) | 7 (21.2%) |
| 35 to 50 years | 0 (0.0%) | 0 (0.0%) |
| Total | 26 (78.8%) | 7 (21.2%) |
Fertility by Education in Fort Plain
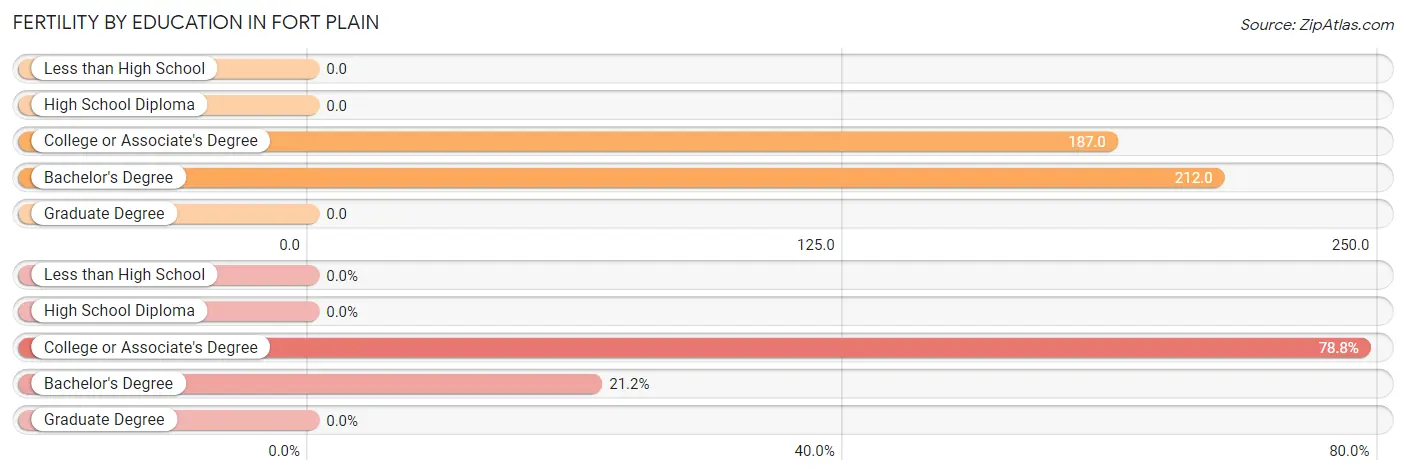
| Educational Attainment | Women with Births | Births / 1,000 Women |
| Less than High School | 0 (0.0%) | 0.0 |
| High School Diploma | 0 (0.0%) | 0.0 |
| College or Associate's Degree | 26 (78.8%) | 187.0 |
| Bachelor's Degree | 7 (21.2%) | 212.0 |
| Graduate Degree | 0 (0.0%) | 0.0 |
| Total | 33 (100.0%) | 81.0 |
Fertility by Education by Marriage Status in Fort Plain
21.2% of women with births in Fort Plain are unmarried. Women with the educational attainment of college or associate's degree are most likely to be married with 100.0% of them married at childbirth, while women with the educational attainment of bachelor's degree are least likely to be married with 100.0% of them unmarried at childbirth.
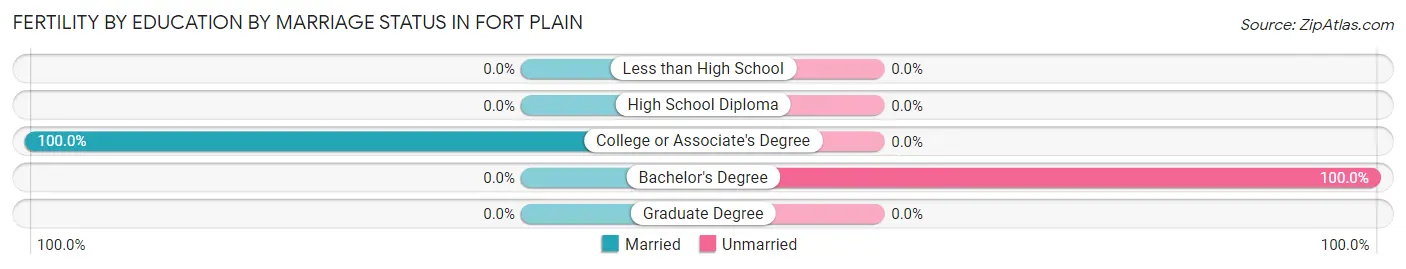
| Educational Attainment | Married | Unmarried |
| Less than High School | 0 (0.0%) | 0 (0.0%) |
| High School Diploma | 0 (0.0%) | 0 (0.0%) |
| College or Associate's Degree | 26 (100.0%) | 0 (0.0%) |
| Bachelor's Degree | 0 (0.0%) | 7 (100.0%) |
| Graduate Degree | 0 (0.0%) | 0 (0.0%) |
| Total | 26 (78.8%) | 7 (21.2%) |
Employment Characteristics in Fort Plain
Employment by Class of Employer in Fort Plain
Among the 921 employed individuals in Fort Plain, private company employees (536 | 58.2%), not-for-profit organizations (169 | 18.3%), and local government employees (132 | 14.3%) make up the most common classes of employment.
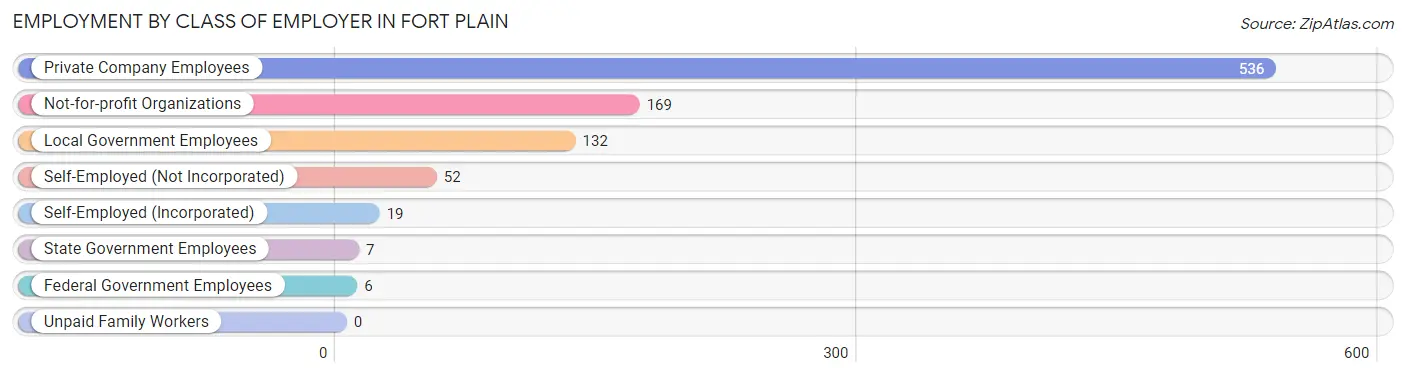
| Employer Class | # Employees | % Employees |
| Private Company Employees | 536 | 58.2% |
| Self-Employed (Incorporated) | 19 | 2.1% |
| Self-Employed (Not Incorporated) | 52 | 5.7% |
| Not-for-profit Organizations | 169 | 18.3% |
| Local Government Employees | 132 | 14.3% |
| State Government Employees | 7 | 0.8% |
| Federal Government Employees | 6 | 0.6% |
| Unpaid Family Workers | 0 | 0.0% |
| Total | 921 | 100.0% |
Employment Status by Age in Fort Plain
According to the labor force statistics for Fort Plain, out of the total population over 16 years of age (1,620), 61.7% or 1,000 individuals are in the labor force, with 6.8% or 68 of them unemployed. The age group with the highest labor force participation rate is 30 to 34 years, with 92.2% or 107 individuals in the labor force. Within the labor force, the 16 to 19 years age range has the highest percentage of unemployed individuals, with 51.2% or 21 of them being unemployed.
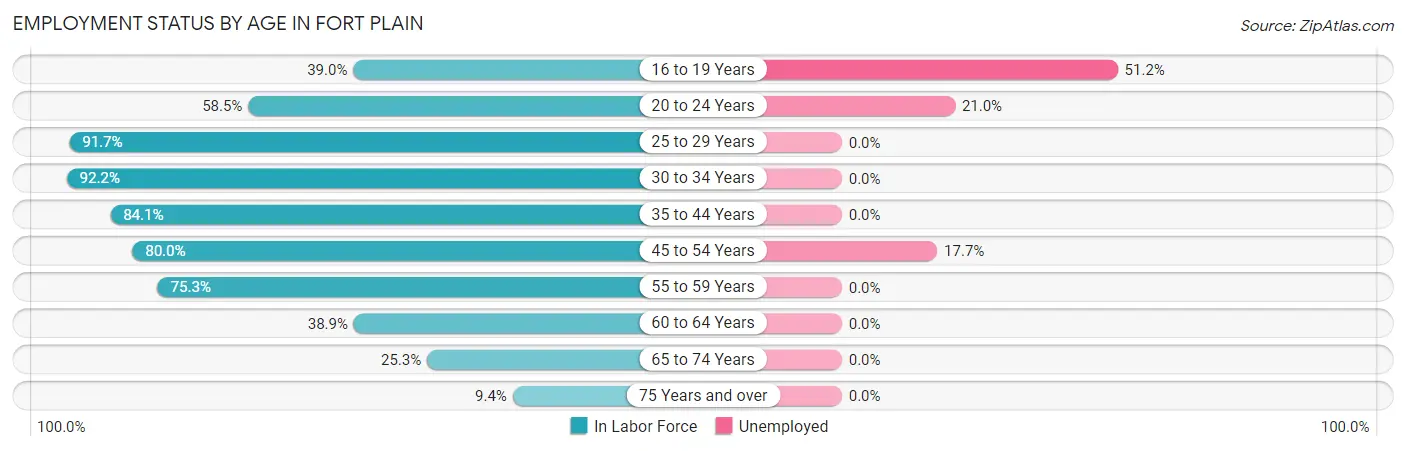
| Age Bracket | In Labor Force | Unemployed |
| 16 to 19 Years | 41 (39.0%) | 21 (51.2%) |
| 20 to 24 Years | 62 (58.5%) | 13 (21.0%) |
| 25 to 29 Years | 77 (91.7%) | 0 (0.0%) |
| 30 to 34 Years | 107 (92.2%) | 0 (0.0%) |
| 35 to 44 Years | 211 (84.1%) | 0 (0.0%) |
| 45 to 54 Years | 192 (80.0%) | 34 (17.7%) |
| 55 to 59 Years | 192 (75.3%) | 0 (0.0%) |
| 60 to 64 Years | 58 (38.9%) | 0 (0.0%) |
| 65 to 74 Years | 47 (25.3%) | 0 (0.0%) |
| 75 Years and over | 12 (9.4%) | 0 (0.0%) |
| Total | 1,000 (61.7%) | 68 (6.8%) |
Employment Status by Educational Attainment in Fort Plain
According to labor force statistics for Fort Plain, 76.4% of individuals (837) out of the total population between 25 and 64 years of age (1,095) are in the labor force, with 4.1% or 34 of them being unemployed. The group with the highest labor force participation rate are those with the educational attainment of bachelor's degree or higher, with 81.6% or 168 individuals in the labor force. Within the labor force, individuals with college / associate degree education have the highest percentage of unemployment, with 12.1% or 34 of them being unemployed.
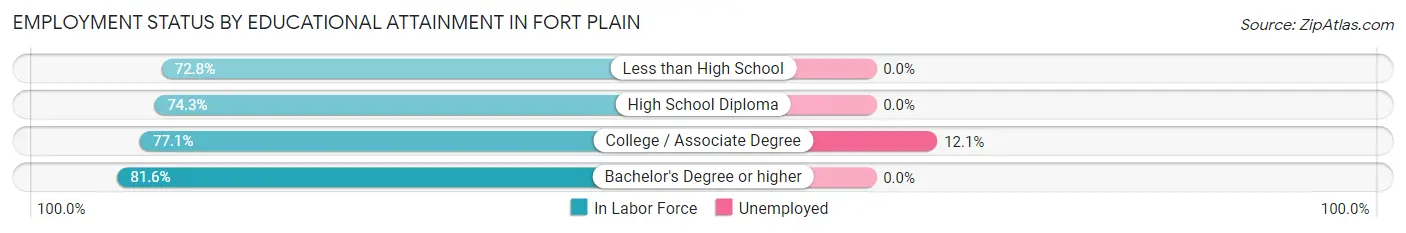
| Educational Attainment | In Labor Force | Unemployed |
| Less than High School | 83 (72.8%) | 0 (0.0%) |
| High School Diploma | 306 (74.3%) | 0 (0.0%) |
| College / Associate Degree | 280 (77.1%) | 44 (12.1%) |
| Bachelor's Degree or higher | 168 (81.6%) | 0 (0.0%) |
| Total | 837 (76.4%) | 45 (4.1%) |
Employment Occupations by Sex in Fort Plain
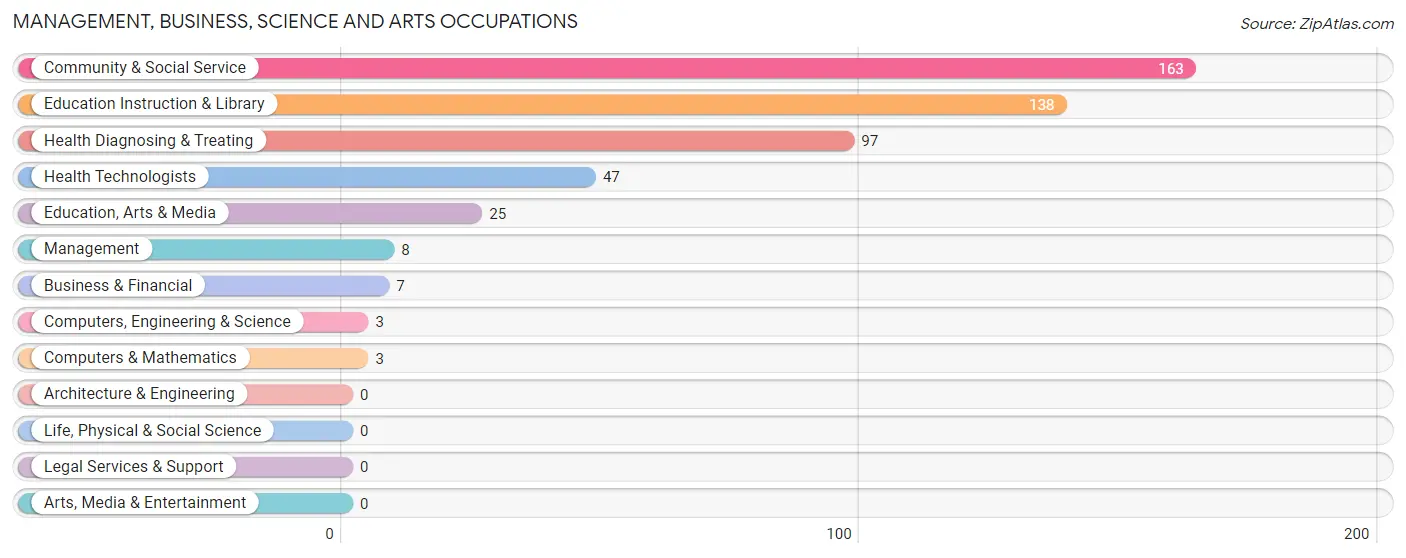
Management, Business, Science and Arts Occupations
The most common Management, Business, Science and Arts occupations in Fort Plain are Community & Social Service (163 | 17.5%), Education Instruction & Library (138 | 14.8%), Health Diagnosing & Treating (97 | 10.4%), Health Technologists (47 | 5.1%), and Education, Arts & Media (25 | 2.7%).
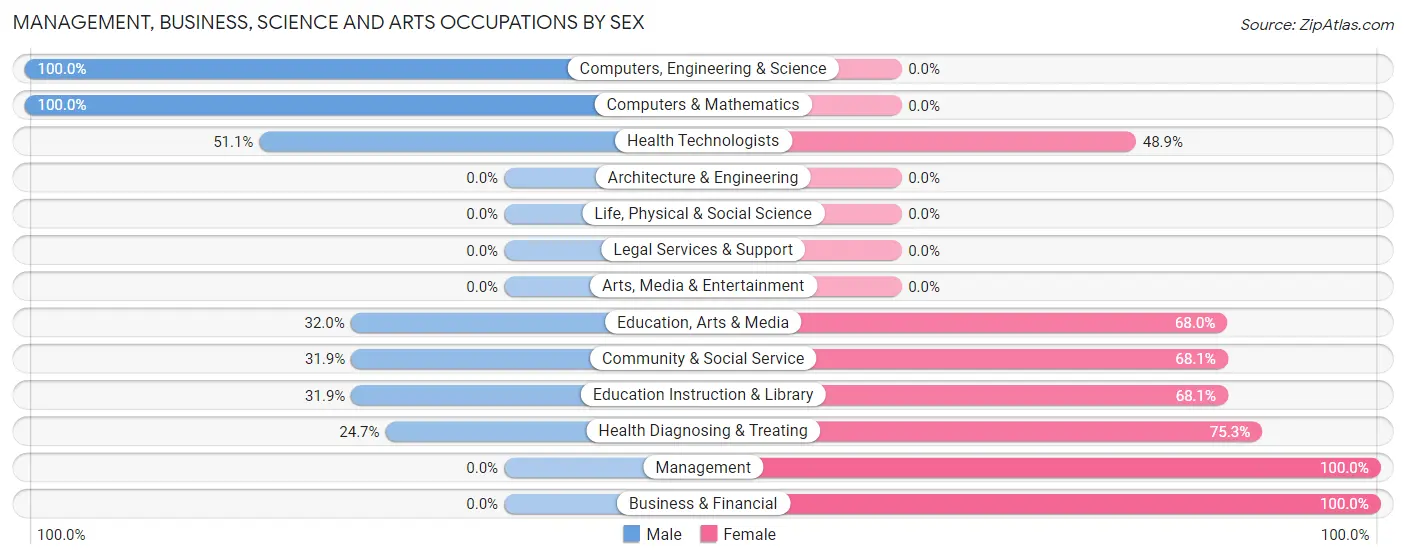
Management, Business, Science and Arts Occupations by Sex
Within the Management, Business, Science and Arts occupations in Fort Plain, the most male-oriented occupations are Computers, Engineering & Science (100.0%), Computers & Mathematics (100.0%), and Health Technologists (51.1%), while the most female-oriented occupations are Management (100.0%), Business & Financial (100.0%), and Health Diagnosing & Treating (75.3%).
| Occupation | Male | Female |
| Management | 0 (0.0%) | 8 (100.0%) |
| Business & Financial | 0 (0.0%) | 7 (100.0%) |
| Computers, Engineering & Science | 3 (100.0%) | 0 (0.0%) |
| Computers & Mathematics | 3 (100.0%) | 0 (0.0%) |
| Architecture & Engineering | 0 (0.0%) | 0 (0.0%) |
| Life, Physical & Social Science | 0 (0.0%) | 0 (0.0%) |
| Community & Social Service | 52 (31.9%) | 111 (68.1%) |
| Education, Arts & Media | 8 (32.0%) | 17 (68.0%) |
| Legal Services & Support | 0 (0.0%) | 0 (0.0%) |
| Education Instruction & Library | 44 (31.9%) | 94 (68.1%) |
| Arts, Media & Entertainment | 0 (0.0%) | 0 (0.0%) |
| Health Diagnosing & Treating | 24 (24.7%) | 73 (75.3%) |
| Health Technologists | 24 (51.1%) | 23 (48.9%) |
| Total (Category) | 79 (28.4%) | 199 (71.6%) |
| Total (Overall) | 504 (54.1%) | 427 (45.9%) |
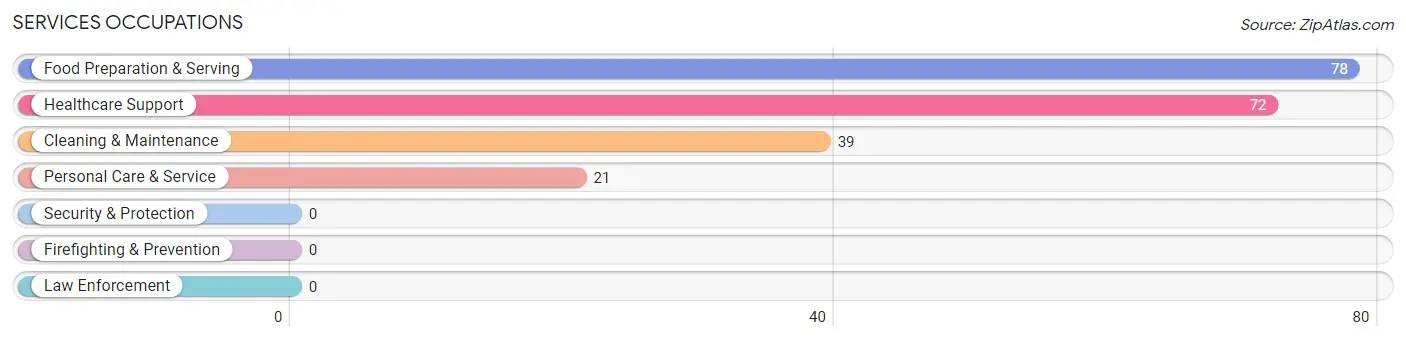
Services Occupations
The most common Services occupations in Fort Plain are Food Preparation & Serving (78 | 8.4%), Healthcare Support (72 | 7.7%), Cleaning & Maintenance (39 | 4.2%), and Personal Care & Service (21 | 2.3%).
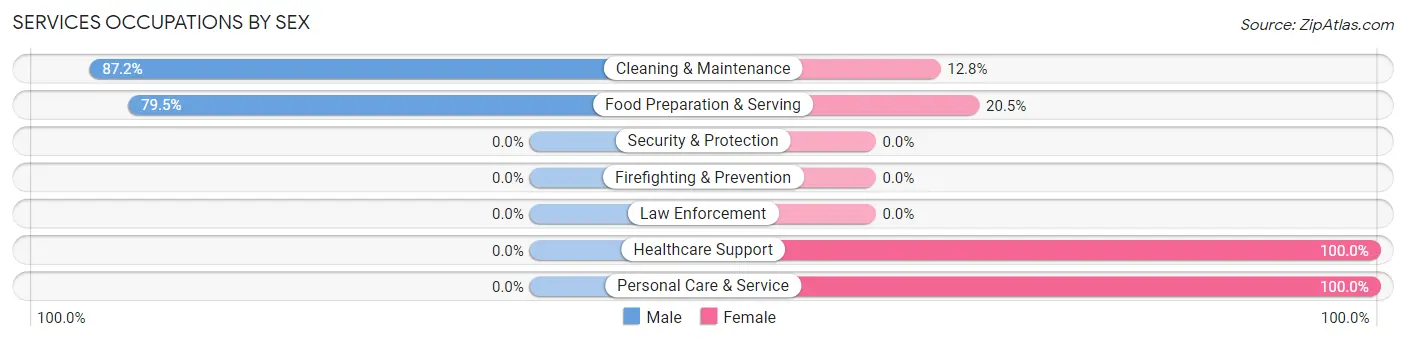
Services Occupations by Sex
Within the Services occupations in Fort Plain, the most male-oriented occupations are Cleaning & Maintenance (87.2%), and Food Preparation & Serving (79.5%), while the most female-oriented occupations are Healthcare Support (100.0%), Personal Care & Service (100.0%), and Food Preparation & Serving (20.5%).
| Occupation | Male | Female |
| Healthcare Support | 0 (0.0%) | 72 (100.0%) |
| Security & Protection | 0 (0.0%) | 0 (0.0%) |
| Firefighting & Prevention | 0 (0.0%) | 0 (0.0%) |
| Law Enforcement | 0 (0.0%) | 0 (0.0%) |
| Food Preparation & Serving | 62 (79.5%) | 16 (20.5%) |
| Cleaning & Maintenance | 34 (87.2%) | 5 (12.8%) |
| Personal Care & Service | 0 (0.0%) | 21 (100.0%) |
| Total (Category) | 96 (45.7%) | 114 (54.3%) |
| Total (Overall) | 504 (54.1%) | 427 (45.9%) |
Sales and Office Occupations
The most common Sales and Office occupations in Fort Plain are Office & Administration (78 | 8.4%), and Sales & Related (22 | 2.4%).
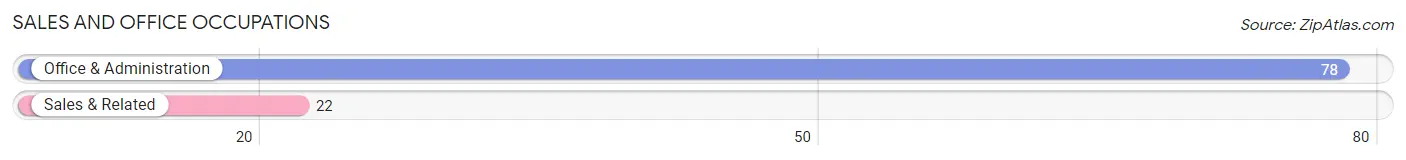
Sales and Office Occupations by Sex
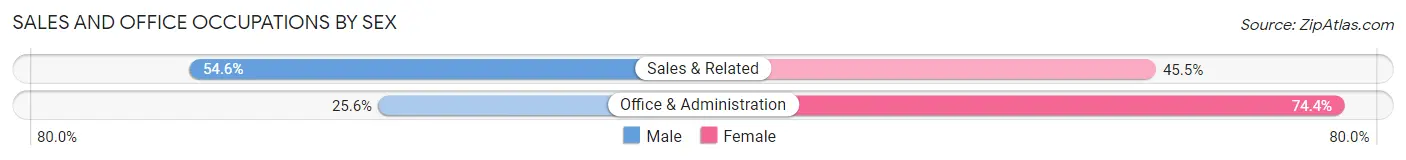
| Occupation | Male | Female |
| Sales & Related | 12 (54.5%) | 10 (45.5%) |
| Office & Administration | 20 (25.6%) | 58 (74.4%) |
| Total (Category) | 32 (32.0%) | 68 (68.0%) |
| Total (Overall) | 504 (54.1%) | 427 (45.9%) |
Natural Resources, Construction and Maintenance Occupations
The most common Natural Resources, Construction and Maintenance occupations in Fort Plain are Installation, Maintenance & Repair (61 | 6.6%), and Construction & Extraction (49 | 5.3%).
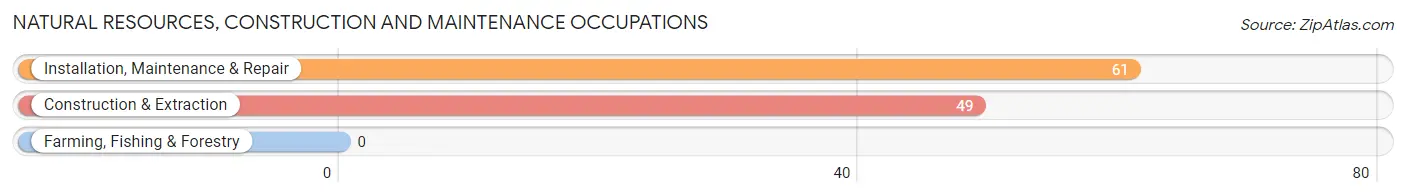
Natural Resources, Construction and Maintenance Occupations by Sex
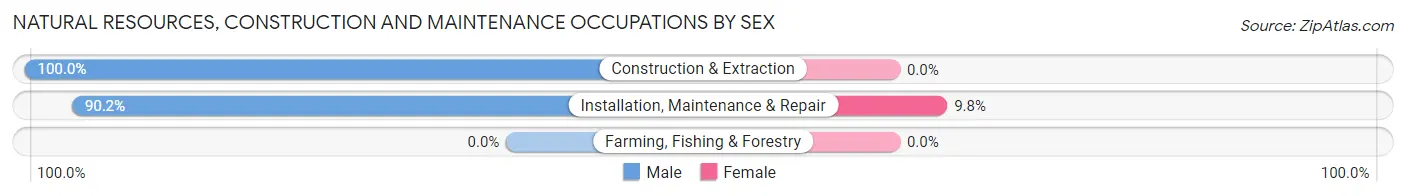
| Occupation | Male | Female |
| Farming, Fishing & Forestry | 0 (0.0%) | 0 (0.0%) |
| Construction & Extraction | 49 (100.0%) | 0 (0.0%) |
| Installation, Maintenance & Repair | 55 (90.2%) | 6 (9.8%) |
| Total (Category) | 104 (94.6%) | 6 (5.4%) |
| Total (Overall) | 504 (54.1%) | 427 (45.9%) |
Production, Transportation and Moving Occupations
The most common Production, Transportation and Moving occupations in Fort Plain are Material Moving (122 | 13.1%), Production (91 | 9.8%), and Transportation (20 | 2.1%).
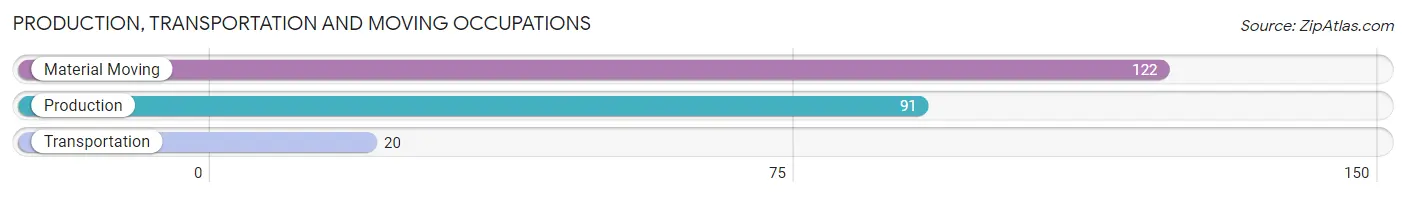
Production, Transportation and Moving Occupations by Sex
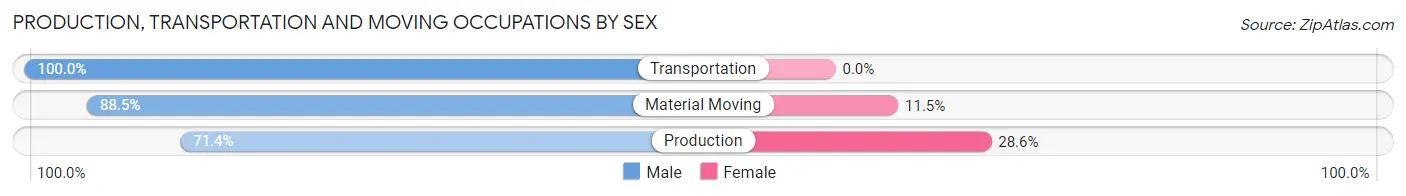
| Occupation | Male | Female |
| Production | 65 (71.4%) | 26 (28.6%) |
| Transportation | 20 (100.0%) | 0 (0.0%) |
| Material Moving | 108 (88.5%) | 14 (11.5%) |
| Total (Category) | 193 (82.8%) | 40 (17.2%) |
| Total (Overall) | 504 (54.1%) | 427 (45.9%) |
Employment Industries by Sex in Fort Plain
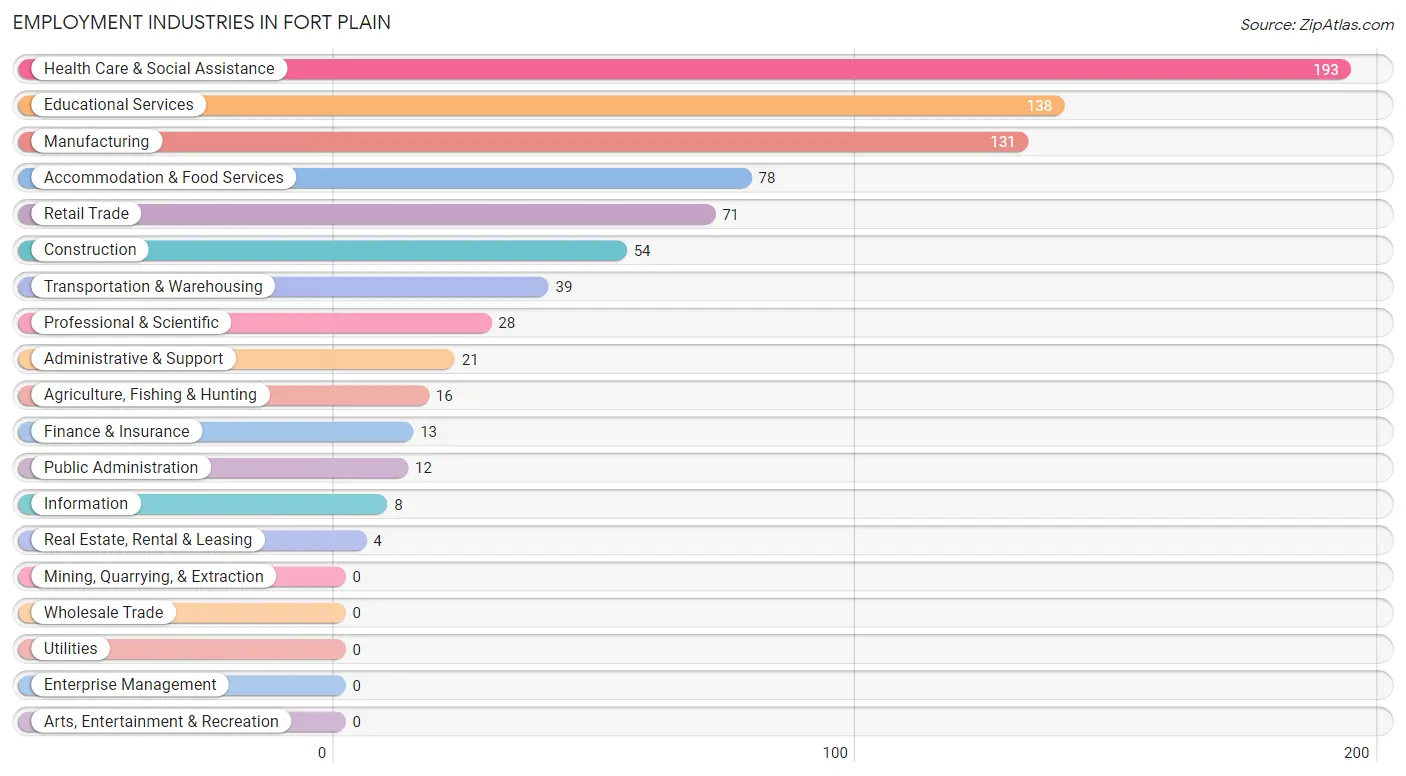
Employment Industries in Fort Plain
The major employment industries in Fort Plain include Health Care & Social Assistance (193 | 20.7%), Educational Services (138 | 14.8%), Manufacturing (131 | 14.1%), Accommodation & Food Services (78 | 8.4%), and Retail Trade (71 | 7.6%).
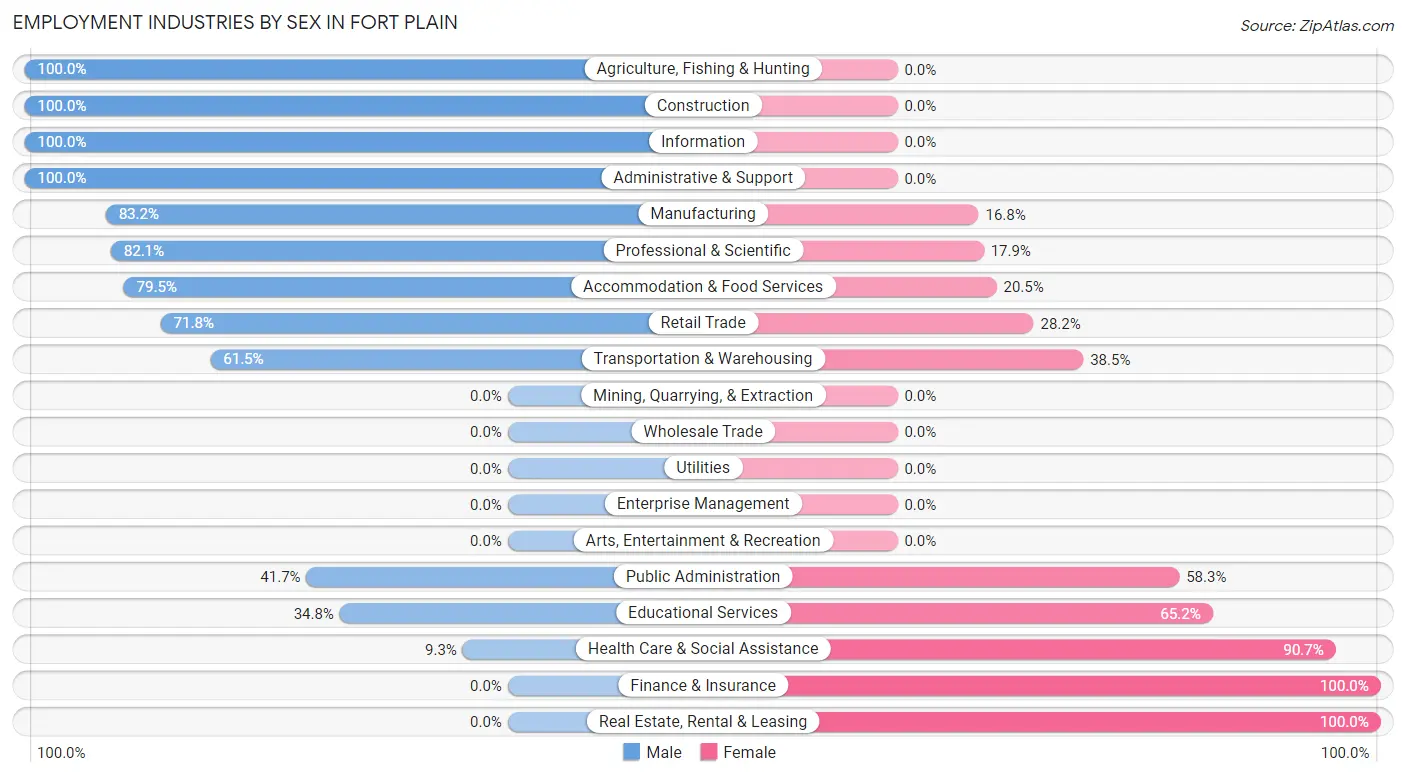
Employment Industries by Sex in Fort Plain
The Fort Plain industries that see more men than women are Agriculture, Fishing & Hunting (100.0%), Construction (100.0%), and Information (100.0%), whereas the industries that tend to have a higher number of women are Finance & Insurance (100.0%), Real Estate, Rental & Leasing (100.0%), and Health Care & Social Assistance (90.7%).
| Industry | Male | Female |
| Agriculture, Fishing & Hunting | 16 (100.0%) | 0 (0.0%) |
| Mining, Quarrying, & Extraction | 0 (0.0%) | 0 (0.0%) |
| Construction | 54 (100.0%) | 0 (0.0%) |
| Manufacturing | 109 (83.2%) | 22 (16.8%) |
| Wholesale Trade | 0 (0.0%) | 0 (0.0%) |
| Retail Trade | 51 (71.8%) | 20 (28.2%) |
| Transportation & Warehousing | 24 (61.5%) | 15 (38.5%) |
| Utilities | 0 (0.0%) | 0 (0.0%) |
| Information | 8 (100.0%) | 0 (0.0%) |
| Finance & Insurance | 0 (0.0%) | 13 (100.0%) |
| Real Estate, Rental & Leasing | 0 (0.0%) | 4 (100.0%) |
| Professional & Scientific | 23 (82.1%) | 5 (17.9%) |
| Enterprise Management | 0 (0.0%) | 0 (0.0%) |
| Administrative & Support | 21 (100.0%) | 0 (0.0%) |
| Educational Services | 48 (34.8%) | 90 (65.2%) |
| Health Care & Social Assistance | 18 (9.3%) | 175 (90.7%) |
| Arts, Entertainment & Recreation | 0 (0.0%) | 0 (0.0%) |
| Accommodation & Food Services | 62 (79.5%) | 16 (20.5%) |
| Public Administration | 5 (41.7%) | 7 (58.3%) |
| Total | 504 (54.1%) | 427 (45.9%) |
Education in Fort Plain
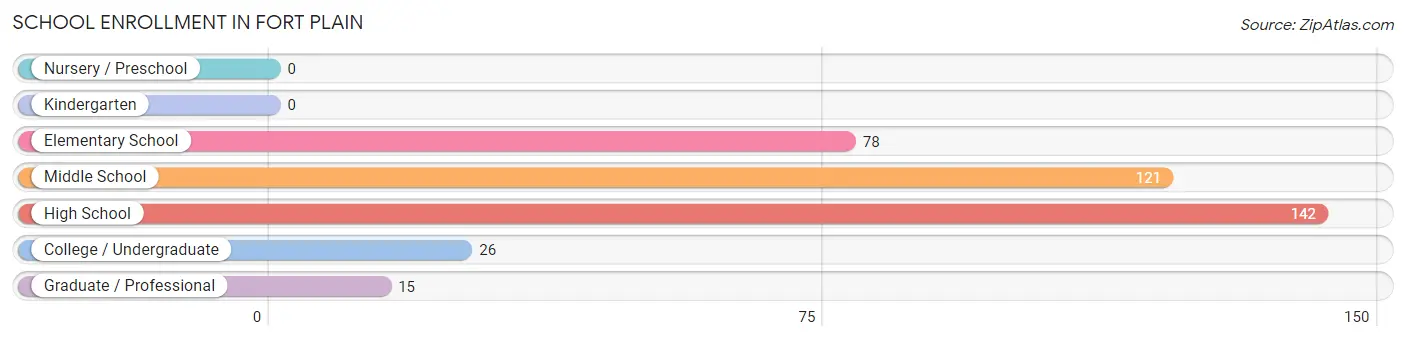
School Enrollment in Fort Plain
The most common levels of schooling among the 382 students in Fort Plain are high school (142 | 37.2%), middle school (121 | 31.7%), and elementary school (78 | 20.4%).
| School Level | # Students | % Students |
| Nursery / Preschool | 0 | 0.0% |
| Kindergarten | 0 | 0.0% |
| Elementary School | 78 | 20.4% |
| Middle School | 121 | 31.7% |
| High School | 142 | 37.2% |
| College / Undergraduate | 26 | 6.8% |
| Graduate / Professional | 15 | 3.9% |
| Total | 382 | 100.0% |
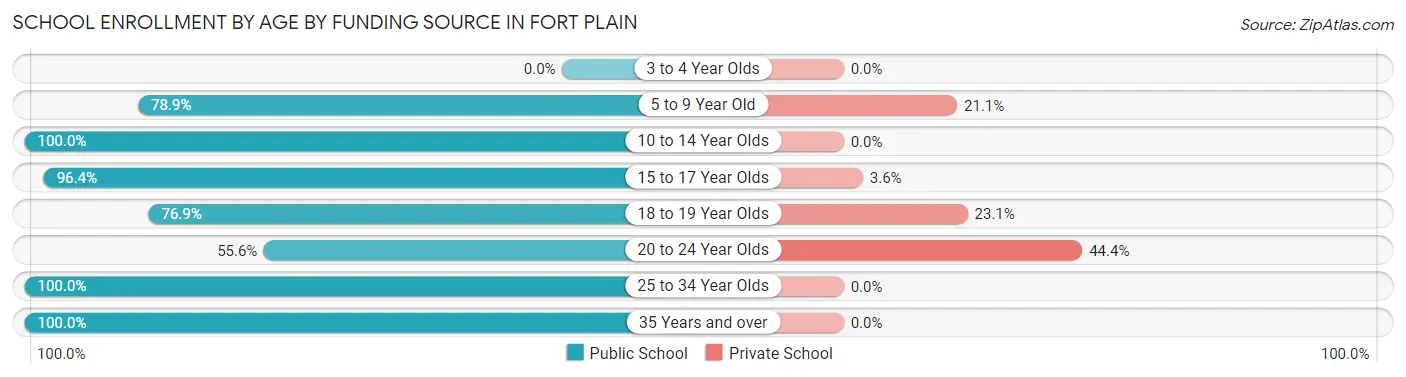
School Enrollment by Age by Funding Source in Fort Plain
Out of a total of 382 students who are enrolled in schools in Fort Plain, 35 (9.2%) attend a private institution, while the remaining 347 (90.8%) are enrolled in public schools. The age group of 20 to 24 year olds has the highest likelihood of being enrolled in private schools, with 8 (44.4% in the age bracket) enrolled. Conversely, the age group of 10 to 14 year olds has the lowest likelihood of being enrolled in a private school, with 145 (100.0% in the age bracket) attending a public institution.
| Age Bracket | Public School | Private School |
| 3 to 4 Year Olds | 0 (0.0%) | 0 (0.0%) |
| 5 to 9 Year Old | 56 (78.9%) | 15 (21.1%) |
| 10 to 14 Year Olds | 145 (100.0%) | 0 (0.0%) |
| 15 to 17 Year Olds | 81 (96.4%) | 3 (3.6%) |
| 18 to 19 Year Olds | 30 (76.9%) | 9 (23.1%) |
| 20 to 24 Year Olds | 10 (55.6%) | 8 (44.4%) |
| 25 to 34 Year Olds | 12 (100.0%) | 0 (0.0%) |
| 35 Years and over | 13 (100.0%) | 0 (0.0%) |
| Total | 347 (90.8%) | 35 (9.2%) |
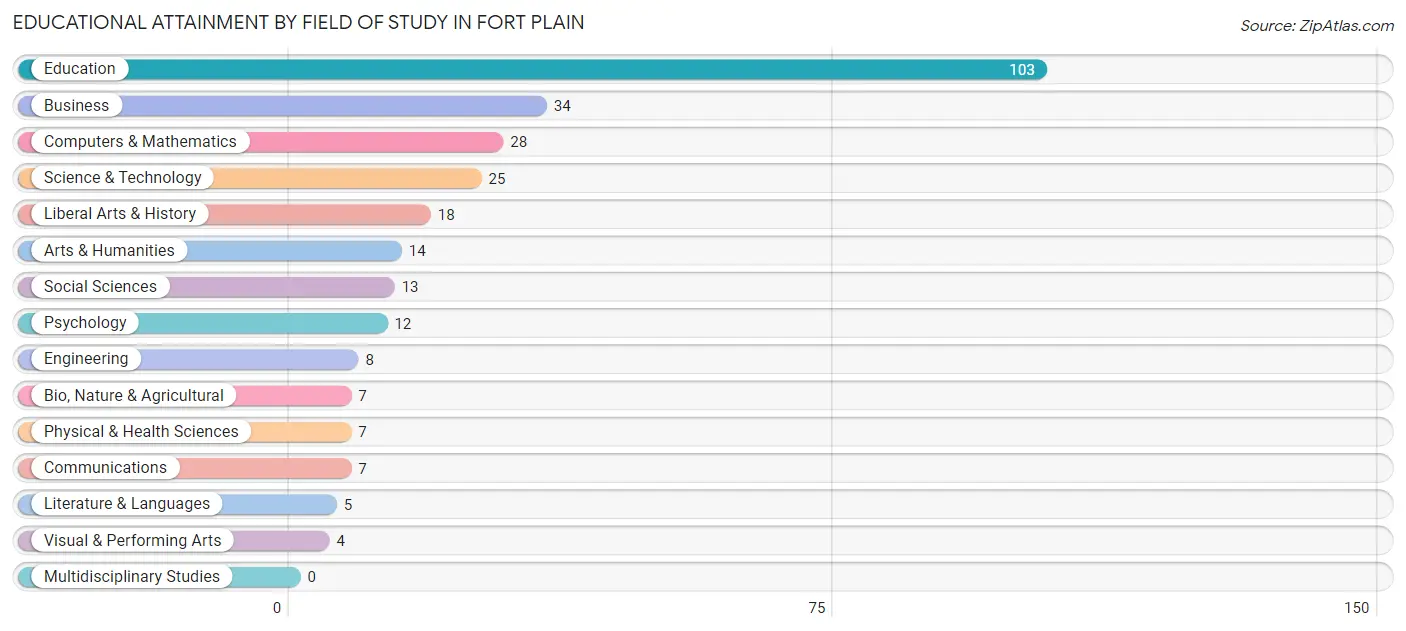
Educational Attainment by Field of Study in Fort Plain
Education (103 | 36.1%), business (34 | 11.9%), computers & mathematics (28 | 9.8%), science & technology (25 | 8.8%), and liberal arts & history (18 | 6.3%) are the most common fields of study among 285 individuals in Fort Plain who have obtained a bachelor's degree or higher.
| Field of Study | # Graduates | % Graduates |
| Computers & Mathematics | 28 | 9.8% |
| Bio, Nature & Agricultural | 7 | 2.5% |
| Physical & Health Sciences | 7 | 2.5% |
| Psychology | 12 | 4.2% |
| Social Sciences | 13 | 4.6% |
| Engineering | 8 | 2.8% |
| Multidisciplinary Studies | 0 | 0.0% |
| Science & Technology | 25 | 8.8% |
| Business | 34 | 11.9% |
| Education | 103 | 36.1% |
| Literature & Languages | 5 | 1.8% |
| Liberal Arts & History | 18 | 6.3% |
| Visual & Performing Arts | 4 | 1.4% |
| Communications | 7 | 2.5% |
| Arts & Humanities | 14 | 4.9% |
| Total | 285 | 100.0% |
Transportation & Commute in Fort Plain
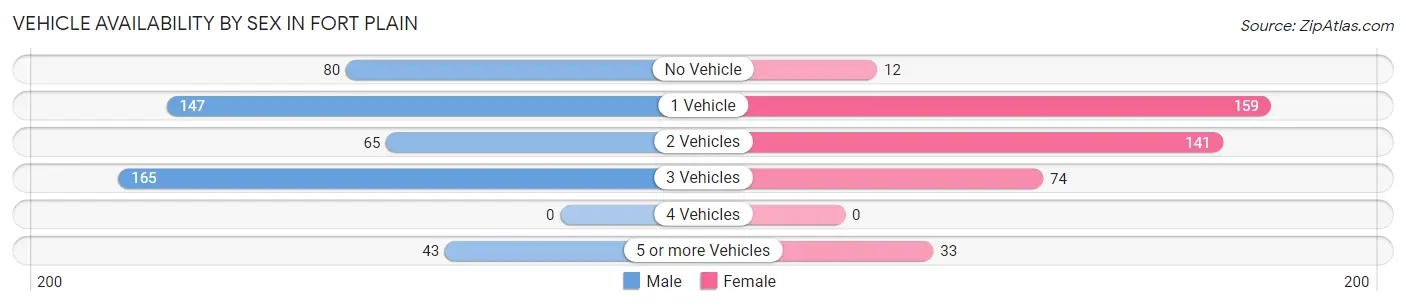
Vehicle Availability by Sex in Fort Plain
The most prevalent vehicle ownership categories in Fort Plain are males with 3 vehicles (165, accounting for 33.0%) and females with 3 vehicles (74, making up 39.4%).
| Vehicles Available | Male | Female |
| No Vehicle | 80 (16.0%) | 12 (2.9%) |
| 1 Vehicle | 147 (29.4%) | 159 (38.0%) |
| 2 Vehicles | 65 (13.0%) | 141 (33.7%) |
| 3 Vehicles | 165 (33.0%) | 74 (17.7%) |
| 4 Vehicles | 0 (0.0%) | 0 (0.0%) |
| 5 or more Vehicles | 43 (8.6%) | 33 (7.9%) |
| Total | 500 (100.0%) | 419 (100.0%) |
Commute Time in Fort Plain
The most frequently occuring commute durations in Fort Plain are 5 to 9 minutes (173 commuters, 19.4%), 10 to 14 minutes (168 commuters, 18.8%), and 30 to 34 minutes (156 commuters, 17.5%).
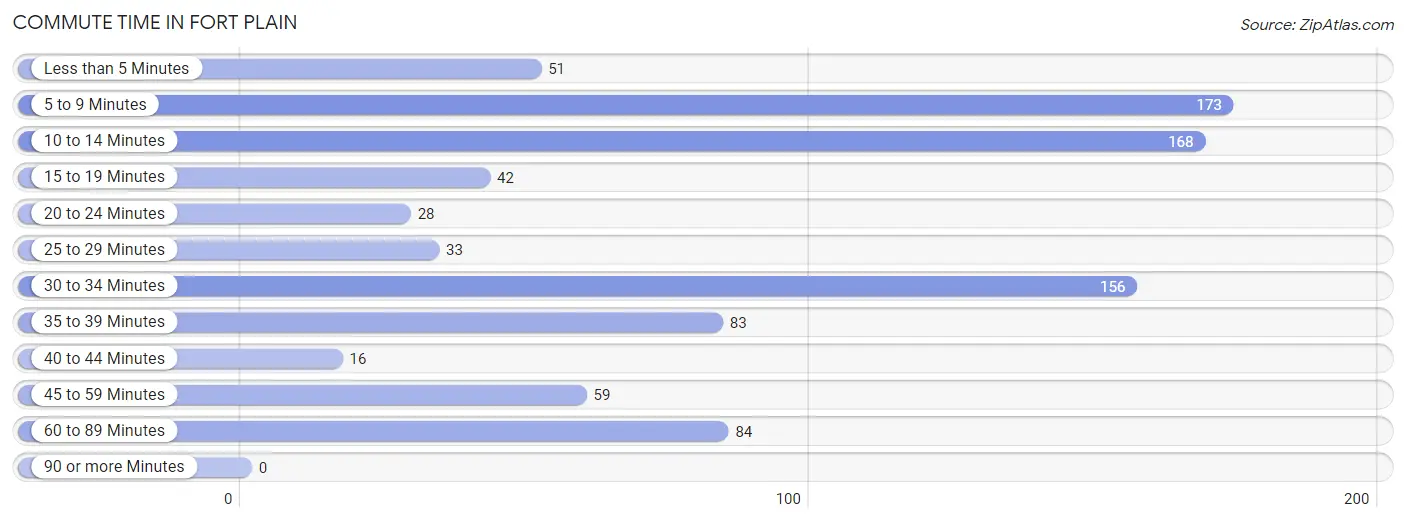
| Commute Time | # Commuters | % Commuters |
| Less than 5 Minutes | 51 | 5.7% |
| 5 to 9 Minutes | 173 | 19.4% |
| 10 to 14 Minutes | 168 | 18.8% |
| 15 to 19 Minutes | 42 | 4.7% |
| 20 to 24 Minutes | 28 | 3.1% |
| 25 to 29 Minutes | 33 | 3.7% |
| 30 to 34 Minutes | 156 | 17.5% |
| 35 to 39 Minutes | 83 | 9.3% |
| 40 to 44 Minutes | 16 | 1.8% |
| 45 to 59 Minutes | 59 | 6.6% |
| 60 to 89 Minutes | 84 | 9.4% |
| 90 or more Minutes | 0 | 0.0% |
Commute Time by Sex in Fort Plain
The most common commute times in Fort Plain are 10 to 14 minutes (130 commuters, 26.4%) for males and 30 to 34 minutes (108 commuters, 26.9%) for females.
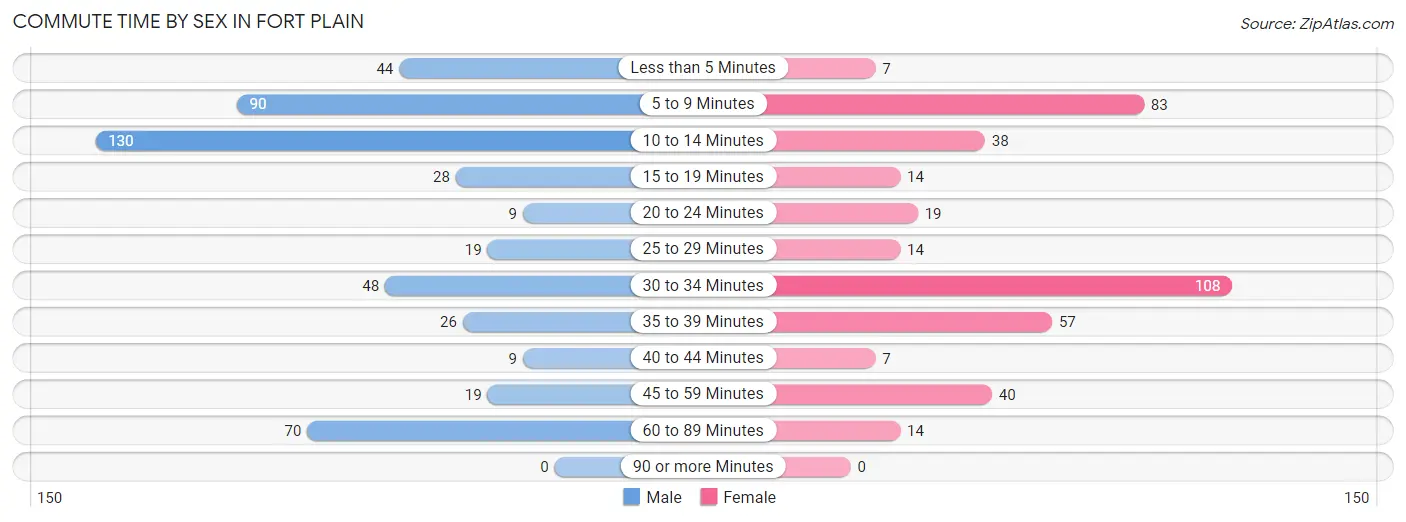
| Commute Time | Male | Female |
| Less than 5 Minutes | 44 (8.9%) | 7 (1.8%) |
| 5 to 9 Minutes | 90 (18.3%) | 83 (20.7%) |
| 10 to 14 Minutes | 130 (26.4%) | 38 (9.5%) |
| 15 to 19 Minutes | 28 (5.7%) | 14 (3.5%) |
| 20 to 24 Minutes | 9 (1.8%) | 19 (4.7%) |
| 25 to 29 Minutes | 19 (3.9%) | 14 (3.5%) |
| 30 to 34 Minutes | 48 (9.8%) | 108 (26.9%) |
| 35 to 39 Minutes | 26 (5.3%) | 57 (14.2%) |
| 40 to 44 Minutes | 9 (1.8%) | 7 (1.8%) |
| 45 to 59 Minutes | 19 (3.9%) | 40 (10.0%) |
| 60 to 89 Minutes | 70 (14.2%) | 14 (3.5%) |
| 90 or more Minutes | 0 (0.0%) | 0 (0.0%) |
Time of Departure to Work by Sex in Fort Plain
The most frequent times of departure to work in Fort Plain are 4:00 PM to 11:59 PM (119, 24.2%) for males and 7:30 AM to 7:59 AM (83, 20.7%) for females.
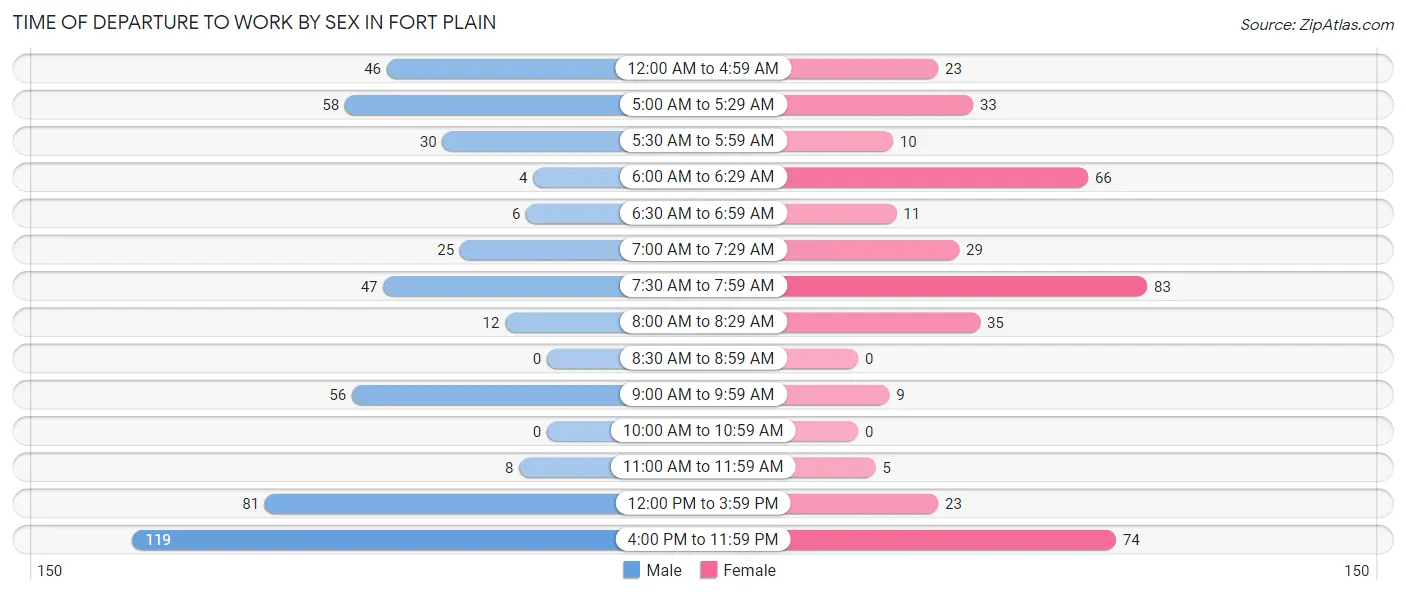
| Time of Departure | Male | Female |
| 12:00 AM to 4:59 AM | 46 (9.3%) | 23 (5.7%) |
| 5:00 AM to 5:29 AM | 58 (11.8%) | 33 (8.2%) |
| 5:30 AM to 5:59 AM | 30 (6.1%) | 10 (2.5%) |
| 6:00 AM to 6:29 AM | 4 (0.8%) | 66 (16.5%) |
| 6:30 AM to 6:59 AM | 6 (1.2%) | 11 (2.7%) |
| 7:00 AM to 7:29 AM | 25 (5.1%) | 29 (7.2%) |
| 7:30 AM to 7:59 AM | 47 (9.6%) | 83 (20.7%) |
| 8:00 AM to 8:29 AM | 12 (2.4%) | 35 (8.7%) |
| 8:30 AM to 8:59 AM | 0 (0.0%) | 0 (0.0%) |
| 9:00 AM to 9:59 AM | 56 (11.4%) | 9 (2.2%) |
| 10:00 AM to 10:59 AM | 0 (0.0%) | 0 (0.0%) |
| 11:00 AM to 11:59 AM | 8 (1.6%) | 5 (1.3%) |
| 12:00 PM to 3:59 PM | 81 (16.5%) | 23 (5.7%) |
| 4:00 PM to 11:59 PM | 119 (24.2%) | 74 (18.4%) |
| Total | 492 (100.0%) | 401 (100.0%) |
Housing Occupancy in Fort Plain
Occupancy by Ownership in Fort Plain
Of the total 768 dwellings in Fort Plain, owner-occupied units account for 516 (67.2%), while renter-occupied units make up 252 (32.8%).
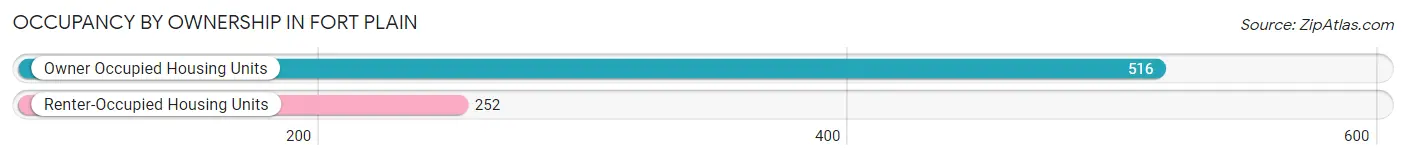
| Occupancy | # Housing Units | % Housing Units |
| Owner Occupied Housing Units | 516 | 67.2% |
| Renter-Occupied Housing Units | 252 | 32.8% |
| Total Occupied Housing Units | 768 | 100.0% |
Occupancy by Household Size in Fort Plain
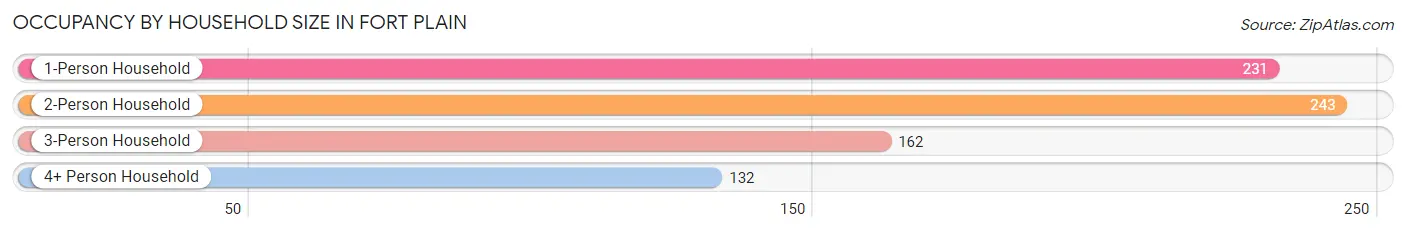
| Household Size | # Housing Units | % Housing Units |
| 1-Person Household | 231 | 30.1% |
| 2-Person Household | 243 | 31.6% |
| 3-Person Household | 162 | 21.1% |
| 4+ Person Household | 132 | 17.2% |
| Total Housing Units | 768 | 100.0% |
Occupancy by Ownership by Household Size in Fort Plain
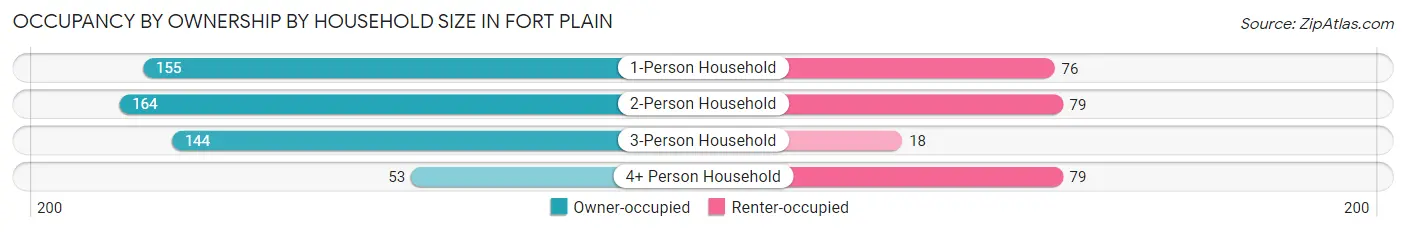
| Household Size | Owner-occupied | Renter-occupied |
| 1-Person Household | 155 (67.1%) | 76 (32.9%) |
| 2-Person Household | 164 (67.5%) | 79 (32.5%) |
| 3-Person Household | 144 (88.9%) | 18 (11.1%) |
| 4+ Person Household | 53 (40.2%) | 79 (59.9%) |
| Total Housing Units | 516 (67.2%) | 252 (32.8%) |
Occupancy by Educational Attainment in Fort Plain
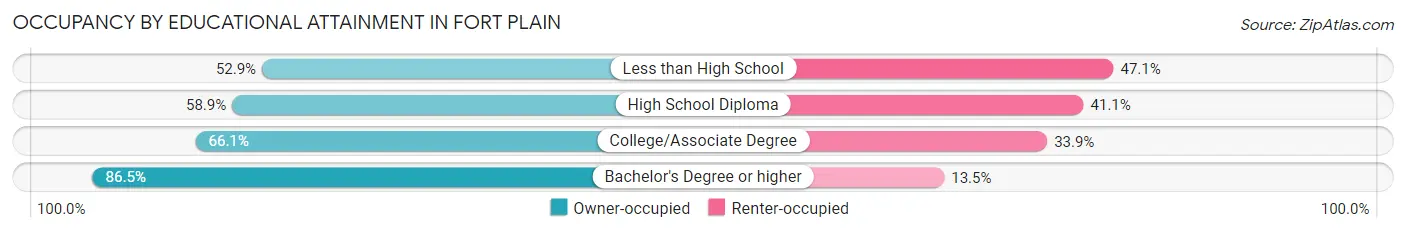
| Household Size | Owner-occupied | Renter-occupied |
| Less than High School | 18 (52.9%) | 16 (47.1%) |
| High School Diploma | 166 (58.9%) | 116 (41.1%) |
| College/Associate Degree | 191 (66.1%) | 98 (33.9%) |
| Bachelor's Degree or higher | 141 (86.5%) | 22 (13.5%) |
Occupancy by Age of Householder in Fort Plain
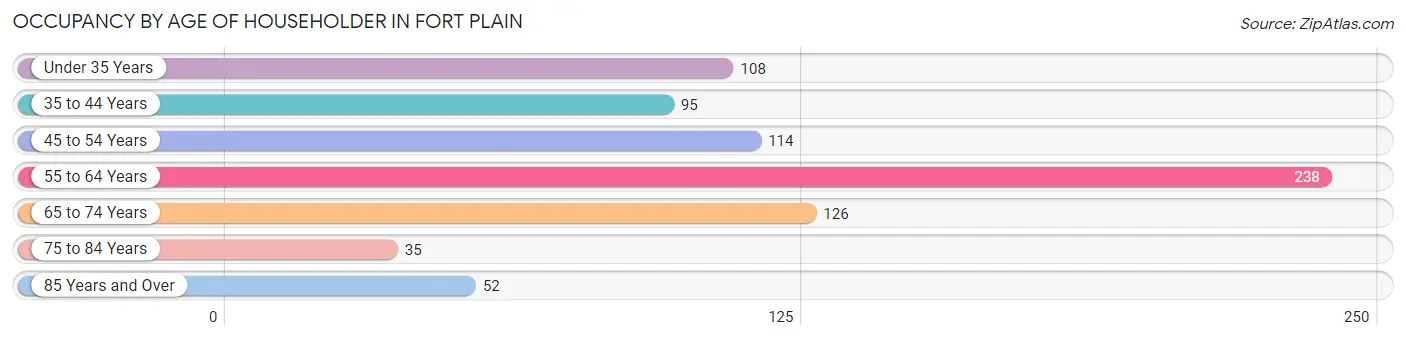
| Age Bracket | # Households | % Households |
| Under 35 Years | 108 | 14.1% |
| 35 to 44 Years | 95 | 12.4% |
| 45 to 54 Years | 114 | 14.8% |
| 55 to 64 Years | 238 | 31.0% |
| 65 to 74 Years | 126 | 16.4% |
| 75 to 84 Years | 35 | 4.6% |
| 85 Years and Over | 52 | 6.8% |
| Total | 768 | 100.0% |
Housing Finances in Fort Plain
Median Income by Occupancy in Fort Plain
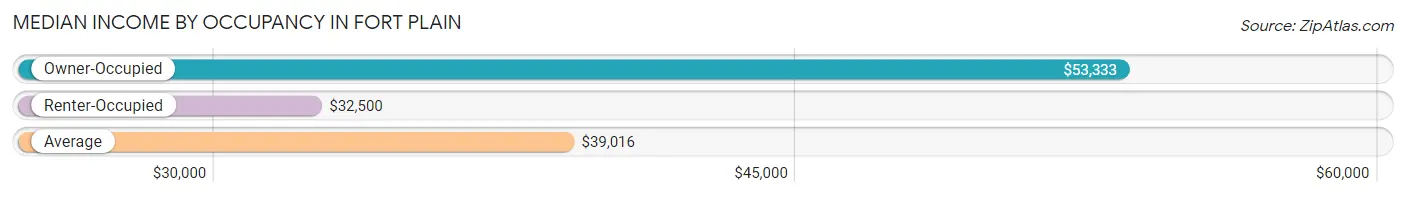
| Occupancy Type | # Households | Median Income |
| Owner-Occupied | 516 (67.2%) | $53,333 |
| Renter-Occupied | 252 (32.8%) | $32,500 |
| Average | 768 (100.0%) | $39,016 |
Occupancy by Householder Income Bracket in Fort Plain
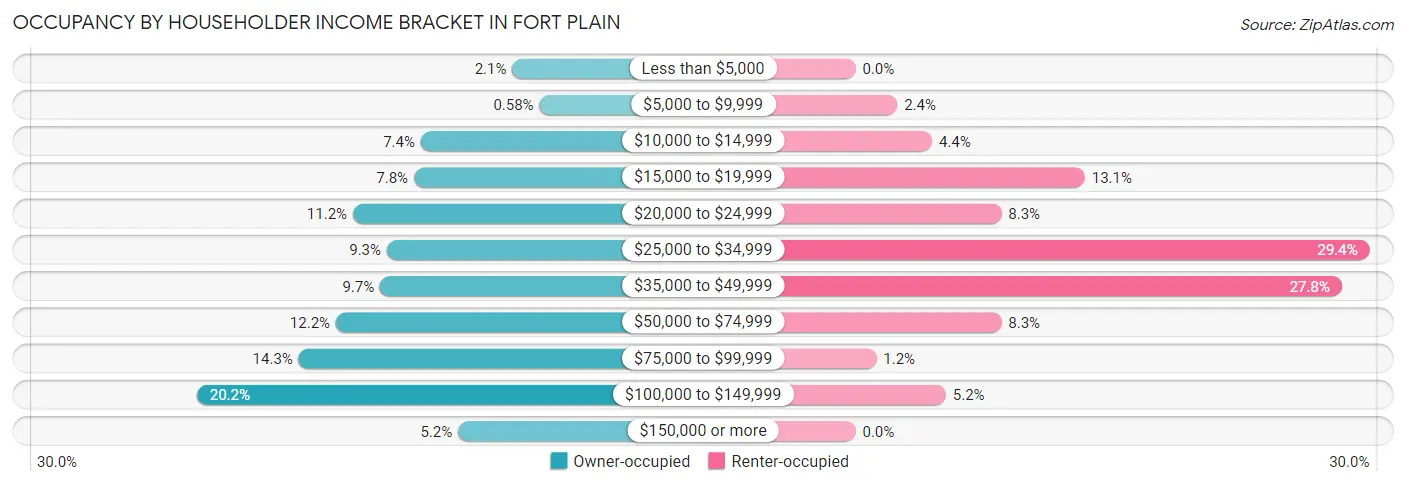
| Income Bracket | Owner-occupied | Renter-occupied |
| Less than $5,000 | 11 (2.1%) | 0 (0.0%) |
| $5,000 to $9,999 | 3 (0.6%) | 6 (2.4%) |
| $10,000 to $14,999 | 38 (7.4%) | 11 (4.4%) |
| $15,000 to $19,999 | 40 (7.7%) | 33 (13.1%) |
| $20,000 to $24,999 | 58 (11.2%) | 21 (8.3%) |
| $25,000 to $34,999 | 48 (9.3%) | 74 (29.4%) |
| $35,000 to $49,999 | 50 (9.7%) | 70 (27.8%) |
| $50,000 to $74,999 | 63 (12.2%) | 21 (8.3%) |
| $75,000 to $99,999 | 74 (14.3%) | 3 (1.2%) |
| $100,000 to $149,999 | 104 (20.2%) | 13 (5.2%) |
| $150,000 or more | 27 (5.2%) | 0 (0.0%) |
| Total | 516 (100.0%) | 252 (100.0%) |
Monthly Housing Cost Tiers in Fort Plain
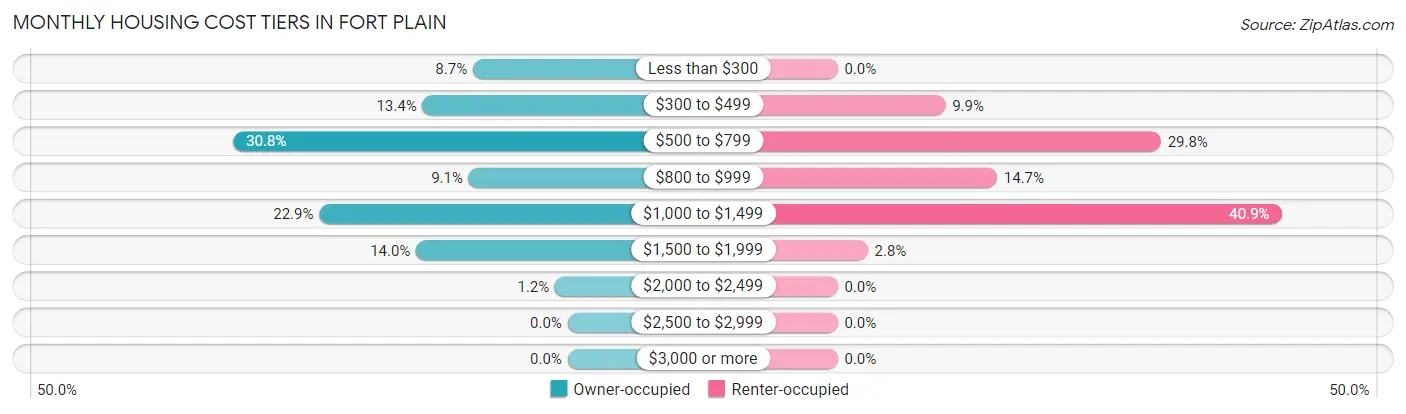
| Monthly Cost | Owner-occupied | Renter-occupied |
| Less than $300 | 45 (8.7%) | 0 (0.0%) |
| $300 to $499 | 69 (13.4%) | 25 (9.9%) |
| $500 to $799 | 159 (30.8%) | 75 (29.8%) |
| $800 to $999 | 47 (9.1%) | 37 (14.7%) |
| $1,000 to $1,499 | 118 (22.9%) | 103 (40.9%) |
| $1,500 to $1,999 | 72 (14.0%) | 7 (2.8%) |
| $2,000 to $2,499 | 6 (1.2%) | 0 (0.0%) |
| $2,500 to $2,999 | 0 (0.0%) | 0 (0.0%) |
| $3,000 or more | 0 (0.0%) | 0 (0.0%) |
| Total | 516 (100.0%) | 252 (100.0%) |
Physical Housing Characteristics in Fort Plain
Housing Structures in Fort Plain
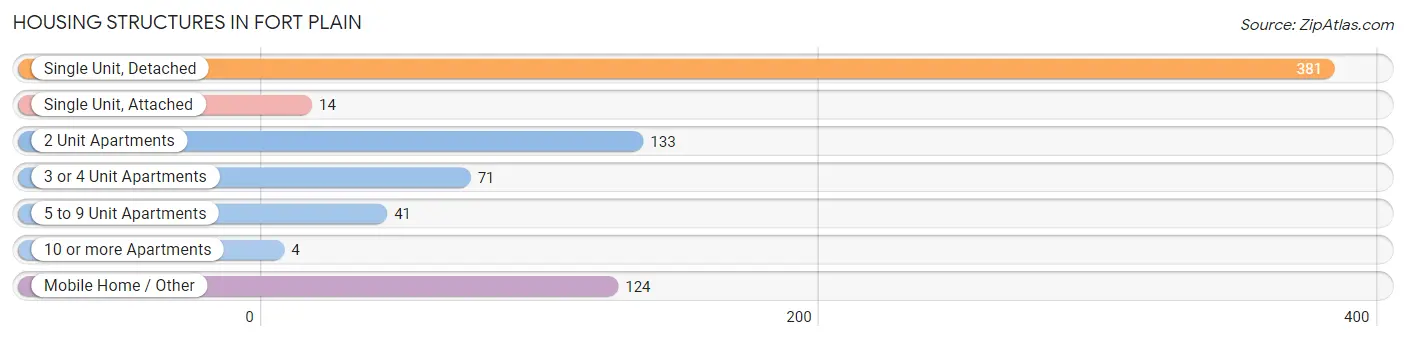
| Structure Type | # Housing Units | % Housing Units |
| Single Unit, Detached | 381 | 49.6% |
| Single Unit, Attached | 14 | 1.8% |
| 2 Unit Apartments | 133 | 17.3% |
| 3 or 4 Unit Apartments | 71 | 9.2% |
| 5 to 9 Unit Apartments | 41 | 5.3% |
| 10 or more Apartments | 4 | 0.5% |
| Mobile Home / Other | 124 | 16.2% |
| Total | 768 | 100.0% |
Housing Structures by Occupancy in Fort Plain
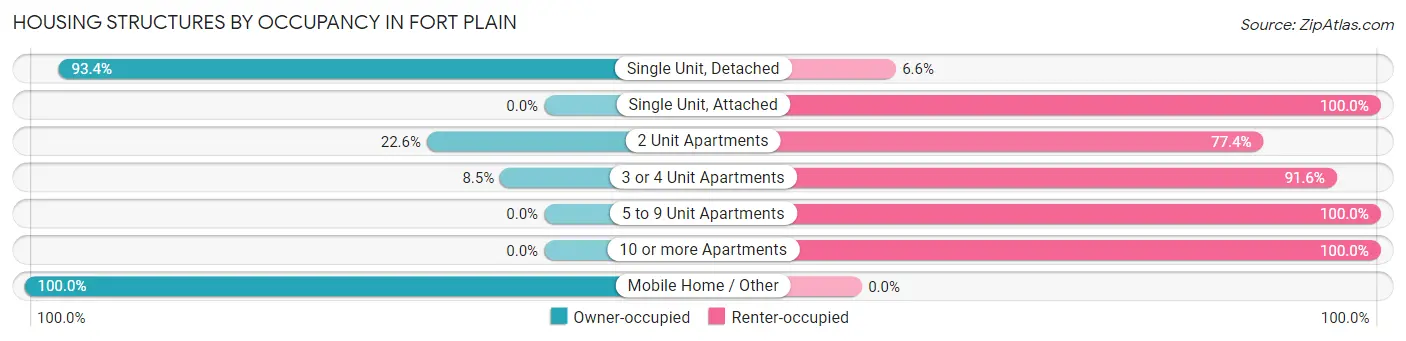
| Structure Type | Owner-occupied | Renter-occupied |
| Single Unit, Detached | 356 (93.4%) | 25 (6.6%) |
| Single Unit, Attached | 0 (0.0%) | 14 (100.0%) |
| 2 Unit Apartments | 30 (22.6%) | 103 (77.4%) |
| 3 or 4 Unit Apartments | 6 (8.5%) | 65 (91.5%) |
| 5 to 9 Unit Apartments | 0 (0.0%) | 41 (100.0%) |
| 10 or more Apartments | 0 (0.0%) | 4 (100.0%) |
| Mobile Home / Other | 124 (100.0%) | 0 (0.0%) |
| Total | 516 (67.2%) | 252 (32.8%) |
Housing Structures by Number of Rooms in Fort Plain
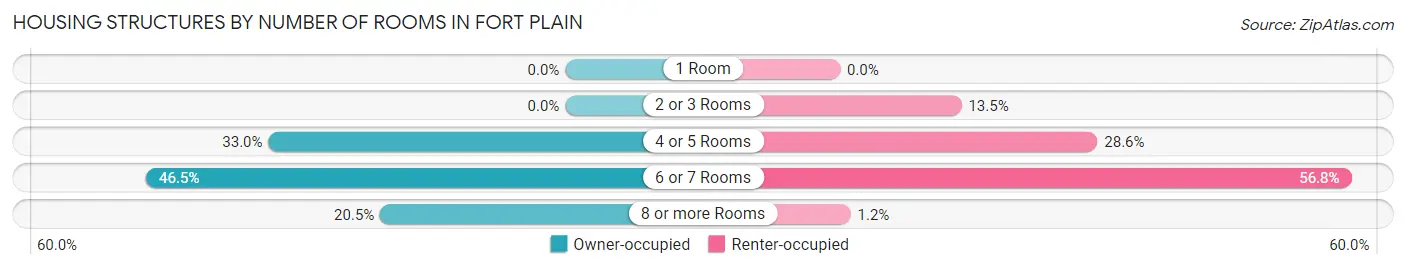
| Number of Rooms | Owner-occupied | Renter-occupied |
| 1 Room | 0 (0.0%) | 0 (0.0%) |
| 2 or 3 Rooms | 0 (0.0%) | 34 (13.5%) |
| 4 or 5 Rooms | 170 (33.0%) | 72 (28.6%) |
| 6 or 7 Rooms | 240 (46.5%) | 143 (56.8%) |
| 8 or more Rooms | 106 (20.5%) | 3 (1.2%) |
| Total | 516 (100.0%) | 252 (100.0%) |
Housing Structure by Heating Type in Fort Plain
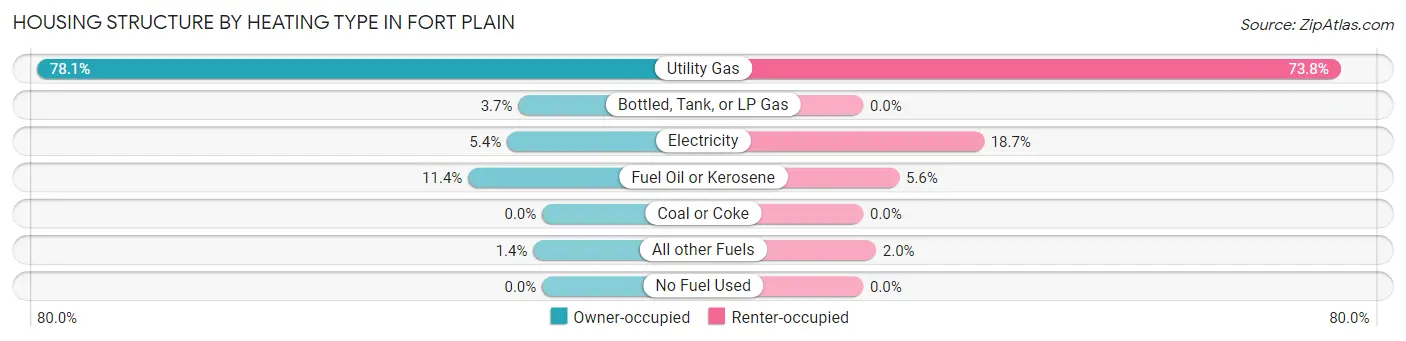
| Heating Type | Owner-occupied | Renter-occupied |
| Utility Gas | 403 (78.1%) | 186 (73.8%) |
| Bottled, Tank, or LP Gas | 19 (3.7%) | 0 (0.0%) |
| Electricity | 28 (5.4%) | 47 (18.6%) |
| Fuel Oil or Kerosene | 59 (11.4%) | 14 (5.6%) |
| Coal or Coke | 0 (0.0%) | 0 (0.0%) |
| All other Fuels | 7 (1.4%) | 5 (2.0%) |
| No Fuel Used | 0 (0.0%) | 0 (0.0%) |
| Total | 516 (100.0%) | 252 (100.0%) |
Household Vehicle Usage in Fort Plain
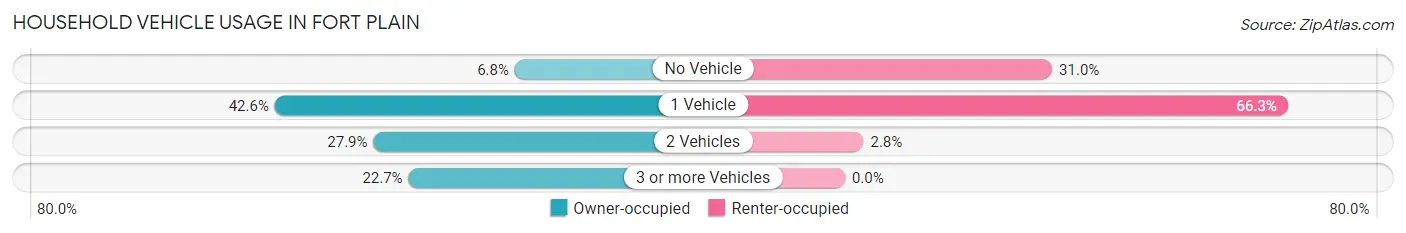
| Vehicles per Household | Owner-occupied | Renter-occupied |
| No Vehicle | 35 (6.8%) | 78 (30.9%) |
| 1 Vehicle | 220 (42.6%) | 167 (66.3%) |
| 2 Vehicles | 144 (27.9%) | 7 (2.8%) |
| 3 or more Vehicles | 117 (22.7%) | 0 (0.0%) |
| Total | 516 (100.0%) | 252 (100.0%) |
Real Estate & Mortgages in Fort Plain
Real Estate and Mortgage Overview in Fort Plain
| Characteristic | Without Mortgage | With Mortgage |
| Housing Units | 309 | 207 |
| Median Property Value | $62,800 | $81,400 |
| Median Household Income | - | - |
| Monthly Housing Costs | $586 | $0 |
| Real Estate Taxes | $2,819 | $10 |
Property Value by Mortgage Status in Fort Plain
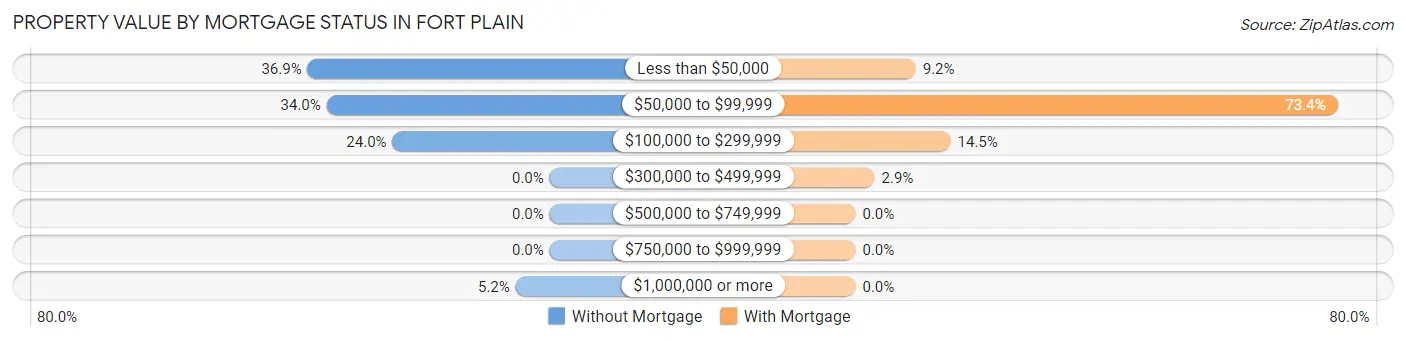
| Property Value | Without Mortgage | With Mortgage |
| Less than $50,000 | 114 (36.9%) | 19 (9.2%) |
| $50,000 to $99,999 | 105 (34.0%) | 152 (73.4%) |
| $100,000 to $299,999 | 74 (23.9%) | 30 (14.5%) |
| $300,000 to $499,999 | 0 (0.0%) | 6 (2.9%) |
| $500,000 to $749,999 | 0 (0.0%) | 0 (0.0%) |
| $750,000 to $999,999 | 0 (0.0%) | 0 (0.0%) |
| $1,000,000 or more | 16 (5.2%) | 0 (0.0%) |
| Total | 309 (100.0%) | 207 (100.0%) |
Household Income by Mortgage Status in Fort Plain
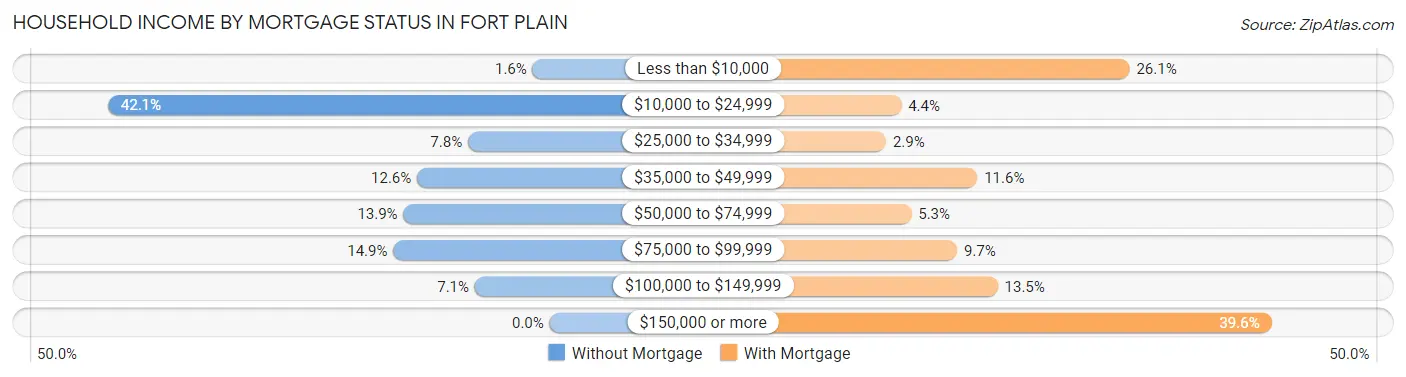
| Household Income | Without Mortgage | With Mortgage |
| Less than $10,000 | 5 (1.6%) | 54 (26.1%) |
| $10,000 to $24,999 | 130 (42.1%) | 9 (4.3%) |
| $25,000 to $34,999 | 24 (7.8%) | 6 (2.9%) |
| $35,000 to $49,999 | 39 (12.6%) | 24 (11.6%) |
| $50,000 to $74,999 | 43 (13.9%) | 11 (5.3%) |
| $75,000 to $99,999 | 46 (14.9%) | 20 (9.7%) |
| $100,000 to $149,999 | 22 (7.1%) | 28 (13.5%) |
| $150,000 or more | 0 (0.0%) | 82 (39.6%) |
| Total | 309 (100.0%) | 207 (100.0%) |
Property Value to Household Income Ratio in Fort Plain
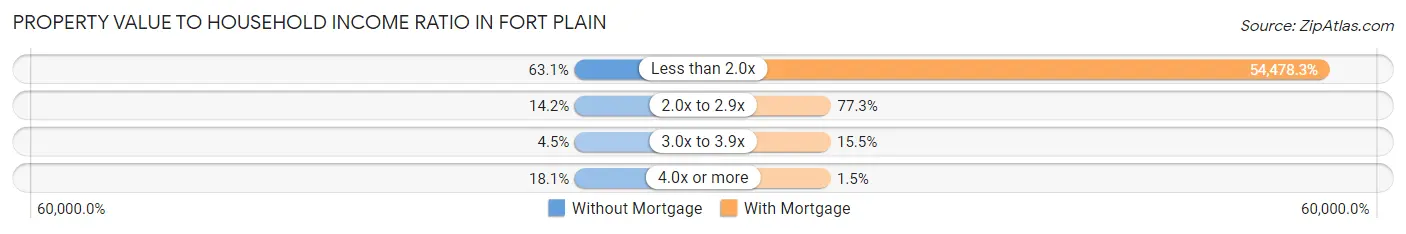
| Value-to-Income Ratio | Without Mortgage | With Mortgage |
| Less than 2.0x | 195 (63.1%) | 112,770 (54,478.3%) |
| 2.0x to 2.9x | 44 (14.2%) | 160 (77.3%) |
| 3.0x to 3.9x | 14 (4.5%) | 32 (15.5%) |
| 4.0x or more | 56 (18.1%) | 3 (1.5%) |
| Total | 309 (100.0%) | 207 (100.0%) |
Real Estate Taxes by Mortgage Status in Fort Plain
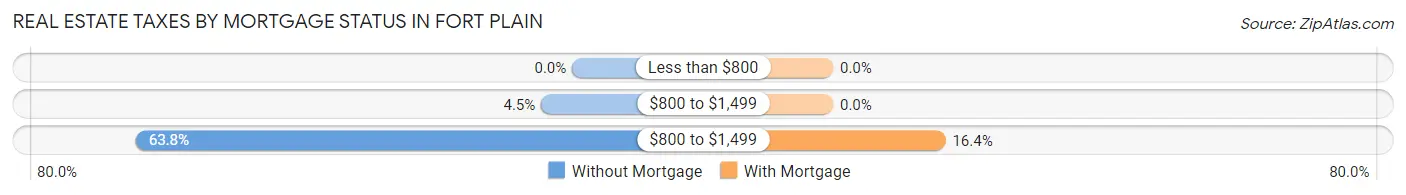
| Property Taxes | Without Mortgage | With Mortgage |
| Less than $800 | 0 (0.0%) | 0 (0.0%) |
| $800 to $1,499 | 14 (4.5%) | 0 (0.0%) |
| $800 to $1,499 | 197 (63.7%) | 34 (16.4%) |
| Total | 309 (100.0%) | 207 (100.0%) |
Health & Disability in Fort Plain
Health Insurance Coverage by Age in Fort Plain
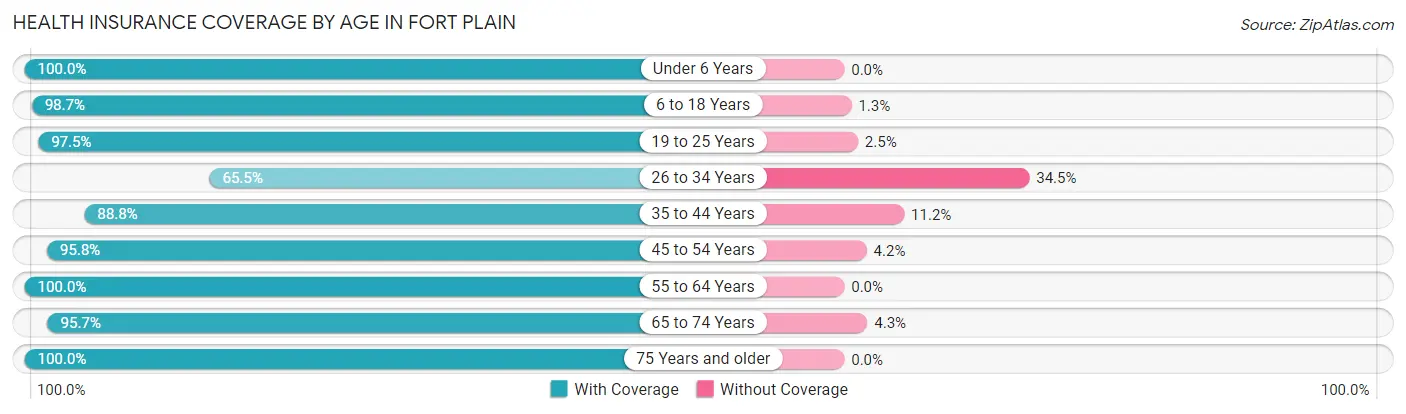
| Age Bracket | With Coverage | Without Coverage |
| Under 6 Years | 113 (100.0%) | 0 (0.0%) |
| 6 to 18 Years | 370 (98.7%) | 5 (1.3%) |
| 19 to 25 Years | 115 (97.5%) | 3 (2.5%) |
| 26 to 34 Years | 131 (65.5%) | 69 (34.5%) |
| 35 to 44 Years | 223 (88.8%) | 28 (11.2%) |
| 45 to 54 Years | 230 (95.8%) | 10 (4.2%) |
| 55 to 64 Years | 404 (100.0%) | 0 (0.0%) |
| 65 to 74 Years | 178 (95.7%) | 8 (4.3%) |
| 75 Years and older | 128 (100.0%) | 0 (0.0%) |
| Total | 1,892 (93.9%) | 123 (6.1%) |
Health Insurance Coverage by Citizenship Status in Fort Plain
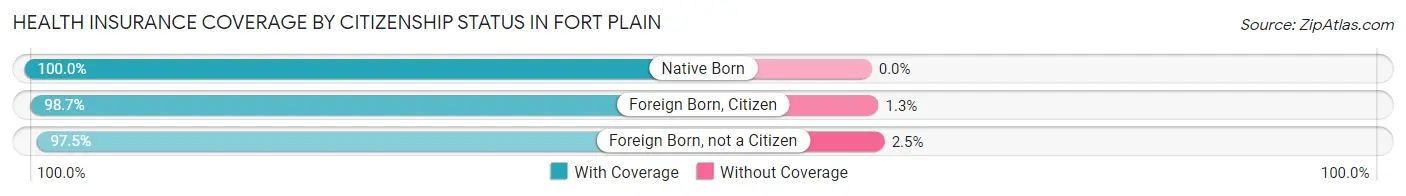
| Citizenship Status | With Coverage | Without Coverage |
| Native Born | 113 (100.0%) | 0 (0.0%) |
| Foreign Born, Citizen | 370 (98.7%) | 5 (1.3%) |
| Foreign Born, not a Citizen | 115 (97.5%) | 3 (2.5%) |
Health Insurance Coverage by Household Income in Fort Plain
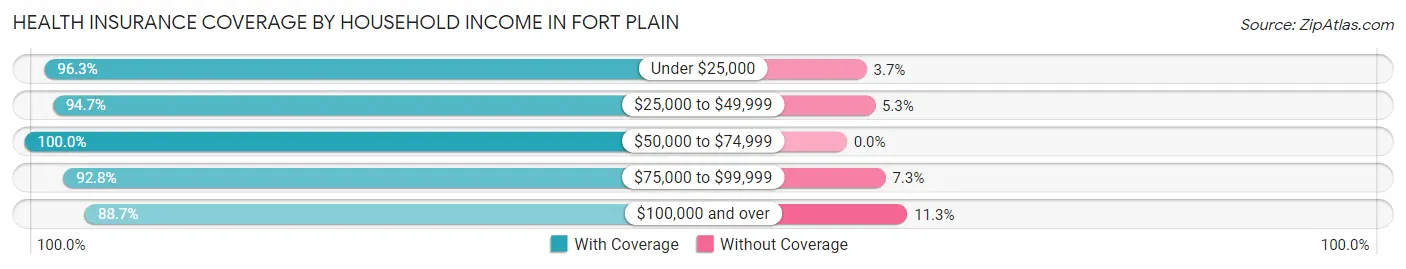
| Household Income | With Coverage | Without Coverage |
| Under $25,000 | 337 (96.3%) | 13 (3.7%) |
| $25,000 to $49,999 | 629 (94.7%) | 35 (5.3%) |
| $50,000 to $74,999 | 226 (100.0%) | 0 (0.0%) |
| $75,000 to $99,999 | 256 (92.7%) | 20 (7.2%) |
| $100,000 and over | 430 (88.7%) | 55 (11.3%) |
Public vs Private Health Insurance Coverage by Age in Fort Plain
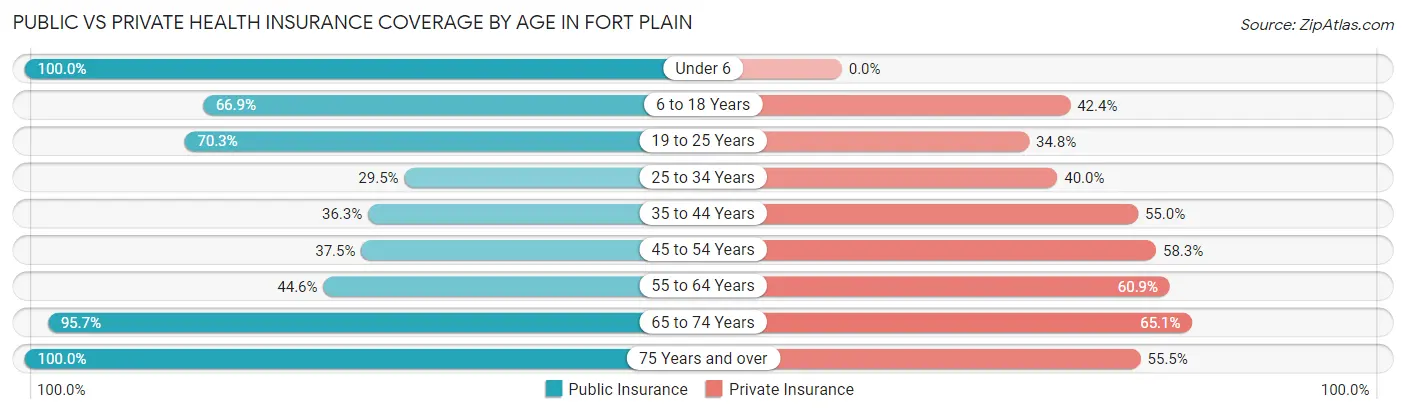
| Age Bracket | Public Insurance | Private Insurance |
| Under 6 | 113 (100.0%) | 0 (0.0%) |
| 6 to 18 Years | 251 (66.9%) | 159 (42.4%) |
| 19 to 25 Years | 83 (70.3%) | 41 (34.7%) |
| 25 to 34 Years | 59 (29.5%) | 80 (40.0%) |
| 35 to 44 Years | 91 (36.2%) | 138 (55.0%) |
| 45 to 54 Years | 90 (37.5%) | 140 (58.3%) |
| 55 to 64 Years | 180 (44.6%) | 246 (60.9%) |
| 65 to 74 Years | 178 (95.7%) | 121 (65.0%) |
| 75 Years and over | 128 (100.0%) | 71 (55.5%) |
| Total | 1,173 (58.2%) | 996 (49.4%) |
Disability Status by Sex by Age in Fort Plain
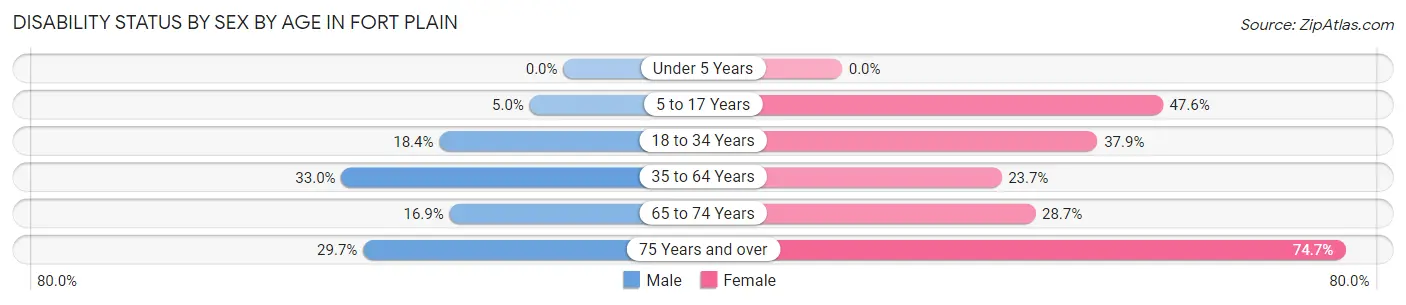
| Age Bracket | Male | Female |
| Under 5 Years | 0 (0.0%) | 0 (0.0%) |
| 5 to 17 Years | 7 (5.0%) | 90 (47.6%) |
| 18 to 34 Years | 35 (18.4%) | 66 (37.9%) |
| 35 to 64 Years | 146 (33.0%) | 107 (23.7%) |
| 65 to 74 Years | 12 (16.9%) | 33 (28.7%) |
| 75 Years and over | 11 (29.7%) | 68 (74.7%) |
Disability Class by Sex by Age in Fort Plain
Disability Class: Hearing Difficulty
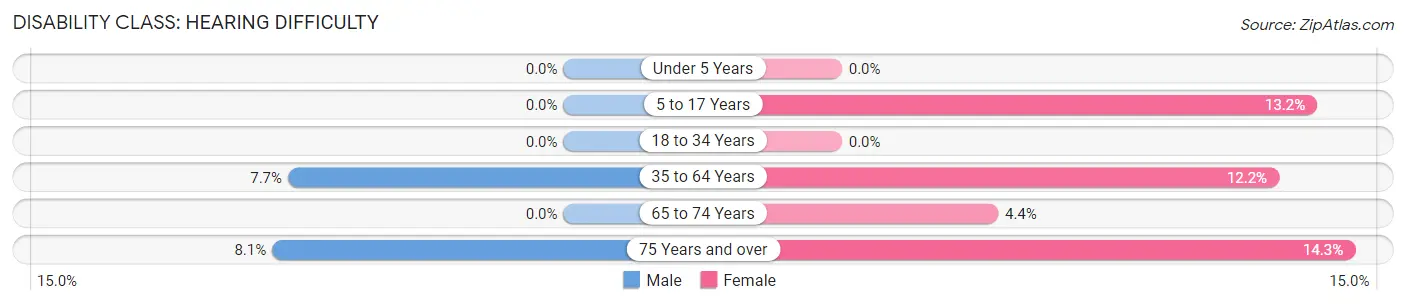
| Age Bracket | Male | Female |
| Under 5 Years | 0 (0.0%) | 0 (0.0%) |
| 5 to 17 Years | 0 (0.0%) | 25 (13.2%) |
| 18 to 34 Years | 0 (0.0%) | 0 (0.0%) |
| 35 to 64 Years | 34 (7.7%) | 55 (12.2%) |
| 65 to 74 Years | 0 (0.0%) | 5 (4.3%) |
| 75 Years and over | 3 (8.1%) | 13 (14.3%) |
Disability Class: Vision Difficulty
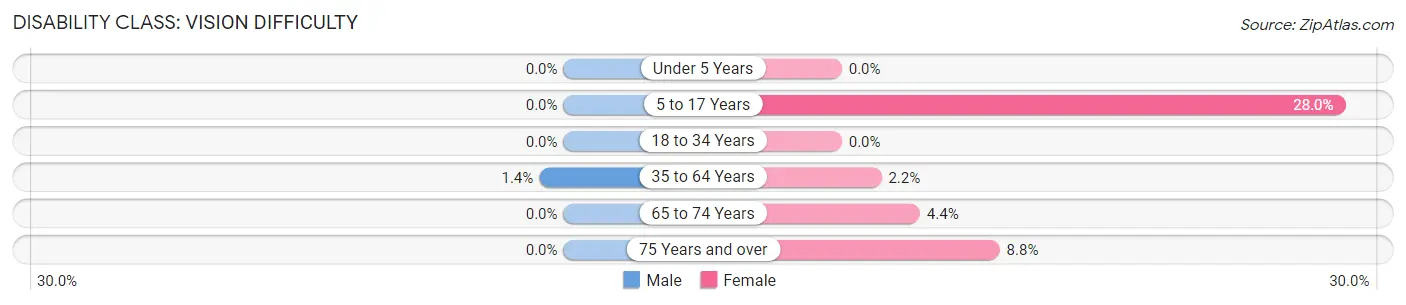
| Age Bracket | Male | Female |
| Under 5 Years | 0 (0.0%) | 0 (0.0%) |
| 5 to 17 Years | 0 (0.0%) | 53 (28.0%) |
| 18 to 34 Years | 0 (0.0%) | 0 (0.0%) |
| 35 to 64 Years | 6 (1.3%) | 10 (2.2%) |
| 65 to 74 Years | 0 (0.0%) | 5 (4.3%) |
| 75 Years and over | 0 (0.0%) | 8 (8.8%) |
Disability Class: Cognitive Difficulty
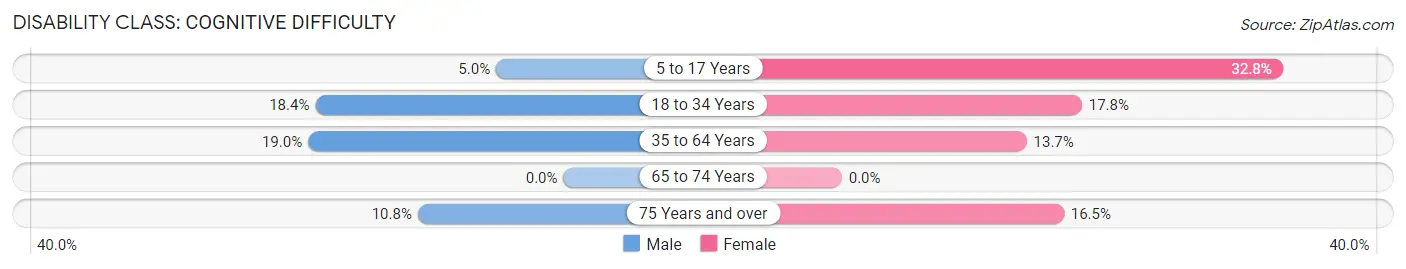
| Age Bracket | Male | Female |
| 5 to 17 Years | 7 (5.0%) | 62 (32.8%) |
| 18 to 34 Years | 35 (18.4%) | 31 (17.8%) |
| 35 to 64 Years | 84 (19.0%) | 62 (13.7%) |
| 65 to 74 Years | 0 (0.0%) | 0 (0.0%) |
| 75 Years and over | 4 (10.8%) | 15 (16.5%) |
Disability Class: Ambulatory Difficulty
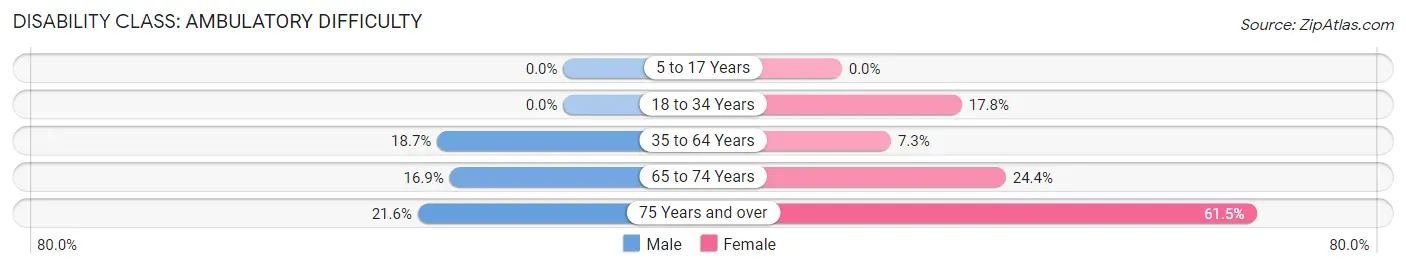
| Age Bracket | Male | Female |
| 5 to 17 Years | 0 (0.0%) | 0 (0.0%) |
| 18 to 34 Years | 0 (0.0%) | 31 (17.8%) |
| 35 to 64 Years | 83 (18.7%) | 33 (7.3%) |
| 65 to 74 Years | 12 (16.9%) | 28 (24.3%) |
| 75 Years and over | 8 (21.6%) | 56 (61.5%) |
Disability Class: Self-Care Difficulty
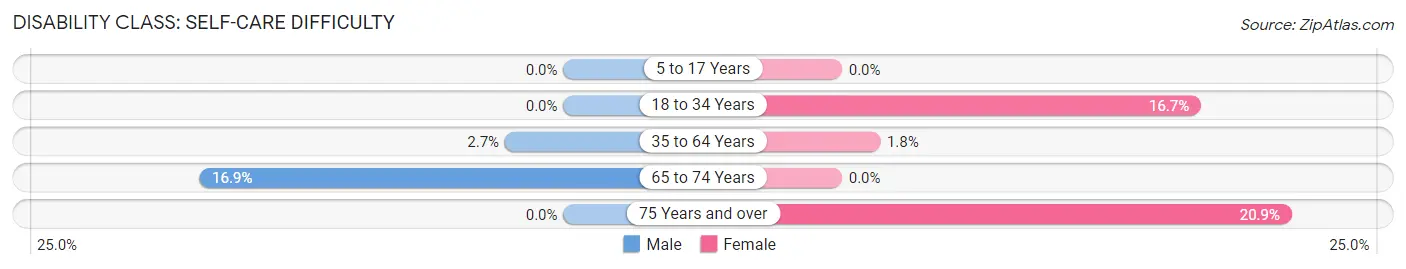
| Age Bracket | Male | Female |
| 5 to 17 Years | 0 (0.0%) | 0 (0.0%) |
| 18 to 34 Years | 0 (0.0%) | 29 (16.7%) |
| 35 to 64 Years | 12 (2.7%) | 8 (1.8%) |
| 65 to 74 Years | 12 (16.9%) | 0 (0.0%) |
| 75 Years and over | 0 (0.0%) | 19 (20.9%) |
Technology Access in Fort Plain
Computing Device Access in Fort Plain
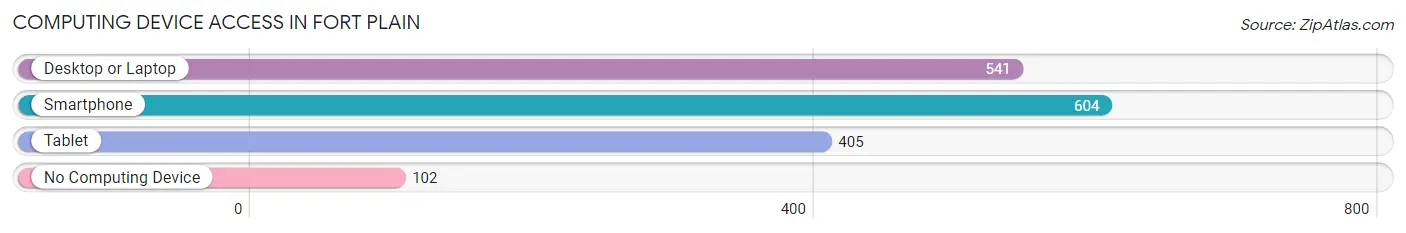
| Device Type | # Households | % Households |
| Desktop or Laptop | 541 | 70.4% |
| Smartphone | 604 | 78.6% |
| Tablet | 405 | 52.7% |
| No Computing Device | 102 | 13.3% |
| Total | 768 | 100.0% |
Internet Access in Fort Plain
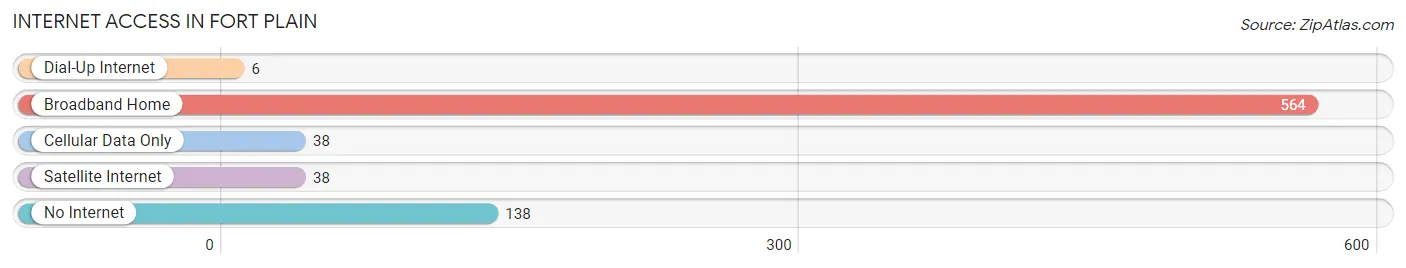
| Internet Type | # Households | % Households |
| Dial-Up Internet | 6 | 0.8% |
| Broadband Home | 564 | 73.4% |
| Cellular Data Only | 38 | 5.0% |
| Satellite Internet | 38 | 5.0% |
| No Internet | 138 | 18.0% |
| Total | 768 | 100.0% |
Fort Plain Summary
History
Fort Plain is a village located in the town of Minden in Montgomery County, New York. It is situated on the Mohawk River, near the foothills of the Adirondack Mountains. The village was originally known as Caughnawaga, and was settled by Dutch and German immigrants in the late 17th century. The village was renamed Fort Plain in 1780, after the Revolutionary War fort that was built there.
The village was an important stop on the Erie Canal, which was completed in 1825. The canal brought increased trade and commerce to the area, and the village grew rapidly. The village was incorporated in 1832, and by the mid-19th century, it was a thriving industrial center. The village was home to several factories, including a paper mill, a tannery, and a woolen mill.
The village was also home to several prominent citizens, including the abolitionist Gerrit Smith, who owned a large estate in the area. Smith was a major supporter of the Underground Railroad, and his estate was a stop on the route.
Geography
Fort Plain is located in the Mohawk Valley region of New York State. The village is situated on the Mohawk River, near the foothills of the Adirondack Mountains. The village is located approximately 25 miles west of Albany, and is accessible via the New York State Thruway.
The village is located in a rural area, and is surrounded by farmland. The nearby towns of Canajoharie and St. Johnsville are both located within a few miles of the village.
Economy
The economy of Fort Plain is largely based on agriculture and tourism. The village is home to several farms, which produce a variety of crops, including corn, soybeans, and hay. The village is also home to several wineries, which produce a variety of wines.
The village is also a popular tourist destination, due to its proximity to the Adirondack Mountains. The village is home to several historic sites, including the Fort Plain Museum, which is dedicated to the history of the village. The village is also home to several parks and recreational areas, including the Fort Plain Nature Preserve.
Demographics
As of the 2010 census, the population of Fort Plain was 2,624. The population is largely white (94.3%), with small percentages of African American (2.2%), Asian (1.2%), and Hispanic (1.2%) residents. The median household income is $41,944, and the median age is 41.7 years.
The village is served by the Fort Plain Central School District, which includes two elementary schools, one middle school, and one high school. The village is also home to several churches, including the First Presbyterian Church, which was founded in 1790.
Common Questions
What is Per Capita Income in Fort Plain?
Per Capita income in Fort Plain is $23,724.
What is the Median Family Income in Fort Plain?
Median Family Income in Fort Plain is $52,361.
What is the Median Household income in Fort Plain?
Median Household Income in Fort Plain is $39,016.
What is Income or Wage Gap in Fort Plain?
Income or Wage Gap in Fort Plain is 0.2%.
Women in Fort Plain earn 99.8 cents for every dollar earned by a man.
What is Family Income Deficit in Fort Plain?
Family Income Deficit in Fort Plain is $13,423.
Families that are below poverty line in Fort Plain earn $13,423 less on average than the poverty threshold level.
What is Inequality or Gini Index in Fort Plain?
Inequality or Gini Index in Fort Plain is 0.42.
What is the Total Population of Fort Plain?
Total Population of Fort Plain is 2,015.
What is the Total Male Population of Fort Plain?
Total Male Population of Fort Plain is 950.
What is the Total Female Population of Fort Plain?
Total Female Population of Fort Plain is 1,065.
What is the Ratio of Males per 100 Females in Fort Plain?
There are 89.20 Males per 100 Females in Fort Plain.
What is the Ratio of Females per 100 Males in Fort Plain?
There are 112.11 Females per 100 Males in Fort Plain.
What is the Median Population Age in Fort Plain?
Median Population Age in Fort Plain is 42.5 Years.
What is the Average Family Size in Fort Plain
Average Family Size in Fort Plain is 3.2 People.
What is the Average Household Size in Fort Plain
Average Household Size in Fort Plain is 2.6 People.
How Large is the Labor Force in Fort Plain?
There are 1,000 People in the Labor Forcein in Fort Plain.
What is the Percentage of People in the Labor Force in Fort Plain?
61.7% of People are in the Labor Force in Fort Plain.
What is the Unemployment Rate in Fort Plain?
Unemployment Rate in Fort Plain is 6.8%.