Fort Edward, NY Map & Demographics
Fort Edward Map
Fort Edward Overview
$30,062
PER CAPITA INCOME
$67,344
AVG FAMILY INCOME
$57,795
AVG HOUSEHOLD INCOME
8.0%
WAGE / INCOME GAP [ % ]
92.0¢/ $1
WAGE / INCOME GAP [ $ ]
0.41
INEQUALITY / GINI INDEX
3,189
TOTAL POPULATION
1,510
MALE POPULATION
1,679
FEMALE POPULATION
89.93
MALES / 100 FEMALES
111.19
FEMALES / 100 MALES
42.2
MEDIAN AGE
2.9
AVG FAMILY SIZE
2.4
AVG HOUSEHOLD SIZE
1,795
LABOR FORCE [ PEOPLE ]
70.6%
PERCENT IN LABOR FORCE
2.0%
UNEMPLOYMENT RATE
Fort Edward Zip Codes
Income in Fort Edward
Income Overview in Fort Edward
Per Capita Income in Fort Edward is $30,062, while median incomes of families and households are $67,344 and $57,795 respectively.
| Characteristic | Number | Measure |
| Per Capita Income | 3,189 | $30,062 |
| Median Family Income | 843 | $67,344 |
| Mean Family Income | 843 | $81,679 |
| Median Household Income | 1,331 | $57,795 |
| Mean Household Income | 1,331 | $70,732 |
| Income Deficit | 843 | $0 |
| Wage / Income Gap (%) | 3,189 | 8.02% |
| Wage / Income Gap ($) | 3,189 | 91.98¢ per $1 |
| Gini / Inequality Index | 3,189 | 0.41 |
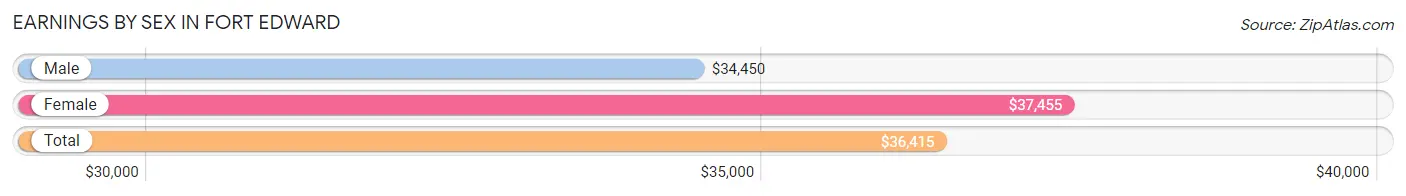
Earnings by Sex in Fort Edward
Average Earnings in Fort Edward are $36,415, $34,450 for men and $37,455 for women, a difference of 8.0%.
| Sex | Number | Average Earnings |
| Male | 861 (47.9%) | $34,450 |
| Female | 937 (52.1%) | $37,455 |
| Total | 1,798 (100.0%) | $36,415 |
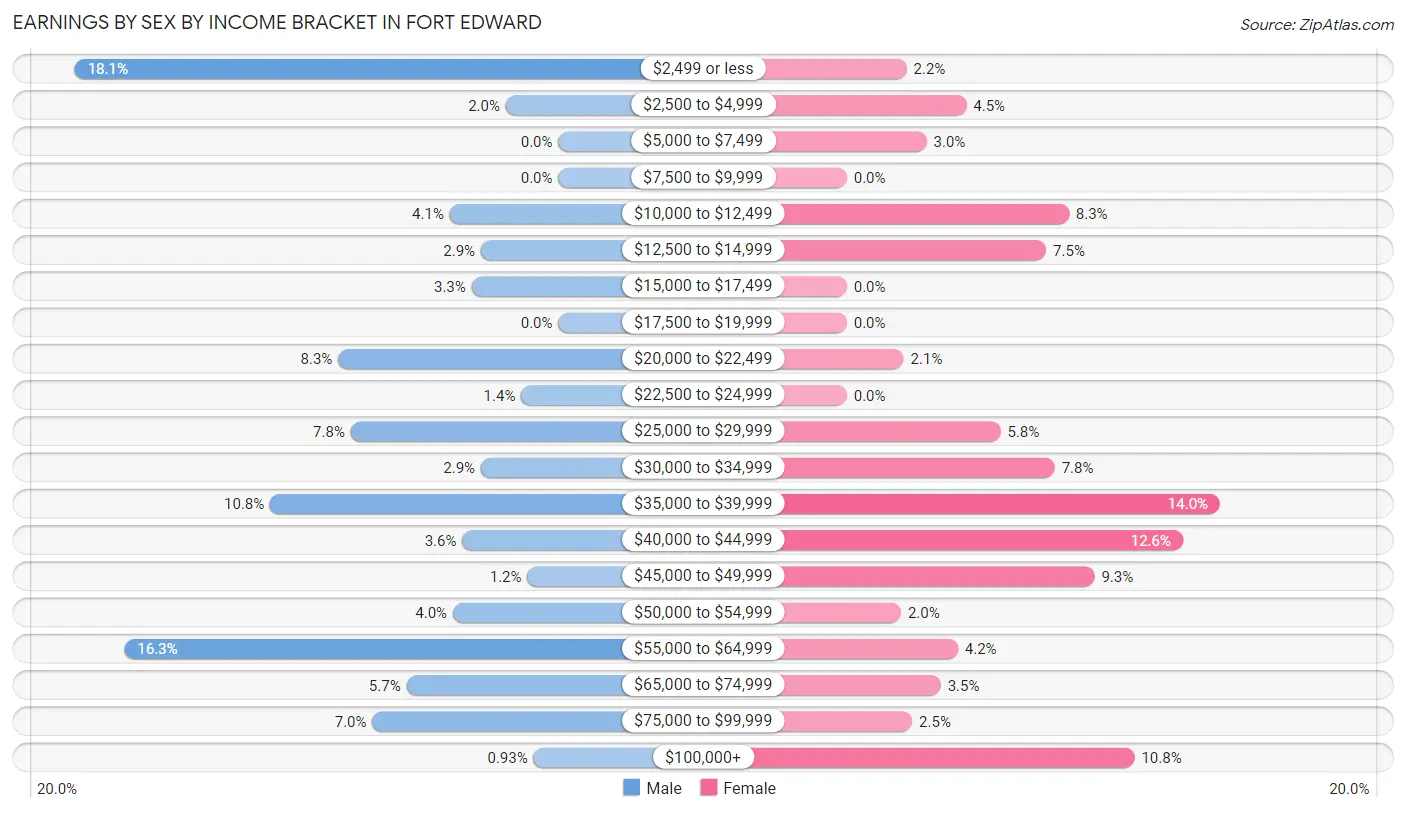
Earnings by Sex by Income Bracket in Fort Edward
The most common earnings brackets in Fort Edward are $2,499 or less for men (156 | 18.1%) and $35,000 to $39,999 for women (131 | 14.0%).
| Income | Male | Female |
| $2,499 or less | 156 (18.1%) | 21 (2.2%) |
| $2,500 to $4,999 | 17 (2.0%) | 42 (4.5%) |
| $5,000 to $7,499 | 0 (0.0%) | 28 (3.0%) |
| $7,500 to $9,999 | 0 (0.0%) | 0 (0.0%) |
| $10,000 to $12,499 | 35 (4.1%) | 78 (8.3%) |
| $12,500 to $14,999 | 25 (2.9%) | 70 (7.5%) |
| $15,000 to $17,499 | 28 (3.3%) | 0 (0.0%) |
| $17,500 to $19,999 | 0 (0.0%) | 0 (0.0%) |
| $20,000 to $22,499 | 71 (8.3%) | 20 (2.1%) |
| $22,500 to $24,999 | 12 (1.4%) | 0 (0.0%) |
| $25,000 to $29,999 | 67 (7.8%) | 54 (5.8%) |
| $30,000 to $34,999 | 25 (2.9%) | 73 (7.8%) |
| $35,000 to $39,999 | 93 (10.8%) | 131 (14.0%) |
| $40,000 to $44,999 | 31 (3.6%) | 118 (12.6%) |
| $45,000 to $49,999 | 10 (1.2%) | 87 (9.3%) |
| $50,000 to $54,999 | 34 (4.0%) | 19 (2.0%) |
| $55,000 to $64,999 | 140 (16.3%) | 39 (4.2%) |
| $65,000 to $74,999 | 49 (5.7%) | 33 (3.5%) |
| $75,000 to $99,999 | 60 (7.0%) | 23 (2.5%) |
| $100,000+ | 8 (0.9%) | 101 (10.8%) |
| Total | 861 (100.0%) | 937 (100.0%) |
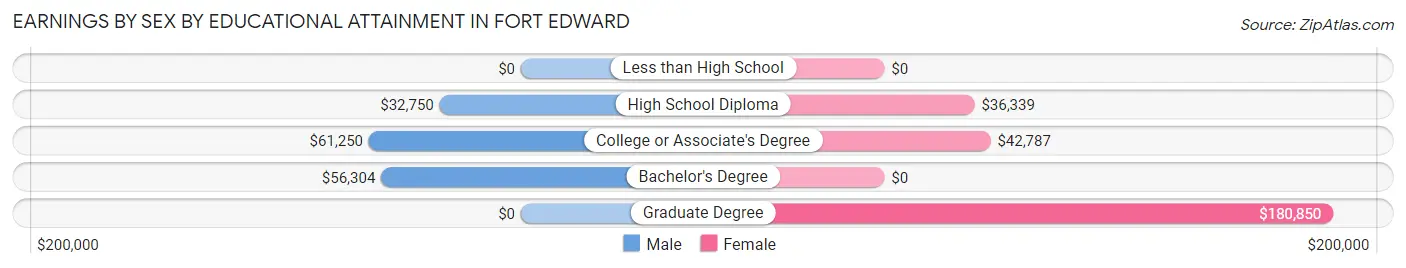
Earnings by Sex by Educational Attainment in Fort Edward
Average earnings in Fort Edward are $41,290 for men and $42,529 for women, a difference of 2.9%. Men with an educational attainment of college or associate's degree enjoy the highest average annual earnings of $61,250, while those with high school diploma education earn the least with $32,750. Women with an educational attainment of graduate degree earn the most with the average annual earnings of $180,850, while those with high school diploma education have the smallest earnings of $36,339.
| Educational Attainment | Male Income | Female Income |
| Less than High School | - | - |
| High School Diploma | $32,750 | $36,339 |
| College or Associate's Degree | $61,250 | $42,787 |
| Bachelor's Degree | $56,304 | $0 |
| Graduate Degree | - | - |
| Total | $41,290 | $42,529 |
Family Income in Fort Edward
Family Income Brackets in Fort Edward
According to the Fort Edward family income data, there are 191 families falling into the $50,000 to $74,999 income range, which is the most common income bracket and makes up 22.7% of all families. Conversely, the $15,000 to $24,999 income bracket is the least frequent group with only 3 families (0.4%) belonging to this category.
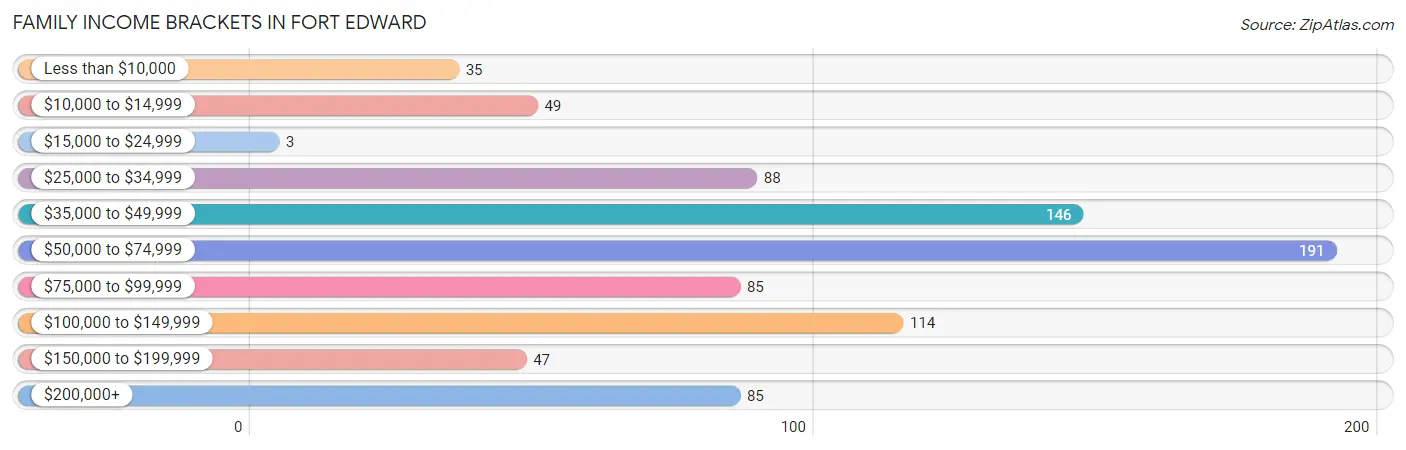
| Income Bracket | # Families | % Families |
| Less than $10,000 | 35 | 4.2% |
| $10,000 to $14,999 | 49 | 5.8% |
| $15,000 to $24,999 | 3 | 0.4% |
| $25,000 to $34,999 | 88 | 10.4% |
| $35,000 to $49,999 | 146 | 17.3% |
| $50,000 to $74,999 | 191 | 22.7% |
| $75,000 to $99,999 | 85 | 10.1% |
| $100,000 to $149,999 | 114 | 13.5% |
| $150,000 to $199,999 | 47 | 5.6% |
| $200,000+ | 85 | 10.1% |
Family Income by Famaliy Size in Fort Edward
5-person families (23 | 2.7%) account for the highest median family income in Fort Edward with $87,321 per family, while 5-person families (23 | 2.7%) have the highest median income of $17,464 per family member.
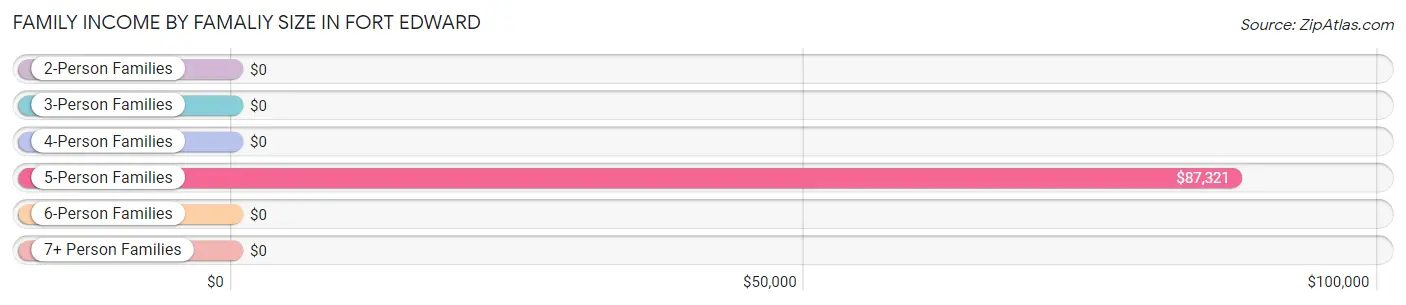
| Income Bracket | # Families | Median Income |
| 2-Person Families | 380 (45.1%) | $0 |
| 3-Person Families | 291 (34.5%) | $0 |
| 4-Person Families | 149 (17.7%) | $0 |
| 5-Person Families | 23 (2.7%) | $87,321 |
| 6-Person Families | 0 (0.0%) | $0 |
| 7+ Person Families | 0 (0.0%) | $0 |
| Total | 843 (100.0%) | $67,344 |
Family Income by Number of Earners in Fort Edward
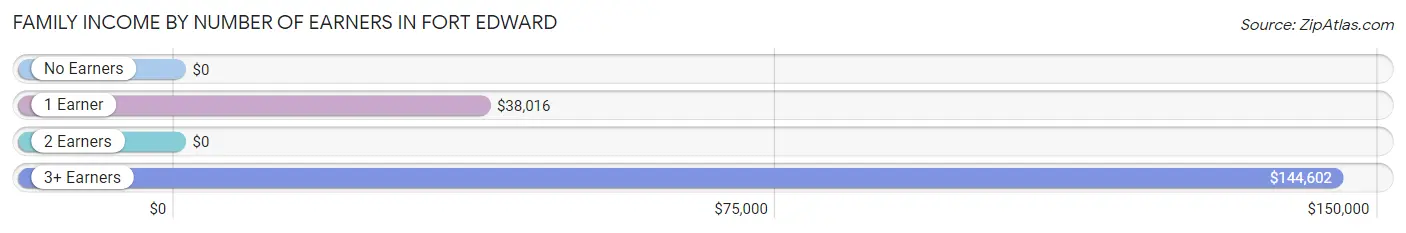
| Number of Earners | # Families | Median Income |
| No Earners | 136 (16.1%) | $0 |
| 1 Earner | 355 (42.1%) | $38,016 |
| 2 Earners | 224 (26.6%) | $0 |
| 3+ Earners | 128 (15.2%) | $144,602 |
| Total | 843 (100.0%) | $67,344 |
Household Income in Fort Edward
Household Income Brackets in Fort Edward
With 343 households falling in the category, the $50,000 to $74,999 income range is the most frequent in Fort Edward, accounting for 25.8% of all households. In contrast, only 23 households (1.7%) fall into the $15,000 to $24,999 income bracket, making it the least populous group.
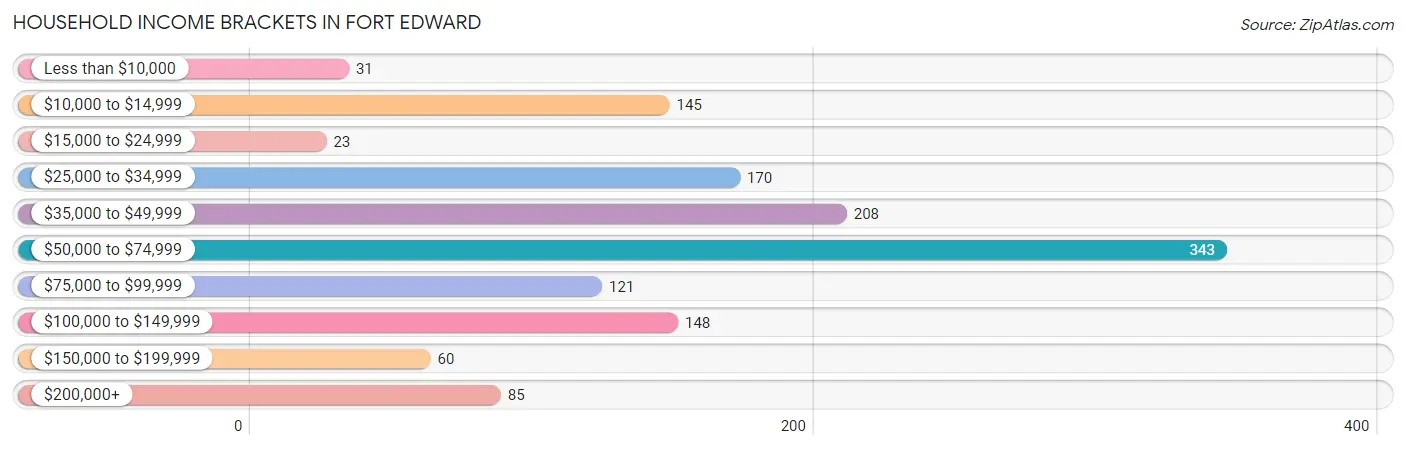
| Income Bracket | # Households | % Households |
| Less than $10,000 | 31 | 2.3% |
| $10,000 to $14,999 | 145 | 10.9% |
| $15,000 to $24,999 | 23 | 1.7% |
| $25,000 to $34,999 | 170 | 12.8% |
| $35,000 to $49,999 | 208 | 15.6% |
| $50,000 to $74,999 | 343 | 25.8% |
| $75,000 to $99,999 | 121 | 9.1% |
| $100,000 to $149,999 | 148 | 11.1% |
| $150,000 to $199,999 | 60 | 4.5% |
| $200,000+ | 85 | 6.4% |
Household Income by Householder Age in Fort Edward
The median household income in Fort Edward is $57,795, with the highest median household income of $58,833 found in the 65+ years age bracket for the primary householder. A total of 226 households (17.0%) fall into this category. Meanwhile, the 15 to 24 years age bracket for the primary householder has the lowest median household income of $0, with 40 households (3.0%) in this group.
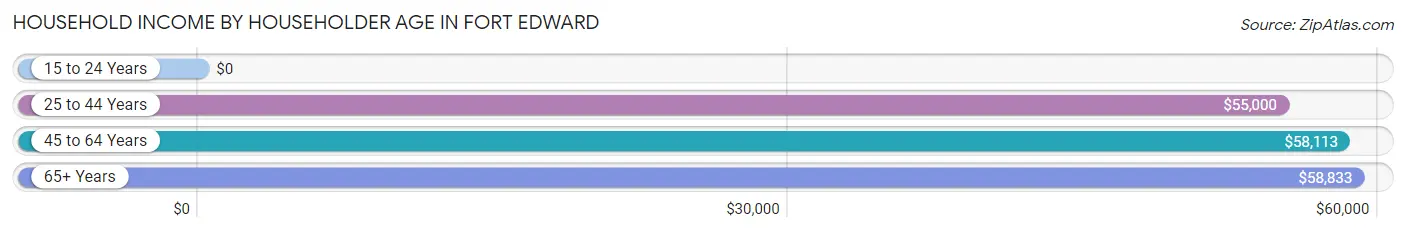
| Income Bracket | # Households | Median Income |
| 15 to 24 Years | 40 (3.0%) | $0 |
| 25 to 44 Years | 390 (29.3%) | $55,000 |
| 45 to 64 Years | 675 (50.7%) | $58,113 |
| 65+ Years | 226 (17.0%) | $58,833 |
| Total | 1,331 (100.0%) | $57,795 |
Poverty in Fort Edward
Income Below Poverty by Sex and Age in Fort Edward
With 11.3% poverty level for males and 17.4% for females among the residents of Fort Edward, 55 to 64 year old males and 6 to 11 year old females are the most vulnerable to poverty, with 137 males (33.7%) and 87 females (43.9%) in their respective age groups living below the poverty level.
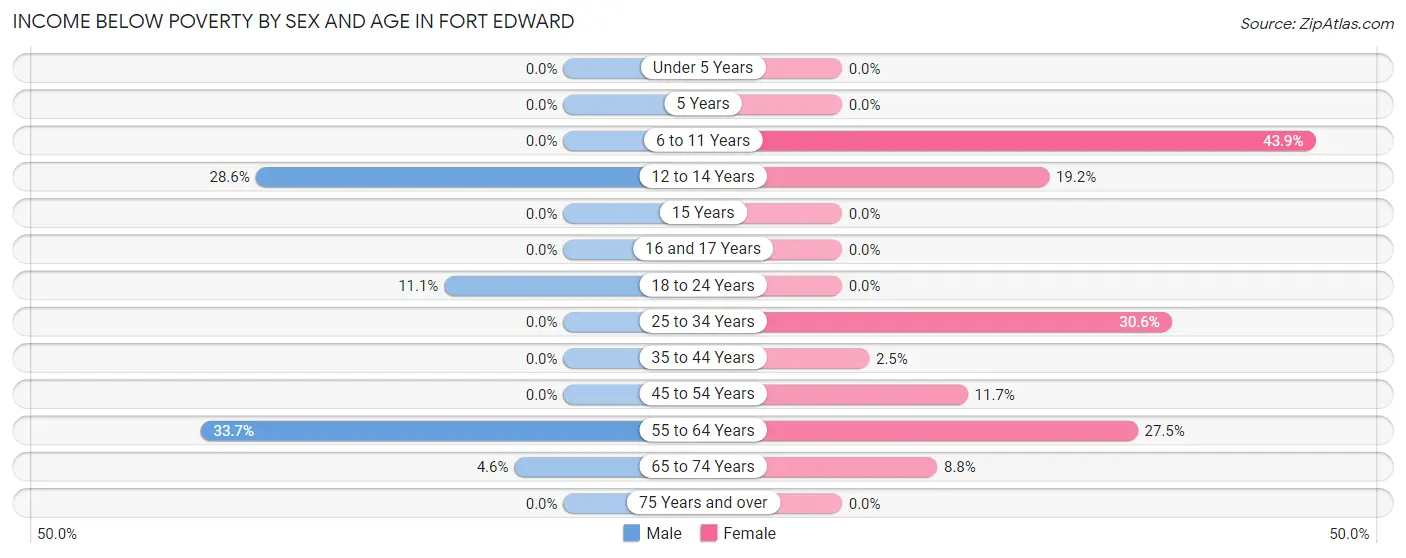
| Age Bracket | Male | Female |
| Under 5 Years | 0 (0.0%) | 0 (0.0%) |
| 5 Years | 0 (0.0%) | 0 (0.0%) |
| 6 to 11 Years | 0 (0.0%) | 87 (43.9%) |
| 12 to 14 Years | 6 (28.6%) | 15 (19.2%) |
| 15 Years | 0 (0.0%) | 0 (0.0%) |
| 16 and 17 Years | 0 (0.0%) | 0 (0.0%) |
| 18 to 24 Years | 23 (11.1%) | 0 (0.0%) |
| 25 to 34 Years | 0 (0.0%) | 60 (30.6%) |
| 35 to 44 Years | 0 (0.0%) | 5 (2.5%) |
| 45 to 54 Years | 0 (0.0%) | 34 (11.7%) |
| 55 to 64 Years | 137 (33.7%) | 70 (27.5%) |
| 65 to 74 Years | 3 (4.5%) | 19 (8.8%) |
| 75 Years and over | 0 (0.0%) | 0 (0.0%) |
| Total | 169 (11.3%) | 290 (17.4%) |
Income Above Poverty by Sex and Age in Fort Edward
According to the poverty statistics in Fort Edward, males aged under 5 years and females aged under 5 years are the age groups that are most secure financially, with 100.0% of males and 100.0% of females in these age groups living above the poverty line.
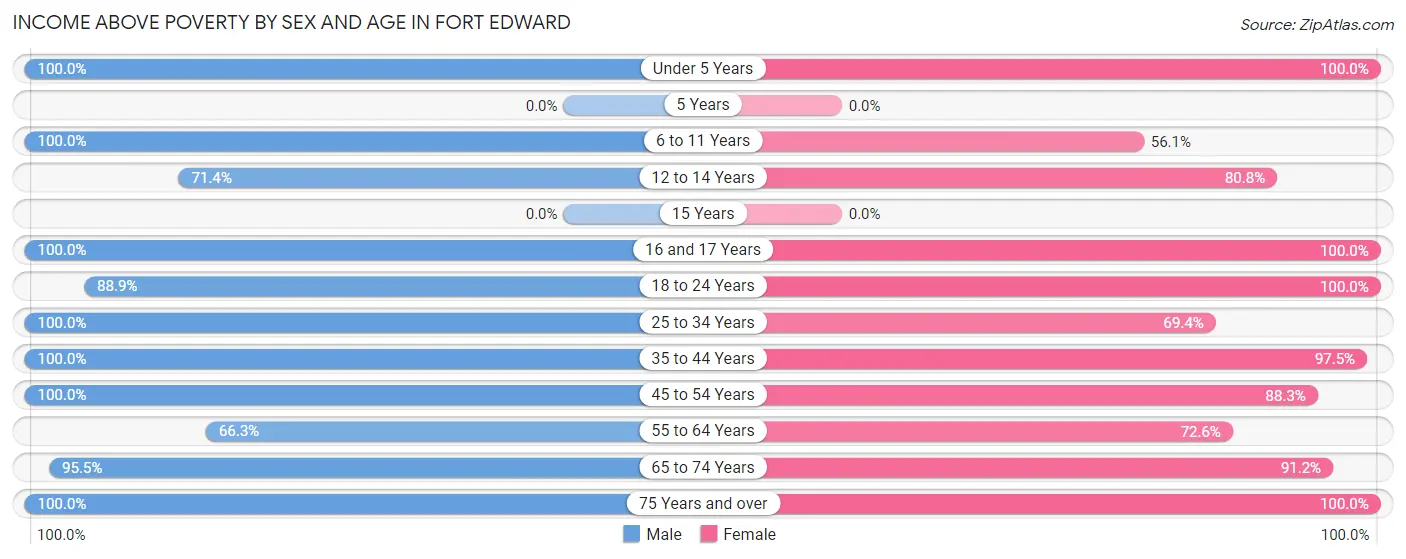
| Age Bracket | Male | Female |
| Under 5 Years | 171 (100.0%) | 32 (100.0%) |
| 5 Years | 0 (0.0%) | 0 (0.0%) |
| 6 to 11 Years | 121 (100.0%) | 111 (56.1%) |
| 12 to 14 Years | 15 (71.4%) | 63 (80.8%) |
| 15 Years | 0 (0.0%) | 0 (0.0%) |
| 16 and 17 Years | 49 (100.0%) | 14 (100.0%) |
| 18 to 24 Years | 185 (88.9%) | 161 (100.0%) |
| 25 to 34 Years | 170 (100.0%) | 136 (69.4%) |
| 35 to 44 Years | 66 (100.0%) | 193 (97.5%) |
| 45 to 54 Years | 132 (100.0%) | 257 (88.3%) |
| 55 to 64 Years | 270 (66.3%) | 185 (72.6%) |
| 65 to 74 Years | 63 (95.5%) | 196 (91.2%) |
| 75 Years and over | 83 (100.0%) | 31 (100.0%) |
| Total | 1,325 (88.7%) | 1,379 (82.6%) |
Income Below Poverty Among Married-Couple Families in Fort Edward
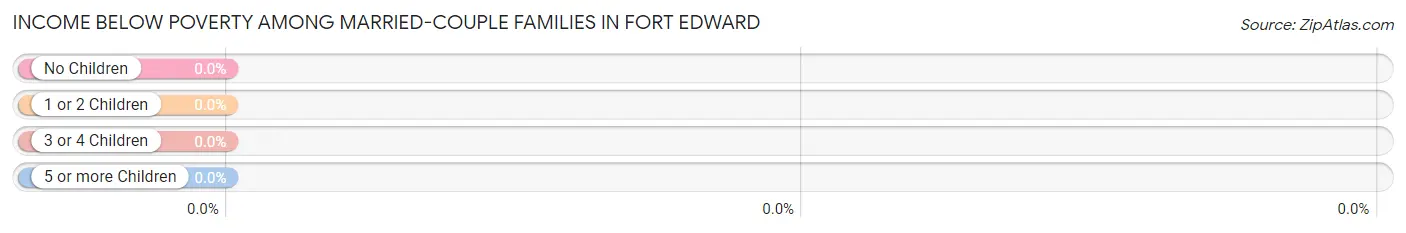
| Children | Above Poverty | Below Poverty |
| No Children | 317 (100.0%) | 0 (0.0%) |
| 1 or 2 Children | 44 (100.0%) | 0 (0.0%) |
| 3 or 4 Children | 12 (100.0%) | 0 (0.0%) |
| 5 or more Children | 0 (0.0%) | 0 (0.0%) |
| Total | 373 (100.0%) | 0 (0.0%) |
Income Below Poverty Among Single-Parent Households in Fort Edward
According to the poverty data in Fort Edward, 18.1% or 17 single-father households and 17.8% or 67 single-mother households are living below the poverty line. Among single-father households, those with no children have the highest poverty rate, with 17 households (100.0%) experiencing poverty. Likewise, among single-mother households, those with 1 or 2 children have the highest poverty rate, with 67 households (22.2%) falling below the poverty line.
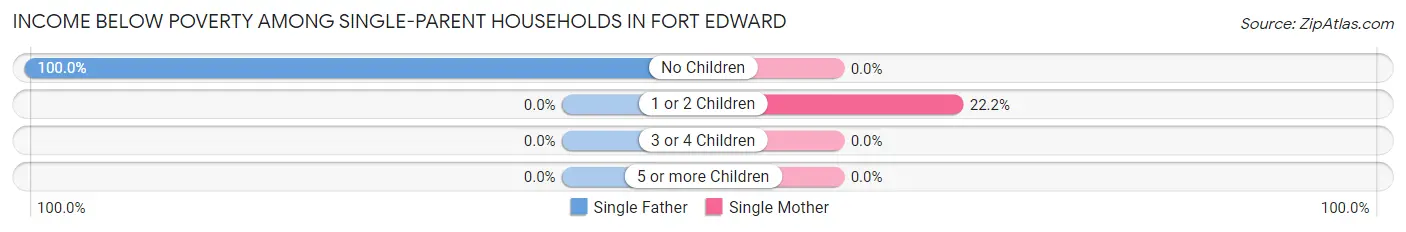
| Children | Single Father | Single Mother |
| No Children | 17 (100.0%) | 0 (0.0%) |
| 1 or 2 Children | 0 (0.0%) | 67 (22.2%) |
| 3 or 4 Children | 0 (0.0%) | 0 (0.0%) |
| 5 or more Children | 0 (0.0%) | 0 (0.0%) |
| Total | 17 (18.1%) | 67 (17.8%) |
Income Below Poverty Among Married-Couple vs Single-Parent Households in Fort Edward
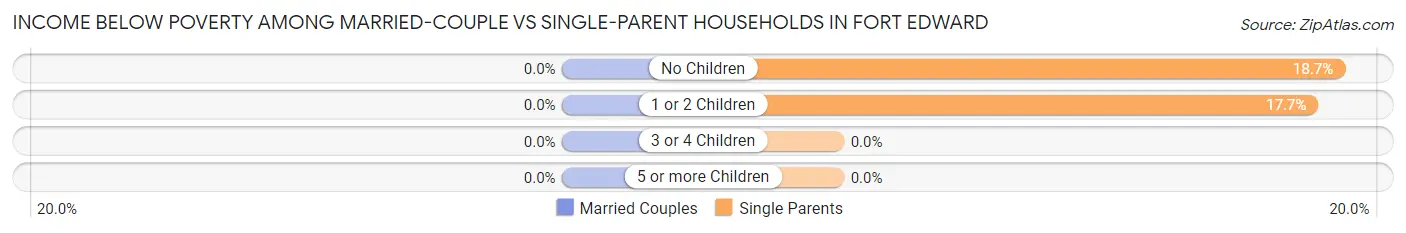
| Children | Married-Couple Families | Single-Parent Households |
| No Children | 0 (0.0%) | 17 (18.7%) |
| 1 or 2 Children | 0 (0.0%) | 67 (17.7%) |
| 3 or 4 Children | 0 (0.0%) | 0 (0.0%) |
| 5 or more Children | 0 (0.0%) | 0 (0.0%) |
| Total | 0 (0.0%) | 84 (17.9%) |
Race in Fort Edward
The most populous races in Fort Edward are White / Caucasian (3,125 | 98.0%), Asian (26 | 0.8%), and Black / African American (18 | 0.6%).
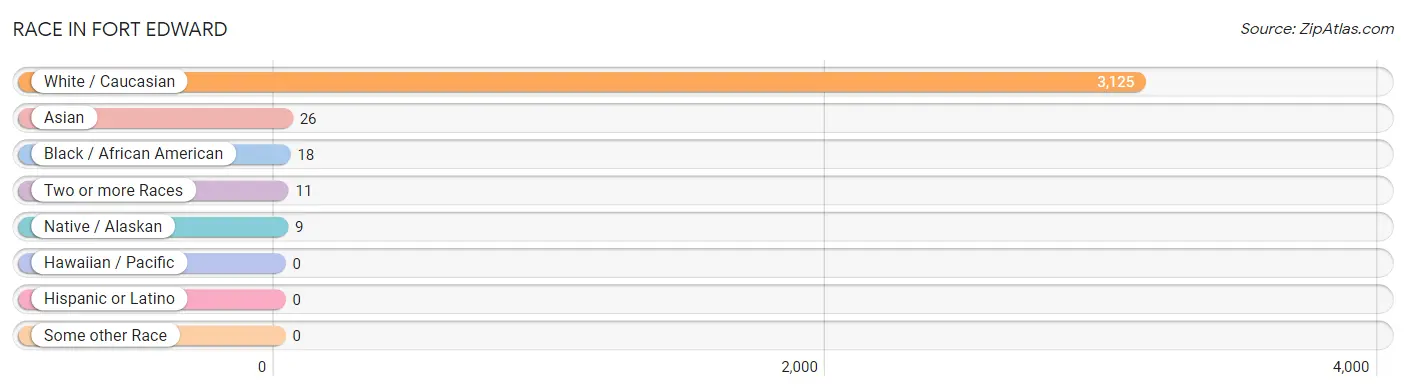
| Race | # Population | % Population |
| Asian | 26 | 0.8% |
| Black / African American | 18 | 0.6% |
| Hawaiian / Pacific | 0 | 0.0% |
| Hispanic or Latino | 0 | 0.0% |
| Native / Alaskan | 9 | 0.3% |
| White / Caucasian | 3,125 | 98.0% |
| Two or more Races | 11 | 0.3% |
| Some other Race | 0 | 0.0% |
| Total | 3,189 | 100.0% |
Ancestry in Fort Edward
The most populous ancestries reported in Fort Edward are Irish (653 | 20.5%), English (576 | 18.1%), American (449 | 14.1%), Italian (410 | 12.9%), and Dutch (300 | 9.4%), together accounting for 74.9% of all Fort Edward residents.
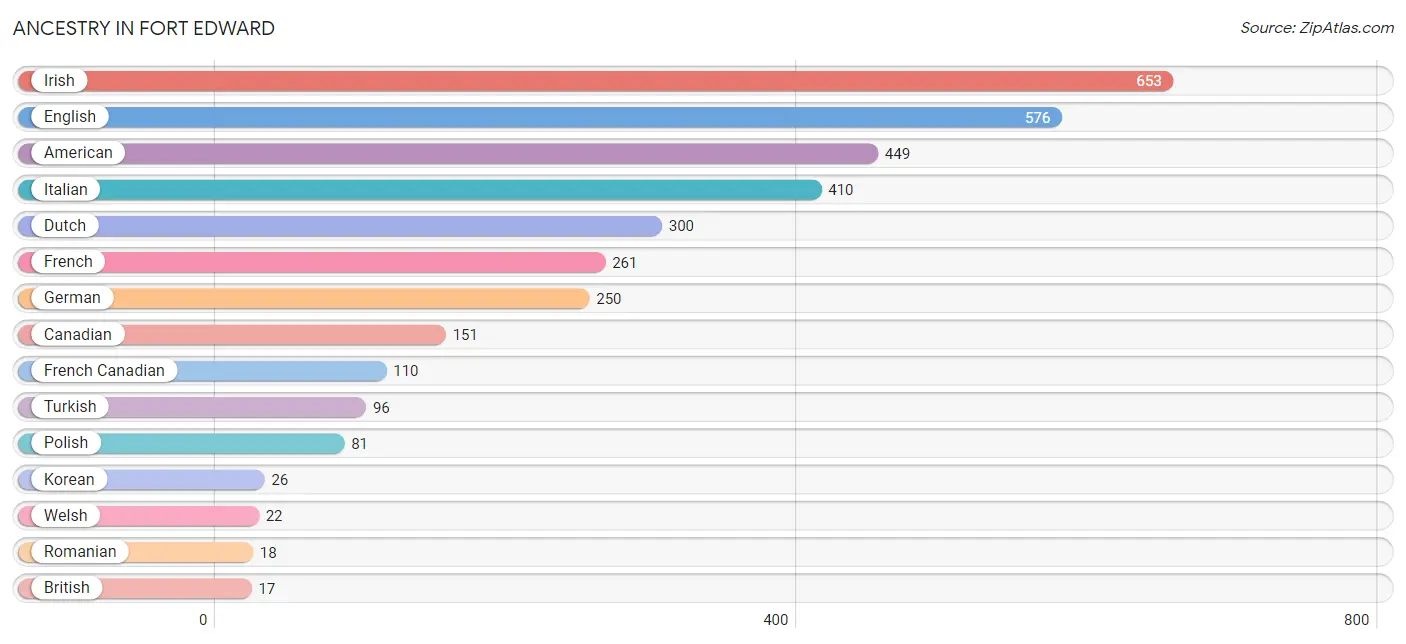
| Ancestry | # Population | % Population |
| American | 449 | 14.1% |
| Blackfeet | 6 | 0.2% |
| British | 17 | 0.5% |
| Canadian | 151 | 4.7% |
| Cherokee | 3 | 0.1% |
| Czechoslovakian | 11 | 0.3% |
| Dutch | 300 | 9.4% |
| English | 576 | 18.1% |
| French | 261 | 8.2% |
| French Canadian | 110 | 3.5% |
| German | 250 | 7.8% |
| Irish | 653 | 20.5% |
| Italian | 410 | 12.9% |
| Korean | 26 | 0.8% |
| Polish | 81 | 2.5% |
| Romanian | 18 | 0.6% |
| Scotch-Irish | 17 | 0.5% |
| Scottish | 11 | 0.3% |
| Turkish | 96 | 3.0% |
| Welsh | 22 | 0.7% | View All 20 Rows |
Immigrants in Fort Edward
The most numerous immigrant groups reported in Fort Edward came from Asia (122 | 3.8%), Turkey (96 | 3.0%), Western Asia (96 | 3.0%), Philippines (26 | 0.8%), and South Eastern Asia (26 | 0.8%), together accounting for 11.5% of all Fort Edward residents.
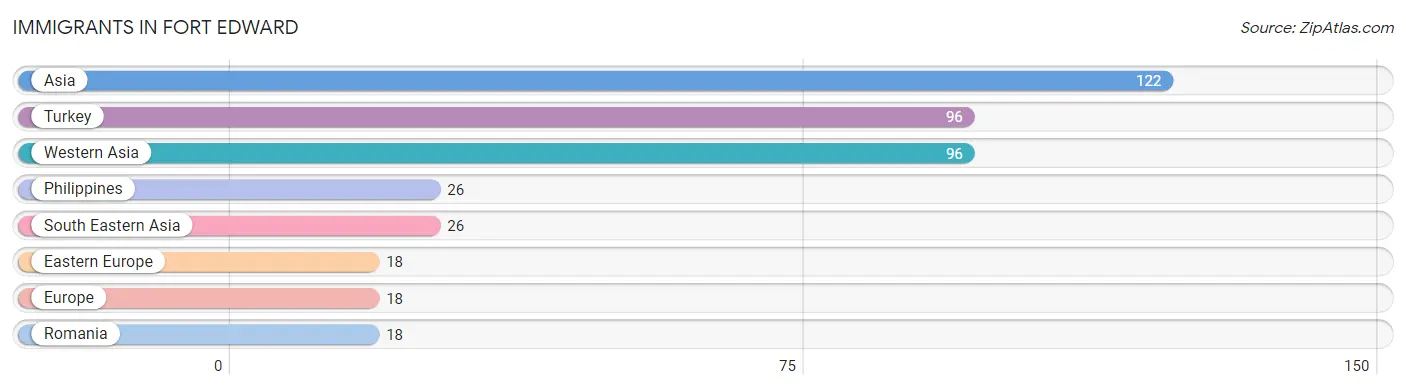
| Immigration Origin | # Population | % Population |
| Asia | 122 | 3.8% |
| Eastern Europe | 18 | 0.6% |
| Europe | 18 | 0.6% |
| Philippines | 26 | 0.8% |
| Romania | 18 | 0.6% |
| South Eastern Asia | 26 | 0.8% |
| Turkey | 96 | 3.0% |
| Western Asia | 96 | 3.0% | View All 8 Rows |
Sex and Age in Fort Edward
Sex and Age in Fort Edward
The most populous age groups in Fort Edward are 55 to 59 Years (250 | 16.6%) for men and 55 to 59 Years (216 | 12.9%) for women.
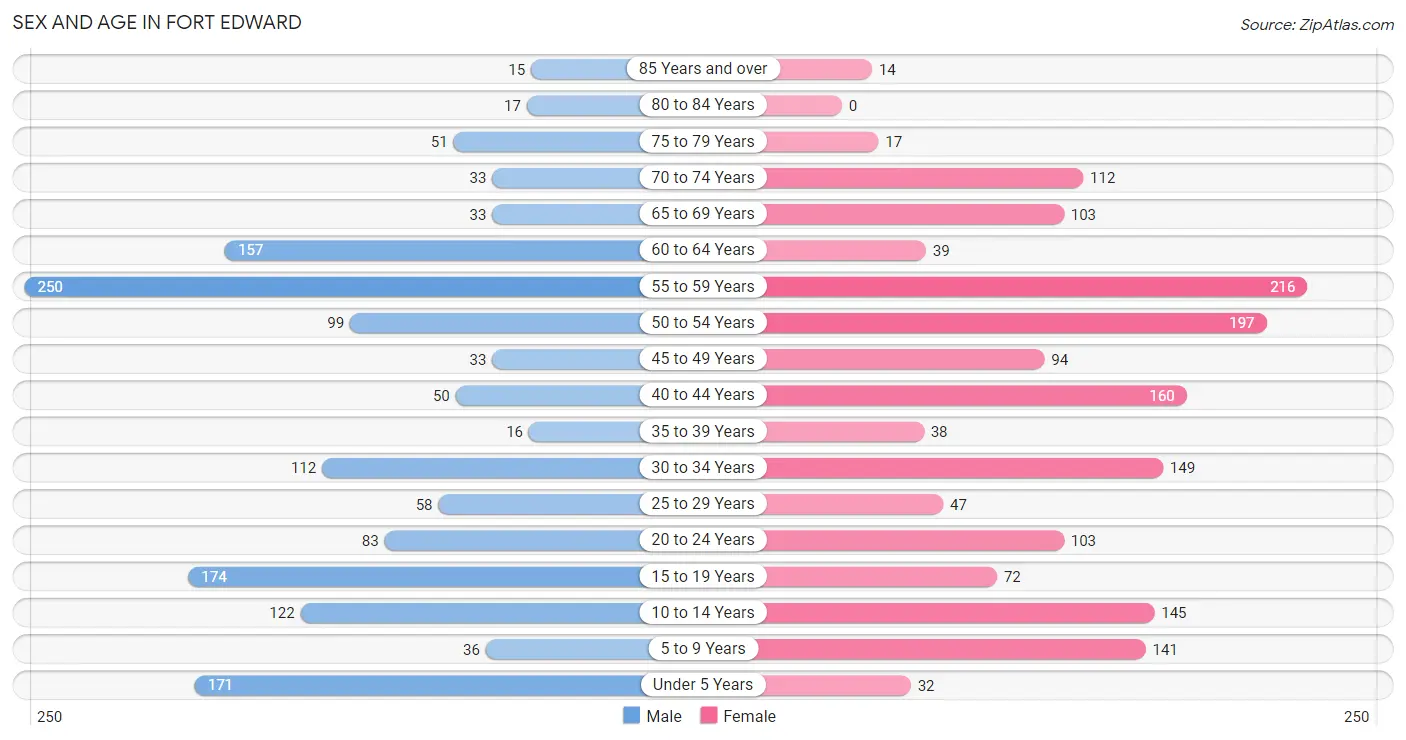
| Age Bracket | Male | Female |
| Under 5 Years | 171 (11.3%) | 32 (1.9%) |
| 5 to 9 Years | 36 (2.4%) | 141 (8.4%) |
| 10 to 14 Years | 122 (8.1%) | 145 (8.6%) |
| 15 to 19 Years | 174 (11.5%) | 72 (4.3%) |
| 20 to 24 Years | 83 (5.5%) | 103 (6.1%) |
| 25 to 29 Years | 58 (3.8%) | 47 (2.8%) |
| 30 to 34 Years | 112 (7.4%) | 149 (8.9%) |
| 35 to 39 Years | 16 (1.1%) | 38 (2.3%) |
| 40 to 44 Years | 50 (3.3%) | 160 (9.5%) |
| 45 to 49 Years | 33 (2.2%) | 94 (5.6%) |
| 50 to 54 Years | 99 (6.6%) | 197 (11.7%) |
| 55 to 59 Years | 250 (16.6%) | 216 (12.9%) |
| 60 to 64 Years | 157 (10.4%) | 39 (2.3%) |
| 65 to 69 Years | 33 (2.2%) | 103 (6.1%) |
| 70 to 74 Years | 33 (2.2%) | 112 (6.7%) |
| 75 to 79 Years | 51 (3.4%) | 17 (1.0%) |
| 80 to 84 Years | 17 (1.1%) | 0 (0.0%) |
| 85 Years and over | 15 (1.0%) | 14 (0.8%) |
| Total | 1,510 (100.0%) | 1,679 (100.0%) |
Families and Households in Fort Edward
Median Family Size in Fort Edward
The median family size in Fort Edward is 2.86 persons per family, with married-couple families (373 | 44.3%) accounting for the largest median family size of 3.04 persons per family. On the other hand, single female/mother families (376 | 44.6%) represent the smallest median family size with 2.71 persons per family.
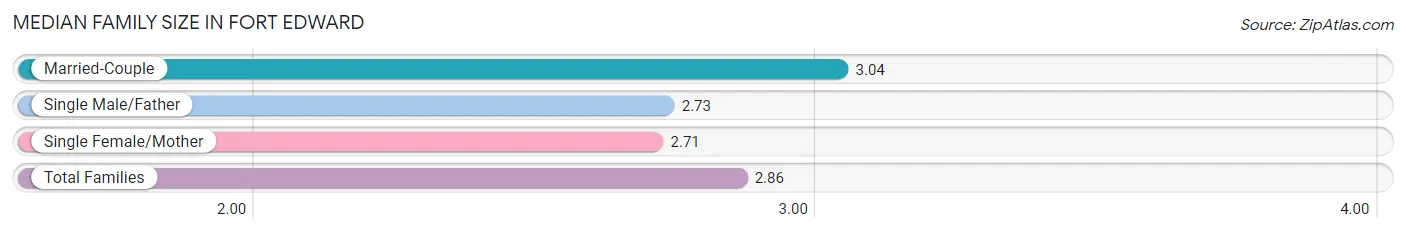
| Family Type | # Families | Family Size |
| Married-Couple | 373 (44.3%) | 3.04 |
| Single Male/Father | 94 (11.2%) | 2.73 |
| Single Female/Mother | 376 (44.6%) | 2.71 |
| Total Families | 843 (100.0%) | 2.86 |
Median Household Size in Fort Edward
The median household size in Fort Edward is 2.38 persons per household, with married-couple households (373 | 28.0%) accounting for the largest median household size of 3.04 persons per household. non-family households (488 | 36.7%) represent the smallest median household size with 1.35 persons per household.
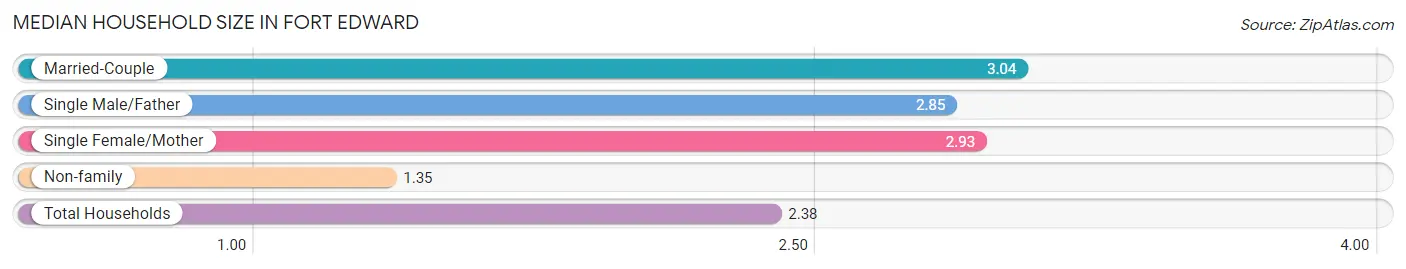
| Household Type | # Households | Household Size |
| Married-Couple | 373 (28.0%) | 3.04 |
| Single Male/Father | 94 (7.1%) | 2.85 |
| Single Female/Mother | 376 (28.2%) | 2.93 |
| Non-family | 488 (36.7%) | 1.35 |
| Total Households | 1,331 (100.0%) | 2.38 |
Household Size by Marriage Status in Fort Edward
Out of a total of 1,331 households in Fort Edward, 843 (63.3%) are family households, while 488 (36.7%) are nonfamily households. The most numerous type of family households are 2-person households, comprising 341, and the most common type of nonfamily households are 1-person households, comprising 350.
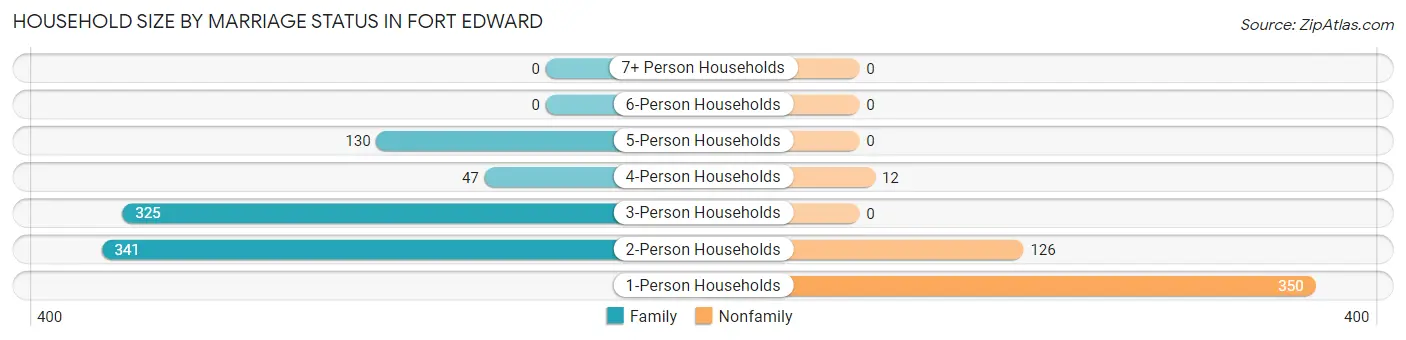
| Household Size | Family Households | Nonfamily Households |
| 1-Person Households | - | 350 (26.3%) |
| 2-Person Households | 341 (25.6%) | 126 (9.5%) |
| 3-Person Households | 325 (24.4%) | 0 (0.0%) |
| 4-Person Households | 47 (3.5%) | 12 (0.9%) |
| 5-Person Households | 130 (9.8%) | 0 (0.0%) |
| 6-Person Households | 0 (0.0%) | 0 (0.0%) |
| 7+ Person Households | 0 (0.0%) | 0 (0.0%) |
| Total | 843 (63.3%) | 488 (36.7%) |
Female Fertility in Fort Edward
Fertility by Age in Fort Edward
Average fertility rate in Fort Edward is 16.0 births per 1,000 women. Women in the age bracket of 20 to 34 years have the highest fertility rate with 37.0 births per 1,000 women. Women in the age bracket of 20 to 34 years acount for 100.0% of all women with births.
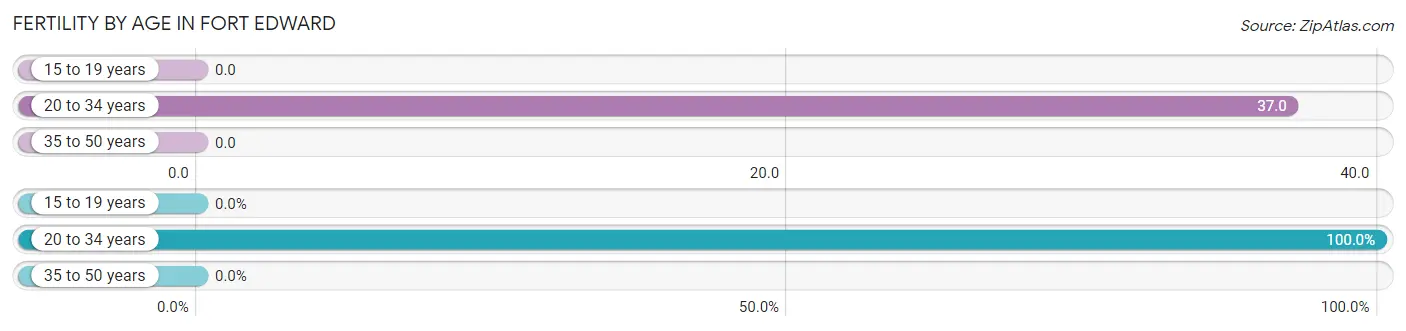
| Age Bracket | Women with Births | Births / 1,000 Women |
| 15 to 19 years | 0 (0.0%) | 0.0 |
| 20 to 34 years | 11 (100.0%) | 37.0 |
| 35 to 50 years | 0 (0.0%) | 0.0 |
| Total | 11 (100.0%) | 16.0 |
Fertility by Age by Marriage Status in Fort Edward
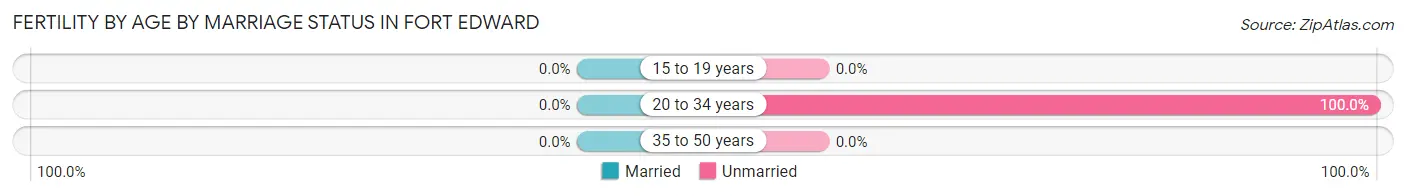
| Age Bracket | Married | Unmarried |
| 15 to 19 years | 0 (0.0%) | 0 (0.0%) |
| 20 to 34 years | 0 (0.0%) | 11 (100.0%) |
| 35 to 50 years | 0 (0.0%) | 0 (0.0%) |
| Total | 0 (0.0%) | 11 (100.0%) |
Fertility by Education in Fort Edward
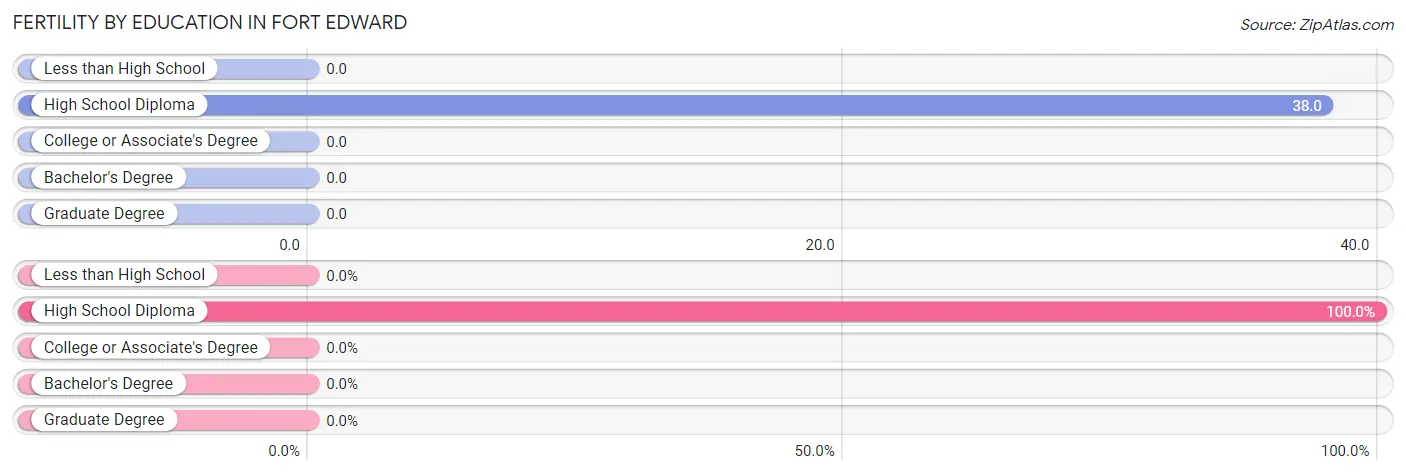
| Educational Attainment | Women with Births | Births / 1,000 Women |
| Less than High School | 0 (0.0%) | 0.0 |
| High School Diploma | 11 (100.0%) | 38.0 |
| College or Associate's Degree | 0 (0.0%) | 0.0 |
| Bachelor's Degree | 0 (0.0%) | 0.0 |
| Graduate Degree | 0 (0.0%) | 0.0 |
| Total | 11 (100.0%) | 16.0 |
Fertility by Education by Marriage Status in Fort Edward
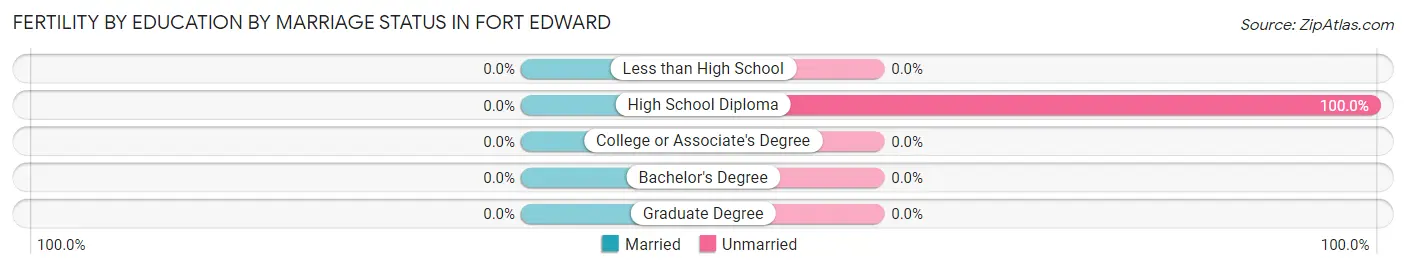
| Educational Attainment | Married | Unmarried |
| Less than High School | 0 (0.0%) | 0 (0.0%) |
| High School Diploma | 0 (0.0%) | 11 (100.0%) |
| College or Associate's Degree | 0 (0.0%) | 0 (0.0%) |
| Bachelor's Degree | 0 (0.0%) | 0 (0.0%) |
| Graduate Degree | 0 (0.0%) | 0 (0.0%) |
| Total | 0 (0.0%) | 11 (100.0%) |
Employment Characteristics in Fort Edward
Employment by Class of Employer in Fort Edward
Among the 1,690 employed individuals in Fort Edward, private company employees (1,284 | 76.0%), not-for-profit organizations (191 | 11.3%), and local government employees (98 | 5.8%) make up the most common classes of employment.
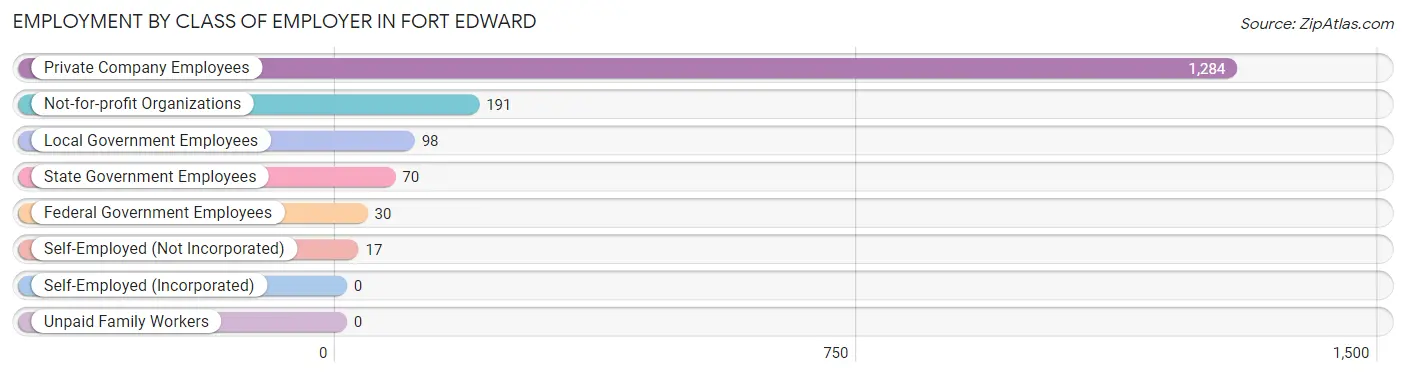
| Employer Class | # Employees | % Employees |
| Private Company Employees | 1,284 | 76.0% |
| Self-Employed (Incorporated) | 0 | 0.0% |
| Self-Employed (Not Incorporated) | 17 | 1.0% |
| Not-for-profit Organizations | 191 | 11.3% |
| Local Government Employees | 98 | 5.8% |
| State Government Employees | 70 | 4.1% |
| Federal Government Employees | 30 | 1.8% |
| Unpaid Family Workers | 0 | 0.0% |
| Total | 1,690 | 100.0% |
Employment Status by Age in Fort Edward
According to the labor force statistics for Fort Edward, out of the total population over 16 years of age (2,542), 70.6% or 1,795 individuals are in the labor force, with 2.0% or 36 of them unemployed. The age group with the highest labor force participation rate is 20 to 24 years, with 100.0% or 186 individuals in the labor force. Within the labor force, the 35 to 44 years age range has the highest percentage of unemployed individuals, with 9.5% or 23 of them being unemployed.
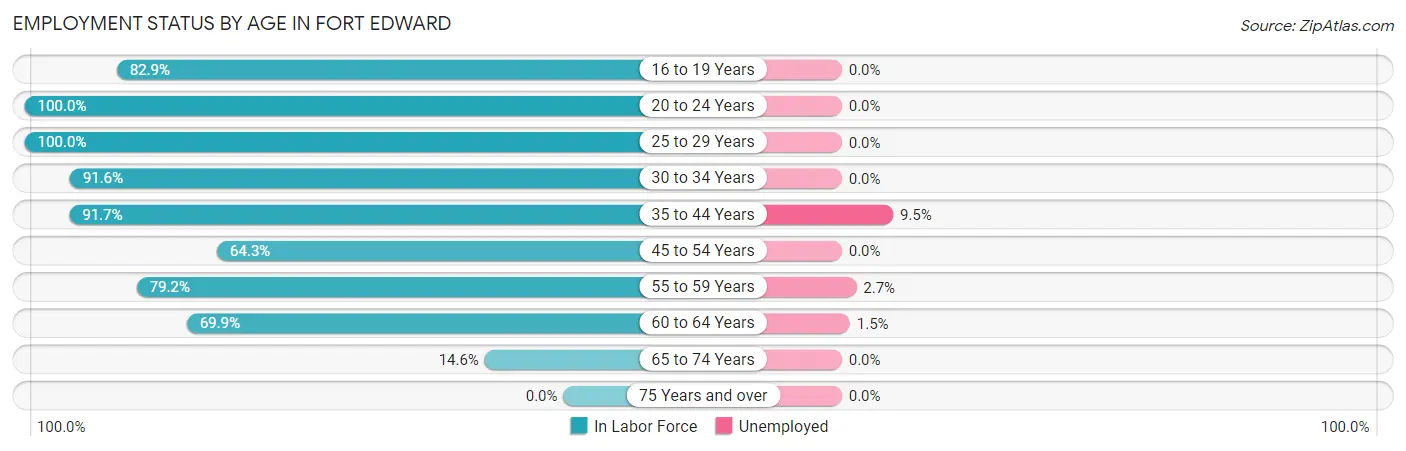
| Age Bracket | In Labor Force | Unemployed |
| 16 to 19 Years | 204 (82.9%) | 0 (0.0%) |
| 20 to 24 Years | 186 (100.0%) | 0 (0.0%) |
| 25 to 29 Years | 105 (100.0%) | 0 (0.0%) |
| 30 to 34 Years | 239 (91.6%) | 0 (0.0%) |
| 35 to 44 Years | 242 (91.7%) | 23 (9.5%) |
| 45 to 54 Years | 272 (64.3%) | 0 (0.0%) |
| 55 to 59 Years | 369 (79.2%) | 10 (2.7%) |
| 60 to 64 Years | 137 (69.9%) | 2 (1.5%) |
| 65 to 74 Years | 41 (14.6%) | 0 (0.0%) |
| 75 Years and over | 0 (0.0%) | 0 (0.0%) |
| Total | 1,795 (70.6%) | 36 (2.0%) |
Employment Status by Educational Attainment in Fort Edward
According to labor force statistics for Fort Edward, 79.5% of individuals (1,363) out of the total population between 25 and 64 years of age (1,715) are in the labor force, with 2.6% or 35 of them being unemployed. The group with the highest labor force participation rate are those with the educational attainment of bachelor's degree or higher, with 90.0% or 288 individuals in the labor force. Within the labor force, individuals with less than high school education have the highest percentage of unemployment, with 5.7% or 2 of them being unemployed.
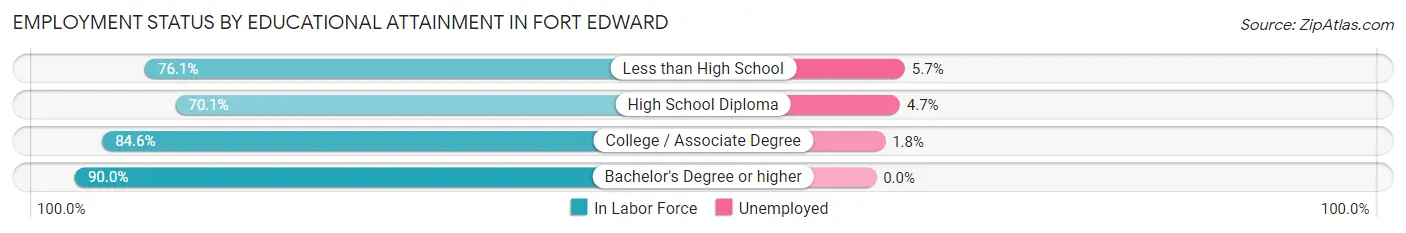
| Educational Attainment | In Labor Force | Unemployed |
| Less than High School | 35 (76.1%) | 3 (5.7%) |
| High School Diploma | 485 (70.1%) | 33 (4.7%) |
| College / Associate Degree | 556 (84.6%) | 12 (1.8%) |
| Bachelor's Degree or higher | 288 (90.0%) | 0 (0.0%) |
| Total | 1,363 (79.5%) | 45 (2.6%) |
Employment Occupations by Sex in Fort Edward
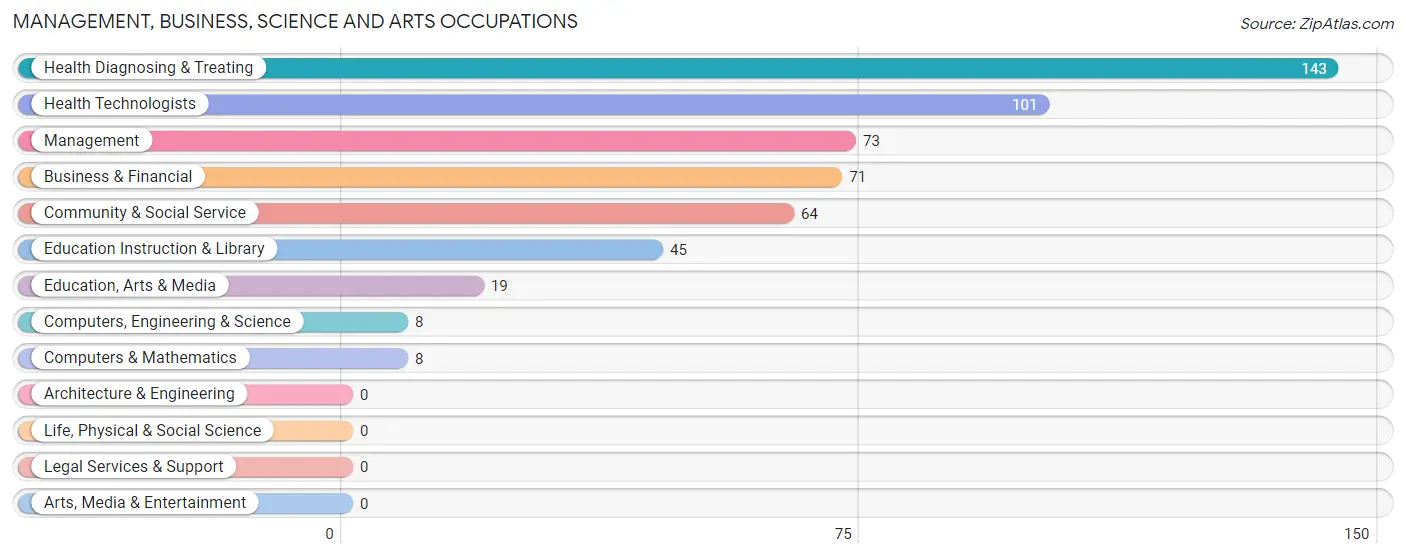
Management, Business, Science and Arts Occupations
The most common Management, Business, Science and Arts occupations in Fort Edward are Health Diagnosing & Treating (143 | 8.2%), Health Technologists (101 | 5.8%), Management (73 | 4.2%), Business & Financial (71 | 4.1%), and Community & Social Service (64 | 3.7%).
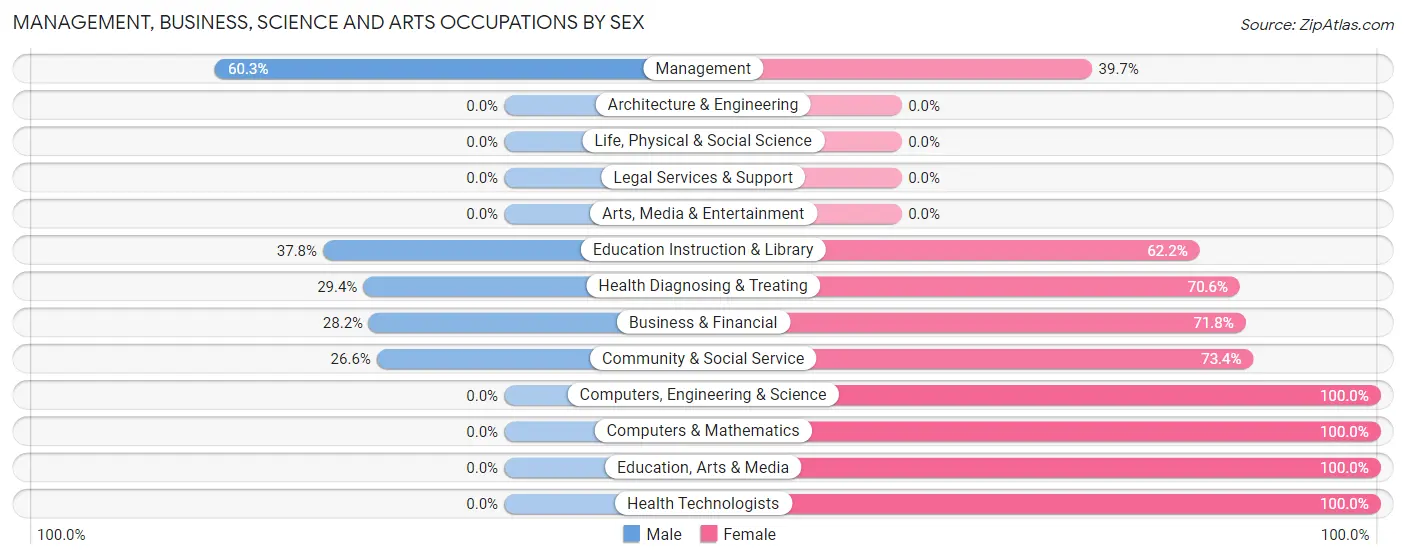
Management, Business, Science and Arts Occupations by Sex
Within the Management, Business, Science and Arts occupations in Fort Edward, the most male-oriented occupations are Management (60.3%), Education Instruction & Library (37.8%), and Health Diagnosing & Treating (29.4%), while the most female-oriented occupations are Computers, Engineering & Science (100.0%), Computers & Mathematics (100.0%), and Education, Arts & Media (100.0%).
| Occupation | Male | Female |
| Management | 44 (60.3%) | 29 (39.7%) |
| Business & Financial | 20 (28.2%) | 51 (71.8%) |
| Computers, Engineering & Science | 0 (0.0%) | 8 (100.0%) |
| Computers & Mathematics | 0 (0.0%) | 8 (100.0%) |
| Architecture & Engineering | 0 (0.0%) | 0 (0.0%) |
| Life, Physical & Social Science | 0 (0.0%) | 0 (0.0%) |
| Community & Social Service | 17 (26.6%) | 47 (73.4%) |
| Education, Arts & Media | 0 (0.0%) | 19 (100.0%) |
| Legal Services & Support | 0 (0.0%) | 0 (0.0%) |
| Education Instruction & Library | 17 (37.8%) | 28 (62.2%) |
| Arts, Media & Entertainment | 0 (0.0%) | 0 (0.0%) |
| Health Diagnosing & Treating | 42 (29.4%) | 101 (70.6%) |
| Health Technologists | 0 (0.0%) | 101 (100.0%) |
| Total (Category) | 123 (34.3%) | 236 (65.7%) |
| Total (Overall) | 829 (47.4%) | 920 (52.6%) |
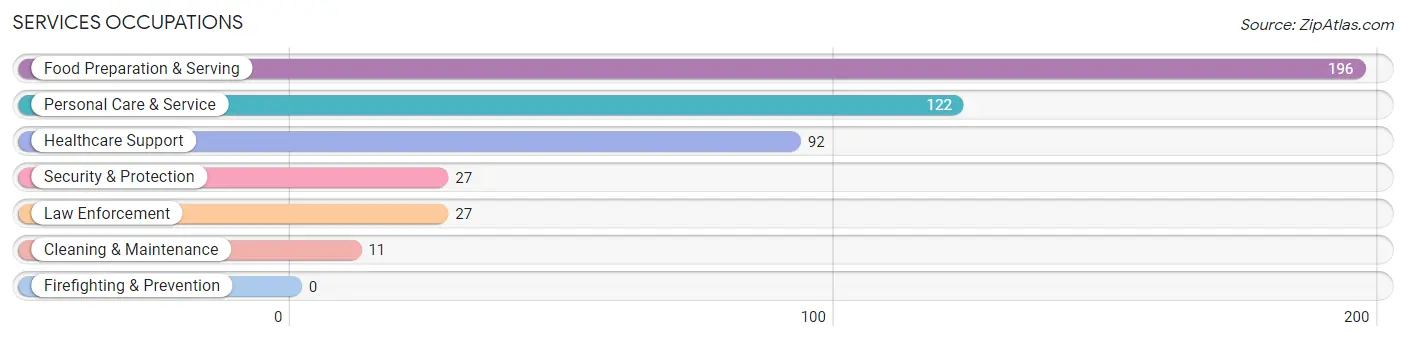
Services Occupations
The most common Services occupations in Fort Edward are Food Preparation & Serving (196 | 11.2%), Personal Care & Service (122 | 7.0%), Healthcare Support (92 | 5.3%), Security & Protection (27 | 1.5%), and Law Enforcement (27 | 1.5%).
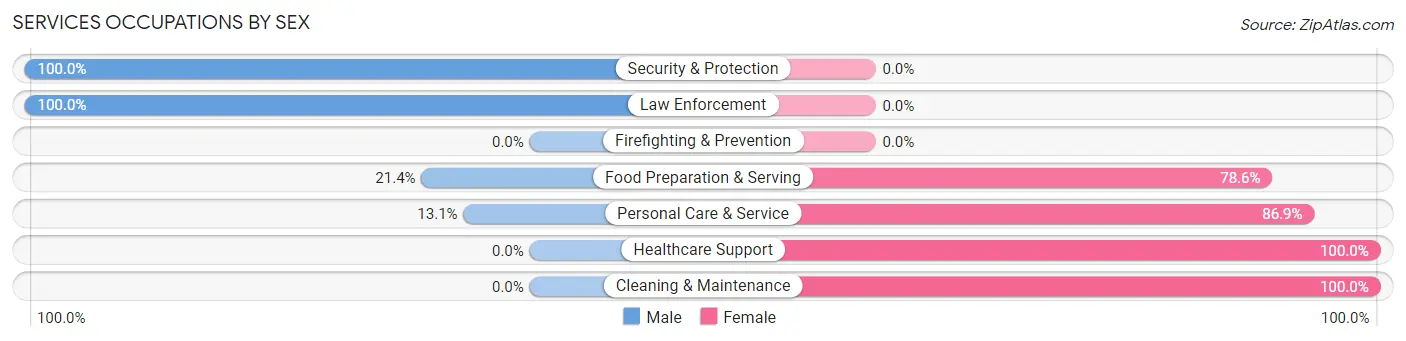
Services Occupations by Sex
Within the Services occupations in Fort Edward, the most male-oriented occupations are Security & Protection (100.0%), Law Enforcement (100.0%), and Food Preparation & Serving (21.4%), while the most female-oriented occupations are Healthcare Support (100.0%), Cleaning & Maintenance (100.0%), and Personal Care & Service (86.9%).
| Occupation | Male | Female |
| Healthcare Support | 0 (0.0%) | 92 (100.0%) |
| Security & Protection | 27 (100.0%) | 0 (0.0%) |
| Firefighting & Prevention | 0 (0.0%) | 0 (0.0%) |
| Law Enforcement | 27 (100.0%) | 0 (0.0%) |
| Food Preparation & Serving | 42 (21.4%) | 154 (78.6%) |
| Cleaning & Maintenance | 0 (0.0%) | 11 (100.0%) |
| Personal Care & Service | 16 (13.1%) | 106 (86.9%) |
| Total (Category) | 85 (19.0%) | 363 (81.0%) |
| Total (Overall) | 829 (47.4%) | 920 (52.6%) |
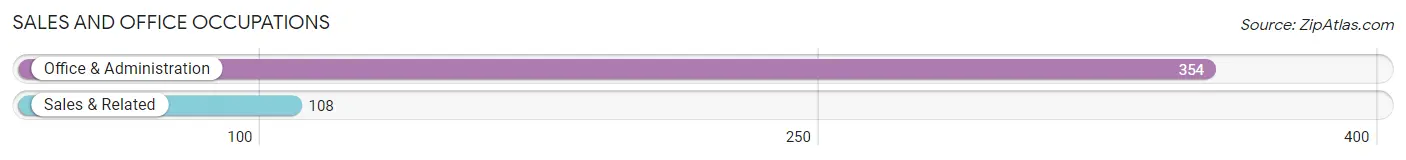
Sales and Office Occupations
The most common Sales and Office occupations in Fort Edward are Office & Administration (354 | 20.2%), and Sales & Related (108 | 6.2%).
Sales and Office Occupations by Sex
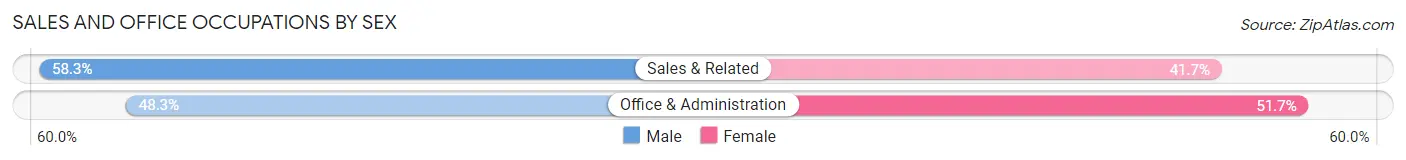
| Occupation | Male | Female |
| Sales & Related | 63 (58.3%) | 45 (41.7%) |
| Office & Administration | 171 (48.3%) | 183 (51.7%) |
| Total (Category) | 234 (50.6%) | 228 (49.3%) |
| Total (Overall) | 829 (47.4%) | 920 (52.6%) |
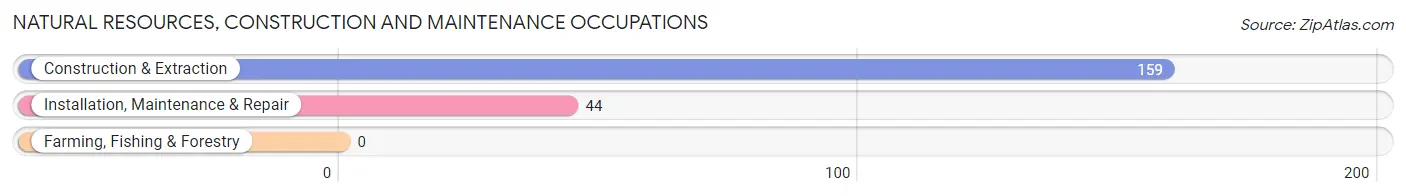
Natural Resources, Construction and Maintenance Occupations
The most common Natural Resources, Construction and Maintenance occupations in Fort Edward are Construction & Extraction (159 | 9.1%), and Installation, Maintenance & Repair (44 | 2.5%).
Natural Resources, Construction and Maintenance Occupations by Sex
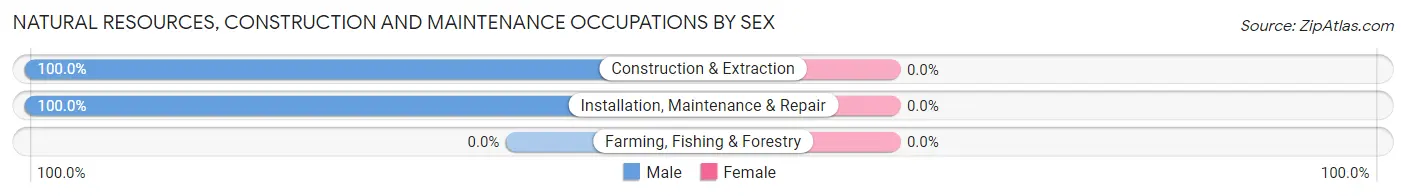
| Occupation | Male | Female |
| Farming, Fishing & Forestry | 0 (0.0%) | 0 (0.0%) |
| Construction & Extraction | 159 (100.0%) | 0 (0.0%) |
| Installation, Maintenance & Repair | 44 (100.0%) | 0 (0.0%) |
| Total (Category) | 203 (100.0%) | 0 (0.0%) |
| Total (Overall) | 829 (47.4%) | 920 (52.6%) |
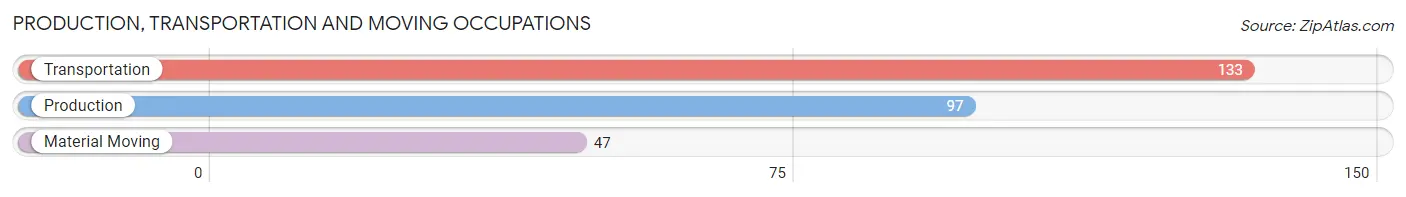
Production, Transportation and Moving Occupations
The most common Production, Transportation and Moving occupations in Fort Edward are Transportation (133 | 7.6%), Production (97 | 5.6%), and Material Moving (47 | 2.7%).
Production, Transportation and Moving Occupations by Sex
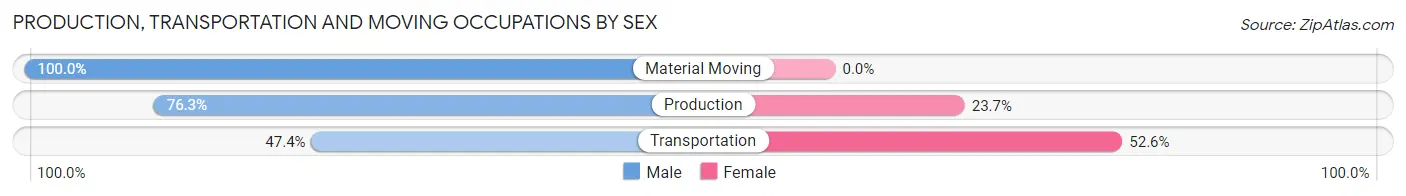
| Occupation | Male | Female |
| Production | 74 (76.3%) | 23 (23.7%) |
| Transportation | 63 (47.4%) | 70 (52.6%) |
| Material Moving | 47 (100.0%) | 0 (0.0%) |
| Total (Category) | 184 (66.4%) | 93 (33.6%) |
| Total (Overall) | 829 (47.4%) | 920 (52.6%) |
Employment Industries by Sex in Fort Edward
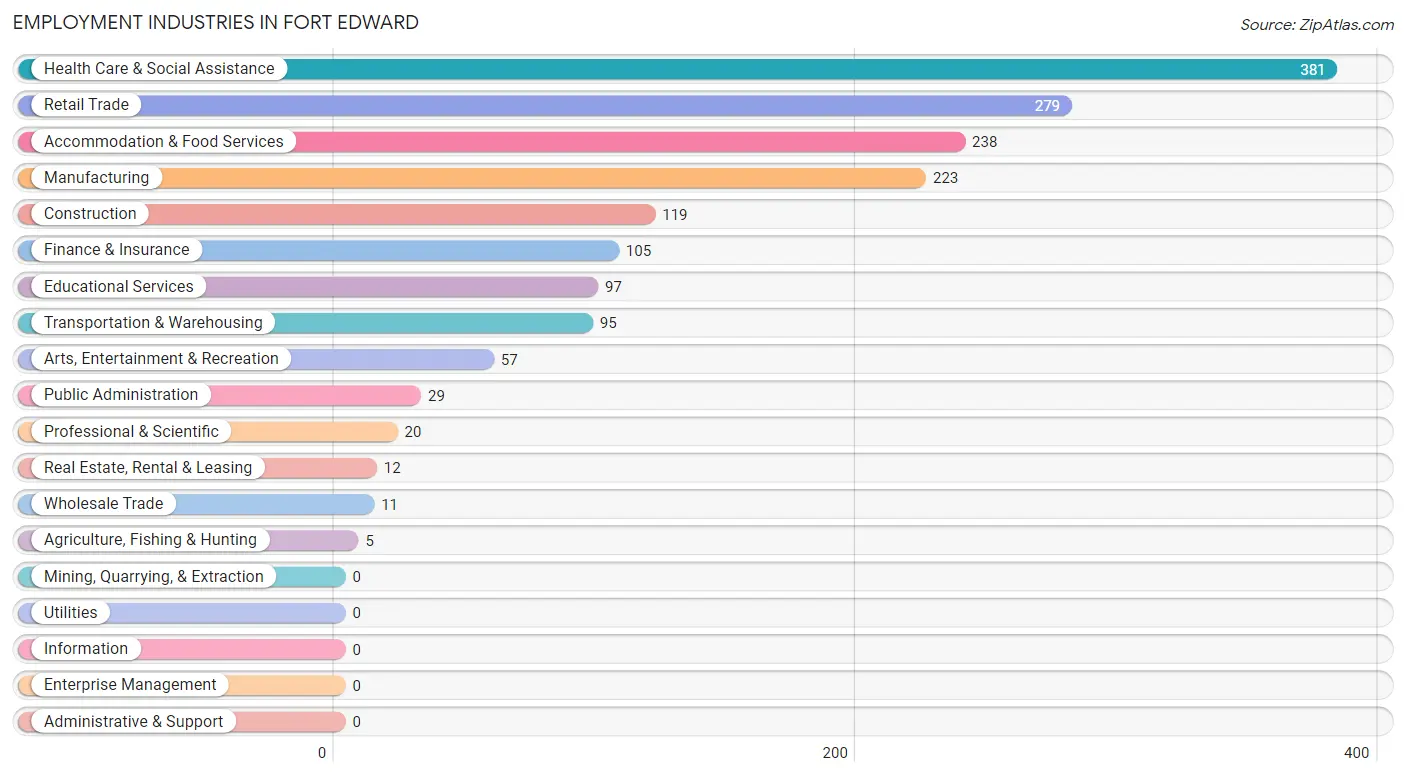
Employment Industries in Fort Edward
The major employment industries in Fort Edward include Health Care & Social Assistance (381 | 21.8%), Retail Trade (279 | 16.0%), Accommodation & Food Services (238 | 13.6%), Manufacturing (223 | 12.8%), and Construction (119 | 6.8%).
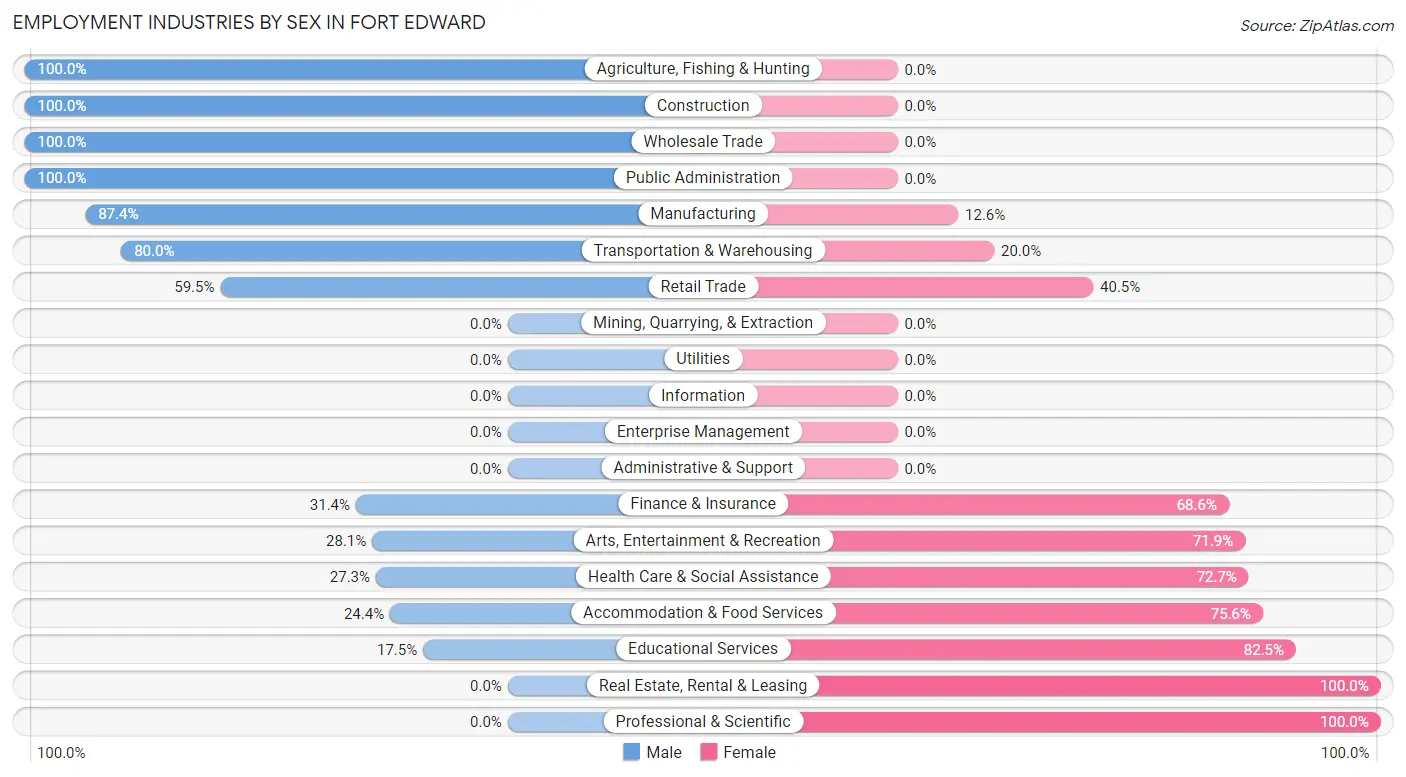
Employment Industries by Sex in Fort Edward
The Fort Edward industries that see more men than women are Agriculture, Fishing & Hunting (100.0%), Construction (100.0%), and Wholesale Trade (100.0%), whereas the industries that tend to have a higher number of women are Real Estate, Rental & Leasing (100.0%), Professional & Scientific (100.0%), and Educational Services (82.5%).
| Industry | Male | Female |
| Agriculture, Fishing & Hunting | 5 (100.0%) | 0 (0.0%) |
| Mining, Quarrying, & Extraction | 0 (0.0%) | 0 (0.0%) |
| Construction | 119 (100.0%) | 0 (0.0%) |
| Manufacturing | 195 (87.4%) | 28 (12.6%) |
| Wholesale Trade | 11 (100.0%) | 0 (0.0%) |
| Retail Trade | 166 (59.5%) | 113 (40.5%) |
| Transportation & Warehousing | 76 (80.0%) | 19 (20.0%) |
| Utilities | 0 (0.0%) | 0 (0.0%) |
| Information | 0 (0.0%) | 0 (0.0%) |
| Finance & Insurance | 33 (31.4%) | 72 (68.6%) |
| Real Estate, Rental & Leasing | 0 (0.0%) | 12 (100.0%) |
| Professional & Scientific | 0 (0.0%) | 20 (100.0%) |
| Enterprise Management | 0 (0.0%) | 0 (0.0%) |
| Administrative & Support | 0 (0.0%) | 0 (0.0%) |
| Educational Services | 17 (17.5%) | 80 (82.5%) |
| Health Care & Social Assistance | 104 (27.3%) | 277 (72.7%) |
| Arts, Entertainment & Recreation | 16 (28.1%) | 41 (71.9%) |
| Accommodation & Food Services | 58 (24.4%) | 180 (75.6%) |
| Public Administration | 29 (100.0%) | 0 (0.0%) |
| Total | 829 (47.4%) | 920 (52.6%) |
Education in Fort Edward
School Enrollment in Fort Edward
The most common levels of schooling among the 645 students in Fort Edward are middle school (212 | 32.9%), elementary school (191 | 29.6%), and high school (97 | 15.0%).
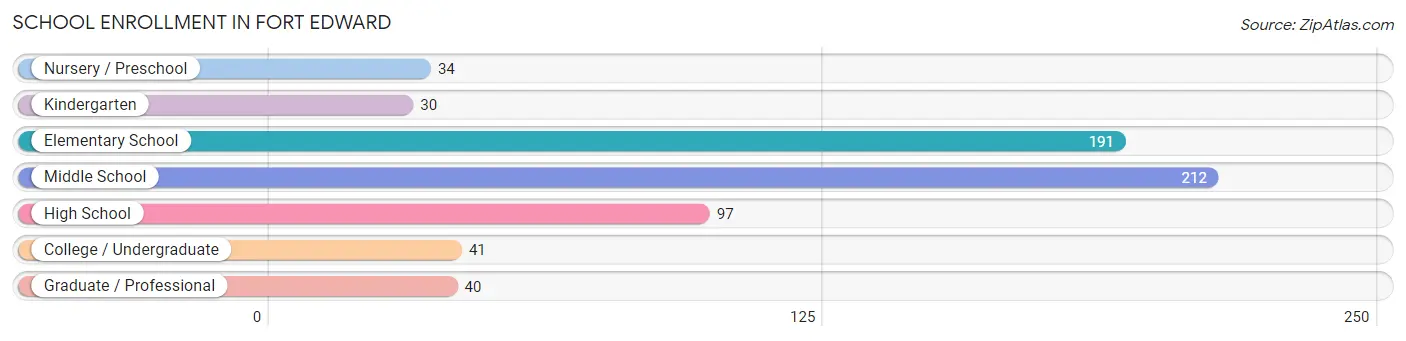
| School Level | # Students | % Students |
| Nursery / Preschool | 34 | 5.3% |
| Kindergarten | 30 | 4.6% |
| Elementary School | 191 | 29.6% |
| Middle School | 212 | 32.9% |
| High School | 97 | 15.0% |
| College / Undergraduate | 41 | 6.4% |
| Graduate / Professional | 40 | 6.2% |
| Total | 645 | 100.0% |
School Enrollment by Age by Funding Source in Fort Edward
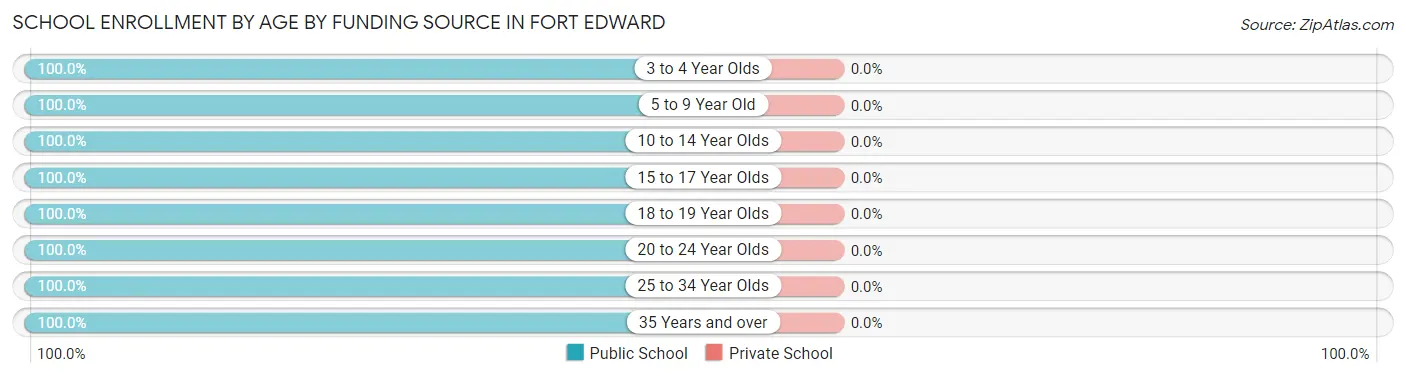
| Age Bracket | Public School | Private School |
| 3 to 4 Year Olds | 34 (100.0%) | 0 (0.0%) |
| 5 to 9 Year Old | 177 (100.0%) | 0 (0.0%) |
| 10 to 14 Year Olds | 267 (100.0%) | 0 (0.0%) |
| 15 to 17 Year Olds | 63 (100.0%) | 0 (0.0%) |
| 18 to 19 Year Olds | 48 (100.0%) | 0 (0.0%) |
| 20 to 24 Year Olds | 16 (100.0%) | 0 (0.0%) |
| 25 to 34 Year Olds | 32 (100.0%) | 0 (0.0%) |
| 35 Years and over | 8 (100.0%) | 0 (0.0%) |
| Total | 645 (100.0%) | 0 (0.0%) |
Educational Attainment by Field of Study in Fort Edward
Science & technology (124 | 34.6%), business (116 | 32.4%), education (56 | 15.6%), arts & humanities (30 | 8.4%), and psychology (17 | 4.8%) are the most common fields of study among 358 individuals in Fort Edward who have obtained a bachelor's degree or higher.
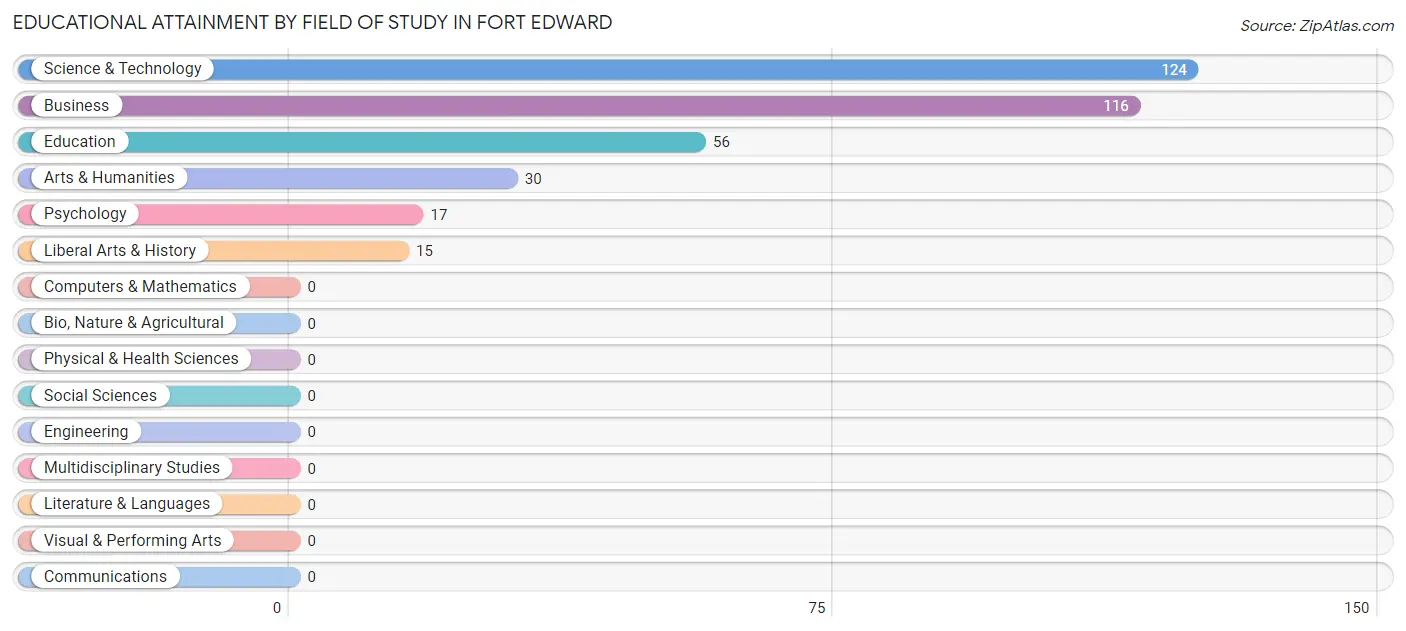
| Field of Study | # Graduates | % Graduates |
| Computers & Mathematics | 0 | 0.0% |
| Bio, Nature & Agricultural | 0 | 0.0% |
| Physical & Health Sciences | 0 | 0.0% |
| Psychology | 17 | 4.8% |
| Social Sciences | 0 | 0.0% |
| Engineering | 0 | 0.0% |
| Multidisciplinary Studies | 0 | 0.0% |
| Science & Technology | 124 | 34.6% |
| Business | 116 | 32.4% |
| Education | 56 | 15.6% |
| Literature & Languages | 0 | 0.0% |
| Liberal Arts & History | 15 | 4.2% |
| Visual & Performing Arts | 0 | 0.0% |
| Communications | 0 | 0.0% |
| Arts & Humanities | 30 | 8.4% |
| Total | 358 | 100.0% |
Transportation & Commute in Fort Edward
Vehicle Availability by Sex in Fort Edward
The most prevalent vehicle ownership categories in Fort Edward are males with 3 vehicles (268, accounting for 32.2%) and females with 3 vehicles (64, making up 31.3%).
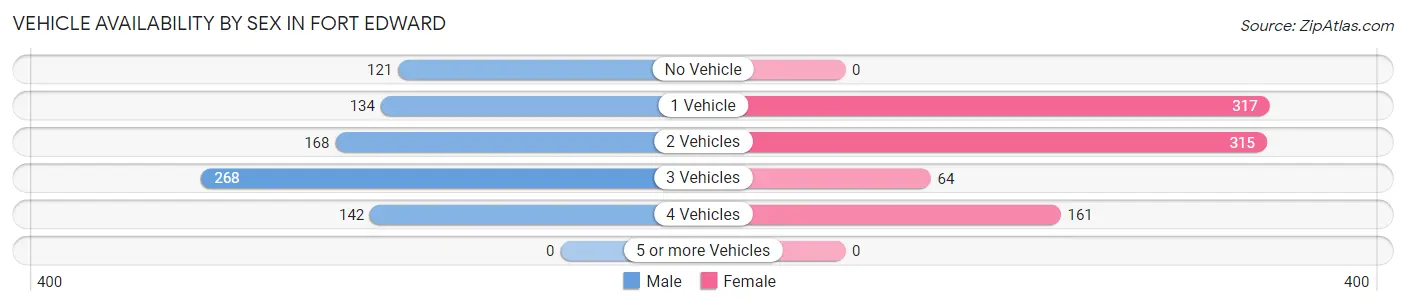
| Vehicles Available | Male | Female |
| No Vehicle | 121 (14.5%) | 0 (0.0%) |
| 1 Vehicle | 134 (16.1%) | 317 (37.0%) |
| 2 Vehicles | 168 (20.2%) | 315 (36.8%) |
| 3 Vehicles | 268 (32.2%) | 64 (7.5%) |
| 4 Vehicles | 142 (17.1%) | 161 (18.8%) |
| 5 or more Vehicles | 0 (0.0%) | 0 (0.0%) |
| Total | 833 (100.0%) | 857 (100.0%) |
Commute Time in Fort Edward
The most frequently occuring commute durations in Fort Edward are 15 to 19 minutes (410 commuters, 26.0%), 20 to 24 minutes (259 commuters, 16.4%), and 5 to 9 minutes (215 commuters, 13.6%).
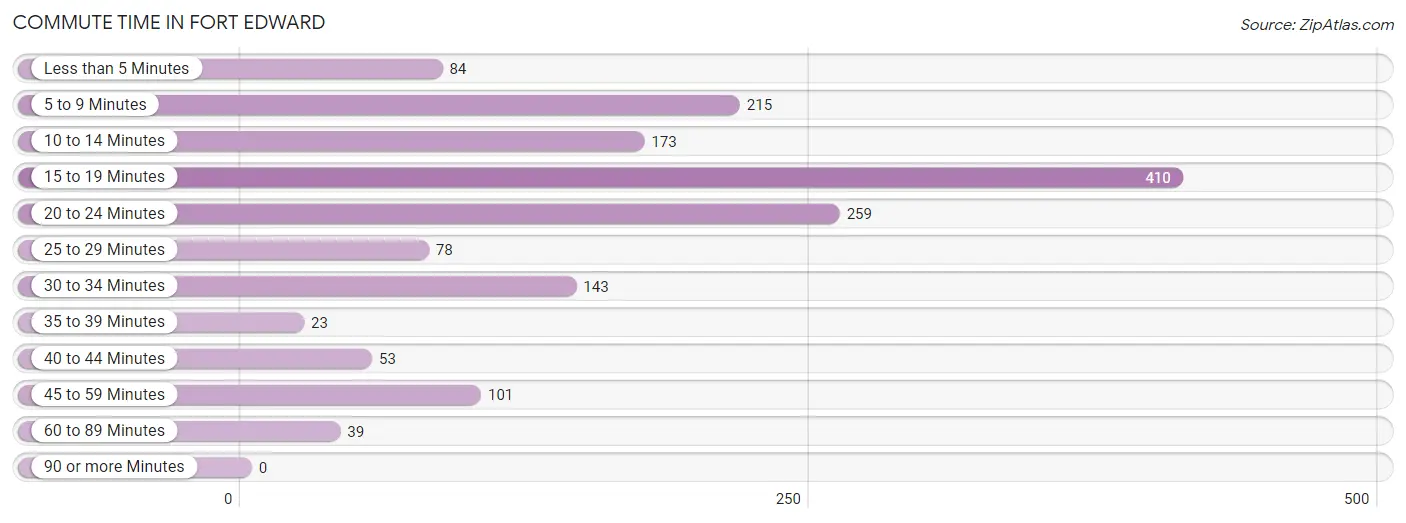
| Commute Time | # Commuters | % Commuters |
| Less than 5 Minutes | 84 | 5.3% |
| 5 to 9 Minutes | 215 | 13.6% |
| 10 to 14 Minutes | 173 | 11.0% |
| 15 to 19 Minutes | 410 | 26.0% |
| 20 to 24 Minutes | 259 | 16.4% |
| 25 to 29 Minutes | 78 | 4.9% |
| 30 to 34 Minutes | 143 | 9.1% |
| 35 to 39 Minutes | 23 | 1.5% |
| 40 to 44 Minutes | 53 | 3.4% |
| 45 to 59 Minutes | 101 | 6.4% |
| 60 to 89 Minutes | 39 | 2.5% |
| 90 or more Minutes | 0 | 0.0% |
Commute Time by Sex in Fort Edward
The most common commute times in Fort Edward are 20 to 24 minutes (177 commuters, 22.3%) for males and 15 to 19 minutes (266 commuters, 34.0%) for females.
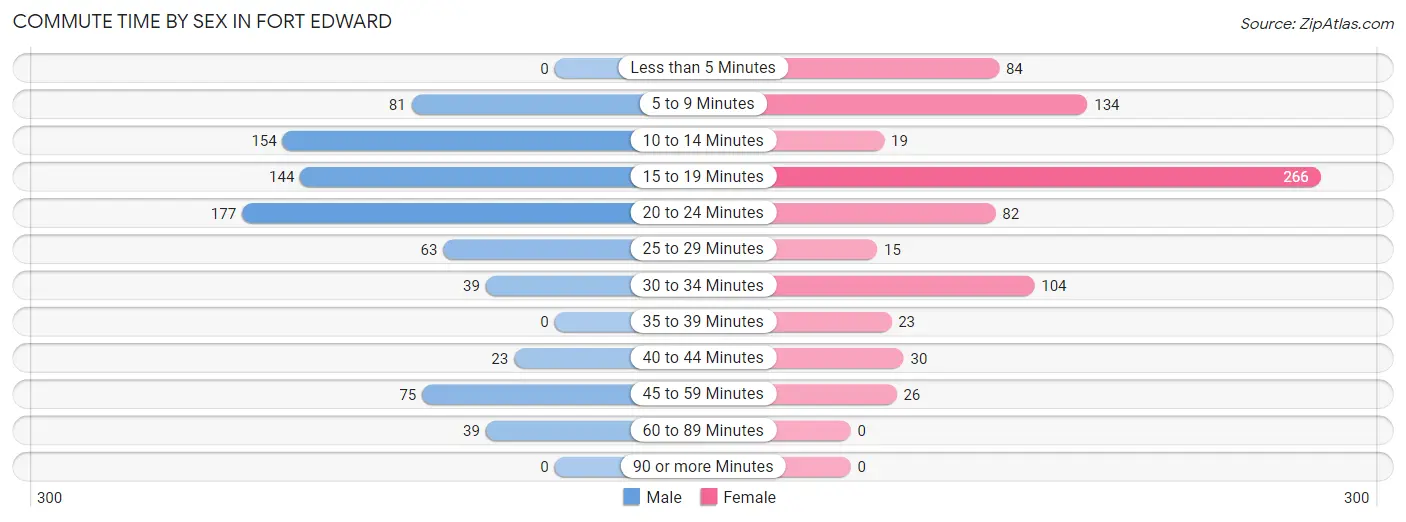
| Commute Time | Male | Female |
| Less than 5 Minutes | 0 (0.0%) | 84 (10.7%) |
| 5 to 9 Minutes | 81 (10.2%) | 134 (17.1%) |
| 10 to 14 Minutes | 154 (19.4%) | 19 (2.4%) |
| 15 to 19 Minutes | 144 (18.1%) | 266 (34.0%) |
| 20 to 24 Minutes | 177 (22.3%) | 82 (10.5%) |
| 25 to 29 Minutes | 63 (7.9%) | 15 (1.9%) |
| 30 to 34 Minutes | 39 (4.9%) | 104 (13.3%) |
| 35 to 39 Minutes | 0 (0.0%) | 23 (2.9%) |
| 40 to 44 Minutes | 23 (2.9%) | 30 (3.8%) |
| 45 to 59 Minutes | 75 (9.4%) | 26 (3.3%) |
| 60 to 89 Minutes | 39 (4.9%) | 0 (0.0%) |
| 90 or more Minutes | 0 (0.0%) | 0 (0.0%) |
Time of Departure to Work by Sex in Fort Edward
The most frequent times of departure to work in Fort Edward are 7:00 AM to 7:29 AM (160, 20.1%) for males and 7:30 AM to 7:59 AM (280, 35.8%) for females.
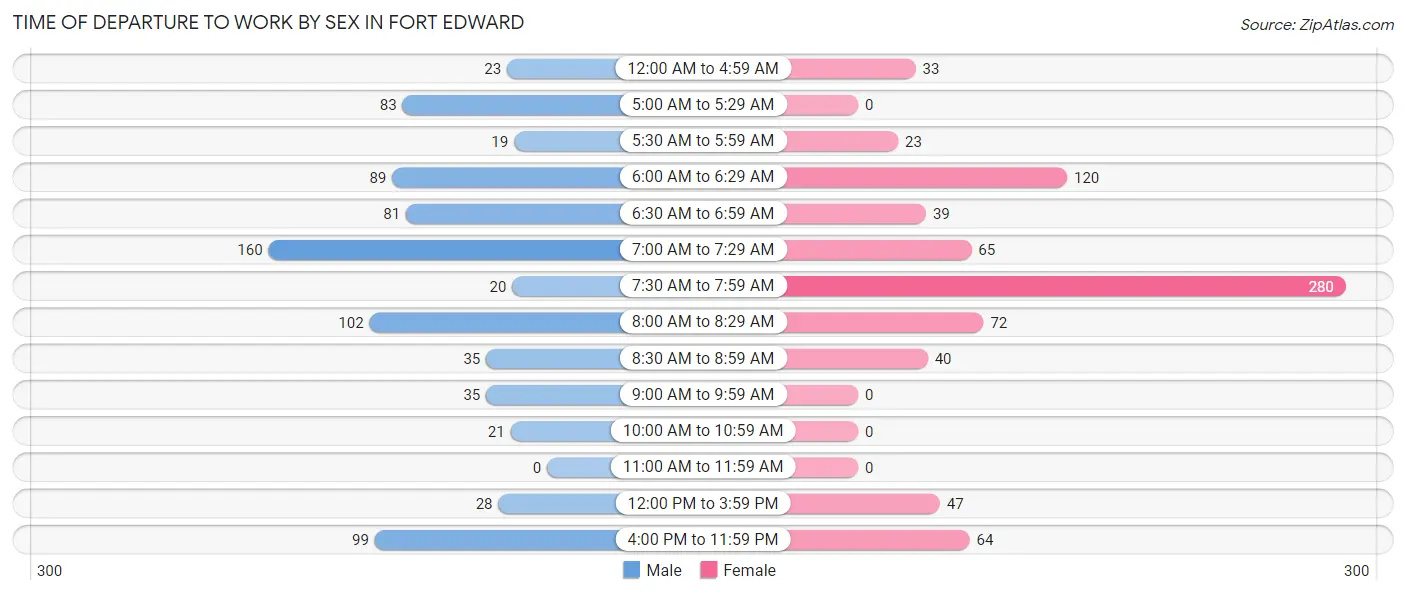
| Time of Departure | Male | Female |
| 12:00 AM to 4:59 AM | 23 (2.9%) | 33 (4.2%) |
| 5:00 AM to 5:29 AM | 83 (10.4%) | 0 (0.0%) |
| 5:30 AM to 5:59 AM | 19 (2.4%) | 23 (2.9%) |
| 6:00 AM to 6:29 AM | 89 (11.2%) | 120 (15.3%) |
| 6:30 AM to 6:59 AM | 81 (10.2%) | 39 (5.0%) |
| 7:00 AM to 7:29 AM | 160 (20.1%) | 65 (8.3%) |
| 7:30 AM to 7:59 AM | 20 (2.5%) | 280 (35.8%) |
| 8:00 AM to 8:29 AM | 102 (12.8%) | 72 (9.2%) |
| 8:30 AM to 8:59 AM | 35 (4.4%) | 40 (5.1%) |
| 9:00 AM to 9:59 AM | 35 (4.4%) | 0 (0.0%) |
| 10:00 AM to 10:59 AM | 21 (2.6%) | 0 (0.0%) |
| 11:00 AM to 11:59 AM | 0 (0.0%) | 0 (0.0%) |
| 12:00 PM to 3:59 PM | 28 (3.5%) | 47 (6.0%) |
| 4:00 PM to 11:59 PM | 99 (12.4%) | 64 (8.2%) |
| Total | 795 (100.0%) | 783 (100.0%) |
Housing Occupancy in Fort Edward
Occupancy by Ownership in Fort Edward
Of the total 1,331 dwellings in Fort Edward, owner-occupied units account for 868 (65.2%), while renter-occupied units make up 463 (34.8%).
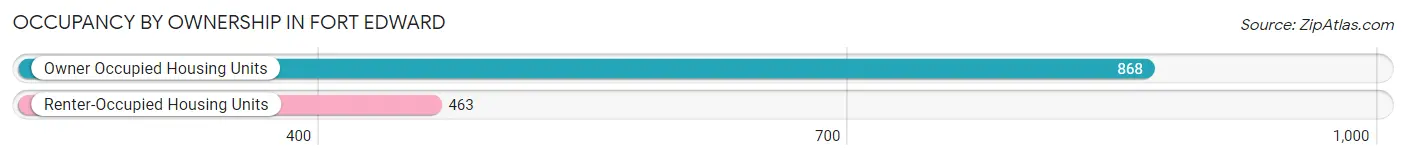
| Occupancy | # Housing Units | % Housing Units |
| Owner Occupied Housing Units | 868 | 65.2% |
| Renter-Occupied Housing Units | 463 | 34.8% |
| Total Occupied Housing Units | 1,331 | 100.0% |
Occupancy by Household Size in Fort Edward
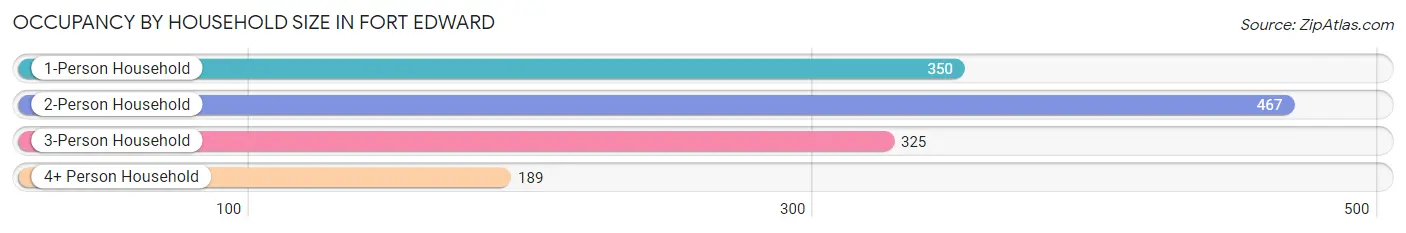
| Household Size | # Housing Units | % Housing Units |
| 1-Person Household | 350 | 26.3% |
| 2-Person Household | 467 | 35.1% |
| 3-Person Household | 325 | 24.4% |
| 4+ Person Household | 189 | 14.2% |
| Total Housing Units | 1,331 | 100.0% |
Occupancy by Ownership by Household Size in Fort Edward
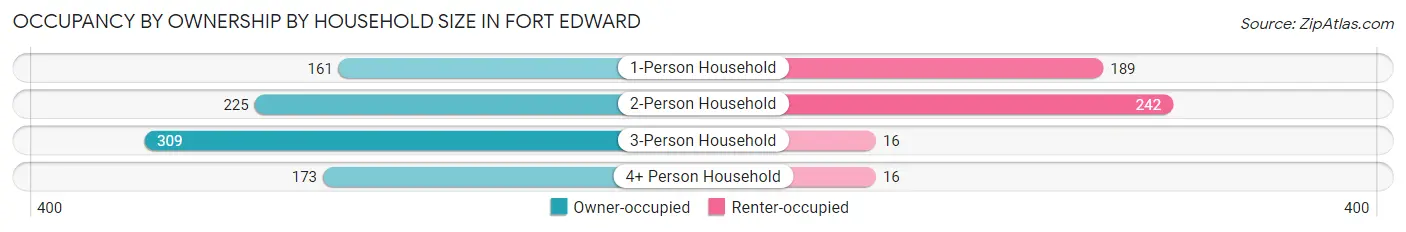
| Household Size | Owner-occupied | Renter-occupied |
| 1-Person Household | 161 (46.0%) | 189 (54.0%) |
| 2-Person Household | 225 (48.2%) | 242 (51.8%) |
| 3-Person Household | 309 (95.1%) | 16 (4.9%) |
| 4+ Person Household | 173 (91.5%) | 16 (8.5%) |
| Total Housing Units | 868 (65.2%) | 463 (34.8%) |
Occupancy by Educational Attainment in Fort Edward
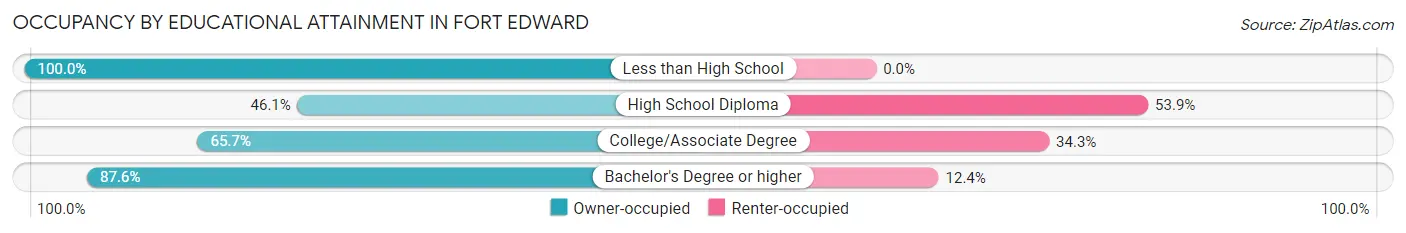
| Household Size | Owner-occupied | Renter-occupied |
| Less than High School | 47 (100.0%) | 0 (0.0%) |
| High School Diploma | 211 (46.1%) | 247 (53.9%) |
| College/Associate Degree | 341 (65.7%) | 178 (34.3%) |
| Bachelor's Degree or higher | 269 (87.6%) | 38 (12.4%) |
Occupancy by Age of Householder in Fort Edward
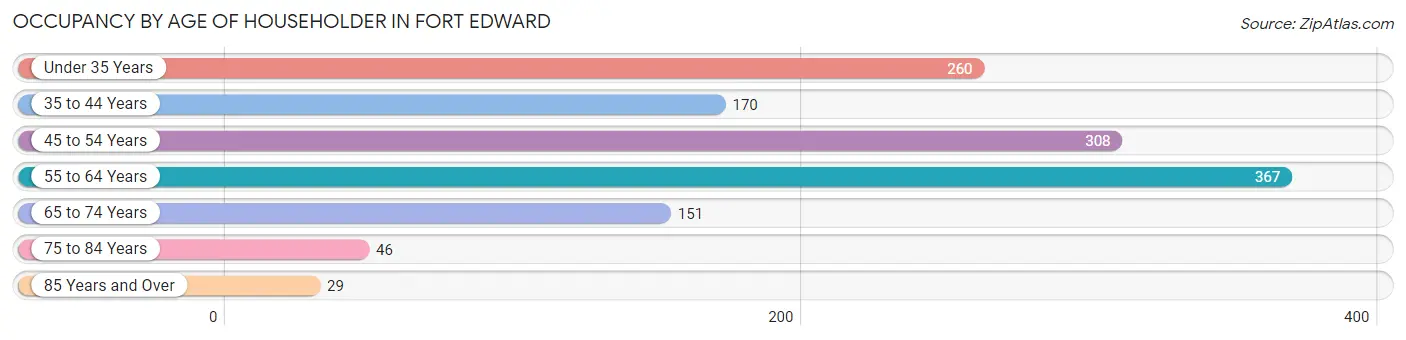
| Age Bracket | # Households | % Households |
| Under 35 Years | 260 | 19.5% |
| 35 to 44 Years | 170 | 12.8% |
| 45 to 54 Years | 308 | 23.1% |
| 55 to 64 Years | 367 | 27.6% |
| 65 to 74 Years | 151 | 11.3% |
| 75 to 84 Years | 46 | 3.5% |
| 85 Years and Over | 29 | 2.2% |
| Total | 1,331 | 100.0% |
Housing Finances in Fort Edward
Median Income by Occupancy in Fort Edward
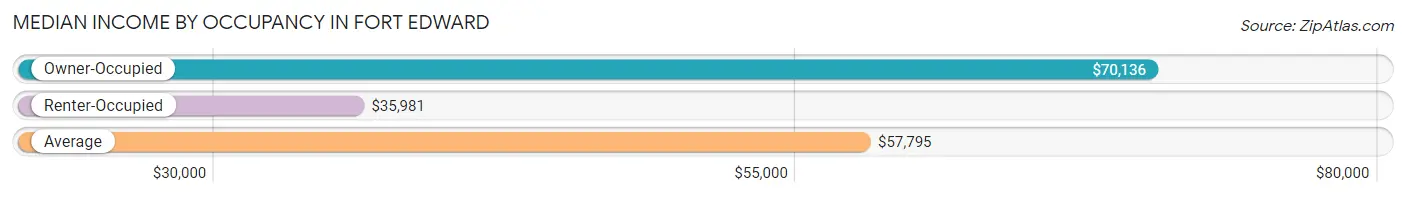
| Occupancy Type | # Households | Median Income |
| Owner-Occupied | 868 (65.2%) | $70,136 |
| Renter-Occupied | 463 (34.8%) | $35,981 |
| Average | 1,331 (100.0%) | $57,795 |
Occupancy by Householder Income Bracket in Fort Edward
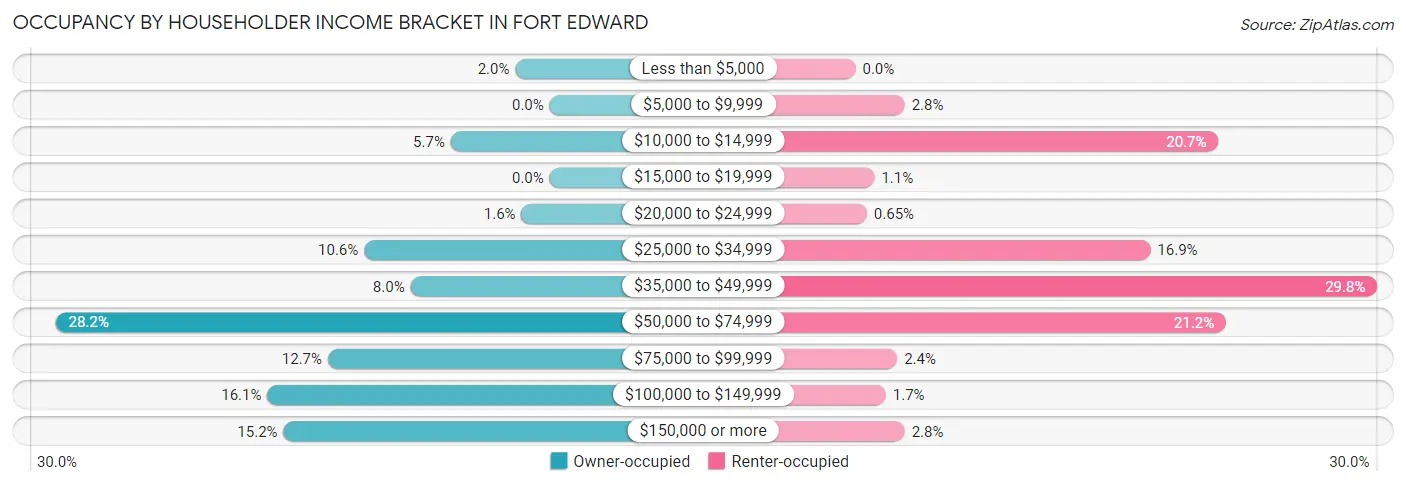
| Income Bracket | Owner-occupied | Renter-occupied |
| Less than $5,000 | 17 (2.0%) | 0 (0.0%) |
| $5,000 to $9,999 | 0 (0.0%) | 13 (2.8%) |
| $10,000 to $14,999 | 49 (5.7%) | 96 (20.7%) |
| $15,000 to $19,999 | 0 (0.0%) | 5 (1.1%) |
| $20,000 to $24,999 | 14 (1.6%) | 3 (0.6%) |
| $25,000 to $34,999 | 92 (10.6%) | 78 (16.9%) |
| $35,000 to $49,999 | 69 (8.0%) | 138 (29.8%) |
| $50,000 to $74,999 | 245 (28.2%) | 98 (21.2%) |
| $75,000 to $99,999 | 110 (12.7%) | 11 (2.4%) |
| $100,000 to $149,999 | 140 (16.1%) | 8 (1.7%) |
| $150,000 or more | 132 (15.2%) | 13 (2.8%) |
| Total | 868 (100.0%) | 463 (100.0%) |
Monthly Housing Cost Tiers in Fort Edward
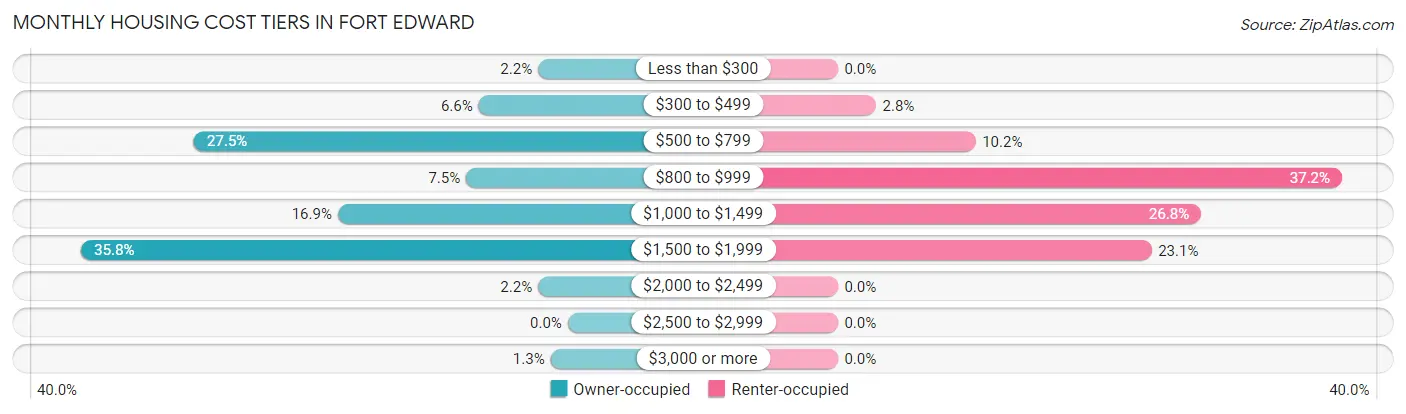
| Monthly Cost | Owner-occupied | Renter-occupied |
| Less than $300 | 19 (2.2%) | 0 (0.0%) |
| $300 to $499 | 57 (6.6%) | 13 (2.8%) |
| $500 to $799 | 239 (27.5%) | 47 (10.2%) |
| $800 to $999 | 65 (7.5%) | 172 (37.1%) |
| $1,000 to $1,499 | 147 (16.9%) | 124 (26.8%) |
| $1,500 to $1,999 | 311 (35.8%) | 107 (23.1%) |
| $2,000 to $2,499 | 19 (2.2%) | 0 (0.0%) |
| $2,500 to $2,999 | 0 (0.0%) | 0 (0.0%) |
| $3,000 or more | 11 (1.3%) | 0 (0.0%) |
| Total | 868 (100.0%) | 463 (100.0%) |
Physical Housing Characteristics in Fort Edward
Housing Structures in Fort Edward
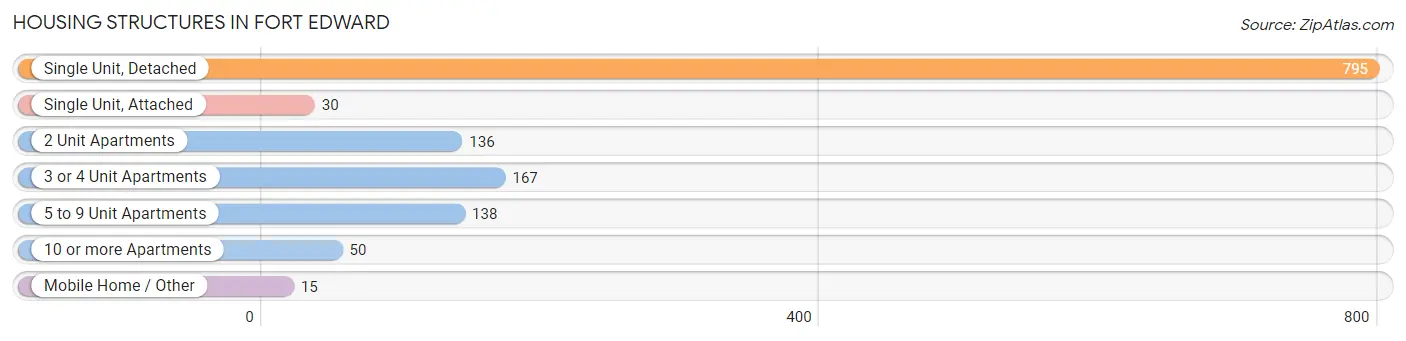
| Structure Type | # Housing Units | % Housing Units |
| Single Unit, Detached | 795 | 59.7% |
| Single Unit, Attached | 30 | 2.2% |
| 2 Unit Apartments | 136 | 10.2% |
| 3 or 4 Unit Apartments | 167 | 12.6% |
| 5 to 9 Unit Apartments | 138 | 10.4% |
| 10 or more Apartments | 50 | 3.8% |
| Mobile Home / Other | 15 | 1.1% |
| Total | 1,331 | 100.0% |
Housing Structures by Occupancy in Fort Edward
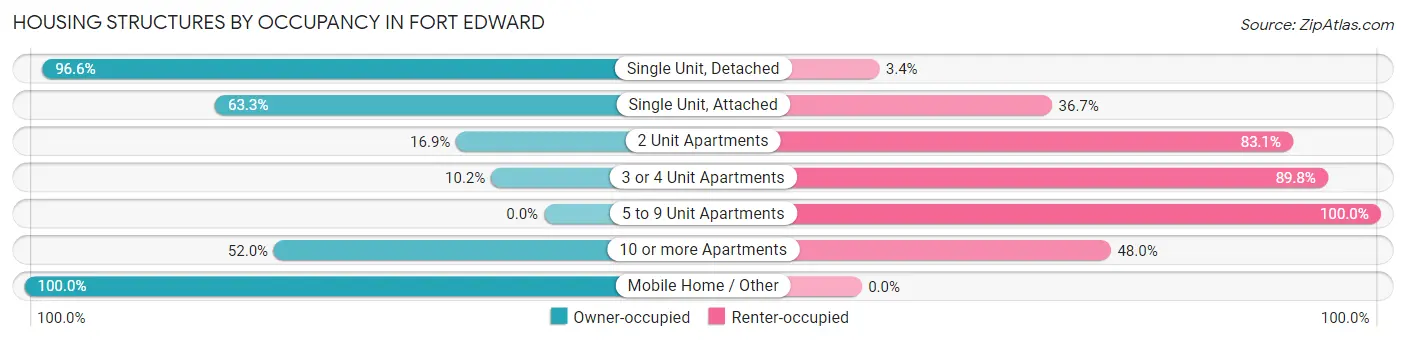
| Structure Type | Owner-occupied | Renter-occupied |
| Single Unit, Detached | 768 (96.6%) | 27 (3.4%) |
| Single Unit, Attached | 19 (63.3%) | 11 (36.7%) |
| 2 Unit Apartments | 23 (16.9%) | 113 (83.1%) |
| 3 or 4 Unit Apartments | 17 (10.2%) | 150 (89.8%) |
| 5 to 9 Unit Apartments | 0 (0.0%) | 138 (100.0%) |
| 10 or more Apartments | 26 (52.0%) | 24 (48.0%) |
| Mobile Home / Other | 15 (100.0%) | 0 (0.0%) |
| Total | 868 (65.2%) | 463 (34.8%) |
Housing Structures by Number of Rooms in Fort Edward
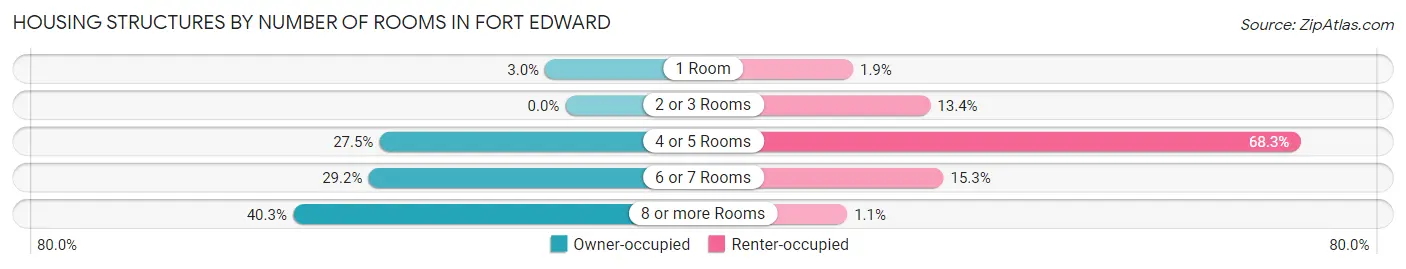
| Number of Rooms | Owner-occupied | Renter-occupied |
| 1 Room | 26 (3.0%) | 9 (1.9%) |
| 2 or 3 Rooms | 0 (0.0%) | 62 (13.4%) |
| 4 or 5 Rooms | 239 (27.5%) | 316 (68.2%) |
| 6 or 7 Rooms | 253 (29.1%) | 71 (15.3%) |
| 8 or more Rooms | 350 (40.3%) | 5 (1.1%) |
| Total | 868 (100.0%) | 463 (100.0%) |
Housing Structure by Heating Type in Fort Edward
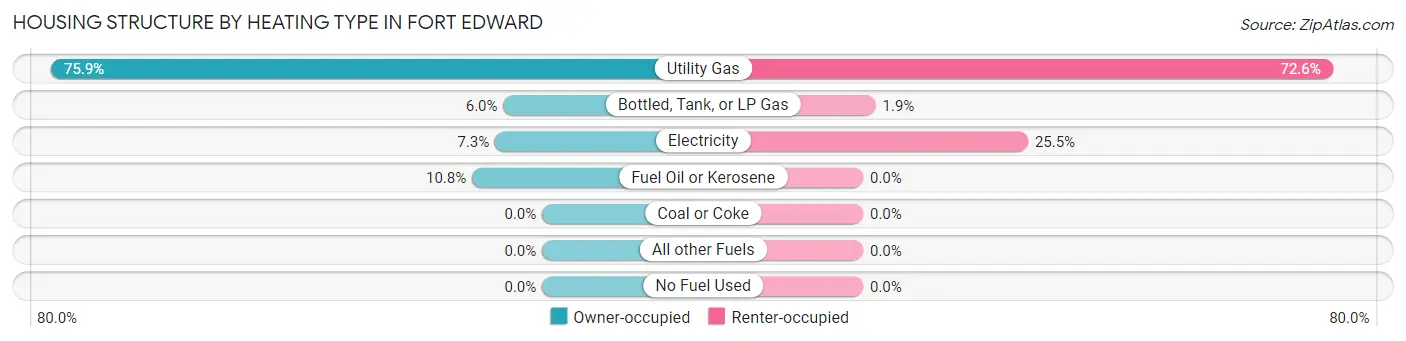
| Heating Type | Owner-occupied | Renter-occupied |
| Utility Gas | 659 (75.9%) | 336 (72.6%) |
| Bottled, Tank, or LP Gas | 52 (6.0%) | 9 (1.9%) |
| Electricity | 63 (7.3%) | 118 (25.5%) |
| Fuel Oil or Kerosene | 94 (10.8%) | 0 (0.0%) |
| Coal or Coke | 0 (0.0%) | 0 (0.0%) |
| All other Fuels | 0 (0.0%) | 0 (0.0%) |
| No Fuel Used | 0 (0.0%) | 0 (0.0%) |
| Total | 868 (100.0%) | 463 (100.0%) |
Household Vehicle Usage in Fort Edward
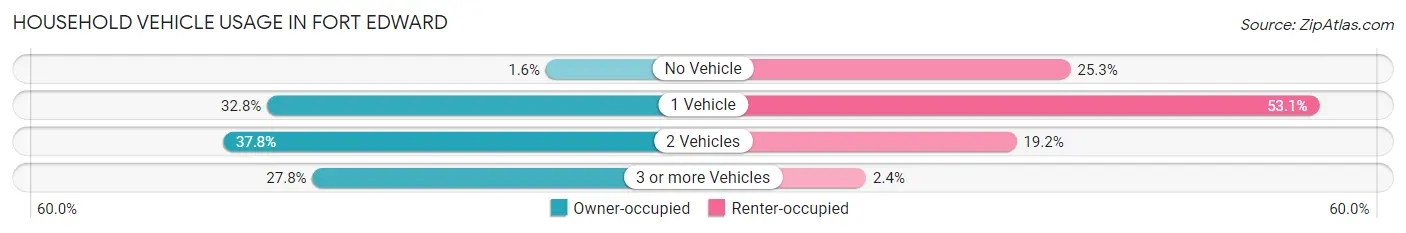
| Vehicles per Household | Owner-occupied | Renter-occupied |
| No Vehicle | 14 (1.6%) | 117 (25.3%) |
| 1 Vehicle | 285 (32.8%) | 246 (53.1%) |
| 2 Vehicles | 328 (37.8%) | 89 (19.2%) |
| 3 or more Vehicles | 241 (27.8%) | 11 (2.4%) |
| Total | 868 (100.0%) | 463 (100.0%) |
Real Estate & Mortgages in Fort Edward
Real Estate and Mortgage Overview in Fort Edward
| Characteristic | Without Mortgage | With Mortgage |
| Housing Units | 273 | 595 |
| Median Property Value | $98,600 | $175,900 |
| Median Household Income | $52,841 | $113 |
| Monthly Housing Costs | $551 | $11 |
| Real Estate Taxes | $3,554 | $57 |
Property Value by Mortgage Status in Fort Edward
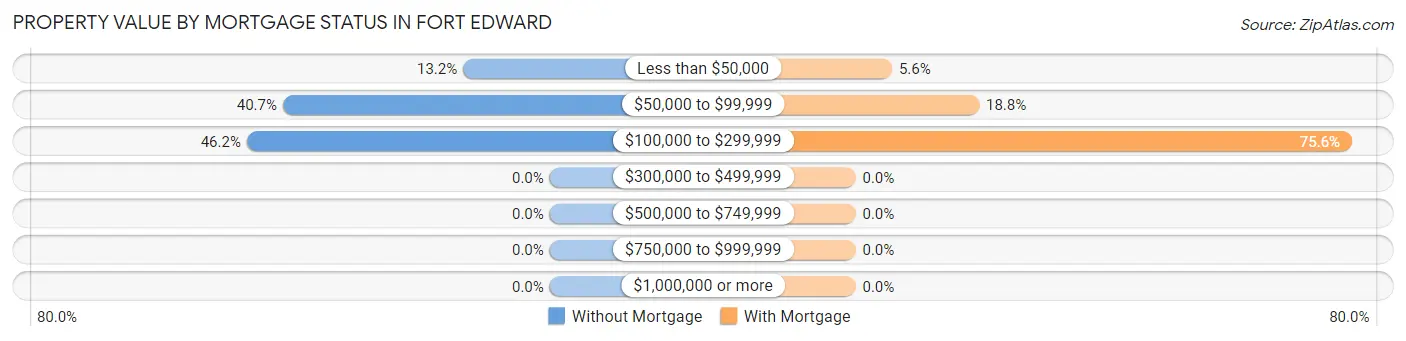
| Property Value | Without Mortgage | With Mortgage |
| Less than $50,000 | 36 (13.2%) | 33 (5.6%) |
| $50,000 to $99,999 | 111 (40.7%) | 112 (18.8%) |
| $100,000 to $299,999 | 126 (46.2%) | 450 (75.6%) |
| $300,000 to $499,999 | 0 (0.0%) | 0 (0.0%) |
| $500,000 to $749,999 | 0 (0.0%) | 0 (0.0%) |
| $750,000 to $999,999 | 0 (0.0%) | 0 (0.0%) |
| $1,000,000 or more | 0 (0.0%) | 0 (0.0%) |
| Total | 273 (100.0%) | 595 (100.0%) |
Household Income by Mortgage Status in Fort Edward
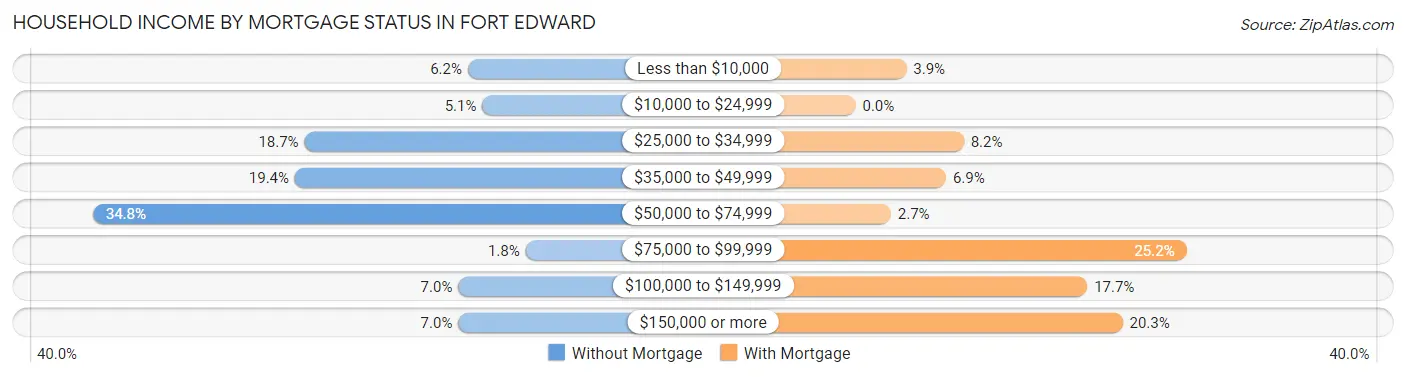
| Household Income | Without Mortgage | With Mortgage |
| Less than $10,000 | 17 (6.2%) | 23 (3.9%) |
| $10,000 to $24,999 | 14 (5.1%) | 0 (0.0%) |
| $25,000 to $34,999 | 51 (18.7%) | 49 (8.2%) |
| $35,000 to $49,999 | 53 (19.4%) | 41 (6.9%) |
| $50,000 to $74,999 | 95 (34.8%) | 16 (2.7%) |
| $75,000 to $99,999 | 5 (1.8%) | 150 (25.2%) |
| $100,000 to $149,999 | 19 (7.0%) | 105 (17.6%) |
| $150,000 or more | 19 (7.0%) | 121 (20.3%) |
| Total | 273 (100.0%) | 595 (100.0%) |
Property Value to Household Income Ratio in Fort Edward
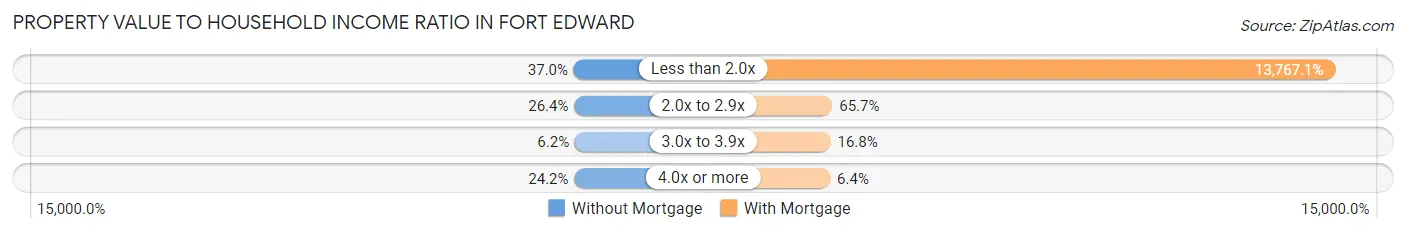
| Value-to-Income Ratio | Without Mortgage | With Mortgage |
| Less than 2.0x | 101 (37.0%) | 81,914 (13,767.1%) |
| 2.0x to 2.9x | 72 (26.4%) | 391 (65.7%) |
| 3.0x to 3.9x | 17 (6.2%) | 100 (16.8%) |
| 4.0x or more | 66 (24.2%) | 38 (6.4%) |
| Total | 273 (100.0%) | 595 (100.0%) |
Real Estate Taxes by Mortgage Status in Fort Edward
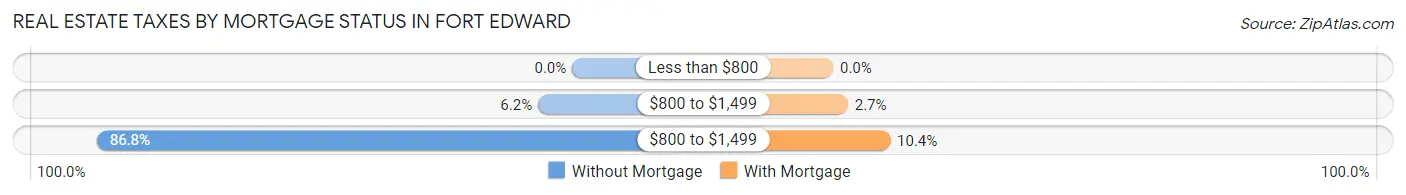
| Property Taxes | Without Mortgage | With Mortgage |
| Less than $800 | 0 (0.0%) | 0 (0.0%) |
| $800 to $1,499 | 17 (6.2%) | 16 (2.7%) |
| $800 to $1,499 | 237 (86.8%) | 62 (10.4%) |
| Total | 273 (100.0%) | 595 (100.0%) |
Health & Disability in Fort Edward
Health Insurance Coverage by Age in Fort Edward
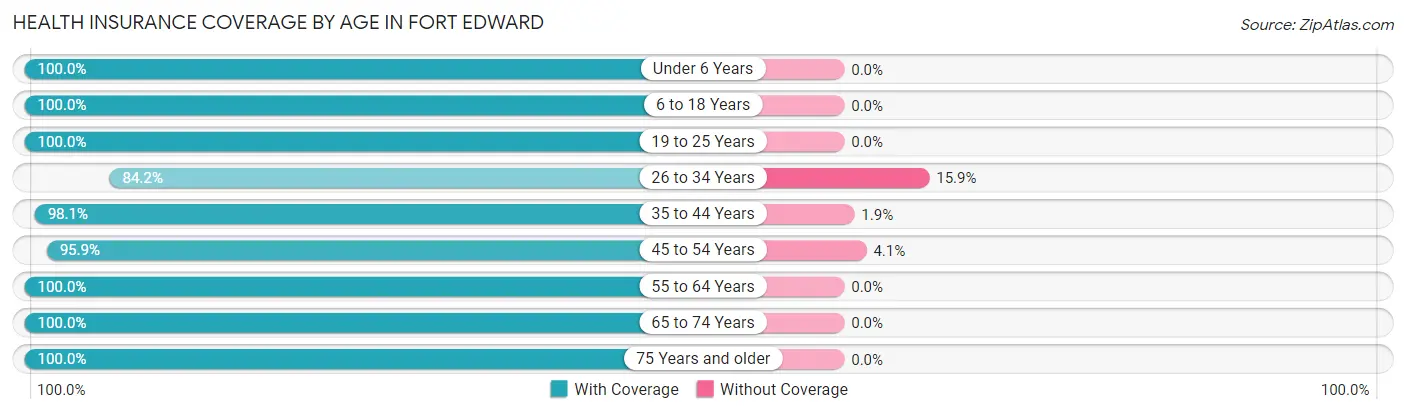
| Age Bracket | With Coverage | Without Coverage |
| Under 6 Years | 203 (100.0%) | 0 (0.0%) |
| 6 to 18 Years | 618 (100.0%) | 0 (0.0%) |
| 19 to 25 Years | 258 (100.0%) | 0 (0.0%) |
| 26 to 34 Years | 308 (84.2%) | 58 (15.9%) |
| 35 to 44 Years | 259 (98.1%) | 5 (1.9%) |
| 45 to 54 Years | 395 (95.9%) | 17 (4.1%) |
| 55 to 64 Years | 662 (100.0%) | 0 (0.0%) |
| 65 to 74 Years | 281 (100.0%) | 0 (0.0%) |
| 75 Years and older | 114 (100.0%) | 0 (0.0%) |
| Total | 3,098 (97.5%) | 80 (2.5%) |
Health Insurance Coverage by Citizenship Status in Fort Edward
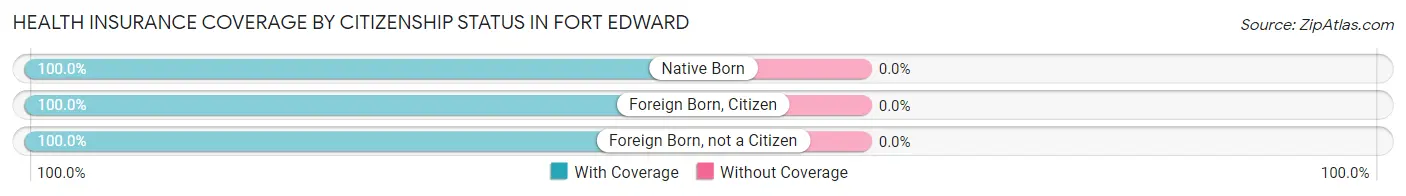
| Citizenship Status | With Coverage | Without Coverage |
| Native Born | 203 (100.0%) | 0 (0.0%) |
| Foreign Born, Citizen | 618 (100.0%) | 0 (0.0%) |
| Foreign Born, not a Citizen | 258 (100.0%) | 0 (0.0%) |
Health Insurance Coverage by Household Income in Fort Edward

| Household Income | With Coverage | Without Coverage |
| Under $25,000 | 286 (84.1%) | 54 (15.9%) |
| $25,000 to $49,999 | 649 (96.2%) | 26 (3.8%) |
| $50,000 to $74,999 | 728 (100.0%) | 0 (0.0%) |
| $75,000 to $99,999 | 432 (100.0%) | 0 (0.0%) |
| $100,000 and over | 976 (100.0%) | 0 (0.0%) |
Public vs Private Health Insurance Coverage by Age in Fort Edward
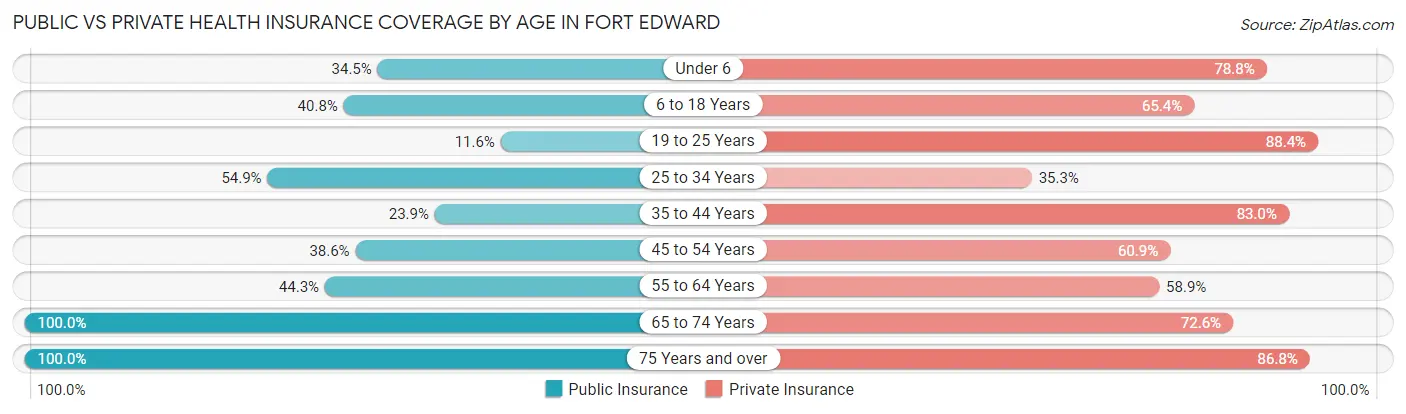
| Age Bracket | Public Insurance | Private Insurance |
| Under 6 | 70 (34.5%) | 160 (78.8%) |
| 6 to 18 Years | 252 (40.8%) | 404 (65.4%) |
| 19 to 25 Years | 30 (11.6%) | 228 (88.4%) |
| 25 to 34 Years | 201 (54.9%) | 129 (35.2%) |
| 35 to 44 Years | 63 (23.9%) | 219 (83.0%) |
| 45 to 54 Years | 159 (38.6%) | 251 (60.9%) |
| 55 to 64 Years | 293 (44.3%) | 390 (58.9%) |
| 65 to 74 Years | 281 (100.0%) | 204 (72.6%) |
| 75 Years and over | 114 (100.0%) | 99 (86.8%) |
| Total | 1,463 (46.0%) | 2,084 (65.6%) |
Disability Status by Sex by Age in Fort Edward
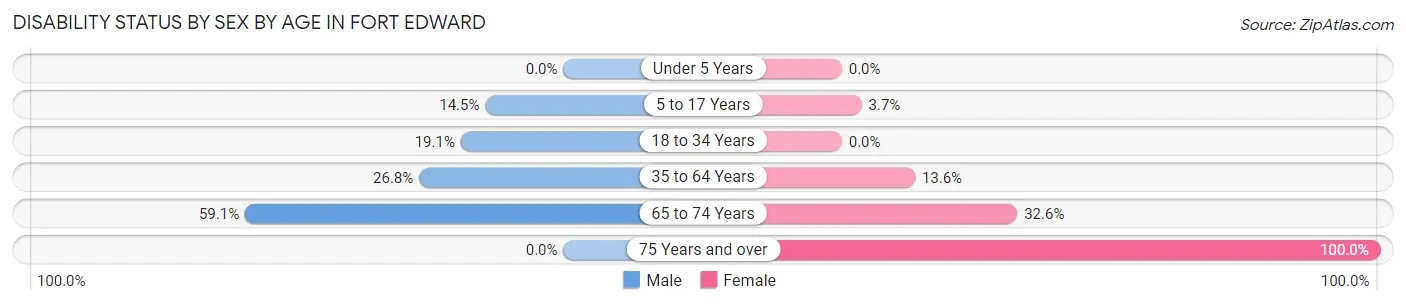
| Age Bracket | Male | Female |
| Under 5 Years | 0 (0.0%) | 0 (0.0%) |
| 5 to 17 Years | 30 (14.5%) | 11 (3.7%) |
| 18 to 34 Years | 72 (19.1%) | 0 (0.0%) |
| 35 to 64 Years | 159 (26.8%) | 101 (13.6%) |
| 65 to 74 Years | 39 (59.1%) | 70 (32.6%) |
| 75 Years and over | 0 (0.0%) | 31 (100.0%) |
Disability Class by Sex by Age in Fort Edward
Disability Class: Hearing Difficulty
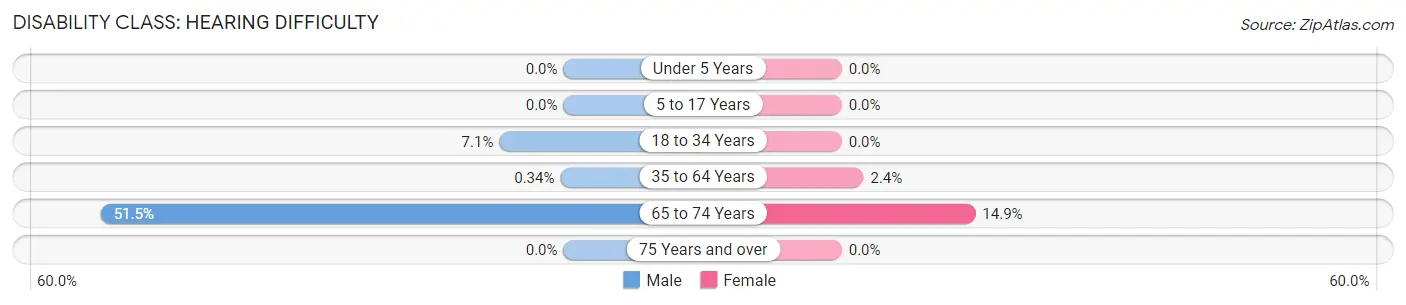
| Age Bracket | Male | Female |
| Under 5 Years | 0 (0.0%) | 0 (0.0%) |
| 5 to 17 Years | 0 (0.0%) | 0 (0.0%) |
| 18 to 34 Years | 27 (7.1%) | 0 (0.0%) |
| 35 to 64 Years | 2 (0.3%) | 18 (2.4%) |
| 65 to 74 Years | 34 (51.5%) | 32 (14.9%) |
| 75 Years and over | 0 (0.0%) | 0 (0.0%) |
Disability Class: Vision Difficulty
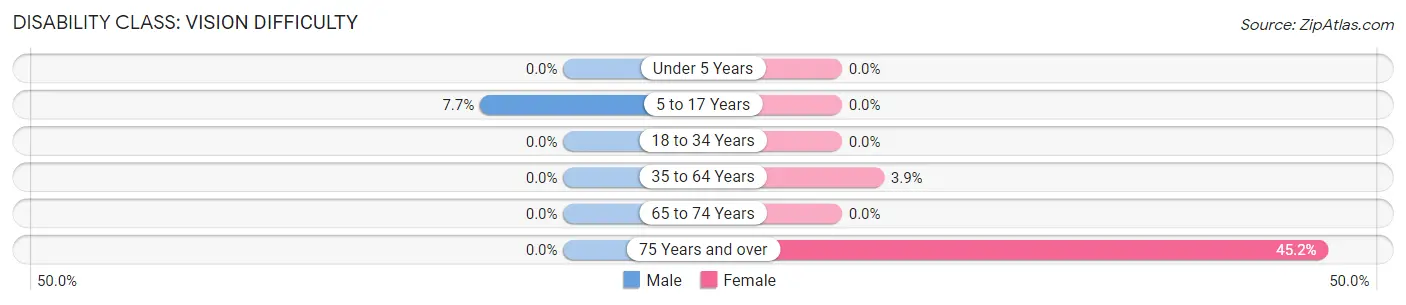
| Age Bracket | Male | Female |
| Under 5 Years | 0 (0.0%) | 0 (0.0%) |
| 5 to 17 Years | 16 (7.7%) | 0 (0.0%) |
| 18 to 34 Years | 0 (0.0%) | 0 (0.0%) |
| 35 to 64 Years | 0 (0.0%) | 29 (3.9%) |
| 65 to 74 Years | 0 (0.0%) | 0 (0.0%) |
| 75 Years and over | 0 (0.0%) | 14 (45.2%) |
Disability Class: Cognitive Difficulty
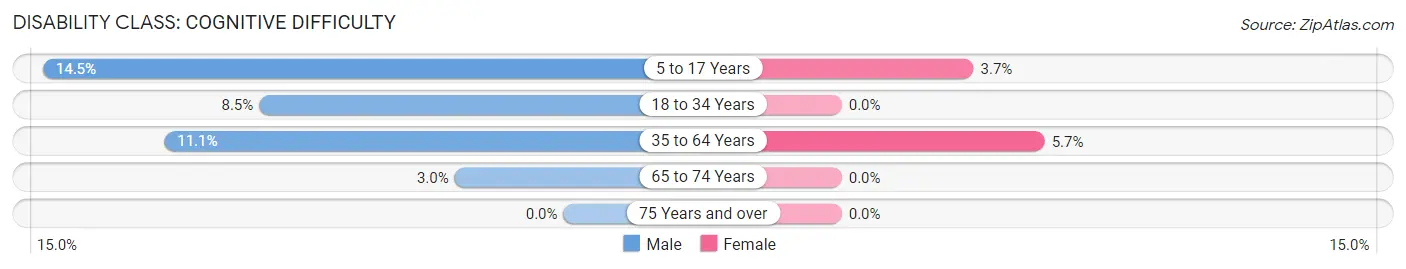
| Age Bracket | Male | Female |
| 5 to 17 Years | 30 (14.5%) | 11 (3.7%) |
| 18 to 34 Years | 32 (8.5%) | 0 (0.0%) |
| 35 to 64 Years | 66 (11.1%) | 42 (5.7%) |
| 65 to 74 Years | 2 (3.0%) | 0 (0.0%) |
| 75 Years and over | 0 (0.0%) | 0 (0.0%) |
Disability Class: Ambulatory Difficulty
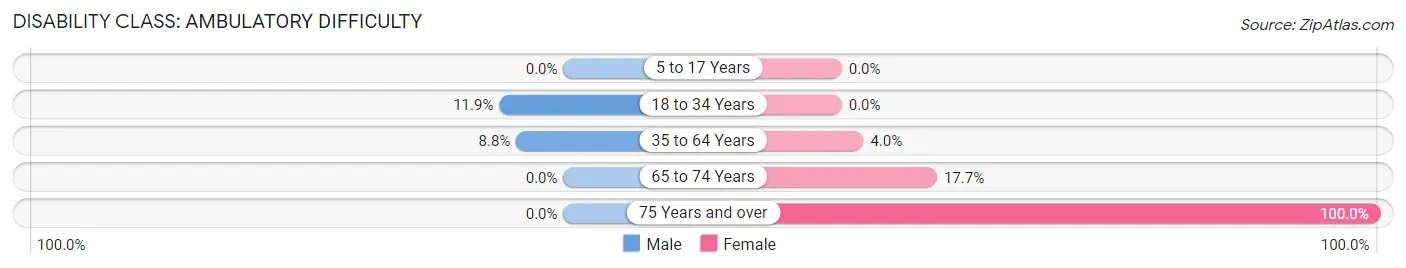
| Age Bracket | Male | Female |
| 5 to 17 Years | 0 (0.0%) | 0 (0.0%) |
| 18 to 34 Years | 45 (11.9%) | 0 (0.0%) |
| 35 to 64 Years | 52 (8.7%) | 30 (4.0%) |
| 65 to 74 Years | 0 (0.0%) | 38 (17.7%) |
| 75 Years and over | 0 (0.0%) | 31 (100.0%) |
Disability Class: Self-Care Difficulty

| Age Bracket | Male | Female |
| 5 to 17 Years | 14 (6.8%) | 0 (0.0%) |
| 18 to 34 Years | 27 (7.1%) | 0 (0.0%) |
| 35 to 64 Years | 0 (0.0%) | 24 (3.2%) |
| 65 to 74 Years | 2 (3.0%) | 38 (17.7%) |
| 75 Years and over | 0 (0.0%) | 0 (0.0%) |
Technology Access in Fort Edward
Computing Device Access in Fort Edward
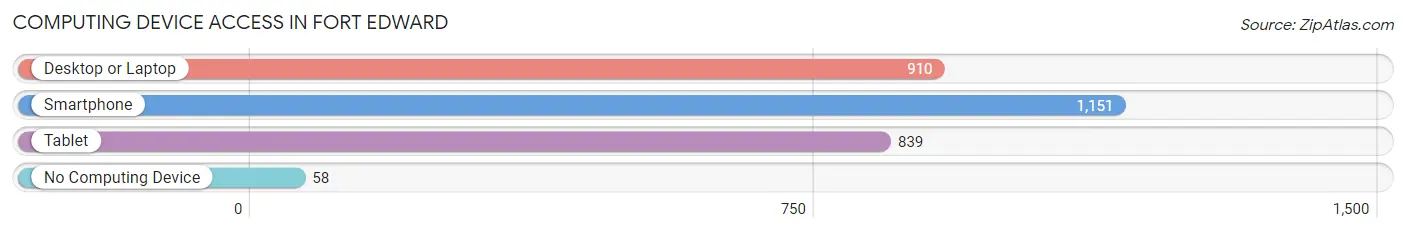
| Device Type | # Households | % Households |
| Desktop or Laptop | 910 | 68.4% |
| Smartphone | 1,151 | 86.5% |
| Tablet | 839 | 63.0% |
| No Computing Device | 58 | 4.4% |
| Total | 1,331 | 100.0% |
Internet Access in Fort Edward
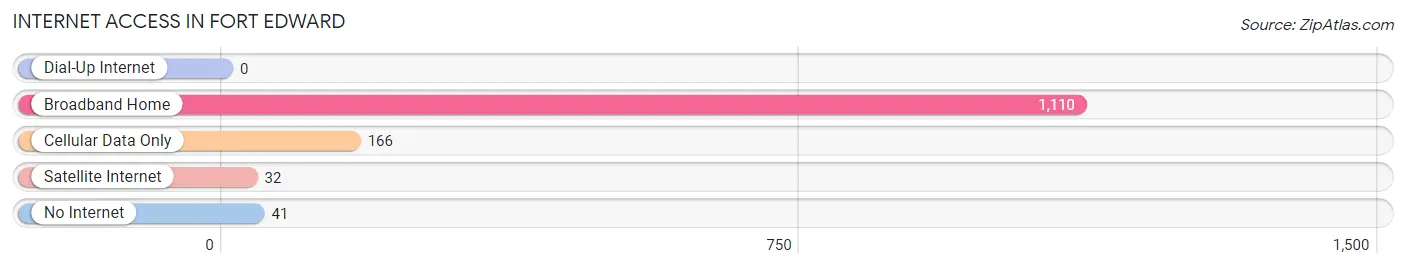
| Internet Type | # Households | % Households |
| Dial-Up Internet | 0 | 0.0% |
| Broadband Home | 1,110 | 83.4% |
| Cellular Data Only | 166 | 12.5% |
| Satellite Internet | 32 | 2.4% |
| No Internet | 41 | 3.1% |
| Total | 1,331 | 100.0% |
Fort Edward Summary
Fort Edward is a village located in Washington County, New York, United States. It is situated on the east bank of the Hudson River, about 40 miles north of Albany. The population was 2,891 at the 2010 census.
History
Fort Edward was first settled in 1709 by Dutch settlers. The village was originally known as "Half Moon Point" and was part of the town of Kingsbury. In 1755, the British built a fort here during the French and Indian War, and the village was renamed "Fort Edward" in honor of the Duke of York, who later became King George III.
The village was an important military post during the Revolutionary War, and was the site of the Battle of Fort Edward in 1777. After the war, the village became an important trading center and was incorporated in 1817.
Geography
Fort Edward is located at 43°17'N 73°37'W (43.28, -73.62). According to the United States Census Bureau, the village has a total area of 1.2 square miles (3.1 km2), all of it land.
Economy
Fort Edward is home to several businesses, including a number of manufacturing companies. The village is also home to the Fort Edward Yacht Basin, a marina on the Hudson River.
Demographics
As of the census of 2000, there were 2,945 people, 1,204 households, and 790 families residing in the village. The population density was 2,521.2 people per square mile (973.2/km2). There were 1,279 housing units at an average density of 1,072.2 per square mile (414.7/km2). The racial makeup of the village was 97.45% White, 0.64% African American, 0.17% Native American, 0.17% Asian, 0.03% Pacific Islander, 0.48% from other races, and 1.05% from two or more races. Hispanic or Latino of any race were 1.41% of the population.
There were 1,204 households, out of which 32.2% had children under the age of 18 living with them, 49.3% were married couples living together, 12.7% had a female householder with no husband present, and 33.2% were non-families. 28.2% of all households were made up of individuals, and 13.2% had someone living alone who was 65 years of age or older. The average household size was 2.44 and the average family size was 2.97.
In the village, the population was spread out, with 25.2% under the age of 18, 7.2% from 18 to 24, 28.7% from 25 to 44, 22.3% from 45 to 64, and 16.6% who were 65 years of age or older. The median age was 38 years. For every 100 females, there were 91.2 males. For every 100 females age 18 and over, there were 87.2 males.
The median income for a household in the village was $37,917, and the median income for a family was $45,000. Males had a median income of $32,500 versus $25,000 for females. The per capita income for the village was $18,845. About 6.2% of families and 8.3% of the population were below the poverty line, including 10.2% of those under age 18 and 8.2% of those age 65 or over.
Common Questions
What is Per Capita Income in Fort Edward?
Per Capita income in Fort Edward is $30,062.
What is the Median Family Income in Fort Edward?
Median Family Income in Fort Edward is $67,344.
What is the Median Household income in Fort Edward?
Median Household Income in Fort Edward is $57,795.
What is Income or Wage Gap in Fort Edward?
Income or Wage Gap in Fort Edward is 8.0%.
Women in Fort Edward earn 92.0 cents for every dollar earned by a man.
What is Inequality or Gini Index in Fort Edward?
Inequality or Gini Index in Fort Edward is 0.41.
What is the Total Population of Fort Edward?
Total Population of Fort Edward is 3,189.
What is the Total Male Population of Fort Edward?
Total Male Population of Fort Edward is 1,510.
What is the Total Female Population of Fort Edward?
Total Female Population of Fort Edward is 1,679.
What is the Ratio of Males per 100 Females in Fort Edward?
There are 89.93 Males per 100 Females in Fort Edward.
What is the Ratio of Females per 100 Males in Fort Edward?
There are 111.19 Females per 100 Males in Fort Edward.
What is the Median Population Age in Fort Edward?
Median Population Age in Fort Edward is 42.2 Years.
What is the Average Family Size in Fort Edward
Average Family Size in Fort Edward is 2.9 People.
What is the Average Household Size in Fort Edward
Average Household Size in Fort Edward is 2.4 People.
How Large is the Labor Force in Fort Edward?
There are 1,795 People in the Labor Forcein in Fort Edward.
What is the Percentage of People in the Labor Force in Fort Edward?
70.6% of People are in the Labor Force in Fort Edward.
What is the Unemployment Rate in Fort Edward?
Unemployment Rate in Fort Edward is 2.0%.