Forestville, NY Map & Demographics
Forestville Map
Forestville Overview
$22,143
PER CAPITA INCOME
0.45
INEQUALITY / GINI INDEX
532
TOTAL POPULATION
165
MALE POPULATION
367
FEMALE POPULATION
44.96
MALES / 100 FEMALES
222.42
FEMALES / 100 MALES
25.2
MEDIAN AGE
3.0
AVG FAMILY SIZE
2.5
AVG HOUSEHOLD SIZE
213
LABOR FORCE [ PEOPLE ]
73.7%
PERCENT IN LABOR FORCE
Forestville Zip Codes
Forestville Area Codes
Income in Forestville
Income Overview in Forestville
| Characteristic | Number | Measure |
| Per Capita Income | 532 | $22,143 |
| Median Family Income | 154 | $0 |
| Mean Family Income | 154 | $56,914 |
| Median Household Income | 202 | $0 |
| Mean Household Income | 202 | $57,381 |
| Income Deficit | 154 | $0 |
| Wage / Income Gap (%) | 532 | 0.00% |
| Wage / Income Gap ($) | 532 | 100.00¢ per $1 |
| Gini / Inequality Index | 532 | 0.45 |
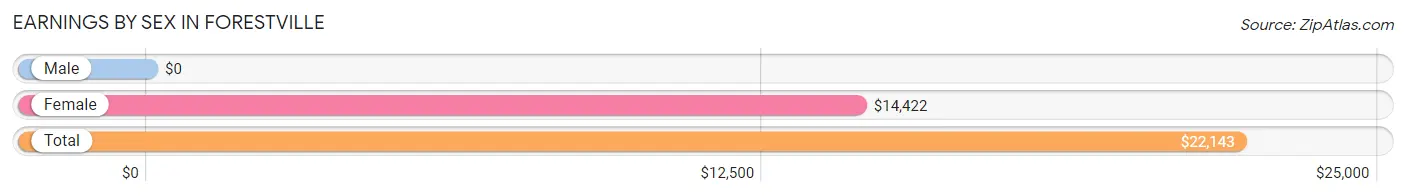
Earnings by Sex in Forestville
| Sex | Number | Average Earnings |
| Male | 81 (35.8%) | $0 |
| Female | 145 (64.2%) | $14,422 |
| Total | 226 (100.0%) | $22,143 |
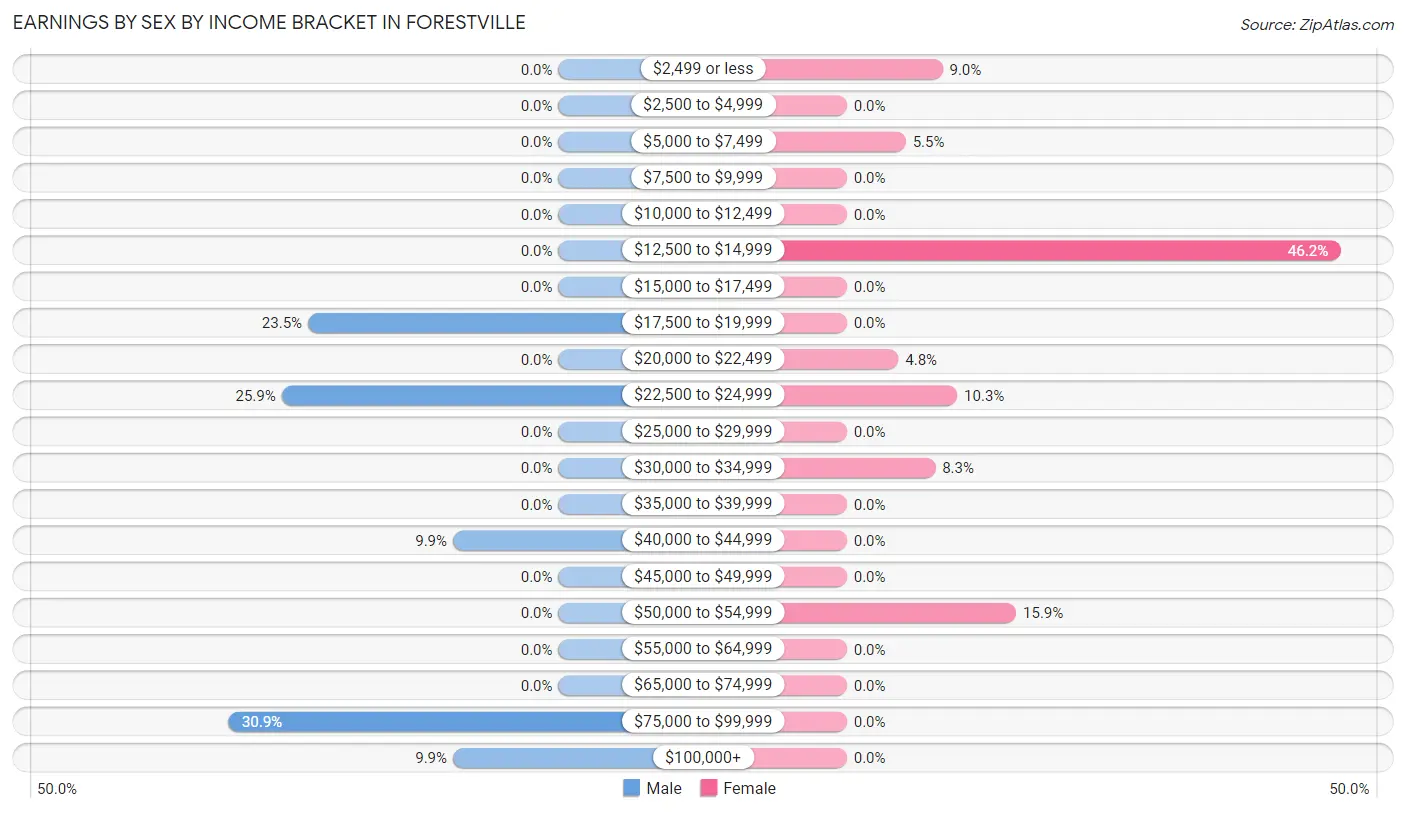
Earnings by Sex by Income Bracket in Forestville
The most common earnings brackets in Forestville are $75,000 to $99,999 for men (25 | 30.9%) and $12,500 to $14,999 for women (67 | 46.2%).
| Income | Male | Female |
| $2,499 or less | 0 (0.0%) | 13 (9.0%) |
| $2,500 to $4,999 | 0 (0.0%) | 0 (0.0%) |
| $5,000 to $7,499 | 0 (0.0%) | 8 (5.5%) |
| $7,500 to $9,999 | 0 (0.0%) | 0 (0.0%) |
| $10,000 to $12,499 | 0 (0.0%) | 0 (0.0%) |
| $12,500 to $14,999 | 0 (0.0%) | 67 (46.2%) |
| $15,000 to $17,499 | 0 (0.0%) | 0 (0.0%) |
| $17,500 to $19,999 | 19 (23.5%) | 0 (0.0%) |
| $20,000 to $22,499 | 0 (0.0%) | 7 (4.8%) |
| $22,500 to $24,999 | 21 (25.9%) | 15 (10.3%) |
| $25,000 to $29,999 | 0 (0.0%) | 0 (0.0%) |
| $30,000 to $34,999 | 0 (0.0%) | 12 (8.3%) |
| $35,000 to $39,999 | 0 (0.0%) | 0 (0.0%) |
| $40,000 to $44,999 | 8 (9.9%) | 0 (0.0%) |
| $45,000 to $49,999 | 0 (0.0%) | 0 (0.0%) |
| $50,000 to $54,999 | 0 (0.0%) | 23 (15.9%) |
| $55,000 to $64,999 | 0 (0.0%) | 0 (0.0%) |
| $65,000 to $74,999 | 0 (0.0%) | 0 (0.0%) |
| $75,000 to $99,999 | 25 (30.9%) | 0 (0.0%) |
| $100,000+ | 8 (9.9%) | 0 (0.0%) |
| Total | 81 (100.0%) | 145 (100.0%) |
Earnings by Sex by Educational Attainment in Forestville
| Educational Attainment | Male Income | Female Income |
| Less than High School | - | - |
| High School Diploma | - | - |
| College or Associate's Degree | - | - |
| Bachelor's Degree | - | - |
| Graduate Degree | - | - |
| Total | - | - |
Family Income in Forestville
Family Income Brackets in Forestville
According to the Forestville family income data, there are 67 families falling into the $25,000 to $34,999 income range, which is the most common income bracket and makes up 43.5% of all families.
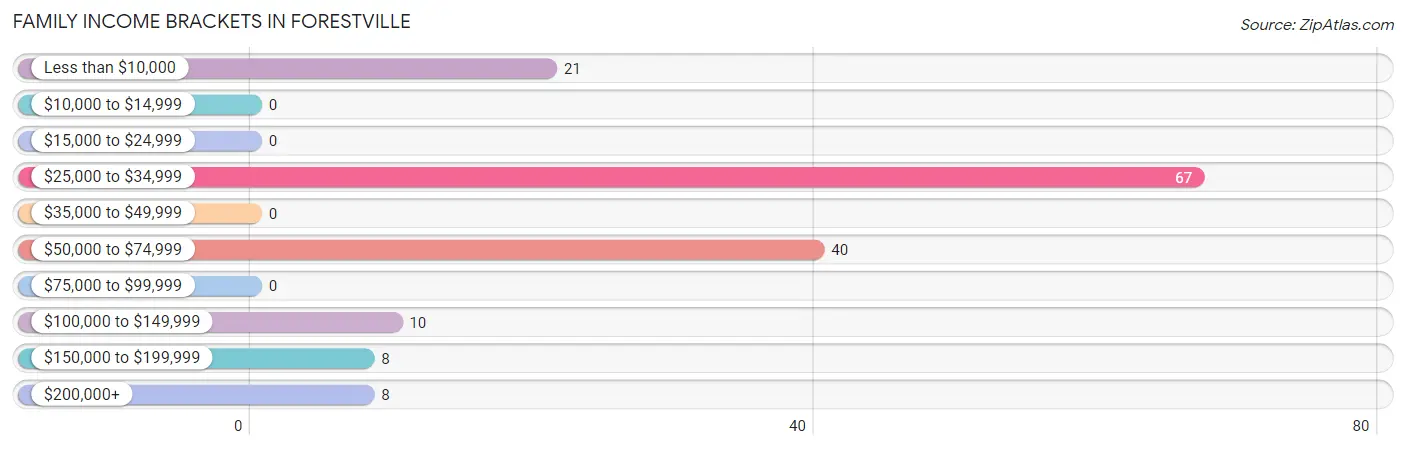
| Income Bracket | # Families | % Families |
| Less than $10,000 | 21 | 13.6% |
| $10,000 to $14,999 | 0 | 0.0% |
| $15,000 to $24,999 | 0 | 0.0% |
| $25,000 to $34,999 | 67 | 43.5% |
| $35,000 to $49,999 | 0 | 0.0% |
| $50,000 to $74,999 | 40 | 26.0% |
| $75,000 to $99,999 | 0 | 0.0% |
| $100,000 to $149,999 | 10 | 6.5% |
| $150,000 to $199,999 | 8 | 5.2% |
| $200,000+ | 8 | 5.2% |
Family Income by Famaliy Size in Forestville
2-person families (39 | 25.3%) account for the highest median family income in Forestville with $51,250 per family, while 2-person families (39 | 25.3%) have the highest median income of $25,625 per family member.
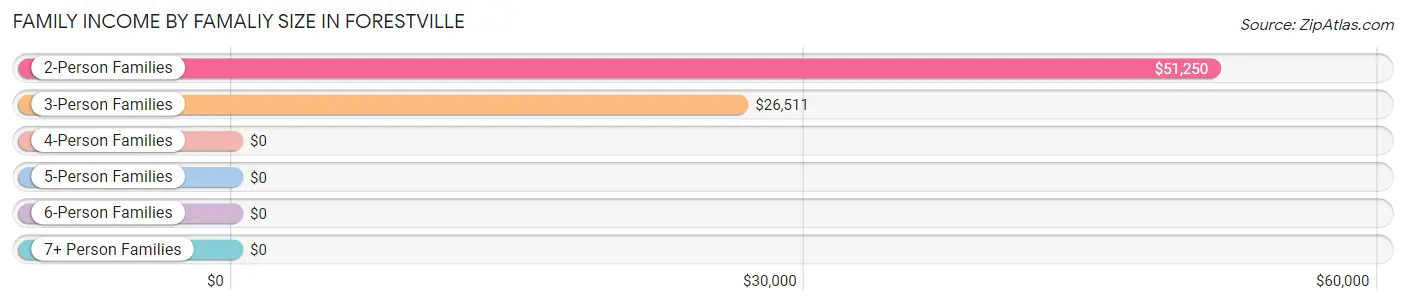
| Income Bracket | # Families | Median Income |
| 2-Person Families | 39 (25.3%) | $51,250 |
| 3-Person Families | 107 (69.5%) | $26,511 |
| 4-Person Families | 8 (5.2%) | $0 |
| 5-Person Families | 0 (0.0%) | $0 |
| 6-Person Families | 0 (0.0%) | $0 |
| 7+ Person Families | 0 (0.0%) | $0 |
| Total | 154 (100.0%) | $0 |
Family Income by Number of Earners in Forestville
| Number of Earners | # Families | Median Income |
| No Earners | 16 (10.4%) | $0 |
| 1 Earner | 120 (77.9%) | $0 |
| 2 Earners | 10 (6.5%) | $0 |
| 3+ Earners | 8 (5.2%) | $0 |
| Total | 154 (100.0%) | $0 |
Household Income in Forestville
Household Income Brackets in Forestville
With 67 households falling in the category, the $25,000 to $34,999 income range is the most frequent in Forestville, accounting for 33.2% of all households.
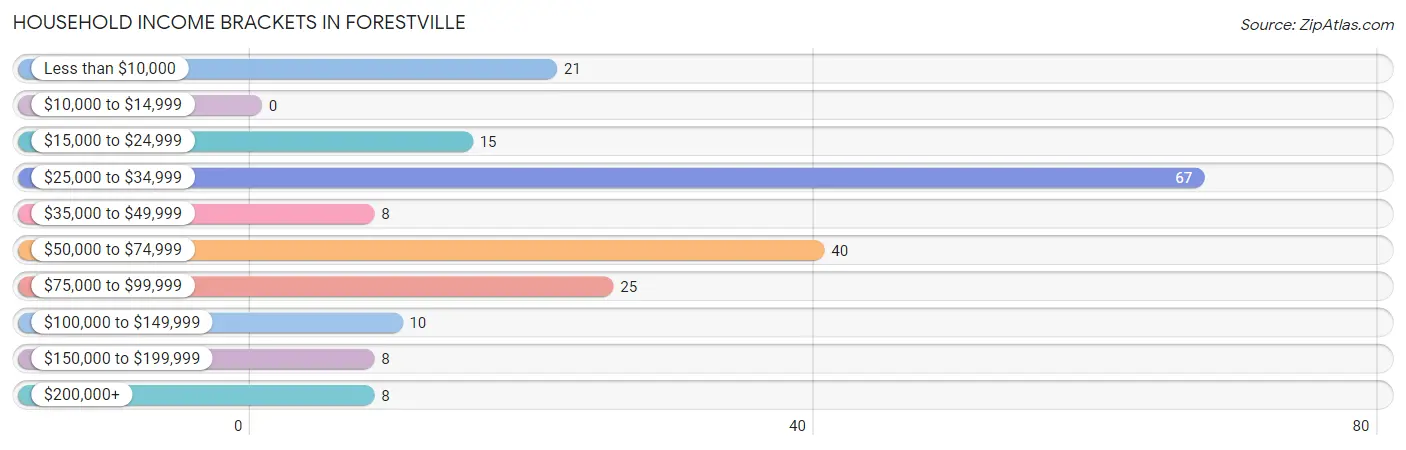
| Income Bracket | # Households | % Households |
| Less than $10,000 | 21 | 10.4% |
| $10,000 to $14,999 | 0 | 0.0% |
| $15,000 to $24,999 | 15 | 7.4% |
| $25,000 to $34,999 | 67 | 33.2% |
| $35,000 to $49,999 | 8 | 4.0% |
| $50,000 to $74,999 | 40 | 19.8% |
| $75,000 to $99,999 | 25 | 12.4% |
| $100,000 to $149,999 | 10 | 5.0% |
| $150,000 to $199,999 | 8 | 4.0% |
| $200,000+ | 8 | 4.0% |
Household Income by Householder Age in Forestville
| Income Bracket | # Households | Median Income |
| 15 to 24 Years | 0 (0.0%) | $0 |
| 25 to 44 Years | 150 (74.3%) | $0 |
| 45 to 64 Years | 31 (15.3%) | $0 |
| 65+ Years | 21 (10.4%) | $0 |
| Total | 202 (100.0%) | $0 |
Poverty in Forestville
Income Below Poverty by Sex and Age in Forestville
With 18.8% poverty level for males and 9.5% for females among the residents of Forestville, 15 year old males and 45 to 54 year old females are the most vulnerable to poverty, with 14 males (100.0%) and 13 females (61.9%) in their respective age groups living below the poverty level.
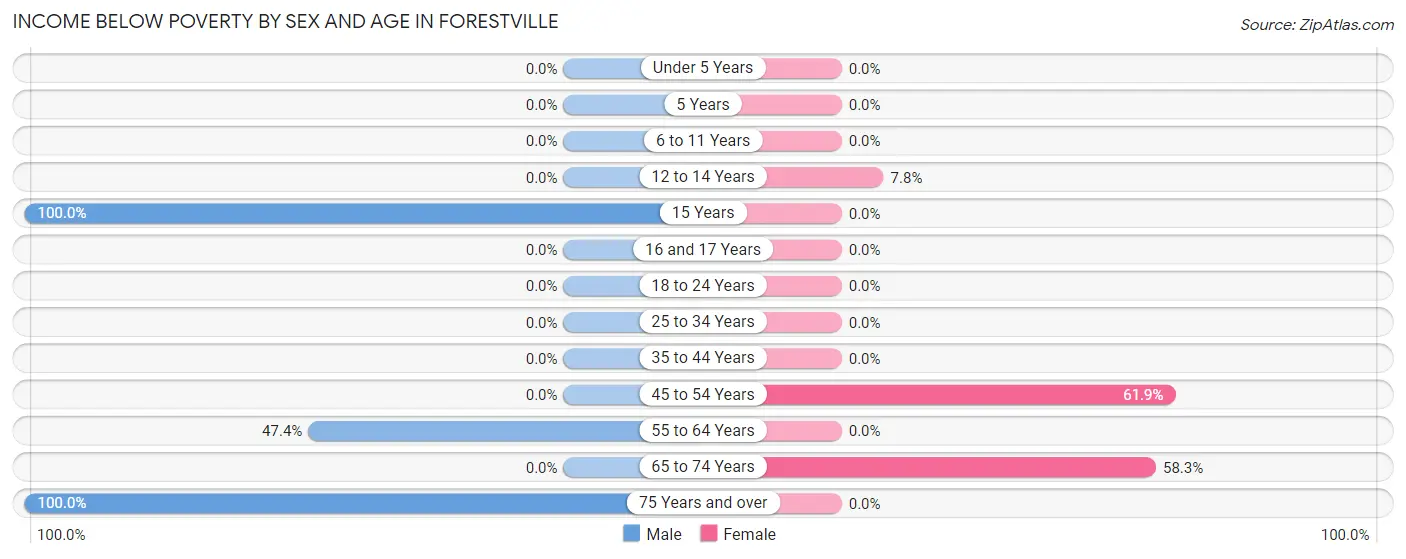
| Age Bracket | Male | Female |
| Under 5 Years | 0 (0.0%) | 0 (0.0%) |
| 5 Years | 0 (0.0%) | 0 (0.0%) |
| 6 to 11 Years | 0 (0.0%) | 0 (0.0%) |
| 12 to 14 Years | 0 (0.0%) | 15 (7.8%) |
| 15 Years | 14 (100.0%) | 0 (0.0%) |
| 16 and 17 Years | 0 (0.0%) | 0 (0.0%) |
| 18 to 24 Years | 0 (0.0%) | 0 (0.0%) |
| 25 to 34 Years | 0 (0.0%) | 0 (0.0%) |
| 35 to 44 Years | 0 (0.0%) | 0 (0.0%) |
| 45 to 54 Years | 0 (0.0%) | 13 (61.9%) |
| 55 to 64 Years | 9 (47.4%) | 0 (0.0%) |
| 65 to 74 Years | 0 (0.0%) | 7 (58.3%) |
| 75 Years and over | 8 (100.0%) | 0 (0.0%) |
| Total | 31 (18.8%) | 35 (9.5%) |
Income Above Poverty by Sex and Age in Forestville
According to the poverty statistics in Forestville, males aged 5 years and females aged 25 to 34 years are the age groups that are most secure financially, with 100.0% of males and 100.0% of females in these age groups living above the poverty line.
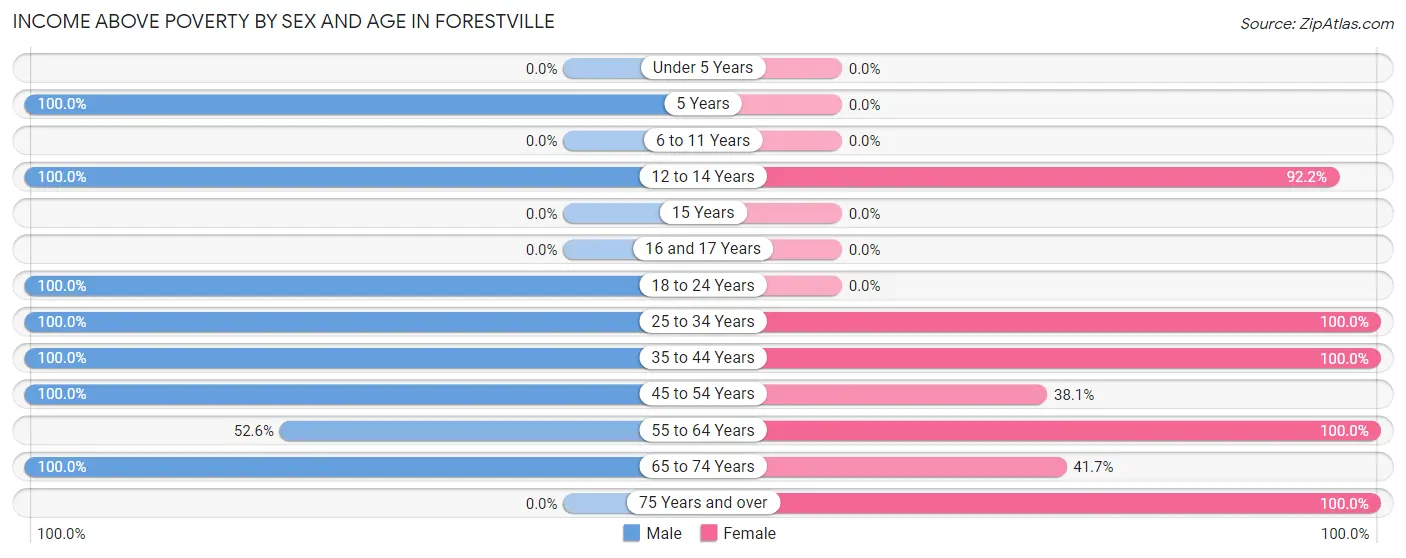
| Age Bracket | Male | Female |
| Under 5 Years | 0 (0.0%) | 0 (0.0%) |
| 5 Years | 25 (100.0%) | 0 (0.0%) |
| 6 to 11 Years | 0 (0.0%) | 0 (0.0%) |
| 12 to 14 Years | 11 (100.0%) | 178 (92.2%) |
| 15 Years | 0 (0.0%) | 0 (0.0%) |
| 16 and 17 Years | 0 (0.0%) | 0 (0.0%) |
| 18 to 24 Years | 19 (100.0%) | 0 (0.0%) |
| 25 to 34 Years | 21 (100.0%) | 38 (100.0%) |
| 35 to 44 Years | 33 (100.0%) | 86 (100.0%) |
| 45 to 54 Years | 8 (100.0%) | 8 (38.1%) |
| 55 to 64 Years | 10 (52.6%) | 9 (100.0%) |
| 65 to 74 Years | 7 (100.0%) | 5 (41.7%) |
| 75 Years and over | 0 (0.0%) | 8 (100.0%) |
| Total | 134 (81.2%) | 332 (90.5%) |
Income Below Poverty Among Married-Couple Families in Forestville
The poverty statistics for married-couple families in Forestville show that 33.3% or 8 of the total 24 families live below the poverty line. Families with no children have the highest poverty rate of 33.3%, comprising of 8 families. On the other hand, families with no children have the lowest poverty rate of 33.3%, which includes 8 families.
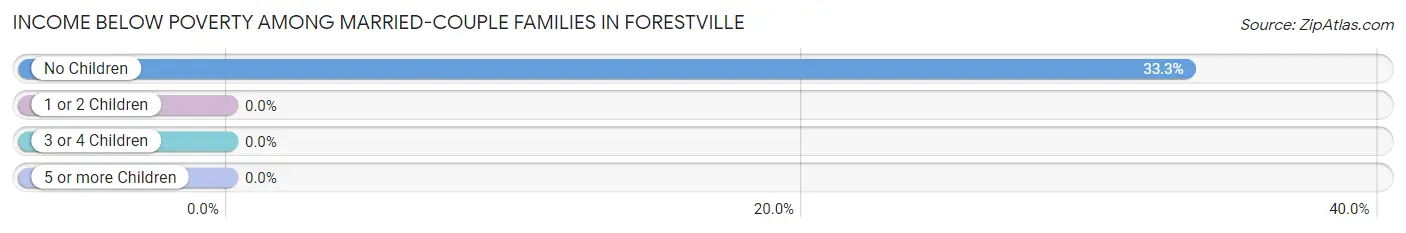
| Children | Above Poverty | Below Poverty |
| No Children | 16 (66.7%) | 8 (33.3%) |
| 1 or 2 Children | 0 (0.0%) | 0 (0.0%) |
| 3 or 4 Children | 0 (0.0%) | 0 (0.0%) |
| 5 or more Children | 0 (0.0%) | 0 (0.0%) |
| Total | 16 (66.7%) | 8 (33.3%) |
Income Below Poverty Among Single-Parent Households in Forestville
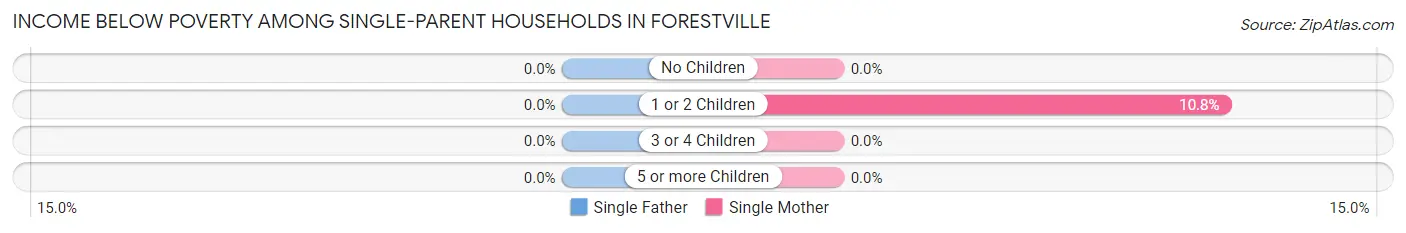
| Children | Single Father | Single Mother |
| No Children | 0 (0.0%) | 0 (0.0%) |
| 1 or 2 Children | 0 (0.0%) | 13 (10.8%) |
| 3 or 4 Children | 0 (0.0%) | 0 (0.0%) |
| 5 or more Children | 0 (0.0%) | 0 (0.0%) |
| Total | 0 (0.0%) | 13 (10.8%) |
Income Below Poverty Among Married-Couple vs Single-Parent Households in Forestville
The poverty data for Forestville shows that 8 of the married-couple family households (33.3%) and 13 of the single-parent households (10.0%) are living below the poverty level. Within the married-couple family households, those with no children have the highest poverty rate, with 8 households (33.3%) falling below the poverty line. Among the single-parent households, those with 1 or 2 children have the highest poverty rate, with 13 household (10.8%) living below poverty.
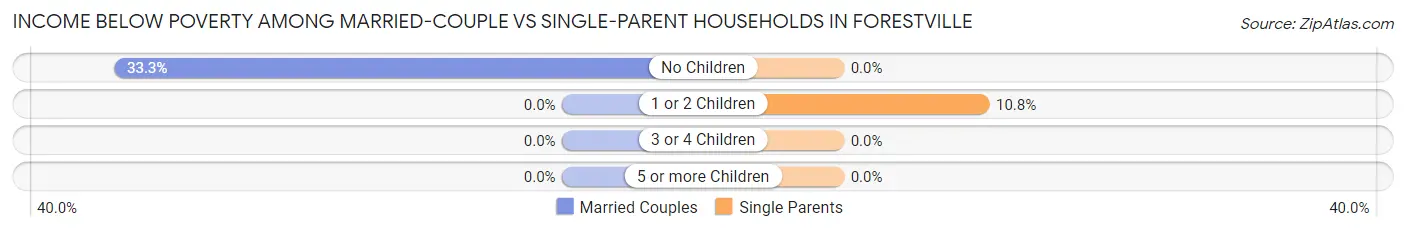
| Children | Married-Couple Families | Single-Parent Households |
| No Children | 8 (33.3%) | 0 (0.0%) |
| 1 or 2 Children | 0 (0.0%) | 13 (10.8%) |
| 3 or 4 Children | 0 (0.0%) | 0 (0.0%) |
| 5 or more Children | 0 (0.0%) | 0 (0.0%) |
| Total | 8 (33.3%) | 13 (10.0%) |
Race in Forestville
The most populous races in Forestville are , and White / Caucasian (532 | 100.0%).
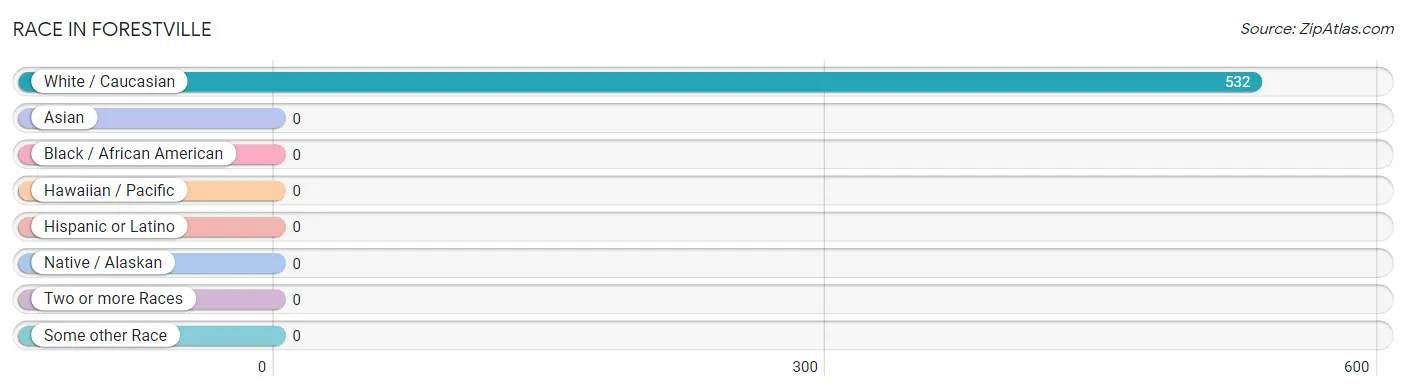
| Race | # Population | % Population |
| Asian | 0 | 0.0% |
| Black / African American | 0 | 0.0% |
| Hawaiian / Pacific | 0 | 0.0% |
| Hispanic or Latino | 0 | 0.0% |
| Native / Alaskan | 0 | 0.0% |
| White / Caucasian | 532 | 100.0% |
| Two or more Races | 0 | 0.0% |
| Some other Race | 0 | 0.0% |
| Total | 532 | 100.0% |
Ancestry in Forestville
The most populous ancestries reported in Forestville are German (341 | 64.1%), Irish (325 | 61.1%), English (78 | 14.7%), Polish (75 | 14.1%), and Swedish (42 | 7.9%), together accounting for 161.8% of all Forestville residents.
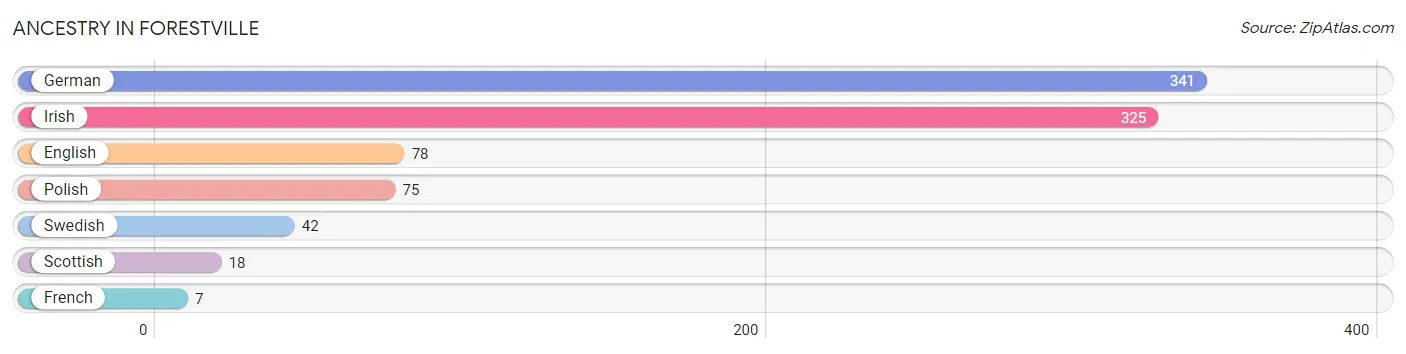
| Ancestry | # Population | % Population |
| English | 78 | 14.7% |
| French | 7 | 1.3% |
| German | 341 | 64.1% |
| Irish | 325 | 61.1% |
| Polish | 75 | 14.1% |
| Scottish | 18 | 3.4% |
| Swedish | 42 | 7.9% | View All 7 Rows |
Immigrants in Forestville
The most numerous immigrant groups reported in Forestville came from , and Canada (25 | 4.7%), together accounting for 4.7% of all Forestville residents.

| Immigration Origin | # Population | % Population |
| Canada | 25 | 4.7% | View All 1 Rows |
Sex and Age in Forestville
Sex and Age in Forestville
The most populous age groups in Forestville are 40 to 44 Years (33 | 20.0%) for men and 10 to 14 Years (193 | 52.6%) for women.
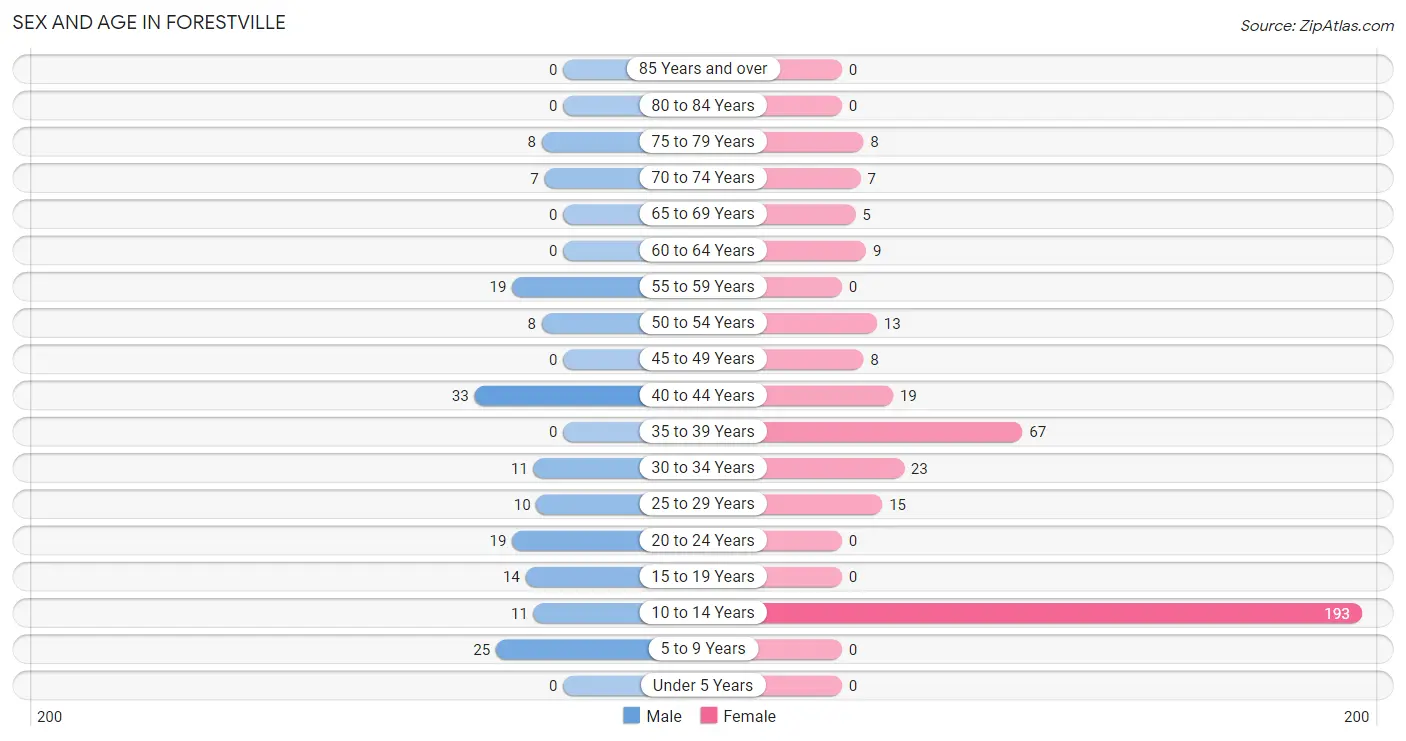
| Age Bracket | Male | Female |
| Under 5 Years | 0 (0.0%) | 0 (0.0%) |
| 5 to 9 Years | 25 (15.1%) | 0 (0.0%) |
| 10 to 14 Years | 11 (6.7%) | 193 (52.6%) |
| 15 to 19 Years | 14 (8.5%) | 0 (0.0%) |
| 20 to 24 Years | 19 (11.5%) | 0 (0.0%) |
| 25 to 29 Years | 10 (6.1%) | 15 (4.1%) |
| 30 to 34 Years | 11 (6.7%) | 23 (6.3%) |
| 35 to 39 Years | 0 (0.0%) | 67 (18.3%) |
| 40 to 44 Years | 33 (20.0%) | 19 (5.2%) |
| 45 to 49 Years | 0 (0.0%) | 8 (2.2%) |
| 50 to 54 Years | 8 (4.9%) | 13 (3.5%) |
| 55 to 59 Years | 19 (11.5%) | 0 (0.0%) |
| 60 to 64 Years | 0 (0.0%) | 9 (2.5%) |
| 65 to 69 Years | 0 (0.0%) | 5 (1.4%) |
| 70 to 74 Years | 7 (4.2%) | 7 (1.9%) |
| 75 to 79 Years | 8 (4.9%) | 8 (2.2%) |
| 80 to 84 Years | 0 (0.0%) | 0 (0.0%) |
| 85 Years and over | 0 (0.0%) | 0 (0.0%) |
| Total | 165 (100.0%) | 367 (100.0%) |
Families and Households in Forestville
Median Family Size in Forestville
The median family size in Forestville is 3.03 persons per family, with single male/father families (10 | 6.5%) accounting for the largest median family size of 3.1 persons per family. On the other hand, married-couple families (24 | 15.6%) represent the smallest median family size with 2.71 persons per family.
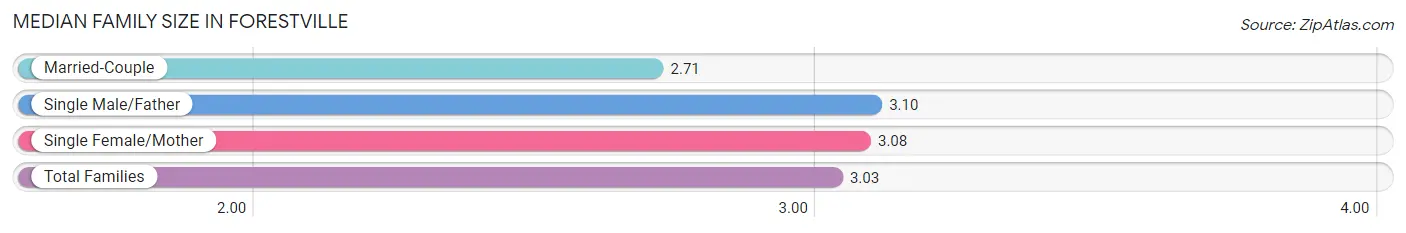
| Family Type | # Families | Family Size |
| Married-Couple | 24 (15.6%) | 2.71 |
| Single Male/Father | 10 (6.5%) | 3.10 |
| Single Female/Mother | 120 (77.9%) | 3.08 |
| Total Families | 154 (100.0%) | 3.03 |
Median Household Size in Forestville
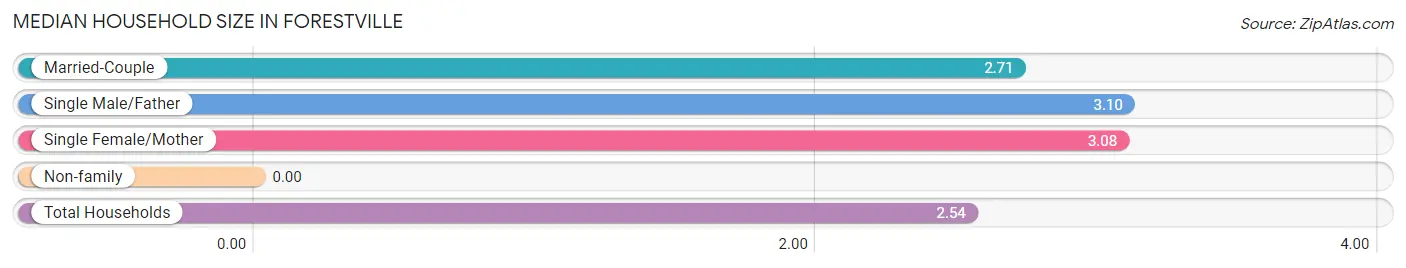
| Household Type | # Households | Household Size |
| Married-Couple | 24 (11.9%) | 2.71 |
| Single Male/Father | 10 (5.0%) | 3.10 |
| Single Female/Mother | 120 (59.4%) | 3.08 |
| Non-family | 48 (23.8%) | - |
| Total Households | 202 (100.0%) | 2.54 |
Household Size by Marriage Status in Forestville
Out of a total of 202 households in Forestville, 154 (76.2%) are family households, while 48 (23.8%) are nonfamily households. The most numerous type of family households are 3-person households, comprising 107, and the most common type of nonfamily households are 1-person households, comprising 48.
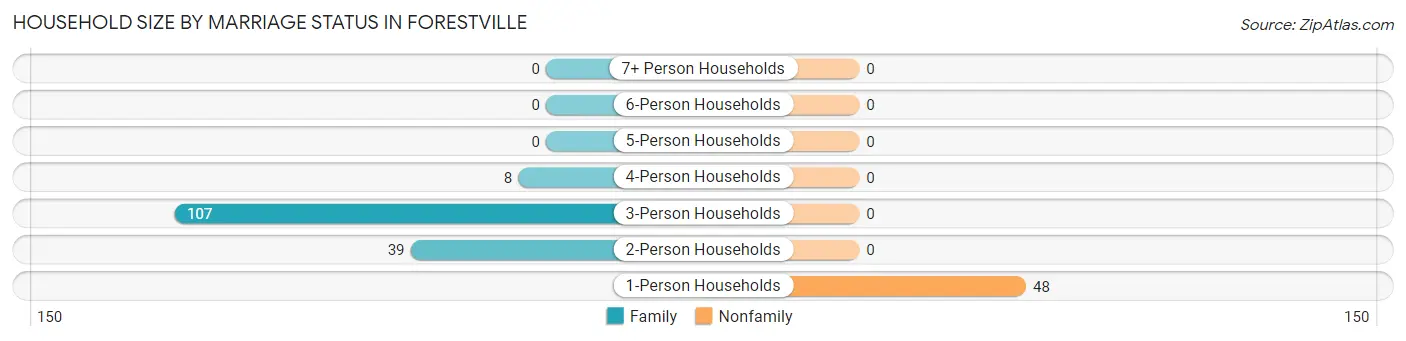
| Household Size | Family Households | Nonfamily Households |
| 1-Person Households | - | 48 (23.8%) |
| 2-Person Households | 39 (19.3%) | 0 (0.0%) |
| 3-Person Households | 107 (53.0%) | 0 (0.0%) |
| 4-Person Households | 8 (4.0%) | 0 (0.0%) |
| 5-Person Households | 0 (0.0%) | 0 (0.0%) |
| 6-Person Households | 0 (0.0%) | 0 (0.0%) |
| 7+ Person Households | 0 (0.0%) | 0 (0.0%) |
| Total | 154 (76.2%) | 48 (23.8%) |
Female Fertility in Forestville
Fertility by Age in Forestville
| Age Bracket | Women with Births | Births / 1,000 Women |
| 15 to 19 years | 0 (0.0%) | 0.0 |
| 20 to 34 years | 0 (0.0%) | 0.0 |
| 35 to 50 years | 0 (0.0%) | 0.0 |
| Total | 0 (0.0%) | 0.0 |
Fertility by Age by Marriage Status in Forestville
| Age Bracket | Married | Unmarried |
| 15 to 19 years | 0 (0.0%) | 0 (0.0%) |
| 20 to 34 years | 0 (0.0%) | 0 (0.0%) |
| 35 to 50 years | 0 (0.0%) | 0 (0.0%) |
| Total | 0 (0.0%) | 0 (0.0%) |
Fertility by Education in Forestville
| Educational Attainment | Women with Births | Births / 1,000 Women |
| Less than High School | 0 (0.0%) | 0.0 |
| High School Diploma | 0 (0.0%) | 0.0 |
| College or Associate's Degree | 0 (0.0%) | 0.0 |
| Bachelor's Degree | 0 (0.0%) | 0.0 |
| Graduate Degree | 0 (0.0%) | 0.0 |
| Total | 0 (0.0%) | 0.0 |
Fertility by Education by Marriage Status in Forestville
| Educational Attainment | Married | Unmarried |
| Less than High School | 0 (0.0%) | 0 (0.0%) |
| High School Diploma | 0 (0.0%) | 0 (0.0%) |
| College or Associate's Degree | 0 (0.0%) | 0 (0.0%) |
| Bachelor's Degree | 0 (0.0%) | 0 (0.0%) |
| Graduate Degree | 0 (0.0%) | 0 (0.0%) |
| Total | 0 (0.0%) | 0 (0.0%) |
Employment Characteristics in Forestville
Employment by Class of Employer in Forestville
Among the 213 employed individuals in Forestville, private company employees (72 | 33.8%), local government employees (67 | 31.5%), and state government employees (31 | 14.5%) make up the most common classes of employment.
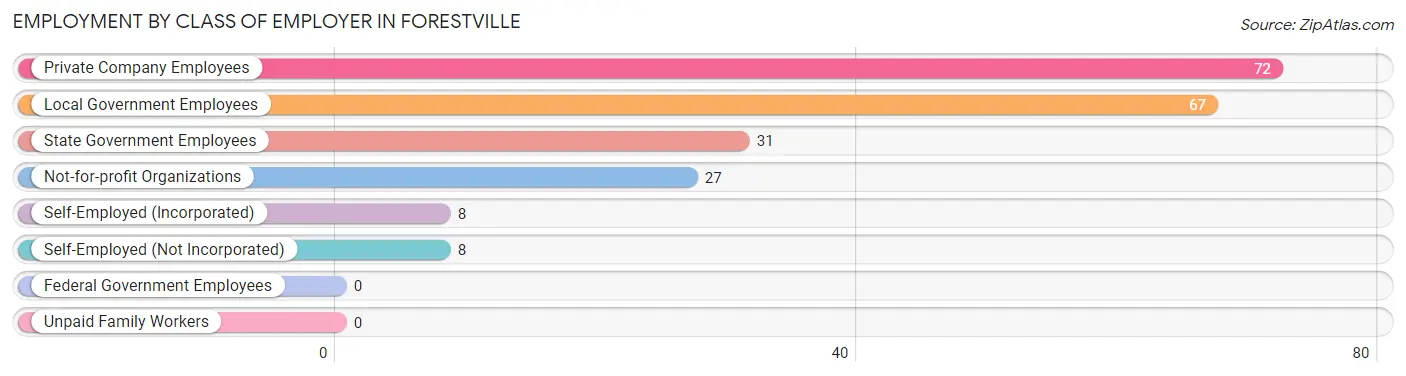
| Employer Class | # Employees | % Employees |
| Private Company Employees | 72 | 33.8% |
| Self-Employed (Incorporated) | 8 | 3.8% |
| Self-Employed (Not Incorporated) | 8 | 3.8% |
| Not-for-profit Organizations | 27 | 12.7% |
| Local Government Employees | 67 | 31.5% |
| State Government Employees | 31 | 14.5% |
| Federal Government Employees | 0 | 0.0% |
| Unpaid Family Workers | 0 | 0.0% |
| Total | 213 | 100.0% |
Employment Status by Age in Forestville
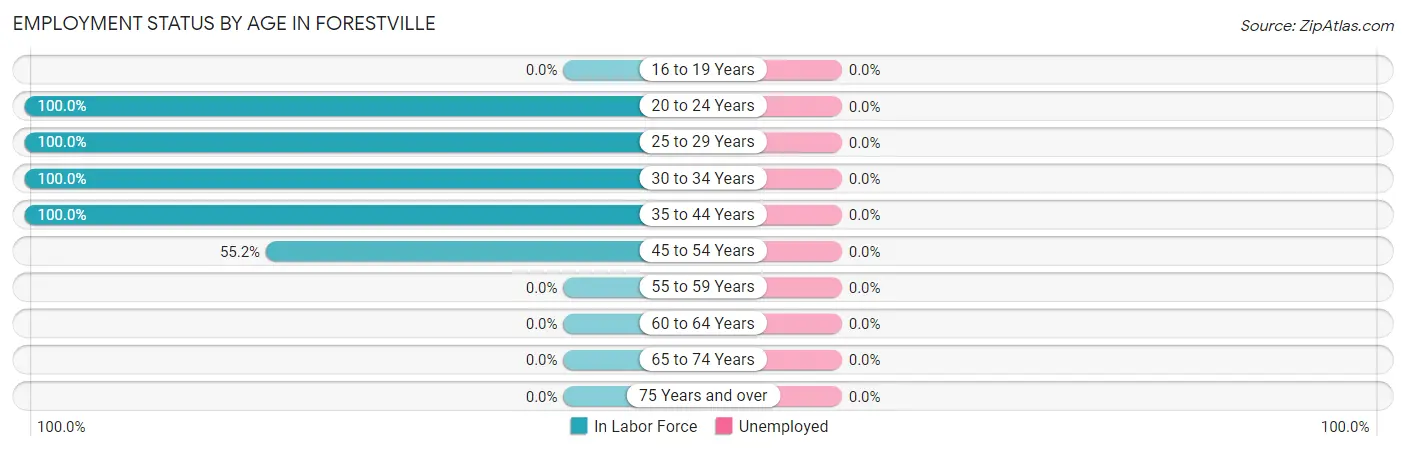
| Age Bracket | In Labor Force | Unemployed |
| 16 to 19 Years | 0 (0.0%) | 0 (0.0%) |
| 20 to 24 Years | 19 (100.0%) | 0 (0.0%) |
| 25 to 29 Years | 25 (100.0%) | 0 (0.0%) |
| 30 to 34 Years | 34 (100.0%) | 0 (0.0%) |
| 35 to 44 Years | 119 (100.0%) | 0 (0.0%) |
| 45 to 54 Years | 16 (55.2%) | 0 (0.0%) |
| 55 to 59 Years | 0 (0.0%) | 0 (0.0%) |
| 60 to 64 Years | 0 (0.0%) | 0 (0.0%) |
| 65 to 74 Years | 0 (0.0%) | 0 (0.0%) |
| 75 Years and over | 0 (0.0%) | 0 (0.0%) |
| Total | 213 (73.7%) | 0 (0.0%) |
Employment Status by Educational Attainment in Forestville
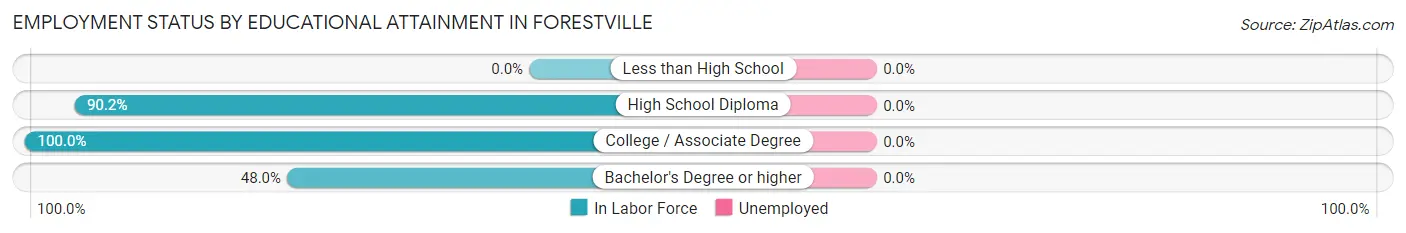
| Educational Attainment | In Labor Force | Unemployed |
| Less than High School | 0 (0.0%) | 0 (0.0%) |
| High School Diploma | 92 (90.2%) | 0 (0.0%) |
| College / Associate Degree | 90 (100.0%) | 0 (0.0%) |
| Bachelor's Degree or higher | 12 (48.0%) | 0 (0.0%) |
| Total | 194 (82.6%) | 0 (0.0%) |
Employment Occupations by Sex in Forestville
Management, Business, Science and Arts Occupations
The most common Management, Business, Science and Arts occupations in Forestville are Community & Social Service (27 | 12.7%), Education, Arts & Media (15 | 7.0%), and Education Instruction & Library (12 | 5.6%).
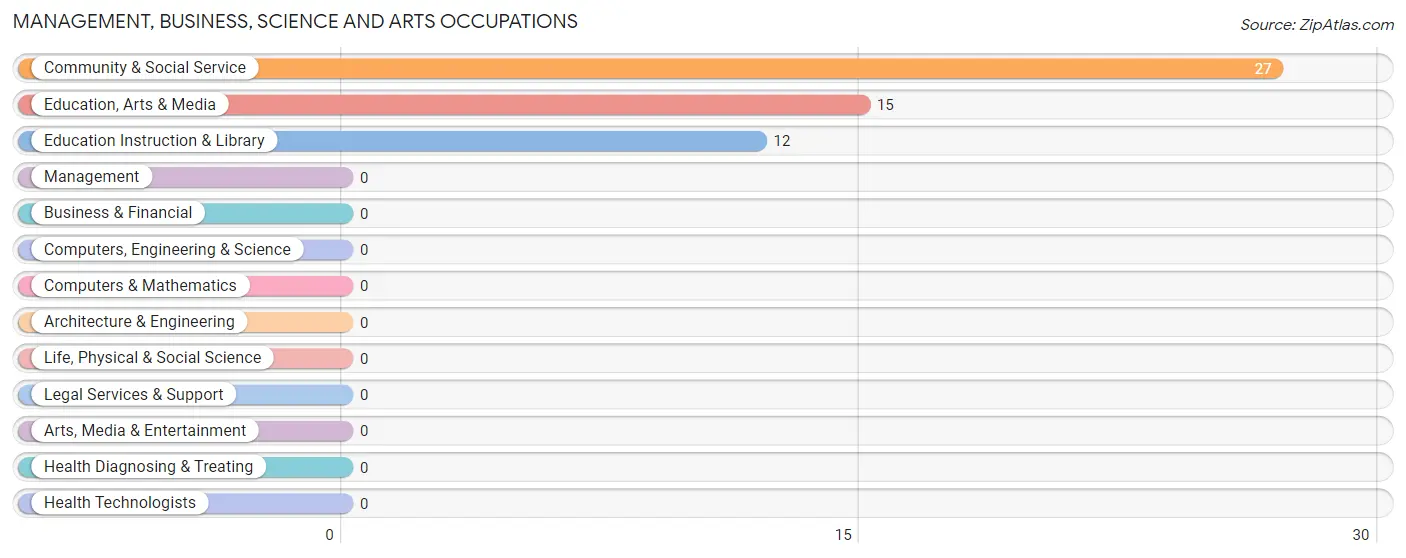
Management, Business, Science and Arts Occupations by Sex
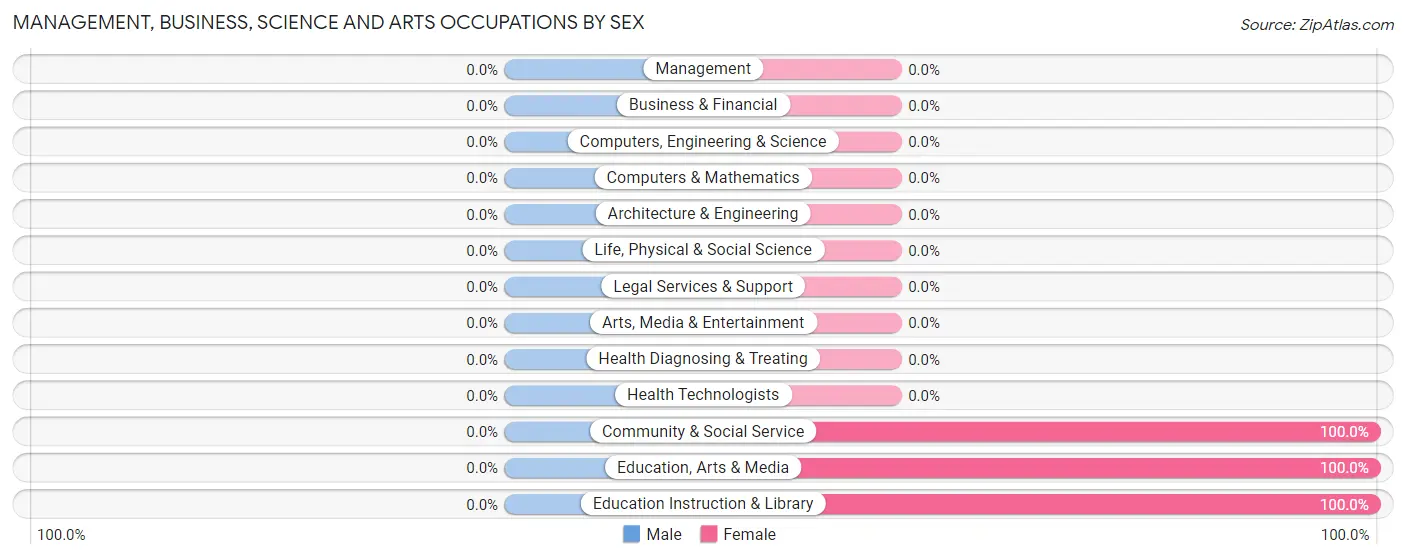
| Occupation | Male | Female |
| Management | 0 (0.0%) | 0 (0.0%) |
| Business & Financial | 0 (0.0%) | 0 (0.0%) |
| Computers, Engineering & Science | 0 (0.0%) | 0 (0.0%) |
| Computers & Mathematics | 0 (0.0%) | 0 (0.0%) |
| Architecture & Engineering | 0 (0.0%) | 0 (0.0%) |
| Life, Physical & Social Science | 0 (0.0%) | 0 (0.0%) |
| Community & Social Service | 0 (0.0%) | 27 (100.0%) |
| Education, Arts & Media | 0 (0.0%) | 15 (100.0%) |
| Legal Services & Support | 0 (0.0%) | 0 (0.0%) |
| Education Instruction & Library | 0 (0.0%) | 12 (100.0%) |
| Arts, Media & Entertainment | 0 (0.0%) | 0 (0.0%) |
| Health Diagnosing & Treating | 0 (0.0%) | 0 (0.0%) |
| Health Technologists | 0 (0.0%) | 0 (0.0%) |
| Total (Category) | 0 (0.0%) | 27 (100.0%) |
| Total (Overall) | 81 (38.0%) | 132 (62.0%) |
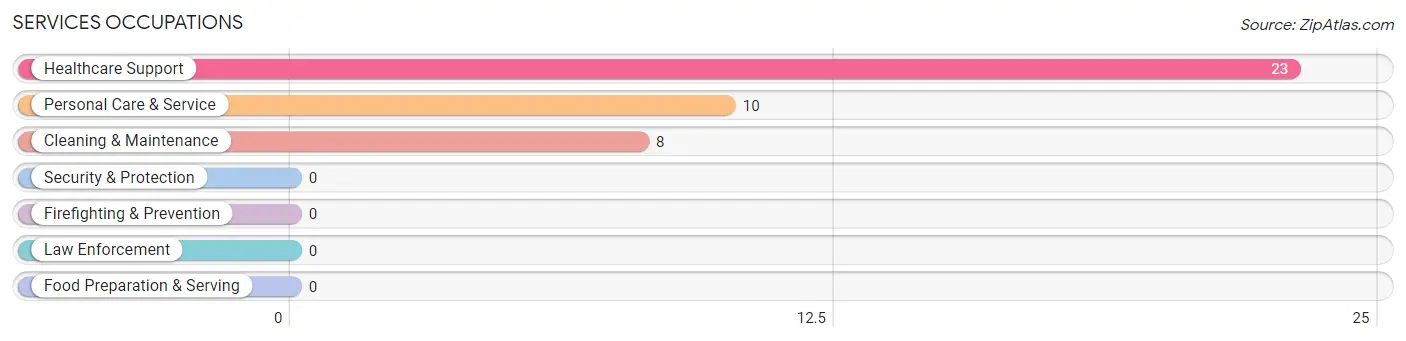
Services Occupations
The most common Services occupations in Forestville are Healthcare Support (23 | 10.8%), Personal Care & Service (10 | 4.7%), and Cleaning & Maintenance (8 | 3.8%).
Services Occupations by Sex
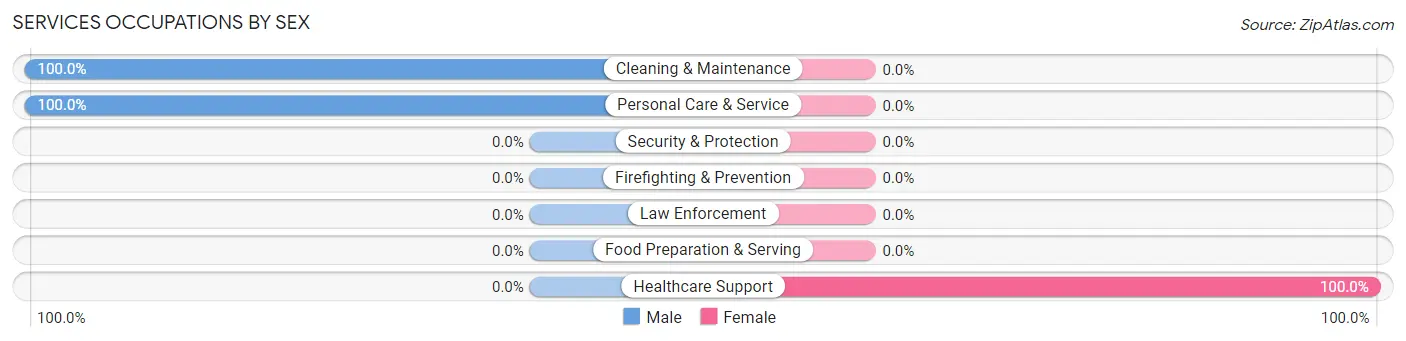
| Occupation | Male | Female |
| Healthcare Support | 0 (0.0%) | 23 (100.0%) |
| Security & Protection | 0 (0.0%) | 0 (0.0%) |
| Firefighting & Prevention | 0 (0.0%) | 0 (0.0%) |
| Law Enforcement | 0 (0.0%) | 0 (0.0%) |
| Food Preparation & Serving | 0 (0.0%) | 0 (0.0%) |
| Cleaning & Maintenance | 8 (100.0%) | 0 (0.0%) |
| Personal Care & Service | 10 (100.0%) | 0 (0.0%) |
| Total (Category) | 18 (43.9%) | 23 (56.1%) |
| Total (Overall) | 81 (38.0%) | 132 (62.0%) |
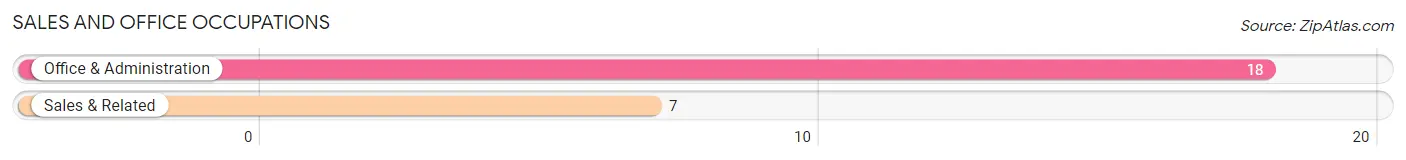
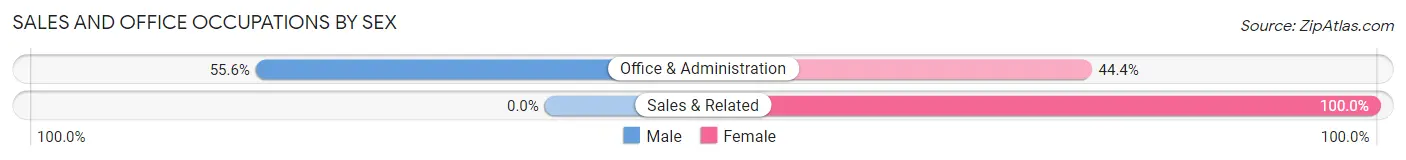
Sales and Office Occupations
The most common Sales and Office occupations in Forestville are Office & Administration (18 | 8.5%), and Sales & Related (7 | 3.3%).
Sales and Office Occupations by Sex
| Occupation | Male | Female |
| Sales & Related | 0 (0.0%) | 7 (100.0%) |
| Office & Administration | 10 (55.6%) | 8 (44.4%) |
| Total (Category) | 10 (40.0%) | 15 (60.0%) |
| Total (Overall) | 81 (38.0%) | 132 (62.0%) |
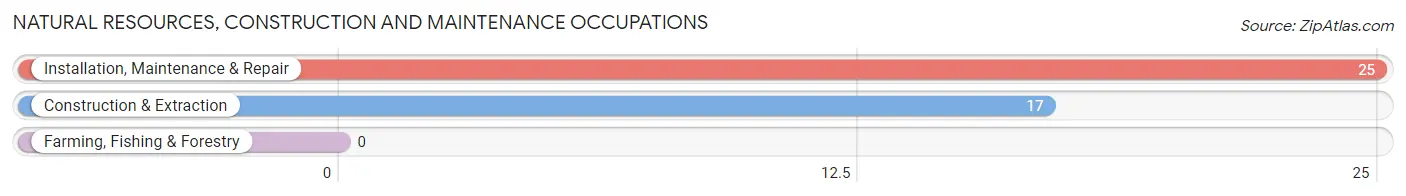
Natural Resources, Construction and Maintenance Occupations
The most common Natural Resources, Construction and Maintenance occupations in Forestville are Installation, Maintenance & Repair (25 | 11.7%), and Construction & Extraction (17 | 8.0%).
Natural Resources, Construction and Maintenance Occupations by Sex
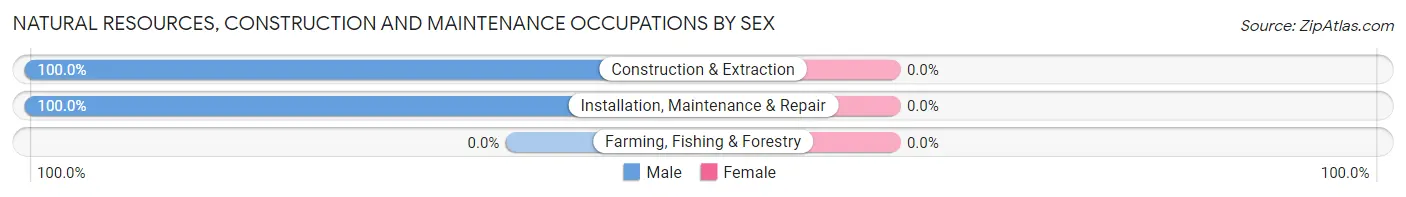
| Occupation | Male | Female |
| Farming, Fishing & Forestry | 0 (0.0%) | 0 (0.0%) |
| Construction & Extraction | 17 (100.0%) | 0 (0.0%) |
| Installation, Maintenance & Repair | 25 (100.0%) | 0 (0.0%) |
| Total (Category) | 42 (100.0%) | 0 (0.0%) |
| Total (Overall) | 81 (38.0%) | 132 (62.0%) |
Production, Transportation and Moving Occupations
The most common Production, Transportation and Moving occupations in Forestville are Transportation (67 | 31.5%), and Material Moving (11 | 5.2%).
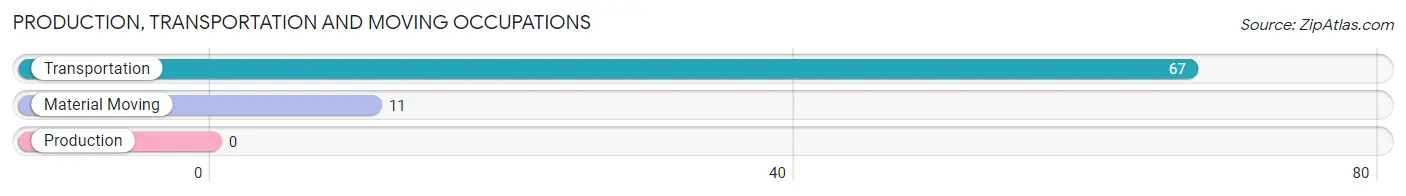
Production, Transportation and Moving Occupations by Sex
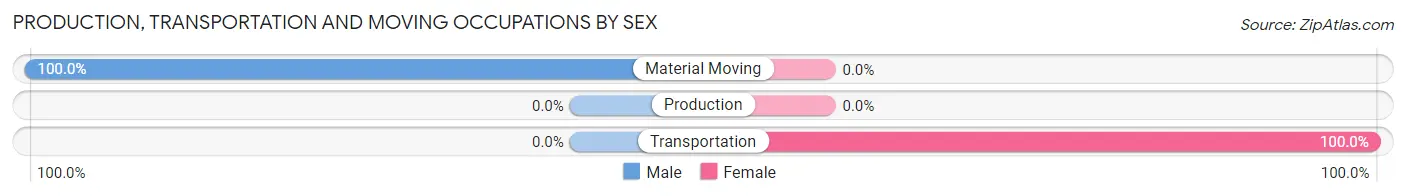
| Occupation | Male | Female |
| Production | 0 (0.0%) | 0 (0.0%) |
| Transportation | 0 (0.0%) | 67 (100.0%) |
| Material Moving | 11 (100.0%) | 0 (0.0%) |
| Total (Category) | 11 (14.1%) | 67 (85.9%) |
| Total (Overall) | 81 (38.0%) | 132 (62.0%) |
Employment Industries by Sex in Forestville
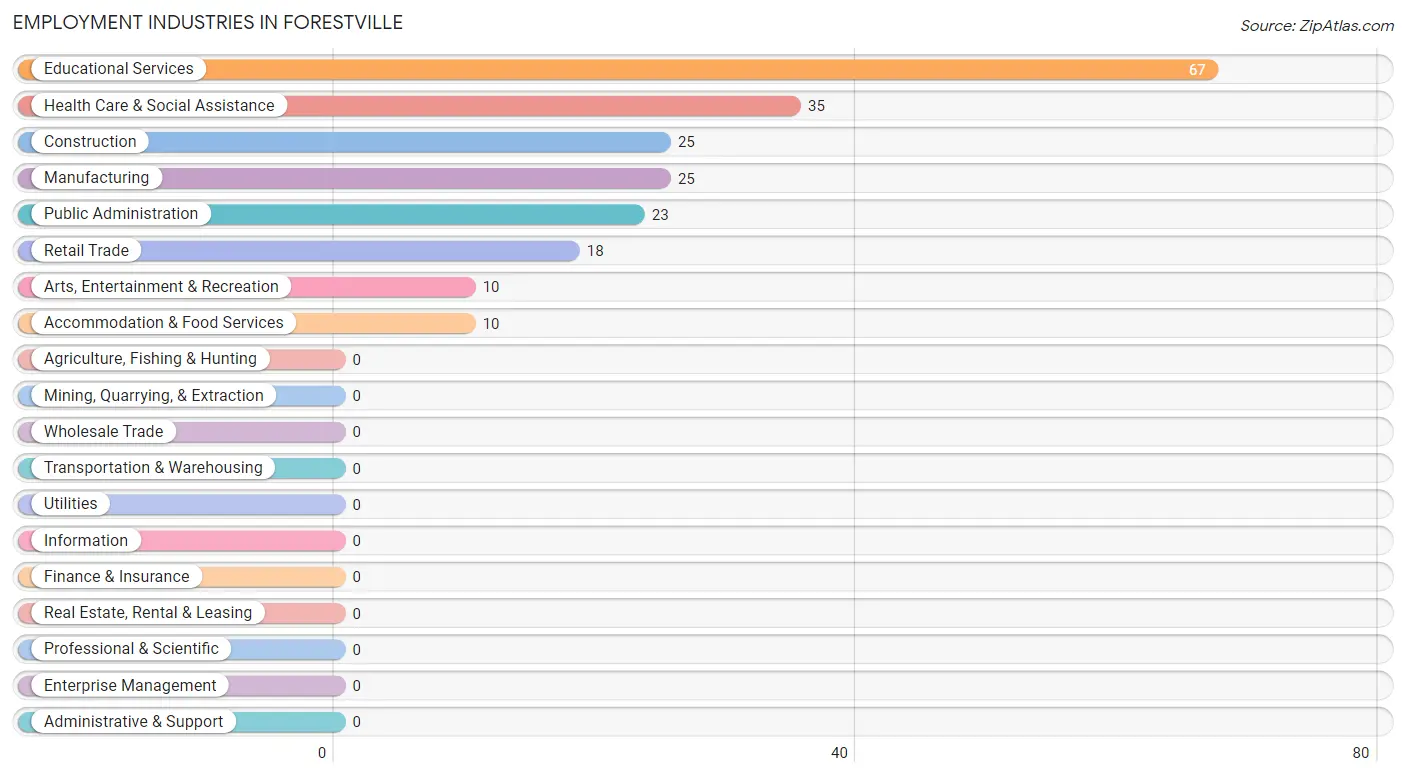
Employment Industries in Forestville
The major employment industries in Forestville include Educational Services (67 | 31.5%), Health Care & Social Assistance (35 | 16.4%), Construction (25 | 11.7%), Manufacturing (25 | 11.7%), and Public Administration (23 | 10.8%).
Employment Industries by Sex in Forestville
The Forestville industries that see more men than women are Manufacturing (100.0%), Arts, Entertainment & Recreation (100.0%), and Accommodation & Food Services (100.0%), whereas the industries that tend to have a higher number of women are Educational Services (100.0%), Public Administration (100.0%), and Health Care & Social Assistance (77.1%).
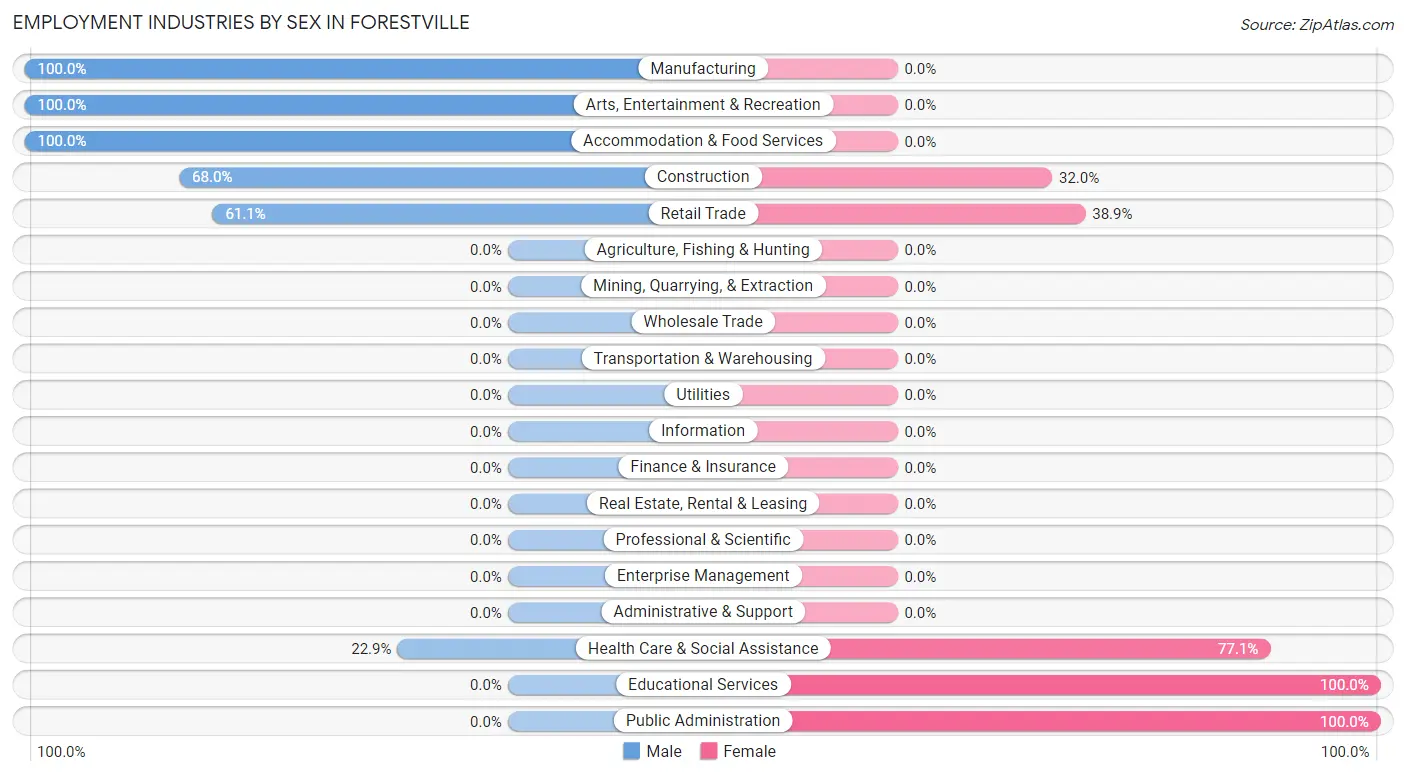
| Industry | Male | Female |
| Agriculture, Fishing & Hunting | 0 (0.0%) | 0 (0.0%) |
| Mining, Quarrying, & Extraction | 0 (0.0%) | 0 (0.0%) |
| Construction | 17 (68.0%) | 8 (32.0%) |
| Manufacturing | 25 (100.0%) | 0 (0.0%) |
| Wholesale Trade | 0 (0.0%) | 0 (0.0%) |
| Retail Trade | 11 (61.1%) | 7 (38.9%) |
| Transportation & Warehousing | 0 (0.0%) | 0 (0.0%) |
| Utilities | 0 (0.0%) | 0 (0.0%) |
| Information | 0 (0.0%) | 0 (0.0%) |
| Finance & Insurance | 0 (0.0%) | 0 (0.0%) |
| Real Estate, Rental & Leasing | 0 (0.0%) | 0 (0.0%) |
| Professional & Scientific | 0 (0.0%) | 0 (0.0%) |
| Enterprise Management | 0 (0.0%) | 0 (0.0%) |
| Administrative & Support | 0 (0.0%) | 0 (0.0%) |
| Educational Services | 0 (0.0%) | 67 (100.0%) |
| Health Care & Social Assistance | 8 (22.9%) | 27 (77.1%) |
| Arts, Entertainment & Recreation | 10 (100.0%) | 0 (0.0%) |
| Accommodation & Food Services | 10 (100.0%) | 0 (0.0%) |
| Public Administration | 0 (0.0%) | 23 (100.0%) |
| Total | 81 (38.0%) | 132 (62.0%) |
Education in Forestville
School Enrollment in Forestville
The most common levels of schooling among the 218 students in Forestville are middle school (178 | 81.7%), and high school (40 | 18.3%).
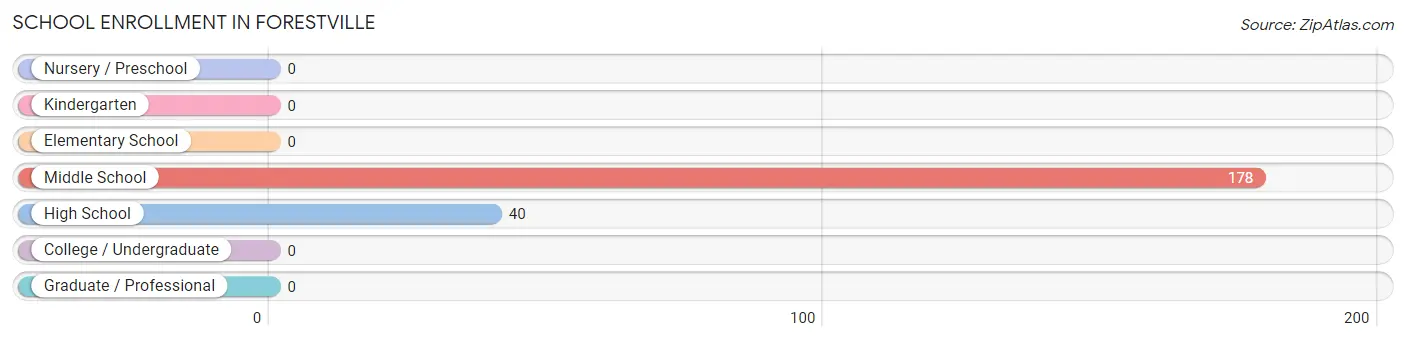
| School Level | # Students | % Students |
| Nursery / Preschool | 0 | 0.0% |
| Kindergarten | 0 | 0.0% |
| Elementary School | 0 | 0.0% |
| Middle School | 178 | 81.7% |
| High School | 40 | 18.3% |
| College / Undergraduate | 0 | 0.0% |
| Graduate / Professional | 0 | 0.0% |
| Total | 218 | 100.0% |
School Enrollment by Age by Funding Source in Forestville
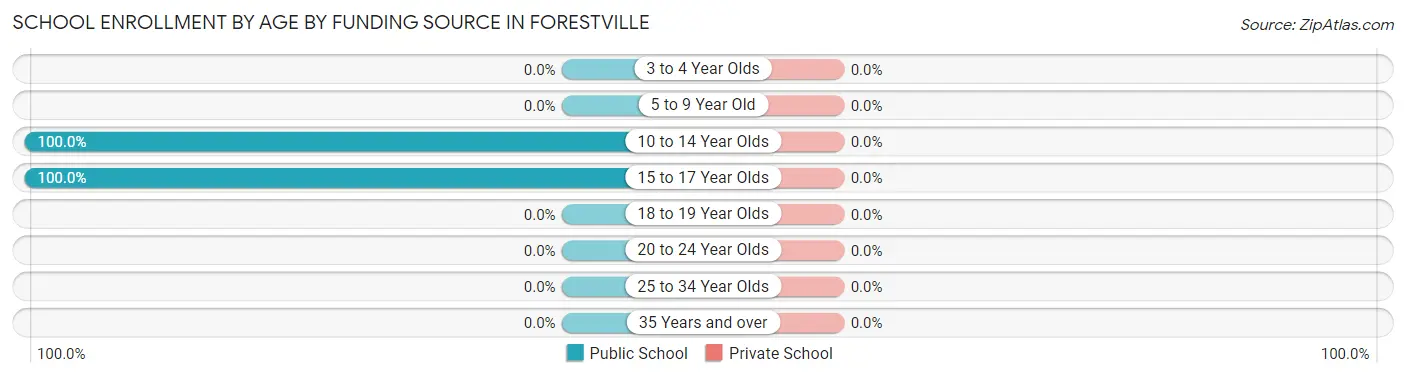
| Age Bracket | Public School | Private School |
| 3 to 4 Year Olds | 0 (0.0%) | 0 (0.0%) |
| 5 to 9 Year Old | 0 (0.0%) | 0 (0.0%) |
| 10 to 14 Year Olds | 204 (100.0%) | 0 (0.0%) |
| 15 to 17 Year Olds | 14 (100.0%) | 0 (0.0%) |
| 18 to 19 Year Olds | 0 (0.0%) | 0 (0.0%) |
| 20 to 24 Year Olds | 0 (0.0%) | 0 (0.0%) |
| 25 to 34 Year Olds | 0 (0.0%) | 0 (0.0%) |
| 35 Years and over | 0 (0.0%) | 0 (0.0%) |
| Total | 218 (100.0%) | 0 (0.0%) |
Educational Attainment by Field of Study in Forestville
Social sciences (13 | 40.6%), education (12 | 37.5%), and bio, nature & agricultural (7 | 21.9%) are the most common fields of study among 32 individuals in Forestville who have obtained a bachelor's degree or higher.
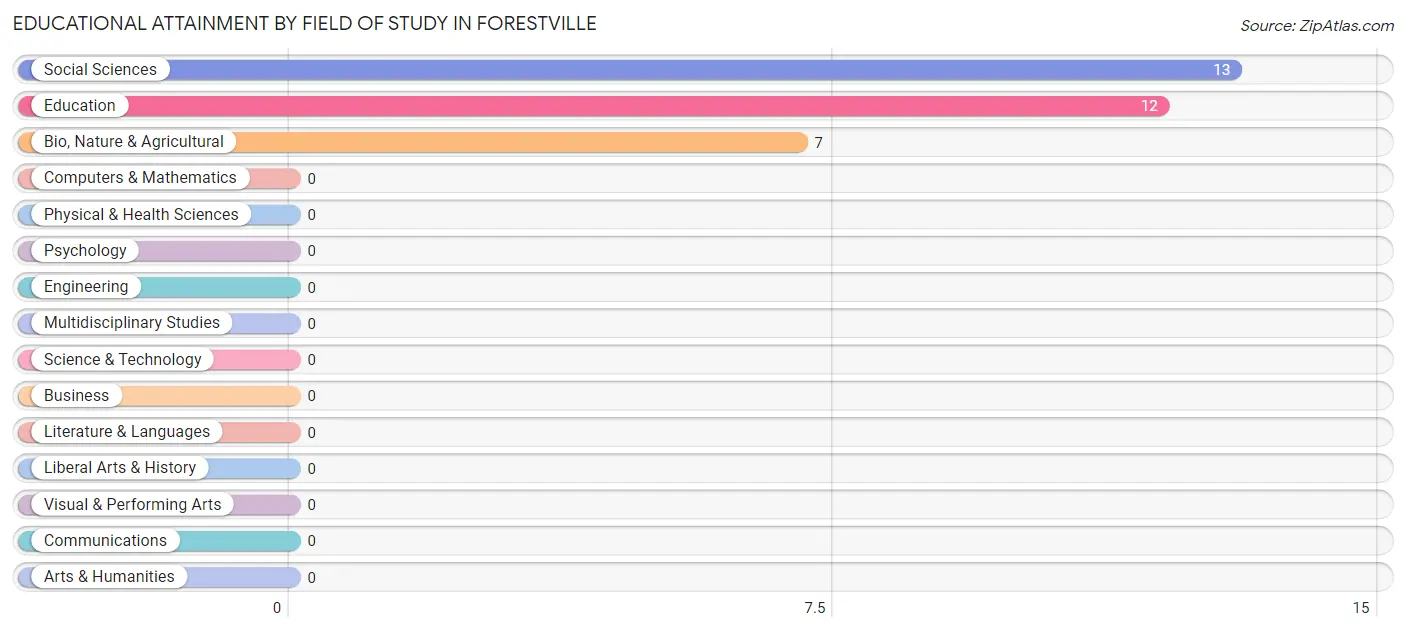
| Field of Study | # Graduates | % Graduates |
| Computers & Mathematics | 0 | 0.0% |
| Bio, Nature & Agricultural | 7 | 21.9% |
| Physical & Health Sciences | 0 | 0.0% |
| Psychology | 0 | 0.0% |
| Social Sciences | 13 | 40.6% |
| Engineering | 0 | 0.0% |
| Multidisciplinary Studies | 0 | 0.0% |
| Science & Technology | 0 | 0.0% |
| Business | 0 | 0.0% |
| Education | 12 | 37.5% |
| Literature & Languages | 0 | 0.0% |
| Liberal Arts & History | 0 | 0.0% |
| Visual & Performing Arts | 0 | 0.0% |
| Communications | 0 | 0.0% |
| Arts & Humanities | 0 | 0.0% |
| Total | 32 | 100.0% |
Transportation & Commute in Forestville
Vehicle Availability by Sex in Forestville
The most prevalent vehicle ownership categories in Forestville are males with 4 vehicles (48, accounting for 59.3%) and females with 4 vehicles (8, making up 36.4%).
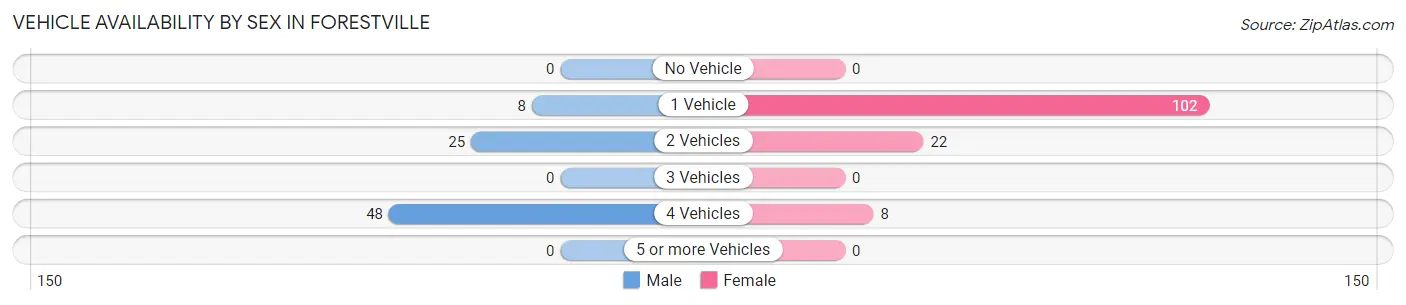
| Vehicles Available | Male | Female |
| No Vehicle | 0 (0.0%) | 0 (0.0%) |
| 1 Vehicle | 8 (9.9%) | 102 (77.3%) |
| 2 Vehicles | 25 (30.9%) | 22 (16.7%) |
| 3 Vehicles | 0 (0.0%) | 0 (0.0%) |
| 4 Vehicles | 48 (59.3%) | 8 (6.1%) |
| 5 or more Vehicles | 0 (0.0%) | 0 (0.0%) |
| Total | 81 (100.0%) | 132 (100.0%) |
Commute Time in Forestville
The most frequently occuring commute durations in Forestville are 20 to 24 minutes (74 commuters, 34.7%), 15 to 19 minutes (66 commuters, 31.0%), and 5 to 9 minutes (25 commuters, 11.7%).
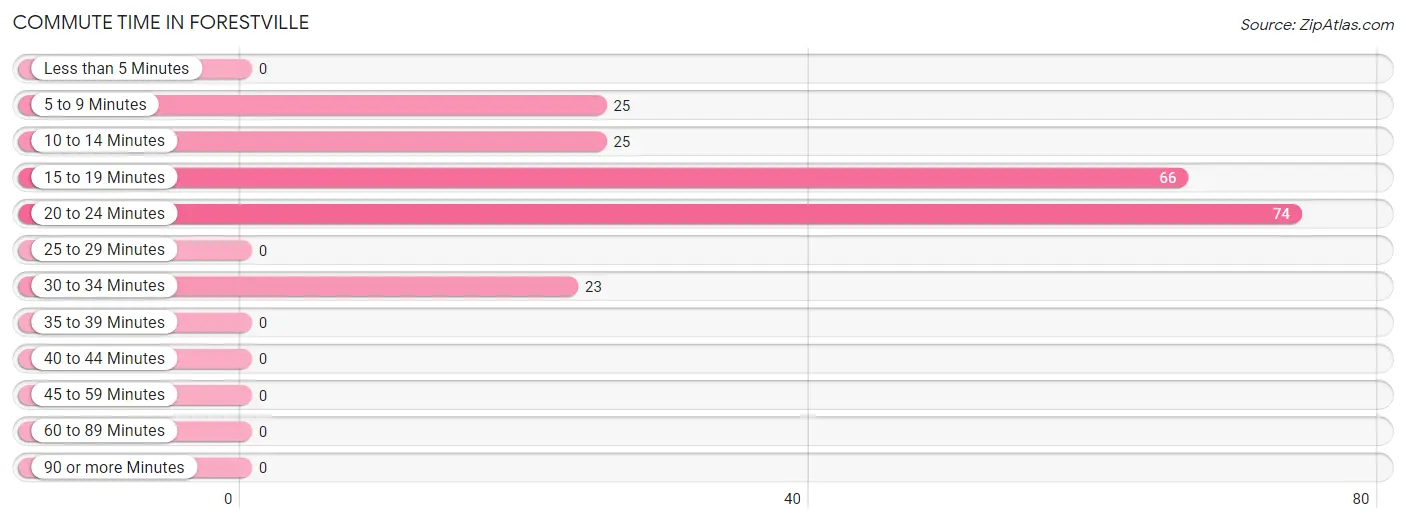
| Commute Time | # Commuters | % Commuters |
| Less than 5 Minutes | 0 | 0.0% |
| 5 to 9 Minutes | 25 | 11.7% |
| 10 to 14 Minutes | 25 | 11.7% |
| 15 to 19 Minutes | 66 | 31.0% |
| 20 to 24 Minutes | 74 | 34.7% |
| 25 to 29 Minutes | 0 | 0.0% |
| 30 to 34 Minutes | 23 | 10.8% |
| 35 to 39 Minutes | 0 | 0.0% |
| 40 to 44 Minutes | 0 | 0.0% |
| 45 to 59 Minutes | 0 | 0.0% |
| 60 to 89 Minutes | 0 | 0.0% |
| 90 or more Minutes | 0 | 0.0% |
Commute Time by Sex in Forestville
The most common commute times in Forestville are 15 to 19 minutes (39 commuters, 48.1%) for males and 20 to 24 minutes (74 commuters, 56.1%) for females.
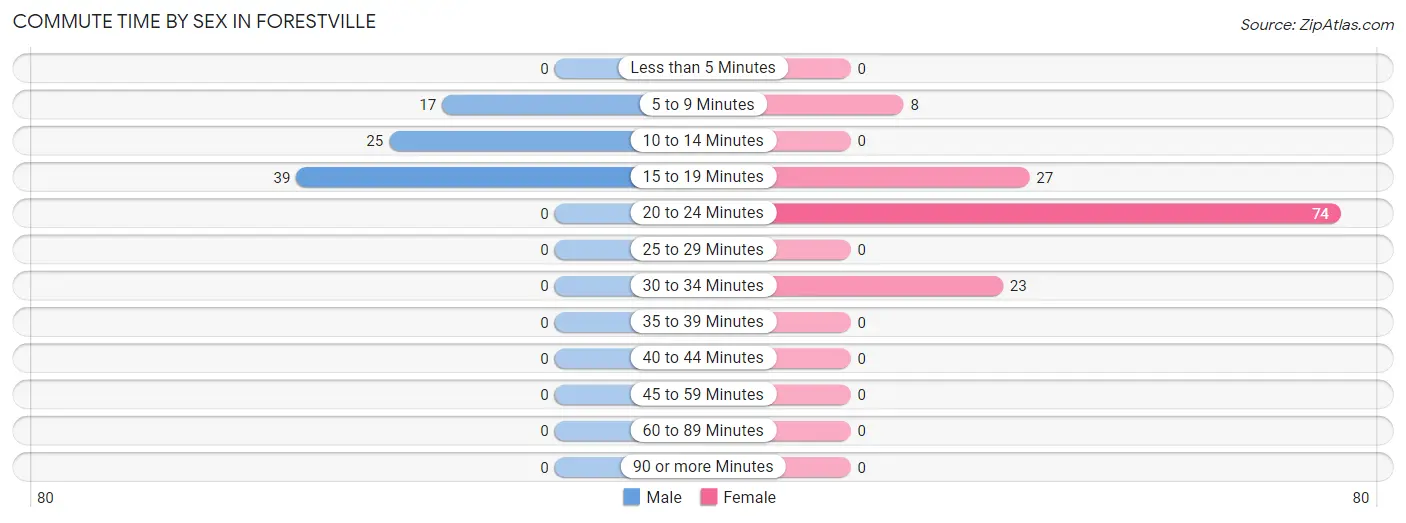
| Commute Time | Male | Female |
| Less than 5 Minutes | 0 (0.0%) | 0 (0.0%) |
| 5 to 9 Minutes | 17 (21.0%) | 8 (6.1%) |
| 10 to 14 Minutes | 25 (30.9%) | 0 (0.0%) |
| 15 to 19 Minutes | 39 (48.1%) | 27 (20.4%) |
| 20 to 24 Minutes | 0 (0.0%) | 74 (56.1%) |
| 25 to 29 Minutes | 0 (0.0%) | 0 (0.0%) |
| 30 to 34 Minutes | 0 (0.0%) | 23 (17.4%) |
| 35 to 39 Minutes | 0 (0.0%) | 0 (0.0%) |
| 40 to 44 Minutes | 0 (0.0%) | 0 (0.0%) |
| 45 to 59 Minutes | 0 (0.0%) | 0 (0.0%) |
| 60 to 89 Minutes | 0 (0.0%) | 0 (0.0%) |
| 90 or more Minutes | 0 (0.0%) | 0 (0.0%) |
Time of Departure to Work by Sex in Forestville
The most frequent times of departure to work in Forestville are 7:00 AM to 7:29 AM (27, 33.3%) for males and 7:30 AM to 7:59 AM (67, 50.8%) for females.
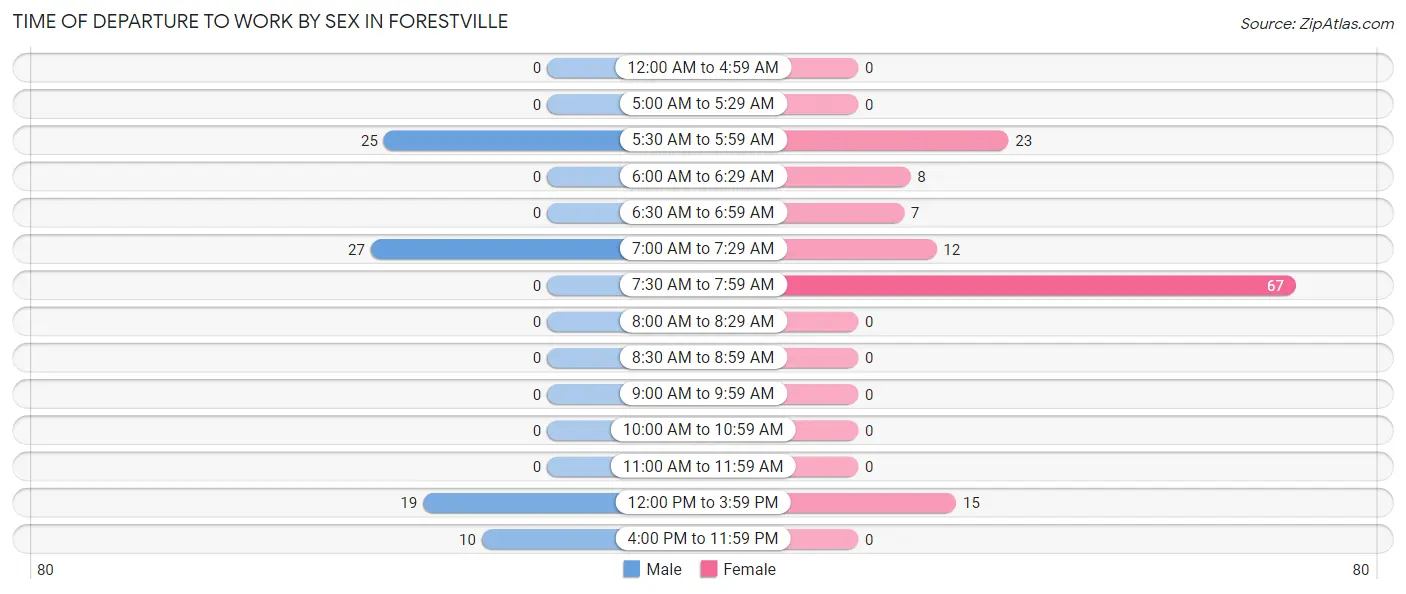
| Time of Departure | Male | Female |
| 12:00 AM to 4:59 AM | 0 (0.0%) | 0 (0.0%) |
| 5:00 AM to 5:29 AM | 0 (0.0%) | 0 (0.0%) |
| 5:30 AM to 5:59 AM | 25 (30.9%) | 23 (17.4%) |
| 6:00 AM to 6:29 AM | 0 (0.0%) | 8 (6.1%) |
| 6:30 AM to 6:59 AM | 0 (0.0%) | 7 (5.3%) |
| 7:00 AM to 7:29 AM | 27 (33.3%) | 12 (9.1%) |
| 7:30 AM to 7:59 AM | 0 (0.0%) | 67 (50.8%) |
| 8:00 AM to 8:29 AM | 0 (0.0%) | 0 (0.0%) |
| 8:30 AM to 8:59 AM | 0 (0.0%) | 0 (0.0%) |
| 9:00 AM to 9:59 AM | 0 (0.0%) | 0 (0.0%) |
| 10:00 AM to 10:59 AM | 0 (0.0%) | 0 (0.0%) |
| 11:00 AM to 11:59 AM | 0 (0.0%) | 0 (0.0%) |
| 12:00 PM to 3:59 PM | 19 (23.5%) | 15 (11.4%) |
| 4:00 PM to 11:59 PM | 10 (12.3%) | 0 (0.0%) |
| Total | 81 (100.0%) | 132 (100.0%) |
Housing Occupancy in Forestville
Occupancy by Ownership in Forestville
Of the total 202 dwellings in Forestville, owner-occupied units account for 112 (55.4%), while renter-occupied units make up 90 (44.6%).
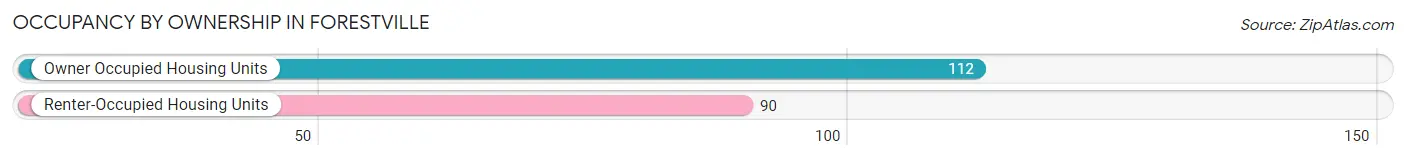
| Occupancy | # Housing Units | % Housing Units |
| Owner Occupied Housing Units | 112 | 55.4% |
| Renter-Occupied Housing Units | 90 | 44.6% |
| Total Occupied Housing Units | 202 | 100.0% |
Occupancy by Household Size in Forestville
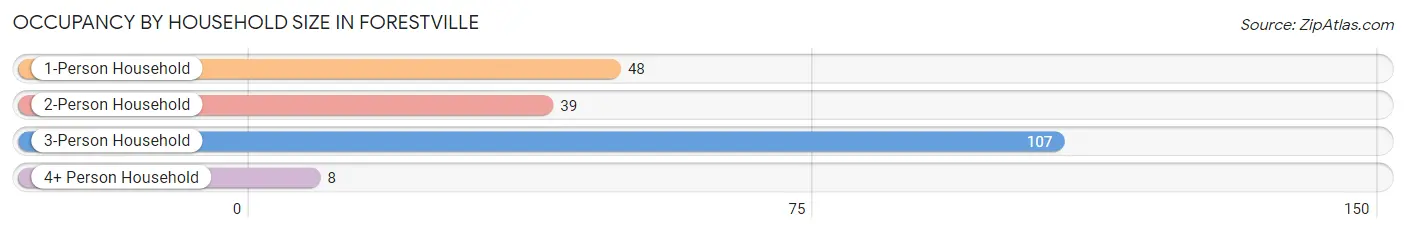
| Household Size | # Housing Units | % Housing Units |
| 1-Person Household | 48 | 23.8% |
| 2-Person Household | 39 | 19.3% |
| 3-Person Household | 107 | 53.0% |
| 4+ Person Household | 8 | 4.0% |
| Total Housing Units | 202 | 100.0% |
Occupancy by Ownership by Household Size in Forestville
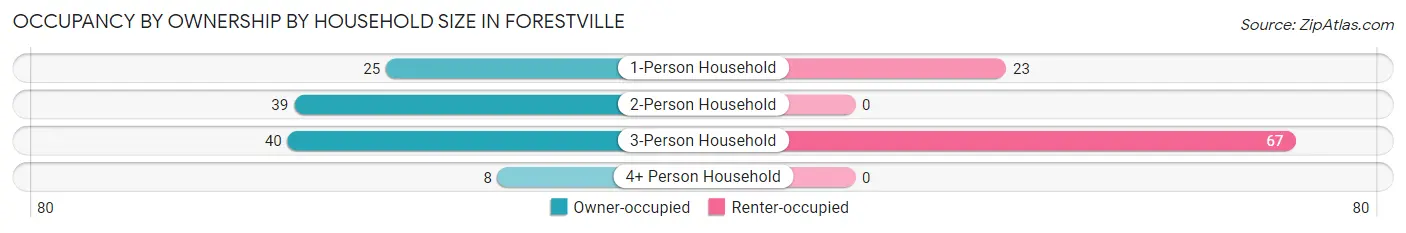
| Household Size | Owner-occupied | Renter-occupied |
| 1-Person Household | 25 (52.1%) | 23 (47.9%) |
| 2-Person Household | 39 (100.0%) | 0 (0.0%) |
| 3-Person Household | 40 (37.4%) | 67 (62.6%) |
| 4+ Person Household | 8 (100.0%) | 0 (0.0%) |
| Total Housing Units | 112 (55.4%) | 90 (44.6%) |
Occupancy by Educational Attainment in Forestville
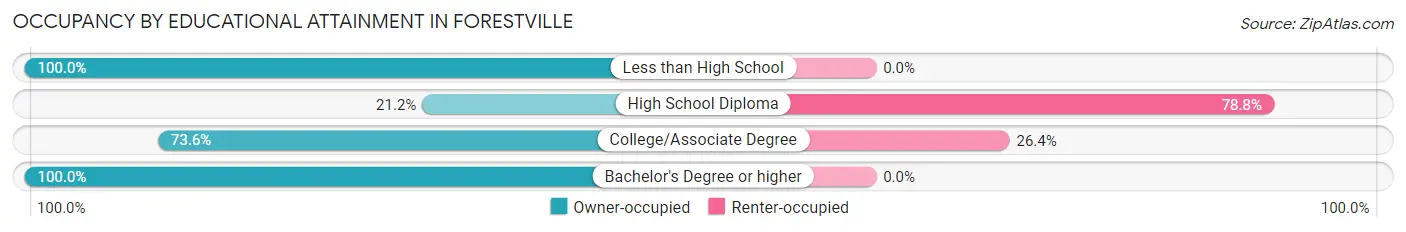
| Household Size | Owner-occupied | Renter-occupied |
| Less than High School | 5 (100.0%) | 0 (0.0%) |
| High School Diploma | 18 (21.2%) | 67 (78.8%) |
| College/Associate Degree | 64 (73.6%) | 23 (26.4%) |
| Bachelor's Degree or higher | 25 (100.0%) | 0 (0.0%) |
Occupancy by Age of Householder in Forestville
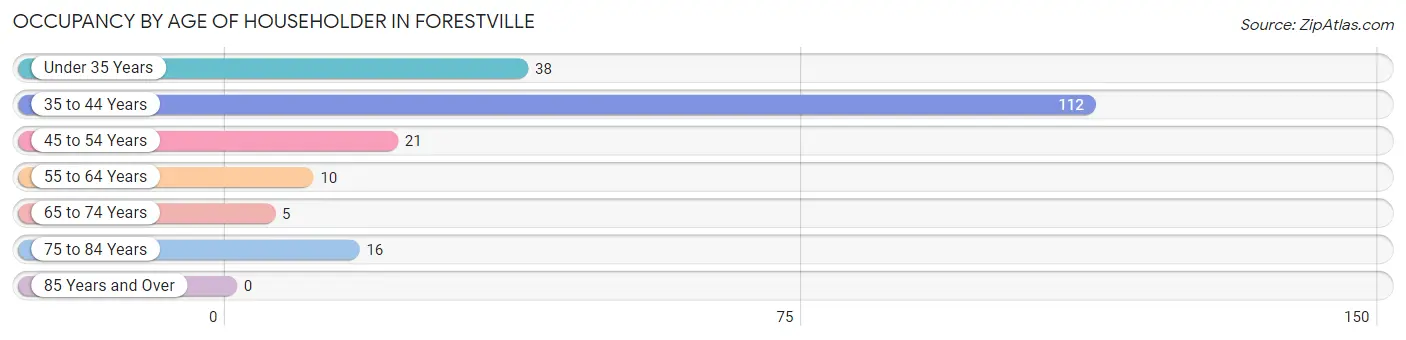
| Age Bracket | # Households | % Households |
| Under 35 Years | 38 | 18.8% |
| 35 to 44 Years | 112 | 55.4% |
| 45 to 54 Years | 21 | 10.4% |
| 55 to 64 Years | 10 | 5.0% |
| 65 to 74 Years | 5 | 2.5% |
| 75 to 84 Years | 16 | 7.9% |
| 85 Years and Over | 0 | 0.0% |
| Total | 202 | 100.0% |
Housing Finances in Forestville
Median Income by Occupancy in Forestville
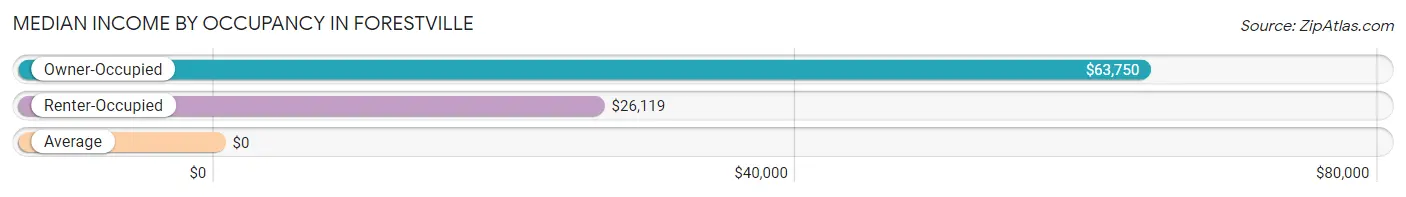
| Occupancy Type | # Households | Median Income |
| Owner-Occupied | 112 (55.4%) | $63,750 |
| Renter-Occupied | 90 (44.6%) | $26,119 |
| Average | 202 (100.0%) | $0 |
Occupancy by Householder Income Bracket in Forestville
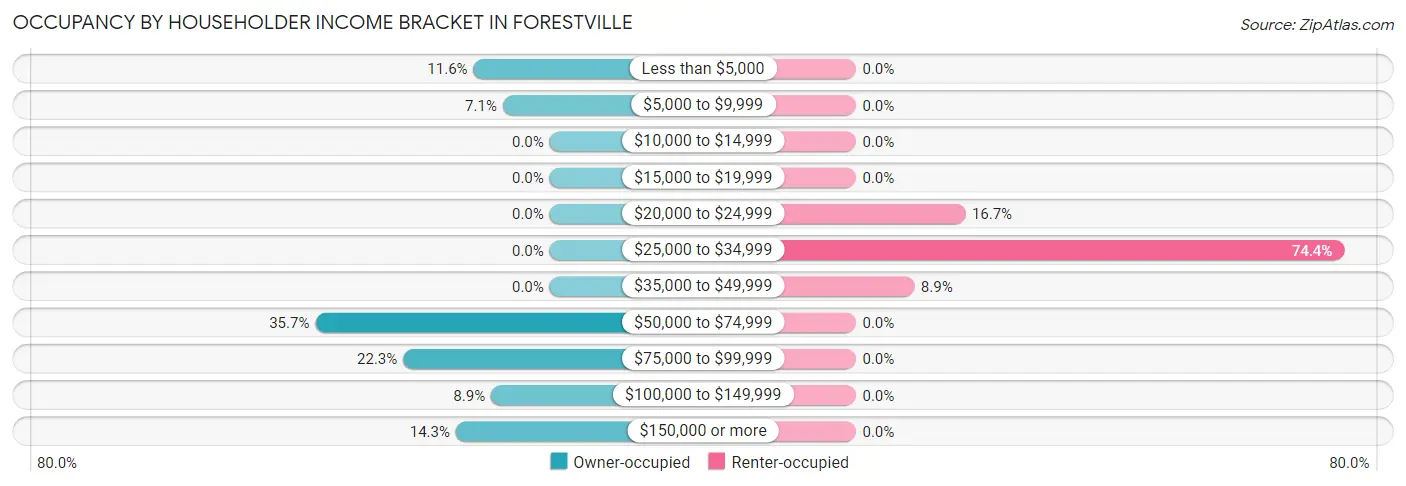
| Income Bracket | Owner-occupied | Renter-occupied |
| Less than $5,000 | 13 (11.6%) | 0 (0.0%) |
| $5,000 to $9,999 | 8 (7.1%) | 0 (0.0%) |
| $10,000 to $14,999 | 0 (0.0%) | 0 (0.0%) |
| $15,000 to $19,999 | 0 (0.0%) | 0 (0.0%) |
| $20,000 to $24,999 | 0 (0.0%) | 15 (16.7%) |
| $25,000 to $34,999 | 0 (0.0%) | 67 (74.4%) |
| $35,000 to $49,999 | 0 (0.0%) | 8 (8.9%) |
| $50,000 to $74,999 | 40 (35.7%) | 0 (0.0%) |
| $75,000 to $99,999 | 25 (22.3%) | 0 (0.0%) |
| $100,000 to $149,999 | 10 (8.9%) | 0 (0.0%) |
| $150,000 or more | 16 (14.3%) | 0 (0.0%) |
| Total | 112 (100.0%) | 90 (100.0%) |
Monthly Housing Cost Tiers in Forestville
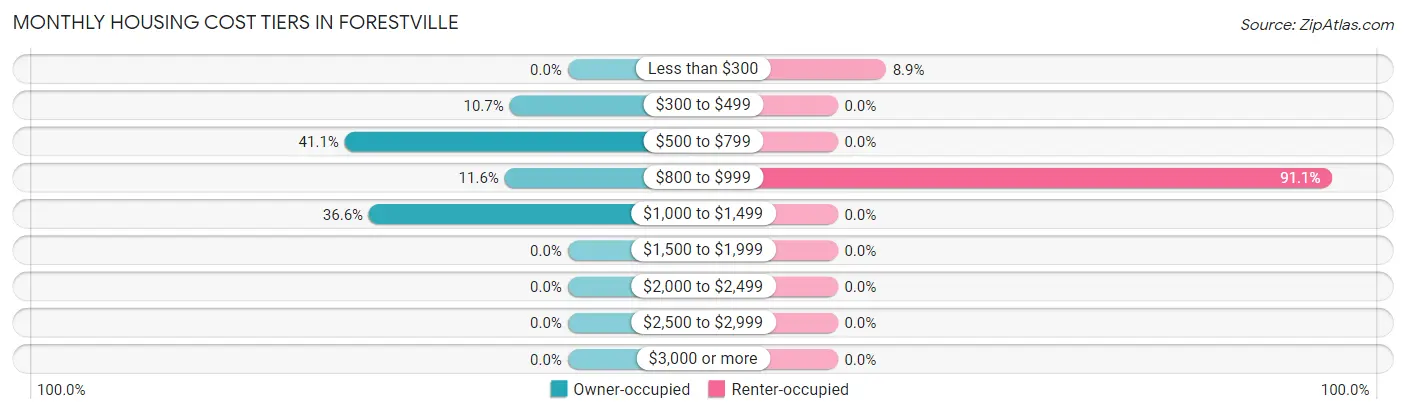
| Monthly Cost | Owner-occupied | Renter-occupied |
| Less than $300 | 0 (0.0%) | 8 (8.9%) |
| $300 to $499 | 12 (10.7%) | 0 (0.0%) |
| $500 to $799 | 46 (41.1%) | 0 (0.0%) |
| $800 to $999 | 13 (11.6%) | 82 (91.1%) |
| $1,000 to $1,499 | 41 (36.6%) | 0 (0.0%) |
| $1,500 to $1,999 | 0 (0.0%) | 0 (0.0%) |
| $2,000 to $2,499 | 0 (0.0%) | 0 (0.0%) |
| $2,500 to $2,999 | 0 (0.0%) | 0 (0.0%) |
| $3,000 or more | 0 (0.0%) | 0 (0.0%) |
| Total | 112 (100.0%) | 90 (100.0%) |
Physical Housing Characteristics in Forestville
Housing Structures in Forestville
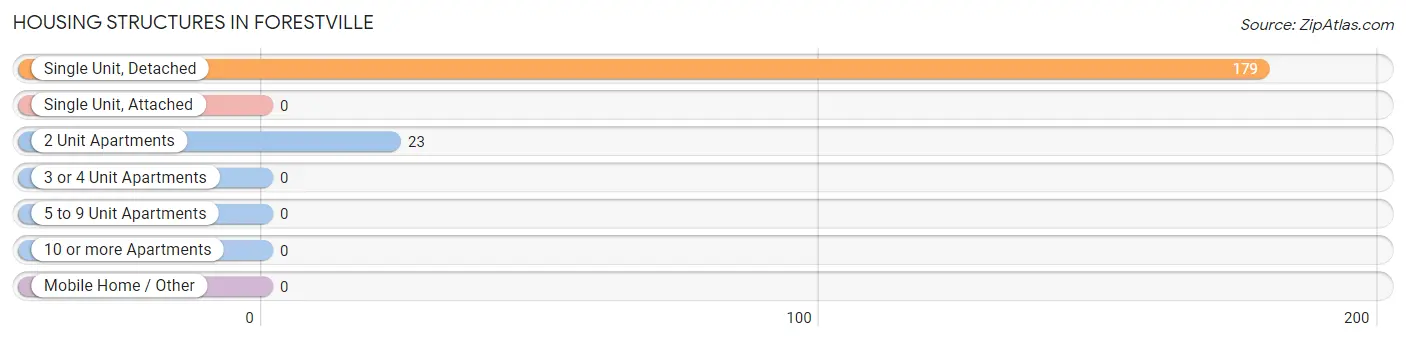
| Structure Type | # Housing Units | % Housing Units |
| Single Unit, Detached | 179 | 88.6% |
| Single Unit, Attached | 0 | 0.0% |
| 2 Unit Apartments | 23 | 11.4% |
| 3 or 4 Unit Apartments | 0 | 0.0% |
| 5 to 9 Unit Apartments | 0 | 0.0% |
| 10 or more Apartments | 0 | 0.0% |
| Mobile Home / Other | 0 | 0.0% |
| Total | 202 | 100.0% |
Housing Structures by Occupancy in Forestville
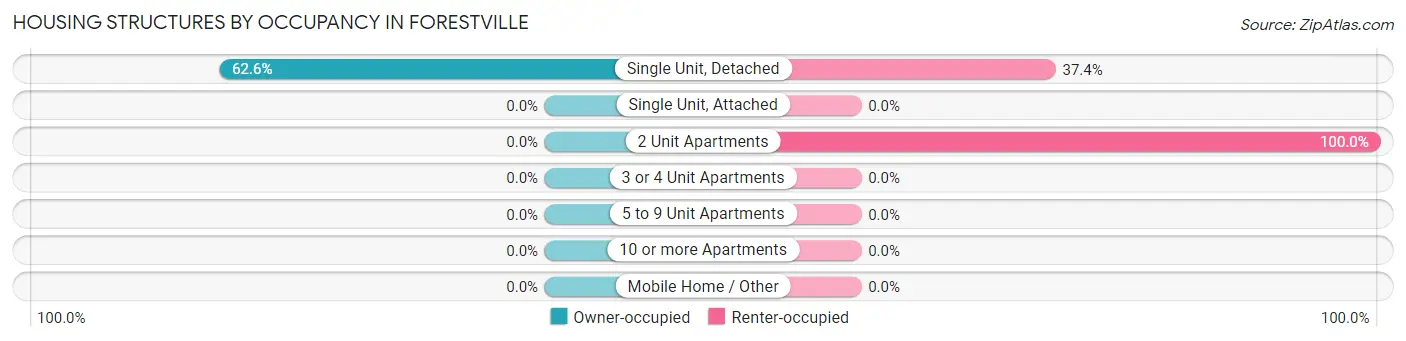
| Structure Type | Owner-occupied | Renter-occupied |
| Single Unit, Detached | 112 (62.6%) | 67 (37.4%) |
| Single Unit, Attached | 0 (0.0%) | 0 (0.0%) |
| 2 Unit Apartments | 0 (0.0%) | 23 (100.0%) |
| 3 or 4 Unit Apartments | 0 (0.0%) | 0 (0.0%) |
| 5 to 9 Unit Apartments | 0 (0.0%) | 0 (0.0%) |
| 10 or more Apartments | 0 (0.0%) | 0 (0.0%) |
| Mobile Home / Other | 0 (0.0%) | 0 (0.0%) |
| Total | 112 (55.4%) | 90 (44.6%) |
Housing Structures by Number of Rooms in Forestville
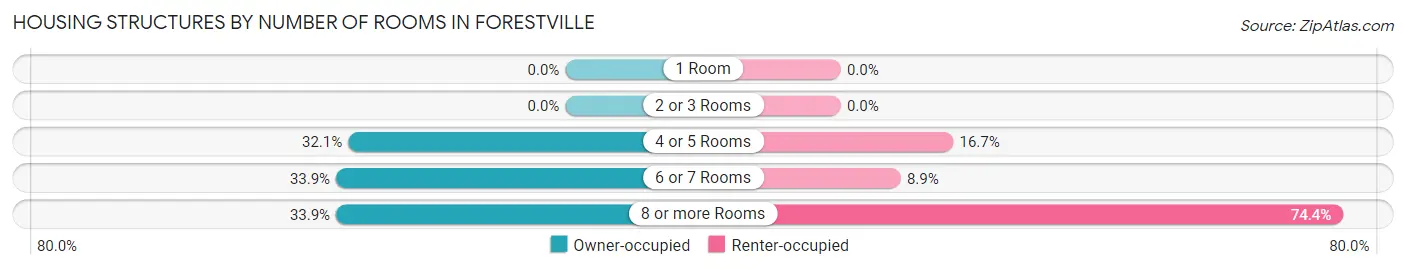
| Number of Rooms | Owner-occupied | Renter-occupied |
| 1 Room | 0 (0.0%) | 0 (0.0%) |
| 2 or 3 Rooms | 0 (0.0%) | 0 (0.0%) |
| 4 or 5 Rooms | 36 (32.1%) | 15 (16.7%) |
| 6 or 7 Rooms | 38 (33.9%) | 8 (8.9%) |
| 8 or more Rooms | 38 (33.9%) | 67 (74.4%) |
| Total | 112 (100.0%) | 90 (100.0%) |
Housing Structure by Heating Type in Forestville
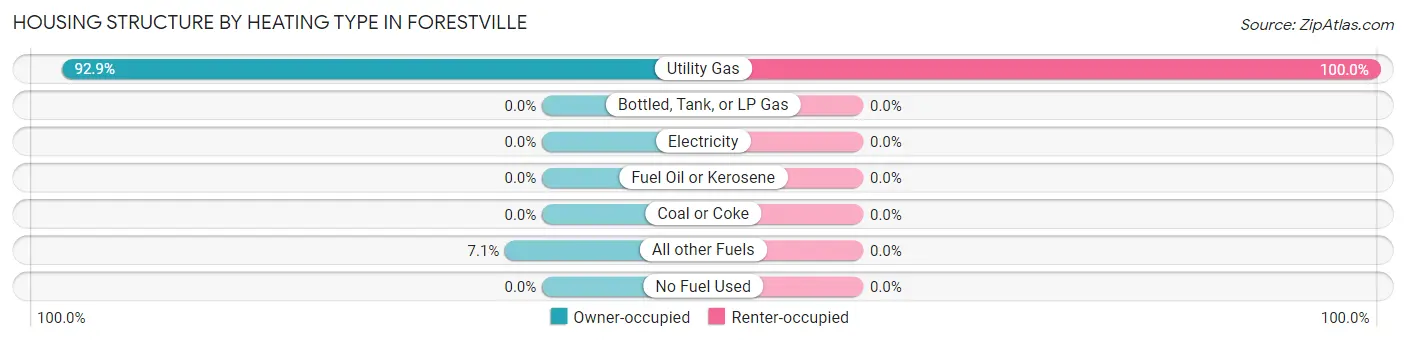
| Heating Type | Owner-occupied | Renter-occupied |
| Utility Gas | 104 (92.9%) | 90 (100.0%) |
| Bottled, Tank, or LP Gas | 0 (0.0%) | 0 (0.0%) |
| Electricity | 0 (0.0%) | 0 (0.0%) |
| Fuel Oil or Kerosene | 0 (0.0%) | 0 (0.0%) |
| Coal or Coke | 0 (0.0%) | 0 (0.0%) |
| All other Fuels | 8 (7.1%) | 0 (0.0%) |
| No Fuel Used | 0 (0.0%) | 0 (0.0%) |
| Total | 112 (100.0%) | 90 (100.0%) |
Household Vehicle Usage in Forestville
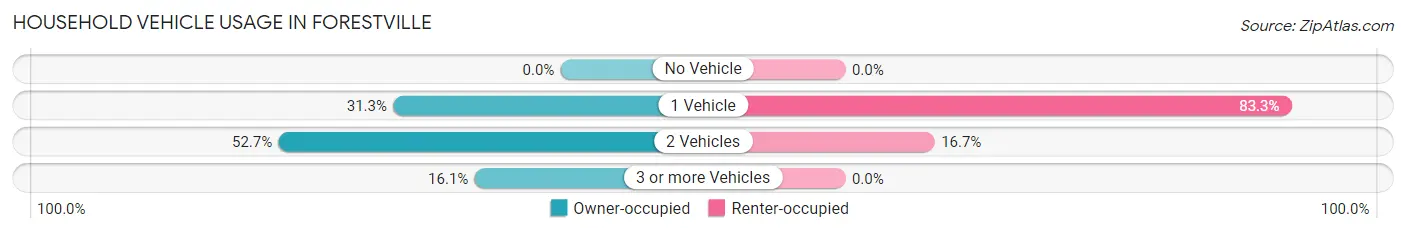
| Vehicles per Household | Owner-occupied | Renter-occupied |
| No Vehicle | 0 (0.0%) | 0 (0.0%) |
| 1 Vehicle | 35 (31.2%) | 75 (83.3%) |
| 2 Vehicles | 59 (52.7%) | 15 (16.7%) |
| 3 or more Vehicles | 18 (16.1%) | 0 (0.0%) |
| Total | 112 (100.0%) | 90 (100.0%) |
Real Estate & Mortgages in Forestville
Real Estate and Mortgage Overview in Forestville
| Characteristic | Without Mortgage | With Mortgage |
| Housing Units | 33 | 79 |
| Median Property Value | $98,300 | $93,400 |
| Median Household Income | - | - |
| Monthly Housing Costs | $556 | $0 |
| Real Estate Taxes | $2,214 | $23 |
Property Value by Mortgage Status in Forestville
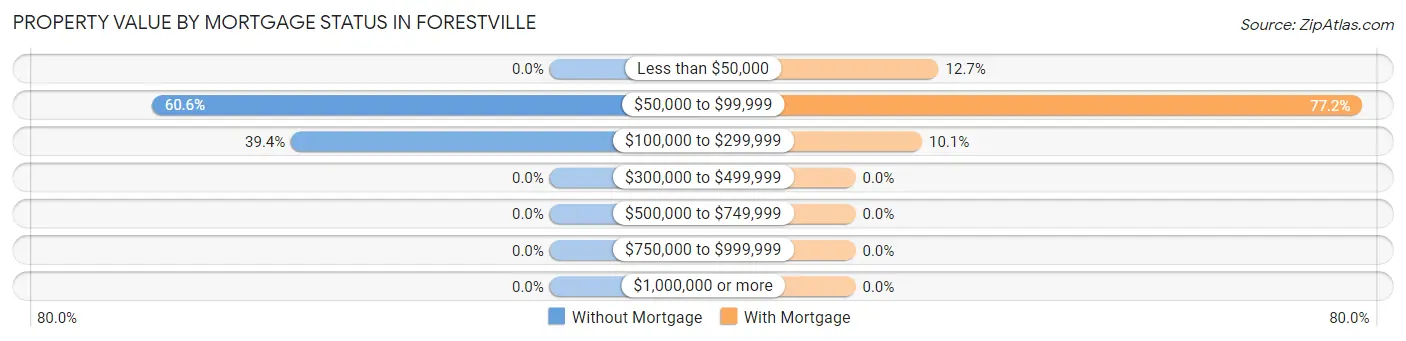
| Property Value | Without Mortgage | With Mortgage |
| Less than $50,000 | 0 (0.0%) | 10 (12.7%) |
| $50,000 to $99,999 | 20 (60.6%) | 61 (77.2%) |
| $100,000 to $299,999 | 13 (39.4%) | 8 (10.1%) |
| $300,000 to $499,999 | 0 (0.0%) | 0 (0.0%) |
| $500,000 to $749,999 | 0 (0.0%) | 0 (0.0%) |
| $750,000 to $999,999 | 0 (0.0%) | 0 (0.0%) |
| $1,000,000 or more | 0 (0.0%) | 0 (0.0%) |
| Total | 33 (100.0%) | 79 (100.0%) |
Household Income by Mortgage Status in Forestville
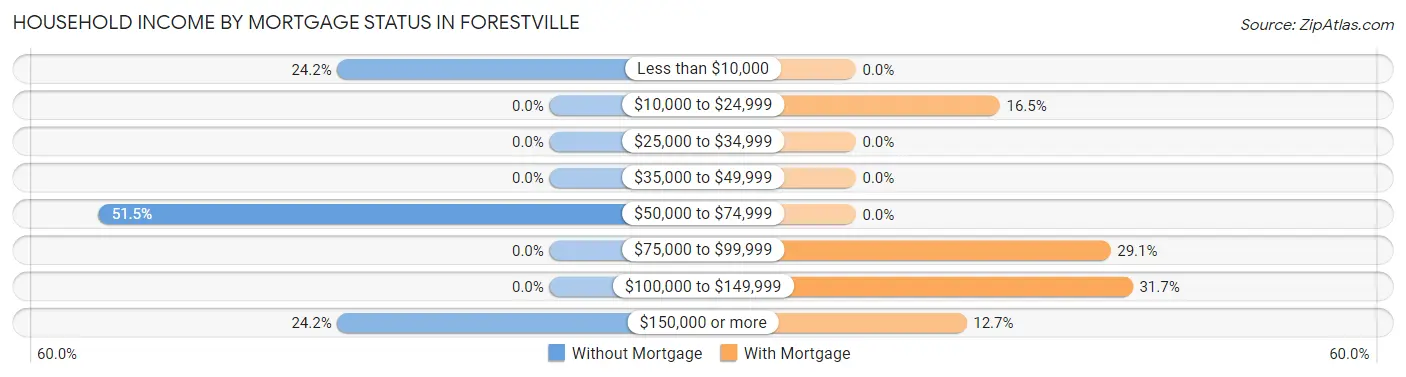
| Household Income | Without Mortgage | With Mortgage |
| Less than $10,000 | 8 (24.2%) | 0 (0.0%) |
| $10,000 to $24,999 | 0 (0.0%) | 13 (16.5%) |
| $25,000 to $34,999 | 0 (0.0%) | 0 (0.0%) |
| $35,000 to $49,999 | 0 (0.0%) | 0 (0.0%) |
| $50,000 to $74,999 | 17 (51.5%) | 0 (0.0%) |
| $75,000 to $99,999 | 0 (0.0%) | 23 (29.1%) |
| $100,000 to $149,999 | 0 (0.0%) | 25 (31.7%) |
| $150,000 or more | 8 (24.2%) | 10 (12.7%) |
| Total | 33 (100.0%) | 79 (100.0%) |
Property Value to Household Income Ratio in Forestville
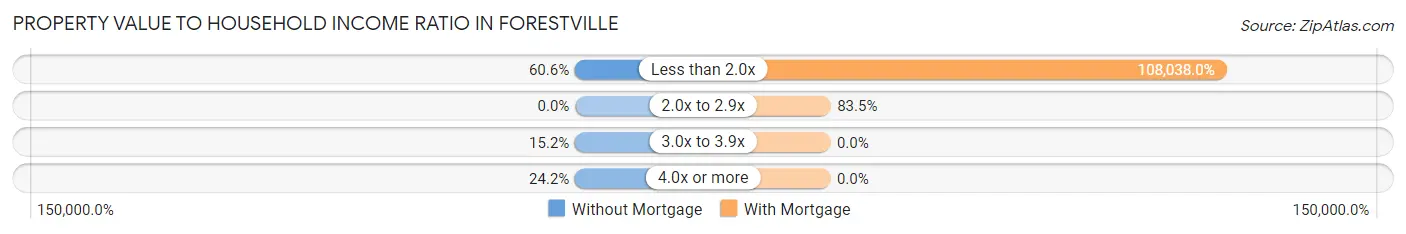
| Value-to-Income Ratio | Without Mortgage | With Mortgage |
| Less than 2.0x | 20 (60.6%) | 85,350 (108,038.0%) |
| 2.0x to 2.9x | 0 (0.0%) | 66 (83.5%) |
| 3.0x to 3.9x | 5 (15.1%) | 0 (0.0%) |
| 4.0x or more | 8 (24.2%) | 0 (0.0%) |
| Total | 33 (100.0%) | 79 (100.0%) |
Real Estate Taxes by Mortgage Status in Forestville
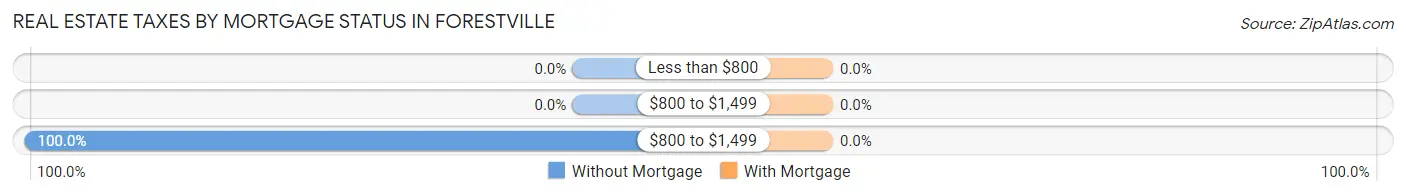
| Property Taxes | Without Mortgage | With Mortgage |
| Less than $800 | 0 (0.0%) | 0 (0.0%) |
| $800 to $1,499 | 0 (0.0%) | 0 (0.0%) |
| $800 to $1,499 | 33 (100.0%) | 0 (0.0%) |
| Total | 33 (100.0%) | 79 (100.0%) |
Health & Disability in Forestville
Health Insurance Coverage by Age in Forestville
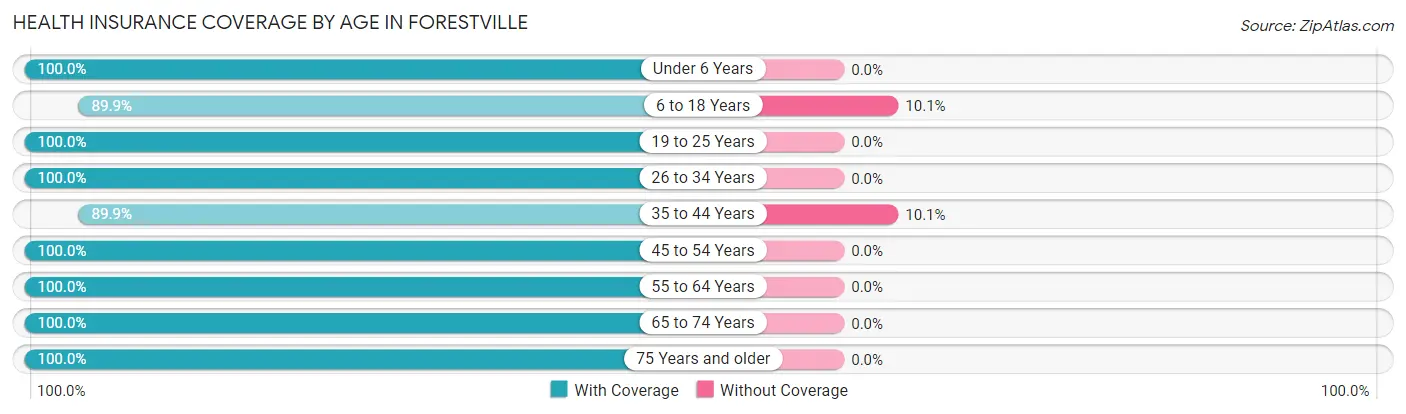
| Age Bracket | With Coverage | Without Coverage |
| Under 6 Years | 25 (100.0%) | 0 (0.0%) |
| 6 to 18 Years | 196 (89.9%) | 22 (10.1%) |
| 19 to 25 Years | 44 (100.0%) | 0 (0.0%) |
| 26 to 34 Years | 34 (100.0%) | 0 (0.0%) |
| 35 to 44 Years | 107 (89.9%) | 12 (10.1%) |
| 45 to 54 Years | 29 (100.0%) | 0 (0.0%) |
| 55 to 64 Years | 28 (100.0%) | 0 (0.0%) |
| 65 to 74 Years | 19 (100.0%) | 0 (0.0%) |
| 75 Years and older | 16 (100.0%) | 0 (0.0%) |
| Total | 498 (93.6%) | 34 (6.4%) |
Health Insurance Coverage by Citizenship Status in Forestville
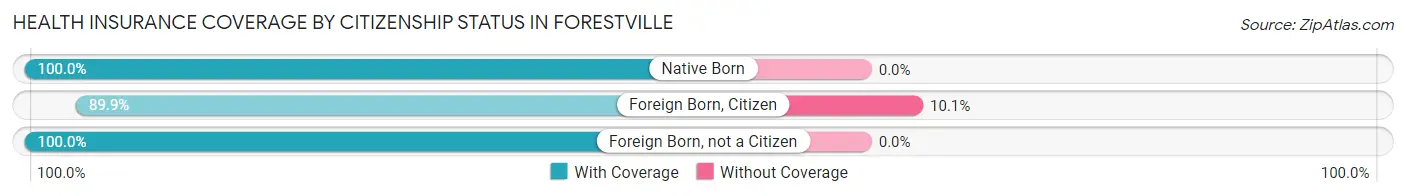
| Citizenship Status | With Coverage | Without Coverage |
| Native Born | 25 (100.0%) | 0 (0.0%) |
| Foreign Born, Citizen | 196 (89.9%) | 22 (10.1%) |
| Foreign Born, not a Citizen | 44 (100.0%) | 0 (0.0%) |
Health Insurance Coverage by Household Income in Forestville
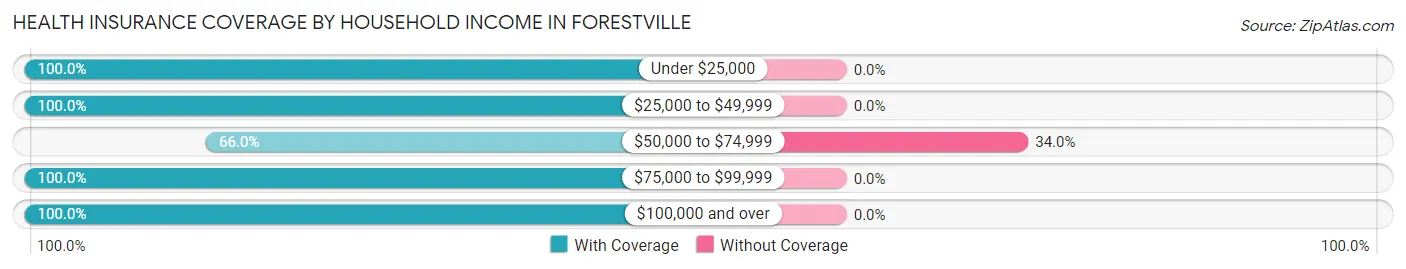
| Household Income | With Coverage | Without Coverage |
| Under $25,000 | 72 (100.0%) | 0 (0.0%) |
| $25,000 to $49,999 | 236 (100.0%) | 0 (0.0%) |
| $50,000 to $74,999 | 66 (66.0%) | 34 (34.0%) |
| $75,000 to $99,999 | 25 (100.0%) | 0 (0.0%) |
| $100,000 and over | 81 (100.0%) | 0 (0.0%) |
Public vs Private Health Insurance Coverage by Age in Forestville
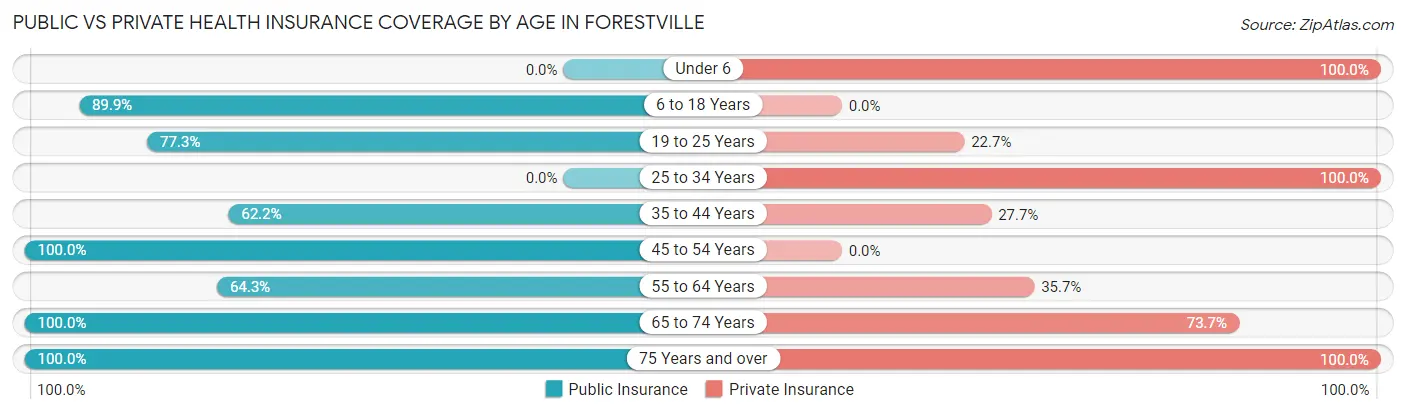
| Age Bracket | Public Insurance | Private Insurance |
| Under 6 | 0 (0.0%) | 25 (100.0%) |
| 6 to 18 Years | 196 (89.9%) | 0 (0.0%) |
| 19 to 25 Years | 34 (77.3%) | 10 (22.7%) |
| 25 to 34 Years | 0 (0.0%) | 34 (100.0%) |
| 35 to 44 Years | 74 (62.2%) | 33 (27.7%) |
| 45 to 54 Years | 29 (100.0%) | 0 (0.0%) |
| 55 to 64 Years | 18 (64.3%) | 10 (35.7%) |
| 65 to 74 Years | 19 (100.0%) | 14 (73.7%) |
| 75 Years and over | 16 (100.0%) | 16 (100.0%) |
| Total | 386 (72.6%) | 142 (26.7%) |
Disability Status by Sex by Age in Forestville
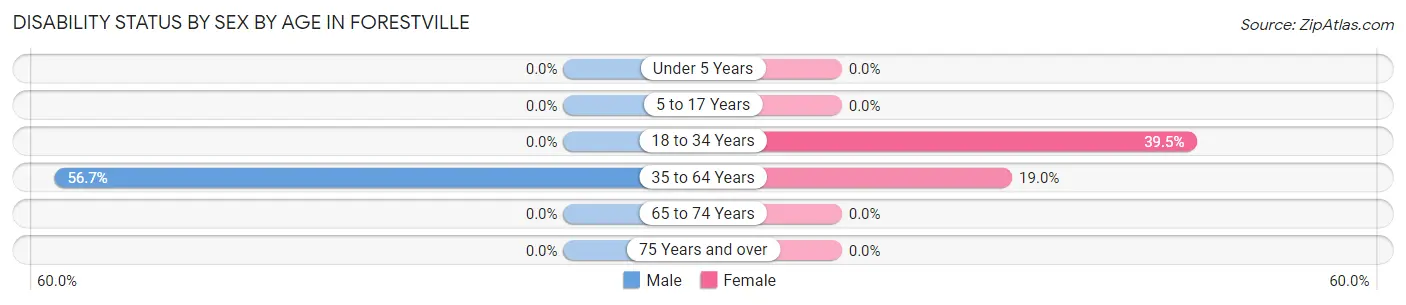
| Age Bracket | Male | Female |
| Under 5 Years | 0 (0.0%) | 0 (0.0%) |
| 5 to 17 Years | 0 (0.0%) | 0 (0.0%) |
| 18 to 34 Years | 0 (0.0%) | 15 (39.5%) |
| 35 to 64 Years | 34 (56.7%) | 22 (19.0%) |
| 65 to 74 Years | 0 (0.0%) | 0 (0.0%) |
| 75 Years and over | 0 (0.0%) | 0 (0.0%) |
Disability Class by Sex by Age in Forestville
Disability Class: Hearing Difficulty
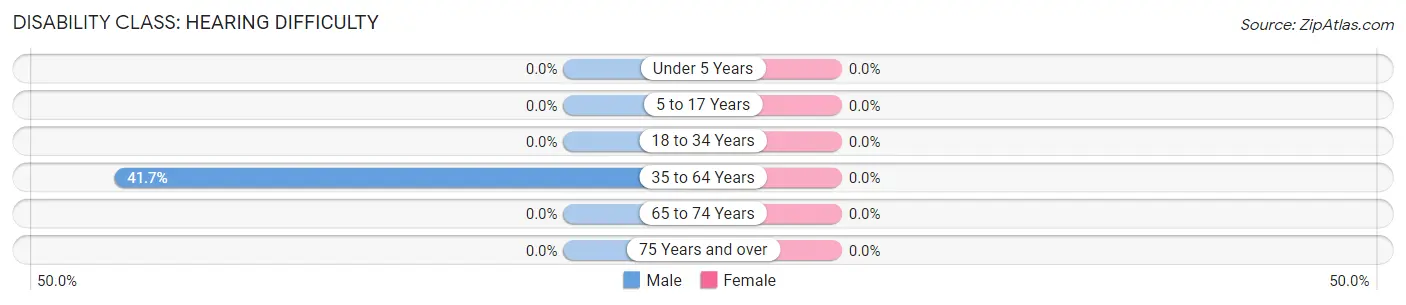
| Age Bracket | Male | Female |
| Under 5 Years | 0 (0.0%) | 0 (0.0%) |
| 5 to 17 Years | 0 (0.0%) | 0 (0.0%) |
| 18 to 34 Years | 0 (0.0%) | 0 (0.0%) |
| 35 to 64 Years | 25 (41.7%) | 0 (0.0%) |
| 65 to 74 Years | 0 (0.0%) | 0 (0.0%) |
| 75 Years and over | 0 (0.0%) | 0 (0.0%) |
Disability Class: Vision Difficulty
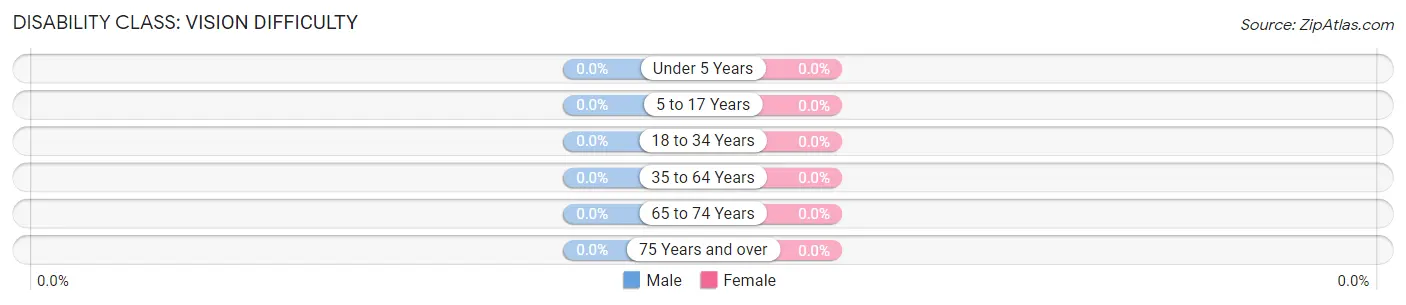
| Age Bracket | Male | Female |
| Under 5 Years | 0 (0.0%) | 0 (0.0%) |
| 5 to 17 Years | 0 (0.0%) | 0 (0.0%) |
| 18 to 34 Years | 0 (0.0%) | 0 (0.0%) |
| 35 to 64 Years | 0 (0.0%) | 0 (0.0%) |
| 65 to 74 Years | 0 (0.0%) | 0 (0.0%) |
| 75 Years and over | 0 (0.0%) | 0 (0.0%) |
Disability Class: Cognitive Difficulty
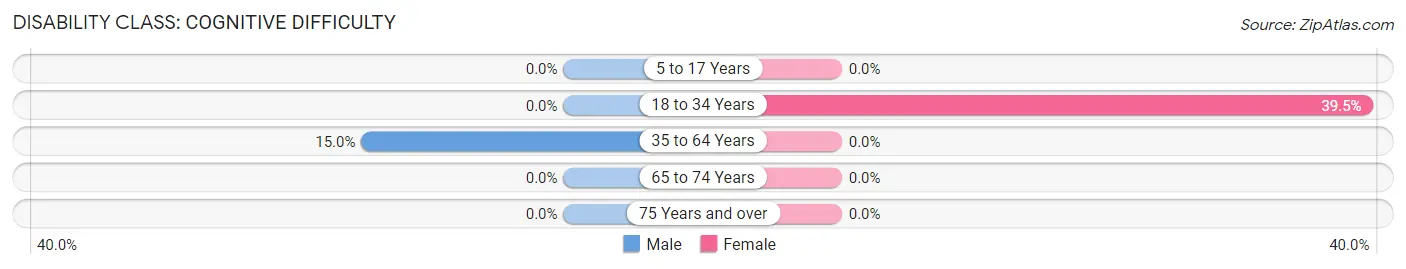
| Age Bracket | Male | Female |
| 5 to 17 Years | 0 (0.0%) | 0 (0.0%) |
| 18 to 34 Years | 0 (0.0%) | 15 (39.5%) |
| 35 to 64 Years | 9 (15.0%) | 0 (0.0%) |
| 65 to 74 Years | 0 (0.0%) | 0 (0.0%) |
| 75 Years and over | 0 (0.0%) | 0 (0.0%) |
Disability Class: Ambulatory Difficulty
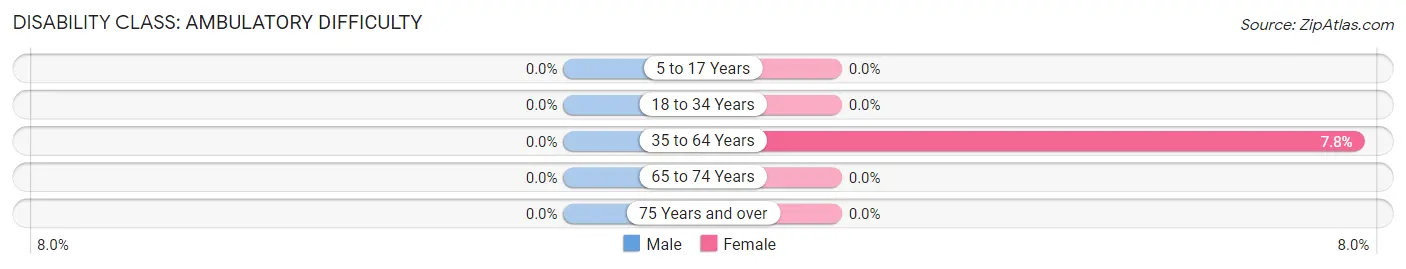
| Age Bracket | Male | Female |
| 5 to 17 Years | 0 (0.0%) | 0 (0.0%) |
| 18 to 34 Years | 0 (0.0%) | 0 (0.0%) |
| 35 to 64 Years | 0 (0.0%) | 9 (7.8%) |
| 65 to 74 Years | 0 (0.0%) | 0 (0.0%) |
| 75 Years and over | 0 (0.0%) | 0 (0.0%) |
Disability Class: Self-Care Difficulty

| Age Bracket | Male | Female |
| 5 to 17 Years | 0 (0.0%) | 0 (0.0%) |
| 18 to 34 Years | 0 (0.0%) | 0 (0.0%) |
| 35 to 64 Years | 0 (0.0%) | 9 (7.8%) |
| 65 to 74 Years | 0 (0.0%) | 0 (0.0%) |
| 75 Years and over | 0 (0.0%) | 0 (0.0%) |
Technology Access in Forestville
Computing Device Access in Forestville
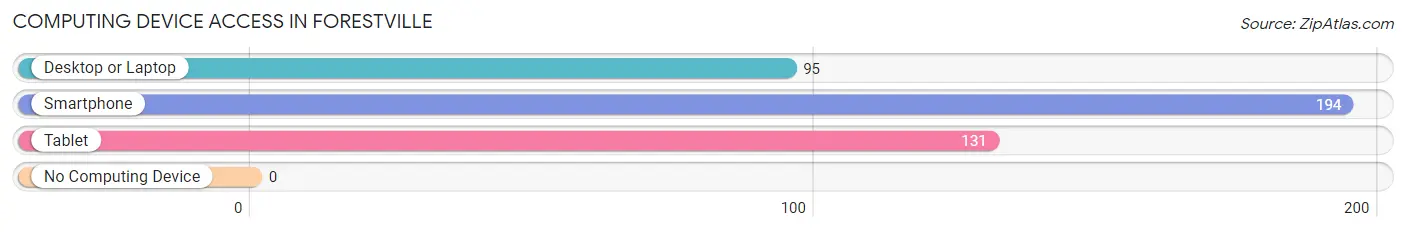
| Device Type | # Households | % Households |
| Desktop or Laptop | 95 | 47.0% |
| Smartphone | 194 | 96.0% |
| Tablet | 131 | 64.8% |
| No Computing Device | 0 | 0.0% |
| Total | 202 | 100.0% |
Internet Access in Forestville
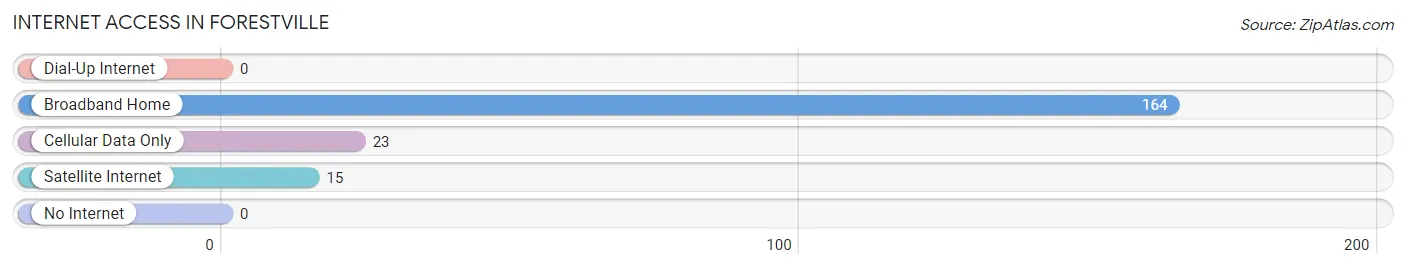
| Internet Type | # Households | % Households |
| Dial-Up Internet | 0 | 0.0% |
| Broadband Home | 164 | 81.2% |
| Cellular Data Only | 23 | 11.4% |
| Satellite Internet | 15 | 7.4% |
| No Internet | 0 | 0.0% |
| Total | 202 | 100.0% |
Forestville Summary
History
The town of Forestville is located in Chautauqua County, New York, and is part of the Jamestown-Dunkirk-Fredonia metropolitan area. The town was first settled in 1811 by a group of settlers from Connecticut, and was originally known as "Hardscrabble". The town was officially established in 1820, and was named after the abundance of trees in the area.
The town of Forestville has a rich history, and has been home to many notable people throughout its history. The most famous of these is the abolitionist and women's rights activist Harriet Tubman, who was born in the town in 1822. Tubman was a major figure in the Underground Railroad, and helped many slaves escape to freedom.
The town of Forestville has also been home to many other notable people, including the inventor of the telephone, Alexander Graham Bell, who lived in the town for a short time in the late 1800s.
Geography
The town of Forestville is located in the southwestern corner of Chautauqua County, and is bordered by the towns of Hanover, Sheridan, and Pomfret. The town is situated on the banks of the Chadakoin River, and is surrounded by rolling hills and forests. The town has a total area of 24.2 square miles, and is home to a population of approximately 2,000 people.
The town of Forestville is located in the humid continental climate zone, and experiences warm summers and cold winters. The average annual temperature is around 50 degrees Fahrenheit, and the average annual precipitation is around 40 inches.
Economy
The town of Forestville has a strong agricultural economy, and is home to many farms and orchards. The town is also home to several small businesses, including a few restaurants, a grocery store, and a few retail stores.
The town of Forestville is also home to a few manufacturing companies, including a furniture factory and a plastics factory. The town is also home to a few small technology companies, and is home to a few software development companies.
Demographics
As of the 2010 census, the town of Forestville had a population of 2,000 people. The racial makeup of the town was 97.5% White, 0.5% African American, 0.5% Native American, 0.5% Asian, and 1.0% from other races. Hispanic or Latino of any race were 1.5% of the population.
The median household income in the town was $41,250, and the median family income was $50,000. The per capita income for the town was $20,000. About 10.5% of families and 13.5% of the population were below the poverty line, including 17.5% of those under age 18 and 8.5% of those age 65 or over.
Common Questions
What is Per Capita Income in Forestville?
Per Capita income in Forestville is $22,143.
What is Inequality or Gini Index in Forestville?
Inequality or Gini Index in Forestville is 0.45.
What is the Total Population of Forestville?
Total Population of Forestville is 532.
What is the Total Male Population of Forestville?
Total Male Population of Forestville is 165.
What is the Total Female Population of Forestville?
Total Female Population of Forestville is 367.
What is the Ratio of Males per 100 Females in Forestville?
There are 44.96 Males per 100 Females in Forestville.
What is the Ratio of Females per 100 Males in Forestville?
There are 222.42 Females per 100 Males in Forestville.
What is the Median Population Age in Forestville?
Median Population Age in Forestville is 25.2 Years.
What is the Average Family Size in Forestville
Average Family Size in Forestville is 3.0 People.
What is the Average Household Size in Forestville
Average Household Size in Forestville is 2.5 People.
How Large is the Labor Force in Forestville?
There are 213 People in the Labor Forcein in Forestville.
What is the Percentage of People in the Labor Force in Forestville?
73.7% of People are in the Labor Force in Forestville.