Fishers Island, NY Map & Demographics
Fishers Island Map
Fishers Island Overview
$21,489
PER CAPITA INCOME
$47,708
AVG HOUSEHOLD INCOME
0.09
INEQUALITY / GINI INDEX
53
TOTAL POPULATION
33
MALE POPULATION
20
FEMALE POPULATION
165.00
MALES / 100 FEMALES
60.61
FEMALES / 100 MALES
37.6
MEDIAN AGE
2.3
AVG FAMILY SIZE
1.9
AVG HOUSEHOLD SIZE
39
LABOR FORCE [ PEOPLE ]
83.0%
PERCENT IN LABOR FORCE
Fishers Island Zip Codes
Fishers Island Area Codes
Income in Fishers Island
Income Overview in Fishers Island
| Characteristic | Number | Measure |
| Per Capita Income | 53 | $21,489 |
| Median Family Income | 13 | $0 |
| Mean Family Income | 13 | $0 |
| Median Household Income | 19 | $47,708 |
| Mean Household Income | 19 | $45,300 |
| Income Deficit | 13 | $0 |
| Wage / Income Gap (%) | 53 | 0.00% |
| Wage / Income Gap ($) | 53 | 100.00¢ per $1 |
| Gini / Inequality Index | 53 | 0.09 |
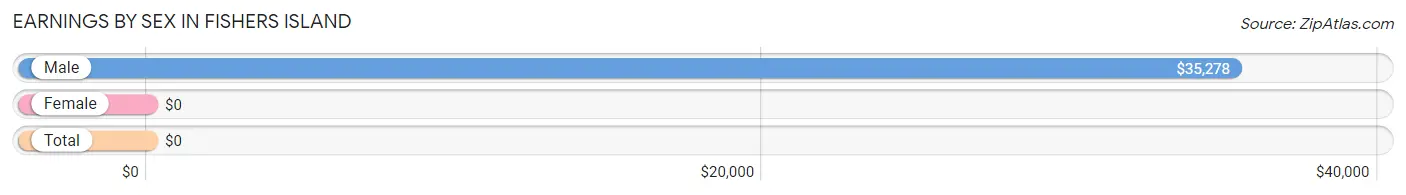
Earnings by Sex in Fishers Island
| Sex | Number | Average Earnings |
| Male | 20 (51.3%) | $35,278 |
| Female | 19 (48.7%) | $0 |
| Total | 39 (100.0%) | $0 |
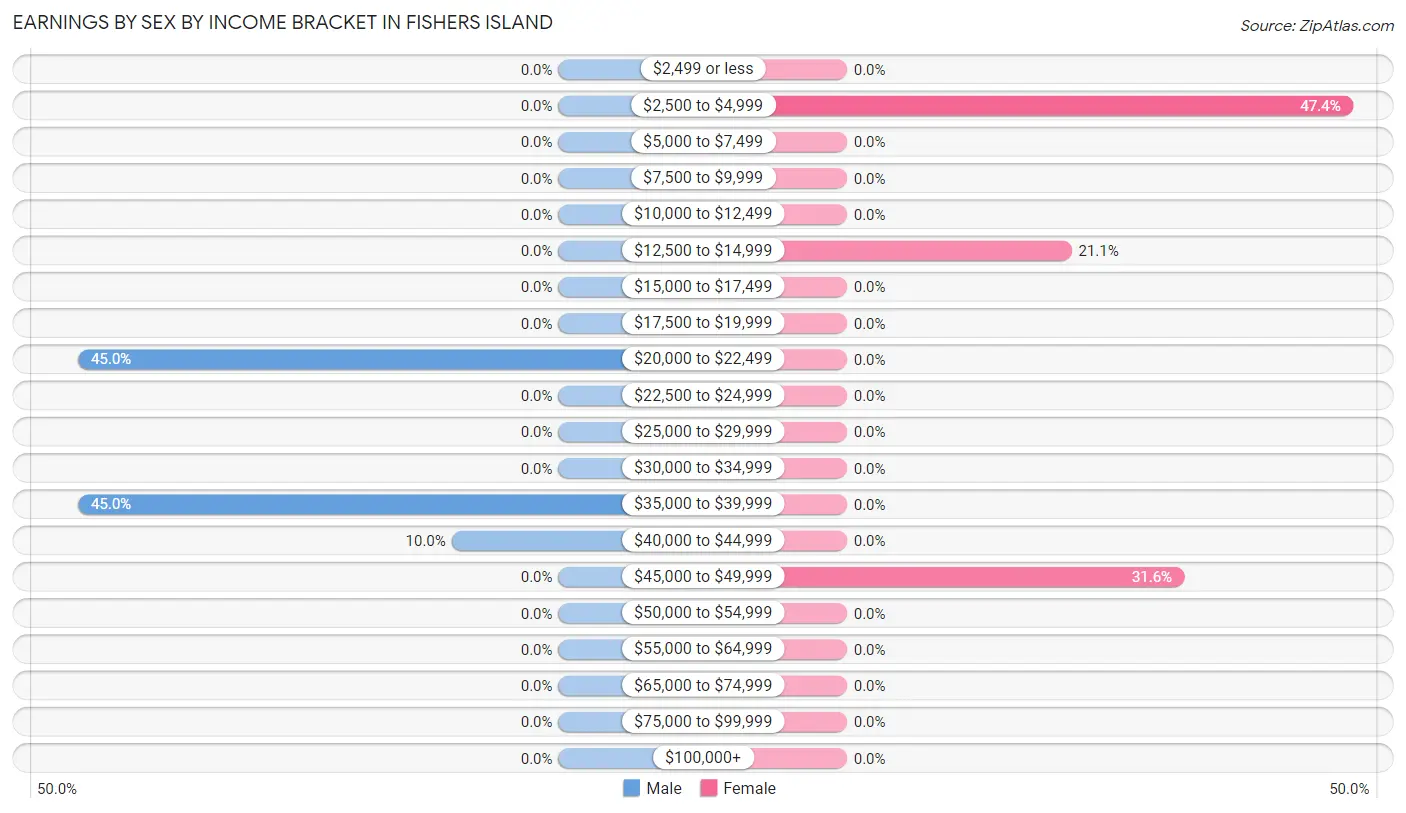
Earnings by Sex by Income Bracket in Fishers Island
The most common earnings brackets in Fishers Island are $20,000 to $22,499 for men (9 | 45.0%) and $2,500 to $4,999 for women (9 | 47.4%).
| Income | Male | Female |
| $2,499 or less | 0 (0.0%) | 0 (0.0%) |
| $2,500 to $4,999 | 0 (0.0%) | 9 (47.4%) |
| $5,000 to $7,499 | 0 (0.0%) | 0 (0.0%) |
| $7,500 to $9,999 | 0 (0.0%) | 0 (0.0%) |
| $10,000 to $12,499 | 0 (0.0%) | 0 (0.0%) |
| $12,500 to $14,999 | 0 (0.0%) | 4 (21.0%) |
| $15,000 to $17,499 | 0 (0.0%) | 0 (0.0%) |
| $17,500 to $19,999 | 0 (0.0%) | 0 (0.0%) |
| $20,000 to $22,499 | 9 (45.0%) | 0 (0.0%) |
| $22,500 to $24,999 | 0 (0.0%) | 0 (0.0%) |
| $25,000 to $29,999 | 0 (0.0%) | 0 (0.0%) |
| $30,000 to $34,999 | 0 (0.0%) | 0 (0.0%) |
| $35,000 to $39,999 | 9 (45.0%) | 0 (0.0%) |
| $40,000 to $44,999 | 2 (10.0%) | 0 (0.0%) |
| $45,000 to $49,999 | 0 (0.0%) | 6 (31.6%) |
| $50,000 to $54,999 | 0 (0.0%) | 0 (0.0%) |
| $55,000 to $64,999 | 0 (0.0%) | 0 (0.0%) |
| $65,000 to $74,999 | 0 (0.0%) | 0 (0.0%) |
| $75,000 to $99,999 | 0 (0.0%) | 0 (0.0%) |
| $100,000+ | 0 (0.0%) | 0 (0.0%) |
| Total | 20 (100.0%) | 19 (100.0%) |
Earnings by Sex by Educational Attainment in Fishers Island
| Educational Attainment | Male Income | Female Income |
| Less than High School | - | - |
| High School Diploma | - | - |
| College or Associate's Degree | - | - |
| Bachelor's Degree | - | - |
| Graduate Degree | - | - |
| Total | $35,278 | $0 |
Family Income in Fishers Island
Family Income Brackets in Fishers Island
According to the Fishers Island family income data, there are 9 families falling into the $35,000 to $49,999 income range, which is the most common income bracket and makes up 69.2% of all families.
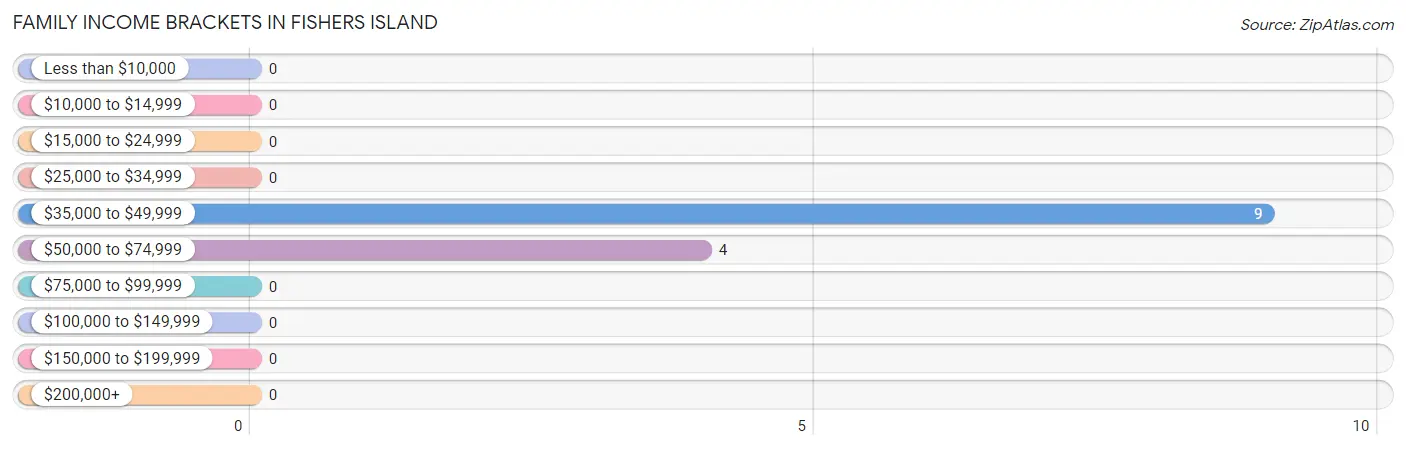
| Income Bracket | # Families | % Families |
| Less than $10,000 | 0 | 0.0% |
| $10,000 to $14,999 | 0 | 0.0% |
| $15,000 to $24,999 | 0 | 0.0% |
| $25,000 to $34,999 | 0 | 0.0% |
| $35,000 to $49,999 | 9 | 69.2% |
| $50,000 to $74,999 | 4 | 30.8% |
| $75,000 to $99,999 | 0 | 0.0% |
| $100,000 to $149,999 | 0 | 0.0% |
| $150,000 to $199,999 | 0 | 0.0% |
| $200,000+ | 0 | 0.0% |
Family Income by Famaliy Size in Fishers Island
| Income Bracket | # Families | Median Income |
| 2-Person Families | 9 (69.2%) | $0 |
| 3-Person Families | 0 (0.0%) | $0 |
| 4-Person Families | 4 (30.8%) | $0 |
| 5-Person Families | 0 (0.0%) | $0 |
| 6-Person Families | 0 (0.0%) | $0 |
| 7+ Person Families | 0 (0.0%) | $0 |
| Total | 13 (100.0%) | $0 |
Family Income by Number of Earners in Fishers Island
| Number of Earners | # Families | Median Income |
| No Earners | 0 (0.0%) | $0 |
| 1 Earner | 0 (0.0%) | $0 |
| 2 Earners | 13 (100.0%) | $0 |
| 3+ Earners | 0 (0.0%) | $0 |
| Total | 13 (100.0%) | $0 |
Household Income in Fishers Island
Household Income Brackets in Fishers Island
With 15 households falling in the category, the $35,000 to $49,999 income range is the most frequent in Fishers Island, accounting for 78.9% of all households.
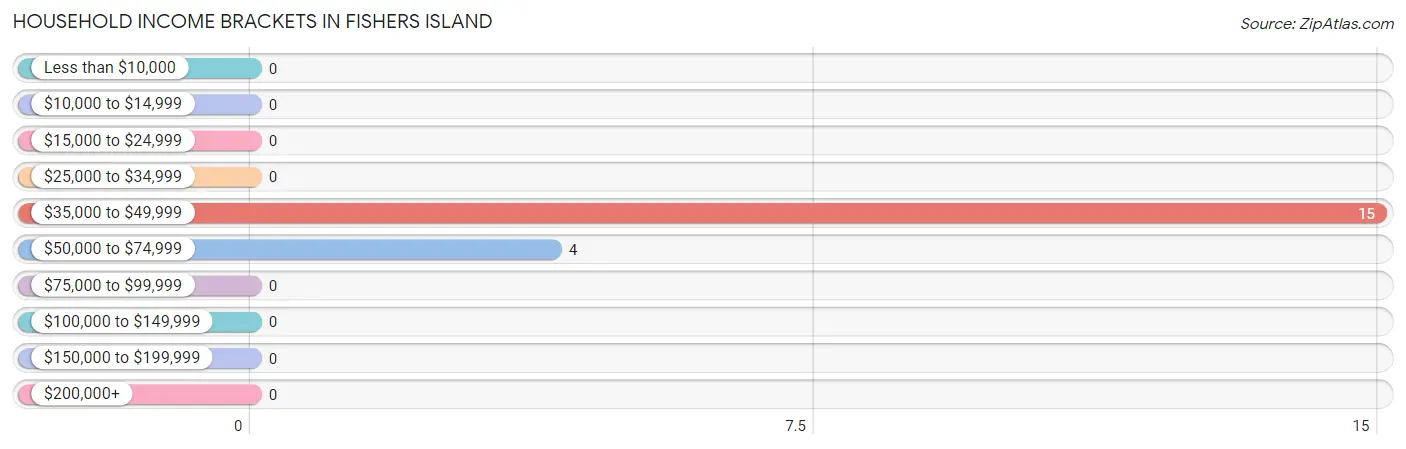
| Income Bracket | # Households | % Households |
| Less than $10,000 | 0 | 0.0% |
| $10,000 to $14,999 | 0 | 0.0% |
| $15,000 to $24,999 | 0 | 0.0% |
| $25,000 to $34,999 | 0 | 0.0% |
| $35,000 to $49,999 | 15 | 78.9% |
| $50,000 to $74,999 | 4 | 21.1% |
| $75,000 to $99,999 | 0 | 0.0% |
| $100,000 to $149,999 | 0 | 0.0% |
| $150,000 to $199,999 | 0 | 0.0% |
| $200,000+ | 0 | 0.0% |
Household Income by Householder Age in Fishers Island
| Income Bracket | # Households | Median Income |
| 15 to 24 Years | 6 (31.6%) | $0 |
| 25 to 44 Years | 9 (47.4%) | $0 |
| 45 to 64 Years | 4 (21.0%) | $0 |
| 65+ Years | 0 (0.0%) | $0 |
| Total | 19 (100.0%) | $47,708 |
Poverty in Fishers Island
Income Below Poverty by Sex and Age in Fishers Island
| Age Bracket | Male | Female |
| Under 5 Years | 0 (0.0%) | 0 (0.0%) |
| 5 Years | 0 (0.0%) | 0 (0.0%) |
| 6 to 11 Years | 0 (0.0%) | 0 (0.0%) |
| 12 to 14 Years | 0 (0.0%) | 0 (0.0%) |
| 15 Years | 0 (0.0%) | 0 (0.0%) |
| 16 and 17 Years | 0 (0.0%) | 0 (0.0%) |
| 18 to 24 Years | 0 (0.0%) | 0 (0.0%) |
| 25 to 34 Years | 0 (0.0%) | 0 (0.0%) |
| 35 to 44 Years | 0 (0.0%) | 0 (0.0%) |
| 45 to 54 Years | 0 (0.0%) | 0 (0.0%) |
| 55 to 64 Years | 0 (0.0%) | 0 (0.0%) |
| 65 to 74 Years | 0 (0.0%) | 0 (0.0%) |
| 75 Years and over | 0 (0.0%) | 0 (0.0%) |
| Total | 0 (0.0%) | 0 (0.0%) |
Income Above Poverty by Sex and Age in Fishers Island
According to the poverty statistics in Fishers Island, males aged 12 to 14 years and females aged 6 to 11 years are the age groups that are most secure financially, with 100.0% of males and 100.0% of females in these age groups living above the poverty line.
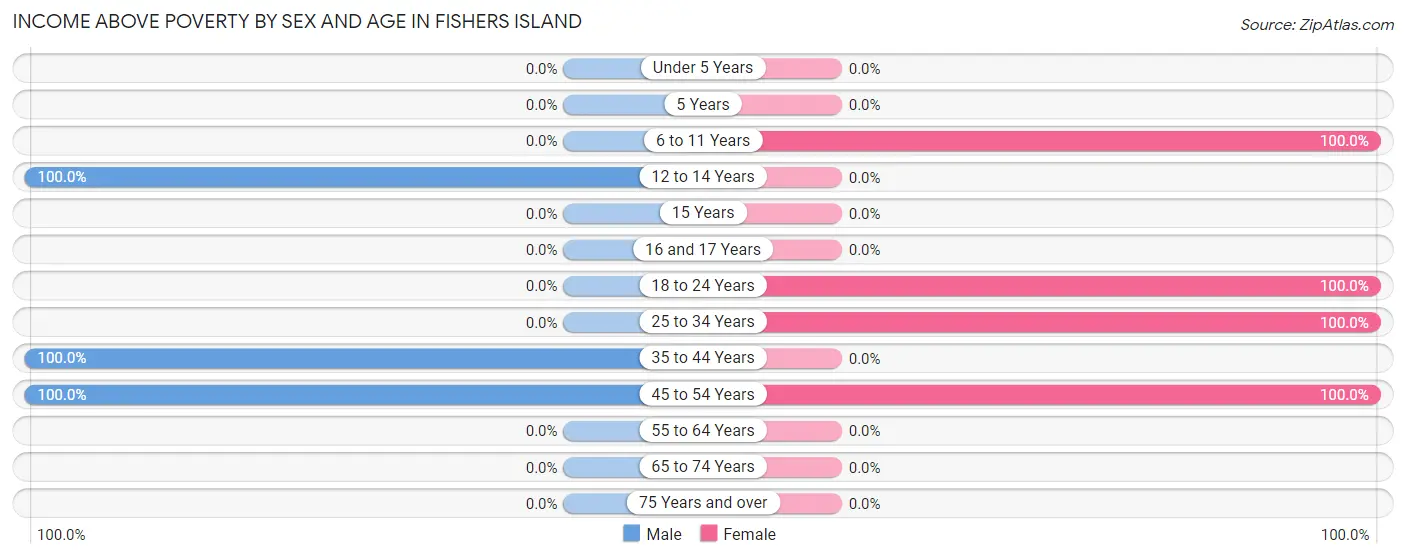
| Age Bracket | Male | Female |
| Under 5 Years | 0 (0.0%) | 0 (0.0%) |
| 5 Years | 0 (0.0%) | 0 (0.0%) |
| 6 to 11 Years | 0 (0.0%) | 1 (100.0%) |
| 12 to 14 Years | 5 (100.0%) | 0 (0.0%) |
| 15 Years | 0 (0.0%) | 0 (0.0%) |
| 16 and 17 Years | 0 (0.0%) | 0 (0.0%) |
| 18 to 24 Years | 0 (0.0%) | 6 (100.0%) |
| 25 to 34 Years | 0 (0.0%) | 9 (100.0%) |
| 35 to 44 Years | 18 (100.0%) | 0 (0.0%) |
| 45 to 54 Years | 10 (100.0%) | 4 (100.0%) |
| 55 to 64 Years | 0 (0.0%) | 0 (0.0%) |
| 65 to 74 Years | 0 (0.0%) | 0 (0.0%) |
| 75 Years and over | 0 (0.0%) | 0 (0.0%) |
| Total | 33 (100.0%) | 20 (100.0%) |
Income Below Poverty Among Married-Couple Families in Fishers Island
| Children | Above Poverty | Below Poverty |
| No Children | 9 (100.0%) | 0 (0.0%) |
| 1 or 2 Children | 4 (100.0%) | 0 (0.0%) |
| 3 or 4 Children | 0 (0.0%) | 0 (0.0%) |
| 5 or more Children | 0 (0.0%) | 0 (0.0%) |
| Total | 13 (100.0%) | 0 (0.0%) |
Income Below Poverty Among Single-Parent Households in Fishers Island
| Children | Single Father | Single Mother |
| No Children | 0 (0.0%) | 0 (0.0%) |
| 1 or 2 Children | 0 (0.0%) | 0 (0.0%) |
| 3 or 4 Children | 0 (0.0%) | 0 (0.0%) |
| 5 or more Children | 0 (0.0%) | 0 (0.0%) |
| Total | 0 (0.0%) | 0 (0.0%) |
Income Below Poverty Among Married-Couple vs Single-Parent Households in Fishers Island
| Children | Married-Couple Families | Single-Parent Households |
| No Children | 0 (0.0%) | 0 (0.0%) |
| 1 or 2 Children | 0 (0.0%) | 0 (0.0%) |
| 3 or 4 Children | 0 (0.0%) | 0 (0.0%) |
| 5 or more Children | 0 (0.0%) | 0 (0.0%) |
| Total | 0 (0.0%) | 0 (0.0%) |
Race in Fishers Island
The most populous races in Fishers Island are White / Caucasian (33 | 62.3%), Hispanic or Latino (9 | 17.0%), and Some other Race (9 | 17.0%).
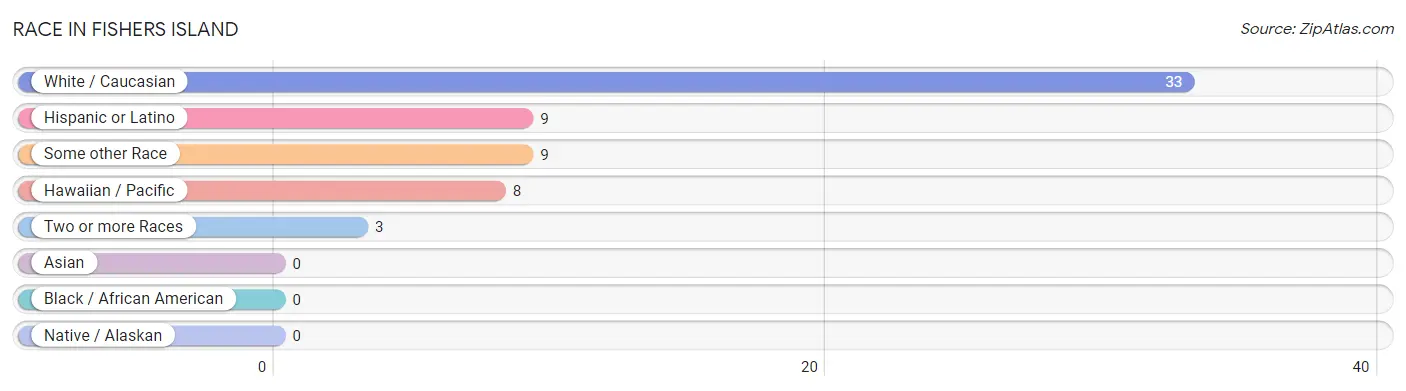
| Race | # Population | % Population |
| Asian | 0 | 0.0% |
| Black / African American | 0 | 0.0% |
| Hawaiian / Pacific | 8 | 15.1% |
| Hispanic or Latino | 9 | 17.0% |
| Native / Alaskan | 0 | 0.0% |
| White / Caucasian | 33 | 62.3% |
| Two or more Races | 3 | 5.7% |
| Some other Race | 9 | 17.0% |
| Total | 53 | 100.0% |
Ancestry in Fishers Island
The most populous ancestries reported in Fishers Island are German (18 | 34.0%), Italian (10 | 18.9%), English (9 | 17.0%), Native Hawaiian (8 | 15.1%), and Scottish (6 | 11.3%), together accounting for 96.2% of all Fishers Island residents.
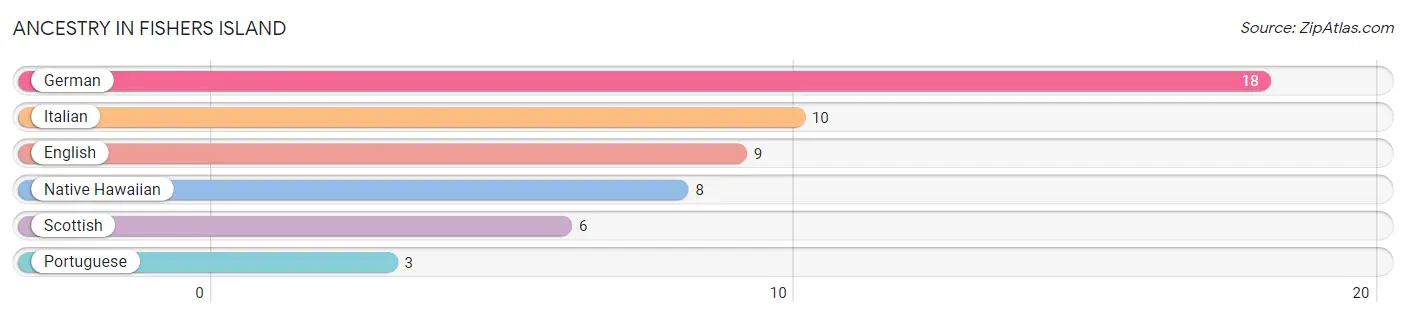
| Ancestry | # Population | % Population |
| English | 9 | 17.0% |
| German | 18 | 34.0% |
| Italian | 10 | 18.9% |
| Native Hawaiian | 8 | 15.1% |
| Portuguese | 3 | 5.7% |
| Scottish | 6 | 11.3% | View All 6 Rows |
Immigrants in Fishers Island
The most numerous immigrant groups reported in Fishers Island came from Central America (9 | 17.0%), Latin America (9 | 17.0%), and Mexico (9 | 17.0%), together accounting for 50.9% of all Fishers Island residents.
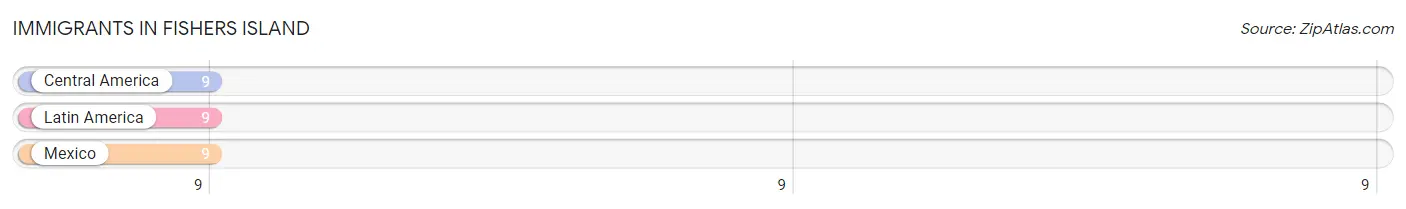
| Immigration Origin | # Population | % Population |
| Central America | 9 | 17.0% |
| Latin America | 9 | 17.0% |
| Mexico | 9 | 17.0% | View All 3 Rows |
Sex and Age in Fishers Island
Sex and Age in Fishers Island
The most populous age groups in Fishers Island are 35 to 39 Years (18 | 54.5%) for men and 30 to 34 Years (9 | 45.0%) for women.
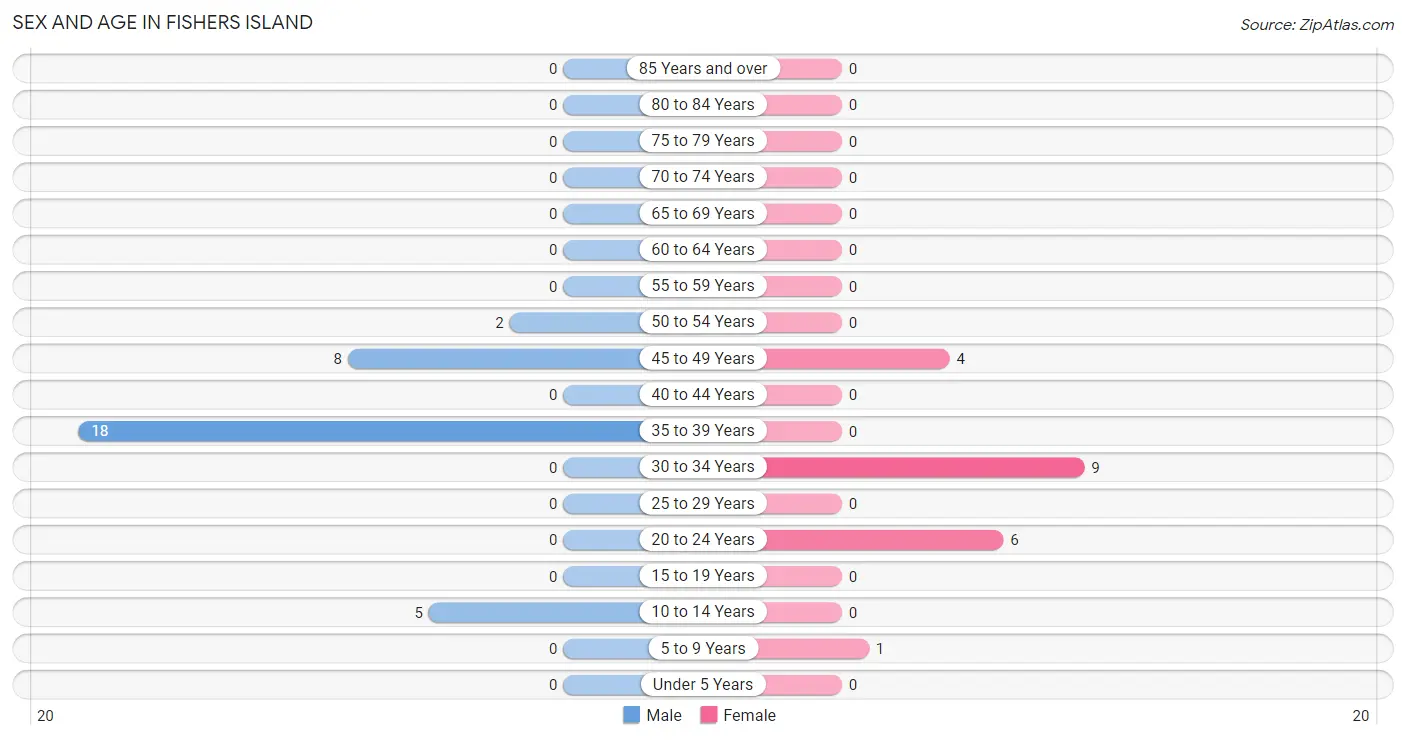
| Age Bracket | Male | Female |
| Under 5 Years | 0 (0.0%) | 0 (0.0%) |
| 5 to 9 Years | 0 (0.0%) | 1 (5.0%) |
| 10 to 14 Years | 5 (15.1%) | 0 (0.0%) |
| 15 to 19 Years | 0 (0.0%) | 0 (0.0%) |
| 20 to 24 Years | 0 (0.0%) | 6 (30.0%) |
| 25 to 29 Years | 0 (0.0%) | 0 (0.0%) |
| 30 to 34 Years | 0 (0.0%) | 9 (45.0%) |
| 35 to 39 Years | 18 (54.5%) | 0 (0.0%) |
| 40 to 44 Years | 0 (0.0%) | 0 (0.0%) |
| 45 to 49 Years | 8 (24.2%) | 4 (20.0%) |
| 50 to 54 Years | 2 (6.1%) | 0 (0.0%) |
| 55 to 59 Years | 0 (0.0%) | 0 (0.0%) |
| 60 to 64 Years | 0 (0.0%) | 0 (0.0%) |
| 65 to 69 Years | 0 (0.0%) | 0 (0.0%) |
| 70 to 74 Years | 0 (0.0%) | 0 (0.0%) |
| 75 to 79 Years | 0 (0.0%) | 0 (0.0%) |
| 80 to 84 Years | 0 (0.0%) | 0 (0.0%) |
| 85 Years and over | 0 (0.0%) | 0 (0.0%) |
| Total | 33 (100.0%) | 20 (100.0%) |
Families and Households in Fishers Island
Median Family Size in Fishers Island
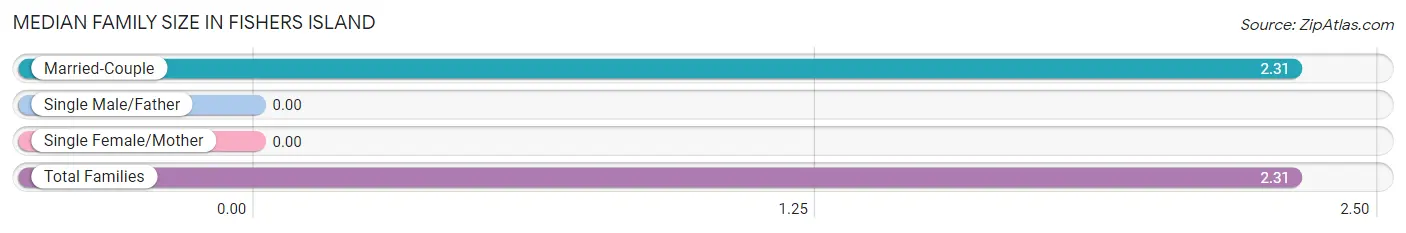
| Family Type | # Families | Family Size |
| Married-Couple | 13 (100.0%) | 2.31 |
| Single Male/Father | 0 (0.0%) | - |
| Single Female/Mother | 0 (0.0%) | - |
| Total Families | 13 (100.0%) | 2.31 |
Median Household Size in Fishers Island
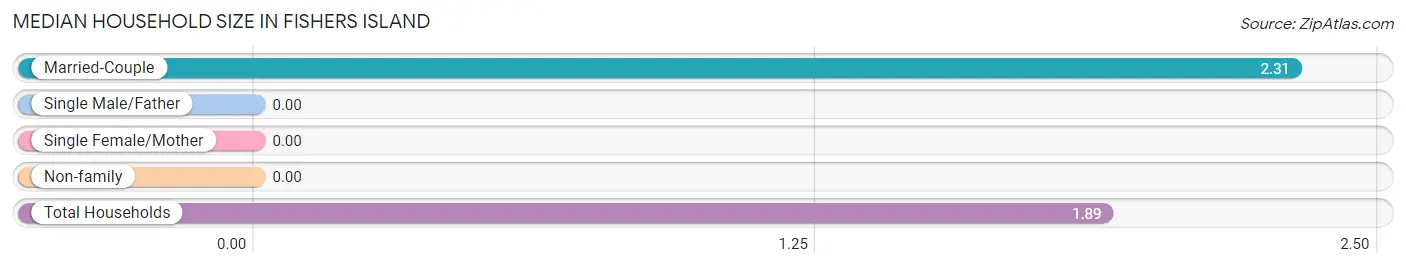
| Household Type | # Households | Household Size |
| Married-Couple | 13 (68.4%) | 2.31 |
| Single Male/Father | 0 (0.0%) | - |
| Single Female/Mother | 0 (0.0%) | - |
| Non-family | 6 (31.6%) | - |
| Total Households | 19 (100.0%) | 1.89 |
Household Size by Marriage Status in Fishers Island
Out of a total of 19 households in Fishers Island, 13 (68.4%) are family households, while 6 (31.6%) are nonfamily households. The most numerous type of family households are 2-person households, comprising 9, and the most common type of nonfamily households are 1-person households, comprising 6.
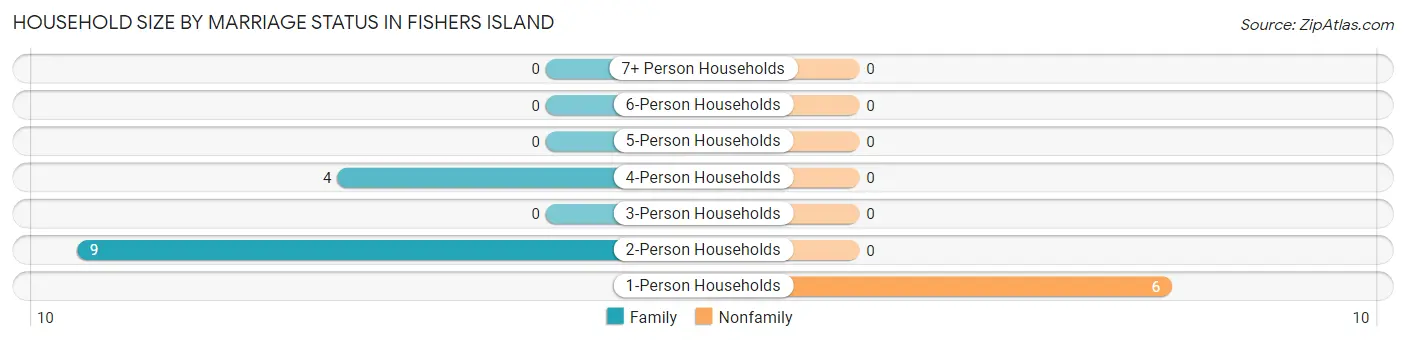
| Household Size | Family Households | Nonfamily Households |
| 1-Person Households | - | 6 (31.6%) |
| 2-Person Households | 9 (47.4%) | 0 (0.0%) |
| 3-Person Households | 0 (0.0%) | 0 (0.0%) |
| 4-Person Households | 4 (21.0%) | 0 (0.0%) |
| 5-Person Households | 0 (0.0%) | 0 (0.0%) |
| 6-Person Households | 0 (0.0%) | 0 (0.0%) |
| 7+ Person Households | 0 (0.0%) | 0 (0.0%) |
| Total | 13 (68.4%) | 6 (31.6%) |
Female Fertility in Fishers Island
Fertility by Age in Fishers Island
| Age Bracket | Women with Births | Births / 1,000 Women |
| 15 to 19 years | 0 (0.0%) | 0.0 |
| 20 to 34 years | 0 (0.0%) | 0.0 |
| 35 to 50 years | 0 (0.0%) | 0.0 |
| Total | 0 (0.0%) | 0.0 |
Fertility by Age by Marriage Status in Fishers Island
| Age Bracket | Married | Unmarried |
| 15 to 19 years | 0 (0.0%) | 0 (0.0%) |
| 20 to 34 years | 0 (0.0%) | 0 (0.0%) |
| 35 to 50 years | 0 (0.0%) | 0 (0.0%) |
| Total | 0 (0.0%) | 0 (0.0%) |
Fertility by Education in Fishers Island
| Educational Attainment | Women with Births | Births / 1,000 Women |
| Less than High School | 0 (0.0%) | 0.0 |
| High School Diploma | 0 (0.0%) | 0.0 |
| College or Associate's Degree | 0 (0.0%) | 0.0 |
| Bachelor's Degree | 0 (0.0%) | 0.0 |
| Graduate Degree | 0 (0.0%) | 0.0 |
| Total | 0 (0.0%) | 0.0 |
Fertility by Education by Marriage Status in Fishers Island
| Educational Attainment | Married | Unmarried |
| Less than High School | 0 (0.0%) | 0 (0.0%) |
| High School Diploma | 0 (0.0%) | 0 (0.0%) |
| College or Associate's Degree | 0 (0.0%) | 0 (0.0%) |
| Bachelor's Degree | 0 (0.0%) | 0 (0.0%) |
| Graduate Degree | 0 (0.0%) | 0 (0.0%) |
| Total | 0 (0.0%) | 0 (0.0%) |
Employment Characteristics in Fishers Island
Employment by Class of Employer in Fishers Island
Among the 39 employed individuals in Fishers Island, private company employees (29 | 74.4%), local government employees (6 | 15.4%), and self-employed (not incorporated) (4 | 10.3%) make up the most common classes of employment.
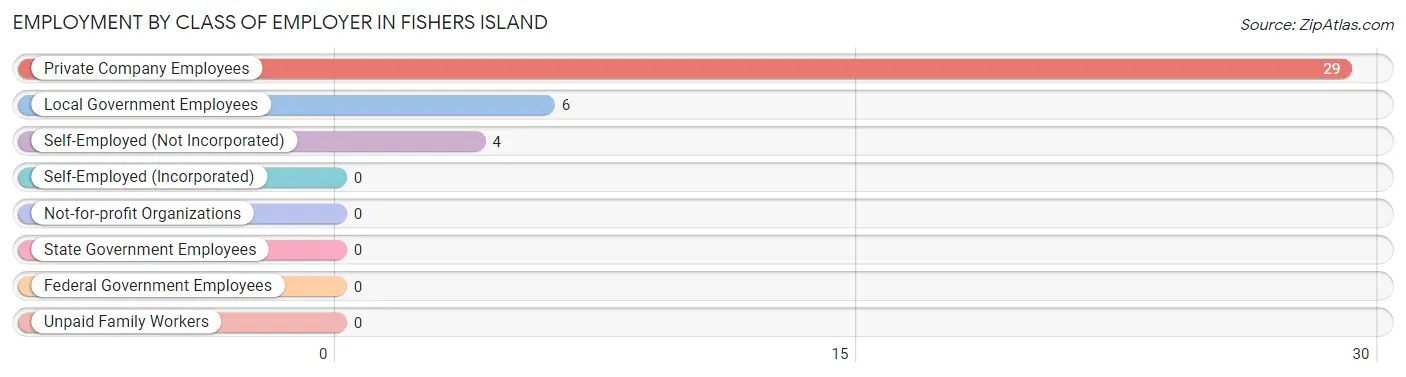
| Employer Class | # Employees | % Employees |
| Private Company Employees | 29 | 74.4% |
| Self-Employed (Incorporated) | 0 | 0.0% |
| Self-Employed (Not Incorporated) | 4 | 10.3% |
| Not-for-profit Organizations | 0 | 0.0% |
| Local Government Employees | 6 | 15.4% |
| State Government Employees | 0 | 0.0% |
| Federal Government Employees | 0 | 0.0% |
| Unpaid Family Workers | 0 | 0.0% |
| Total | 39 | 100.0% |
Employment Status by Age in Fishers Island
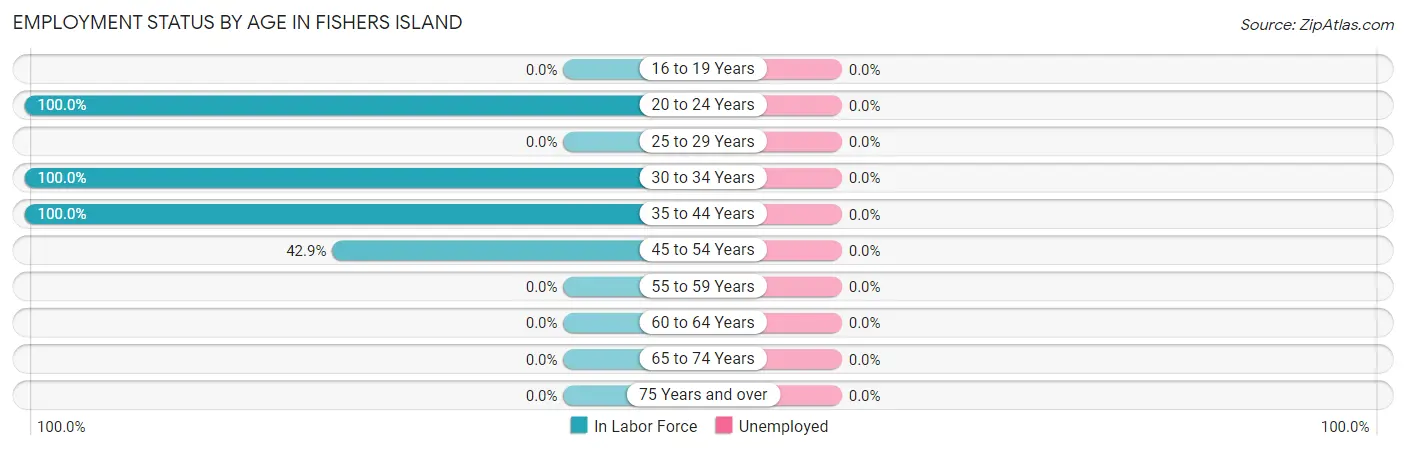
| Age Bracket | In Labor Force | Unemployed |
| 16 to 19 Years | 0 (0.0%) | 0 (0.0%) |
| 20 to 24 Years | 6 (100.0%) | 0 (0.0%) |
| 25 to 29 Years | 0 (0.0%) | 0 (0.0%) |
| 30 to 34 Years | 9 (100.0%) | 0 (0.0%) |
| 35 to 44 Years | 18 (100.0%) | 0 (0.0%) |
| 45 to 54 Years | 6 (42.9%) | 0 (0.0%) |
| 55 to 59 Years | 0 (0.0%) | 0 (0.0%) |
| 60 to 64 Years | 0 (0.0%) | 0 (0.0%) |
| 65 to 74 Years | 0 (0.0%) | 0 (0.0%) |
| 75 Years and over | 0 (0.0%) | 0 (0.0%) |
| Total | 39 (83.0%) | 0 (0.0%) |
Employment Status by Educational Attainment in Fishers Island
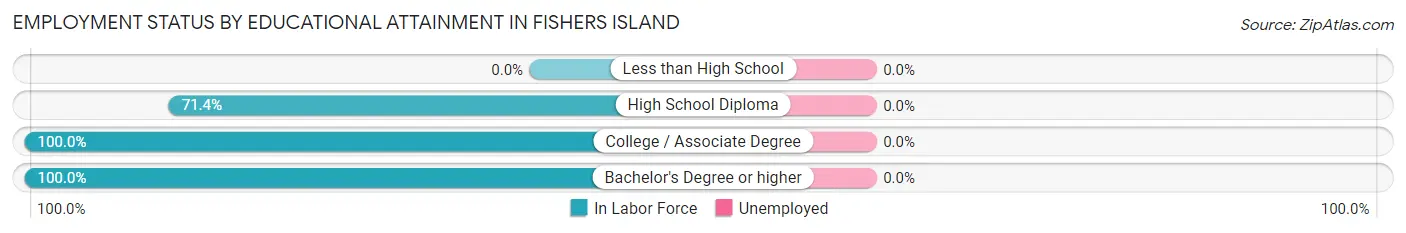
| Educational Attainment | In Labor Force | Unemployed |
| Less than High School | 0 (0.0%) | 0 (0.0%) |
| High School Diploma | 20 (71.4%) | 0 (0.0%) |
| College / Associate Degree | 9 (100.0%) | 0 (0.0%) |
| Bachelor's Degree or higher | 4 (100.0%) | 0 (0.0%) |
| Total | 33 (80.5%) | 0 (0.0%) |
Employment Occupations by Sex in Fishers Island
Management, Business, Science and Arts Occupations
The most common Management, Business, Science and Arts occupations in Fishers Island are Management (20 | 51.3%), Computers, Engineering & Science (6 | 15.4%), and Architecture & Engineering (6 | 15.4%).
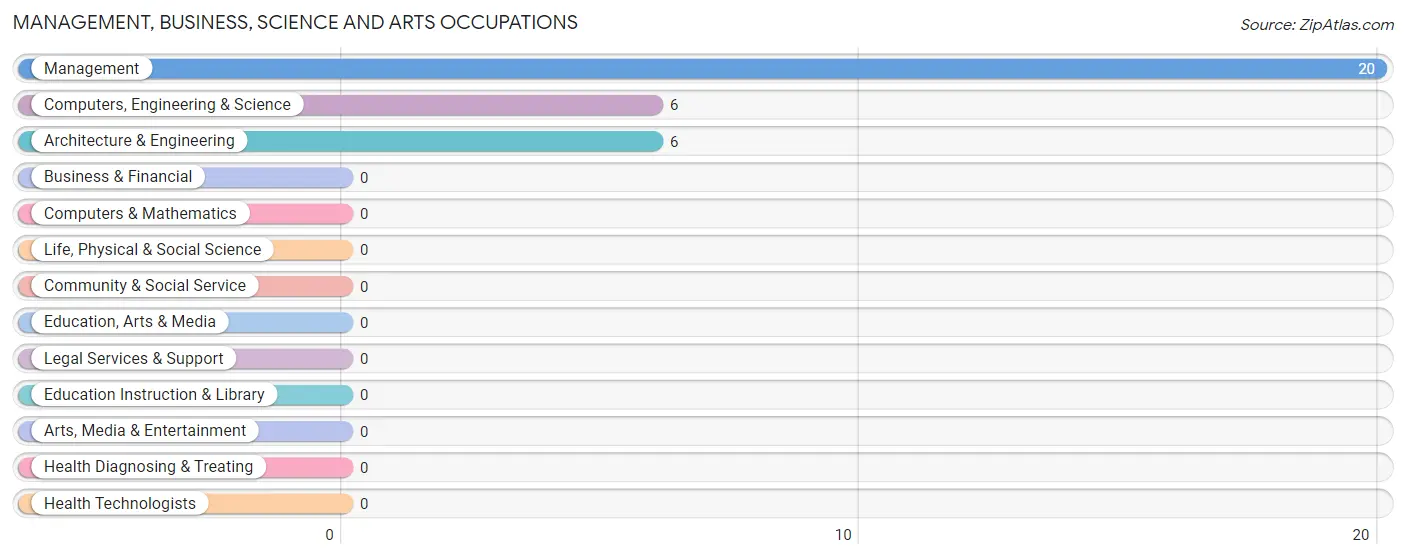
Management, Business, Science and Arts Occupations by Sex
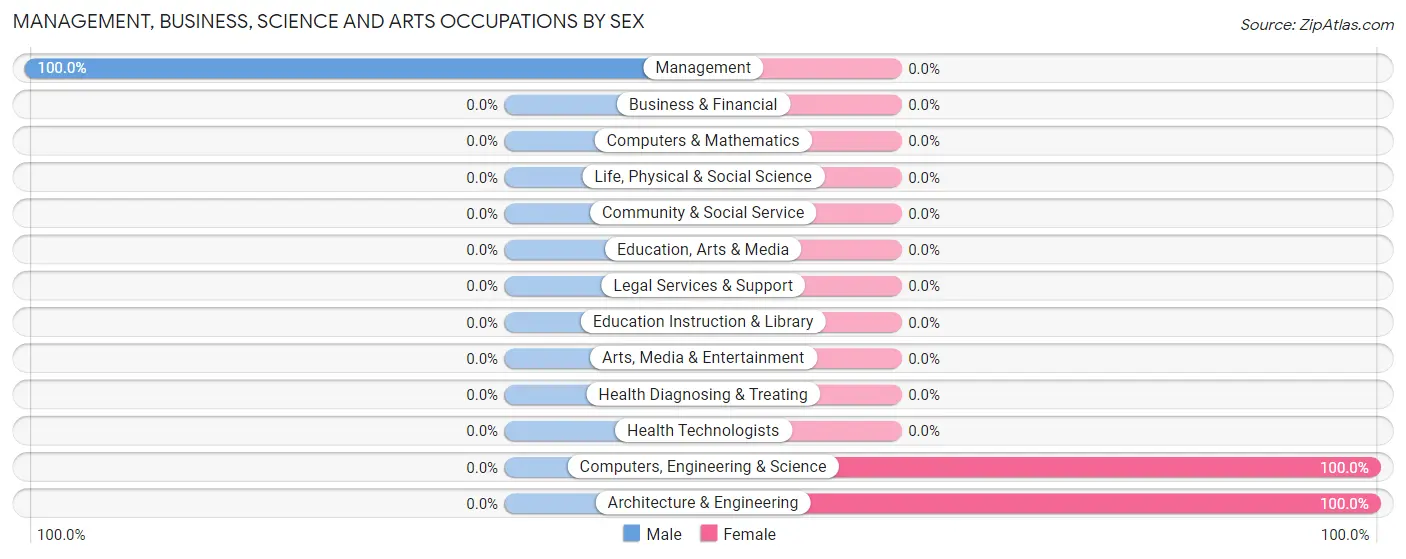
| Occupation | Male | Female |
| Management | 20 (100.0%) | 0 (0.0%) |
| Business & Financial | 0 (0.0%) | 0 (0.0%) |
| Computers, Engineering & Science | 0 (0.0%) | 6 (100.0%) |
| Computers & Mathematics | 0 (0.0%) | 0 (0.0%) |
| Architecture & Engineering | 0 (0.0%) | 6 (100.0%) |
| Life, Physical & Social Science | 0 (0.0%) | 0 (0.0%) |
| Community & Social Service | 0 (0.0%) | 0 (0.0%) |
| Education, Arts & Media | 0 (0.0%) | 0 (0.0%) |
| Legal Services & Support | 0 (0.0%) | 0 (0.0%) |
| Education Instruction & Library | 0 (0.0%) | 0 (0.0%) |
| Arts, Media & Entertainment | 0 (0.0%) | 0 (0.0%) |
| Health Diagnosing & Treating | 0 (0.0%) | 0 (0.0%) |
| Health Technologists | 0 (0.0%) | 0 (0.0%) |
| Total (Category) | 20 (76.9%) | 6 (23.1%) |
| Total (Overall) | 20 (51.3%) | 19 (48.7%) |
Services Occupations
The most common Services occupations in Fishers Island are Cleaning & Maintenance (9 | 23.1%), and Healthcare Support (4 | 10.3%).
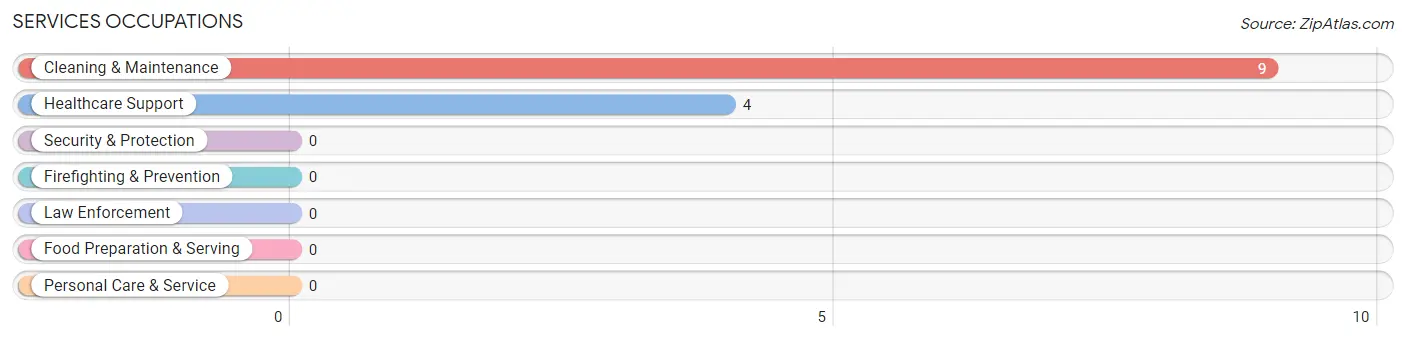
Services Occupations by Sex
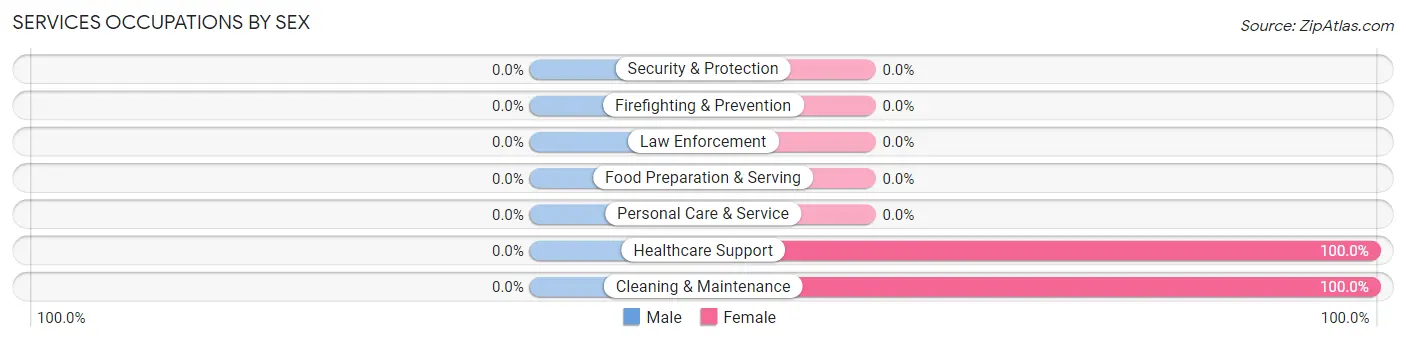
| Occupation | Male | Female |
| Healthcare Support | 0 (0.0%) | 4 (100.0%) |
| Security & Protection | 0 (0.0%) | 0 (0.0%) |
| Firefighting & Prevention | 0 (0.0%) | 0 (0.0%) |
| Law Enforcement | 0 (0.0%) | 0 (0.0%) |
| Food Preparation & Serving | 0 (0.0%) | 0 (0.0%) |
| Cleaning & Maintenance | 0 (0.0%) | 9 (100.0%) |
| Personal Care & Service | 0 (0.0%) | 0 (0.0%) |
| Total (Category) | 0 (0.0%) | 13 (100.0%) |
| Total (Overall) | 20 (51.3%) | 19 (48.7%) |
Sales and Office Occupations
Sales and Office Occupations by Sex
| Occupation | Male | Female |
| Sales & Related | 0 (0.0%) | 0 (0.0%) |
| Office & Administration | 0 (0.0%) | 0 (0.0%) |
| Total (Category) | 0 (0.0%) | 0 (0.0%) |
| Total (Overall) | 20 (51.3%) | 19 (48.7%) |
Natural Resources, Construction and Maintenance Occupations
Natural Resources, Construction and Maintenance Occupations by Sex
| Occupation | Male | Female |
| Farming, Fishing & Forestry | 0 (0.0%) | 0 (0.0%) |
| Construction & Extraction | 0 (0.0%) | 0 (0.0%) |
| Installation, Maintenance & Repair | 0 (0.0%) | 0 (0.0%) |
| Total (Category) | 0 (0.0%) | 0 (0.0%) |
| Total (Overall) | 20 (51.3%) | 19 (48.7%) |
Production, Transportation and Moving Occupations
Production, Transportation and Moving Occupations by Sex
| Occupation | Male | Female |
| Production | 0 (0.0%) | 0 (0.0%) |
| Transportation | 0 (0.0%) | 0 (0.0%) |
| Material Moving | 0 (0.0%) | 0 (0.0%) |
| Total (Category) | 0 (0.0%) | 0 (0.0%) |
| Total (Overall) | 20 (51.3%) | 19 (48.7%) |
Employment Industries by Sex in Fishers Island
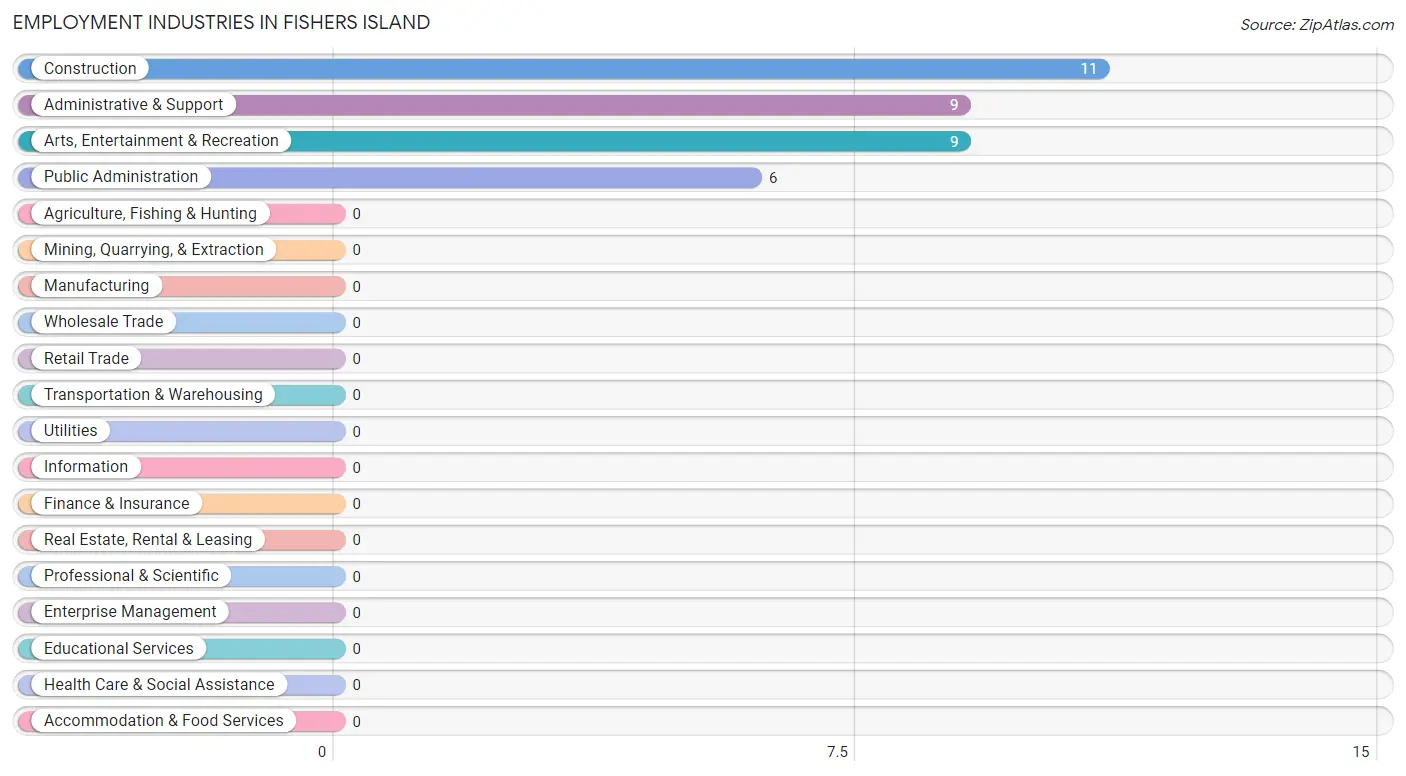
Employment Industries in Fishers Island
The major employment industries in Fishers Island include Construction (11 | 28.2%), Administrative & Support (9 | 23.1%), Arts, Entertainment & Recreation (9 | 23.1%), and Public Administration (6 | 15.4%).
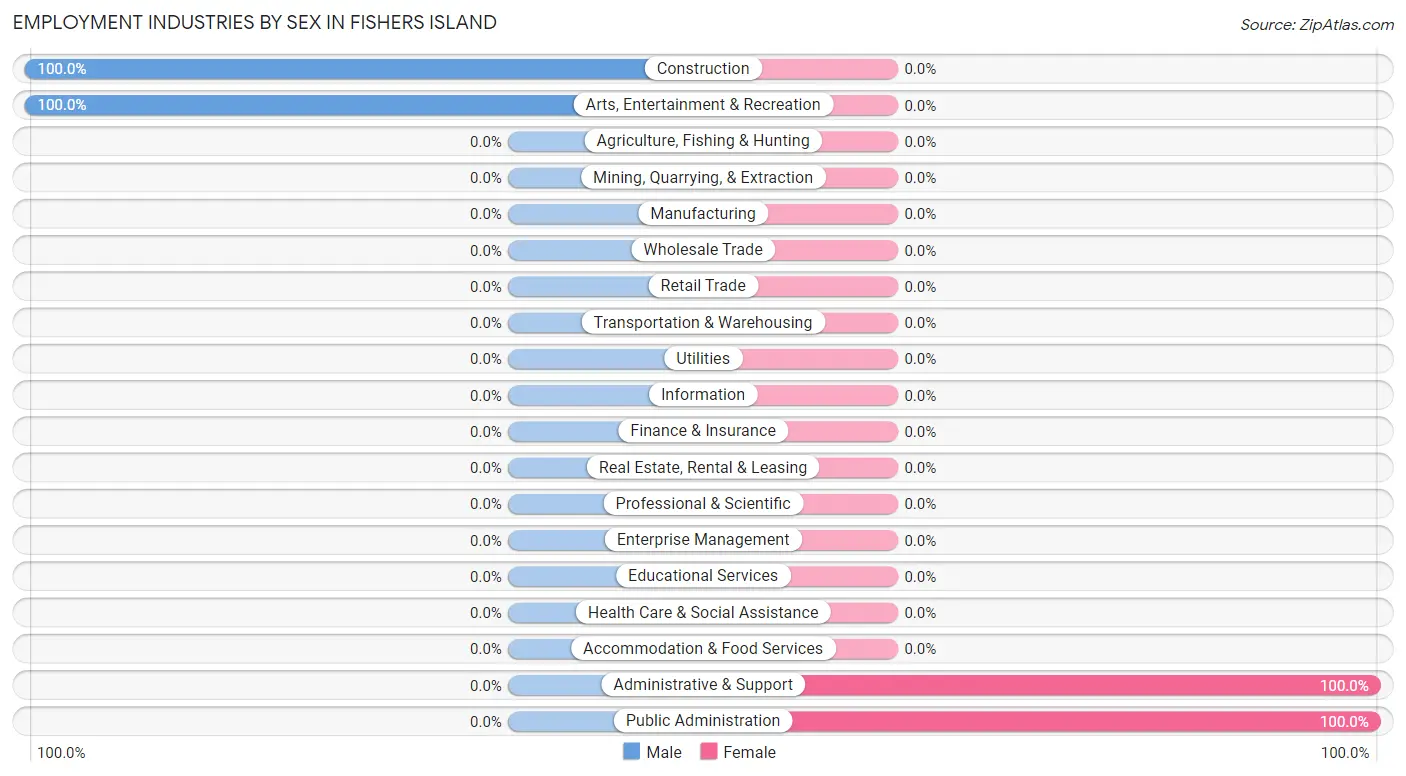
Employment Industries by Sex in Fishers Island
The Fishers Island industries that see more men than women are Construction (100.0%), and Arts, Entertainment & Recreation (100.0%), whereas the industries that tend to have a higher number of women are Administrative & Support (100.0%), and Public Administration (100.0%).
| Industry | Male | Female |
| Agriculture, Fishing & Hunting | 0 (0.0%) | 0 (0.0%) |
| Mining, Quarrying, & Extraction | 0 (0.0%) | 0 (0.0%) |
| Construction | 11 (100.0%) | 0 (0.0%) |
| Manufacturing | 0 (0.0%) | 0 (0.0%) |
| Wholesale Trade | 0 (0.0%) | 0 (0.0%) |
| Retail Trade | 0 (0.0%) | 0 (0.0%) |
| Transportation & Warehousing | 0 (0.0%) | 0 (0.0%) |
| Utilities | 0 (0.0%) | 0 (0.0%) |
| Information | 0 (0.0%) | 0 (0.0%) |
| Finance & Insurance | 0 (0.0%) | 0 (0.0%) |
| Real Estate, Rental & Leasing | 0 (0.0%) | 0 (0.0%) |
| Professional & Scientific | 0 (0.0%) | 0 (0.0%) |
| Enterprise Management | 0 (0.0%) | 0 (0.0%) |
| Administrative & Support | 0 (0.0%) | 9 (100.0%) |
| Educational Services | 0 (0.0%) | 0 (0.0%) |
| Health Care & Social Assistance | 0 (0.0%) | 0 (0.0%) |
| Arts, Entertainment & Recreation | 9 (100.0%) | 0 (0.0%) |
| Accommodation & Food Services | 0 (0.0%) | 0 (0.0%) |
| Public Administration | 0 (0.0%) | 6 (100.0%) |
| Total | 20 (51.3%) | 19 (48.7%) |
Education in Fishers Island
School Enrollment in Fishers Island
The most common levels of schooling among the 6 students in Fishers Island are middle school (5 | 83.3%), and elementary school (1 | 16.7%).
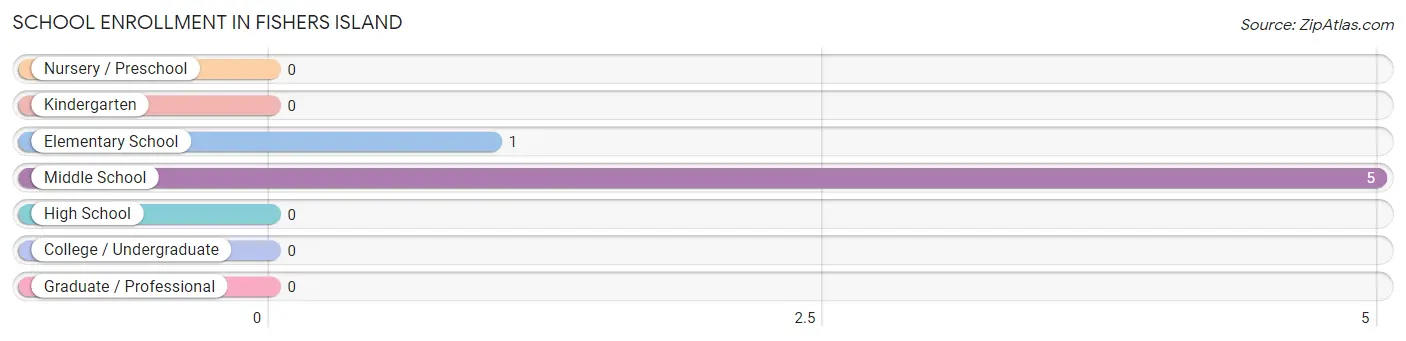
| School Level | # Students | % Students |
| Nursery / Preschool | 0 | 0.0% |
| Kindergarten | 0 | 0.0% |
| Elementary School | 1 | 16.7% |
| Middle School | 5 | 83.3% |
| High School | 0 | 0.0% |
| College / Undergraduate | 0 | 0.0% |
| Graduate / Professional | 0 | 0.0% |
| Total | 6 | 100.0% |
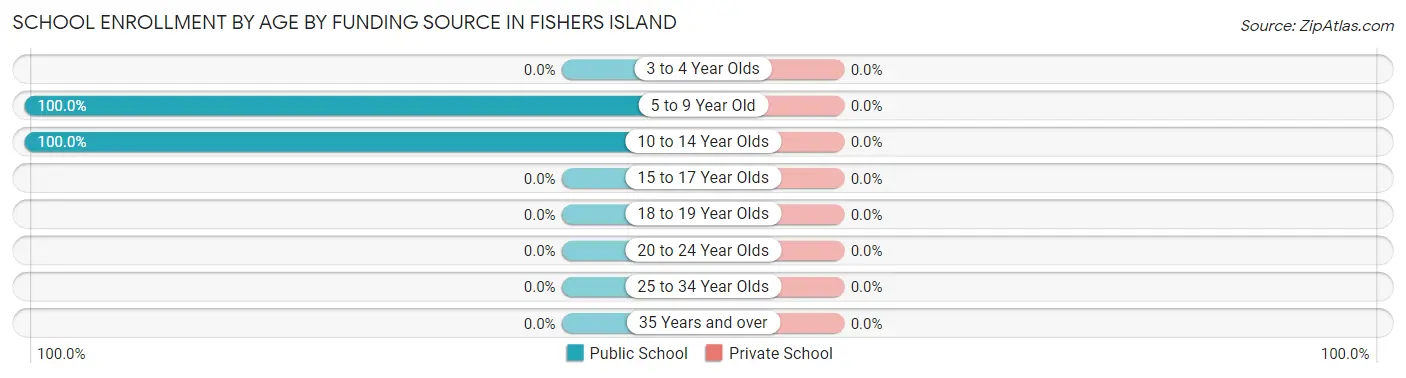
School Enrollment by Age by Funding Source in Fishers Island
| Age Bracket | Public School | Private School |
| 3 to 4 Year Olds | 0 (0.0%) | 0 (0.0%) |
| 5 to 9 Year Old | 1 (100.0%) | 0 (0.0%) |
| 10 to 14 Year Olds | 5 (100.0%) | 0 (0.0%) |
| 15 to 17 Year Olds | 0 (0.0%) | 0 (0.0%) |
| 18 to 19 Year Olds | 0 (0.0%) | 0 (0.0%) |
| 20 to 24 Year Olds | 0 (0.0%) | 0 (0.0%) |
| 25 to 34 Year Olds | 0 (0.0%) | 0 (0.0%) |
| 35 Years and over | 0 (0.0%) | 0 (0.0%) |
| Total | 6 (100.0%) | 0 (0.0%) |
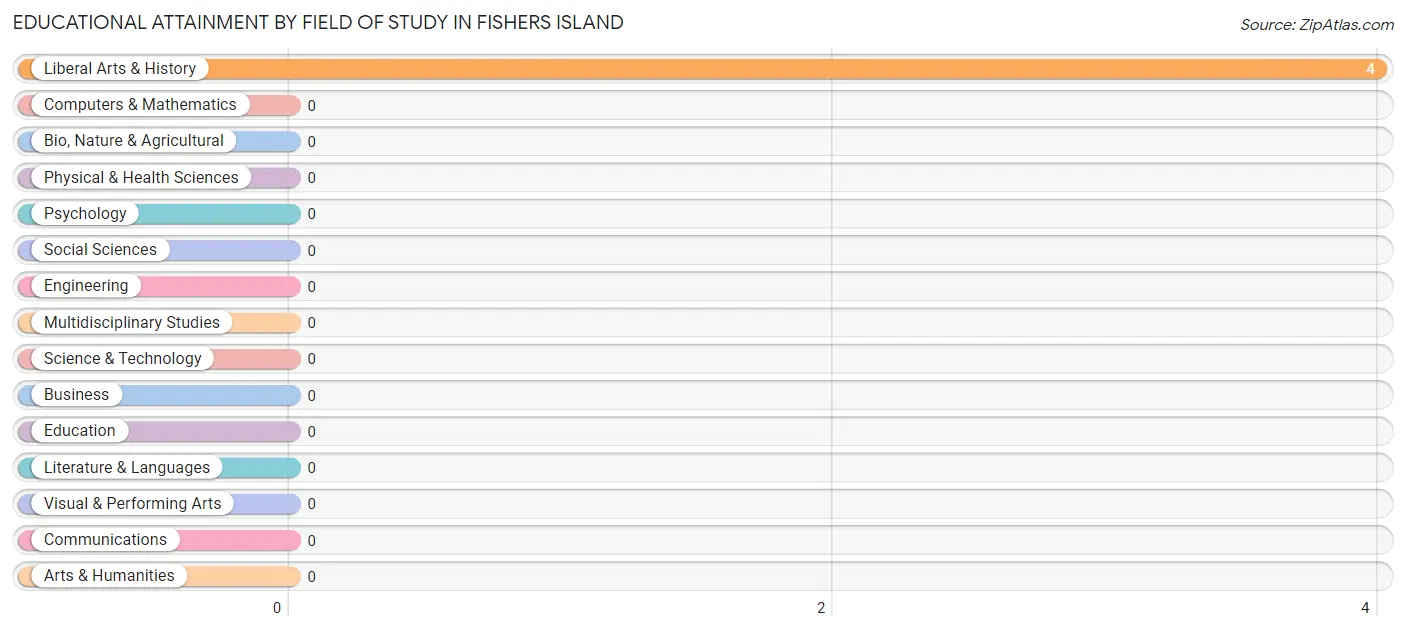
Educational Attainment by Field of Study in Fishers Island
, and liberal arts & history (4 | 100.0%) are the most common fields of study among 4 individuals in Fishers Island who have obtained a bachelor's degree or higher.
| Field of Study | # Graduates | % Graduates |
| Computers & Mathematics | 0 | 0.0% |
| Bio, Nature & Agricultural | 0 | 0.0% |
| Physical & Health Sciences | 0 | 0.0% |
| Psychology | 0 | 0.0% |
| Social Sciences | 0 | 0.0% |
| Engineering | 0 | 0.0% |
| Multidisciplinary Studies | 0 | 0.0% |
| Science & Technology | 0 | 0.0% |
| Business | 0 | 0.0% |
| Education | 0 | 0.0% |
| Literature & Languages | 0 | 0.0% |
| Liberal Arts & History | 4 | 100.0% |
| Visual & Performing Arts | 0 | 0.0% |
| Communications | 0 | 0.0% |
| Arts & Humanities | 0 | 0.0% |
| Total | 4 | 100.0% |
Transportation & Commute in Fishers Island
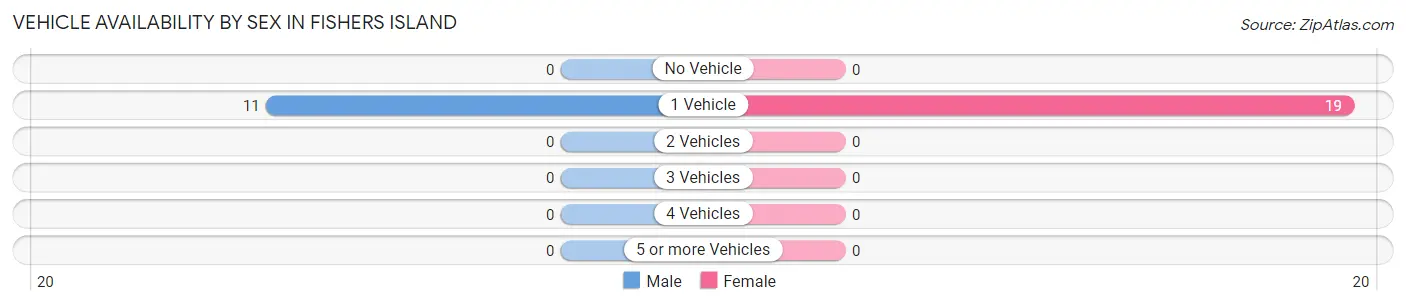
Vehicle Availability by Sex in Fishers Island
The most prevalent vehicle ownership categories in Fishers Island are males with 1 vehicle (11, accounting for 100.0%) and females with 1 vehicle (19, making up 57.9%).
| Vehicles Available | Male | Female |
| No Vehicle | 0 (0.0%) | 0 (0.0%) |
| 1 Vehicle | 11 (100.0%) | 19 (100.0%) |
| 2 Vehicles | 0 (0.0%) | 0 (0.0%) |
| 3 Vehicles | 0 (0.0%) | 0 (0.0%) |
| 4 Vehicles | 0 (0.0%) | 0 (0.0%) |
| 5 or more Vehicles | 0 (0.0%) | 0 (0.0%) |
| Total | 11 (100.0%) | 19 (100.0%) |
Commute Time in Fishers Island
The most frequently occuring commute durations in Fishers Island are 5 to 9 minutes (11 commuters, 36.7%), 10 to 14 minutes (10 commuters, 33.3%), and less than 5 minutes (9 commuters, 30.0%).
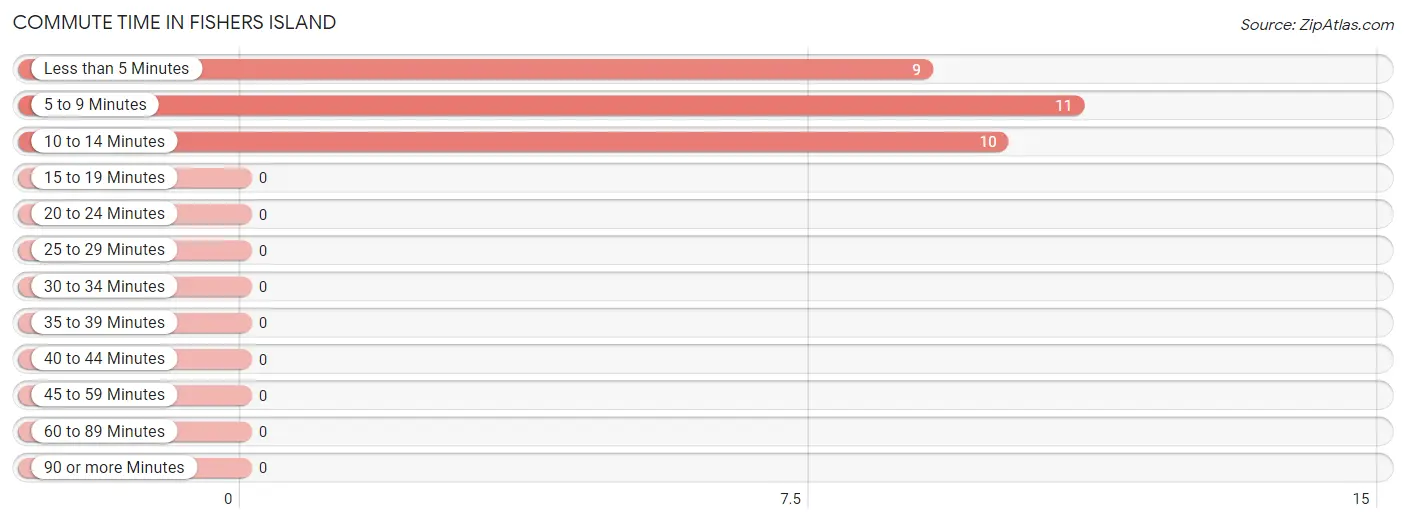
| Commute Time | # Commuters | % Commuters |
| Less than 5 Minutes | 9 | 30.0% |
| 5 to 9 Minutes | 11 | 36.7% |
| 10 to 14 Minutes | 10 | 33.3% |
| 15 to 19 Minutes | 0 | 0.0% |
| 20 to 24 Minutes | 0 | 0.0% |
| 25 to 29 Minutes | 0 | 0.0% |
| 30 to 34 Minutes | 0 | 0.0% |
| 35 to 39 Minutes | 0 | 0.0% |
| 40 to 44 Minutes | 0 | 0.0% |
| 45 to 59 Minutes | 0 | 0.0% |
| 60 to 89 Minutes | 0 | 0.0% |
| 90 or more Minutes | 0 | 0.0% |
Commute Time by Sex in Fishers Island
The most common commute times in Fishers Island are less than 5 minutes (9 commuters, 81.8%) for males and 10 to 14 minutes (10 commuters, 52.6%) for females.
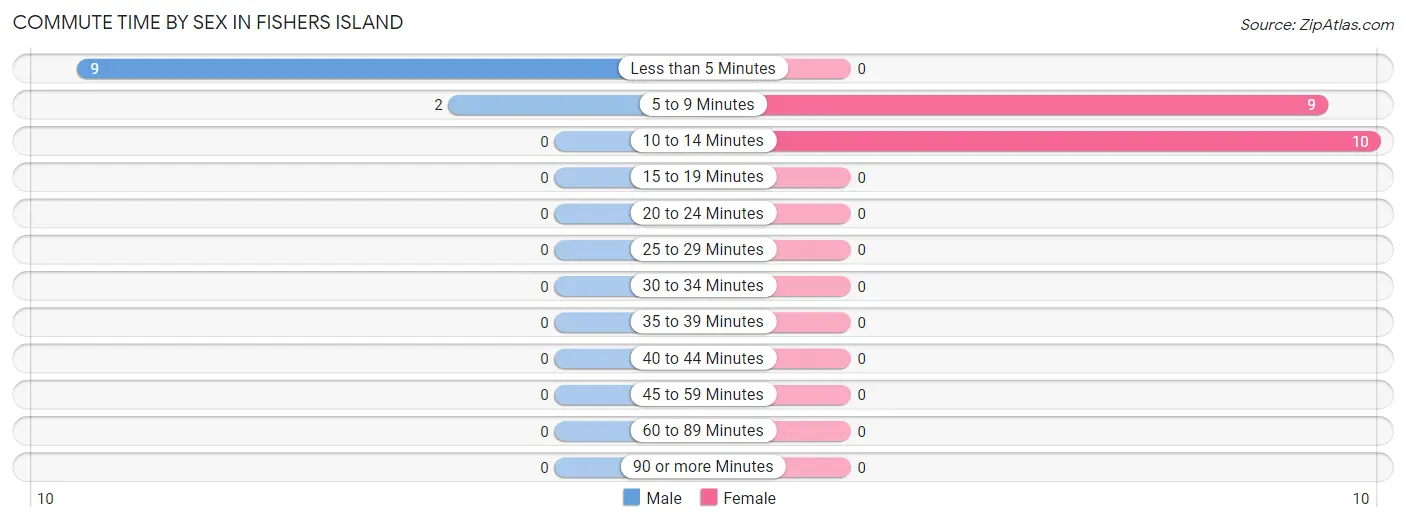
| Commute Time | Male | Female |
| Less than 5 Minutes | 9 (81.8%) | 0 (0.0%) |
| 5 to 9 Minutes | 2 (18.2%) | 9 (47.4%) |
| 10 to 14 Minutes | 0 (0.0%) | 10 (52.6%) |
| 15 to 19 Minutes | 0 (0.0%) | 0 (0.0%) |
| 20 to 24 Minutes | 0 (0.0%) | 0 (0.0%) |
| 25 to 29 Minutes | 0 (0.0%) | 0 (0.0%) |
| 30 to 34 Minutes | 0 (0.0%) | 0 (0.0%) |
| 35 to 39 Minutes | 0 (0.0%) | 0 (0.0%) |
| 40 to 44 Minutes | 0 (0.0%) | 0 (0.0%) |
| 45 to 59 Minutes | 0 (0.0%) | 0 (0.0%) |
| 60 to 89 Minutes | 0 (0.0%) | 0 (0.0%) |
| 90 or more Minutes | 0 (0.0%) | 0 (0.0%) |
Time of Departure to Work by Sex in Fishers Island
The most frequent times of departure to work in Fishers Island are 7:00 AM to 7:29 AM (9, 81.8%) for males and 12:00 AM to 4:59 AM (9, 47.4%) for females.
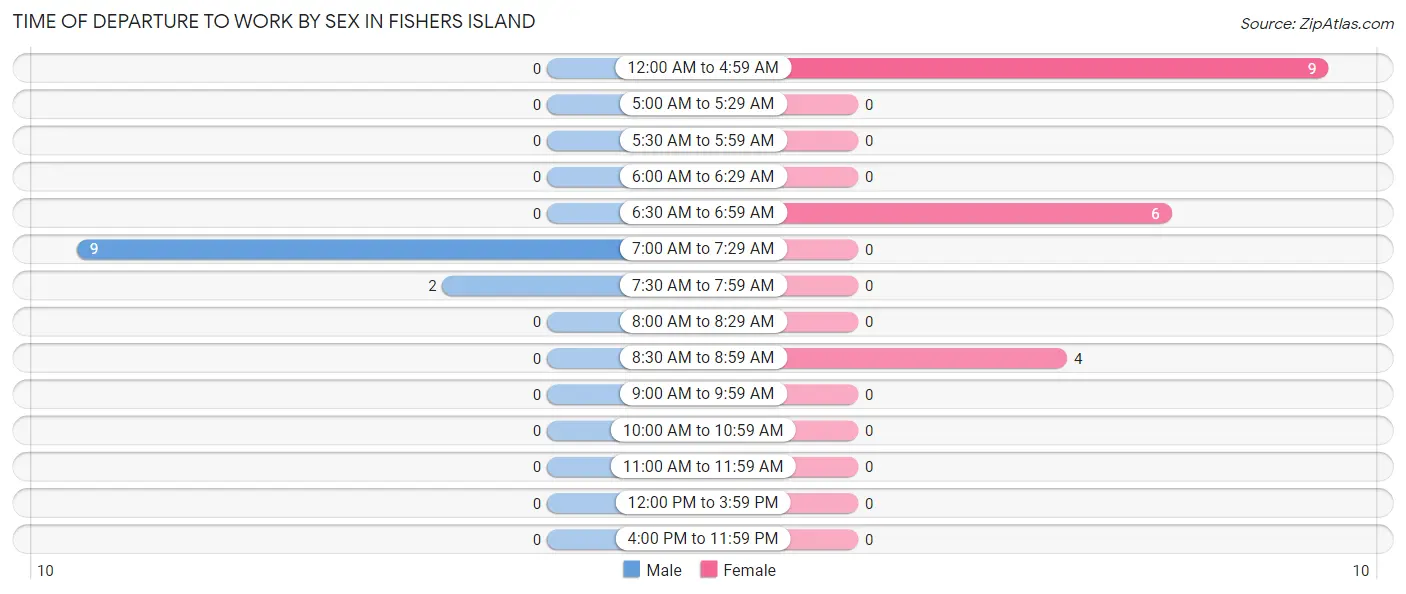
| Time of Departure | Male | Female |
| 12:00 AM to 4:59 AM | 0 (0.0%) | 9 (47.4%) |
| 5:00 AM to 5:29 AM | 0 (0.0%) | 0 (0.0%) |
| 5:30 AM to 5:59 AM | 0 (0.0%) | 0 (0.0%) |
| 6:00 AM to 6:29 AM | 0 (0.0%) | 0 (0.0%) |
| 6:30 AM to 6:59 AM | 0 (0.0%) | 6 (31.6%) |
| 7:00 AM to 7:29 AM | 9 (81.8%) | 0 (0.0%) |
| 7:30 AM to 7:59 AM | 2 (18.2%) | 0 (0.0%) |
| 8:00 AM to 8:29 AM | 0 (0.0%) | 0 (0.0%) |
| 8:30 AM to 8:59 AM | 0 (0.0%) | 4 (21.0%) |
| 9:00 AM to 9:59 AM | 0 (0.0%) | 0 (0.0%) |
| 10:00 AM to 10:59 AM | 0 (0.0%) | 0 (0.0%) |
| 11:00 AM to 11:59 AM | 0 (0.0%) | 0 (0.0%) |
| 12:00 PM to 3:59 PM | 0 (0.0%) | 0 (0.0%) |
| 4:00 PM to 11:59 PM | 0 (0.0%) | 0 (0.0%) |
| Total | 11 (100.0%) | 19 (100.0%) |
Housing Occupancy in Fishers Island
Occupancy by Ownership in Fishers Island
Of the total 19 dwellings in Fishers Island, owner-occupied units account for 9 (47.4%), while renter-occupied units make up 10 (52.6%).
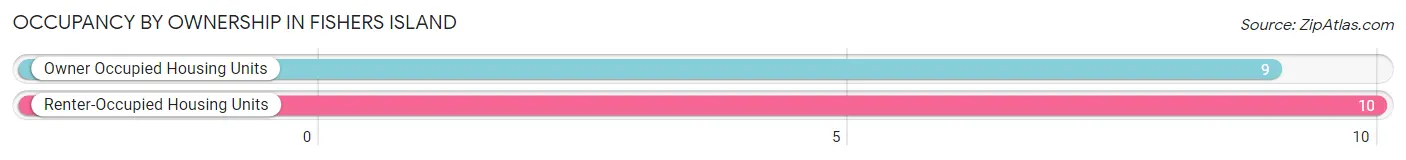
| Occupancy | # Housing Units | % Housing Units |
| Owner Occupied Housing Units | 9 | 47.4% |
| Renter-Occupied Housing Units | 10 | 52.6% |
| Total Occupied Housing Units | 19 | 100.0% |
Occupancy by Household Size in Fishers Island
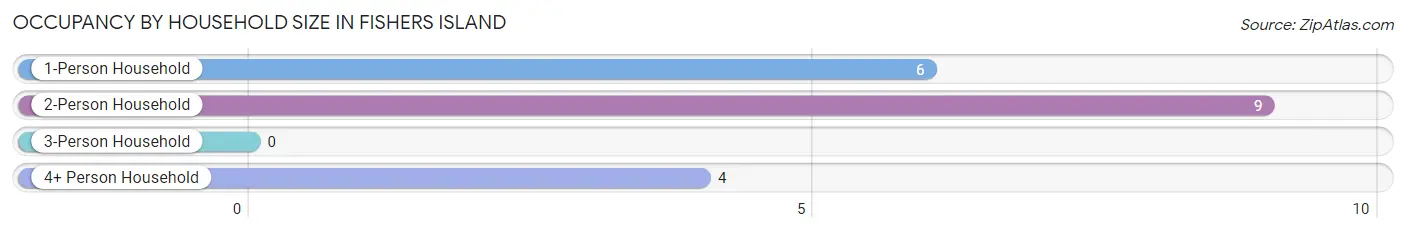
| Household Size | # Housing Units | % Housing Units |
| 1-Person Household | 6 | 31.6% |
| 2-Person Household | 9 | 47.4% |
| 3-Person Household | 0 | 0.0% |
| 4+ Person Household | 4 | 21.0% |
| Total Housing Units | 19 | 100.0% |
Occupancy by Ownership by Household Size in Fishers Island
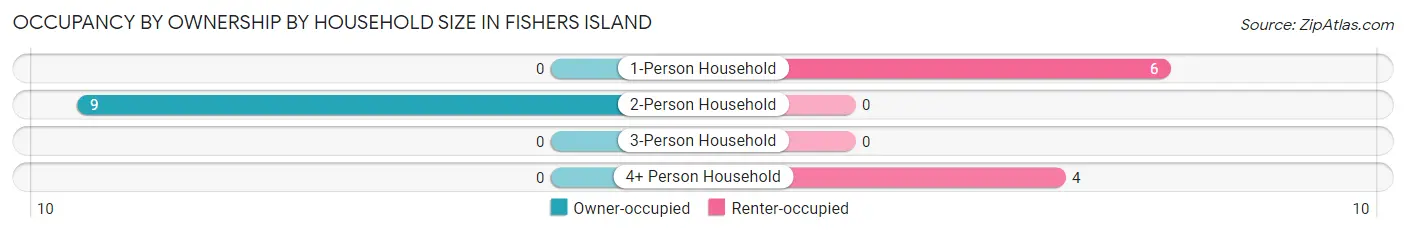
| Household Size | Owner-occupied | Renter-occupied |
| 1-Person Household | 0 (0.0%) | 6 (100.0%) |
| 2-Person Household | 9 (100.0%) | 0 (0.0%) |
| 3-Person Household | 0 (0.0%) | 0 (0.0%) |
| 4+ Person Household | 0 (0.0%) | 4 (100.0%) |
| Total Housing Units | 9 (47.4%) | 10 (52.6%) |
Occupancy by Educational Attainment in Fishers Island
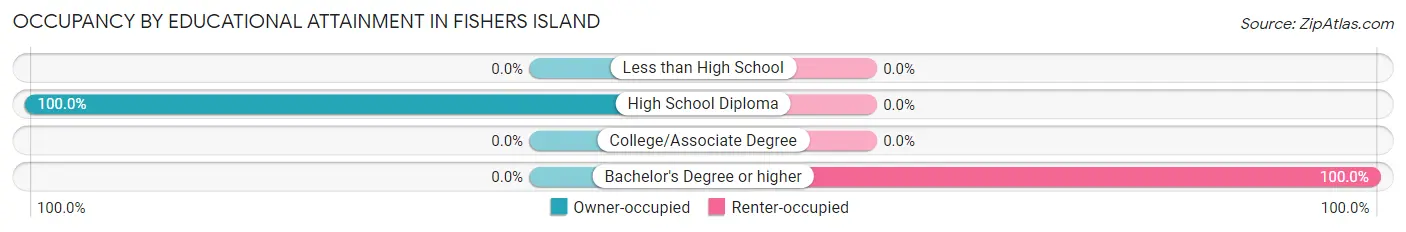
| Household Size | Owner-occupied | Renter-occupied |
| Less than High School | 0 (0.0%) | 0 (0.0%) |
| High School Diploma | 9 (100.0%) | 0 (0.0%) |
| College/Associate Degree | 0 (0.0%) | 0 (0.0%) |
| Bachelor's Degree or higher | 0 (0.0%) | 10 (100.0%) |
Occupancy by Age of Householder in Fishers Island
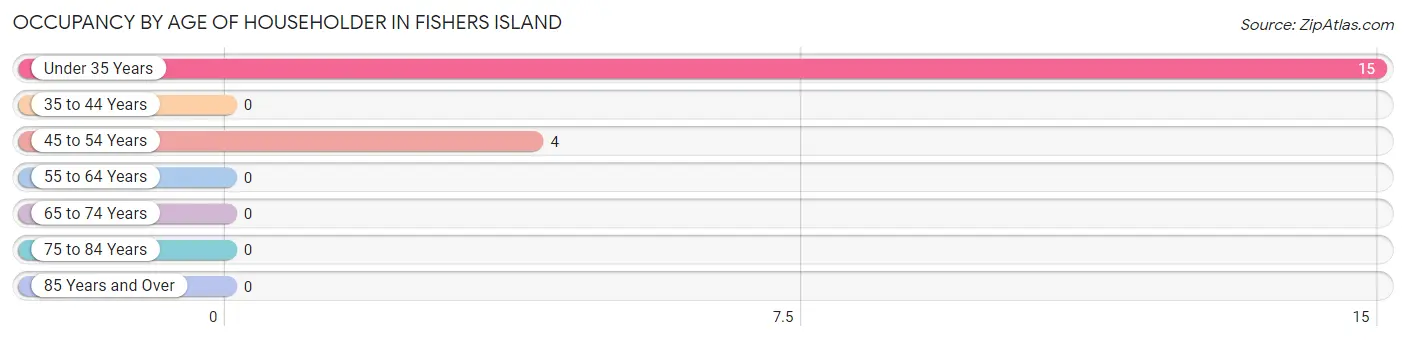
| Age Bracket | # Households | % Households |
| Under 35 Years | 15 | 78.9% |
| 35 to 44 Years | 0 | 0.0% |
| 45 to 54 Years | 4 | 21.0% |
| 55 to 64 Years | 0 | 0.0% |
| 65 to 74 Years | 0 | 0.0% |
| 75 to 84 Years | 0 | 0.0% |
| 85 Years and Over | 0 | 0.0% |
| Total | 19 | 100.0% |
Housing Finances in Fishers Island
Median Income by Occupancy in Fishers Island
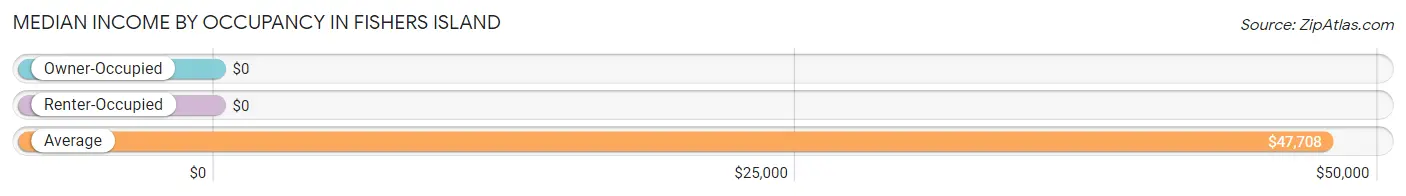
| Occupancy Type | # Households | Median Income |
| Owner-Occupied | 9 (47.4%) | $0 |
| Renter-Occupied | 10 (52.6%) | $0 |
| Average | 19 (100.0%) | $47,708 |
Occupancy by Householder Income Bracket in Fishers Island
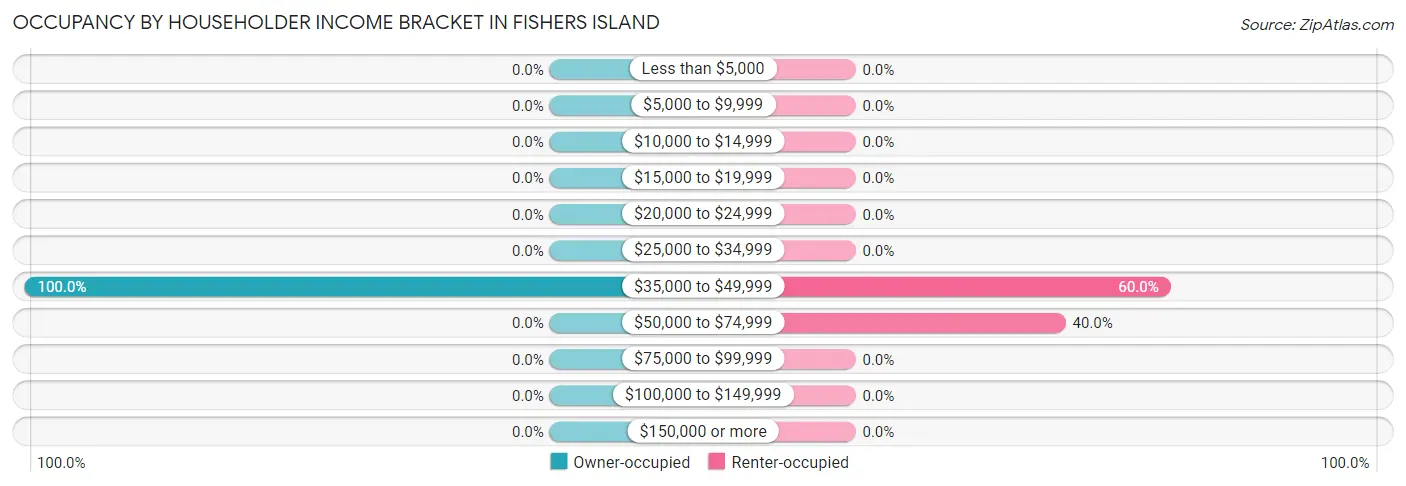
| Income Bracket | Owner-occupied | Renter-occupied |
| Less than $5,000 | 0 (0.0%) | 0 (0.0%) |
| $5,000 to $9,999 | 0 (0.0%) | 0 (0.0%) |
| $10,000 to $14,999 | 0 (0.0%) | 0 (0.0%) |
| $15,000 to $19,999 | 0 (0.0%) | 0 (0.0%) |
| $20,000 to $24,999 | 0 (0.0%) | 0 (0.0%) |
| $25,000 to $34,999 | 0 (0.0%) | 0 (0.0%) |
| $35,000 to $49,999 | 9 (100.0%) | 6 (60.0%) |
| $50,000 to $74,999 | 0 (0.0%) | 4 (40.0%) |
| $75,000 to $99,999 | 0 (0.0%) | 0 (0.0%) |
| $100,000 to $149,999 | 0 (0.0%) | 0 (0.0%) |
| $150,000 or more | 0 (0.0%) | 0 (0.0%) |
| Total | 9 (100.0%) | 10 (100.0%) |
Monthly Housing Cost Tiers in Fishers Island
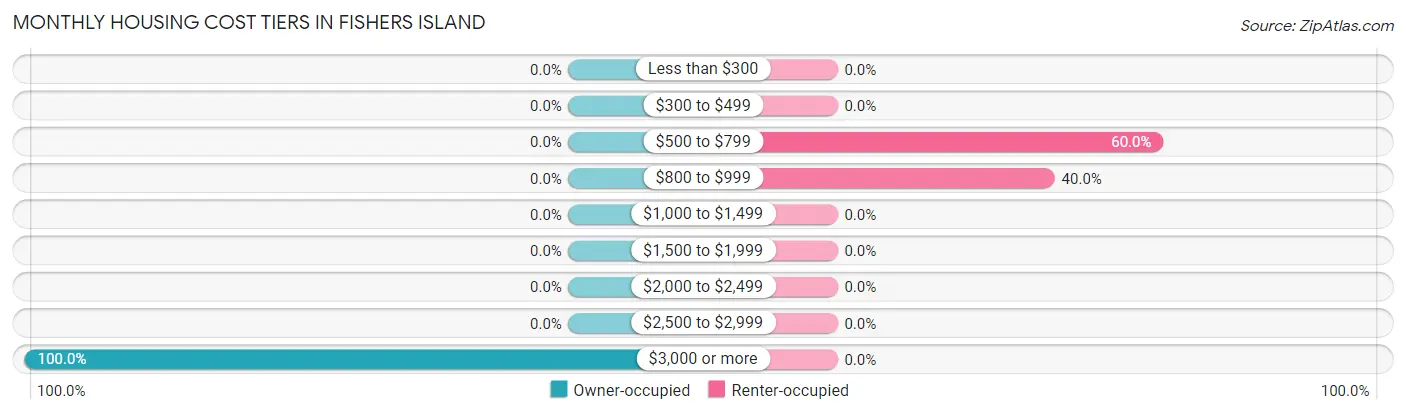
| Monthly Cost | Owner-occupied | Renter-occupied |
| Less than $300 | 0 (0.0%) | 0 (0.0%) |
| $300 to $499 | 0 (0.0%) | 0 (0.0%) |
| $500 to $799 | 0 (0.0%) | 6 (60.0%) |
| $800 to $999 | 0 (0.0%) | 4 (40.0%) |
| $1,000 to $1,499 | 0 (0.0%) | 0 (0.0%) |
| $1,500 to $1,999 | 0 (0.0%) | 0 (0.0%) |
| $2,000 to $2,499 | 0 (0.0%) | 0 (0.0%) |
| $2,500 to $2,999 | 0 (0.0%) | 0 (0.0%) |
| $3,000 or more | 9 (100.0%) | 0 (0.0%) |
| Total | 9 (100.0%) | 10 (100.0%) |
Physical Housing Characteristics in Fishers Island
Housing Structures in Fishers Island
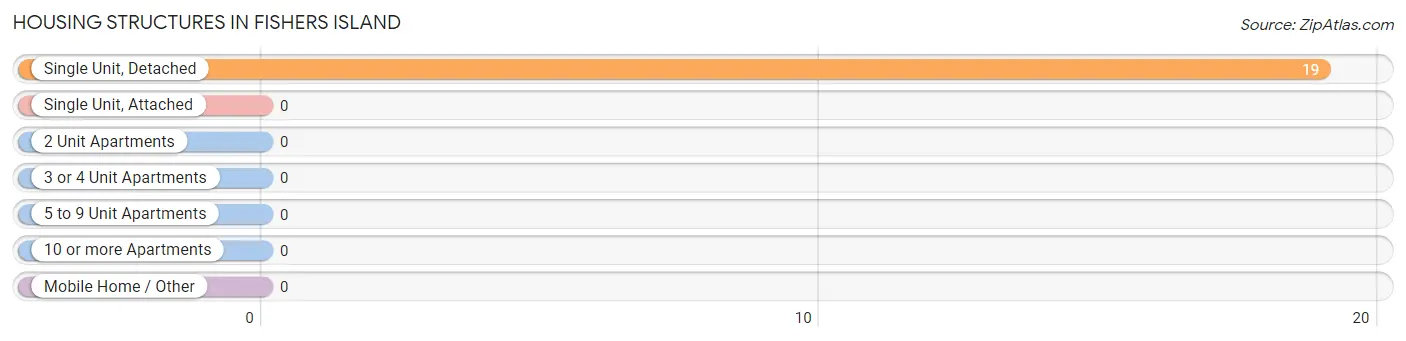
| Structure Type | # Housing Units | % Housing Units |
| Single Unit, Detached | 19 | 100.0% |
| Single Unit, Attached | 0 | 0.0% |
| 2 Unit Apartments | 0 | 0.0% |
| 3 or 4 Unit Apartments | 0 | 0.0% |
| 5 to 9 Unit Apartments | 0 | 0.0% |
| 10 or more Apartments | 0 | 0.0% |
| Mobile Home / Other | 0 | 0.0% |
| Total | 19 | 100.0% |
Housing Structures by Occupancy in Fishers Island
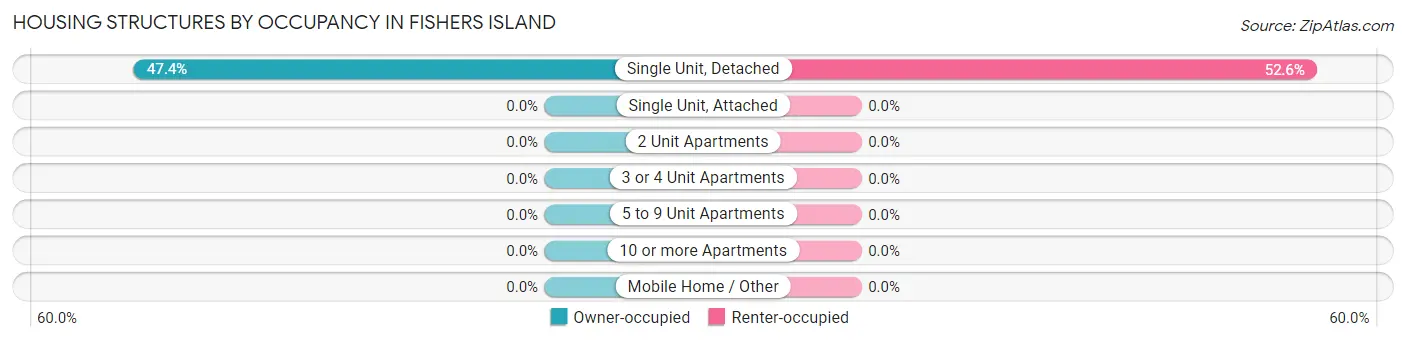
| Structure Type | Owner-occupied | Renter-occupied |
| Single Unit, Detached | 9 (47.4%) | 10 (52.6%) |
| Single Unit, Attached | 0 (0.0%) | 0 (0.0%) |
| 2 Unit Apartments | 0 (0.0%) | 0 (0.0%) |
| 3 or 4 Unit Apartments | 0 (0.0%) | 0 (0.0%) |
| 5 to 9 Unit Apartments | 0 (0.0%) | 0 (0.0%) |
| 10 or more Apartments | 0 (0.0%) | 0 (0.0%) |
| Mobile Home / Other | 0 (0.0%) | 0 (0.0%) |
| Total | 9 (47.4%) | 10 (52.6%) |
Housing Structures by Number of Rooms in Fishers Island
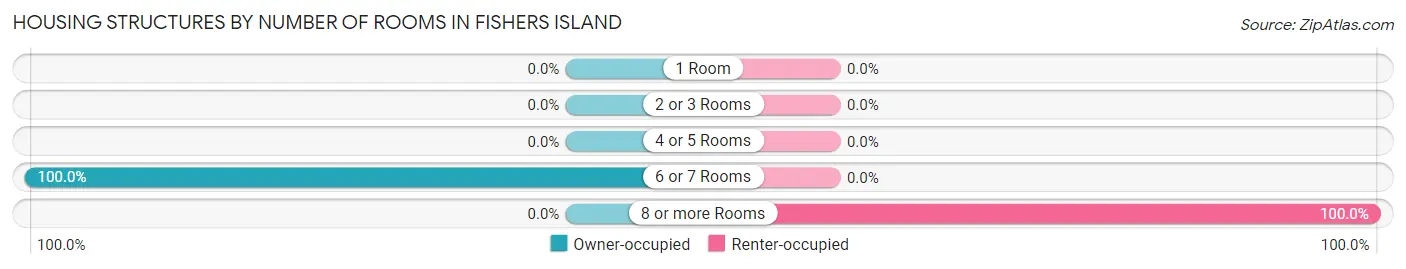
| Number of Rooms | Owner-occupied | Renter-occupied |
| 1 Room | 0 (0.0%) | 0 (0.0%) |
| 2 or 3 Rooms | 0 (0.0%) | 0 (0.0%) |
| 4 or 5 Rooms | 0 (0.0%) | 0 (0.0%) |
| 6 or 7 Rooms | 9 (100.0%) | 0 (0.0%) |
| 8 or more Rooms | 0 (0.0%) | 10 (100.0%) |
| Total | 9 (100.0%) | 10 (100.0%) |
Housing Structure by Heating Type in Fishers Island
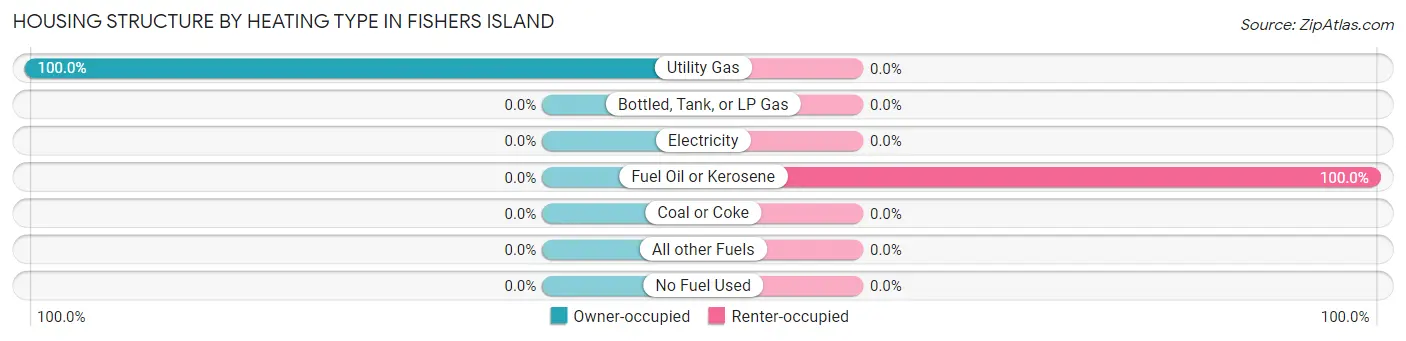
| Heating Type | Owner-occupied | Renter-occupied |
| Utility Gas | 9 (100.0%) | 0 (0.0%) |
| Bottled, Tank, or LP Gas | 0 (0.0%) | 0 (0.0%) |
| Electricity | 0 (0.0%) | 0 (0.0%) |
| Fuel Oil or Kerosene | 0 (0.0%) | 10 (100.0%) |
| Coal or Coke | 0 (0.0%) | 0 (0.0%) |
| All other Fuels | 0 (0.0%) | 0 (0.0%) |
| No Fuel Used | 0 (0.0%) | 0 (0.0%) |
| Total | 9 (100.0%) | 10 (100.0%) |
Household Vehicle Usage in Fishers Island
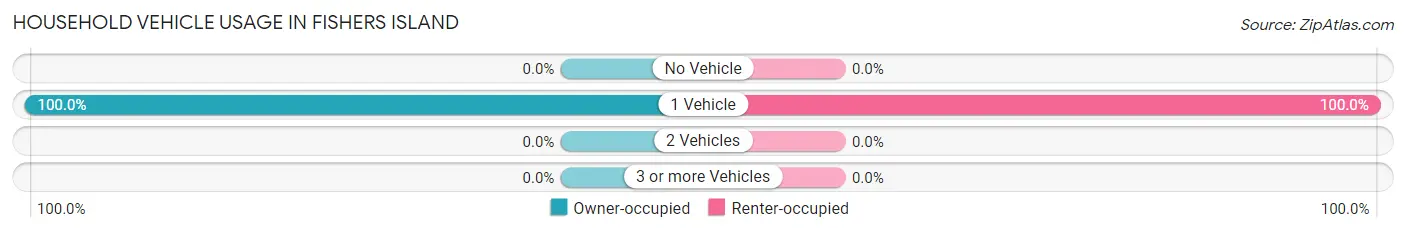
| Vehicles per Household | Owner-occupied | Renter-occupied |
| No Vehicle | 0 (0.0%) | 0 (0.0%) |
| 1 Vehicle | 9 (100.0%) | 10 (100.0%) |
| 2 Vehicles | 0 (0.0%) | 0 (0.0%) |
| 3 or more Vehicles | 0 (0.0%) | 0 (0.0%) |
| Total | 9 (100.0%) | 10 (100.0%) |
Real Estate & Mortgages in Fishers Island
Real Estate and Mortgage Overview in Fishers Island
| Characteristic | Without Mortgage | With Mortgage |
| Housing Units | 9 | 0 |
| Median Property Value | - | - |
| Median Household Income | - | - |
| Monthly Housing Costs | - | - |
| Real Estate Taxes | - | - |
Property Value by Mortgage Status in Fishers Island
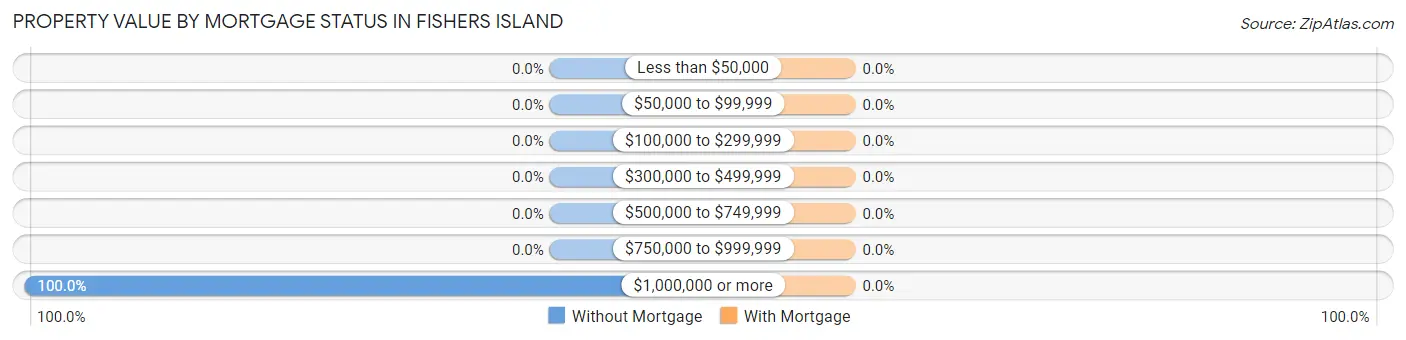
| Property Value | Without Mortgage | With Mortgage |
| Less than $50,000 | 0 (0.0%) | 0 (0.0%) |
| $50,000 to $99,999 | 0 (0.0%) | 0 (0.0%) |
| $100,000 to $299,999 | 0 (0.0%) | 0 (0.0%) |
| $300,000 to $499,999 | 0 (0.0%) | 0 (0.0%) |
| $500,000 to $749,999 | 0 (0.0%) | 0 (0.0%) |
| $750,000 to $999,999 | 0 (0.0%) | 0 (0.0%) |
| $1,000,000 or more | 9 (100.0%) | 0 (0.0%) |
| Total | 9 (100.0%) | 0 (0.0%) |
Household Income by Mortgage Status in Fishers Island
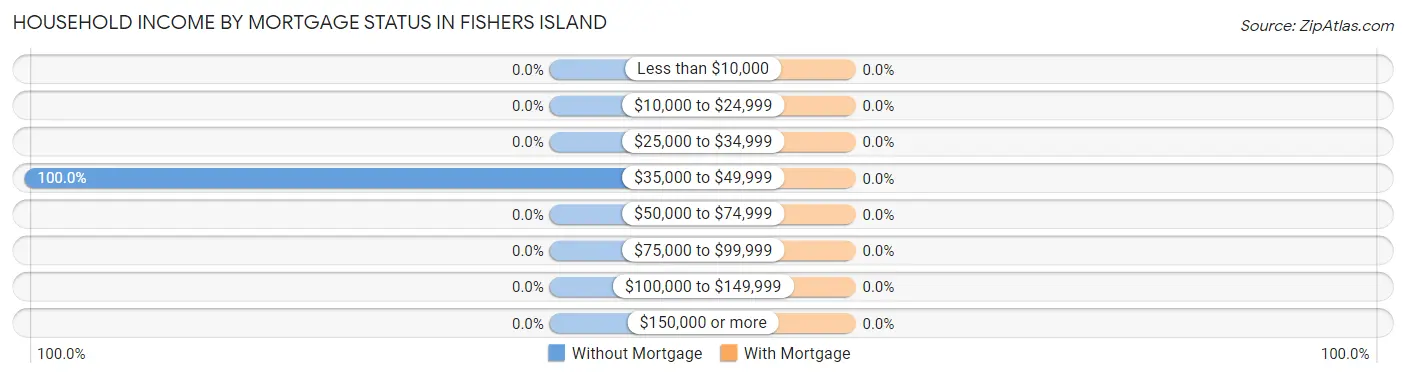
| Household Income | Without Mortgage | With Mortgage |
| Less than $10,000 | 0 (0.0%) | 0 (0.0%) |
| $10,000 to $24,999 | 0 (0.0%) | 0 (0.0%) |
| $25,000 to $34,999 | 0 (0.0%) | 0 (0.0%) |
| $35,000 to $49,999 | 9 (100.0%) | 0 (0.0%) |
| $50,000 to $74,999 | 0 (0.0%) | 0 (0.0%) |
| $75,000 to $99,999 | 0 (0.0%) | 0 (0.0%) |
| $100,000 to $149,999 | 0 (0.0%) | 0 (0.0%) |
| $150,000 or more | 0 (0.0%) | 0 (0.0%) |
| Total | 9 (100.0%) | 0 (0.0%) |
Property Value to Household Income Ratio in Fishers Island
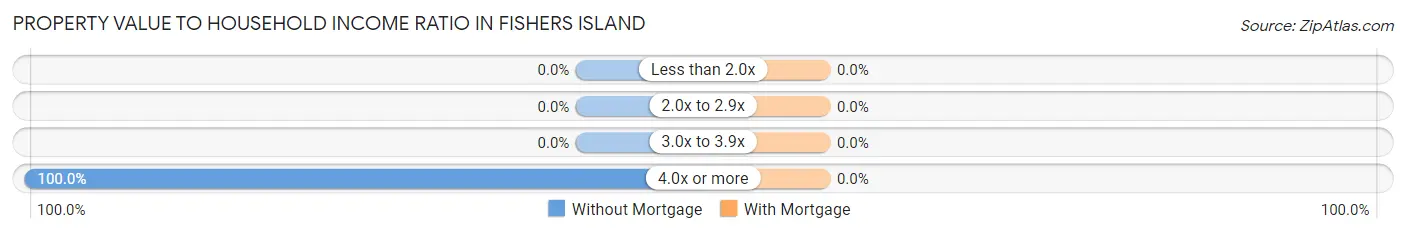
| Value-to-Income Ratio | Without Mortgage | With Mortgage |
| Less than 2.0x | 0 (0.0%) | 0 (0.0%) |
| 2.0x to 2.9x | 0 (0.0%) | 0 (0.0%) |
| 3.0x to 3.9x | 0 (0.0%) | 0 (0.0%) |
| 4.0x or more | 9 (100.0%) | 0 (0.0%) |
| Total | 9 (100.0%) | 0 (0.0%) |
Real Estate Taxes by Mortgage Status in Fishers Island
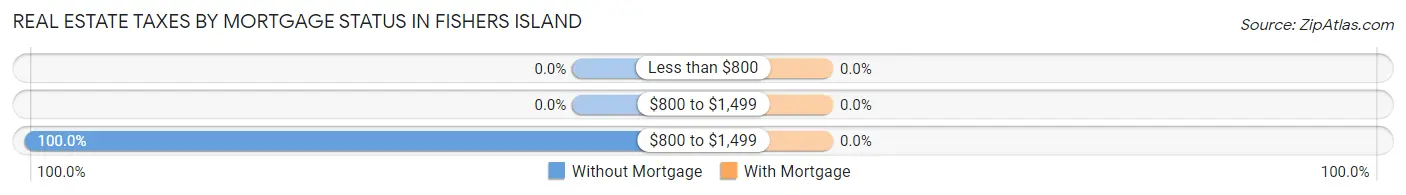
| Property Taxes | Without Mortgage | With Mortgage |
| Less than $800 | 0 (0.0%) | 0 (0.0%) |
| $800 to $1,499 | 0 (0.0%) | 0 (0.0%) |
| $800 to $1,499 | 9 (100.0%) | 0 (0.0%) |
| Total | 9 (100.0%) | 0 (0.0%) |
Health & Disability in Fishers Island
Health Insurance Coverage by Age in Fishers Island
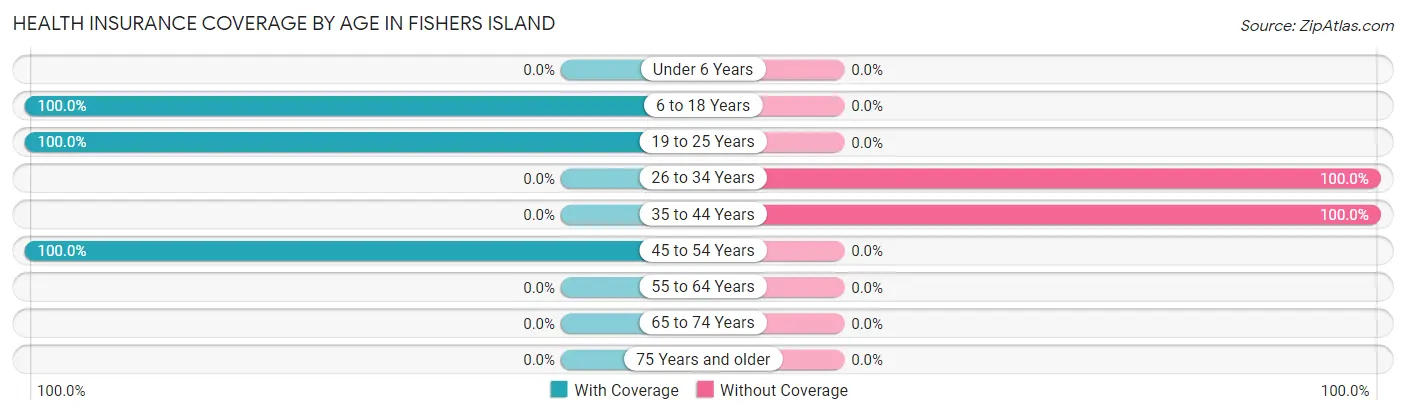
| Age Bracket | With Coverage | Without Coverage |
| Under 6 Years | 0 (0.0%) | 0 (0.0%) |
| 6 to 18 Years | 6 (100.0%) | 0 (0.0%) |
| 19 to 25 Years | 6 (100.0%) | 0 (0.0%) |
| 26 to 34 Years | 0 (0.0%) | 9 (100.0%) |
| 35 to 44 Years | 0 (0.0%) | 18 (100.0%) |
| 45 to 54 Years | 14 (100.0%) | 0 (0.0%) |
| 55 to 64 Years | 0 (0.0%) | 0 (0.0%) |
| 65 to 74 Years | 0 (0.0%) | 0 (0.0%) |
| 75 Years and older | 0 (0.0%) | 0 (0.0%) |
| Total | 26 (49.1%) | 27 (50.9%) |
Health Insurance Coverage by Citizenship Status in Fishers Island
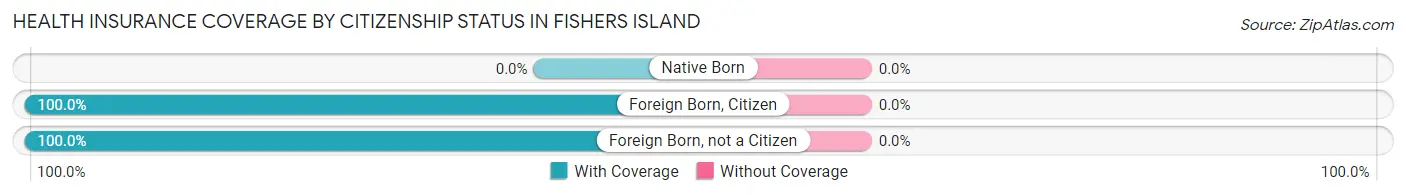
| Citizenship Status | With Coverage | Without Coverage |
| Native Born | 0 (0.0%) | 0 (0.0%) |
| Foreign Born, Citizen | 6 (100.0%) | 0 (0.0%) |
| Foreign Born, not a Citizen | 6 (100.0%) | 0 (0.0%) |
Health Insurance Coverage by Household Income in Fishers Island
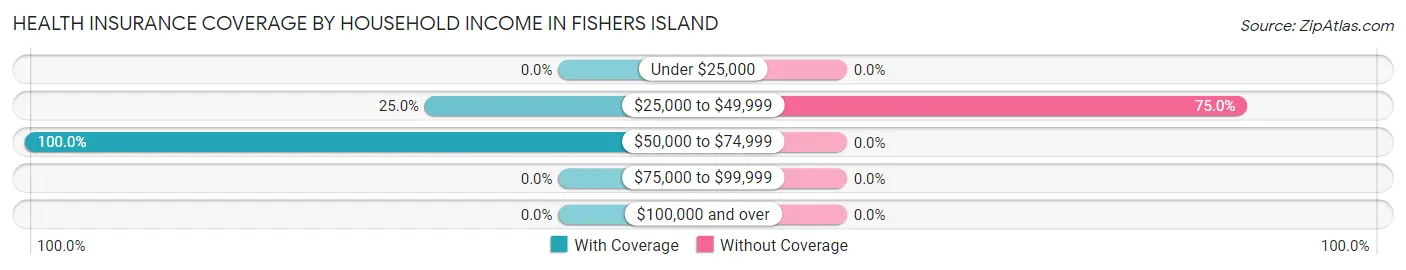
| Household Income | With Coverage | Without Coverage |
| Under $25,000 | 0 (0.0%) | 0 (0.0%) |
| $25,000 to $49,999 | 6 (25.0%) | 18 (75.0%) |
| $50,000 to $74,999 | 12 (100.0%) | 0 (0.0%) |
| $75,000 to $99,999 | 0 (0.0%) | 0 (0.0%) |
| $100,000 and over | 0 (0.0%) | 0 (0.0%) |
Public vs Private Health Insurance Coverage by Age in Fishers Island
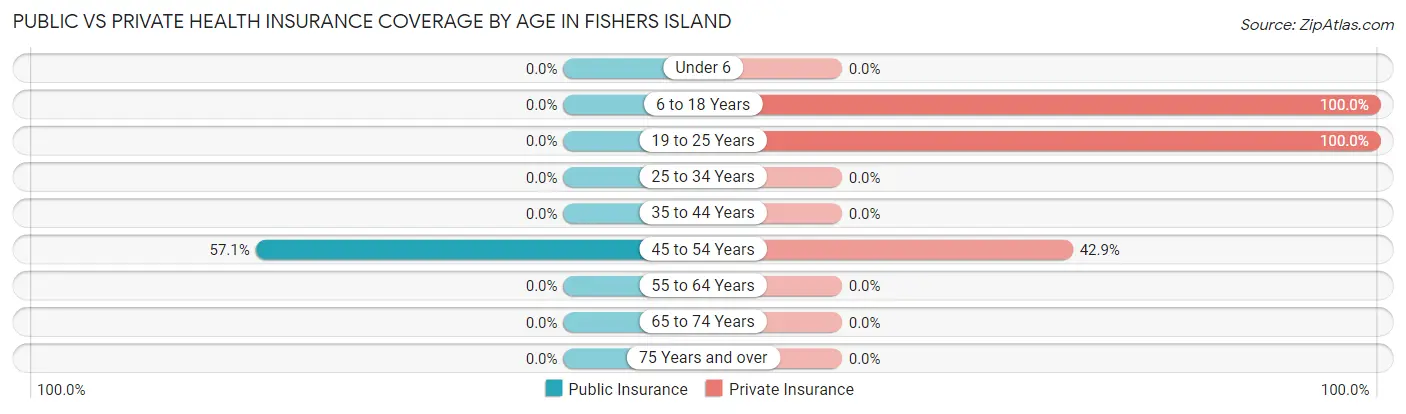
| Age Bracket | Public Insurance | Private Insurance |
| Under 6 | 0 (0.0%) | 0 (0.0%) |
| 6 to 18 Years | 0 (0.0%) | 6 (100.0%) |
| 19 to 25 Years | 0 (0.0%) | 6 (100.0%) |
| 25 to 34 Years | 0 (0.0%) | 0 (0.0%) |
| 35 to 44 Years | 0 (0.0%) | 0 (0.0%) |
| 45 to 54 Years | 8 (57.1%) | 6 (42.9%) |
| 55 to 64 Years | 0 (0.0%) | 0 (0.0%) |
| 65 to 74 Years | 0 (0.0%) | 0 (0.0%) |
| 75 Years and over | 0 (0.0%) | 0 (0.0%) |
| Total | 8 (15.1%) | 18 (34.0%) |
Disability Status by Sex by Age in Fishers Island
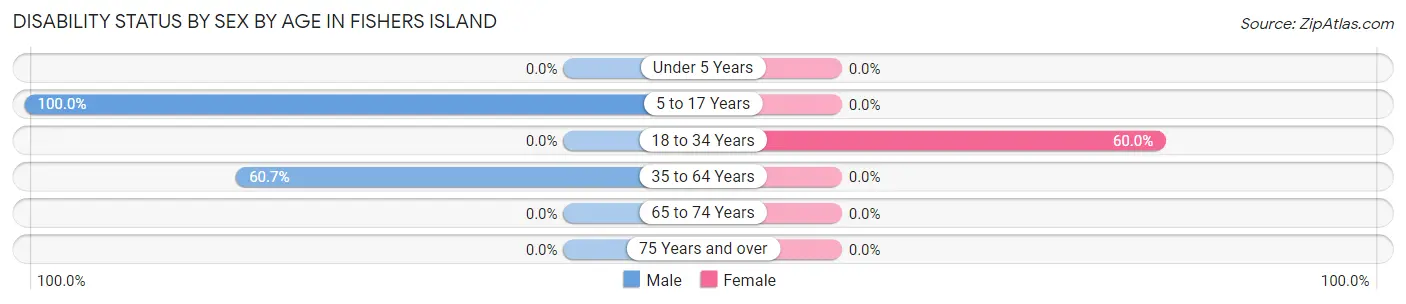
| Age Bracket | Male | Female |
| Under 5 Years | 0 (0.0%) | 0 (0.0%) |
| 5 to 17 Years | 5 (100.0%) | 0 (0.0%) |
| 18 to 34 Years | 0 (0.0%) | 9 (60.0%) |
| 35 to 64 Years | 17 (60.7%) | 0 (0.0%) |
| 65 to 74 Years | 0 (0.0%) | 0 (0.0%) |
| 75 Years and over | 0 (0.0%) | 0 (0.0%) |
Disability Class by Sex by Age in Fishers Island
Disability Class: Hearing Difficulty
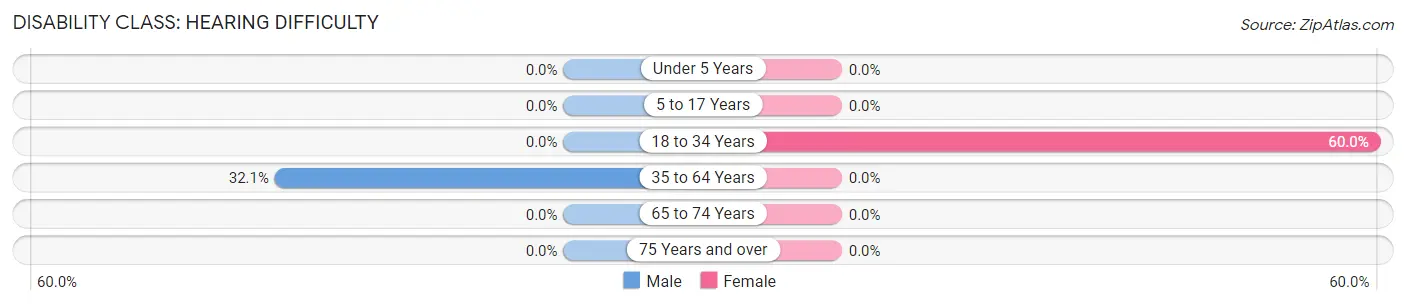
| Age Bracket | Male | Female |
| Under 5 Years | 0 (0.0%) | 0 (0.0%) |
| 5 to 17 Years | 0 (0.0%) | 0 (0.0%) |
| 18 to 34 Years | 0 (0.0%) | 9 (60.0%) |
| 35 to 64 Years | 9 (32.1%) | 0 (0.0%) |
| 65 to 74 Years | 0 (0.0%) | 0 (0.0%) |
| 75 Years and over | 0 (0.0%) | 0 (0.0%) |
Disability Class: Vision Difficulty
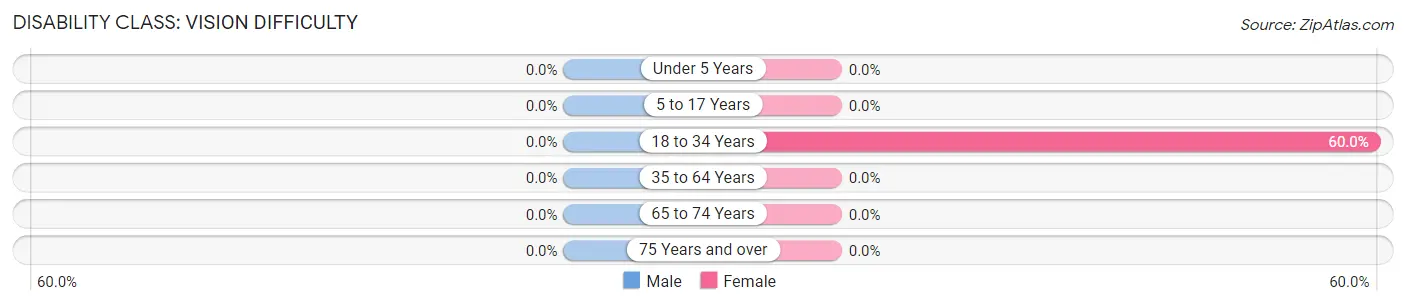
| Age Bracket | Male | Female |
| Under 5 Years | 0 (0.0%) | 0 (0.0%) |
| 5 to 17 Years | 0 (0.0%) | 0 (0.0%) |
| 18 to 34 Years | 0 (0.0%) | 9 (60.0%) |
| 35 to 64 Years | 0 (0.0%) | 0 (0.0%) |
| 65 to 74 Years | 0 (0.0%) | 0 (0.0%) |
| 75 Years and over | 0 (0.0%) | 0 (0.0%) |
Disability Class: Cognitive Difficulty
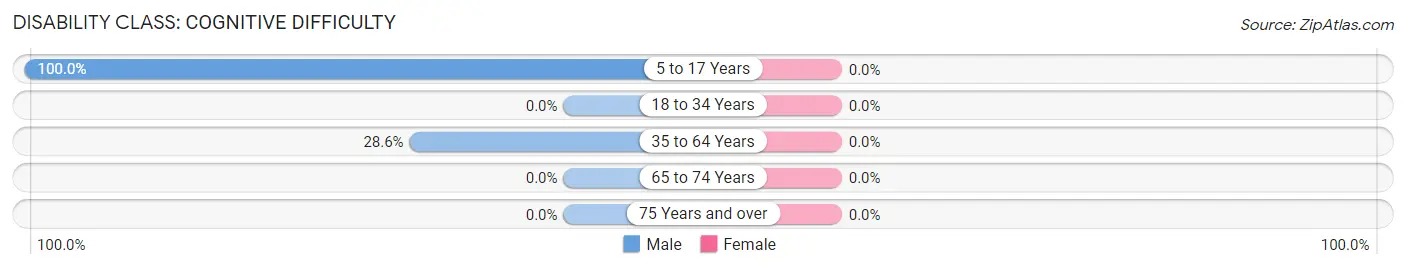
| Age Bracket | Male | Female |
| 5 to 17 Years | 5 (100.0%) | 0 (0.0%) |
| 18 to 34 Years | 0 (0.0%) | 0 (0.0%) |
| 35 to 64 Years | 8 (28.6%) | 0 (0.0%) |
| 65 to 74 Years | 0 (0.0%) | 0 (0.0%) |
| 75 Years and over | 0 (0.0%) | 0 (0.0%) |
Disability Class: Ambulatory Difficulty
| Age Bracket | Male | Female |
| 5 to 17 Years | 0 (0.0%) | 0 (0.0%) |
| 18 to 34 Years | 0 (0.0%) | 0 (0.0%) |
| 35 to 64 Years | 0 (0.0%) | 0 (0.0%) |
| 65 to 74 Years | 0 (0.0%) | 0 (0.0%) |
| 75 Years and over | 0 (0.0%) | 0 (0.0%) |
Disability Class: Self-Care Difficulty
| Age Bracket | Male | Female |
| 5 to 17 Years | 0 (0.0%) | 0 (0.0%) |
| 18 to 34 Years | 0 (0.0%) | 0 (0.0%) |
| 35 to 64 Years | 0 (0.0%) | 0 (0.0%) |
| 65 to 74 Years | 0 (0.0%) | 0 (0.0%) |
| 75 Years and over | 0 (0.0%) | 0 (0.0%) |
Technology Access in Fishers Island
Computing Device Access in Fishers Island
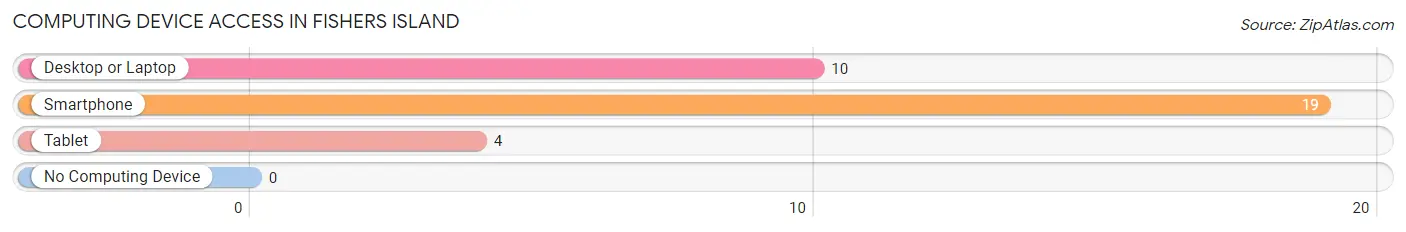
| Device Type | # Households | % Households |
| Desktop or Laptop | 10 | 52.6% |
| Smartphone | 19 | 100.0% |
| Tablet | 4 | 21.0% |
| No Computing Device | 0 | 0.0% |
| Total | 19 | 100.0% |
Internet Access in Fishers Island
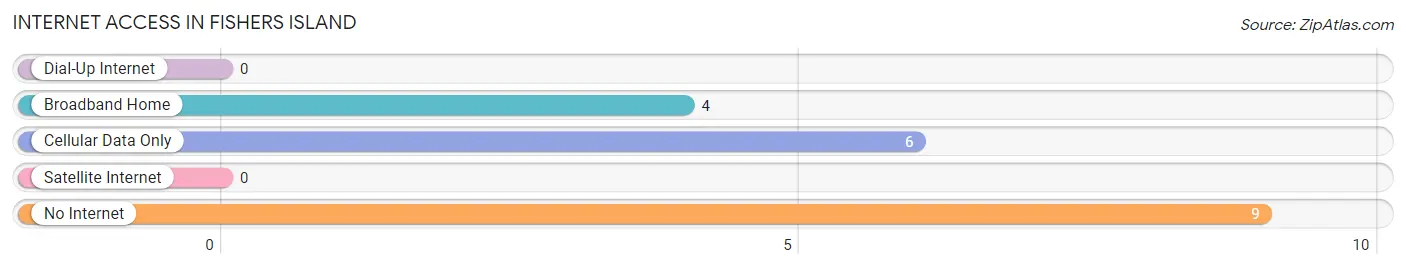
| Internet Type | # Households | % Households |
| Dial-Up Internet | 0 | 0.0% |
| Broadband Home | 4 | 21.0% |
| Cellular Data Only | 6 | 31.6% |
| Satellite Internet | 0 | 0.0% |
| No Internet | 9 | 47.4% |
| Total | 19 | 100.0% |
Fishers Island Summary
Fishers Island is a small island located off the southeastern coast of Connecticut in the Long Island Sound. It is part of the Town of Southold in Suffolk County, New York. The island is approximately 9 miles long and 1.5 miles wide, with a total area of 8.5 square miles. It is accessible by ferry from New London, Connecticut and is home to a population of approximately 250 year-round residents.
History
Fishers Island has a long and varied history. The island was originally inhabited by the Manhanset Indians, who called it “Mannamoosh” or “Island of the Little God.” The first European settlers arrived in 1614, and the island was purchased by Thomas Stanton in 1641. The island was then sold to the Winthrop family in 1659, who held it until 1879. During this time, the island was used primarily for farming and fishing.
In 1879, the island was purchased by William A. Fisher, a wealthy New York City banker. He and his family developed the island into a summer resort, building a hotel, a golf course, and a yacht club. The island was then sold to the U.S. Navy in 1942, and used as a training base during World War II. After the war, the island was returned to the Fisher family, who continued to develop it as a resort.
Geography
Fishers Island is located in the Long Island Sound, approximately 9 miles off the southeastern coast of Connecticut. It is part of the Town of Southold in Suffolk County, New York. The island is approximately 9 miles long and 1.5 miles wide, with a total area of 8.5 square miles. It is accessible by ferry from New London, Connecticut.
The island is composed of a variety of habitats, including salt marshes, sandy beaches, and woodlands. The highest point on the island is the summit of Fishers Hill, which rises to a height of 110 feet. The island is also home to a variety of wildlife, including deer, foxes, rabbits, and a variety of birds.
Economy
Fishers Island has a small, but vibrant economy. The island is home to a variety of businesses, including restaurants, shops, and a marina. Tourism is also an important part of the island’s economy, with visitors coming to enjoy the island’s beaches, golf courses, and other attractions.
The island is also home to a variety of industries, including fishing, shellfishing, and boatbuilding. The island is also home to a number of farms, which produce a variety of fruits and vegetables.
Demographics
As of the 2010 census, Fishers Island had a population of 250 people. The population is predominantly white (97.2%), with a small minority of African Americans (1.2%) and Hispanics (1.2%). The median household income is $87,500, and the median age is 48.
Fishers Island is a small, but vibrant community. The island is home to a variety of businesses, industries, and attractions, and is a popular destination for tourists and residents alike. The island’s unique history and geography make it a unique and interesting place to visit and live.
Common Questions
What is Per Capita Income in Fishers Island?
Per Capita income in Fishers Island is $21,489.
What is the Median Household income in Fishers Island?
Median Household Income in Fishers Island is $47,708.
What is Inequality or Gini Index in Fishers Island?
Inequality or Gini Index in Fishers Island is 0.09.
What is the Total Population of Fishers Island?
Total Population of Fishers Island is 53.
What is the Total Male Population of Fishers Island?
Total Male Population of Fishers Island is 33.
What is the Total Female Population of Fishers Island?
Total Female Population of Fishers Island is 20.
What is the Ratio of Males per 100 Females in Fishers Island?
There are 165.00 Males per 100 Females in Fishers Island.
What is the Ratio of Females per 100 Males in Fishers Island?
There are 60.61 Females per 100 Males in Fishers Island.
What is the Median Population Age in Fishers Island?
Median Population Age in Fishers Island is 37.6 Years.
What is the Average Family Size in Fishers Island
Average Family Size in Fishers Island is 2.3 People.
What is the Average Household Size in Fishers Island
Average Household Size in Fishers Island is 1.9 People.
How Large is the Labor Force in Fishers Island?
There are 39 People in the Labor Forcein in Fishers Island.
What is the Percentage of People in the Labor Force in Fishers Island?
83.0% of People are in the Labor Force in Fishers Island.