Fairport, NY Map & Demographics
Fairport Map
Fairport Overview
$56,066
PER CAPITA INCOME
$97,099
AVG FAMILY INCOME
$95,354
AVG HOUSEHOLD INCOME
35.7%
WAGE / INCOME GAP [ % ]
64.3¢/ $1
WAGE / INCOME GAP [ $ ]
0.41
INEQUALITY / GINI INDEX
5,442
TOTAL POPULATION
2,492
MALE POPULATION
2,950
FEMALE POPULATION
84.47
MALES / 100 FEMALES
118.38
FEMALES / 100 MALES
48.8
MEDIAN AGE
2.4
AVG FAMILY SIZE
2.0
AVG HOUSEHOLD SIZE
2,796
LABOR FORCE [ PEOPLE ]
59.9%
PERCENT IN LABOR FORCE
4.5%
UNEMPLOYMENT RATE
Fairport Zip Codes
Fairport Area Codes
Income in Fairport
Income Overview in Fairport
Per Capita Income in Fairport is $56,066, while median incomes of families and households are $97,099 and $95,354 respectively.
| Characteristic | Number | Measure |
| Per Capita Income | 5,442 | $56,066 |
| Median Family Income | 1,579 | $97,099 |
| Mean Family Income | 1,579 | $117,340 |
| Median Household Income | 2,735 | $95,354 |
| Mean Household Income | 2,735 | $111,527 |
| Income Deficit | 1,579 | $0 |
| Wage / Income Gap (%) | 5,442 | 35.72% |
| Wage / Income Gap ($) | 5,442 | 64.28¢ per $1 |
| Gini / Inequality Index | 5,442 | 0.41 |
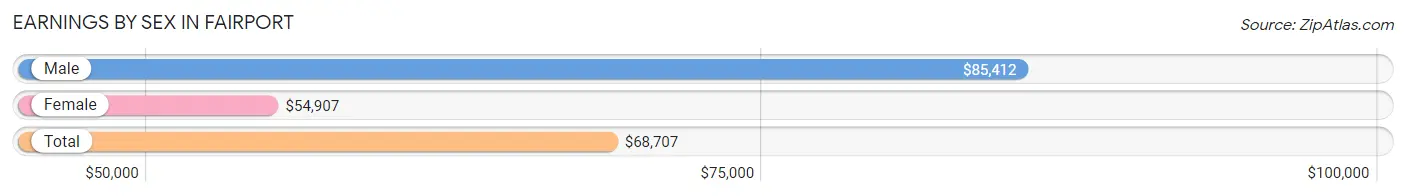
Earnings by Sex in Fairport
Average Earnings in Fairport are $68,707, $85,412 for men and $54,907 for women, a difference of 35.7%.
| Sex | Number | Average Earnings |
| Male | 1,430 (49.0%) | $85,412 |
| Female | 1,486 (51.0%) | $54,907 |
| Total | 2,916 (100.0%) | $68,707 |
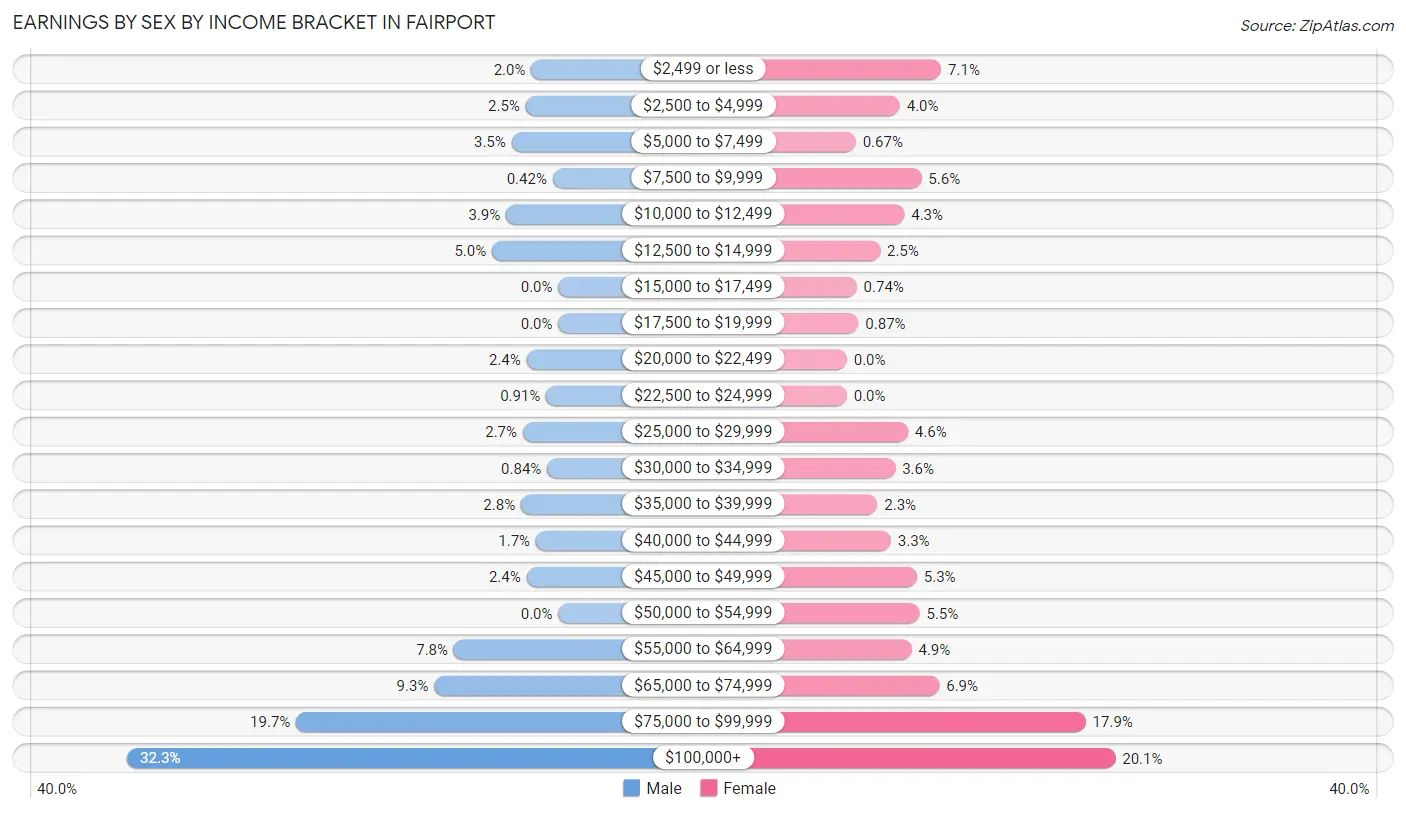
Earnings by Sex by Income Bracket in Fairport
The most common earnings brackets in Fairport are $100,000+ for men (462 | 32.3%) and $100,000+ for women (299 | 20.1%).
| Income | Male | Female |
| $2,499 or less | 29 (2.0%) | 105 (7.1%) |
| $2,500 to $4,999 | 35 (2.5%) | 59 (4.0%) |
| $5,000 to $7,499 | 50 (3.5%) | 10 (0.7%) |
| $7,500 to $9,999 | 6 (0.4%) | 83 (5.6%) |
| $10,000 to $12,499 | 56 (3.9%) | 64 (4.3%) |
| $12,500 to $14,999 | 71 (5.0%) | 37 (2.5%) |
| $15,000 to $17,499 | 0 (0.0%) | 11 (0.7%) |
| $17,500 to $19,999 | 0 (0.0%) | 13 (0.9%) |
| $20,000 to $22,499 | 34 (2.4%) | 0 (0.0%) |
| $22,500 to $24,999 | 13 (0.9%) | 0 (0.0%) |
| $25,000 to $29,999 | 38 (2.7%) | 68 (4.6%) |
| $30,000 to $34,999 | 12 (0.8%) | 54 (3.6%) |
| $35,000 to $39,999 | 40 (2.8%) | 34 (2.3%) |
| $40,000 to $44,999 | 24 (1.7%) | 49 (3.3%) |
| $45,000 to $49,999 | 34 (2.4%) | 78 (5.2%) |
| $50,000 to $54,999 | 0 (0.0%) | 81 (5.4%) |
| $55,000 to $64,999 | 112 (7.8%) | 72 (4.9%) |
| $65,000 to $74,999 | 133 (9.3%) | 103 (6.9%) |
| $75,000 to $99,999 | 281 (19.7%) | 266 (17.9%) |
| $100,000+ | 462 (32.3%) | 299 (20.1%) |
| Total | 1,430 (100.0%) | 1,486 (100.0%) |
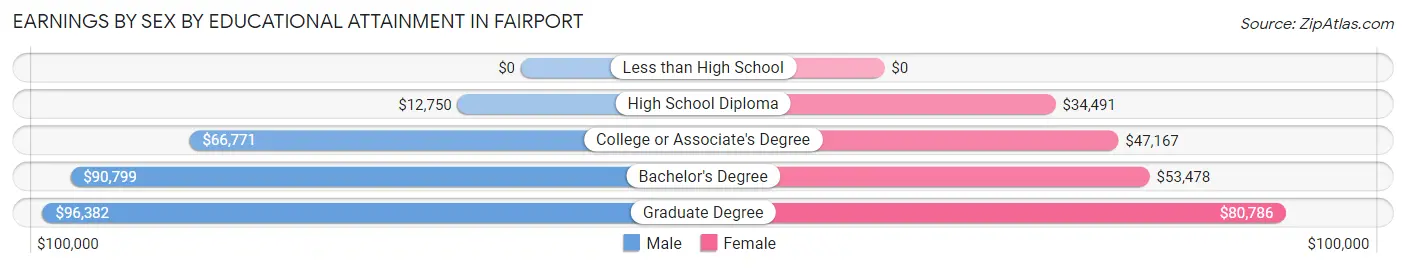
Earnings by Sex by Educational Attainment in Fairport
Average earnings in Fairport are $85,882 for men and $70,690 for women, a difference of 17.7%. Men with an educational attainment of graduate degree enjoy the highest average annual earnings of $96,382, while those with high school diploma education earn the least with $12,750. Women with an educational attainment of graduate degree earn the most with the average annual earnings of $80,786, while those with high school diploma education have the smallest earnings of $34,491.
| Educational Attainment | Male Income | Female Income |
| Less than High School | - | - |
| High School Diploma | $12,750 | $34,491 |
| College or Associate's Degree | $66,771 | $47,167 |
| Bachelor's Degree | $90,799 | $53,478 |
| Graduate Degree | $96,382 | $80,786 |
| Total | $85,882 | $70,690 |
Family Income in Fairport
Family Income Brackets in Fairport
According to the Fairport family income data, there are 399 families falling into the $100,000 to $149,999 income range, which is the most common income bracket and makes up 25.3% of all families.
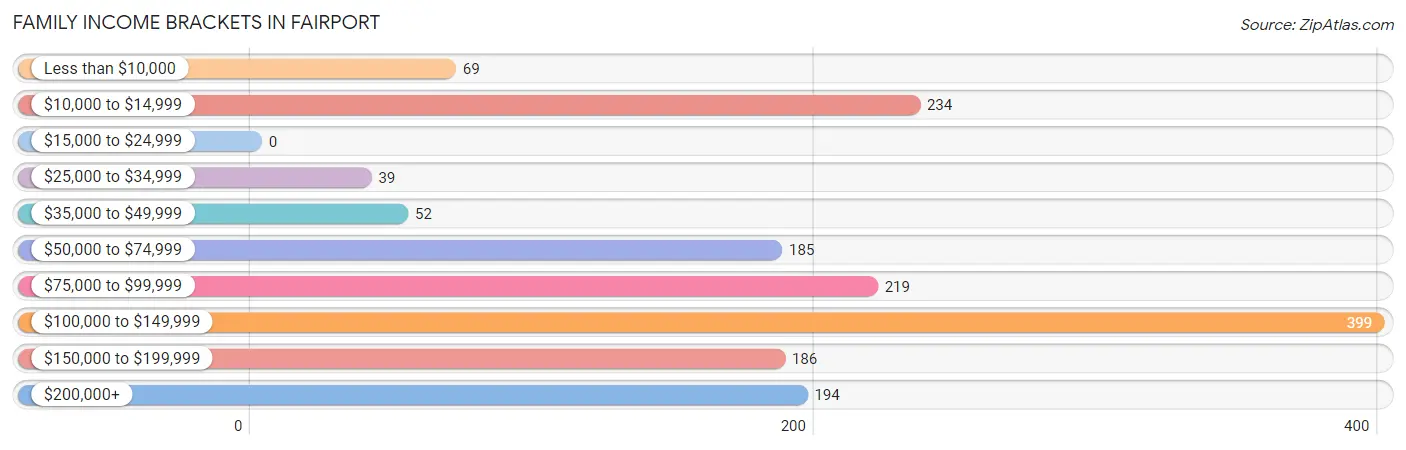
| Income Bracket | # Families | % Families |
| Less than $10,000 | 69 | 4.4% |
| $10,000 to $14,999 | 234 | 14.8% |
| $15,000 to $24,999 | 0 | 0.0% |
| $25,000 to $34,999 | 39 | 2.5% |
| $35,000 to $49,999 | 52 | 3.3% |
| $50,000 to $74,999 | 185 | 11.7% |
| $75,000 to $99,999 | 219 | 13.9% |
| $100,000 to $149,999 | 399 | 25.3% |
| $150,000 to $199,999 | 186 | 11.8% |
| $200,000+ | 194 | 12.3% |
Family Income by Famaliy Size in Fairport
4-person families (107 | 6.8%) account for the highest median family income in Fairport with $175,662 per family, while 2-person families (1,117 | 70.7%) have the highest median income of $47,515 per family member.
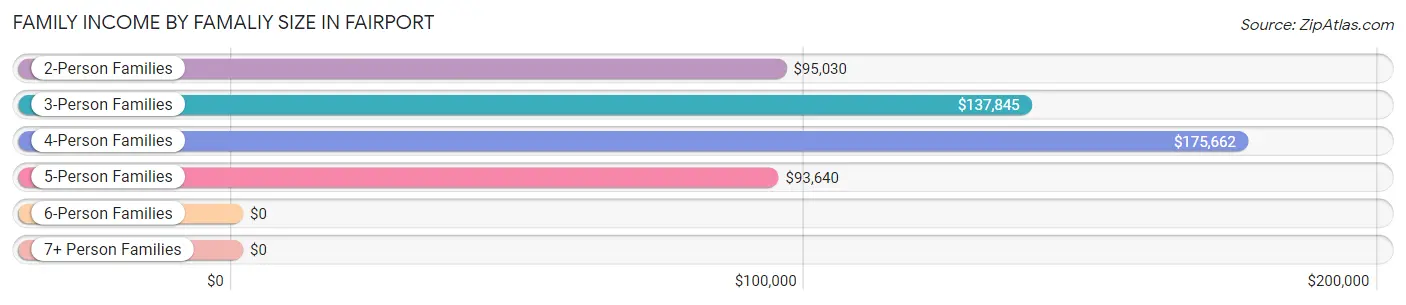
| Income Bracket | # Families | Median Income |
| 2-Person Families | 1,117 (70.7%) | $95,030 |
| 3-Person Families | 256 (16.2%) | $137,845 |
| 4-Person Families | 107 (6.8%) | $175,662 |
| 5-Person Families | 99 (6.3%) | $93,640 |
| 6-Person Families | 0 (0.0%) | $0 |
| 7+ Person Families | 0 (0.0%) | $0 |
| Total | 1,579 (100.0%) | $97,099 |
Family Income by Number of Earners in Fairport
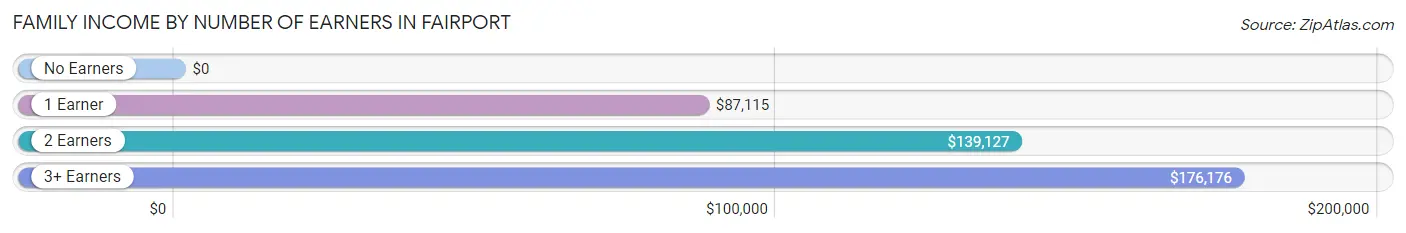
| Number of Earners | # Families | Median Income |
| No Earners | 474 (30.0%) | $0 |
| 1 Earner | 514 (32.6%) | $87,115 |
| 2 Earners | 547 (34.6%) | $139,127 |
| 3+ Earners | 44 (2.8%) | $176,176 |
| Total | 1,579 (100.0%) | $97,099 |
Household Income in Fairport
Household Income Brackets in Fairport
With 635 households falling in the category, the $100,000 to $149,999 income range is the most frequent in Fairport, accounting for 23.2% of all households. In contrast, only 14 households (0.5%) fall into the $25,000 to $34,999 income bracket, making it the least populous group.
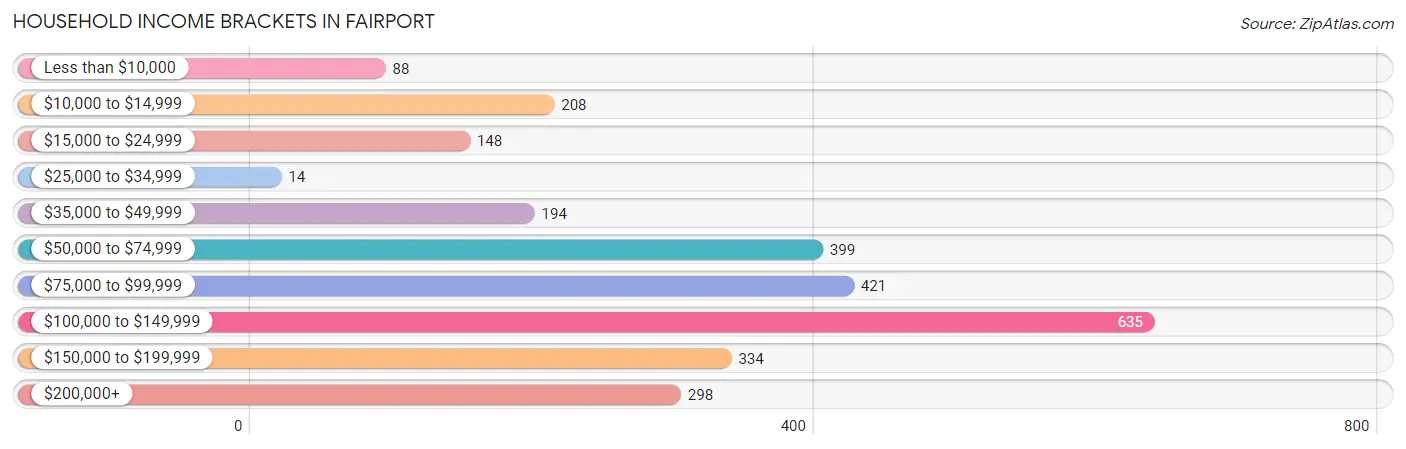
| Income Bracket | # Households | % Households |
| Less than $10,000 | 88 | 3.2% |
| $10,000 to $14,999 | 208 | 7.6% |
| $15,000 to $24,999 | 148 | 5.4% |
| $25,000 to $34,999 | 14 | 0.5% |
| $35,000 to $49,999 | 194 | 7.1% |
| $50,000 to $74,999 | 399 | 14.6% |
| $75,000 to $99,999 | 421 | 15.4% |
| $100,000 to $149,999 | 635 | 23.2% |
| $150,000 to $199,999 | 334 | 12.2% |
| $200,000+ | 298 | 10.9% |
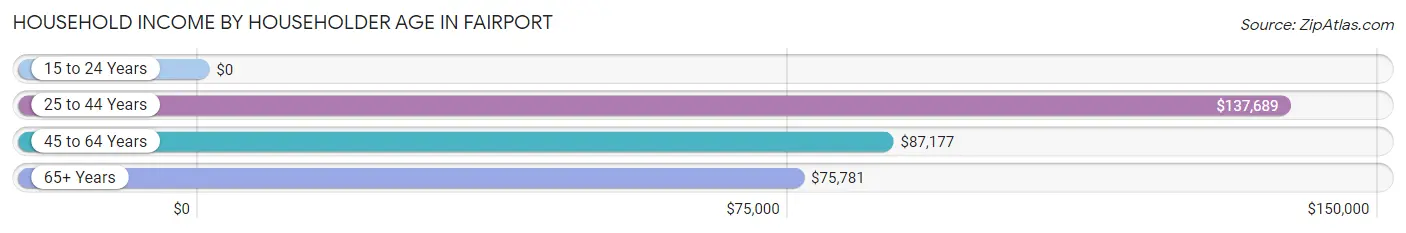
Household Income by Householder Age in Fairport
The median household income in Fairport is $95,354, with the highest median household income of $137,689 found in the 25 to 44 years age bracket for the primary householder. A total of 674 households (24.6%) fall into this category. Meanwhile, the 15 to 24 years age bracket for the primary householder has the lowest median household income of $0, with 68 households (2.5%) in this group.
| Income Bracket | # Households | Median Income |
| 15 to 24 Years | 68 (2.5%) | $0 |
| 25 to 44 Years | 674 (24.6%) | $137,689 |
| 45 to 64 Years | 1,269 (46.4%) | $87,177 |
| 65+ Years | 724 (26.5%) | $75,781 |
| Total | 2,735 (100.0%) | $95,354 |
Poverty in Fairport
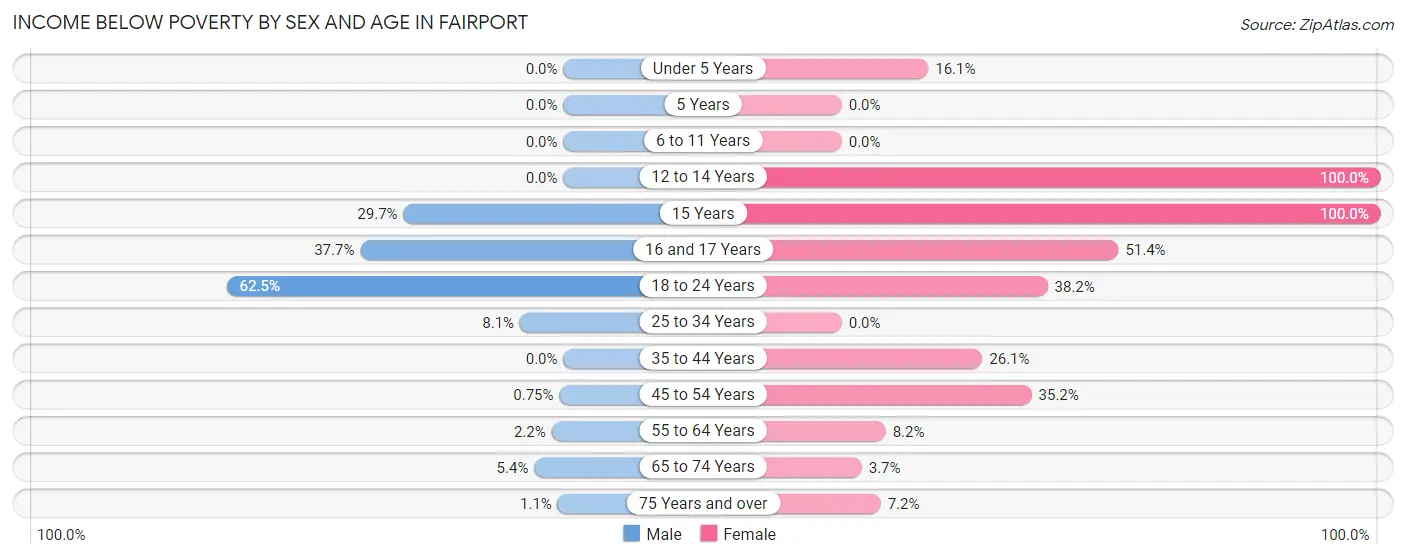
Income Below Poverty by Sex and Age in Fairport
With 5.7% poverty level for males and 21.6% for females among the residents of Fairport, 18 to 24 year old males and 12 to 14 year old females are the most vulnerable to poverty, with 25 males (62.5%) and 118 females (100.0%) in their respective age groups living below the poverty level.
| Age Bracket | Male | Female |
| Under 5 Years | 0 (0.0%) | 22 (16.1%) |
| 5 Years | 0 (0.0%) | 0 (0.0%) |
| 6 to 11 Years | 0 (0.0%) | 0 (0.0%) |
| 12 to 14 Years | 0 (0.0%) | 118 (100.0%) |
| 15 Years | 19 (29.7%) | 22 (100.0%) |
| 16 and 17 Years | 23 (37.7%) | 38 (51.3%) |
| 18 to 24 Years | 25 (62.5%) | 68 (38.2%) |
| 25 to 34 Years | 40 (8.1%) | 0 (0.0%) |
| 35 to 44 Years | 0 (0.0%) | 78 (26.1%) |
| 45 to 54 Years | 2 (0.7%) | 211 (35.2%) |
| 55 to 64 Years | 9 (2.2%) | 46 (8.2%) |
| 65 to 74 Years | 21 (5.4%) | 15 (3.7%) |
| 75 Years and over | 2 (1.1%) | 18 (7.2%) |
| Total | 141 (5.7%) | 636 (21.6%) |
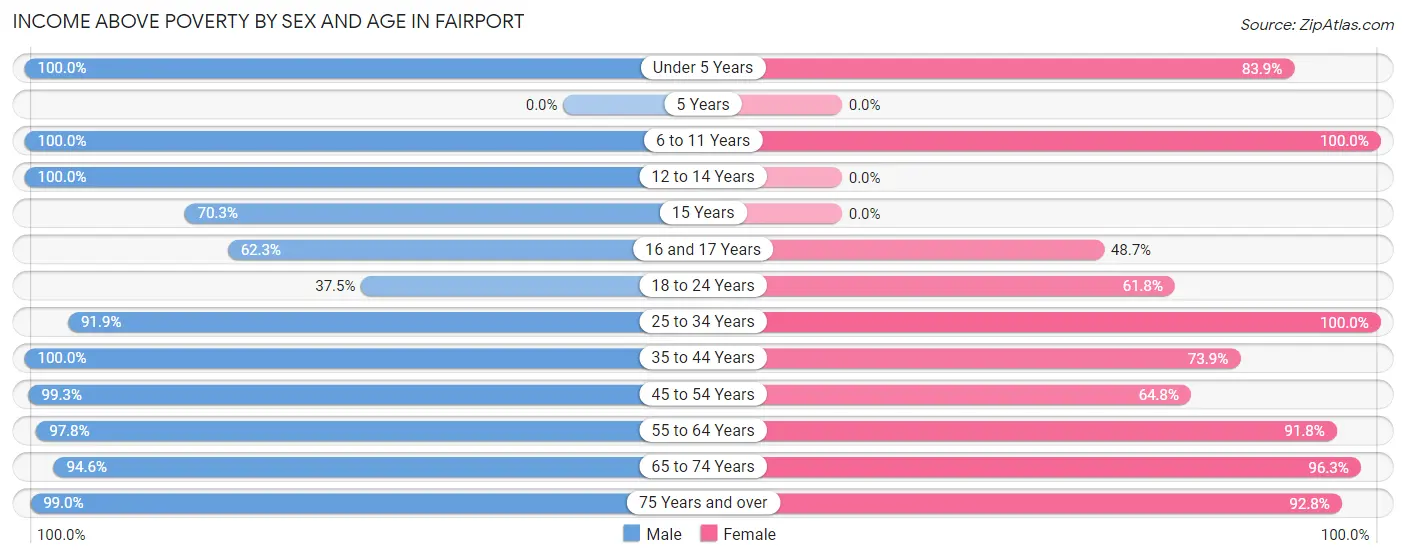
Income Above Poverty by Sex and Age in Fairport
According to the poverty statistics in Fairport, males aged under 5 years and females aged 6 to 11 years are the age groups that are most secure financially, with 100.0% of males and 100.0% of females in these age groups living above the poverty line.
| Age Bracket | Male | Female |
| Under 5 Years | 52 (100.0%) | 115 (83.9%) |
| 5 Years | 0 (0.0%) | 0 (0.0%) |
| 6 to 11 Years | 131 (100.0%) | 143 (100.0%) |
| 12 to 14 Years | 108 (100.0%) | 0 (0.0%) |
| 15 Years | 45 (70.3%) | 0 (0.0%) |
| 16 and 17 Years | 38 (62.3%) | 36 (48.6%) |
| 18 to 24 Years | 15 (37.5%) | 110 (61.8%) |
| 25 to 34 Years | 456 (91.9%) | 163 (100.0%) |
| 35 to 44 Years | 281 (100.0%) | 221 (73.9%) |
| 45 to 54 Years | 265 (99.3%) | 388 (64.8%) |
| 55 to 64 Years | 403 (97.8%) | 518 (91.8%) |
| 65 to 74 Years | 368 (94.6%) | 389 (96.3%) |
| 75 Years and over | 189 (99.0%) | 231 (92.8%) |
| Total | 2,351 (94.3%) | 2,314 (78.4%) |
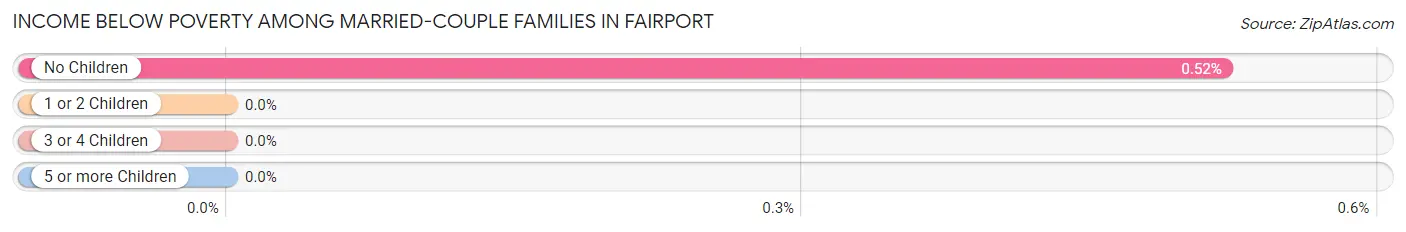
Income Below Poverty Among Married-Couple Families in Fairport
The poverty statistics for married-couple families in Fairport show that 0.4% or 4 of the total 1,090 families live below the poverty line. Families with no children have the highest poverty rate of 0.5%, comprising of 4 families. On the other hand, families with 1 or 2 children have the lowest poverty rate of 0.0%, which includes 0 families.
| Children | Above Poverty | Below Poverty |
| No Children | 764 (99.5%) | 4 (0.5%) |
| 1 or 2 Children | 257 (100.0%) | 0 (0.0%) |
| 3 or 4 Children | 65 (100.0%) | 0 (0.0%) |
| 5 or more Children | 0 (0.0%) | 0 (0.0%) |
| Total | 1,086 (99.6%) | 4 (0.4%) |
Income Below Poverty Among Single-Parent Households in Fairport
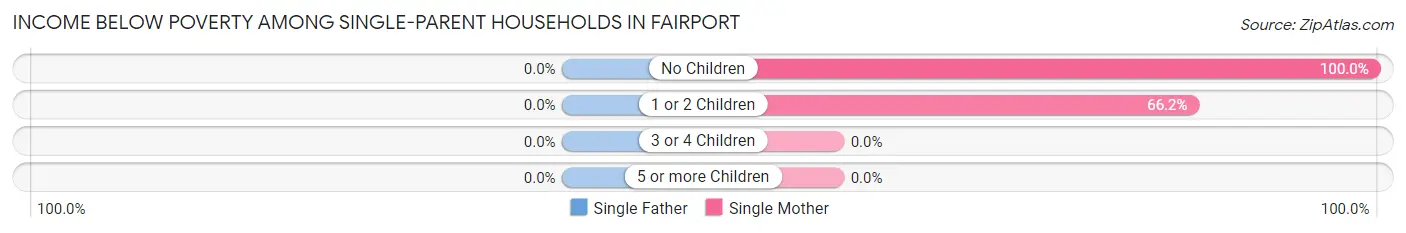
| Children | Single Father | Single Mother |
| No Children | 0 (0.0%) | 46 (100.0%) |
| 1 or 2 Children | 0 (0.0%) | 253 (66.2%) |
| 3 or 4 Children | 0 (0.0%) | 0 (0.0%) |
| 5 or more Children | 0 (0.0%) | 0 (0.0%) |
| Total | 0 (0.0%) | 299 (69.9%) |
Income Below Poverty Among Married-Couple vs Single-Parent Households in Fairport
The poverty data for Fairport shows that 4 of the married-couple family households (0.4%) and 299 of the single-parent households (61.2%) are living below the poverty level. Within the married-couple family households, those with no children have the highest poverty rate, with 4 households (0.5%) falling below the poverty line. Among the single-parent households, those with no children have the highest poverty rate, with 46 household (74.2%) living below poverty.
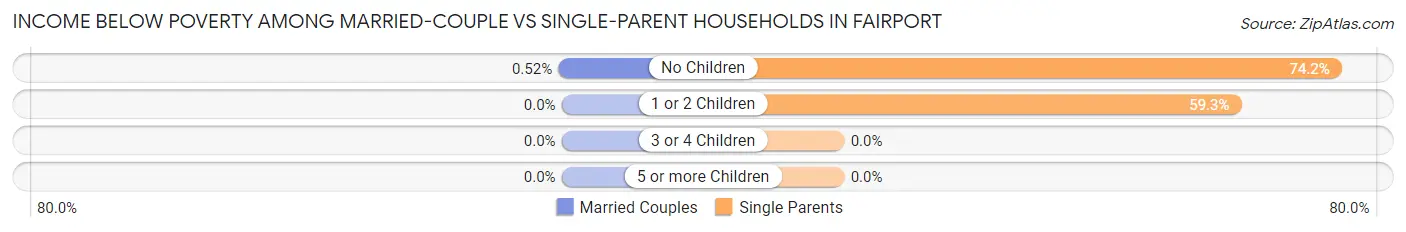
| Children | Married-Couple Families | Single-Parent Households |
| No Children | 4 (0.5%) | 46 (74.2%) |
| 1 or 2 Children | 0 (0.0%) | 253 (59.3%) |
| 3 or 4 Children | 0 (0.0%) | 0 (0.0%) |
| 5 or more Children | 0 (0.0%) | 0 (0.0%) |
| Total | 4 (0.4%) | 299 (61.2%) |
Race in Fairport
The most populous races in Fairport are White / Caucasian (5,053 | 92.8%), Two or more Races (302 | 5.6%), and Hispanic or Latino (172 | 3.2%).
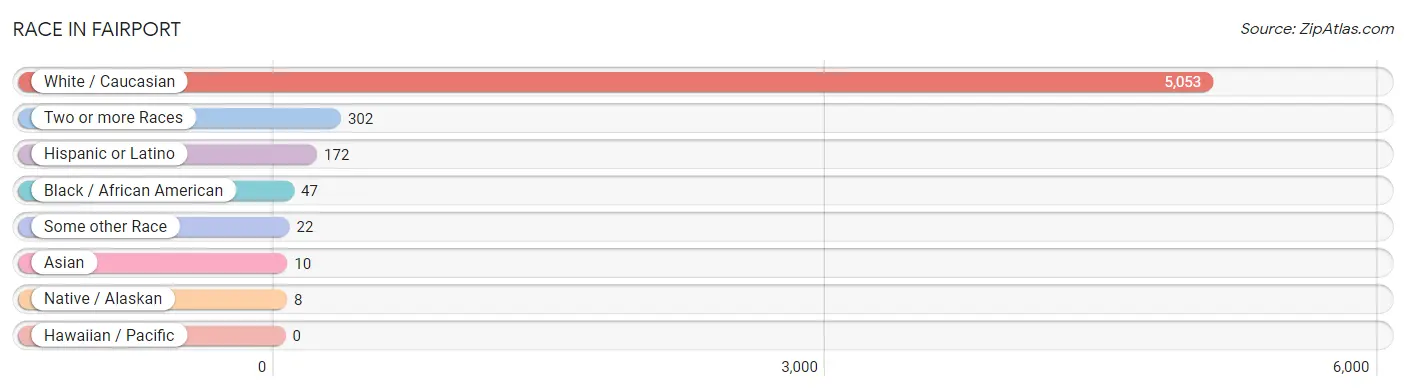
| Race | # Population | % Population |
| Asian | 10 | 0.2% |
| Black / African American | 47 | 0.9% |
| Hawaiian / Pacific | 0 | 0.0% |
| Hispanic or Latino | 172 | 3.2% |
| Native / Alaskan | 8 | 0.2% |
| White / Caucasian | 5,053 | 92.8% |
| Two or more Races | 302 | 5.6% |
| Some other Race | 22 | 0.4% |
| Total | 5,442 | 100.0% |
Ancestry in Fairport
The most populous ancestries reported in Fairport are German (1,337 | 24.6%), Italian (1,298 | 23.8%), Irish (1,252 | 23.0%), English (987 | 18.1%), and American (379 | 7.0%), together accounting for 96.5% of all Fairport residents.
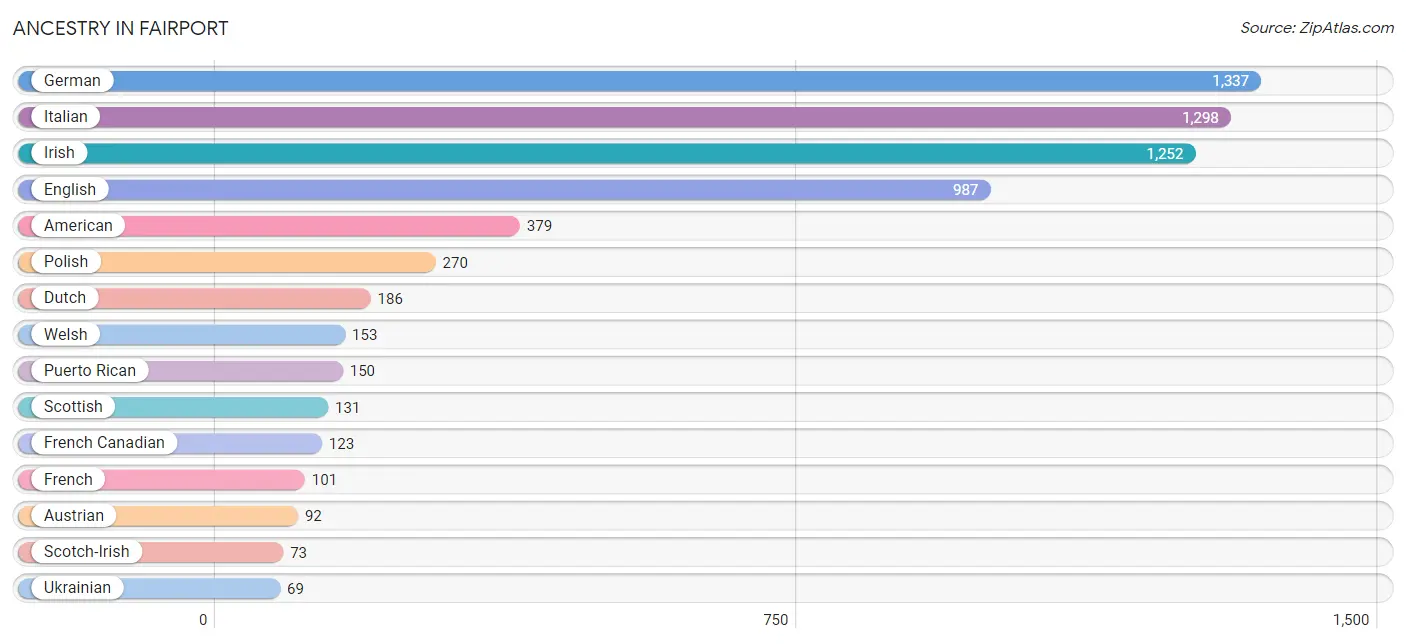
| Ancestry | # Population | % Population |
| American | 379 | 7.0% |
| Austrian | 92 | 1.7% |
| Bhutanese | 50 | 0.9% |
| British | 25 | 0.5% |
| Canadian | 26 | 0.5% |
| Central American | 22 | 0.4% |
| Czech | 13 | 0.2% |
| Dutch | 186 | 3.4% |
| English | 987 | 18.1% |
| European | 12 | 0.2% |
| French | 101 | 1.9% |
| French Canadian | 123 | 2.3% |
| German | 1,337 | 24.6% |
| Irish | 1,252 | 23.0% |
| Iroquois | 4 | 0.1% |
| Italian | 1,298 | 23.8% |
| Lithuanian | 22 | 0.4% |
| Norwegian | 56 | 1.0% |
| Polish | 270 | 5.0% |
| Portuguese | 19 | 0.4% |
| Puerto Rican | 150 | 2.8% |
| Russian | 11 | 0.2% |
| Salvadoran | 22 | 0.4% |
| Scandinavian | 34 | 0.6% |
| Scotch-Irish | 73 | 1.3% |
| Scottish | 131 | 2.4% |
| Slovak | 14 | 0.3% |
| Swedish | 22 | 0.4% |
| Swiss | 6 | 0.1% |
| Ukrainian | 69 | 1.3% |
| Welsh | 153 | 2.8% | View All 31 Rows |
Immigrants in Fairport
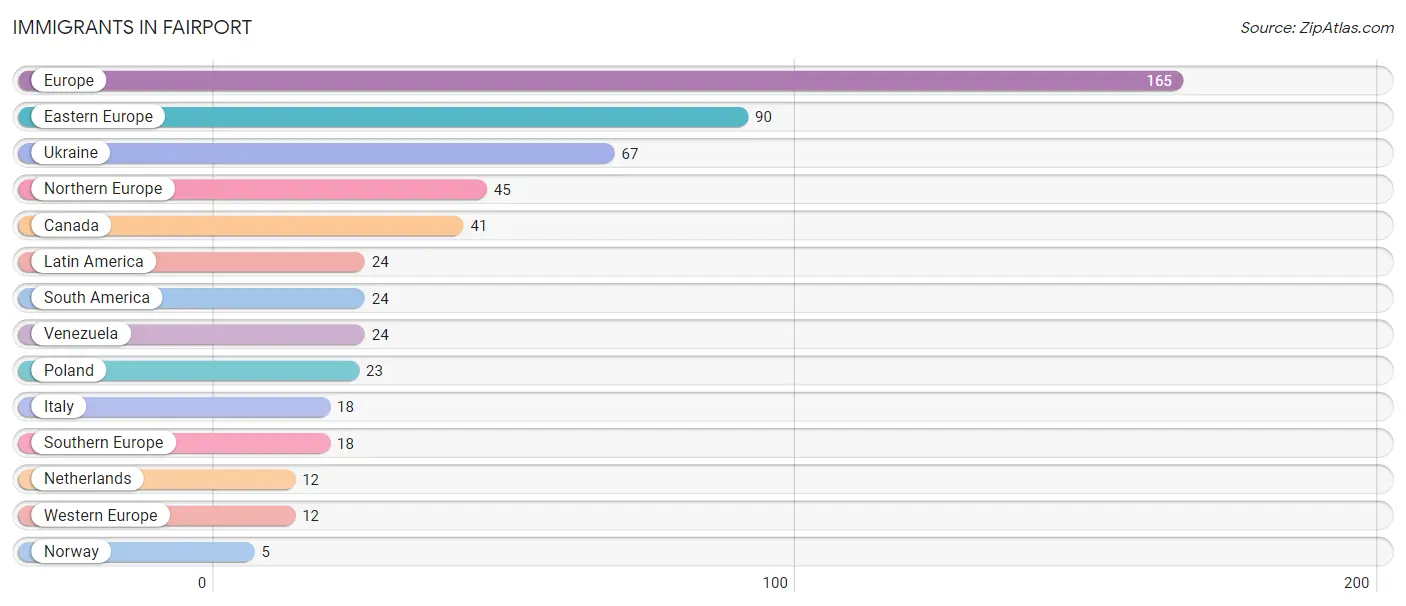
The most numerous immigrant groups reported in Fairport came from Europe (165 | 3.0%), Eastern Europe (90 | 1.7%), Ukraine (67 | 1.2%), Northern Europe (45 | 0.8%), and Canada (41 | 0.7%), together accounting for 7.5% of all Fairport residents.
| Immigration Origin | # Population | % Population |
| Canada | 41 | 0.7% |
| Eastern Europe | 90 | 1.7% |
| Europe | 165 | 3.0% |
| Italy | 18 | 0.3% |
| Latin America | 24 | 0.4% |
| Netherlands | 12 | 0.2% |
| Northern Europe | 45 | 0.8% |
| Norway | 5 | 0.1% |
| Poland | 23 | 0.4% |
| South America | 24 | 0.4% |
| Southern Europe | 18 | 0.3% |
| Ukraine | 67 | 1.2% |
| Venezuela | 24 | 0.4% |
| Western Europe | 12 | 0.2% | View All 14 Rows |
Sex and Age in Fairport
Sex and Age in Fairport
The most populous age groups in Fairport are 60 to 64 Years (277 | 11.1%) for men and 45 to 49 Years (398 | 13.5%) for women.
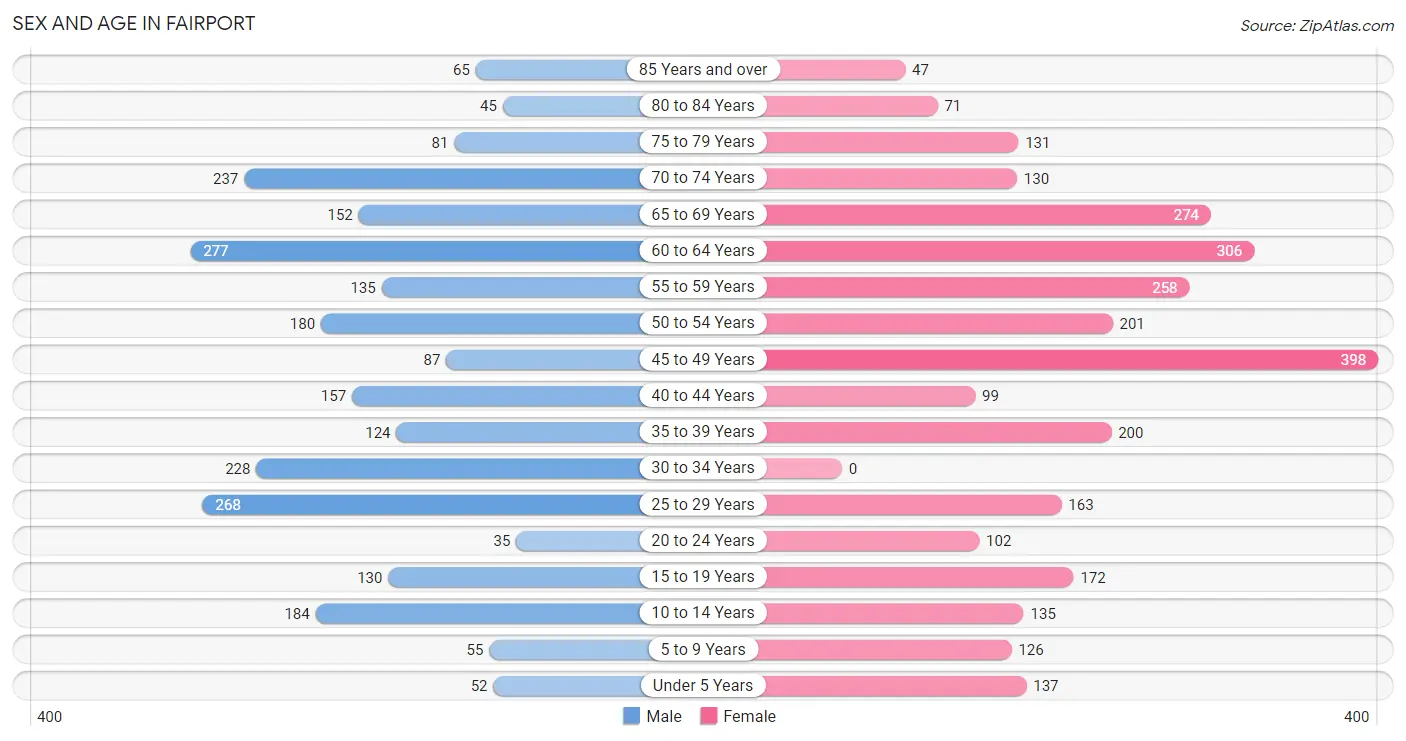
| Age Bracket | Male | Female |
| Under 5 Years | 52 (2.1%) | 137 (4.6%) |
| 5 to 9 Years | 55 (2.2%) | 126 (4.3%) |
| 10 to 14 Years | 184 (7.4%) | 135 (4.6%) |
| 15 to 19 Years | 130 (5.2%) | 172 (5.8%) |
| 20 to 24 Years | 35 (1.4%) | 102 (3.5%) |
| 25 to 29 Years | 268 (10.7%) | 163 (5.5%) |
| 30 to 34 Years | 228 (9.1%) | 0 (0.0%) |
| 35 to 39 Years | 124 (5.0%) | 200 (6.8%) |
| 40 to 44 Years | 157 (6.3%) | 99 (3.4%) |
| 45 to 49 Years | 87 (3.5%) | 398 (13.5%) |
| 50 to 54 Years | 180 (7.2%) | 201 (6.8%) |
| 55 to 59 Years | 135 (5.4%) | 258 (8.7%) |
| 60 to 64 Years | 277 (11.1%) | 306 (10.4%) |
| 65 to 69 Years | 152 (6.1%) | 274 (9.3%) |
| 70 to 74 Years | 237 (9.5%) | 130 (4.4%) |
| 75 to 79 Years | 81 (3.3%) | 131 (4.4%) |
| 80 to 84 Years | 45 (1.8%) | 71 (2.4%) |
| 85 Years and over | 65 (2.6%) | 47 (1.6%) |
| Total | 2,492 (100.0%) | 2,950 (100.0%) |
Families and Households in Fairport
Median Family Size in Fairport
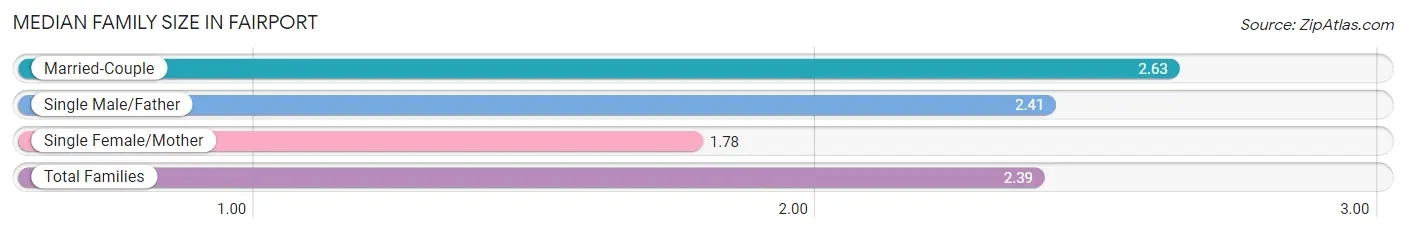
The median family size in Fairport is 2.39 persons per family, with married-couple families (1,090 | 69.0%) accounting for the largest median family size of 2.63 persons per family. On the other hand, single female/mother families (428 | 27.1%) represent the smallest median family size with 1.78 persons per family.
| Family Type | # Families | Family Size |
| Married-Couple | 1,090 (69.0%) | 2.63 |
| Single Male/Father | 61 (3.9%) | 2.41 |
| Single Female/Mother | 428 (27.1%) | 1.78 |
| Total Families | 1,579 (100.0%) | 2.39 |
Median Household Size in Fairport
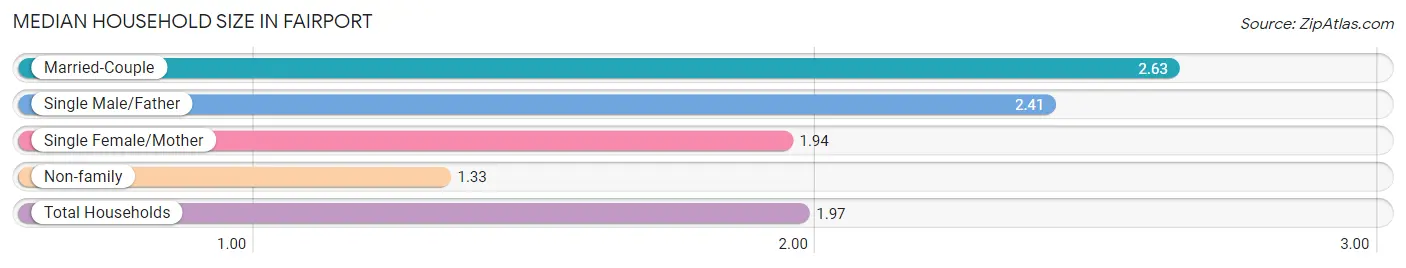
The median household size in Fairport is 1.97 persons per household, with married-couple households (1,090 | 39.9%) accounting for the largest median household size of 2.63 persons per household. non-family households (1,156 | 42.3%) represent the smallest median household size with 1.33 persons per household.
| Household Type | # Households | Household Size |
| Married-Couple | 1,090 (39.9%) | 2.63 |
| Single Male/Father | 61 (2.2%) | 2.41 |
| Single Female/Mother | 428 (15.7%) | 1.94 |
| Non-family | 1,156 (42.3%) | 1.33 |
| Total Households | 2,735 (100.0%) | 1.97 |
Household Size by Marriage Status in Fairport
Out of a total of 2,735 households in Fairport, 1,579 (57.7%) are family households, while 1,156 (42.3%) are nonfamily households. The most numerous type of family households are 2-person households, comprising 1,066, and the most common type of nonfamily households are 1-person households, comprising 816.
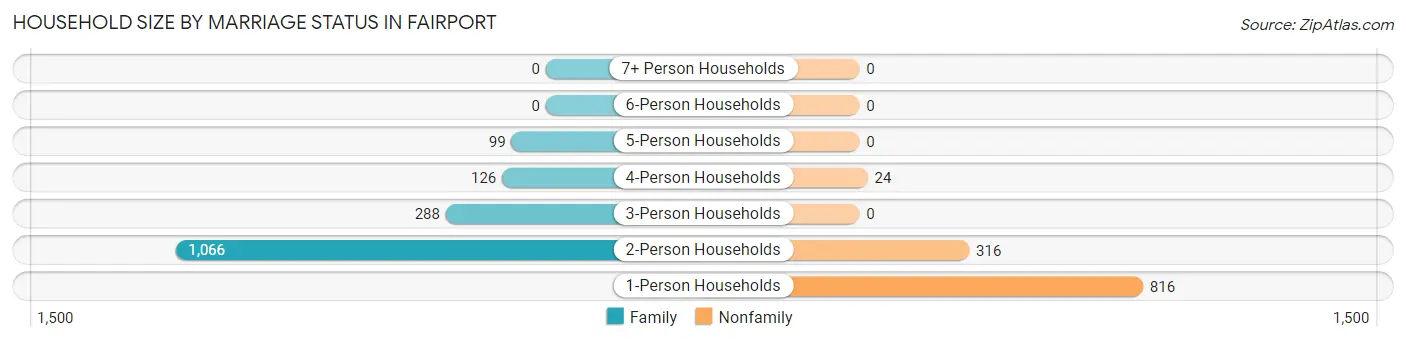
| Household Size | Family Households | Nonfamily Households |
| 1-Person Households | - | 816 (29.8%) |
| 2-Person Households | 1,066 (39.0%) | 316 (11.6%) |
| 3-Person Households | 288 (10.5%) | 0 (0.0%) |
| 4-Person Households | 126 (4.6%) | 24 (0.9%) |
| 5-Person Households | 99 (3.6%) | 0 (0.0%) |
| 6-Person Households | 0 (0.0%) | 0 (0.0%) |
| 7+ Person Households | 0 (0.0%) | 0 (0.0%) |
| Total | 1,579 (57.7%) | 1,156 (42.3%) |
Female Fertility in Fairport
Fertility by Age in Fairport
Average fertility rate in Fairport is 48.0 births per 1,000 women. Women in the age bracket of 20 to 34 years have the highest fertility rate with 117.0 births per 1,000 women. Women in the age bracket of 20 to 34 years acount for 56.4% of all women with births.
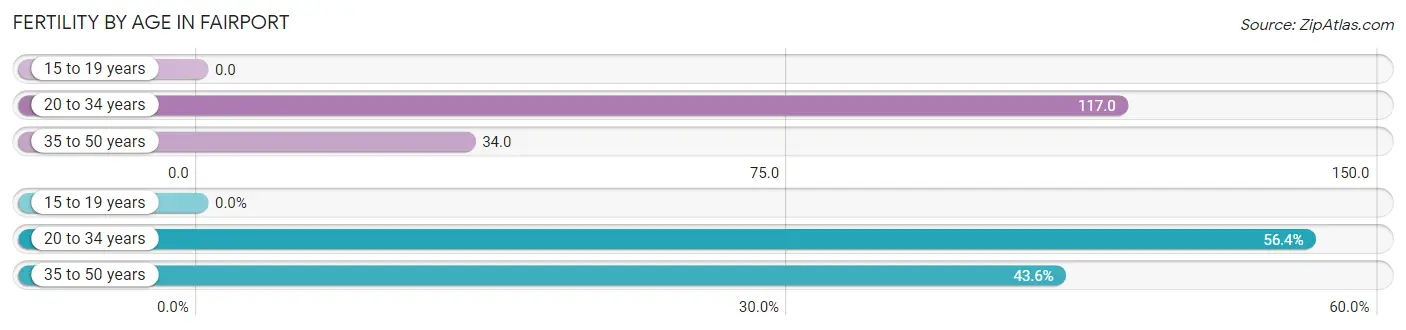
| Age Bracket | Women with Births | Births / 1,000 Women |
| 15 to 19 years | 0 (0.0%) | 0.0 |
| 20 to 34 years | 31 (56.4%) | 117.0 |
| 35 to 50 years | 24 (43.6%) | 34.0 |
| Total | 55 (100.0%) | 48.0 |
Fertility by Age by Marriage Status in Fairport
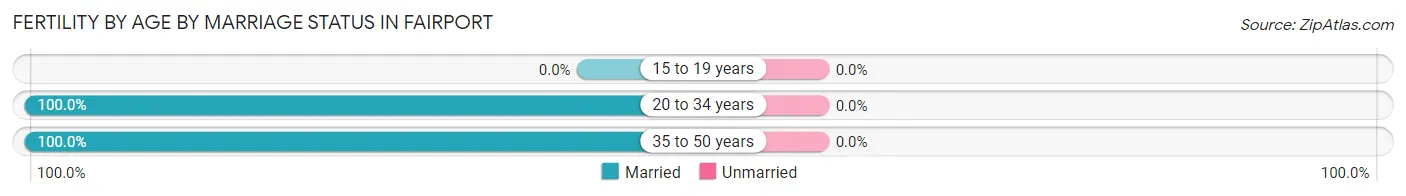
| Age Bracket | Married | Unmarried |
| 15 to 19 years | 0 (0.0%) | 0 (0.0%) |
| 20 to 34 years | 31 (100.0%) | 0 (0.0%) |
| 35 to 50 years | 24 (100.0%) | 0 (0.0%) |
| Total | 55 (100.0%) | 0 (0.0%) |
Fertility by Education in Fairport
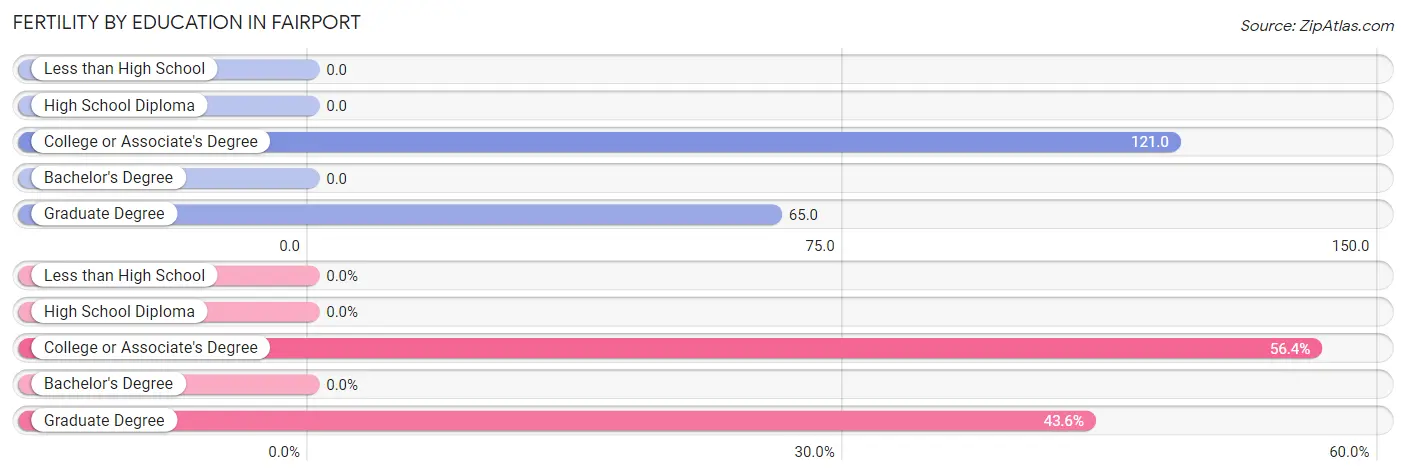
| Educational Attainment | Women with Births | Births / 1,000 Women |
| Less than High School | 0 (0.0%) | 0.0 |
| High School Diploma | 0 (0.0%) | 0.0 |
| College or Associate's Degree | 31 (56.4%) | 121.0 |
| Bachelor's Degree | 0 (0.0%) | 0.0 |
| Graduate Degree | 24 (43.6%) | 65.0 |
| Total | 55 (100.0%) | 48.0 |
Fertility by Education by Marriage Status in Fairport
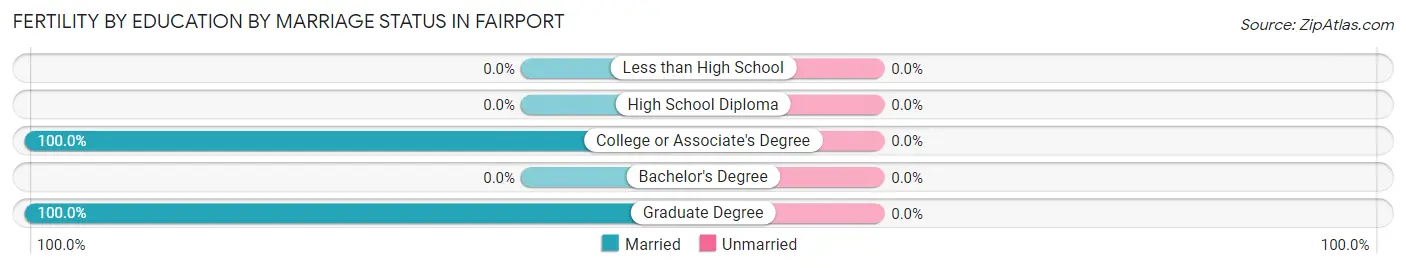
| Educational Attainment | Married | Unmarried |
| Less than High School | 0 (0.0%) | 0 (0.0%) |
| High School Diploma | 0 (0.0%) | 0 (0.0%) |
| College or Associate's Degree | 31 (100.0%) | 0 (0.0%) |
| Bachelor's Degree | 0 (0.0%) | 0 (0.0%) |
| Graduate Degree | 24 (100.0%) | 0 (0.0%) |
| Total | 55 (100.0%) | 0 (0.0%) |
Employment Characteristics in Fairport
Employment by Class of Employer in Fairport
Among the 2,588 employed individuals in Fairport, private company employees (1,577 | 60.9%), not-for-profit organizations (310 | 12.0%), and local government employees (237 | 9.2%) make up the most common classes of employment.
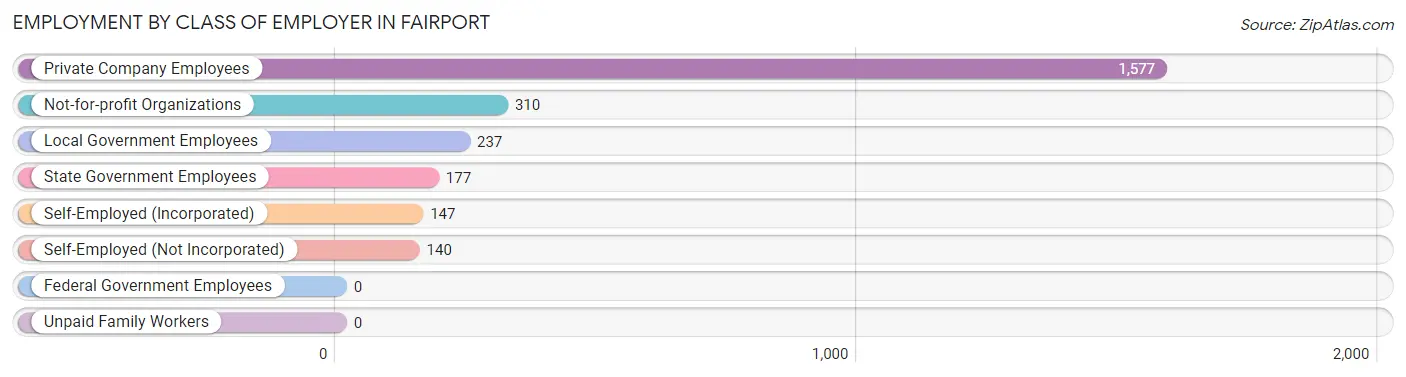
| Employer Class | # Employees | % Employees |
| Private Company Employees | 1,577 | 60.9% |
| Self-Employed (Incorporated) | 147 | 5.7% |
| Self-Employed (Not Incorporated) | 140 | 5.4% |
| Not-for-profit Organizations | 310 | 12.0% |
| Local Government Employees | 237 | 9.2% |
| State Government Employees | 177 | 6.8% |
| Federal Government Employees | 0 | 0.0% |
| Unpaid Family Workers | 0 | 0.0% |
| Total | 2,588 | 100.0% |
Employment Status by Age in Fairport
According to the labor force statistics for Fairport, out of the total population over 16 years of age (4,667), 59.9% or 2,796 individuals are in the labor force, with 4.5% or 126 of them unemployed. The age group with the highest labor force participation rate is 30 to 34 years, with 100.0% or 228 individuals in the labor force. Within the labor force, the 60 to 64 years age range has the highest percentage of unemployed individuals, with 11.1% or 40 of them being unemployed.
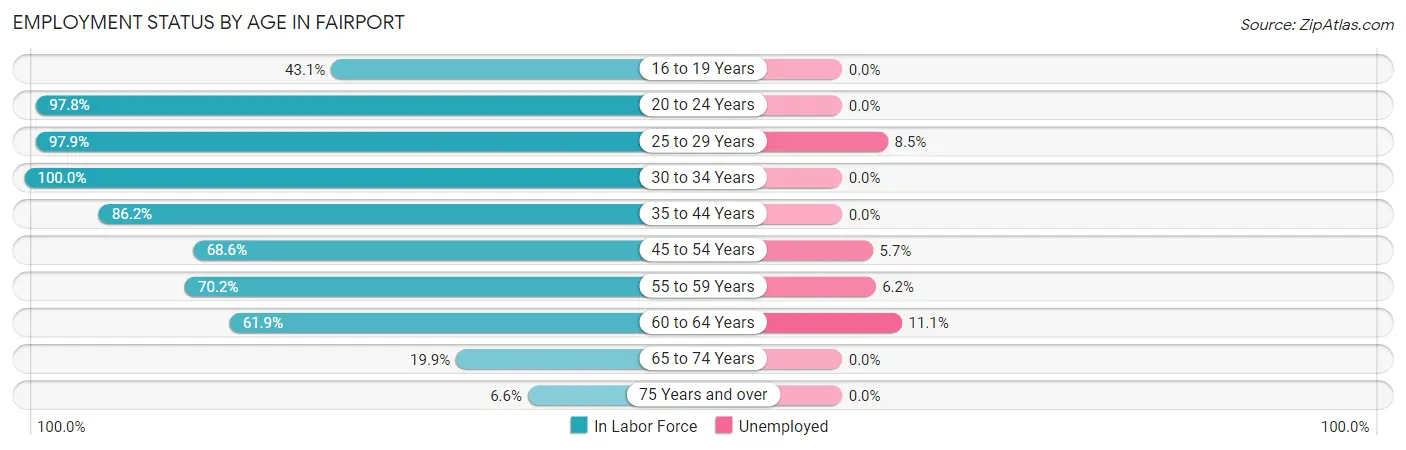
| Age Bracket | In Labor Force | Unemployed |
| 16 to 19 Years | 93 (43.1%) | 0 (0.0%) |
| 20 to 24 Years | 134 (97.8%) | 0 (0.0%) |
| 25 to 29 Years | 422 (97.9%) | 36 (8.5%) |
| 30 to 34 Years | 228 (100.0%) | 0 (0.0%) |
| 35 to 44 Years | 500 (86.2%) | 0 (0.0%) |
| 45 to 54 Years | 594 (68.6%) | 34 (5.7%) |
| 55 to 59 Years | 276 (70.2%) | 17 (6.2%) |
| 60 to 64 Years | 361 (61.9%) | 40 (11.1%) |
| 65 to 74 Years | 158 (19.9%) | 0 (0.0%) |
| 75 Years and over | 29 (6.6%) | 0 (0.0%) |
| Total | 2,796 (59.9%) | 126 (4.5%) |
Employment Status by Educational Attainment in Fairport
According to labor force statistics for Fairport, 77.3% of individuals (2,382) out of the total population between 25 and 64 years of age (3,081) are in the labor force, with 5.3% or 126 of them being unemployed. The group with the highest labor force participation rate are those with the educational attainment of bachelor's degree or higher, with 86.4% or 1,684 individuals in the labor force. Within the labor force, individuals with college / associate degree education have the highest percentage of unemployment, with 16.0% or 80 of them being unemployed.
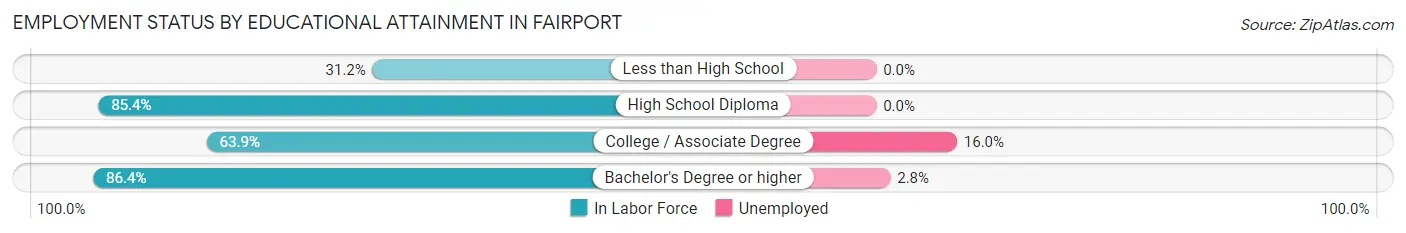
| Educational Attainment | In Labor Force | Unemployed |
| Less than High School | 58 (31.2%) | 0 (0.0%) |
| High School Diploma | 140 (85.4%) | 0 (0.0%) |
| College / Associate Degree | 500 (63.9%) | 125 (16.0%) |
| Bachelor's Degree or higher | 1,684 (86.4%) | 55 (2.8%) |
| Total | 2,382 (77.3%) | 163 (5.3%) |
Employment Occupations by Sex in Fairport
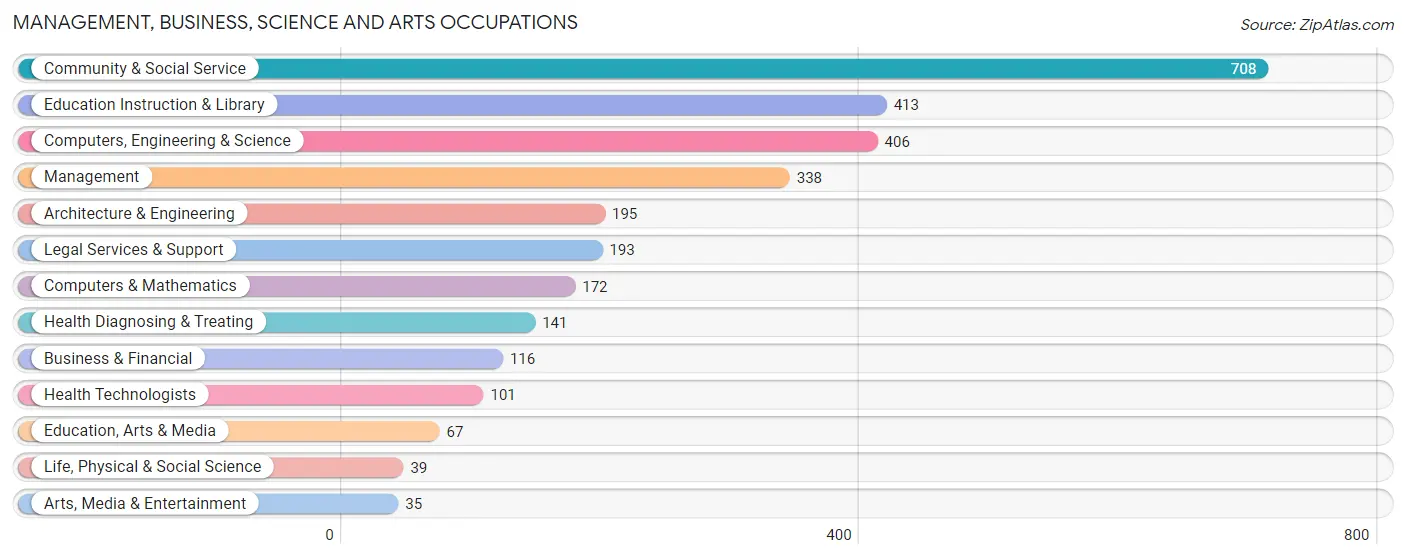
Management, Business, Science and Arts Occupations
The most common Management, Business, Science and Arts occupations in Fairport are Community & Social Service (708 | 26.5%), Education Instruction & Library (413 | 15.5%), Computers, Engineering & Science (406 | 15.2%), Management (338 | 12.7%), and Architecture & Engineering (195 | 7.3%).
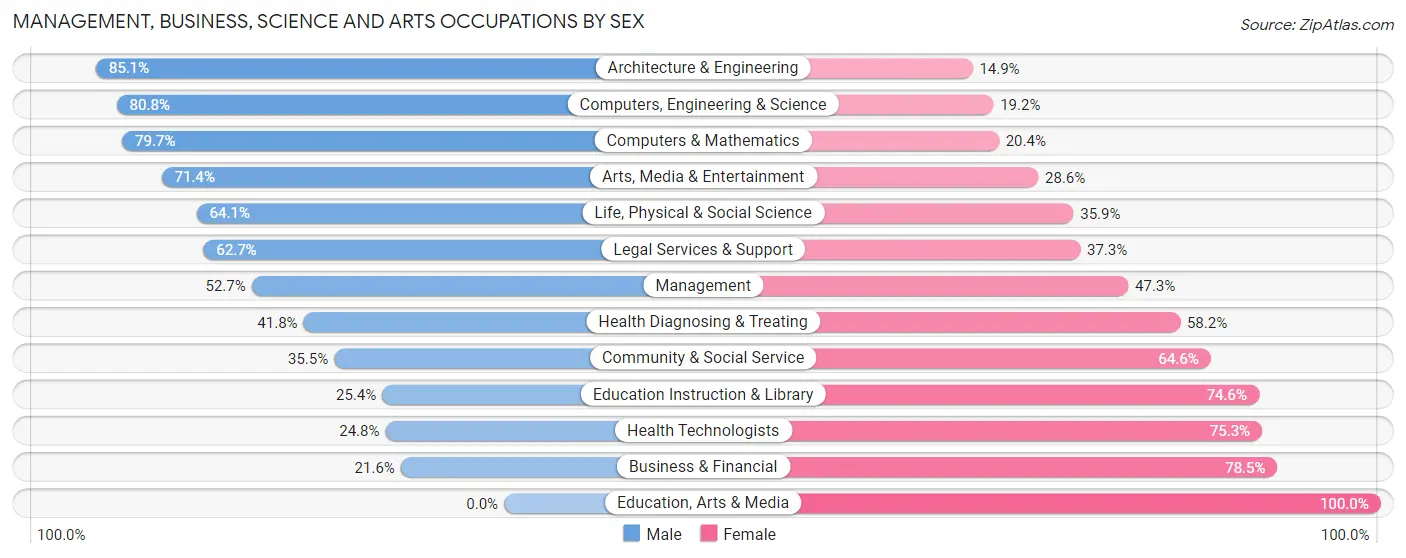
Management, Business, Science and Arts Occupations by Sex
Within the Management, Business, Science and Arts occupations in Fairport, the most male-oriented occupations are Architecture & Engineering (85.1%), Computers, Engineering & Science (80.8%), and Computers & Mathematics (79.6%), while the most female-oriented occupations are Education, Arts & Media (100.0%), Business & Financial (78.4%), and Health Technologists (75.2%).
| Occupation | Male | Female |
| Management | 178 (52.7%) | 160 (47.3%) |
| Business & Financial | 25 (21.5%) | 91 (78.4%) |
| Computers, Engineering & Science | 328 (80.8%) | 78 (19.2%) |
| Computers & Mathematics | 137 (79.6%) | 35 (20.3%) |
| Architecture & Engineering | 166 (85.1%) | 29 (14.9%) |
| Life, Physical & Social Science | 25 (64.1%) | 14 (35.9%) |
| Community & Social Service | 251 (35.4%) | 457 (64.5%) |
| Education, Arts & Media | 0 (0.0%) | 67 (100.0%) |
| Legal Services & Support | 121 (62.7%) | 72 (37.3%) |
| Education Instruction & Library | 105 (25.4%) | 308 (74.6%) |
| Arts, Media & Entertainment | 25 (71.4%) | 10 (28.6%) |
| Health Diagnosing & Treating | 59 (41.8%) | 82 (58.2%) |
| Health Technologists | 25 (24.7%) | 76 (75.2%) |
| Total (Category) | 841 (49.2%) | 868 (50.8%) |
| Total (Overall) | 1,328 (49.8%) | 1,340 (50.2%) |
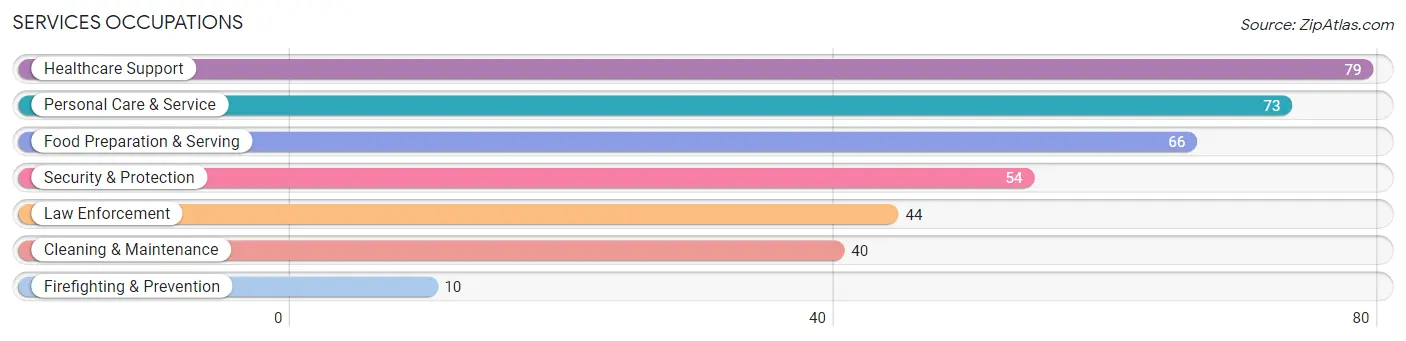
Services Occupations
The most common Services occupations in Fairport are Healthcare Support (79 | 3.0%), Personal Care & Service (73 | 2.7%), Food Preparation & Serving (66 | 2.5%), Security & Protection (54 | 2.0%), and Law Enforcement (44 | 1.7%).
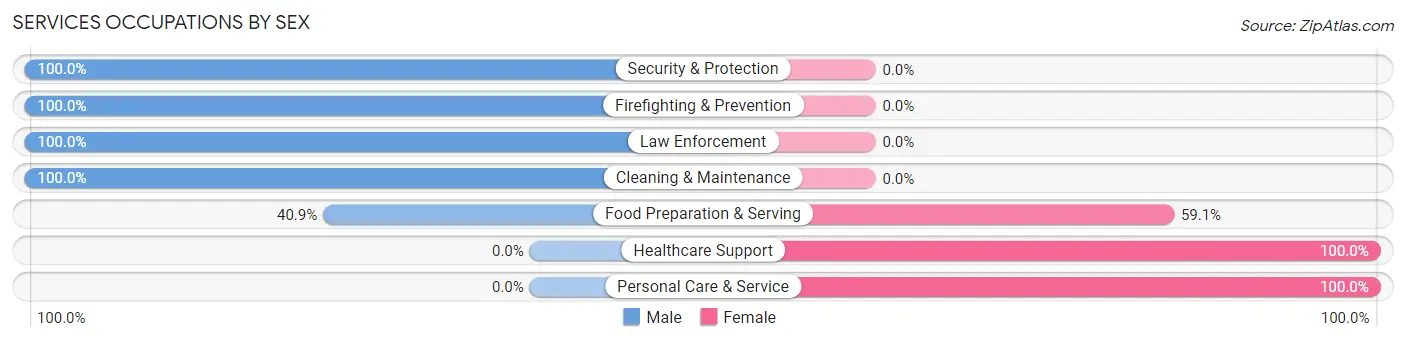
Services Occupations by Sex
Within the Services occupations in Fairport, the most male-oriented occupations are Security & Protection (100.0%), Firefighting & Prevention (100.0%), and Law Enforcement (100.0%), while the most female-oriented occupations are Healthcare Support (100.0%), Personal Care & Service (100.0%), and Food Preparation & Serving (59.1%).
| Occupation | Male | Female |
| Healthcare Support | 0 (0.0%) | 79 (100.0%) |
| Security & Protection | 54 (100.0%) | 0 (0.0%) |
| Firefighting & Prevention | 10 (100.0%) | 0 (0.0%) |
| Law Enforcement | 44 (100.0%) | 0 (0.0%) |
| Food Preparation & Serving | 27 (40.9%) | 39 (59.1%) |
| Cleaning & Maintenance | 40 (100.0%) | 0 (0.0%) |
| Personal Care & Service | 0 (0.0%) | 73 (100.0%) |
| Total (Category) | 121 (38.8%) | 191 (61.2%) |
| Total (Overall) | 1,328 (49.8%) | 1,340 (50.2%) |
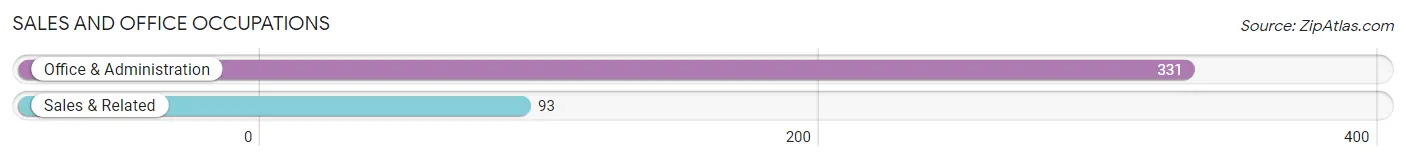
Sales and Office Occupations
The most common Sales and Office occupations in Fairport are Office & Administration (331 | 12.4%), and Sales & Related (93 | 3.5%).
Sales and Office Occupations by Sex
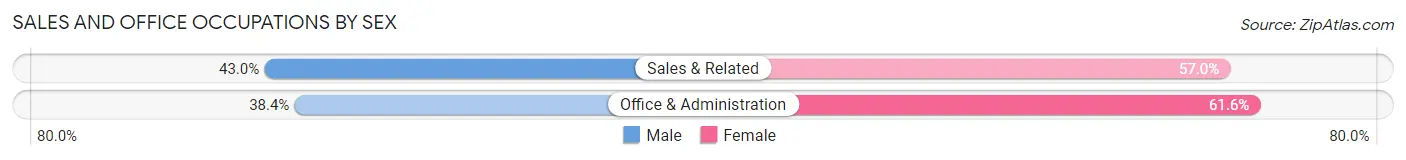
| Occupation | Male | Female |
| Sales & Related | 40 (43.0%) | 53 (57.0%) |
| Office & Administration | 127 (38.4%) | 204 (61.6%) |
| Total (Category) | 167 (39.4%) | 257 (60.6%) |
| Total (Overall) | 1,328 (49.8%) | 1,340 (50.2%) |
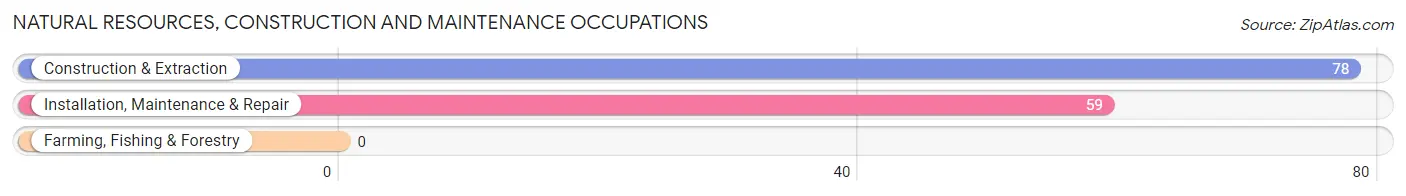
Natural Resources, Construction and Maintenance Occupations
The most common Natural Resources, Construction and Maintenance occupations in Fairport are Construction & Extraction (78 | 2.9%), and Installation, Maintenance & Repair (59 | 2.2%).
Natural Resources, Construction and Maintenance Occupations by Sex
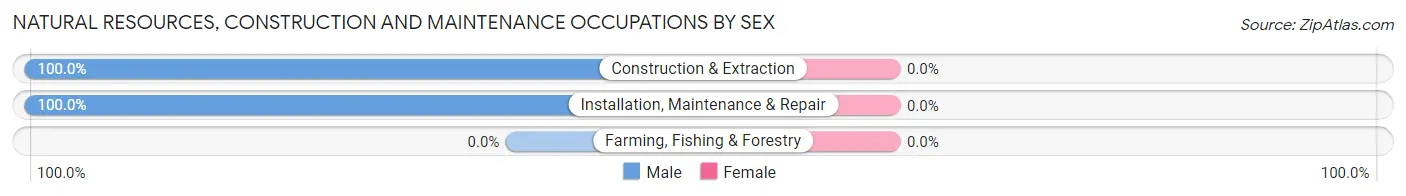
| Occupation | Male | Female |
| Farming, Fishing & Forestry | 0 (0.0%) | 0 (0.0%) |
| Construction & Extraction | 78 (100.0%) | 0 (0.0%) |
| Installation, Maintenance & Repair | 59 (100.0%) | 0 (0.0%) |
| Total (Category) | 137 (100.0%) | 0 (0.0%) |
| Total (Overall) | 1,328 (49.8%) | 1,340 (50.2%) |
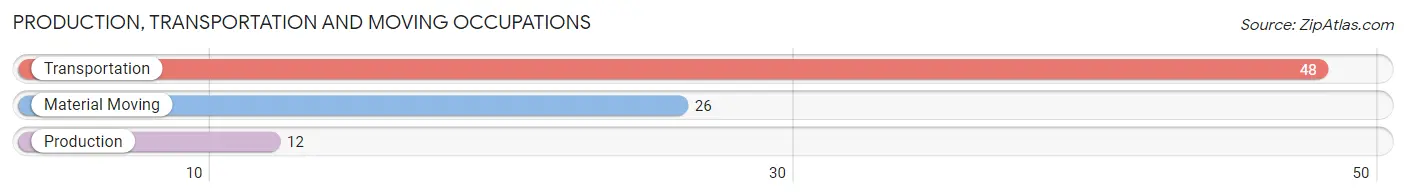
Production, Transportation and Moving Occupations
The most common Production, Transportation and Moving occupations in Fairport are Transportation (48 | 1.8%), Material Moving (26 | 1.0%), and Production (12 | 0.4%).
Production, Transportation and Moving Occupations by Sex
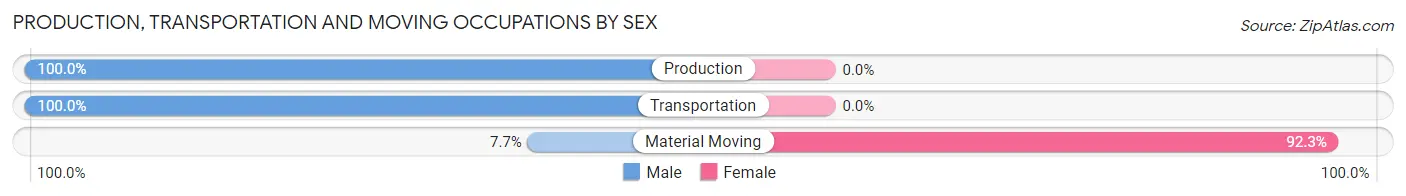
| Occupation | Male | Female |
| Production | 12 (100.0%) | 0 (0.0%) |
| Transportation | 48 (100.0%) | 0 (0.0%) |
| Material Moving | 2 (7.7%) | 24 (92.3%) |
| Total (Category) | 62 (72.1%) | 24 (27.9%) |
| Total (Overall) | 1,328 (49.8%) | 1,340 (50.2%) |
Employment Industries by Sex in Fairport
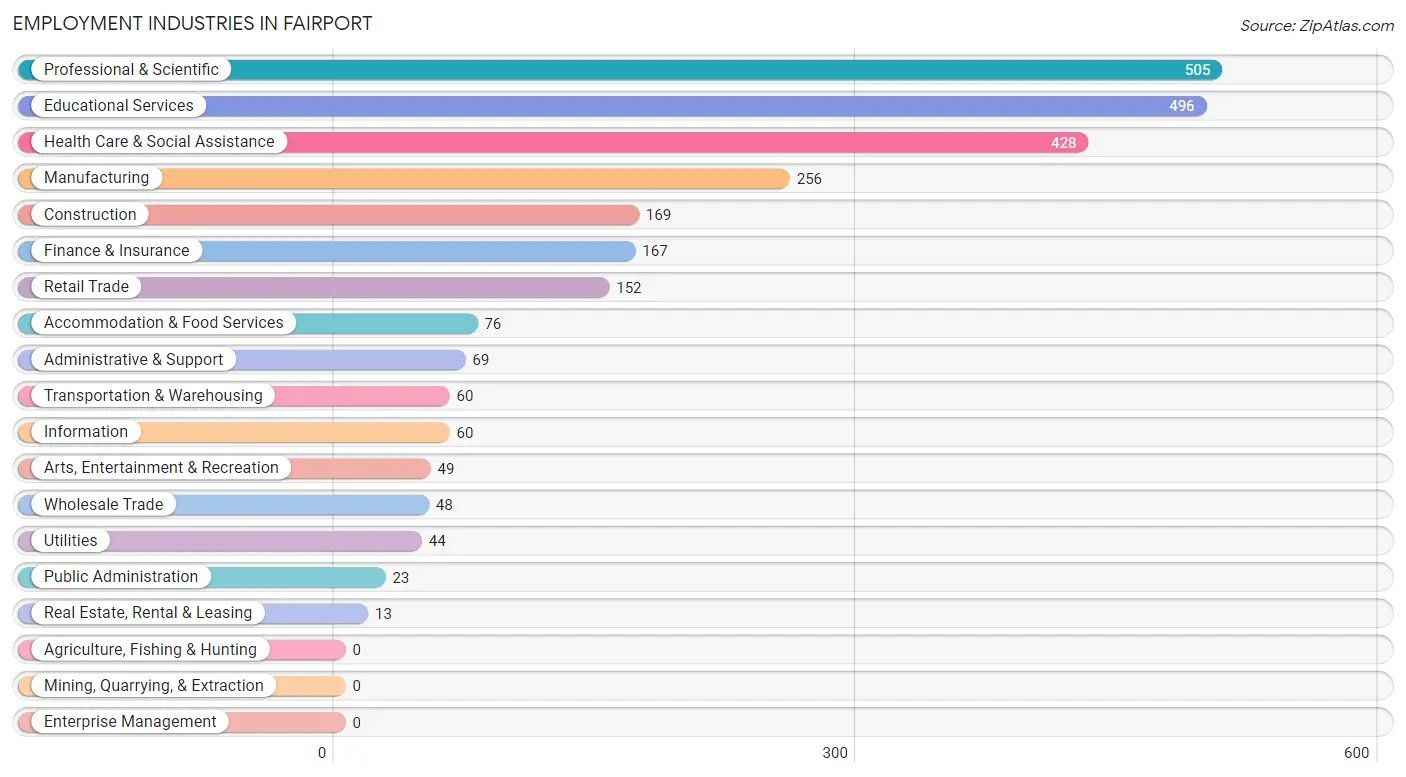
Employment Industries in Fairport
The major employment industries in Fairport include Professional & Scientific (505 | 18.9%), Educational Services (496 | 18.6%), Health Care & Social Assistance (428 | 16.0%), Manufacturing (256 | 9.6%), and Construction (169 | 6.3%).
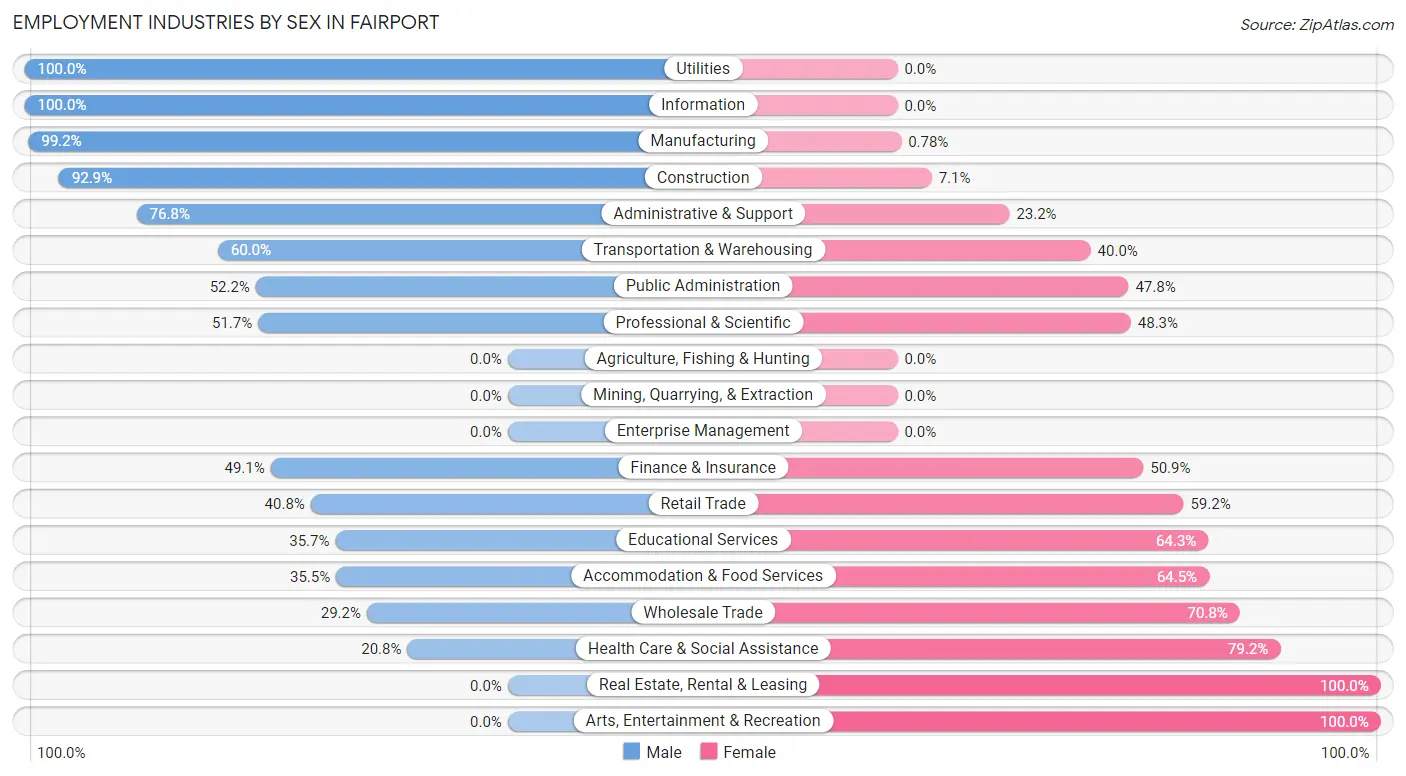
Employment Industries by Sex in Fairport
The Fairport industries that see more men than women are Utilities (100.0%), Information (100.0%), and Manufacturing (99.2%), whereas the industries that tend to have a higher number of women are Real Estate, Rental & Leasing (100.0%), Arts, Entertainment & Recreation (100.0%), and Health Care & Social Assistance (79.2%).
| Industry | Male | Female |
| Agriculture, Fishing & Hunting | 0 (0.0%) | 0 (0.0%) |
| Mining, Quarrying, & Extraction | 0 (0.0%) | 0 (0.0%) |
| Construction | 157 (92.9%) | 12 (7.1%) |
| Manufacturing | 254 (99.2%) | 2 (0.8%) |
| Wholesale Trade | 14 (29.2%) | 34 (70.8%) |
| Retail Trade | 62 (40.8%) | 90 (59.2%) |
| Transportation & Warehousing | 36 (60.0%) | 24 (40.0%) |
| Utilities | 44 (100.0%) | 0 (0.0%) |
| Information | 60 (100.0%) | 0 (0.0%) |
| Finance & Insurance | 82 (49.1%) | 85 (50.9%) |
| Real Estate, Rental & Leasing | 0 (0.0%) | 13 (100.0%) |
| Professional & Scientific | 261 (51.7%) | 244 (48.3%) |
| Enterprise Management | 0 (0.0%) | 0 (0.0%) |
| Administrative & Support | 53 (76.8%) | 16 (23.2%) |
| Educational Services | 177 (35.7%) | 319 (64.3%) |
| Health Care & Social Assistance | 89 (20.8%) | 339 (79.2%) |
| Arts, Entertainment & Recreation | 0 (0.0%) | 49 (100.0%) |
| Accommodation & Food Services | 27 (35.5%) | 49 (64.5%) |
| Public Administration | 12 (52.2%) | 11 (47.8%) |
| Total | 1,328 (49.8%) | 1,340 (50.2%) |
Education in Fairport
School Enrollment in Fairport
The most common levels of schooling among the 1,002 students in Fairport are high school (351 | 35.0%), middle school (171 | 17.1%), and college / undergraduate (165 | 16.5%).
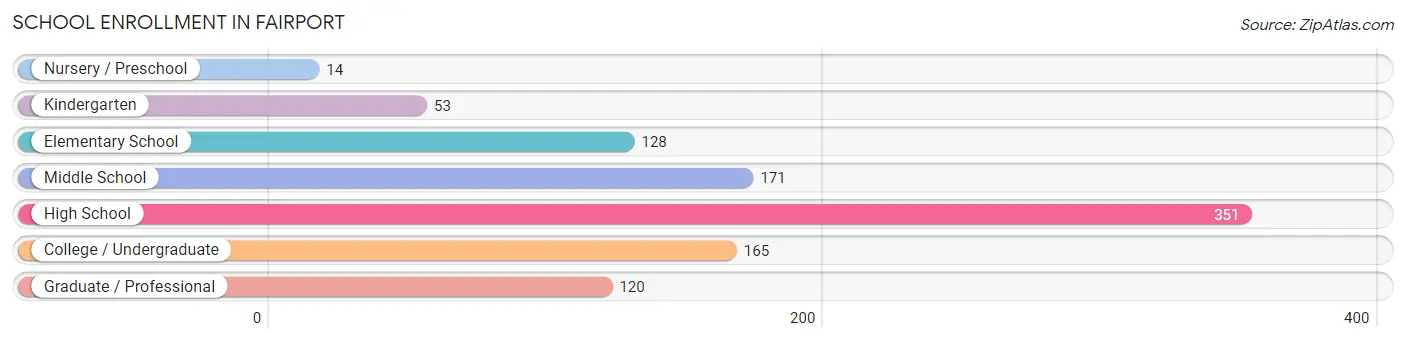
| School Level | # Students | % Students |
| Nursery / Preschool | 14 | 1.4% |
| Kindergarten | 53 | 5.3% |
| Elementary School | 128 | 12.8% |
| Middle School | 171 | 17.1% |
| High School | 351 | 35.0% |
| College / Undergraduate | 165 | 16.5% |
| Graduate / Professional | 120 | 12.0% |
| Total | 1,002 | 100.0% |
School Enrollment by Age by Funding Source in Fairport
Out of a total of 1,002 students who are enrolled in schools in Fairport, 186 (18.6%) attend a private institution, while the remaining 816 (81.4%) are enrolled in public schools. The age group of 25 to 34 year olds has the highest likelihood of being enrolled in private schools, with 90 (55.9% in the age bracket) enrolled. Conversely, the age group of 3 to 4 year olds has the lowest likelihood of being enrolled in a private school, with 14 (100.0% in the age bracket) attending a public institution.
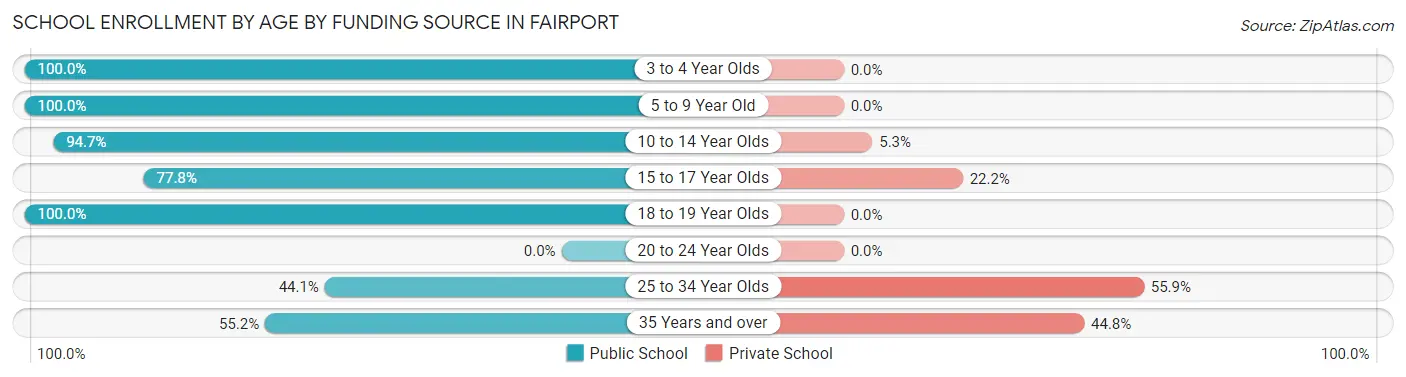
| Age Bracket | Public School | Private School |
| 3 to 4 Year Olds | 14 (100.0%) | 0 (0.0%) |
| 5 to 9 Year Old | 181 (100.0%) | 0 (0.0%) |
| 10 to 14 Year Olds | 302 (94.7%) | 17 (5.3%) |
| 15 to 17 Year Olds | 172 (77.8%) | 49 (22.2%) |
| 18 to 19 Year Olds | 39 (100.0%) | 0 (0.0%) |
| 20 to 24 Year Olds | 0 (0.0%) | 0 (0.0%) |
| 25 to 34 Year Olds | 71 (44.1%) | 90 (55.9%) |
| 35 Years and over | 37 (55.2%) | 30 (44.8%) |
| Total | 816 (81.4%) | 186 (18.6%) |
Educational Attainment by Field of Study in Fairport
Education (363 | 13.2%), business (312 | 11.3%), social sciences (301 | 10.9%), engineering (252 | 9.1%), and literature & languages (244 | 8.8%) are the most common fields of study among 2,761 individuals in Fairport who have obtained a bachelor's degree or higher.
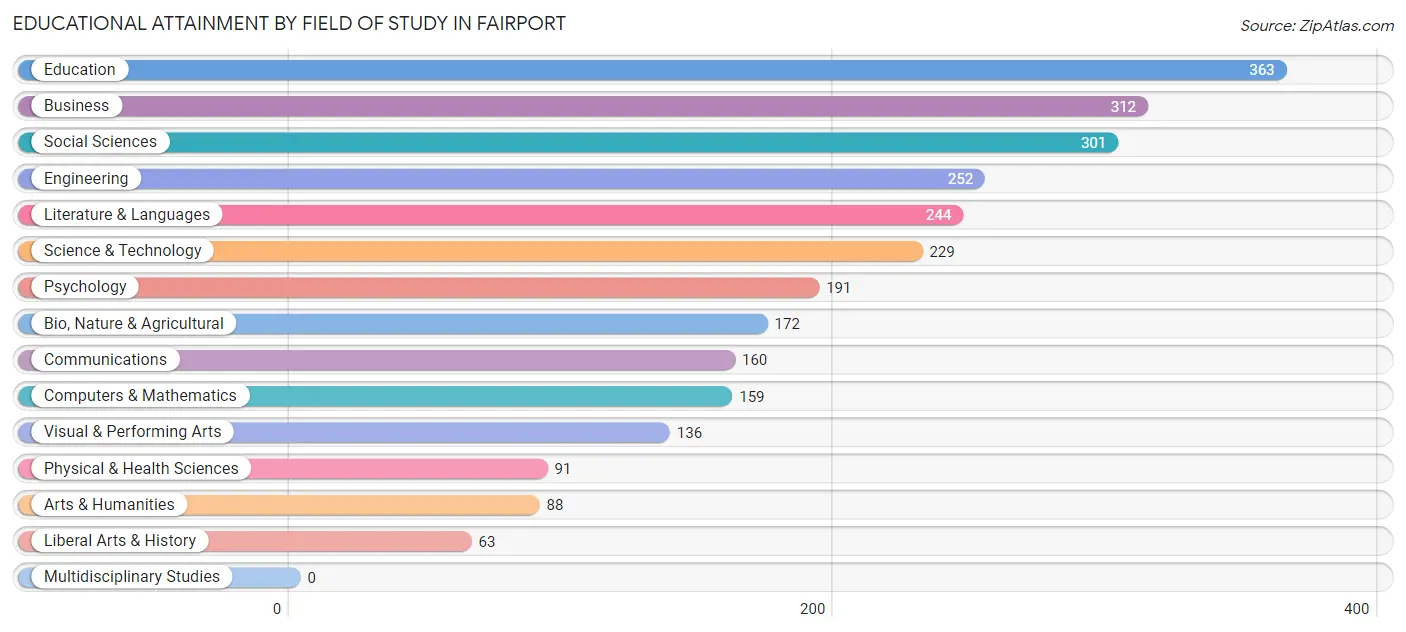
| Field of Study | # Graduates | % Graduates |
| Computers & Mathematics | 159 | 5.8% |
| Bio, Nature & Agricultural | 172 | 6.2% |
| Physical & Health Sciences | 91 | 3.3% |
| Psychology | 191 | 6.9% |
| Social Sciences | 301 | 10.9% |
| Engineering | 252 | 9.1% |
| Multidisciplinary Studies | 0 | 0.0% |
| Science & Technology | 229 | 8.3% |
| Business | 312 | 11.3% |
| Education | 363 | 13.2% |
| Literature & Languages | 244 | 8.8% |
| Liberal Arts & History | 63 | 2.3% |
| Visual & Performing Arts | 136 | 4.9% |
| Communications | 160 | 5.8% |
| Arts & Humanities | 88 | 3.2% |
| Total | 2,761 | 100.0% |
Transportation & Commute in Fairport
Vehicle Availability by Sex in Fairport
The most prevalent vehicle ownership categories in Fairport are males with 2 vehicles (811, accounting for 62.3%) and females with 2 vehicles (552, making up 63.2%).
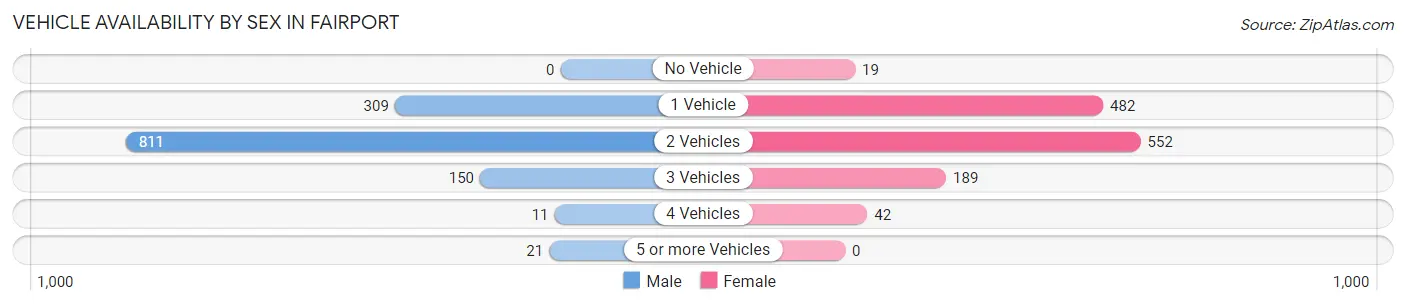
| Vehicles Available | Male | Female |
| No Vehicle | 0 (0.0%) | 19 (1.5%) |
| 1 Vehicle | 309 (23.7%) | 482 (37.5%) |
| 2 Vehicles | 811 (62.3%) | 552 (43.0%) |
| 3 Vehicles | 150 (11.5%) | 189 (14.7%) |
| 4 Vehicles | 11 (0.8%) | 42 (3.3%) |
| 5 or more Vehicles | 21 (1.6%) | 0 (0.0%) |
| Total | 1,302 (100.0%) | 1,284 (100.0%) |
Commute Time in Fairport
The most frequently occuring commute durations in Fairport are 15 to 19 minutes (495 commuters, 24.1%), 30 to 34 minutes (385 commuters, 18.8%), and 20 to 24 minutes (371 commuters, 18.1%).
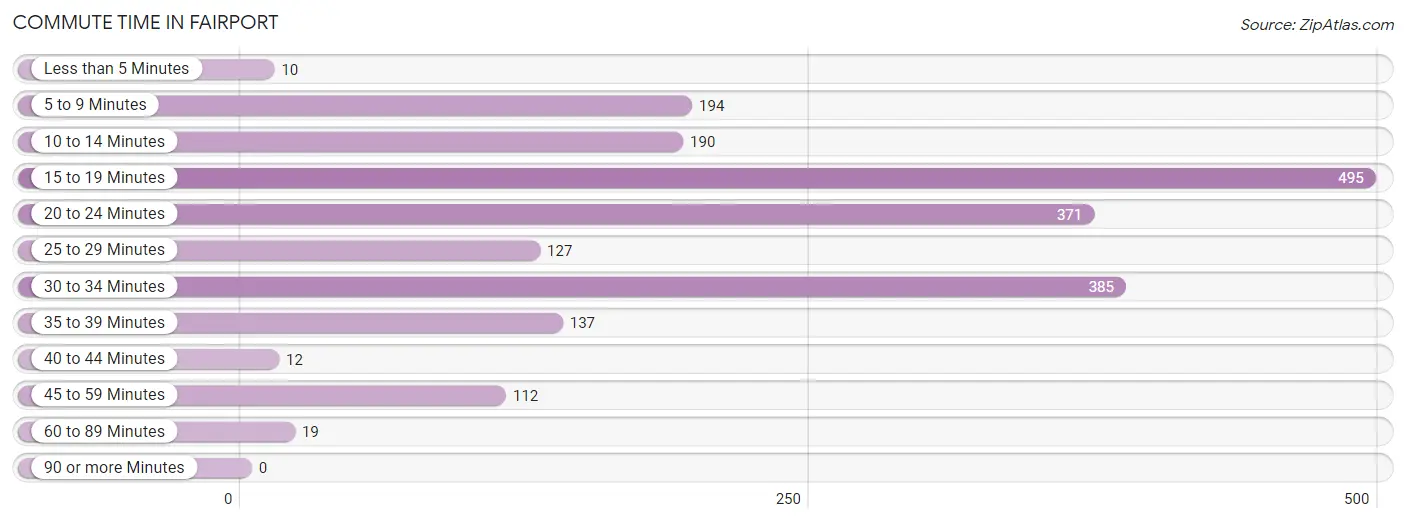
| Commute Time | # Commuters | % Commuters |
| Less than 5 Minutes | 10 | 0.5% |
| 5 to 9 Minutes | 194 | 9.5% |
| 10 to 14 Minutes | 190 | 9.3% |
| 15 to 19 Minutes | 495 | 24.1% |
| 20 to 24 Minutes | 371 | 18.1% |
| 25 to 29 Minutes | 127 | 6.2% |
| 30 to 34 Minutes | 385 | 18.8% |
| 35 to 39 Minutes | 137 | 6.7% |
| 40 to 44 Minutes | 12 | 0.6% |
| 45 to 59 Minutes | 112 | 5.5% |
| 60 to 89 Minutes | 19 | 0.9% |
| 90 or more Minutes | 0 | 0.0% |
Commute Time by Sex in Fairport
The most common commute times in Fairport are 15 to 19 minutes (281 commuters, 27.1%) for males and 30 to 34 minutes (254 commuters, 25.1%) for females.
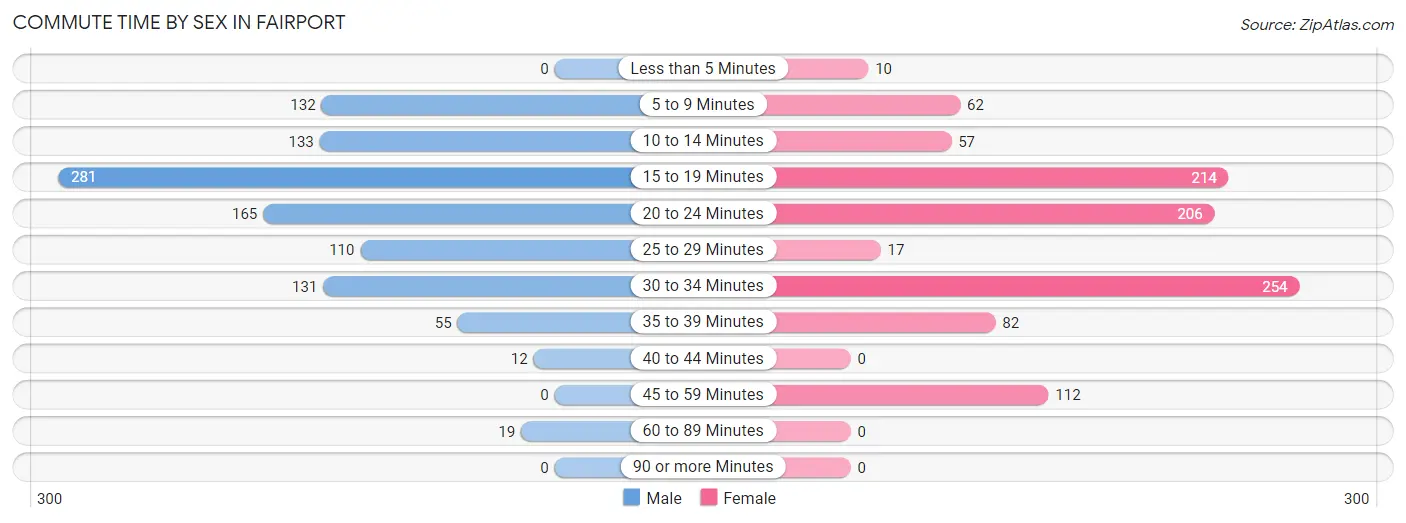
| Commute Time | Male | Female |
| Less than 5 Minutes | 0 (0.0%) | 10 (1.0%) |
| 5 to 9 Minutes | 132 (12.7%) | 62 (6.1%) |
| 10 to 14 Minutes | 133 (12.8%) | 57 (5.6%) |
| 15 to 19 Minutes | 281 (27.1%) | 214 (21.1%) |
| 20 to 24 Minutes | 165 (15.9%) | 206 (20.3%) |
| 25 to 29 Minutes | 110 (10.6%) | 17 (1.7%) |
| 30 to 34 Minutes | 131 (12.6%) | 254 (25.1%) |
| 35 to 39 Minutes | 55 (5.3%) | 82 (8.1%) |
| 40 to 44 Minutes | 12 (1.2%) | 0 (0.0%) |
| 45 to 59 Minutes | 0 (0.0%) | 112 (11.1%) |
| 60 to 89 Minutes | 19 (1.8%) | 0 (0.0%) |
| 90 or more Minutes | 0 (0.0%) | 0 (0.0%) |
Time of Departure to Work by Sex in Fairport
The most frequent times of departure to work in Fairport are 7:30 AM to 7:59 AM (350, 33.7%) for males and 7:00 AM to 7:29 AM (198, 19.5%) for females.
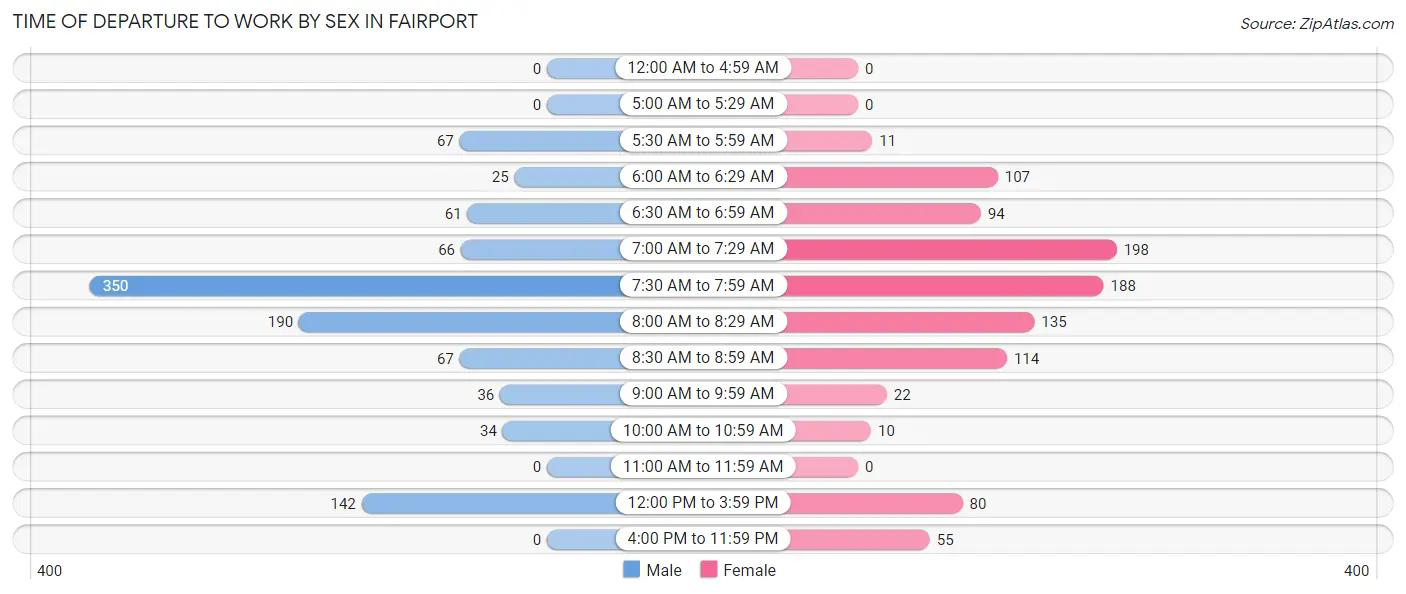
| Time of Departure | Male | Female |
| 12:00 AM to 4:59 AM | 0 (0.0%) | 0 (0.0%) |
| 5:00 AM to 5:29 AM | 0 (0.0%) | 0 (0.0%) |
| 5:30 AM to 5:59 AM | 67 (6.5%) | 11 (1.1%) |
| 6:00 AM to 6:29 AM | 25 (2.4%) | 107 (10.5%) |
| 6:30 AM to 6:59 AM | 61 (5.9%) | 94 (9.3%) |
| 7:00 AM to 7:29 AM | 66 (6.4%) | 198 (19.5%) |
| 7:30 AM to 7:59 AM | 350 (33.7%) | 188 (18.5%) |
| 8:00 AM to 8:29 AM | 190 (18.3%) | 135 (13.3%) |
| 8:30 AM to 8:59 AM | 67 (6.5%) | 114 (11.2%) |
| 9:00 AM to 9:59 AM | 36 (3.5%) | 22 (2.2%) |
| 10:00 AM to 10:59 AM | 34 (3.3%) | 10 (1.0%) |
| 11:00 AM to 11:59 AM | 0 (0.0%) | 0 (0.0%) |
| 12:00 PM to 3:59 PM | 142 (13.7%) | 80 (7.9%) |
| 4:00 PM to 11:59 PM | 0 (0.0%) | 55 (5.4%) |
| Total | 1,038 (100.0%) | 1,014 (100.0%) |
Housing Occupancy in Fairport
Occupancy by Ownership in Fairport
Of the total 2,735 dwellings in Fairport, owner-occupied units account for 1,813 (66.3%), while renter-occupied units make up 922 (33.7%).
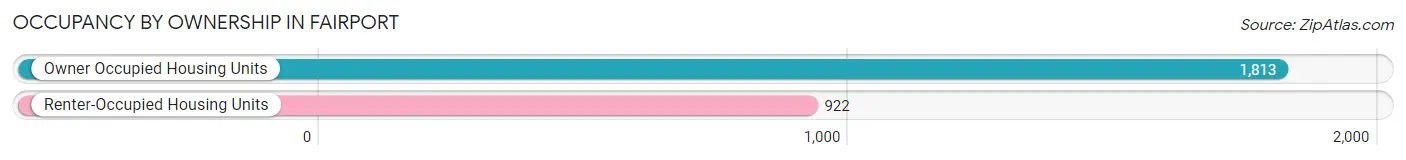
| Occupancy | # Housing Units | % Housing Units |
| Owner Occupied Housing Units | 1,813 | 66.3% |
| Renter-Occupied Housing Units | 922 | 33.7% |
| Total Occupied Housing Units | 2,735 | 100.0% |
Occupancy by Household Size in Fairport
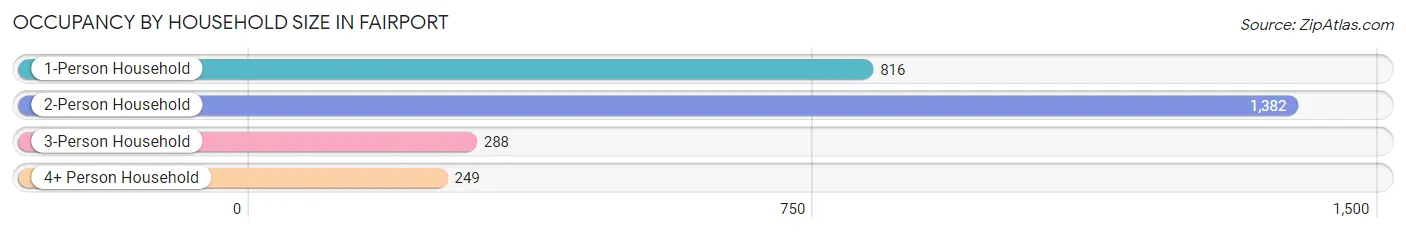
| Household Size | # Housing Units | % Housing Units |
| 1-Person Household | 816 | 29.8% |
| 2-Person Household | 1,382 | 50.5% |
| 3-Person Household | 288 | 10.5% |
| 4+ Person Household | 249 | 9.1% |
| Total Housing Units | 2,735 | 100.0% |
Occupancy by Ownership by Household Size in Fairport
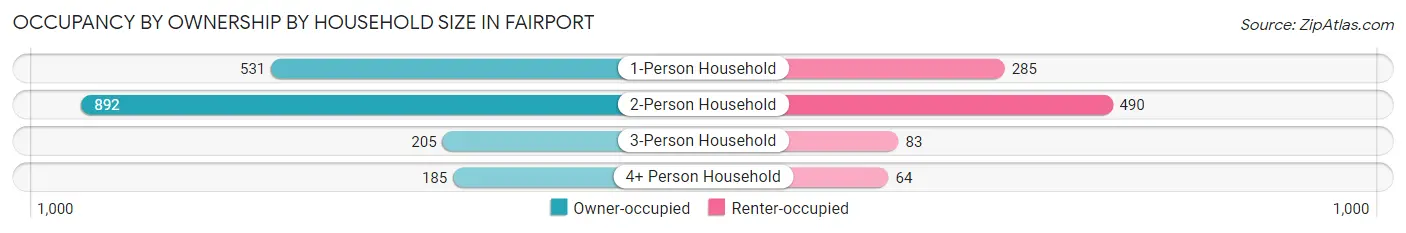
| Household Size | Owner-occupied | Renter-occupied |
| 1-Person Household | 531 (65.1%) | 285 (34.9%) |
| 2-Person Household | 892 (64.5%) | 490 (35.5%) |
| 3-Person Household | 205 (71.2%) | 83 (28.8%) |
| 4+ Person Household | 185 (74.3%) | 64 (25.7%) |
| Total Housing Units | 1,813 (66.3%) | 922 (33.7%) |
Occupancy by Educational Attainment in Fairport
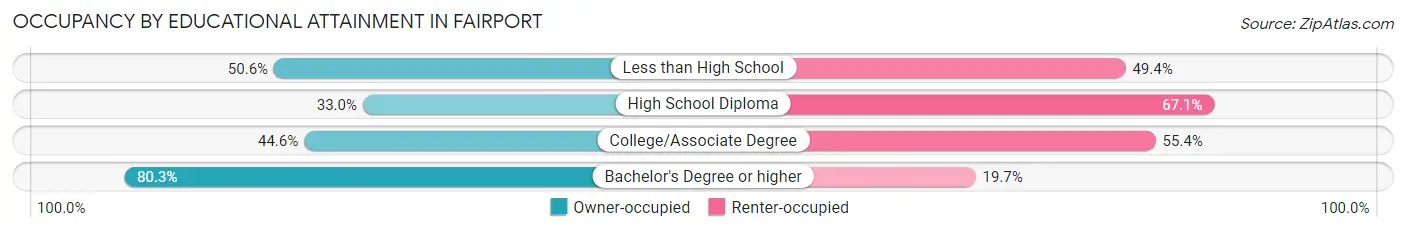
| Household Size | Owner-occupied | Renter-occupied |
| Less than High School | 44 (50.6%) | 43 (49.4%) |
| High School Diploma | 58 (33.0%) | 118 (67.0%) |
| College/Associate Degree | 342 (44.6%) | 425 (55.4%) |
| Bachelor's Degree or higher | 1,369 (80.3%) | 336 (19.7%) |
Occupancy by Age of Householder in Fairport
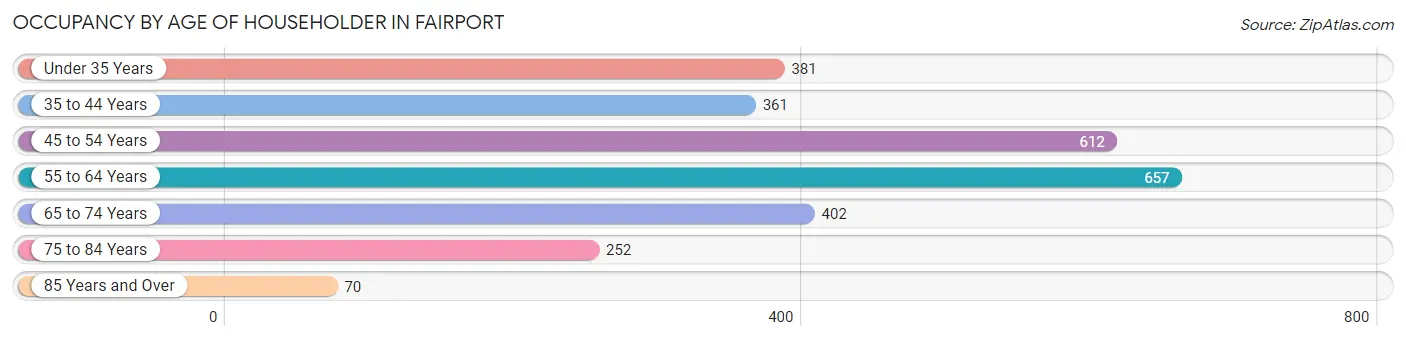
| Age Bracket | # Households | % Households |
| Under 35 Years | 381 | 13.9% |
| 35 to 44 Years | 361 | 13.2% |
| 45 to 54 Years | 612 | 22.4% |
| 55 to 64 Years | 657 | 24.0% |
| 65 to 74 Years | 402 | 14.7% |
| 75 to 84 Years | 252 | 9.2% |
| 85 Years and Over | 70 | 2.6% |
| Total | 2,735 | 100.0% |
Housing Finances in Fairport
Median Income by Occupancy in Fairport
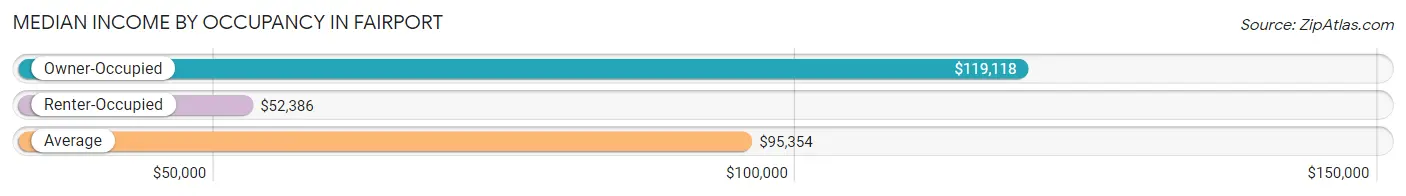
| Occupancy Type | # Households | Median Income |
| Owner-Occupied | 1,813 (66.3%) | $119,118 |
| Renter-Occupied | 922 (33.7%) | $52,386 |
| Average | 2,735 (100.0%) | $95,354 |
Occupancy by Householder Income Bracket in Fairport
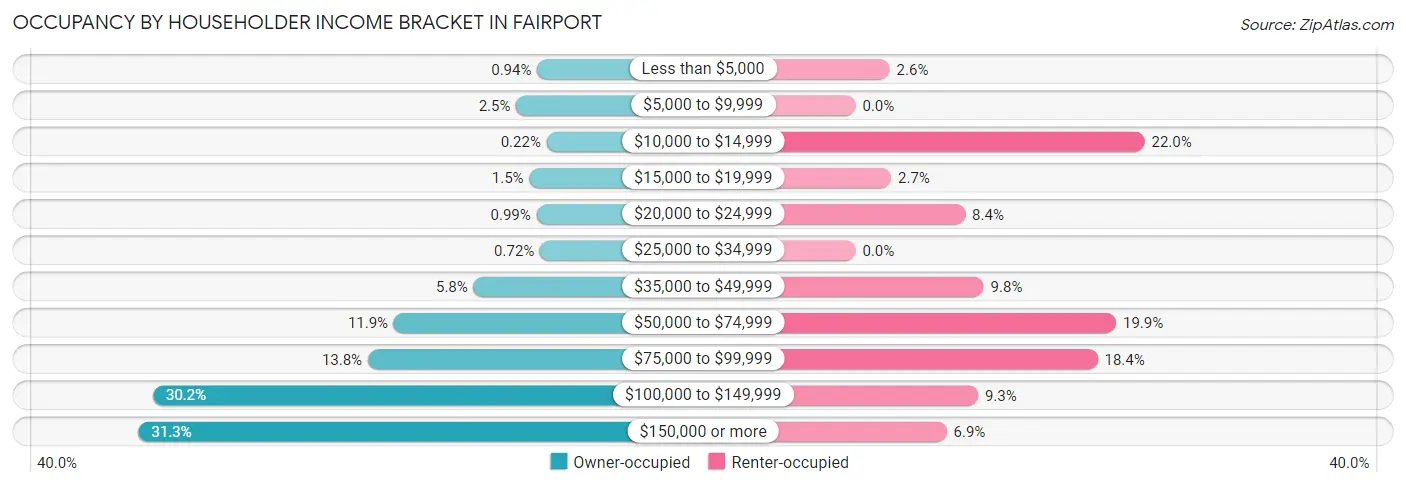
| Income Bracket | Owner-occupied | Renter-occupied |
| Less than $5,000 | 17 (0.9%) | 24 (2.6%) |
| $5,000 to $9,999 | 46 (2.5%) | 0 (0.0%) |
| $10,000 to $14,999 | 4 (0.2%) | 203 (22.0%) |
| $15,000 to $19,999 | 28 (1.5%) | 25 (2.7%) |
| $20,000 to $24,999 | 18 (1.0%) | 77 (8.4%) |
| $25,000 to $34,999 | 13 (0.7%) | 0 (0.0%) |
| $35,000 to $49,999 | 105 (5.8%) | 90 (9.8%) |
| $50,000 to $74,999 | 215 (11.9%) | 183 (19.9%) |
| $75,000 to $99,999 | 251 (13.8%) | 170 (18.4%) |
| $100,000 to $149,999 | 548 (30.2%) | 86 (9.3%) |
| $150,000 or more | 568 (31.3%) | 64 (6.9%) |
| Total | 1,813 (100.0%) | 922 (100.0%) |
Monthly Housing Cost Tiers in Fairport
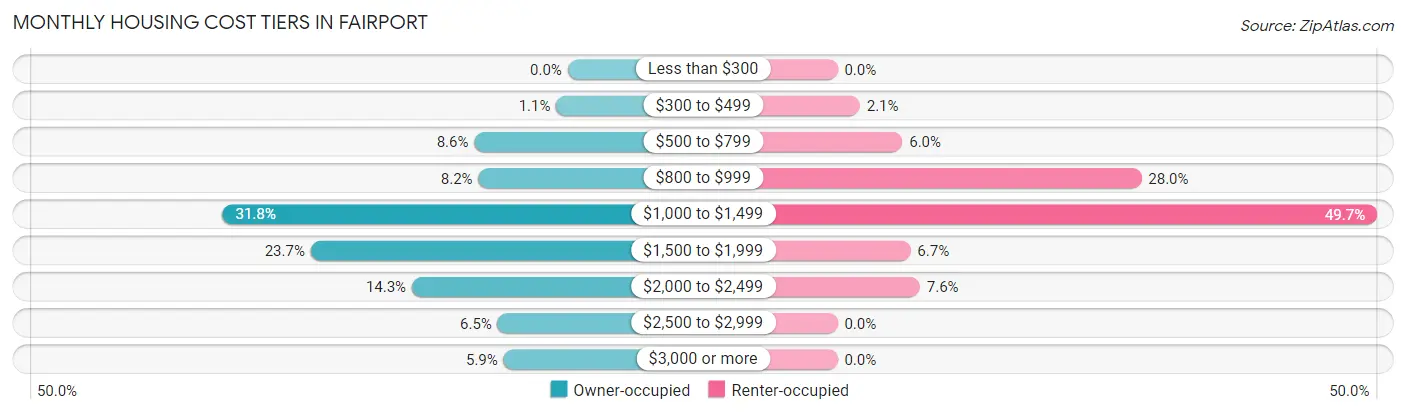
| Monthly Cost | Owner-occupied | Renter-occupied |
| Less than $300 | 0 (0.0%) | 0 (0.0%) |
| $300 to $499 | 19 (1.1%) | 19 (2.1%) |
| $500 to $799 | 156 (8.6%) | 55 (6.0%) |
| $800 to $999 | 149 (8.2%) | 258 (28.0%) |
| $1,000 to $1,499 | 576 (31.8%) | 458 (49.7%) |
| $1,500 to $1,999 | 429 (23.7%) | 62 (6.7%) |
| $2,000 to $2,499 | 260 (14.3%) | 70 (7.6%) |
| $2,500 to $2,999 | 117 (6.5%) | 0 (0.0%) |
| $3,000 or more | 107 (5.9%) | 0 (0.0%) |
| Total | 1,813 (100.0%) | 922 (100.0%) |
Physical Housing Characteristics in Fairport
Housing Structures in Fairport
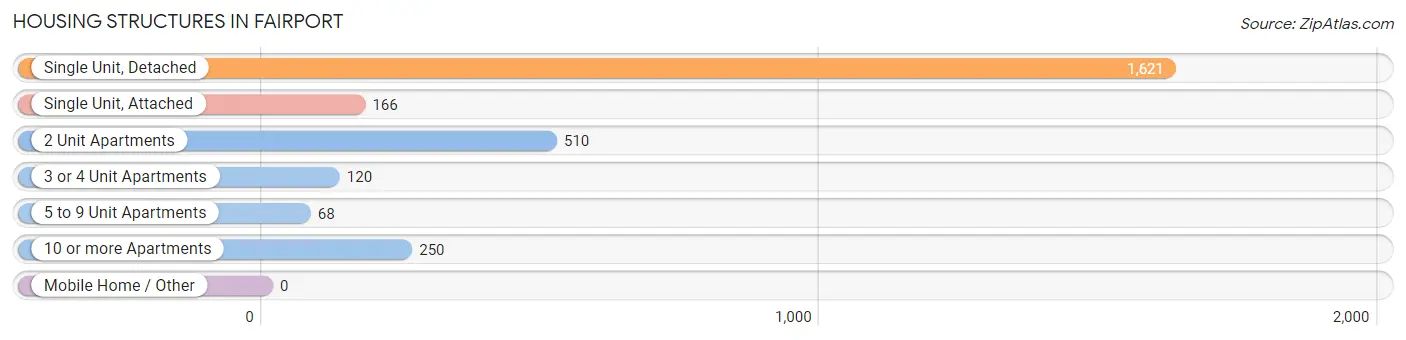
| Structure Type | # Housing Units | % Housing Units |
| Single Unit, Detached | 1,621 | 59.3% |
| Single Unit, Attached | 166 | 6.1% |
| 2 Unit Apartments | 510 | 18.6% |
| 3 or 4 Unit Apartments | 120 | 4.4% |
| 5 to 9 Unit Apartments | 68 | 2.5% |
| 10 or more Apartments | 250 | 9.1% |
| Mobile Home / Other | 0 | 0.0% |
| Total | 2,735 | 100.0% |
Housing Structures by Occupancy in Fairport
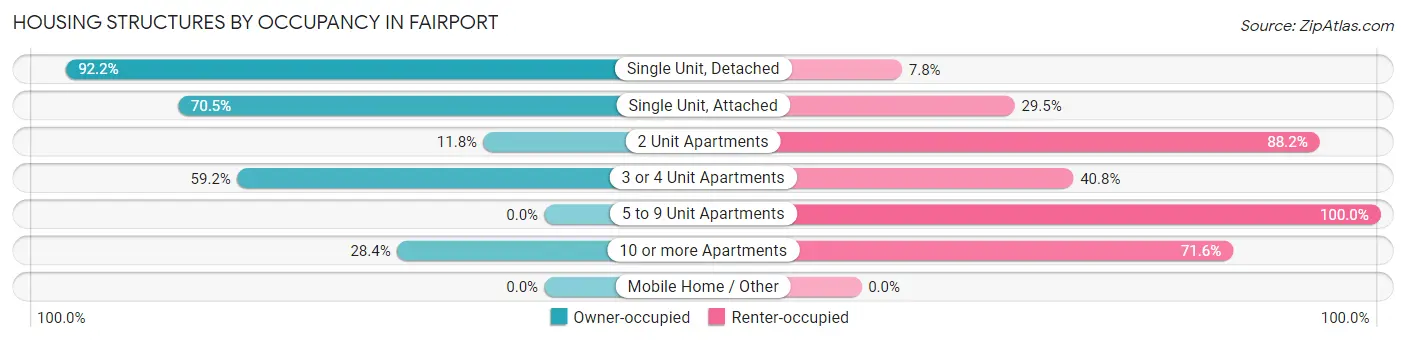
| Structure Type | Owner-occupied | Renter-occupied |
| Single Unit, Detached | 1,494 (92.2%) | 127 (7.8%) |
| Single Unit, Attached | 117 (70.5%) | 49 (29.5%) |
| 2 Unit Apartments | 60 (11.8%) | 450 (88.2%) |
| 3 or 4 Unit Apartments | 71 (59.2%) | 49 (40.8%) |
| 5 to 9 Unit Apartments | 0 (0.0%) | 68 (100.0%) |
| 10 or more Apartments | 71 (28.4%) | 179 (71.6%) |
| Mobile Home / Other | 0 (0.0%) | 0 (0.0%) |
| Total | 1,813 (66.3%) | 922 (33.7%) |
Housing Structures by Number of Rooms in Fairport
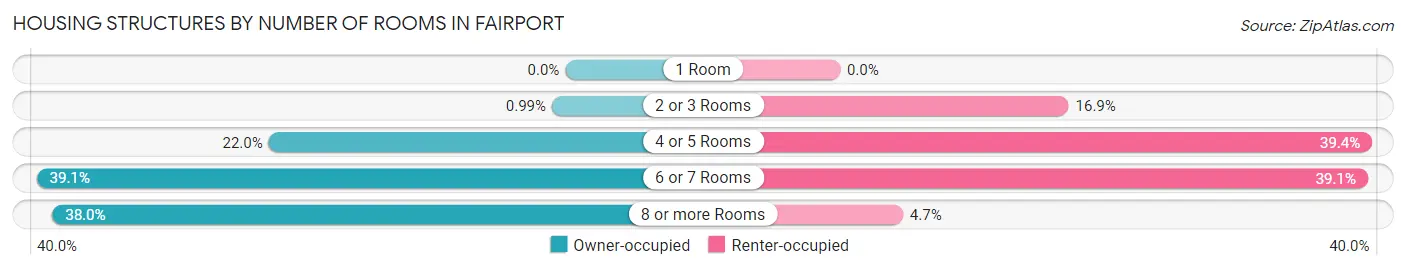
| Number of Rooms | Owner-occupied | Renter-occupied |
| 1 Room | 0 (0.0%) | 0 (0.0%) |
| 2 or 3 Rooms | 18 (1.0%) | 156 (16.9%) |
| 4 or 5 Rooms | 398 (22.0%) | 363 (39.4%) |
| 6 or 7 Rooms | 709 (39.1%) | 360 (39.1%) |
| 8 or more Rooms | 688 (38.0%) | 43 (4.7%) |
| Total | 1,813 (100.0%) | 922 (100.0%) |
Housing Structure by Heating Type in Fairport
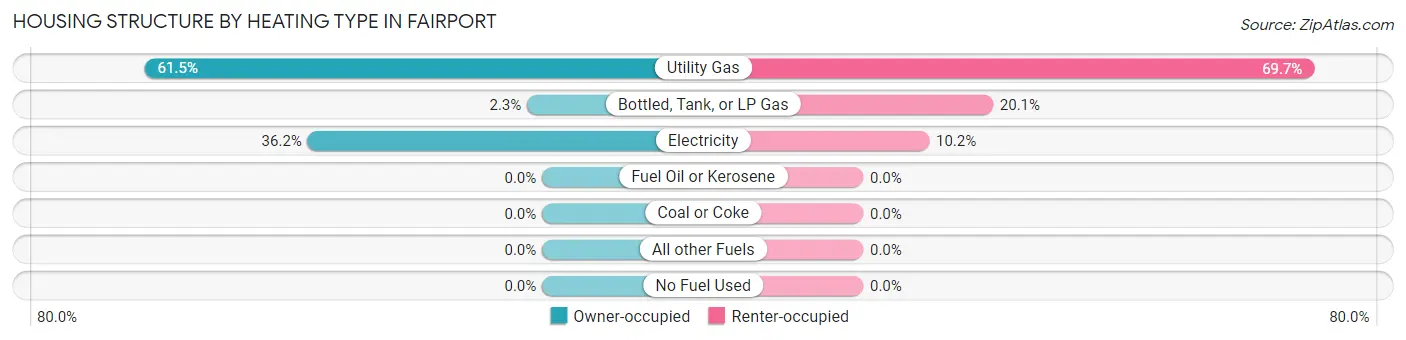
| Heating Type | Owner-occupied | Renter-occupied |
| Utility Gas | 1,114 (61.5%) | 643 (69.7%) |
| Bottled, Tank, or LP Gas | 42 (2.3%) | 185 (20.1%) |
| Electricity | 657 (36.2%) | 94 (10.2%) |
| Fuel Oil or Kerosene | 0 (0.0%) | 0 (0.0%) |
| Coal or Coke | 0 (0.0%) | 0 (0.0%) |
| All other Fuels | 0 (0.0%) | 0 (0.0%) |
| No Fuel Used | 0 (0.0%) | 0 (0.0%) |
| Total | 1,813 (100.0%) | 922 (100.0%) |
Household Vehicle Usage in Fairport
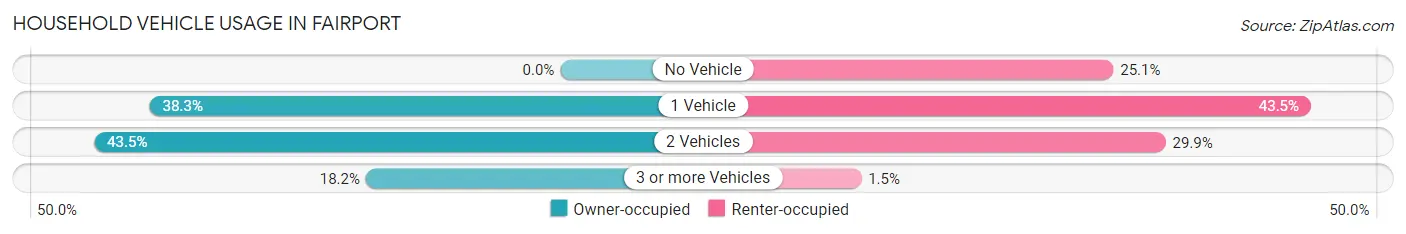
| Vehicles per Household | Owner-occupied | Renter-occupied |
| No Vehicle | 0 (0.0%) | 231 (25.1%) |
| 1 Vehicle | 695 (38.3%) | 401 (43.5%) |
| 2 Vehicles | 789 (43.5%) | 276 (29.9%) |
| 3 or more Vehicles | 329 (18.1%) | 14 (1.5%) |
| Total | 1,813 (100.0%) | 922 (100.0%) |
Real Estate & Mortgages in Fairport
Real Estate and Mortgage Overview in Fairport
| Characteristic | Without Mortgage | With Mortgage |
| Housing Units | 647 | 1,166 |
| Median Property Value | $258,700 | $254,100 |
| Median Household Income | $93,750 | $436 |
| Monthly Housing Costs | $1,044 | $107 |
| Real Estate Taxes | $8,894 | $16 |
Property Value by Mortgage Status in Fairport
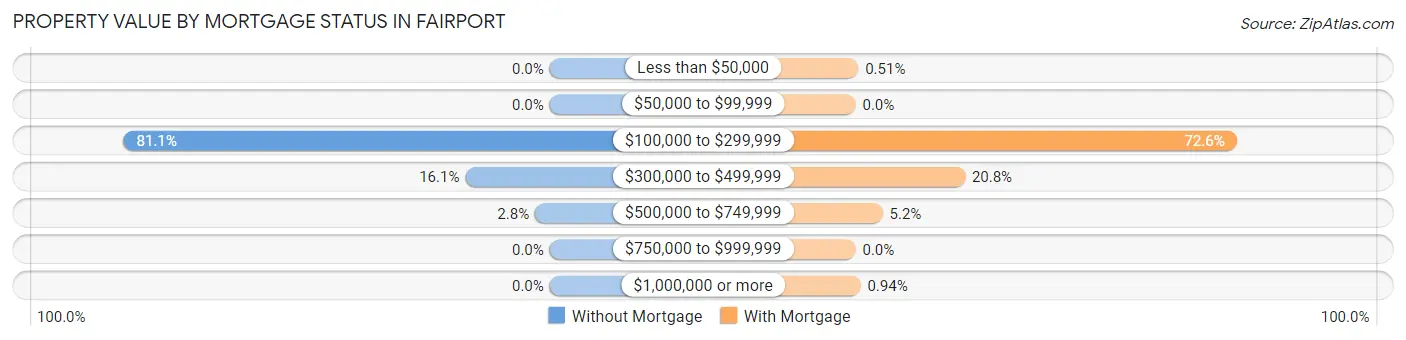
| Property Value | Without Mortgage | With Mortgage |
| Less than $50,000 | 0 (0.0%) | 6 (0.5%) |
| $50,000 to $99,999 | 0 (0.0%) | 0 (0.0%) |
| $100,000 to $299,999 | 525 (81.1%) | 846 (72.6%) |
| $300,000 to $499,999 | 104 (16.1%) | 243 (20.8%) |
| $500,000 to $749,999 | 18 (2.8%) | 60 (5.1%) |
| $750,000 to $999,999 | 0 (0.0%) | 0 (0.0%) |
| $1,000,000 or more | 0 (0.0%) | 11 (0.9%) |
| Total | 647 (100.0%) | 1,166 (100.0%) |
Household Income by Mortgage Status in Fairport
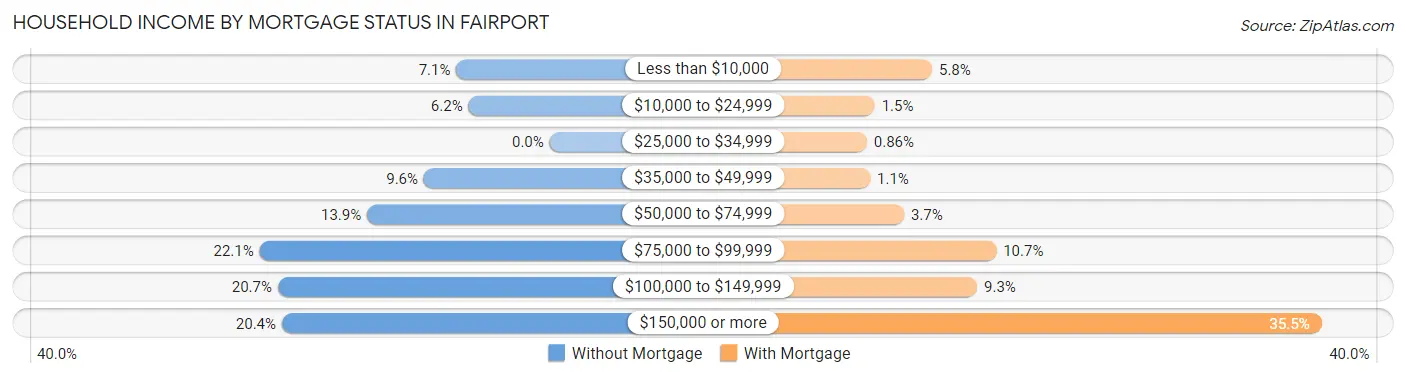
| Household Income | Without Mortgage | With Mortgage |
| Less than $10,000 | 46 (7.1%) | 68 (5.8%) |
| $10,000 to $24,999 | 40 (6.2%) | 17 (1.5%) |
| $25,000 to $34,999 | 0 (0.0%) | 10 (0.9%) |
| $35,000 to $49,999 | 62 (9.6%) | 13 (1.1%) |
| $50,000 to $74,999 | 90 (13.9%) | 43 (3.7%) |
| $75,000 to $99,999 | 143 (22.1%) | 125 (10.7%) |
| $100,000 to $149,999 | 134 (20.7%) | 108 (9.3%) |
| $150,000 or more | 132 (20.4%) | 414 (35.5%) |
| Total | 647 (100.0%) | 1,166 (100.0%) |
Property Value to Household Income Ratio in Fairport
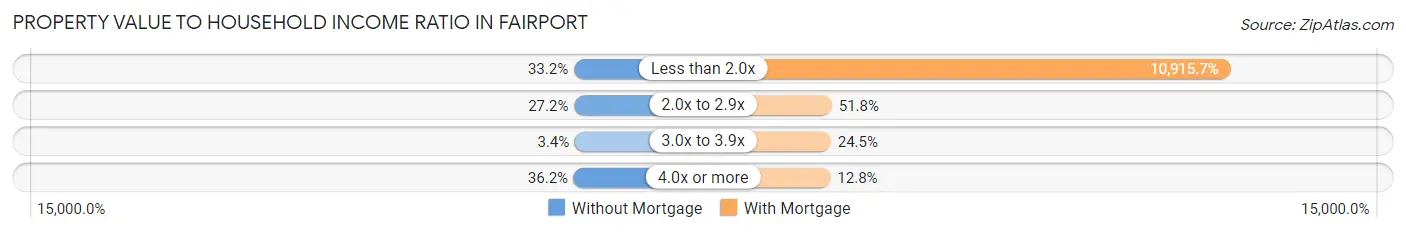
| Value-to-Income Ratio | Without Mortgage | With Mortgage |
| Less than 2.0x | 215 (33.2%) | 127,277 (10,915.7%) |
| 2.0x to 2.9x | 176 (27.2%) | 604 (51.8%) |
| 3.0x to 3.9x | 22 (3.4%) | 286 (24.5%) |
| 4.0x or more | 234 (36.2%) | 149 (12.8%) |
| Total | 647 (100.0%) | 1,166 (100.0%) |
Real Estate Taxes by Mortgage Status in Fairport
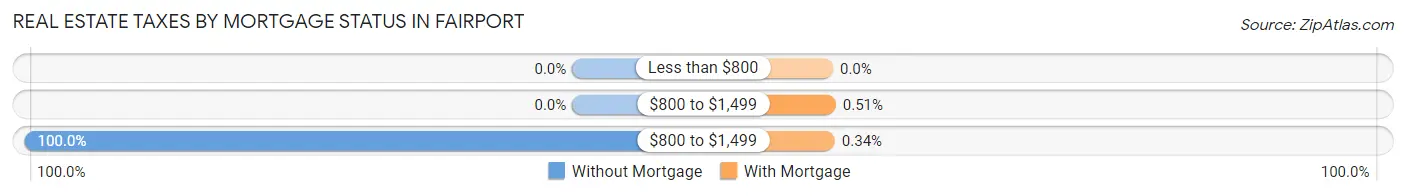
| Property Taxes | Without Mortgage | With Mortgage |
| Less than $800 | 0 (0.0%) | 0 (0.0%) |
| $800 to $1,499 | 0 (0.0%) | 6 (0.5%) |
| $800 to $1,499 | 647 (100.0%) | 4 (0.3%) |
| Total | 647 (100.0%) | 1,166 (100.0%) |
Health & Disability in Fairport
Health Insurance Coverage by Age in Fairport
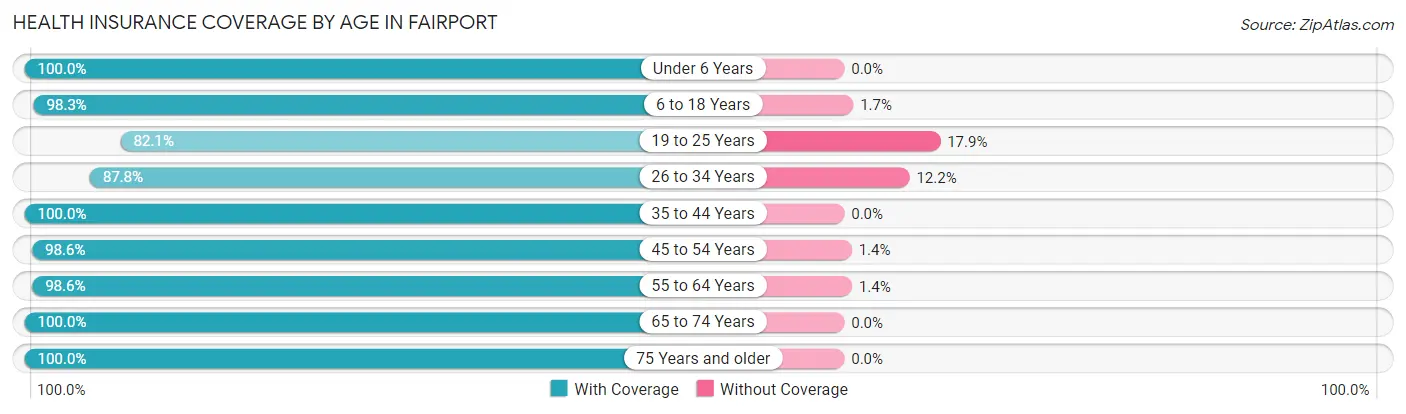
| Age Bracket | With Coverage | Without Coverage |
| Under 6 Years | 189 (100.0%) | 0 (0.0%) |
| 6 to 18 Years | 770 (98.3%) | 13 (1.7%) |
| 19 to 25 Years | 156 (82.1%) | 34 (17.9%) |
| 26 to 34 Years | 549 (87.8%) | 76 (12.2%) |
| 35 to 44 Years | 580 (100.0%) | 0 (0.0%) |
| 45 to 54 Years | 854 (98.6%) | 12 (1.4%) |
| 55 to 64 Years | 962 (98.6%) | 14 (1.4%) |
| 65 to 74 Years | 793 (100.0%) | 0 (0.0%) |
| 75 Years and older | 440 (100.0%) | 0 (0.0%) |
| Total | 5,293 (97.3%) | 149 (2.7%) |
Health Insurance Coverage by Citizenship Status in Fairport
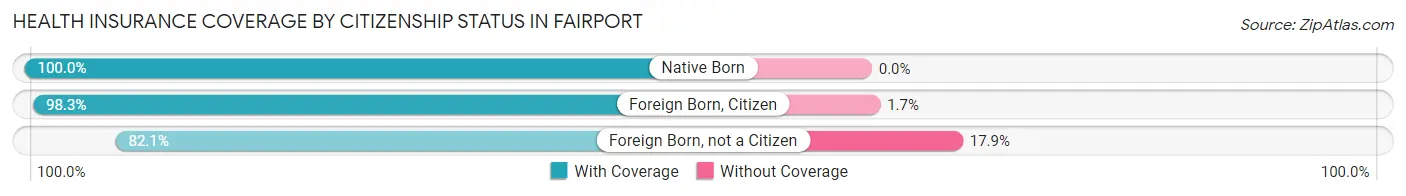
| Citizenship Status | With Coverage | Without Coverage |
| Native Born | 189 (100.0%) | 0 (0.0%) |
| Foreign Born, Citizen | 770 (98.3%) | 13 (1.7%) |
| Foreign Born, not a Citizen | 156 (82.1%) | 34 (17.9%) |
Health Insurance Coverage by Household Income in Fairport
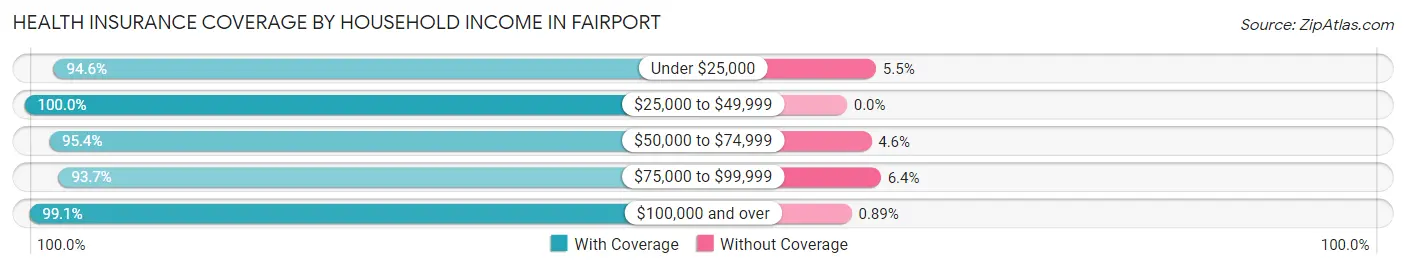
| Household Income | With Coverage | Without Coverage |
| Under $25,000 | 694 (94.6%) | 40 (5.4%) |
| $25,000 to $49,999 | 329 (100.0%) | 0 (0.0%) |
| $50,000 to $74,999 | 707 (95.4%) | 34 (4.6%) |
| $75,000 to $99,999 | 738 (93.6%) | 50 (6.4%) |
| $100,000 and over | 2,772 (99.1%) | 25 (0.9%) |
Public vs Private Health Insurance Coverage by Age in Fairport
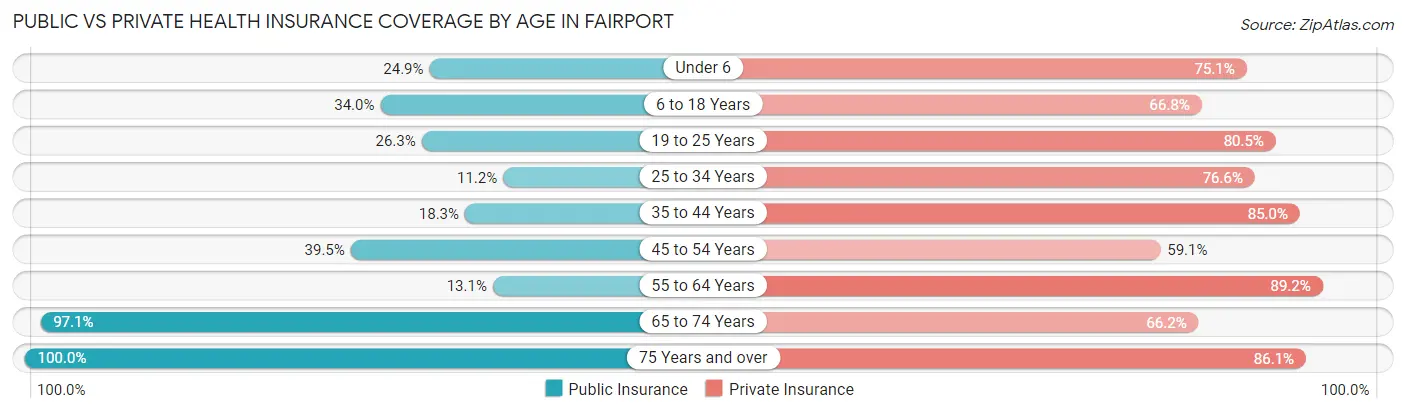
| Age Bracket | Public Insurance | Private Insurance |
| Under 6 | 47 (24.9%) | 142 (75.1%) |
| 6 to 18 Years | 266 (34.0%) | 523 (66.8%) |
| 19 to 25 Years | 50 (26.3%) | 153 (80.5%) |
| 25 to 34 Years | 70 (11.2%) | 479 (76.6%) |
| 35 to 44 Years | 106 (18.3%) | 493 (85.0%) |
| 45 to 54 Years | 342 (39.5%) | 512 (59.1%) |
| 55 to 64 Years | 128 (13.1%) | 871 (89.2%) |
| 65 to 74 Years | 770 (97.1%) | 525 (66.2%) |
| 75 Years and over | 440 (100.0%) | 379 (86.1%) |
| Total | 2,219 (40.8%) | 4,077 (74.9%) |
Disability Status by Sex by Age in Fairport
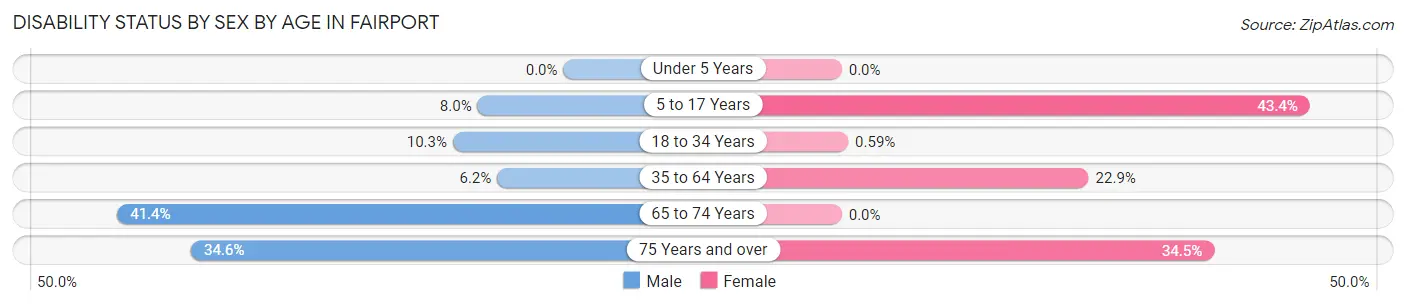
| Age Bracket | Male | Female |
| Under 5 Years | 0 (0.0%) | 0 (0.0%) |
| 5 to 17 Years | 29 (8.0%) | 155 (43.4%) |
| 18 to 34 Years | 55 (10.3%) | 2 (0.6%) |
| 35 to 64 Years | 59 (6.1%) | 335 (22.9%) |
| 65 to 74 Years | 161 (41.4%) | 0 (0.0%) |
| 75 Years and over | 66 (34.5%) | 86 (34.5%) |
Disability Class by Sex by Age in Fairport
Disability Class: Hearing Difficulty
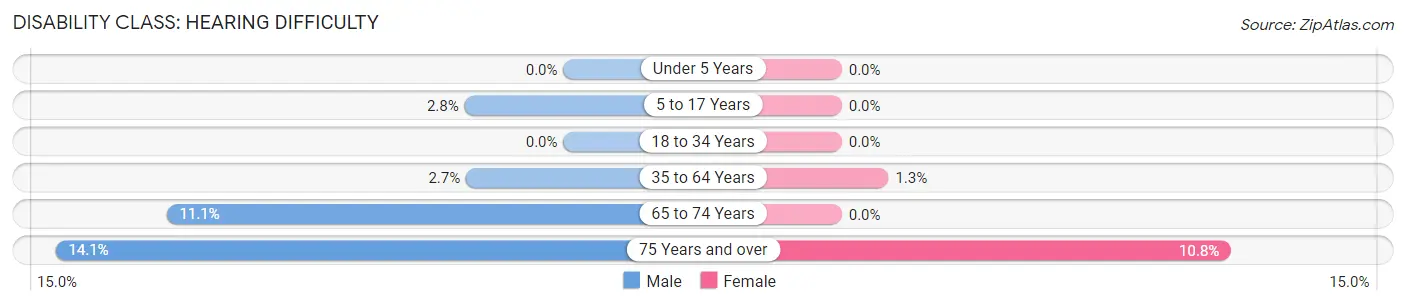
| Age Bracket | Male | Female |
| Under 5 Years | 0 (0.0%) | 0 (0.0%) |
| 5 to 17 Years | 10 (2.8%) | 0 (0.0%) |
| 18 to 34 Years | 0 (0.0%) | 0 (0.0%) |
| 35 to 64 Years | 26 (2.7%) | 19 (1.3%) |
| 65 to 74 Years | 43 (11.1%) | 0 (0.0%) |
| 75 Years and over | 27 (14.1%) | 27 (10.8%) |
Disability Class: Vision Difficulty
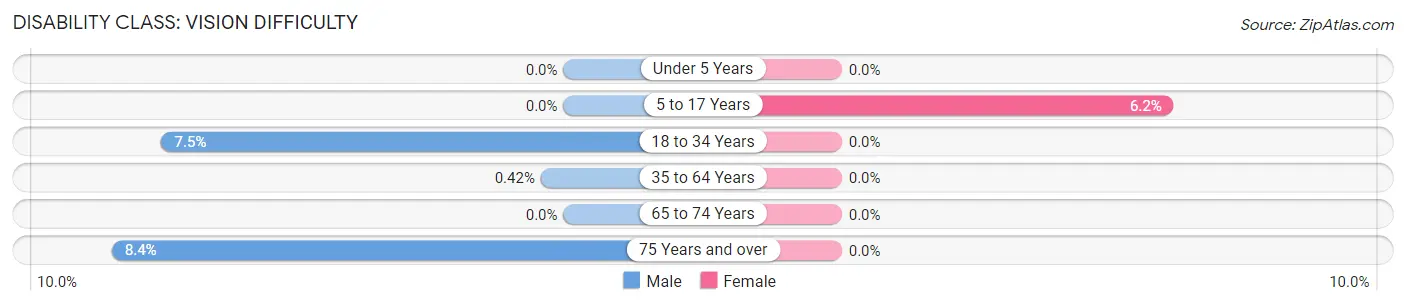
| Age Bracket | Male | Female |
| Under 5 Years | 0 (0.0%) | 0 (0.0%) |
| 5 to 17 Years | 0 (0.0%) | 22 (6.2%) |
| 18 to 34 Years | 40 (7.5%) | 0 (0.0%) |
| 35 to 64 Years | 4 (0.4%) | 0 (0.0%) |
| 65 to 74 Years | 0 (0.0%) | 0 (0.0%) |
| 75 Years and over | 16 (8.4%) | 0 (0.0%) |
Disability Class: Cognitive Difficulty
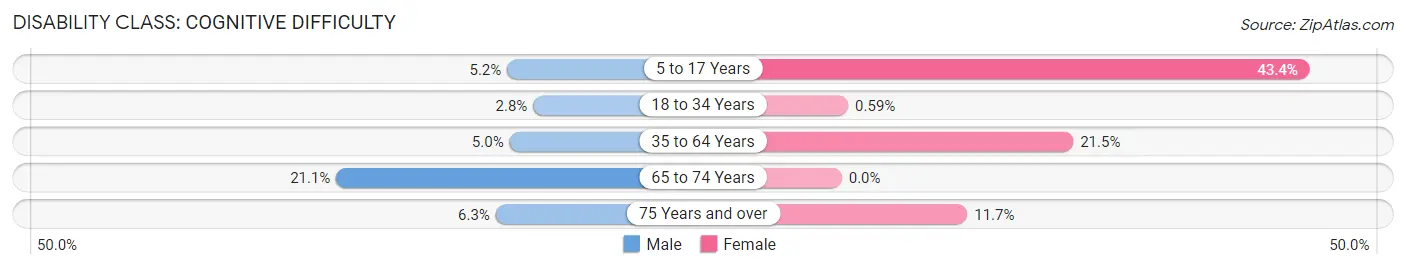
| Age Bracket | Male | Female |
| 5 to 17 Years | 19 (5.2%) | 155 (43.4%) |
| 18 to 34 Years | 15 (2.8%) | 2 (0.6%) |
| 35 to 64 Years | 48 (5.0%) | 314 (21.5%) |
| 65 to 74 Years | 82 (21.1%) | 0 (0.0%) |
| 75 Years and over | 12 (6.3%) | 29 (11.7%) |
Disability Class: Ambulatory Difficulty
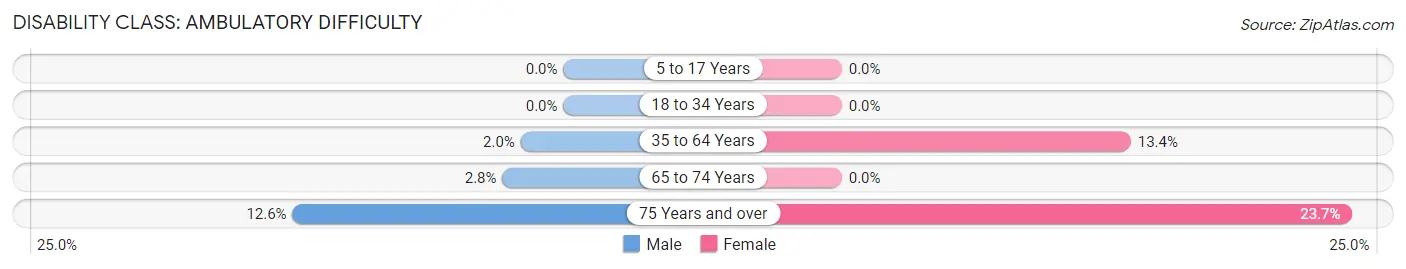
| Age Bracket | Male | Female |
| 5 to 17 Years | 0 (0.0%) | 0 (0.0%) |
| 18 to 34 Years | 0 (0.0%) | 0 (0.0%) |
| 35 to 64 Years | 19 (2.0%) | 196 (13.4%) |
| 65 to 74 Years | 11 (2.8%) | 0 (0.0%) |
| 75 Years and over | 24 (12.6%) | 59 (23.7%) |
Disability Class: Self-Care Difficulty
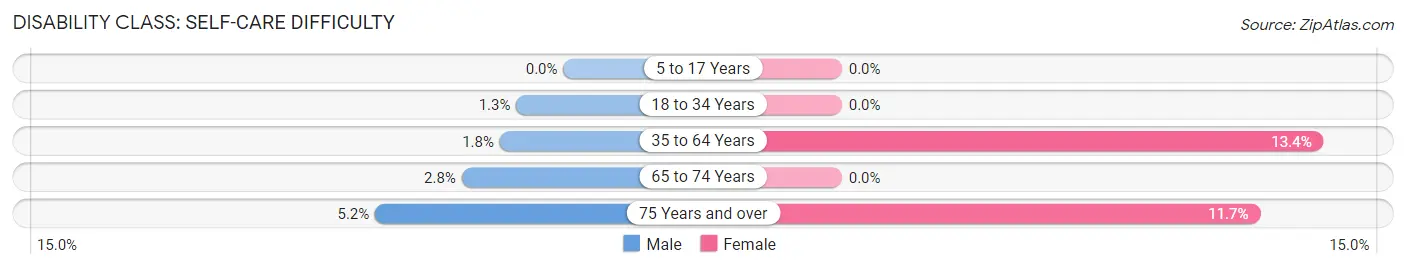
| Age Bracket | Male | Female |
| 5 to 17 Years | 0 (0.0%) | 0 (0.0%) |
| 18 to 34 Years | 7 (1.3%) | 0 (0.0%) |
| 35 to 64 Years | 17 (1.8%) | 196 (13.4%) |
| 65 to 74 Years | 11 (2.8%) | 0 (0.0%) |
| 75 Years and over | 10 (5.2%) | 29 (11.7%) |
Technology Access in Fairport
Computing Device Access in Fairport
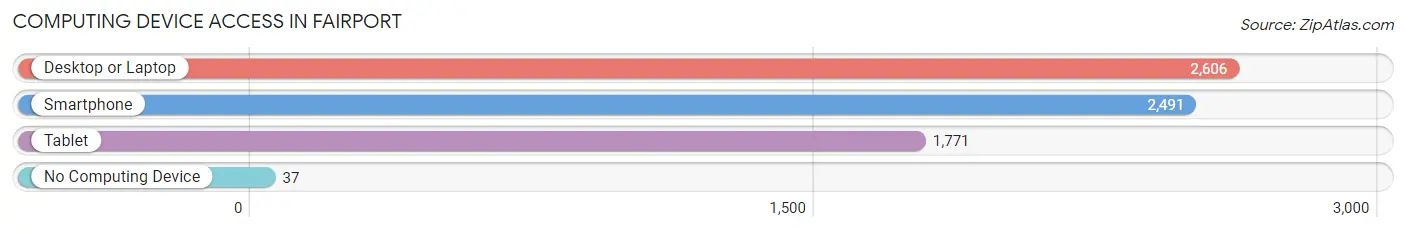
| Device Type | # Households | % Households |
| Desktop or Laptop | 2,606 | 95.3% |
| Smartphone | 2,491 | 91.1% |
| Tablet | 1,771 | 64.7% |
| No Computing Device | 37 | 1.3% |
| Total | 2,735 | 100.0% |
Internet Access in Fairport
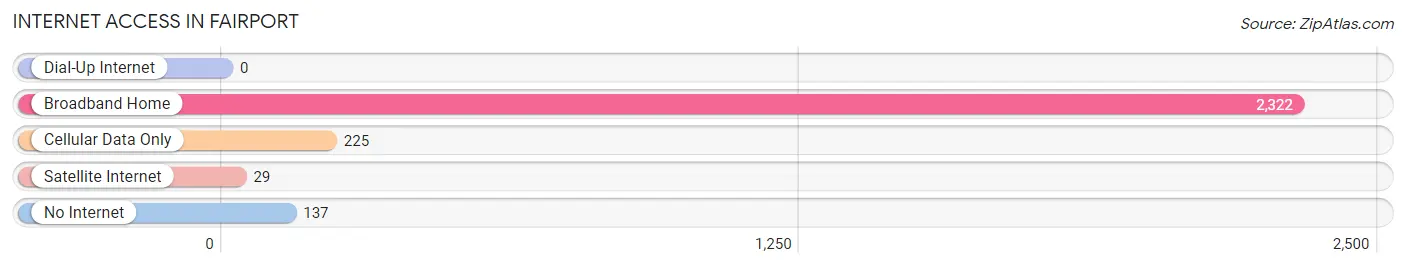
| Internet Type | # Households | % Households |
| Dial-Up Internet | 0 | 0.0% |
| Broadband Home | 2,322 | 84.9% |
| Cellular Data Only | 225 | 8.2% |
| Satellite Internet | 29 | 1.1% |
| No Internet | 137 | 5.0% |
| Total | 2,735 | 100.0% |
Fairport Summary
Fairport, NY is a village located in the town of Perinton, in Monroe County, New York. It is situated on the Erie Canal, and is a suburb of Rochester. The village has a population of 5,353 as of the 2010 census.
History
The area that is now Fairport was originally inhabited by the Seneca people, who were part of the Iroquois Confederacy. The first European settlers arrived in the area in the late 1700s, and the village was officially founded in 1867. The village was named after Fairport Harbor, which was located on the Erie Canal.
The Erie Canal was a major factor in the growth of Fairport. The canal provided a transportation route for goods and people, and the village became a hub for commerce and industry. The canal also attracted many immigrants to the area, and the village became a melting pot of cultures.
In the late 1800s, the village was home to several factories, including a paper mill, a flour mill, and a brewery. The village also had a thriving business district, with several stores and restaurants.
Geography
Fairport is located in the Finger Lakes region of New York, about 10 miles east of Rochester. The village is situated on the Erie Canal, and is bordered by the towns of Perinton, Pittsford, and Penfield. The village is located on the south bank of the canal, and is surrounded by rolling hills and farmland.
The village has a total area of 1.3 square miles, all of which is land. The terrain is mostly flat, with some hills in the northern part of the village. The highest point in the village is located at the intersection of Main Street and Church Street, which is about 400 feet above sea level.
Economy
Fairport’s economy is largely based on tourism and retail. The village is home to several restaurants, shops, and other businesses. The village also has a thriving arts and culture scene, with several galleries, theaters, and music venues.
The village is also home to several large employers, including Wegmans, a regional grocery store chain, and Xerox, a global technology company. The village is also home to several smaller businesses, including a number of professional services firms.
Demographics
As of the 2010 census, the village had a population of 5,353. The population is predominantly white (93.3%), with small percentages of African American (2.2%), Asian (1.7%), and Hispanic (1.6%) residents. The median household income is $68,945, and the median home value is $219,400.
The village is served by the Fairport Central School District, which includes four elementary schools, one middle school, and one high school. The village is also home to several private schools, including the Fairport Baptist Academy and the Fairport Montessori School.
Conclusion
Fairport, NY is a village located in the town of Perinton, in Monroe County, New York. It is situated on the Erie Canal, and is a suburb of Rochester. The village has a population of 5,353 as of the 2010 census. The village has a long history, and has been a hub for commerce and industry since the late 1800s. The village is home to several large employers, and has a thriving tourism and retail sector. The population is predominantly white, with small percentages of African American, Asian, and Hispanic residents. The village is served by the Fairport Central School District, and is home to several private schools.
Common Questions
What is Per Capita Income in Fairport?
Per Capita income in Fairport is $56,066.
What is the Median Family Income in Fairport?
Median Family Income in Fairport is $97,099.
What is the Median Household income in Fairport?
Median Household Income in Fairport is $95,354.
What is Income or Wage Gap in Fairport?
Income or Wage Gap in Fairport is 35.7%.
Women in Fairport earn 64.3 cents for every dollar earned by a man.
What is Inequality or Gini Index in Fairport?
Inequality or Gini Index in Fairport is 0.41.
What is the Total Population of Fairport?
Total Population of Fairport is 5,442.
What is the Total Male Population of Fairport?
Total Male Population of Fairport is 2,492.
What is the Total Female Population of Fairport?
Total Female Population of Fairport is 2,950.
What is the Ratio of Males per 100 Females in Fairport?
There are 84.47 Males per 100 Females in Fairport.
What is the Ratio of Females per 100 Males in Fairport?
There are 118.38 Females per 100 Males in Fairport.
What is the Median Population Age in Fairport?
Median Population Age in Fairport is 48.8 Years.
What is the Average Family Size in Fairport
Average Family Size in Fairport is 2.4 People.
What is the Average Household Size in Fairport
Average Household Size in Fairport is 2.0 People.
How Large is the Labor Force in Fairport?
There are 2,796 People in the Labor Forcein in Fairport.
What is the Percentage of People in the Labor Force in Fairport?
59.9% of People are in the Labor Force in Fairport.
What is the Unemployment Rate in Fairport?
Unemployment Rate in Fairport is 4.5%.