Elmira, NY Map & Demographics
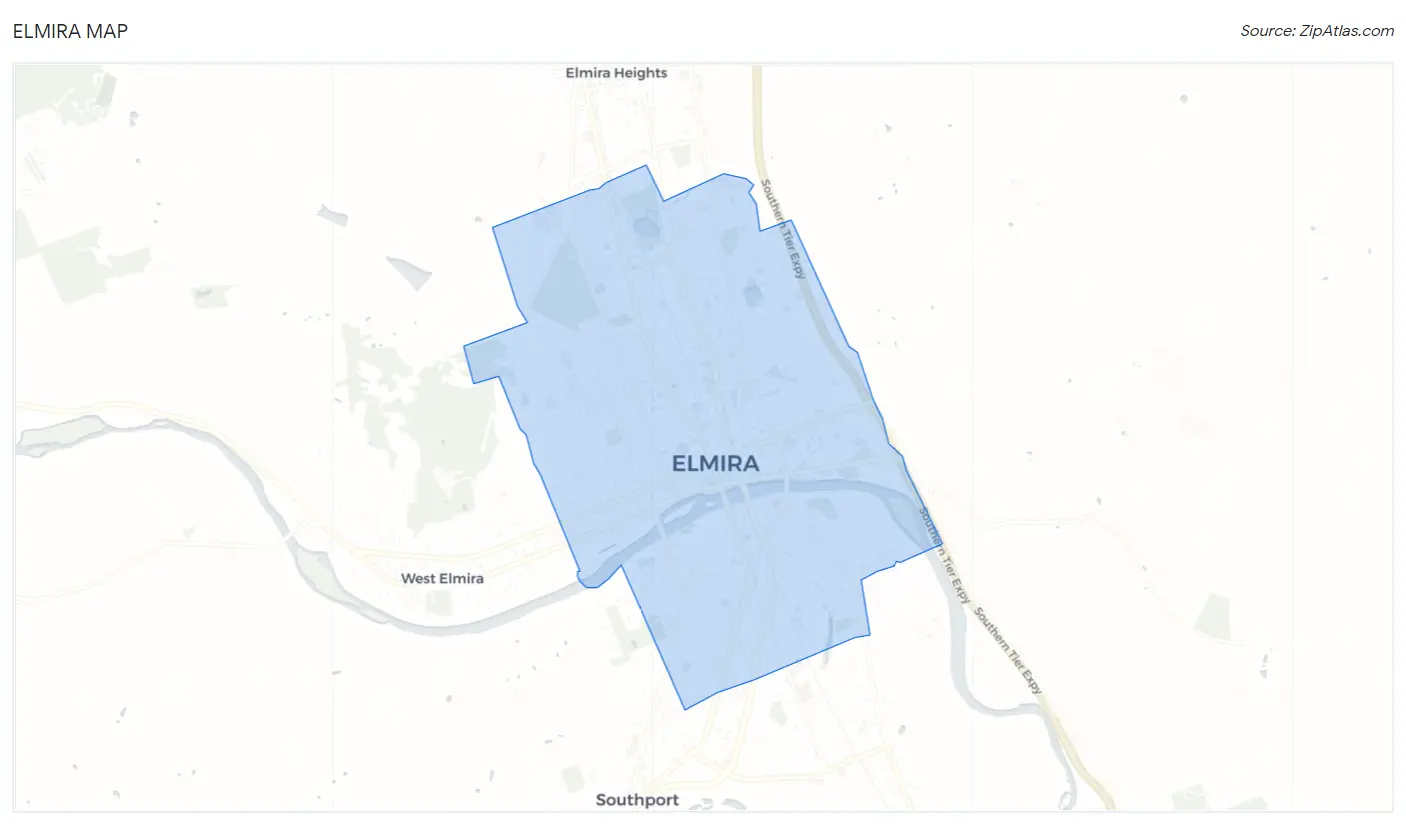
Elmira Map
Elmira Overview
$22,259
PER CAPITA INCOME
$51,610
AVG FAMILY INCOME
$41,073
AVG HOUSEHOLD INCOME
24.4%
WAGE / INCOME GAP [ % ]
75.6¢/ $1
WAGE / INCOME GAP [ $ ]
$9,900
FAMILY INCOME DEFICIT
0.46
INEQUALITY / GINI INDEX
26,494
TOTAL POPULATION
13,143
MALE POPULATION
13,351
FEMALE POPULATION
98.44
MALES / 100 FEMALES
101.58
FEMALES / 100 MALES
35.9
MEDIAN AGE
3.0
AVG FAMILY SIZE
2.3
AVG HOUSEHOLD SIZE
11,386
LABOR FORCE [ PEOPLE ]
54.2%
PERCENT IN LABOR FORCE
9.8%
UNEMPLOYMENT RATE
Elmira Area Codes
Income in Elmira
Income Overview in Elmira
Per Capita Income in Elmira is $22,259, while median incomes of families and households are $51,610 and $41,073 respectively.
| Characteristic | Number | Measure |
| Per Capita Income | 26,494 | $22,259 |
| Median Family Income | 5,571 | $51,610 |
| Mean Family Income | 5,571 | $65,549 |
| Median Household Income | 10,313 | $41,073 |
| Mean Household Income | 10,313 | $56,177 |
| Income Deficit | 5,571 | $9,900 |
| Wage / Income Gap (%) | 26,494 | 24.43% |
| Wage / Income Gap ($) | 26,494 | 75.57¢ per $1 |
| Gini / Inequality Index | 26,494 | 0.46 |
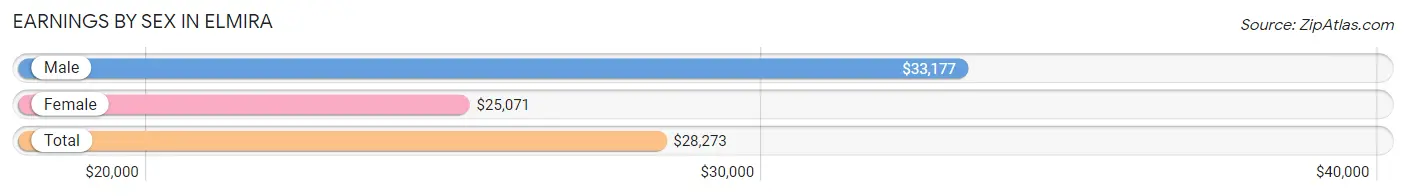
Earnings by Sex in Elmira
Average Earnings in Elmira are $28,273, $33,177 for men and $25,071 for women, a difference of 24.4%.
| Sex | Number | Average Earnings |
| Male | 5,702 (48.1%) | $33,177 |
| Female | 6,140 (51.8%) | $25,071 |
| Total | 11,842 (100.0%) | $28,273 |
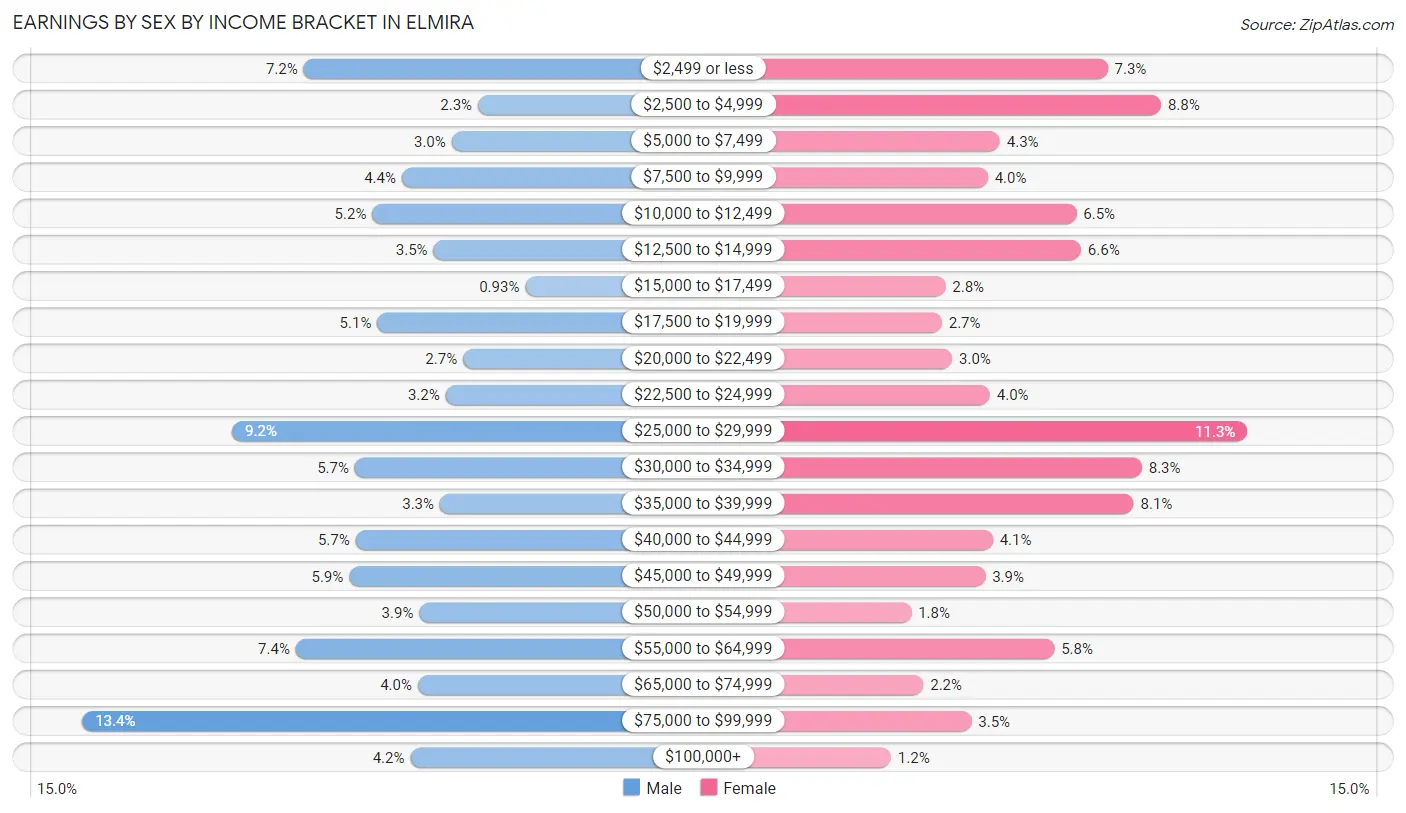
Earnings by Sex by Income Bracket in Elmira
The most common earnings brackets in Elmira are $75,000 to $99,999 for men (763 | 13.4%) and $25,000 to $29,999 for women (691 | 11.3%).
| Income | Male | Female |
| $2,499 or less | 408 (7.2%) | 450 (7.3%) |
| $2,500 to $4,999 | 129 (2.3%) | 542 (8.8%) |
| $5,000 to $7,499 | 171 (3.0%) | 264 (4.3%) |
| $7,500 to $9,999 | 251 (4.4%) | 243 (4.0%) |
| $10,000 to $12,499 | 298 (5.2%) | 396 (6.5%) |
| $12,500 to $14,999 | 200 (3.5%) | 404 (6.6%) |
| $15,000 to $17,499 | 53 (0.9%) | 170 (2.8%) |
| $17,500 to $19,999 | 290 (5.1%) | 164 (2.7%) |
| $20,000 to $22,499 | 153 (2.7%) | 182 (3.0%) |
| $22,500 to $24,999 | 181 (3.2%) | 247 (4.0%) |
| $25,000 to $29,999 | 523 (9.2%) | 691 (11.3%) |
| $30,000 to $34,999 | 326 (5.7%) | 509 (8.3%) |
| $35,000 to $39,999 | 190 (3.3%) | 495 (8.1%) |
| $40,000 to $44,999 | 325 (5.7%) | 252 (4.1%) |
| $45,000 to $49,999 | 335 (5.9%) | 239 (3.9%) |
| $50,000 to $54,999 | 223 (3.9%) | 111 (1.8%) |
| $55,000 to $64,999 | 421 (7.4%) | 358 (5.8%) |
| $65,000 to $74,999 | 225 (4.0%) | 132 (2.1%) |
| $75,000 to $99,999 | 763 (13.4%) | 215 (3.5%) |
| $100,000+ | 237 (4.2%) | 76 (1.2%) |
| Total | 5,702 (100.0%) | 6,140 (100.0%) |
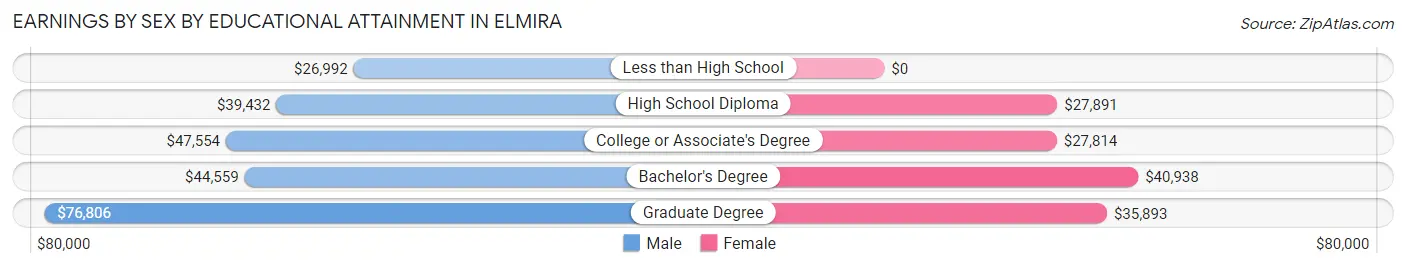
Earnings by Sex by Educational Attainment in Elmira
Average earnings in Elmira are $42,184 for men and $28,741 for women, a difference of 31.9%. Men with an educational attainment of graduate degree enjoy the highest average annual earnings of $76,806, while those with less than high school education earn the least with $26,992. Women with an educational attainment of bachelor's degree earn the most with the average annual earnings of $40,938, while those with college or associate's degree education have the smallest earnings of $27,814.
| Educational Attainment | Male Income | Female Income |
| Less than High School | $26,992 | $0 |
| High School Diploma | $39,432 | $27,891 |
| College or Associate's Degree | $47,554 | $27,814 |
| Bachelor's Degree | $44,559 | $40,938 |
| Graduate Degree | $76,806 | $35,893 |
| Total | $42,184 | $28,741 |
Family Income in Elmira
Family Income Brackets in Elmira
According to the Elmira family income data, there are 958 families falling into the $100,000 to $149,999 income range, which is the most common income bracket and makes up 17.2% of all families. Conversely, the $200,000+ income bracket is the least frequent group with only 89 families (1.6%) belonging to this category.
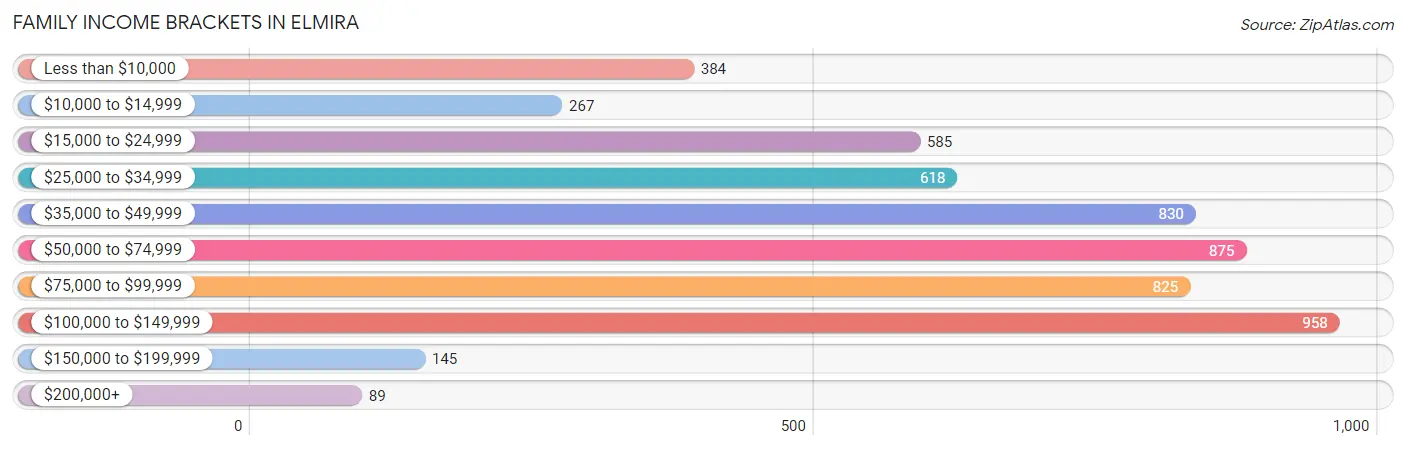
| Income Bracket | # Families | % Families |
| Less than $10,000 | 384 | 6.9% |
| $10,000 to $14,999 | 267 | 4.8% |
| $15,000 to $24,999 | 585 | 10.5% |
| $25,000 to $34,999 | 618 | 11.1% |
| $35,000 to $49,999 | 830 | 14.9% |
| $50,000 to $74,999 | 875 | 15.7% |
| $75,000 to $99,999 | 825 | 14.8% |
| $100,000 to $149,999 | 958 | 17.2% |
| $150,000 to $199,999 | 145 | 2.6% |
| $200,000+ | 89 | 1.6% |
Family Income by Famaliy Size in Elmira
4-person families (817 | 14.7%) account for the highest median family income in Elmira with $76,225 per family, while 2-person families (2,643 | 47.4%) have the highest median income of $24,300 per family member.
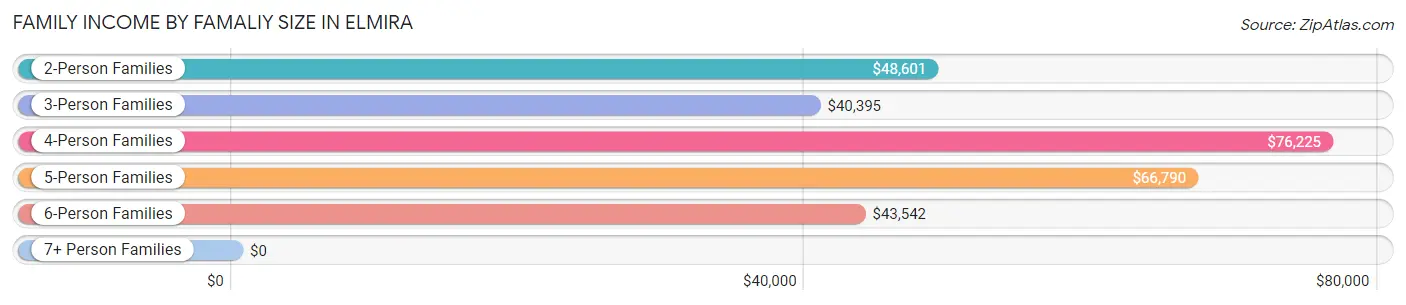
| Income Bracket | # Families | Median Income |
| 2-Person Families | 2,643 (47.4%) | $48,601 |
| 3-Person Families | 1,352 (24.3%) | $40,395 |
| 4-Person Families | 817 (14.7%) | $76,225 |
| 5-Person Families | 491 (8.8%) | $66,790 |
| 6-Person Families | 169 (3.0%) | $43,542 |
| 7+ Person Families | 99 (1.8%) | $0 |
| Total | 5,571 (100.0%) | $51,610 |
Family Income by Number of Earners in Elmira
The median family income in Elmira is $51,610, with families comprising 3+ earners (364) having the highest median family income of $97,143, while families with no earners (1,219) have the lowest median family income of $26,767, accounting for 6.5% and 21.9% of families, respectively.
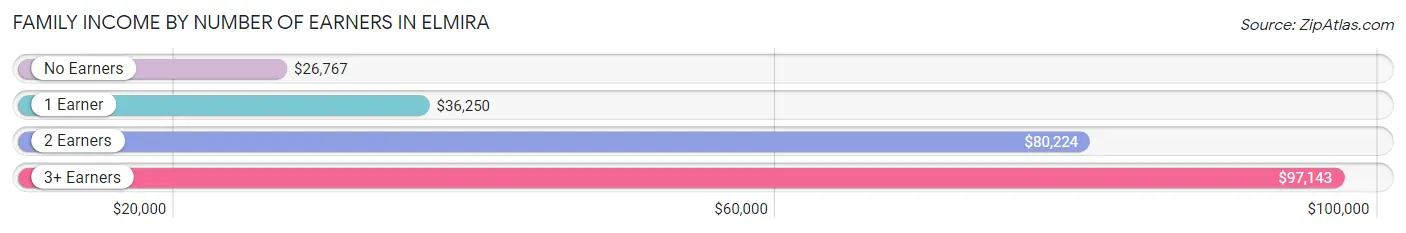
| Number of Earners | # Families | Median Income |
| No Earners | 1,219 (21.9%) | $26,767 |
| 1 Earner | 2,012 (36.1%) | $36,250 |
| 2 Earners | 1,976 (35.5%) | $80,224 |
| 3+ Earners | 364 (6.5%) | $97,143 |
| Total | 5,571 (100.0%) | $51,610 |
Household Income in Elmira
Household Income Brackets in Elmira
With 1,681 households falling in the category, the $50,000 to $74,999 income range is the most frequent in Elmira, accounting for 16.3% of all households. In contrast, only 124 households (1.2%) fall into the $200,000+ income bracket, making it the least populous group.
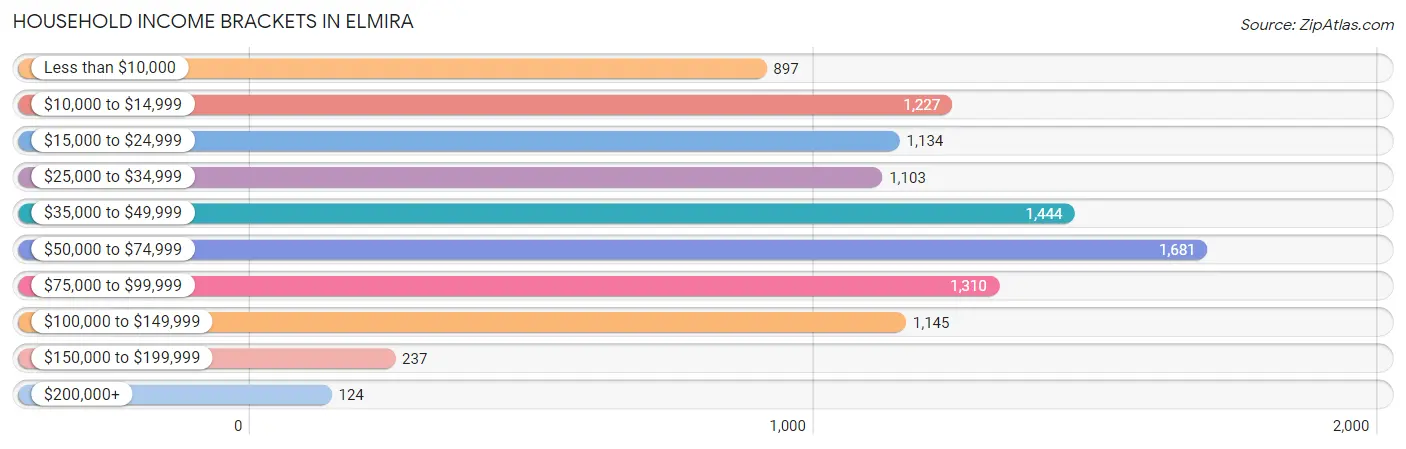
| Income Bracket | # Households | % Households |
| Less than $10,000 | 897 | 8.7% |
| $10,000 to $14,999 | 1,227 | 11.9% |
| $15,000 to $24,999 | 1,134 | 11.0% |
| $25,000 to $34,999 | 1,103 | 10.7% |
| $35,000 to $49,999 | 1,444 | 14.0% |
| $50,000 to $74,999 | 1,681 | 16.3% |
| $75,000 to $99,999 | 1,310 | 12.7% |
| $100,000 to $149,999 | 1,145 | 11.1% |
| $150,000 to $199,999 | 237 | 2.3% |
| $200,000+ | 124 | 1.2% |
Household Income by Householder Age in Elmira
The median household income in Elmira is $41,073, with the highest median household income of $52,147 found in the 25 to 44 years age bracket for the primary householder. A total of 3,542 households (34.4%) fall into this category. Meanwhile, the 15 to 24 years age bracket for the primary householder has the lowest median household income of $28,083, with 397 households (3.8%) in this group.
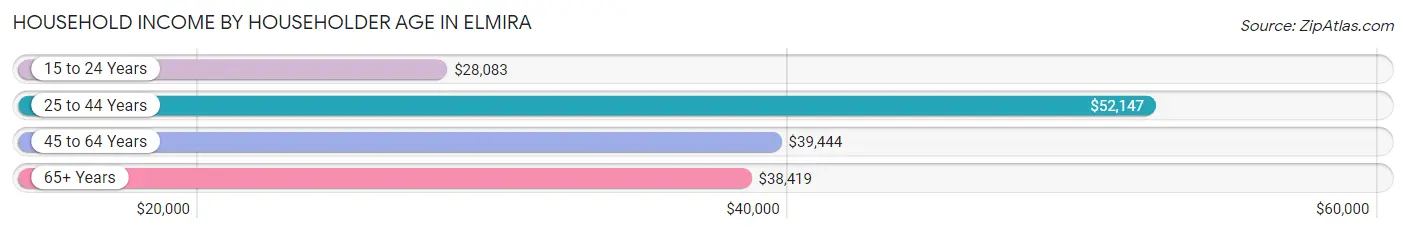
| Income Bracket | # Households | Median Income |
| 15 to 24 Years | 397 (3.8%) | $28,083 |
| 25 to 44 Years | 3,542 (34.4%) | $52,147 |
| 45 to 64 Years | 3,832 (37.2%) | $39,444 |
| 65+ Years | 2,542 (24.6%) | $38,419 |
| Total | 10,313 (100.0%) | $41,073 |
Poverty in Elmira
Income Below Poverty by Sex and Age in Elmira
With 26.8% poverty level for males and 28.4% for females among the residents of Elmira, 12 to 14 year old males and 5 year old females are the most vulnerable to poverty, with 265 males (48.4%) and 154 females (67.0%) in their respective age groups living below the poverty level.
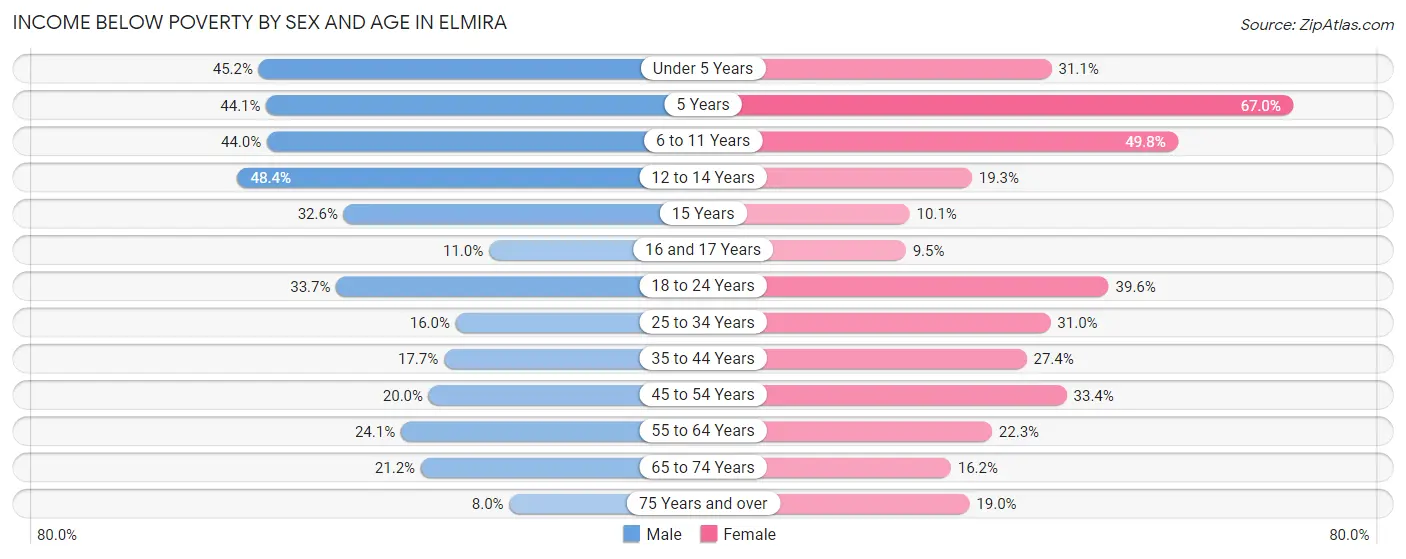
| Age Bracket | Male | Female |
| Under 5 Years | 246 (45.2%) | 218 (31.1%) |
| 5 Years | 86 (44.1%) | 154 (67.0%) |
| 6 to 11 Years | 557 (44.0%) | 481 (49.8%) |
| 12 to 14 Years | 265 (48.4%) | 112 (19.3%) |
| 15 Years | 45 (32.6%) | 13 (10.1%) |
| 16 and 17 Years | 16 (11.0%) | 30 (9.5%) |
| 18 to 24 Years | 407 (33.7%) | 338 (39.6%) |
| 25 to 34 Years | 293 (16.0%) | 522 (31.0%) |
| 35 to 44 Years | 214 (17.7%) | 465 (27.4%) |
| 45 to 54 Years | 252 (20.0%) | 463 (33.4%) |
| 55 to 64 Years | 360 (24.1%) | 348 (22.3%) |
| 65 to 74 Years | 202 (21.1%) | 254 (16.2%) |
| 75 Years and over | 23 (8.0%) | 159 (19.0%) |
| Total | 2,966 (26.8%) | 3,557 (28.4%) |
Income Above Poverty by Sex and Age in Elmira
According to the poverty statistics in Elmira, males aged 75 years and over and females aged 16 and 17 years are the age groups that are most secure financially, with 92.0% of males and 90.5% of females in these age groups living above the poverty line.
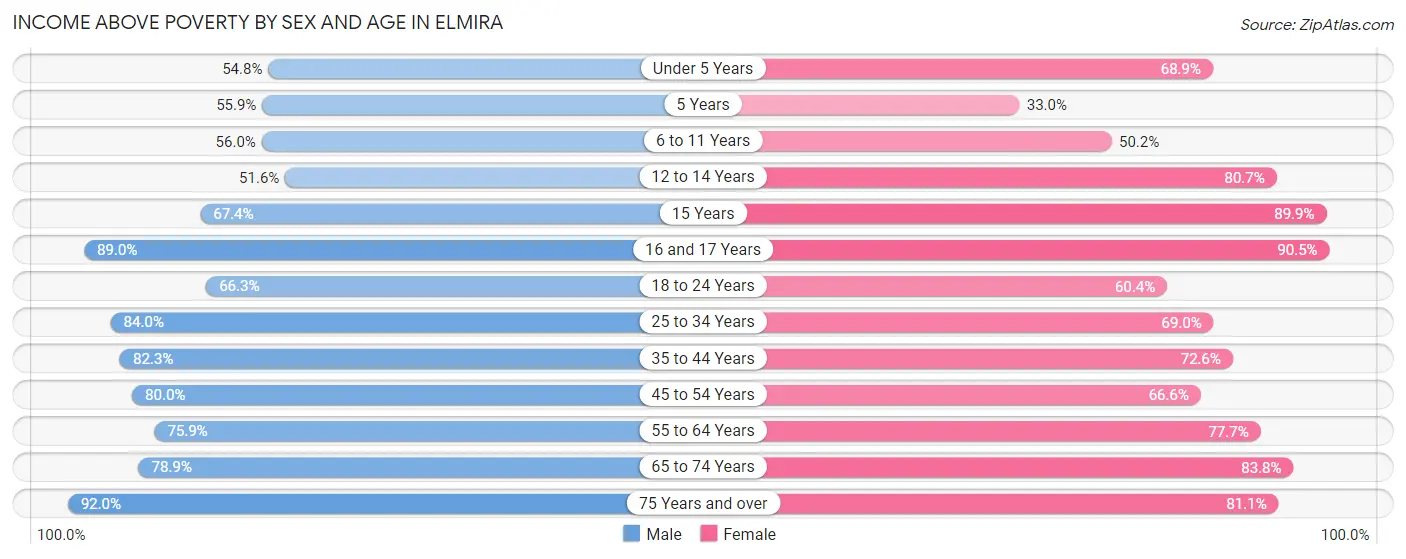
| Age Bracket | Male | Female |
| Under 5 Years | 298 (54.8%) | 482 (68.9%) |
| 5 Years | 109 (55.9%) | 76 (33.0%) |
| 6 to 11 Years | 709 (56.0%) | 484 (50.2%) |
| 12 to 14 Years | 283 (51.6%) | 468 (80.7%) |
| 15 Years | 93 (67.4%) | 116 (89.9%) |
| 16 and 17 Years | 129 (89.0%) | 286 (90.5%) |
| 18 to 24 Years | 800 (66.3%) | 515 (60.4%) |
| 25 to 34 Years | 1,542 (84.0%) | 1,163 (69.0%) |
| 35 to 44 Years | 994 (82.3%) | 1,230 (72.6%) |
| 45 to 54 Years | 1,010 (80.0%) | 924 (66.6%) |
| 55 to 64 Years | 1,133 (75.9%) | 1,213 (77.7%) |
| 65 to 74 Years | 753 (78.8%) | 1,315 (83.8%) |
| 75 Years and over | 264 (92.0%) | 680 (81.0%) |
| Total | 8,117 (73.2%) | 8,952 (71.6%) |
Income Below Poverty Among Married-Couple Families in Elmira
The poverty statistics for married-couple families in Elmira show that 6.5% or 205 of the total 3,177 families live below the poverty line. Families with 5 or more children have the highest poverty rate of 25.6%, comprising of 10 families. On the other hand, families with no children have the lowest poverty rate of 5.0%, which includes 93 families.
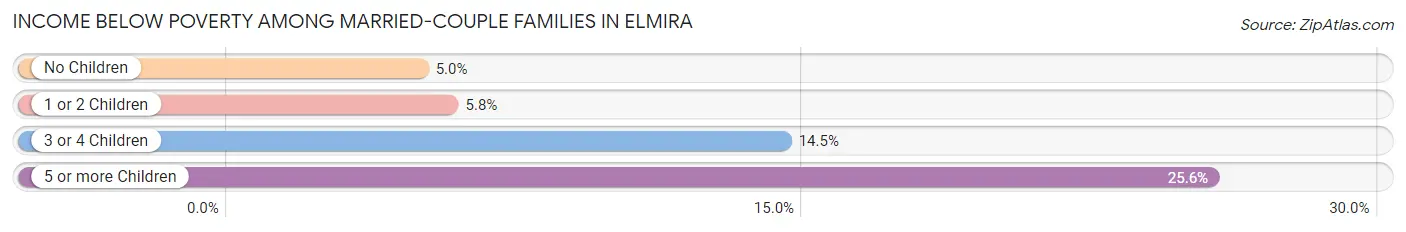
| Children | Above Poverty | Below Poverty |
| No Children | 1,775 (95.0%) | 93 (5.0%) |
| 1 or 2 Children | 884 (94.2%) | 54 (5.8%) |
| 3 or 4 Children | 284 (85.5%) | 48 (14.5%) |
| 5 or more Children | 29 (74.4%) | 10 (25.6%) |
| Total | 2,972 (93.5%) | 205 (6.5%) |
Income Below Poverty Among Single-Parent Households in Elmira
According to the poverty data in Elmira, 33.6% or 149 single-father households and 44.6% or 869 single-mother households are living below the poverty line. Among single-father households, those with 3 or 4 children have the highest poverty rate, with 27 households (100.0%) experiencing poverty. Likewise, among single-mother households, those with 5 or more children have the highest poverty rate, with 72 households (84.7%) falling below the poverty line.
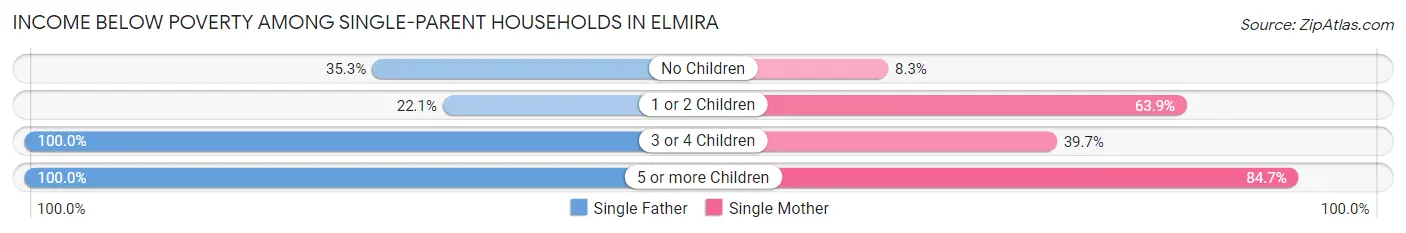
| Children | Single Father | Single Mother |
| No Children | 36 (35.3%) | 52 (8.3%) |
| 1 or 2 Children | 65 (22.1%) | 670 (63.9%) |
| 3 or 4 Children | 27 (100.0%) | 75 (39.7%) |
| 5 or more Children | 21 (100.0%) | 72 (84.7%) |
| Total | 149 (33.6%) | 869 (44.6%) |
Income Below Poverty Among Married-Couple vs Single-Parent Households in Elmira
The poverty data for Elmira shows that 205 of the married-couple family households (6.5%) and 1,018 of the single-parent households (42.5%) are living below the poverty level. Within the married-couple family households, those with 5 or more children have the highest poverty rate, with 10 households (25.6%) falling below the poverty line. Among the single-parent households, those with 5 or more children have the highest poverty rate, with 93 household (87.7%) living below poverty.
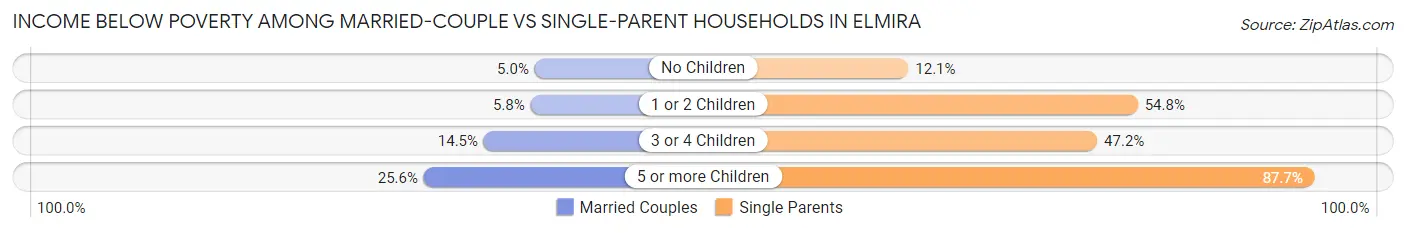
| Children | Married-Couple Families | Single-Parent Households |
| No Children | 93 (5.0%) | 88 (12.0%) |
| 1 or 2 Children | 54 (5.8%) | 735 (54.8%) |
| 3 or 4 Children | 48 (14.5%) | 102 (47.2%) |
| 5 or more Children | 10 (25.6%) | 93 (87.7%) |
| Total | 205 (6.5%) | 1,018 (42.5%) |
Race in Elmira
The most populous races in Elmira are White / Caucasian (20,052 | 75.7%), Black / African American (2,849 | 10.7%), and Two or more Races (2,531 | 9.6%).
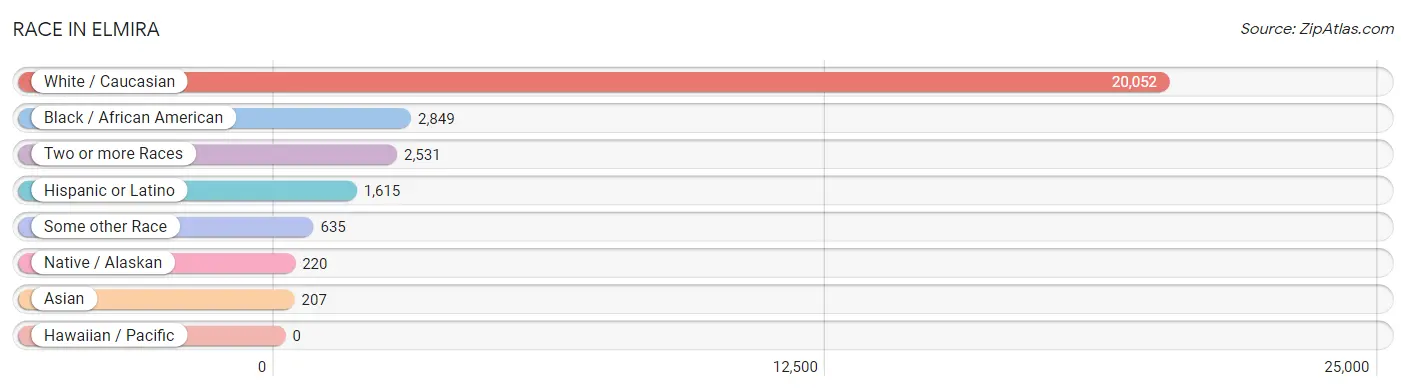
| Race | # Population | % Population |
| Asian | 207 | 0.8% |
| Black / African American | 2,849 | 10.7% |
| Hawaiian / Pacific | 0 | 0.0% |
| Hispanic or Latino | 1,615 | 6.1% |
| Native / Alaskan | 220 | 0.8% |
| White / Caucasian | 20,052 | 75.7% |
| Two or more Races | 2,531 | 9.6% |
| Some other Race | 635 | 2.4% |
| Total | 26,494 | 100.0% |
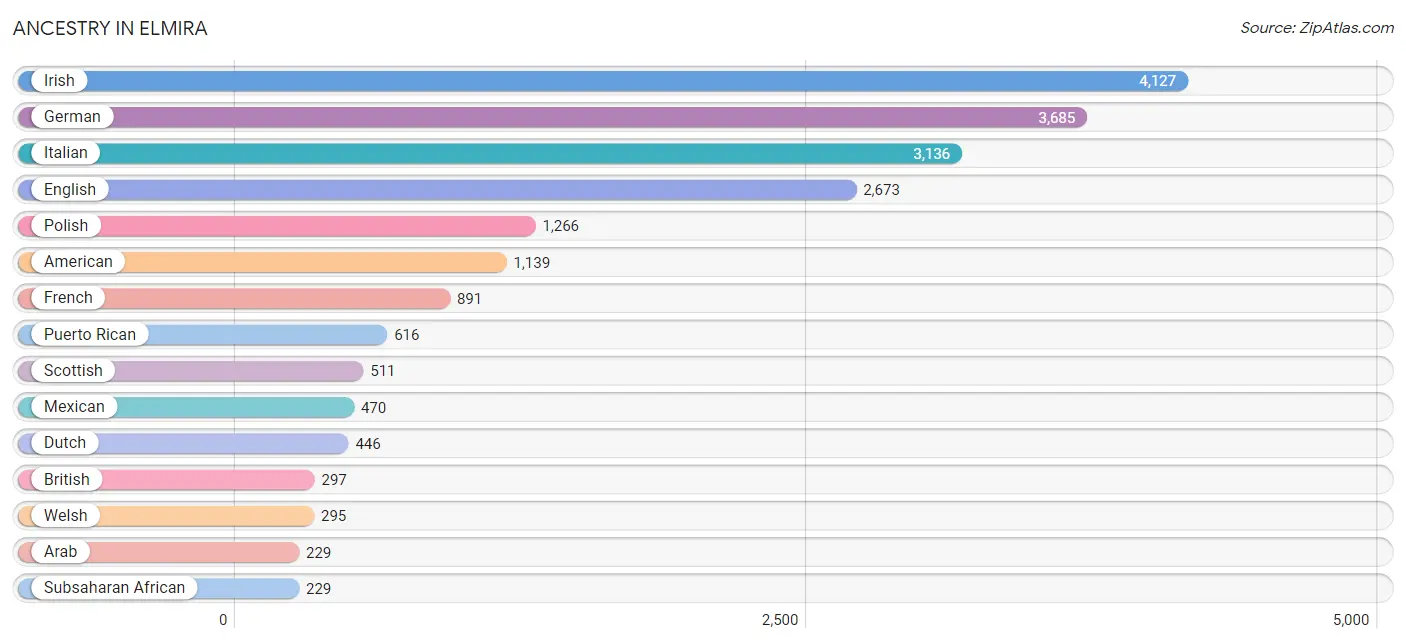
Ancestry in Elmira
The most populous ancestries reported in Elmira are Irish (4,127 | 15.6%), German (3,685 | 13.9%), Italian (3,136 | 11.8%), English (2,673 | 10.1%), and Polish (1,266 | 4.8%), together accounting for 56.2% of all Elmira residents.
| Ancestry | # Population | % Population |
| African | 210 | 0.8% |
| Albanian | 12 | 0.1% |
| American | 1,139 | 4.3% |
| Apache | 2 | 0.0% |
| Arab | 229 | 0.9% |
| Armenian | 191 | 0.7% |
| Austrian | 37 | 0.1% |
| Blackfeet | 4 | 0.0% |
| British | 297 | 1.1% |
| British West Indian | 7 | 0.0% |
| Burmese | 28 | 0.1% |
| Canadian | 14 | 0.1% |
| Central American | 23 | 0.1% |
| Central American Indian | 18 | 0.1% |
| Cherokee | 7 | 0.0% |
| Colombian | 37 | 0.1% |
| Croatian | 21 | 0.1% |
| Cuban | 18 | 0.1% |
| Czech | 31 | 0.1% |
| Delaware | 9 | 0.0% |
| Dominican | 94 | 0.4% |
| Dutch | 446 | 1.7% |
| Eastern European | 31 | 0.1% |
| Ecuadorian | 67 | 0.3% |
| English | 2,673 | 10.1% |
| Estonian | 24 | 0.1% |
| European | 150 | 0.6% |
| French | 891 | 3.4% |
| French American Indian | 8 | 0.0% |
| French Canadian | 215 | 0.8% |
| German | 3,685 | 13.9% |
| German Russian | 16 | 0.1% |
| Greek | 29 | 0.1% |
| Guatemalan | 3 | 0.0% |
| Haitian | 7 | 0.0% |
| Hungarian | 119 | 0.4% |
| Icelander | 11 | 0.0% |
| Indian (Asian) | 219 | 0.8% |
| Irish | 4,127 | 15.6% |
| Iroquois | 6 | 0.0% |
| Israeli | 9 | 0.0% |
| Italian | 3,136 | 11.8% |
| Jamaican | 169 | 0.6% |
| Korean | 33 | 0.1% |
| Latvian | 11 | 0.0% |
| Lebanese | 204 | 0.8% |
| Mexican | 470 | 1.8% |
| Mexican American Indian | 187 | 0.7% |
| Navajo | 19 | 0.1% |
| Nicaraguan | 1 | 0.0% |
| Northern European | 39 | 0.2% |
| Norwegian | 39 | 0.2% |
| Panamanian | 7 | 0.0% |
| Pennsylvania German | 181 | 0.7% |
| Polish | 1,266 | 4.8% |
| Portuguese | 7 | 0.0% |
| Puerto Rican | 616 | 2.3% |
| Russian | 223 | 0.8% |
| Salvadoran | 12 | 0.1% |
| Scandinavian | 17 | 0.1% |
| Scotch-Irish | 62 | 0.2% |
| Scottish | 511 | 1.9% |
| Sioux | 6 | 0.0% |
| Slavic | 12 | 0.1% |
| Slovak | 37 | 0.1% |
| South American | 104 | 0.4% |
| Spaniard | 11 | 0.0% |
| Spanish | 29 | 0.1% |
| Sri Lankan | 8 | 0.0% |
| Subsaharan African | 229 | 0.9% |
| Swedish | 195 | 0.7% |
| Swiss | 23 | 0.1% |
| Syrian | 10 | 0.0% |
| Thai | 55 | 0.2% |
| Trinidadian and Tobagonian | 3 | 0.0% |
| Ukrainian | 216 | 0.8% |
| Welsh | 295 | 1.1% |
| West Indian | 9 | 0.0% |
| Yugoslavian | 3 | 0.0% | View All 79 Rows |
Immigrants in Elmira
The most numerous immigrant groups reported in Elmira came from Latin America (305 | 1.1%), Caribbean (219 | 0.8%), Asia (183 | 0.7%), Jamaica (143 | 0.5%), and Europe (132 | 0.5%), together accounting for 3.7% of all Elmira residents.
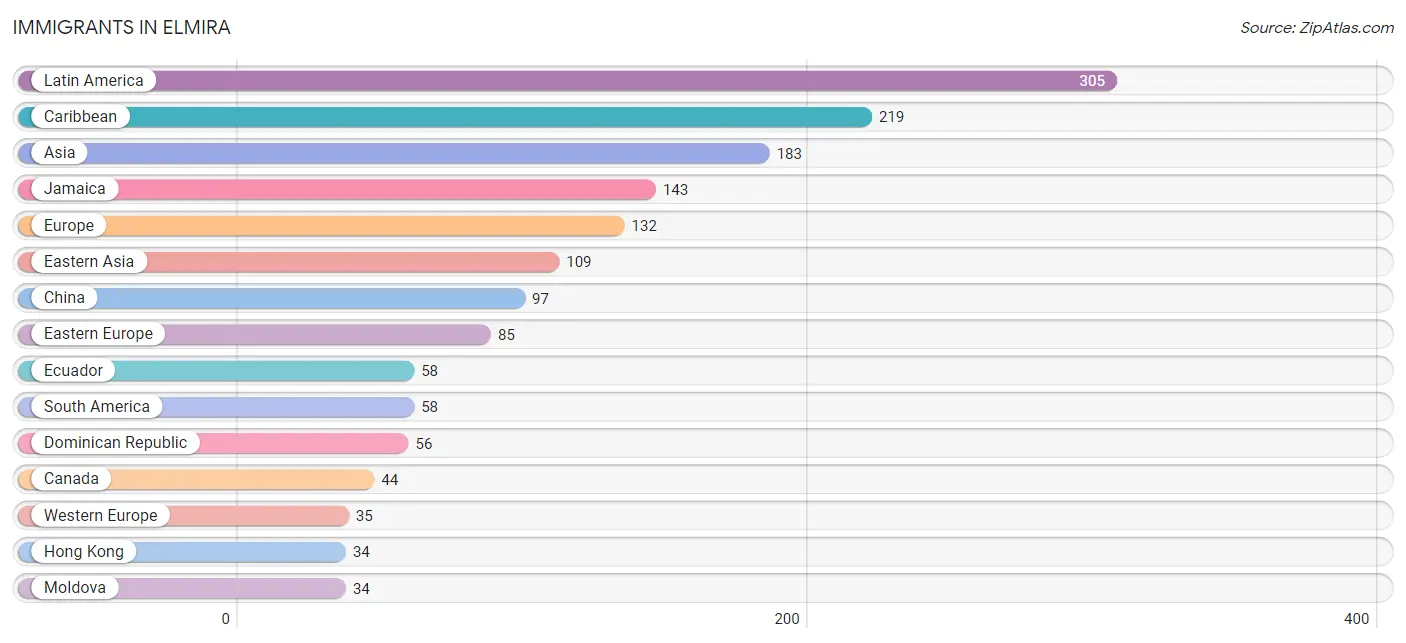
| Immigration Origin | # Population | % Population |
| Africa | 5 | 0.0% |
| Albania | 5 | 0.0% |
| Asia | 183 | 0.7% |
| Canada | 44 | 0.2% |
| Caribbean | 219 | 0.8% |
| Central America | 28 | 0.1% |
| China | 97 | 0.4% |
| Cuba | 12 | 0.1% |
| Dominican Republic | 56 | 0.2% |
| Eastern Asia | 109 | 0.4% |
| Eastern Europe | 85 | 0.3% |
| Ecuador | 58 | 0.2% |
| El Salvador | 9 | 0.0% |
| Europe | 132 | 0.5% |
| Germany | 18 | 0.1% |
| Guatemala | 10 | 0.0% |
| Hong Kong | 34 | 0.1% |
| Italy | 12 | 0.1% |
| Jamaica | 143 | 0.5% |
| Korea | 12 | 0.1% |
| Latin America | 305 | 1.1% |
| Mexico | 9 | 0.0% |
| Moldova | 34 | 0.1% |
| Philippines | 25 | 0.1% |
| Russia | 17 | 0.1% |
| South America | 58 | 0.2% |
| South Central Asia | 25 | 0.1% |
| South Eastern Asia | 25 | 0.1% |
| Southern Europe | 12 | 0.1% |
| Ukraine | 29 | 0.1% |
| Western Asia | 24 | 0.1% |
| Western Europe | 35 | 0.1% | View All 32 Rows |
Sex and Age in Elmira
Sex and Age in Elmira
The most populous age groups in Elmira are 25 to 29 Years (1,174 | 8.9%) for men and 65 to 69 Years (1,051 | 7.9%) for women.
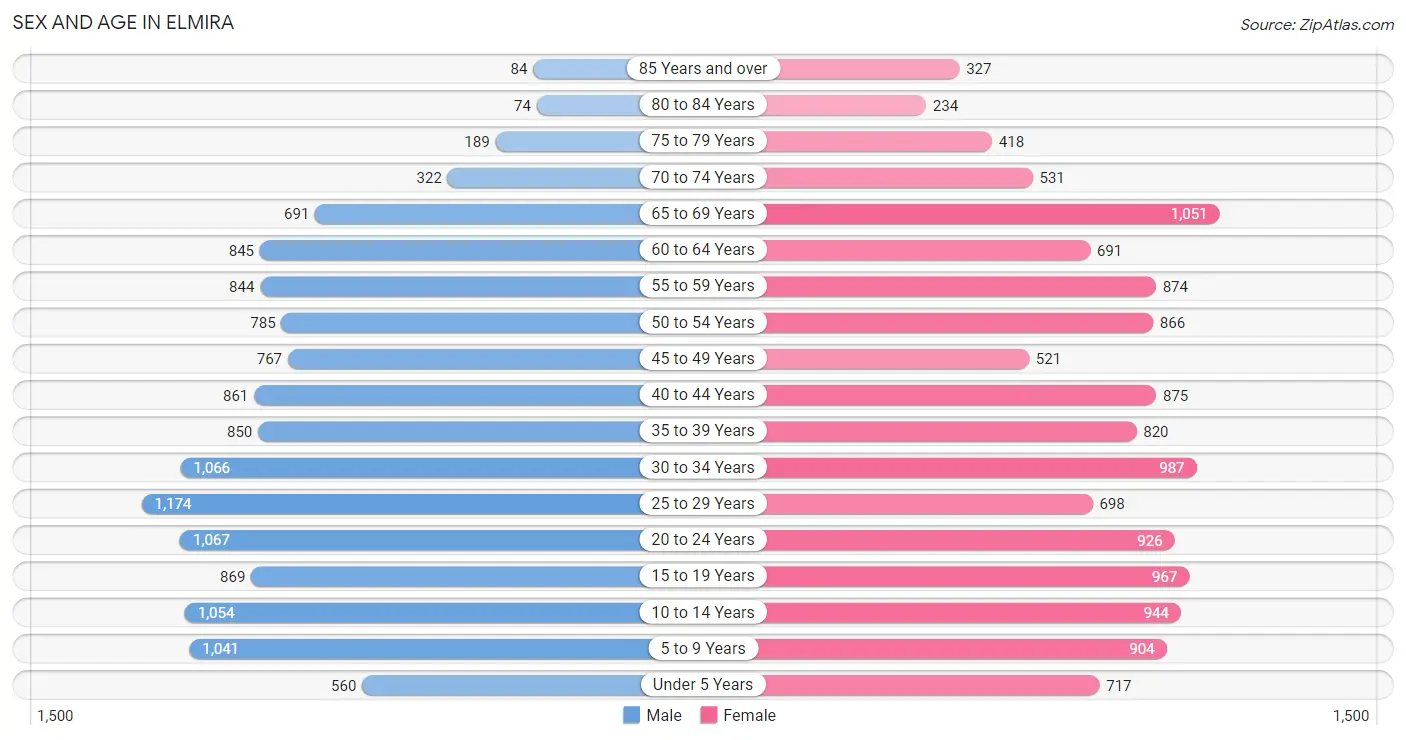
| Age Bracket | Male | Female |
| Under 5 Years | 560 (4.3%) | 717 (5.4%) |
| 5 to 9 Years | 1,041 (7.9%) | 904 (6.8%) |
| 10 to 14 Years | 1,054 (8.0%) | 944 (7.1%) |
| 15 to 19 Years | 869 (6.6%) | 967 (7.2%) |
| 20 to 24 Years | 1,067 (8.1%) | 926 (6.9%) |
| 25 to 29 Years | 1,174 (8.9%) | 698 (5.2%) |
| 30 to 34 Years | 1,066 (8.1%) | 987 (7.4%) |
| 35 to 39 Years | 850 (6.5%) | 820 (6.1%) |
| 40 to 44 Years | 861 (6.6%) | 875 (6.6%) |
| 45 to 49 Years | 767 (5.8%) | 521 (3.9%) |
| 50 to 54 Years | 785 (6.0%) | 866 (6.5%) |
| 55 to 59 Years | 844 (6.4%) | 874 (6.6%) |
| 60 to 64 Years | 845 (6.4%) | 691 (5.2%) |
| 65 to 69 Years | 691 (5.3%) | 1,051 (7.9%) |
| 70 to 74 Years | 322 (2.5%) | 531 (4.0%) |
| 75 to 79 Years | 189 (1.4%) | 418 (3.1%) |
| 80 to 84 Years | 74 (0.6%) | 234 (1.8%) |
| 85 Years and over | 84 (0.6%) | 327 (2.5%) |
| Total | 13,143 (100.0%) | 13,351 (100.0%) |
Families and Households in Elmira
Median Family Size in Elmira
The median family size in Elmira is 3.05 persons per family, with single female/mother families (1,950 | 35.0%) accounting for the largest median family size of 3.11 persons per family. On the other hand, single male/father families (444 | 8.0%) represent the smallest median family size with 2.59 persons per family.
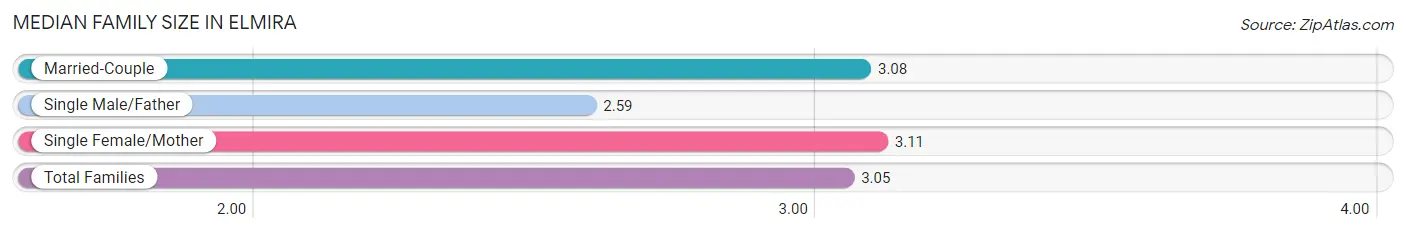
| Family Type | # Families | Family Size |
| Married-Couple | 3,177 (57.0%) | 3.08 |
| Single Male/Father | 444 (8.0%) | 2.59 |
| Single Female/Mother | 1,950 (35.0%) | 3.11 |
| Total Families | 5,571 (100.0%) | 3.05 |
Median Household Size in Elmira
The median household size in Elmira is 2.29 persons per household, with single female/mother households (1,950 | 18.9%) accounting for the largest median household size of 3.43 persons per household. non-family households (4,742 | 46.0%) represent the smallest median household size with 1.18 persons per household.
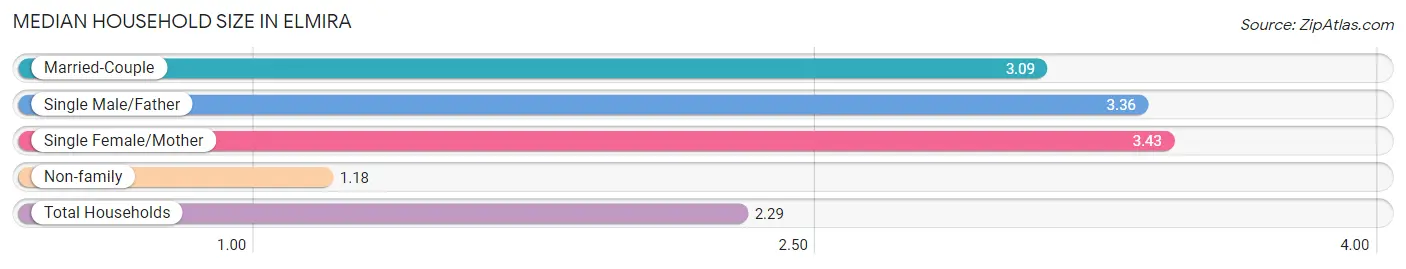
| Household Type | # Households | Household Size |
| Married-Couple | 3,177 (30.8%) | 3.09 |
| Single Male/Father | 444 (4.3%) | 3.36 |
| Single Female/Mother | 1,950 (18.9%) | 3.43 |
| Non-family | 4,742 (46.0%) | 1.18 |
| Total Households | 10,313 (100.0%) | 2.29 |
Household Size by Marriage Status in Elmira
Out of a total of 10,313 households in Elmira, 5,571 (54.0%) are family households, while 4,742 (46.0%) are nonfamily households. The most numerous type of family households are 2-person households, comprising 2,297, and the most common type of nonfamily households are 1-person households, comprising 4,039.
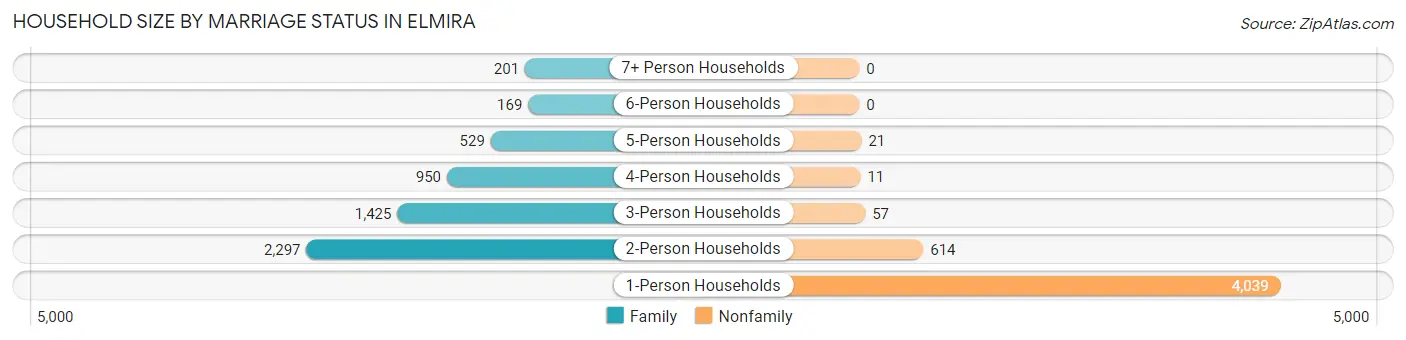
| Household Size | Family Households | Nonfamily Households |
| 1-Person Households | - | 4,039 (39.2%) |
| 2-Person Households | 2,297 (22.3%) | 614 (5.9%) |
| 3-Person Households | 1,425 (13.8%) | 57 (0.5%) |
| 4-Person Households | 950 (9.2%) | 11 (0.1%) |
| 5-Person Households | 529 (5.1%) | 21 (0.2%) |
| 6-Person Households | 169 (1.6%) | 0 (0.0%) |
| 7+ Person Households | 201 (1.9%) | 0 (0.0%) |
| Total | 5,571 (54.0%) | 4,742 (46.0%) |
Female Fertility in Elmira
Fertility by Age in Elmira
Average fertility rate in Elmira is 55.0 births per 1,000 women. Women in the age bracket of 20 to 34 years have the highest fertility rate with 122.0 births per 1,000 women. Women in the age bracket of 20 to 34 years acount for 97.0% of all women with births.
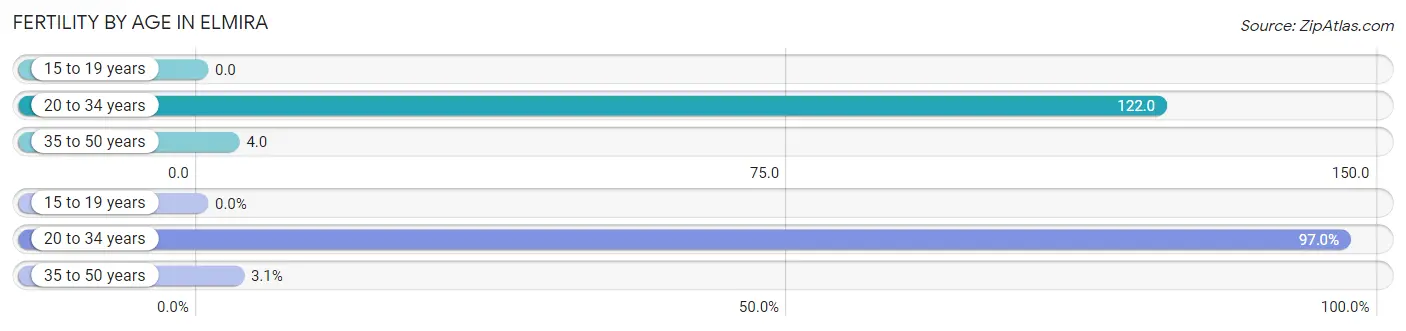
| Age Bracket | Women with Births | Births / 1,000 Women |
| 15 to 19 years | 0 (0.0%) | 0.0 |
| 20 to 34 years | 318 (97.0%) | 122.0 |
| 35 to 50 years | 10 (3.0%) | 4.0 |
| Total | 328 (100.0%) | 55.0 |
Fertility by Age by Marriage Status in Elmira
52.1% of women with births (328) in Elmira are married. The highest percentage of unmarried women with births falls into 20 to 34 years age bracket with 49.4% of them unmarried at the time of birth, while the lowest percentage of unmarried women with births belong to 35 to 50 years age bracket with 0.0% of them unmarried.
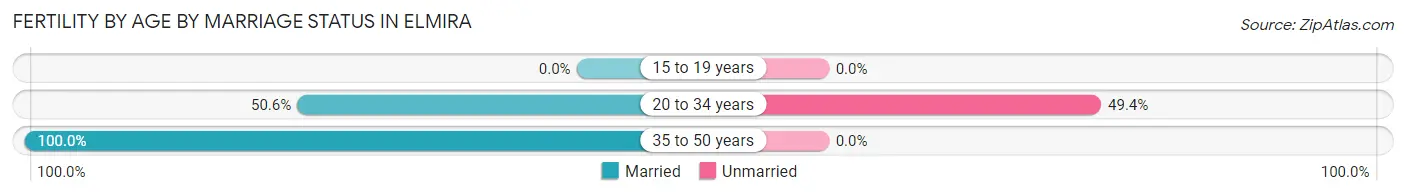
| Age Bracket | Married | Unmarried |
| 15 to 19 years | 0 (0.0%) | 0 (0.0%) |
| 20 to 34 years | 161 (50.6%) | 157 (49.4%) |
| 35 to 50 years | 10 (100.0%) | 0 (0.0%) |
| Total | 171 (52.1%) | 157 (47.9%) |
Fertility by Education in Elmira
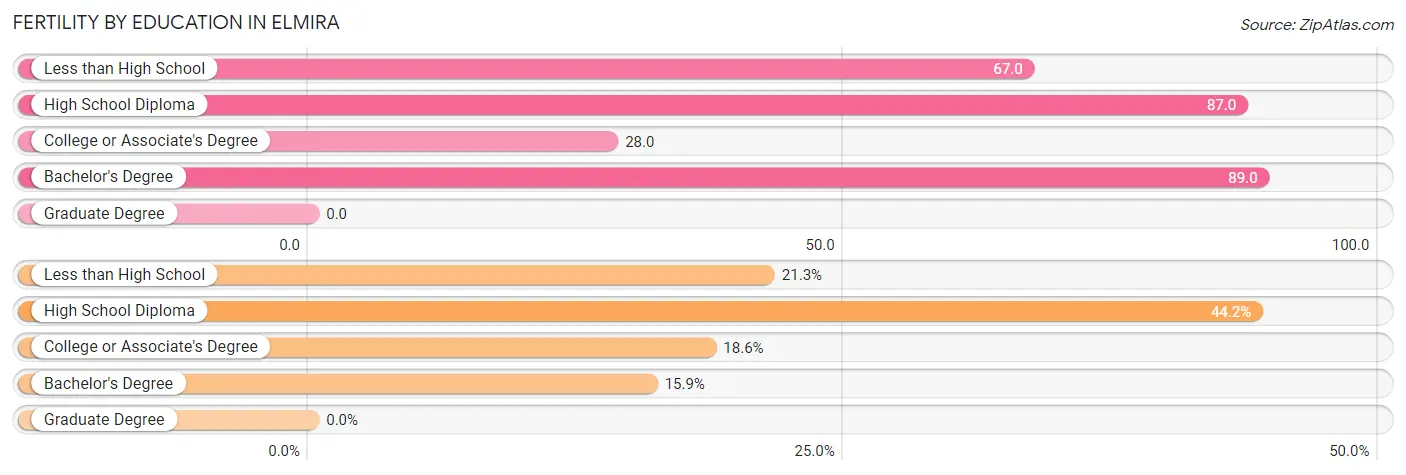
| Educational Attainment | Women with Births | Births / 1,000 Women |
| Less than High School | 70 (21.3%) | 67.0 |
| High School Diploma | 145 (44.2%) | 87.0 |
| College or Associate's Degree | 61 (18.6%) | 28.0 |
| Bachelor's Degree | 52 (15.9%) | 89.0 |
| Graduate Degree | 0 (0.0%) | 0.0 |
| Total | 328 (100.0%) | 55.0 |
Fertility by Education by Marriage Status in Elmira
47.9% of women with births in Elmira are unmarried. Women with the educational attainment of less than high school are most likely to be married with 100.0% of them married at childbirth, while women with the educational attainment of college or associate's degree are least likely to be married with 93.4% of them unmarried at childbirth.
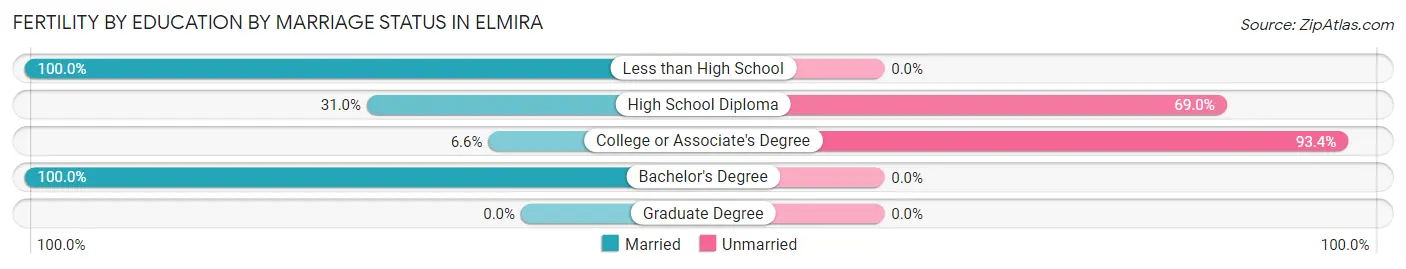
| Educational Attainment | Married | Unmarried |
| Less than High School | 70 (100.0%) | 0 (0.0%) |
| High School Diploma | 45 (31.0%) | 100 (69.0%) |
| College or Associate's Degree | 4 (6.6%) | 57 (93.4%) |
| Bachelor's Degree | 52 (100.0%) | 0 (0.0%) |
| Graduate Degree | 0 (0.0%) | 0 (0.0%) |
| Total | 171 (52.1%) | 157 (47.9%) |
Employment Characteristics in Elmira
Employment by Class of Employer in Elmira
Among the 10,083 employed individuals in Elmira, private company employees (5,929 | 58.8%), not-for-profit organizations (1,525 | 15.1%), and local government employees (1,255 | 12.4%) make up the most common classes of employment.
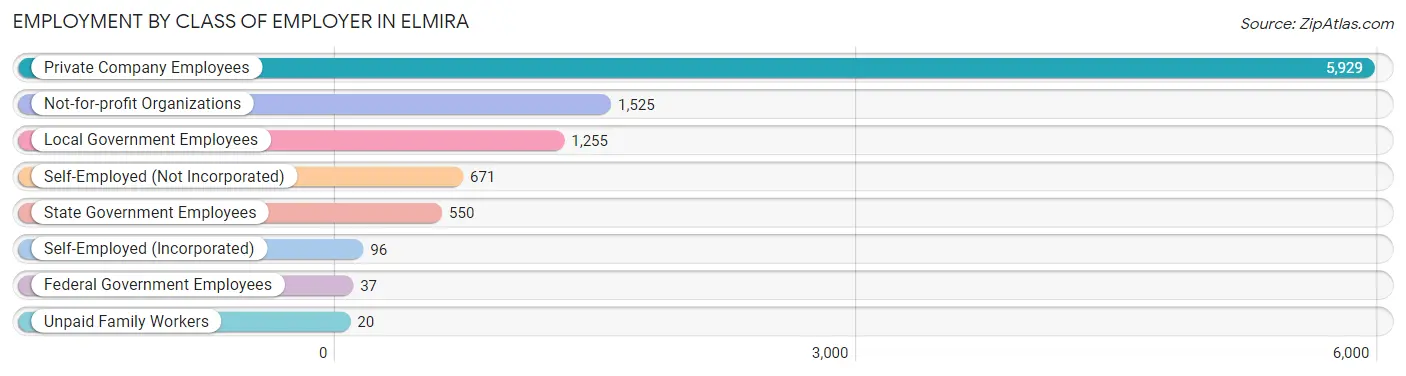
| Employer Class | # Employees | % Employees |
| Private Company Employees | 5,929 | 58.8% |
| Self-Employed (Incorporated) | 96 | 0.9% |
| Self-Employed (Not Incorporated) | 671 | 6.7% |
| Not-for-profit Organizations | 1,525 | 15.1% |
| Local Government Employees | 1,255 | 12.4% |
| State Government Employees | 550 | 5.4% |
| Federal Government Employees | 37 | 0.4% |
| Unpaid Family Workers | 20 | 0.2% |
| Total | 10,083 | 100.0% |
Employment Status by Age in Elmira
According to the labor force statistics for Elmira, out of the total population over 16 years of age (21,007), 54.2% or 11,386 individuals are in the labor force, with 9.8% or 1,116 of them unemployed. The age group with the highest labor force participation rate is 30 to 34 years, with 74.7% or 1,534 individuals in the labor force. Within the labor force, the 20 to 24 years age range has the highest percentage of unemployed individuals, with 23.1% or 334 of them being unemployed.
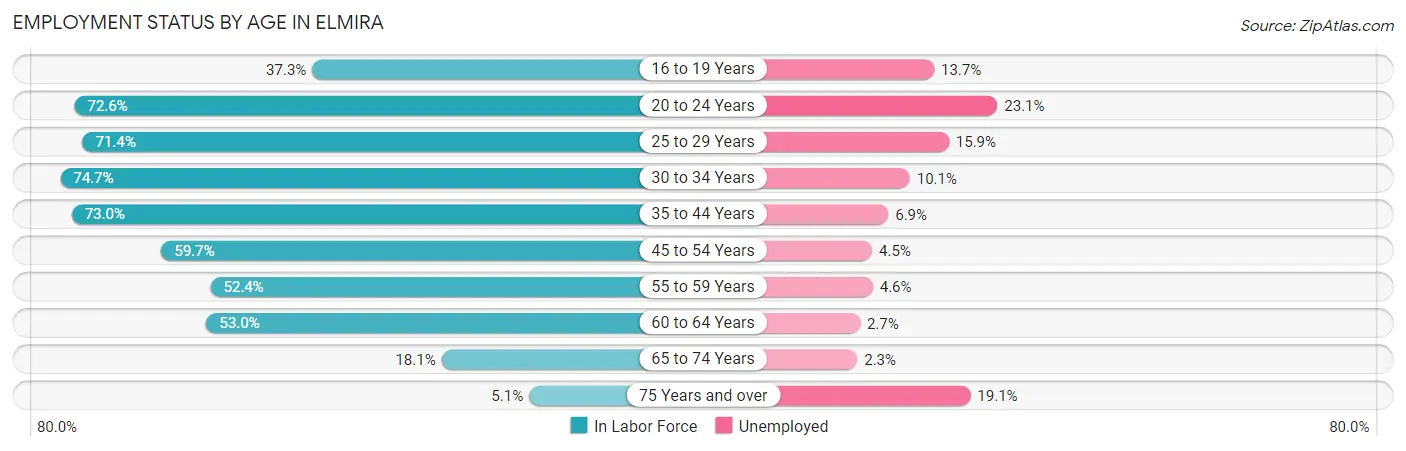
| Age Bracket | In Labor Force | Unemployed |
| 16 to 19 Years | 585 (37.3%) | 80 (13.7%) |
| 20 to 24 Years | 1,447 (72.6%) | 334 (23.1%) |
| 25 to 29 Years | 1,337 (71.4%) | 213 (15.9%) |
| 30 to 34 Years | 1,534 (74.7%) | 155 (10.1%) |
| 35 to 44 Years | 2,486 (73.0%) | 172 (6.9%) |
| 45 to 54 Years | 1,755 (59.7%) | 79 (4.5%) |
| 55 to 59 Years | 900 (52.4%) | 41 (4.6%) |
| 60 to 64 Years | 814 (53.0%) | 22 (2.7%) |
| 65 to 74 Years | 470 (18.1%) | 11 (2.3%) |
| 75 Years and over | 68 (5.1%) | 13 (19.1%) |
| Total | 11,386 (54.2%) | 1,116 (9.8%) |
Employment Status by Educational Attainment in Elmira
According to labor force statistics for Elmira, 65.3% of individuals (8,831) out of the total population between 25 and 64 years of age (13,524) are in the labor force, with 7.7% or 680 of them being unemployed. The group with the highest labor force participation rate are those with the educational attainment of bachelor's degree or higher, with 85.8% or 2,057 individuals in the labor force. Within the labor force, individuals with less than high school education have the highest percentage of unemployment, with 19.7% or 194 of them being unemployed.
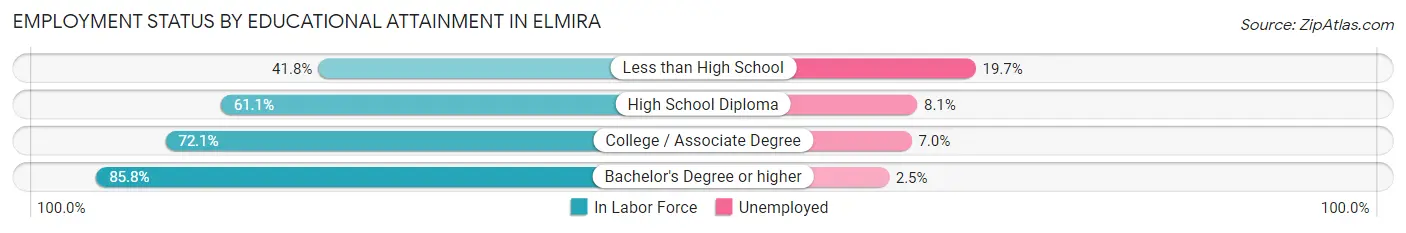
| Educational Attainment | In Labor Force | Unemployed |
| Less than High School | 984 (41.8%) | 464 (19.7%) |
| High School Diploma | 3,013 (61.1%) | 399 (8.1%) |
| College / Associate Degree | 2,770 (72.1%) | 269 (7.0%) |
| Bachelor's Degree or higher | 2,057 (85.8%) | 60 (2.5%) |
| Total | 8,831 (65.3%) | 1,041 (7.7%) |
Employment Occupations by Sex in Elmira
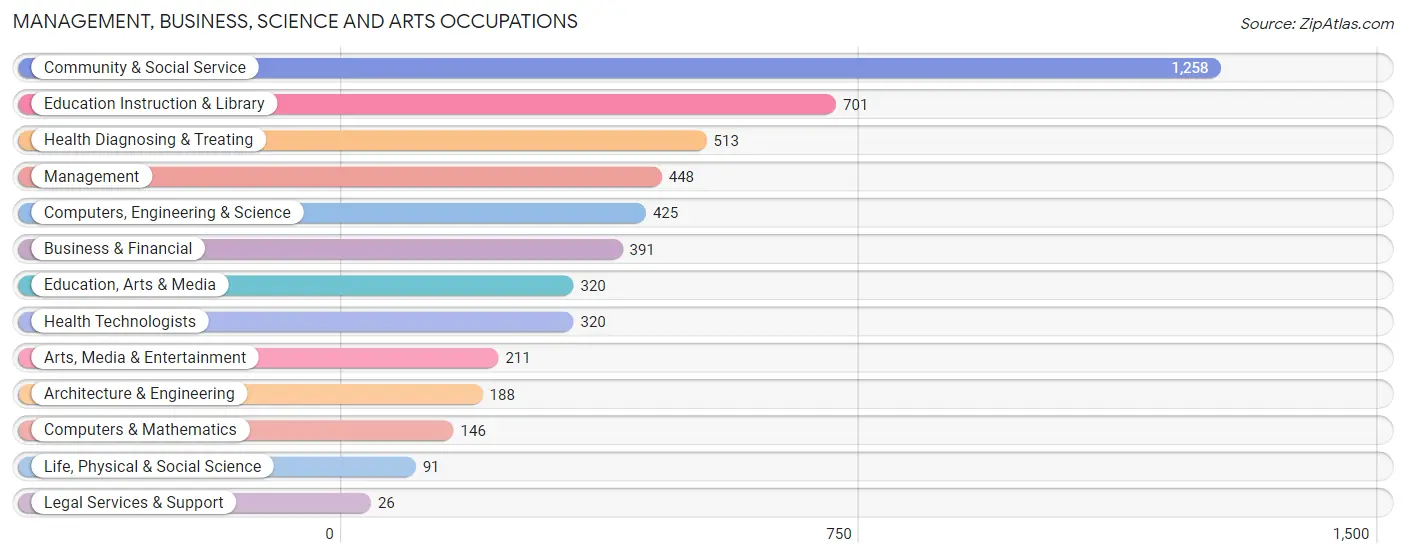
Management, Business, Science and Arts Occupations
The most common Management, Business, Science and Arts occupations in Elmira are Community & Social Service (1,258 | 12.2%), Education Instruction & Library (701 | 6.8%), Health Diagnosing & Treating (513 | 5.0%), Management (448 | 4.4%), and Computers, Engineering & Science (425 | 4.1%).
Management, Business, Science and Arts Occupations by Sex
Within the Management, Business, Science and Arts occupations in Elmira, the most male-oriented occupations are Architecture & Engineering (80.8%), Computers, Engineering & Science (65.4%), and Computers & Mathematics (64.4%), while the most female-oriented occupations are Legal Services & Support (100.0%), Education, Arts & Media (78.4%), and Arts, Media & Entertainment (78.2%).
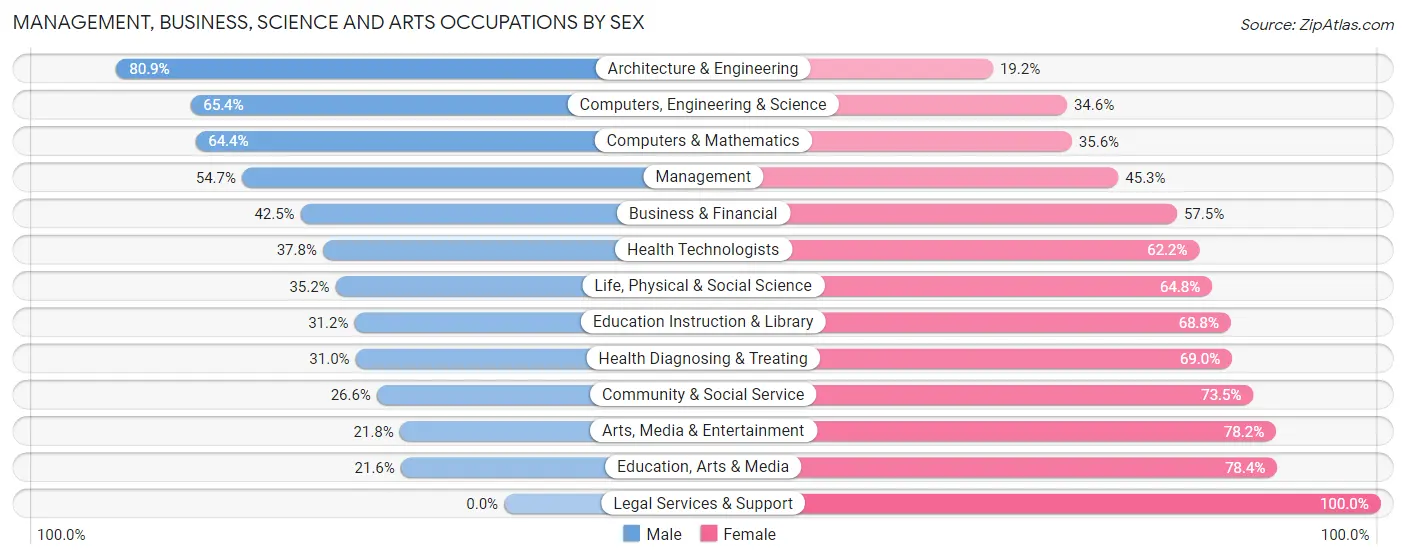
| Occupation | Male | Female |
| Management | 245 (54.7%) | 203 (45.3%) |
| Business & Financial | 166 (42.5%) | 225 (57.5%) |
| Computers, Engineering & Science | 278 (65.4%) | 147 (34.6%) |
| Computers & Mathematics | 94 (64.4%) | 52 (35.6%) |
| Architecture & Engineering | 152 (80.8%) | 36 (19.2%) |
| Life, Physical & Social Science | 32 (35.2%) | 59 (64.8%) |
| Community & Social Service | 334 (26.6%) | 924 (73.5%) |
| Education, Arts & Media | 69 (21.6%) | 251 (78.4%) |
| Legal Services & Support | 0 (0.0%) | 26 (100.0%) |
| Education Instruction & Library | 219 (31.2%) | 482 (68.8%) |
| Arts, Media & Entertainment | 46 (21.8%) | 165 (78.2%) |
| Health Diagnosing & Treating | 159 (31.0%) | 354 (69.0%) |
| Health Technologists | 121 (37.8%) | 199 (62.2%) |
| Total (Category) | 1,182 (39.0%) | 1,853 (61.1%) |
| Total (Overall) | 4,960 (48.3%) | 5,315 (51.7%) |
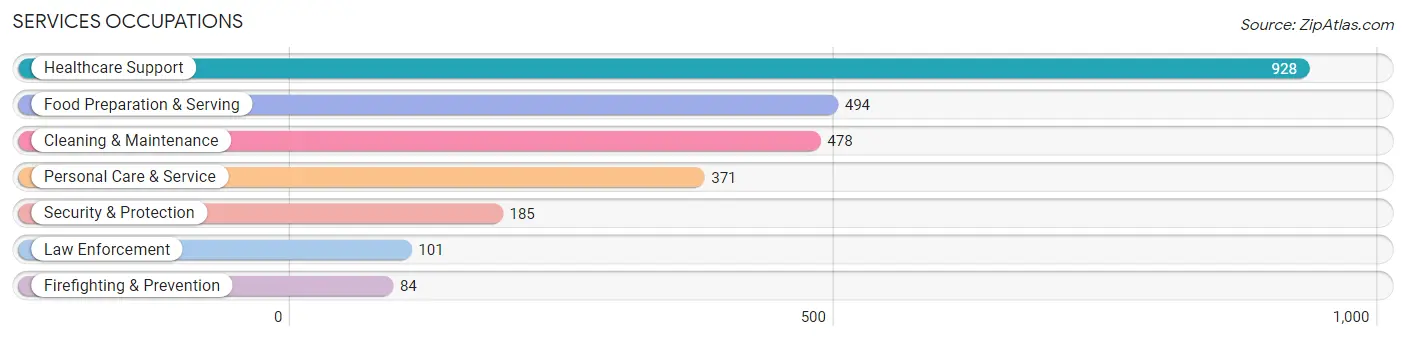
Services Occupations
The most common Services occupations in Elmira are Healthcare Support (928 | 9.0%), Food Preparation & Serving (494 | 4.8%), Cleaning & Maintenance (478 | 4.6%), Personal Care & Service (371 | 3.6%), and Security & Protection (185 | 1.8%).
Services Occupations by Sex
Within the Services occupations in Elmira, the most male-oriented occupations are Law Enforcement (100.0%), Security & Protection (68.1%), and Cleaning & Maintenance (64.2%), while the most female-oriented occupations are Healthcare Support (91.2%), Personal Care & Service (81.7%), and Firefighting & Prevention (70.2%).
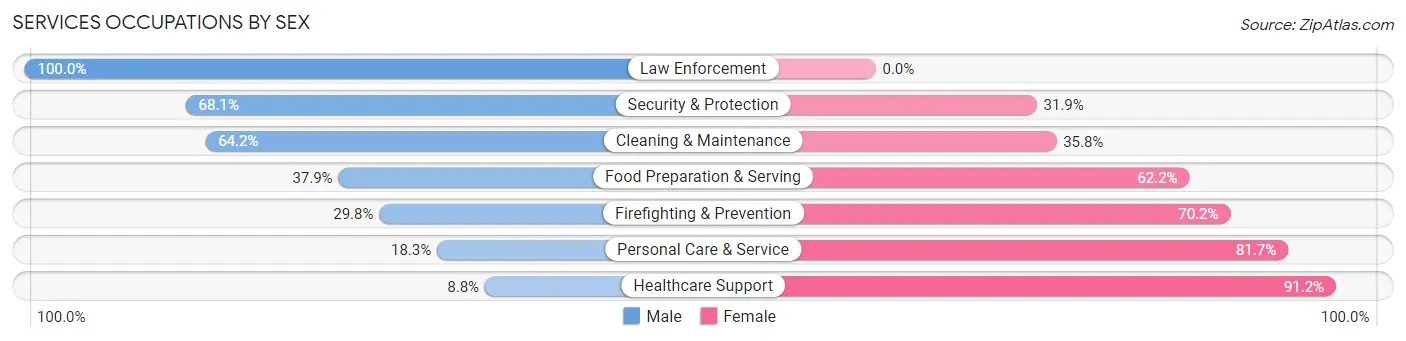
| Occupation | Male | Female |
| Healthcare Support | 82 (8.8%) | 846 (91.2%) |
| Security & Protection | 126 (68.1%) | 59 (31.9%) |
| Firefighting & Prevention | 25 (29.8%) | 59 (70.2%) |
| Law Enforcement | 101 (100.0%) | 0 (0.0%) |
| Food Preparation & Serving | 187 (37.9%) | 307 (62.2%) |
| Cleaning & Maintenance | 307 (64.2%) | 171 (35.8%) |
| Personal Care & Service | 68 (18.3%) | 303 (81.7%) |
| Total (Category) | 770 (31.4%) | 1,686 (68.6%) |
| Total (Overall) | 4,960 (48.3%) | 5,315 (51.7%) |
Sales and Office Occupations
The most common Sales and Office occupations in Elmira are Office & Administration (1,274 | 12.4%), and Sales & Related (1,187 | 11.6%).

Sales and Office Occupations by Sex

| Occupation | Male | Female |
| Sales & Related | 472 (39.8%) | 715 (60.2%) |
| Office & Administration | 442 (34.7%) | 832 (65.3%) |
| Total (Category) | 914 (37.1%) | 1,547 (62.9%) |
| Total (Overall) | 4,960 (48.3%) | 5,315 (51.7%) |
Natural Resources, Construction and Maintenance Occupations
The most common Natural Resources, Construction and Maintenance occupations in Elmira are Construction & Extraction (383 | 3.7%), and Installation, Maintenance & Repair (184 | 1.8%).
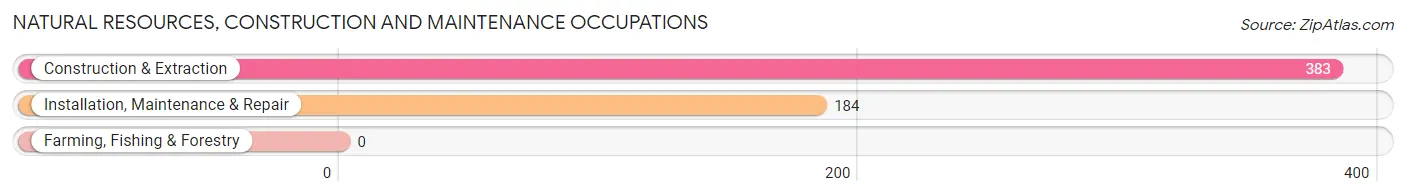
Natural Resources, Construction and Maintenance Occupations by Sex
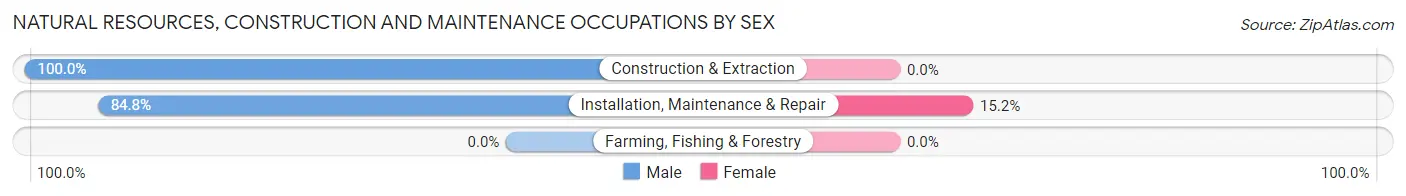
| Occupation | Male | Female |
| Farming, Fishing & Forestry | 0 (0.0%) | 0 (0.0%) |
| Construction & Extraction | 383 (100.0%) | 0 (0.0%) |
| Installation, Maintenance & Repair | 156 (84.8%) | 28 (15.2%) |
| Total (Category) | 539 (95.1%) | 28 (4.9%) |
| Total (Overall) | 4,960 (48.3%) | 5,315 (51.7%) |
Production, Transportation and Moving Occupations
The most common Production, Transportation and Moving occupations in Elmira are Material Moving (858 | 8.4%), Production (567 | 5.5%), and Transportation (331 | 3.2%).
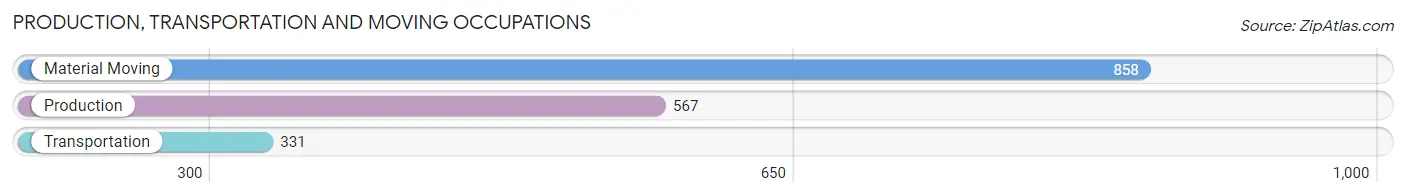
Production, Transportation and Moving Occupations by Sex
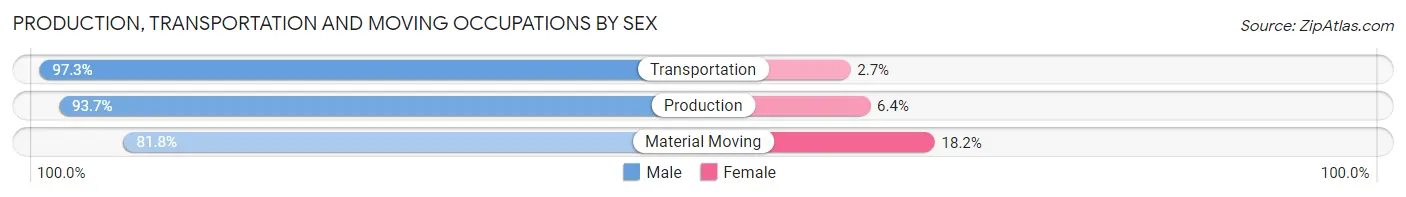
| Occupation | Male | Female |
| Production | 531 (93.6%) | 36 (6.4%) |
| Transportation | 322 (97.3%) | 9 (2.7%) |
| Material Moving | 702 (81.8%) | 156 (18.2%) |
| Total (Category) | 1,555 (88.5%) | 201 (11.5%) |
| Total (Overall) | 4,960 (48.3%) | 5,315 (51.7%) |
Employment Industries by Sex in Elmira
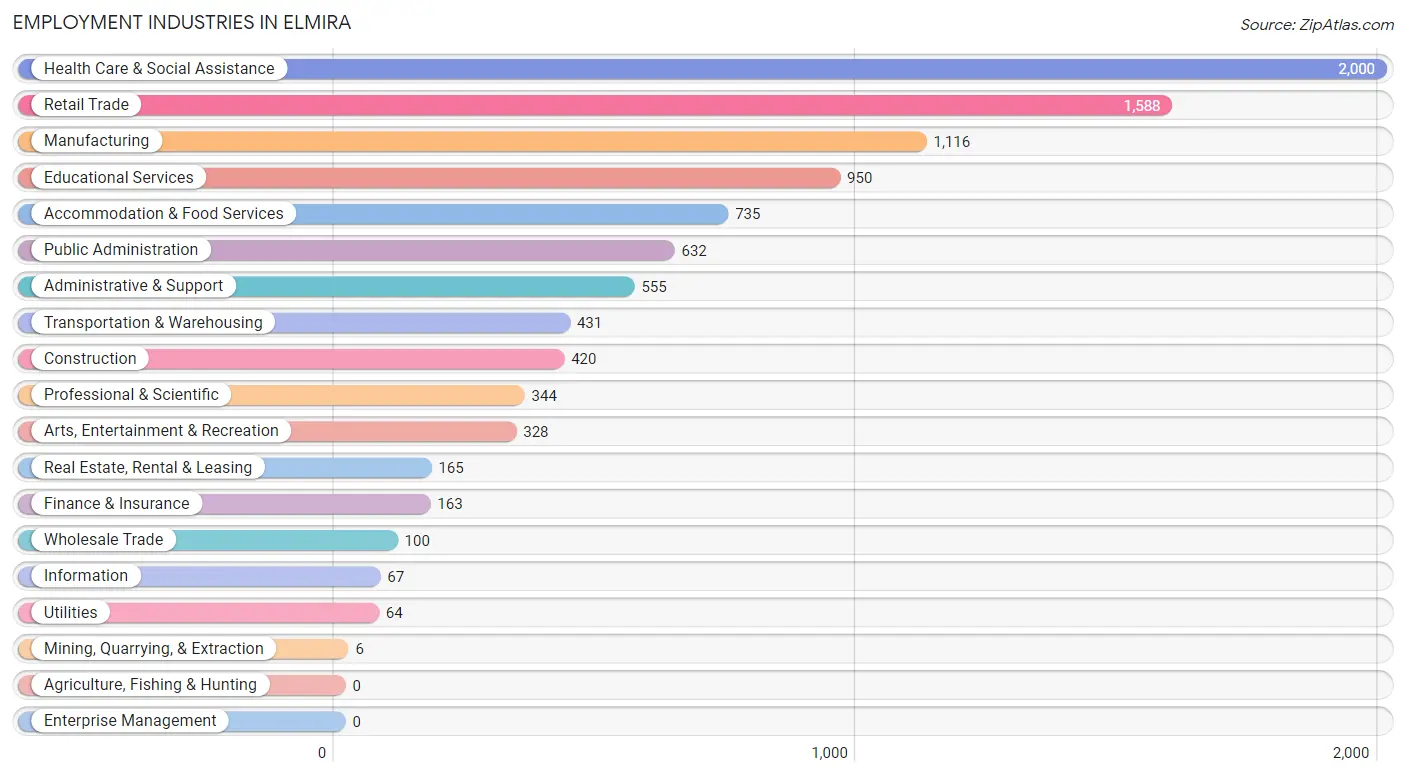
Employment Industries in Elmira
The major employment industries in Elmira include Health Care & Social Assistance (2,000 | 19.5%), Retail Trade (1,588 | 15.4%), Manufacturing (1,116 | 10.9%), Educational Services (950 | 9.2%), and Accommodation & Food Services (735 | 7.1%).
Employment Industries by Sex in Elmira
The Elmira industries that see more men than women are Mining, Quarrying, & Extraction (100.0%), Utilities (100.0%), and Construction (96.0%), whereas the industries that tend to have a higher number of women are Health Care & Social Assistance (86.6%), Arts, Entertainment & Recreation (71.3%), and Educational Services (68.6%).
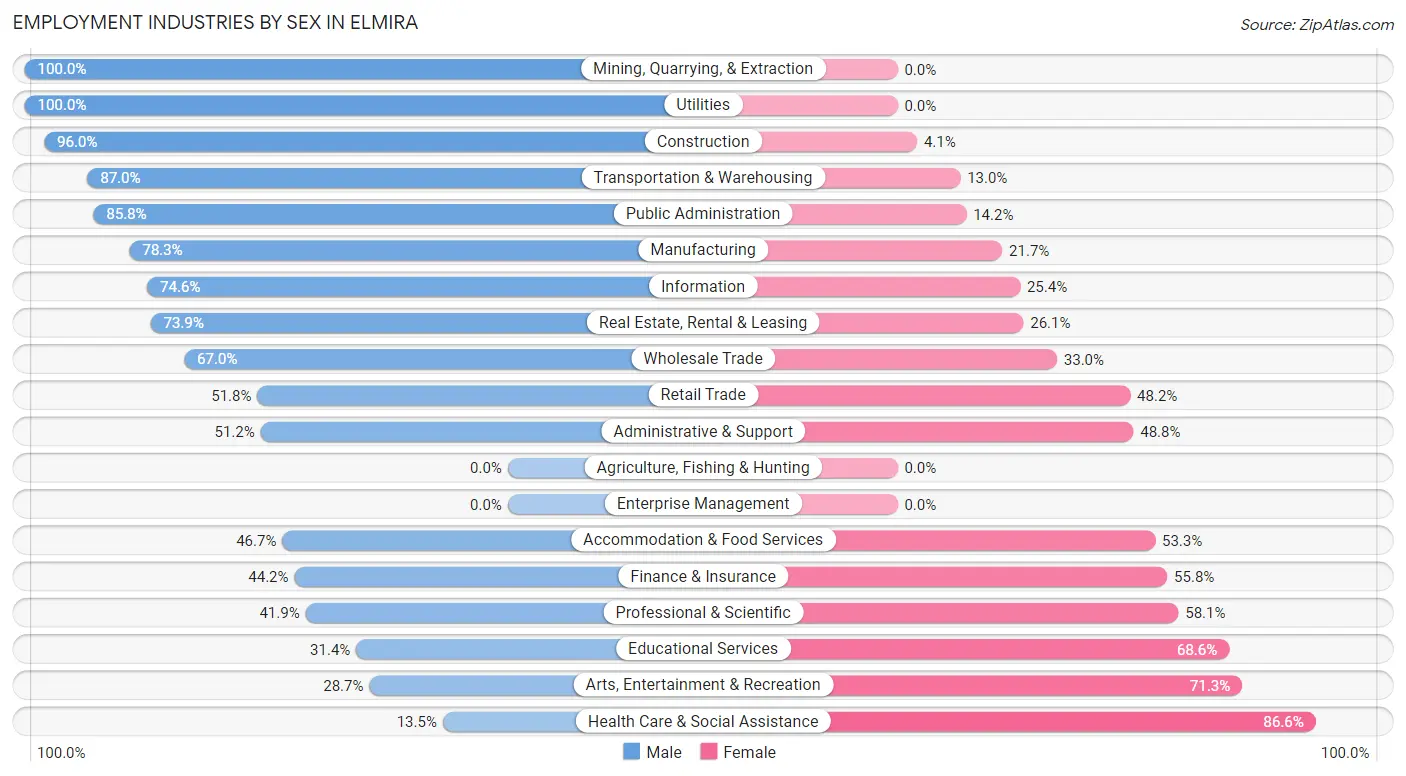
| Industry | Male | Female |
| Agriculture, Fishing & Hunting | 0 (0.0%) | 0 (0.0%) |
| Mining, Quarrying, & Extraction | 6 (100.0%) | 0 (0.0%) |
| Construction | 403 (96.0%) | 17 (4.1%) |
| Manufacturing | 874 (78.3%) | 242 (21.7%) |
| Wholesale Trade | 67 (67.0%) | 33 (33.0%) |
| Retail Trade | 823 (51.8%) | 765 (48.2%) |
| Transportation & Warehousing | 375 (87.0%) | 56 (13.0%) |
| Utilities | 64 (100.0%) | 0 (0.0%) |
| Information | 50 (74.6%) | 17 (25.4%) |
| Finance & Insurance | 72 (44.2%) | 91 (55.8%) |
| Real Estate, Rental & Leasing | 122 (73.9%) | 43 (26.1%) |
| Professional & Scientific | 144 (41.9%) | 200 (58.1%) |
| Enterprise Management | 0 (0.0%) | 0 (0.0%) |
| Administrative & Support | 284 (51.2%) | 271 (48.8%) |
| Educational Services | 298 (31.4%) | 652 (68.6%) |
| Health Care & Social Assistance | 269 (13.5%) | 1,731 (86.6%) |
| Arts, Entertainment & Recreation | 94 (28.7%) | 234 (71.3%) |
| Accommodation & Food Services | 343 (46.7%) | 392 (53.3%) |
| Public Administration | 542 (85.8%) | 90 (14.2%) |
| Total | 4,960 (48.3%) | 5,315 (51.7%) |
Education in Elmira
School Enrollment in Elmira
The most common levels of schooling among the 6,323 students in Elmira are middle school (1,543 | 24.4%), elementary school (1,389 | 22.0%), and college / undergraduate (1,348 | 21.3%).
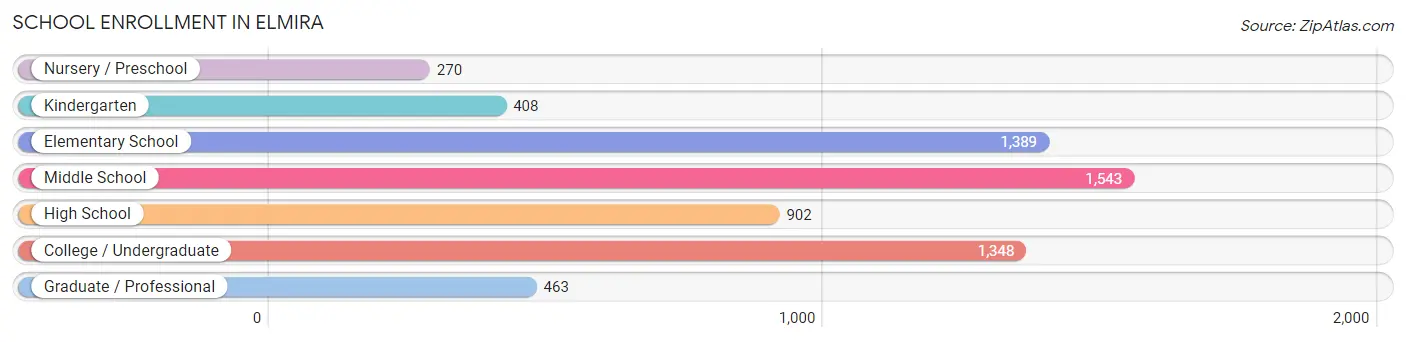
| School Level | # Students | % Students |
| Nursery / Preschool | 270 | 4.3% |
| Kindergarten | 408 | 6.5% |
| Elementary School | 1,389 | 22.0% |
| Middle School | 1,543 | 24.4% |
| High School | 902 | 14.3% |
| College / Undergraduate | 1,348 | 21.3% |
| Graduate / Professional | 463 | 7.3% |
| Total | 6,323 | 100.0% |
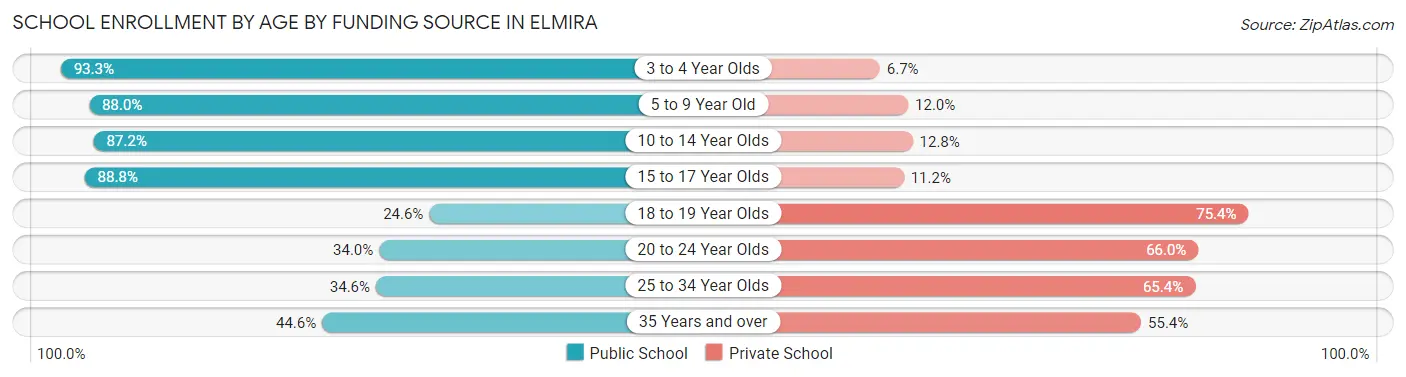
School Enrollment by Age by Funding Source in Elmira
Out of a total of 6,323 students who are enrolled in schools in Elmira, 1,764 (27.9%) attend a private institution, while the remaining 4,559 (72.1%) are enrolled in public schools. The age group of 18 to 19 year olds has the highest likelihood of being enrolled in private schools, with 474 (75.4% in the age bracket) enrolled. Conversely, the age group of 3 to 4 year olds has the lowest likelihood of being enrolled in a private school, with 166 (93.3% in the age bracket) attending a public institution.
| Age Bracket | Public School | Private School |
| 3 to 4 Year Olds | 166 (93.3%) | 12 (6.7%) |
| 5 to 9 Year Old | 1,518 (88.0%) | 207 (12.0%) |
| 10 to 14 Year Olds | 1,677 (87.2%) | 247 (12.8%) |
| 15 to 17 Year Olds | 619 (88.8%) | 78 (11.2%) |
| 18 to 19 Year Olds | 155 (24.6%) | 474 (75.4%) |
| 20 to 24 Year Olds | 215 (34.0%) | 418 (66.0%) |
| 25 to 34 Year Olds | 112 (34.6%) | 212 (65.4%) |
| 35 Years and over | 95 (44.6%) | 118 (55.4%) |
| Total | 4,559 (72.1%) | 1,764 (27.9%) |
Educational Attainment by Field of Study in Elmira
Education (735 | 22.3%), business (416 | 12.6%), literature & languages (318 | 9.6%), psychology (295 | 8.9%), and science & technology (263 | 8.0%) are the most common fields of study among 3,302 individuals in Elmira who have obtained a bachelor's degree or higher.
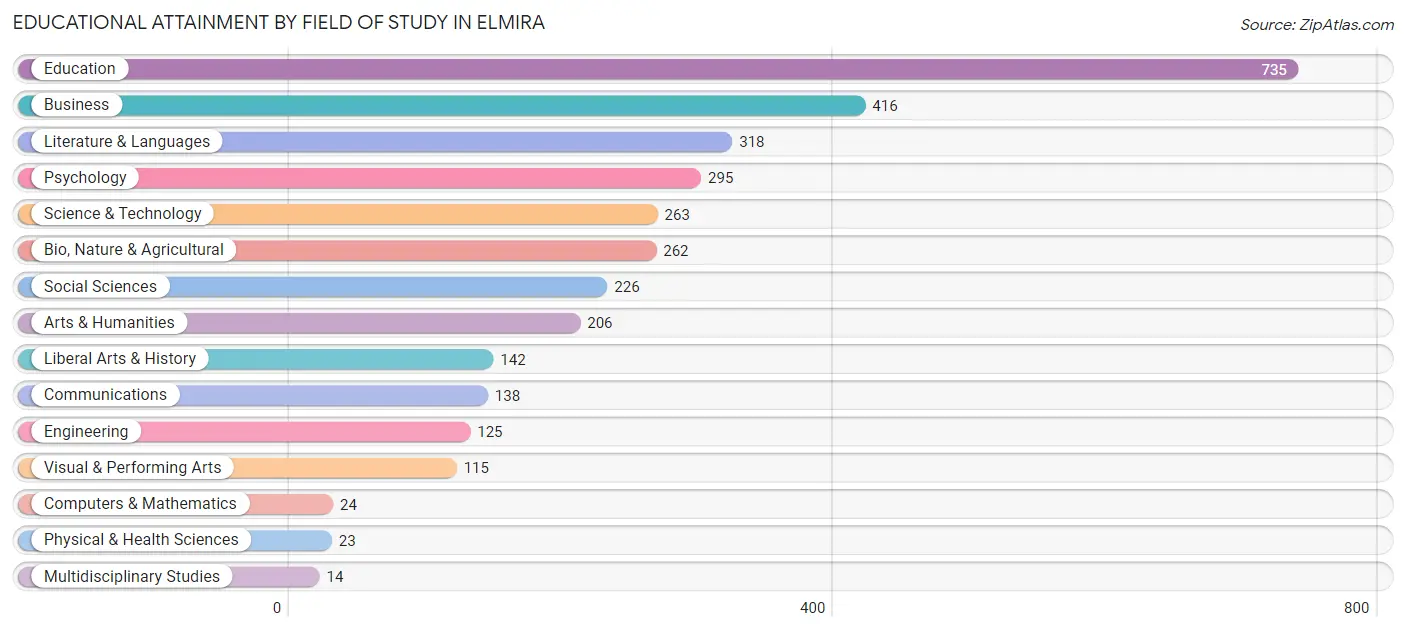
| Field of Study | # Graduates | % Graduates |
| Computers & Mathematics | 24 | 0.7% |
| Bio, Nature & Agricultural | 262 | 7.9% |
| Physical & Health Sciences | 23 | 0.7% |
| Psychology | 295 | 8.9% |
| Social Sciences | 226 | 6.8% |
| Engineering | 125 | 3.8% |
| Multidisciplinary Studies | 14 | 0.4% |
| Science & Technology | 263 | 8.0% |
| Business | 416 | 12.6% |
| Education | 735 | 22.3% |
| Literature & Languages | 318 | 9.6% |
| Liberal Arts & History | 142 | 4.3% |
| Visual & Performing Arts | 115 | 3.5% |
| Communications | 138 | 4.2% |
| Arts & Humanities | 206 | 6.2% |
| Total | 3,302 | 100.0% |
Transportation & Commute in Elmira
Vehicle Availability by Sex in Elmira
The most prevalent vehicle ownership categories in Elmira are males with 2 vehicles (2,172, accounting for 45.0%) and females with 2 vehicles (1,862, making up 43.5%).
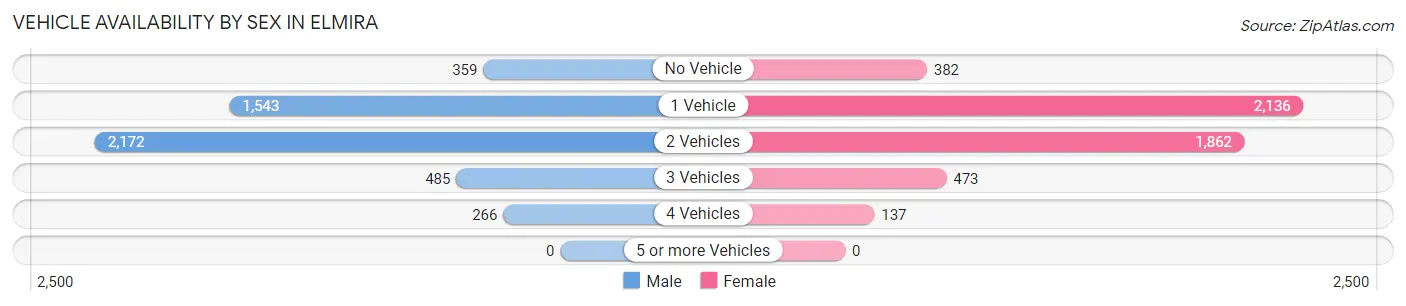
| Vehicles Available | Male | Female |
| No Vehicle | 359 (7.4%) | 382 (7.7%) |
| 1 Vehicle | 1,543 (32.0%) | 2,136 (42.8%) |
| 2 Vehicles | 2,172 (45.0%) | 1,862 (37.3%) |
| 3 Vehicles | 485 (10.1%) | 473 (9.5%) |
| 4 Vehicles | 266 (5.5%) | 137 (2.8%) |
| 5 or more Vehicles | 0 (0.0%) | 0 (0.0%) |
| Total | 4,825 (100.0%) | 4,990 (100.0%) |
Commute Time in Elmira
The most frequently occuring commute durations in Elmira are 5 to 9 minutes (1,891 commuters, 20.1%), 15 to 19 minutes (1,828 commuters, 19.5%), and 10 to 14 minutes (1,726 commuters, 18.4%).
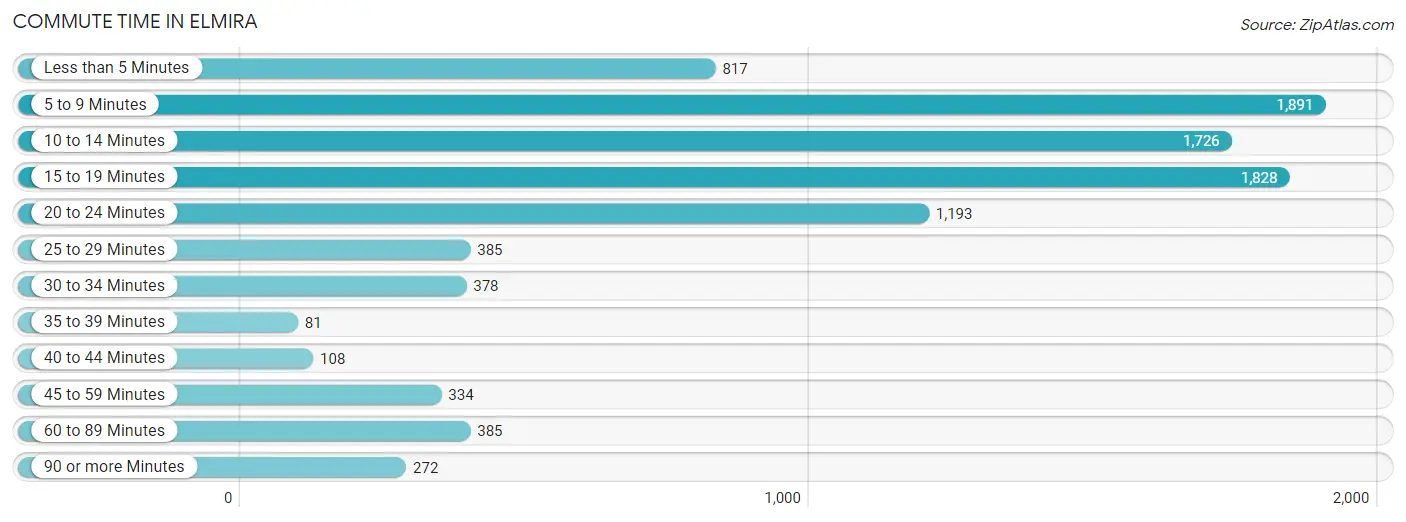
| Commute Time | # Commuters | % Commuters |
| Less than 5 Minutes | 817 | 8.7% |
| 5 to 9 Minutes | 1,891 | 20.1% |
| 10 to 14 Minutes | 1,726 | 18.4% |
| 15 to 19 Minutes | 1,828 | 19.5% |
| 20 to 24 Minutes | 1,193 | 12.7% |
| 25 to 29 Minutes | 385 | 4.1% |
| 30 to 34 Minutes | 378 | 4.0% |
| 35 to 39 Minutes | 81 | 0.9% |
| 40 to 44 Minutes | 108 | 1.1% |
| 45 to 59 Minutes | 334 | 3.5% |
| 60 to 89 Minutes | 385 | 4.1% |
| 90 or more Minutes | 272 | 2.9% |
Commute Time by Sex in Elmira
The most common commute times in Elmira are 15 to 19 minutes (975 commuters, 21.6%) for males and 10 to 14 minutes (1,024 commuters, 21.0%) for females.
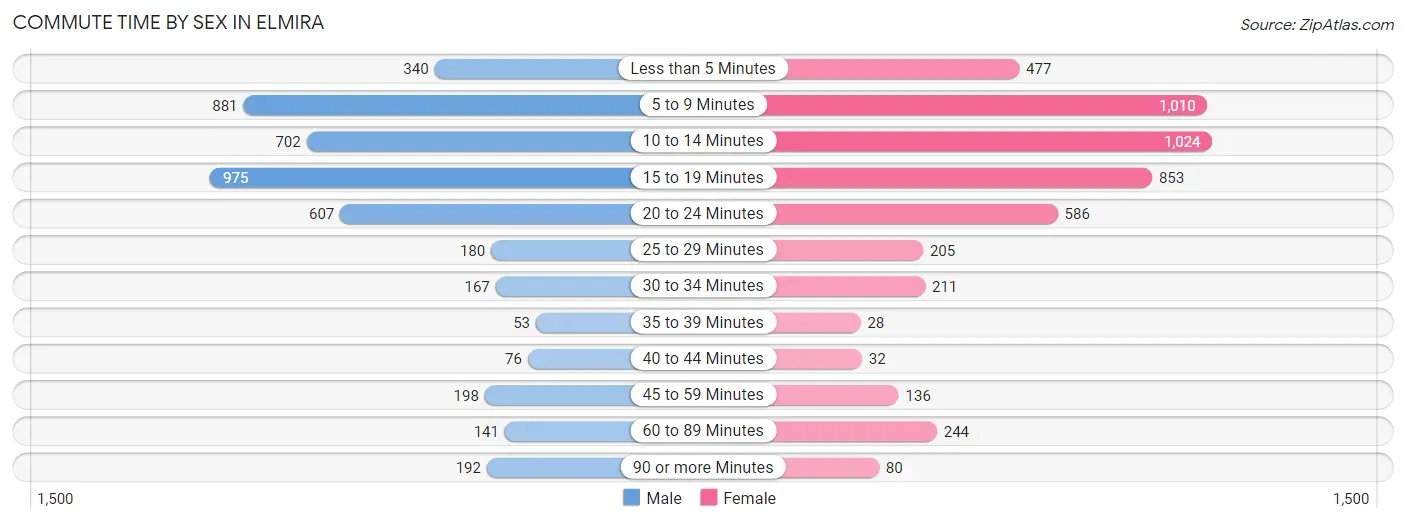
| Commute Time | Male | Female |
| Less than 5 Minutes | 340 (7.5%) | 477 (9.8%) |
| 5 to 9 Minutes | 881 (19.5%) | 1,010 (20.7%) |
| 10 to 14 Minutes | 702 (15.6%) | 1,024 (21.0%) |
| 15 to 19 Minutes | 975 (21.6%) | 853 (17.5%) |
| 20 to 24 Minutes | 607 (13.5%) | 586 (12.0%) |
| 25 to 29 Minutes | 180 (4.0%) | 205 (4.2%) |
| 30 to 34 Minutes | 167 (3.7%) | 211 (4.3%) |
| 35 to 39 Minutes | 53 (1.2%) | 28 (0.6%) |
| 40 to 44 Minutes | 76 (1.7%) | 32 (0.6%) |
| 45 to 59 Minutes | 198 (4.4%) | 136 (2.8%) |
| 60 to 89 Minutes | 141 (3.1%) | 244 (5.0%) |
| 90 or more Minutes | 192 (4.3%) | 80 (1.6%) |
Time of Departure to Work by Sex in Elmira
The most frequent times of departure to work in Elmira are 7:30 AM to 7:59 AM (629, 13.9%) for males and 7:30 AM to 7:59 AM (817, 16.7%) for females.
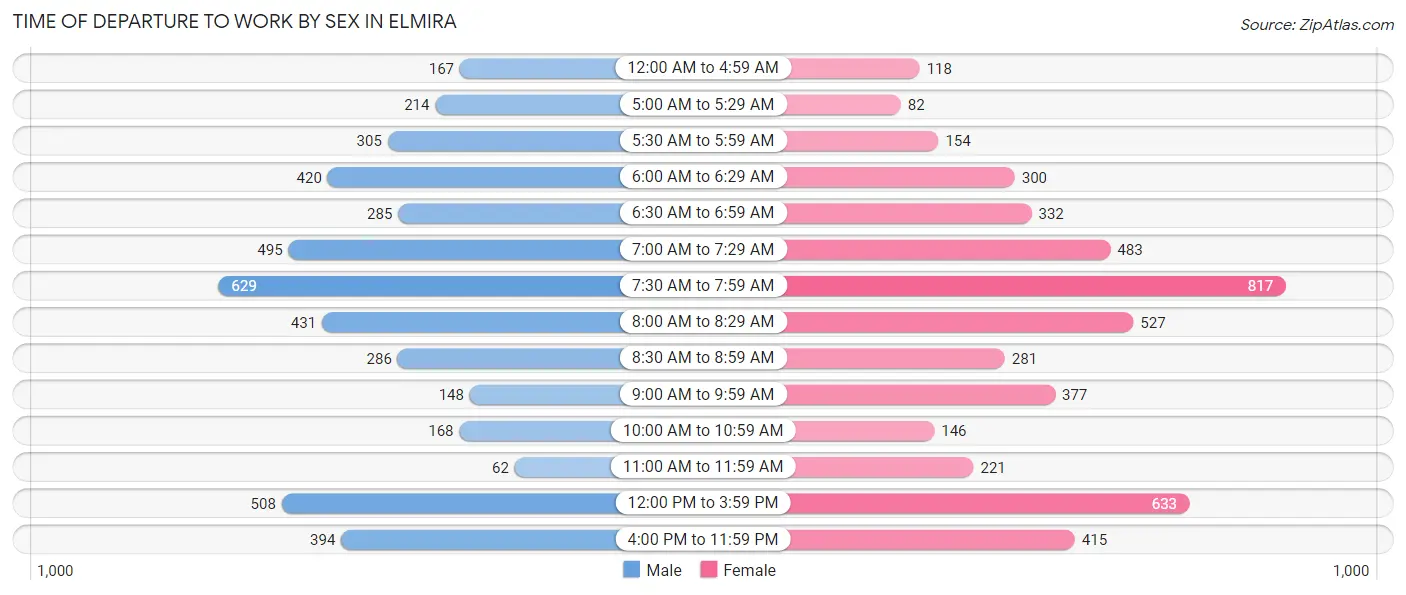
| Time of Departure | Male | Female |
| 12:00 AM to 4:59 AM | 167 (3.7%) | 118 (2.4%) |
| 5:00 AM to 5:29 AM | 214 (4.7%) | 82 (1.7%) |
| 5:30 AM to 5:59 AM | 305 (6.8%) | 154 (3.2%) |
| 6:00 AM to 6:29 AM | 420 (9.3%) | 300 (6.1%) |
| 6:30 AM to 6:59 AM | 285 (6.3%) | 332 (6.8%) |
| 7:00 AM to 7:29 AM | 495 (11.0%) | 483 (9.9%) |
| 7:30 AM to 7:59 AM | 629 (13.9%) | 817 (16.7%) |
| 8:00 AM to 8:29 AM | 431 (9.6%) | 527 (10.8%) |
| 8:30 AM to 8:59 AM | 286 (6.3%) | 281 (5.8%) |
| 9:00 AM to 9:59 AM | 148 (3.3%) | 377 (7.7%) |
| 10:00 AM to 10:59 AM | 168 (3.7%) | 146 (3.0%) |
| 11:00 AM to 11:59 AM | 62 (1.4%) | 221 (4.5%) |
| 12:00 PM to 3:59 PM | 508 (11.3%) | 633 (13.0%) |
| 4:00 PM to 11:59 PM | 394 (8.7%) | 415 (8.5%) |
| Total | 4,512 (100.0%) | 4,886 (100.0%) |
Housing Occupancy in Elmira
Occupancy by Ownership in Elmira
Of the total 10,313 dwellings in Elmira, owner-occupied units account for 5,182 (50.2%), while renter-occupied units make up 5,131 (49.7%).
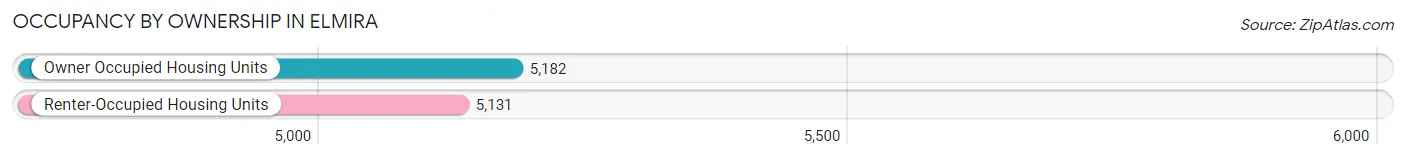
| Occupancy | # Housing Units | % Housing Units |
| Owner Occupied Housing Units | 5,182 | 50.2% |
| Renter-Occupied Housing Units | 5,131 | 49.7% |
| Total Occupied Housing Units | 10,313 | 100.0% |
Occupancy by Household Size in Elmira
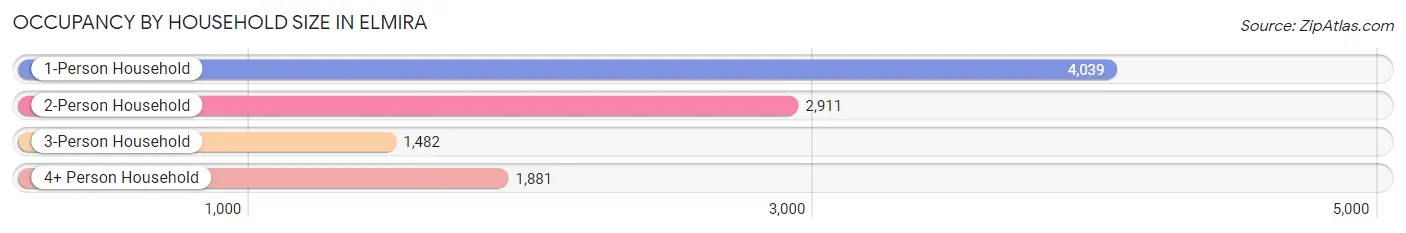
| Household Size | # Housing Units | % Housing Units |
| 1-Person Household | 4,039 | 39.2% |
| 2-Person Household | 2,911 | 28.2% |
| 3-Person Household | 1,482 | 14.4% |
| 4+ Person Household | 1,881 | 18.2% |
| Total Housing Units | 10,313 | 100.0% |
Occupancy by Ownership by Household Size in Elmira
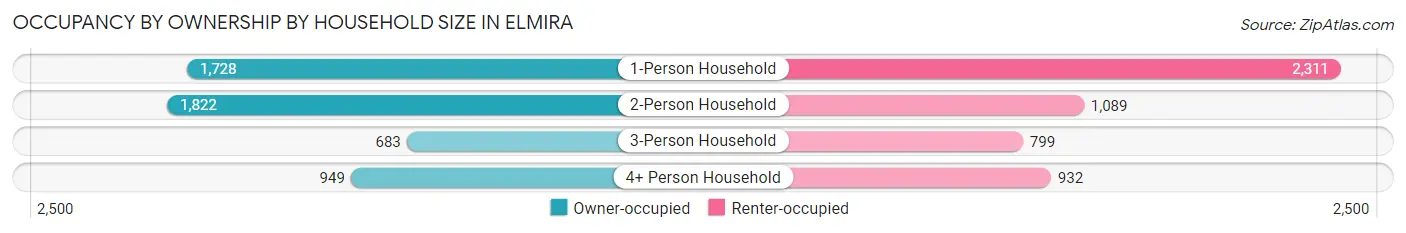
| Household Size | Owner-occupied | Renter-occupied |
| 1-Person Household | 1,728 (42.8%) | 2,311 (57.2%) |
| 2-Person Household | 1,822 (62.6%) | 1,089 (37.4%) |
| 3-Person Household | 683 (46.1%) | 799 (53.9%) |
| 4+ Person Household | 949 (50.4%) | 932 (49.5%) |
| Total Housing Units | 5,182 (50.2%) | 5,131 (49.7%) |
Occupancy by Educational Attainment in Elmira
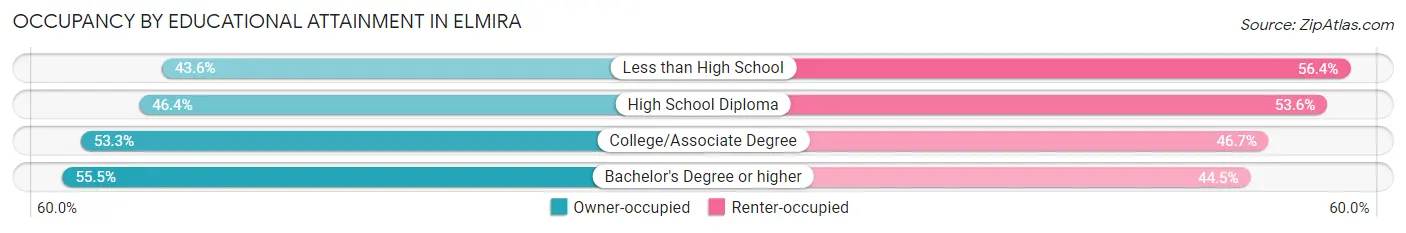
| Household Size | Owner-occupied | Renter-occupied |
| Less than High School | 548 (43.6%) | 708 (56.4%) |
| High School Diploma | 1,606 (46.4%) | 1,858 (53.6%) |
| College/Associate Degree | 1,851 (53.3%) | 1,621 (46.7%) |
| Bachelor's Degree or higher | 1,177 (55.5%) | 944 (44.5%) |
Occupancy by Age of Householder in Elmira
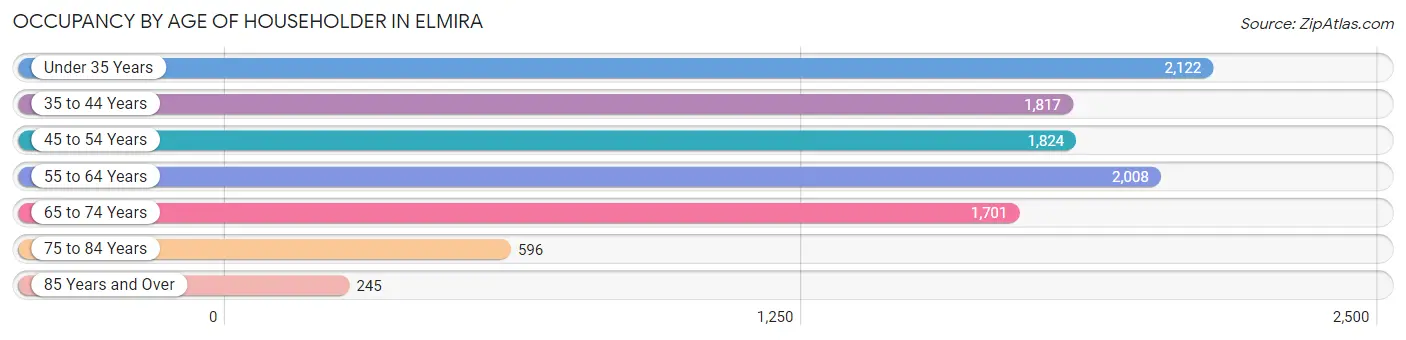
| Age Bracket | # Households | % Households |
| Under 35 Years | 2,122 | 20.6% |
| 35 to 44 Years | 1,817 | 17.6% |
| 45 to 54 Years | 1,824 | 17.7% |
| 55 to 64 Years | 2,008 | 19.5% |
| 65 to 74 Years | 1,701 | 16.5% |
| 75 to 84 Years | 596 | 5.8% |
| 85 Years and Over | 245 | 2.4% |
| Total | 10,313 | 100.0% |
Housing Finances in Elmira
Median Income by Occupancy in Elmira
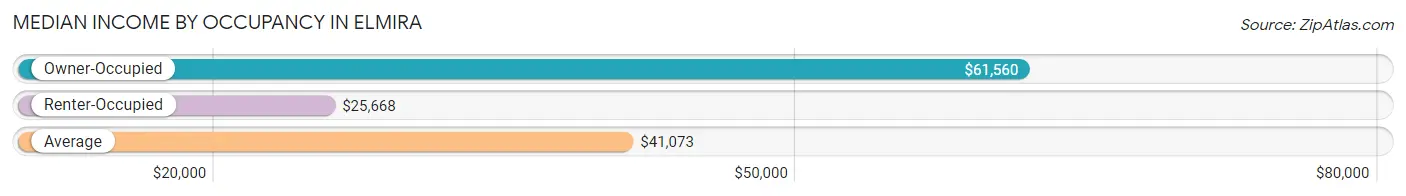
| Occupancy Type | # Households | Median Income |
| Owner-Occupied | 5,182 (50.2%) | $61,560 |
| Renter-Occupied | 5,131 (49.7%) | $25,668 |
| Average | 10,313 (100.0%) | $41,073 |
Occupancy by Householder Income Bracket in Elmira
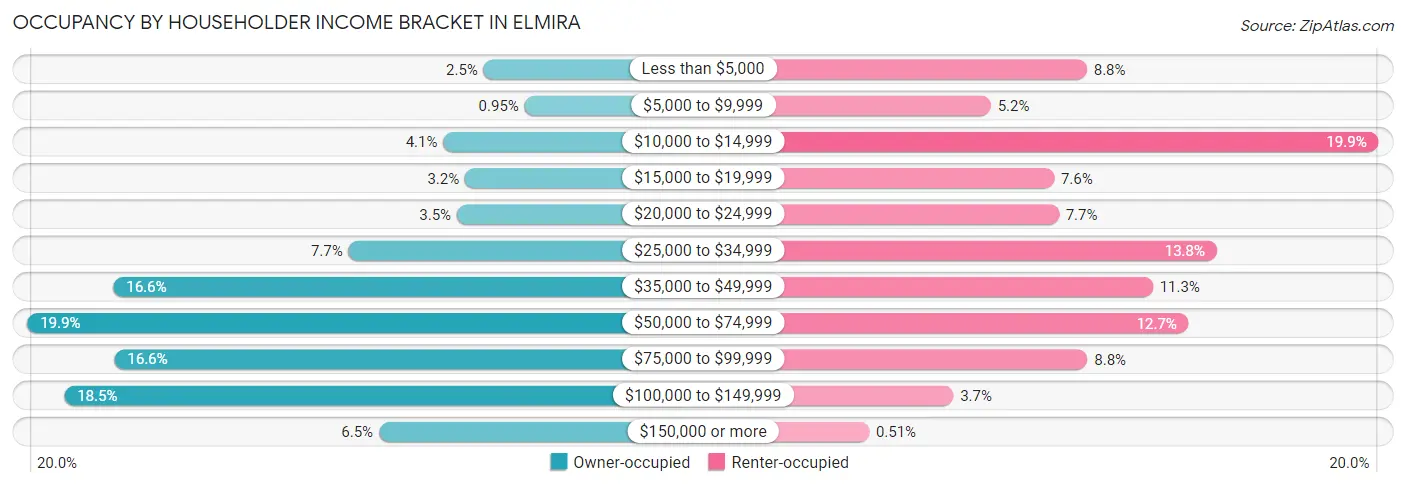
| Income Bracket | Owner-occupied | Renter-occupied |
| Less than $5,000 | 130 (2.5%) | 452 (8.8%) |
| $5,000 to $9,999 | 49 (0.9%) | 264 (5.1%) |
| $10,000 to $14,999 | 210 (4.1%) | 1,022 (19.9%) |
| $15,000 to $19,999 | 167 (3.2%) | 388 (7.6%) |
| $20,000 to $24,999 | 183 (3.5%) | 397 (7.7%) |
| $25,000 to $34,999 | 397 (7.7%) | 706 (13.8%) |
| $35,000 to $49,999 | 861 (16.6%) | 581 (11.3%) |
| $50,000 to $74,999 | 1,031 (19.9%) | 651 (12.7%) |
| $75,000 to $99,999 | 859 (16.6%) | 453 (8.8%) |
| $100,000 to $149,999 | 958 (18.5%) | 191 (3.7%) |
| $150,000 or more | 337 (6.5%) | 26 (0.5%) |
| Total | 5,182 (100.0%) | 5,131 (100.0%) |
Monthly Housing Cost Tiers in Elmira
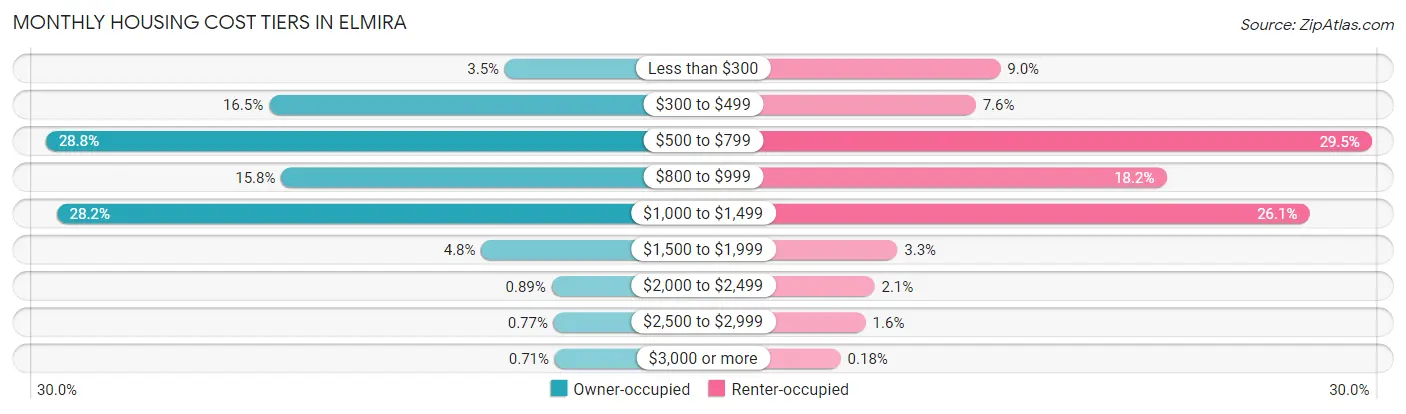
| Monthly Cost | Owner-occupied | Renter-occupied |
| Less than $300 | 180 (3.5%) | 462 (9.0%) |
| $300 to $499 | 855 (16.5%) | 392 (7.6%) |
| $500 to $799 | 1,494 (28.8%) | 1,514 (29.5%) |
| $800 to $999 | 820 (15.8%) | 932 (18.2%) |
| $1,000 to $1,499 | 1,463 (28.2%) | 1,337 (26.1%) |
| $1,500 to $1,999 | 247 (4.8%) | 170 (3.3%) |
| $2,000 to $2,499 | 46 (0.9%) | 105 (2.1%) |
| $2,500 to $2,999 | 40 (0.8%) | 80 (1.6%) |
| $3,000 or more | 37 (0.7%) | 9 (0.2%) |
| Total | 5,182 (100.0%) | 5,131 (100.0%) |
Physical Housing Characteristics in Elmira
Housing Structures in Elmira
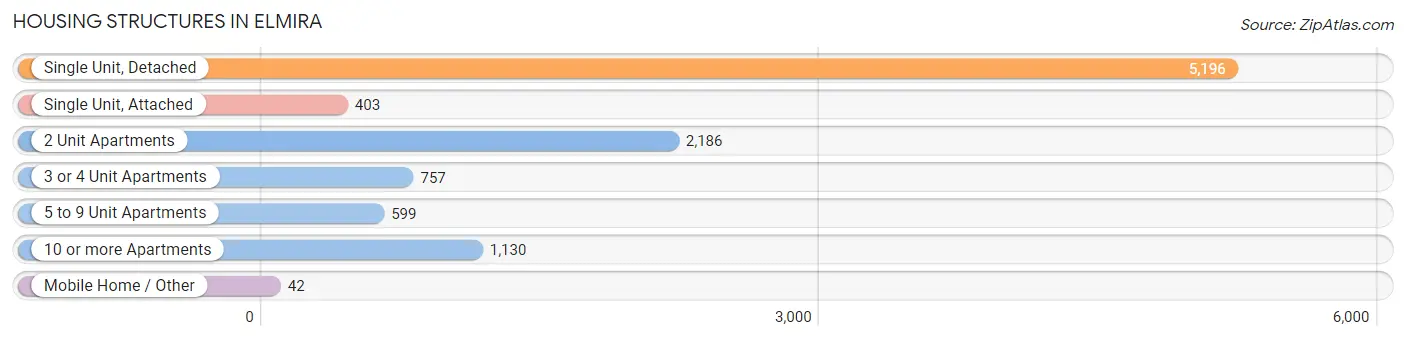
| Structure Type | # Housing Units | % Housing Units |
| Single Unit, Detached | 5,196 | 50.4% |
| Single Unit, Attached | 403 | 3.9% |
| 2 Unit Apartments | 2,186 | 21.2% |
| 3 or 4 Unit Apartments | 757 | 7.3% |
| 5 to 9 Unit Apartments | 599 | 5.8% |
| 10 or more Apartments | 1,130 | 11.0% |
| Mobile Home / Other | 42 | 0.4% |
| Total | 10,313 | 100.0% |
Housing Structures by Occupancy in Elmira
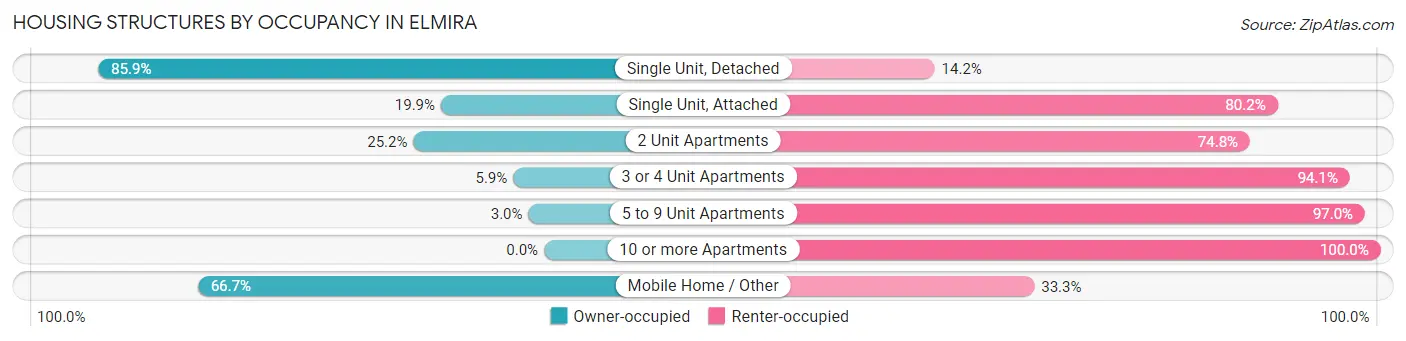
| Structure Type | Owner-occupied | Renter-occupied |
| Single Unit, Detached | 4,461 (85.9%) | 735 (14.1%) |
| Single Unit, Attached | 80 (19.9%) | 323 (80.1%) |
| 2 Unit Apartments | 550 (25.2%) | 1,636 (74.8%) |
| 3 or 4 Unit Apartments | 45 (5.9%) | 712 (94.1%) |
| 5 to 9 Unit Apartments | 18 (3.0%) | 581 (97.0%) |
| 10 or more Apartments | 0 (0.0%) | 1,130 (100.0%) |
| Mobile Home / Other | 28 (66.7%) | 14 (33.3%) |
| Total | 5,182 (50.2%) | 5,131 (49.7%) |
Housing Structures by Number of Rooms in Elmira
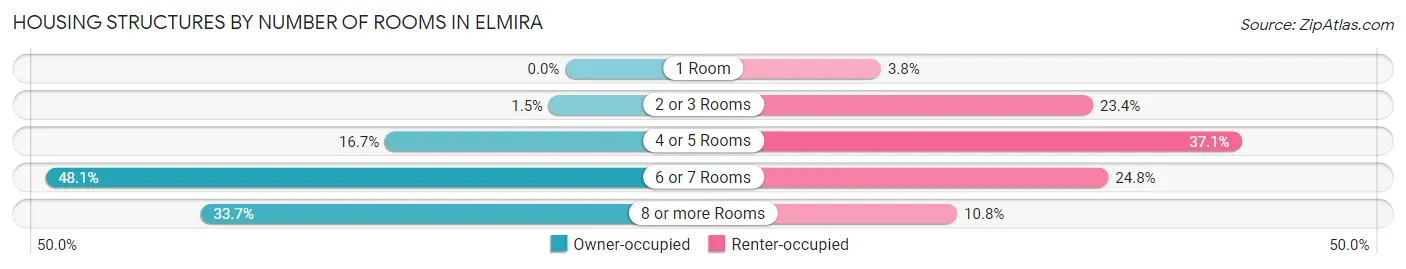
| Number of Rooms | Owner-occupied | Renter-occupied |
| 1 Room | 0 (0.0%) | 195 (3.8%) |
| 2 or 3 Rooms | 78 (1.5%) | 1,201 (23.4%) |
| 4 or 5 Rooms | 864 (16.7%) | 1,905 (37.1%) |
| 6 or 7 Rooms | 2,492 (48.1%) | 1,274 (24.8%) |
| 8 or more Rooms | 1,748 (33.7%) | 556 (10.8%) |
| Total | 5,182 (100.0%) | 5,131 (100.0%) |
Housing Structure by Heating Type in Elmira
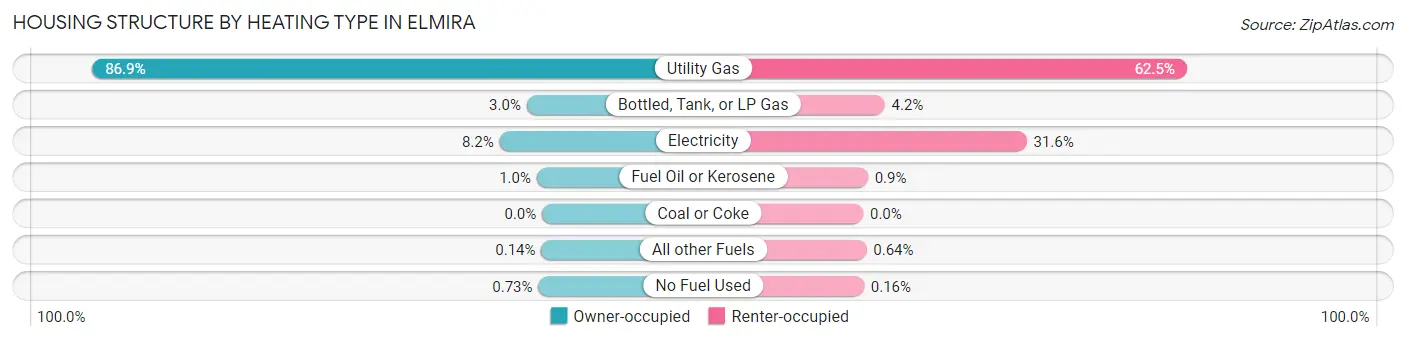
| Heating Type | Owner-occupied | Renter-occupied |
| Utility Gas | 4,504 (86.9%) | 3,209 (62.5%) |
| Bottled, Tank, or LP Gas | 154 (3.0%) | 214 (4.2%) |
| Electricity | 426 (8.2%) | 1,621 (31.6%) |
| Fuel Oil or Kerosene | 53 (1.0%) | 46 (0.9%) |
| Coal or Coke | 0 (0.0%) | 0 (0.0%) |
| All other Fuels | 7 (0.1%) | 33 (0.6%) |
| No Fuel Used | 38 (0.7%) | 8 (0.2%) |
| Total | 5,182 (100.0%) | 5,131 (100.0%) |
Household Vehicle Usage in Elmira
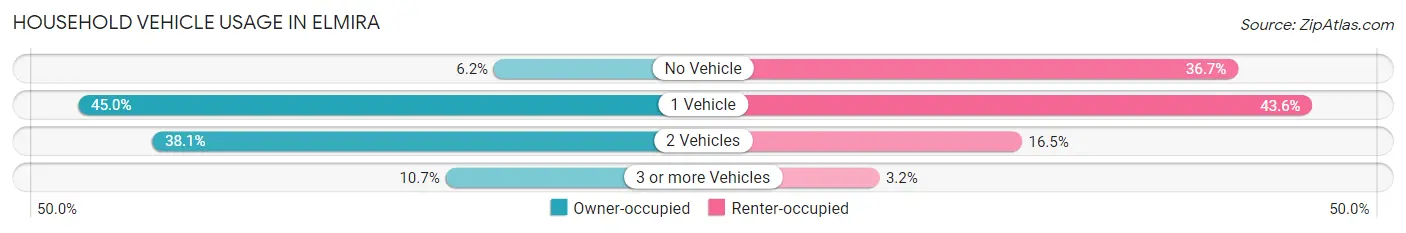
| Vehicles per Household | Owner-occupied | Renter-occupied |
| No Vehicle | 321 (6.2%) | 1,883 (36.7%) |
| 1 Vehicle | 2,332 (45.0%) | 2,239 (43.6%) |
| 2 Vehicles | 1,974 (38.1%) | 846 (16.5%) |
| 3 or more Vehicles | 555 (10.7%) | 163 (3.2%) |
| Total | 5,182 (100.0%) | 5,131 (100.0%) |
Real Estate & Mortgages in Elmira
Real Estate and Mortgage Overview in Elmira
| Characteristic | Without Mortgage | With Mortgage |
| Housing Units | 2,379 | 2,803 |
| Median Property Value | $77,400 | $93,500 |
| Median Household Income | $48,580 | $266 |
| Monthly Housing Costs | $528 | $37 |
| Real Estate Taxes | $2,706 | $89 |
Property Value by Mortgage Status in Elmira
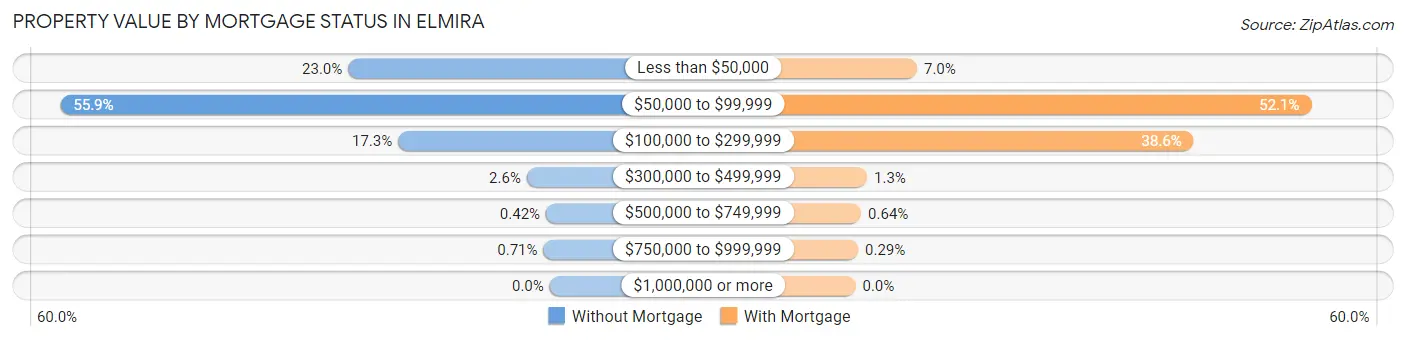
| Property Value | Without Mortgage | With Mortgage |
| Less than $50,000 | 548 (23.0%) | 197 (7.0%) |
| $50,000 to $99,999 | 1,330 (55.9%) | 1,460 (52.1%) |
| $100,000 to $299,999 | 412 (17.3%) | 1,083 (38.6%) |
| $300,000 to $499,999 | 62 (2.6%) | 37 (1.3%) |
| $500,000 to $749,999 | 10 (0.4%) | 18 (0.6%) |
| $750,000 to $999,999 | 17 (0.7%) | 8 (0.3%) |
| $1,000,000 or more | 0 (0.0%) | 0 (0.0%) |
| Total | 2,379 (100.0%) | 2,803 (100.0%) |
Household Income by Mortgage Status in Elmira
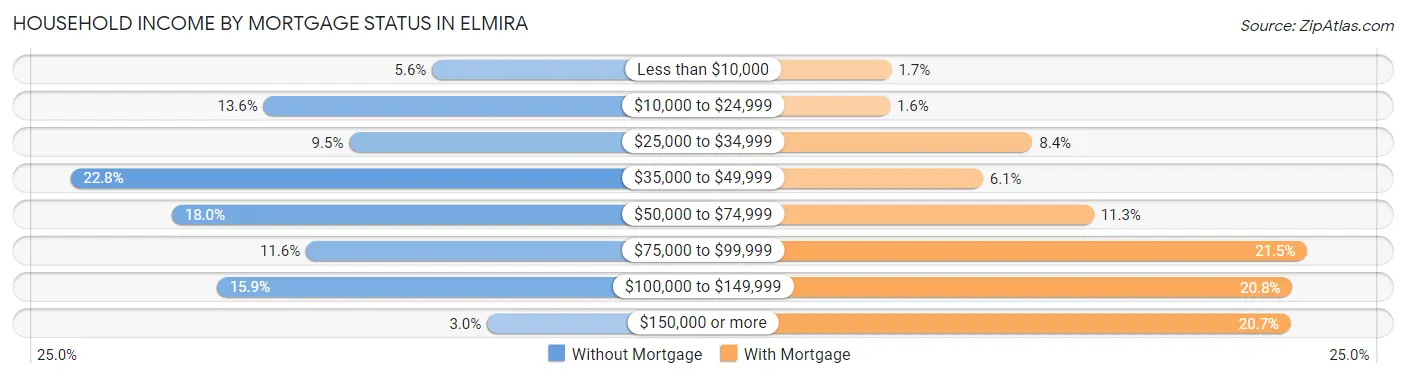
| Household Income | Without Mortgage | With Mortgage |
| Less than $10,000 | 133 (5.6%) | 48 (1.7%) |
| $10,000 to $24,999 | 324 (13.6%) | 46 (1.6%) |
| $25,000 to $34,999 | 227 (9.5%) | 236 (8.4%) |
| $35,000 to $49,999 | 543 (22.8%) | 170 (6.1%) |
| $50,000 to $74,999 | 428 (18.0%) | 318 (11.3%) |
| $75,000 to $99,999 | 276 (11.6%) | 603 (21.5%) |
| $100,000 to $149,999 | 377 (15.9%) | 583 (20.8%) |
| $150,000 or more | 71 (3.0%) | 581 (20.7%) |
| Total | 2,379 (100.0%) | 2,803 (100.0%) |
Property Value to Household Income Ratio in Elmira
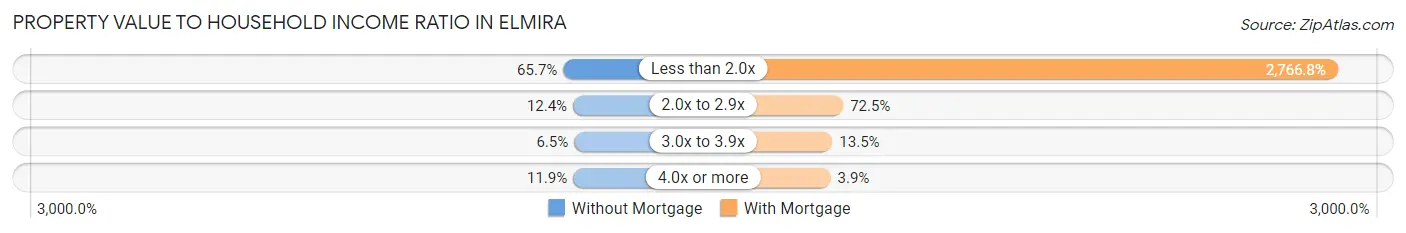
| Value-to-Income Ratio | Without Mortgage | With Mortgage |
| Less than 2.0x | 1,563 (65.7%) | 77,554 (2,766.8%) |
| 2.0x to 2.9x | 295 (12.4%) | 2,031 (72.5%) |
| 3.0x to 3.9x | 155 (6.5%) | 379 (13.5%) |
| 4.0x or more | 282 (11.8%) | 109 (3.9%) |
| Total | 2,379 (100.0%) | 2,803 (100.0%) |
Real Estate Taxes by Mortgage Status in Elmira
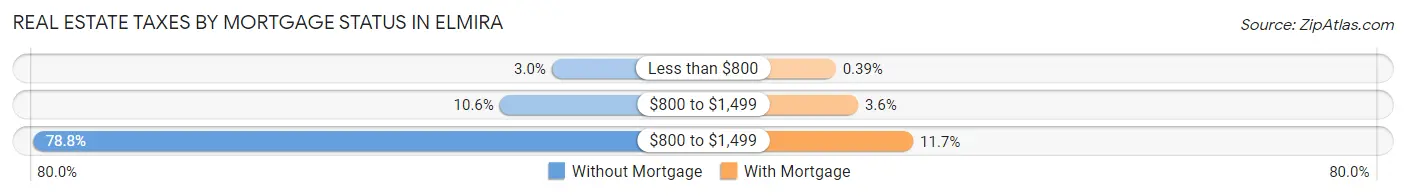
| Property Taxes | Without Mortgage | With Mortgage |
| Less than $800 | 71 (3.0%) | 11 (0.4%) |
| $800 to $1,499 | 252 (10.6%) | 102 (3.6%) |
| $800 to $1,499 | 1,875 (78.8%) | 328 (11.7%) |
| Total | 2,379 (100.0%) | 2,803 (100.0%) |
Health & Disability in Elmira
Health Insurance Coverage by Age in Elmira
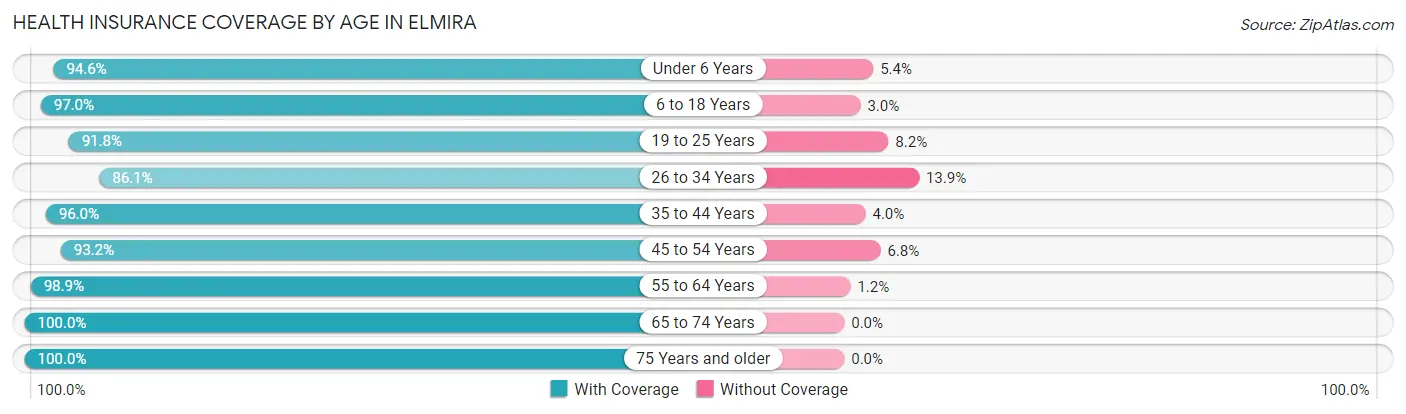
| Age Bracket | With Coverage | Without Coverage |
| Under 6 Years | 1,615 (94.6%) | 92 (5.4%) |
| 6 to 18 Years | 4,619 (97.0%) | 144 (3.0%) |
| 19 to 25 Years | 2,722 (91.8%) | 244 (8.2%) |
| 26 to 34 Years | 2,582 (86.1%) | 418 (13.9%) |
| 35 to 44 Years | 2,788 (96.0%) | 115 (4.0%) |
| 45 to 54 Years | 2,470 (93.2%) | 179 (6.8%) |
| 55 to 64 Years | 3,019 (98.9%) | 35 (1.1%) |
| 65 to 74 Years | 2,524 (100.0%) | 0 (0.0%) |
| 75 Years and older | 1,126 (100.0%) | 0 (0.0%) |
| Total | 23,465 (95.0%) | 1,227 (5.0%) |
Health Insurance Coverage by Citizenship Status in Elmira
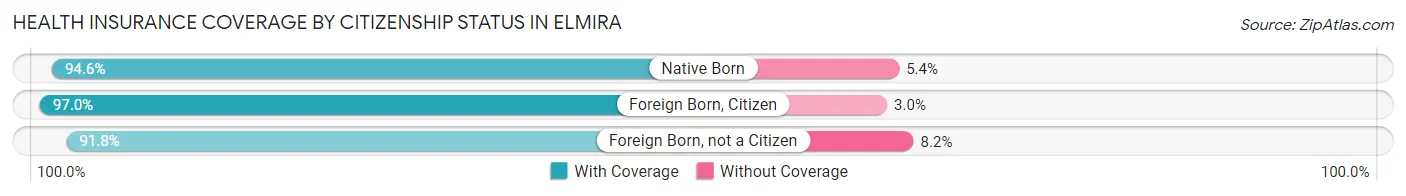
| Citizenship Status | With Coverage | Without Coverage |
| Native Born | 1,615 (94.6%) | 92 (5.4%) |
| Foreign Born, Citizen | 4,619 (97.0%) | 144 (3.0%) |
| Foreign Born, not a Citizen | 2,722 (91.8%) | 244 (8.2%) |
Health Insurance Coverage by Household Income in Elmira
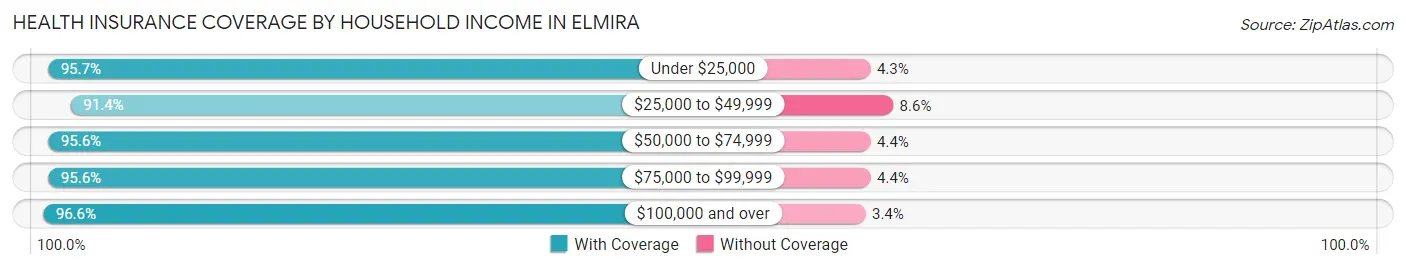
| Household Income | With Coverage | Without Coverage |
| Under $25,000 | 5,272 (95.7%) | 239 (4.3%) |
| $25,000 to $49,999 | 5,025 (91.4%) | 472 (8.6%) |
| $50,000 to $74,999 | 4,486 (95.6%) | 205 (4.4%) |
| $75,000 to $99,999 | 3,435 (95.6%) | 157 (4.4%) |
| $100,000 and over | 4,176 (96.6%) | 148 (3.4%) |
Public vs Private Health Insurance Coverage by Age in Elmira
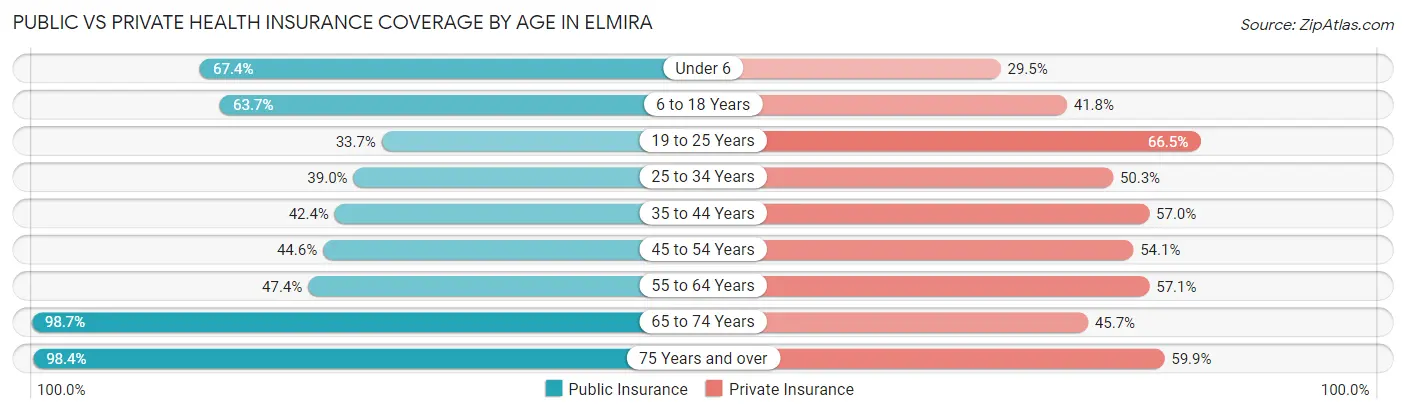
| Age Bracket | Public Insurance | Private Insurance |
| Under 6 | 1,151 (67.4%) | 503 (29.5%) |
| 6 to 18 Years | 3,034 (63.7%) | 1,989 (41.8%) |
| 19 to 25 Years | 1,000 (33.7%) | 1,972 (66.5%) |
| 25 to 34 Years | 1,169 (39.0%) | 1,510 (50.3%) |
| 35 to 44 Years | 1,232 (42.4%) | 1,656 (57.0%) |
| 45 to 54 Years | 1,182 (44.6%) | 1,433 (54.1%) |
| 55 to 64 Years | 1,447 (47.4%) | 1,743 (57.1%) |
| 65 to 74 Years | 2,490 (98.7%) | 1,153 (45.7%) |
| 75 Years and over | 1,108 (98.4%) | 674 (59.9%) |
| Total | 13,813 (55.9%) | 12,633 (51.2%) |
Disability Status by Sex by Age in Elmira
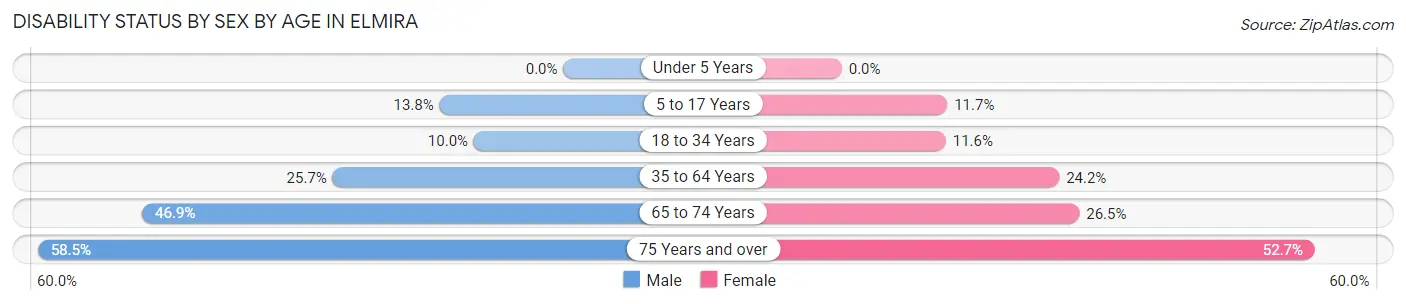
| Age Bracket | Male | Female |
| Under 5 Years | 0 (0.0%) | 0 (0.0%) |
| 5 to 17 Years | 327 (13.8%) | 270 (11.7%) |
| 18 to 34 Years | 335 (10.0%) | 362 (11.6%) |
| 35 to 64 Years | 1,018 (25.7%) | 1,124 (24.2%) |
| 65 to 74 Years | 448 (46.9%) | 415 (26.5%) |
| 75 Years and over | 168 (58.5%) | 442 (52.7%) |
Disability Class by Sex by Age in Elmira
Disability Class: Hearing Difficulty
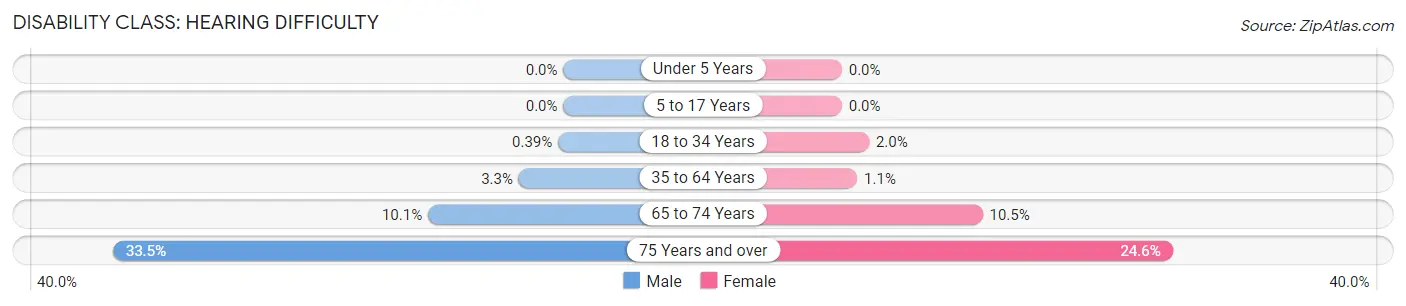
| Age Bracket | Male | Female |
| Under 5 Years | 0 (0.0%) | 0 (0.0%) |
| 5 to 17 Years | 0 (0.0%) | 0 (0.0%) |
| 18 to 34 Years | 13 (0.4%) | 63 (2.0%) |
| 35 to 64 Years | 131 (3.3%) | 53 (1.1%) |
| 65 to 74 Years | 96 (10.1%) | 164 (10.4%) |
| 75 Years and over | 96 (33.5%) | 206 (24.5%) |
Disability Class: Vision Difficulty
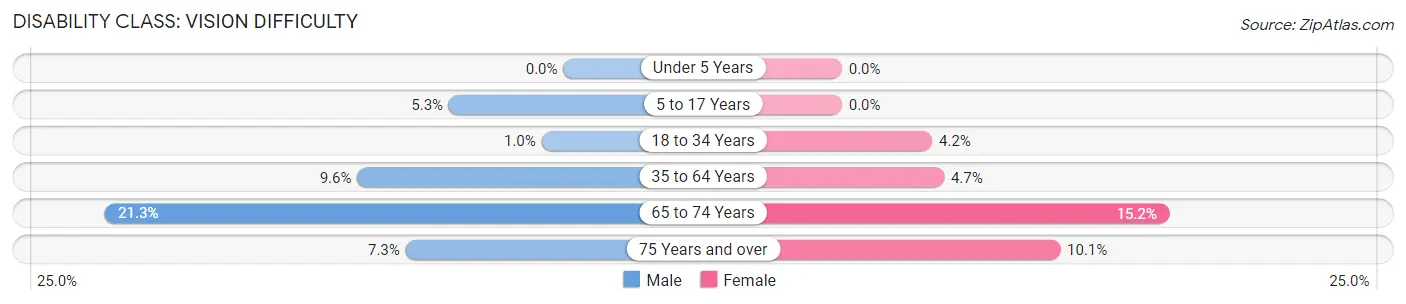
| Age Bracket | Male | Female |
| Under 5 Years | 0 (0.0%) | 0 (0.0%) |
| 5 to 17 Years | 126 (5.3%) | 0 (0.0%) |
| 18 to 34 Years | 34 (1.0%) | 131 (4.2%) |
| 35 to 64 Years | 379 (9.6%) | 220 (4.7%) |
| 65 to 74 Years | 203 (21.3%) | 238 (15.2%) |
| 75 Years and over | 21 (7.3%) | 85 (10.1%) |
Disability Class: Cognitive Difficulty
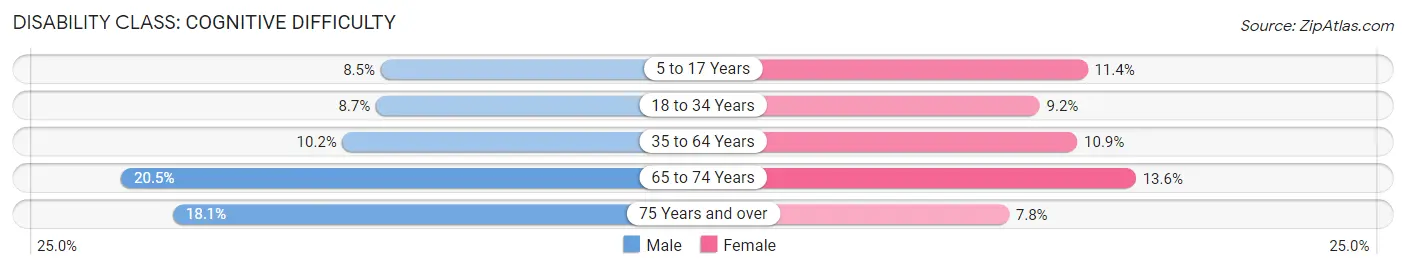
| Age Bracket | Male | Female |
| 5 to 17 Years | 201 (8.5%) | 262 (11.4%) |
| 18 to 34 Years | 292 (8.7%) | 287 (9.2%) |
| 35 to 64 Years | 406 (10.2%) | 507 (10.9%) |
| 65 to 74 Years | 196 (20.5%) | 214 (13.6%) |
| 75 Years and over | 52 (18.1%) | 65 (7.7%) |
Disability Class: Ambulatory Difficulty
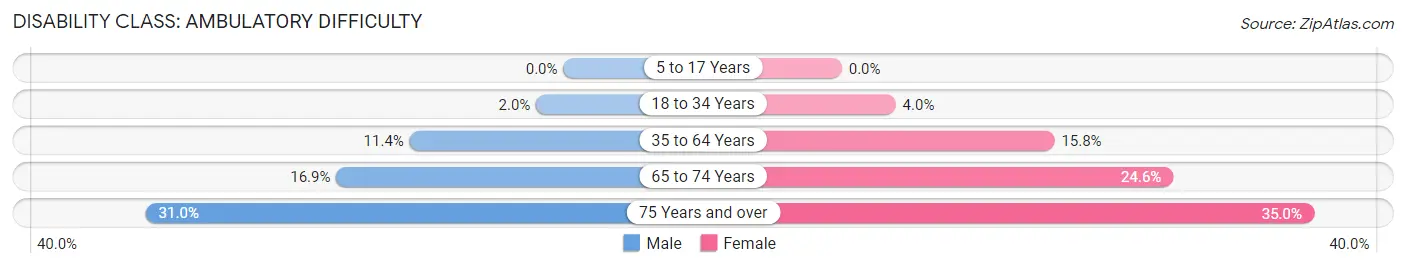
| Age Bracket | Male | Female |
| 5 to 17 Years | 0 (0.0%) | 0 (0.0%) |
| 18 to 34 Years | 68 (2.0%) | 125 (4.0%) |
| 35 to 64 Years | 452 (11.4%) | 733 (15.8%) |
| 65 to 74 Years | 161 (16.9%) | 386 (24.6%) |
| 75 Years and over | 89 (31.0%) | 294 (35.0%) |
Disability Class: Self-Care Difficulty
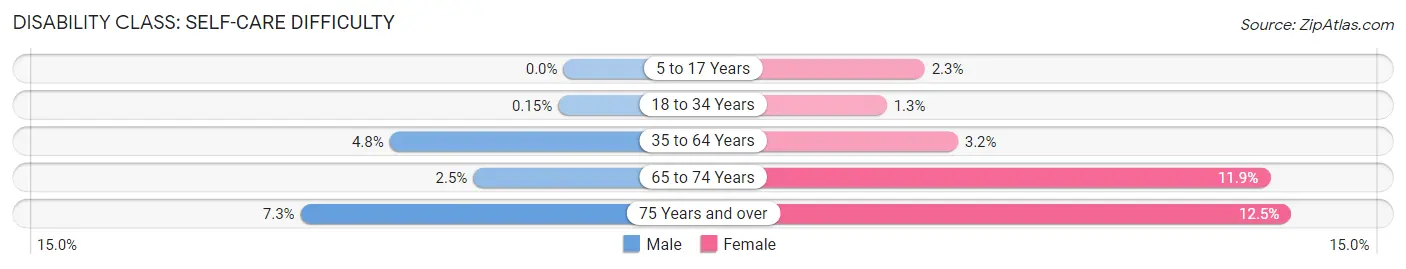
| Age Bracket | Male | Female |
| 5 to 17 Years | 0 (0.0%) | 53 (2.3%) |
| 18 to 34 Years | 5 (0.2%) | 39 (1.3%) |
| 35 to 64 Years | 192 (4.8%) | 150 (3.2%) |
| 65 to 74 Years | 24 (2.5%) | 187 (11.9%) |
| 75 Years and over | 21 (7.3%) | 105 (12.5%) |
Technology Access in Elmira
Computing Device Access in Elmira
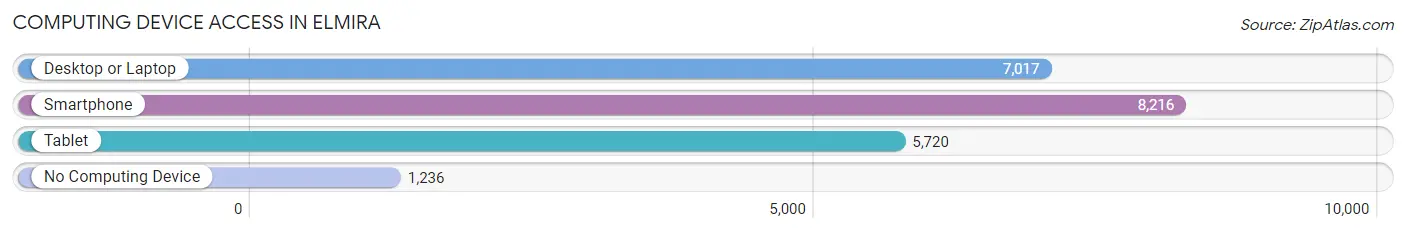
| Device Type | # Households | % Households |
| Desktop or Laptop | 7,017 | 68.0% |
| Smartphone | 8,216 | 79.7% |
| Tablet | 5,720 | 55.5% |
| No Computing Device | 1,236 | 12.0% |
| Total | 10,313 | 100.0% |
Internet Access in Elmira
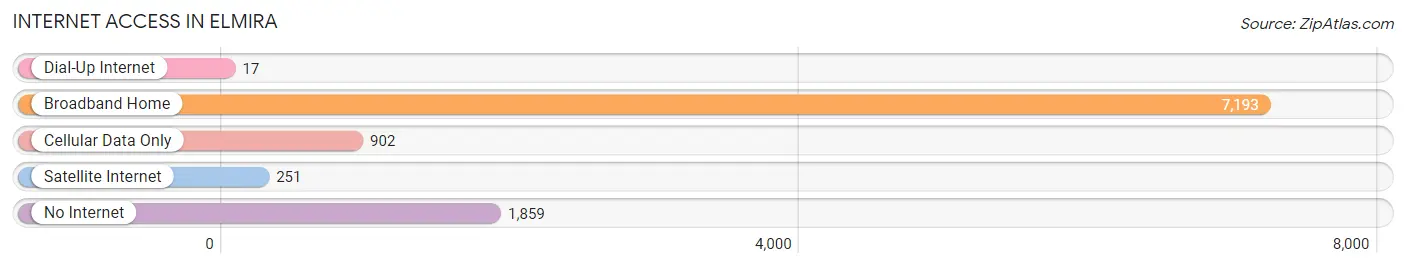
| Internet Type | # Households | % Households |
| Dial-Up Internet | 17 | 0.2% |
| Broadband Home | 7,193 | 69.8% |
| Cellular Data Only | 902 | 8.7% |
| Satellite Internet | 251 | 2.4% |
| No Internet | 1,859 | 18.0% |
| Total | 10,313 | 100.0% |
Elmira Summary
Elmira, New York is a city located in Chemung County in the Southern Tier region of New York State. It is situated in the Finger Lakes region of the state, and is the county seat of Chemung County. The city is located on the Chemung River, and is the largest city in the county. The city has a population of approximately 29,200 people, according to the 2010 census.
History
The area that is now Elmira was originally inhabited by the Iroquois Native American tribe. The first European settlers arrived in the area in the late 1700s, and the city was officially founded in 1791. The city was named after the daughter of the founder, Colonel Samuel Campbell.
In the early 1800s, the city became an important transportation hub, as it was located at the intersection of two major transportation routes. The Chemung Canal, which connected the Susquehanna and Chenango Rivers, and the Chemung Railroad, which connected Elmira to the Erie Canal, both ran through the city.
During the Civil War, Elmira was the site of a Union prison camp, known as the Elmira Prison Camp. The camp was established in 1864, and housed Confederate prisoners of war. The camp was notorious for its poor conditions, and was the site of a large number of deaths due to disease and malnutrition.
Geography
Elmira is located in the Finger Lakes region of New York State, in the Southern Tier region. The city is situated on the Chemung River, and is the county seat of Chemung County. The city is located at the intersection of two major transportation routes, the Chemung Canal and the Chemung Railroad.
The city has a total area of 8.3 square miles, of which 8.2 square miles is land and 0.1 square miles is water. The city is located at an elevation of 1,067 feet above sea level.
Economy
Elmira’s economy is largely based on manufacturing and healthcare. The city is home to several large manufacturing companies, including Corning Incorporated, which produces glass and ceramics, and Dresser-Rand, which produces industrial equipment. The city is also home to several healthcare providers, including Arnot Ogden Medical Center and St. Joseph’s Hospital.
The city is also home to several educational institutions, including Elmira College, Corning Community College, and the Elmira Business Institute.
Demographics
As of the 2010 census, the city had a population of 29,200 people. The racial makeup of the city was 87.3% White, 8.2% African American, 0.5% Native American, 1.2% Asian, 0.1% Pacific Islander, 0.7% from other races, and 2.1% from two or more races. Hispanic or Latino of any race were 2.7% of the population.
The median income for a household in the city was $33,945, and the median income for a family was $41,945. The per capita income for the city was $19,845. About 17.2% of families and 20.7% of the population were below the poverty line, including 28.2% of those under age 18 and 11.2% of those age 65 or over.
Common Questions
What is Per Capita Income in Elmira?
Per Capita income in Elmira is $22,259.
What is the Median Family Income in Elmira?
Median Family Income in Elmira is $51,610.
What is the Median Household income in Elmira?
Median Household Income in Elmira is $41,073.
What is Income or Wage Gap in Elmira?
Income or Wage Gap in Elmira is 24.4%.
Women in Elmira earn 75.6 cents for every dollar earned by a man.
What is Family Income Deficit in Elmira?
Family Income Deficit in Elmira is $9,900.
Families that are below poverty line in Elmira earn $9,900 less on average than the poverty threshold level.
What is Inequality or Gini Index in Elmira?
Inequality or Gini Index in Elmira is 0.46.
What is the Total Population of Elmira?
Total Population of Elmira is 26,494.
What is the Total Male Population of Elmira?
Total Male Population of Elmira is 13,143.
What is the Total Female Population of Elmira?
Total Female Population of Elmira is 13,351.
What is the Ratio of Males per 100 Females in Elmira?
There are 98.44 Males per 100 Females in Elmira.
What is the Ratio of Females per 100 Males in Elmira?
There are 101.58 Females per 100 Males in Elmira.
What is the Median Population Age in Elmira?
Median Population Age in Elmira is 35.9 Years.
What is the Average Family Size in Elmira
Average Family Size in Elmira is 3.0 People.
What is the Average Household Size in Elmira
Average Household Size in Elmira is 2.3 People.
How Large is the Labor Force in Elmira?
There are 11,386 People in the Labor Forcein in Elmira.
What is the Percentage of People in the Labor Force in Elmira?
54.2% of People are in the Labor Force in Elmira.
What is the Unemployment Rate in Elmira?
Unemployment Rate in Elmira is 9.8%.