Elizabethtown, NY Map & Demographics
Elizabethtown Map
Elizabethtown Overview
$35,308
PER CAPITA INCOME
$70,417
AVG FAMILY INCOME
$61,023
AVG HOUSEHOLD INCOME
11.5%
WAGE / INCOME GAP [ % ]
88.5¢/ $1
WAGE / INCOME GAP [ $ ]
0.39
INEQUALITY / GINI INDEX
553
TOTAL POPULATION
263
MALE POPULATION
290
FEMALE POPULATION
90.69
MALES / 100 FEMALES
110.27
FEMALES / 100 MALES
56.6
MEDIAN AGE
2.6
AVG FAMILY SIZE
1.8
AVG HOUSEHOLD SIZE
219
LABOR FORCE [ PEOPLE ]
45.8%
PERCENT IN LABOR FORCE
5.5%
UNEMPLOYMENT RATE
Elizabethtown Zip Codes
Elizabethtown Area Codes
Income in Elizabethtown
Income Overview in Elizabethtown
Per Capita Income in Elizabethtown is $35,308, while median incomes of families and households are $70,417 and $61,023 respectively.
| Characteristic | Number | Measure |
| Per Capita Income | 553 | $35,308 |
| Median Family Income | 87 | $70,417 |
| Mean Family Income | 87 | $71,529 |
| Median Household Income | 255 | $61,023 |
| Mean Household Income | 255 | $68,914 |
| Income Deficit | 87 | $0 |
| Wage / Income Gap (%) | 553 | 11.48% |
| Wage / Income Gap ($) | 553 | 88.52¢ per $1 |
| Gini / Inequality Index | 553 | 0.39 |
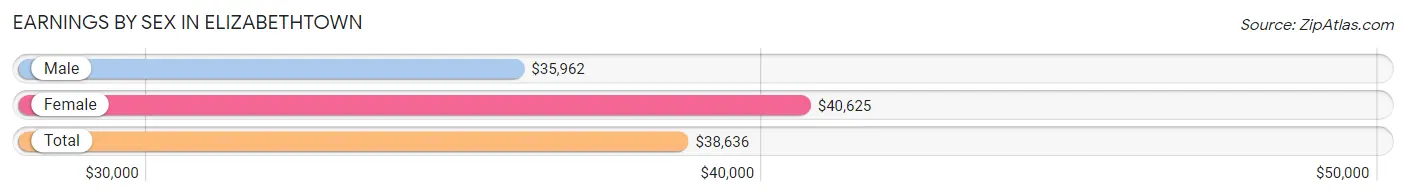
Earnings by Sex in Elizabethtown
Average Earnings in Elizabethtown are $38,636, $35,962 for men and $40,625 for women, a difference of 11.5%.
| Sex | Number | Average Earnings |
| Male | 150 (57.3%) | $35,962 |
| Female | 112 (42.7%) | $40,625 |
| Total | 262 (100.0%) | $38,636 |
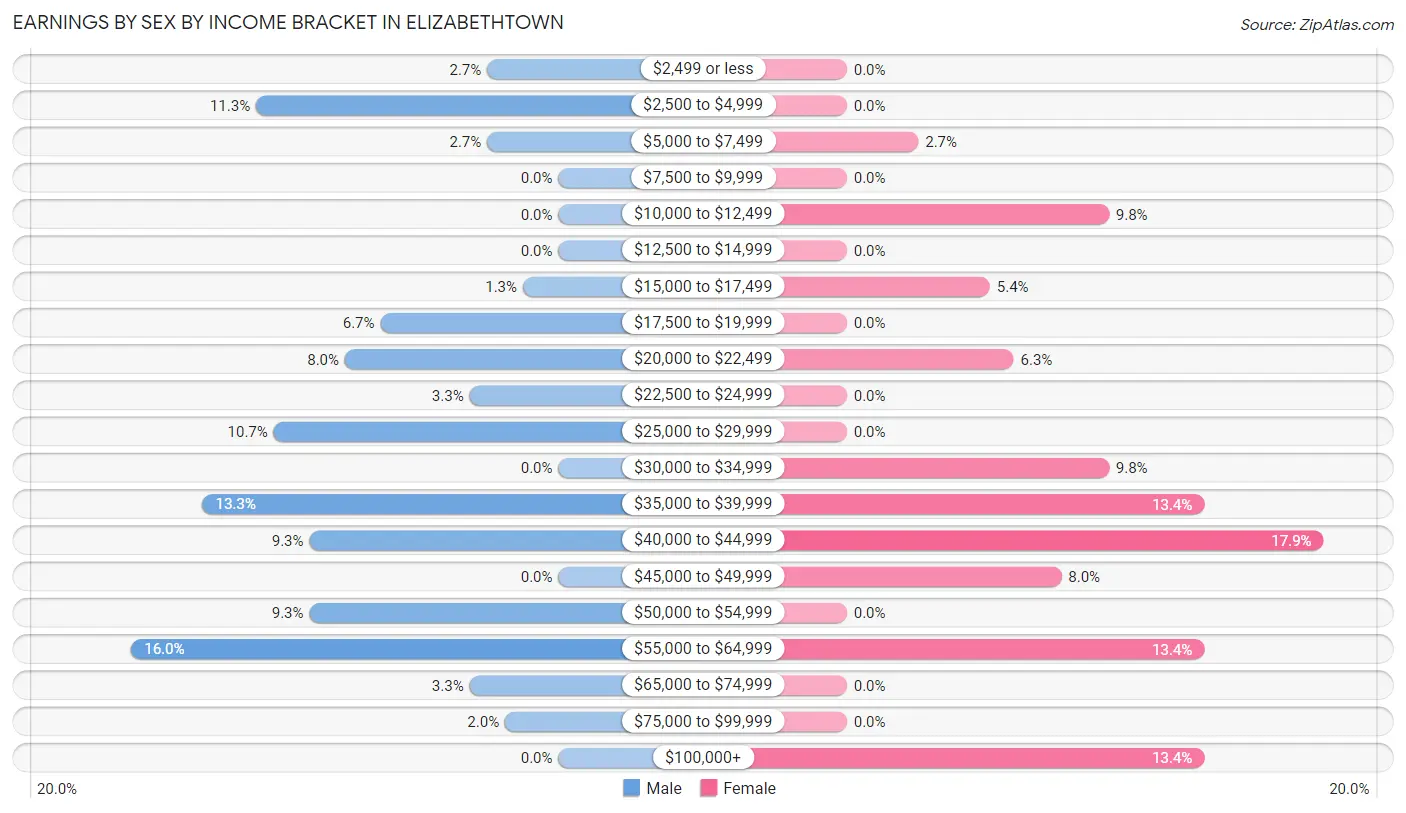
Earnings by Sex by Income Bracket in Elizabethtown
The most common earnings brackets in Elizabethtown are $55,000 to $64,999 for men (24 | 16.0%) and $40,000 to $44,999 for women (20 | 17.9%).
| Income | Male | Female |
| $2,499 or less | 4 (2.7%) | 0 (0.0%) |
| $2,500 to $4,999 | 17 (11.3%) | 0 (0.0%) |
| $5,000 to $7,499 | 4 (2.7%) | 3 (2.7%) |
| $7,500 to $9,999 | 0 (0.0%) | 0 (0.0%) |
| $10,000 to $12,499 | 0 (0.0%) | 11 (9.8%) |
| $12,500 to $14,999 | 0 (0.0%) | 0 (0.0%) |
| $15,000 to $17,499 | 2 (1.3%) | 6 (5.4%) |
| $17,500 to $19,999 | 10 (6.7%) | 0 (0.0%) |
| $20,000 to $22,499 | 12 (8.0%) | 7 (6.2%) |
| $22,500 to $24,999 | 5 (3.3%) | 0 (0.0%) |
| $25,000 to $29,999 | 16 (10.7%) | 0 (0.0%) |
| $30,000 to $34,999 | 0 (0.0%) | 11 (9.8%) |
| $35,000 to $39,999 | 20 (13.3%) | 15 (13.4%) |
| $40,000 to $44,999 | 14 (9.3%) | 20 (17.9%) |
| $45,000 to $49,999 | 0 (0.0%) | 9 (8.0%) |
| $50,000 to $54,999 | 14 (9.3%) | 0 (0.0%) |
| $55,000 to $64,999 | 24 (16.0%) | 15 (13.4%) |
| $65,000 to $74,999 | 5 (3.3%) | 0 (0.0%) |
| $75,000 to $99,999 | 3 (2.0%) | 0 (0.0%) |
| $100,000+ | 0 (0.0%) | 15 (13.4%) |
| Total | 150 (100.0%) | 112 (100.0%) |
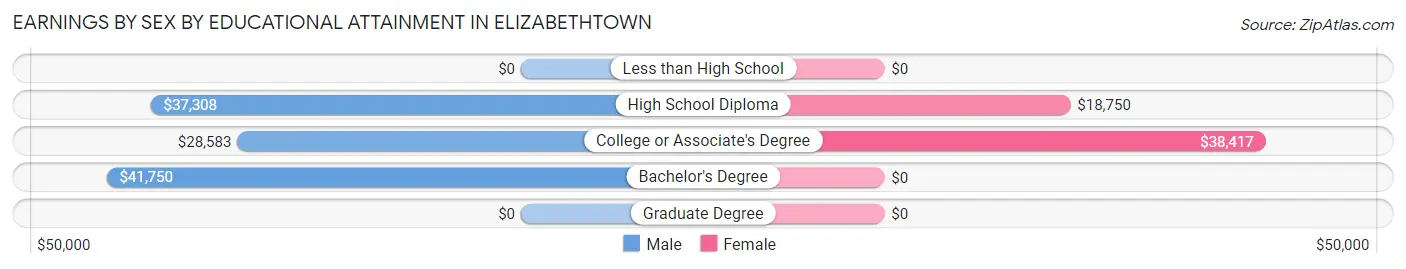
Earnings by Sex by Educational Attainment in Elizabethtown
Average earnings in Elizabethtown are $36,346 for men and $39,083 for women, a difference of 7.0%. Men with an educational attainment of bachelor's degree enjoy the highest average annual earnings of $41,750, while those with college or associate's degree education earn the least with $28,583. Women with an educational attainment of college or associate's degree earn the most with the average annual earnings of $38,417, while those with high school diploma education have the smallest earnings of $18,750.
| Educational Attainment | Male Income | Female Income |
| Less than High School | - | - |
| High School Diploma | $37,308 | $18,750 |
| College or Associate's Degree | $28,583 | $38,417 |
| Bachelor's Degree | $41,750 | $0 |
| Graduate Degree | - | - |
| Total | $36,346 | $39,083 |
Family Income in Elizabethtown
Family Income Brackets in Elizabethtown
According to the Elizabethtown family income data, there are 21 families falling into the $75,000 to $99,999 income range, which is the most common income bracket and makes up 24.1% of all families.
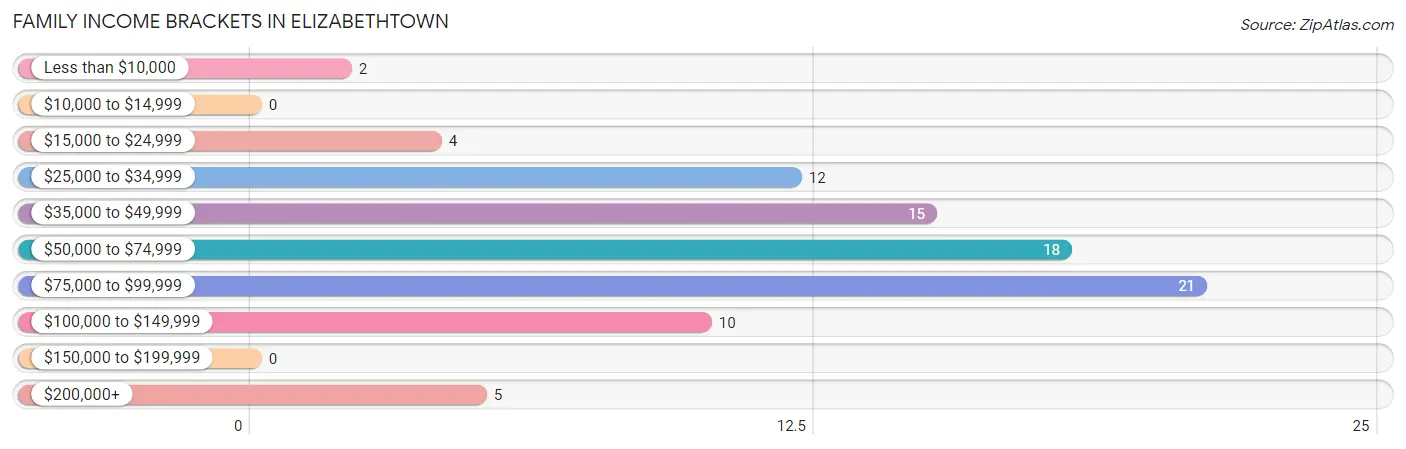
| Income Bracket | # Families | % Families |
| Less than $10,000 | 2 | 2.3% |
| $10,000 to $14,999 | 0 | 0.0% |
| $15,000 to $24,999 | 4 | 4.6% |
| $25,000 to $34,999 | 12 | 13.8% |
| $35,000 to $49,999 | 15 | 17.2% |
| $50,000 to $74,999 | 18 | 20.7% |
| $75,000 to $99,999 | 21 | 24.1% |
| $100,000 to $149,999 | 10 | 11.5% |
| $150,000 to $199,999 | 0 | 0.0% |
| $200,000+ | 5 | 5.7% |
Family Income by Famaliy Size in Elizabethtown
2-person families (61 | 70.1%) account for the highest median family income in Elizabethtown with $72,083 per family, while 2-person families (61 | 70.1%) have the highest median income of $36,042 per family member.
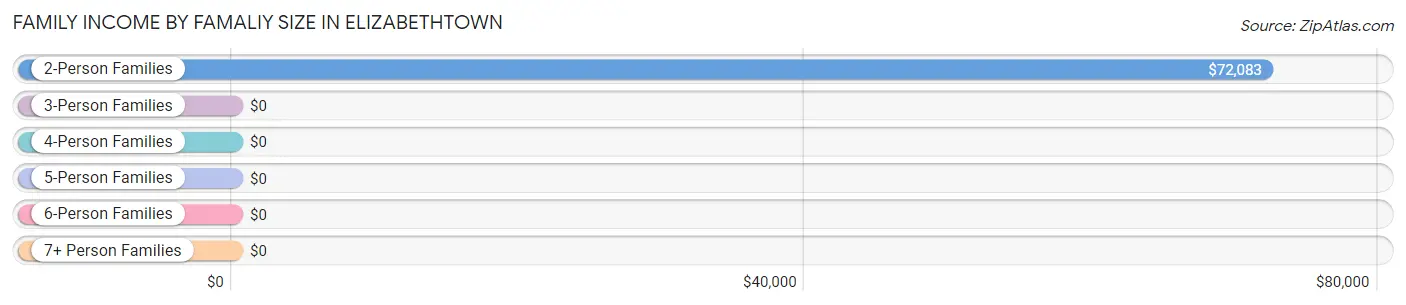
| Income Bracket | # Families | Median Income |
| 2-Person Families | 61 (70.1%) | $72,083 |
| 3-Person Families | 11 (12.6%) | $0 |
| 4-Person Families | 0 (0.0%) | $0 |
| 5-Person Families | 15 (17.2%) | $0 |
| 6-Person Families | 0 (0.0%) | $0 |
| 7+ Person Families | 0 (0.0%) | $0 |
| Total | 87 (100.0%) | $70,417 |
Family Income by Number of Earners in Elizabethtown
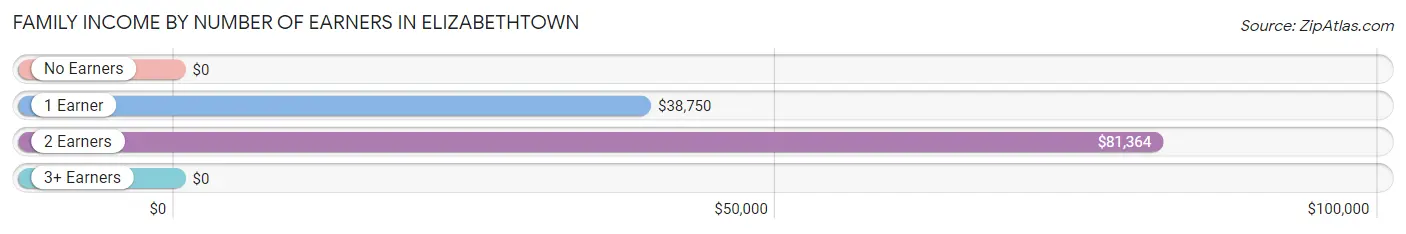
| Number of Earners | # Families | Median Income |
| No Earners | 14 (16.1%) | $0 |
| 1 Earner | 39 (44.8%) | $38,750 |
| 2 Earners | 34 (39.1%) | $81,364 |
| 3+ Earners | 0 (0.0%) | $0 |
| Total | 87 (100.0%) | $70,417 |
Household Income in Elizabethtown
Household Income Brackets in Elizabethtown
With 51 households falling in the category, the $50,000 to $74,999 income range is the most frequent in Elizabethtown, accounting for 20.0% of all households. In contrast, only 5 households (2.0%) fall into the $200,000+ income bracket, making it the least populous group.
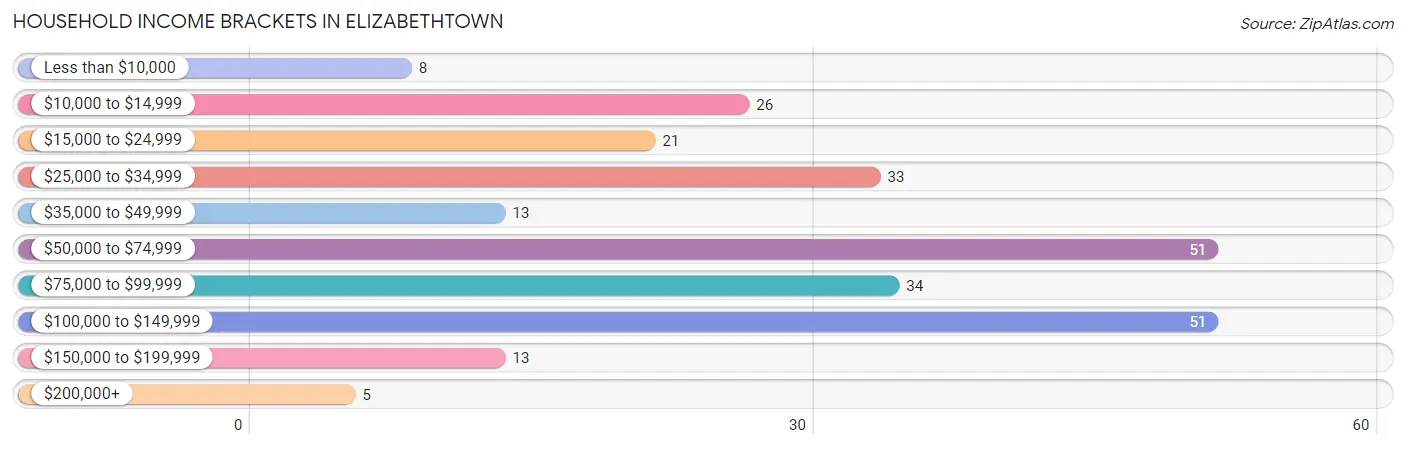
| Income Bracket | # Households | % Households |
| Less than $10,000 | 8 | 3.1% |
| $10,000 to $14,999 | 26 | 10.2% |
| $15,000 to $24,999 | 21 | 8.2% |
| $25,000 to $34,999 | 33 | 12.9% |
| $35,000 to $49,999 | 13 | 5.1% |
| $50,000 to $74,999 | 51 | 20.0% |
| $75,000 to $99,999 | 34 | 13.3% |
| $100,000 to $149,999 | 51 | 20.0% |
| $150,000 to $199,999 | 13 | 5.1% |
| $200,000+ | 5 | 2.0% |
Household Income by Householder Age in Elizabethtown
The median household income in Elizabethtown is $61,023, with the highest median household income of $113,000 found in the 25 to 44 years age bracket for the primary householder. A total of 54 households (21.2%) fall into this category. Meanwhile, the 15 to 24 years age bracket for the primary householder has the lowest median household income of $0, with 8 households (3.1%) in this group.
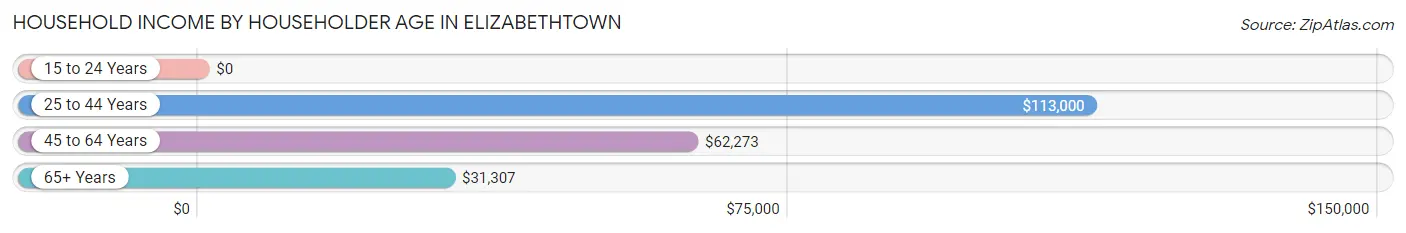
| Income Bracket | # Households | Median Income |
| 15 to 24 Years | 8 (3.1%) | $0 |
| 25 to 44 Years | 54 (21.2%) | $113,000 |
| 45 to 64 Years | 104 (40.8%) | $62,273 |
| 65+ Years | 89 (34.9%) | $31,307 |
| Total | 255 (100.0%) | $61,023 |
Poverty in Elizabethtown
Income Below Poverty by Sex and Age in Elizabethtown
With 11.3% poverty level for males and 15.3% for females among the residents of Elizabethtown, 65 to 74 year old males and 45 to 54 year old females are the most vulnerable to poverty, with 16 males (33.3%) and 16 females (57.1%) in their respective age groups living below the poverty level.
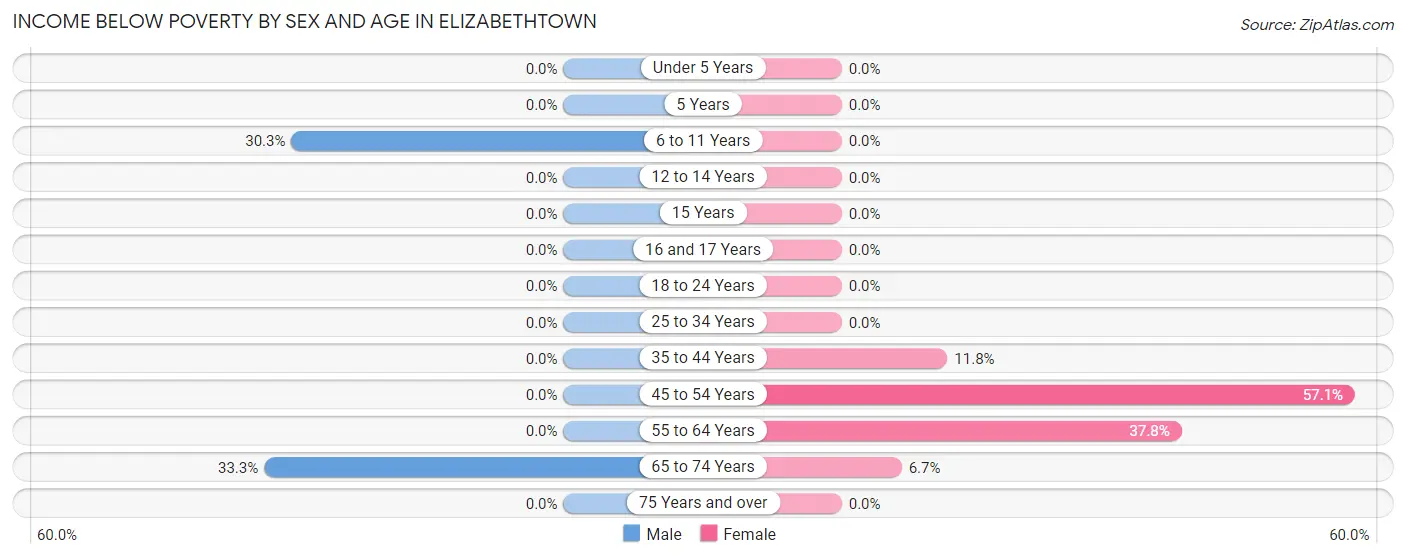
| Age Bracket | Male | Female |
| Under 5 Years | 0 (0.0%) | 0 (0.0%) |
| 5 Years | 0 (0.0%) | 0 (0.0%) |
| 6 to 11 Years | 10 (30.3%) | 0 (0.0%) |
| 12 to 14 Years | 0 (0.0%) | 0 (0.0%) |
| 15 Years | 0 (0.0%) | 0 (0.0%) |
| 16 and 17 Years | 0 (0.0%) | 0 (0.0%) |
| 18 to 24 Years | 0 (0.0%) | 0 (0.0%) |
| 25 to 34 Years | 0 (0.0%) | 0 (0.0%) |
| 35 to 44 Years | 0 (0.0%) | 2 (11.8%) |
| 45 to 54 Years | 0 (0.0%) | 16 (57.1%) |
| 55 to 64 Years | 0 (0.0%) | 14 (37.8%) |
| 65 to 74 Years | 16 (33.3%) | 3 (6.7%) |
| 75 Years and over | 0 (0.0%) | 0 (0.0%) |
| Total | 26 (11.3%) | 35 (15.3%) |
Income Above Poverty by Sex and Age in Elizabethtown
According to the poverty statistics in Elizabethtown, males aged under 5 years and females aged 6 to 11 years are the age groups that are most secure financially, with 100.0% of males and 100.0% of females in these age groups living above the poverty line.
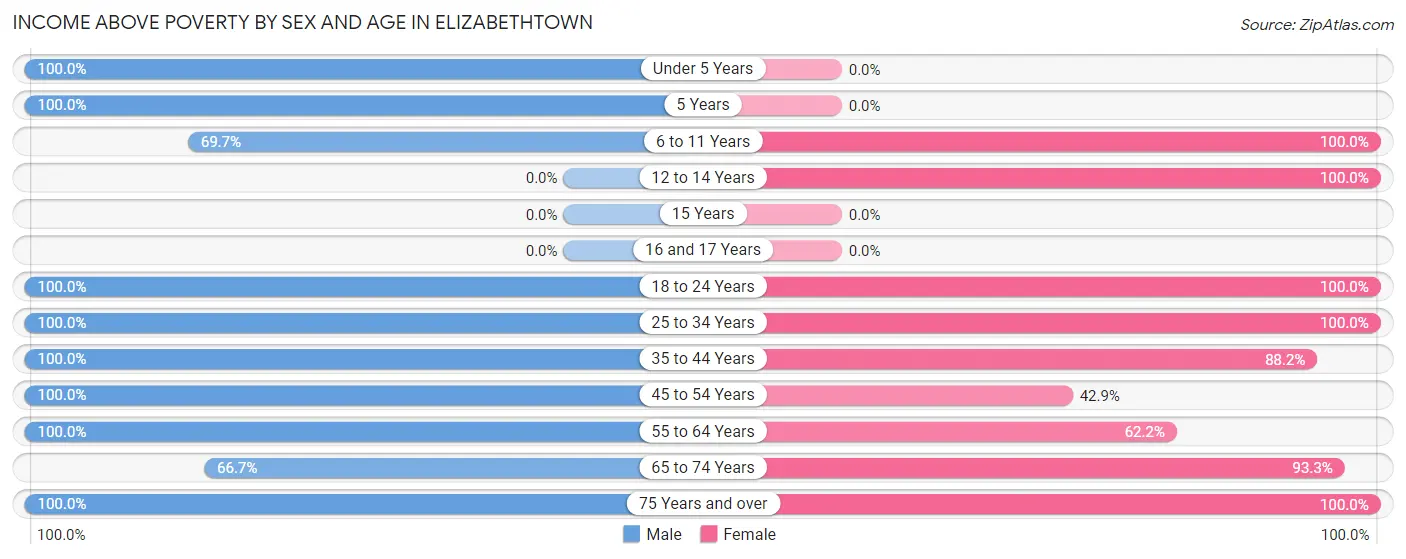
| Age Bracket | Male | Female |
| Under 5 Years | 9 (100.0%) | 0 (0.0%) |
| 5 Years | 11 (100.0%) | 0 (0.0%) |
| 6 to 11 Years | 23 (69.7%) | 6 (100.0%) |
| 12 to 14 Years | 0 (0.0%) | 9 (100.0%) |
| 15 Years | 0 (0.0%) | 0 (0.0%) |
| 16 and 17 Years | 0 (0.0%) | 0 (0.0%) |
| 18 to 24 Years | 4 (100.0%) | 17 (100.0%) |
| 25 to 34 Years | 48 (100.0%) | 37 (100.0%) |
| 35 to 44 Years | 11 (100.0%) | 15 (88.2%) |
| 45 to 54 Years | 21 (100.0%) | 12 (42.9%) |
| 55 to 64 Years | 41 (100.0%) | 23 (62.2%) |
| 65 to 74 Years | 32 (66.7%) | 42 (93.3%) |
| 75 Years and over | 5 (100.0%) | 32 (100.0%) |
| Total | 205 (88.7%) | 193 (84.7%) |
Income Below Poverty Among Married-Couple Families in Elizabethtown
The poverty statistics for married-couple families in Elizabethtown show that 10.3% or 4 of the total 39 families live below the poverty line. Families with no children have the highest poverty rate of 10.3%, comprising of 4 families. On the other hand, families with no children have the lowest poverty rate of 10.3%, which includes 4 families.
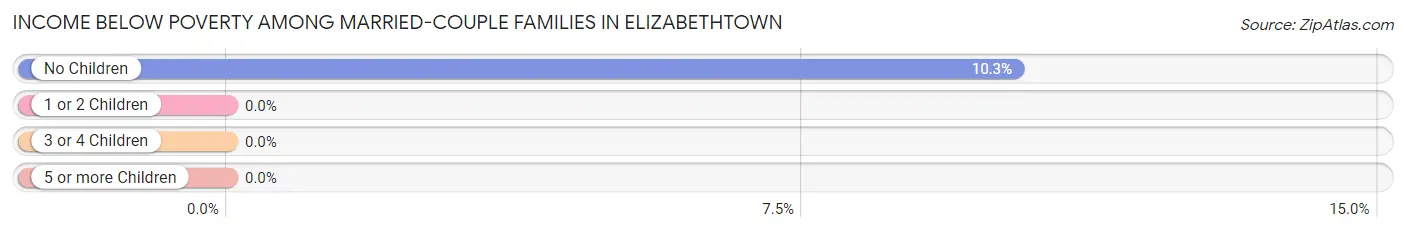
| Children | Above Poverty | Below Poverty |
| No Children | 35 (89.7%) | 4 (10.3%) |
| 1 or 2 Children | 0 (0.0%) | 0 (0.0%) |
| 3 or 4 Children | 0 (0.0%) | 0 (0.0%) |
| 5 or more Children | 0 (0.0%) | 0 (0.0%) |
| Total | 35 (89.7%) | 4 (10.3%) |
Income Below Poverty Among Single-Parent Households in Elizabethtown
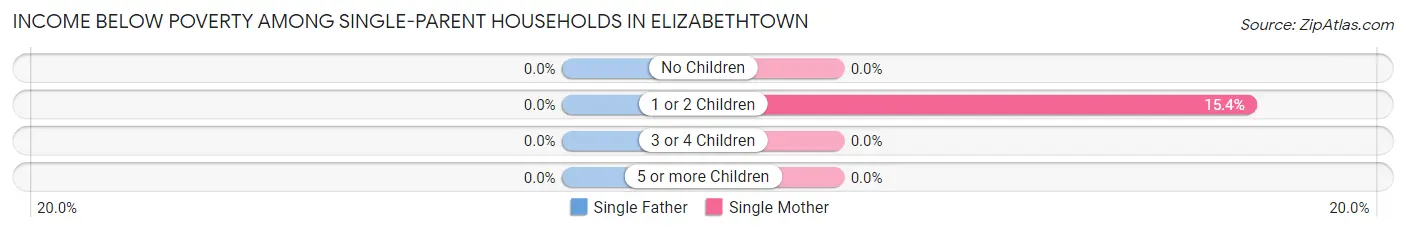
| Children | Single Father | Single Mother |
| No Children | 0 (0.0%) | 0 (0.0%) |
| 1 or 2 Children | 0 (0.0%) | 2 (15.4%) |
| 3 or 4 Children | 0 (0.0%) | 0 (0.0%) |
| 5 or more Children | 0 (0.0%) | 0 (0.0%) |
| Total | 0 (0.0%) | 2 (5.7%) |
Income Below Poverty Among Married-Couple vs Single-Parent Households in Elizabethtown
The poverty data for Elizabethtown shows that 4 of the married-couple family households (10.3%) and 2 of the single-parent households (4.2%) are living below the poverty level. Within the married-couple family households, those with no children have the highest poverty rate, with 4 households (10.3%) falling below the poverty line. Among the single-parent households, those with 1 or 2 children have the highest poverty rate, with 2 household (10.0%) living below poverty.
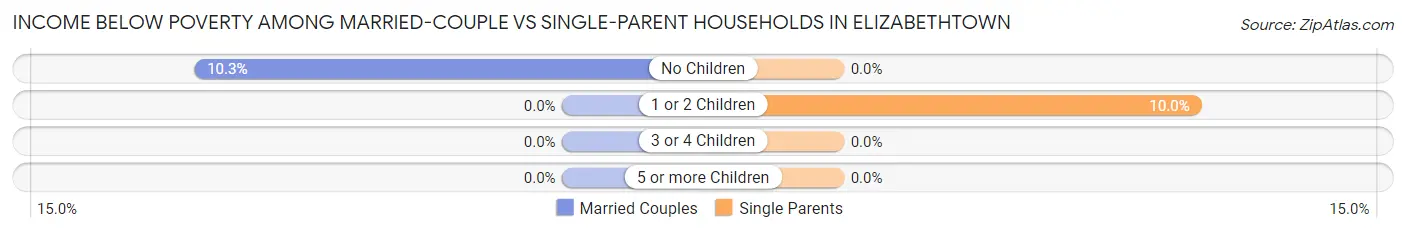
| Children | Married-Couple Families | Single-Parent Households |
| No Children | 4 (10.3%) | 0 (0.0%) |
| 1 or 2 Children | 0 (0.0%) | 2 (10.0%) |
| 3 or 4 Children | 0 (0.0%) | 0 (0.0%) |
| 5 or more Children | 0 (0.0%) | 0 (0.0%) |
| Total | 4 (10.3%) | 2 (4.2%) |
Race in Elizabethtown
The most populous races in Elizabethtown are White / Caucasian (499 | 90.2%), Black / African American (38 | 6.9%), and Hispanic or Latino (18 | 3.3%).
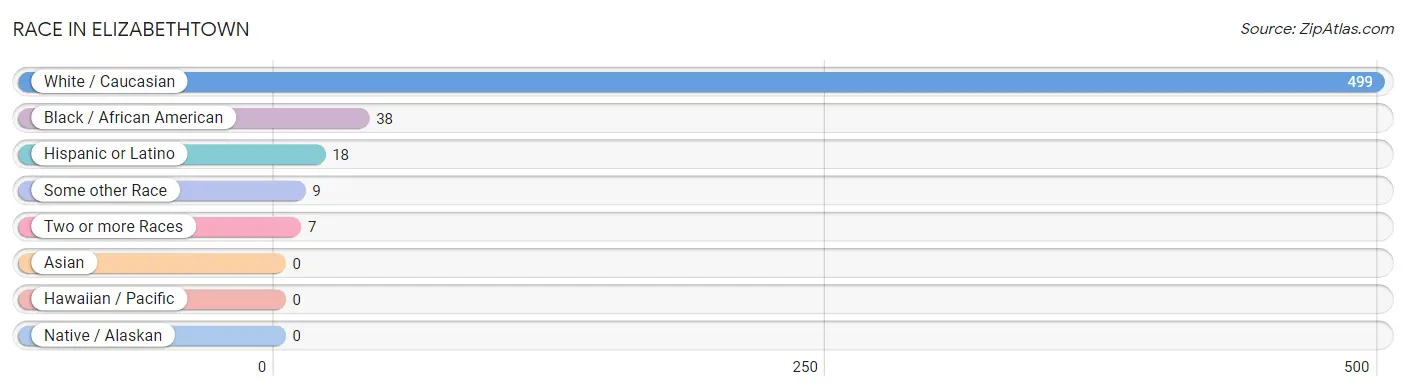
| Race | # Population | % Population |
| Asian | 0 | 0.0% |
| Black / African American | 38 | 6.9% |
| Hawaiian / Pacific | 0 | 0.0% |
| Hispanic or Latino | 18 | 3.3% |
| Native / Alaskan | 0 | 0.0% |
| White / Caucasian | 499 | 90.2% |
| Two or more Races | 7 | 1.3% |
| Some other Race | 9 | 1.6% |
| Total | 553 | 100.0% |
Ancestry in Elizabethtown
The most populous ancestries reported in Elizabethtown are Irish (175 | 31.7%), English (96 | 17.4%), French (70 | 12.7%), Italian (44 | 8.0%), and Scottish (28 | 5.1%), together accounting for 74.7% of all Elizabethtown residents.
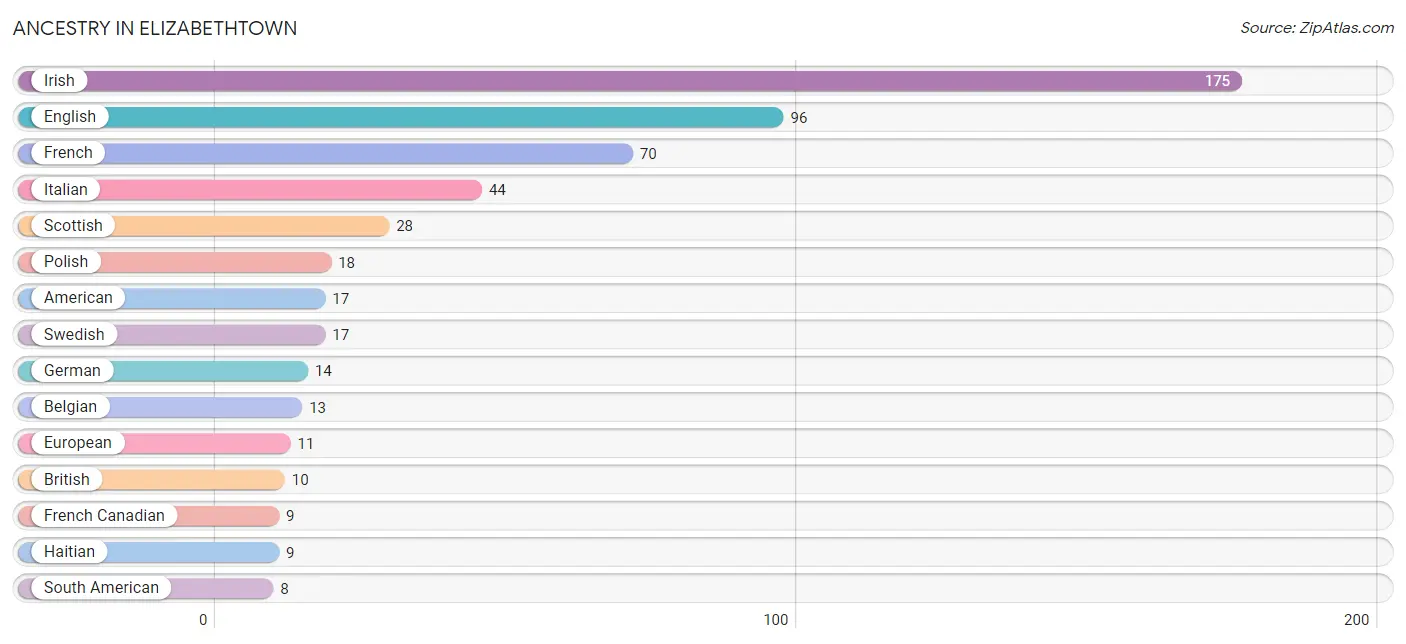
| Ancestry | # Population | % Population |
| American | 17 | 3.1% |
| Arab | 1 | 0.2% |
| Belgian | 13 | 2.4% |
| British | 10 | 1.8% |
| Cherokee | 1 | 0.2% |
| English | 96 | 17.4% |
| Estonian | 2 | 0.4% |
| European | 11 | 2.0% |
| French | 70 | 12.7% |
| French Canadian | 9 | 1.6% |
| German | 14 | 2.5% |
| Greek | 1 | 0.2% |
| Haitian | 9 | 1.6% |
| Irish | 175 | 31.7% |
| Iroquois | 3 | 0.5% |
| Italian | 44 | 8.0% |
| Lebanese | 1 | 0.2% |
| Norwegian | 5 | 0.9% |
| Polish | 18 | 3.3% |
| Russian | 2 | 0.4% |
| Scotch-Irish | 7 | 1.3% |
| Scottish | 28 | 5.1% |
| South American | 8 | 1.5% |
| Spanish | 1 | 0.2% |
| Swedish | 17 | 3.1% |
| Venezuelan | 8 | 1.5% | View All 26 Rows |
Immigrants in Elizabethtown
The most numerous immigrant groups reported in Elizabethtown came from Latin America (17 | 3.1%), Caribbean (9 | 1.6%), Haiti (9 | 1.6%), South America (8 | 1.5%), and Venezuela (8 | 1.5%), together accounting for 9.2% of all Elizabethtown residents.
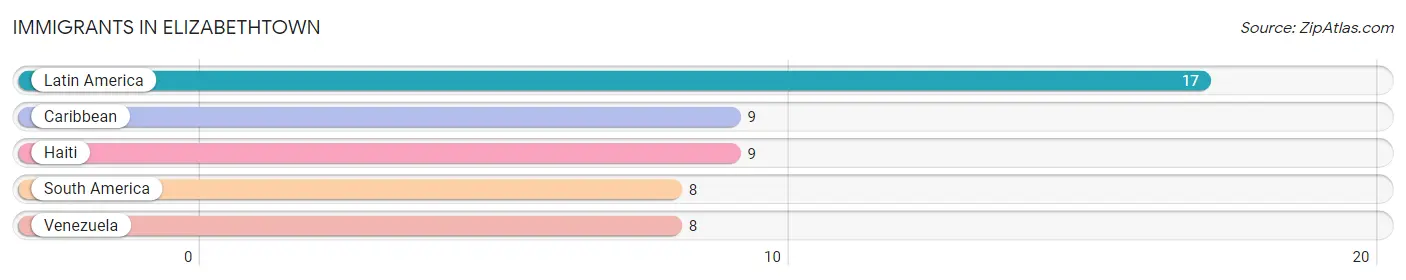
| Immigration Origin | # Population | % Population |
| Caribbean | 9 | 1.6% |
| Haiti | 9 | 1.6% |
| Latin America | 17 | 3.1% |
| South America | 8 | 1.5% |
| Venezuela | 8 | 1.5% | View All 5 Rows |
Sex and Age in Elizabethtown
Sex and Age in Elizabethtown
The most populous age groups in Elizabethtown are 5 to 9 Years (32 | 12.2%) for men and 85 Years and over (55 | 19.0%) for women.
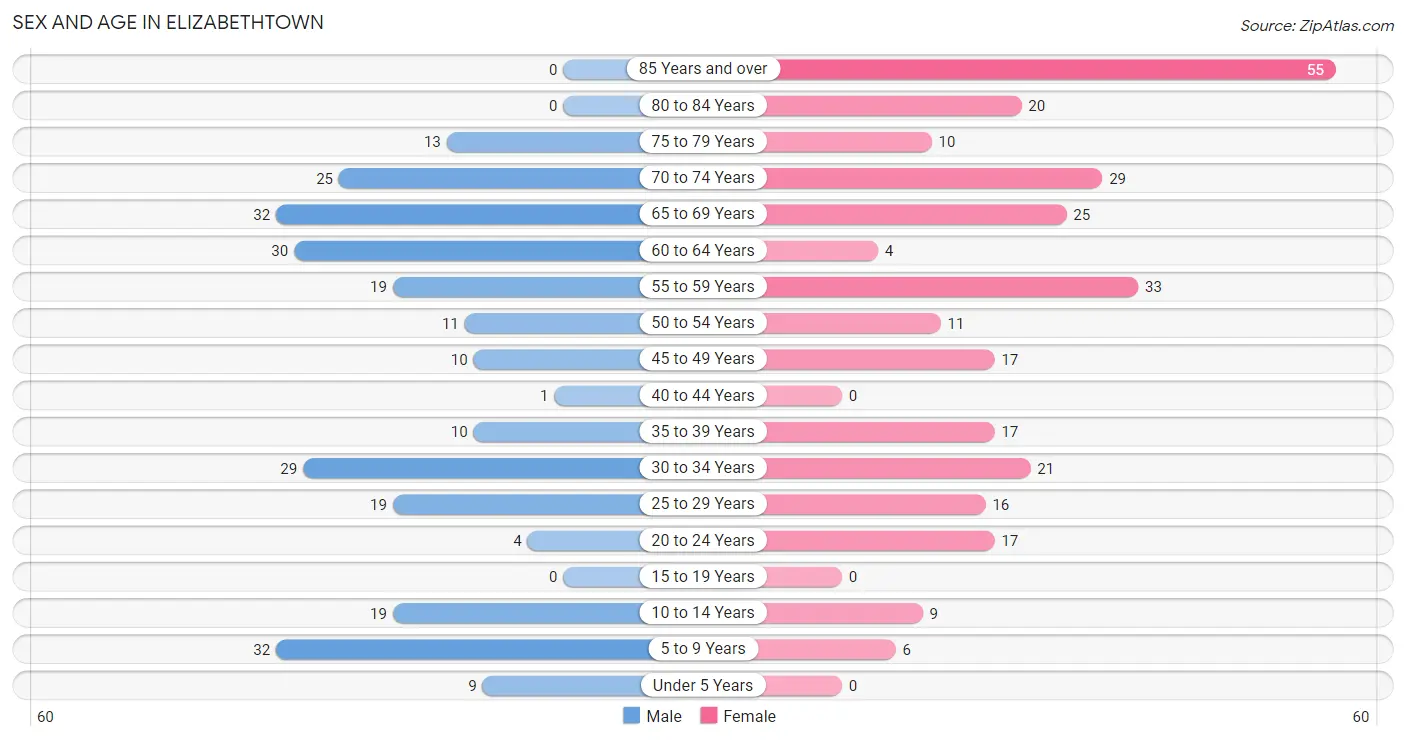
| Age Bracket | Male | Female |
| Under 5 Years | 9 (3.4%) | 0 (0.0%) |
| 5 to 9 Years | 32 (12.2%) | 6 (2.1%) |
| 10 to 14 Years | 19 (7.2%) | 9 (3.1%) |
| 15 to 19 Years | 0 (0.0%) | 0 (0.0%) |
| 20 to 24 Years | 4 (1.5%) | 17 (5.9%) |
| 25 to 29 Years | 19 (7.2%) | 16 (5.5%) |
| 30 to 34 Years | 29 (11.0%) | 21 (7.2%) |
| 35 to 39 Years | 10 (3.8%) | 17 (5.9%) |
| 40 to 44 Years | 1 (0.4%) | 0 (0.0%) |
| 45 to 49 Years | 10 (3.8%) | 17 (5.9%) |
| 50 to 54 Years | 11 (4.2%) | 11 (3.8%) |
| 55 to 59 Years | 19 (7.2%) | 33 (11.4%) |
| 60 to 64 Years | 30 (11.4%) | 4 (1.4%) |
| 65 to 69 Years | 32 (12.2%) | 25 (8.6%) |
| 70 to 74 Years | 25 (9.5%) | 29 (10.0%) |
| 75 to 79 Years | 13 (4.9%) | 10 (3.5%) |
| 80 to 84 Years | 0 (0.0%) | 20 (6.9%) |
| 85 Years and over | 0 (0.0%) | 55 (19.0%) |
| Total | 263 (100.0%) | 290 (100.0%) |
Families and Households in Elizabethtown
Median Family Size in Elizabethtown
The median family size in Elizabethtown is 2.63 persons per family, with single female/mother families (35 | 40.2%) accounting for the largest median family size of 3.43 persons per family. On the other hand, single male/father families (13 | 14.9%) represent the smallest median family size with 2.08 persons per family.
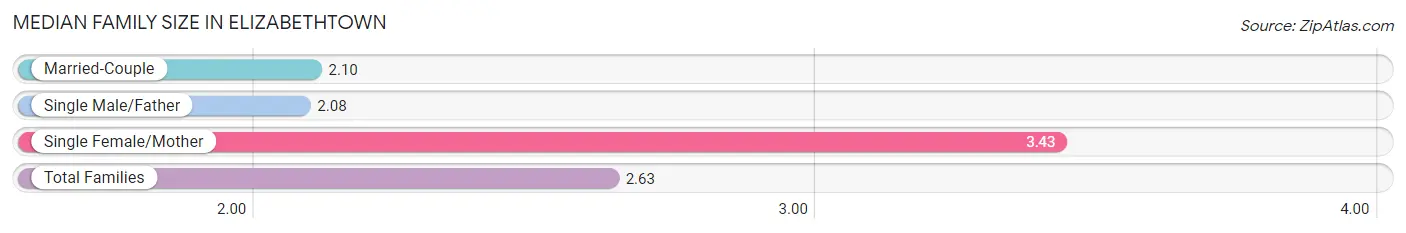
| Family Type | # Families | Family Size |
| Married-Couple | 39 (44.8%) | 2.10 |
| Single Male/Father | 13 (14.9%) | 2.08 |
| Single Female/Mother | 35 (40.2%) | 3.43 |
| Total Families | 87 (100.0%) | 2.63 |
Median Household Size in Elizabethtown
The median household size in Elizabethtown is 1.83 persons per household, with single female/mother households (35 | 13.7%) accounting for the largest median household size of 3.97 persons per household. non-family households (168 | 65.9%) represent the smallest median household size with 1.26 persons per household.
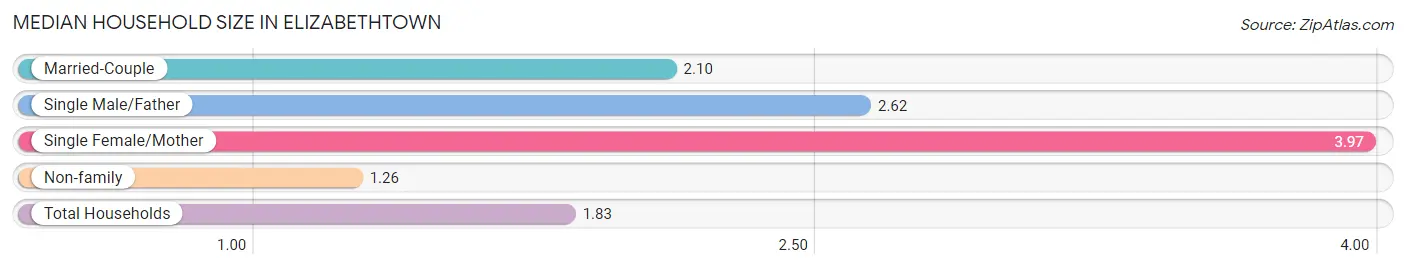
| Household Type | # Households | Household Size |
| Married-Couple | 39 (15.3%) | 2.10 |
| Single Male/Father | 13 (5.1%) | 2.62 |
| Single Female/Mother | 35 (13.7%) | 3.97 |
| Non-family | 168 (65.9%) | 1.26 |
| Total Households | 255 (100.0%) | 1.83 |
Household Size by Marriage Status in Elizabethtown
Out of a total of 255 households in Elizabethtown, 87 (34.1%) are family households, while 168 (65.9%) are nonfamily households. The most numerous type of family households are 2-person households, comprising 54, and the most common type of nonfamily households are 1-person households, comprising 132.
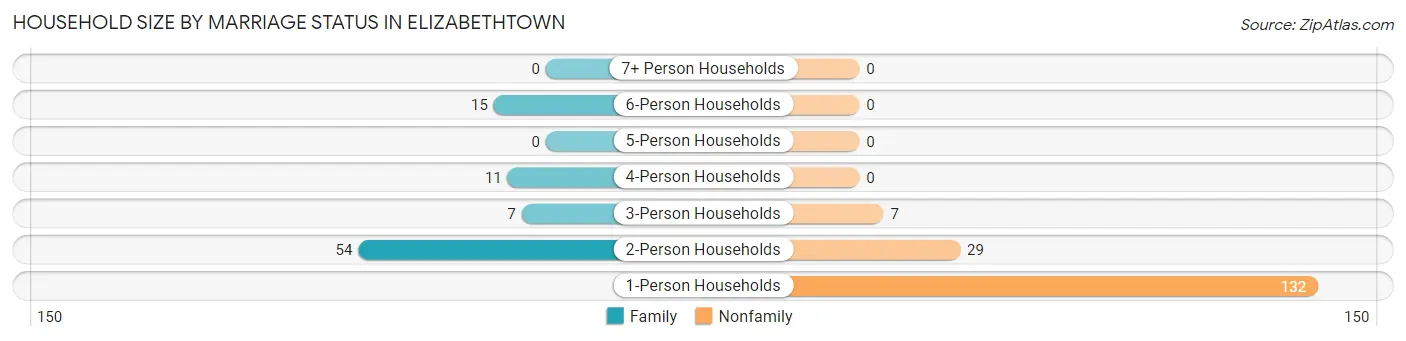
| Household Size | Family Households | Nonfamily Households |
| 1-Person Households | - | 132 (51.8%) |
| 2-Person Households | 54 (21.2%) | 29 (11.4%) |
| 3-Person Households | 7 (2.8%) | 7 (2.8%) |
| 4-Person Households | 11 (4.3%) | 0 (0.0%) |
| 5-Person Households | 0 (0.0%) | 0 (0.0%) |
| 6-Person Households | 15 (5.9%) | 0 (0.0%) |
| 7+ Person Households | 0 (0.0%) | 0 (0.0%) |
| Total | 87 (34.1%) | 168 (65.9%) |
Female Fertility in Elizabethtown
Fertility by Age in Elizabethtown
| Age Bracket | Women with Births | Births / 1,000 Women |
| 15 to 19 years | 0 (0.0%) | 0.0 |
| 20 to 34 years | 0 (0.0%) | 0.0 |
| 35 to 50 years | 0 (0.0%) | 0.0 |
| Total | 0 (0.0%) | 0.0 |
Fertility by Age by Marriage Status in Elizabethtown
| Age Bracket | Married | Unmarried |
| 15 to 19 years | 0 (0.0%) | 0 (0.0%) |
| 20 to 34 years | 0 (0.0%) | 0 (0.0%) |
| 35 to 50 years | 0 (0.0%) | 0 (0.0%) |
| Total | 0 (0.0%) | 0 (0.0%) |
Fertility by Education in Elizabethtown
| Educational Attainment | Women with Births | Births / 1,000 Women |
| Less than High School | 0 (0.0%) | 0.0 |
| High School Diploma | 0 (0.0%) | 0.0 |
| College or Associate's Degree | 0 (0.0%) | 0.0 |
| Bachelor's Degree | 0 (0.0%) | 0.0 |
| Graduate Degree | 0 (0.0%) | 0.0 |
| Total | 0 (0.0%) | 0.0 |
Fertility by Education by Marriage Status in Elizabethtown
| Educational Attainment | Married | Unmarried |
| Less than High School | 0 (0.0%) | 0 (0.0%) |
| High School Diploma | 0 (0.0%) | 0 (0.0%) |
| College or Associate's Degree | 0 (0.0%) | 0 (0.0%) |
| Bachelor's Degree | 0 (0.0%) | 0 (0.0%) |
| Graduate Degree | 0 (0.0%) | 0 (0.0%) |
| Total | 0 (0.0%) | 0 (0.0%) |
Employment Characteristics in Elizabethtown
Employment by Class of Employer in Elizabethtown
Among the 200 employed individuals in Elizabethtown, private company employees (83 | 41.5%), not-for-profit organizations (55 | 27.5%), and local government employees (50 | 25.0%) make up the most common classes of employment.
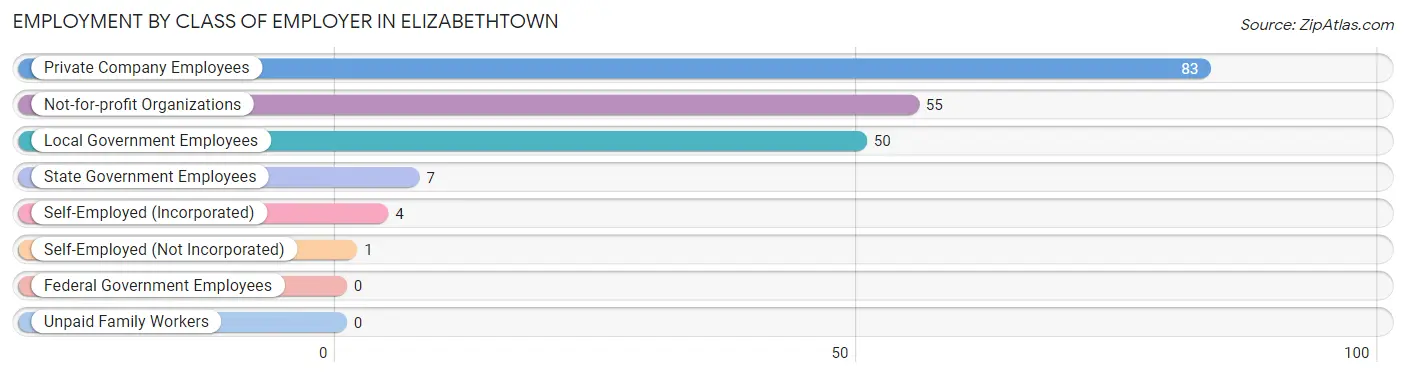
| Employer Class | # Employees | % Employees |
| Private Company Employees | 83 | 41.5% |
| Self-Employed (Incorporated) | 4 | 2.0% |
| Self-Employed (Not Incorporated) | 1 | 0.5% |
| Not-for-profit Organizations | 55 | 27.5% |
| Local Government Employees | 50 | 25.0% |
| State Government Employees | 7 | 3.5% |
| Federal Government Employees | 0 | 0.0% |
| Unpaid Family Workers | 0 | 0.0% |
| Total | 200 | 100.0% |
Employment Status by Age in Elizabethtown
According to the labor force statistics for Elizabethtown, out of the total population over 16 years of age (478), 45.8% or 219 individuals are in the labor force, with 5.5% or 12 of them unemployed. The age group with the highest labor force participation rate is 20 to 24 years, with 100.0% or 21 individuals in the labor force. Within the labor force, the 60 to 64 years age range has the highest percentage of unemployed individuals, with 54.5% or 12 of them being unemployed.
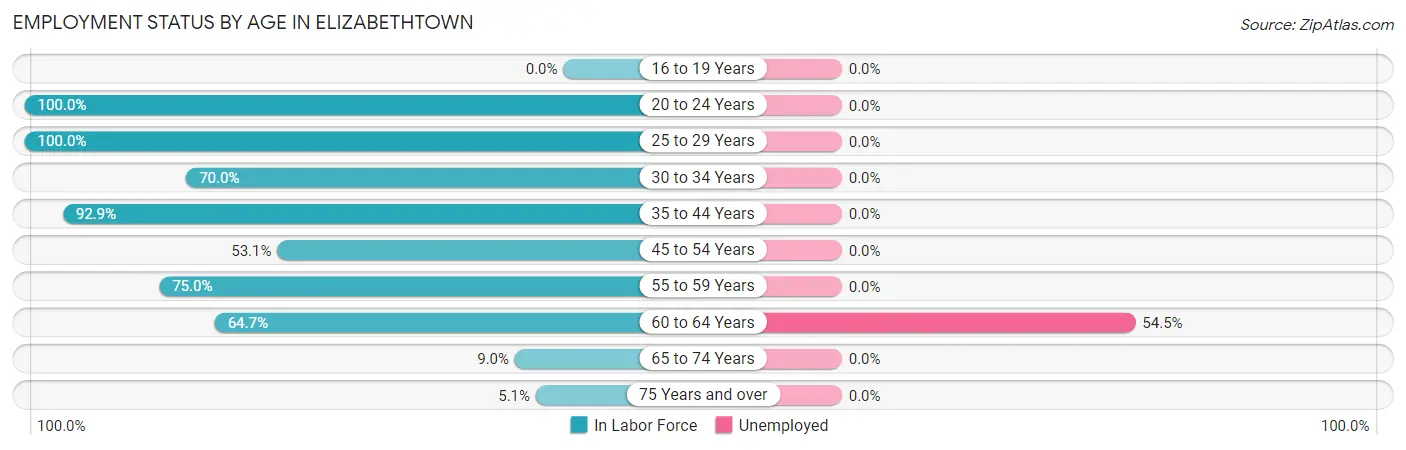
| Age Bracket | In Labor Force | Unemployed |
| 16 to 19 Years | 0 (0.0%) | 0 (0.0%) |
| 20 to 24 Years | 21 (100.0%) | 0 (0.0%) |
| 25 to 29 Years | 35 (100.0%) | 0 (0.0%) |
| 30 to 34 Years | 35 (70.0%) | 0 (0.0%) |
| 35 to 44 Years | 26 (92.9%) | 0 (0.0%) |
| 45 to 54 Years | 26 (53.1%) | 0 (0.0%) |
| 55 to 59 Years | 39 (75.0%) | 0 (0.0%) |
| 60 to 64 Years | 22 (64.7%) | 12 (54.5%) |
| 65 to 74 Years | 10 (9.0%) | 0 (0.0%) |
| 75 Years and over | 5 (5.1%) | 0 (0.0%) |
| Total | 219 (45.8%) | 12 (5.5%) |
Employment Status by Educational Attainment in Elizabethtown
According to labor force statistics for Elizabethtown, 73.8% of individuals (183) out of the total population between 25 and 64 years of age (248) are in the labor force, with 6.6% or 12 of them being unemployed. The group with the highest labor force participation rate are those with the educational attainment of bachelor's degree or higher, with 93.3% or 56 individuals in the labor force. Within the labor force, individuals with high school diploma education have the highest percentage of unemployment, with 12.6% or 12 of them being unemployed.
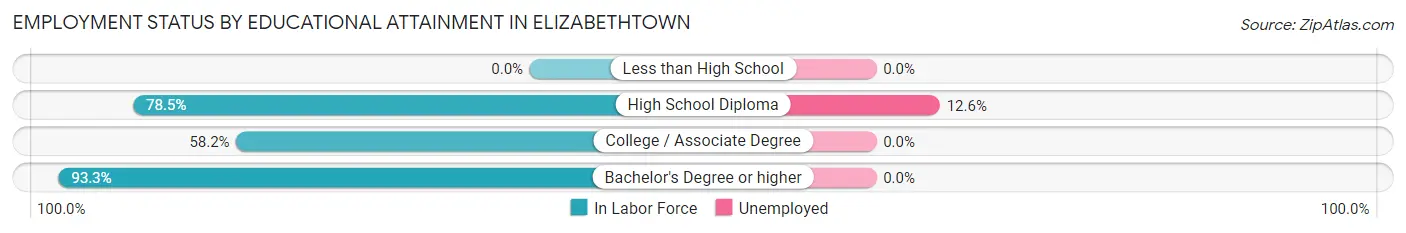
| Educational Attainment | In Labor Force | Unemployed |
| Less than High School | 0 (0.0%) | 0 (0.0%) |
| High School Diploma | 95 (78.5%) | 15 (12.6%) |
| College / Associate Degree | 32 (58.2%) | 0 (0.0%) |
| Bachelor's Degree or higher | 56 (93.3%) | 0 (0.0%) |
| Total | 183 (73.8%) | 16 (6.6%) |
Employment Occupations by Sex in Elizabethtown
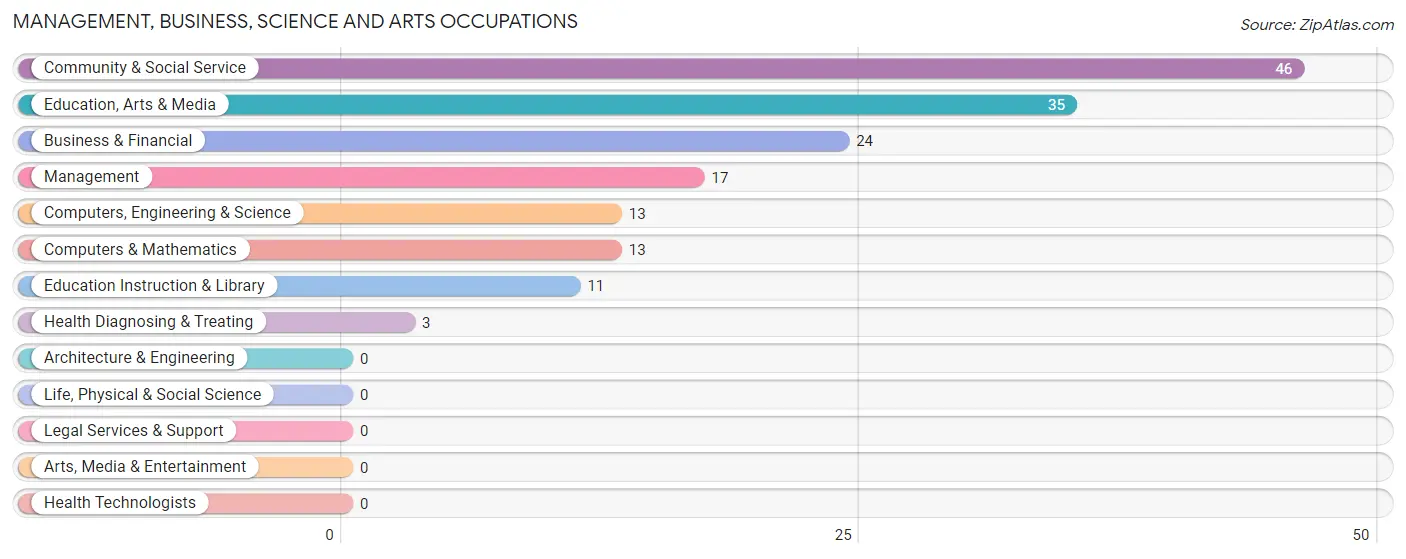
Management, Business, Science and Arts Occupations
The most common Management, Business, Science and Arts occupations in Elizabethtown are Community & Social Service (46 | 22.2%), Education, Arts & Media (35 | 16.9%), Business & Financial (24 | 11.6%), Management (17 | 8.2%), and Computers, Engineering & Science (13 | 6.3%).
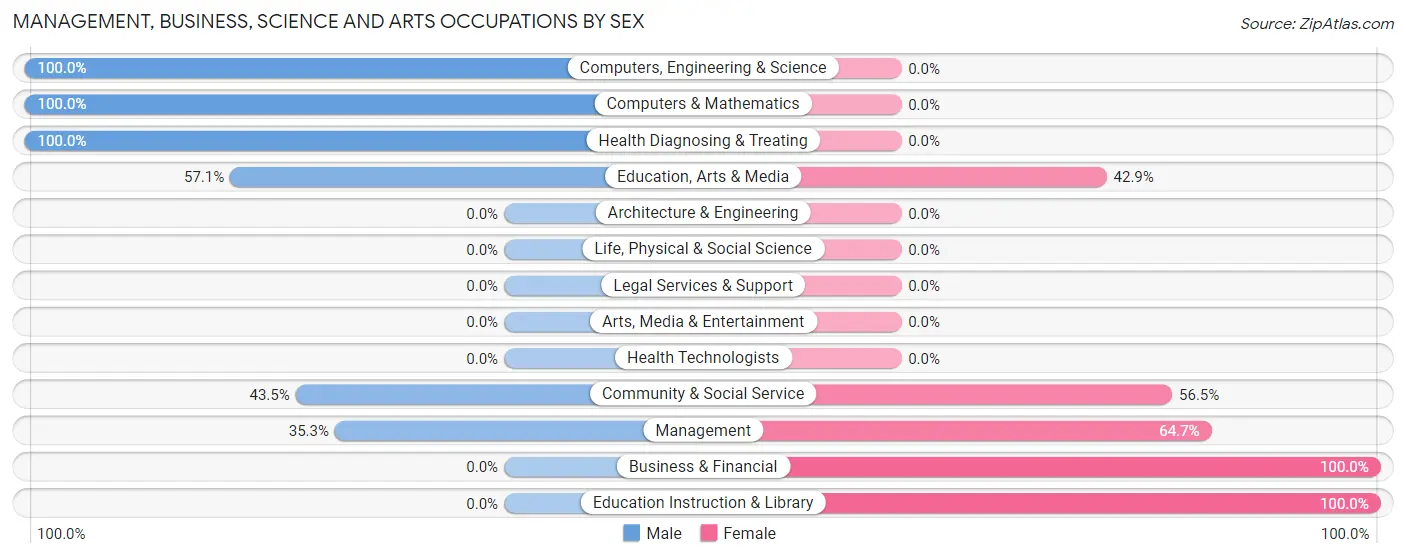
Management, Business, Science and Arts Occupations by Sex
Within the Management, Business, Science and Arts occupations in Elizabethtown, the most male-oriented occupations are Computers, Engineering & Science (100.0%), Computers & Mathematics (100.0%), and Health Diagnosing & Treating (100.0%), while the most female-oriented occupations are Business & Financial (100.0%), Education Instruction & Library (100.0%), and Management (64.7%).
| Occupation | Male | Female |
| Management | 6 (35.3%) | 11 (64.7%) |
| Business & Financial | 0 (0.0%) | 24 (100.0%) |
| Computers, Engineering & Science | 13 (100.0%) | 0 (0.0%) |
| Computers & Mathematics | 13 (100.0%) | 0 (0.0%) |
| Architecture & Engineering | 0 (0.0%) | 0 (0.0%) |
| Life, Physical & Social Science | 0 (0.0%) | 0 (0.0%) |
| Community & Social Service | 20 (43.5%) | 26 (56.5%) |
| Education, Arts & Media | 20 (57.1%) | 15 (42.9%) |
| Legal Services & Support | 0 (0.0%) | 0 (0.0%) |
| Education Instruction & Library | 0 (0.0%) | 11 (100.0%) |
| Arts, Media & Entertainment | 0 (0.0%) | 0 (0.0%) |
| Health Diagnosing & Treating | 3 (100.0%) | 0 (0.0%) |
| Health Technologists | 0 (0.0%) | 0 (0.0%) |
| Total (Category) | 42 (40.8%) | 61 (59.2%) |
| Total (Overall) | 122 (58.9%) | 85 (41.1%) |
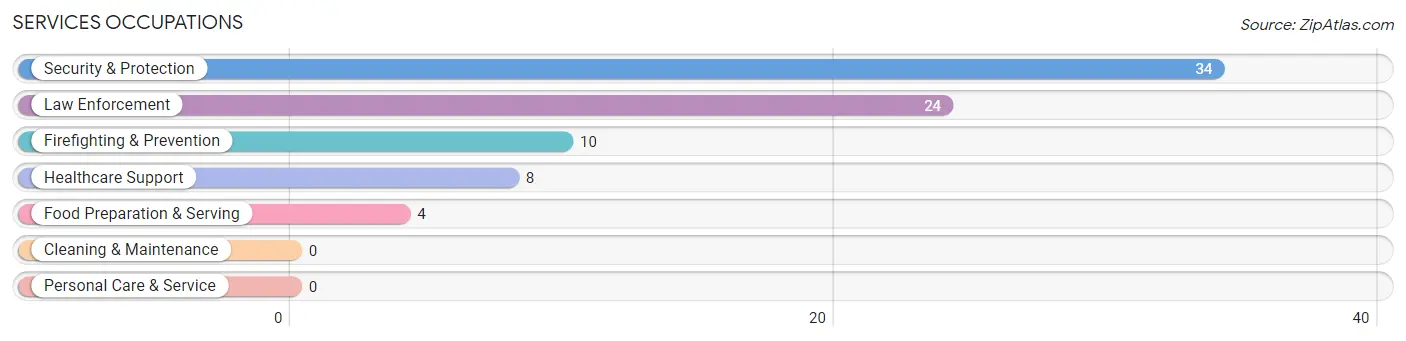
Services Occupations
The most common Services occupations in Elizabethtown are Security & Protection (34 | 16.4%), Law Enforcement (24 | 11.6%), Firefighting & Prevention (10 | 4.8%), Healthcare Support (8 | 3.9%), and Food Preparation & Serving (4 | 1.9%).
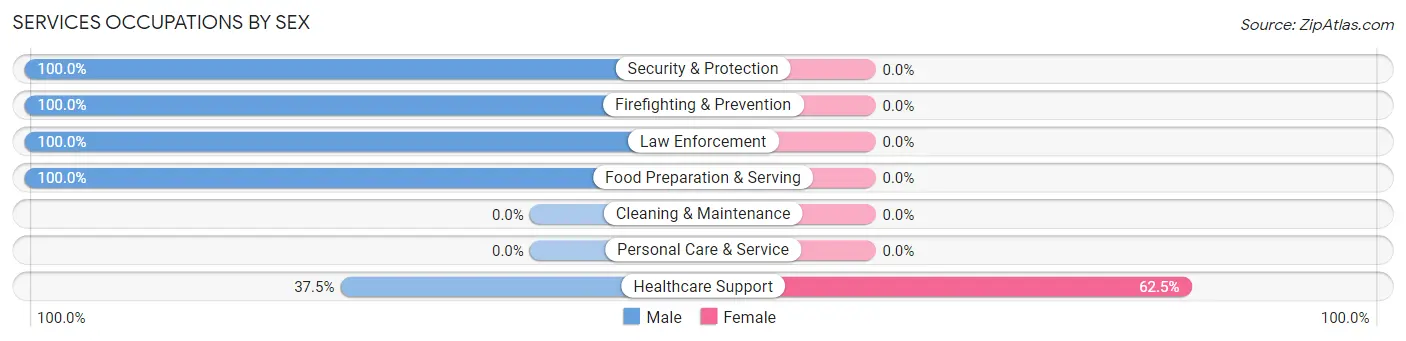
Services Occupations by Sex
| Occupation | Male | Female |
| Healthcare Support | 3 (37.5%) | 5 (62.5%) |
| Security & Protection | 34 (100.0%) | 0 (0.0%) |
| Firefighting & Prevention | 10 (100.0%) | 0 (0.0%) |
| Law Enforcement | 24 (100.0%) | 0 (0.0%) |
| Food Preparation & Serving | 4 (100.0%) | 0 (0.0%) |
| Cleaning & Maintenance | 0 (0.0%) | 0 (0.0%) |
| Personal Care & Service | 0 (0.0%) | 0 (0.0%) |
| Total (Category) | 41 (89.1%) | 5 (10.9%) |
| Total (Overall) | 122 (58.9%) | 85 (41.1%) |
Sales and Office Occupations
The most common Sales and Office occupations in Elizabethtown are Office & Administration (23 | 11.1%), and Sales & Related (5 | 2.4%).
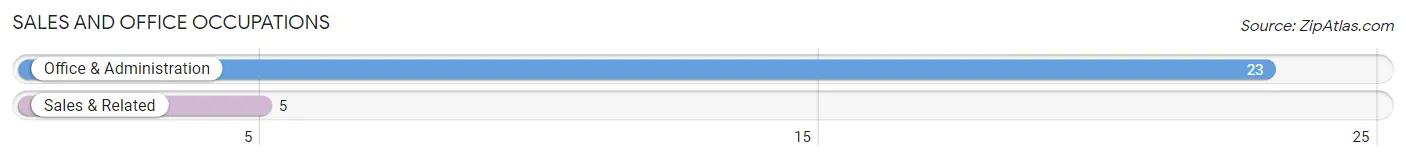
Sales and Office Occupations by Sex
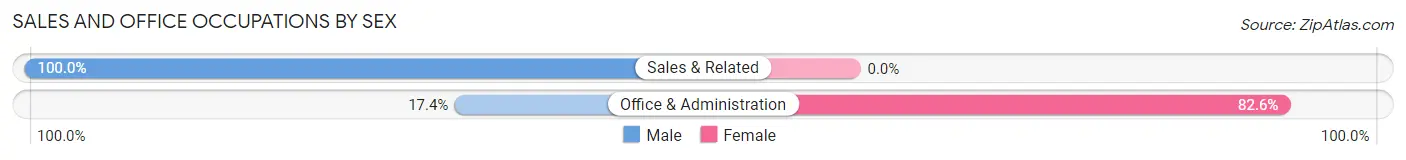
| Occupation | Male | Female |
| Sales & Related | 5 (100.0%) | 0 (0.0%) |
| Office & Administration | 4 (17.4%) | 19 (82.6%) |
| Total (Category) | 9 (32.1%) | 19 (67.9%) |
| Total (Overall) | 122 (58.9%) | 85 (41.1%) |
Natural Resources, Construction and Maintenance Occupations
The most common Natural Resources, Construction and Maintenance occupations in Elizabethtown are Construction & Extraction (10 | 4.8%), and Installation, Maintenance & Repair (4 | 1.9%).
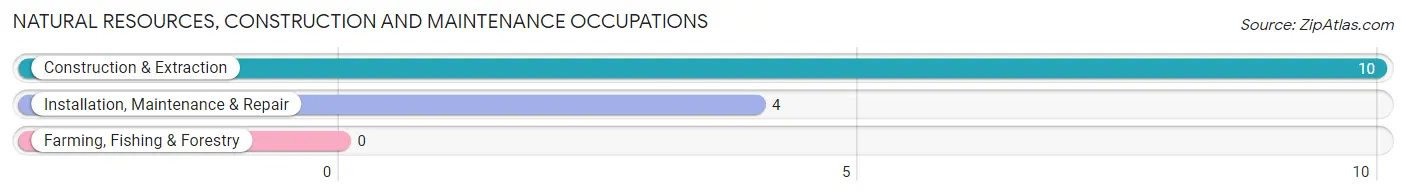
Natural Resources, Construction and Maintenance Occupations by Sex
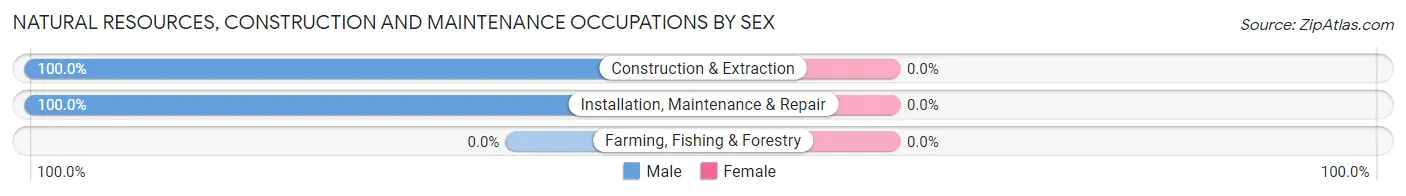
| Occupation | Male | Female |
| Farming, Fishing & Forestry | 0 (0.0%) | 0 (0.0%) |
| Construction & Extraction | 10 (100.0%) | 0 (0.0%) |
| Installation, Maintenance & Repair | 4 (100.0%) | 0 (0.0%) |
| Total (Category) | 14 (100.0%) | 0 (0.0%) |
| Total (Overall) | 122 (58.9%) | 85 (41.1%) |
Production, Transportation and Moving Occupations
The most common Production, Transportation and Moving occupations in Elizabethtown are Production (11 | 5.3%), and Transportation (5 | 2.4%).
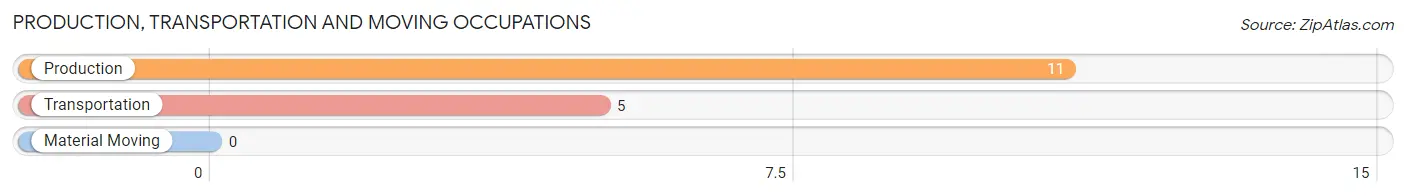
Production, Transportation and Moving Occupations by Sex
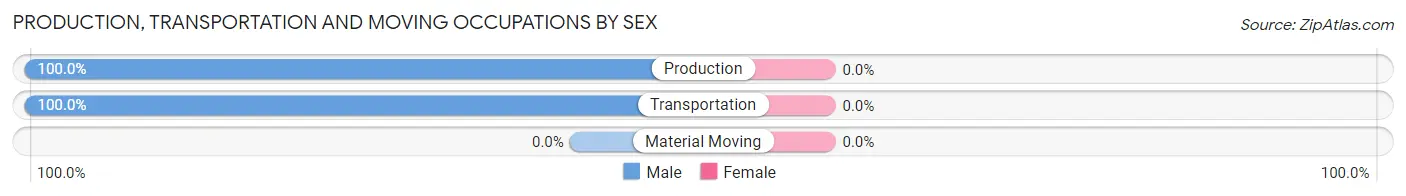
| Occupation | Male | Female |
| Production | 11 (100.0%) | 0 (0.0%) |
| Transportation | 5 (100.0%) | 0 (0.0%) |
| Material Moving | 0 (0.0%) | 0 (0.0%) |
| Total (Category) | 16 (100.0%) | 0 (0.0%) |
| Total (Overall) | 122 (58.9%) | 85 (41.1%) |
Employment Industries by Sex in Elizabethtown
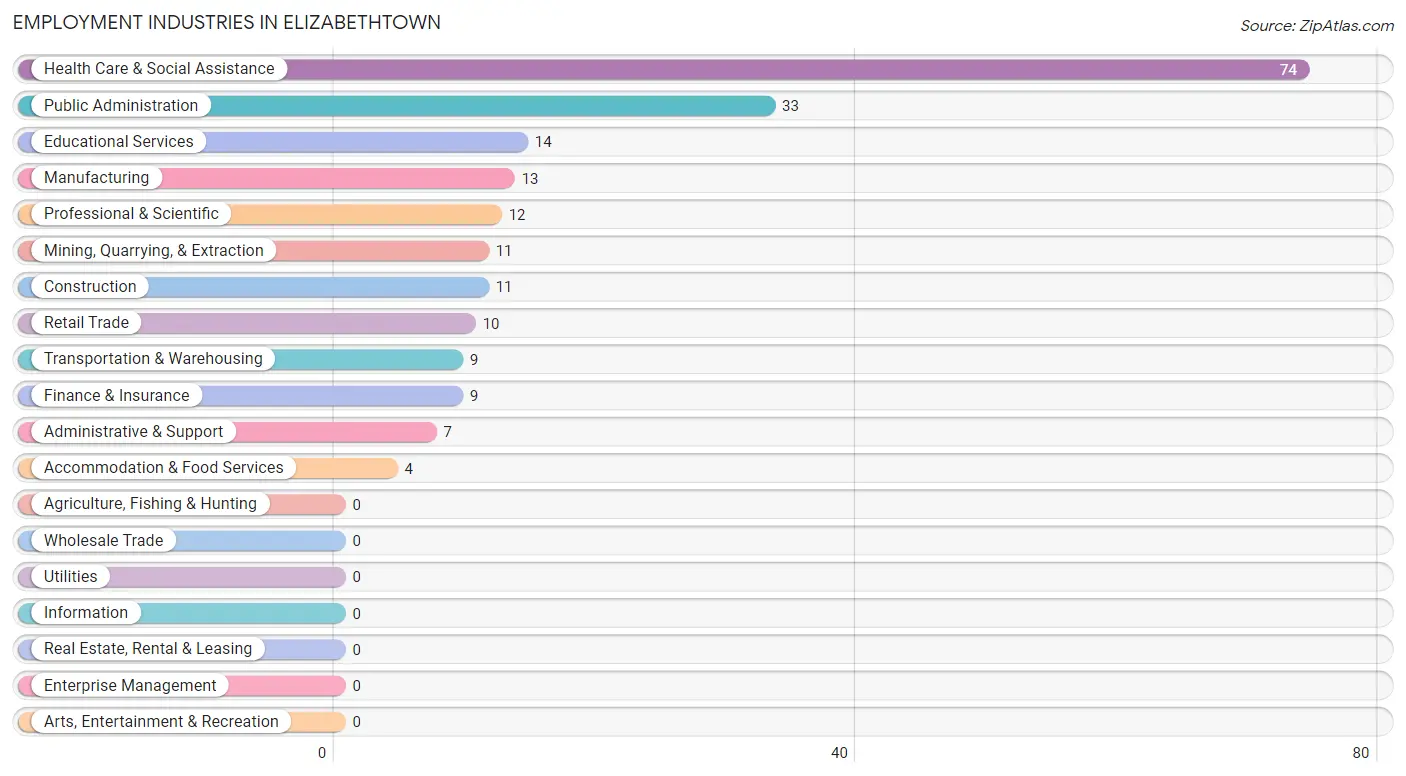
Employment Industries in Elizabethtown
The major employment industries in Elizabethtown include Health Care & Social Assistance (74 | 35.7%), Public Administration (33 | 15.9%), Educational Services (14 | 6.8%), Manufacturing (13 | 6.3%), and Professional & Scientific (12 | 5.8%).
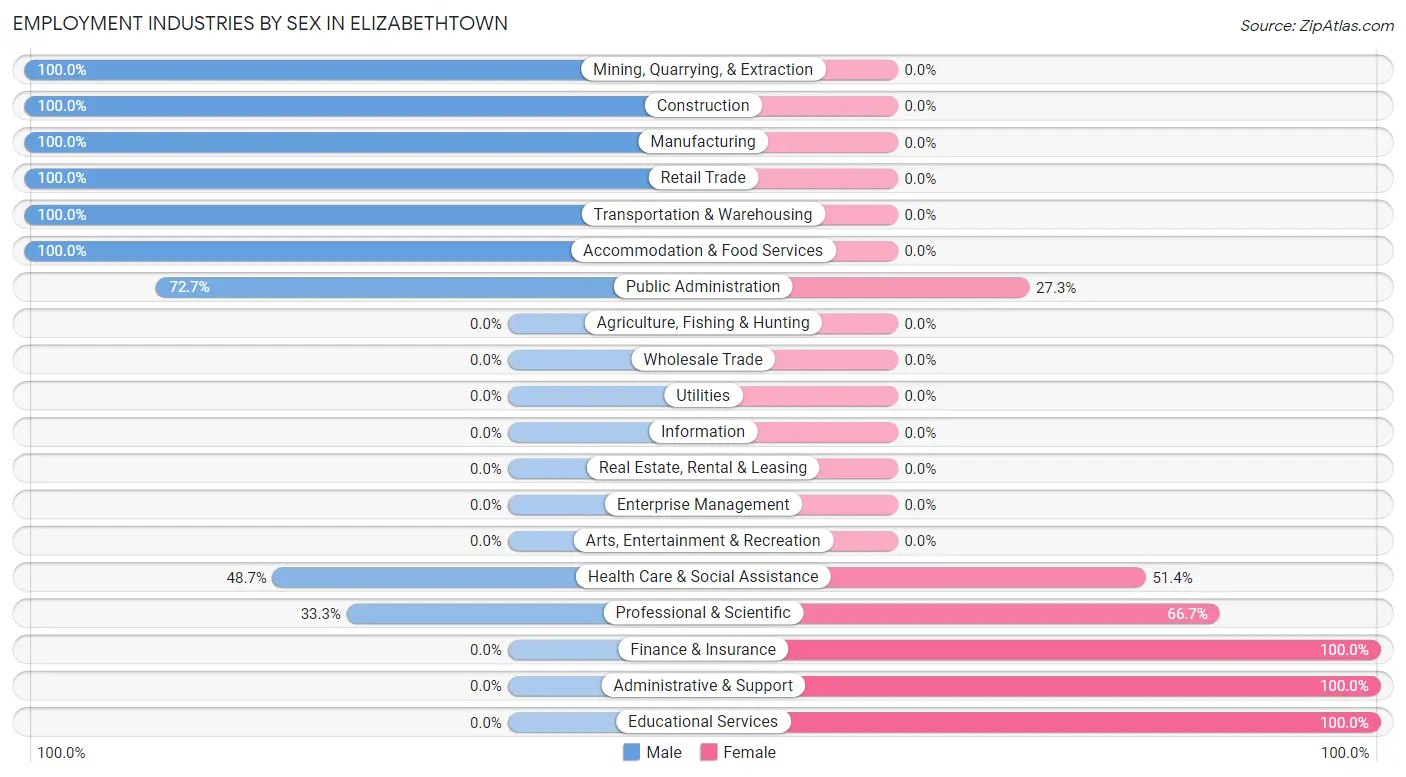
Employment Industries by Sex in Elizabethtown
The Elizabethtown industries that see more men than women are Mining, Quarrying, & Extraction (100.0%), Construction (100.0%), and Manufacturing (100.0%), whereas the industries that tend to have a higher number of women are Finance & Insurance (100.0%), Administrative & Support (100.0%), and Educational Services (100.0%).
| Industry | Male | Female |
| Agriculture, Fishing & Hunting | 0 (0.0%) | 0 (0.0%) |
| Mining, Quarrying, & Extraction | 11 (100.0%) | 0 (0.0%) |
| Construction | 11 (100.0%) | 0 (0.0%) |
| Manufacturing | 13 (100.0%) | 0 (0.0%) |
| Wholesale Trade | 0 (0.0%) | 0 (0.0%) |
| Retail Trade | 10 (100.0%) | 0 (0.0%) |
| Transportation & Warehousing | 9 (100.0%) | 0 (0.0%) |
| Utilities | 0 (0.0%) | 0 (0.0%) |
| Information | 0 (0.0%) | 0 (0.0%) |
| Finance & Insurance | 0 (0.0%) | 9 (100.0%) |
| Real Estate, Rental & Leasing | 0 (0.0%) | 0 (0.0%) |
| Professional & Scientific | 4 (33.3%) | 8 (66.7%) |
| Enterprise Management | 0 (0.0%) | 0 (0.0%) |
| Administrative & Support | 0 (0.0%) | 7 (100.0%) |
| Educational Services | 0 (0.0%) | 14 (100.0%) |
| Health Care & Social Assistance | 36 (48.6%) | 38 (51.3%) |
| Arts, Entertainment & Recreation | 0 (0.0%) | 0 (0.0%) |
| Accommodation & Food Services | 4 (100.0%) | 0 (0.0%) |
| Public Administration | 24 (72.7%) | 9 (27.3%) |
| Total | 122 (58.9%) | 85 (41.1%) |
Education in Elizabethtown
School Enrollment in Elizabethtown
The most common levels of schooling among the 93 students in Elizabethtown are elementary school (27 | 29.0%), college / undergraduate (24 | 25.8%), and middle school (21 | 22.6%).
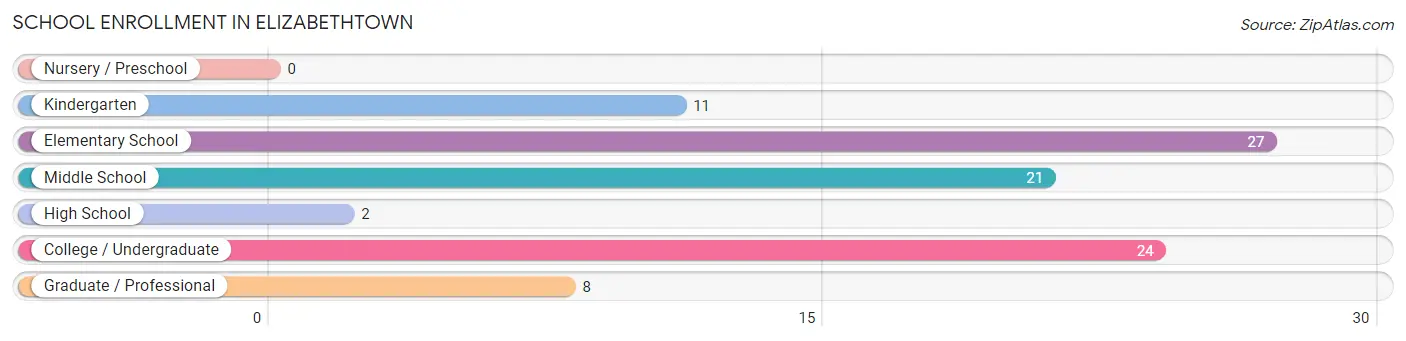
| School Level | # Students | % Students |
| Nursery / Preschool | 0 | 0.0% |
| Kindergarten | 11 | 11.8% |
| Elementary School | 27 | 29.0% |
| Middle School | 21 | 22.6% |
| High School | 2 | 2.1% |
| College / Undergraduate | 24 | 25.8% |
| Graduate / Professional | 8 | 8.6% |
| Total | 93 | 100.0% |
School Enrollment by Age by Funding Source in Elizabethtown
Out of a total of 93 students who are enrolled in schools in Elizabethtown, 7 (7.5%) attend a private institution, while the remaining 86 (92.5%) are enrolled in public schools. The age group of 35 years and over has the highest likelihood of being enrolled in private schools, with 2 (100.0% in the age bracket) enrolled. Conversely, the age group of 5 to 9 year old has the lowest likelihood of being enrolled in a private school, with 38 (100.0% in the age bracket) attending a public institution.
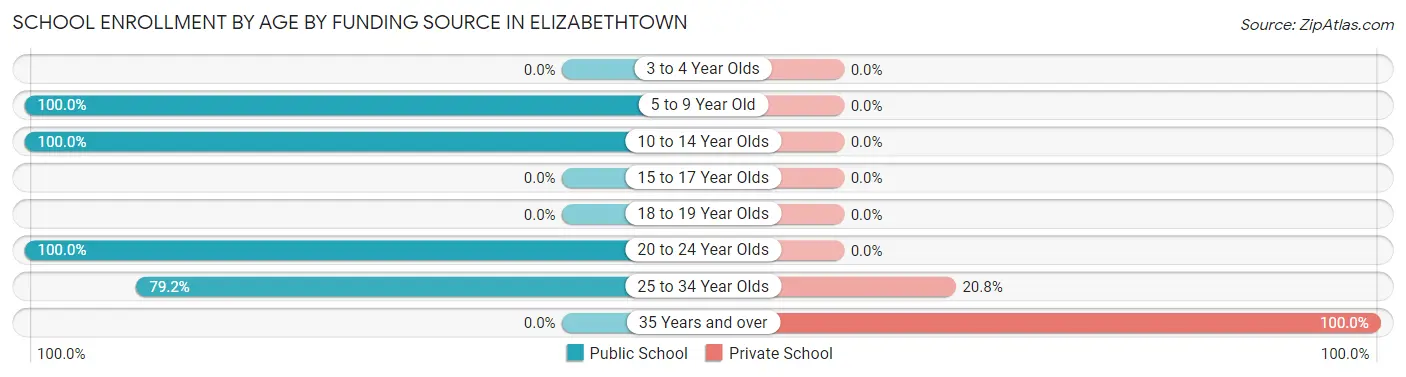
| Age Bracket | Public School | Private School |
| 3 to 4 Year Olds | 0 (0.0%) | 0 (0.0%) |
| 5 to 9 Year Old | 38 (100.0%) | 0 (0.0%) |
| 10 to 14 Year Olds | 21 (100.0%) | 0 (0.0%) |
| 15 to 17 Year Olds | 0 (0.0%) | 0 (0.0%) |
| 18 to 19 Year Olds | 0 (0.0%) | 0 (0.0%) |
| 20 to 24 Year Olds | 8 (100.0%) | 0 (0.0%) |
| 25 to 34 Year Olds | 19 (79.2%) | 5 (20.8%) |
| 35 Years and over | 0 (0.0%) | 2 (100.0%) |
| Total | 86 (92.5%) | 7 (7.5%) |
Educational Attainment by Field of Study in Elizabethtown
Arts & humanities (22 | 20.9%), bio, nature & agricultural (19 | 18.1%), science & technology (18 | 17.1%), social sciences (15 | 14.3%), and education (12 | 11.4%) are the most common fields of study among 105 individuals in Elizabethtown who have obtained a bachelor's degree or higher.
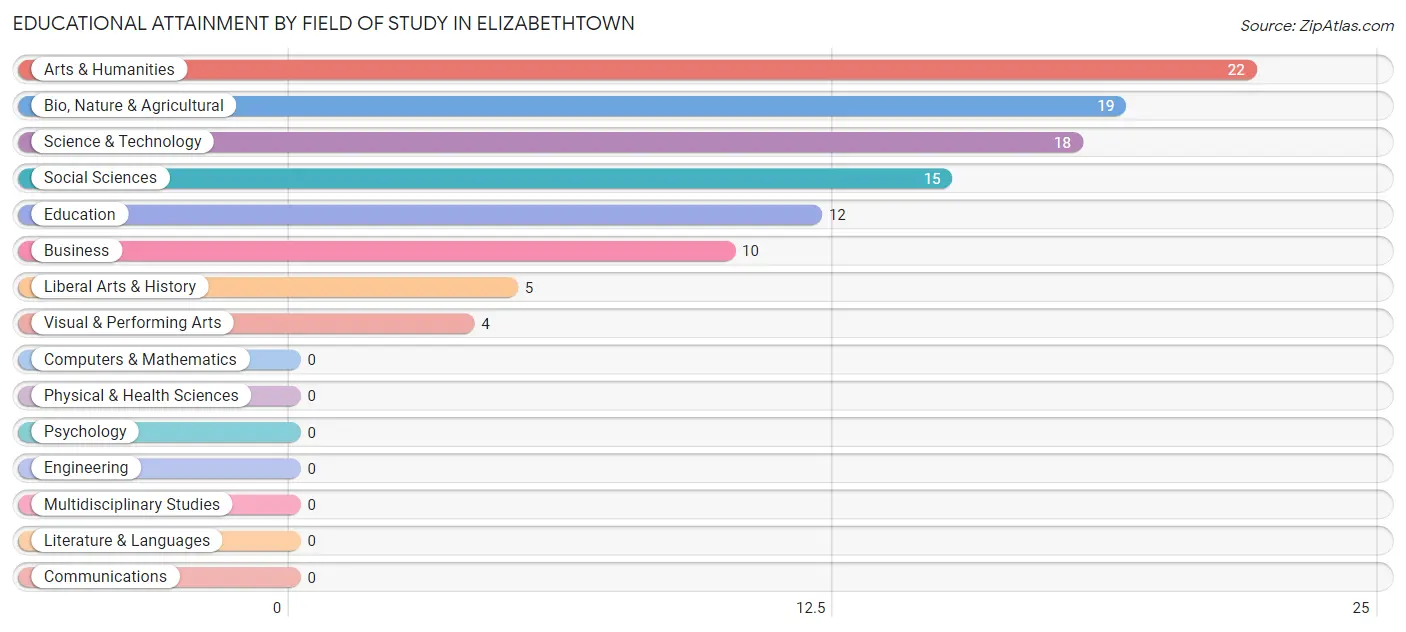
| Field of Study | # Graduates | % Graduates |
| Computers & Mathematics | 0 | 0.0% |
| Bio, Nature & Agricultural | 19 | 18.1% |
| Physical & Health Sciences | 0 | 0.0% |
| Psychology | 0 | 0.0% |
| Social Sciences | 15 | 14.3% |
| Engineering | 0 | 0.0% |
| Multidisciplinary Studies | 0 | 0.0% |
| Science & Technology | 18 | 17.1% |
| Business | 10 | 9.5% |
| Education | 12 | 11.4% |
| Literature & Languages | 0 | 0.0% |
| Liberal Arts & History | 5 | 4.8% |
| Visual & Performing Arts | 4 | 3.8% |
| Communications | 0 | 0.0% |
| Arts & Humanities | 22 | 20.9% |
| Total | 105 | 100.0% |
Transportation & Commute in Elizabethtown
Vehicle Availability by Sex in Elizabethtown
The most prevalent vehicle ownership categories in Elizabethtown are males with 2 vehicles (64, accounting for 55.6%) and females with 2 vehicles (40, making up 75.3%).
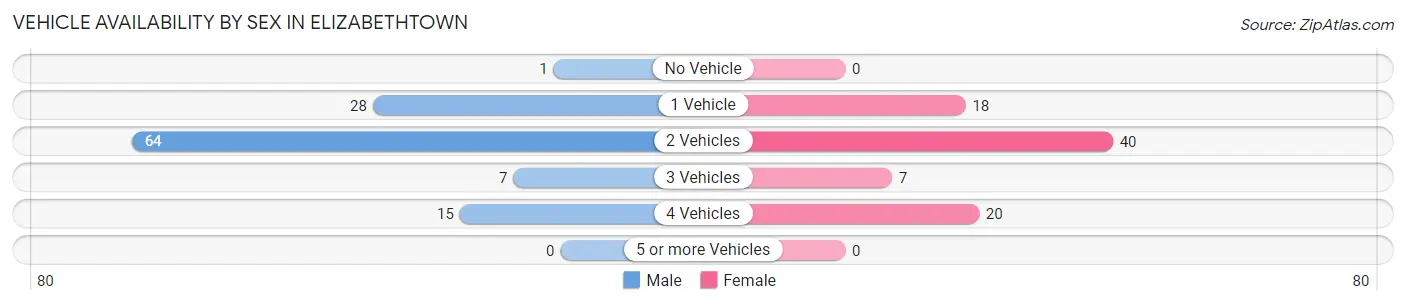
| Vehicles Available | Male | Female |
| No Vehicle | 1 (0.9%) | 0 (0.0%) |
| 1 Vehicle | 28 (24.3%) | 18 (21.2%) |
| 2 Vehicles | 64 (55.6%) | 40 (47.1%) |
| 3 Vehicles | 7 (6.1%) | 7 (8.2%) |
| 4 Vehicles | 15 (13.0%) | 20 (23.5%) |
| 5 or more Vehicles | 0 (0.0%) | 0 (0.0%) |
| Total | 115 (100.0%) | 85 (100.0%) |
Commute Time in Elizabethtown
The most frequently occuring commute durations in Elizabethtown are 5 to 9 minutes (54 commuters, 32.3%), 10 to 14 minutes (38 commuters, 22.8%), and 45 to 59 minutes (24 commuters, 14.4%).
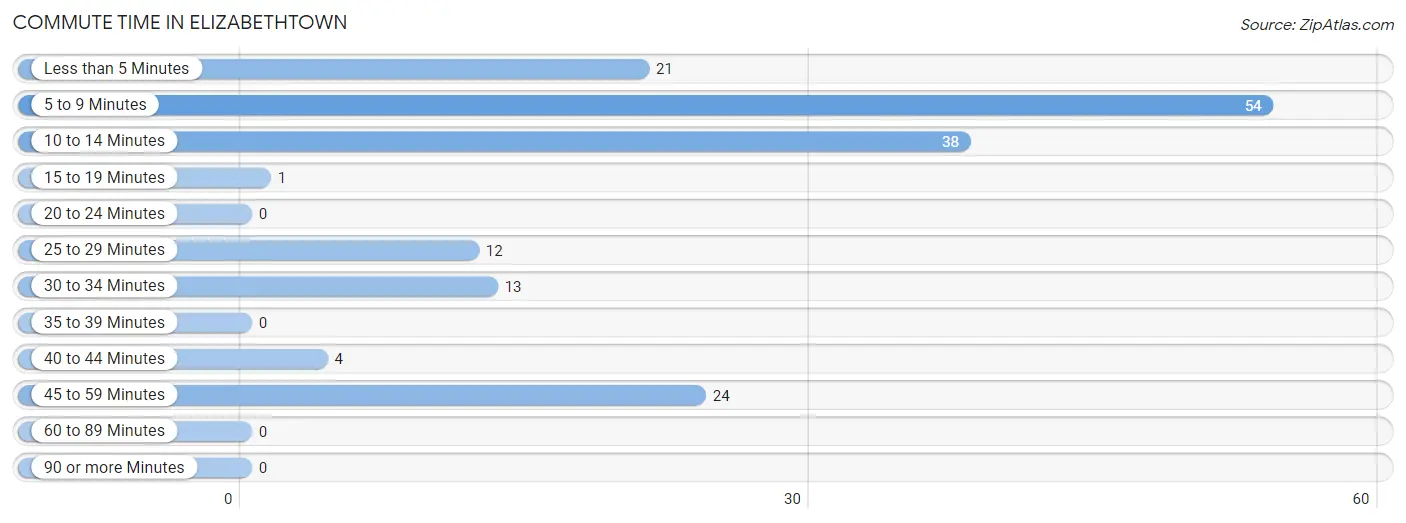
| Commute Time | # Commuters | % Commuters |
| Less than 5 Minutes | 21 | 12.6% |
| 5 to 9 Minutes | 54 | 32.3% |
| 10 to 14 Minutes | 38 | 22.8% |
| 15 to 19 Minutes | 1 | 0.6% |
| 20 to 24 Minutes | 0 | 0.0% |
| 25 to 29 Minutes | 12 | 7.2% |
| 30 to 34 Minutes | 13 | 7.8% |
| 35 to 39 Minutes | 0 | 0.0% |
| 40 to 44 Minutes | 4 | 2.4% |
| 45 to 59 Minutes | 24 | 14.4% |
| 60 to 89 Minutes | 0 | 0.0% |
| 90 or more Minutes | 0 | 0.0% |
Commute Time by Sex in Elizabethtown
The most common commute times in Elizabethtown are 10 to 14 minutes (30 commuters, 28.3%) for males and 5 to 9 minutes (30 commuters, 49.2%) for females.
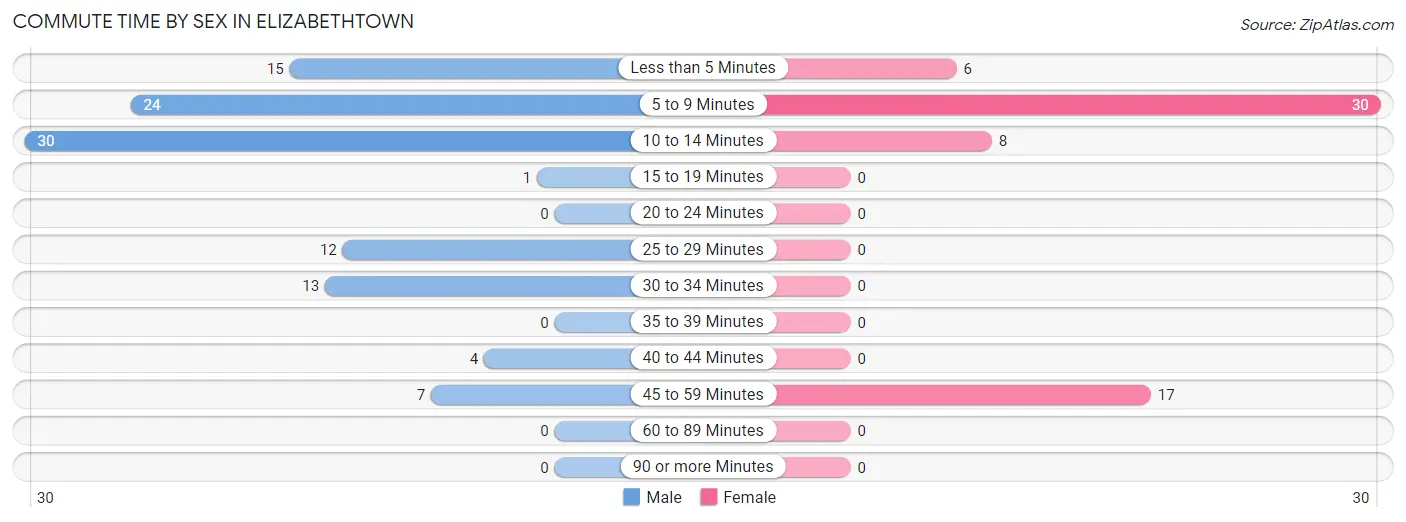
| Commute Time | Male | Female |
| Less than 5 Minutes | 15 (14.1%) | 6 (9.8%) |
| 5 to 9 Minutes | 24 (22.6%) | 30 (49.2%) |
| 10 to 14 Minutes | 30 (28.3%) | 8 (13.1%) |
| 15 to 19 Minutes | 1 (0.9%) | 0 (0.0%) |
| 20 to 24 Minutes | 0 (0.0%) | 0 (0.0%) |
| 25 to 29 Minutes | 12 (11.3%) | 0 (0.0%) |
| 30 to 34 Minutes | 13 (12.3%) | 0 (0.0%) |
| 35 to 39 Minutes | 0 (0.0%) | 0 (0.0%) |
| 40 to 44 Minutes | 4 (3.8%) | 0 (0.0%) |
| 45 to 59 Minutes | 7 (6.6%) | 17 (27.9%) |
| 60 to 89 Minutes | 0 (0.0%) | 0 (0.0%) |
| 90 or more Minutes | 0 (0.0%) | 0 (0.0%) |
Time of Departure to Work by Sex in Elizabethtown
The most frequent times of departure to work in Elizabethtown are 4:00 PM to 11:59 PM (25, 23.6%) for males and 6:30 AM to 6:59 AM (18, 29.5%) for females.
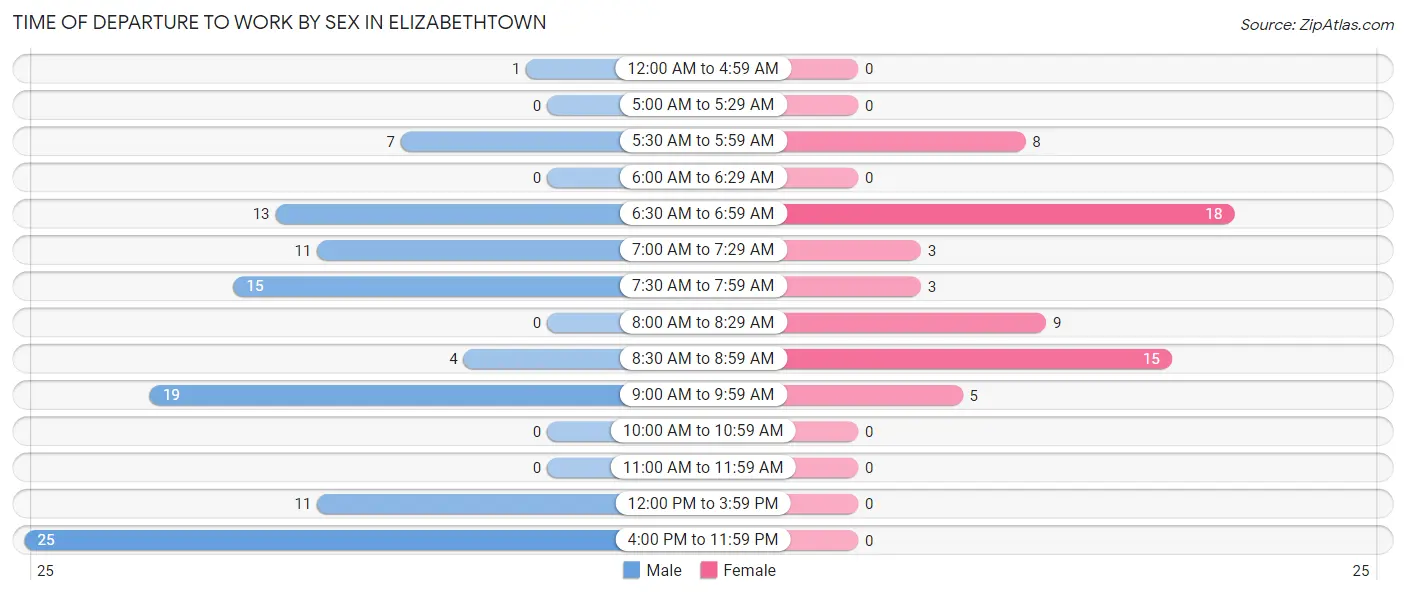
| Time of Departure | Male | Female |
| 12:00 AM to 4:59 AM | 1 (0.9%) | 0 (0.0%) |
| 5:00 AM to 5:29 AM | 0 (0.0%) | 0 (0.0%) |
| 5:30 AM to 5:59 AM | 7 (6.6%) | 8 (13.1%) |
| 6:00 AM to 6:29 AM | 0 (0.0%) | 0 (0.0%) |
| 6:30 AM to 6:59 AM | 13 (12.3%) | 18 (29.5%) |
| 7:00 AM to 7:29 AM | 11 (10.4%) | 3 (4.9%) |
| 7:30 AM to 7:59 AM | 15 (14.1%) | 3 (4.9%) |
| 8:00 AM to 8:29 AM | 0 (0.0%) | 9 (14.7%) |
| 8:30 AM to 8:59 AM | 4 (3.8%) | 15 (24.6%) |
| 9:00 AM to 9:59 AM | 19 (17.9%) | 5 (8.2%) |
| 10:00 AM to 10:59 AM | 0 (0.0%) | 0 (0.0%) |
| 11:00 AM to 11:59 AM | 0 (0.0%) | 0 (0.0%) |
| 12:00 PM to 3:59 PM | 11 (10.4%) | 0 (0.0%) |
| 4:00 PM to 11:59 PM | 25 (23.6%) | 0 (0.0%) |
| Total | 106 (100.0%) | 61 (100.0%) |
Housing Occupancy in Elizabethtown
Occupancy by Ownership in Elizabethtown
Of the total 255 dwellings in Elizabethtown, owner-occupied units account for 171 (67.1%), while renter-occupied units make up 84 (32.9%).
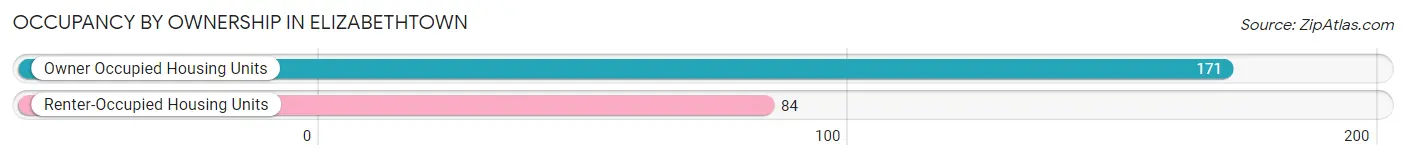
| Occupancy | # Housing Units | % Housing Units |
| Owner Occupied Housing Units | 171 | 67.1% |
| Renter-Occupied Housing Units | 84 | 32.9% |
| Total Occupied Housing Units | 255 | 100.0% |
Occupancy by Household Size in Elizabethtown
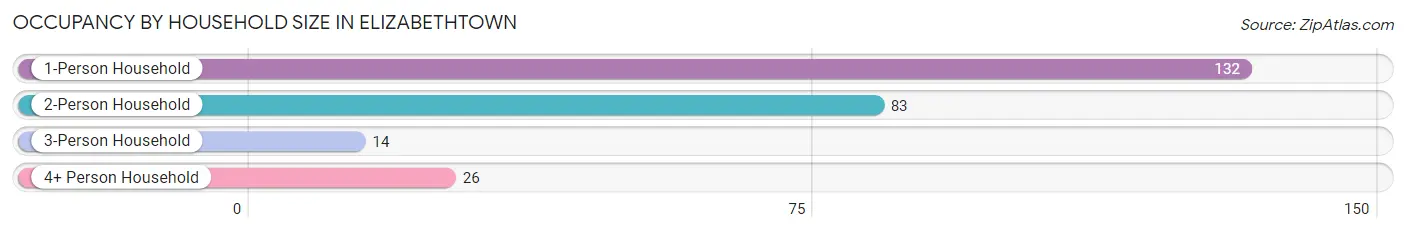
| Household Size | # Housing Units | % Housing Units |
| 1-Person Household | 132 | 51.8% |
| 2-Person Household | 83 | 32.6% |
| 3-Person Household | 14 | 5.5% |
| 4+ Person Household | 26 | 10.2% |
| Total Housing Units | 255 | 100.0% |
Occupancy by Ownership by Household Size in Elizabethtown
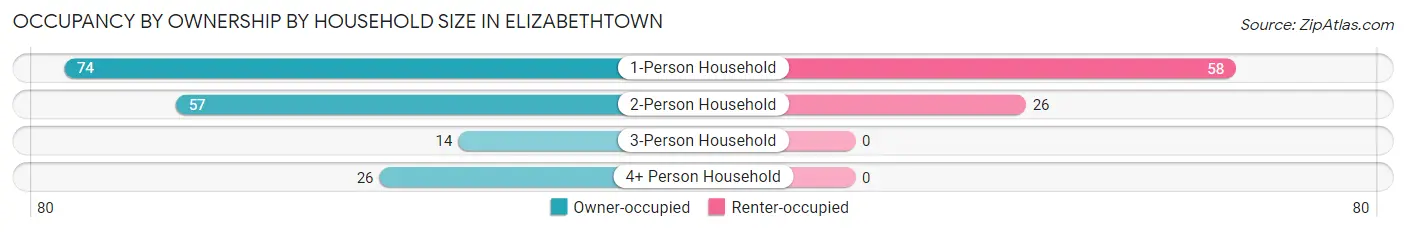
| Household Size | Owner-occupied | Renter-occupied |
| 1-Person Household | 74 (56.1%) | 58 (43.9%) |
| 2-Person Household | 57 (68.7%) | 26 (31.3%) |
| 3-Person Household | 14 (100.0%) | 0 (0.0%) |
| 4+ Person Household | 26 (100.0%) | 0 (0.0%) |
| Total Housing Units | 171 (67.1%) | 84 (32.9%) |
Occupancy by Educational Attainment in Elizabethtown
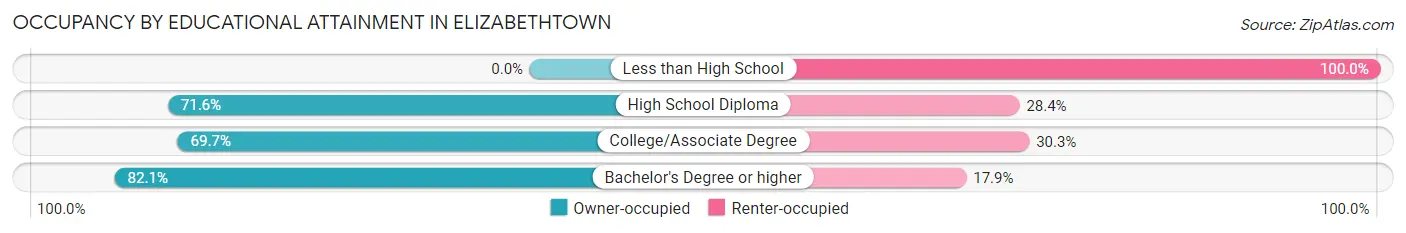
| Household Size | Owner-occupied | Renter-occupied |
| Less than High School | 0 (0.0%) | 22 (100.0%) |
| High School Diploma | 63 (71.6%) | 25 (28.4%) |
| College/Associate Degree | 62 (69.7%) | 27 (30.3%) |
| Bachelor's Degree or higher | 46 (82.1%) | 10 (17.9%) |
Occupancy by Age of Householder in Elizabethtown
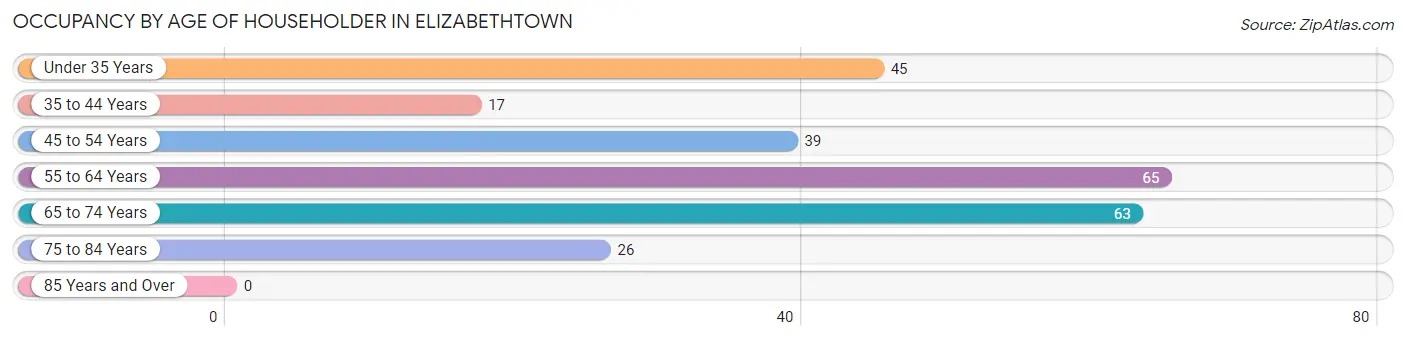
| Age Bracket | # Households | % Households |
| Under 35 Years | 45 | 17.6% |
| 35 to 44 Years | 17 | 6.7% |
| 45 to 54 Years | 39 | 15.3% |
| 55 to 64 Years | 65 | 25.5% |
| 65 to 74 Years | 63 | 24.7% |
| 75 to 84 Years | 26 | 10.2% |
| 85 Years and Over | 0 | 0.0% |
| Total | 255 | 100.0% |
Housing Finances in Elizabethtown
Median Income by Occupancy in Elizabethtown
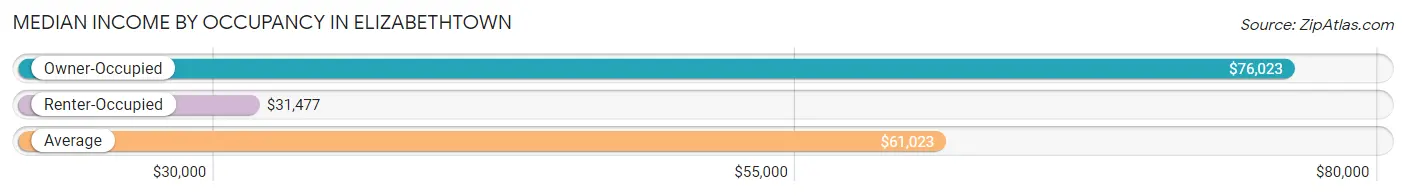
| Occupancy Type | # Households | Median Income |
| Owner-Occupied | 171 (67.1%) | $76,023 |
| Renter-Occupied | 84 (32.9%) | $31,477 |
| Average | 255 (100.0%) | $61,023 |
Occupancy by Householder Income Bracket in Elizabethtown
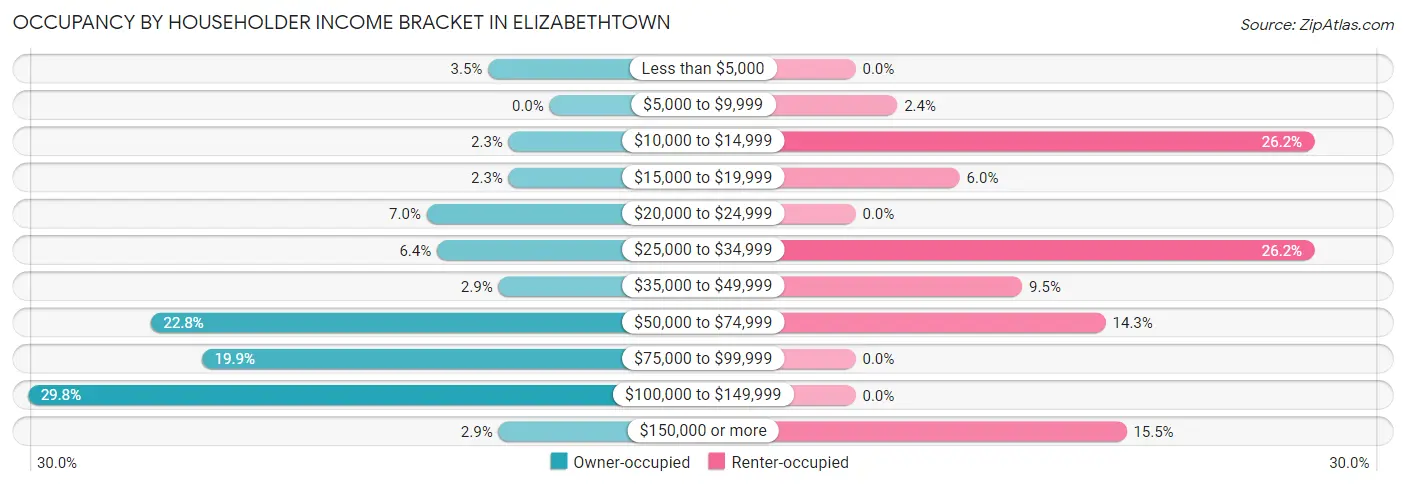
| Income Bracket | Owner-occupied | Renter-occupied |
| Less than $5,000 | 6 (3.5%) | 0 (0.0%) |
| $5,000 to $9,999 | 0 (0.0%) | 2 (2.4%) |
| $10,000 to $14,999 | 4 (2.3%) | 22 (26.2%) |
| $15,000 to $19,999 | 4 (2.3%) | 5 (5.9%) |
| $20,000 to $24,999 | 12 (7.0%) | 0 (0.0%) |
| $25,000 to $34,999 | 11 (6.4%) | 22 (26.2%) |
| $35,000 to $49,999 | 5 (2.9%) | 8 (9.5%) |
| $50,000 to $74,999 | 39 (22.8%) | 12 (14.3%) |
| $75,000 to $99,999 | 34 (19.9%) | 0 (0.0%) |
| $100,000 to $149,999 | 51 (29.8%) | 0 (0.0%) |
| $150,000 or more | 5 (2.9%) | 13 (15.5%) |
| Total | 171 (100.0%) | 84 (100.0%) |
Monthly Housing Cost Tiers in Elizabethtown
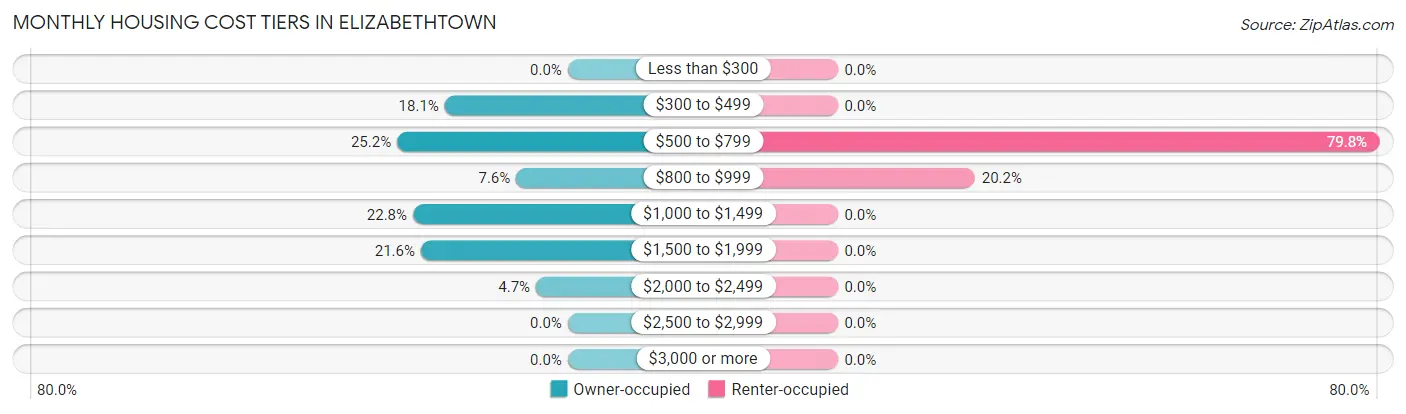
| Monthly Cost | Owner-occupied | Renter-occupied |
| Less than $300 | 0 (0.0%) | 0 (0.0%) |
| $300 to $499 | 31 (18.1%) | 0 (0.0%) |
| $500 to $799 | 43 (25.2%) | 67 (79.8%) |
| $800 to $999 | 13 (7.6%) | 17 (20.2%) |
| $1,000 to $1,499 | 39 (22.8%) | 0 (0.0%) |
| $1,500 to $1,999 | 37 (21.6%) | 0 (0.0%) |
| $2,000 to $2,499 | 8 (4.7%) | 0 (0.0%) |
| $2,500 to $2,999 | 0 (0.0%) | 0 (0.0%) |
| $3,000 or more | 0 (0.0%) | 0 (0.0%) |
| Total | 171 (100.0%) | 84 (100.0%) |
Physical Housing Characteristics in Elizabethtown
Housing Structures in Elizabethtown
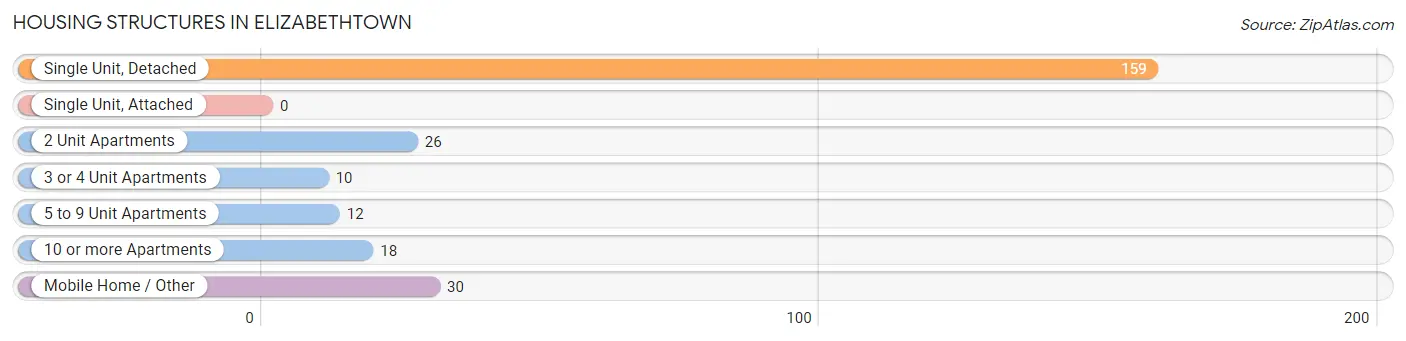
| Structure Type | # Housing Units | % Housing Units |
| Single Unit, Detached | 159 | 62.4% |
| Single Unit, Attached | 0 | 0.0% |
| 2 Unit Apartments | 26 | 10.2% |
| 3 or 4 Unit Apartments | 10 | 3.9% |
| 5 to 9 Unit Apartments | 12 | 4.7% |
| 10 or more Apartments | 18 | 7.1% |
| Mobile Home / Other | 30 | 11.8% |
| Total | 255 | 100.0% |
Housing Structures by Occupancy in Elizabethtown
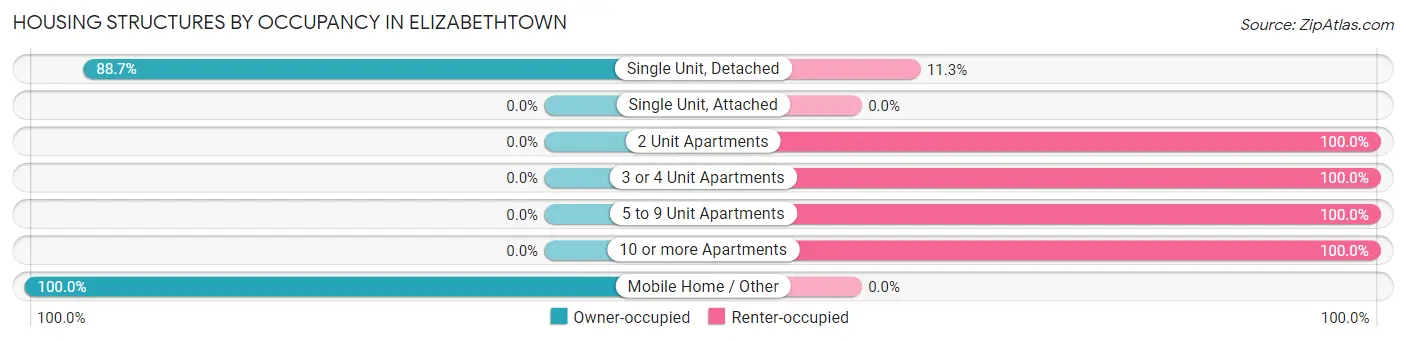
| Structure Type | Owner-occupied | Renter-occupied |
| Single Unit, Detached | 141 (88.7%) | 18 (11.3%) |
| Single Unit, Attached | 0 (0.0%) | 0 (0.0%) |
| 2 Unit Apartments | 0 (0.0%) | 26 (100.0%) |
| 3 or 4 Unit Apartments | 0 (0.0%) | 10 (100.0%) |
| 5 to 9 Unit Apartments | 0 (0.0%) | 12 (100.0%) |
| 10 or more Apartments | 0 (0.0%) | 18 (100.0%) |
| Mobile Home / Other | 30 (100.0%) | 0 (0.0%) |
| Total | 171 (67.1%) | 84 (32.9%) |
Housing Structures by Number of Rooms in Elizabethtown
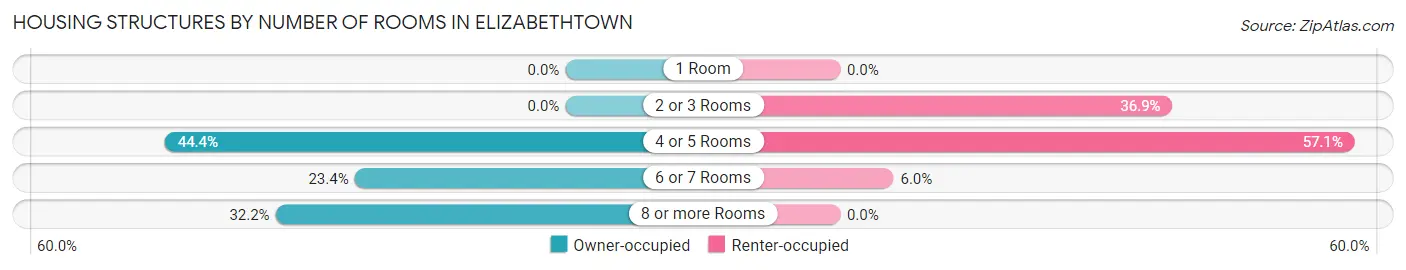
| Number of Rooms | Owner-occupied | Renter-occupied |
| 1 Room | 0 (0.0%) | 0 (0.0%) |
| 2 or 3 Rooms | 0 (0.0%) | 31 (36.9%) |
| 4 or 5 Rooms | 76 (44.4%) | 48 (57.1%) |
| 6 or 7 Rooms | 40 (23.4%) | 5 (5.9%) |
| 8 or more Rooms | 55 (32.2%) | 0 (0.0%) |
| Total | 171 (100.0%) | 84 (100.0%) |
Housing Structure by Heating Type in Elizabethtown
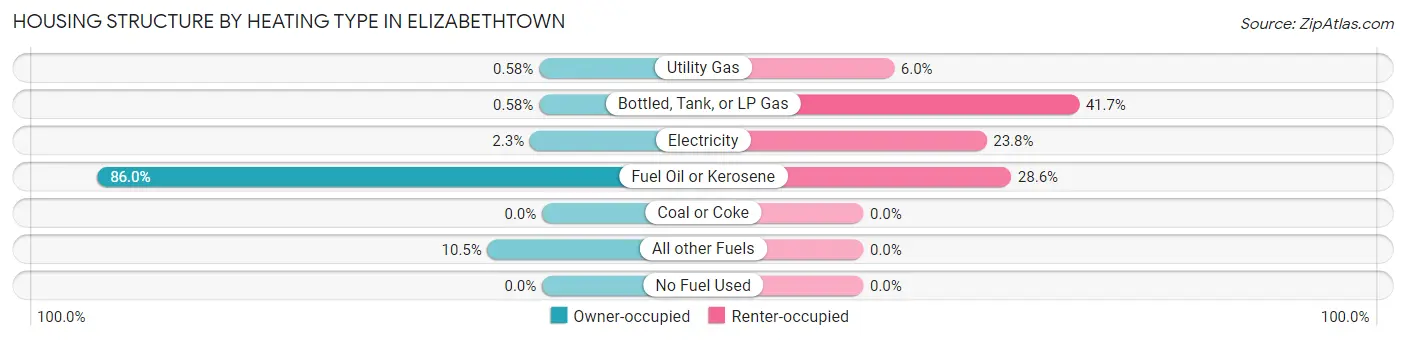
| Heating Type | Owner-occupied | Renter-occupied |
| Utility Gas | 1 (0.6%) | 5 (5.9%) |
| Bottled, Tank, or LP Gas | 1 (0.6%) | 35 (41.7%) |
| Electricity | 4 (2.3%) | 20 (23.8%) |
| Fuel Oil or Kerosene | 147 (86.0%) | 24 (28.6%) |
| Coal or Coke | 0 (0.0%) | 0 (0.0%) |
| All other Fuels | 18 (10.5%) | 0 (0.0%) |
| No Fuel Used | 0 (0.0%) | 0 (0.0%) |
| Total | 171 (100.0%) | 84 (100.0%) |
Household Vehicle Usage in Elizabethtown
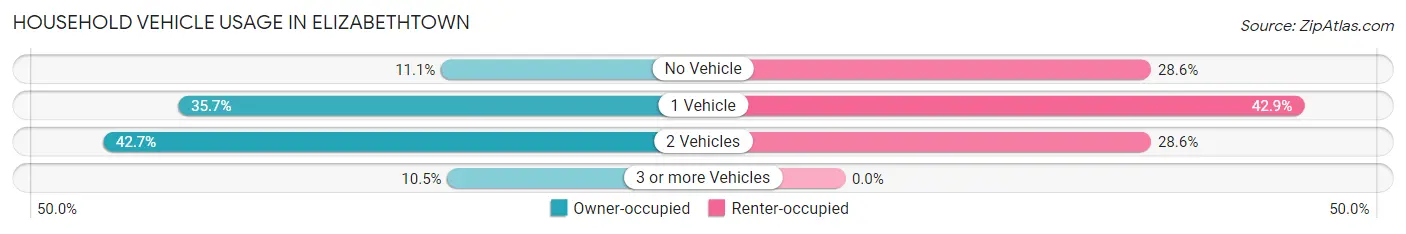
| Vehicles per Household | Owner-occupied | Renter-occupied |
| No Vehicle | 19 (11.1%) | 24 (28.6%) |
| 1 Vehicle | 61 (35.7%) | 36 (42.9%) |
| 2 Vehicles | 73 (42.7%) | 24 (28.6%) |
| 3 or more Vehicles | 18 (10.5%) | 0 (0.0%) |
| Total | 171 (100.0%) | 84 (100.0%) |
Real Estate & Mortgages in Elizabethtown
Real Estate and Mortgage Overview in Elizabethtown
| Characteristic | Without Mortgage | With Mortgage |
| Housing Units | 65 | 106 |
| Median Property Value | - | - |
| Median Household Income | $51,250 | $0 |
| Monthly Housing Costs | $605 | $0 |
| Real Estate Taxes | $2,286 | $4 |
Property Value by Mortgage Status in Elizabethtown
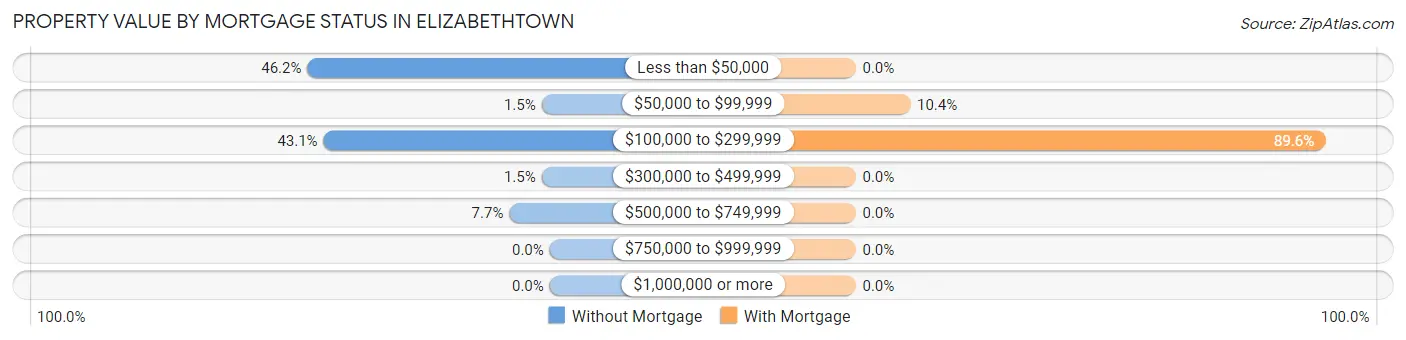
| Property Value | Without Mortgage | With Mortgage |
| Less than $50,000 | 30 (46.2%) | 0 (0.0%) |
| $50,000 to $99,999 | 1 (1.5%) | 11 (10.4%) |
| $100,000 to $299,999 | 28 (43.1%) | 95 (89.6%) |
| $300,000 to $499,999 | 1 (1.5%) | 0 (0.0%) |
| $500,000 to $749,999 | 5 (7.7%) | 0 (0.0%) |
| $750,000 to $999,999 | 0 (0.0%) | 0 (0.0%) |
| $1,000,000 or more | 0 (0.0%) | 0 (0.0%) |
| Total | 65 (100.0%) | 106 (100.0%) |
Household Income by Mortgage Status in Elizabethtown
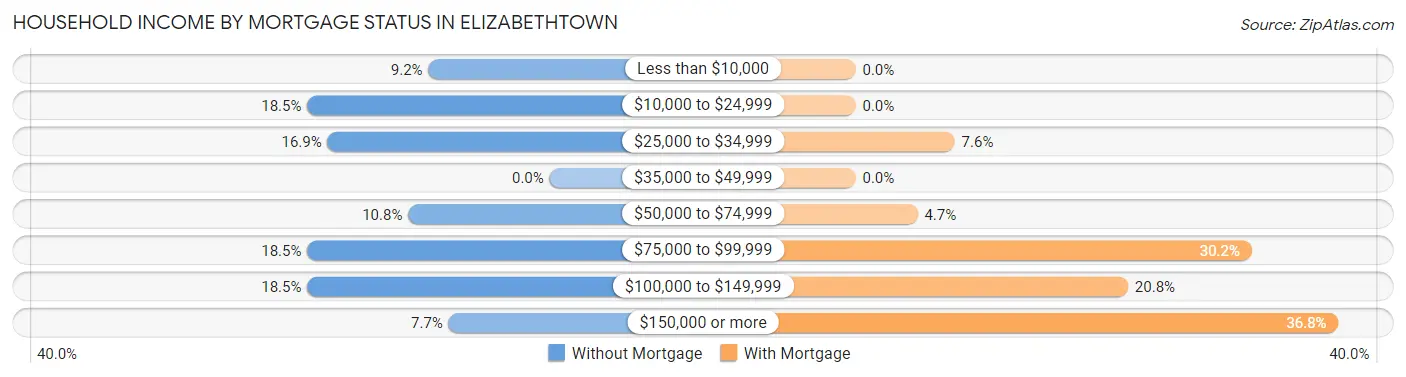
| Household Income | Without Mortgage | With Mortgage |
| Less than $10,000 | 6 (9.2%) | 0 (0.0%) |
| $10,000 to $24,999 | 12 (18.5%) | 0 (0.0%) |
| $25,000 to $34,999 | 11 (16.9%) | 8 (7.5%) |
| $35,000 to $49,999 | 0 (0.0%) | 0 (0.0%) |
| $50,000 to $74,999 | 7 (10.8%) | 5 (4.7%) |
| $75,000 to $99,999 | 12 (18.5%) | 32 (30.2%) |
| $100,000 to $149,999 | 12 (18.5%) | 22 (20.7%) |
| $150,000 or more | 5 (7.7%) | 39 (36.8%) |
| Total | 65 (100.0%) | 106 (100.0%) |
Property Value to Household Income Ratio in Elizabethtown
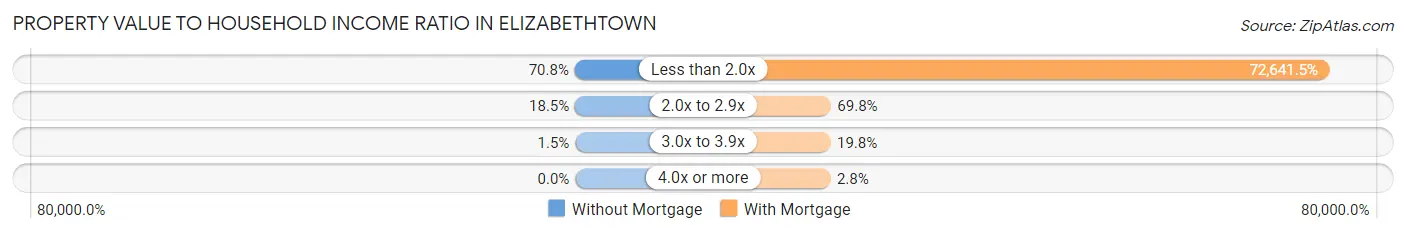
| Value-to-Income Ratio | Without Mortgage | With Mortgage |
| Less than 2.0x | 46 (70.8%) | 77,000 (72,641.5%) |
| 2.0x to 2.9x | 12 (18.5%) | 74 (69.8%) |
| 3.0x to 3.9x | 1 (1.5%) | 21 (19.8%) |
| 4.0x or more | 0 (0.0%) | 3 (2.8%) |
| Total | 65 (100.0%) | 106 (100.0%) |
Real Estate Taxes by Mortgage Status in Elizabethtown
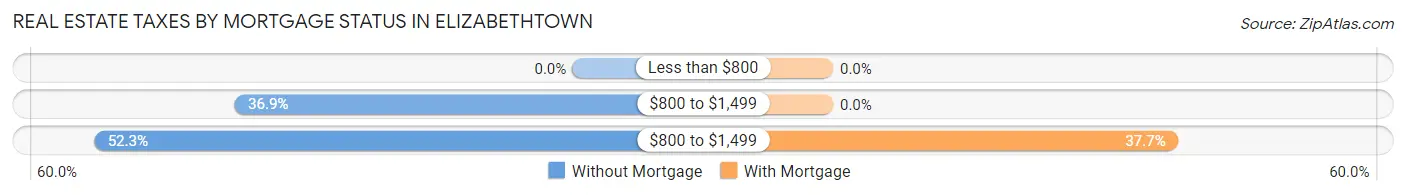
| Property Taxes | Without Mortgage | With Mortgage |
| Less than $800 | 0 (0.0%) | 0 (0.0%) |
| $800 to $1,499 | 24 (36.9%) | 0 (0.0%) |
| $800 to $1,499 | 34 (52.3%) | 40 (37.7%) |
| Total | 65 (100.0%) | 106 (100.0%) |
Health & Disability in Elizabethtown
Health Insurance Coverage by Age in Elizabethtown
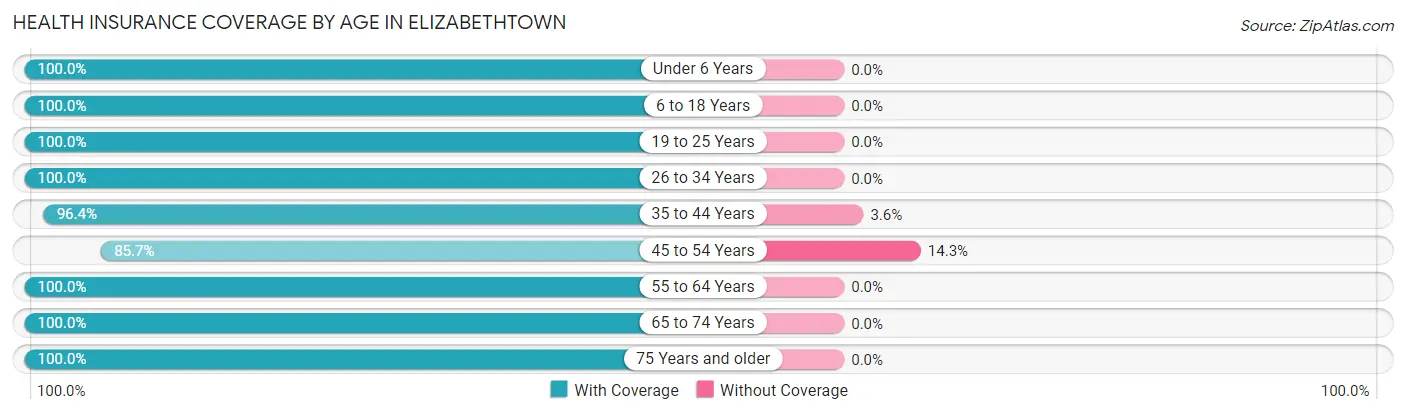
| Age Bracket | With Coverage | Without Coverage |
| Under 6 Years | 20 (100.0%) | 0 (0.0%) |
| 6 to 18 Years | 55 (100.0%) | 0 (0.0%) |
| 19 to 25 Years | 32 (100.0%) | 0 (0.0%) |
| 26 to 34 Years | 74 (100.0%) | 0 (0.0%) |
| 35 to 44 Years | 27 (96.4%) | 1 (3.6%) |
| 45 to 54 Years | 42 (85.7%) | 7 (14.3%) |
| 55 to 64 Years | 78 (100.0%) | 0 (0.0%) |
| 65 to 74 Years | 93 (100.0%) | 0 (0.0%) |
| 75 Years and older | 37 (100.0%) | 0 (0.0%) |
| Total | 458 (98.3%) | 8 (1.7%) |
Health Insurance Coverage by Citizenship Status in Elizabethtown
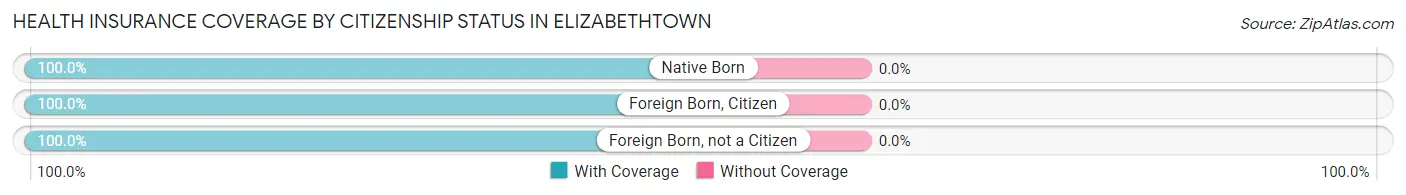
| Citizenship Status | With Coverage | Without Coverage |
| Native Born | 20 (100.0%) | 0 (0.0%) |
| Foreign Born, Citizen | 55 (100.0%) | 0 (0.0%) |
| Foreign Born, not a Citizen | 32 (100.0%) | 0 (0.0%) |
Health Insurance Coverage by Household Income in Elizabethtown
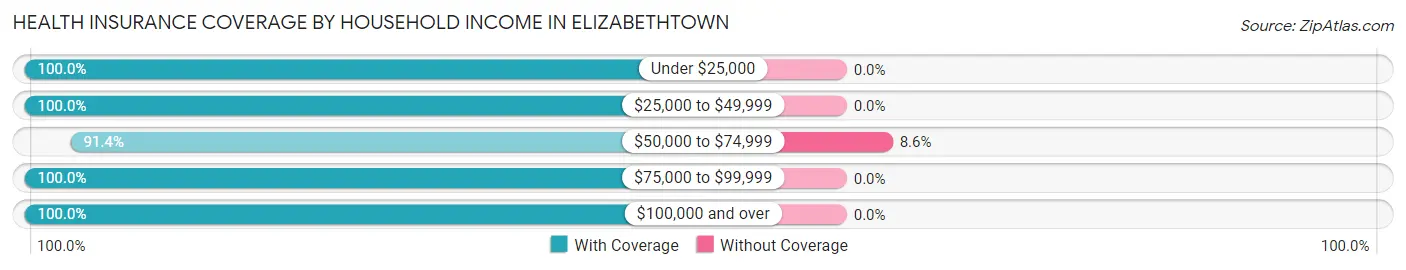
| Household Income | With Coverage | Without Coverage |
| Under $25,000 | 68 (100.0%) | 0 (0.0%) |
| $25,000 to $49,999 | 58 (100.0%) | 0 (0.0%) |
| $50,000 to $74,999 | 85 (91.4%) | 8 (8.6%) |
| $75,000 to $99,999 | 69 (100.0%) | 0 (0.0%) |
| $100,000 and over | 178 (100.0%) | 0 (0.0%) |
Public vs Private Health Insurance Coverage by Age in Elizabethtown
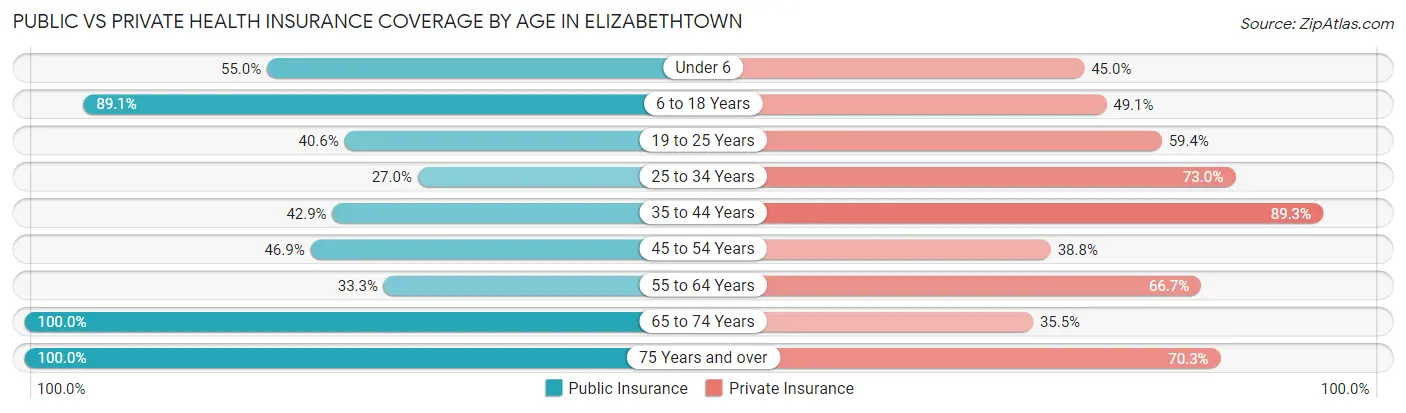
| Age Bracket | Public Insurance | Private Insurance |
| Under 6 | 11 (55.0%) | 9 (45.0%) |
| 6 to 18 Years | 49 (89.1%) | 27 (49.1%) |
| 19 to 25 Years | 13 (40.6%) | 19 (59.4%) |
| 25 to 34 Years | 20 (27.0%) | 54 (73.0%) |
| 35 to 44 Years | 12 (42.9%) | 25 (89.3%) |
| 45 to 54 Years | 23 (46.9%) | 19 (38.8%) |
| 55 to 64 Years | 26 (33.3%) | 52 (66.7%) |
| 65 to 74 Years | 93 (100.0%) | 33 (35.5%) |
| 75 Years and over | 37 (100.0%) | 26 (70.3%) |
| Total | 284 (60.9%) | 264 (56.7%) |
Disability Status by Sex by Age in Elizabethtown
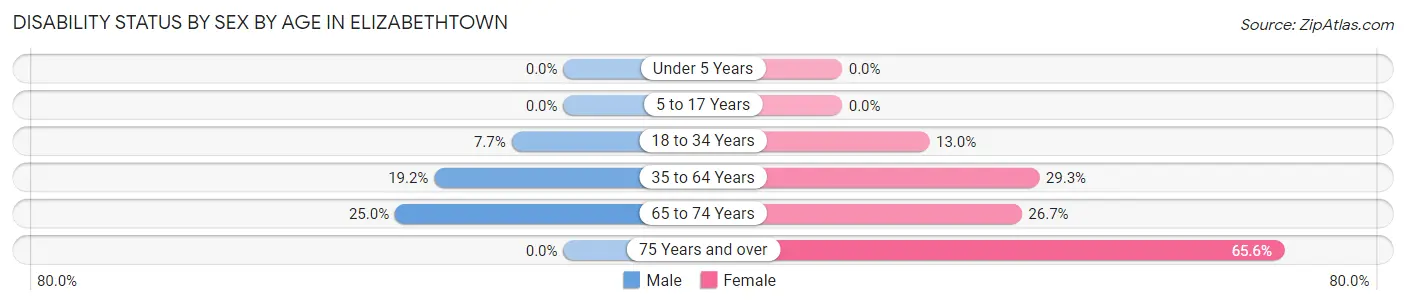
| Age Bracket | Male | Female |
| Under 5 Years | 0 (0.0%) | 0 (0.0%) |
| 5 to 17 Years | 0 (0.0%) | 0 (0.0%) |
| 18 to 34 Years | 4 (7.7%) | 7 (13.0%) |
| 35 to 64 Years | 14 (19.2%) | 24 (29.3%) |
| 65 to 74 Years | 12 (25.0%) | 12 (26.7%) |
| 75 Years and over | 0 (0.0%) | 21 (65.6%) |
Disability Class by Sex by Age in Elizabethtown
Disability Class: Hearing Difficulty
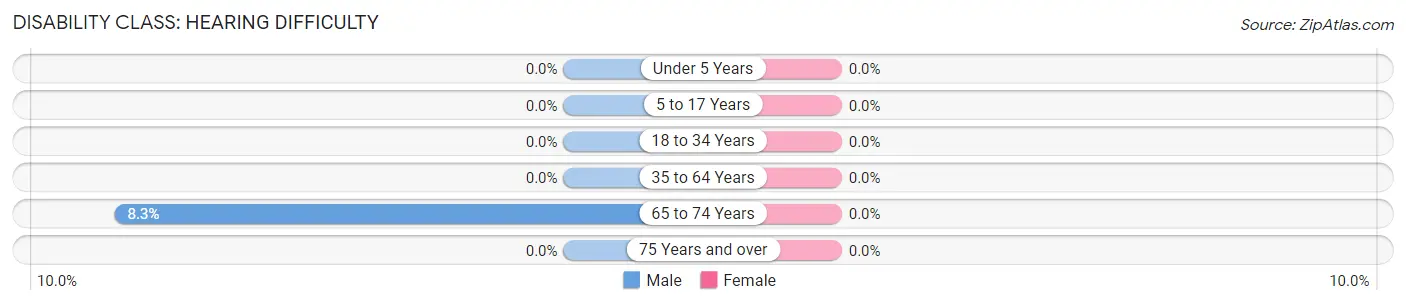
| Age Bracket | Male | Female |
| Under 5 Years | 0 (0.0%) | 0 (0.0%) |
| 5 to 17 Years | 0 (0.0%) | 0 (0.0%) |
| 18 to 34 Years | 0 (0.0%) | 0 (0.0%) |
| 35 to 64 Years | 0 (0.0%) | 0 (0.0%) |
| 65 to 74 Years | 4 (8.3%) | 0 (0.0%) |
| 75 Years and over | 0 (0.0%) | 0 (0.0%) |
Disability Class: Vision Difficulty
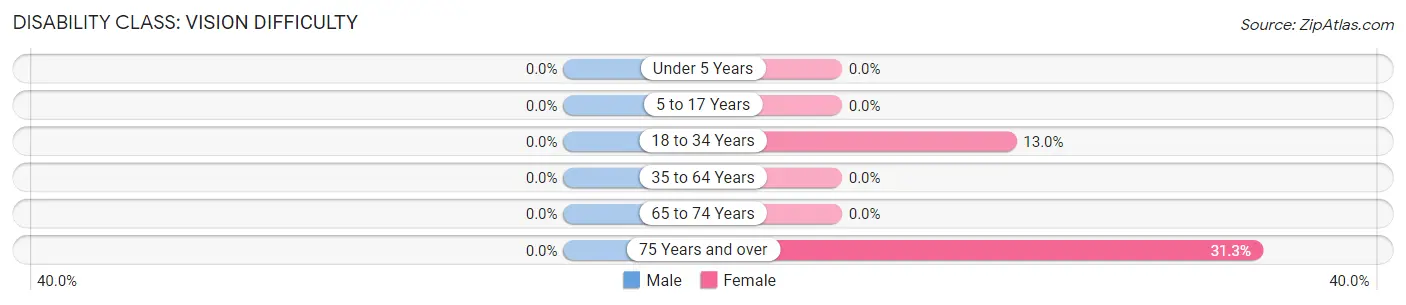
| Age Bracket | Male | Female |
| Under 5 Years | 0 (0.0%) | 0 (0.0%) |
| 5 to 17 Years | 0 (0.0%) | 0 (0.0%) |
| 18 to 34 Years | 0 (0.0%) | 7 (13.0%) |
| 35 to 64 Years | 0 (0.0%) | 0 (0.0%) |
| 65 to 74 Years | 0 (0.0%) | 0 (0.0%) |
| 75 Years and over | 0 (0.0%) | 10 (31.2%) |
Disability Class: Cognitive Difficulty
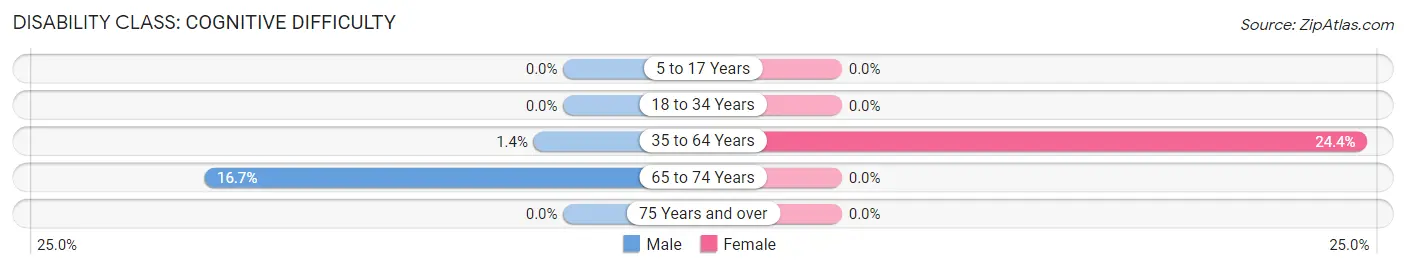
| Age Bracket | Male | Female |
| 5 to 17 Years | 0 (0.0%) | 0 (0.0%) |
| 18 to 34 Years | 0 (0.0%) | 0 (0.0%) |
| 35 to 64 Years | 1 (1.4%) | 20 (24.4%) |
| 65 to 74 Years | 8 (16.7%) | 0 (0.0%) |
| 75 Years and over | 0 (0.0%) | 0 (0.0%) |
Disability Class: Ambulatory Difficulty
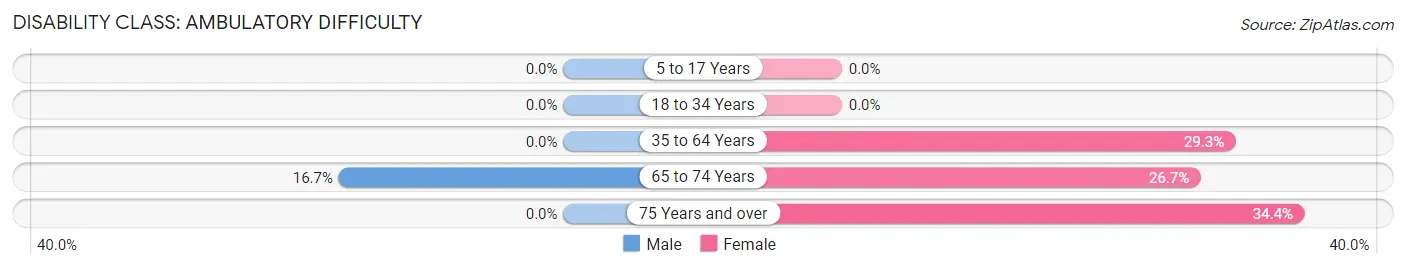
| Age Bracket | Male | Female |
| 5 to 17 Years | 0 (0.0%) | 0 (0.0%) |
| 18 to 34 Years | 0 (0.0%) | 0 (0.0%) |
| 35 to 64 Years | 0 (0.0%) | 24 (29.3%) |
| 65 to 74 Years | 8 (16.7%) | 12 (26.7%) |
| 75 Years and over | 0 (0.0%) | 11 (34.4%) |
Disability Class: Self-Care Difficulty
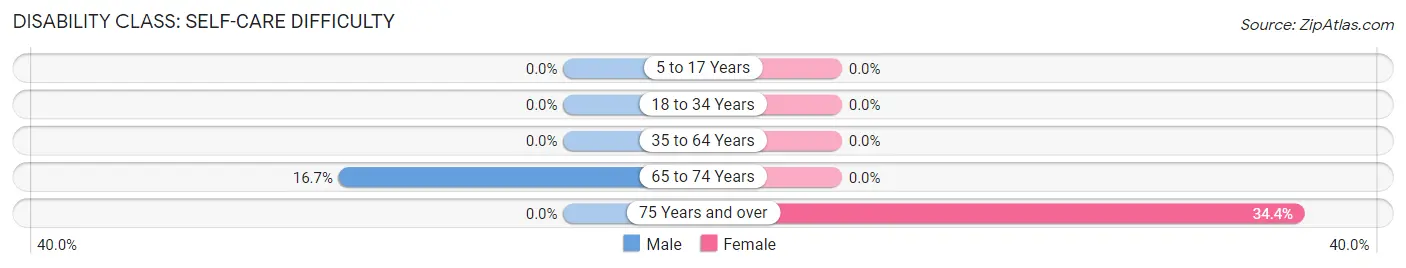
| Age Bracket | Male | Female |
| 5 to 17 Years | 0 (0.0%) | 0 (0.0%) |
| 18 to 34 Years | 0 (0.0%) | 0 (0.0%) |
| 35 to 64 Years | 0 (0.0%) | 0 (0.0%) |
| 65 to 74 Years | 8 (16.7%) | 0 (0.0%) |
| 75 Years and over | 0 (0.0%) | 11 (34.4%) |
Technology Access in Elizabethtown
Computing Device Access in Elizabethtown
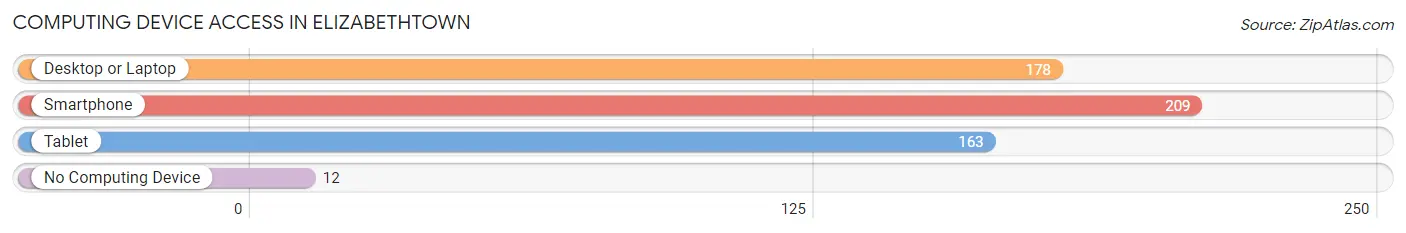
| Device Type | # Households | % Households |
| Desktop or Laptop | 178 | 69.8% |
| Smartphone | 209 | 82.0% |
| Tablet | 163 | 63.9% |
| No Computing Device | 12 | 4.7% |
| Total | 255 | 100.0% |
Internet Access in Elizabethtown
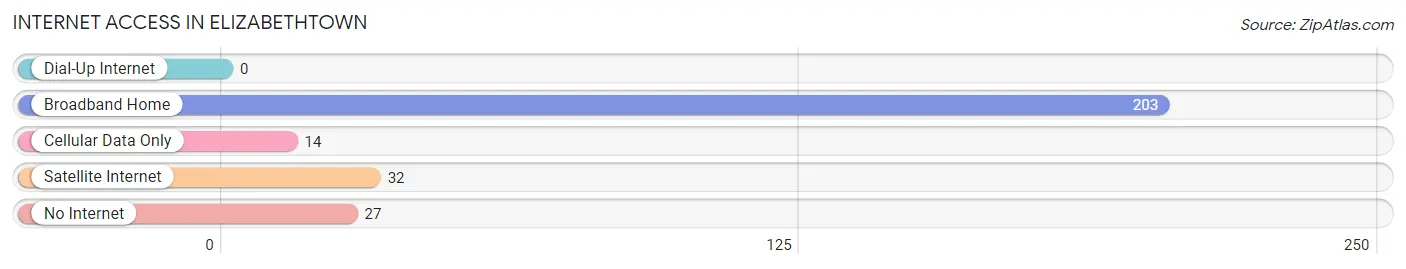
| Internet Type | # Households | % Households |
| Dial-Up Internet | 0 | 0.0% |
| Broadband Home | 203 | 79.6% |
| Cellular Data Only | 14 | 5.5% |
| Satellite Internet | 32 | 12.6% |
| No Internet | 27 | 10.6% |
| Total | 255 | 100.0% |
Elizabethtown Summary
Elizabethtown, NY is a small town located in Essex County, New York. It is situated in the Adirondack Mountains and is part of the Adirondack Park. The town was established in 1798 and is the oldest town in Essex County. The town is home to a population of approximately 1,500 people.
History
Elizabethtown was first settled in 1798 by a group of settlers from New Hampshire. The town was named after Elizabeth, the wife of the first settler, John Brown. The town was originally part of the town of Lewis, but was later incorporated as its own town in 1803.
The town was an important center of commerce in the early 19th century. It was the site of the first post office in Essex County, and the first courthouse in the county was built in Elizabethtown in 1805. The town was also the site of the first school in the county, which was established in 1810.
The town was an important stop on the Underground Railroad, and many escaped slaves passed through the town on their way to freedom. The town was also the site of the first African-American church in Essex County, which was established in 1820.
Geography
Elizabethtown is located in the Adirondack Mountains in the northeastern part of New York State. The town is situated in the Adirondack Park, which is a 6 million acre park that is home to a variety of wildlife and outdoor activities. The town is bordered by the towns of Lewis, Willsboro, and Westport.
The town is located on the western shore of Lake Champlain, which is the sixth largest lake in the United States. The lake is a popular destination for fishing, boating, and other recreational activities. The town is also home to the Ausable River, which is a popular destination for whitewater rafting and kayaking.
Economy
The economy of Elizabethtown is largely based on tourism. The town is a popular destination for outdoor activities such as fishing, boating, hiking, and camping. The town is also home to several small businesses, including restaurants, shops, and lodging.
The town is also home to several manufacturing companies, including a paper mill and a furniture factory. The town is also home to a number of farms, which produce a variety of crops, including apples, potatoes, and hay.
Demographics
As of the 2010 census, the population of Elizabethtown was 1,500. The town is predominantly white, with 95.3% of the population identifying as white. The town also has a small Hispanic population, with 2.7% of the population identifying as Hispanic or Latino.
The median household income in Elizabethtown is $41,250, and the median home value is $133,000. The town has a poverty rate of 11.3%, which is slightly higher than the national average.
Conclusion
Elizabethtown, NY is a small town located in Essex County, New York. It is situated in the Adirondack Mountains and is part of the Adirondack Park. The town was established in 1798 and is the oldest town in Essex County. The town is home to a population of approximately 1,500 people. The economy of Elizabethtown is largely based on tourism, and the town is a popular destination for outdoor activities such as fishing, boating, hiking, and camping. The town is also home to several small businesses, manufacturing companies, and farms. The town is predominantly white, with 95.3% of the population identifying as white. The median household income in Elizabethtown is $41,250, and the median home value is $133,000.
Common Questions
What is Per Capita Income in Elizabethtown?
Per Capita income in Elizabethtown is $35,308.
What is the Median Family Income in Elizabethtown?
Median Family Income in Elizabethtown is $70,417.
What is the Median Household income in Elizabethtown?
Median Household Income in Elizabethtown is $61,023.
What is Income or Wage Gap in Elizabethtown?
Income or Wage Gap in Elizabethtown is 11.5%.
Women in Elizabethtown earn 88.5 cents for every dollar earned by a man.
What is Inequality or Gini Index in Elizabethtown?
Inequality or Gini Index in Elizabethtown is 0.39.
What is the Total Population of Elizabethtown?
Total Population of Elizabethtown is 553.
What is the Total Male Population of Elizabethtown?
Total Male Population of Elizabethtown is 263.
What is the Total Female Population of Elizabethtown?
Total Female Population of Elizabethtown is 290.
What is the Ratio of Males per 100 Females in Elizabethtown?
There are 90.69 Males per 100 Females in Elizabethtown.
What is the Ratio of Females per 100 Males in Elizabethtown?
There are 110.27 Females per 100 Males in Elizabethtown.
What is the Median Population Age in Elizabethtown?
Median Population Age in Elizabethtown is 56.6 Years.
What is the Average Family Size in Elizabethtown
Average Family Size in Elizabethtown is 2.6 People.
What is the Average Household Size in Elizabethtown
Average Household Size in Elizabethtown is 1.8 People.
How Large is the Labor Force in Elizabethtown?
There are 219 People in the Labor Forcein in Elizabethtown.
What is the Percentage of People in the Labor Force in Elizabethtown?
45.8% of People are in the Labor Force in Elizabethtown.
What is the Unemployment Rate in Elizabethtown?
Unemployment Rate in Elizabethtown is 5.5%.