Dalton, NY Map & Demographics
Dalton Map
Dalton Overview
$43,948
PER CAPITA INCOME
$75,625
AVG FAMILY INCOME
$68,915
AVG HOUSEHOLD INCOME
0.27
INEQUALITY / GINI INDEX
347
TOTAL POPULATION
185
MALE POPULATION
162
FEMALE POPULATION
114.20
MALES / 100 FEMALES
87.57
FEMALES / 100 MALES
49.2
MEDIAN AGE
2.9
AVG FAMILY SIZE
1.6
AVG HOUSEHOLD SIZE
194
LABOR FORCE [ PEOPLE ]
64.0%
PERCENT IN LABOR FORCE
Dalton Zip Codes
Dalton Area Codes
Income in Dalton
Income Overview in Dalton
Per Capita Income in Dalton is $43,948, while median incomes of families and households are $75,625 and $68,915 respectively.
| Characteristic | Number | Measure |
| Per Capita Income | 347 | $43,948 |
| Median Family Income | 60 | $75,625 |
| Mean Family Income | 60 | $81,812 |
| Median Household Income | 217 | $68,915 |
| Mean Household Income | 217 | $71,375 |
| Income Deficit | 60 | $0 |
| Wage / Income Gap (%) | 347 | 0.00% |
| Wage / Income Gap ($) | 347 | 100.00¢ per $1 |
| Gini / Inequality Index | 347 | 0.27 |
Earnings by Sex in Dalton
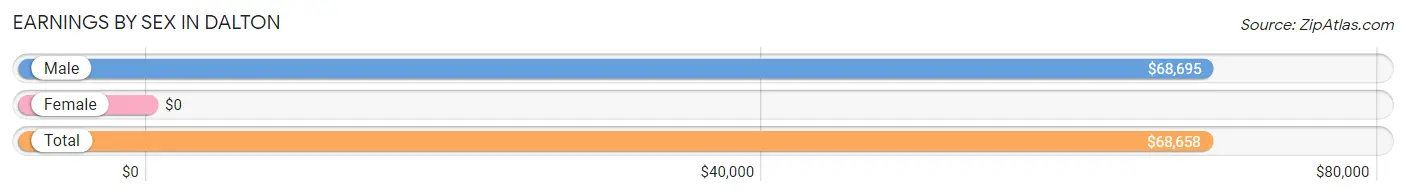
| Sex | Number | Average Earnings |
| Male | 111 (54.1%) | $68,695 |
| Female | 94 (45.9%) | $0 |
| Total | 205 (100.0%) | $68,658 |
Earnings by Sex by Income Bracket in Dalton
The most common earnings brackets in Dalton are $65,000 to $74,999 for men (68 | 61.3%) and $75,000 to $99,999 for women (45 | 47.9%).
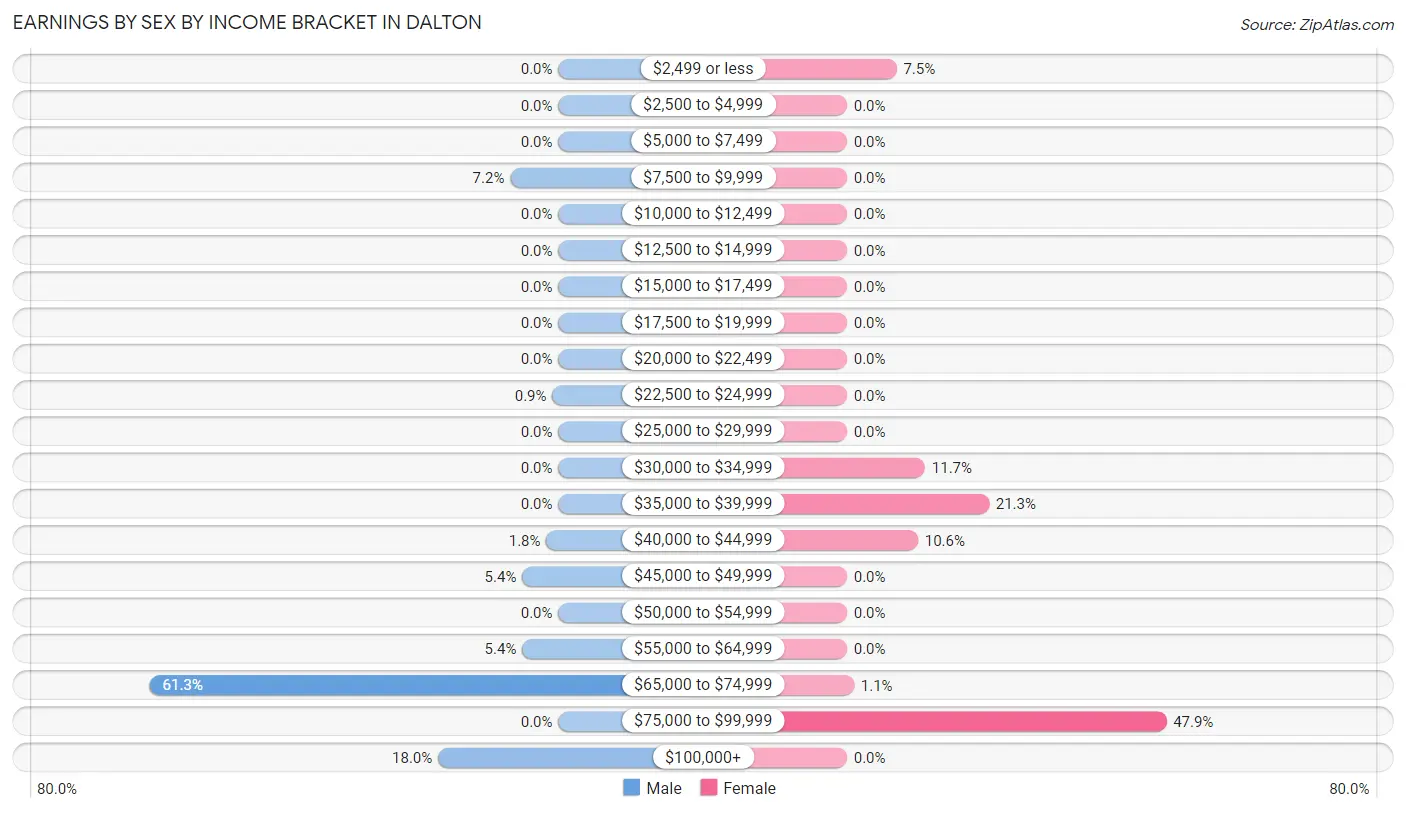
| Income | Male | Female |
| $2,499 or less | 0 (0.0%) | 7 (7.4%) |
| $2,500 to $4,999 | 0 (0.0%) | 0 (0.0%) |
| $5,000 to $7,499 | 0 (0.0%) | 0 (0.0%) |
| $7,500 to $9,999 | 8 (7.2%) | 0 (0.0%) |
| $10,000 to $12,499 | 0 (0.0%) | 0 (0.0%) |
| $12,500 to $14,999 | 0 (0.0%) | 0 (0.0%) |
| $15,000 to $17,499 | 0 (0.0%) | 0 (0.0%) |
| $17,500 to $19,999 | 0 (0.0%) | 0 (0.0%) |
| $20,000 to $22,499 | 0 (0.0%) | 0 (0.0%) |
| $22,500 to $24,999 | 1 (0.9%) | 0 (0.0%) |
| $25,000 to $29,999 | 0 (0.0%) | 0 (0.0%) |
| $30,000 to $34,999 | 0 (0.0%) | 11 (11.7%) |
| $35,000 to $39,999 | 0 (0.0%) | 20 (21.3%) |
| $40,000 to $44,999 | 2 (1.8%) | 10 (10.6%) |
| $45,000 to $49,999 | 6 (5.4%) | 0 (0.0%) |
| $50,000 to $54,999 | 0 (0.0%) | 0 (0.0%) |
| $55,000 to $64,999 | 6 (5.4%) | 0 (0.0%) |
| $65,000 to $74,999 | 68 (61.3%) | 1 (1.1%) |
| $75,000 to $99,999 | 0 (0.0%) | 45 (47.9%) |
| $100,000+ | 20 (18.0%) | 0 (0.0%) |
| Total | 111 (100.0%) | 94 (100.0%) |
Earnings by Sex by Educational Attainment in Dalton
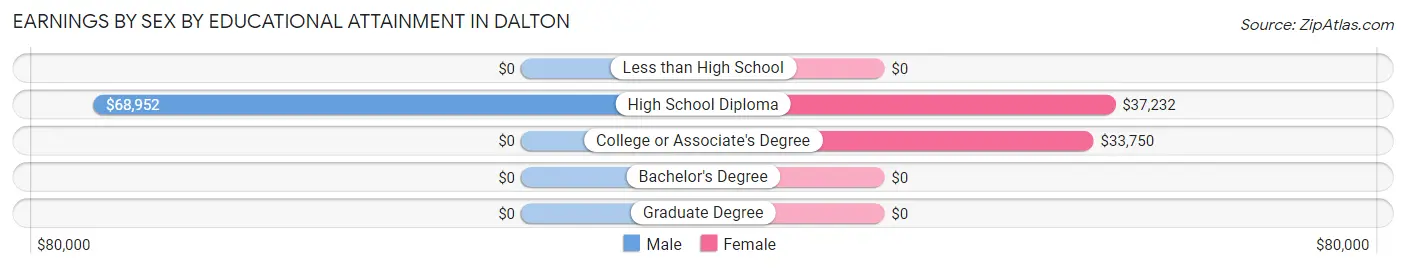
| Educational Attainment | Male Income | Female Income |
| Less than High School | - | - |
| High School Diploma | $68,952 | $37,232 |
| College or Associate's Degree | - | - |
| Bachelor's Degree | - | - |
| Graduate Degree | - | - |
| Total | $68,897 | $0 |
Family Income in Dalton
Family Income Brackets in Dalton
According to the Dalton family income data, there are 22 families falling into the $100,000 to $149,999 income range, which is the most common income bracket and makes up 36.7% of all families.
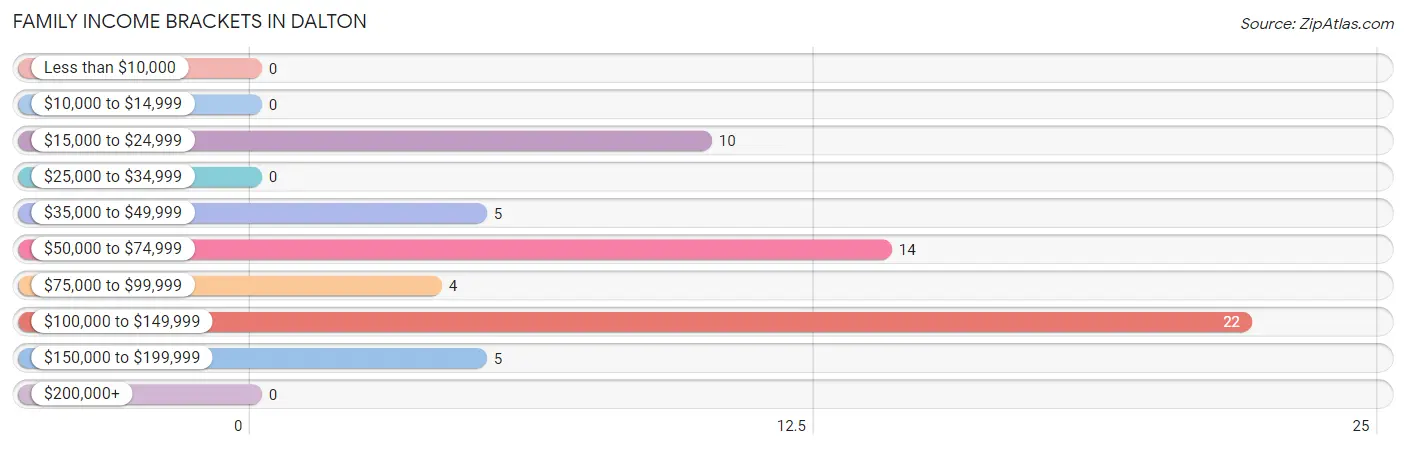
| Income Bracket | # Families | % Families |
| Less than $10,000 | 0 | 0.0% |
| $10,000 to $14,999 | 0 | 0.0% |
| $15,000 to $24,999 | 10 | 16.7% |
| $25,000 to $34,999 | 0 | 0.0% |
| $35,000 to $49,999 | 5 | 8.3% |
| $50,000 to $74,999 | 14 | 23.3% |
| $75,000 to $99,999 | 4 | 6.7% |
| $100,000 to $149,999 | 22 | 36.7% |
| $150,000 to $199,999 | 5 | 8.3% |
| $200,000+ | 0 | 0.0% |
Family Income by Famaliy Size in Dalton
2-person families (40 | 66.7%) account for the highest median family income in Dalton with $100,417 per family, while 2-person families (40 | 66.7%) have the highest median income of $50,208 per family member.
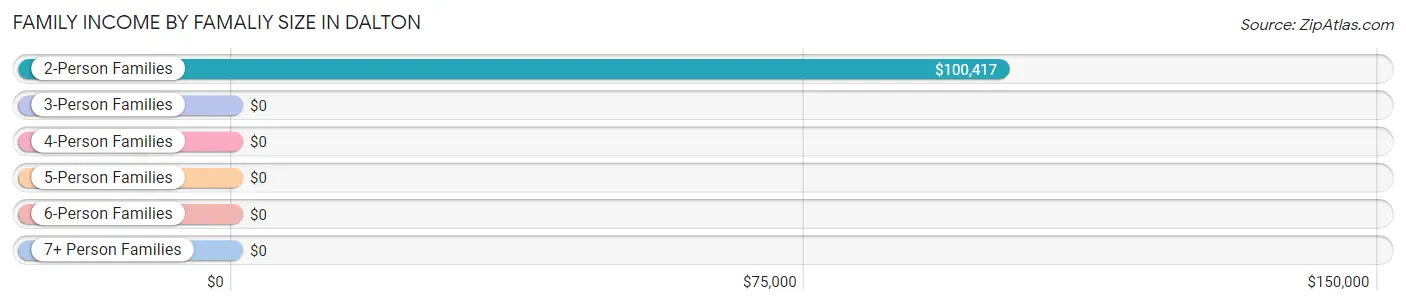
| Income Bracket | # Families | Median Income |
| 2-Person Families | 40 (66.7%) | $100,417 |
| 3-Person Families | 10 (16.7%) | $0 |
| 4-Person Families | 0 (0.0%) | $0 |
| 5-Person Families | 1 (1.7%) | $0 |
| 6-Person Families | 5 (8.3%) | $0 |
| 7+ Person Families | 4 (6.7%) | $0 |
| Total | 60 (100.0%) | $75,625 |
Family Income by Number of Earners in Dalton
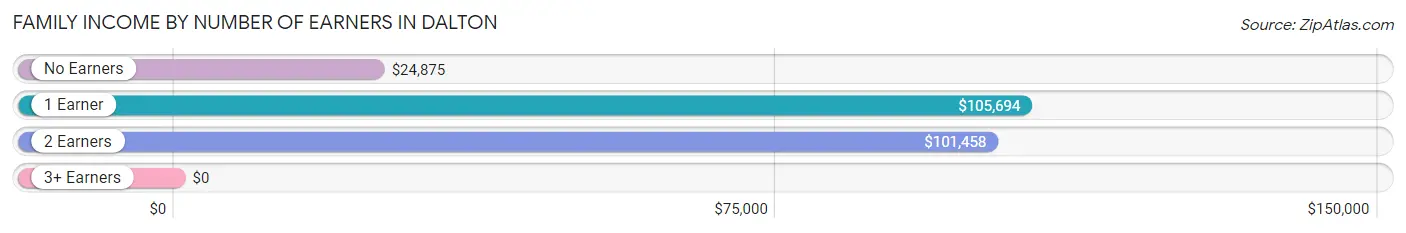
| Number of Earners | # Families | Median Income |
| No Earners | 19 (31.7%) | $24,875 |
| 1 Earner | 13 (21.7%) | $105,694 |
| 2 Earners | 27 (45.0%) | $101,458 |
| 3+ Earners | 1 (1.7%) | $0 |
| Total | 60 (100.0%) | $75,625 |
Household Income in Dalton
Household Income Brackets in Dalton
With 91 households falling in the category, the $50,000 to $74,999 income range is the most frequent in Dalton, accounting for 41.9% of all households.
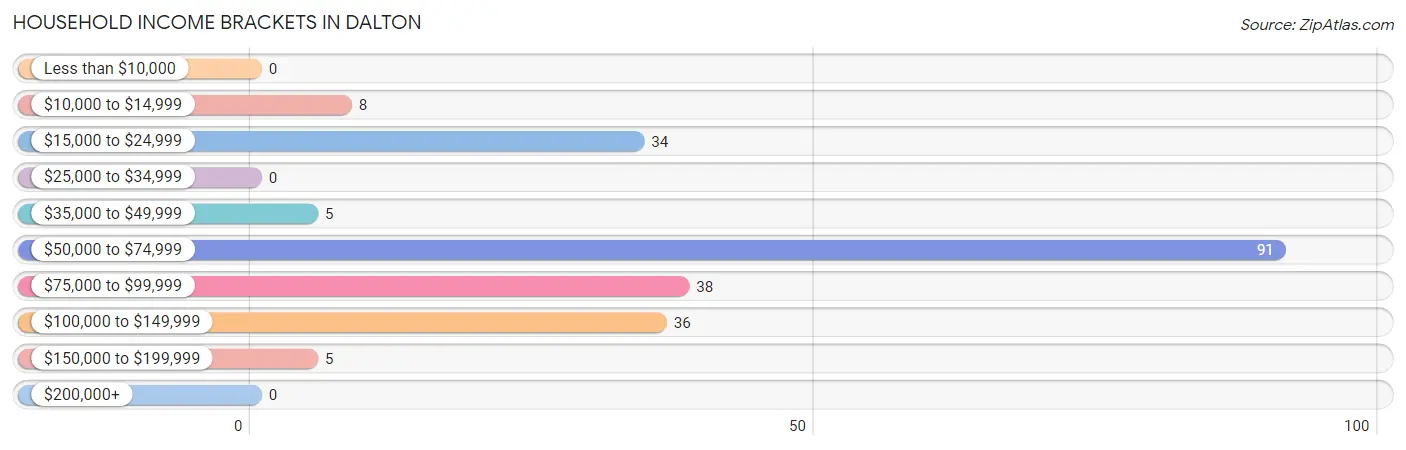
| Income Bracket | # Households | % Households |
| Less than $10,000 | 0 | 0.0% |
| $10,000 to $14,999 | 8 | 3.7% |
| $15,000 to $24,999 | 34 | 15.7% |
| $25,000 to $34,999 | 0 | 0.0% |
| $35,000 to $49,999 | 5 | 2.3% |
| $50,000 to $74,999 | 91 | 41.9% |
| $75,000 to $99,999 | 38 | 17.5% |
| $100,000 to $149,999 | 36 | 16.6% |
| $150,000 to $199,999 | 5 | 2.3% |
| $200,000+ | 0 | 0.0% |
Household Income by Householder Age in Dalton
The median household income in Dalton is $68,915, with the highest median household income of $84,779 found in the 45 to 64 years age bracket for the primary householder. A total of 76 households (35.0%) fall into this category.
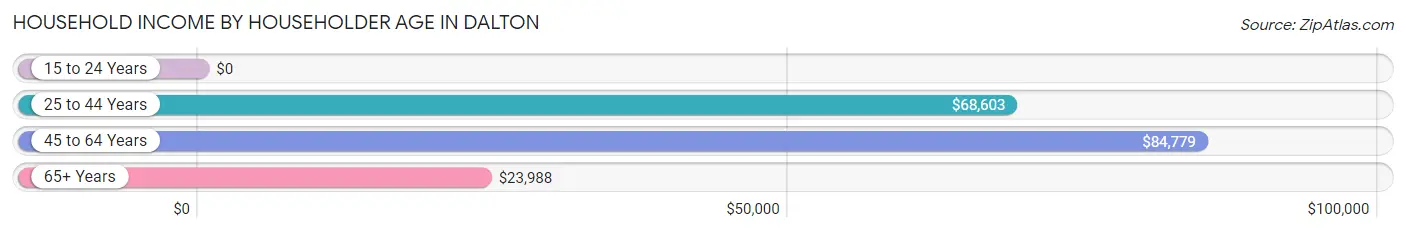
| Income Bracket | # Households | Median Income |
| 15 to 24 Years | 0 (0.0%) | $0 |
| 25 to 44 Years | 88 (40.6%) | $68,603 |
| 45 to 64 Years | 76 (35.0%) | $84,779 |
| 65+ Years | 53 (24.4%) | $23,988 |
| Total | 217 (100.0%) | $68,915 |
Poverty in Dalton
Income Below Poverty by Sex and Age in Dalton
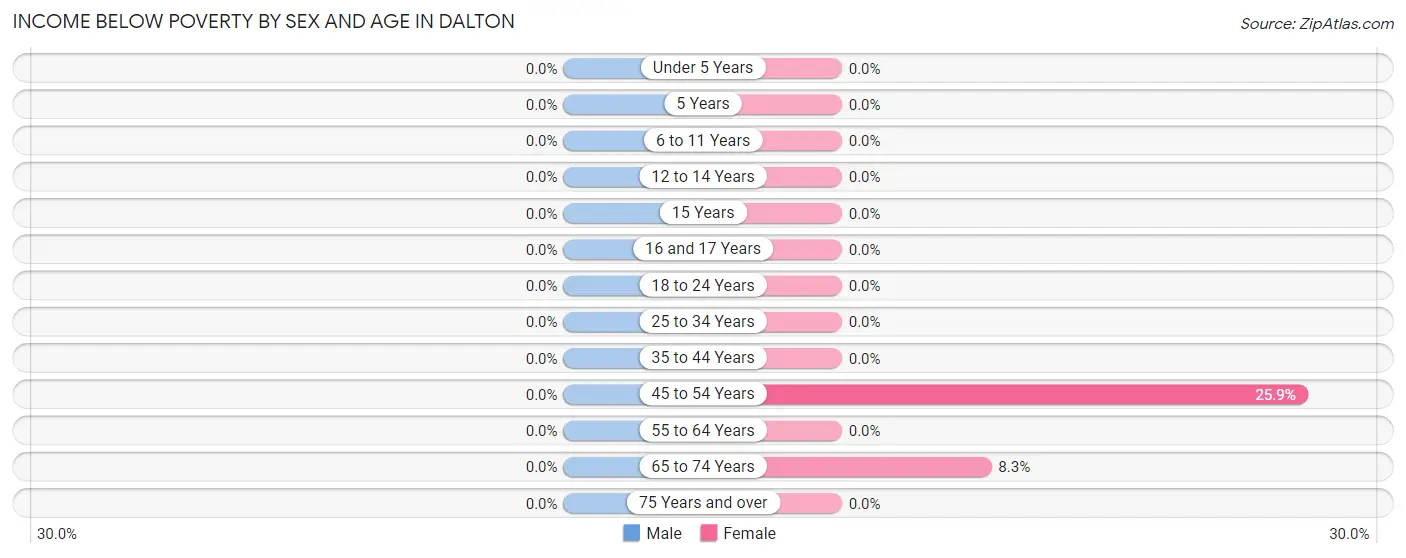
| Age Bracket | Male | Female |
| Under 5 Years | 0 (0.0%) | 0 (0.0%) |
| 5 Years | 0 (0.0%) | 0 (0.0%) |
| 6 to 11 Years | 0 (0.0%) | 0 (0.0%) |
| 12 to 14 Years | 0 (0.0%) | 0 (0.0%) |
| 15 Years | 0 (0.0%) | 0 (0.0%) |
| 16 and 17 Years | 0 (0.0%) | 0 (0.0%) |
| 18 to 24 Years | 0 (0.0%) | 0 (0.0%) |
| 25 to 34 Years | 0 (0.0%) | 0 (0.0%) |
| 35 to 44 Years | 0 (0.0%) | 0 (0.0%) |
| 45 to 54 Years | 0 (0.0%) | 7 (25.9%) |
| 55 to 64 Years | 0 (0.0%) | 0 (0.0%) |
| 65 to 74 Years | 0 (0.0%) | 1 (8.3%) |
| 75 Years and over | 0 (0.0%) | 0 (0.0%) |
| Total | 0 (0.0%) | 8 (4.9%) |
Income Above Poverty by Sex and Age in Dalton
According to the poverty statistics in Dalton, males aged 6 to 11 years and females aged under 5 years are the age groups that are most secure financially, with 100.0% of males and 100.0% of females in these age groups living above the poverty line.
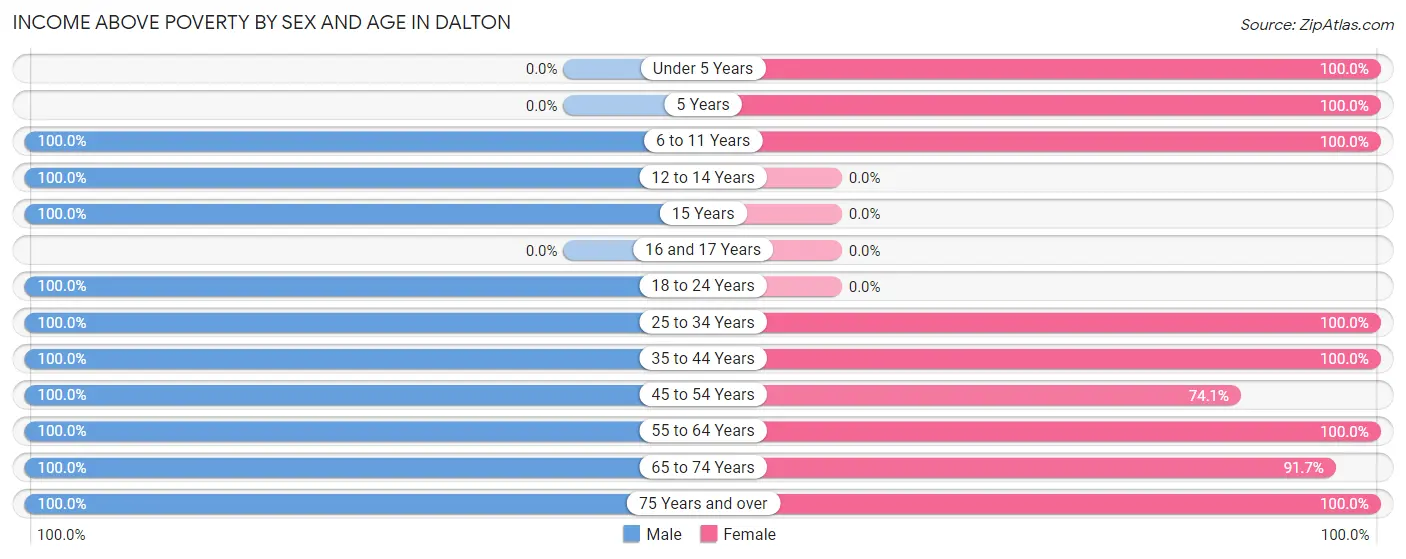
| Age Bracket | Male | Female |
| Under 5 Years | 0 (0.0%) | 11 (100.0%) |
| 5 Years | 0 (0.0%) | 5 (100.0%) |
| 6 to 11 Years | 11 (100.0%) | 11 (100.0%) |
| 12 to 14 Years | 5 (100.0%) | 0 (0.0%) |
| 15 Years | 1 (100.0%) | 0 (0.0%) |
| 16 and 17 Years | 0 (0.0%) | 0 (0.0%) |
| 18 to 24 Years | 32 (100.0%) | 0 (0.0%) |
| 25 to 34 Years | 71 (100.0%) | 5 (100.0%) |
| 35 to 44 Years | 4 (100.0%) | 16 (100.0%) |
| 45 to 54 Years | 5 (100.0%) | 20 (74.1%) |
| 55 to 64 Years | 29 (100.0%) | 48 (100.0%) |
| 65 to 74 Years | 6 (100.0%) | 11 (91.7%) |
| 75 Years and over | 21 (100.0%) | 27 (100.0%) |
| Total | 185 (100.0%) | 154 (95.1%) |
Income Below Poverty Among Married-Couple Families in Dalton
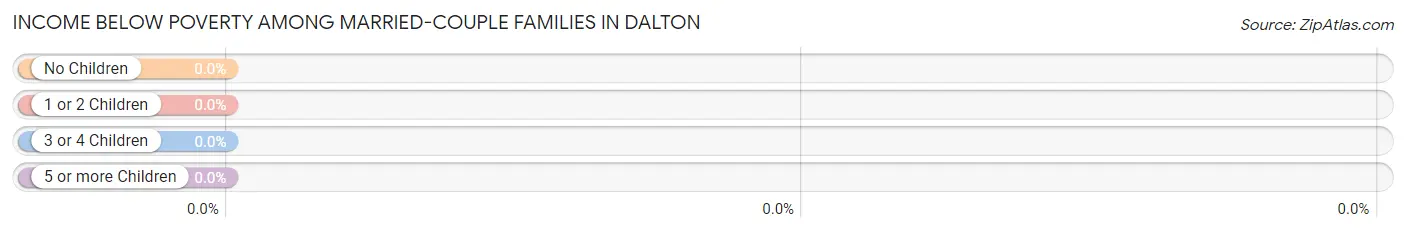
| Children | Above Poverty | Below Poverty |
| No Children | 40 (100.0%) | 0 (0.0%) |
| 1 or 2 Children | 0 (0.0%) | 0 (0.0%) |
| 3 or 4 Children | 9 (100.0%) | 0 (0.0%) |
| 5 or more Children | 0 (0.0%) | 0 (0.0%) |
| Total | 49 (100.0%) | 0 (0.0%) |
Income Below Poverty Among Single-Parent Households in Dalton
| Children | Single Father | Single Mother |
| No Children | 0 (0.0%) | 0 (0.0%) |
| 1 or 2 Children | 0 (0.0%) | 0 (0.0%) |
| 3 or 4 Children | 0 (0.0%) | 0 (0.0%) |
| 5 or more Children | 0 (0.0%) | 0 (0.0%) |
| Total | 0 (0.0%) | 0 (0.0%) |
Income Below Poverty Among Married-Couple vs Single-Parent Households in Dalton
| Children | Married-Couple Families | Single-Parent Households |
| No Children | 0 (0.0%) | 0 (0.0%) |
| 1 or 2 Children | 0 (0.0%) | 0 (0.0%) |
| 3 or 4 Children | 0 (0.0%) | 0 (0.0%) |
| 5 or more Children | 0 (0.0%) | 0 (0.0%) |
| Total | 0 (0.0%) | 0 (0.0%) |
Race in Dalton
The most populous races in Dalton are White / Caucasian (315 | 90.8%), and Two or more Races (32 | 9.2%).
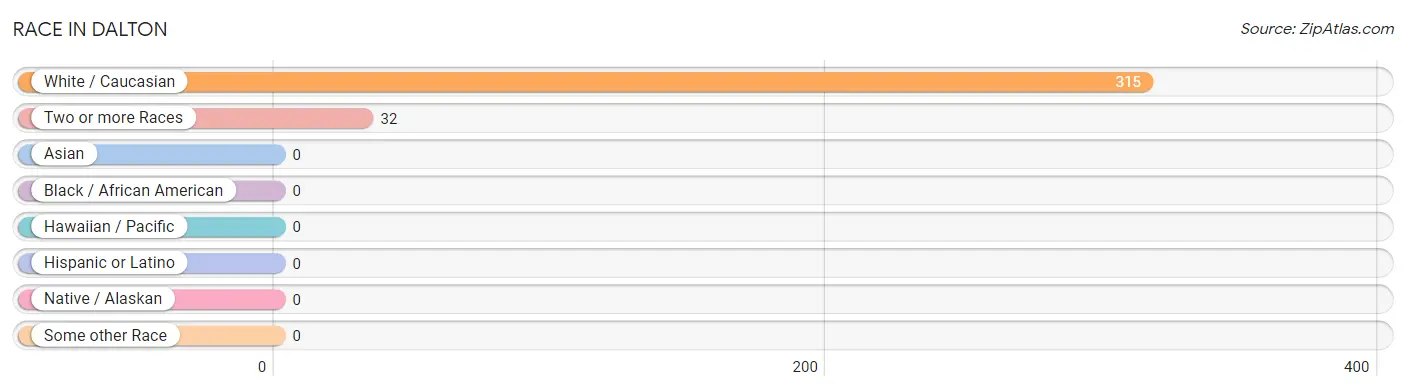
| Race | # Population | % Population |
| Asian | 0 | 0.0% |
| Black / African American | 0 | 0.0% |
| Hawaiian / Pacific | 0 | 0.0% |
| Hispanic or Latino | 0 | 0.0% |
| Native / Alaskan | 0 | 0.0% |
| White / Caucasian | 315 | 90.8% |
| Two or more Races | 32 | 9.2% |
| Some other Race | 0 | 0.0% |
| Total | 347 | 100.0% |
Ancestry in Dalton
The most populous ancestries reported in Dalton are German (150 | 43.2%), Italian (65 | 18.7%), English (42 | 12.1%), European (39 | 11.2%), and Irish (34 | 9.8%), together accounting for 95.1% of all Dalton residents.
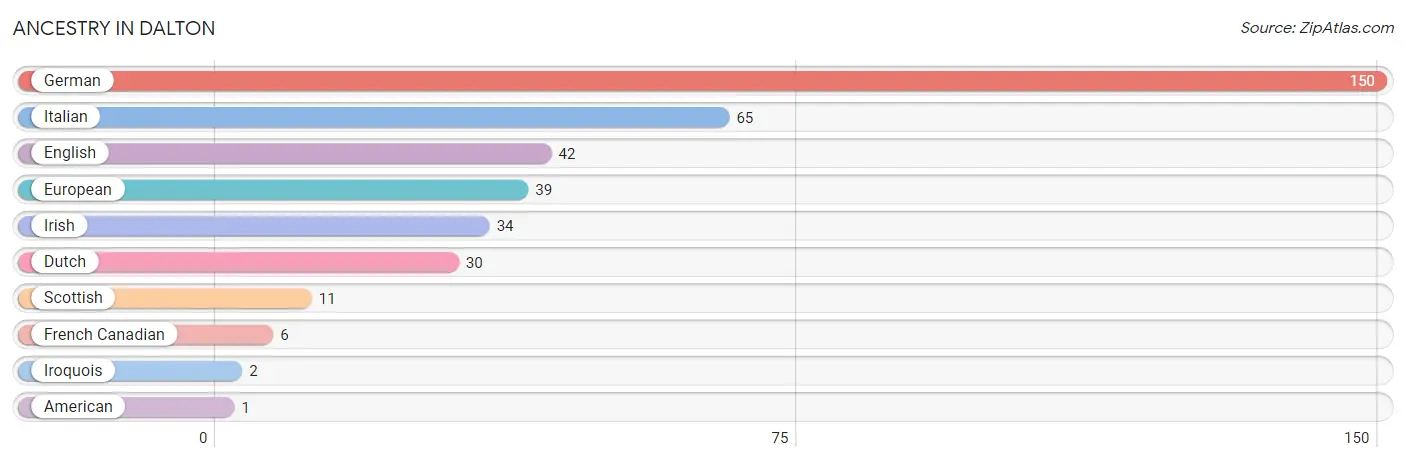
| Ancestry | # Population | % Population |
| American | 1 | 0.3% |
| Dutch | 30 | 8.6% |
| English | 42 | 12.1% |
| European | 39 | 11.2% |
| French Canadian | 6 | 1.7% |
| German | 150 | 43.2% |
| Irish | 34 | 9.8% |
| Iroquois | 2 | 0.6% |
| Italian | 65 | 18.7% |
| Scottish | 11 | 3.2% | View All 10 Rows |
Immigrants in Dalton

| Immigration Origin | # Population | % Population | View All 0 Rows |
Sex and Age in Dalton
Sex and Age in Dalton
The most populous age groups in Dalton are 30 to 34 Years (71 | 38.4%) for men and 60 to 64 Years (42 | 25.9%) for women.
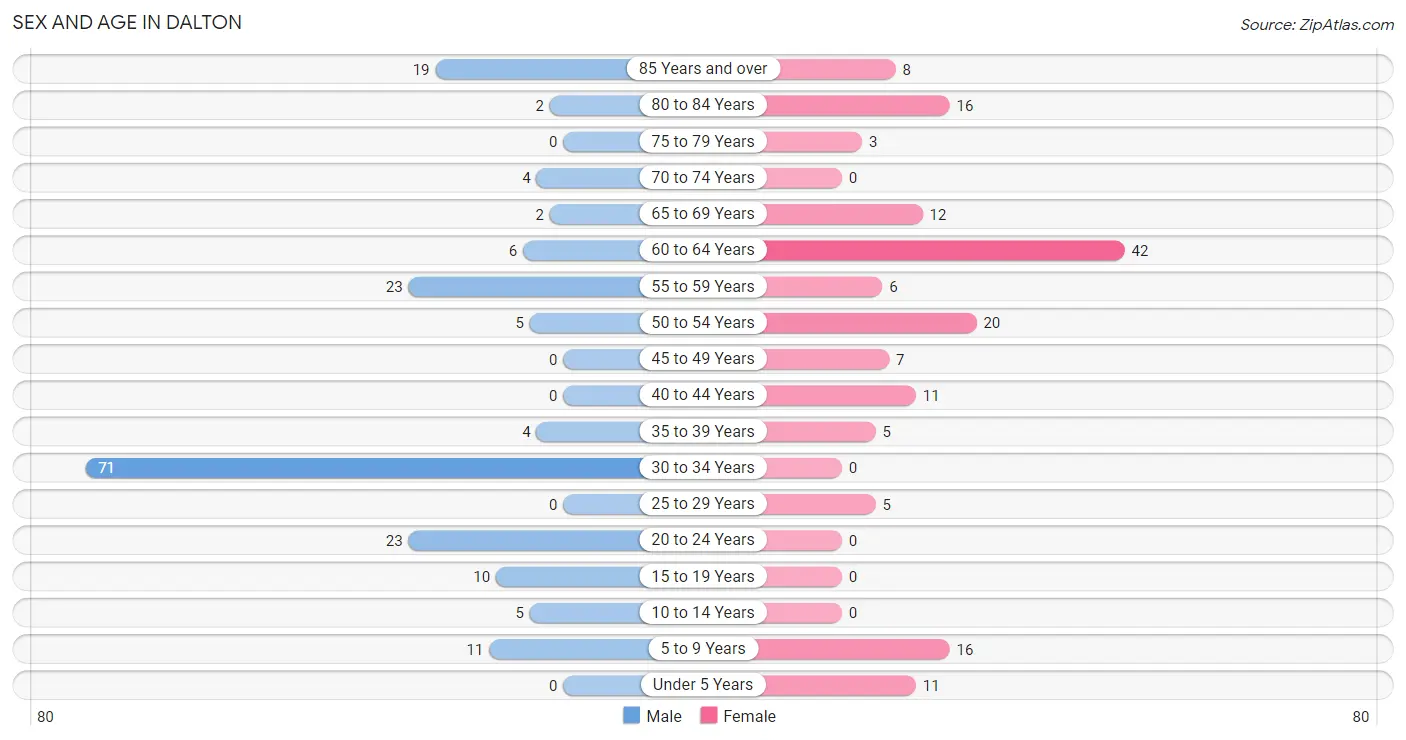
| Age Bracket | Male | Female |
| Under 5 Years | 0 (0.0%) | 11 (6.8%) |
| 5 to 9 Years | 11 (5.9%) | 16 (9.9%) |
| 10 to 14 Years | 5 (2.7%) | 0 (0.0%) |
| 15 to 19 Years | 10 (5.4%) | 0 (0.0%) |
| 20 to 24 Years | 23 (12.4%) | 0 (0.0%) |
| 25 to 29 Years | 0 (0.0%) | 5 (3.1%) |
| 30 to 34 Years | 71 (38.4%) | 0 (0.0%) |
| 35 to 39 Years | 4 (2.2%) | 5 (3.1%) |
| 40 to 44 Years | 0 (0.0%) | 11 (6.8%) |
| 45 to 49 Years | 0 (0.0%) | 7 (4.3%) |
| 50 to 54 Years | 5 (2.7%) | 20 (12.3%) |
| 55 to 59 Years | 23 (12.4%) | 6 (3.7%) |
| 60 to 64 Years | 6 (3.2%) | 42 (25.9%) |
| 65 to 69 Years | 2 (1.1%) | 12 (7.4%) |
| 70 to 74 Years | 4 (2.2%) | 0 (0.0%) |
| 75 to 79 Years | 0 (0.0%) | 3 (1.8%) |
| 80 to 84 Years | 2 (1.1%) | 16 (9.9%) |
| 85 Years and over | 19 (10.3%) | 8 (4.9%) |
| Total | 185 (100.0%) | 162 (100.0%) |
Families and Households in Dalton
Median Family Size in Dalton
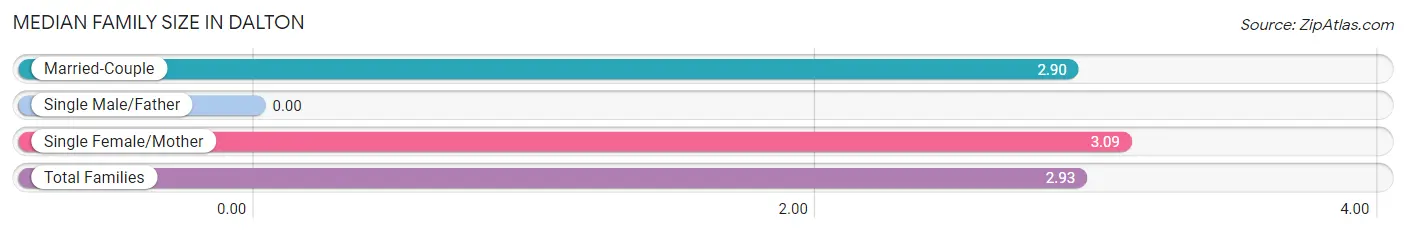
| Family Type | # Families | Family Size |
| Married-Couple | 49 (81.7%) | 2.90 |
| Single Male/Father | 0 (0.0%) | - |
| Single Female/Mother | 11 (18.3%) | 3.09 |
| Total Families | 60 (100.0%) | 2.93 |
Median Household Size in Dalton
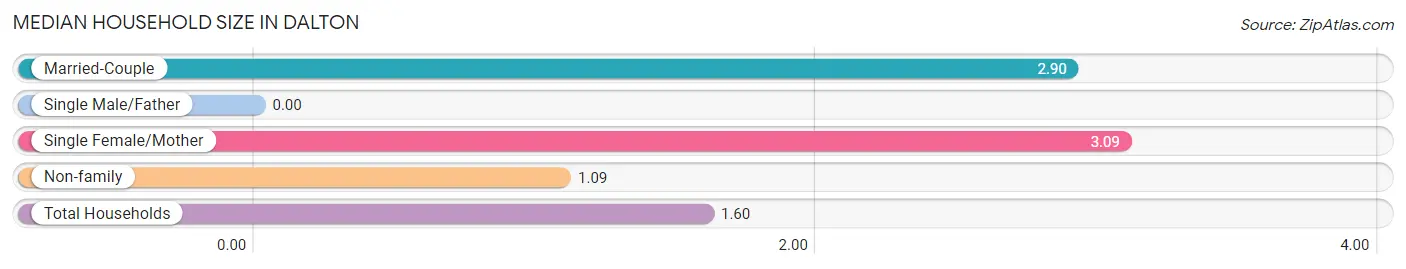
| Household Type | # Households | Household Size |
| Married-Couple | 49 (22.6%) | 2.90 |
| Single Male/Father | 0 (0.0%) | - |
| Single Female/Mother | 11 (5.1%) | 3.09 |
| Non-family | 157 (72.4%) | 1.09 |
| Total Households | 217 (100.0%) | 1.60 |
Household Size by Marriage Status in Dalton
Out of a total of 217 households in Dalton, 60 (27.7%) are family households, while 157 (72.4%) are nonfamily households. The most numerous type of family households are 2-person households, comprising 40, and the most common type of nonfamily households are 1-person households, comprising 143.
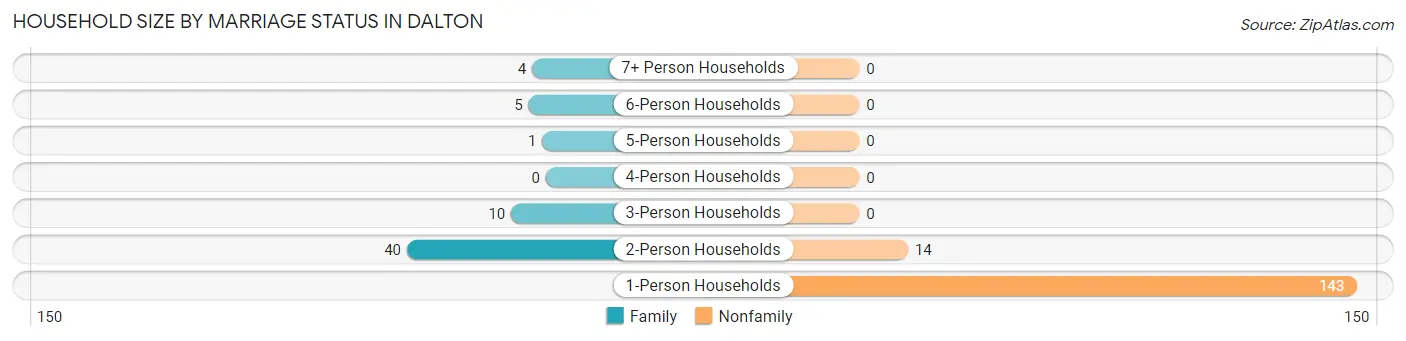
| Household Size | Family Households | Nonfamily Households |
| 1-Person Households | - | 143 (65.9%) |
| 2-Person Households | 40 (18.4%) | 14 (6.5%) |
| 3-Person Households | 10 (4.6%) | 0 (0.0%) |
| 4-Person Households | 0 (0.0%) | 0 (0.0%) |
| 5-Person Households | 1 (0.5%) | 0 (0.0%) |
| 6-Person Households | 5 (2.3%) | 0 (0.0%) |
| 7+ Person Households | 4 (1.8%) | 0 (0.0%) |
| Total | 60 (27.7%) | 157 (72.4%) |
Female Fertility in Dalton
Fertility by Age in Dalton
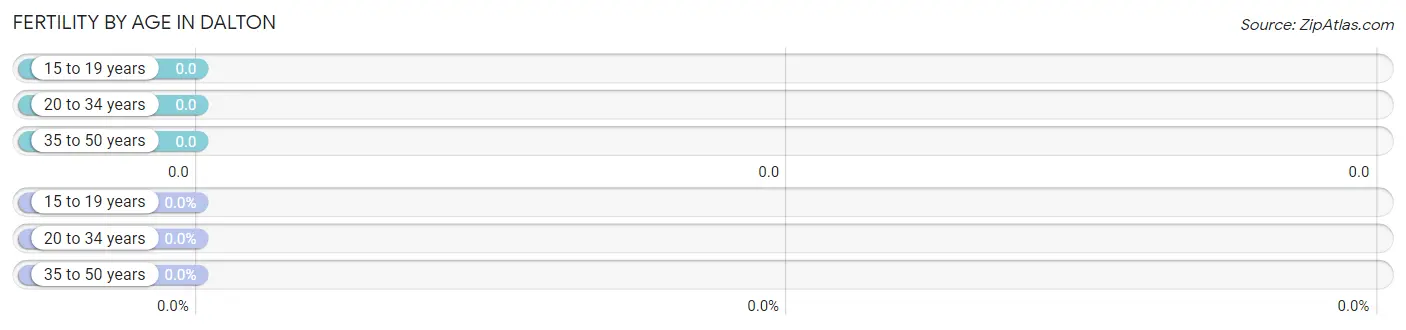
| Age Bracket | Women with Births | Births / 1,000 Women |
| 15 to 19 years | 0 (0.0%) | 0.0 |
| 20 to 34 years | 0 (0.0%) | 0.0 |
| 35 to 50 years | 0 (0.0%) | 0.0 |
| Total | 0 (0.0%) | 0.0 |
Fertility by Age by Marriage Status in Dalton
| Age Bracket | Married | Unmarried |
| 15 to 19 years | 0 (0.0%) | 0 (0.0%) |
| 20 to 34 years | 0 (0.0%) | 0 (0.0%) |
| 35 to 50 years | 0 (0.0%) | 0 (0.0%) |
| Total | 0 (0.0%) | 0 (0.0%) |
Fertility by Education in Dalton
| Educational Attainment | Women with Births | Births / 1,000 Women |
| Less than High School | 0 (0.0%) | 0.0 |
| High School Diploma | 0 (0.0%) | 0.0 |
| College or Associate's Degree | 0 (0.0%) | 0.0 |
| Bachelor's Degree | 0 (0.0%) | 0.0 |
| Graduate Degree | 0 (0.0%) | 0.0 |
| Total | 0 (0.0%) | 0.0 |
Fertility by Education by Marriage Status in Dalton
| Educational Attainment | Married | Unmarried |
| Less than High School | 0 (0.0%) | 0 (0.0%) |
| High School Diploma | 0 (0.0%) | 0 (0.0%) |
| College or Associate's Degree | 0 (0.0%) | 0 (0.0%) |
| Bachelor's Degree | 0 (0.0%) | 0 (0.0%) |
| Graduate Degree | 0 (0.0%) | 0 (0.0%) |
| Total | 0 (0.0%) | 0 (0.0%) |
Employment Characteristics in Dalton
Employment by Class of Employer in Dalton
Among the 188 employed individuals in Dalton, private company employees (125 | 66.5%), and local government employees (63 | 33.5%) make up the most common classes of employment.
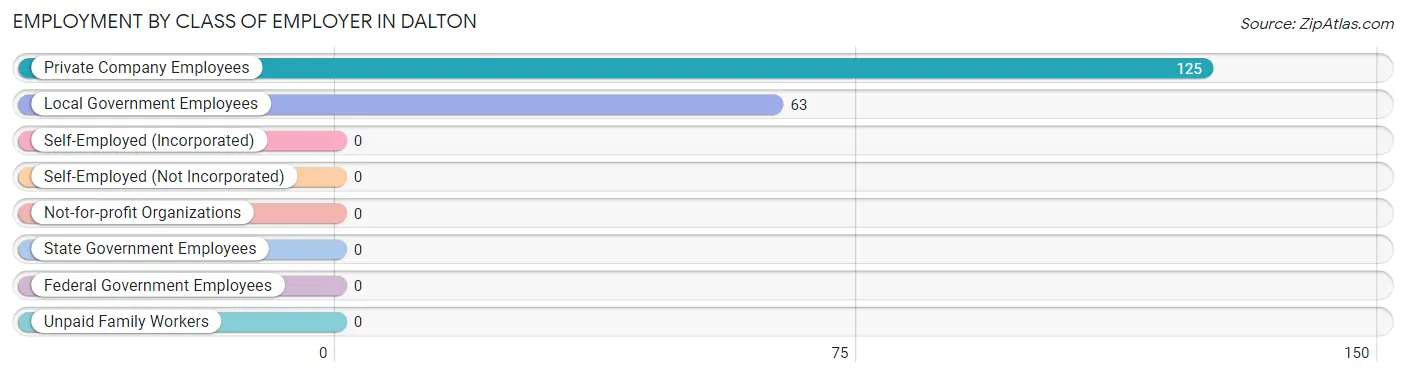
| Employer Class | # Employees | % Employees |
| Private Company Employees | 125 | 66.5% |
| Self-Employed (Incorporated) | 0 | 0.0% |
| Self-Employed (Not Incorporated) | 0 | 0.0% |
| Not-for-profit Organizations | 0 | 0.0% |
| Local Government Employees | 63 | 33.5% |
| State Government Employees | 0 | 0.0% |
| Federal Government Employees | 0 | 0.0% |
| Unpaid Family Workers | 0 | 0.0% |
| Total | 188 | 100.0% |
Employment Status by Age in Dalton
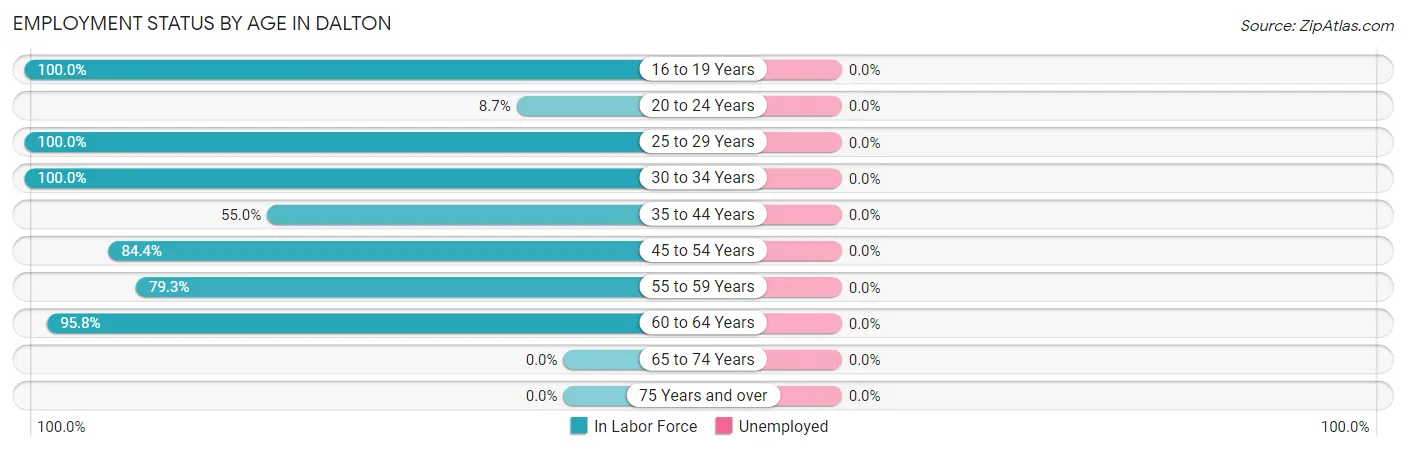
| Age Bracket | In Labor Force | Unemployed |
| 16 to 19 Years | 9 (100.0%) | 0 (0.0%) |
| 20 to 24 Years | 2 (8.7%) | 0 (0.0%) |
| 25 to 29 Years | 5 (100.0%) | 0 (0.0%) |
| 30 to 34 Years | 71 (100.0%) | 0 (0.0%) |
| 35 to 44 Years | 11 (55.0%) | 0 (0.0%) |
| 45 to 54 Years | 27 (84.4%) | 0 (0.0%) |
| 55 to 59 Years | 23 (79.3%) | 0 (0.0%) |
| 60 to 64 Years | 46 (95.8%) | 0 (0.0%) |
| 65 to 74 Years | 0 (0.0%) | 0 (0.0%) |
| 75 Years and over | 0 (0.0%) | 0 (0.0%) |
| Total | 194 (64.0%) | 0 (0.0%) |
Employment Status by Educational Attainment in Dalton
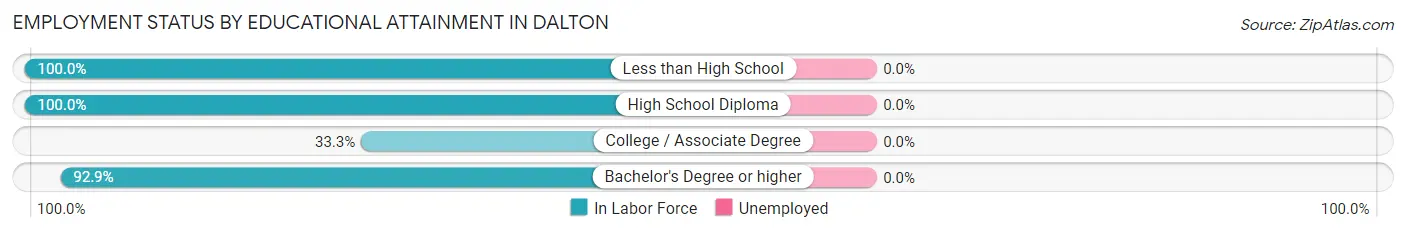
| Educational Attainment | In Labor Force | Unemployed |
| Less than High School | 12 (100.0%) | 0 (0.0%) |
| High School Diploma | 110 (100.0%) | 0 (0.0%) |
| College / Associate Degree | 9 (33.3%) | 0 (0.0%) |
| Bachelor's Degree or higher | 52 (92.9%) | 0 (0.0%) |
| Total | 183 (89.3%) | 0 (0.0%) |
Employment Occupations by Sex in Dalton
Management, Business, Science and Arts Occupations
The most common Management, Business, Science and Arts occupations in Dalton are Community & Social Service (40 | 20.6%), Education Instruction & Library (40 | 20.6%), Health Diagnosing & Treating (5 | 2.6%), Health Technologists (5 | 2.6%), and Computers, Engineering & Science (1 | 0.5%).
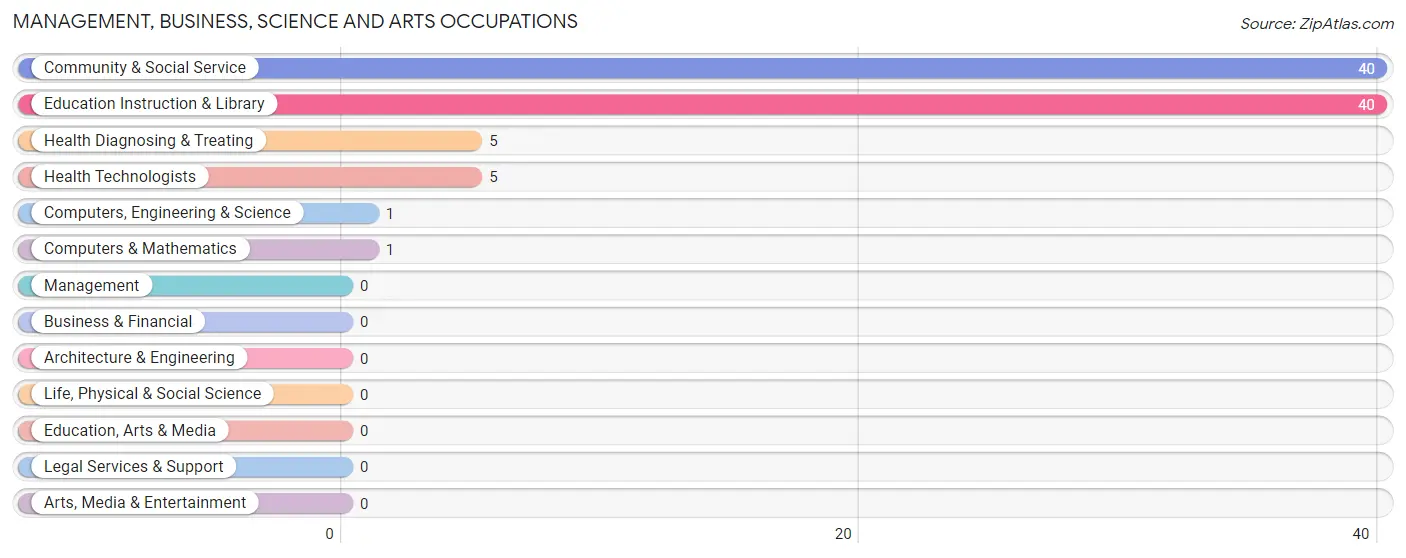
Management, Business, Science and Arts Occupations by Sex
Within the Management, Business, Science and Arts occupations in Dalton, the most male-oriented occupations are Computers, Engineering & Science (100.0%), and Computers & Mathematics (100.0%), while the most female-oriented occupations are Community & Social Service (100.0%), Education Instruction & Library (100.0%), and Health Diagnosing & Treating (100.0%).
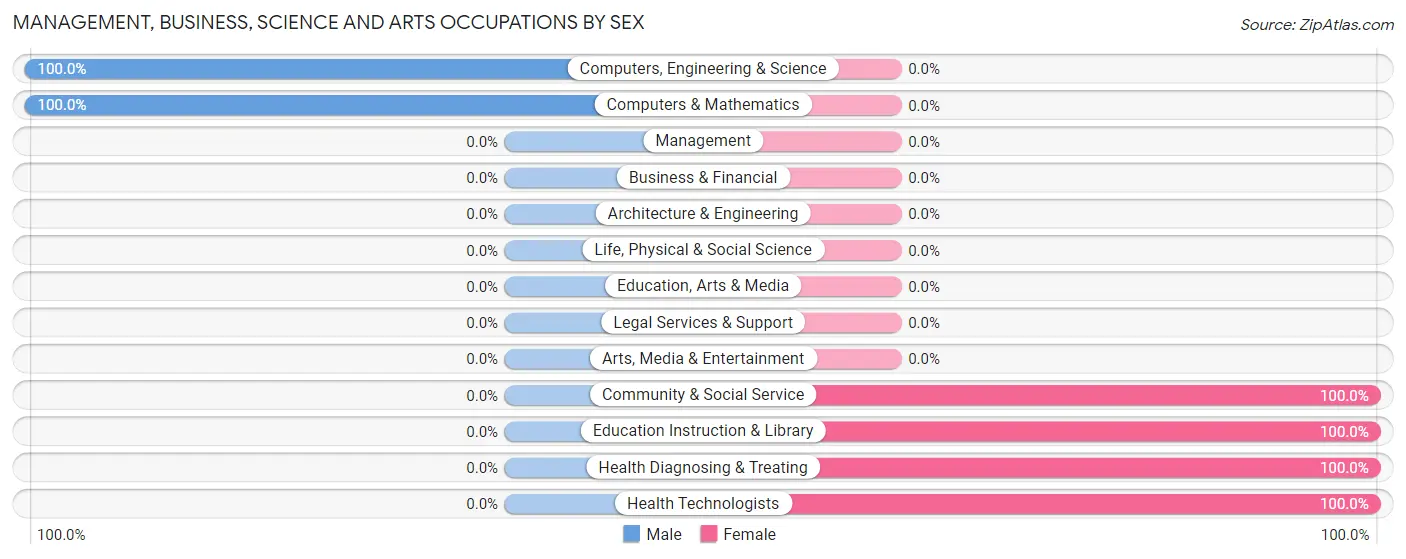
| Occupation | Male | Female |
| Management | 0 (0.0%) | 0 (0.0%) |
| Business & Financial | 0 (0.0%) | 0 (0.0%) |
| Computers, Engineering & Science | 1 (100.0%) | 0 (0.0%) |
| Computers & Mathematics | 1 (100.0%) | 0 (0.0%) |
| Architecture & Engineering | 0 (0.0%) | 0 (0.0%) |
| Life, Physical & Social Science | 0 (0.0%) | 0 (0.0%) |
| Community & Social Service | 0 (0.0%) | 40 (100.0%) |
| Education, Arts & Media | 0 (0.0%) | 0 (0.0%) |
| Legal Services & Support | 0 (0.0%) | 0 (0.0%) |
| Education Instruction & Library | 0 (0.0%) | 40 (100.0%) |
| Arts, Media & Entertainment | 0 (0.0%) | 0 (0.0%) |
| Health Diagnosing & Treating | 0 (0.0%) | 5 (100.0%) |
| Health Technologists | 0 (0.0%) | 5 (100.0%) |
| Total (Category) | 1 (2.2%) | 45 (97.8%) |
| Total (Overall) | 111 (57.2%) | 83 (42.8%) |
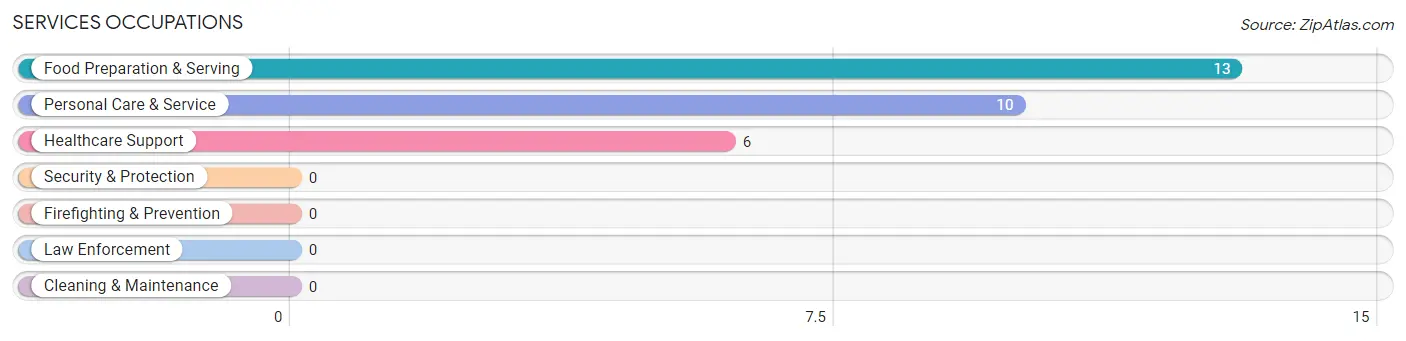
Services Occupations
The most common Services occupations in Dalton are Food Preparation & Serving (13 | 6.7%), Personal Care & Service (10 | 5.1%), and Healthcare Support (6 | 3.1%).
Services Occupations by Sex
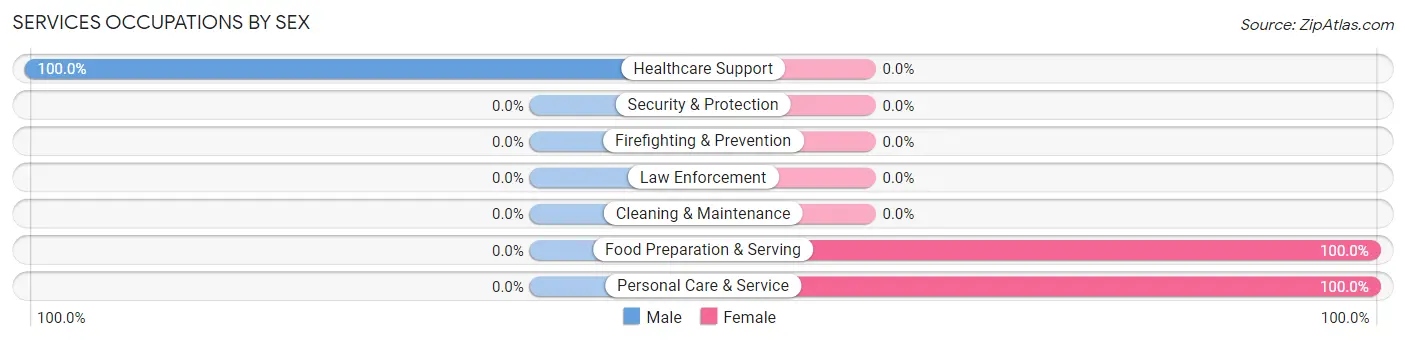
| Occupation | Male | Female |
| Healthcare Support | 6 (100.0%) | 0 (0.0%) |
| Security & Protection | 0 (0.0%) | 0 (0.0%) |
| Firefighting & Prevention | 0 (0.0%) | 0 (0.0%) |
| Law Enforcement | 0 (0.0%) | 0 (0.0%) |
| Food Preparation & Serving | 0 (0.0%) | 13 (100.0%) |
| Cleaning & Maintenance | 0 (0.0%) | 0 (0.0%) |
| Personal Care & Service | 0 (0.0%) | 10 (100.0%) |
| Total (Category) | 6 (20.7%) | 23 (79.3%) |
| Total (Overall) | 111 (57.2%) | 83 (42.8%) |
Sales and Office Occupations
The most common Sales and Office occupations in Dalton are , and Office & Administration (15 | 7.7%).
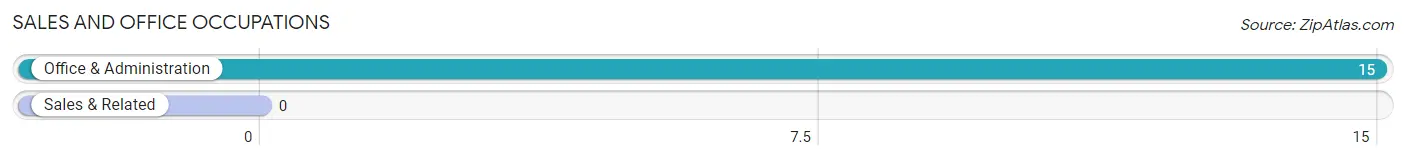
Sales and Office Occupations by Sex
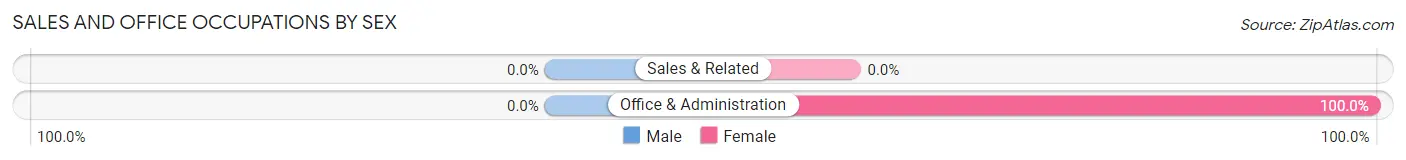
| Occupation | Male | Female |
| Sales & Related | 0 (0.0%) | 0 (0.0%) |
| Office & Administration | 0 (0.0%) | 15 (100.0%) |
| Total (Category) | 0 (0.0%) | 15 (100.0%) |
| Total (Overall) | 111 (57.2%) | 83 (42.8%) |
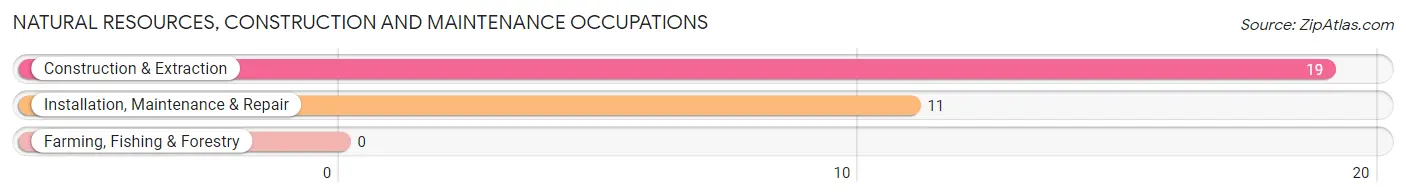
Natural Resources, Construction and Maintenance Occupations
The most common Natural Resources, Construction and Maintenance occupations in Dalton are Construction & Extraction (19 | 9.8%), and Installation, Maintenance & Repair (11 | 5.7%).
Natural Resources, Construction and Maintenance Occupations by Sex
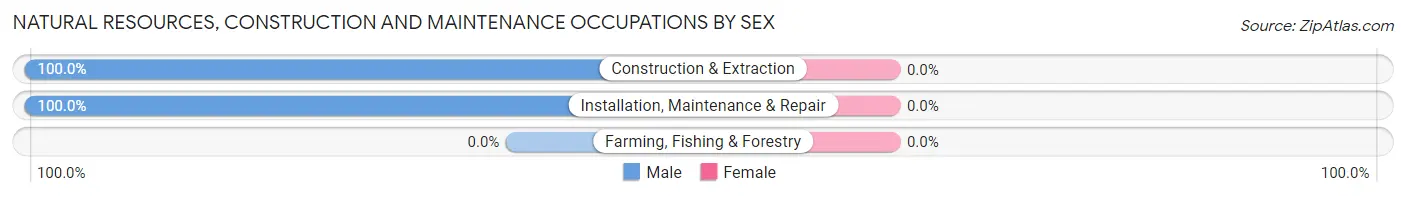
| Occupation | Male | Female |
| Farming, Fishing & Forestry | 0 (0.0%) | 0 (0.0%) |
| Construction & Extraction | 19 (100.0%) | 0 (0.0%) |
| Installation, Maintenance & Repair | 11 (100.0%) | 0 (0.0%) |
| Total (Category) | 30 (100.0%) | 0 (0.0%) |
| Total (Overall) | 111 (57.2%) | 83 (42.8%) |
Production, Transportation and Moving Occupations
The most common Production, Transportation and Moving occupations in Dalton are Production (68 | 35.0%), and Transportation (6 | 3.1%).
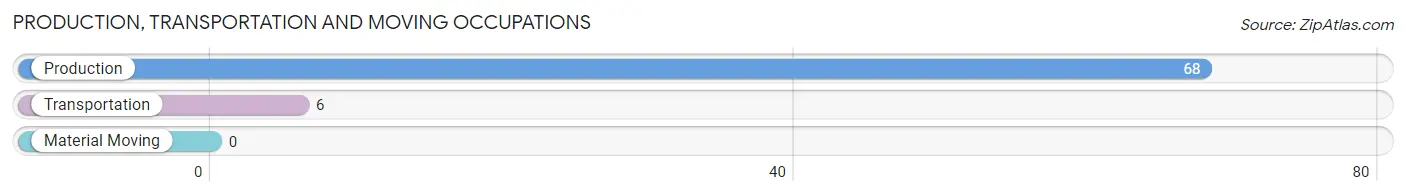
Production, Transportation and Moving Occupations by Sex
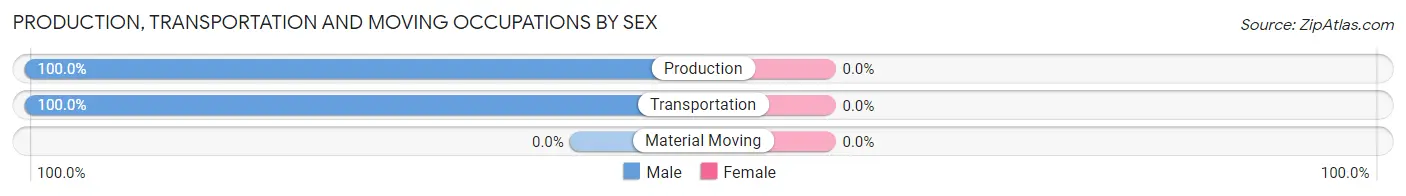
| Occupation | Male | Female |
| Production | 68 (100.0%) | 0 (0.0%) |
| Transportation | 6 (100.0%) | 0 (0.0%) |
| Material Moving | 0 (0.0%) | 0 (0.0%) |
| Total (Category) | 74 (100.0%) | 0 (0.0%) |
| Total (Overall) | 111 (57.2%) | 83 (42.8%) |
Employment Industries by Sex in Dalton
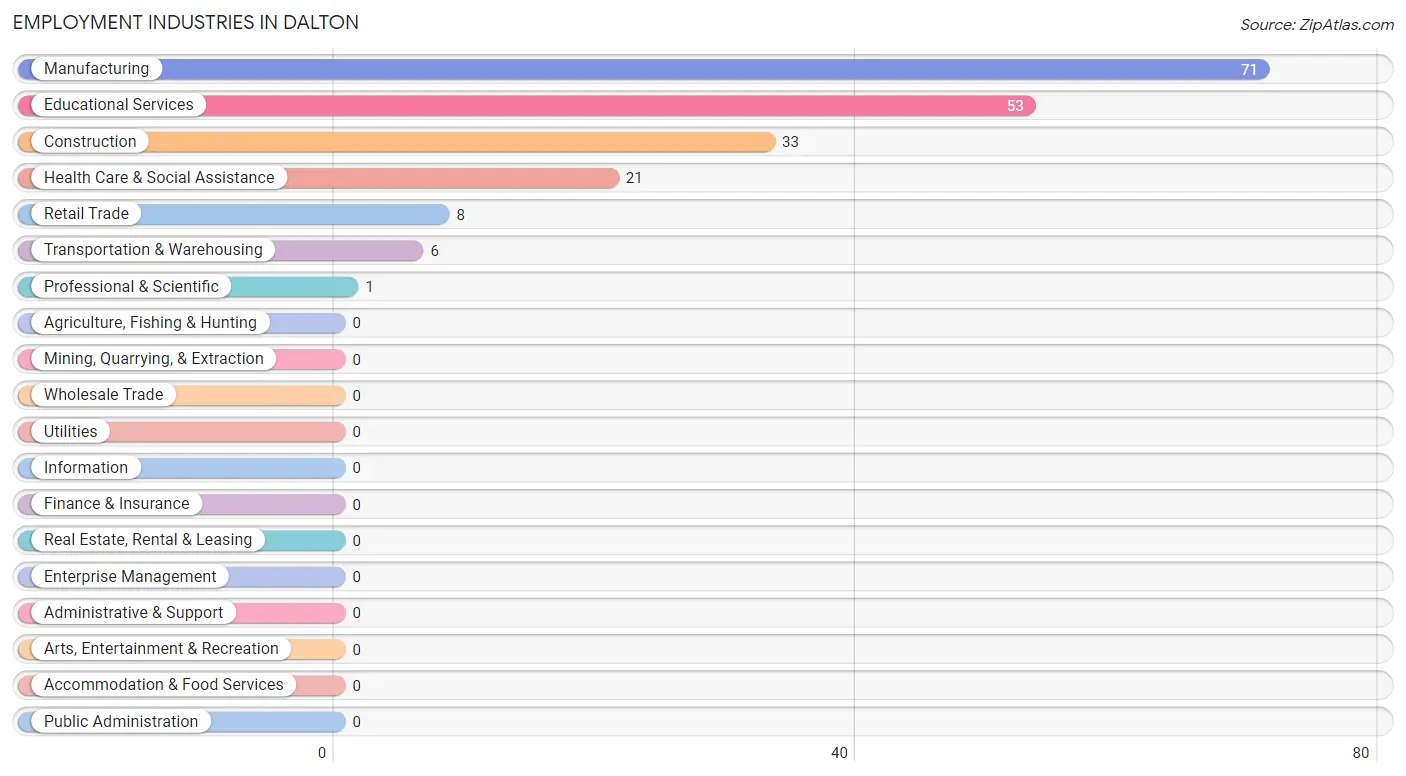
Employment Industries in Dalton
The major employment industries in Dalton include Manufacturing (71 | 36.6%), Educational Services (53 | 27.3%), Construction (33 | 17.0%), Health Care & Social Assistance (21 | 10.8%), and Retail Trade (8 | 4.1%).
Employment Industries by Sex in Dalton
The Dalton industries that see more men than women are Manufacturing (100.0%), Retail Trade (100.0%), and Transportation & Warehousing (100.0%), whereas the industries that tend to have a higher number of women are Educational Services (100.0%), Health Care & Social Assistance (71.4%), and Construction (42.4%).
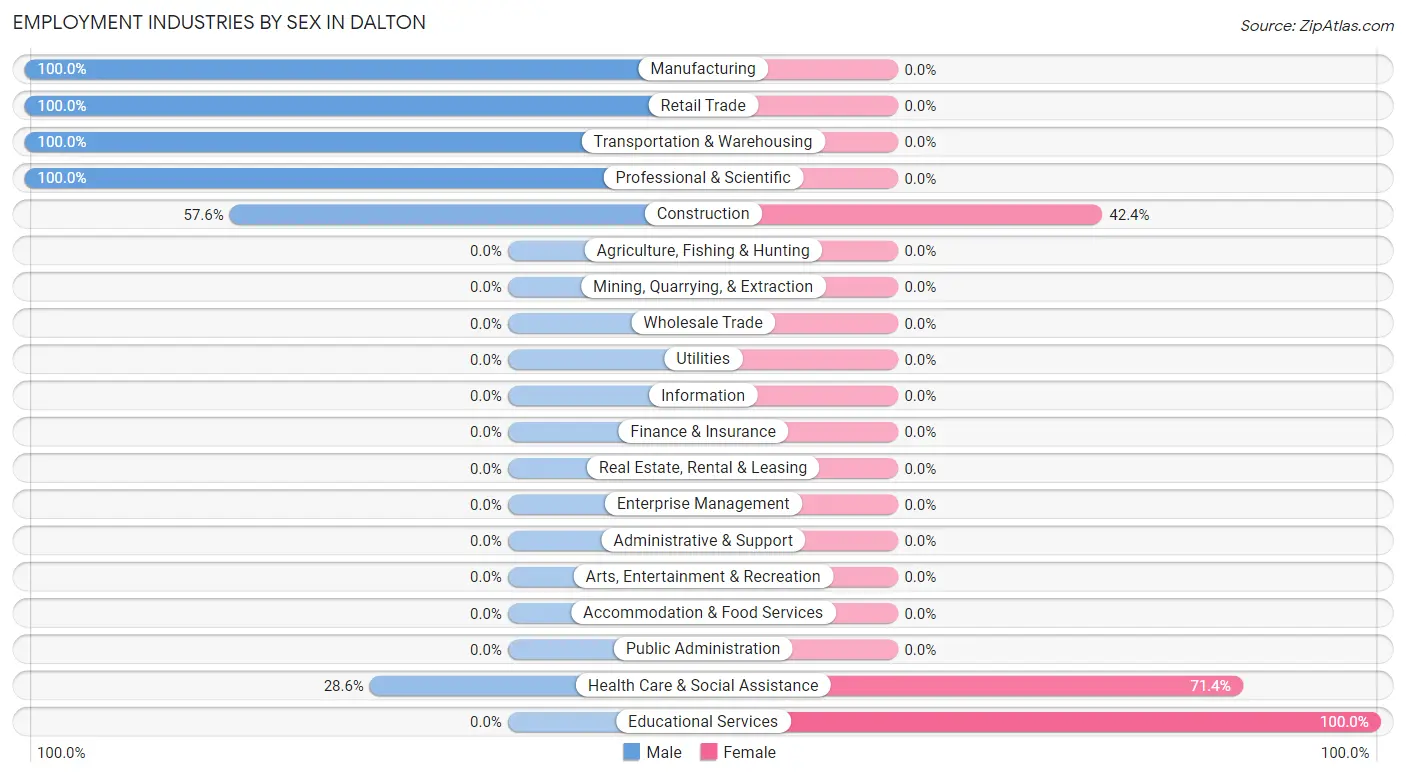
| Industry | Male | Female |
| Agriculture, Fishing & Hunting | 0 (0.0%) | 0 (0.0%) |
| Mining, Quarrying, & Extraction | 0 (0.0%) | 0 (0.0%) |
| Construction | 19 (57.6%) | 14 (42.4%) |
| Manufacturing | 71 (100.0%) | 0 (0.0%) |
| Wholesale Trade | 0 (0.0%) | 0 (0.0%) |
| Retail Trade | 8 (100.0%) | 0 (0.0%) |
| Transportation & Warehousing | 6 (100.0%) | 0 (0.0%) |
| Utilities | 0 (0.0%) | 0 (0.0%) |
| Information | 0 (0.0%) | 0 (0.0%) |
| Finance & Insurance | 0 (0.0%) | 0 (0.0%) |
| Real Estate, Rental & Leasing | 0 (0.0%) | 0 (0.0%) |
| Professional & Scientific | 1 (100.0%) | 0 (0.0%) |
| Enterprise Management | 0 (0.0%) | 0 (0.0%) |
| Administrative & Support | 0 (0.0%) | 0 (0.0%) |
| Educational Services | 0 (0.0%) | 53 (100.0%) |
| Health Care & Social Assistance | 6 (28.6%) | 15 (71.4%) |
| Arts, Entertainment & Recreation | 0 (0.0%) | 0 (0.0%) |
| Accommodation & Food Services | 0 (0.0%) | 0 (0.0%) |
| Public Administration | 0 (0.0%) | 0 (0.0%) |
| Total | 111 (57.2%) | 83 (42.8%) |
Education in Dalton
School Enrollment in Dalton
The most common levels of schooling among the 44 students in Dalton are elementary school (22 | 50.0%), high school (9 | 20.4%), and kindergarten (5 | 11.4%).
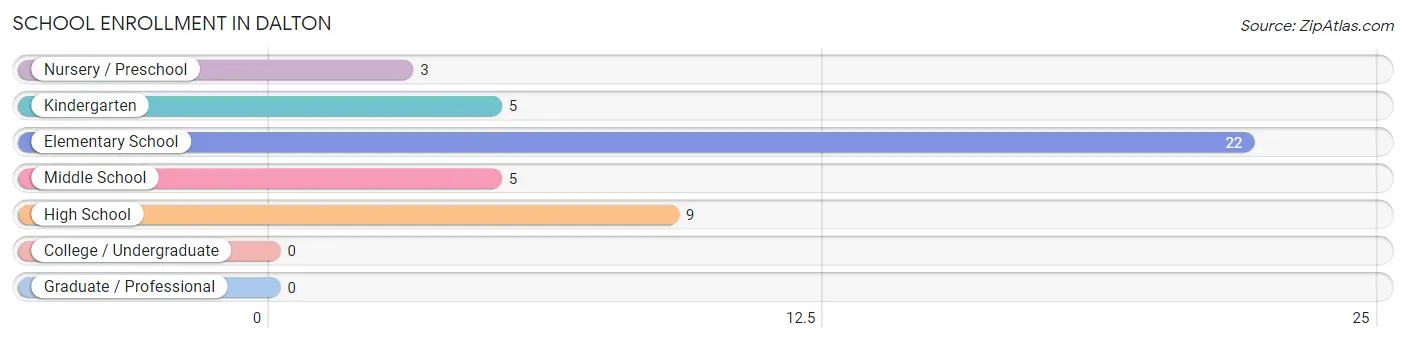
| School Level | # Students | % Students |
| Nursery / Preschool | 3 | 6.8% |
| Kindergarten | 5 | 11.4% |
| Elementary School | 22 | 50.0% |
| Middle School | 5 | 11.4% |
| High School | 9 | 20.4% |
| College / Undergraduate | 0 | 0.0% |
| Graduate / Professional | 0 | 0.0% |
| Total | 44 | 100.0% |
School Enrollment by Age by Funding Source in Dalton
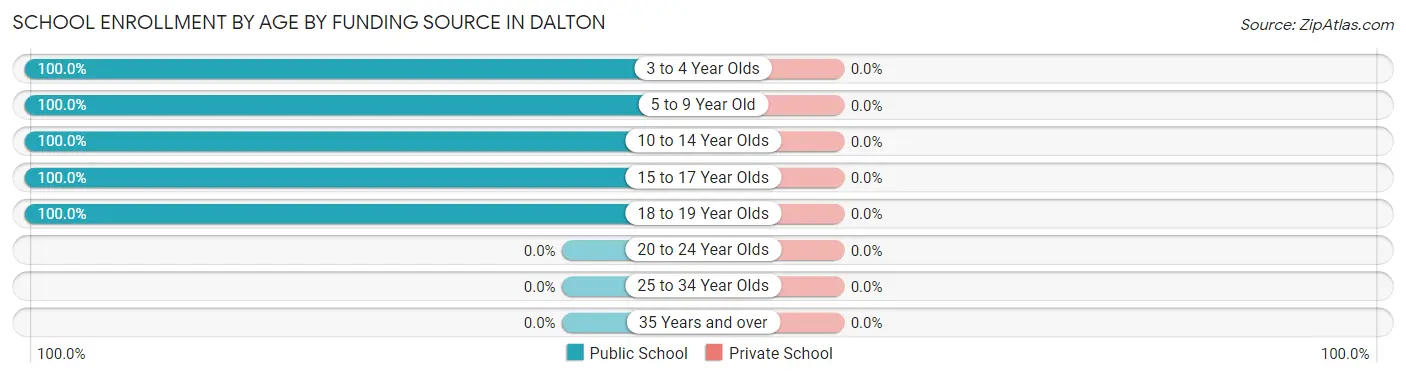
| Age Bracket | Public School | Private School |
| 3 to 4 Year Olds | 3 (100.0%) | 0 (0.0%) |
| 5 to 9 Year Old | 27 (100.0%) | 0 (0.0%) |
| 10 to 14 Year Olds | 5 (100.0%) | 0 (0.0%) |
| 15 to 17 Year Olds | 1 (100.0%) | 0 (0.0%) |
| 18 to 19 Year Olds | 8 (100.0%) | 0 (0.0%) |
| 20 to 24 Year Olds | 0 (0.0%) | 0 (0.0%) |
| 25 to 34 Year Olds | 0 (0.0%) | 0 (0.0%) |
| 35 Years and over | 0 (0.0%) | 0 (0.0%) |
| Total | 44 (100.0%) | 0 (0.0%) |
Educational Attainment by Field of Study in Dalton
Education (53 | 75.7%), psychology (11 | 15.7%), science & technology (5 | 7.1%), and liberal arts & history (1 | 1.4%) are the most common fields of study among 70 individuals in Dalton who have obtained a bachelor's degree or higher.
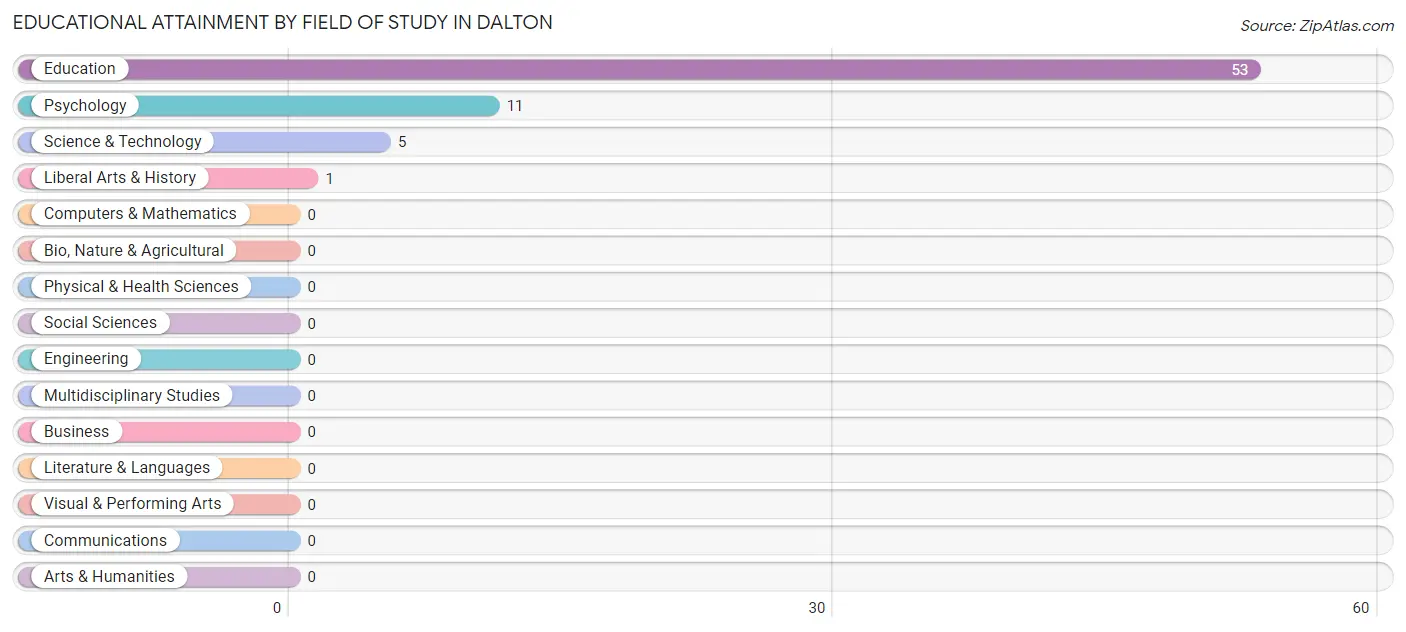
| Field of Study | # Graduates | % Graduates |
| Computers & Mathematics | 0 | 0.0% |
| Bio, Nature & Agricultural | 0 | 0.0% |
| Physical & Health Sciences | 0 | 0.0% |
| Psychology | 11 | 15.7% |
| Social Sciences | 0 | 0.0% |
| Engineering | 0 | 0.0% |
| Multidisciplinary Studies | 0 | 0.0% |
| Science & Technology | 5 | 7.1% |
| Business | 0 | 0.0% |
| Education | 53 | 75.7% |
| Literature & Languages | 0 | 0.0% |
| Liberal Arts & History | 1 | 1.4% |
| Visual & Performing Arts | 0 | 0.0% |
| Communications | 0 | 0.0% |
| Arts & Humanities | 0 | 0.0% |
| Total | 70 | 100.0% |
Transportation & Commute in Dalton
Vehicle Availability by Sex in Dalton
The most prevalent vehicle ownership categories in Dalton are males with 2 vehicles (99, accounting for 89.2%) and females with 2 vehicles (24, making up 128.6%).
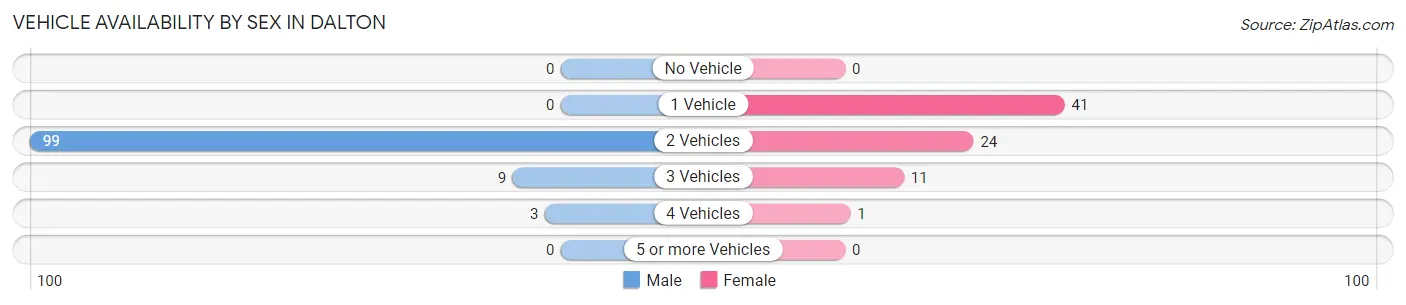
| Vehicles Available | Male | Female |
| No Vehicle | 0 (0.0%) | 0 (0.0%) |
| 1 Vehicle | 0 (0.0%) | 41 (53.2%) |
| 2 Vehicles | 99 (89.2%) | 24 (31.2%) |
| 3 Vehicles | 9 (8.1%) | 11 (14.3%) |
| 4 Vehicles | 3 (2.7%) | 1 (1.3%) |
| 5 or more Vehicles | 0 (0.0%) | 0 (0.0%) |
| Total | 111 (100.0%) | 77 (100.0%) |
Commute Time in Dalton
The most frequently occuring commute durations in Dalton are 60 to 89 minutes (90 commuters, 49.4%), 5 to 9 minutes (42 commuters, 23.1%), and 45 to 59 minutes (26 commuters, 14.3%).
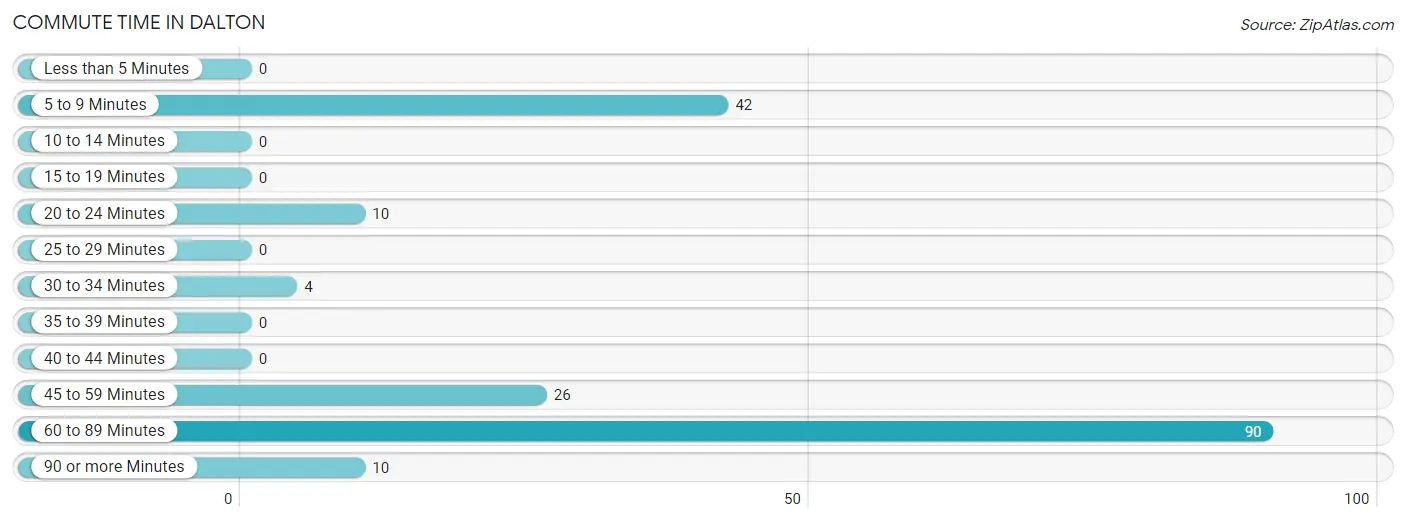
| Commute Time | # Commuters | % Commuters |
| Less than 5 Minutes | 0 | 0.0% |
| 5 to 9 Minutes | 42 | 23.1% |
| 10 to 14 Minutes | 0 | 0.0% |
| 15 to 19 Minutes | 0 | 0.0% |
| 20 to 24 Minutes | 10 | 5.5% |
| 25 to 29 Minutes | 0 | 0.0% |
| 30 to 34 Minutes | 4 | 2.2% |
| 35 to 39 Minutes | 0 | 0.0% |
| 40 to 44 Minutes | 0 | 0.0% |
| 45 to 59 Minutes | 26 | 14.3% |
| 60 to 89 Minutes | 90 | 49.4% |
| 90 or more Minutes | 10 | 5.5% |
Commute Time by Sex in Dalton
The most common commute times in Dalton are 60 to 89 minutes (76 commuters, 72.4%) for males and 5 to 9 minutes (42 commuters, 54.5%) for females.
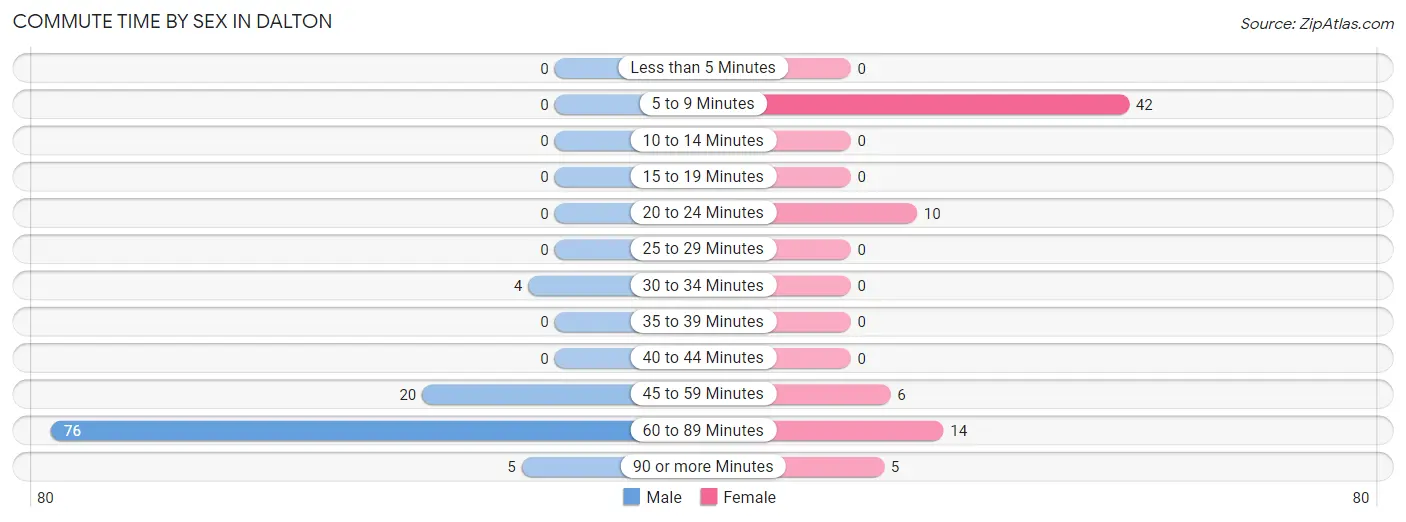
| Commute Time | Male | Female |
| Less than 5 Minutes | 0 (0.0%) | 0 (0.0%) |
| 5 to 9 Minutes | 0 (0.0%) | 42 (54.5%) |
| 10 to 14 Minutes | 0 (0.0%) | 0 (0.0%) |
| 15 to 19 Minutes | 0 (0.0%) | 0 (0.0%) |
| 20 to 24 Minutes | 0 (0.0%) | 10 (13.0%) |
| 25 to 29 Minutes | 0 (0.0%) | 0 (0.0%) |
| 30 to 34 Minutes | 4 (3.8%) | 0 (0.0%) |
| 35 to 39 Minutes | 0 (0.0%) | 0 (0.0%) |
| 40 to 44 Minutes | 0 (0.0%) | 0 (0.0%) |
| 45 to 59 Minutes | 20 (19.1%) | 6 (7.8%) |
| 60 to 89 Minutes | 76 (72.4%) | 14 (18.2%) |
| 90 or more Minutes | 5 (4.8%) | 5 (6.5%) |
Time of Departure to Work by Sex in Dalton
The most frequent times of departure to work in Dalton are 5:00 AM to 5:29 AM (71, 67.6%) for males and 7:00 AM to 7:29 AM (41, 53.2%) for females.
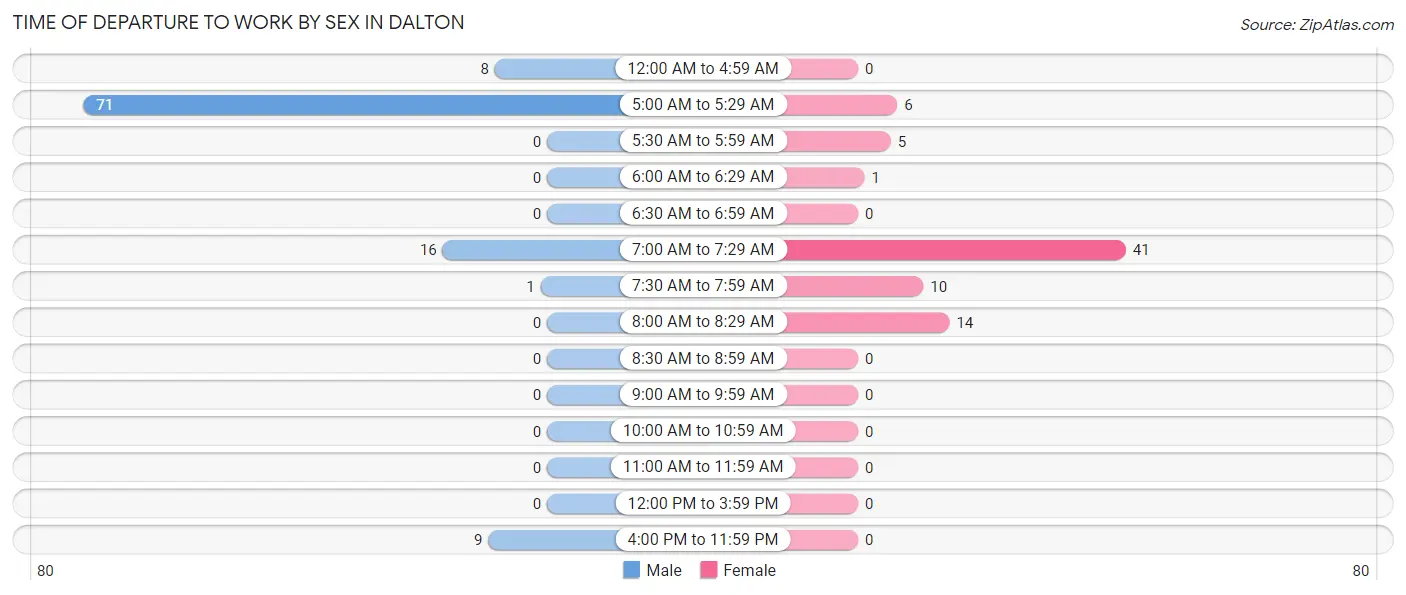
| Time of Departure | Male | Female |
| 12:00 AM to 4:59 AM | 8 (7.6%) | 0 (0.0%) |
| 5:00 AM to 5:29 AM | 71 (67.6%) | 6 (7.8%) |
| 5:30 AM to 5:59 AM | 0 (0.0%) | 5 (6.5%) |
| 6:00 AM to 6:29 AM | 0 (0.0%) | 1 (1.3%) |
| 6:30 AM to 6:59 AM | 0 (0.0%) | 0 (0.0%) |
| 7:00 AM to 7:29 AM | 16 (15.2%) | 41 (53.2%) |
| 7:30 AM to 7:59 AM | 1 (0.9%) | 10 (13.0%) |
| 8:00 AM to 8:29 AM | 0 (0.0%) | 14 (18.2%) |
| 8:30 AM to 8:59 AM | 0 (0.0%) | 0 (0.0%) |
| 9:00 AM to 9:59 AM | 0 (0.0%) | 0 (0.0%) |
| 10:00 AM to 10:59 AM | 0 (0.0%) | 0 (0.0%) |
| 11:00 AM to 11:59 AM | 0 (0.0%) | 0 (0.0%) |
| 12:00 PM to 3:59 PM | 0 (0.0%) | 0 (0.0%) |
| 4:00 PM to 11:59 PM | 9 (8.6%) | 0 (0.0%) |
| Total | 105 (100.0%) | 77 (100.0%) |
Housing Occupancy in Dalton
Occupancy by Ownership in Dalton
Of the total 217 dwellings in Dalton, owner-occupied units account for 207 (95.4%), while renter-occupied units make up 10 (4.6%).
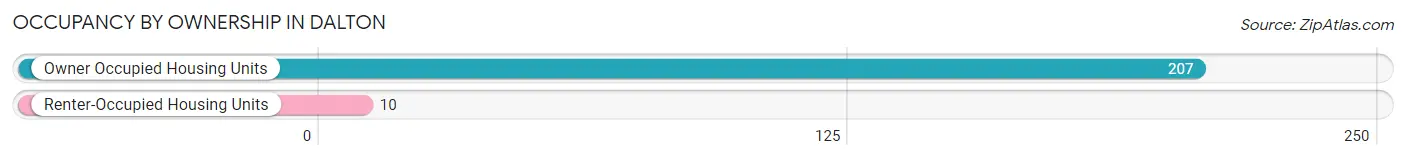
| Occupancy | # Housing Units | % Housing Units |
| Owner Occupied Housing Units | 207 | 95.4% |
| Renter-Occupied Housing Units | 10 | 4.6% |
| Total Occupied Housing Units | 217 | 100.0% |
Occupancy by Household Size in Dalton
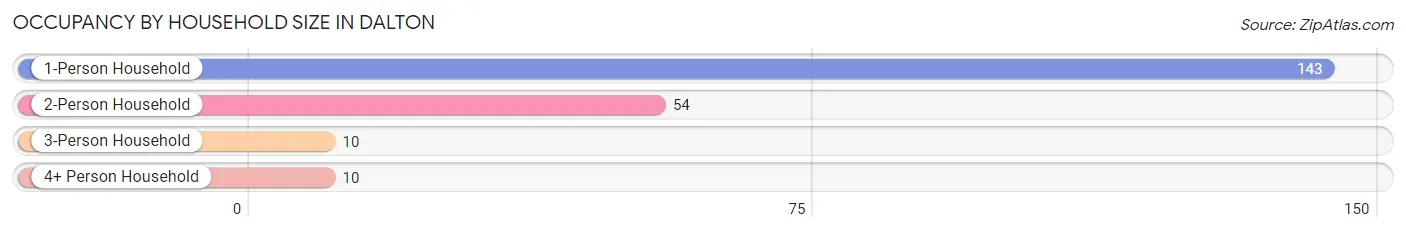
| Household Size | # Housing Units | % Housing Units |
| 1-Person Household | 143 | 65.9% |
| 2-Person Household | 54 | 24.9% |
| 3-Person Household | 10 | 4.6% |
| 4+ Person Household | 10 | 4.6% |
| Total Housing Units | 217 | 100.0% |
Occupancy by Ownership by Household Size in Dalton
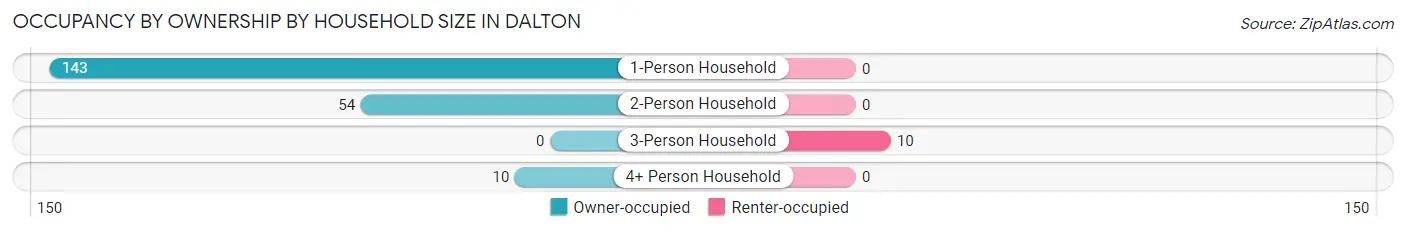
| Household Size | Owner-occupied | Renter-occupied |
| 1-Person Household | 143 (100.0%) | 0 (0.0%) |
| 2-Person Household | 54 (100.0%) | 0 (0.0%) |
| 3-Person Household | 0 (0.0%) | 10 (100.0%) |
| 4+ Person Household | 10 (100.0%) | 0 (0.0%) |
| Total Housing Units | 207 (95.4%) | 10 (4.6%) |
Occupancy by Educational Attainment in Dalton
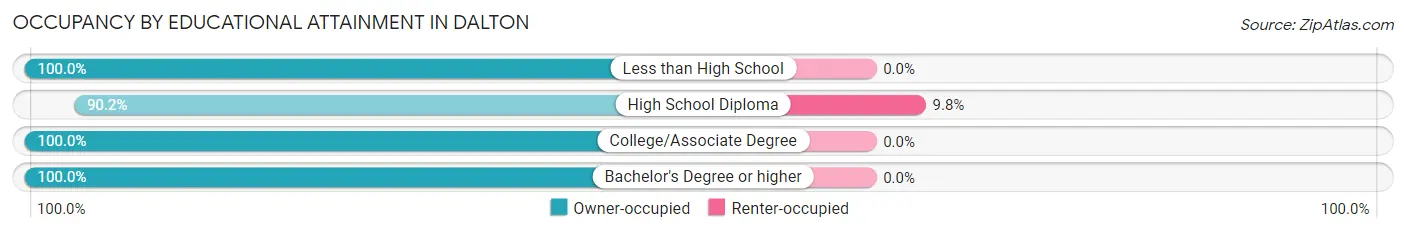
| Household Size | Owner-occupied | Renter-occupied |
| Less than High School | 32 (100.0%) | 0 (0.0%) |
| High School Diploma | 92 (90.2%) | 10 (9.8%) |
| College/Associate Degree | 14 (100.0%) | 0 (0.0%) |
| Bachelor's Degree or higher | 69 (100.0%) | 0 (0.0%) |
Occupancy by Age of Householder in Dalton
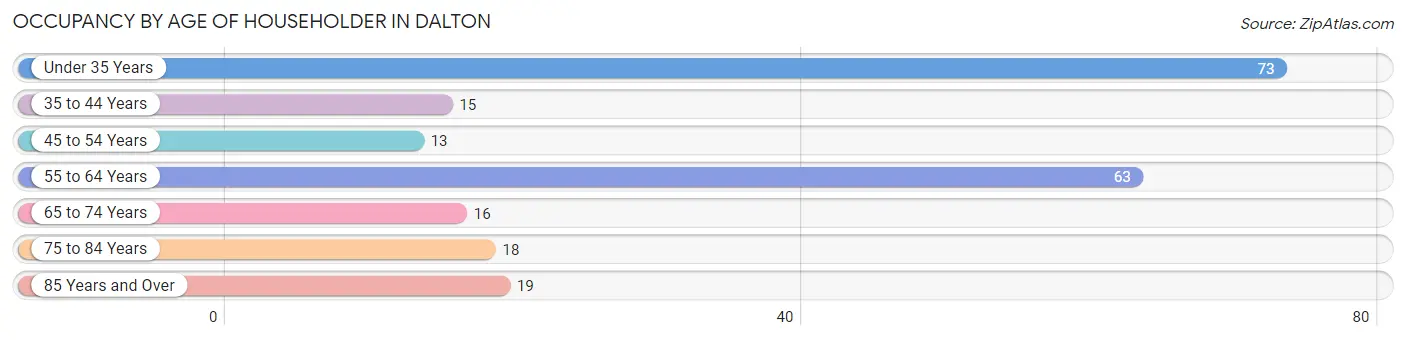
| Age Bracket | # Households | % Households |
| Under 35 Years | 73 | 33.6% |
| 35 to 44 Years | 15 | 6.9% |
| 45 to 54 Years | 13 | 6.0% |
| 55 to 64 Years | 63 | 29.0% |
| 65 to 74 Years | 16 | 7.4% |
| 75 to 84 Years | 18 | 8.3% |
| 85 Years and Over | 19 | 8.8% |
| Total | 217 | 100.0% |
Housing Finances in Dalton
Median Income by Occupancy in Dalton
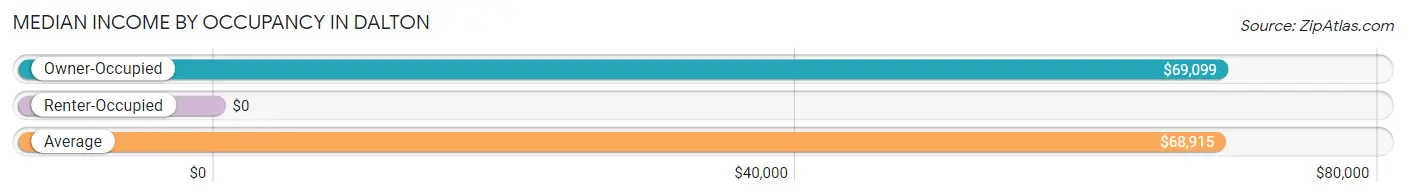
| Occupancy Type | # Households | Median Income |
| Owner-Occupied | 207 (95.4%) | $69,099 |
| Renter-Occupied | 10 (4.6%) | $0 |
| Average | 217 (100.0%) | $68,915 |
Occupancy by Householder Income Bracket in Dalton
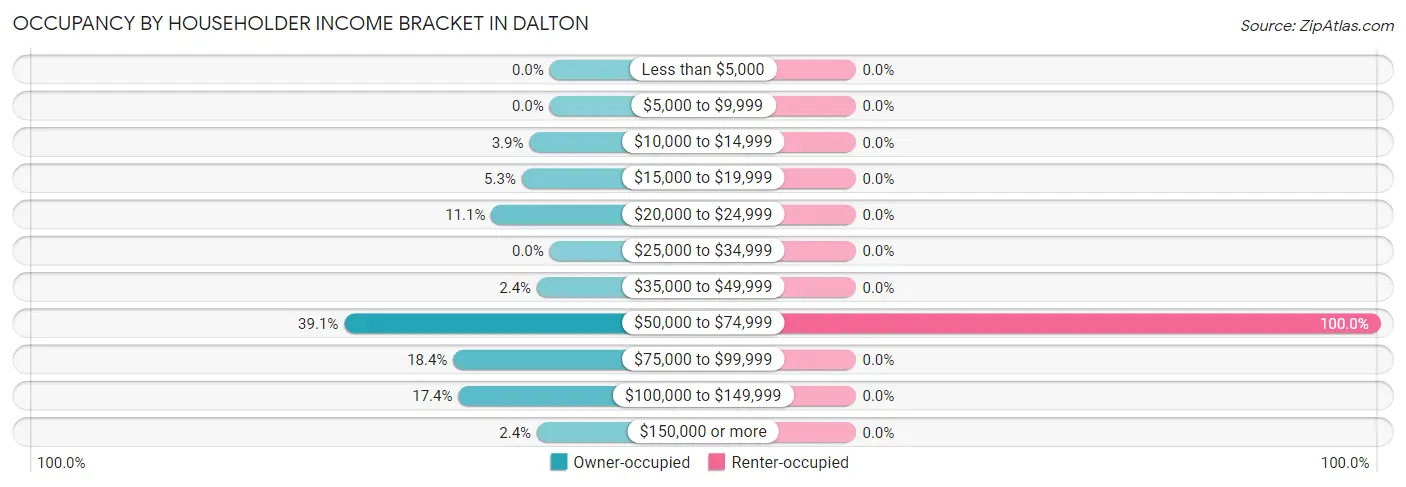
| Income Bracket | Owner-occupied | Renter-occupied |
| Less than $5,000 | 0 (0.0%) | 0 (0.0%) |
| $5,000 to $9,999 | 0 (0.0%) | 0 (0.0%) |
| $10,000 to $14,999 | 8 (3.9%) | 0 (0.0%) |
| $15,000 to $19,999 | 11 (5.3%) | 0 (0.0%) |
| $20,000 to $24,999 | 23 (11.1%) | 0 (0.0%) |
| $25,000 to $34,999 | 0 (0.0%) | 0 (0.0%) |
| $35,000 to $49,999 | 5 (2.4%) | 0 (0.0%) |
| $50,000 to $74,999 | 81 (39.1%) | 10 (100.0%) |
| $75,000 to $99,999 | 38 (18.4%) | 0 (0.0%) |
| $100,000 to $149,999 | 36 (17.4%) | 0 (0.0%) |
| $150,000 or more | 5 (2.4%) | 0 (0.0%) |
| Total | 207 (100.0%) | 10 (100.0%) |
Monthly Housing Cost Tiers in Dalton
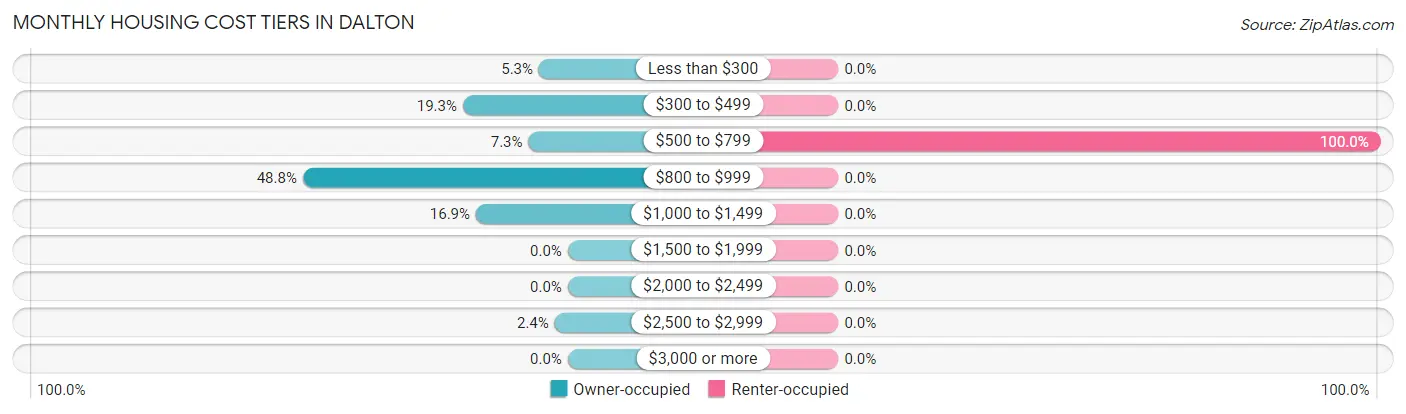
| Monthly Cost | Owner-occupied | Renter-occupied |
| Less than $300 | 11 (5.3%) | 0 (0.0%) |
| $300 to $499 | 40 (19.3%) | 0 (0.0%) |
| $500 to $799 | 15 (7.2%) | 10 (100.0%) |
| $800 to $999 | 101 (48.8%) | 0 (0.0%) |
| $1,000 to $1,499 | 35 (16.9%) | 0 (0.0%) |
| $1,500 to $1,999 | 0 (0.0%) | 0 (0.0%) |
| $2,000 to $2,499 | 0 (0.0%) | 0 (0.0%) |
| $2,500 to $2,999 | 5 (2.4%) | 0 (0.0%) |
| $3,000 or more | 0 (0.0%) | 0 (0.0%) |
| Total | 207 (100.0%) | 10 (100.0%) |
Physical Housing Characteristics in Dalton
Housing Structures in Dalton
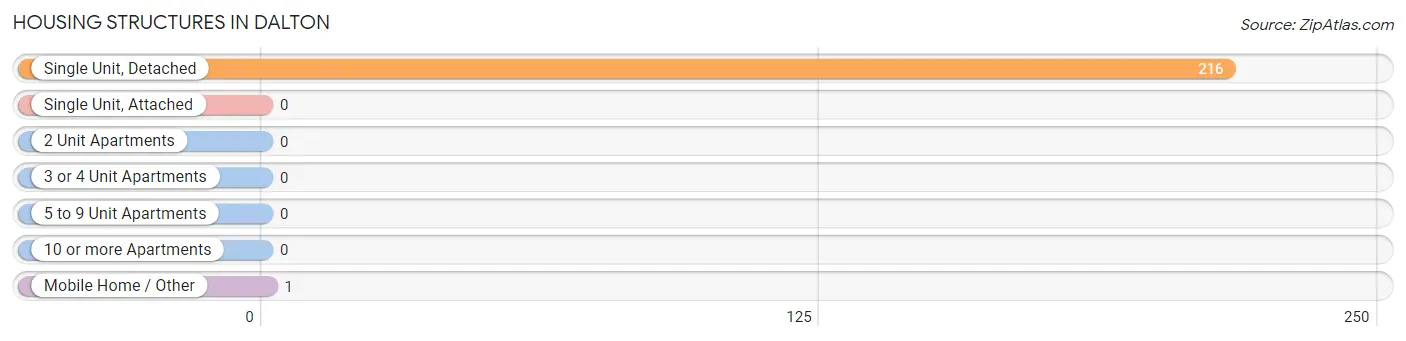
| Structure Type | # Housing Units | % Housing Units |
| Single Unit, Detached | 216 | 99.5% |
| Single Unit, Attached | 0 | 0.0% |
| 2 Unit Apartments | 0 | 0.0% |
| 3 or 4 Unit Apartments | 0 | 0.0% |
| 5 to 9 Unit Apartments | 0 | 0.0% |
| 10 or more Apartments | 0 | 0.0% |
| Mobile Home / Other | 1 | 0.5% |
| Total | 217 | 100.0% |
Housing Structures by Occupancy in Dalton
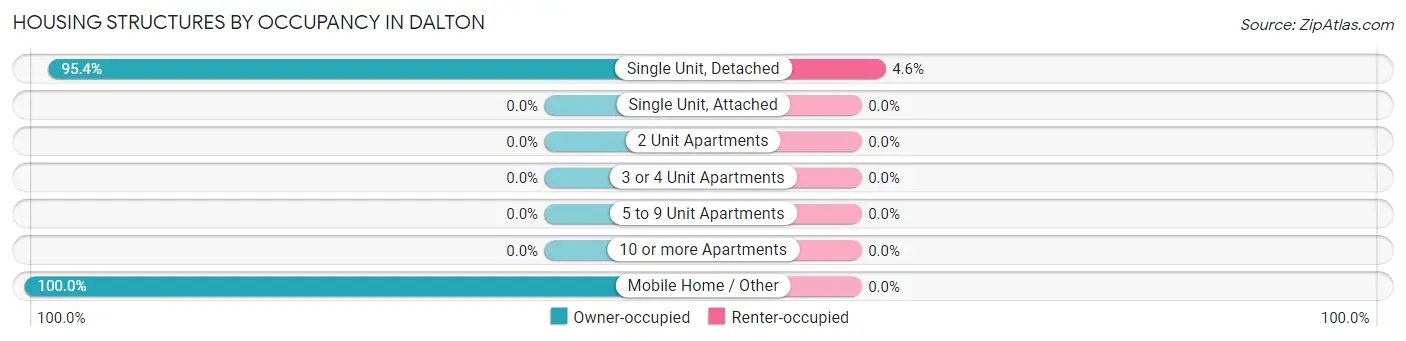
| Structure Type | Owner-occupied | Renter-occupied |
| Single Unit, Detached | 206 (95.4%) | 10 (4.6%) |
| Single Unit, Attached | 0 (0.0%) | 0 (0.0%) |
| 2 Unit Apartments | 0 (0.0%) | 0 (0.0%) |
| 3 or 4 Unit Apartments | 0 (0.0%) | 0 (0.0%) |
| 5 to 9 Unit Apartments | 0 (0.0%) | 0 (0.0%) |
| 10 or more Apartments | 0 (0.0%) | 0 (0.0%) |
| Mobile Home / Other | 1 (100.0%) | 0 (0.0%) |
| Total | 207 (95.4%) | 10 (4.6%) |
Housing Structures by Number of Rooms in Dalton
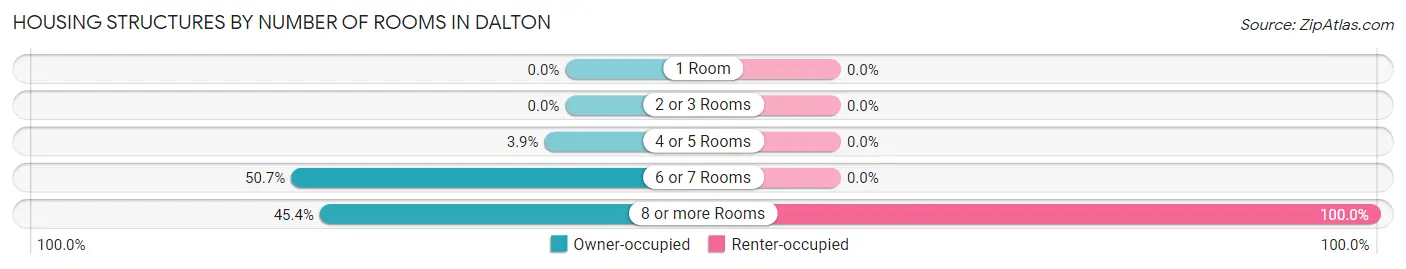
| Number of Rooms | Owner-occupied | Renter-occupied |
| 1 Room | 0 (0.0%) | 0 (0.0%) |
| 2 or 3 Rooms | 0 (0.0%) | 0 (0.0%) |
| 4 or 5 Rooms | 8 (3.9%) | 0 (0.0%) |
| 6 or 7 Rooms | 105 (50.7%) | 0 (0.0%) |
| 8 or more Rooms | 94 (45.4%) | 10 (100.0%) |
| Total | 207 (100.0%) | 10 (100.0%) |
Housing Structure by Heating Type in Dalton
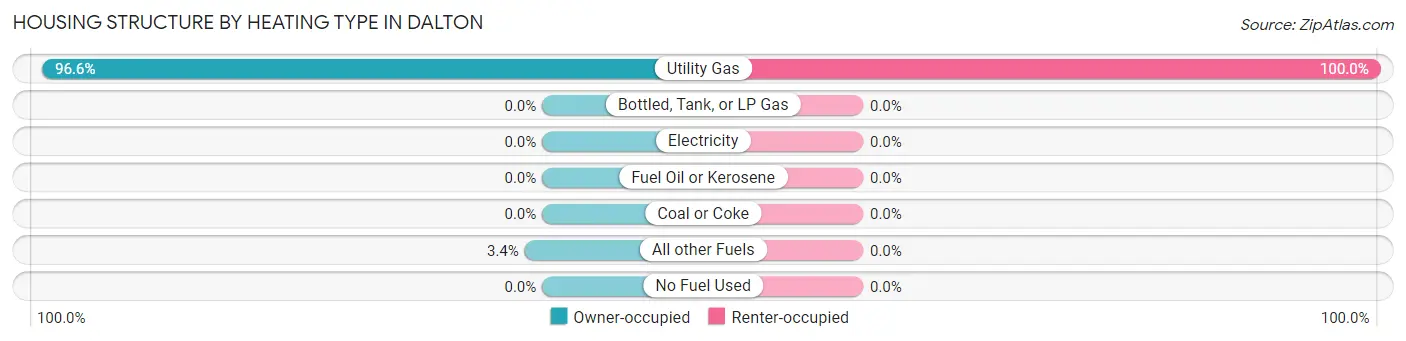
| Heating Type | Owner-occupied | Renter-occupied |
| Utility Gas | 200 (96.6%) | 10 (100.0%) |
| Bottled, Tank, or LP Gas | 0 (0.0%) | 0 (0.0%) |
| Electricity | 0 (0.0%) | 0 (0.0%) |
| Fuel Oil or Kerosene | 0 (0.0%) | 0 (0.0%) |
| Coal or Coke | 0 (0.0%) | 0 (0.0%) |
| All other Fuels | 7 (3.4%) | 0 (0.0%) |
| No Fuel Used | 0 (0.0%) | 0 (0.0%) |
| Total | 207 (100.0%) | 10 (100.0%) |
Household Vehicle Usage in Dalton
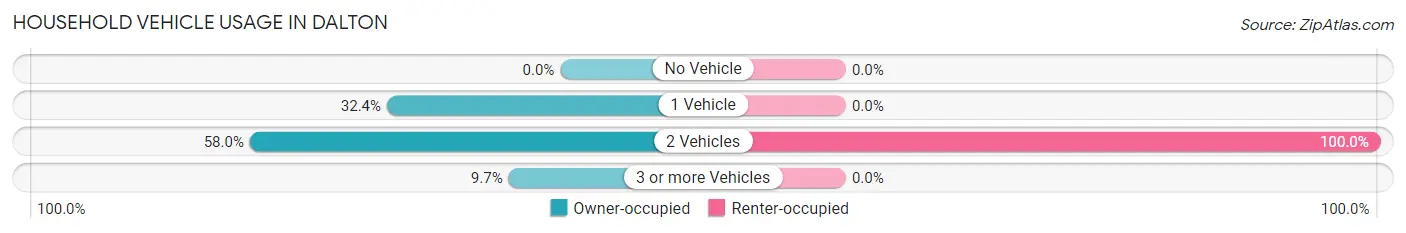
| Vehicles per Household | Owner-occupied | Renter-occupied |
| No Vehicle | 0 (0.0%) | 0 (0.0%) |
| 1 Vehicle | 67 (32.4%) | 0 (0.0%) |
| 2 Vehicles | 120 (58.0%) | 10 (100.0%) |
| 3 or more Vehicles | 20 (9.7%) | 0 (0.0%) |
| Total | 207 (100.0%) | 10 (100.0%) |
Real Estate & Mortgages in Dalton
Real Estate and Mortgage Overview in Dalton
| Characteristic | Without Mortgage | With Mortgage |
| Housing Units | 77 | 130 |
| Median Property Value | - | - |
| Median Household Income | - | - |
| Monthly Housing Costs | $473 | $0 |
| Real Estate Taxes | $2,476 | $0 |
Property Value by Mortgage Status in Dalton
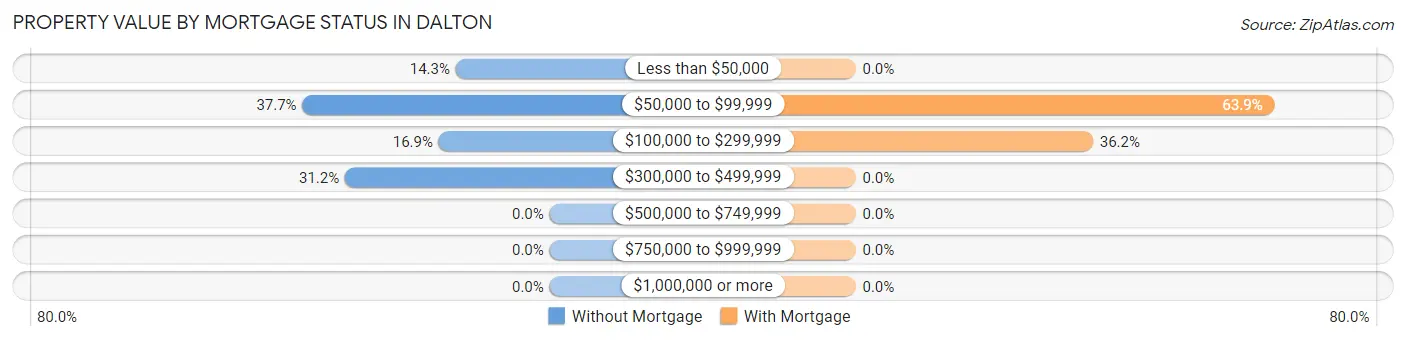
| Property Value | Without Mortgage | With Mortgage |
| Less than $50,000 | 11 (14.3%) | 0 (0.0%) |
| $50,000 to $99,999 | 29 (37.7%) | 83 (63.8%) |
| $100,000 to $299,999 | 13 (16.9%) | 47 (36.1%) |
| $300,000 to $499,999 | 24 (31.2%) | 0 (0.0%) |
| $500,000 to $749,999 | 0 (0.0%) | 0 (0.0%) |
| $750,000 to $999,999 | 0 (0.0%) | 0 (0.0%) |
| $1,000,000 or more | 0 (0.0%) | 0 (0.0%) |
| Total | 77 (100.0%) | 130 (100.0%) |
Household Income by Mortgage Status in Dalton
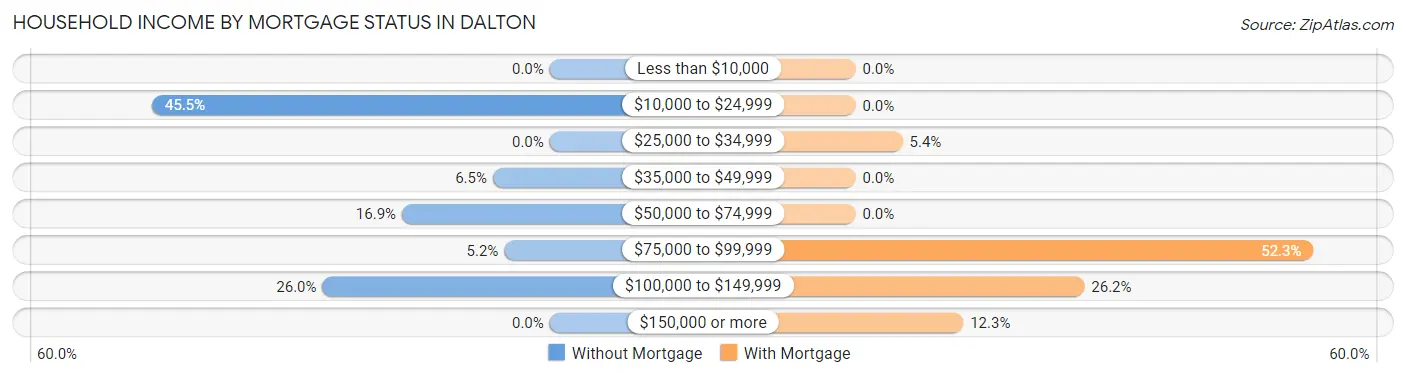
| Household Income | Without Mortgage | With Mortgage |
| Less than $10,000 | 0 (0.0%) | 0 (0.0%) |
| $10,000 to $24,999 | 35 (45.5%) | 0 (0.0%) |
| $25,000 to $34,999 | 0 (0.0%) | 7 (5.4%) |
| $35,000 to $49,999 | 5 (6.5%) | 0 (0.0%) |
| $50,000 to $74,999 | 13 (16.9%) | 0 (0.0%) |
| $75,000 to $99,999 | 4 (5.2%) | 68 (52.3%) |
| $100,000 to $149,999 | 20 (26.0%) | 34 (26.2%) |
| $150,000 or more | 0 (0.0%) | 16 (12.3%) |
| Total | 77 (100.0%) | 130 (100.0%) |
Property Value to Household Income Ratio in Dalton
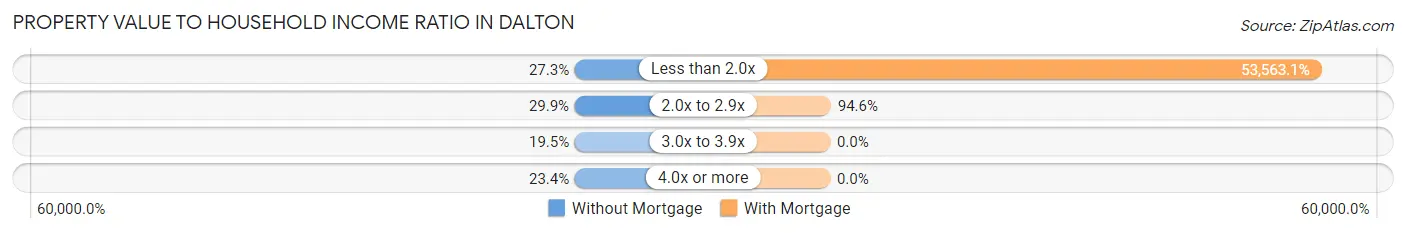
| Value-to-Income Ratio | Without Mortgage | With Mortgage |
| Less than 2.0x | 21 (27.3%) | 69,632 (53,563.1%) |
| 2.0x to 2.9x | 23 (29.9%) | 123 (94.6%) |
| 3.0x to 3.9x | 15 (19.5%) | 0 (0.0%) |
| 4.0x or more | 18 (23.4%) | 0 (0.0%) |
| Total | 77 (100.0%) | 130 (100.0%) |
Real Estate Taxes by Mortgage Status in Dalton
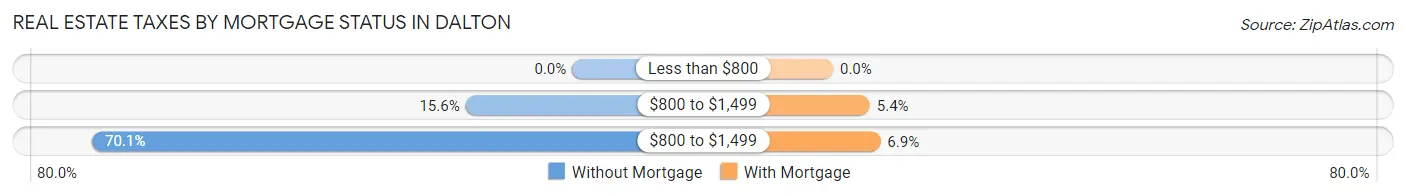
| Property Taxes | Without Mortgage | With Mortgage |
| Less than $800 | 0 (0.0%) | 0 (0.0%) |
| $800 to $1,499 | 12 (15.6%) | 7 (5.4%) |
| $800 to $1,499 | 54 (70.1%) | 9 (6.9%) |
| Total | 77 (100.0%) | 130 (100.0%) |
Health & Disability in Dalton
Health Insurance Coverage by Age in Dalton
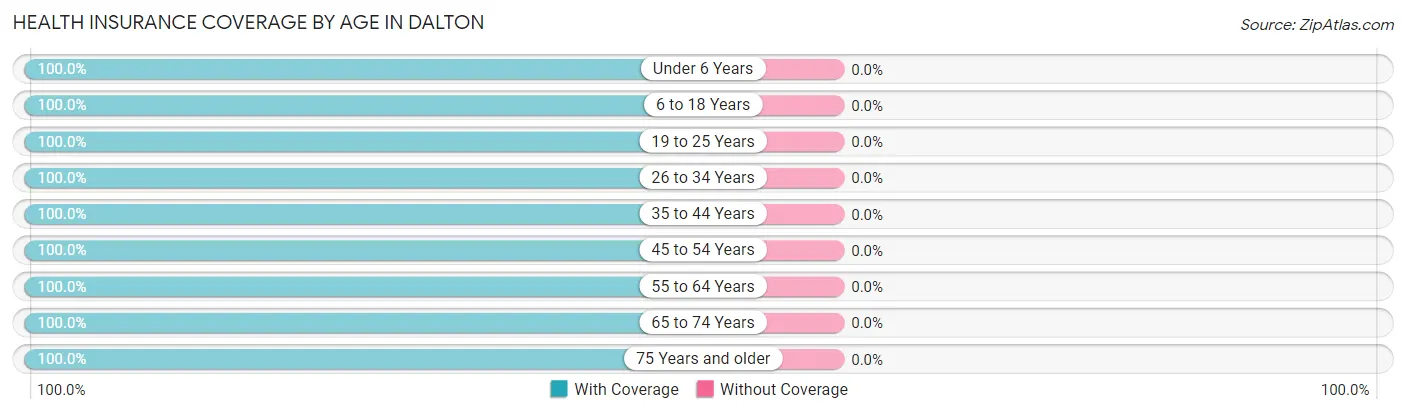
| Age Bracket | With Coverage | Without Coverage |
| Under 6 Years | 16 (100.0%) | 0 (0.0%) |
| 6 to 18 Years | 37 (100.0%) | 0 (0.0%) |
| 19 to 25 Years | 28 (100.0%) | 0 (0.0%) |
| 26 to 34 Years | 71 (100.0%) | 0 (0.0%) |
| 35 to 44 Years | 20 (100.0%) | 0 (0.0%) |
| 45 to 54 Years | 32 (100.0%) | 0 (0.0%) |
| 55 to 64 Years | 77 (100.0%) | 0 (0.0%) |
| 65 to 74 Years | 18 (100.0%) | 0 (0.0%) |
| 75 Years and older | 48 (100.0%) | 0 (0.0%) |
| Total | 347 (100.0%) | 0 (0.0%) |
Health Insurance Coverage by Citizenship Status in Dalton
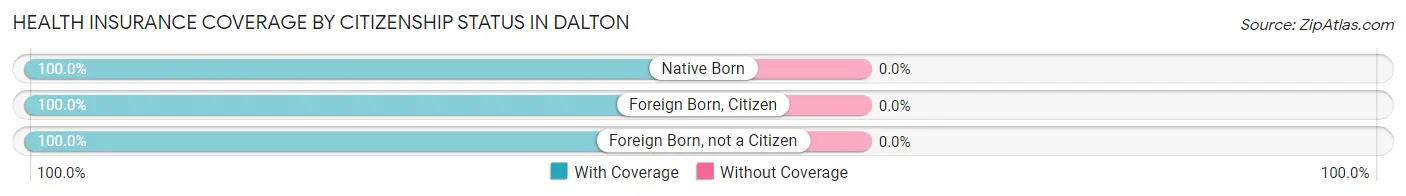
| Citizenship Status | With Coverage | Without Coverage |
| Native Born | 16 (100.0%) | 0 (0.0%) |
| Foreign Born, Citizen | 37 (100.0%) | 0 (0.0%) |
| Foreign Born, not a Citizen | 28 (100.0%) | 0 (0.0%) |
Health Insurance Coverage by Household Income in Dalton
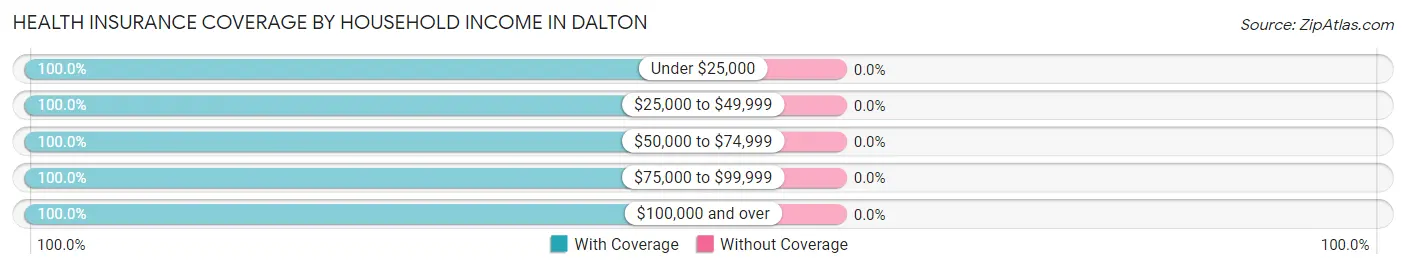
| Household Income | With Coverage | Without Coverage |
| Under $25,000 | 50 (100.0%) | 0 (0.0%) |
| $25,000 to $49,999 | 7 (100.0%) | 0 (0.0%) |
| $50,000 to $74,999 | 156 (100.0%) | 0 (0.0%) |
| $75,000 to $99,999 | 41 (100.0%) | 0 (0.0%) |
| $100,000 and over | 93 (100.0%) | 0 (0.0%) |
Public vs Private Health Insurance Coverage by Age in Dalton
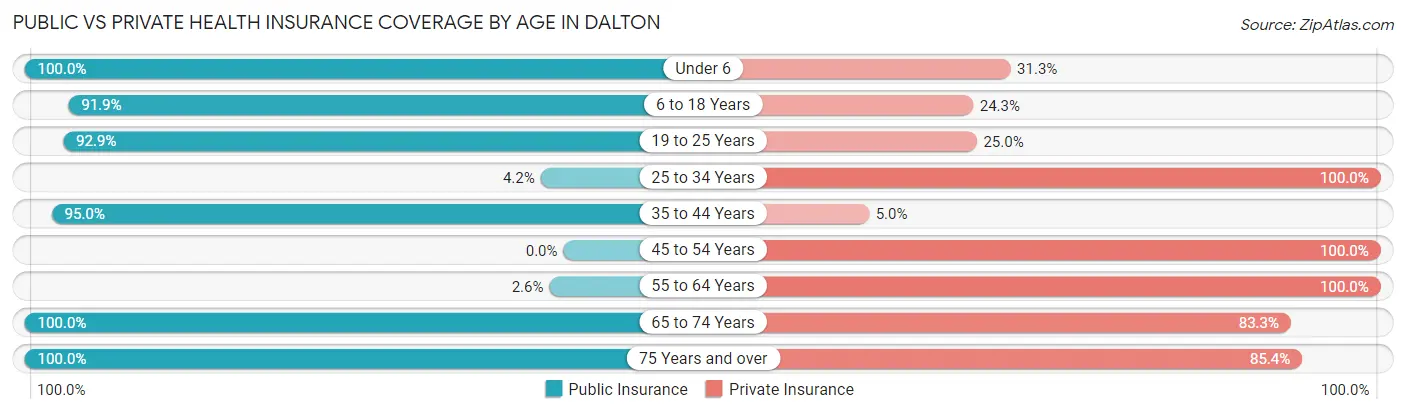
| Age Bracket | Public Insurance | Private Insurance |
| Under 6 | 16 (100.0%) | 5 (31.2%) |
| 6 to 18 Years | 34 (91.9%) | 9 (24.3%) |
| 19 to 25 Years | 26 (92.9%) | 7 (25.0%) |
| 25 to 34 Years | 3 (4.2%) | 71 (100.0%) |
| 35 to 44 Years | 19 (95.0%) | 1 (5.0%) |
| 45 to 54 Years | 0 (0.0%) | 32 (100.0%) |
| 55 to 64 Years | 2 (2.6%) | 77 (100.0%) |
| 65 to 74 Years | 18 (100.0%) | 15 (83.3%) |
| 75 Years and over | 48 (100.0%) | 41 (85.4%) |
| Total | 166 (47.8%) | 258 (74.4%) |
Disability Status by Sex by Age in Dalton
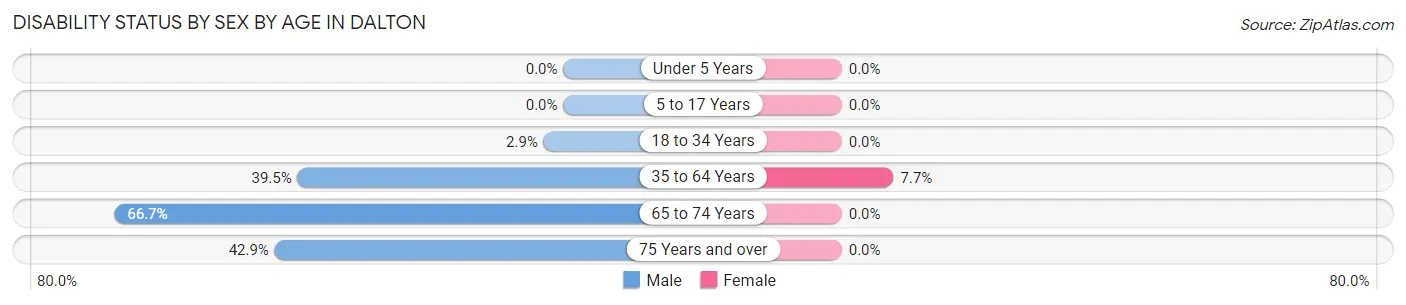
| Age Bracket | Male | Female |
| Under 5 Years | 0 (0.0%) | 0 (0.0%) |
| 5 to 17 Years | 0 (0.0%) | 0 (0.0%) |
| 18 to 34 Years | 3 (2.9%) | 0 (0.0%) |
| 35 to 64 Years | 15 (39.5%) | 7 (7.7%) |
| 65 to 74 Years | 4 (66.7%) | 0 (0.0%) |
| 75 Years and over | 9 (42.9%) | 0 (0.0%) |
Disability Class by Sex by Age in Dalton
Disability Class: Hearing Difficulty
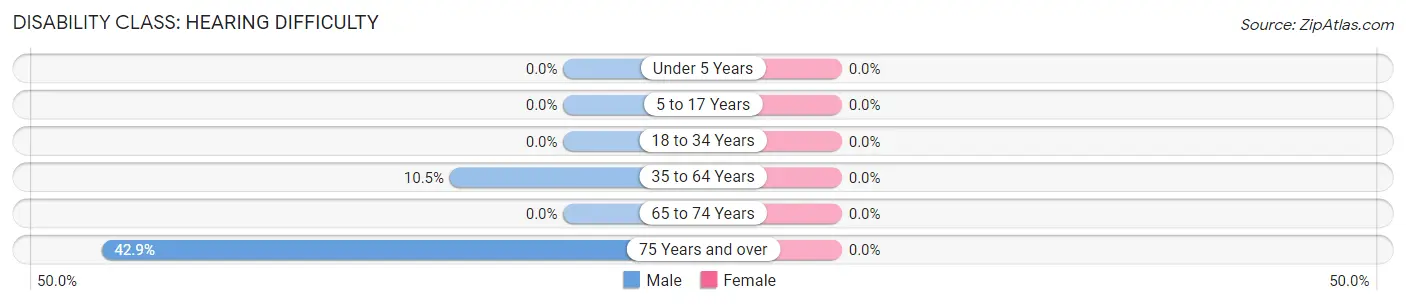
| Age Bracket | Male | Female |
| Under 5 Years | 0 (0.0%) | 0 (0.0%) |
| 5 to 17 Years | 0 (0.0%) | 0 (0.0%) |
| 18 to 34 Years | 0 (0.0%) | 0 (0.0%) |
| 35 to 64 Years | 4 (10.5%) | 0 (0.0%) |
| 65 to 74 Years | 0 (0.0%) | 0 (0.0%) |
| 75 Years and over | 9 (42.9%) | 0 (0.0%) |
Disability Class: Vision Difficulty
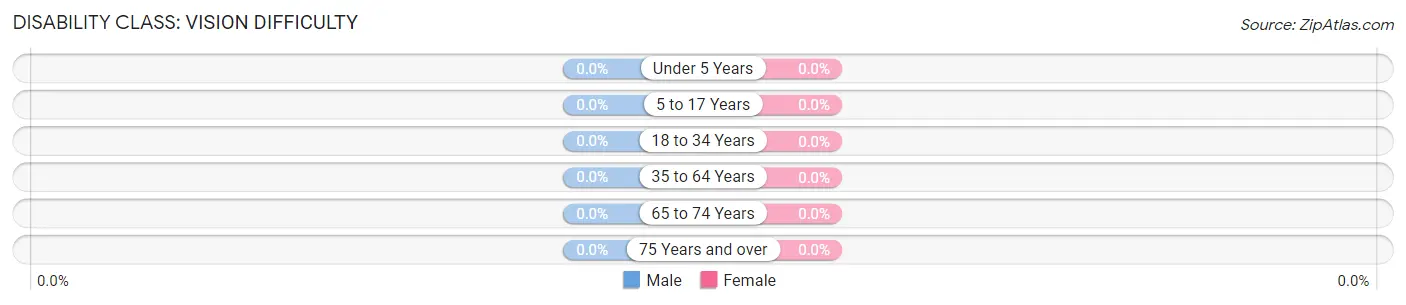
| Age Bracket | Male | Female |
| Under 5 Years | 0 (0.0%) | 0 (0.0%) |
| 5 to 17 Years | 0 (0.0%) | 0 (0.0%) |
| 18 to 34 Years | 0 (0.0%) | 0 (0.0%) |
| 35 to 64 Years | 0 (0.0%) | 0 (0.0%) |
| 65 to 74 Years | 0 (0.0%) | 0 (0.0%) |
| 75 Years and over | 0 (0.0%) | 0 (0.0%) |
Disability Class: Cognitive Difficulty
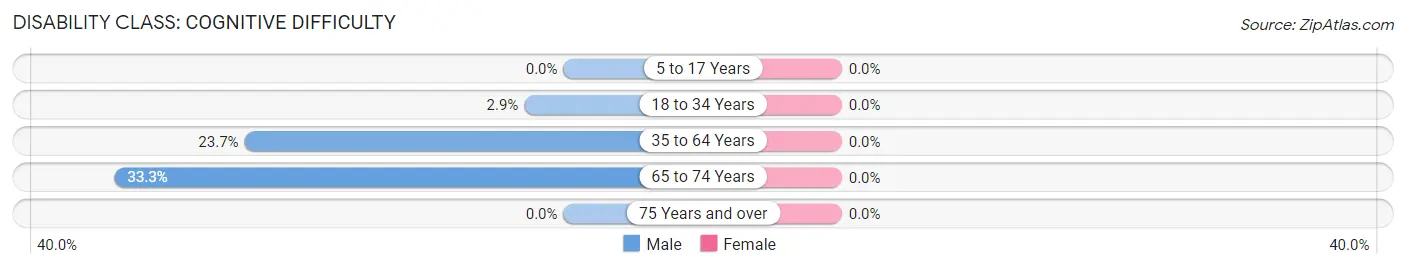
| Age Bracket | Male | Female |
| 5 to 17 Years | 0 (0.0%) | 0 (0.0%) |
| 18 to 34 Years | 3 (2.9%) | 0 (0.0%) |
| 35 to 64 Years | 9 (23.7%) | 0 (0.0%) |
| 65 to 74 Years | 2 (33.3%) | 0 (0.0%) |
| 75 Years and over | 0 (0.0%) | 0 (0.0%) |
Disability Class: Ambulatory Difficulty
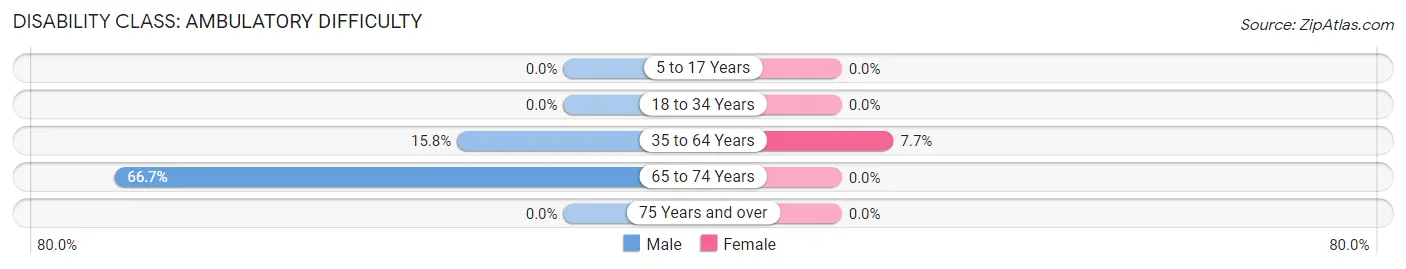
| Age Bracket | Male | Female |
| 5 to 17 Years | 0 (0.0%) | 0 (0.0%) |
| 18 to 34 Years | 0 (0.0%) | 0 (0.0%) |
| 35 to 64 Years | 6 (15.8%) | 7 (7.7%) |
| 65 to 74 Years | 4 (66.7%) | 0 (0.0%) |
| 75 Years and over | 0 (0.0%) | 0 (0.0%) |
Disability Class: Self-Care Difficulty
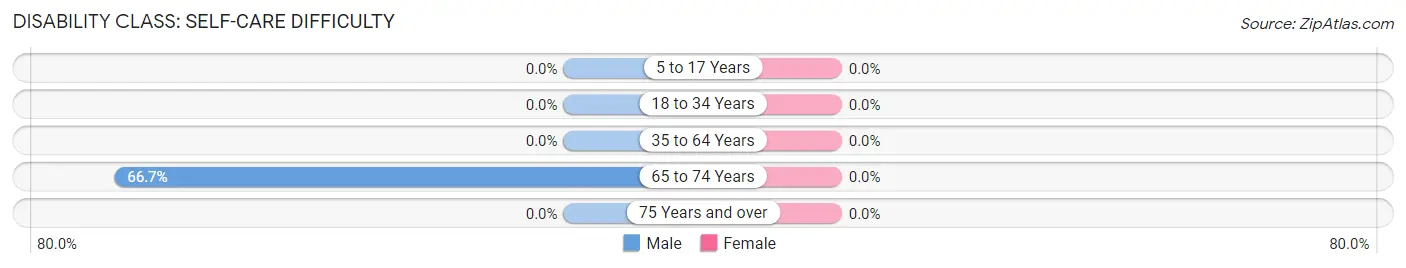
| Age Bracket | Male | Female |
| 5 to 17 Years | 0 (0.0%) | 0 (0.0%) |
| 18 to 34 Years | 0 (0.0%) | 0 (0.0%) |
| 35 to 64 Years | 0 (0.0%) | 0 (0.0%) |
| 65 to 74 Years | 4 (66.7%) | 0 (0.0%) |
| 75 Years and over | 0 (0.0%) | 0 (0.0%) |
Technology Access in Dalton
Computing Device Access in Dalton
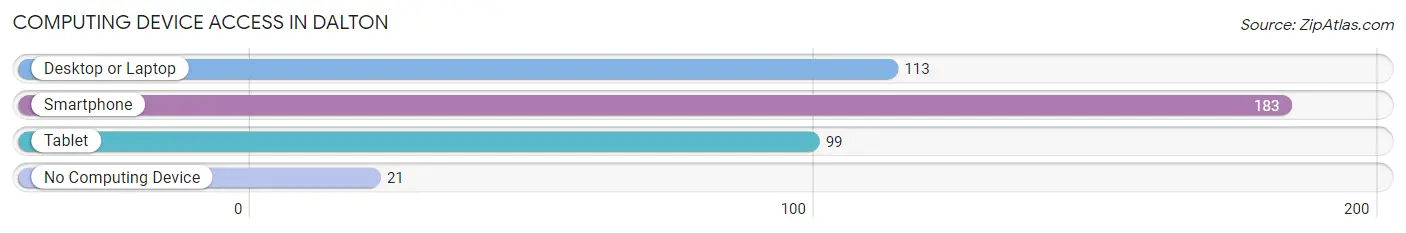
| Device Type | # Households | % Households |
| Desktop or Laptop | 113 | 52.1% |
| Smartphone | 183 | 84.3% |
| Tablet | 99 | 45.6% |
| No Computing Device | 21 | 9.7% |
| Total | 217 | 100.0% |
Internet Access in Dalton
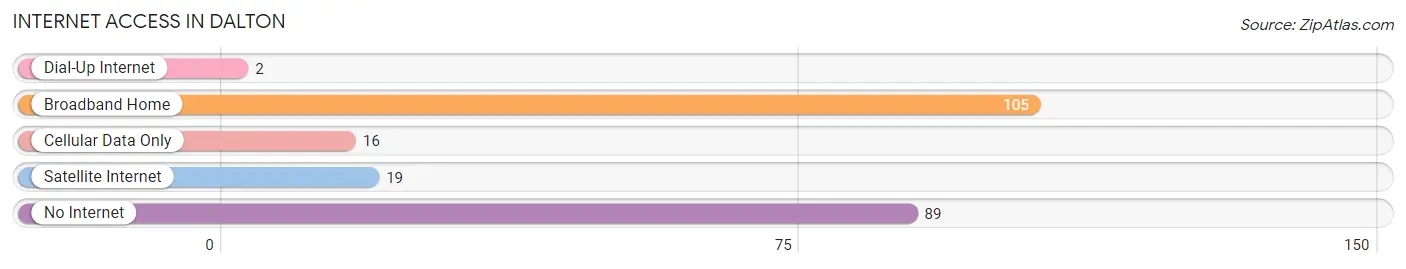
| Internet Type | # Households | % Households |
| Dial-Up Internet | 2 | 0.9% |
| Broadband Home | 105 | 48.4% |
| Cellular Data Only | 16 | 7.4% |
| Satellite Internet | 19 | 8.8% |
| No Internet | 89 | 41.0% |
| Total | 217 | 100.0% |
Dalton Summary
Dalton is a small town located in the western part of New York State, in the Finger Lakes region. It is situated in the town of Dalton, which is part of the county of Genesee. The town has a population of approximately 1,500 people, and is located about 25 miles south of Rochester.
History
The town of Dalton was first settled in 1810 by a group of settlers from Connecticut. The town was named after the town of Dalton, Massachusetts, which was the hometown of the settlers. The town was officially incorporated in 1817.
In the early years, the town was primarily an agricultural community, with the main crops being wheat, corn, and potatoes. The town also had a number of small businesses, including a sawmill, a gristmill, and a blacksmith shop.
In the late 19th century, the town began to experience a period of growth and development. The railroad arrived in 1881, and the town began to attract new businesses and industries. The town also became a popular tourist destination, with many people coming to visit the nearby Letchworth State Park.
Geography
Dalton is located in the western part of New York State, in the Finger Lakes region. The town is situated in the town of Dalton, which is part of the county of Genesee. The town is located about 25 miles south of Rochester.
The town is situated on the banks of the Genesee River, and is surrounded by rolling hills and farmland. The town is also located near several lakes, including Honeoye Lake, Canadice Lake, and Hemlock Lake.
Economy
The economy of Dalton is primarily based on agriculture and tourism. The town is home to several farms, which produce a variety of crops, including wheat, corn, and potatoes. The town also has a number of small businesses, including a sawmill, a gristmill, and a blacksmith shop.
The town is also a popular tourist destination, with many people coming to visit the nearby Letchworth State Park. The park is known for its spectacular waterfalls and scenic views.
Demographics
As of the 2010 census, the town of Dalton had a population of 1,500 people. The racial makeup of the town was 97.3% White, 0.7% African American, 0.3% Native American, 0.3% Asian, and 1.3% from other races. The median household income was $45,000, and the median family income was $50,000.
Conclusion
Dalton is a small town located in the western part of New York State, in the Finger Lakes region. The town has a population of approximately 1,500 people, and is located about 25 miles south of Rochester. The town has a long history, and was first settled in 1810 by a group of settlers from Connecticut. The town is primarily an agricultural community, with the main crops being wheat, corn, and potatoes. The town is also a popular tourist destination, with many people coming to visit the nearby Letchworth State Park. The town has a diverse population, with the racial makeup being 97.3% White, 0.7% African American, 0.3% Native American, 0.3% Asian, and 1.3% from other races. The median household income was $45,000, and the median family income was $50,000.
Common Questions
What is Per Capita Income in Dalton?
Per Capita income in Dalton is $43,948.
What is the Median Family Income in Dalton?
Median Family Income in Dalton is $75,625.
What is the Median Household income in Dalton?
Median Household Income in Dalton is $68,915.
What is Inequality or Gini Index in Dalton?
Inequality or Gini Index in Dalton is 0.27.
What is the Total Population of Dalton?
Total Population of Dalton is 347.
What is the Total Male Population of Dalton?
Total Male Population of Dalton is 185.
What is the Total Female Population of Dalton?
Total Female Population of Dalton is 162.
What is the Ratio of Males per 100 Females in Dalton?
There are 114.20 Males per 100 Females in Dalton.
What is the Ratio of Females per 100 Males in Dalton?
There are 87.57 Females per 100 Males in Dalton.
What is the Median Population Age in Dalton?
Median Population Age in Dalton is 49.2 Years.
What is the Average Family Size in Dalton
Average Family Size in Dalton is 2.9 People.
What is the Average Household Size in Dalton
Average Household Size in Dalton is 1.6 People.
How Large is the Labor Force in Dalton?
There are 194 People in the Labor Forcein in Dalton.
What is the Percentage of People in the Labor Force in Dalton?
64.0% of People are in the Labor Force in Dalton.