Crystal Beach, NY Map & Demographics
Crystal Beach Map
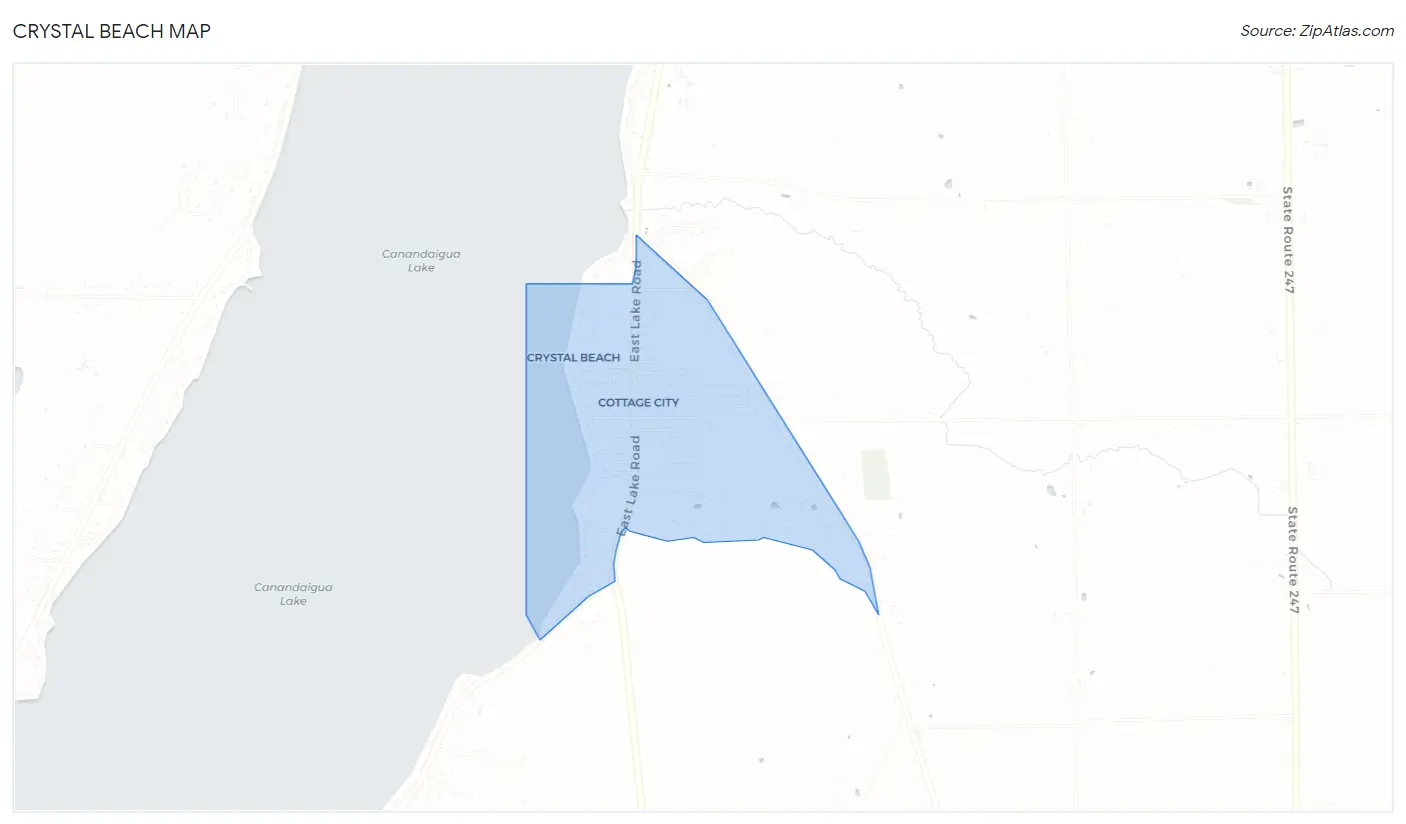
Crystal Beach Overview
$37,027
PER CAPITA INCOME
$88,977
AVG FAMILY INCOME
$58,984
AVG HOUSEHOLD INCOME
17.7%
WAGE / INCOME GAP [ % ]
82.3¢/ $1
WAGE / INCOME GAP [ $ ]
0.36
INEQUALITY / GINI INDEX
746
TOTAL POPULATION
373
MALE POPULATION
373
FEMALE POPULATION
100.00
MALES / 100 FEMALES
100.00
FEMALES / 100 MALES
57.2
MEDIAN AGE
2.7
AVG FAMILY SIZE
1.9
AVG HOUSEHOLD SIZE
378
LABOR FORCE [ PEOPLE ]
53.5%
PERCENT IN LABOR FORCE
Income in Crystal Beach
Income Overview in Crystal Beach
Per Capita Income in Crystal Beach is $37,027, while median incomes of families and households are $88,977 and $58,984 respectively.
| Characteristic | Number | Measure |
| Per Capita Income | 746 | $37,027 |
| Median Family Income | 206 | $88,977 |
| Mean Family Income | 206 | $91,719 |
| Median Household Income | 394 | $58,984 |
| Mean Household Income | 394 | $68,785 |
| Income Deficit | 206 | $0 |
| Wage / Income Gap (%) | 746 | 17.74% |
| Wage / Income Gap ($) | 746 | 82.26¢ per $1 |
| Gini / Inequality Index | 746 | 0.36 |
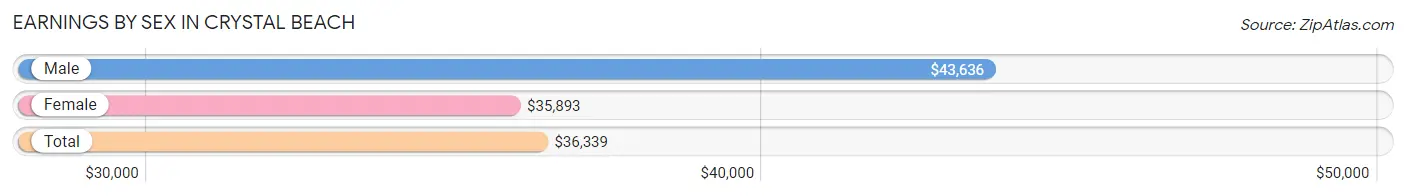
Earnings by Sex in Crystal Beach
Average Earnings in Crystal Beach are $36,339, $43,636 for men and $35,893 for women, a difference of 17.7%.
| Sex | Number | Average Earnings |
| Male | 260 (55.6%) | $43,636 |
| Female | 208 (44.4%) | $35,893 |
| Total | 468 (100.0%) | $36,339 |
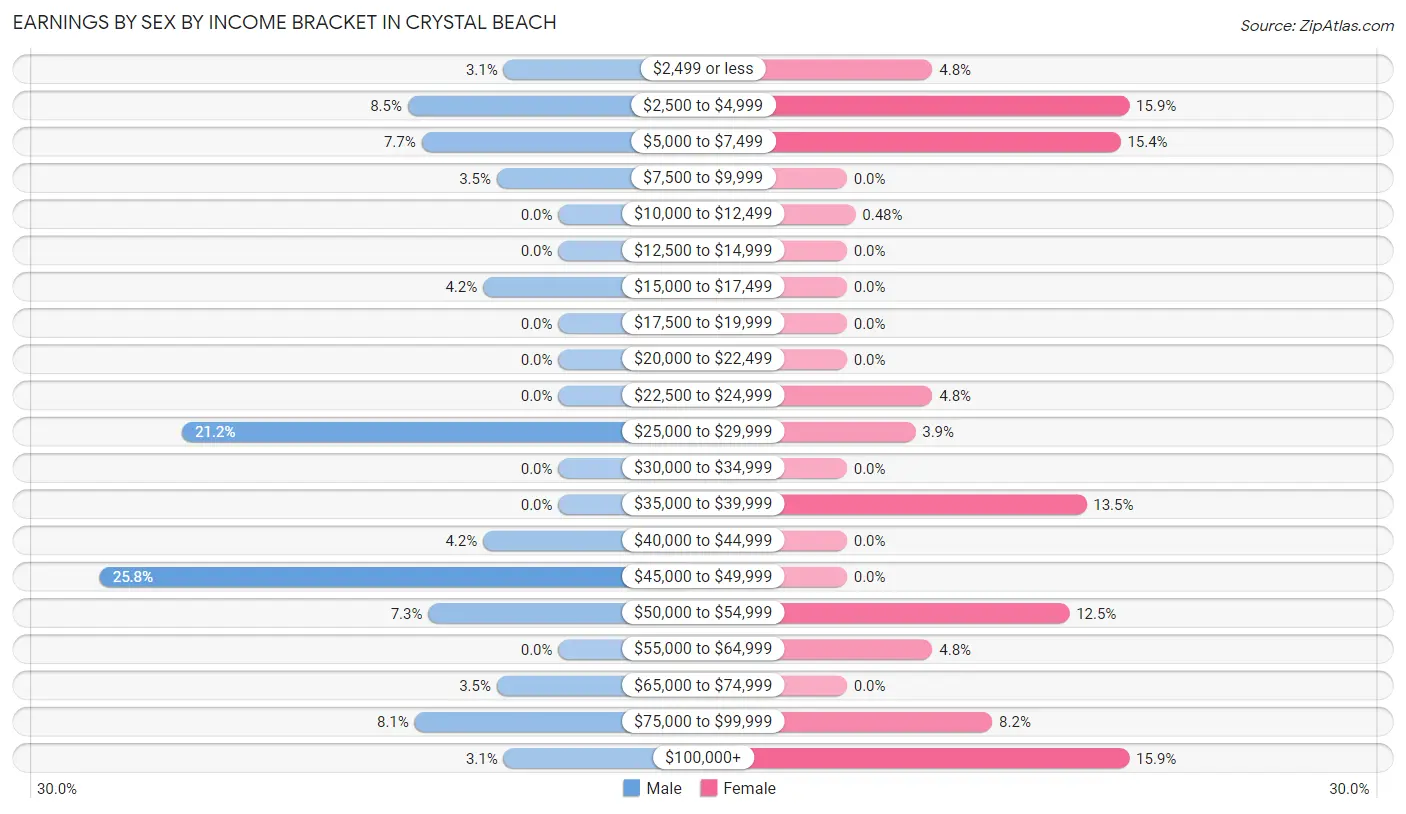
Earnings by Sex by Income Bracket in Crystal Beach
The most common earnings brackets in Crystal Beach are $45,000 to $49,999 for men (67 | 25.8%) and $2,500 to $4,999 for women (33 | 15.9%).
| Income | Male | Female |
| $2,499 or less | 8 (3.1%) | 10 (4.8%) |
| $2,500 to $4,999 | 22 (8.5%) | 33 (15.9%) |
| $5,000 to $7,499 | 20 (7.7%) | 32 (15.4%) |
| $7,500 to $9,999 | 9 (3.5%) | 0 (0.0%) |
| $10,000 to $12,499 | 0 (0.0%) | 1 (0.5%) |
| $12,500 to $14,999 | 0 (0.0%) | 0 (0.0%) |
| $15,000 to $17,499 | 11 (4.2%) | 0 (0.0%) |
| $17,500 to $19,999 | 0 (0.0%) | 0 (0.0%) |
| $20,000 to $22,499 | 0 (0.0%) | 0 (0.0%) |
| $22,500 to $24,999 | 0 (0.0%) | 10 (4.8%) |
| $25,000 to $29,999 | 55 (21.1%) | 8 (3.8%) |
| $30,000 to $34,999 | 0 (0.0%) | 0 (0.0%) |
| $35,000 to $39,999 | 0 (0.0%) | 28 (13.5%) |
| $40,000 to $44,999 | 11 (4.2%) | 0 (0.0%) |
| $45,000 to $49,999 | 67 (25.8%) | 0 (0.0%) |
| $50,000 to $54,999 | 19 (7.3%) | 26 (12.5%) |
| $55,000 to $64,999 | 0 (0.0%) | 10 (4.8%) |
| $65,000 to $74,999 | 9 (3.5%) | 0 (0.0%) |
| $75,000 to $99,999 | 21 (8.1%) | 17 (8.2%) |
| $100,000+ | 8 (3.1%) | 33 (15.9%) |
| Total | 260 (100.0%) | 208 (100.0%) |
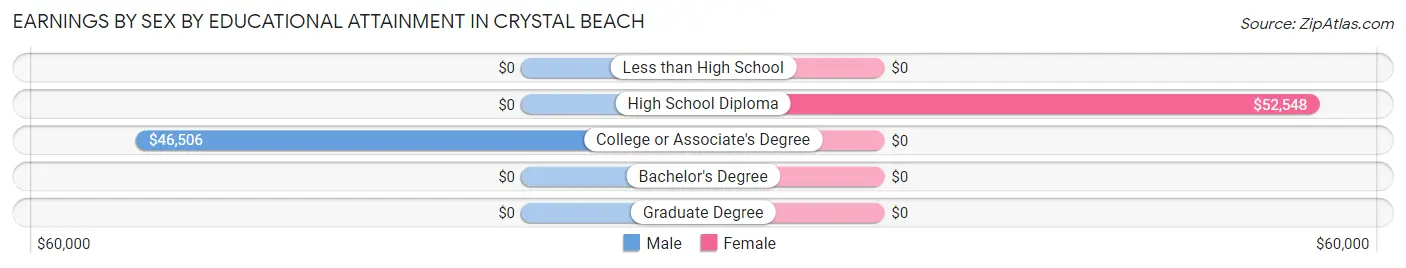
Earnings by Sex by Educational Attainment in Crystal Beach
Average earnings in Crystal Beach are $45,256 for men and $37,361 for women, a difference of 17.4%. Men with an educational attainment of college or associate's degree enjoy the highest average annual earnings of $46,506, while those with college or associate's degree education earn the least with $46,506. Women with an educational attainment of high school diploma earn the most with the average annual earnings of $52,548, while those with high school diploma education have the smallest earnings of $52,548.
| Educational Attainment | Male Income | Female Income |
| Less than High School | - | - |
| High School Diploma | - | - |
| College or Associate's Degree | $46,506 | $0 |
| Bachelor's Degree | - | - |
| Graduate Degree | - | - |
| Total | $45,256 | $37,361 |
Family Income in Crystal Beach
Family Income Brackets in Crystal Beach
According to the Crystal Beach family income data, there are 66 families falling into the $100,000 to $149,999 income range, which is the most common income bracket and makes up 32.0% of all families.
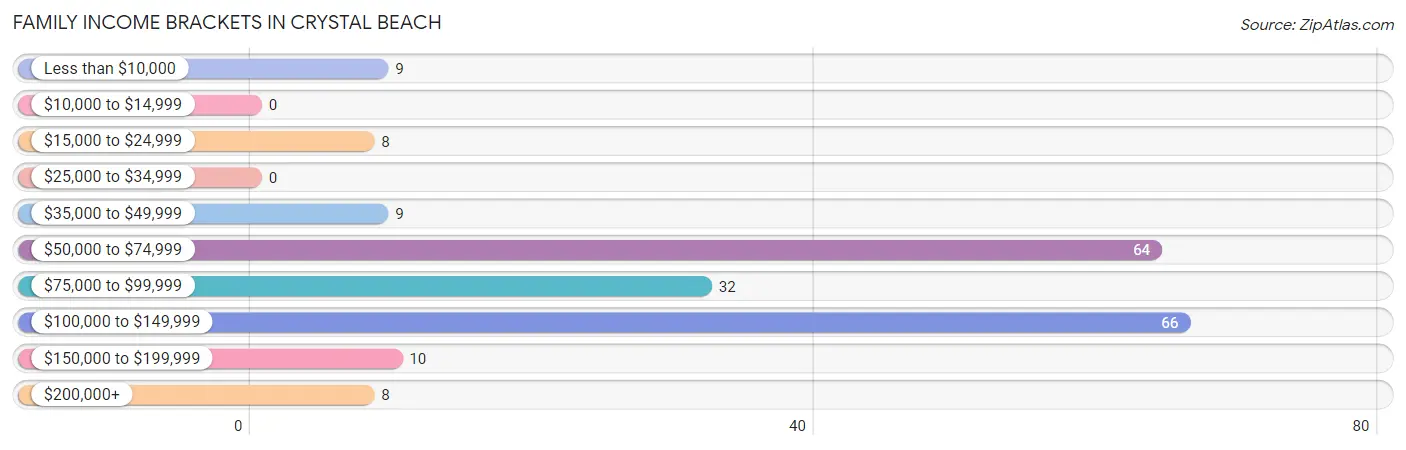
| Income Bracket | # Families | % Families |
| Less than $10,000 | 9 | 4.4% |
| $10,000 to $14,999 | 0 | 0.0% |
| $15,000 to $24,999 | 8 | 3.9% |
| $25,000 to $34,999 | 0 | 0.0% |
| $35,000 to $49,999 | 9 | 4.4% |
| $50,000 to $74,999 | 64 | 31.1% |
| $75,000 to $99,999 | 32 | 15.5% |
| $100,000 to $149,999 | 66 | 32.0% |
| $150,000 to $199,999 | 10 | 4.9% |
| $200,000+ | 8 | 3.9% |
Family Income by Famaliy Size in Crystal Beach
2-person families (137 | 66.5%) account for the highest median family income in Crystal Beach with $88,807 per family, while 2-person families (137 | 66.5%) have the highest median income of $44,404 per family member.
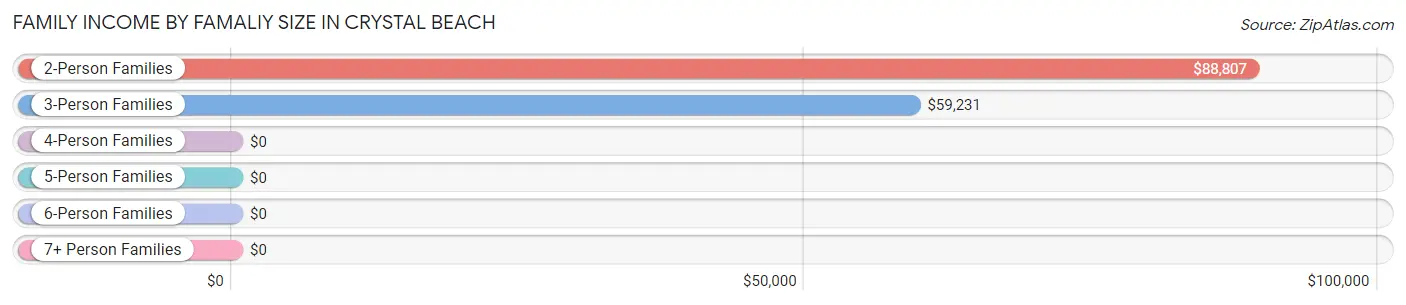
| Income Bracket | # Families | Median Income |
| 2-Person Families | 137 (66.5%) | $88,807 |
| 3-Person Families | 42 (20.4%) | $59,231 |
| 4-Person Families | 17 (8.3%) | $0 |
| 5-Person Families | 0 (0.0%) | $0 |
| 6-Person Families | 0 (0.0%) | $0 |
| 7+ Person Families | 10 (4.9%) | $0 |
| Total | 206 (100.0%) | $88,977 |
Family Income by Number of Earners in Crystal Beach
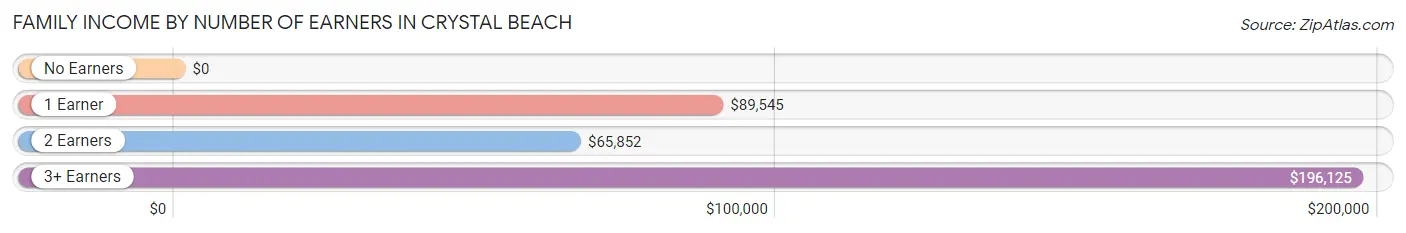
| Number of Earners | # Families | Median Income |
| No Earners | 26 (12.6%) | $0 |
| 1 Earner | 54 (26.2%) | $89,545 |
| 2 Earners | 99 (48.1%) | $65,852 |
| 3+ Earners | 27 (13.1%) | $196,125 |
| Total | 206 (100.0%) | $88,977 |
Household Income in Crystal Beach
Household Income Brackets in Crystal Beach
With 93 households falling in the category, the $50,000 to $74,999 income range is the most frequent in Crystal Beach, accounting for 23.6% of all households.
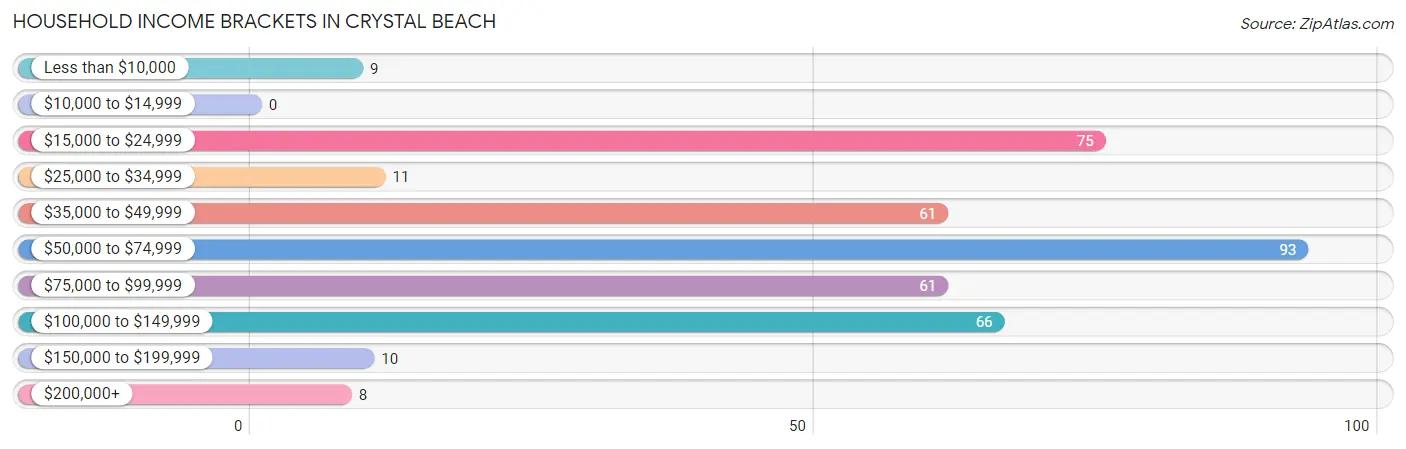
| Income Bracket | # Households | % Households |
| Less than $10,000 | 9 | 2.3% |
| $10,000 to $14,999 | 0 | 0.0% |
| $15,000 to $24,999 | 75 | 19.0% |
| $25,000 to $34,999 | 11 | 2.8% |
| $35,000 to $49,999 | 61 | 15.5% |
| $50,000 to $74,999 | 93 | 23.6% |
| $75,000 to $99,999 | 61 | 15.5% |
| $100,000 to $149,999 | 66 | 16.8% |
| $150,000 to $199,999 | 10 | 2.5% |
| $200,000+ | 8 | 2.0% |
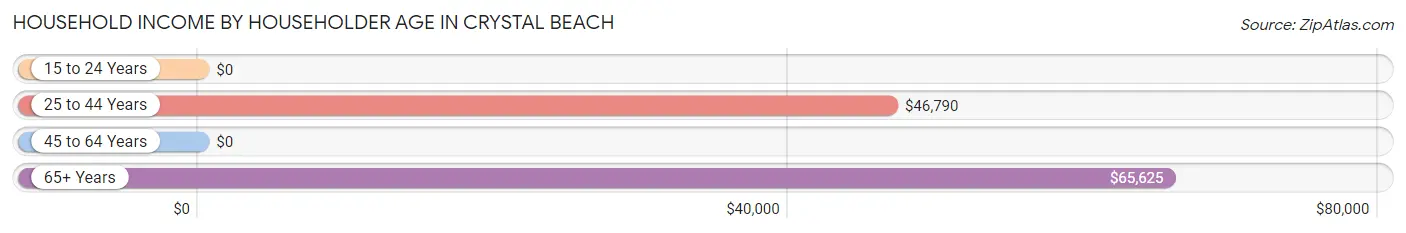
Household Income by Householder Age in Crystal Beach
The median household income in Crystal Beach is $58,984, with the highest median household income of $65,625 found in the 65+ years age bracket for the primary householder. A total of 173 households (43.9%) fall into this category.
| Income Bracket | # Households | Median Income |
| 15 to 24 Years | 0 (0.0%) | $0 |
| 25 to 44 Years | 87 (22.1%) | $46,790 |
| 45 to 64 Years | 134 (34.0%) | $0 |
| 65+ Years | 173 (43.9%) | $65,625 |
| Total | 394 (100.0%) | $58,984 |
Poverty in Crystal Beach
Income Below Poverty by Sex and Age in Crystal Beach
With 3.7% poverty level for males and 2.4% for females among the residents of Crystal Beach, 65 to 74 year old males and 65 to 74 year old females are the most vulnerable to poverty, with 10 males (20.4%) and 9 females (8.0%) in their respective age groups living below the poverty level.
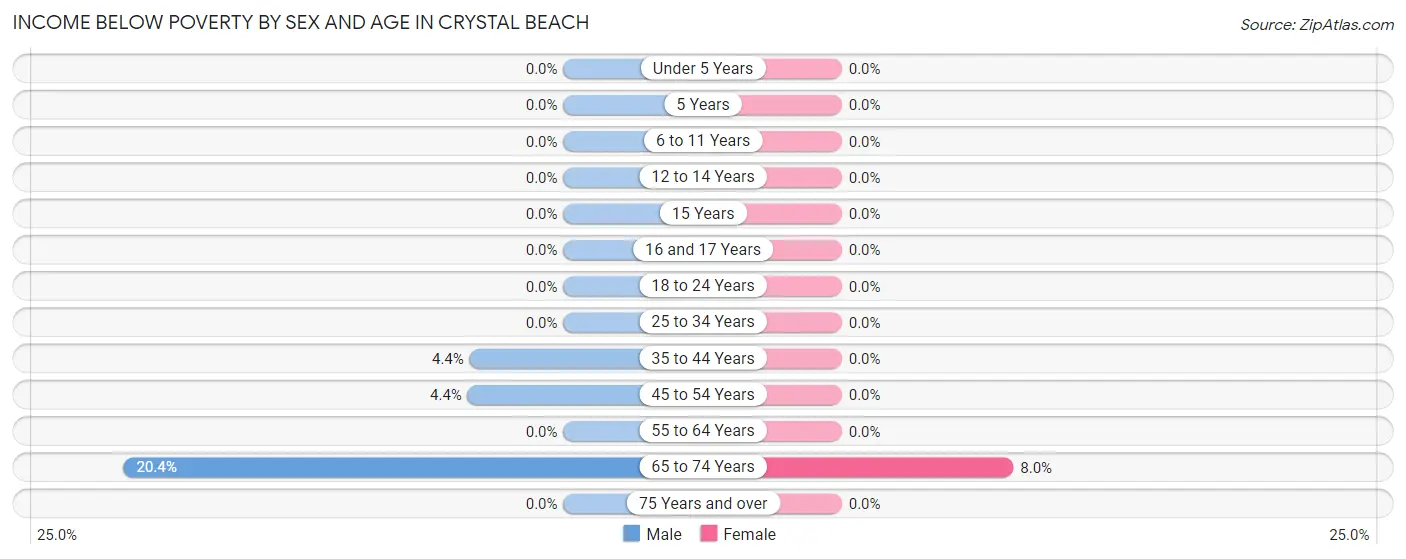
| Age Bracket | Male | Female |
| Under 5 Years | 0 (0.0%) | 0 (0.0%) |
| 5 Years | 0 (0.0%) | 0 (0.0%) |
| 6 to 11 Years | 0 (0.0%) | 0 (0.0%) |
| 12 to 14 Years | 0 (0.0%) | 0 (0.0%) |
| 15 Years | 0 (0.0%) | 0 (0.0%) |
| 16 and 17 Years | 0 (0.0%) | 0 (0.0%) |
| 18 to 24 Years | 0 (0.0%) | 0 (0.0%) |
| 25 to 34 Years | 0 (0.0%) | 0 (0.0%) |
| 35 to 44 Years | 2 (4.3%) | 0 (0.0%) |
| 45 to 54 Years | 2 (4.4%) | 0 (0.0%) |
| 55 to 64 Years | 0 (0.0%) | 0 (0.0%) |
| 65 to 74 Years | 10 (20.4%) | 9 (8.0%) |
| 75 Years and over | 0 (0.0%) | 0 (0.0%) |
| Total | 14 (3.7%) | 9 (2.4%) |
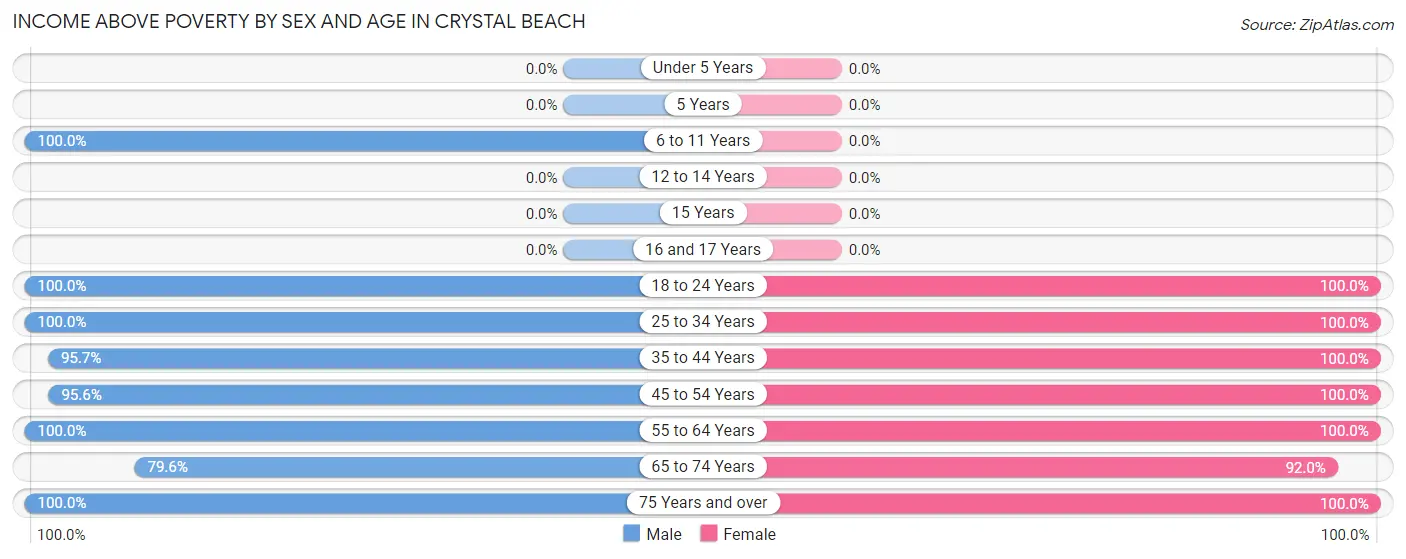
Income Above Poverty by Sex and Age in Crystal Beach
According to the poverty statistics in Crystal Beach, males aged 6 to 11 years and females aged 18 to 24 years are the age groups that are most secure financially, with 100.0% of males and 100.0% of females in these age groups living above the poverty line.
| Age Bracket | Male | Female |
| Under 5 Years | 0 (0.0%) | 0 (0.0%) |
| 5 Years | 0 (0.0%) | 0 (0.0%) |
| 6 to 11 Years | 40 (100.0%) | 0 (0.0%) |
| 12 to 14 Years | 0 (0.0%) | 0 (0.0%) |
| 15 Years | 0 (0.0%) | 0 (0.0%) |
| 16 and 17 Years | 0 (0.0%) | 0 (0.0%) |
| 18 to 24 Years | 39 (100.0%) | 34 (100.0%) |
| 25 to 34 Years | 30 (100.0%) | 8 (100.0%) |
| 35 to 44 Years | 44 (95.7%) | 56 (100.0%) |
| 45 to 54 Years | 43 (95.6%) | 42 (100.0%) |
| 55 to 64 Years | 86 (100.0%) | 68 (100.0%) |
| 65 to 74 Years | 39 (79.6%) | 104 (92.0%) |
| 75 Years and over | 38 (100.0%) | 52 (100.0%) |
| Total | 359 (96.3%) | 364 (97.6%) |
Income Below Poverty Among Married-Couple Families in Crystal Beach
The poverty statistics for married-couple families in Crystal Beach show that 5.3% or 9 of the total 171 families live below the poverty line. Families with no children have the highest poverty rate of 5.7%, comprising of 9 families. On the other hand, families with 1 or 2 children have the lowest poverty rate of 0.0%, which includes 0 families.
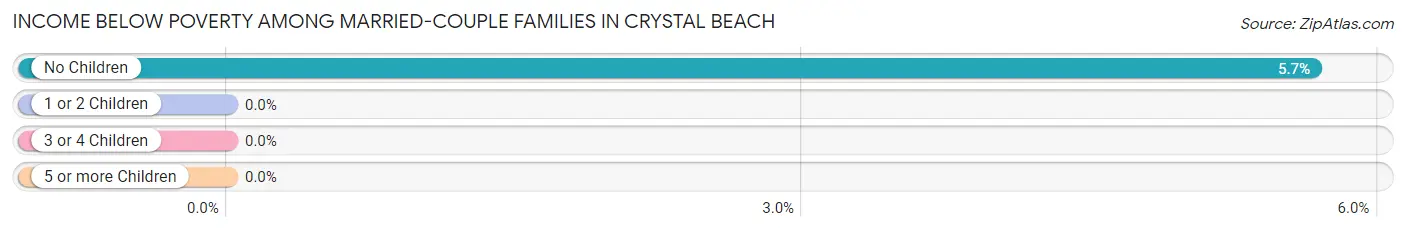
| Children | Above Poverty | Below Poverty |
| No Children | 150 (94.3%) | 9 (5.7%) |
| 1 or 2 Children | 12 (100.0%) | 0 (0.0%) |
| 3 or 4 Children | 0 (0.0%) | 0 (0.0%) |
| 5 or more Children | 0 (0.0%) | 0 (0.0%) |
| Total | 162 (94.7%) | 9 (5.3%) |
Income Below Poverty Among Single-Parent Households in Crystal Beach
| Children | Single Father | Single Mother |
| No Children | 0 (0.0%) | 0 (0.0%) |
| 1 or 2 Children | 0 (0.0%) | 0 (0.0%) |
| 3 or 4 Children | 0 (0.0%) | 0 (0.0%) |
| 5 or more Children | 0 (0.0%) | 0 (0.0%) |
| Total | 0 (0.0%) | 0 (0.0%) |
Income Below Poverty Among Married-Couple vs Single-Parent Households in Crystal Beach
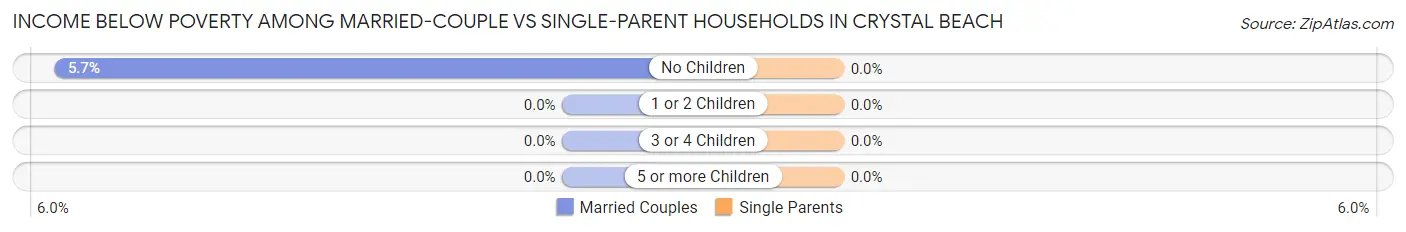
| Children | Married-Couple Families | Single-Parent Households |
| No Children | 9 (5.7%) | 0 (0.0%) |
| 1 or 2 Children | 0 (0.0%) | 0 (0.0%) |
| 3 or 4 Children | 0 (0.0%) | 0 (0.0%) |
| 5 or more Children | 0 (0.0%) | 0 (0.0%) |
| Total | 9 (5.3%) | 0 (0.0%) |
Race in Crystal Beach
The most populous races in Crystal Beach are White / Caucasian (641 | 85.9%), Asian (63 | 8.5%), and Two or more Races (41 | 5.5%).
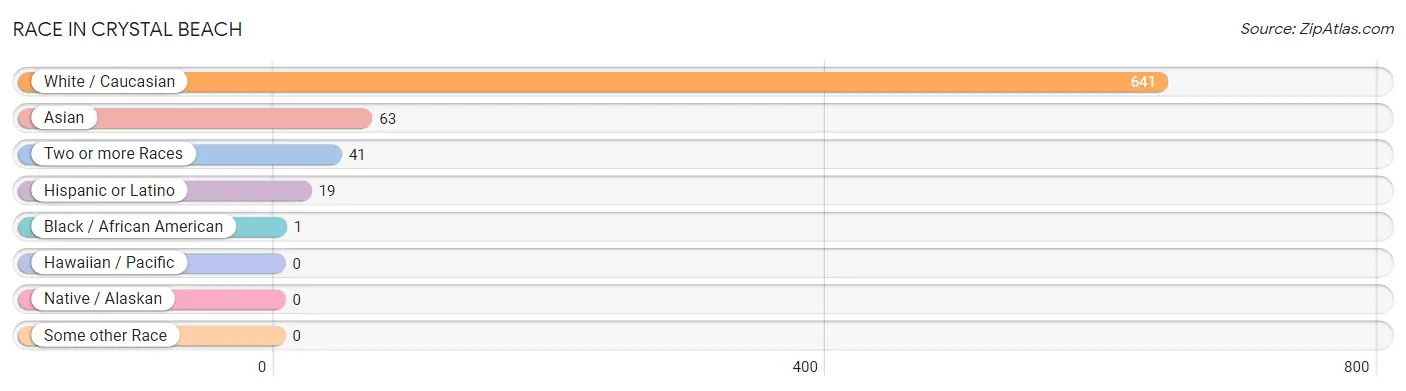
| Race | # Population | % Population |
| Asian | 63 | 8.5% |
| Black / African American | 1 | 0.1% |
| Hawaiian / Pacific | 0 | 0.0% |
| Hispanic or Latino | 19 | 2.5% |
| Native / Alaskan | 0 | 0.0% |
| White / Caucasian | 641 | 85.9% |
| Two or more Races | 41 | 5.5% |
| Some other Race | 0 | 0.0% |
| Total | 746 | 100.0% |
Ancestry in Crystal Beach
The most populous ancestries reported in Crystal Beach are German (162 | 21.7%), English (158 | 21.2%), Irish (114 | 15.3%), Northern European (87 | 11.7%), and Italian (75 | 10.1%), together accounting for 79.9% of all Crystal Beach residents.
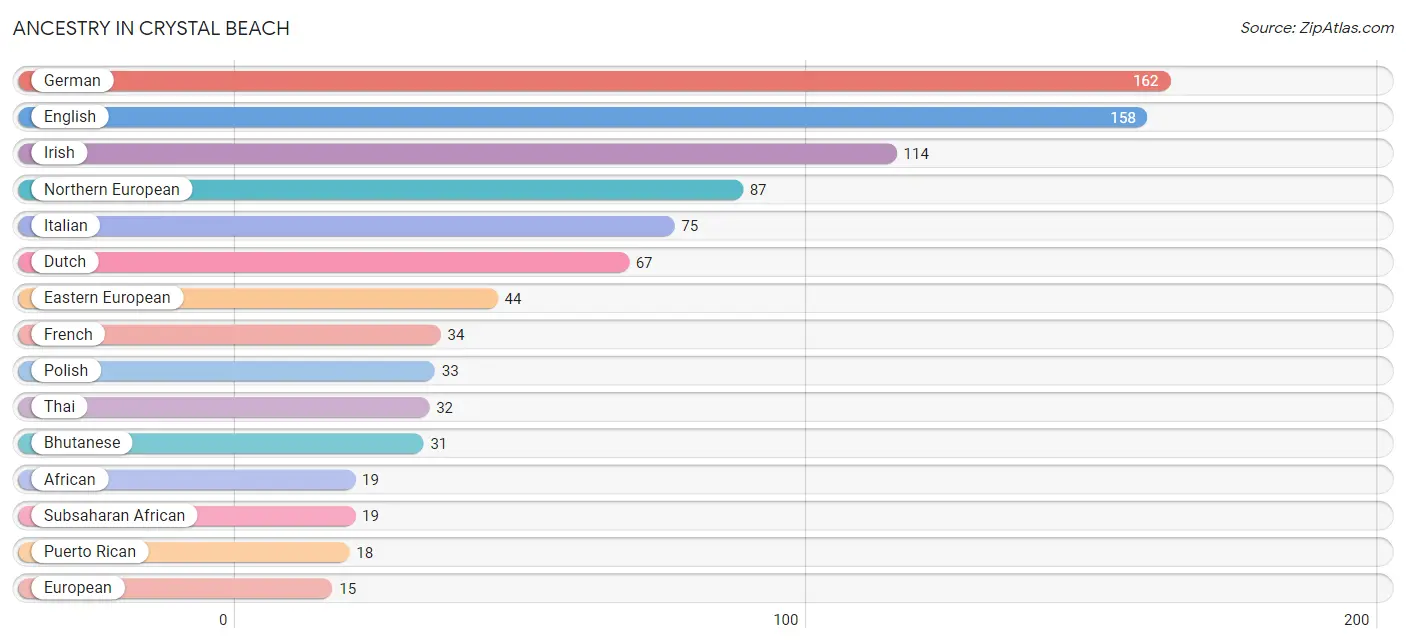
| Ancestry | # Population | % Population |
| African | 19 | 2.5% |
| Bhutanese | 31 | 4.2% |
| British | 9 | 1.2% |
| Croatian | 8 | 1.1% |
| Dutch | 67 | 9.0% |
| Eastern European | 44 | 5.9% |
| English | 158 | 21.2% |
| European | 15 | 2.0% |
| French | 34 | 4.6% |
| French Canadian | 9 | 1.2% |
| German | 162 | 21.7% |
| Irish | 114 | 15.3% |
| Italian | 75 | 10.1% |
| Northern European | 87 | 11.7% |
| Polish | 33 | 4.4% |
| Puerto Rican | 18 | 2.4% |
| Subsaharan African | 19 | 2.5% |
| Swedish | 10 | 1.3% |
| Thai | 32 | 4.3% |
| Ukrainian | 9 | 1.2% | View All 20 Rows |
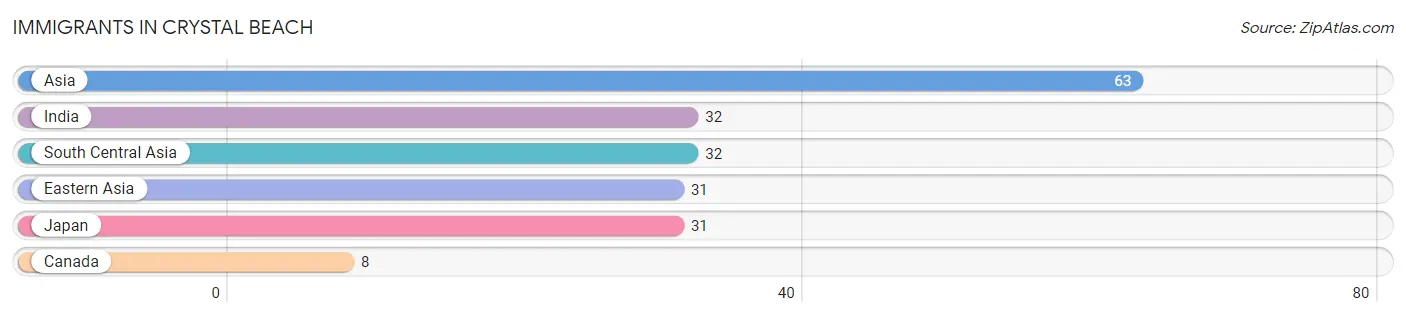
Immigrants in Crystal Beach
The most numerous immigrant groups reported in Crystal Beach came from Asia (63 | 8.5%), India (32 | 4.3%), South Central Asia (32 | 4.3%), Eastern Asia (31 | 4.2%), and Japan (31 | 4.2%), together accounting for 25.4% of all Crystal Beach residents.
| Immigration Origin | # Population | % Population |
| Asia | 63 | 8.5% |
| Canada | 8 | 1.1% |
| Eastern Asia | 31 | 4.2% |
| India | 32 | 4.3% |
| Japan | 31 | 4.2% |
| South Central Asia | 32 | 4.3% | View All 6 Rows |
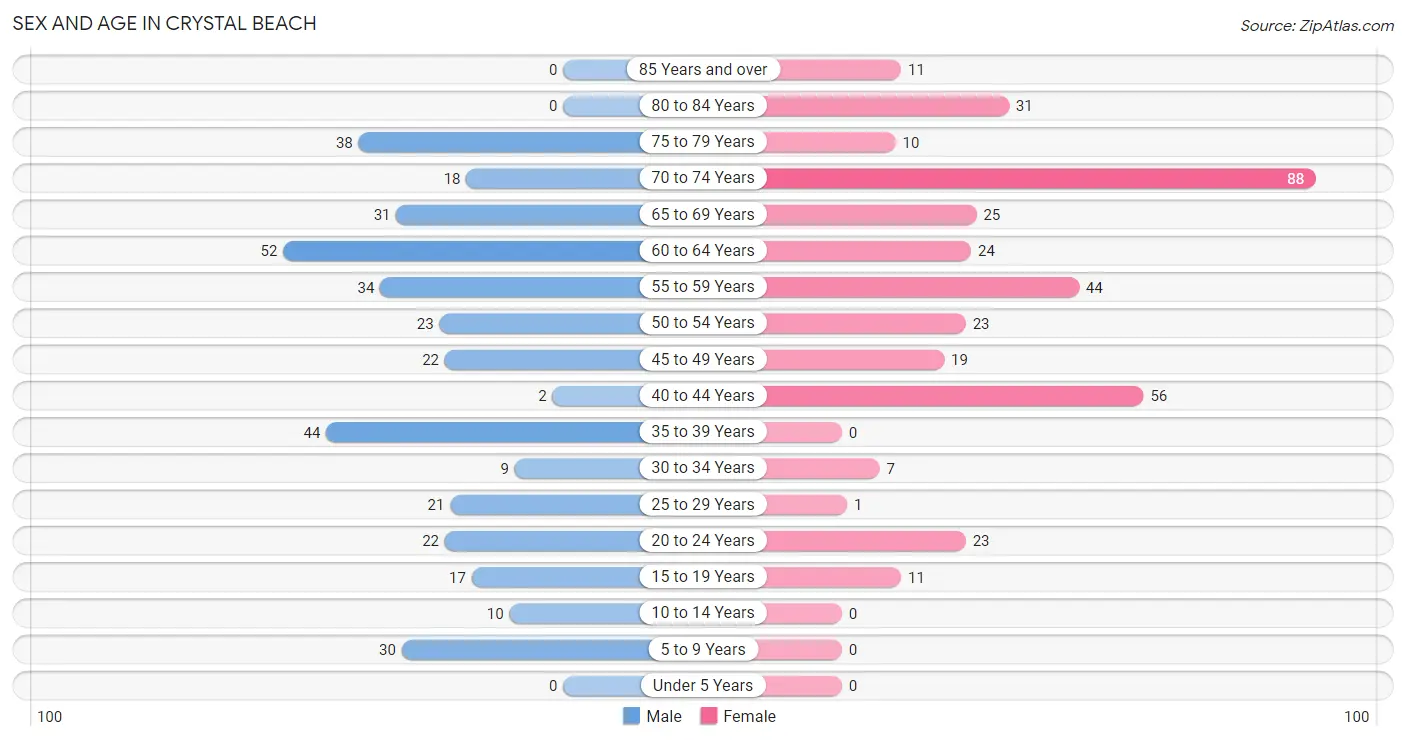
Sex and Age in Crystal Beach
Sex and Age in Crystal Beach
The most populous age groups in Crystal Beach are 60 to 64 Years (52 | 13.9%) for men and 70 to 74 Years (88 | 23.6%) for women.
| Age Bracket | Male | Female |
| Under 5 Years | 0 (0.0%) | 0 (0.0%) |
| 5 to 9 Years | 30 (8.0%) | 0 (0.0%) |
| 10 to 14 Years | 10 (2.7%) | 0 (0.0%) |
| 15 to 19 Years | 17 (4.6%) | 11 (2.9%) |
| 20 to 24 Years | 22 (5.9%) | 23 (6.2%) |
| 25 to 29 Years | 21 (5.6%) | 1 (0.3%) |
| 30 to 34 Years | 9 (2.4%) | 7 (1.9%) |
| 35 to 39 Years | 44 (11.8%) | 0 (0.0%) |
| 40 to 44 Years | 2 (0.5%) | 56 (15.0%) |
| 45 to 49 Years | 22 (5.9%) | 19 (5.1%) |
| 50 to 54 Years | 23 (6.2%) | 23 (6.2%) |
| 55 to 59 Years | 34 (9.1%) | 44 (11.8%) |
| 60 to 64 Years | 52 (13.9%) | 24 (6.4%) |
| 65 to 69 Years | 31 (8.3%) | 25 (6.7%) |
| 70 to 74 Years | 18 (4.8%) | 88 (23.6%) |
| 75 to 79 Years | 38 (10.2%) | 10 (2.7%) |
| 80 to 84 Years | 0 (0.0%) | 31 (8.3%) |
| 85 Years and over | 0 (0.0%) | 11 (2.9%) |
| Total | 373 (100.0%) | 373 (100.0%) |
Families and Households in Crystal Beach
Median Family Size in Crystal Beach
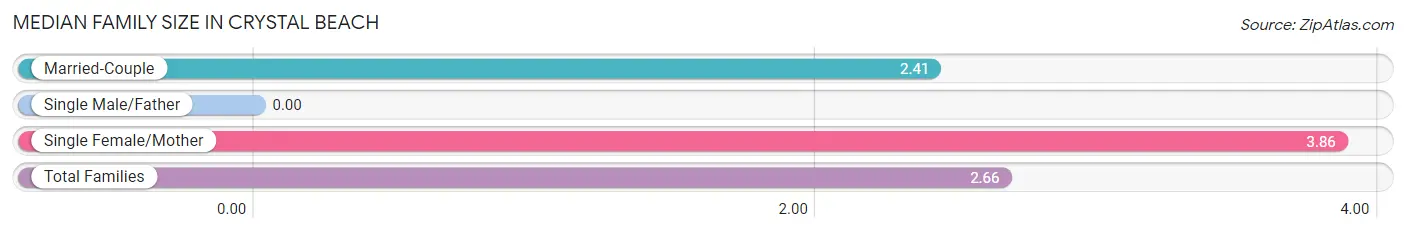
| Family Type | # Families | Family Size |
| Married-Couple | 171 (83.0%) | 2.41 |
| Single Male/Father | 0 (0.0%) | - |
| Single Female/Mother | 35 (17.0%) | 3.86 |
| Total Families | 206 (100.0%) | 2.66 |
Median Household Size in Crystal Beach
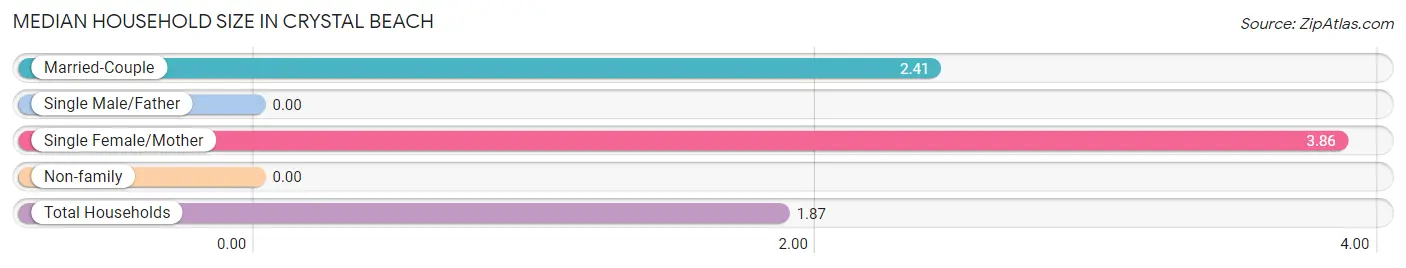
| Household Type | # Households | Household Size |
| Married-Couple | 171 (43.4%) | 2.41 |
| Single Male/Father | 0 (0.0%) | - |
| Single Female/Mother | 35 (8.9%) | 3.86 |
| Non-family | 188 (47.7%) | - |
| Total Households | 394 (100.0%) | 1.87 |
Household Size by Marriage Status in Crystal Beach
Out of a total of 394 households in Crystal Beach, 206 (52.3%) are family households, while 188 (47.7%) are nonfamily households. The most numerous type of family households are 2-person households, comprising 137, and the most common type of nonfamily households are 1-person households, comprising 188.
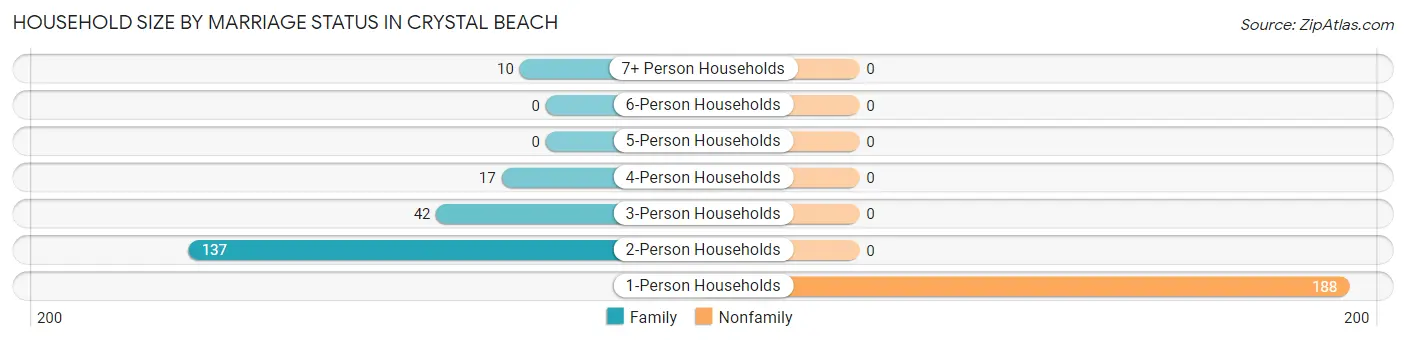
| Household Size | Family Households | Nonfamily Households |
| 1-Person Households | - | 188 (47.7%) |
| 2-Person Households | 137 (34.8%) | 0 (0.0%) |
| 3-Person Households | 42 (10.7%) | 0 (0.0%) |
| 4-Person Households | 17 (4.3%) | 0 (0.0%) |
| 5-Person Households | 0 (0.0%) | 0 (0.0%) |
| 6-Person Households | 0 (0.0%) | 0 (0.0%) |
| 7+ Person Households | 10 (2.5%) | 0 (0.0%) |
| Total | 206 (52.3%) | 188 (47.7%) |
Female Fertility in Crystal Beach
Fertility by Age in Crystal Beach
| Age Bracket | Women with Births | Births / 1,000 Women |
| 15 to 19 years | 0 (0.0%) | 0.0 |
| 20 to 34 years | 0 (0.0%) | 0.0 |
| 35 to 50 years | 0 (0.0%) | 0.0 |
| Total | 0 (0.0%) | 0.0 |
Fertility by Age by Marriage Status in Crystal Beach
| Age Bracket | Married | Unmarried |
| 15 to 19 years | 0 (0.0%) | 0 (0.0%) |
| 20 to 34 years | 0 (0.0%) | 0 (0.0%) |
| 35 to 50 years | 0 (0.0%) | 0 (0.0%) |
| Total | 0 (0.0%) | 0 (0.0%) |
Fertility by Education in Crystal Beach
| Educational Attainment | Women with Births | Births / 1,000 Women |
| Less than High School | 0 (0.0%) | 0.0 |
| High School Diploma | 0 (0.0%) | 0.0 |
| College or Associate's Degree | 0 (0.0%) | 0.0 |
| Bachelor's Degree | 0 (0.0%) | 0.0 |
| Graduate Degree | 0 (0.0%) | 0.0 |
| Total | 0 (0.0%) | 0.0 |
Fertility by Education by Marriage Status in Crystal Beach
| Educational Attainment | Married | Unmarried |
| Less than High School | 0 (0.0%) | 0 (0.0%) |
| High School Diploma | 0 (0.0%) | 0 (0.0%) |
| College or Associate's Degree | 0 (0.0%) | 0 (0.0%) |
| Bachelor's Degree | 0 (0.0%) | 0 (0.0%) |
| Graduate Degree | 0 (0.0%) | 0 (0.0%) |
| Total | 0 (0.0%) | 0 (0.0%) |
Employment Characteristics in Crystal Beach
Employment by Class of Employer in Crystal Beach
Among the 357 employed individuals in Crystal Beach, private company employees (253 | 70.9%), not-for-profit organizations (39 | 10.9%), and local government employees (34 | 9.5%) make up the most common classes of employment.
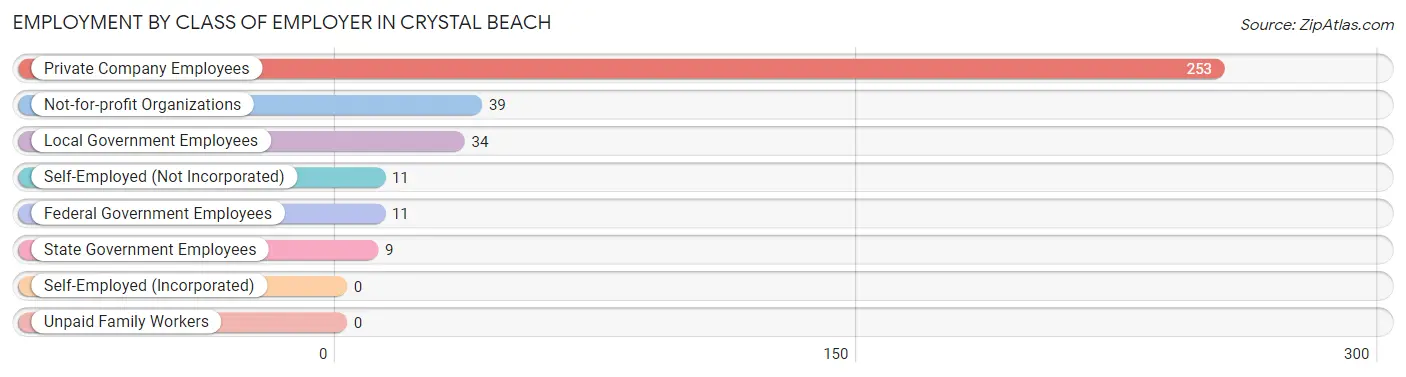
| Employer Class | # Employees | % Employees |
| Private Company Employees | 253 | 70.9% |
| Self-Employed (Incorporated) | 0 | 0.0% |
| Self-Employed (Not Incorporated) | 11 | 3.1% |
| Not-for-profit Organizations | 39 | 10.9% |
| Local Government Employees | 34 | 9.5% |
| State Government Employees | 9 | 2.5% |
| Federal Government Employees | 11 | 3.1% |
| Unpaid Family Workers | 0 | 0.0% |
| Total | 357 | 100.0% |
Employment Status by Age in Crystal Beach
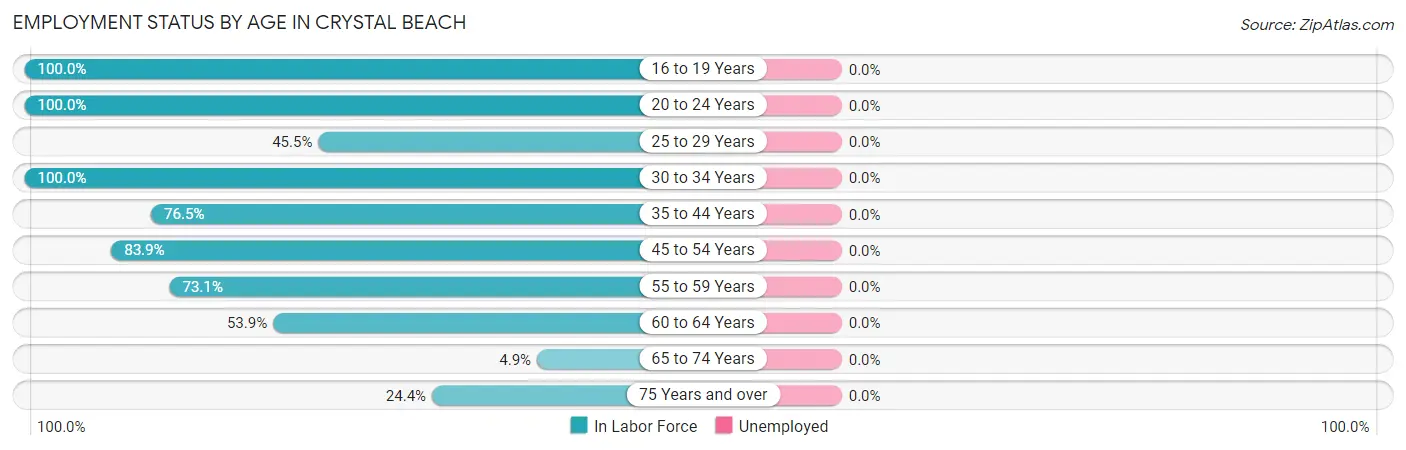
| Age Bracket | In Labor Force | Unemployed |
| 16 to 19 Years | 28 (100.0%) | 0 (0.0%) |
| 20 to 24 Years | 45 (100.0%) | 0 (0.0%) |
| 25 to 29 Years | 10 (45.5%) | 0 (0.0%) |
| 30 to 34 Years | 16 (100.0%) | 0 (0.0%) |
| 35 to 44 Years | 78 (76.5%) | 0 (0.0%) |
| 45 to 54 Years | 73 (83.9%) | 0 (0.0%) |
| 55 to 59 Years | 57 (73.1%) | 0 (0.0%) |
| 60 to 64 Years | 41 (53.9%) | 0 (0.0%) |
| 65 to 74 Years | 8 (4.9%) | 0 (0.0%) |
| 75 Years and over | 22 (24.4%) | 0 (0.0%) |
| Total | 378 (53.5%) | 0 (0.0%) |
Employment Status by Educational Attainment in Crystal Beach
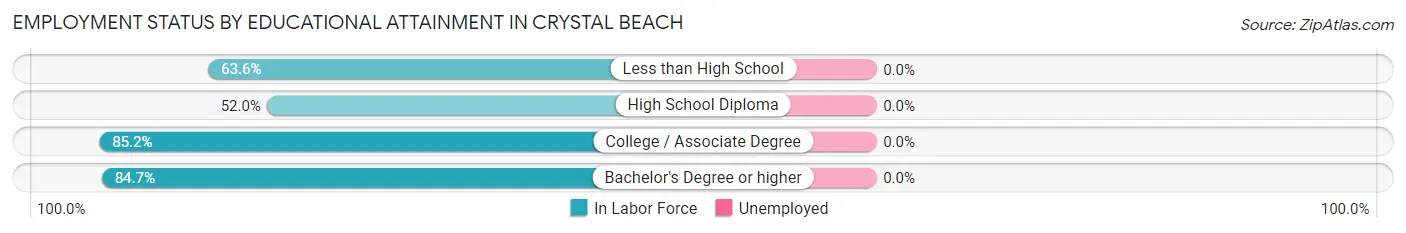
| Educational Attainment | In Labor Force | Unemployed |
| Less than High School | 21 (63.6%) | 0 (0.0%) |
| High School Diploma | 66 (52.0%) | 0 (0.0%) |
| College / Associate Degree | 127 (85.2%) | 0 (0.0%) |
| Bachelor's Degree or higher | 61 (84.7%) | 0 (0.0%) |
| Total | 275 (72.2%) | 0 (0.0%) |
Employment Occupations by Sex in Crystal Beach
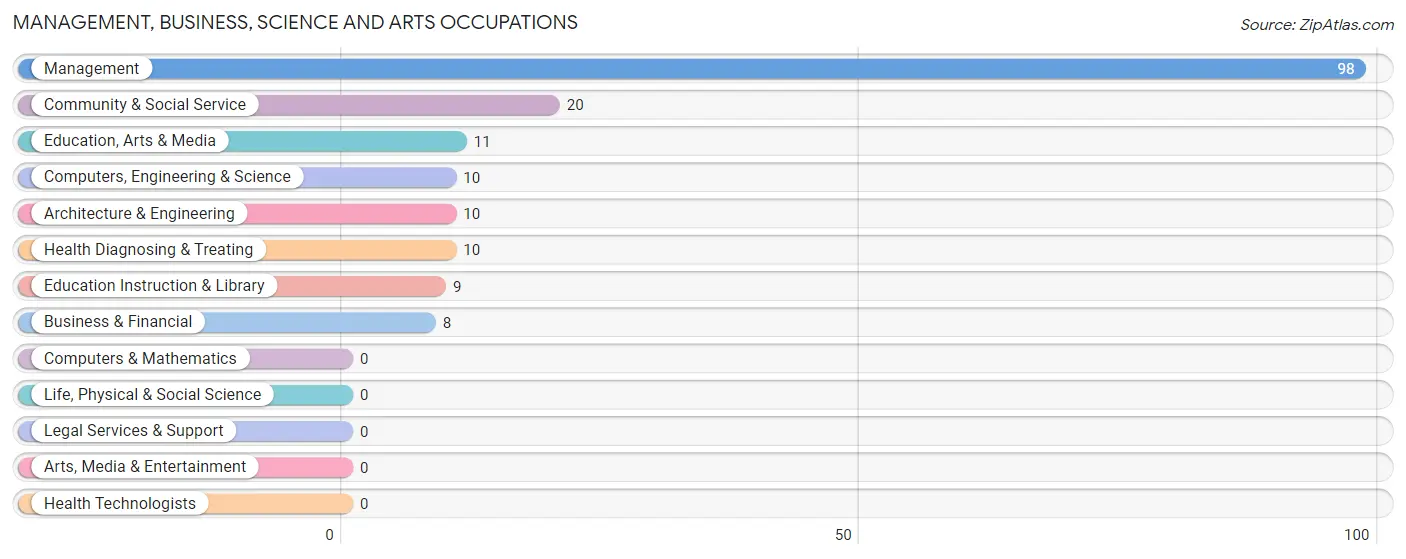
Management, Business, Science and Arts Occupations
The most common Management, Business, Science and Arts occupations in Crystal Beach are Management (98 | 25.9%), Community & Social Service (20 | 5.3%), Education, Arts & Media (11 | 2.9%), Computers, Engineering & Science (10 | 2.6%), and Architecture & Engineering (10 | 2.6%).
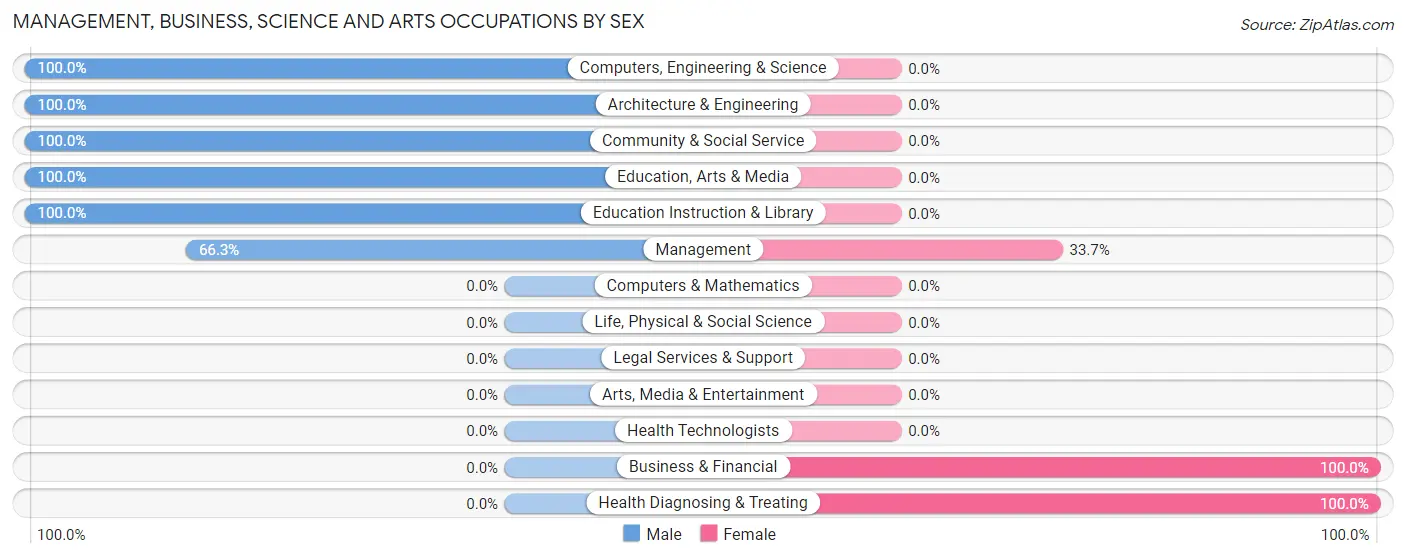
Management, Business, Science and Arts Occupations by Sex
Within the Management, Business, Science and Arts occupations in Crystal Beach, the most male-oriented occupations are Computers, Engineering & Science (100.0%), Architecture & Engineering (100.0%), and Community & Social Service (100.0%), while the most female-oriented occupations are Business & Financial (100.0%), Health Diagnosing & Treating (100.0%), and Management (33.7%).
| Occupation | Male | Female |
| Management | 65 (66.3%) | 33 (33.7%) |
| Business & Financial | 0 (0.0%) | 8 (100.0%) |
| Computers, Engineering & Science | 10 (100.0%) | 0 (0.0%) |
| Computers & Mathematics | 0 (0.0%) | 0 (0.0%) |
| Architecture & Engineering | 10 (100.0%) | 0 (0.0%) |
| Life, Physical & Social Science | 0 (0.0%) | 0 (0.0%) |
| Community & Social Service | 20 (100.0%) | 0 (0.0%) |
| Education, Arts & Media | 11 (100.0%) | 0 (0.0%) |
| Legal Services & Support | 0 (0.0%) | 0 (0.0%) |
| Education Instruction & Library | 9 (100.0%) | 0 (0.0%) |
| Arts, Media & Entertainment | 0 (0.0%) | 0 (0.0%) |
| Health Diagnosing & Treating | 0 (0.0%) | 10 (100.0%) |
| Health Technologists | 0 (0.0%) | 0 (0.0%) |
| Total (Category) | 95 (65.1%) | 51 (34.9%) |
| Total (Overall) | 218 (57.7%) | 160 (42.3%) |
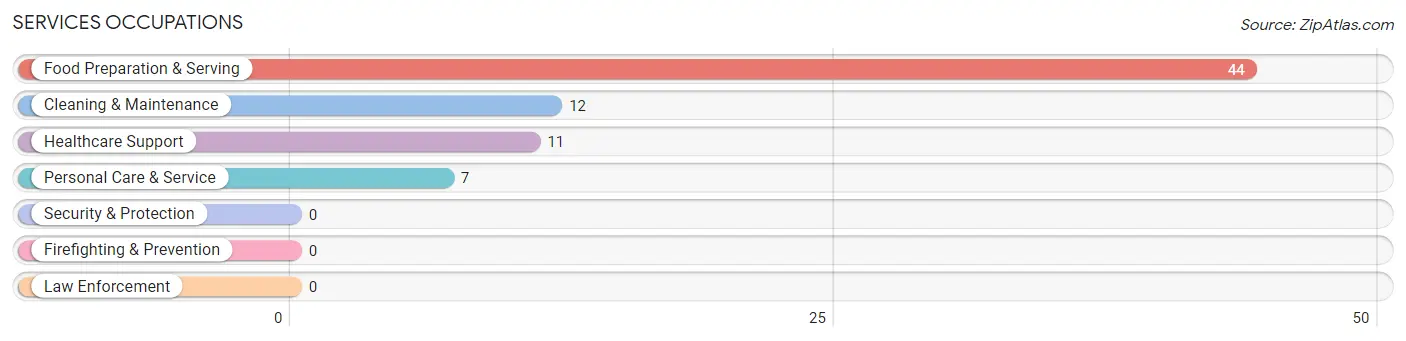
Services Occupations
The most common Services occupations in Crystal Beach are Food Preparation & Serving (44 | 11.6%), Cleaning & Maintenance (12 | 3.2%), Healthcare Support (11 | 2.9%), and Personal Care & Service (7 | 1.8%).
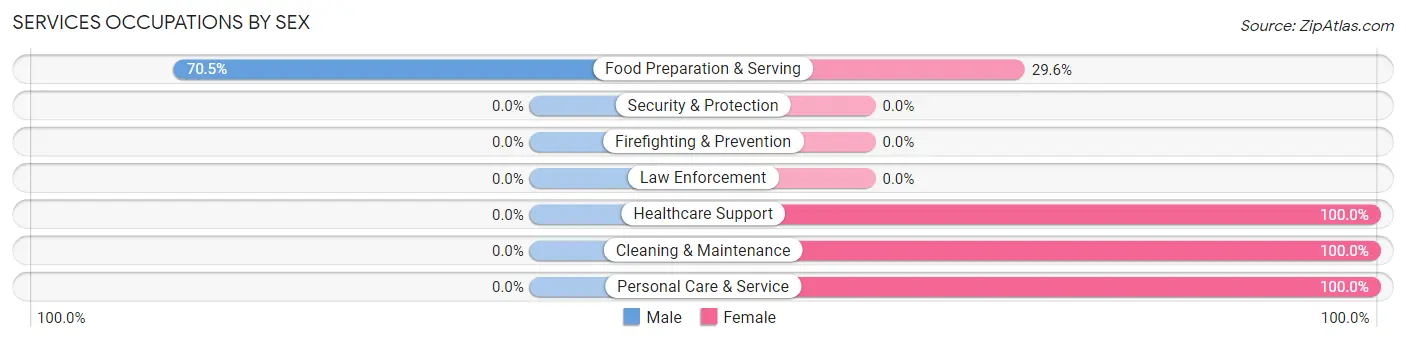
Services Occupations by Sex
| Occupation | Male | Female |
| Healthcare Support | 0 (0.0%) | 11 (100.0%) |
| Security & Protection | 0 (0.0%) | 0 (0.0%) |
| Firefighting & Prevention | 0 (0.0%) | 0 (0.0%) |
| Law Enforcement | 0 (0.0%) | 0 (0.0%) |
| Food Preparation & Serving | 31 (70.5%) | 13 (29.5%) |
| Cleaning & Maintenance | 0 (0.0%) | 12 (100.0%) |
| Personal Care & Service | 0 (0.0%) | 7 (100.0%) |
| Total (Category) | 31 (41.9%) | 43 (58.1%) |
| Total (Overall) | 218 (57.7%) | 160 (42.3%) |
Sales and Office Occupations
The most common Sales and Office occupations in Crystal Beach are Office & Administration (47 | 12.4%), and Sales & Related (28 | 7.4%).
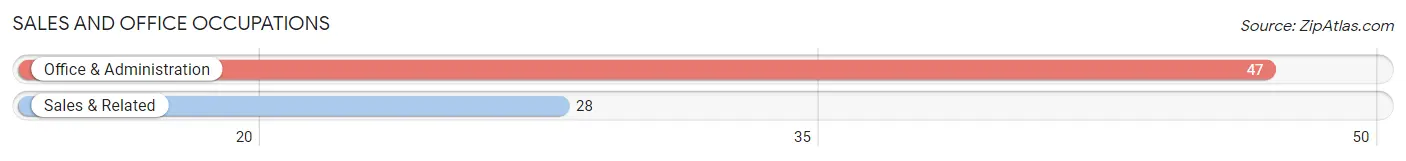
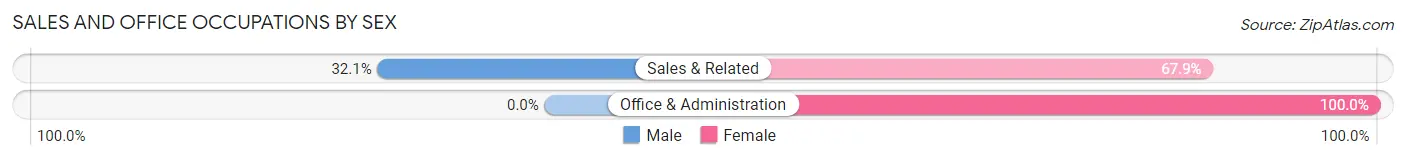
Sales and Office Occupations by Sex
| Occupation | Male | Female |
| Sales & Related | 9 (32.1%) | 19 (67.9%) |
| Office & Administration | 0 (0.0%) | 47 (100.0%) |
| Total (Category) | 9 (12.0%) | 66 (88.0%) |
| Total (Overall) | 218 (57.7%) | 160 (42.3%) |
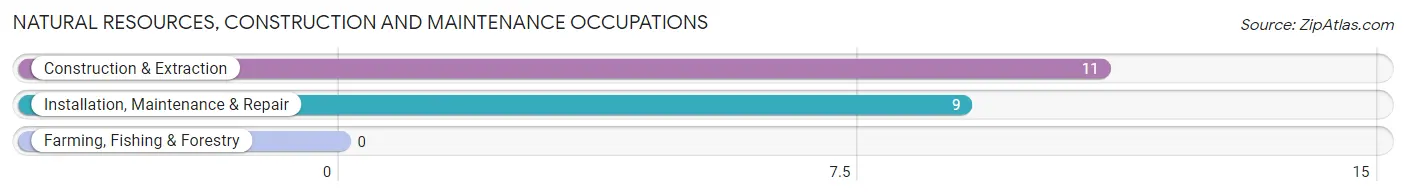
Natural Resources, Construction and Maintenance Occupations
The most common Natural Resources, Construction and Maintenance occupations in Crystal Beach are Construction & Extraction (11 | 2.9%), and Installation, Maintenance & Repair (9 | 2.4%).
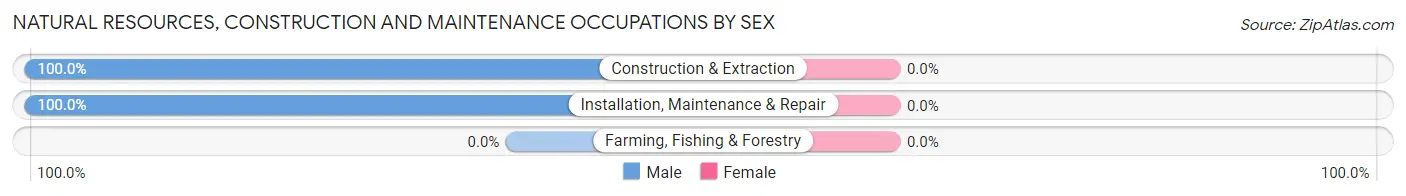
Natural Resources, Construction and Maintenance Occupations by Sex
| Occupation | Male | Female |
| Farming, Fishing & Forestry | 0 (0.0%) | 0 (0.0%) |
| Construction & Extraction | 11 (100.0%) | 0 (0.0%) |
| Installation, Maintenance & Repair | 9 (100.0%) | 0 (0.0%) |
| Total (Category) | 20 (100.0%) | 0 (0.0%) |
| Total (Overall) | 218 (57.7%) | 160 (42.3%) |
Production, Transportation and Moving Occupations
The most common Production, Transportation and Moving occupations in Crystal Beach are Transportation (45 | 11.9%), and Material Moving (18 | 4.8%).
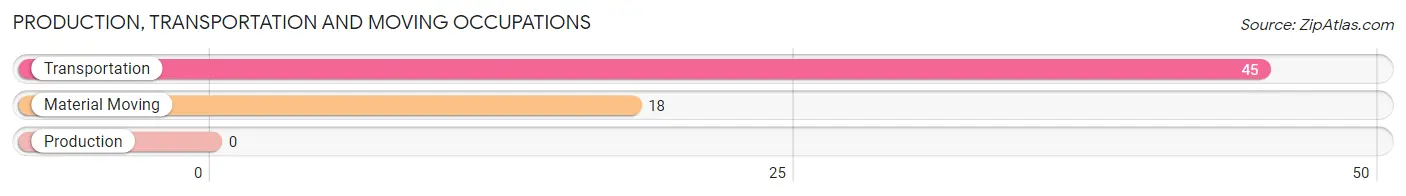
Production, Transportation and Moving Occupations by Sex
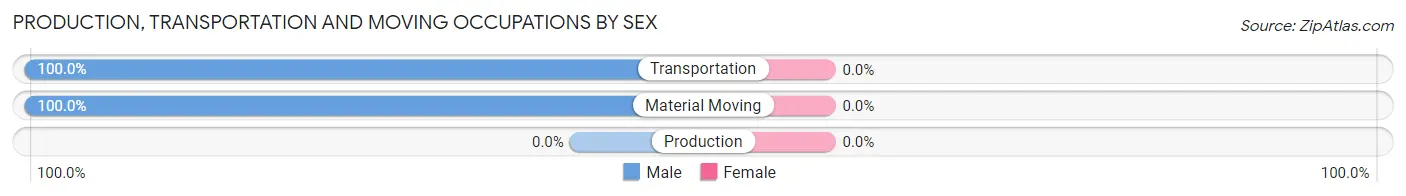
| Occupation | Male | Female |
| Production | 0 (0.0%) | 0 (0.0%) |
| Transportation | 45 (100.0%) | 0 (0.0%) |
| Material Moving | 18 (100.0%) | 0 (0.0%) |
| Total (Category) | 63 (100.0%) | 0 (0.0%) |
| Total (Overall) | 218 (57.7%) | 160 (42.3%) |
Employment Industries by Sex in Crystal Beach
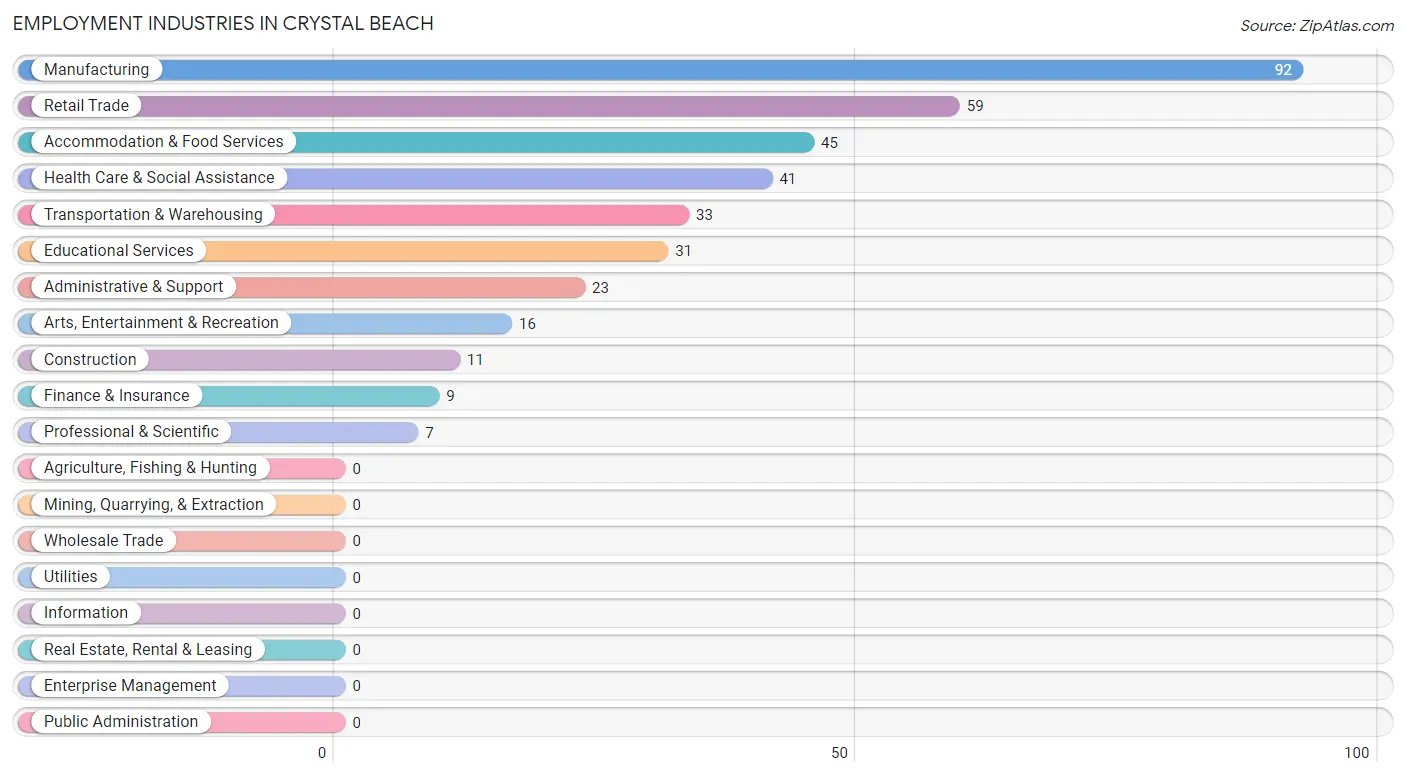
Employment Industries in Crystal Beach
The major employment industries in Crystal Beach include Manufacturing (92 | 24.3%), Retail Trade (59 | 15.6%), Accommodation & Food Services (45 | 11.9%), Health Care & Social Assistance (41 | 10.8%), and Transportation & Warehousing (33 | 8.7%).
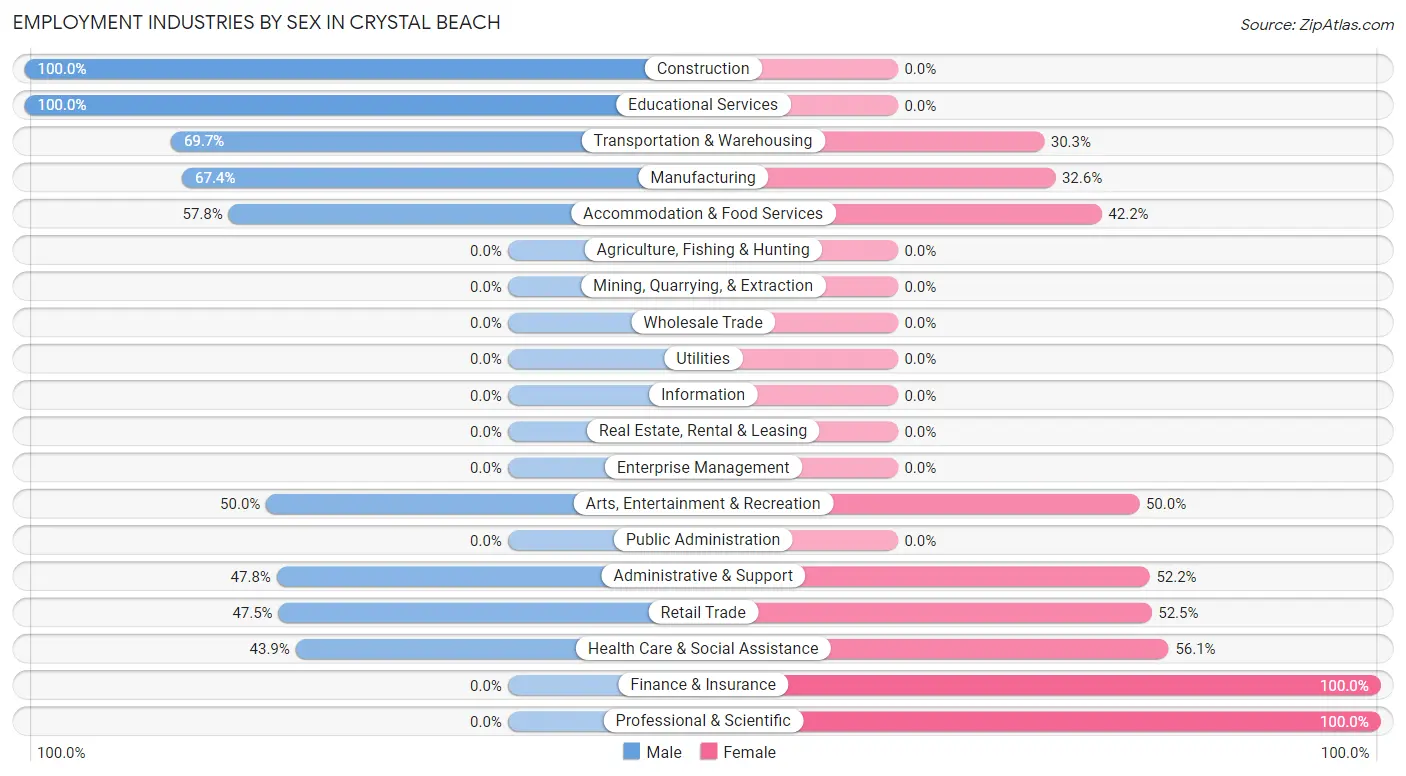
Employment Industries by Sex in Crystal Beach
The Crystal Beach industries that see more men than women are Construction (100.0%), Educational Services (100.0%), and Transportation & Warehousing (69.7%), whereas the industries that tend to have a higher number of women are Finance & Insurance (100.0%), Professional & Scientific (100.0%), and Health Care & Social Assistance (56.1%).
| Industry | Male | Female |
| Agriculture, Fishing & Hunting | 0 (0.0%) | 0 (0.0%) |
| Mining, Quarrying, & Extraction | 0 (0.0%) | 0 (0.0%) |
| Construction | 11 (100.0%) | 0 (0.0%) |
| Manufacturing | 62 (67.4%) | 30 (32.6%) |
| Wholesale Trade | 0 (0.0%) | 0 (0.0%) |
| Retail Trade | 28 (47.5%) | 31 (52.5%) |
| Transportation & Warehousing | 23 (69.7%) | 10 (30.3%) |
| Utilities | 0 (0.0%) | 0 (0.0%) |
| Information | 0 (0.0%) | 0 (0.0%) |
| Finance & Insurance | 0 (0.0%) | 9 (100.0%) |
| Real Estate, Rental & Leasing | 0 (0.0%) | 0 (0.0%) |
| Professional & Scientific | 0 (0.0%) | 7 (100.0%) |
| Enterprise Management | 0 (0.0%) | 0 (0.0%) |
| Administrative & Support | 11 (47.8%) | 12 (52.2%) |
| Educational Services | 31 (100.0%) | 0 (0.0%) |
| Health Care & Social Assistance | 18 (43.9%) | 23 (56.1%) |
| Arts, Entertainment & Recreation | 8 (50.0%) | 8 (50.0%) |
| Accommodation & Food Services | 26 (57.8%) | 19 (42.2%) |
| Public Administration | 0 (0.0%) | 0 (0.0%) |
| Total | 218 (57.7%) | 160 (42.3%) |
Education in Crystal Beach
School Enrollment in Crystal Beach
The most common levels of schooling among the 80 students in Crystal Beach are college / undergraduate (32 | 40.0%), elementary school (30 | 37.5%), and middle school (10 | 12.5%).
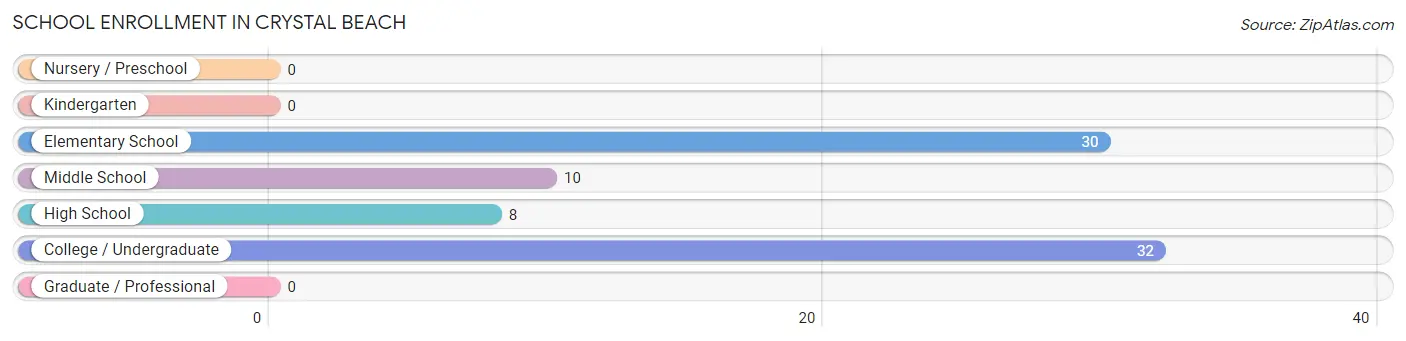
| School Level | # Students | % Students |
| Nursery / Preschool | 0 | 0.0% |
| Kindergarten | 0 | 0.0% |
| Elementary School | 30 | 37.5% |
| Middle School | 10 | 12.5% |
| High School | 8 | 10.0% |
| College / Undergraduate | 32 | 40.0% |
| Graduate / Professional | 0 | 0.0% |
| Total | 80 | 100.0% |
School Enrollment by Age by Funding Source in Crystal Beach
Out of a total of 80 students who are enrolled in schools in Crystal Beach, 22 (27.5%) attend a private institution, while the remaining 58 (72.5%) are enrolled in public schools. The age group of 18 to 19 year olds has the highest likelihood of being enrolled in private schools, with 11 (57.9% in the age bracket) enrolled. Conversely, the age group of 10 to 14 year olds has the lowest likelihood of being enrolled in a private school, with 10 (100.0% in the age bracket) attending a public institution.
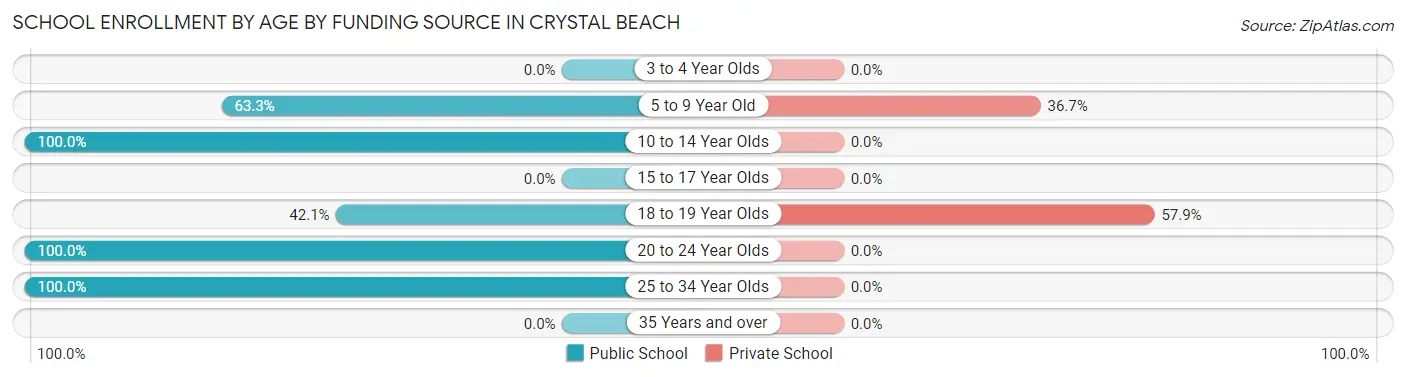
| Age Bracket | Public School | Private School |
| 3 to 4 Year Olds | 0 (0.0%) | 0 (0.0%) |
| 5 to 9 Year Old | 19 (63.3%) | 11 (36.7%) |
| 10 to 14 Year Olds | 10 (100.0%) | 0 (0.0%) |
| 15 to 17 Year Olds | 0 (0.0%) | 0 (0.0%) |
| 18 to 19 Year Olds | 8 (42.1%) | 11 (57.9%) |
| 20 to 24 Year Olds | 10 (100.0%) | 0 (0.0%) |
| 25 to 34 Year Olds | 11 (100.0%) | 0 (0.0%) |
| 35 Years and over | 0 (0.0%) | 0 (0.0%) |
| Total | 58 (72.5%) | 22 (27.5%) |
Educational Attainment by Field of Study in Crystal Beach
Engineering (21 | 17.9%), education (19 | 16.2%), bio, nature & agricultural (18 | 15.4%), psychology (17 | 14.5%), and liberal arts & history (12 | 10.3%) are the most common fields of study among 117 individuals in Crystal Beach who have obtained a bachelor's degree or higher.
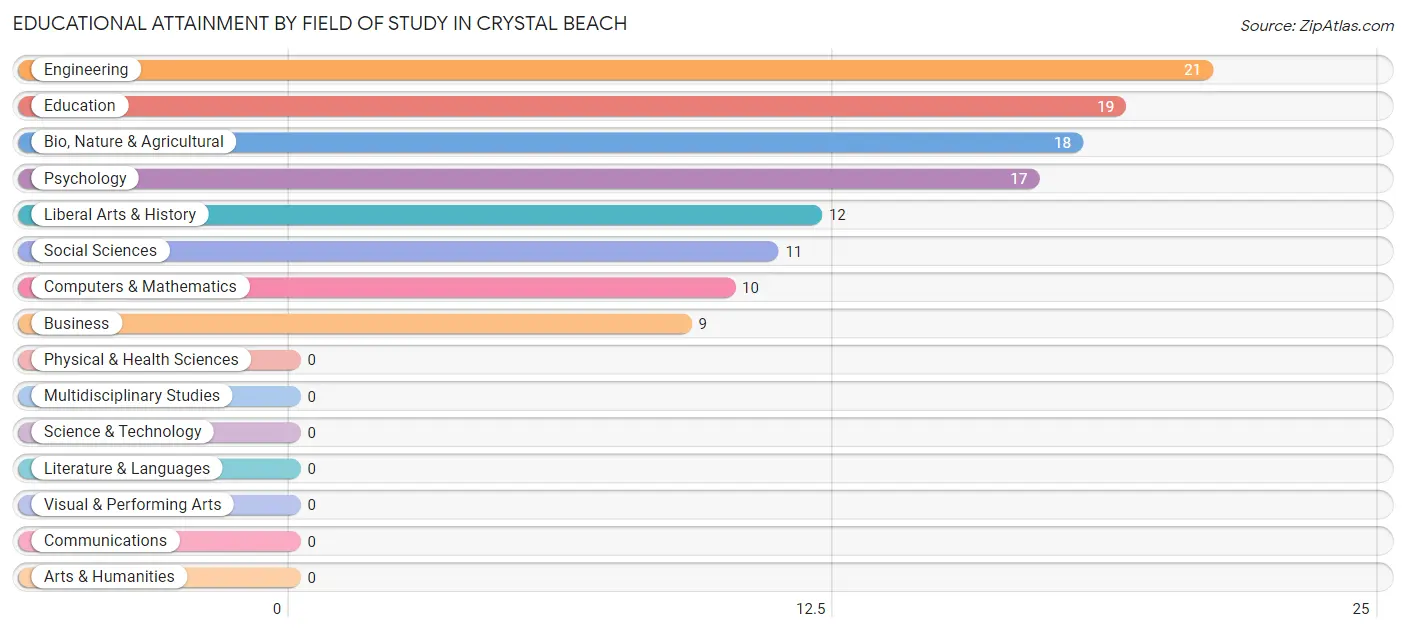
| Field of Study | # Graduates | % Graduates |
| Computers & Mathematics | 10 | 8.6% |
| Bio, Nature & Agricultural | 18 | 15.4% |
| Physical & Health Sciences | 0 | 0.0% |
| Psychology | 17 | 14.5% |
| Social Sciences | 11 | 9.4% |
| Engineering | 21 | 17.9% |
| Multidisciplinary Studies | 0 | 0.0% |
| Science & Technology | 0 | 0.0% |
| Business | 9 | 7.7% |
| Education | 19 | 16.2% |
| Literature & Languages | 0 | 0.0% |
| Liberal Arts & History | 12 | 10.3% |
| Visual & Performing Arts | 0 | 0.0% |
| Communications | 0 | 0.0% |
| Arts & Humanities | 0 | 0.0% |
| Total | 117 | 100.0% |
Transportation & Commute in Crystal Beach
Vehicle Availability by Sex in Crystal Beach
The most prevalent vehicle ownership categories in Crystal Beach are males with 1 vehicle (83, accounting for 38.1%) and females with 1 vehicle (44, making up 60.6%).
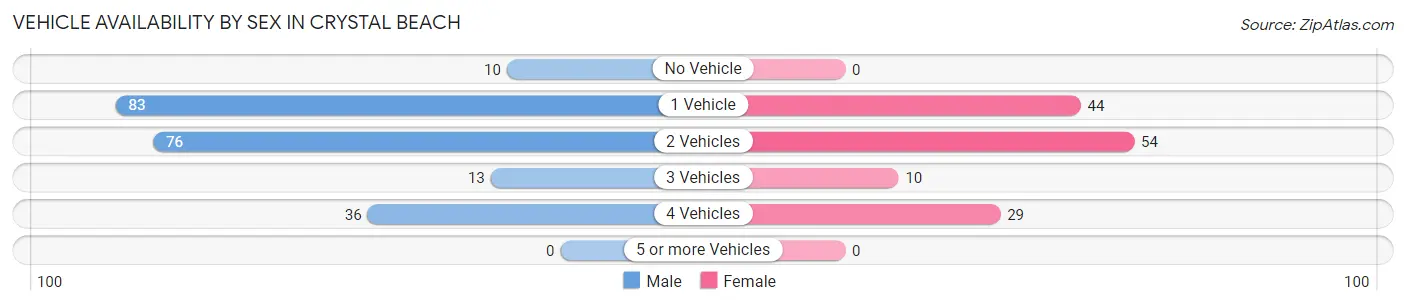
| Vehicles Available | Male | Female |
| No Vehicle | 10 (4.6%) | 0 (0.0%) |
| 1 Vehicle | 83 (38.1%) | 44 (32.1%) |
| 2 Vehicles | 76 (34.9%) | 54 (39.4%) |
| 3 Vehicles | 13 (6.0%) | 10 (7.3%) |
| 4 Vehicles | 36 (16.5%) | 29 (21.2%) |
| 5 or more Vehicles | 0 (0.0%) | 0 (0.0%) |
| Total | 218 (100.0%) | 137 (100.0%) |
Commute Time in Crystal Beach
The most frequently occuring commute durations in Crystal Beach are 15 to 19 minutes (77 commuters, 23.7%), 20 to 24 minutes (53 commuters, 16.3%), and 10 to 14 minutes (52 commuters, 16.0%).
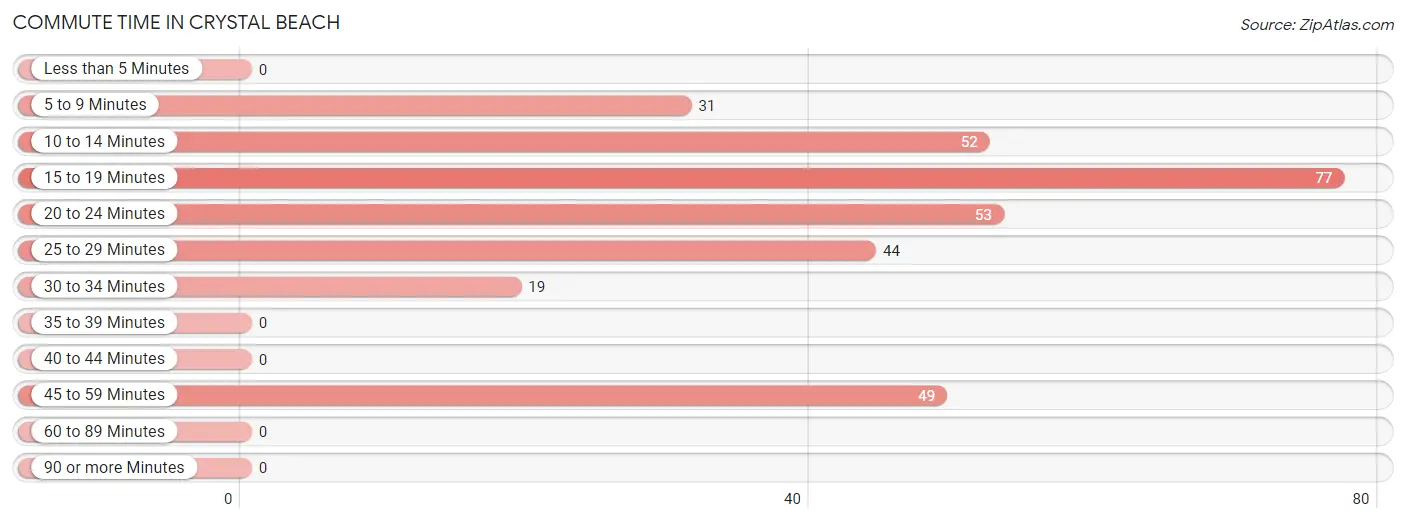
| Commute Time | # Commuters | % Commuters |
| Less than 5 Minutes | 0 | 0.0% |
| 5 to 9 Minutes | 31 | 9.5% |
| 10 to 14 Minutes | 52 | 16.0% |
| 15 to 19 Minutes | 77 | 23.7% |
| 20 to 24 Minutes | 53 | 16.3% |
| 25 to 29 Minutes | 44 | 13.5% |
| 30 to 34 Minutes | 19 | 5.9% |
| 35 to 39 Minutes | 0 | 0.0% |
| 40 to 44 Minutes | 0 | 0.0% |
| 45 to 59 Minutes | 49 | 15.1% |
| 60 to 89 Minutes | 0 | 0.0% |
| 90 or more Minutes | 0 | 0.0% |
Commute Time by Sex in Crystal Beach
The most common commute times in Crystal Beach are 15 to 19 minutes (55 commuters, 28.3%) for males and 20 to 24 minutes (25 commuters, 19.1%) for females.
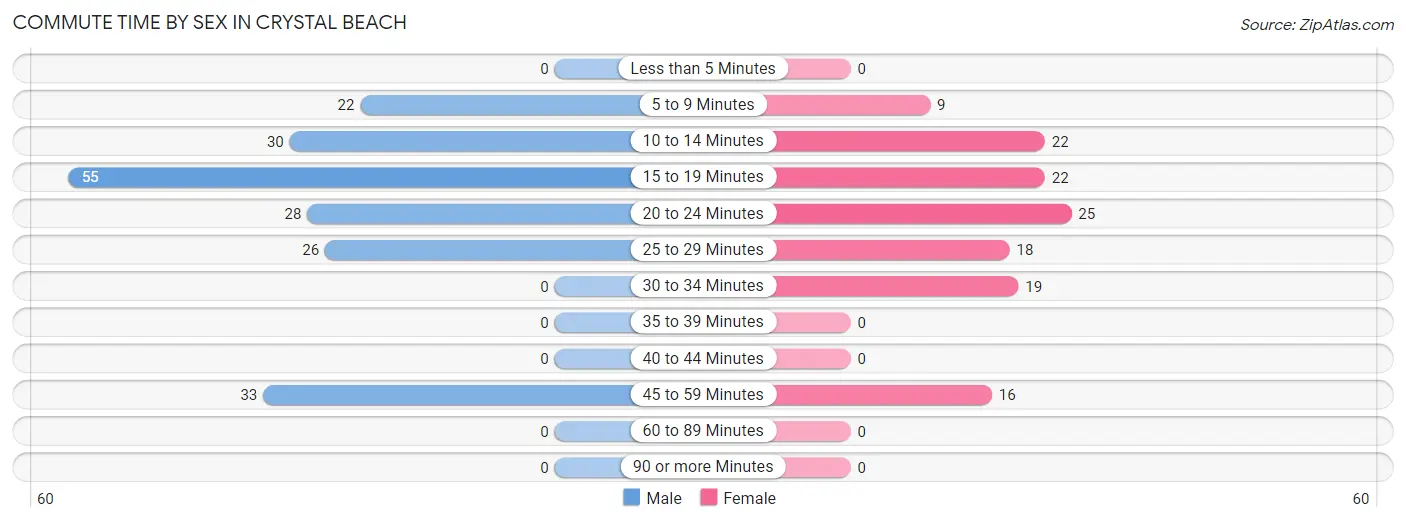
| Commute Time | Male | Female |
| Less than 5 Minutes | 0 (0.0%) | 0 (0.0%) |
| 5 to 9 Minutes | 22 (11.3%) | 9 (6.9%) |
| 10 to 14 Minutes | 30 (15.5%) | 22 (16.8%) |
| 15 to 19 Minutes | 55 (28.3%) | 22 (16.8%) |
| 20 to 24 Minutes | 28 (14.4%) | 25 (19.1%) |
| 25 to 29 Minutes | 26 (13.4%) | 18 (13.7%) |
| 30 to 34 Minutes | 0 (0.0%) | 19 (14.5%) |
| 35 to 39 Minutes | 0 (0.0%) | 0 (0.0%) |
| 40 to 44 Minutes | 0 (0.0%) | 0 (0.0%) |
| 45 to 59 Minutes | 33 (17.0%) | 16 (12.2%) |
| 60 to 89 Minutes | 0 (0.0%) | 0 (0.0%) |
| 90 or more Minutes | 0 (0.0%) | 0 (0.0%) |
Time of Departure to Work by Sex in Crystal Beach
The most frequent times of departure to work in Crystal Beach are 6:30 AM to 6:59 AM (53, 27.3%) for males and 7:30 AM to 7:59 AM (46, 35.1%) for females.
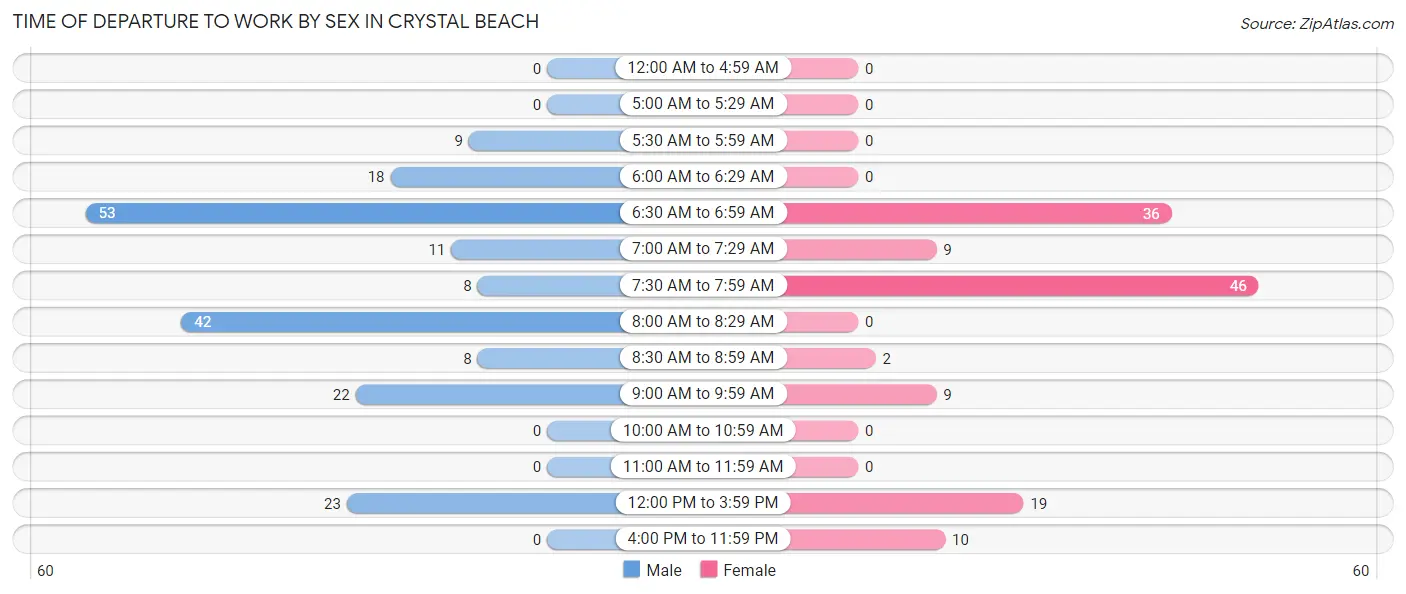
| Time of Departure | Male | Female |
| 12:00 AM to 4:59 AM | 0 (0.0%) | 0 (0.0%) |
| 5:00 AM to 5:29 AM | 0 (0.0%) | 0 (0.0%) |
| 5:30 AM to 5:59 AM | 9 (4.6%) | 0 (0.0%) |
| 6:00 AM to 6:29 AM | 18 (9.3%) | 0 (0.0%) |
| 6:30 AM to 6:59 AM | 53 (27.3%) | 36 (27.5%) |
| 7:00 AM to 7:29 AM | 11 (5.7%) | 9 (6.9%) |
| 7:30 AM to 7:59 AM | 8 (4.1%) | 46 (35.1%) |
| 8:00 AM to 8:29 AM | 42 (21.6%) | 0 (0.0%) |
| 8:30 AM to 8:59 AM | 8 (4.1%) | 2 (1.5%) |
| 9:00 AM to 9:59 AM | 22 (11.3%) | 9 (6.9%) |
| 10:00 AM to 10:59 AM | 0 (0.0%) | 0 (0.0%) |
| 11:00 AM to 11:59 AM | 0 (0.0%) | 0 (0.0%) |
| 12:00 PM to 3:59 PM | 23 (11.9%) | 19 (14.5%) |
| 4:00 PM to 11:59 PM | 0 (0.0%) | 10 (7.6%) |
| Total | 194 (100.0%) | 131 (100.0%) |
Housing Occupancy in Crystal Beach
Occupancy by Ownership in Crystal Beach
Of the total 394 dwellings in Crystal Beach, owner-occupied units account for 287 (72.8%), while renter-occupied units make up 107 (27.2%).
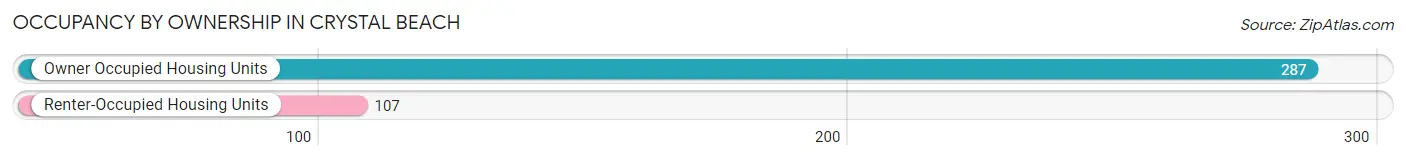
| Occupancy | # Housing Units | % Housing Units |
| Owner Occupied Housing Units | 287 | 72.8% |
| Renter-Occupied Housing Units | 107 | 27.2% |
| Total Occupied Housing Units | 394 | 100.0% |
Occupancy by Household Size in Crystal Beach
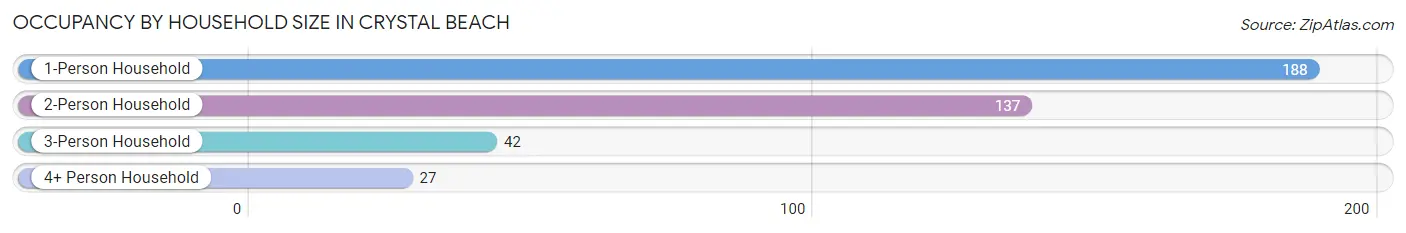
| Household Size | # Housing Units | % Housing Units |
| 1-Person Household | 188 | 47.7% |
| 2-Person Household | 137 | 34.8% |
| 3-Person Household | 42 | 10.7% |
| 4+ Person Household | 27 | 6.9% |
| Total Housing Units | 394 | 100.0% |
Occupancy by Ownership by Household Size in Crystal Beach
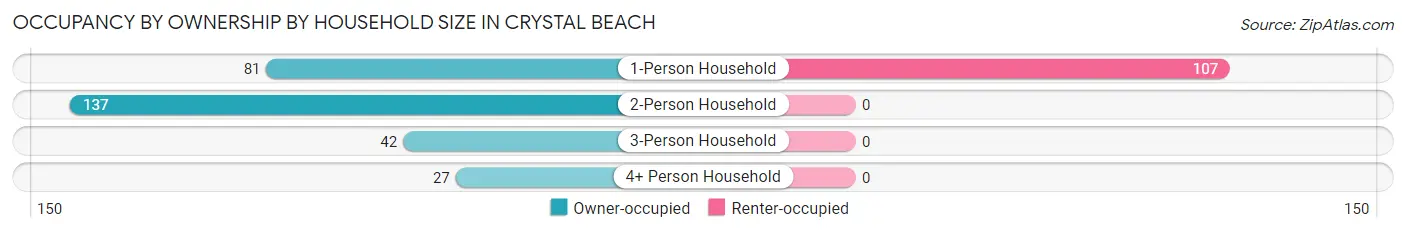
| Household Size | Owner-occupied | Renter-occupied |
| 1-Person Household | 81 (43.1%) | 107 (56.9%) |
| 2-Person Household | 137 (100.0%) | 0 (0.0%) |
| 3-Person Household | 42 (100.0%) | 0 (0.0%) |
| 4+ Person Household | 27 (100.0%) | 0 (0.0%) |
| Total Housing Units | 287 (72.8%) | 107 (27.2%) |
Occupancy by Educational Attainment in Crystal Beach
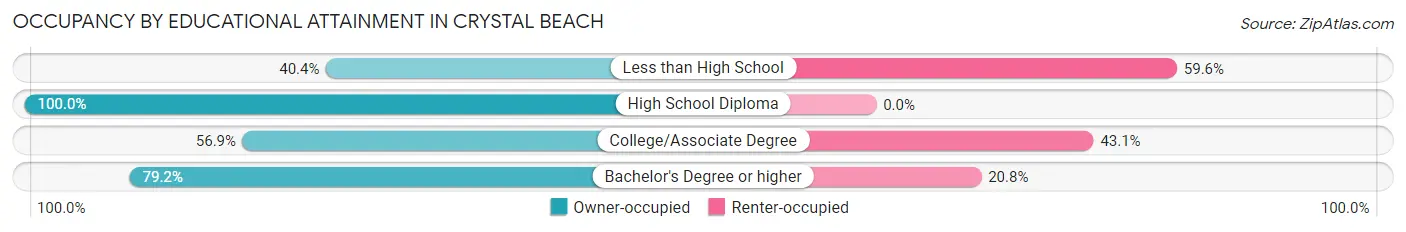
| Household Size | Owner-occupied | Renter-occupied |
| Less than High School | 21 (40.4%) | 31 (59.6%) |
| High School Diploma | 116 (100.0%) | 0 (0.0%) |
| College/Associate Degree | 74 (56.9%) | 56 (43.1%) |
| Bachelor's Degree or higher | 76 (79.2%) | 20 (20.8%) |
Occupancy by Age of Householder in Crystal Beach
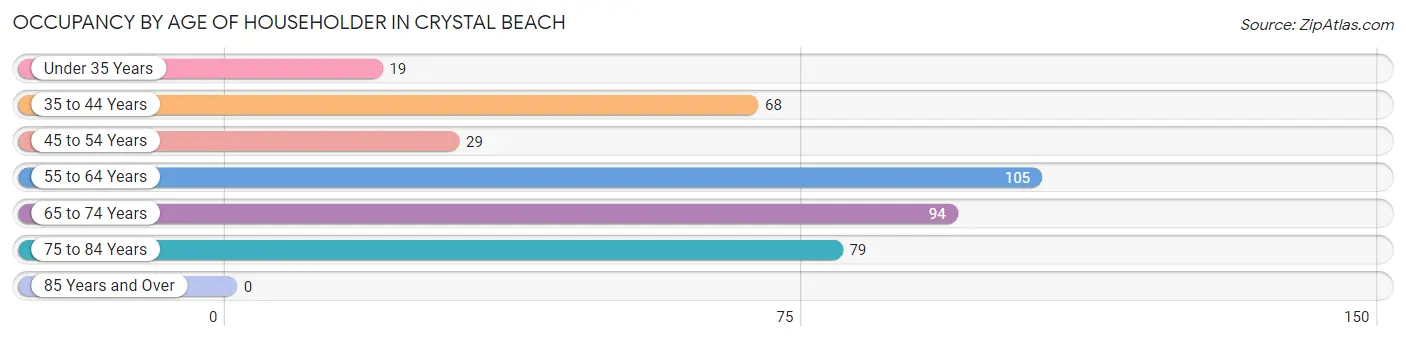
| Age Bracket | # Households | % Households |
| Under 35 Years | 19 | 4.8% |
| 35 to 44 Years | 68 | 17.3% |
| 45 to 54 Years | 29 | 7.4% |
| 55 to 64 Years | 105 | 26.7% |
| 65 to 74 Years | 94 | 23.9% |
| 75 to 84 Years | 79 | 20.1% |
| 85 Years and Over | 0 | 0.0% |
| Total | 394 | 100.0% |
Housing Finances in Crystal Beach
Median Income by Occupancy in Crystal Beach
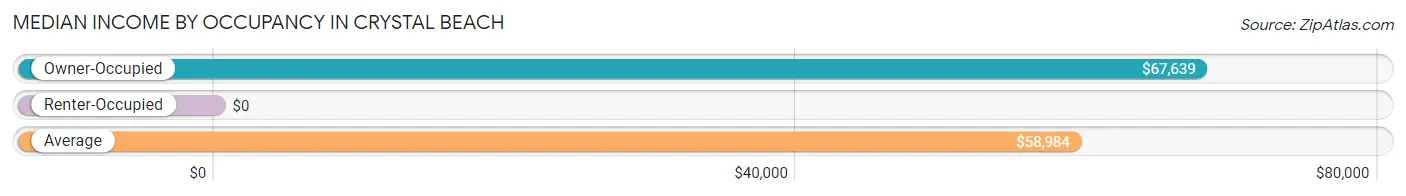
| Occupancy Type | # Households | Median Income |
| Owner-Occupied | 287 (72.8%) | $67,639 |
| Renter-Occupied | 107 (27.2%) | $0 |
| Average | 394 (100.0%) | $58,984 |
Occupancy by Householder Income Bracket in Crystal Beach
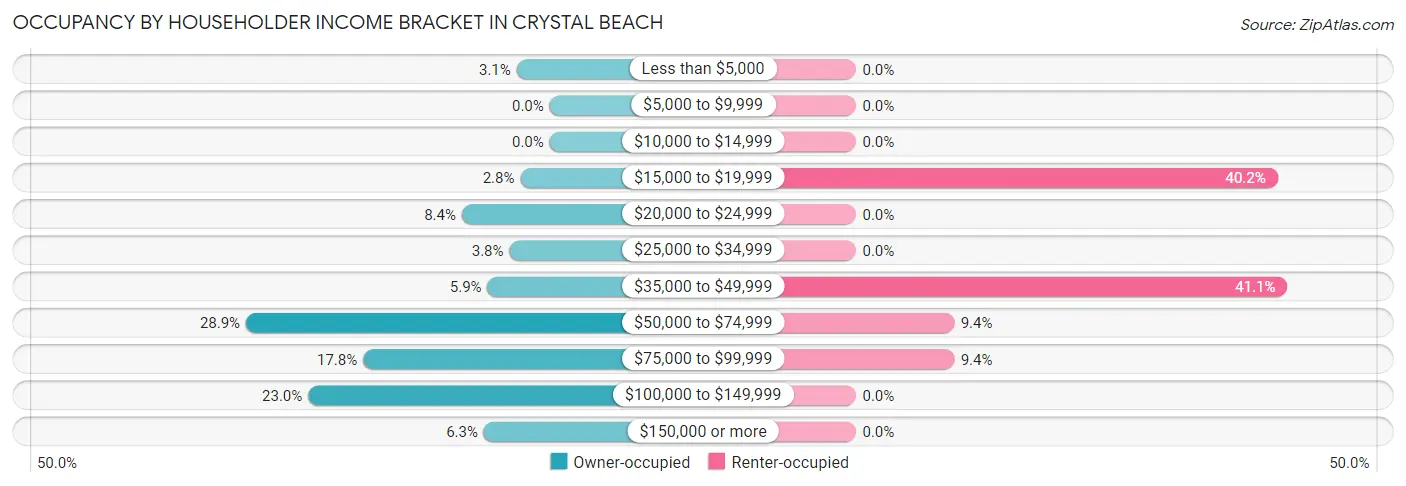
| Income Bracket | Owner-occupied | Renter-occupied |
| Less than $5,000 | 9 (3.1%) | 0 (0.0%) |
| $5,000 to $9,999 | 0 (0.0%) | 0 (0.0%) |
| $10,000 to $14,999 | 0 (0.0%) | 0 (0.0%) |
| $15,000 to $19,999 | 8 (2.8%) | 43 (40.2%) |
| $20,000 to $24,999 | 24 (8.4%) | 0 (0.0%) |
| $25,000 to $34,999 | 11 (3.8%) | 0 (0.0%) |
| $35,000 to $49,999 | 17 (5.9%) | 44 (41.1%) |
| $50,000 to $74,999 | 83 (28.9%) | 10 (9.3%) |
| $75,000 to $99,999 | 51 (17.8%) | 10 (9.3%) |
| $100,000 to $149,999 | 66 (23.0%) | 0 (0.0%) |
| $150,000 or more | 18 (6.3%) | 0 (0.0%) |
| Total | 287 (100.0%) | 107 (100.0%) |
Monthly Housing Cost Tiers in Crystal Beach
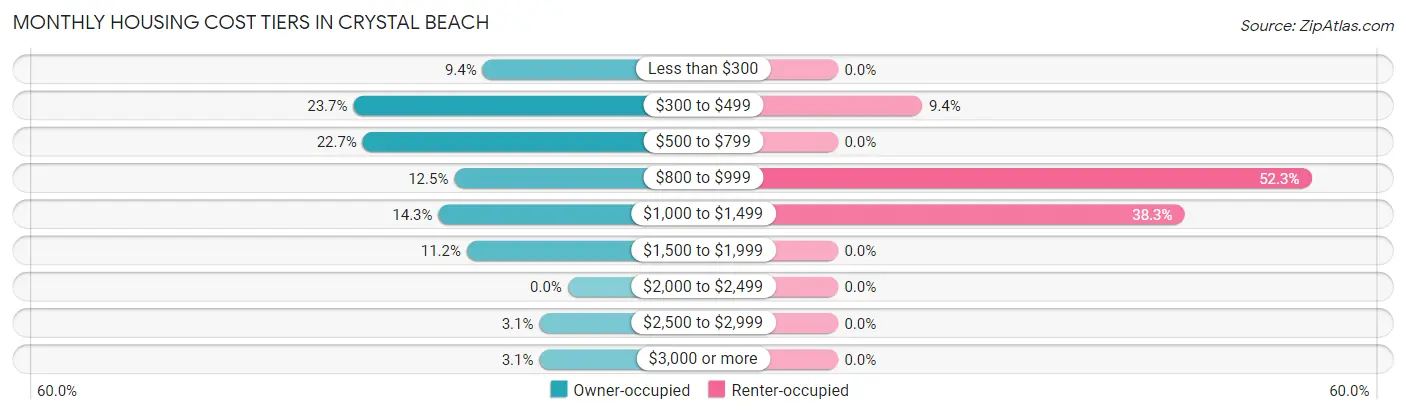
| Monthly Cost | Owner-occupied | Renter-occupied |
| Less than $300 | 27 (9.4%) | 0 (0.0%) |
| $300 to $499 | 68 (23.7%) | 10 (9.3%) |
| $500 to $799 | 65 (22.7%) | 0 (0.0%) |
| $800 to $999 | 36 (12.5%) | 56 (52.3%) |
| $1,000 to $1,499 | 41 (14.3%) | 41 (38.3%) |
| $1,500 to $1,999 | 32 (11.2%) | 0 (0.0%) |
| $2,000 to $2,499 | 0 (0.0%) | 0 (0.0%) |
| $2,500 to $2,999 | 9 (3.1%) | 0 (0.0%) |
| $3,000 or more | 9 (3.1%) | 0 (0.0%) |
| Total | 287 (100.0%) | 107 (100.0%) |
Physical Housing Characteristics in Crystal Beach
Housing Structures in Crystal Beach
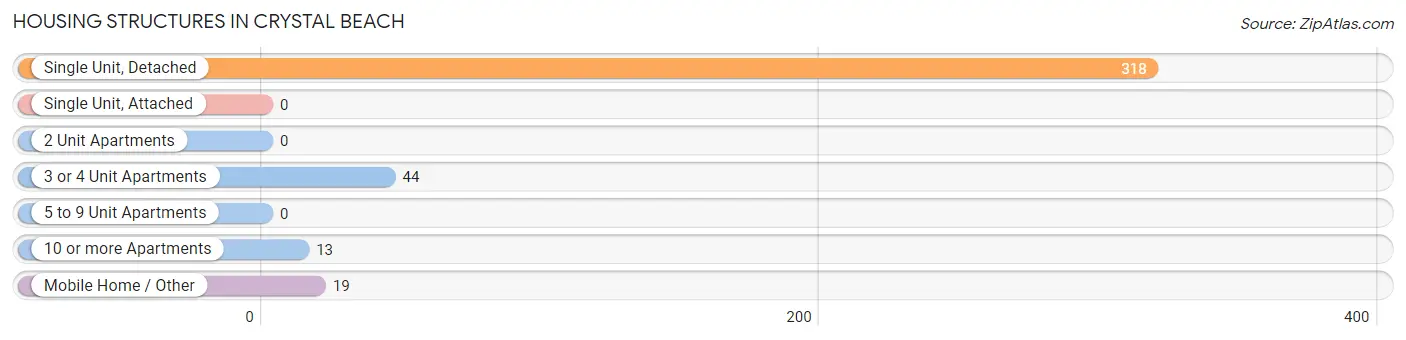
| Structure Type | # Housing Units | % Housing Units |
| Single Unit, Detached | 318 | 80.7% |
| Single Unit, Attached | 0 | 0.0% |
| 2 Unit Apartments | 0 | 0.0% |
| 3 or 4 Unit Apartments | 44 | 11.2% |
| 5 to 9 Unit Apartments | 0 | 0.0% |
| 10 or more Apartments | 13 | 3.3% |
| Mobile Home / Other | 19 | 4.8% |
| Total | 394 | 100.0% |
Housing Structures by Occupancy in Crystal Beach
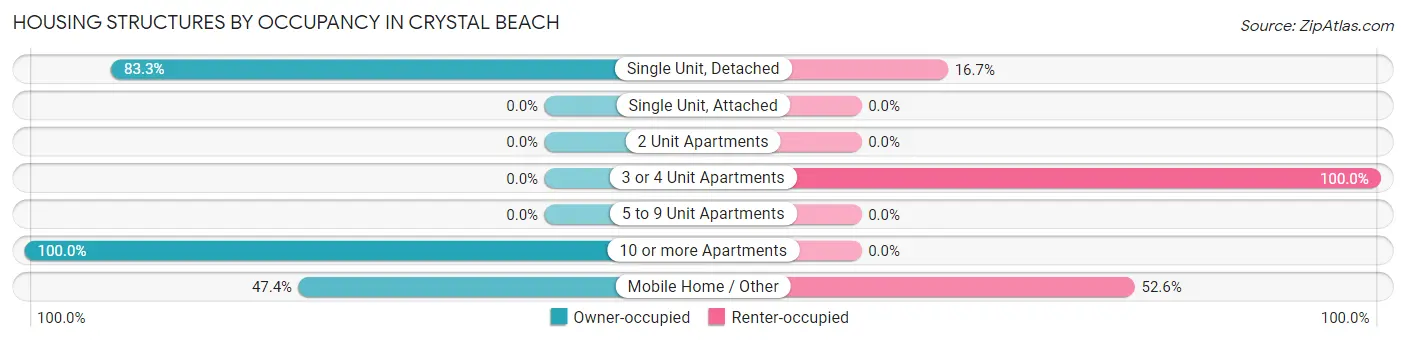
| Structure Type | Owner-occupied | Renter-occupied |
| Single Unit, Detached | 265 (83.3%) | 53 (16.7%) |
| Single Unit, Attached | 0 (0.0%) | 0 (0.0%) |
| 2 Unit Apartments | 0 (0.0%) | 0 (0.0%) |
| 3 or 4 Unit Apartments | 0 (0.0%) | 44 (100.0%) |
| 5 to 9 Unit Apartments | 0 (0.0%) | 0 (0.0%) |
| 10 or more Apartments | 13 (100.0%) | 0 (0.0%) |
| Mobile Home / Other | 9 (47.4%) | 10 (52.6%) |
| Total | 287 (72.8%) | 107 (27.2%) |
Housing Structures by Number of Rooms in Crystal Beach
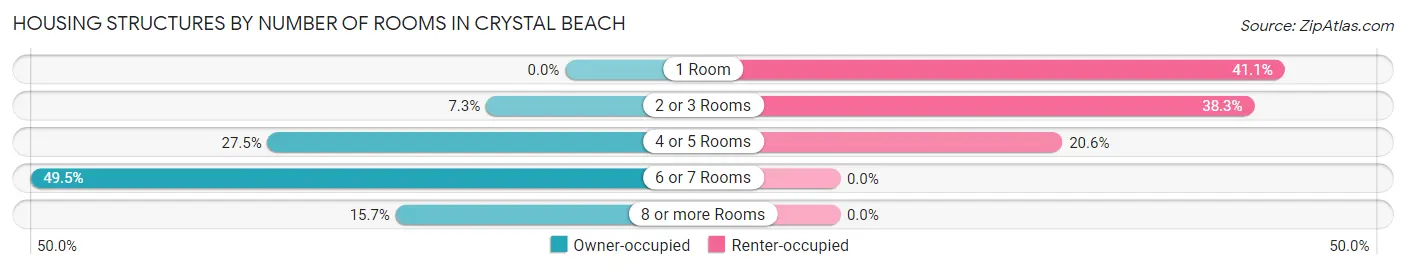
| Number of Rooms | Owner-occupied | Renter-occupied |
| 1 Room | 0 (0.0%) | 44 (41.1%) |
| 2 or 3 Rooms | 21 (7.3%) | 41 (38.3%) |
| 4 or 5 Rooms | 79 (27.5%) | 22 (20.6%) |
| 6 or 7 Rooms | 142 (49.5%) | 0 (0.0%) |
| 8 or more Rooms | 45 (15.7%) | 0 (0.0%) |
| Total | 287 (100.0%) | 107 (100.0%) |
Housing Structure by Heating Type in Crystal Beach
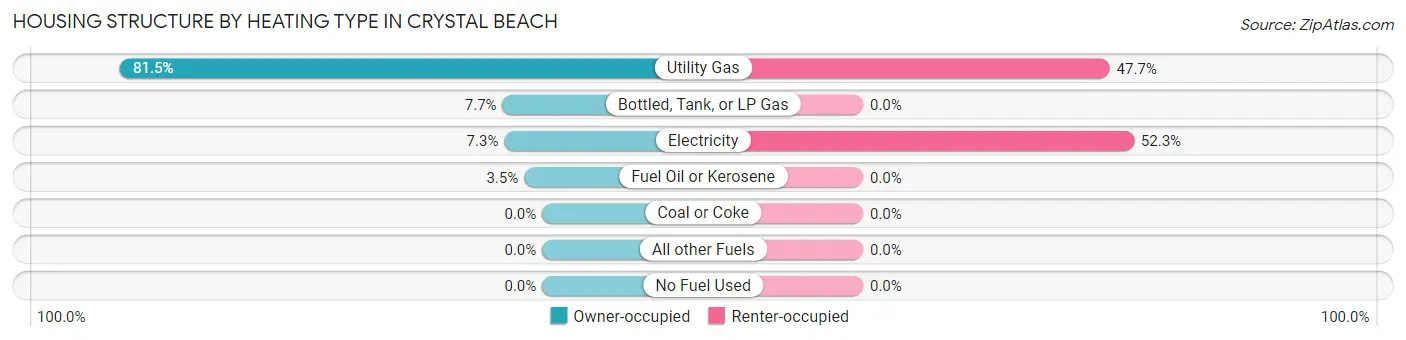
| Heating Type | Owner-occupied | Renter-occupied |
| Utility Gas | 234 (81.5%) | 51 (47.7%) |
| Bottled, Tank, or LP Gas | 22 (7.7%) | 0 (0.0%) |
| Electricity | 21 (7.3%) | 56 (52.3%) |
| Fuel Oil or Kerosene | 10 (3.5%) | 0 (0.0%) |
| Coal or Coke | 0 (0.0%) | 0 (0.0%) |
| All other Fuels | 0 (0.0%) | 0 (0.0%) |
| No Fuel Used | 0 (0.0%) | 0 (0.0%) |
| Total | 287 (100.0%) | 107 (100.0%) |
Household Vehicle Usage in Crystal Beach
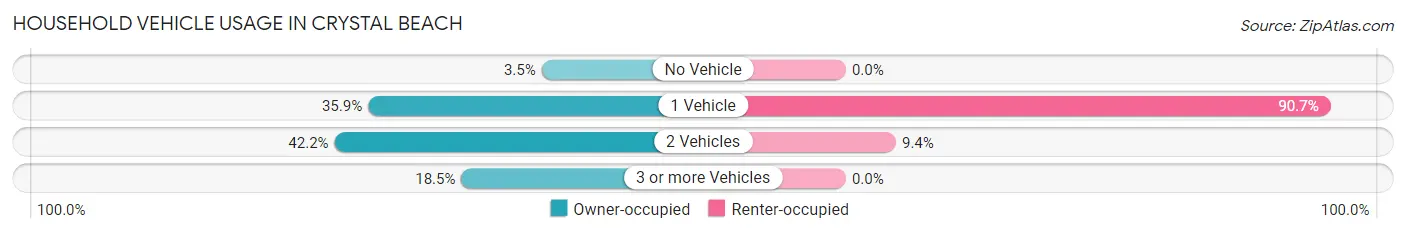
| Vehicles per Household | Owner-occupied | Renter-occupied |
| No Vehicle | 10 (3.5%) | 0 (0.0%) |
| 1 Vehicle | 103 (35.9%) | 97 (90.6%) |
| 2 Vehicles | 121 (42.2%) | 10 (9.3%) |
| 3 or more Vehicles | 53 (18.5%) | 0 (0.0%) |
| Total | 287 (100.0%) | 107 (100.0%) |
Real Estate & Mortgages in Crystal Beach
Real Estate and Mortgage Overview in Crystal Beach
| Characteristic | Without Mortgage | With Mortgage |
| Housing Units | 193 | 94 |
| Median Property Value | $124,600 | $164,100 |
| Median Household Income | $65,511 | $8 |
| Monthly Housing Costs | $507 | $9 |
| Real Estate Taxes | $2,081 | $0 |
Property Value by Mortgage Status in Crystal Beach
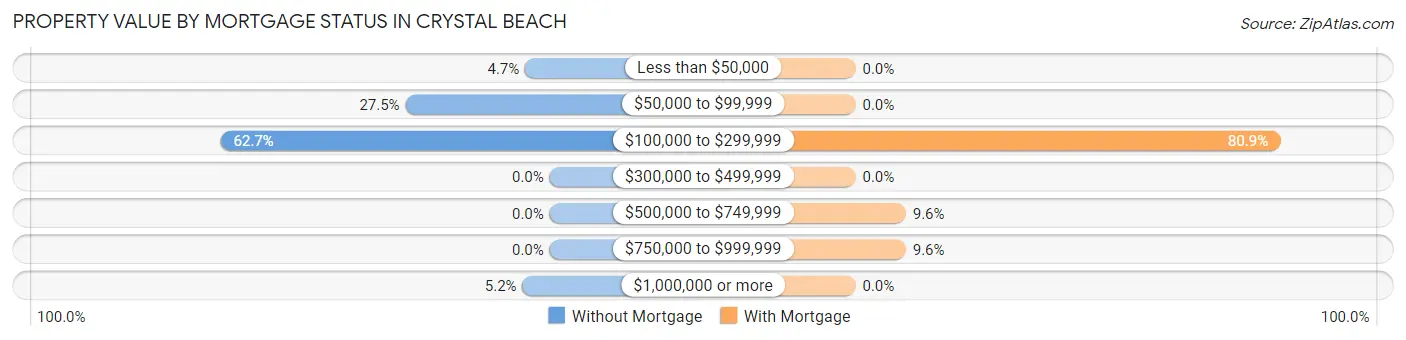
| Property Value | Without Mortgage | With Mortgage |
| Less than $50,000 | 9 (4.7%) | 0 (0.0%) |
| $50,000 to $99,999 | 53 (27.5%) | 0 (0.0%) |
| $100,000 to $299,999 | 121 (62.7%) | 76 (80.8%) |
| $300,000 to $499,999 | 0 (0.0%) | 0 (0.0%) |
| $500,000 to $749,999 | 0 (0.0%) | 9 (9.6%) |
| $750,000 to $999,999 | 0 (0.0%) | 9 (9.6%) |
| $1,000,000 or more | 10 (5.2%) | 0 (0.0%) |
| Total | 193 (100.0%) | 94 (100.0%) |
Household Income by Mortgage Status in Crystal Beach
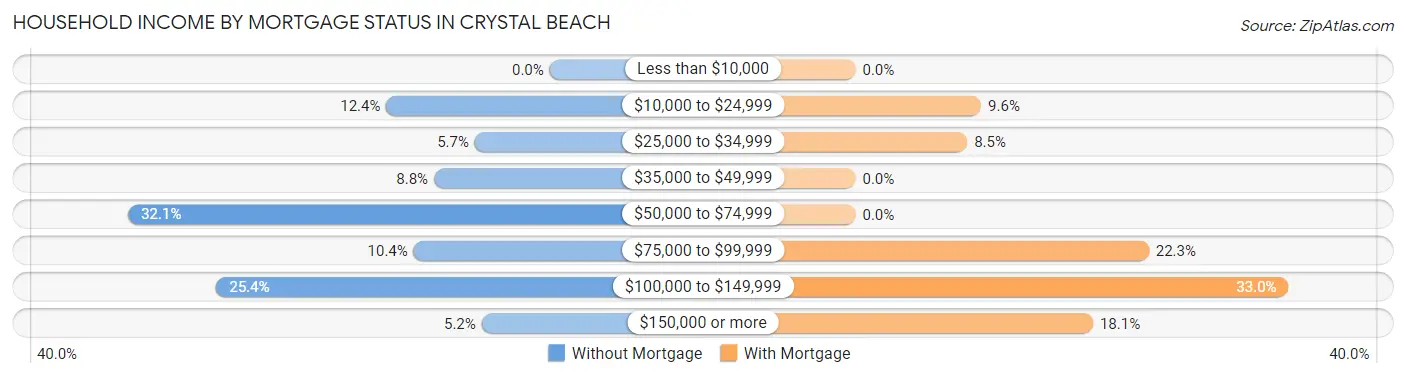
| Household Income | Without Mortgage | With Mortgage |
| Less than $10,000 | 0 (0.0%) | 0 (0.0%) |
| $10,000 to $24,999 | 24 (12.4%) | 9 (9.6%) |
| $25,000 to $34,999 | 11 (5.7%) | 8 (8.5%) |
| $35,000 to $49,999 | 17 (8.8%) | 0 (0.0%) |
| $50,000 to $74,999 | 62 (32.1%) | 0 (0.0%) |
| $75,000 to $99,999 | 20 (10.4%) | 21 (22.3%) |
| $100,000 to $149,999 | 49 (25.4%) | 31 (33.0%) |
| $150,000 or more | 10 (5.2%) | 17 (18.1%) |
| Total | 193 (100.0%) | 94 (100.0%) |
Property Value to Household Income Ratio in Crystal Beach
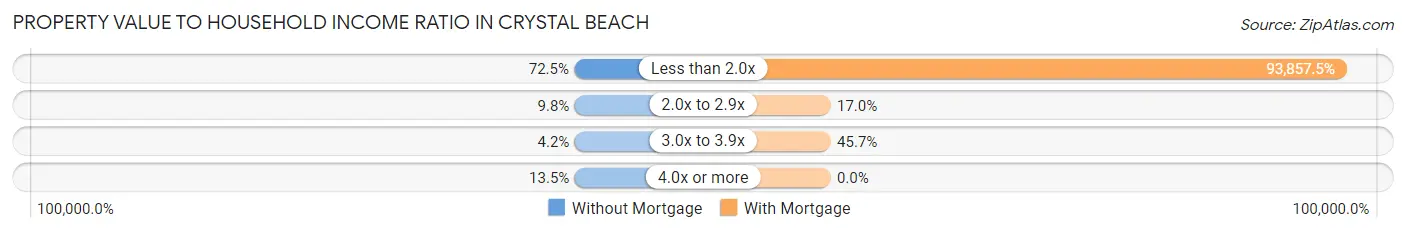
| Value-to-Income Ratio | Without Mortgage | With Mortgage |
| Less than 2.0x | 140 (72.5%) | 88,226 (93,857.4%) |
| 2.0x to 2.9x | 19 (9.8%) | 16 (17.0%) |
| 3.0x to 3.9x | 8 (4.2%) | 43 (45.7%) |
| 4.0x or more | 26 (13.5%) | 0 (0.0%) |
| Total | 193 (100.0%) | 94 (100.0%) |
Real Estate Taxes by Mortgage Status in Crystal Beach
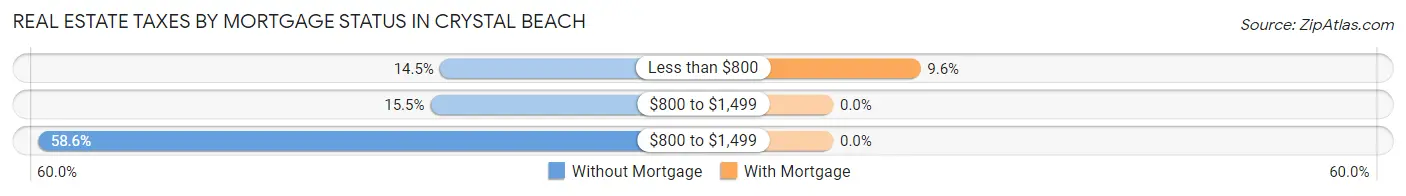
| Property Taxes | Without Mortgage | With Mortgage |
| Less than $800 | 28 (14.5%) | 9 (9.6%) |
| $800 to $1,499 | 30 (15.5%) | 0 (0.0%) |
| $800 to $1,499 | 113 (58.6%) | 0 (0.0%) |
| Total | 193 (100.0%) | 94 (100.0%) |
Health & Disability in Crystal Beach
Health Insurance Coverage by Age in Crystal Beach
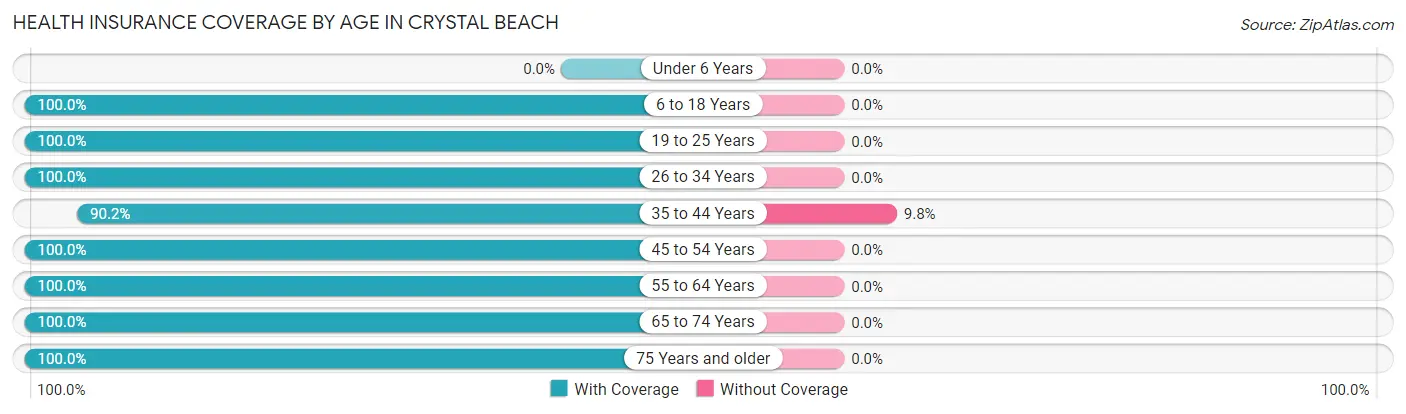
| Age Bracket | With Coverage | Without Coverage |
| Under 6 Years | 0 (0.0%) | 0 (0.0%) |
| 6 to 18 Years | 48 (100.0%) | 0 (0.0%) |
| 19 to 25 Years | 66 (100.0%) | 0 (0.0%) |
| 26 to 34 Years | 37 (100.0%) | 0 (0.0%) |
| 35 to 44 Years | 92 (90.2%) | 10 (9.8%) |
| 45 to 54 Years | 87 (100.0%) | 0 (0.0%) |
| 55 to 64 Years | 154 (100.0%) | 0 (0.0%) |
| 65 to 74 Years | 162 (100.0%) | 0 (0.0%) |
| 75 Years and older | 90 (100.0%) | 0 (0.0%) |
| Total | 736 (98.7%) | 10 (1.3%) |
Health Insurance Coverage by Citizenship Status in Crystal Beach
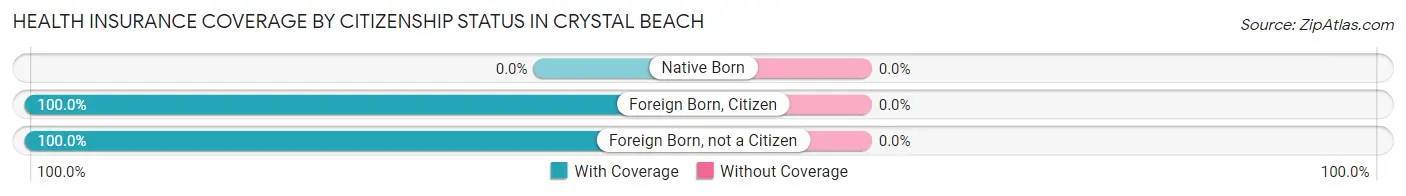
| Citizenship Status | With Coverage | Without Coverage |
| Native Born | 0 (0.0%) | 0 (0.0%) |
| Foreign Born, Citizen | 48 (100.0%) | 0 (0.0%) |
| Foreign Born, not a Citizen | 66 (100.0%) | 0 (0.0%) |
Health Insurance Coverage by Household Income in Crystal Beach
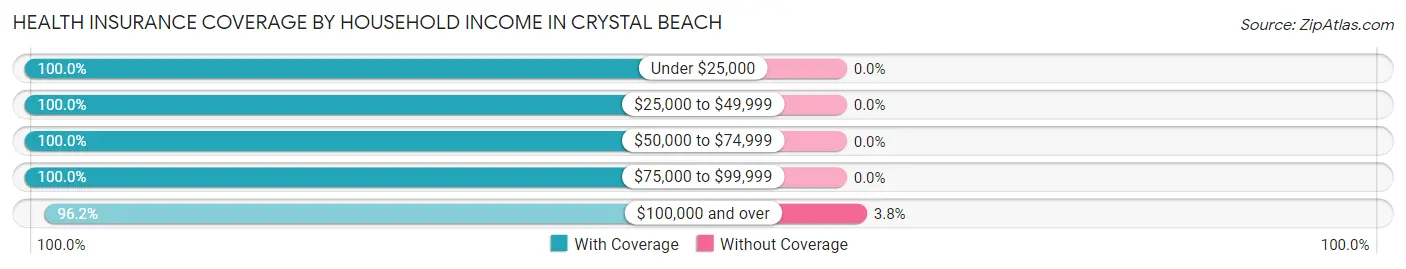
| Household Income | With Coverage | Without Coverage |
| Under $25,000 | 100 (100.0%) | 0 (0.0%) |
| $25,000 to $49,999 | 90 (100.0%) | 0 (0.0%) |
| $50,000 to $74,999 | 185 (100.0%) | 0 (0.0%) |
| $75,000 to $99,999 | 94 (100.0%) | 0 (0.0%) |
| $100,000 and over | 256 (96.2%) | 10 (3.8%) |
Public vs Private Health Insurance Coverage by Age in Crystal Beach
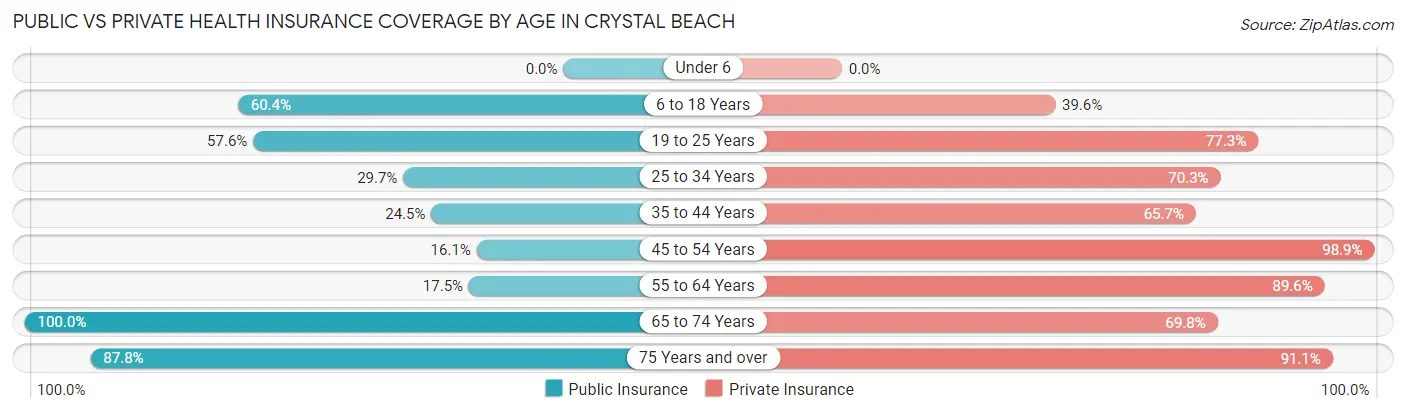
| Age Bracket | Public Insurance | Private Insurance |
| Under 6 | 0 (0.0%) | 0 (0.0%) |
| 6 to 18 Years | 29 (60.4%) | 19 (39.6%) |
| 19 to 25 Years | 38 (57.6%) | 51 (77.3%) |
| 25 to 34 Years | 11 (29.7%) | 26 (70.3%) |
| 35 to 44 Years | 25 (24.5%) | 67 (65.7%) |
| 45 to 54 Years | 14 (16.1%) | 86 (98.9%) |
| 55 to 64 Years | 27 (17.5%) | 138 (89.6%) |
| 65 to 74 Years | 162 (100.0%) | 113 (69.8%) |
| 75 Years and over | 79 (87.8%) | 82 (91.1%) |
| Total | 385 (51.6%) | 582 (78.0%) |
Disability Status by Sex by Age in Crystal Beach
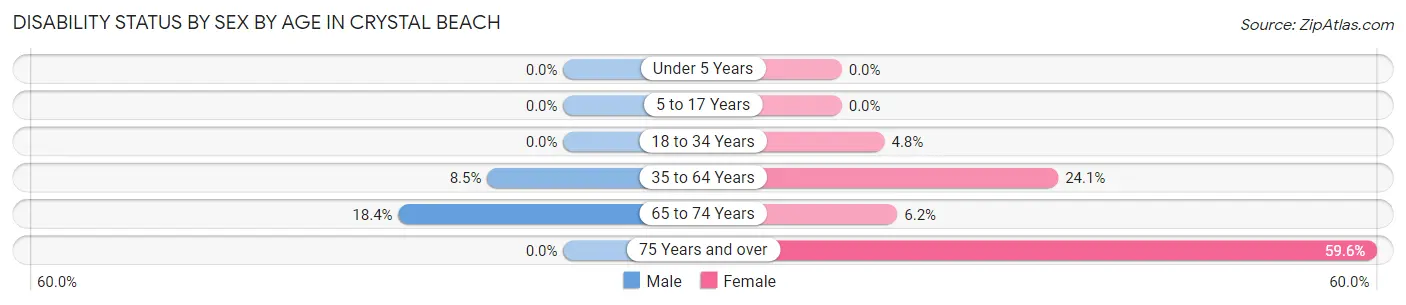
| Age Bracket | Male | Female |
| Under 5 Years | 0 (0.0%) | 0 (0.0%) |
| 5 to 17 Years | 0 (0.0%) | 0 (0.0%) |
| 18 to 34 Years | 0 (0.0%) | 2 (4.8%) |
| 35 to 64 Years | 15 (8.5%) | 40 (24.1%) |
| 65 to 74 Years | 9 (18.4%) | 7 (6.2%) |
| 75 Years and over | 0 (0.0%) | 31 (59.6%) |
Disability Class by Sex by Age in Crystal Beach
Disability Class: Hearing Difficulty
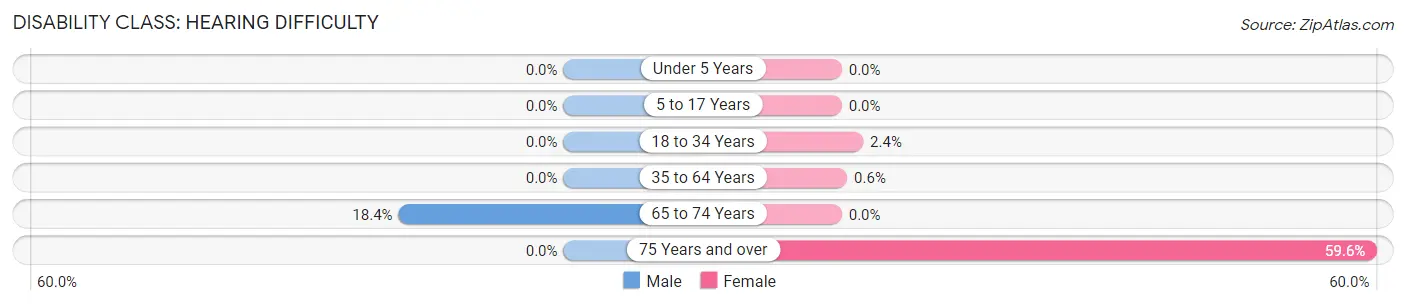
| Age Bracket | Male | Female |
| Under 5 Years | 0 (0.0%) | 0 (0.0%) |
| 5 to 17 Years | 0 (0.0%) | 0 (0.0%) |
| 18 to 34 Years | 0 (0.0%) | 1 (2.4%) |
| 35 to 64 Years | 0 (0.0%) | 1 (0.6%) |
| 65 to 74 Years | 9 (18.4%) | 0 (0.0%) |
| 75 Years and over | 0 (0.0%) | 31 (59.6%) |
Disability Class: Vision Difficulty
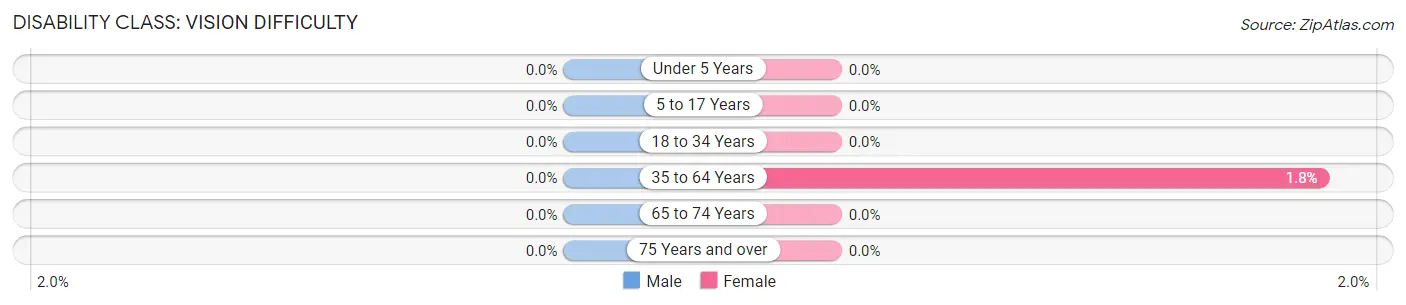
| Age Bracket | Male | Female |
| Under 5 Years | 0 (0.0%) | 0 (0.0%) |
| 5 to 17 Years | 0 (0.0%) | 0 (0.0%) |
| 18 to 34 Years | 0 (0.0%) | 0 (0.0%) |
| 35 to 64 Years | 0 (0.0%) | 3 (1.8%) |
| 65 to 74 Years | 0 (0.0%) | 0 (0.0%) |
| 75 Years and over | 0 (0.0%) | 0 (0.0%) |
Disability Class: Cognitive Difficulty
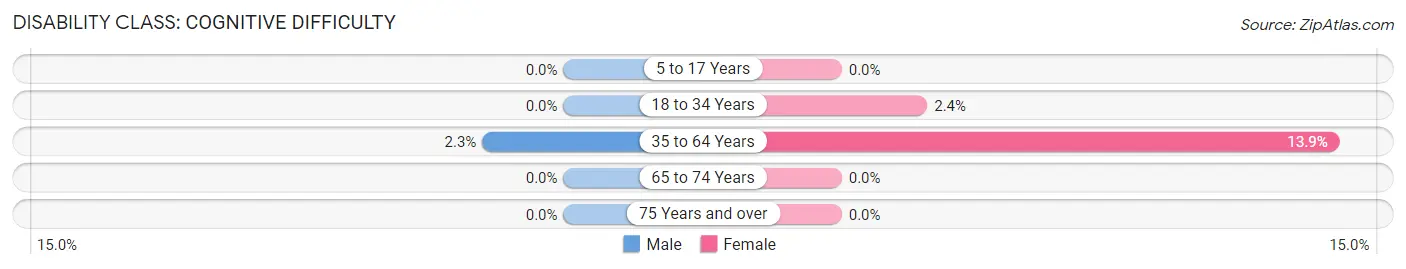
| Age Bracket | Male | Female |
| 5 to 17 Years | 0 (0.0%) | 0 (0.0%) |
| 18 to 34 Years | 0 (0.0%) | 1 (2.4%) |
| 35 to 64 Years | 4 (2.3%) | 23 (13.9%) |
| 65 to 74 Years | 0 (0.0%) | 0 (0.0%) |
| 75 Years and over | 0 (0.0%) | 0 (0.0%) |
Disability Class: Ambulatory Difficulty
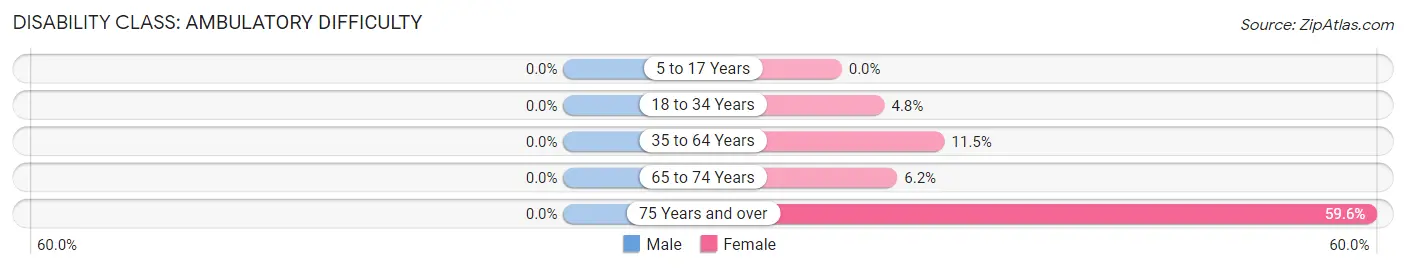
| Age Bracket | Male | Female |
| 5 to 17 Years | 0 (0.0%) | 0 (0.0%) |
| 18 to 34 Years | 0 (0.0%) | 2 (4.8%) |
| 35 to 64 Years | 0 (0.0%) | 19 (11.5%) |
| 65 to 74 Years | 0 (0.0%) | 7 (6.2%) |
| 75 Years and over | 0 (0.0%) | 31 (59.6%) |
Disability Class: Self-Care Difficulty
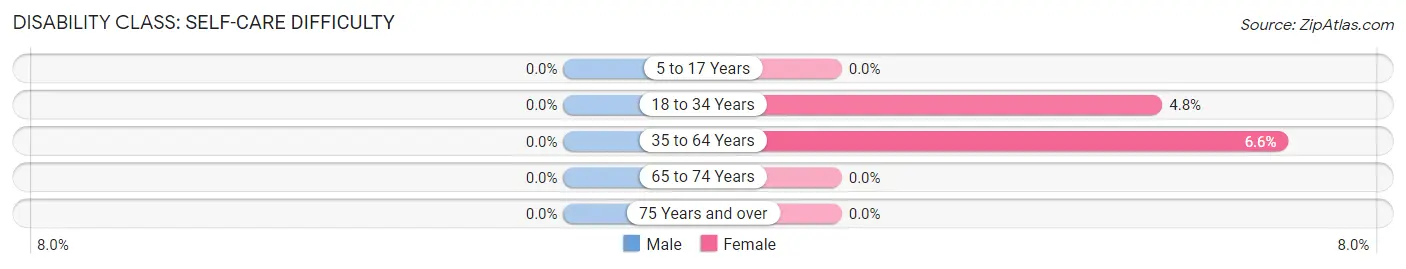
| Age Bracket | Male | Female |
| 5 to 17 Years | 0 (0.0%) | 0 (0.0%) |
| 18 to 34 Years | 0 (0.0%) | 2 (4.8%) |
| 35 to 64 Years | 0 (0.0%) | 11 (6.6%) |
| 65 to 74 Years | 0 (0.0%) | 0 (0.0%) |
| 75 Years and over | 0 (0.0%) | 0 (0.0%) |
Technology Access in Crystal Beach
Computing Device Access in Crystal Beach
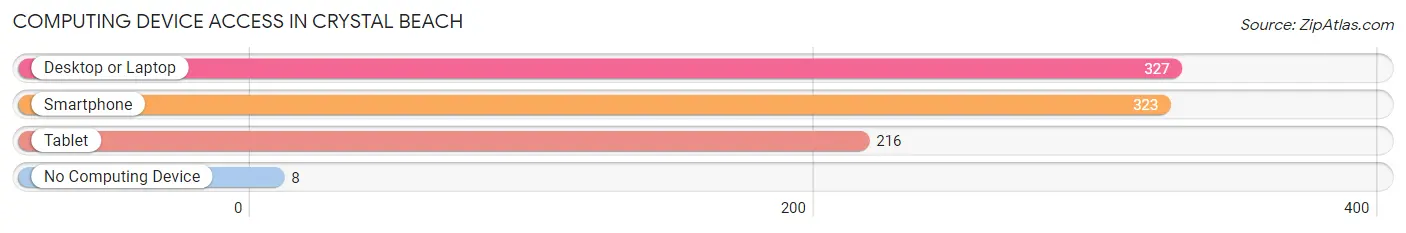
| Device Type | # Households | % Households |
| Desktop or Laptop | 327 | 83.0% |
| Smartphone | 323 | 82.0% |
| Tablet | 216 | 54.8% |
| No Computing Device | 8 | 2.0% |
| Total | 394 | 100.0% |
Internet Access in Crystal Beach
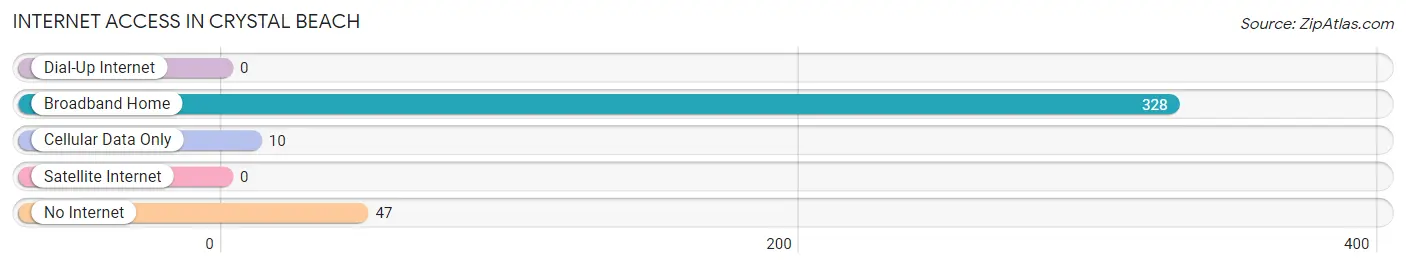
| Internet Type | # Households | % Households |
| Dial-Up Internet | 0 | 0.0% |
| Broadband Home | 328 | 83.3% |
| Cellular Data Only | 10 | 2.5% |
| Satellite Internet | 0 | 0.0% |
| No Internet | 47 | 11.9% |
| Total | 394 | 100.0% |
Crystal Beach Summary
History
Crystal Beach is a small hamlet located in the town of Porter in Niagara County, New York. It is situated on the eastern shore of Lake Ontario, just south of the city of Buffalo. The area was first settled in the early 1800s by a group of settlers from Connecticut. The settlers named the area Crystal Beach after the crystal clear waters of Lake Ontario.
The area was primarily a farming community until the late 1800s when the first hotel was built. This hotel, known as the Crystal Beach Hotel, was a popular destination for tourists and locals alike. The hotel was destroyed by a fire in the early 1900s, but the area continued to be a popular tourist destination.
In the early 1900s, the area began to develop as a summer resort. The Crystal Beach Amusement Park was built in the 1920s and quickly became a popular destination for tourists. The park featured a variety of rides, games, and attractions, including a roller coaster, a ferris wheel, and a carousel. The park was a popular destination for families and was a major draw for tourists from all over the region.
The area continued to be a popular tourist destination until the late 1960s when the amusement park closed. The area has since become a quiet residential community.
Geography
Crystal Beach is located in the town of Porter in Niagara County, New York. It is situated on the eastern shore of Lake Ontario, just south of the city of Buffalo. The area is bordered by the Niagara River to the north and the Lake Ontario to the south.
The area is mostly flat with some rolling hills. The terrain is mostly covered in grass and trees, with some areas of marshland. The area is home to a variety of wildlife, including deer, foxes, and a variety of birds.
Economy
The economy of Crystal Beach is largely based on tourism. The area is home to a variety of hotels, restaurants, and other tourist attractions. The area is also home to a number of small businesses, including retail stores, gas stations, and other services.
The area is also home to a number of farms, which produce a variety of crops, including corn, soybeans, and wheat. The area is also home to a number of wineries, which produce a variety of wines.
Demographics
As of the 2010 census, the population of Crystal Beach was 1,845. The population is largely white (94.3%) with a small percentage of African Americans (2.2%) and Hispanics (2.2%). The median household income is $50,972 and the median age is 44.7 years.
Conclusion
Crystal Beach is a small hamlet located in the town of Porter in Niagara County, New York. It is situated on the eastern shore of Lake Ontario, just south of the city of Buffalo. The area was first settled in the early 1800s and has since become a popular tourist destination. The area is largely based on tourism, with a variety of hotels, restaurants, and other tourist attractions. The population of Crystal Beach is largely white (94.3%) with a small percentage of African Americans (2.2%) and Hispanics (2.2%). The median household income is $50,972 and the median age is 44.7 years.
Common Questions
What is Per Capita Income in Crystal Beach?
Per Capita income in Crystal Beach is $37,027.
What is the Median Family Income in Crystal Beach?
Median Family Income in Crystal Beach is $88,977.
What is the Median Household income in Crystal Beach?
Median Household Income in Crystal Beach is $58,984.
What is Income or Wage Gap in Crystal Beach?
Income or Wage Gap in Crystal Beach is 17.7%.
Women in Crystal Beach earn 82.3 cents for every dollar earned by a man.
What is Inequality or Gini Index in Crystal Beach?
Inequality or Gini Index in Crystal Beach is 0.36.
What is the Total Population of Crystal Beach?
Total Population of Crystal Beach is 746.
What is the Total Male Population of Crystal Beach?
Total Male Population of Crystal Beach is 373.
What is the Total Female Population of Crystal Beach?
Total Female Population of Crystal Beach is 373.
What is the Ratio of Males per 100 Females in Crystal Beach?
There are 100.00 Males per 100 Females in Crystal Beach.
What is the Ratio of Females per 100 Males in Crystal Beach?
There are 100.00 Females per 100 Males in Crystal Beach.
What is the Median Population Age in Crystal Beach?
Median Population Age in Crystal Beach is 57.2 Years.
What is the Average Family Size in Crystal Beach
Average Family Size in Crystal Beach is 2.7 People.
What is the Average Household Size in Crystal Beach
Average Household Size in Crystal Beach is 1.9 People.
How Large is the Labor Force in Crystal Beach?
There are 378 People in the Labor Forcein in Crystal Beach.
What is the Percentage of People in the Labor Force in Crystal Beach?
53.5% of People are in the Labor Force in Crystal Beach.