Churchville, NY Map & Demographics
Churchville Map
Churchville Overview
$44,090
PER CAPITA INCOME
$113,512
AVG FAMILY INCOME
$83,631
AVG HOUSEHOLD INCOME
28.0%
WAGE / INCOME GAP [ % ]
72.0¢/ $1
WAGE / INCOME GAP [ $ ]
0.38
INEQUALITY / GINI INDEX
1,887
TOTAL POPULATION
926
MALE POPULATION
961
FEMALE POPULATION
96.36
MALES / 100 FEMALES
103.78
FEMALES / 100 MALES
50.9
MEDIAN AGE
2.9
AVG FAMILY SIZE
2.2
AVG HOUSEHOLD SIZE
1,020
LABOR FORCE [ PEOPLE ]
63.0%
PERCENT IN LABOR FORCE
3.5%
UNEMPLOYMENT RATE
Churchville Zip Codes
Churchville Area Codes
Income in Churchville
Income Overview in Churchville
Per Capita Income in Churchville is $44,090, while median incomes of families and households are $113,512 and $83,631 respectively.
| Characteristic | Number | Measure |
| Per Capita Income | 1,887 | $44,090 |
| Median Family Income | 541 | $113,512 |
| Mean Family Income | 541 | $121,066 |
| Median Household Income | 841 | $83,631 |
| Mean Household Income | 841 | $98,776 |
| Income Deficit | 541 | $0 |
| Wage / Income Gap (%) | 1,887 | 28.00% |
| Wage / Income Gap ($) | 1,887 | 72.00¢ per $1 |
| Gini / Inequality Index | 1,887 | 0.38 |
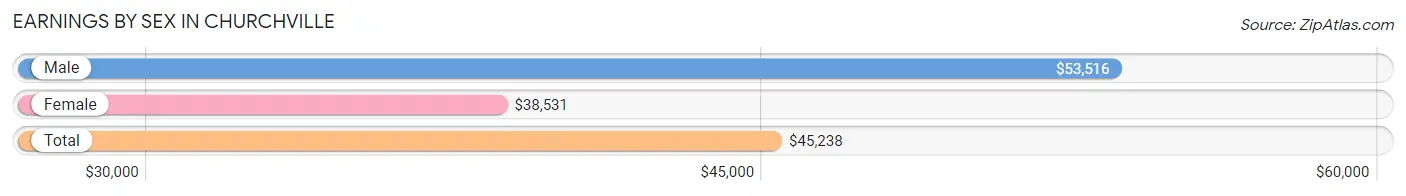
Earnings by Sex in Churchville
Average Earnings in Churchville are $45,238, $53,516 for men and $38,531 for women, a difference of 28.0%.
| Sex | Number | Average Earnings |
| Male | 573 (52.8%) | $53,516 |
| Female | 513 (47.2%) | $38,531 |
| Total | 1,086 (100.0%) | $45,238 |
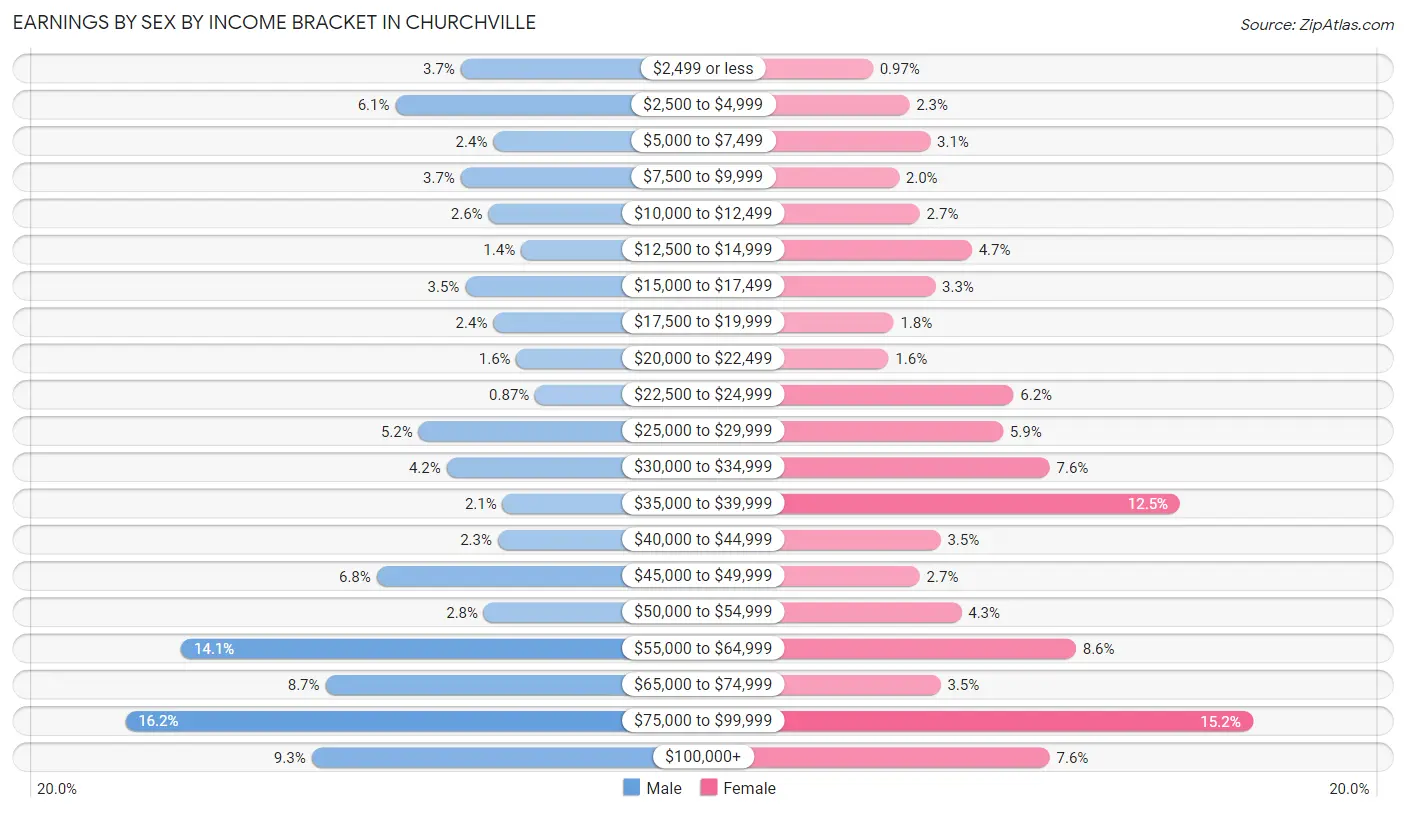
Earnings by Sex by Income Bracket in Churchville
The most common earnings brackets in Churchville are $75,000 to $99,999 for men (93 | 16.2%) and $75,000 to $99,999 for women (78 | 15.2%).
| Income | Male | Female |
| $2,499 or less | 21 (3.7%) | 5 (1.0%) |
| $2,500 to $4,999 | 35 (6.1%) | 12 (2.3%) |
| $5,000 to $7,499 | 14 (2.4%) | 16 (3.1%) |
| $7,500 to $9,999 | 21 (3.7%) | 10 (1.9%) |
| $10,000 to $12,499 | 15 (2.6%) | 14 (2.7%) |
| $12,500 to $14,999 | 8 (1.4%) | 24 (4.7%) |
| $15,000 to $17,499 | 20 (3.5%) | 17 (3.3%) |
| $17,500 to $19,999 | 14 (2.4%) | 9 (1.8%) |
| $20,000 to $22,499 | 9 (1.6%) | 8 (1.6%) |
| $22,500 to $24,999 | 5 (0.9%) | 32 (6.2%) |
| $25,000 to $29,999 | 30 (5.2%) | 30 (5.9%) |
| $30,000 to $34,999 | 24 (4.2%) | 39 (7.6%) |
| $35,000 to $39,999 | 12 (2.1%) | 64 (12.5%) |
| $40,000 to $44,999 | 13 (2.3%) | 18 (3.5%) |
| $45,000 to $49,999 | 39 (6.8%) | 14 (2.7%) |
| $50,000 to $54,999 | 16 (2.8%) | 22 (4.3%) |
| $55,000 to $64,999 | 81 (14.1%) | 44 (8.6%) |
| $65,000 to $74,999 | 50 (8.7%) | 18 (3.5%) |
| $75,000 to $99,999 | 93 (16.2%) | 78 (15.2%) |
| $100,000+ | 53 (9.2%) | 39 (7.6%) |
| Total | 573 (100.0%) | 513 (100.0%) |
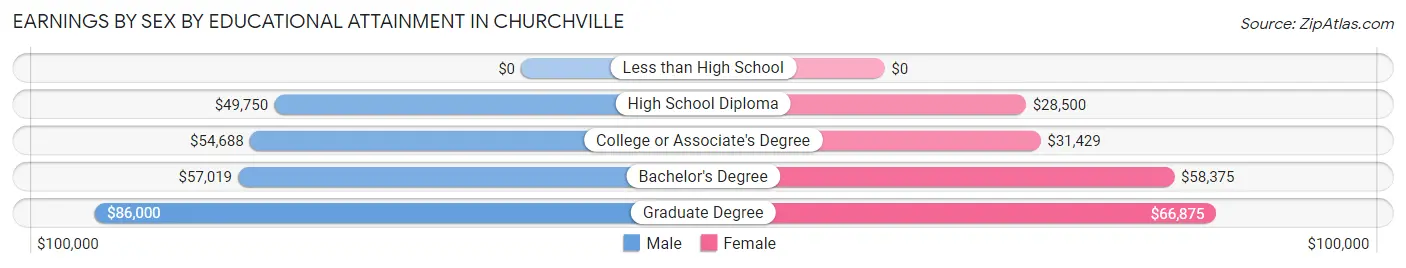
Earnings by Sex by Educational Attainment in Churchville
Average earnings in Churchville are $57,240 for men and $39,648 for women, a difference of 30.7%. Men with an educational attainment of graduate degree enjoy the highest average annual earnings of $86,000, while those with high school diploma education earn the least with $49,750. Women with an educational attainment of graduate degree earn the most with the average annual earnings of $66,875, while those with high school diploma education have the smallest earnings of $28,500.
| Educational Attainment | Male Income | Female Income |
| Less than High School | - | - |
| High School Diploma | $49,750 | $28,500 |
| College or Associate's Degree | $54,688 | $31,429 |
| Bachelor's Degree | $57,019 | $58,375 |
| Graduate Degree | $86,000 | $66,875 |
| Total | $57,240 | $39,648 |
Family Income in Churchville
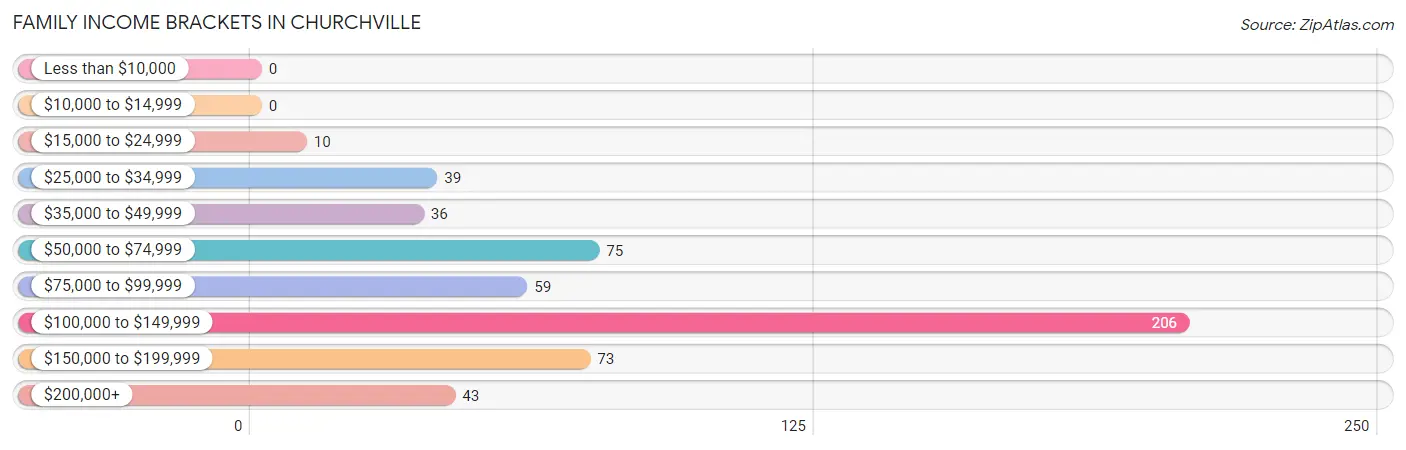
Family Income Brackets in Churchville
According to the Churchville family income data, there are 206 families falling into the $100,000 to $149,999 income range, which is the most common income bracket and makes up 38.1% of all families.
| Income Bracket | # Families | % Families |
| Less than $10,000 | 0 | 0.0% |
| $10,000 to $14,999 | 0 | 0.0% |
| $15,000 to $24,999 | 10 | 1.8% |
| $25,000 to $34,999 | 39 | 7.2% |
| $35,000 to $49,999 | 36 | 6.7% |
| $50,000 to $74,999 | 75 | 13.9% |
| $75,000 to $99,999 | 59 | 10.9% |
| $100,000 to $149,999 | 206 | 38.1% |
| $150,000 to $199,999 | 73 | 13.5% |
| $200,000+ | 43 | 7.9% |
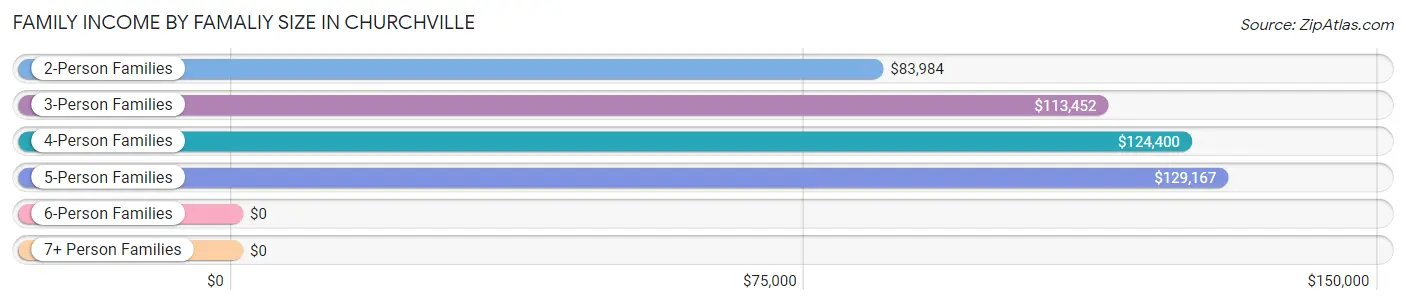
Family Income by Famaliy Size in Churchville
5-person families (18 | 3.3%) account for the highest median family income in Churchville with $129,167 per family, while 2-person families (261 | 48.2%) have the highest median income of $41,992 per family member.
| Income Bracket | # Families | Median Income |
| 2-Person Families | 261 (48.2%) | $83,984 |
| 3-Person Families | 124 (22.9%) | $113,452 |
| 4-Person Families | 130 (24.0%) | $124,400 |
| 5-Person Families | 18 (3.3%) | $129,167 |
| 6-Person Families | 3 (0.5%) | $0 |
| 7+ Person Families | 5 (0.9%) | $0 |
| Total | 541 (100.0%) | $113,512 |
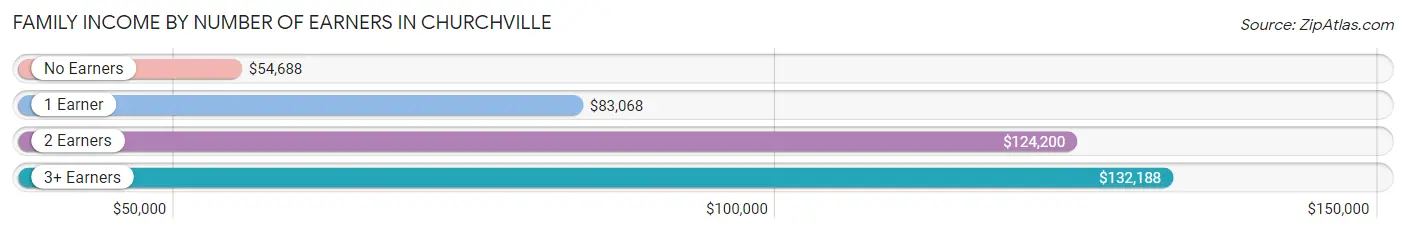
Family Income by Number of Earners in Churchville
The median family income in Churchville is $113,512, with families comprising 3+ earners (89) having the highest median family income of $132,188, while families with no earners (95) have the lowest median family income of $54,688, accounting for 16.5% and 17.6% of families, respectively.
| Number of Earners | # Families | Median Income |
| No Earners | 95 (17.6%) | $54,688 |
| 1 Earner | 123 (22.7%) | $83,068 |
| 2 Earners | 234 (43.2%) | $124,200 |
| 3+ Earners | 89 (16.5%) | $132,188 |
| Total | 541 (100.0%) | $113,512 |
Household Income in Churchville
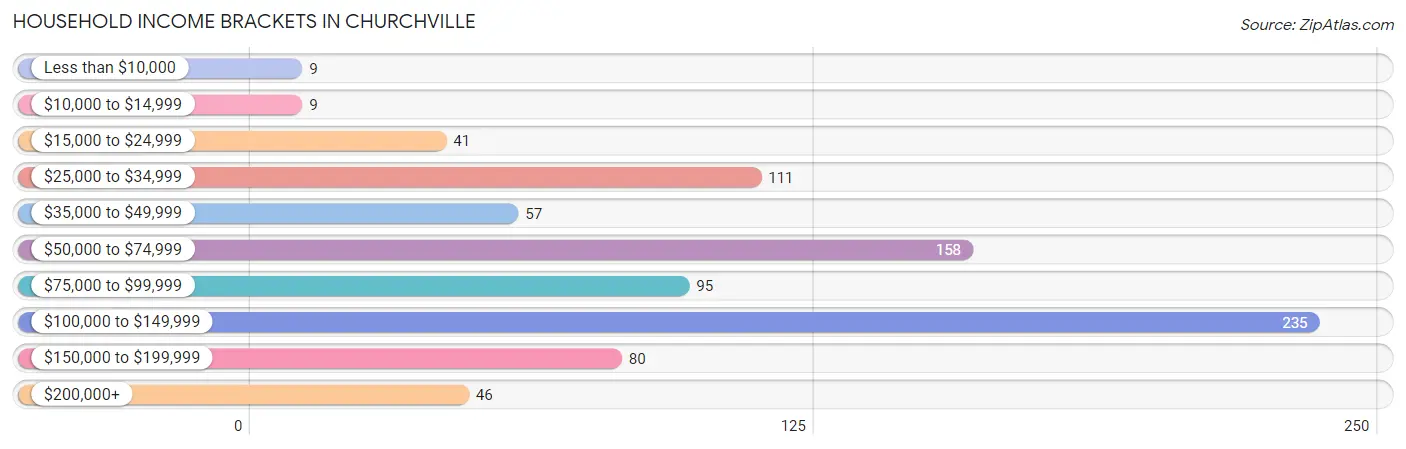
Household Income Brackets in Churchville
With 235 households falling in the category, the $100,000 to $149,999 income range is the most frequent in Churchville, accounting for 27.9% of all households. In contrast, only 9 households (1.1%) fall into the less than $10,000 income bracket, making it the least populous group.
| Income Bracket | # Households | % Households |
| Less than $10,000 | 9 | 1.1% |
| $10,000 to $14,999 | 9 | 1.1% |
| $15,000 to $24,999 | 41 | 4.9% |
| $25,000 to $34,999 | 111 | 13.2% |
| $35,000 to $49,999 | 57 | 6.8% |
| $50,000 to $74,999 | 158 | 18.8% |
| $75,000 to $99,999 | 95 | 11.3% |
| $100,000 to $149,999 | 235 | 27.9% |
| $150,000 to $199,999 | 80 | 9.5% |
| $200,000+ | 46 | 5.5% |
Household Income by Householder Age in Churchville
The median household income in Churchville is $83,631, with the highest median household income of $118,942 found in the 45 to 64 years age bracket for the primary householder. A total of 295 households (35.1%) fall into this category. Meanwhile, the 15 to 24 years age bracket for the primary householder has the lowest median household income of $0, with 5 households (0.6%) in this group.
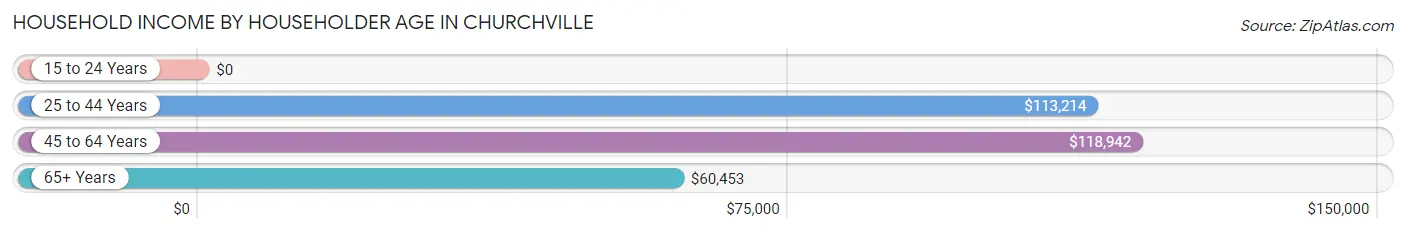
| Income Bracket | # Households | Median Income |
| 15 to 24 Years | 5 (0.6%) | $0 |
| 25 to 44 Years | 194 (23.1%) | $113,214 |
| 45 to 64 Years | 295 (35.1%) | $118,942 |
| 65+ Years | 347 (41.3%) | $60,453 |
| Total | 841 (100.0%) | $83,631 |
Poverty in Churchville
Income Below Poverty by Sex and Age in Churchville
With 0.4% poverty level for males and 2.6% for females among the residents of Churchville, 65 to 74 year old males and 75 year old and over females are the most vulnerable to poverty, with 4 males (2.7%) and 14 females (10.0%) in their respective age groups living below the poverty level.
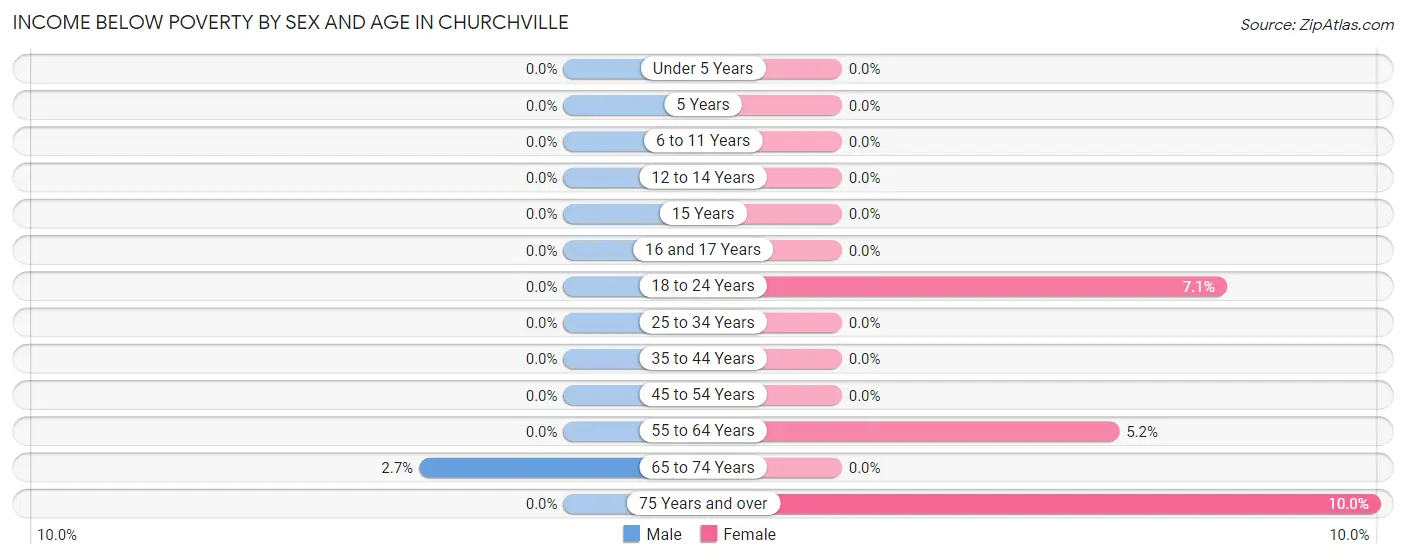
| Age Bracket | Male | Female |
| Under 5 Years | 0 (0.0%) | 0 (0.0%) |
| 5 Years | 0 (0.0%) | 0 (0.0%) |
| 6 to 11 Years | 0 (0.0%) | 0 (0.0%) |
| 12 to 14 Years | 0 (0.0%) | 0 (0.0%) |
| 15 Years | 0 (0.0%) | 0 (0.0%) |
| 16 and 17 Years | 0 (0.0%) | 0 (0.0%) |
| 18 to 24 Years | 0 (0.0%) | 4 (7.1%) |
| 25 to 34 Years | 0 (0.0%) | 0 (0.0%) |
| 35 to 44 Years | 0 (0.0%) | 0 (0.0%) |
| 45 to 54 Years | 0 (0.0%) | 0 (0.0%) |
| 55 to 64 Years | 0 (0.0%) | 7 (5.1%) |
| 65 to 74 Years | 4 (2.7%) | 0 (0.0%) |
| 75 Years and over | 0 (0.0%) | 14 (10.0%) |
| Total | 4 (0.4%) | 25 (2.6%) |
Income Above Poverty by Sex and Age in Churchville
According to the poverty statistics in Churchville, males aged under 5 years and females aged under 5 years are the age groups that are most secure financially, with 100.0% of males and 100.0% of females in these age groups living above the poverty line.
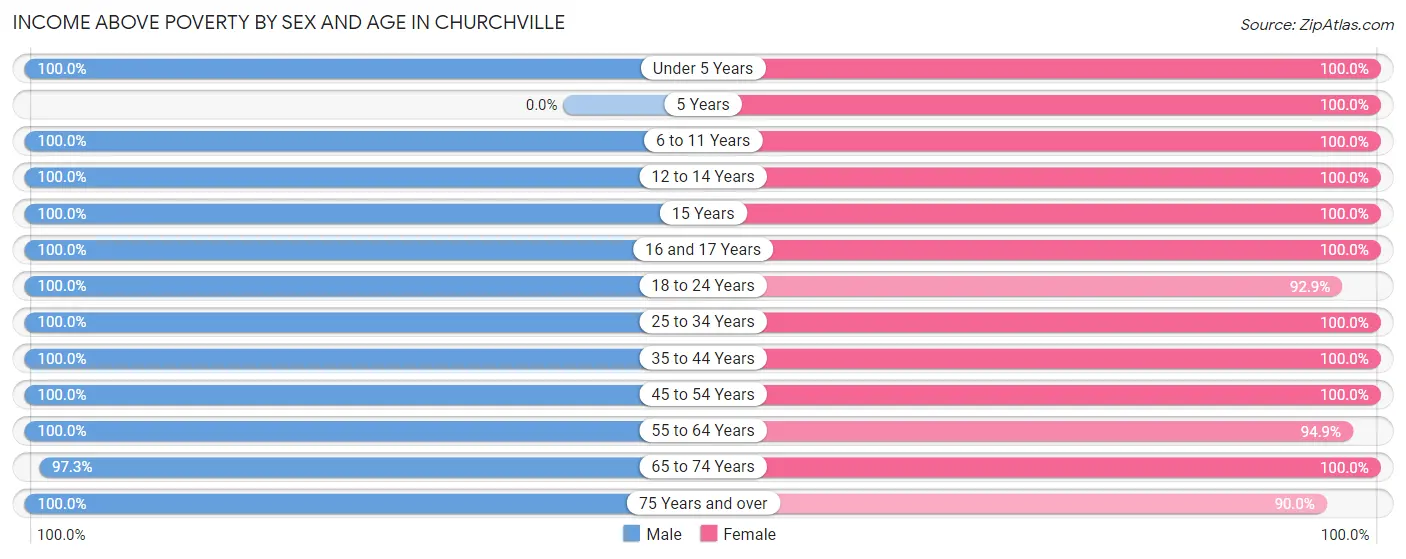
| Age Bracket | Male | Female |
| Under 5 Years | 66 (100.0%) | 83 (100.0%) |
| 5 Years | 0 (0.0%) | 5 (100.0%) |
| 6 to 11 Years | 34 (100.0%) | 33 (100.0%) |
| 12 to 14 Years | 11 (100.0%) | 25 (100.0%) |
| 15 Years | 5 (100.0%) | 6 (100.0%) |
| 16 and 17 Years | 7 (100.0%) | 40 (100.0%) |
| 18 to 24 Years | 102 (100.0%) | 52 (92.9%) |
| 25 to 34 Years | 79 (100.0%) | 83 (100.0%) |
| 35 to 44 Years | 138 (100.0%) | 84 (100.0%) |
| 45 to 54 Years | 99 (100.0%) | 140 (100.0%) |
| 55 to 64 Years | 140 (100.0%) | 129 (94.9%) |
| 65 to 74 Years | 145 (97.3%) | 130 (100.0%) |
| 75 Years and over | 96 (100.0%) | 126 (90.0%) |
| Total | 922 (99.6%) | 936 (97.4%) |
Income Below Poverty Among Married-Couple Families in Churchville
The poverty statistics for married-couple families in Churchville show that 0.9% or 4 of the total 468 families live below the poverty line. Families with no children have the highest poverty rate of 1.4%, comprising of 4 families. On the other hand, families with 1 or 2 children have the lowest poverty rate of 0.0%, which includes 0 families.
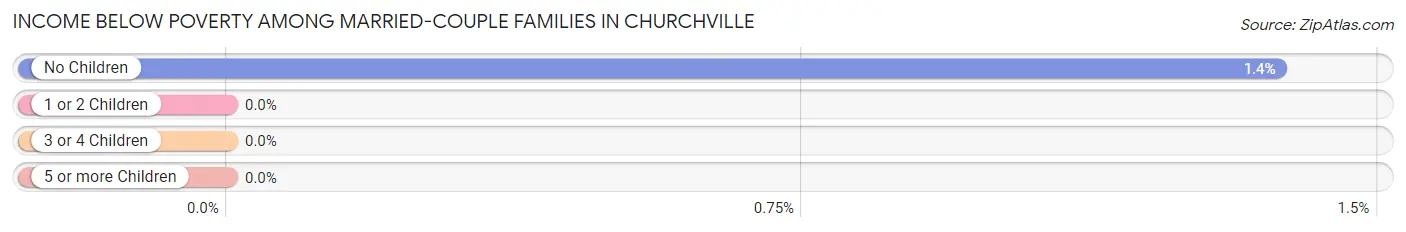
| Children | Above Poverty | Below Poverty |
| No Children | 287 (98.6%) | 4 (1.4%) |
| 1 or 2 Children | 177 (100.0%) | 0 (0.0%) |
| 3 or 4 Children | 0 (0.0%) | 0 (0.0%) |
| 5 or more Children | 0 (0.0%) | 0 (0.0%) |
| Total | 464 (99.2%) | 4 (0.9%) |
Income Below Poverty Among Single-Parent Households in Churchville
| Children | Single Father | Single Mother |
| No Children | 0 (0.0%) | 0 (0.0%) |
| 1 or 2 Children | 0 (0.0%) | 0 (0.0%) |
| 3 or 4 Children | 0 (0.0%) | 0 (0.0%) |
| 5 or more Children | 0 (0.0%) | 0 (0.0%) |
| Total | 0 (0.0%) | 0 (0.0%) |
Income Below Poverty Among Married-Couple vs Single-Parent Households in Churchville
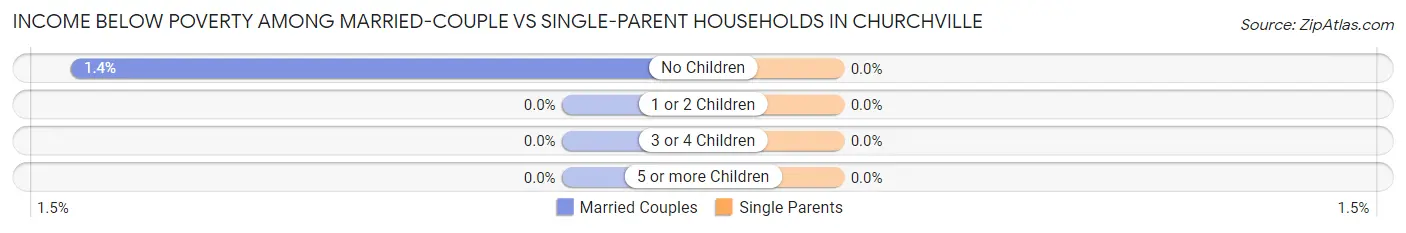
| Children | Married-Couple Families | Single-Parent Households |
| No Children | 4 (1.4%) | 0 (0.0%) |
| 1 or 2 Children | 0 (0.0%) | 0 (0.0%) |
| 3 or 4 Children | 0 (0.0%) | 0 (0.0%) |
| 5 or more Children | 0 (0.0%) | 0 (0.0%) |
| Total | 4 (0.9%) | 0 (0.0%) |
Race in Churchville
The most populous races in Churchville are White / Caucasian (1,779 | 94.3%), Two or more Races (38 | 2.0%), and Black / African American (30 | 1.6%).
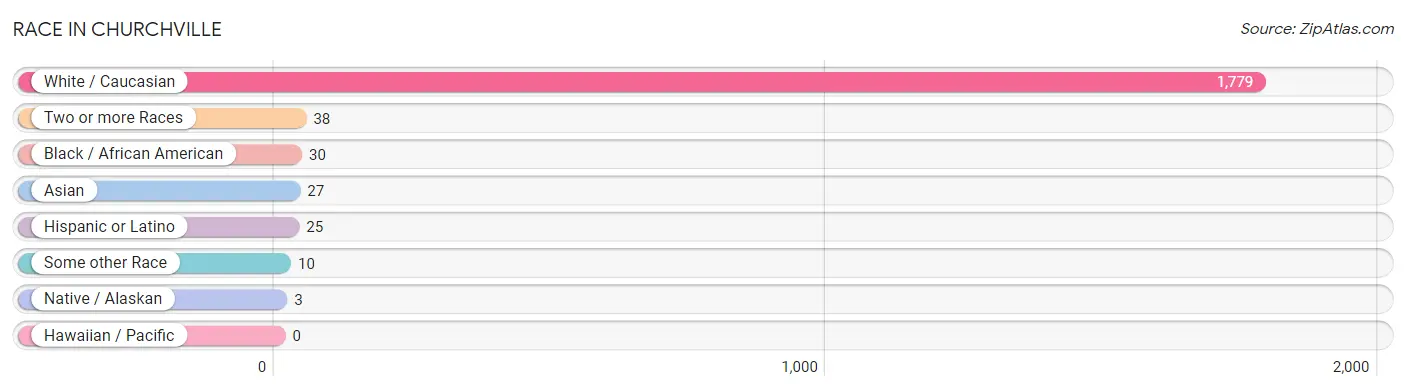
| Race | # Population | % Population |
| Asian | 27 | 1.4% |
| Black / African American | 30 | 1.6% |
| Hawaiian / Pacific | 0 | 0.0% |
| Hispanic or Latino | 25 | 1.3% |
| Native / Alaskan | 3 | 0.2% |
| White / Caucasian | 1,779 | 94.3% |
| Two or more Races | 38 | 2.0% |
| Some other Race | 10 | 0.5% |
| Total | 1,887 | 100.0% |
Ancestry in Churchville
The most populous ancestries reported in Churchville are German (549 | 29.1%), Irish (490 | 26.0%), English (409 | 21.7%), Italian (351 | 18.6%), and Polish (103 | 5.5%), together accounting for 100.8% of all Churchville residents.
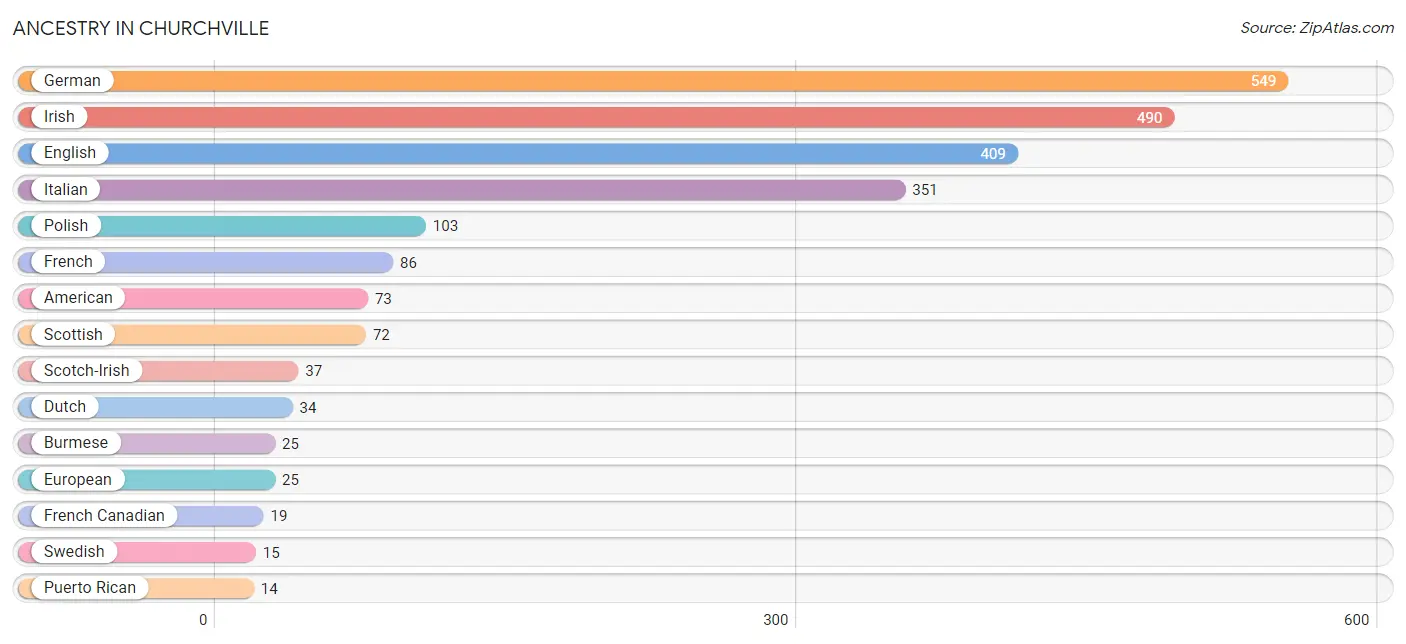
| Ancestry | # Population | % Population |
| American | 73 | 3.9% |
| Bhutanese | 12 | 0.6% |
| British | 11 | 0.6% |
| Burmese | 25 | 1.3% |
| Canadian | 4 | 0.2% |
| Central American | 8 | 0.4% |
| Dutch | 34 | 1.8% |
| Eastern European | 5 | 0.3% |
| English | 409 | 21.7% |
| European | 25 | 1.3% |
| French | 86 | 4.6% |
| French Canadian | 19 | 1.0% |
| German | 549 | 29.1% |
| Greek | 5 | 0.3% |
| Hungarian | 8 | 0.4% |
| Irish | 490 | 26.0% |
| Iroquois | 3 | 0.2% |
| Italian | 351 | 18.6% |
| Jamaican | 8 | 0.4% |
| Lithuanian | 4 | 0.2% |
| Macedonian | 8 | 0.4% |
| Mexican | 3 | 0.2% |
| New Zealander | 5 | 0.3% |
| Norwegian | 5 | 0.3% |
| Panamanian | 8 | 0.4% |
| Polish | 103 | 5.5% |
| Puerto Rican | 14 | 0.7% |
| Russian | 10 | 0.5% |
| Scotch-Irish | 37 | 2.0% |
| Scottish | 72 | 3.8% |
| Slovak | 10 | 0.5% |
| Swedish | 15 | 0.8% |
| Swiss | 4 | 0.2% |
| Thai | 2 | 0.1% |
| Ukrainian | 9 | 0.5% |
| Welsh | 6 | 0.3% | View All 36 Rows |
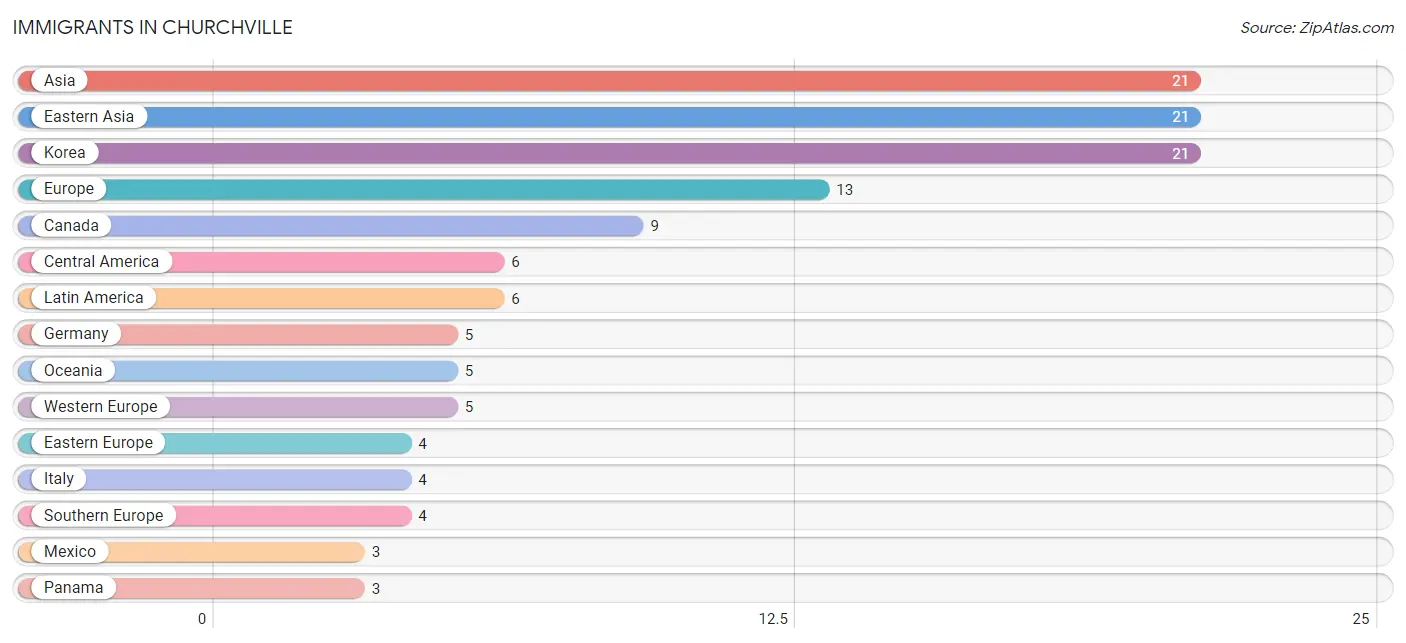
Immigrants in Churchville
The most numerous immigrant groups reported in Churchville came from Asia (21 | 1.1%), Eastern Asia (21 | 1.1%), Korea (21 | 1.1%), Europe (13 | 0.7%), and Canada (9 | 0.5%), together accounting for 4.5% of all Churchville residents.
| Immigration Origin | # Population | % Population |
| Asia | 21 | 1.1% |
| Canada | 9 | 0.5% |
| Central America | 6 | 0.3% |
| Eastern Asia | 21 | 1.1% |
| Eastern Europe | 4 | 0.2% |
| Europe | 13 | 0.7% |
| Germany | 5 | 0.3% |
| Italy | 4 | 0.2% |
| Korea | 21 | 1.1% |
| Latin America | 6 | 0.3% |
| Mexico | 3 | 0.2% |
| Oceania | 5 | 0.3% |
| Panama | 3 | 0.2% |
| Southern Europe | 4 | 0.2% |
| Western Europe | 5 | 0.3% | View All 15 Rows |
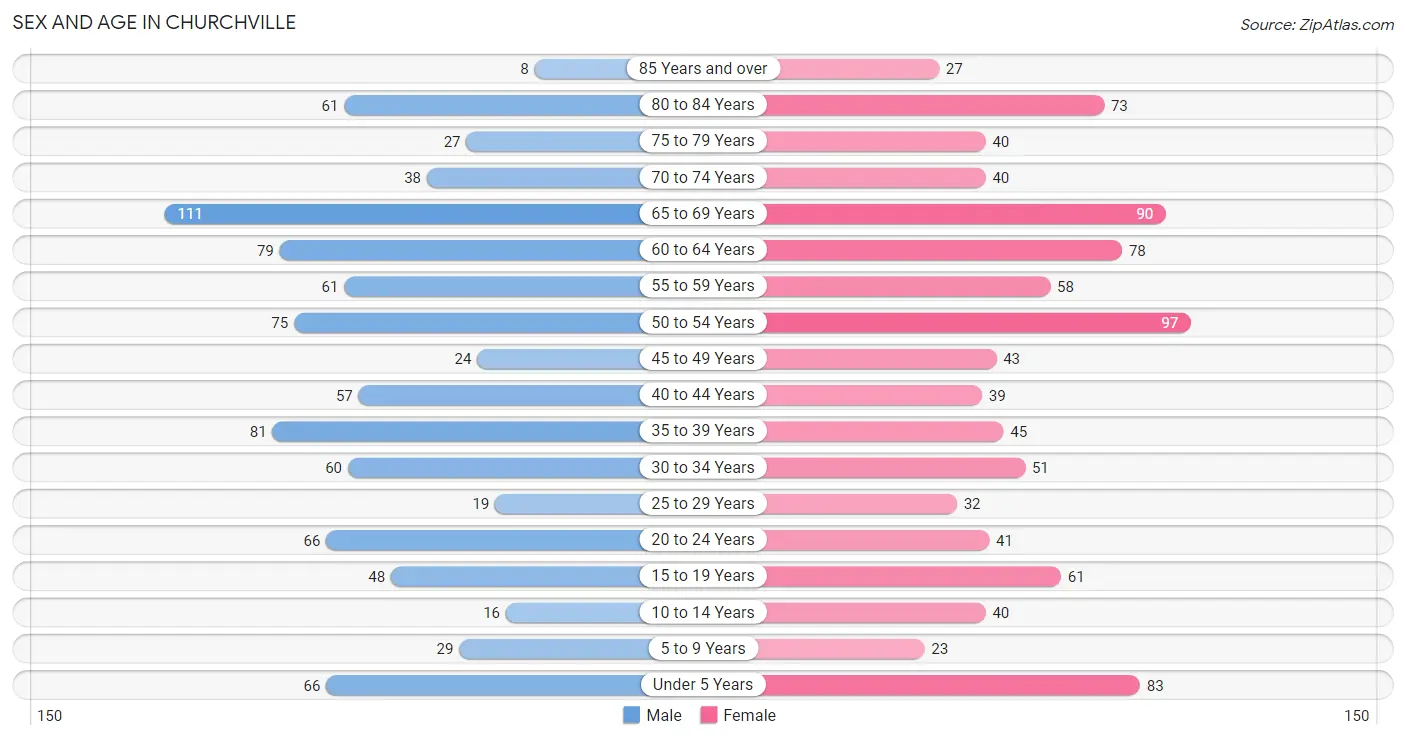
Sex and Age in Churchville
Sex and Age in Churchville
The most populous age groups in Churchville are 65 to 69 Years (111 | 12.0%) for men and 50 to 54 Years (97 | 10.1%) for women.
| Age Bracket | Male | Female |
| Under 5 Years | 66 (7.1%) | 83 (8.6%) |
| 5 to 9 Years | 29 (3.1%) | 23 (2.4%) |
| 10 to 14 Years | 16 (1.7%) | 40 (4.2%) |
| 15 to 19 Years | 48 (5.2%) | 61 (6.4%) |
| 20 to 24 Years | 66 (7.1%) | 41 (4.3%) |
| 25 to 29 Years | 19 (2.1%) | 32 (3.3%) |
| 30 to 34 Years | 60 (6.5%) | 51 (5.3%) |
| 35 to 39 Years | 81 (8.7%) | 45 (4.7%) |
| 40 to 44 Years | 57 (6.2%) | 39 (4.1%) |
| 45 to 49 Years | 24 (2.6%) | 43 (4.5%) |
| 50 to 54 Years | 75 (8.1%) | 97 (10.1%) |
| 55 to 59 Years | 61 (6.6%) | 58 (6.0%) |
| 60 to 64 Years | 79 (8.5%) | 78 (8.1%) |
| 65 to 69 Years | 111 (12.0%) | 90 (9.4%) |
| 70 to 74 Years | 38 (4.1%) | 40 (4.2%) |
| 75 to 79 Years | 27 (2.9%) | 40 (4.2%) |
| 80 to 84 Years | 61 (6.6%) | 73 (7.6%) |
| 85 Years and over | 8 (0.9%) | 27 (2.8%) |
| Total | 926 (100.0%) | 961 (100.0%) |
Families and Households in Churchville
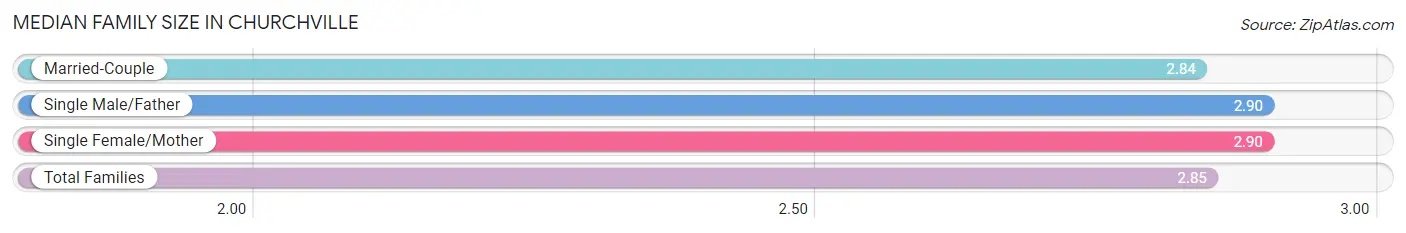
Median Family Size in Churchville
The median family size in Churchville is 2.85 persons per family, with single male/father families (10 | 1.8%) accounting for the largest median family size of 2.9 persons per family. On the other hand, married-couple families (468 | 86.5%) represent the smallest median family size with 2.84 persons per family.
| Family Type | # Families | Family Size |
| Married-Couple | 468 (86.5%) | 2.84 |
| Single Male/Father | 10 (1.8%) | 2.90 |
| Single Female/Mother | 63 (11.7%) | 2.90 |
| Total Families | 541 (100.0%) | 2.85 |
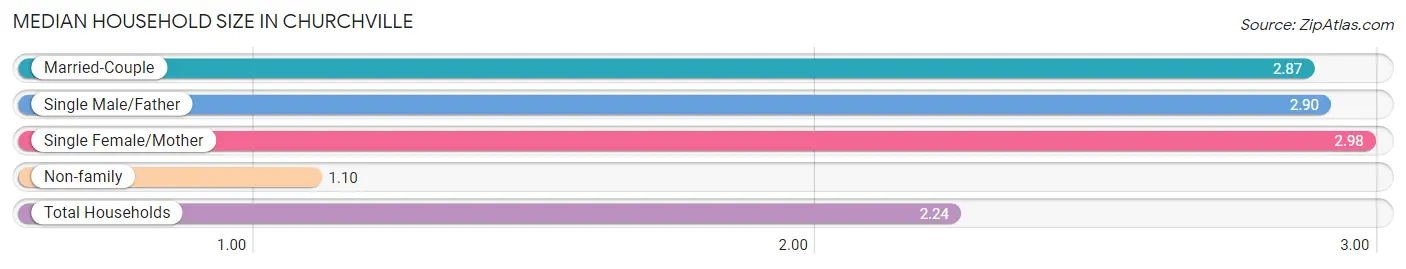
Median Household Size in Churchville
The median household size in Churchville is 2.24 persons per household, with single female/mother households (63 | 7.5%) accounting for the largest median household size of 2.98 persons per household. non-family households (300 | 35.7%) represent the smallest median household size with 1.10 persons per household.
| Household Type | # Households | Household Size |
| Married-Couple | 468 (55.6%) | 2.87 |
| Single Male/Father | 10 (1.2%) | 2.90 |
| Single Female/Mother | 63 (7.5%) | 2.98 |
| Non-family | 300 (35.7%) | 1.10 |
| Total Households | 841 (100.0%) | 2.24 |
Household Size by Marriage Status in Churchville
Out of a total of 841 households in Churchville, 541 (64.3%) are family households, while 300 (35.7%) are nonfamily households. The most numerous type of family households are 2-person households, comprising 261, and the most common type of nonfamily households are 1-person households, comprising 263.
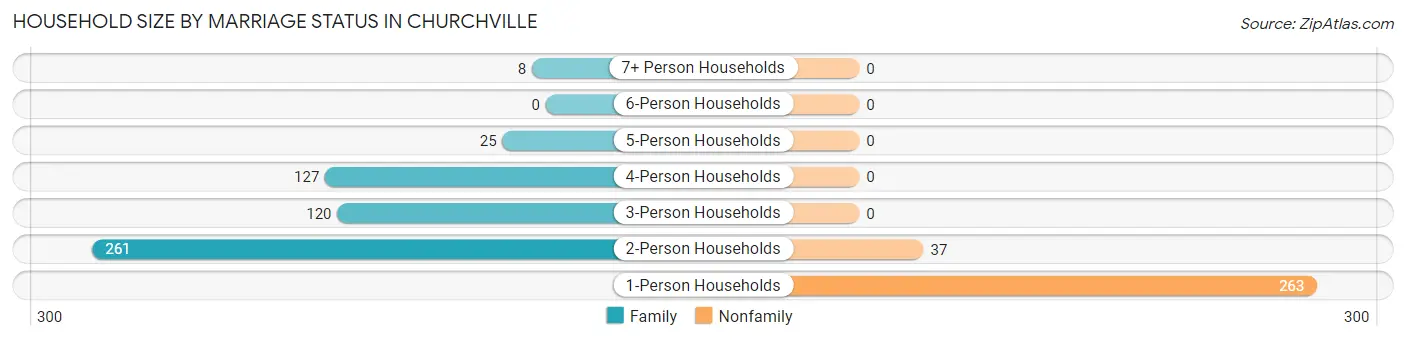
| Household Size | Family Households | Nonfamily Households |
| 1-Person Households | - | 263 (31.3%) |
| 2-Person Households | 261 (31.0%) | 37 (4.4%) |
| 3-Person Households | 120 (14.3%) | 0 (0.0%) |
| 4-Person Households | 127 (15.1%) | 0 (0.0%) |
| 5-Person Households | 25 (3.0%) | 0 (0.0%) |
| 6-Person Households | 0 (0.0%) | 0 (0.0%) |
| 7+ Person Households | 8 (0.9%) | 0 (0.0%) |
| Total | 541 (64.3%) | 300 (35.7%) |
Female Fertility in Churchville
Fertility by Age in Churchville
Average fertility rate in Churchville is 146.0 births per 1,000 women. Women in the age bracket of 20 to 34 years have the highest fertility rate with 258.0 births per 1,000 women. Women in the age bracket of 20 to 34 years acount for 66.7% of all women with births.
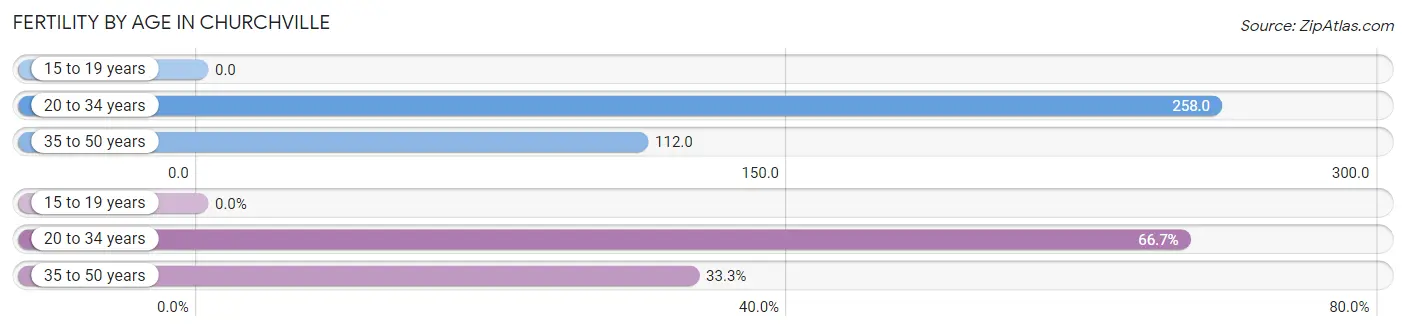
| Age Bracket | Women with Births | Births / 1,000 Women |
| 15 to 19 years | 0 (0.0%) | 0.0 |
| 20 to 34 years | 32 (66.7%) | 258.0 |
| 35 to 50 years | 16 (33.3%) | 112.0 |
| Total | 48 (100.0%) | 146.0 |
Fertility by Age by Marriage Status in Churchville
89.6% of women with births (48) in Churchville are married. The highest percentage of unmarried women with births falls into 35 to 50 years age bracket with 31.2% of them unmarried at the time of birth, while the lowest percentage of unmarried women with births belong to 20 to 34 years age bracket with 0.0% of them unmarried.
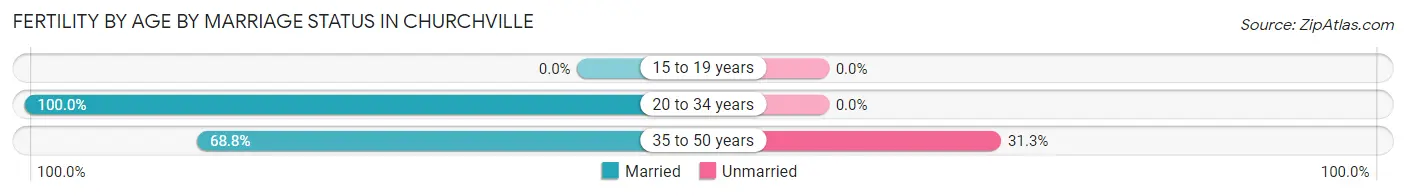
| Age Bracket | Married | Unmarried |
| 15 to 19 years | 0 (0.0%) | 0 (0.0%) |
| 20 to 34 years | 32 (100.0%) | 0 (0.0%) |
| 35 to 50 years | 11 (68.8%) | 5 (31.2%) |
| Total | 43 (89.6%) | 5 (10.4%) |
Fertility by Education in Churchville
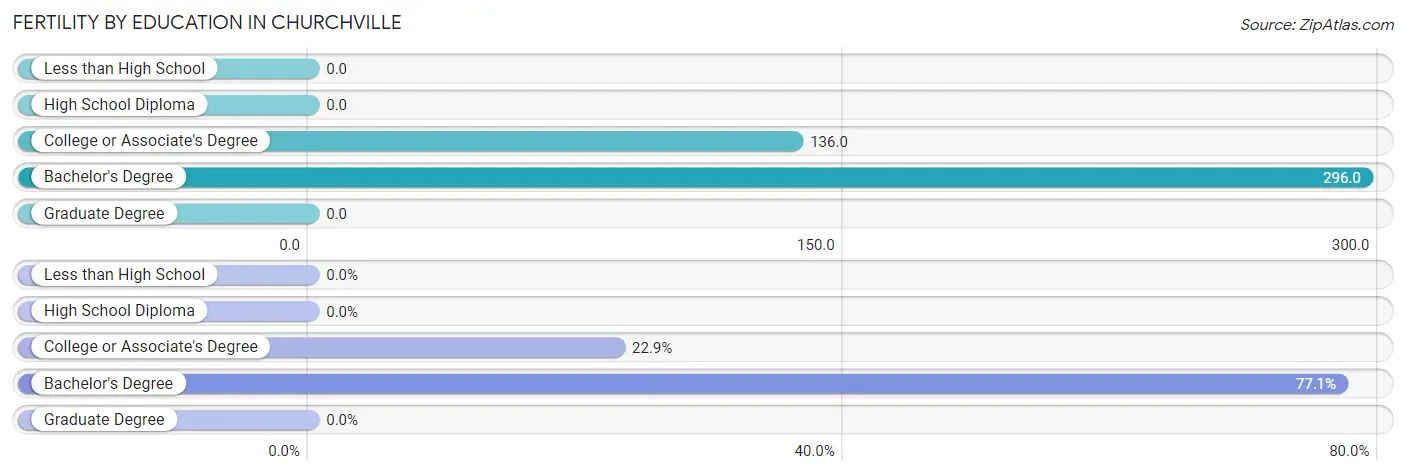
| Educational Attainment | Women with Births | Births / 1,000 Women |
| Less than High School | 0 (0.0%) | 0.0 |
| High School Diploma | 0 (0.0%) | 0.0 |
| College or Associate's Degree | 11 (22.9%) | 136.0 |
| Bachelor's Degree | 37 (77.1%) | 296.0 |
| Graduate Degree | 0 (0.0%) | 0.0 |
| Total | 48 (100.0%) | 146.0 |
Fertility by Education by Marriage Status in Churchville
10.4% of women with births in Churchville are unmarried. Women with the educational attainment of bachelor's degree are most likely to be married with 100.0% of them married at childbirth, while women with the educational attainment of college or associate's degree are least likely to be married with 45.5% of them unmarried at childbirth.
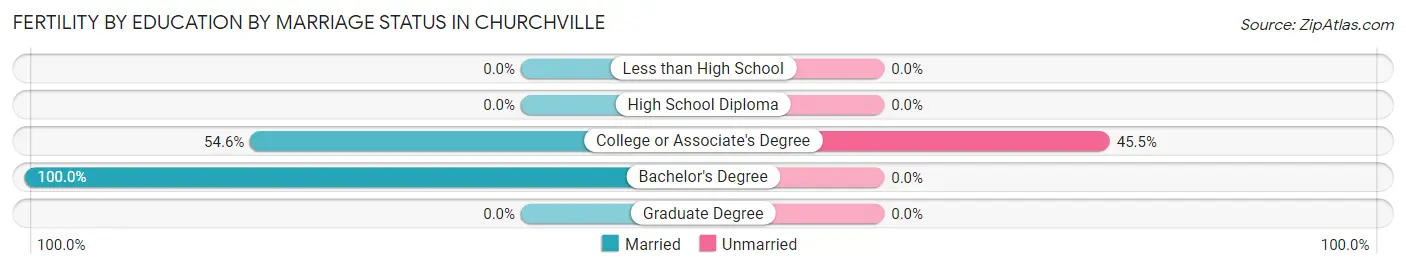
| Educational Attainment | Married | Unmarried |
| Less than High School | 0 (0.0%) | 0 (0.0%) |
| High School Diploma | 0 (0.0%) | 0 (0.0%) |
| College or Associate's Degree | 6 (54.5%) | 5 (45.5%) |
| Bachelor's Degree | 37 (100.0%) | 0 (0.0%) |
| Graduate Degree | 0 (0.0%) | 0 (0.0%) |
| Total | 43 (89.6%) | 5 (10.4%) |
Employment Characteristics in Churchville
Employment by Class of Employer in Churchville
Among the 951 employed individuals in Churchville, private company employees (520 | 54.7%), local government employees (180 | 18.9%), and not-for-profit organizations (142 | 14.9%) make up the most common classes of employment.
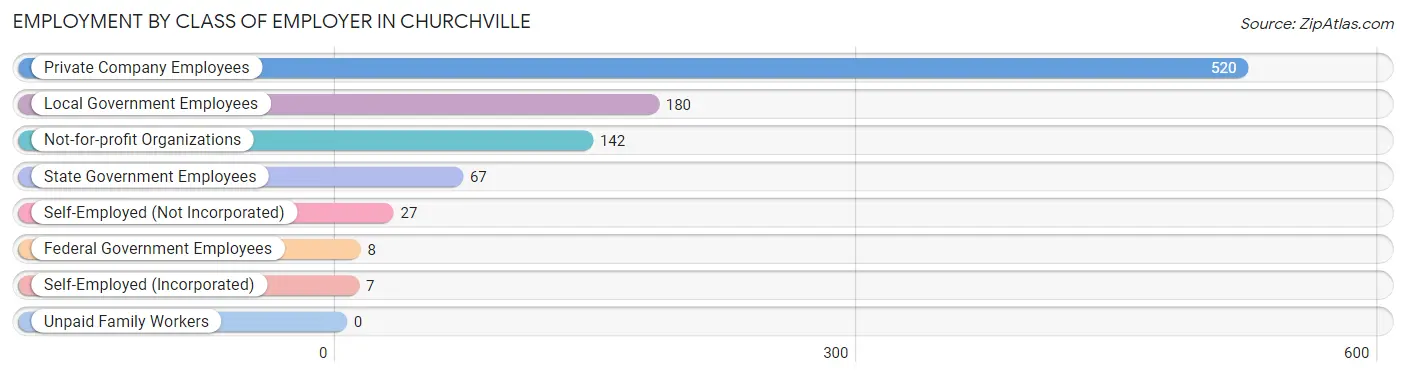
| Employer Class | # Employees | % Employees |
| Private Company Employees | 520 | 54.7% |
| Self-Employed (Incorporated) | 7 | 0.7% |
| Self-Employed (Not Incorporated) | 27 | 2.8% |
| Not-for-profit Organizations | 142 | 14.9% |
| Local Government Employees | 180 | 18.9% |
| State Government Employees | 67 | 7.0% |
| Federal Government Employees | 8 | 0.8% |
| Unpaid Family Workers | 0 | 0.0% |
| Total | 951 | 100.0% |
Employment Status by Age in Churchville
According to the labor force statistics for Churchville, out of the total population over 16 years of age (1,619), 63.0% or 1,020 individuals are in the labor force, with 3.5% or 36 of them unemployed. The age group with the highest labor force participation rate is 30 to 34 years, with 100.0% or 111 individuals in the labor force. Within the labor force, the 65 to 74 years age range has the highest percentage of unemployed individuals, with 9.0% or 7 of them being unemployed.
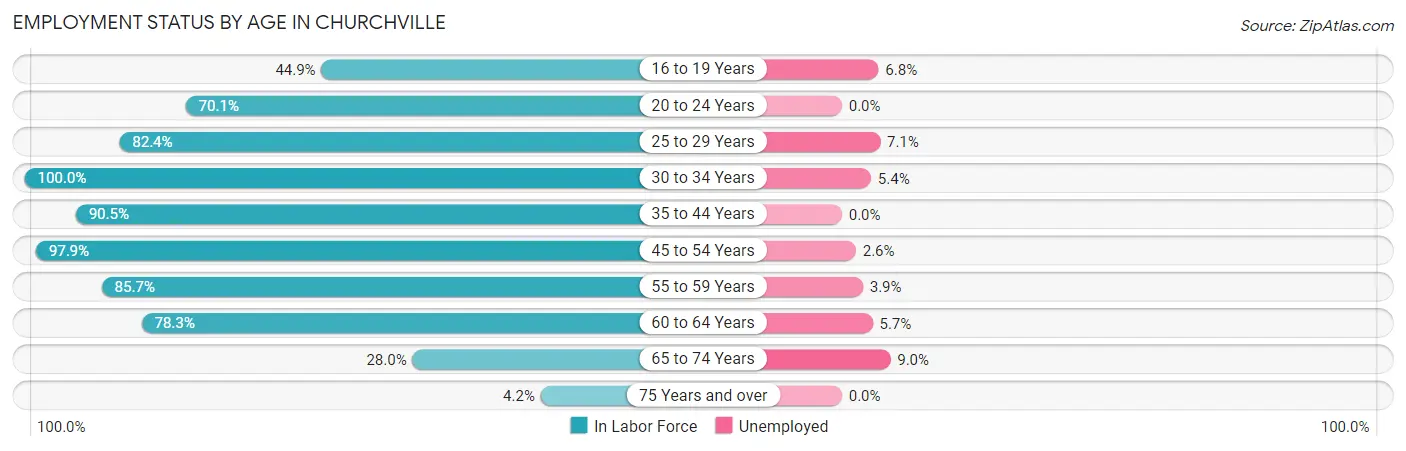
| Age Bracket | In Labor Force | Unemployed |
| 16 to 19 Years | 44 (44.9%) | 3 (6.8%) |
| 20 to 24 Years | 75 (70.1%) | 0 (0.0%) |
| 25 to 29 Years | 42 (82.4%) | 3 (7.1%) |
| 30 to 34 Years | 111 (100.0%) | 6 (5.4%) |
| 35 to 44 Years | 201 (90.5%) | 0 (0.0%) |
| 45 to 54 Years | 234 (97.9%) | 6 (2.6%) |
| 55 to 59 Years | 102 (85.7%) | 4 (3.9%) |
| 60 to 64 Years | 123 (78.3%) | 7 (5.7%) |
| 65 to 74 Years | 78 (28.0%) | 7 (9.0%) |
| 75 Years and over | 10 (4.2%) | 0 (0.0%) |
| Total | 1,020 (63.0%) | 36 (3.5%) |
Employment Status by Educational Attainment in Churchville
According to labor force statistics for Churchville, 90.4% of individuals (813) out of the total population between 25 and 64 years of age (899) are in the labor force, with 3.2% or 26 of them being unemployed. The group with the highest labor force participation rate are those with the educational attainment of college / associate degree, with 91.9% or 238 individuals in the labor force. Within the labor force, individuals with college / associate degree education have the highest percentage of unemployment, with 5.9% or 14 of them being unemployed.
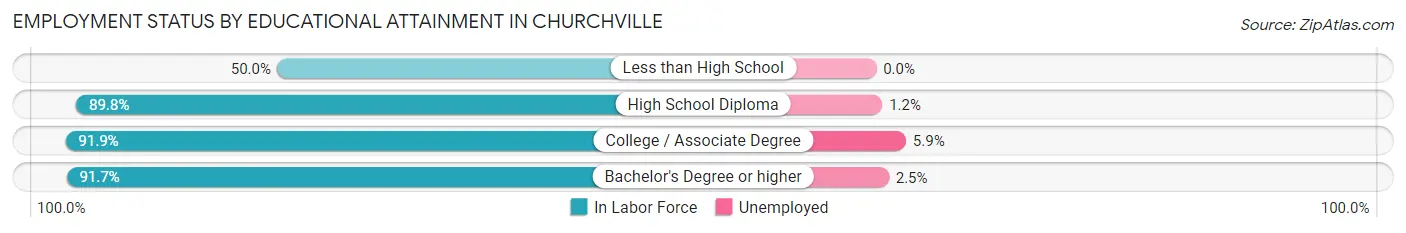
| Educational Attainment | In Labor Force | Unemployed |
| Less than High School | 10 (50.0%) | 0 (0.0%) |
| High School Diploma | 167 (89.8%) | 2 (1.2%) |
| College / Associate Degree | 238 (91.9%) | 15 (5.9%) |
| Bachelor's Degree or higher | 398 (91.7%) | 11 (2.5%) |
| Total | 813 (90.4%) | 29 (3.2%) |
Employment Occupations by Sex in Churchville
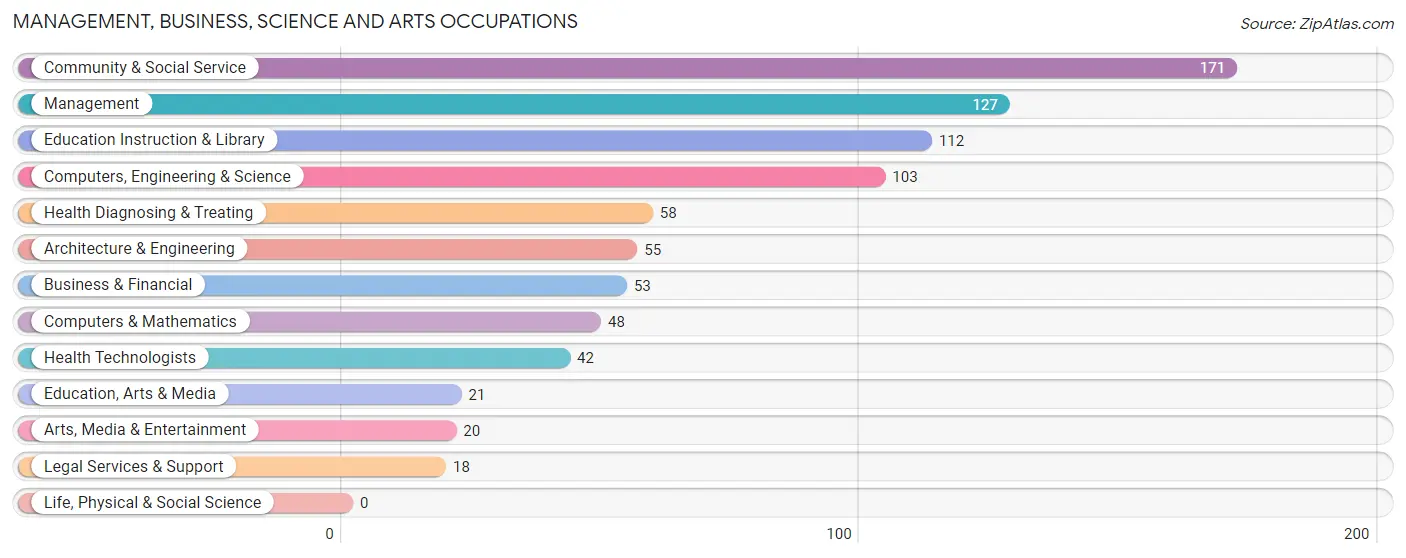
Management, Business, Science and Arts Occupations
The most common Management, Business, Science and Arts occupations in Churchville are Community & Social Service (171 | 17.4%), Management (127 | 12.9%), Education Instruction & Library (112 | 11.4%), Computers, Engineering & Science (103 | 10.5%), and Health Diagnosing & Treating (58 | 5.9%).
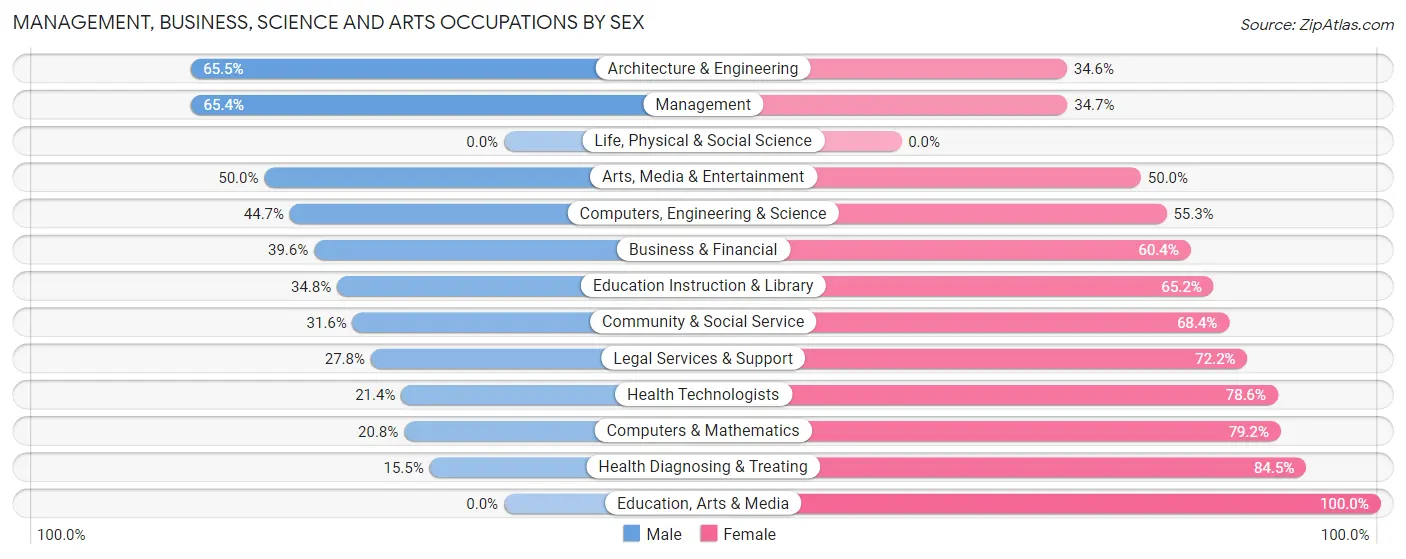
Management, Business, Science and Arts Occupations by Sex
Within the Management, Business, Science and Arts occupations in Churchville, the most male-oriented occupations are Architecture & Engineering (65.4%), Management (65.3%), and Arts, Media & Entertainment (50.0%), while the most female-oriented occupations are Education, Arts & Media (100.0%), Health Diagnosing & Treating (84.5%), and Computers & Mathematics (79.2%).
| Occupation | Male | Female |
| Management | 83 (65.3%) | 44 (34.6%) |
| Business & Financial | 21 (39.6%) | 32 (60.4%) |
| Computers, Engineering & Science | 46 (44.7%) | 57 (55.3%) |
| Computers & Mathematics | 10 (20.8%) | 38 (79.2%) |
| Architecture & Engineering | 36 (65.4%) | 19 (34.5%) |
| Life, Physical & Social Science | 0 (0.0%) | 0 (0.0%) |
| Community & Social Service | 54 (31.6%) | 117 (68.4%) |
| Education, Arts & Media | 0 (0.0%) | 21 (100.0%) |
| Legal Services & Support | 5 (27.8%) | 13 (72.2%) |
| Education Instruction & Library | 39 (34.8%) | 73 (65.2%) |
| Arts, Media & Entertainment | 10 (50.0%) | 10 (50.0%) |
| Health Diagnosing & Treating | 9 (15.5%) | 49 (84.5%) |
| Health Technologists | 9 (21.4%) | 33 (78.6%) |
| Total (Category) | 213 (41.6%) | 299 (58.4%) |
| Total (Overall) | 490 (49.8%) | 494 (50.2%) |
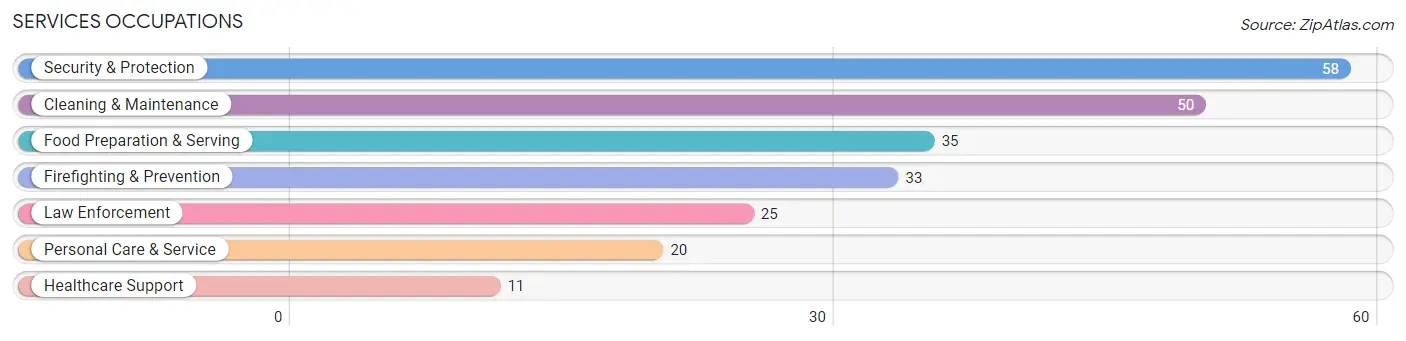
Services Occupations
The most common Services occupations in Churchville are Security & Protection (58 | 5.9%), Cleaning & Maintenance (50 | 5.1%), Food Preparation & Serving (35 | 3.6%), Firefighting & Prevention (33 | 3.4%), and Law Enforcement (25 | 2.5%).
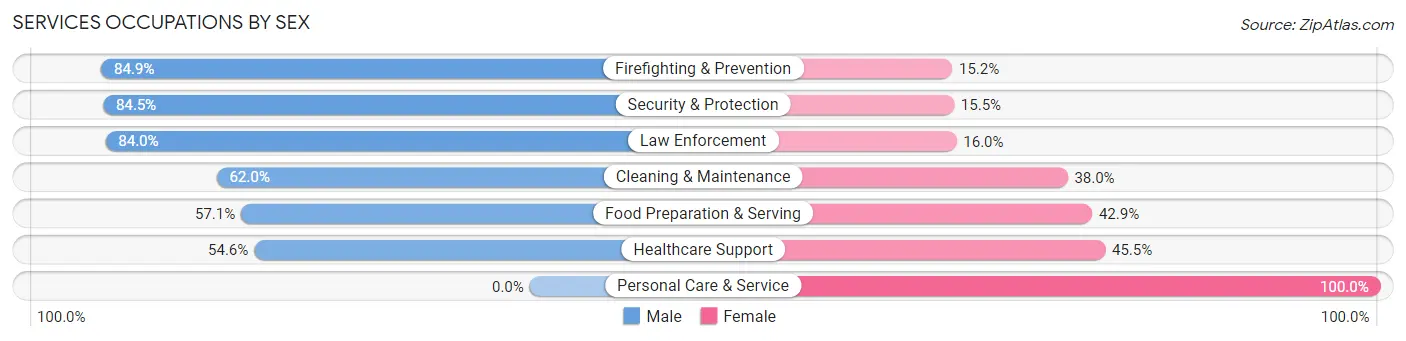
Services Occupations by Sex
Within the Services occupations in Churchville, the most male-oriented occupations are Firefighting & Prevention (84.9%), Security & Protection (84.5%), and Law Enforcement (84.0%), while the most female-oriented occupations are Personal Care & Service (100.0%), Healthcare Support (45.5%), and Food Preparation & Serving (42.9%).
| Occupation | Male | Female |
| Healthcare Support | 6 (54.5%) | 5 (45.5%) |
| Security & Protection | 49 (84.5%) | 9 (15.5%) |
| Firefighting & Prevention | 28 (84.9%) | 5 (15.1%) |
| Law Enforcement | 21 (84.0%) | 4 (16.0%) |
| Food Preparation & Serving | 20 (57.1%) | 15 (42.9%) |
| Cleaning & Maintenance | 31 (62.0%) | 19 (38.0%) |
| Personal Care & Service | 0 (0.0%) | 20 (100.0%) |
| Total (Category) | 106 (60.9%) | 68 (39.1%) |
| Total (Overall) | 490 (49.8%) | 494 (50.2%) |
Sales and Office Occupations
The most common Sales and Office occupations in Churchville are Office & Administration (106 | 10.8%), and Sales & Related (34 | 3.5%).

Sales and Office Occupations by Sex

| Occupation | Male | Female |
| Sales & Related | 19 (55.9%) | 15 (44.1%) |
| Office & Administration | 14 (13.2%) | 92 (86.8%) |
| Total (Category) | 33 (23.6%) | 107 (76.4%) |
| Total (Overall) | 490 (49.8%) | 494 (50.2%) |
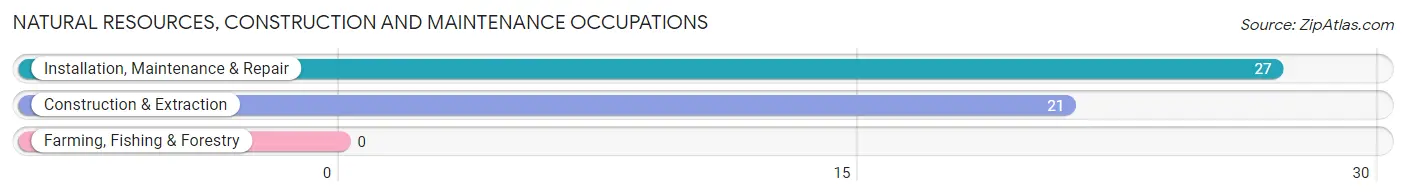
Natural Resources, Construction and Maintenance Occupations
The most common Natural Resources, Construction and Maintenance occupations in Churchville are Installation, Maintenance & Repair (27 | 2.7%), and Construction & Extraction (21 | 2.1%).
Natural Resources, Construction and Maintenance Occupations by Sex
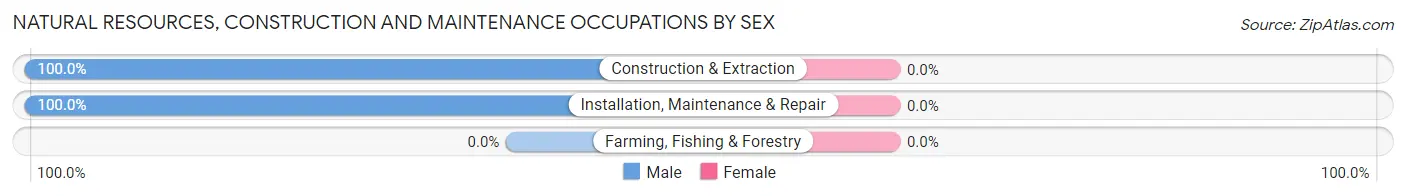
| Occupation | Male | Female |
| Farming, Fishing & Forestry | 0 (0.0%) | 0 (0.0%) |
| Construction & Extraction | 21 (100.0%) | 0 (0.0%) |
| Installation, Maintenance & Repair | 27 (100.0%) | 0 (0.0%) |
| Total (Category) | 48 (100.0%) | 0 (0.0%) |
| Total (Overall) | 490 (49.8%) | 494 (50.2%) |
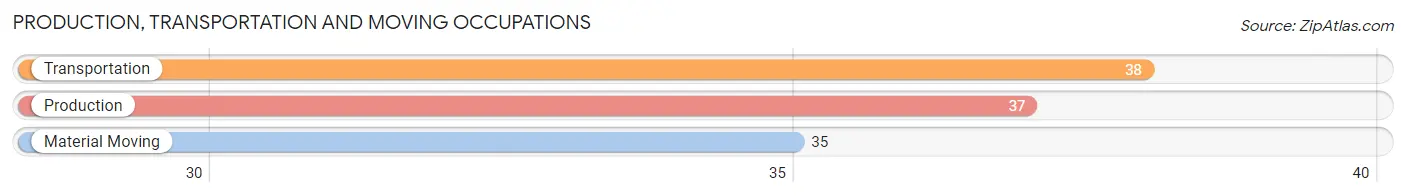
Production, Transportation and Moving Occupations
The most common Production, Transportation and Moving occupations in Churchville are Transportation (38 | 3.9%), Production (37 | 3.8%), and Material Moving (35 | 3.6%).
Production, Transportation and Moving Occupations by Sex
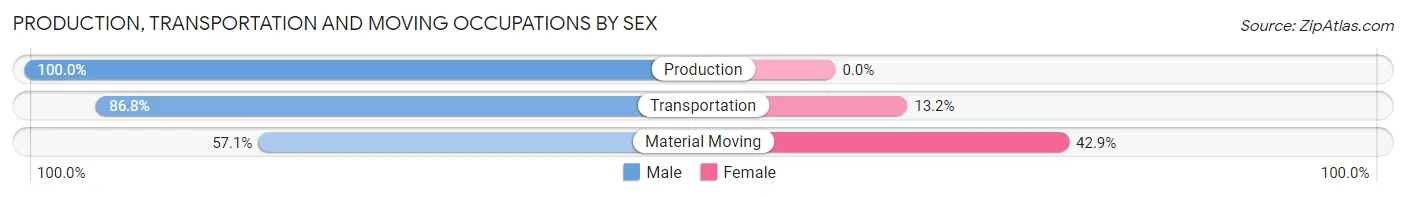
| Occupation | Male | Female |
| Production | 37 (100.0%) | 0 (0.0%) |
| Transportation | 33 (86.8%) | 5 (13.2%) |
| Material Moving | 20 (57.1%) | 15 (42.9%) |
| Total (Category) | 90 (81.8%) | 20 (18.2%) |
| Total (Overall) | 490 (49.8%) | 494 (50.2%) |
Employment Industries by Sex in Churchville
Employment Industries in Churchville
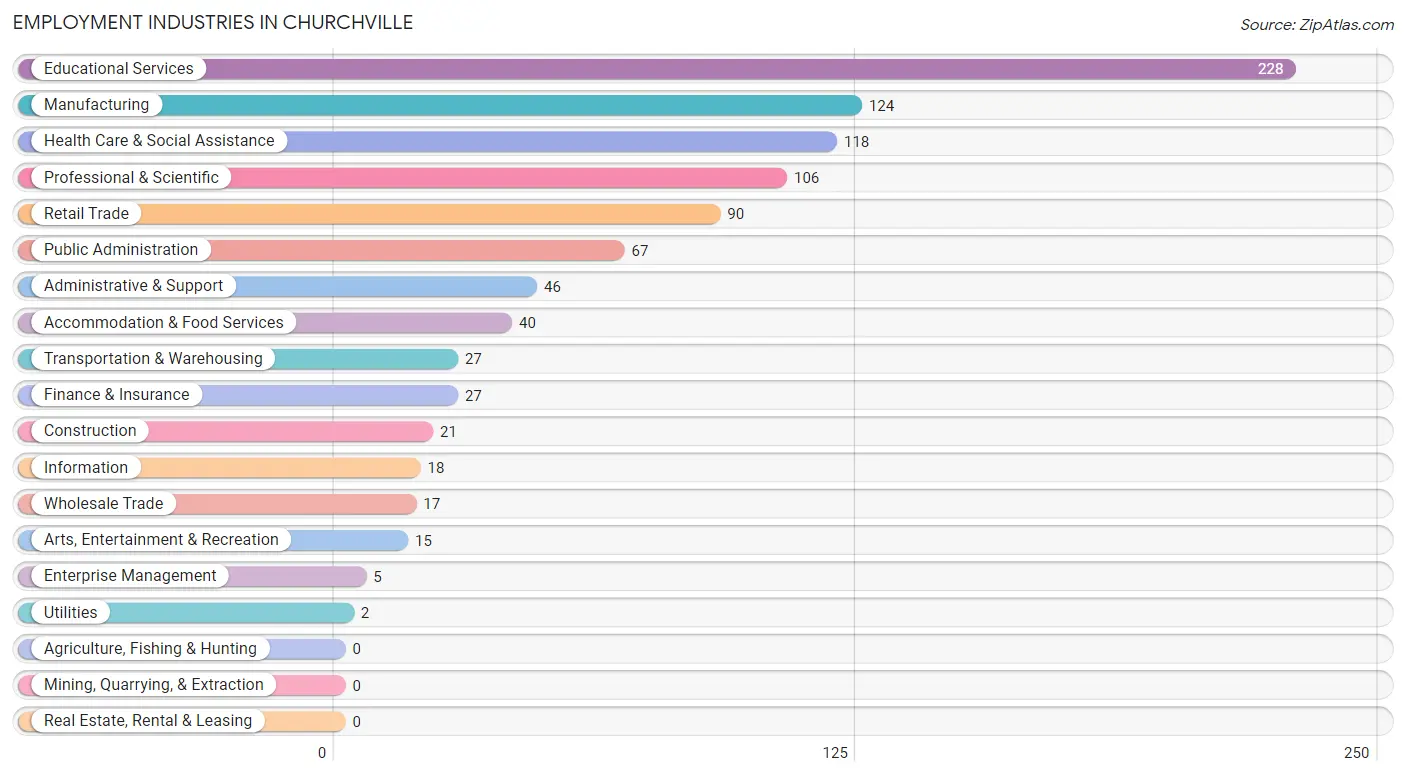
The major employment industries in Churchville include Educational Services (228 | 23.2%), Manufacturing (124 | 12.6%), Health Care & Social Assistance (118 | 12.0%), Professional & Scientific (106 | 10.8%), and Retail Trade (90 | 9.1%).
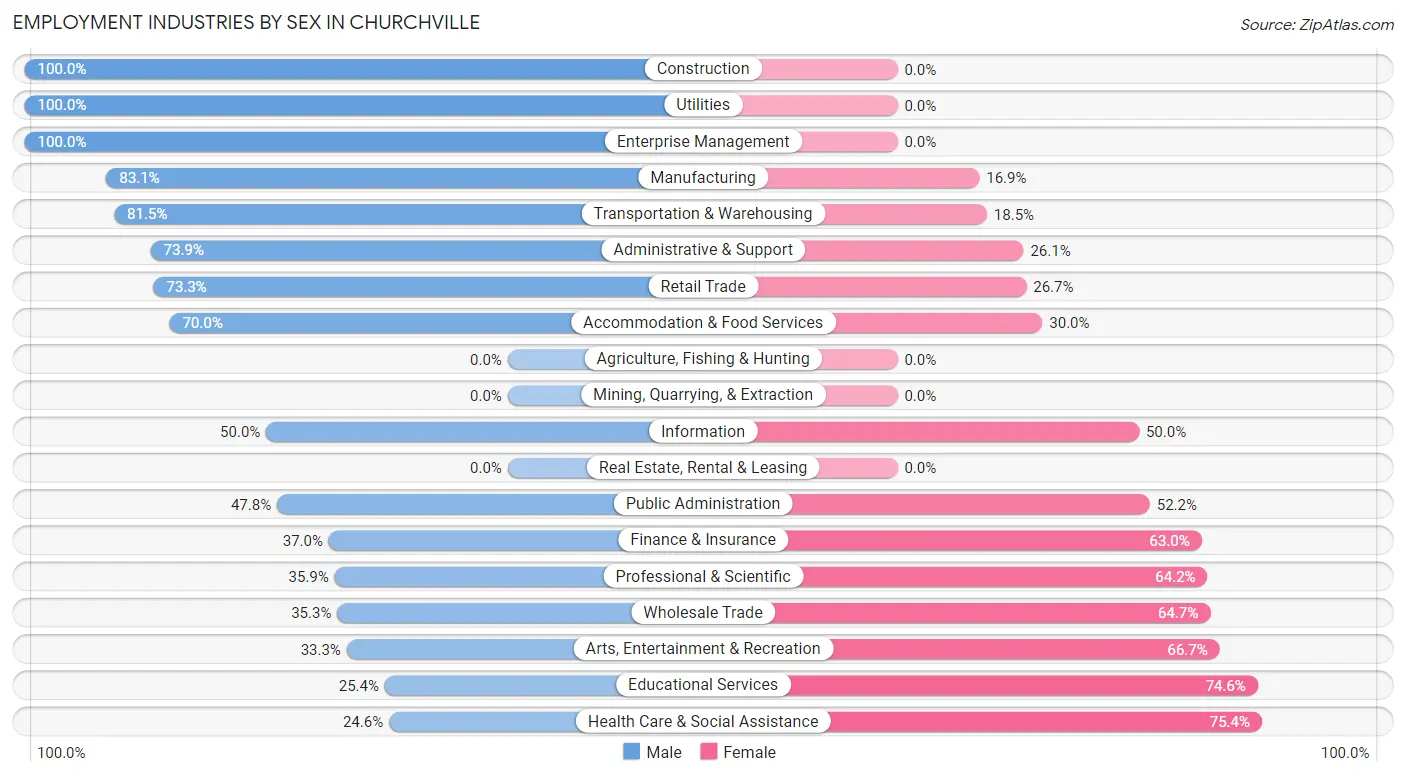
Employment Industries by Sex in Churchville
The Churchville industries that see more men than women are Construction (100.0%), Utilities (100.0%), and Enterprise Management (100.0%), whereas the industries that tend to have a higher number of women are Health Care & Social Assistance (75.4%), Educational Services (74.6%), and Arts, Entertainment & Recreation (66.7%).
| Industry | Male | Female |
| Agriculture, Fishing & Hunting | 0 (0.0%) | 0 (0.0%) |
| Mining, Quarrying, & Extraction | 0 (0.0%) | 0 (0.0%) |
| Construction | 21 (100.0%) | 0 (0.0%) |
| Manufacturing | 103 (83.1%) | 21 (16.9%) |
| Wholesale Trade | 6 (35.3%) | 11 (64.7%) |
| Retail Trade | 66 (73.3%) | 24 (26.7%) |
| Transportation & Warehousing | 22 (81.5%) | 5 (18.5%) |
| Utilities | 2 (100.0%) | 0 (0.0%) |
| Information | 9 (50.0%) | 9 (50.0%) |
| Finance & Insurance | 10 (37.0%) | 17 (63.0%) |
| Real Estate, Rental & Leasing | 0 (0.0%) | 0 (0.0%) |
| Professional & Scientific | 38 (35.8%) | 68 (64.1%) |
| Enterprise Management | 5 (100.0%) | 0 (0.0%) |
| Administrative & Support | 34 (73.9%) | 12 (26.1%) |
| Educational Services | 58 (25.4%) | 170 (74.6%) |
| Health Care & Social Assistance | 29 (24.6%) | 89 (75.4%) |
| Arts, Entertainment & Recreation | 5 (33.3%) | 10 (66.7%) |
| Accommodation & Food Services | 28 (70.0%) | 12 (30.0%) |
| Public Administration | 32 (47.8%) | 35 (52.2%) |
| Total | 490 (49.8%) | 494 (50.2%) |
Education in Churchville
School Enrollment in Churchville
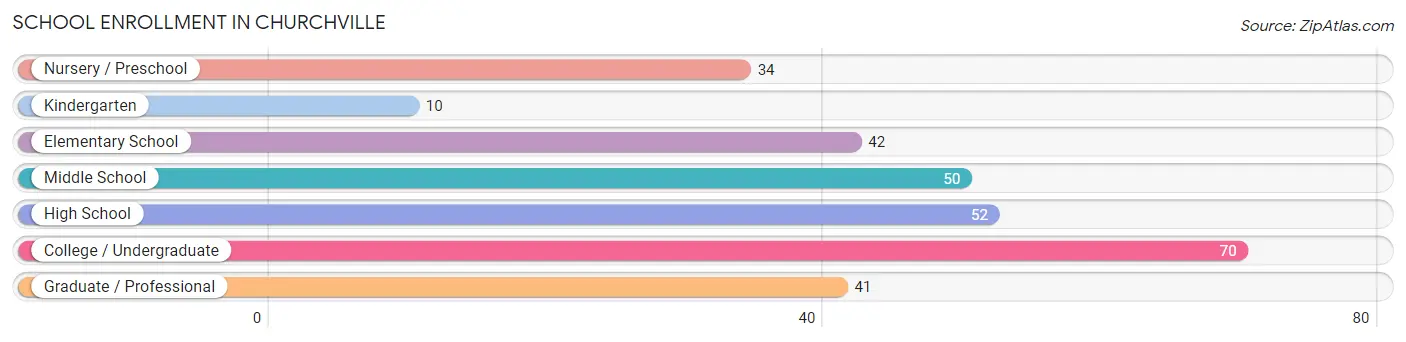
The most common levels of schooling among the 299 students in Churchville are college / undergraduate (70 | 23.4%), high school (52 | 17.4%), and middle school (50 | 16.7%).
| School Level | # Students | % Students |
| Nursery / Preschool | 34 | 11.4% |
| Kindergarten | 10 | 3.3% |
| Elementary School | 42 | 14.1% |
| Middle School | 50 | 16.7% |
| High School | 52 | 17.4% |
| College / Undergraduate | 70 | 23.4% |
| Graduate / Professional | 41 | 13.7% |
| Total | 299 | 100.0% |
School Enrollment by Age by Funding Source in Churchville
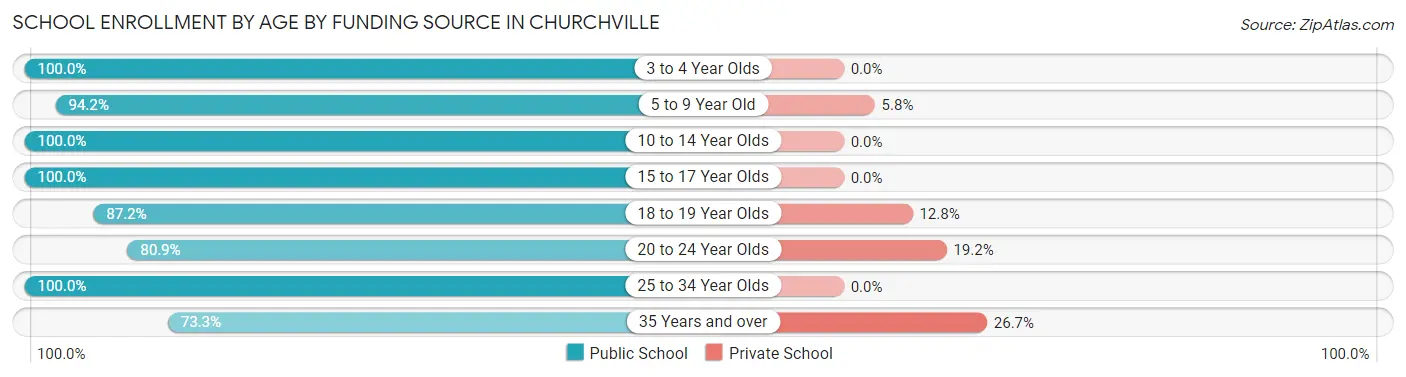
Out of a total of 299 students who are enrolled in schools in Churchville, 25 (8.4%) attend a private institution, while the remaining 274 (91.6%) are enrolled in public schools. The age group of 35 years and over has the highest likelihood of being enrolled in private schools, with 8 (26.7% in the age bracket) enrolled. Conversely, the age group of 3 to 4 year olds has the lowest likelihood of being enrolled in a private school, with 34 (100.0% in the age bracket) attending a public institution.
| Age Bracket | Public School | Private School |
| 3 to 4 Year Olds | 34 (100.0%) | 0 (0.0%) |
| 5 to 9 Year Old | 49 (94.2%) | 3 (5.8%) |
| 10 to 14 Year Olds | 56 (100.0%) | 0 (0.0%) |
| 15 to 17 Year Olds | 23 (100.0%) | 0 (0.0%) |
| 18 to 19 Year Olds | 34 (87.2%) | 5 (12.8%) |
| 20 to 24 Year Olds | 38 (80.8%) | 9 (19.2%) |
| 25 to 34 Year Olds | 18 (100.0%) | 0 (0.0%) |
| 35 Years and over | 22 (73.3%) | 8 (26.7%) |
| Total | 274 (91.6%) | 25 (8.4%) |
Educational Attainment by Field of Study in Churchville
Education (112 | 18.3%), science & technology (90 | 14.7%), business (75 | 12.2%), bio, nature & agricultural (58 | 9.5%), and social sciences (58 | 9.5%) are the most common fields of study among 612 individuals in Churchville who have obtained a bachelor's degree or higher.
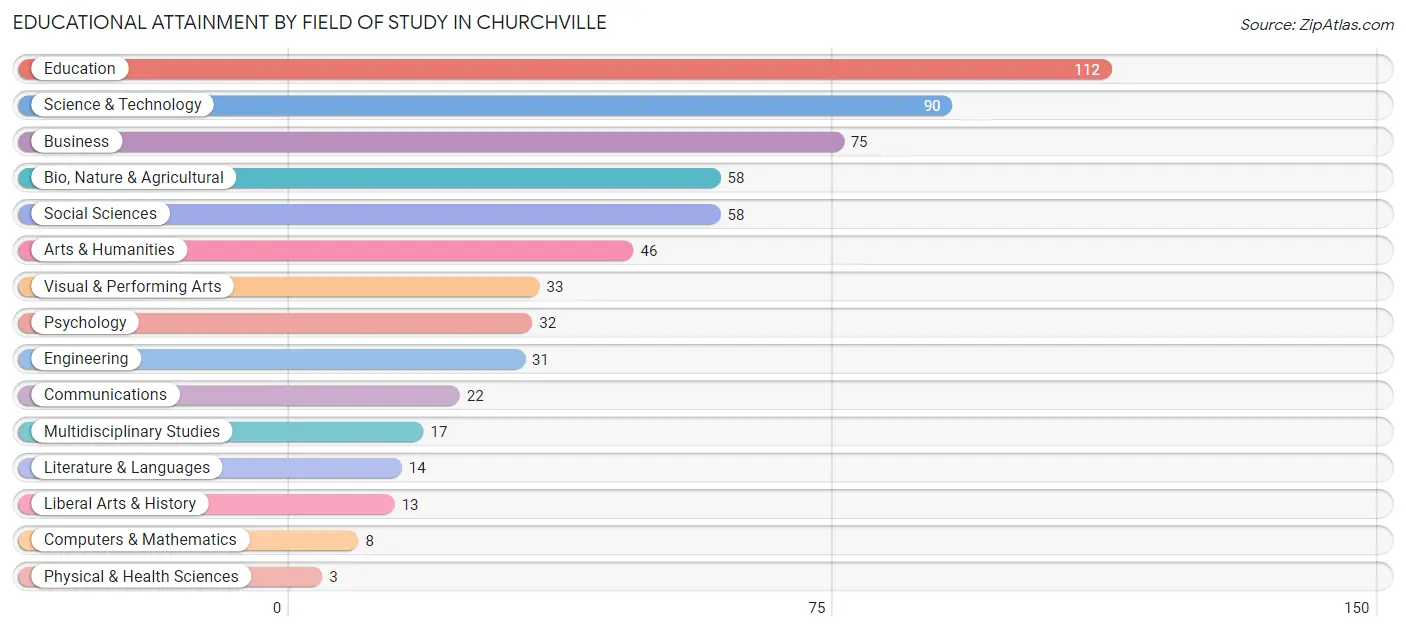
| Field of Study | # Graduates | % Graduates |
| Computers & Mathematics | 8 | 1.3% |
| Bio, Nature & Agricultural | 58 | 9.5% |
| Physical & Health Sciences | 3 | 0.5% |
| Psychology | 32 | 5.2% |
| Social Sciences | 58 | 9.5% |
| Engineering | 31 | 5.1% |
| Multidisciplinary Studies | 17 | 2.8% |
| Science & Technology | 90 | 14.7% |
| Business | 75 | 12.2% |
| Education | 112 | 18.3% |
| Literature & Languages | 14 | 2.3% |
| Liberal Arts & History | 13 | 2.1% |
| Visual & Performing Arts | 33 | 5.4% |
| Communications | 22 | 3.6% |
| Arts & Humanities | 46 | 7.5% |
| Total | 612 | 100.0% |
Transportation & Commute in Churchville
Vehicle Availability by Sex in Churchville
The most prevalent vehicle ownership categories in Churchville are males with 2 vehicles (240, accounting for 51.3%) and females with 2 vehicles (218, making up 49.7%).
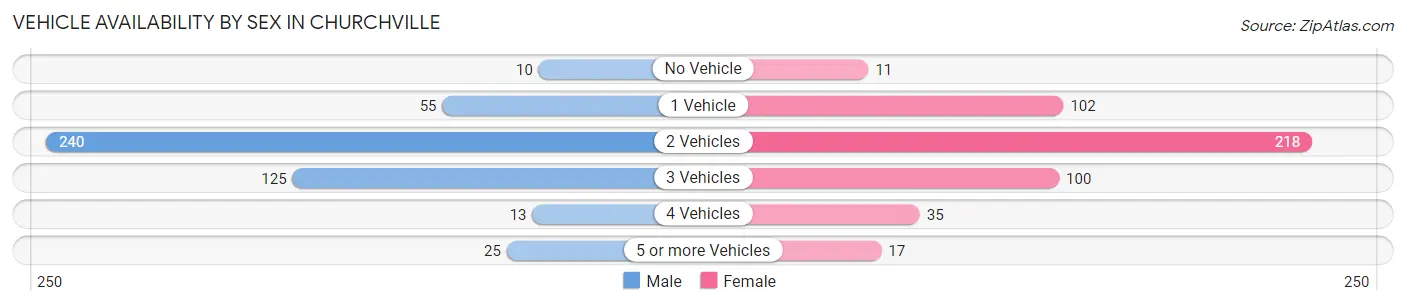
| Vehicles Available | Male | Female |
| No Vehicle | 10 (2.1%) | 11 (2.3%) |
| 1 Vehicle | 55 (11.7%) | 102 (21.1%) |
| 2 Vehicles | 240 (51.3%) | 218 (45.1%) |
| 3 Vehicles | 125 (26.7%) | 100 (20.7%) |
| 4 Vehicles | 13 (2.8%) | 35 (7.2%) |
| 5 or more Vehicles | 25 (5.3%) | 17 (3.5%) |
| Total | 468 (100.0%) | 483 (100.0%) |
Commute Time in Churchville
The most frequently occuring commute durations in Churchville are 20 to 24 minutes (182 commuters, 20.8%), 25 to 29 minutes (148 commuters, 16.9%), and 30 to 34 minutes (147 commuters, 16.8%).
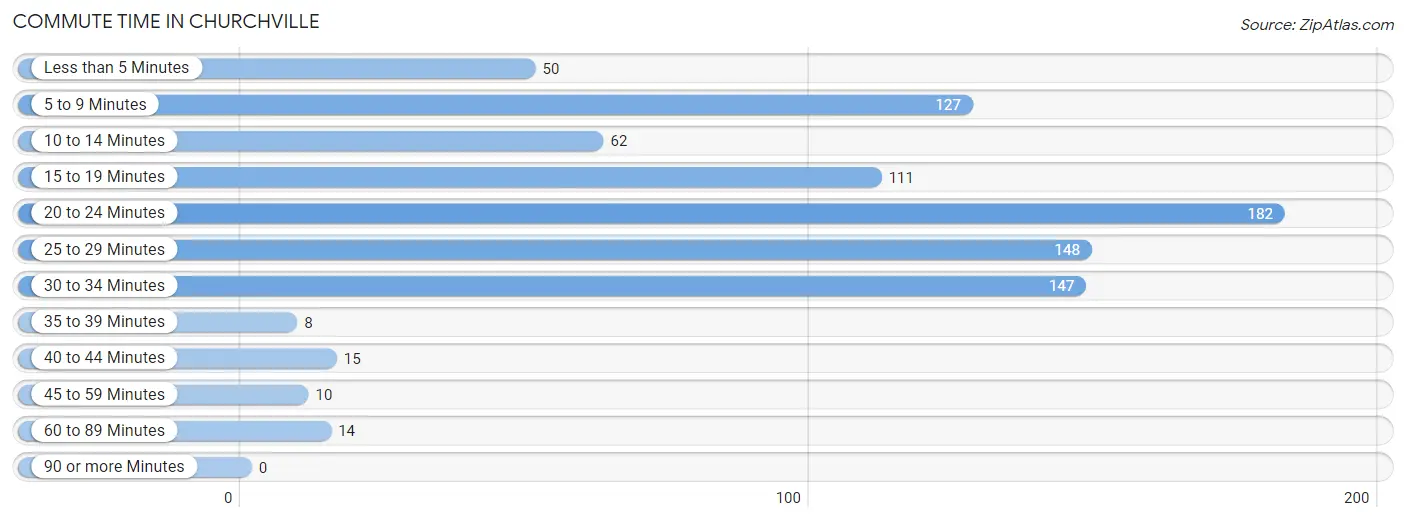
| Commute Time | # Commuters | % Commuters |
| Less than 5 Minutes | 50 | 5.7% |
| 5 to 9 Minutes | 127 | 14.5% |
| 10 to 14 Minutes | 62 | 7.1% |
| 15 to 19 Minutes | 111 | 12.7% |
| 20 to 24 Minutes | 182 | 20.8% |
| 25 to 29 Minutes | 148 | 16.9% |
| 30 to 34 Minutes | 147 | 16.8% |
| 35 to 39 Minutes | 8 | 0.9% |
| 40 to 44 Minutes | 15 | 1.7% |
| 45 to 59 Minutes | 10 | 1.1% |
| 60 to 89 Minutes | 14 | 1.6% |
| 90 or more Minutes | 0 | 0.0% |
Commute Time by Sex in Churchville
The most common commute times in Churchville are 20 to 24 minutes (94 commuters, 21.7%) for males and 5 to 9 minutes (98 commuters, 22.3%) for females.
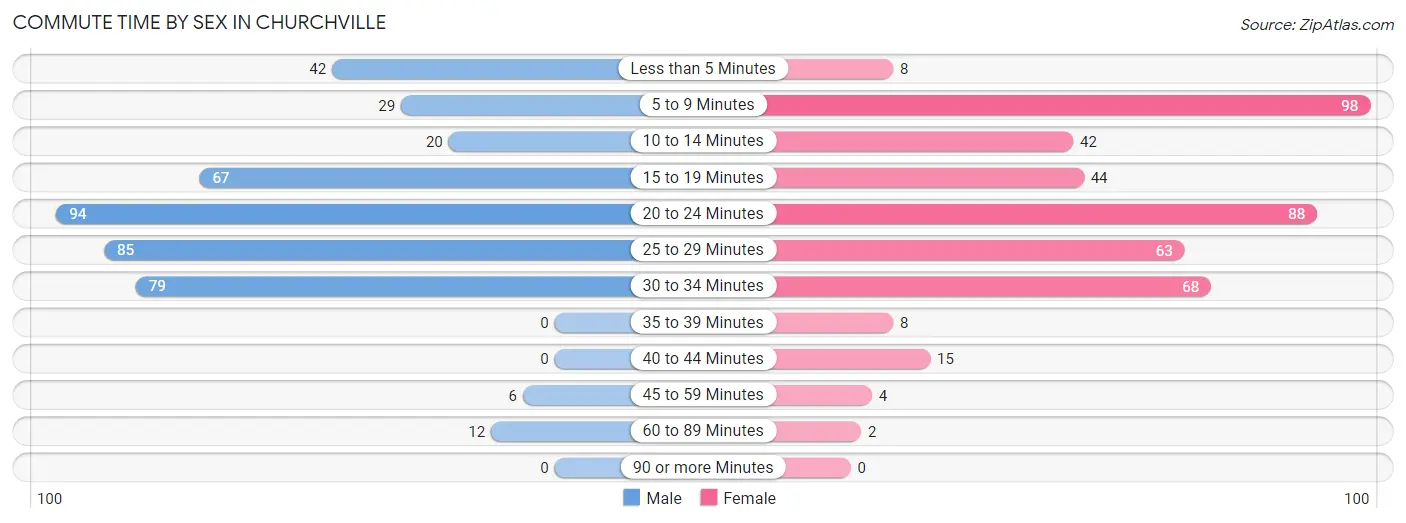
| Commute Time | Male | Female |
| Less than 5 Minutes | 42 (9.7%) | 8 (1.8%) |
| 5 to 9 Minutes | 29 (6.7%) | 98 (22.3%) |
| 10 to 14 Minutes | 20 (4.6%) | 42 (9.6%) |
| 15 to 19 Minutes | 67 (15.4%) | 44 (10.0%) |
| 20 to 24 Minutes | 94 (21.7%) | 88 (20.0%) |
| 25 to 29 Minutes | 85 (19.6%) | 63 (14.3%) |
| 30 to 34 Minutes | 79 (18.2%) | 68 (15.4%) |
| 35 to 39 Minutes | 0 (0.0%) | 8 (1.8%) |
| 40 to 44 Minutes | 0 (0.0%) | 15 (3.4%) |
| 45 to 59 Minutes | 6 (1.4%) | 4 (0.9%) |
| 60 to 89 Minutes | 12 (2.8%) | 2 (0.4%) |
| 90 or more Minutes | 0 (0.0%) | 0 (0.0%) |
Time of Departure to Work by Sex in Churchville
The most frequent times of departure to work in Churchville are 8:00 AM to 8:29 AM (73, 16.8%) for males and 7:30 AM to 7:59 AM (93, 21.1%) for females.
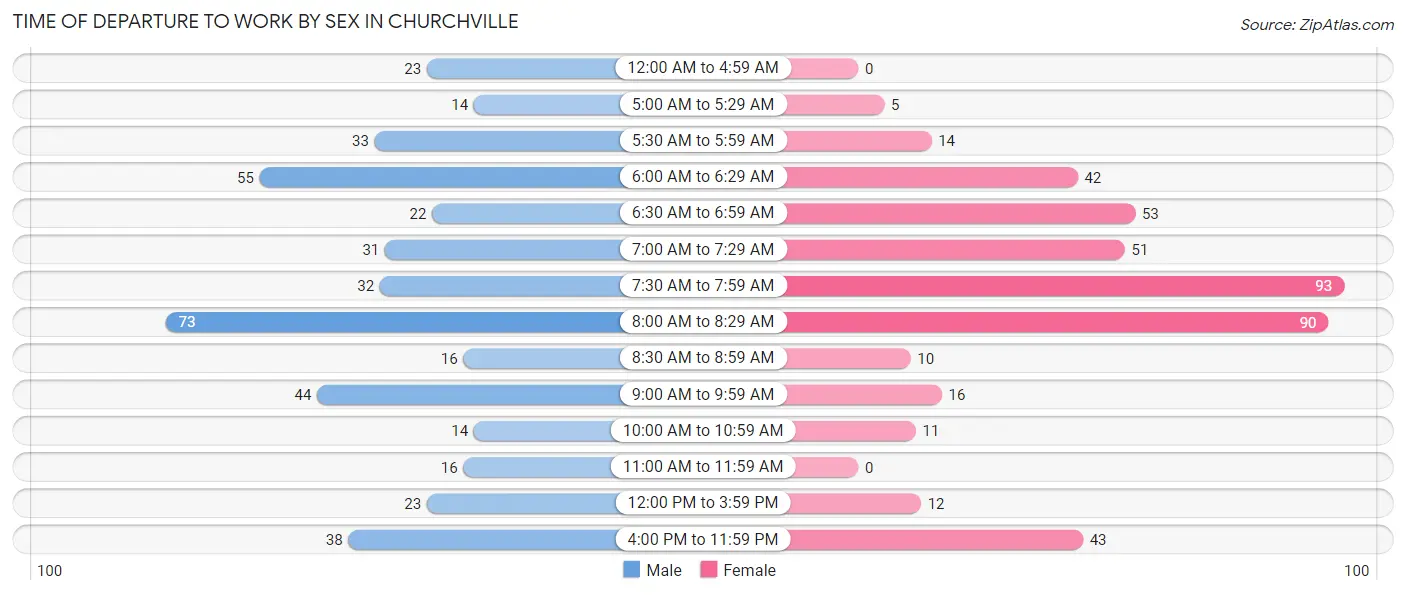
| Time of Departure | Male | Female |
| 12:00 AM to 4:59 AM | 23 (5.3%) | 0 (0.0%) |
| 5:00 AM to 5:29 AM | 14 (3.2%) | 5 (1.1%) |
| 5:30 AM to 5:59 AM | 33 (7.6%) | 14 (3.2%) |
| 6:00 AM to 6:29 AM | 55 (12.7%) | 42 (9.6%) |
| 6:30 AM to 6:59 AM | 22 (5.1%) | 53 (12.0%) |
| 7:00 AM to 7:29 AM | 31 (7.1%) | 51 (11.6%) |
| 7:30 AM to 7:59 AM | 32 (7.4%) | 93 (21.1%) |
| 8:00 AM to 8:29 AM | 73 (16.8%) | 90 (20.4%) |
| 8:30 AM to 8:59 AM | 16 (3.7%) | 10 (2.3%) |
| 9:00 AM to 9:59 AM | 44 (10.1%) | 16 (3.6%) |
| 10:00 AM to 10:59 AM | 14 (3.2%) | 11 (2.5%) |
| 11:00 AM to 11:59 AM | 16 (3.7%) | 0 (0.0%) |
| 12:00 PM to 3:59 PM | 23 (5.3%) | 12 (2.7%) |
| 4:00 PM to 11:59 PM | 38 (8.8%) | 43 (9.8%) |
| Total | 434 (100.0%) | 440 (100.0%) |
Housing Occupancy in Churchville
Occupancy by Ownership in Churchville
Of the total 841 dwellings in Churchville, owner-occupied units account for 732 (87.0%), while renter-occupied units make up 109 (13.0%).
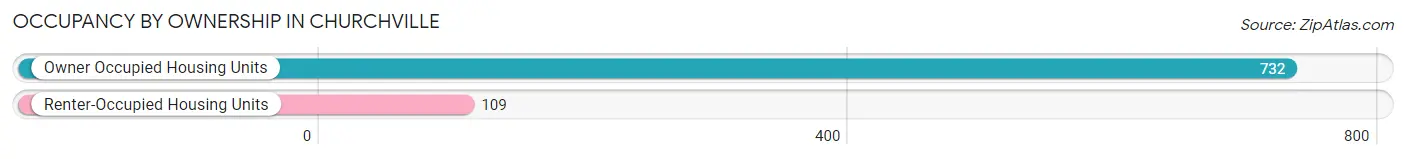
| Occupancy | # Housing Units | % Housing Units |
| Owner Occupied Housing Units | 732 | 87.0% |
| Renter-Occupied Housing Units | 109 | 13.0% |
| Total Occupied Housing Units | 841 | 100.0% |
Occupancy by Household Size in Churchville
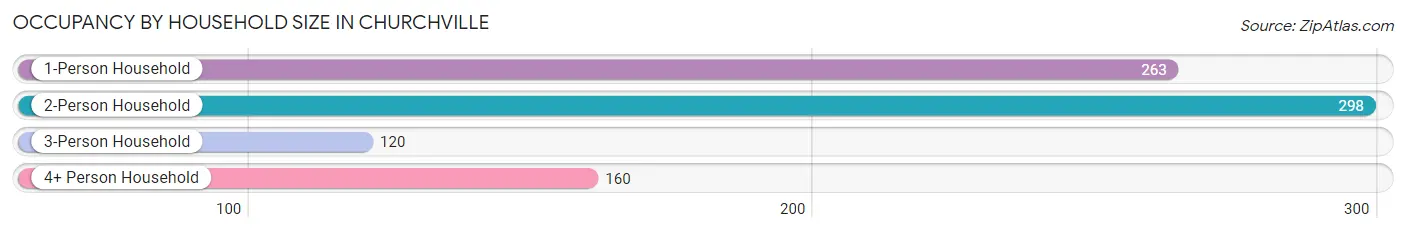
| Household Size | # Housing Units | % Housing Units |
| 1-Person Household | 263 | 31.3% |
| 2-Person Household | 298 | 35.4% |
| 3-Person Household | 120 | 14.3% |
| 4+ Person Household | 160 | 19.0% |
| Total Housing Units | 841 | 100.0% |
Occupancy by Ownership by Household Size in Churchville
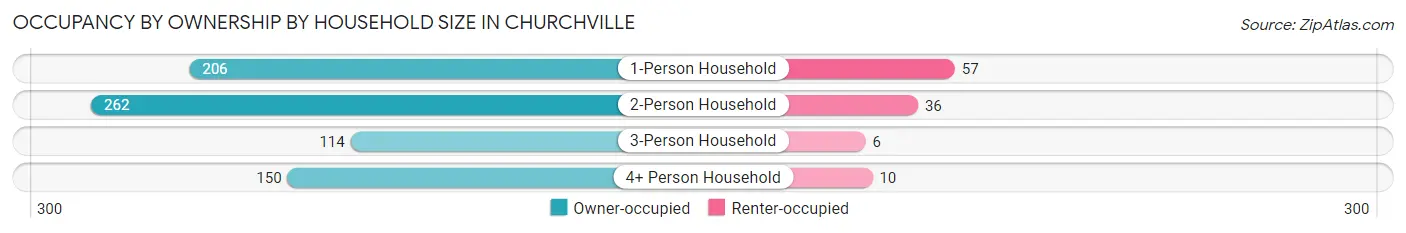
| Household Size | Owner-occupied | Renter-occupied |
| 1-Person Household | 206 (78.3%) | 57 (21.7%) |
| 2-Person Household | 262 (87.9%) | 36 (12.1%) |
| 3-Person Household | 114 (95.0%) | 6 (5.0%) |
| 4+ Person Household | 150 (93.8%) | 10 (6.2%) |
| Total Housing Units | 732 (87.0%) | 109 (13.0%) |
Occupancy by Educational Attainment in Churchville
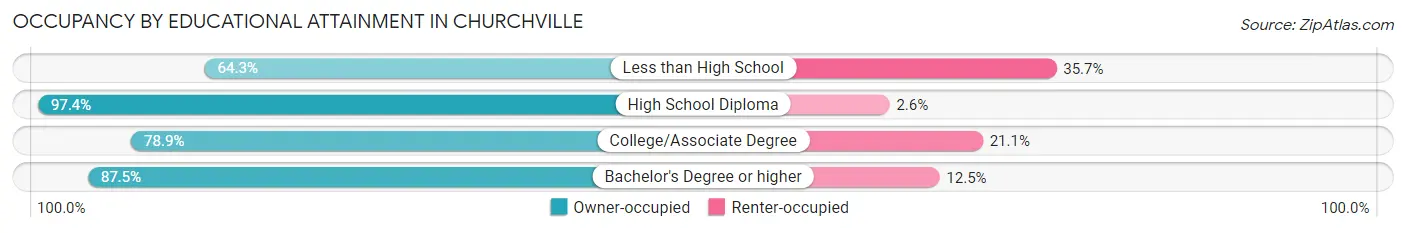
| Household Size | Owner-occupied | Renter-occupied |
| Less than High School | 9 (64.3%) | 5 (35.7%) |
| High School Diploma | 221 (97.4%) | 6 (2.6%) |
| College/Associate Degree | 209 (78.9%) | 56 (21.1%) |
| Bachelor's Degree or higher | 293 (87.5%) | 42 (12.5%) |
Occupancy by Age of Householder in Churchville
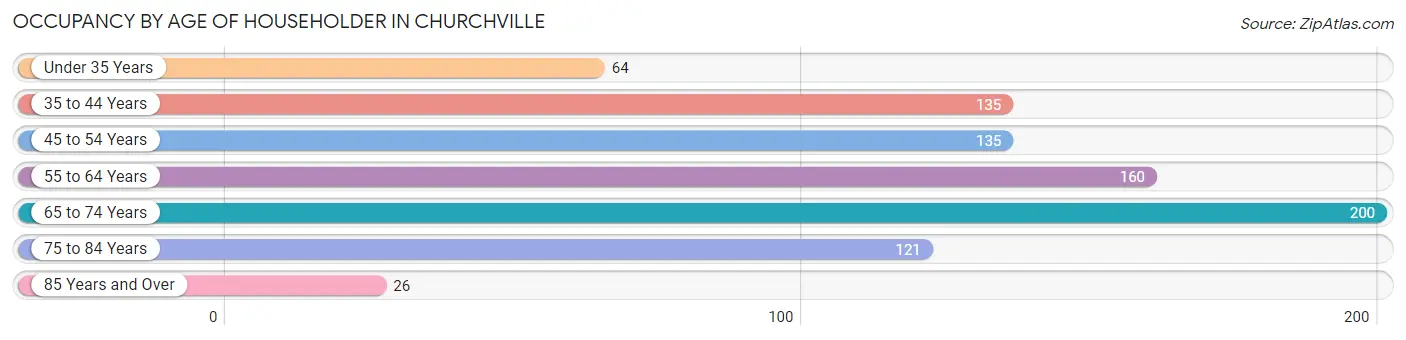
| Age Bracket | # Households | % Households |
| Under 35 Years | 64 | 7.6% |
| 35 to 44 Years | 135 | 16.1% |
| 45 to 54 Years | 135 | 16.1% |
| 55 to 64 Years | 160 | 19.0% |
| 65 to 74 Years | 200 | 23.8% |
| 75 to 84 Years | 121 | 14.4% |
| 85 Years and Over | 26 | 3.1% |
| Total | 841 | 100.0% |
Housing Finances in Churchville
Median Income by Occupancy in Churchville
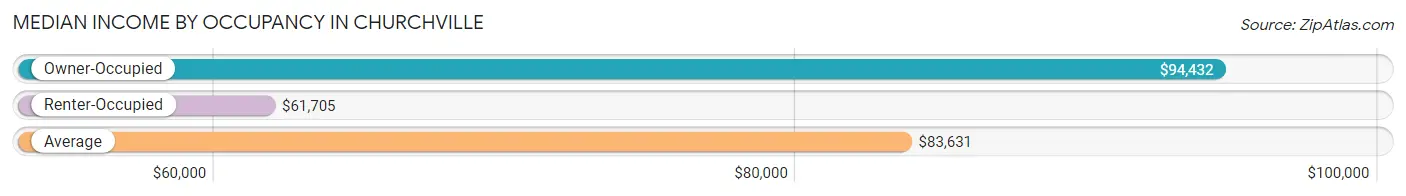
| Occupancy Type | # Households | Median Income |
| Owner-Occupied | 732 (87.0%) | $94,432 |
| Renter-Occupied | 109 (13.0%) | $61,705 |
| Average | 841 (100.0%) | $83,631 |
Occupancy by Householder Income Bracket in Churchville
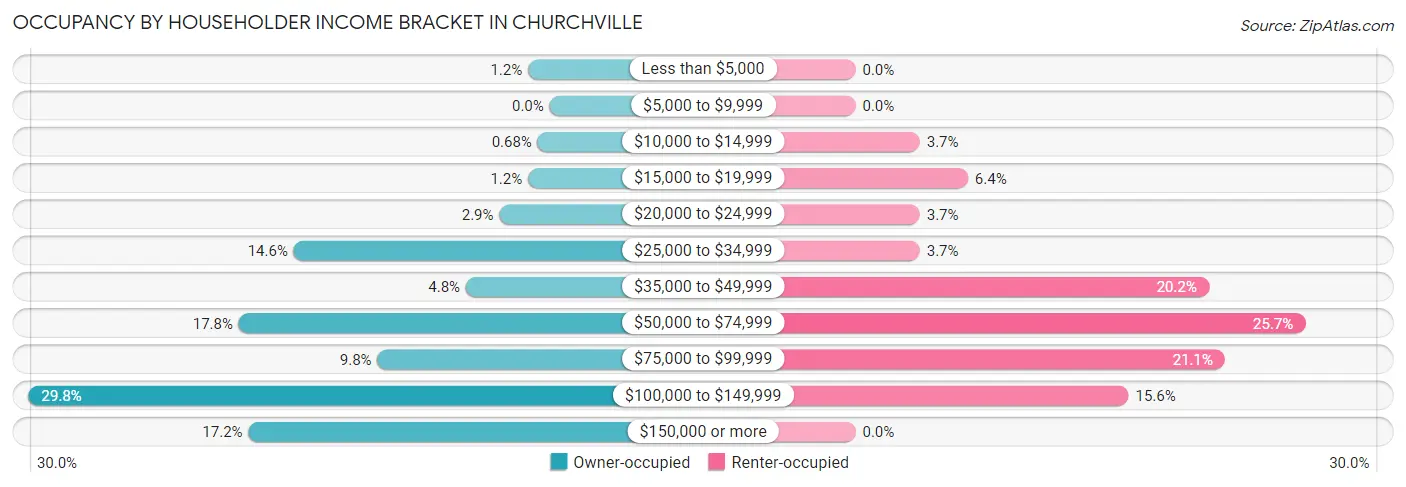
| Income Bracket | Owner-occupied | Renter-occupied |
| Less than $5,000 | 9 (1.2%) | 0 (0.0%) |
| $5,000 to $9,999 | 0 (0.0%) | 0 (0.0%) |
| $10,000 to $14,999 | 5 (0.7%) | 4 (3.7%) |
| $15,000 to $19,999 | 9 (1.2%) | 7 (6.4%) |
| $20,000 to $24,999 | 21 (2.9%) | 4 (3.7%) |
| $25,000 to $34,999 | 107 (14.6%) | 4 (3.7%) |
| $35,000 to $49,999 | 35 (4.8%) | 22 (20.2%) |
| $50,000 to $74,999 | 130 (17.8%) | 28 (25.7%) |
| $75,000 to $99,999 | 72 (9.8%) | 23 (21.1%) |
| $100,000 to $149,999 | 218 (29.8%) | 17 (15.6%) |
| $150,000 or more | 126 (17.2%) | 0 (0.0%) |
| Total | 732 (100.0%) | 109 (100.0%) |
Monthly Housing Cost Tiers in Churchville
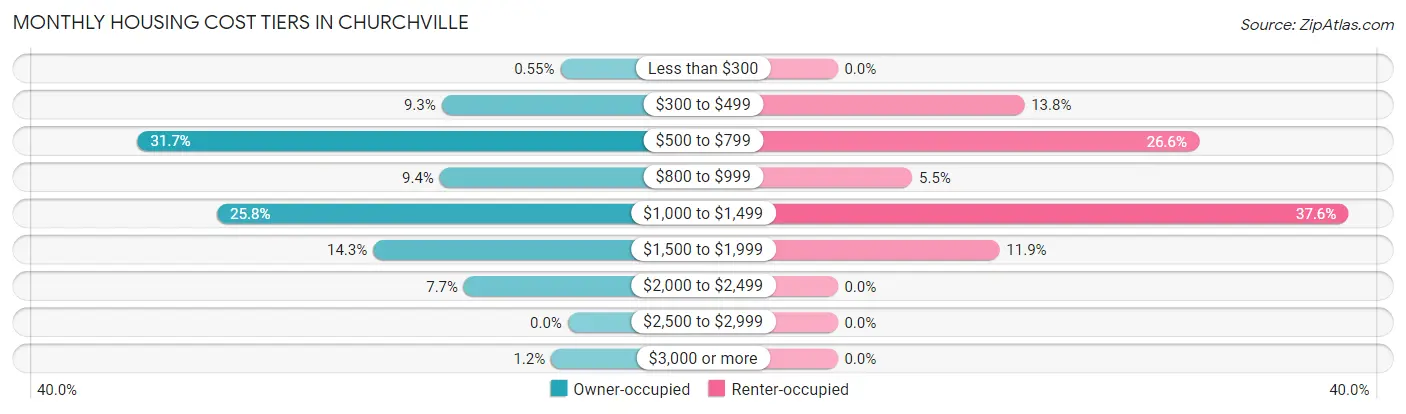
| Monthly Cost | Owner-occupied | Renter-occupied |
| Less than $300 | 4 (0.5%) | 0 (0.0%) |
| $300 to $499 | 68 (9.3%) | 15 (13.8%) |
| $500 to $799 | 232 (31.7%) | 29 (26.6%) |
| $800 to $999 | 69 (9.4%) | 6 (5.5%) |
| $1,000 to $1,499 | 189 (25.8%) | 41 (37.6%) |
| $1,500 to $1,999 | 105 (14.3%) | 13 (11.9%) |
| $2,000 to $2,499 | 56 (7.6%) | 0 (0.0%) |
| $2,500 to $2,999 | 0 (0.0%) | 0 (0.0%) |
| $3,000 or more | 9 (1.2%) | 0 (0.0%) |
| Total | 732 (100.0%) | 109 (100.0%) |
Physical Housing Characteristics in Churchville
Housing Structures in Churchville
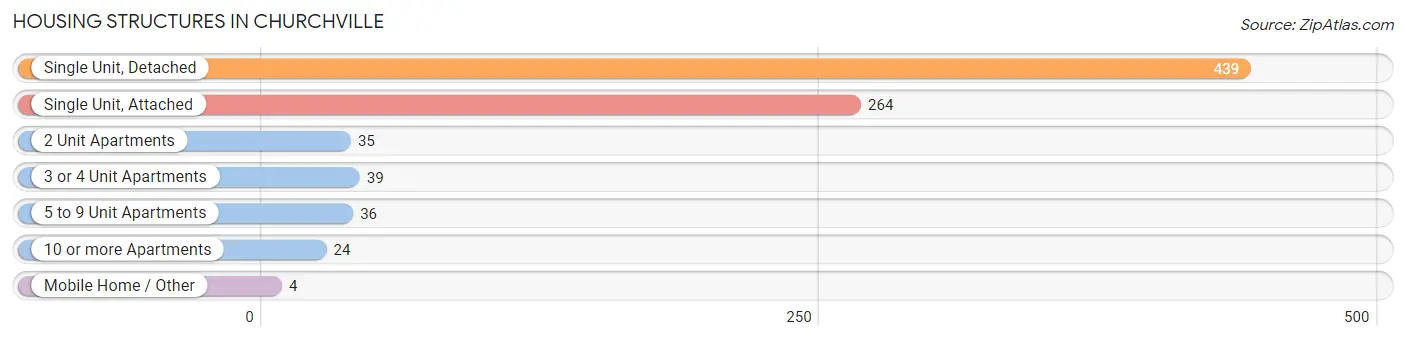
| Structure Type | # Housing Units | % Housing Units |
| Single Unit, Detached | 439 | 52.2% |
| Single Unit, Attached | 264 | 31.4% |
| 2 Unit Apartments | 35 | 4.2% |
| 3 or 4 Unit Apartments | 39 | 4.6% |
| 5 to 9 Unit Apartments | 36 | 4.3% |
| 10 or more Apartments | 24 | 2.9% |
| Mobile Home / Other | 4 | 0.5% |
| Total | 841 | 100.0% |
Housing Structures by Occupancy in Churchville
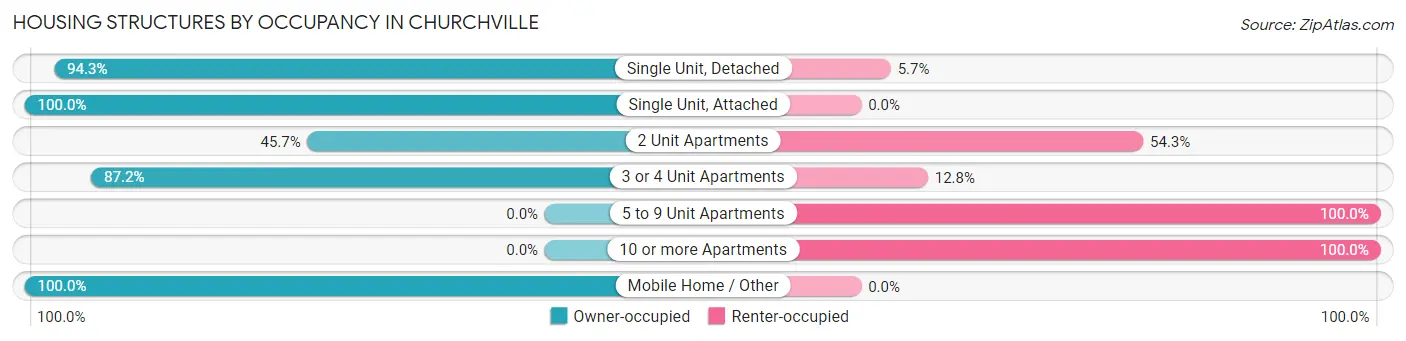
| Structure Type | Owner-occupied | Renter-occupied |
| Single Unit, Detached | 414 (94.3%) | 25 (5.7%) |
| Single Unit, Attached | 264 (100.0%) | 0 (0.0%) |
| 2 Unit Apartments | 16 (45.7%) | 19 (54.3%) |
| 3 or 4 Unit Apartments | 34 (87.2%) | 5 (12.8%) |
| 5 to 9 Unit Apartments | 0 (0.0%) | 36 (100.0%) |
| 10 or more Apartments | 0 (0.0%) | 24 (100.0%) |
| Mobile Home / Other | 4 (100.0%) | 0 (0.0%) |
| Total | 732 (87.0%) | 109 (13.0%) |
Housing Structures by Number of Rooms in Churchville
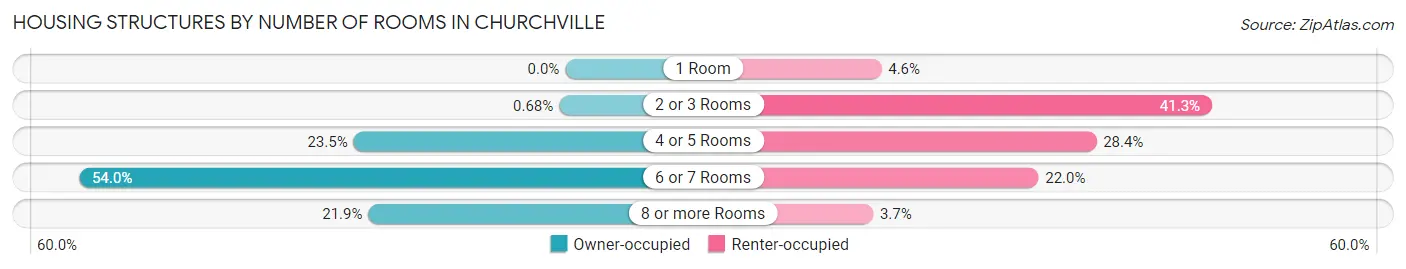
| Number of Rooms | Owner-occupied | Renter-occupied |
| 1 Room | 0 (0.0%) | 5 (4.6%) |
| 2 or 3 Rooms | 5 (0.7%) | 45 (41.3%) |
| 4 or 5 Rooms | 172 (23.5%) | 31 (28.4%) |
| 6 or 7 Rooms | 395 (54.0%) | 24 (22.0%) |
| 8 or more Rooms | 160 (21.9%) | 4 (3.7%) |
| Total | 732 (100.0%) | 109 (100.0%) |
Housing Structure by Heating Type in Churchville
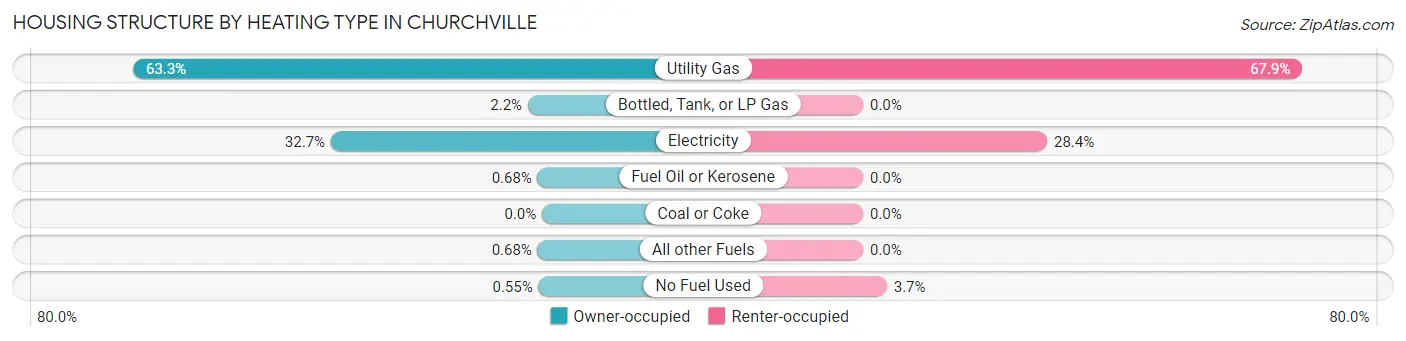
| Heating Type | Owner-occupied | Renter-occupied |
| Utility Gas | 463 (63.2%) | 74 (67.9%) |
| Bottled, Tank, or LP Gas | 16 (2.2%) | 0 (0.0%) |
| Electricity | 239 (32.7%) | 31 (28.4%) |
| Fuel Oil or Kerosene | 5 (0.7%) | 0 (0.0%) |
| Coal or Coke | 0 (0.0%) | 0 (0.0%) |
| All other Fuels | 5 (0.7%) | 0 (0.0%) |
| No Fuel Used | 4 (0.5%) | 4 (3.7%) |
| Total | 732 (100.0%) | 109 (100.0%) |
Household Vehicle Usage in Churchville
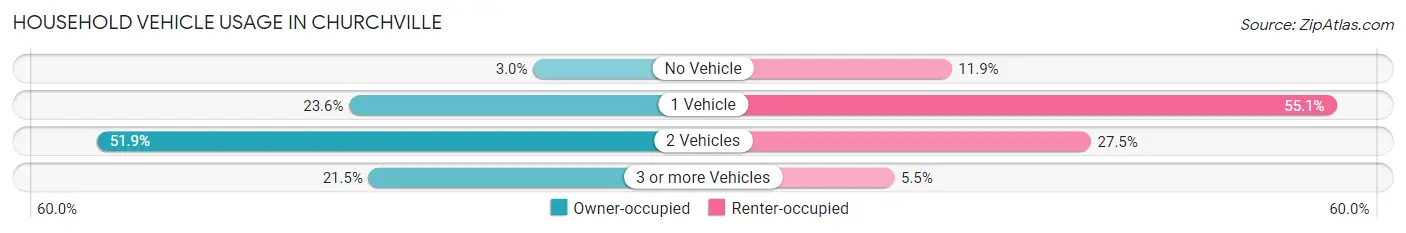
| Vehicles per Household | Owner-occupied | Renter-occupied |
| No Vehicle | 22 (3.0%) | 13 (11.9%) |
| 1 Vehicle | 173 (23.6%) | 60 (55.0%) |
| 2 Vehicles | 380 (51.9%) | 30 (27.5%) |
| 3 or more Vehicles | 157 (21.4%) | 6 (5.5%) |
| Total | 732 (100.0%) | 109 (100.0%) |
Real Estate & Mortgages in Churchville
Real Estate and Mortgage Overview in Churchville
| Characteristic | Without Mortgage | With Mortgage |
| Housing Units | 356 | 376 |
| Median Property Value | $176,100 | $194,200 |
| Median Household Income | $61,167 | $77 |
| Monthly Housing Costs | $724 | $9 |
| Real Estate Taxes | $4,093 | $15 |
Property Value by Mortgage Status in Churchville
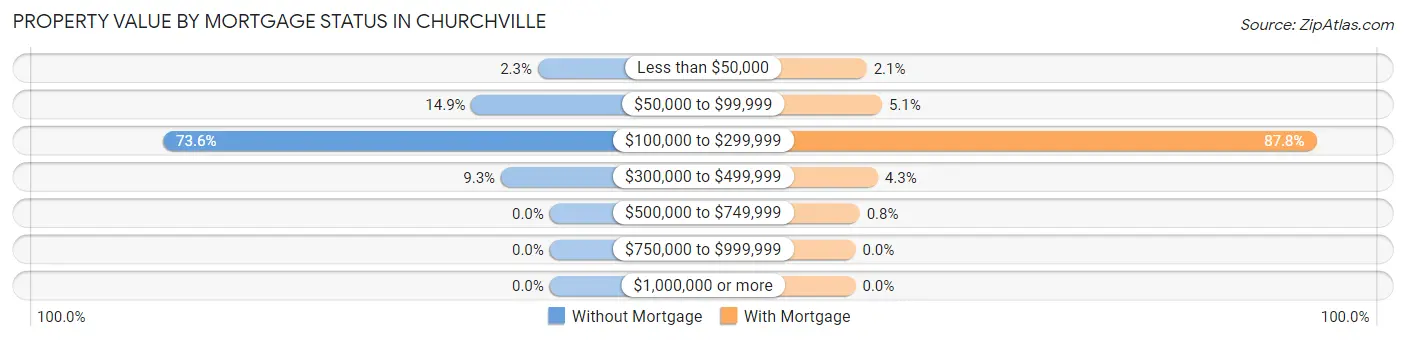
| Property Value | Without Mortgage | With Mortgage |
| Less than $50,000 | 8 (2.2%) | 8 (2.1%) |
| $50,000 to $99,999 | 53 (14.9%) | 19 (5.1%) |
| $100,000 to $299,999 | 262 (73.6%) | 330 (87.8%) |
| $300,000 to $499,999 | 33 (9.3%) | 16 (4.3%) |
| $500,000 to $749,999 | 0 (0.0%) | 3 (0.8%) |
| $750,000 to $999,999 | 0 (0.0%) | 0 (0.0%) |
| $1,000,000 or more | 0 (0.0%) | 0 (0.0%) |
| Total | 356 (100.0%) | 376 (100.0%) |
Household Income by Mortgage Status in Churchville
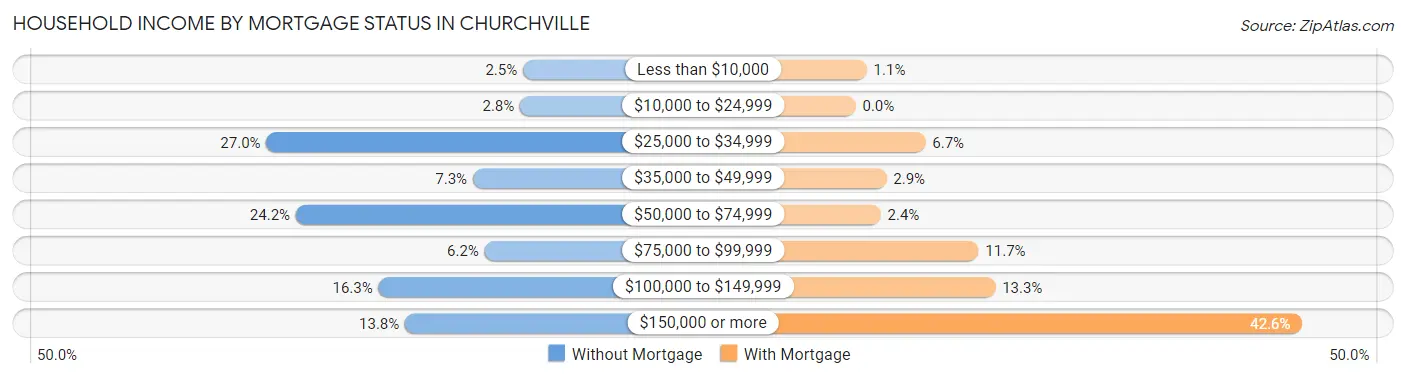
| Household Income | Without Mortgage | With Mortgage |
| Less than $10,000 | 9 (2.5%) | 4 (1.1%) |
| $10,000 to $24,999 | 10 (2.8%) | 0 (0.0%) |
| $25,000 to $34,999 | 96 (27.0%) | 25 (6.7%) |
| $35,000 to $49,999 | 26 (7.3%) | 11 (2.9%) |
| $50,000 to $74,999 | 86 (24.2%) | 9 (2.4%) |
| $75,000 to $99,999 | 22 (6.2%) | 44 (11.7%) |
| $100,000 to $149,999 | 58 (16.3%) | 50 (13.3%) |
| $150,000 or more | 49 (13.8%) | 160 (42.5%) |
| Total | 356 (100.0%) | 376 (100.0%) |
Property Value to Household Income Ratio in Churchville
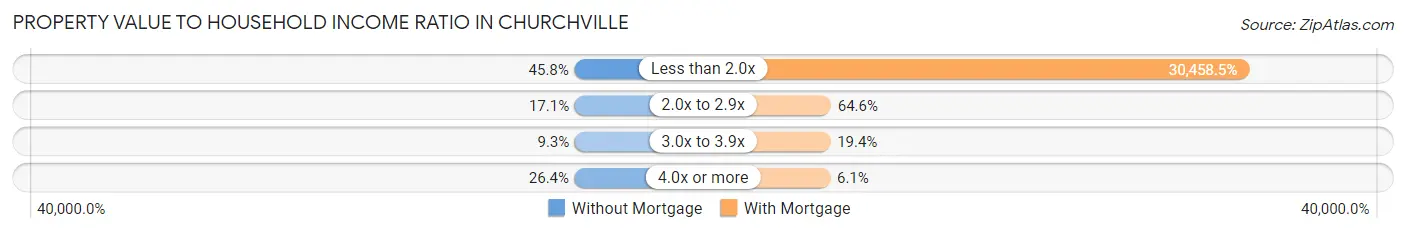
| Value-to-Income Ratio | Without Mortgage | With Mortgage |
| Less than 2.0x | 163 (45.8%) | 114,524 (30,458.5%) |
| 2.0x to 2.9x | 61 (17.1%) | 243 (64.6%) |
| 3.0x to 3.9x | 33 (9.3%) | 73 (19.4%) |
| 4.0x or more | 94 (26.4%) | 23 (6.1%) |
| Total | 356 (100.0%) | 376 (100.0%) |
Real Estate Taxes by Mortgage Status in Churchville
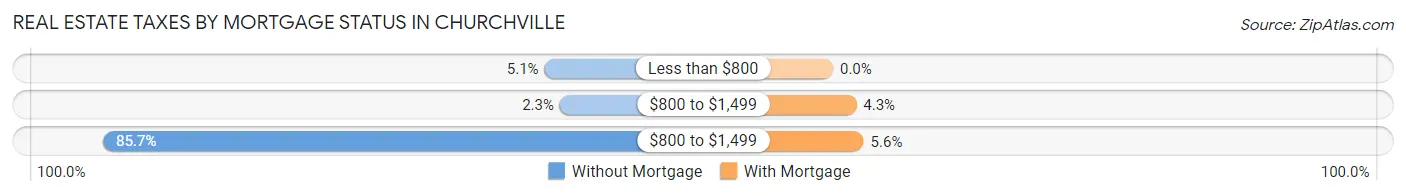
| Property Taxes | Without Mortgage | With Mortgage |
| Less than $800 | 18 (5.1%) | 0 (0.0%) |
| $800 to $1,499 | 8 (2.2%) | 16 (4.3%) |
| $800 to $1,499 | 305 (85.7%) | 21 (5.6%) |
| Total | 356 (100.0%) | 376 (100.0%) |
Health & Disability in Churchville
Health Insurance Coverage by Age in Churchville
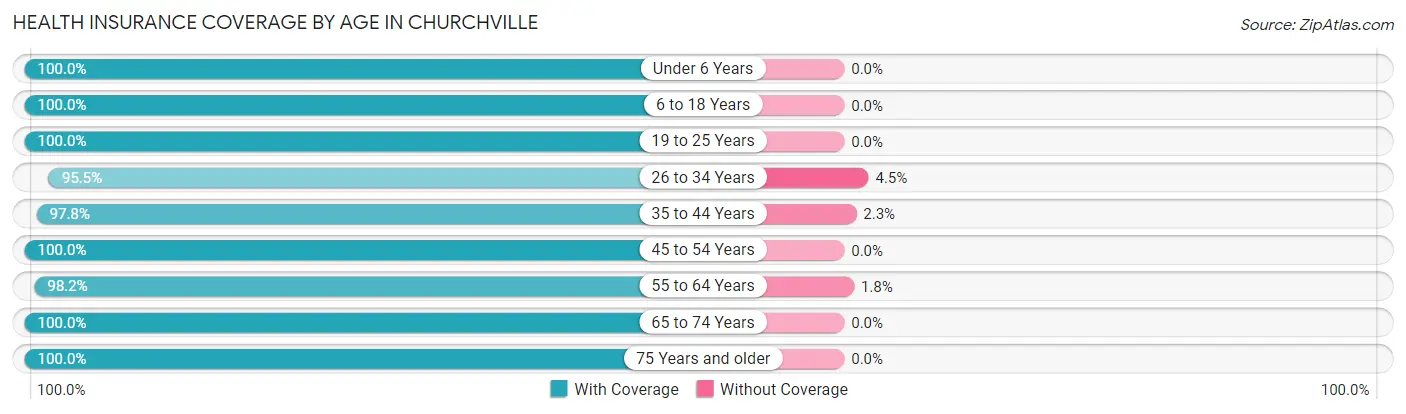
| Age Bracket | With Coverage | Without Coverage |
| Under 6 Years | 154 (100.0%) | 0 (0.0%) |
| 6 to 18 Years | 191 (100.0%) | 0 (0.0%) |
| 19 to 25 Years | 135 (100.0%) | 0 (0.0%) |
| 26 to 34 Years | 148 (95.5%) | 7 (4.5%) |
| 35 to 44 Years | 217 (97.8%) | 5 (2.2%) |
| 45 to 54 Years | 239 (100.0%) | 0 (0.0%) |
| 55 to 64 Years | 271 (98.2%) | 5 (1.8%) |
| 65 to 74 Years | 279 (100.0%) | 0 (0.0%) |
| 75 Years and older | 236 (100.0%) | 0 (0.0%) |
| Total | 1,870 (99.1%) | 17 (0.9%) |
Health Insurance Coverage by Citizenship Status in Churchville
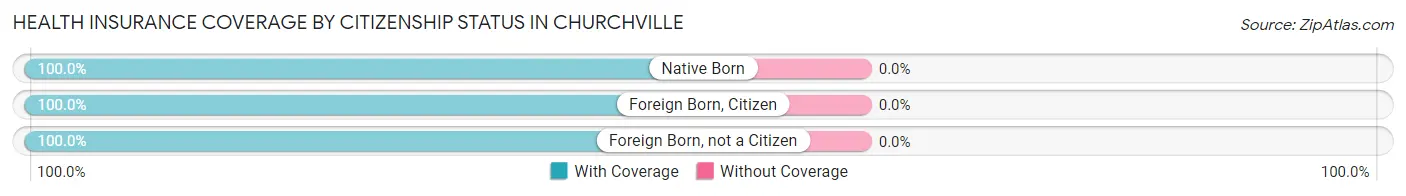
| Citizenship Status | With Coverage | Without Coverage |
| Native Born | 154 (100.0%) | 0 (0.0%) |
| Foreign Born, Citizen | 191 (100.0%) | 0 (0.0%) |
| Foreign Born, not a Citizen | 135 (100.0%) | 0 (0.0%) |
Health Insurance Coverage by Household Income in Churchville
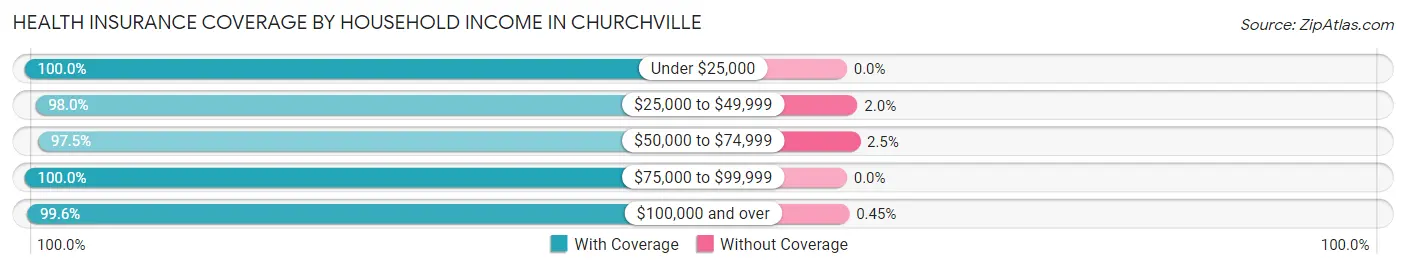
| Household Income | With Coverage | Without Coverage |
| Under $25,000 | 71 (100.0%) | 0 (0.0%) |
| $25,000 to $49,999 | 246 (98.0%) | 5 (2.0%) |
| $50,000 to $74,999 | 275 (97.5%) | 7 (2.5%) |
| $75,000 to $99,999 | 184 (100.0%) | 0 (0.0%) |
| $100,000 and over | 1,094 (99.6%) | 5 (0.4%) |
Public vs Private Health Insurance Coverage by Age in Churchville
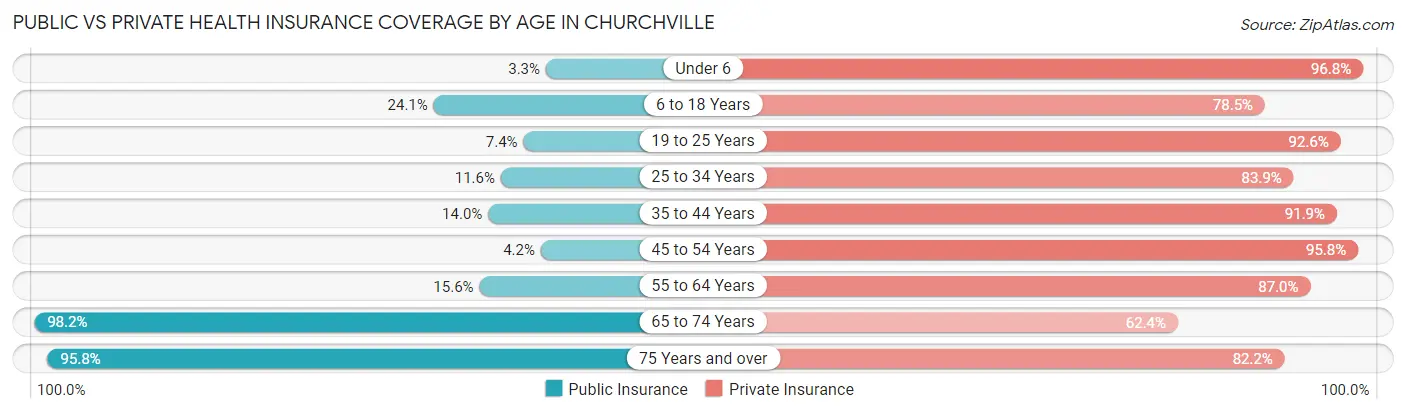
| Age Bracket | Public Insurance | Private Insurance |
| Under 6 | 5 (3.3%) | 149 (96.8%) |
| 6 to 18 Years | 46 (24.1%) | 150 (78.5%) |
| 19 to 25 Years | 10 (7.4%) | 125 (92.6%) |
| 25 to 34 Years | 18 (11.6%) | 130 (83.9%) |
| 35 to 44 Years | 31 (14.0%) | 204 (91.9%) |
| 45 to 54 Years | 10 (4.2%) | 229 (95.8%) |
| 55 to 64 Years | 43 (15.6%) | 240 (87.0%) |
| 65 to 74 Years | 274 (98.2%) | 174 (62.4%) |
| 75 Years and over | 226 (95.8%) | 194 (82.2%) |
| Total | 663 (35.1%) | 1,595 (84.5%) |
Disability Status by Sex by Age in Churchville
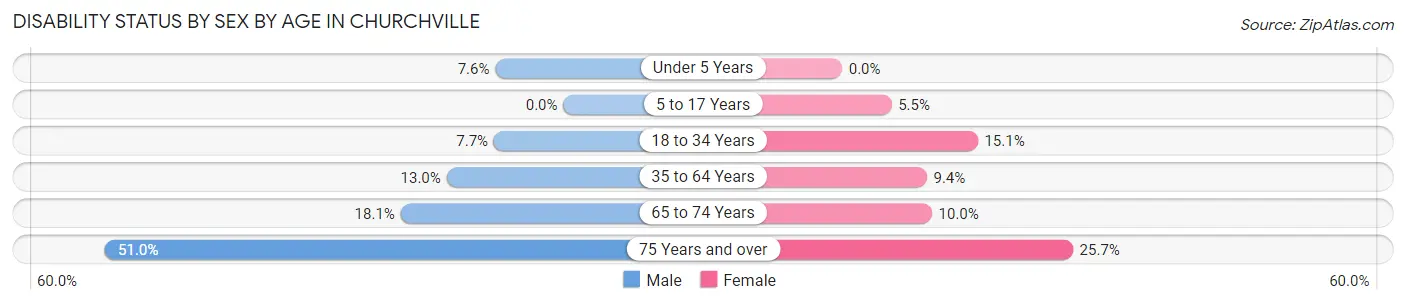
| Age Bracket | Male | Female |
| Under 5 Years | 5 (7.6%) | 0 (0.0%) |
| 5 to 17 Years | 0 (0.0%) | 6 (5.5%) |
| 18 to 34 Years | 14 (7.7%) | 21 (15.1%) |
| 35 to 64 Years | 49 (13.0%) | 34 (9.4%) |
| 65 to 74 Years | 27 (18.1%) | 13 (10.0%) |
| 75 Years and over | 49 (51.0%) | 36 (25.7%) |
Disability Class by Sex by Age in Churchville
Disability Class: Hearing Difficulty
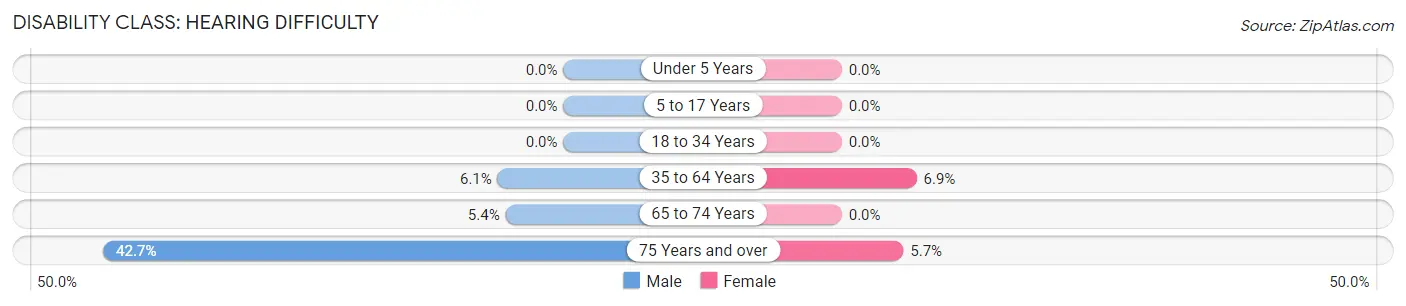
| Age Bracket | Male | Female |
| Under 5 Years | 0 (0.0%) | 0 (0.0%) |
| 5 to 17 Years | 0 (0.0%) | 0 (0.0%) |
| 18 to 34 Years | 0 (0.0%) | 0 (0.0%) |
| 35 to 64 Years | 23 (6.1%) | 25 (6.9%) |
| 65 to 74 Years | 8 (5.4%) | 0 (0.0%) |
| 75 Years and over | 41 (42.7%) | 8 (5.7%) |
Disability Class: Vision Difficulty
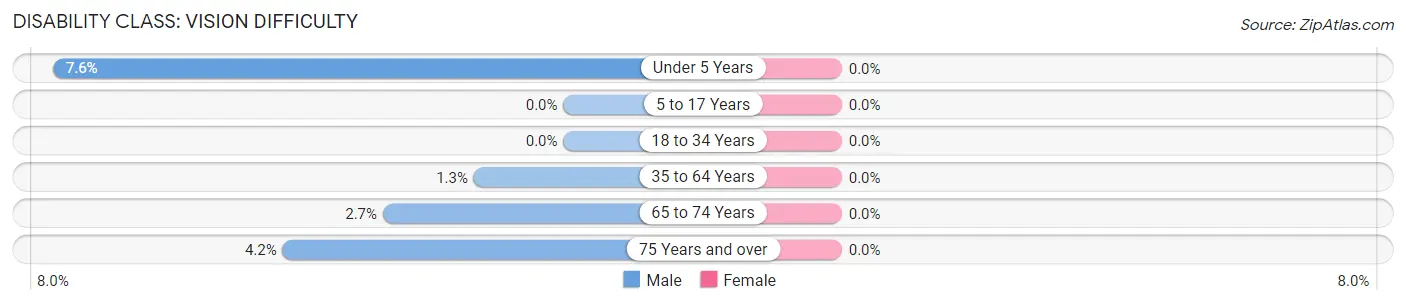
| Age Bracket | Male | Female |
| Under 5 Years | 5 (7.6%) | 0 (0.0%) |
| 5 to 17 Years | 0 (0.0%) | 0 (0.0%) |
| 18 to 34 Years | 0 (0.0%) | 0 (0.0%) |
| 35 to 64 Years | 5 (1.3%) | 0 (0.0%) |
| 65 to 74 Years | 4 (2.7%) | 0 (0.0%) |
| 75 Years and over | 4 (4.2%) | 0 (0.0%) |
Disability Class: Cognitive Difficulty
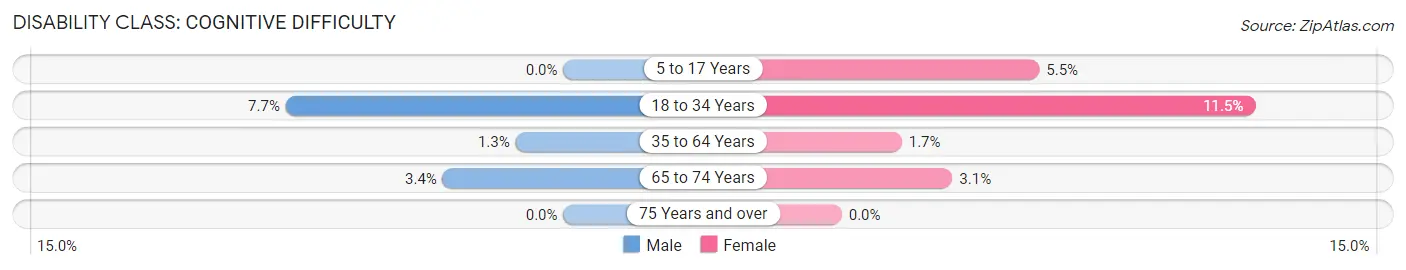
| Age Bracket | Male | Female |
| 5 to 17 Years | 0 (0.0%) | 6 (5.5%) |
| 18 to 34 Years | 14 (7.7%) | 16 (11.5%) |
| 35 to 64 Years | 5 (1.3%) | 6 (1.7%) |
| 65 to 74 Years | 5 (3.4%) | 4 (3.1%) |
| 75 Years and over | 0 (0.0%) | 0 (0.0%) |
Disability Class: Ambulatory Difficulty
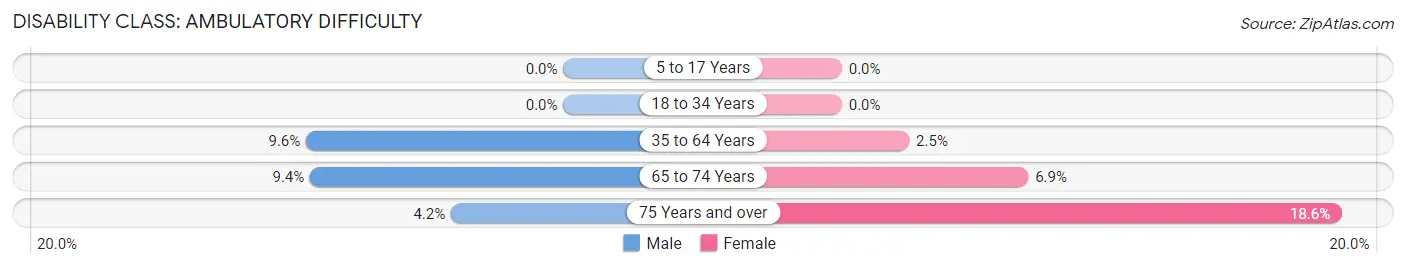
| Age Bracket | Male | Female |
| 5 to 17 Years | 0 (0.0%) | 0 (0.0%) |
| 18 to 34 Years | 0 (0.0%) | 0 (0.0%) |
| 35 to 64 Years | 36 (9.6%) | 9 (2.5%) |
| 65 to 74 Years | 14 (9.4%) | 9 (6.9%) |
| 75 Years and over | 4 (4.2%) | 26 (18.6%) |
Disability Class: Self-Care Difficulty
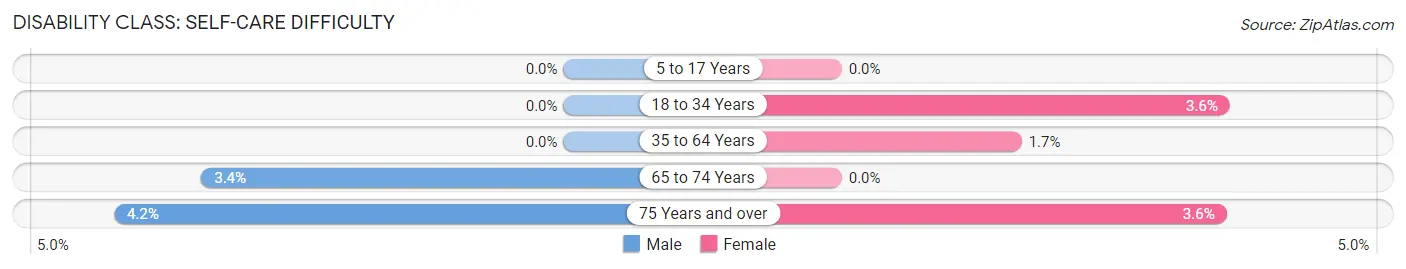
| Age Bracket | Male | Female |
| 5 to 17 Years | 0 (0.0%) | 0 (0.0%) |
| 18 to 34 Years | 0 (0.0%) | 5 (3.6%) |
| 35 to 64 Years | 0 (0.0%) | 6 (1.7%) |
| 65 to 74 Years | 5 (3.4%) | 0 (0.0%) |
| 75 Years and over | 4 (4.2%) | 5 (3.6%) |
Technology Access in Churchville
Computing Device Access in Churchville
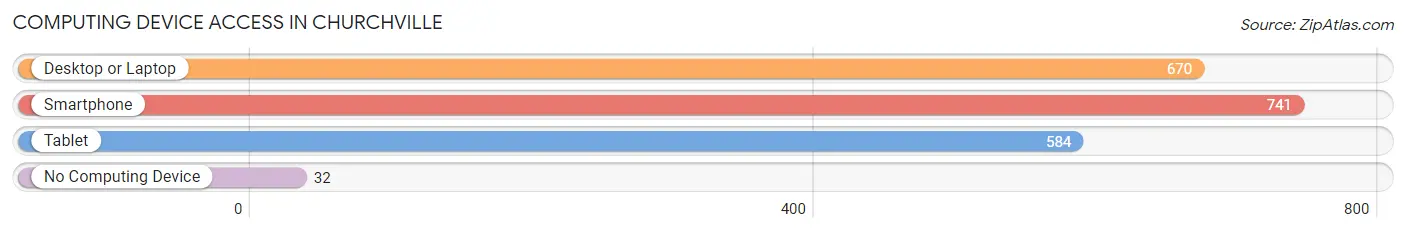
| Device Type | # Households | % Households |
| Desktop or Laptop | 670 | 79.7% |
| Smartphone | 741 | 88.1% |
| Tablet | 584 | 69.4% |
| No Computing Device | 32 | 3.8% |
| Total | 841 | 100.0% |
Internet Access in Churchville
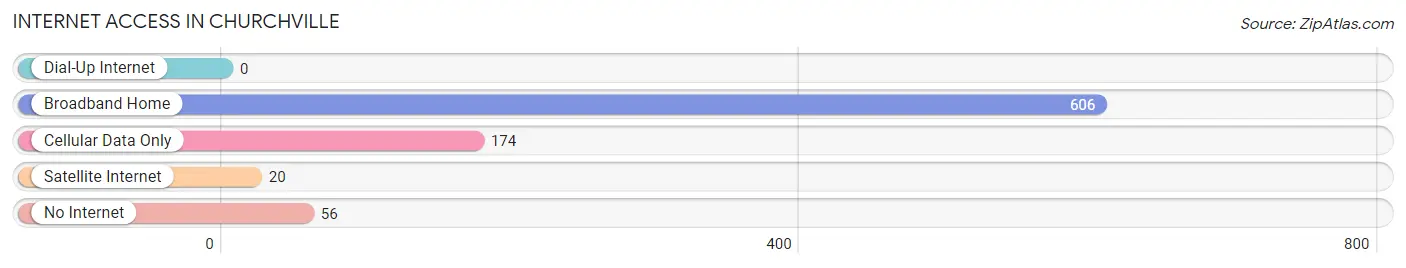
| Internet Type | # Households | % Households |
| Dial-Up Internet | 0 | 0.0% |
| Broadband Home | 606 | 72.1% |
| Cellular Data Only | 174 | 20.7% |
| Satellite Internet | 20 | 2.4% |
| No Internet | 56 | 6.7% |
| Total | 841 | 100.0% |
Churchville Summary
History
The hamlet of Churchville, New York is located in the town of Riga, Monroe County, New York. It is situated on the east side of the Genesee River, about 10 miles south of the city of Rochester. The area was first settled in the early 1800s by a group of German immigrants who were members of the Church of the Brethren. The hamlet was originally known as “Churchville” due to the presence of the church. The hamlet was officially incorporated in 1845.
The hamlet of Churchville was an important stop on the Underground Railroad. It was a safe haven for escaped slaves who were fleeing the south. The hamlet was also home to a number of abolitionists who were active in the anti-slavery movement.
The hamlet of Churchville was also an important stop on the Erie Canal. The canal was built in the early 1800s and connected the Great Lakes to the Hudson River. The canal was an important transportation route for goods and people.
Geography
Churchville is located in the town of Riga, Monroe County, New York. It is situated on the east side of the Genesee River, about 10 miles south of the city of Rochester. The hamlet is located in a rural area and is surrounded by farmland. The terrain is mostly flat with some rolling hills. The climate is humid continental with cold winters and hot summers.
Economy
The economy of Churchville is largely based on agriculture. The hamlet is home to several farms that produce a variety of crops, including corn, soybeans, wheat, and hay. The hamlet is also home to a number of small businesses, including a grocery store, a hardware store, and a few restaurants.
Demographics
As of the 2010 census, the population of Churchville was 1,845. The racial makeup of the hamlet was 97.3% White, 0.7% African American, 0.3% Native American, 0.3% Asian, and 1.4% from other races. The median household income was $50,972. The per capita income was $21,945. The median age was 41.7 years.
Conclusion
Churchville, New York is a small hamlet located in the town of Riga, Monroe County, New York. It is situated on the east side of the Genesee River, about 10 miles south of the city of Rochester. The hamlet was originally settled in the early 1800s by a group of German immigrants who were members of the Church of the Brethren. The hamlet was an important stop on the Underground Railroad and the Erie Canal. The economy of Churchville is largely based on agriculture. As of the 2010 census, the population of Churchville was 1,845. The racial makeup of the hamlet was 97.3% White, 0.7% African American, 0.3% Native American, 0.3% Asian, and 1.4% from other races. The median household income was $50,972. The per capita income was $21,945. The median age was 41.7 years.
Common Questions
What is Per Capita Income in Churchville?
Per Capita income in Churchville is $44,090.
What is the Median Family Income in Churchville?
Median Family Income in Churchville is $113,512.
What is the Median Household income in Churchville?
Median Household Income in Churchville is $83,631.
What is Income or Wage Gap in Churchville?
Income or Wage Gap in Churchville is 28.0%.
Women in Churchville earn 72.0 cents for every dollar earned by a man.
What is Inequality or Gini Index in Churchville?
Inequality or Gini Index in Churchville is 0.38.
What is the Total Population of Churchville?
Total Population of Churchville is 1,887.
What is the Total Male Population of Churchville?
Total Male Population of Churchville is 926.
What is the Total Female Population of Churchville?
Total Female Population of Churchville is 961.
What is the Ratio of Males per 100 Females in Churchville?
There are 96.36 Males per 100 Females in Churchville.
What is the Ratio of Females per 100 Males in Churchville?
There are 103.78 Females per 100 Males in Churchville.
What is the Median Population Age in Churchville?
Median Population Age in Churchville is 50.9 Years.
What is the Average Family Size in Churchville
Average Family Size in Churchville is 2.9 People.
What is the Average Household Size in Churchville
Average Household Size in Churchville is 2.2 People.
How Large is the Labor Force in Churchville?
There are 1,020 People in the Labor Forcein in Churchville.
What is the Percentage of People in the Labor Force in Churchville?
63.0% of People are in the Labor Force in Churchville.
What is the Unemployment Rate in Churchville?
Unemployment Rate in Churchville is 3.5%.