Catskill, NY Map & Demographics
Catskill Map
Catskill Overview
$40,931
PER CAPITA INCOME
$73,750
AVG FAMILY INCOME
$70,532
AVG HOUSEHOLD INCOME
27.4%
WAGE / INCOME GAP [ % ]
72.6¢/ $1
WAGE / INCOME GAP [ $ ]
$2,973
FAMILY INCOME DEFICIT
0.49
INEQUALITY / GINI INDEX
3,830
TOTAL POPULATION
2,043
MALE POPULATION
1,787
FEMALE POPULATION
114.33
MALES / 100 FEMALES
87.47
FEMALES / 100 MALES
43.3
MEDIAN AGE
3.3
AVG FAMILY SIZE
2.2
AVG HOUSEHOLD SIZE
2,105
LABOR FORCE [ PEOPLE ]
59.4%
PERCENT IN LABOR FORCE
6.3%
UNEMPLOYMENT RATE
Catskill Zip Codes
Catskill Area Codes
Income in Catskill
Income Overview in Catskill
Per Capita Income in Catskill is $40,931, while median incomes of families and households are $73,750 and $70,532 respectively.
| Characteristic | Number | Measure |
| Per Capita Income | 3,830 | $40,931 |
| Median Family Income | 718 | $73,750 |
| Mean Family Income | 718 | $116,837 |
| Median Household Income | 1,692 | $70,532 |
| Mean Household Income | 1,692 | $92,140 |
| Income Deficit | 718 | $2,973 |
| Wage / Income Gap (%) | 3,830 | 27.38% |
| Wage / Income Gap ($) | 3,830 | 72.62¢ per $1 |
| Gini / Inequality Index | 3,830 | 0.49 |
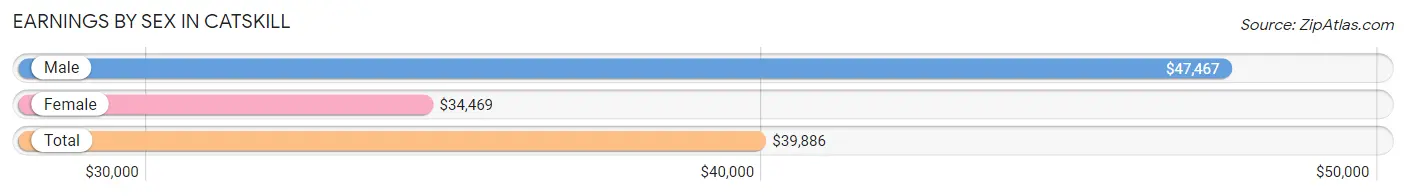
Earnings by Sex in Catskill
Average Earnings in Catskill are $39,886, $47,467 for men and $34,469 for women, a difference of 27.4%.
| Sex | Number | Average Earnings |
| Male | 1,255 (54.3%) | $47,467 |
| Female | 1,055 (45.7%) | $34,469 |
| Total | 2,310 (100.0%) | $39,886 |
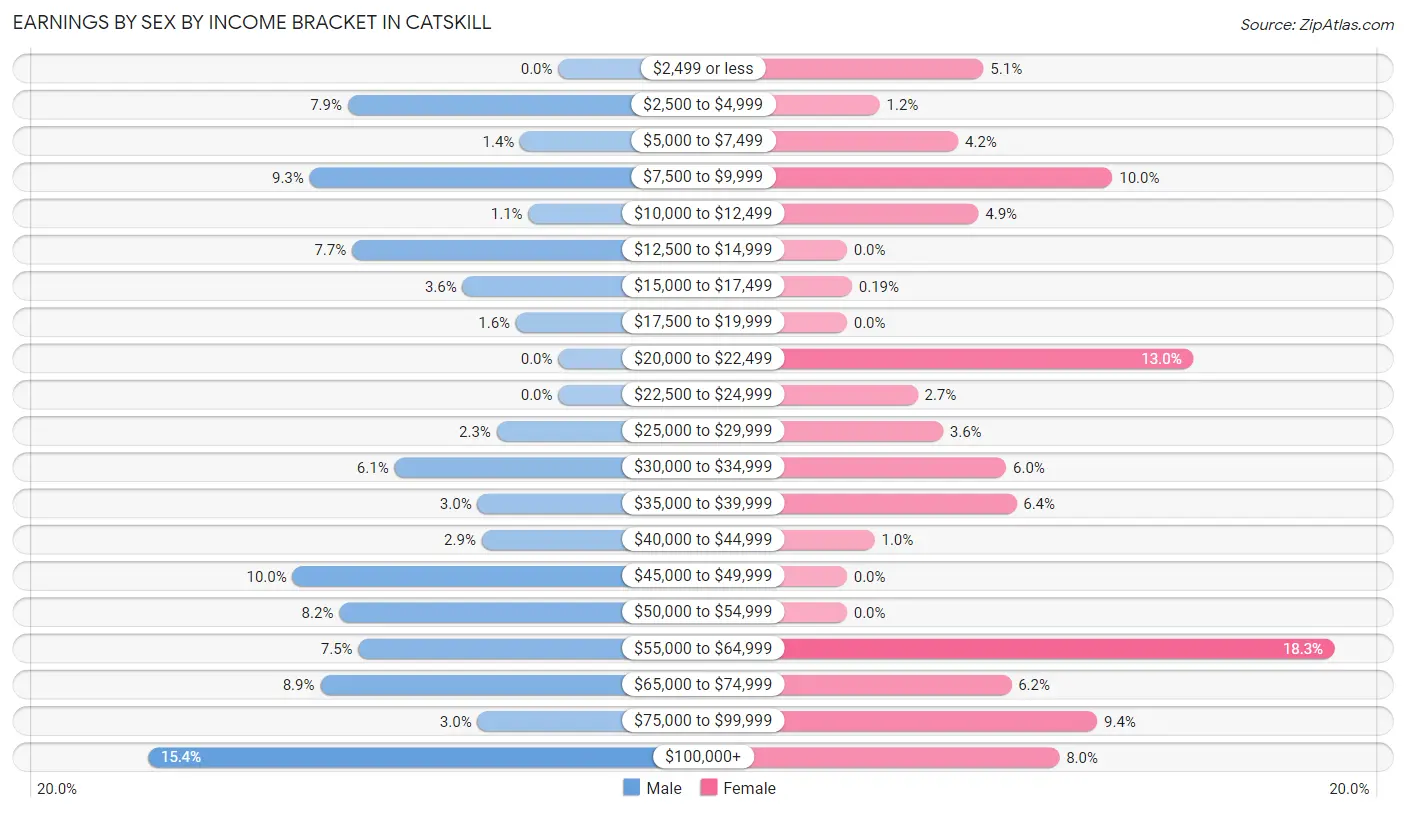
Earnings by Sex by Income Bracket in Catskill
The most common earnings brackets in Catskill are $100,000+ for men (193 | 15.4%) and $55,000 to $64,999 for women (193 | 18.3%).
| Income | Male | Female |
| $2,499 or less | 0 (0.0%) | 54 (5.1%) |
| $2,500 to $4,999 | 99 (7.9%) | 13 (1.2%) |
| $5,000 to $7,499 | 18 (1.4%) | 44 (4.2%) |
| $7,500 to $9,999 | 117 (9.3%) | 105 (10.0%) |
| $10,000 to $12,499 | 14 (1.1%) | 52 (4.9%) |
| $12,500 to $14,999 | 97 (7.7%) | 0 (0.0%) |
| $15,000 to $17,499 | 45 (3.6%) | 2 (0.2%) |
| $17,500 to $19,999 | 20 (1.6%) | 0 (0.0%) |
| $20,000 to $22,499 | 0 (0.0%) | 137 (13.0%) |
| $22,500 to $24,999 | 0 (0.0%) | 28 (2.6%) |
| $25,000 to $29,999 | 29 (2.3%) | 38 (3.6%) |
| $30,000 to $34,999 | 77 (6.1%) | 63 (6.0%) |
| $35,000 to $39,999 | 38 (3.0%) | 67 (6.4%) |
| $40,000 to $44,999 | 36 (2.9%) | 11 (1.0%) |
| $45,000 to $49,999 | 125 (10.0%) | 0 (0.0%) |
| $50,000 to $54,999 | 103 (8.2%) | 0 (0.0%) |
| $55,000 to $64,999 | 94 (7.5%) | 193 (18.3%) |
| $65,000 to $74,999 | 112 (8.9%) | 65 (6.2%) |
| $75,000 to $99,999 | 38 (3.0%) | 99 (9.4%) |
| $100,000+ | 193 (15.4%) | 84 (8.0%) |
| Total | 1,255 (100.0%) | 1,055 (100.0%) |
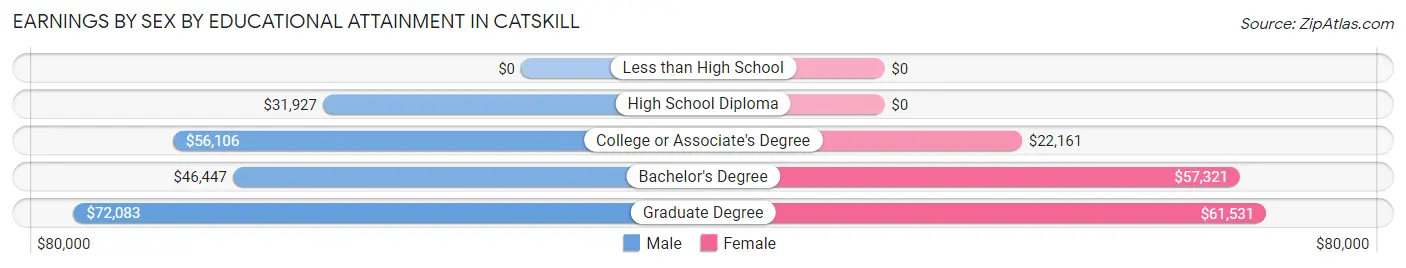
Earnings by Sex by Educational Attainment in Catskill
Average earnings in Catskill are $45,724 for men and $35,994 for women, a difference of 21.3%. Men with an educational attainment of graduate degree enjoy the highest average annual earnings of $72,083, while those with high school diploma education earn the least with $31,927. Women with an educational attainment of graduate degree earn the most with the average annual earnings of $61,531, while those with college or associate's degree education have the smallest earnings of $22,161.
| Educational Attainment | Male Income | Female Income |
| Less than High School | - | - |
| High School Diploma | $31,927 | $0 |
| College or Associate's Degree | $56,106 | $22,161 |
| Bachelor's Degree | $46,447 | $57,321 |
| Graduate Degree | $72,083 | $61,531 |
| Total | $45,724 | $35,994 |
Family Income in Catskill
Family Income Brackets in Catskill
According to the Catskill family income data, there are 121 families falling into the $50,000 to $74,999 income range, which is the most common income bracket and makes up 16.9% of all families.
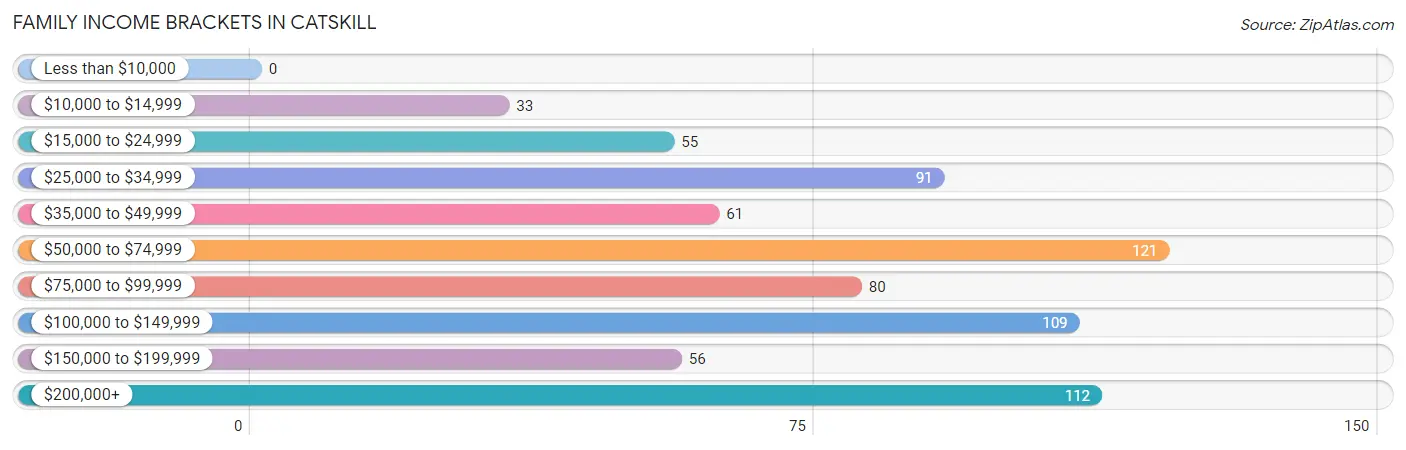
| Income Bracket | # Families | % Families |
| Less than $10,000 | 0 | 0.0% |
| $10,000 to $14,999 | 33 | 4.6% |
| $15,000 to $24,999 | 55 | 7.7% |
| $25,000 to $34,999 | 91 | 12.7% |
| $35,000 to $49,999 | 61 | 8.5% |
| $50,000 to $74,999 | 121 | 16.9% |
| $75,000 to $99,999 | 80 | 11.1% |
| $100,000 to $149,999 | 109 | 15.2% |
| $150,000 to $199,999 | 56 | 7.8% |
| $200,000+ | 112 | 15.6% |
Family Income by Famaliy Size in Catskill
2-person families (452 | 62.9%) account for the highest median family income in Catskill with $90,208 per family, while 2-person families (452 | 62.9%) have the highest median income of $45,104 per family member.
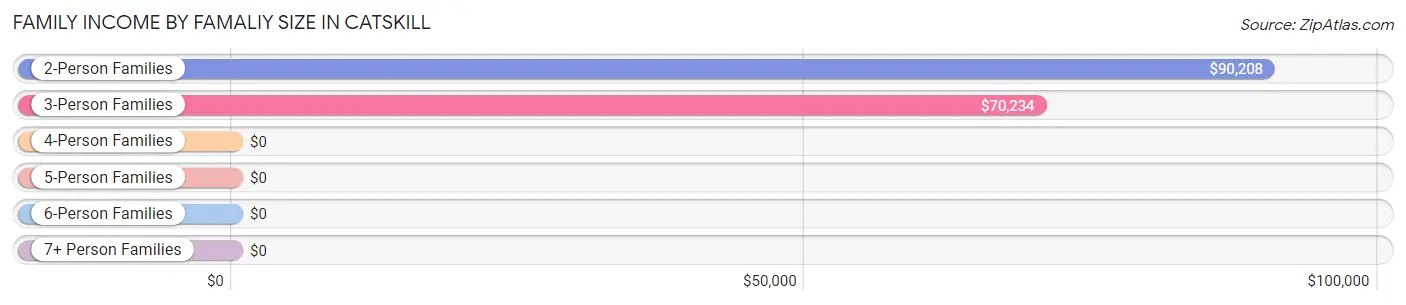
| Income Bracket | # Families | Median Income |
| 2-Person Families | 452 (62.9%) | $90,208 |
| 3-Person Families | 219 (30.5%) | $70,234 |
| 4-Person Families | 18 (2.5%) | $0 |
| 5-Person Families | 29 (4.0%) | $0 |
| 6-Person Families | 0 (0.0%) | $0 |
| 7+ Person Families | 0 (0.0%) | $0 |
| Total | 718 (100.0%) | $73,750 |
Family Income by Number of Earners in Catskill
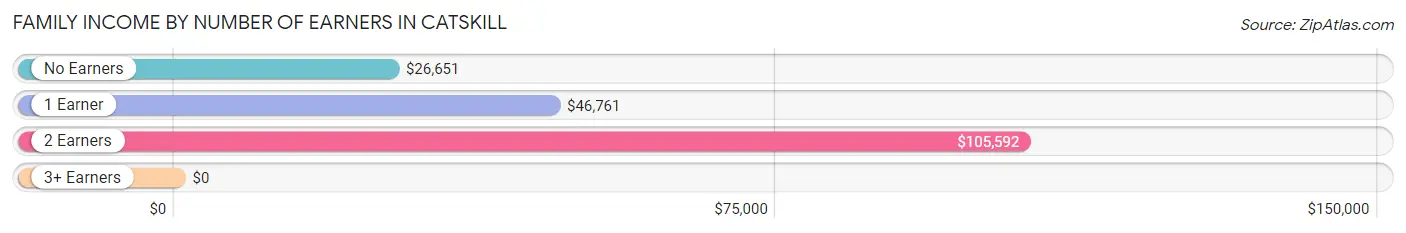
| Number of Earners | # Families | Median Income |
| No Earners | 70 (9.8%) | $26,651 |
| 1 Earner | 274 (38.2%) | $46,761 |
| 2 Earners | 353 (49.2%) | $105,592 |
| 3+ Earners | 21 (2.9%) | $0 |
| Total | 718 (100.0%) | $73,750 |
Household Income in Catskill
Household Income Brackets in Catskill
With 328 households falling in the category, the $50,000 to $74,999 income range is the most frequent in Catskill, accounting for 19.4% of all households. In contrast, only 47 households (2.8%) fall into the less than $10,000 income bracket, making it the least populous group.
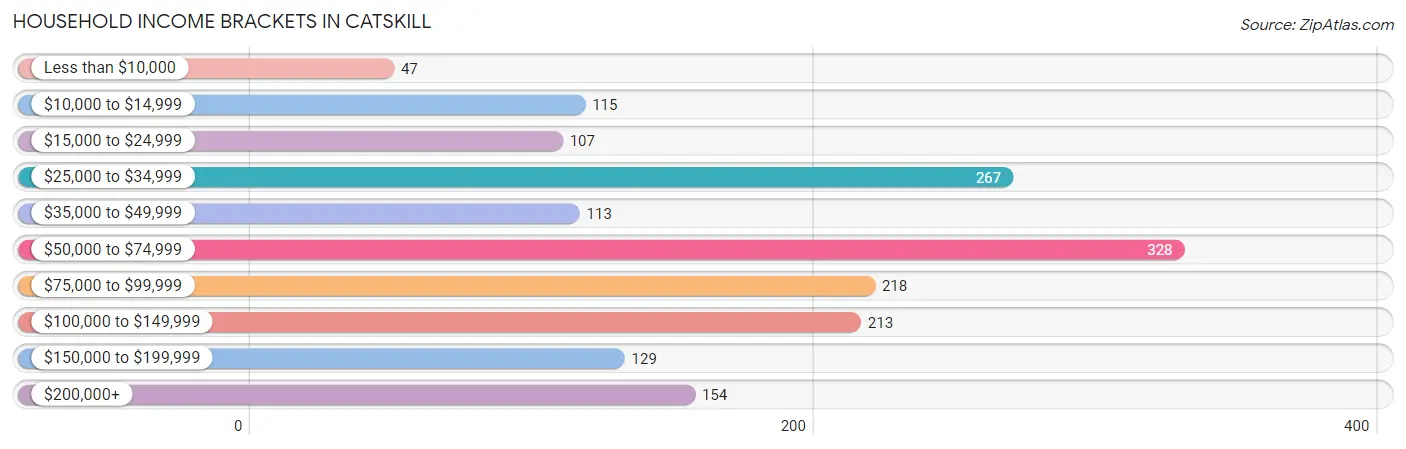
| Income Bracket | # Households | % Households |
| Less than $10,000 | 47 | 2.8% |
| $10,000 to $14,999 | 115 | 6.8% |
| $15,000 to $24,999 | 107 | 6.3% |
| $25,000 to $34,999 | 267 | 15.8% |
| $35,000 to $49,999 | 113 | 6.7% |
| $50,000 to $74,999 | 328 | 19.4% |
| $75,000 to $99,999 | 218 | 12.9% |
| $100,000 to $149,999 | 213 | 12.6% |
| $150,000 to $199,999 | 129 | 7.6% |
| $200,000+ | 154 | 9.1% |
Household Income by Householder Age in Catskill
The median household income in Catskill is $70,532, with the highest median household income of $78,998 found in the 25 to 44 years age bracket for the primary householder. A total of 513 households (30.3%) fall into this category. Meanwhile, the 15 to 24 years age bracket for the primary householder has the lowest median household income of $0, with 52 households (3.1%) in this group.
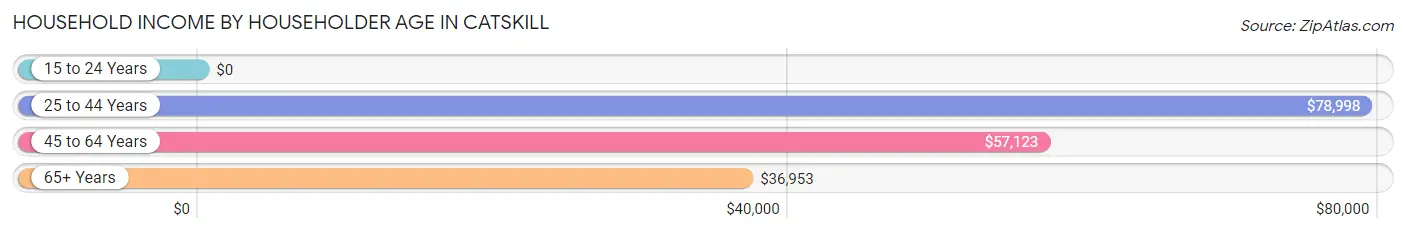
| Income Bracket | # Households | Median Income |
| 15 to 24 Years | 52 (3.1%) | $0 |
| 25 to 44 Years | 513 (30.3%) | $78,998 |
| 45 to 64 Years | 634 (37.5%) | $57,123 |
| 65+ Years | 493 (29.1%) | $36,953 |
| Total | 1,692 (100.0%) | $70,532 |
Poverty in Catskill
Income Below Poverty by Sex and Age in Catskill
With 16.8% poverty level for males and 19.6% for females among the residents of Catskill, 25 to 34 year old males and 55 to 64 year old females are the most vulnerable to poverty, with 129 males (44.3%) and 150 females (36.3%) in their respective age groups living below the poverty level.
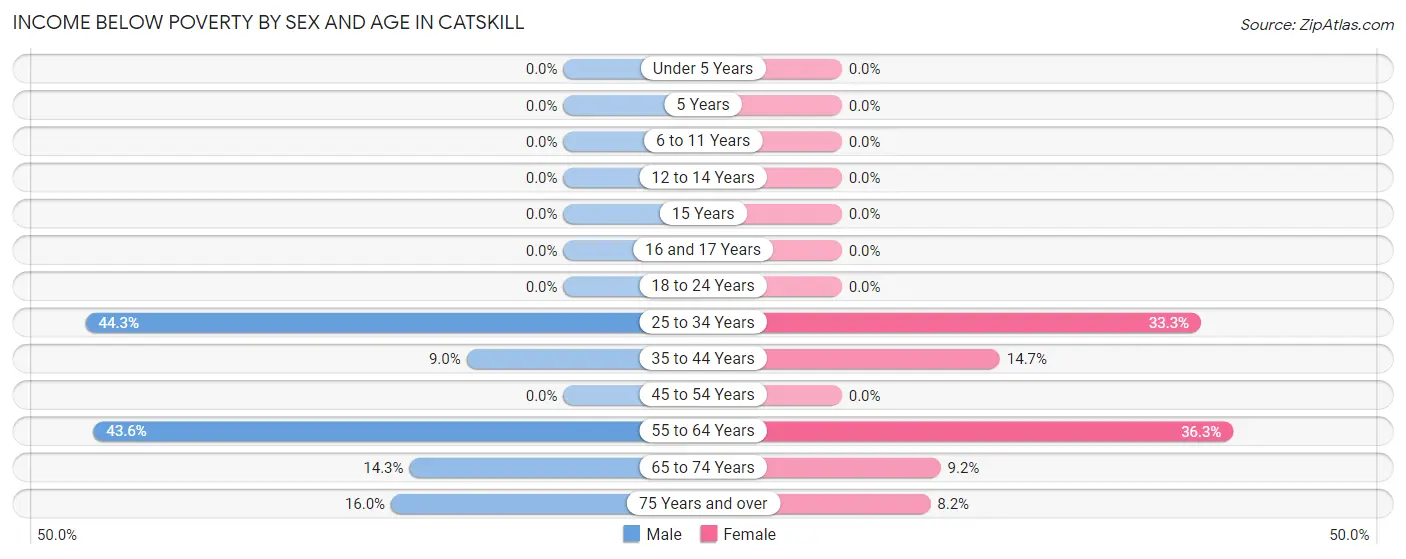
| Age Bracket | Male | Female |
| Under 5 Years | 0 (0.0%) | 0 (0.0%) |
| 5 Years | 0 (0.0%) | 0 (0.0%) |
| 6 to 11 Years | 0 (0.0%) | 0 (0.0%) |
| 12 to 14 Years | 0 (0.0%) | 0 (0.0%) |
| 15 Years | 0 (0.0%) | 0 (0.0%) |
| 16 and 17 Years | 0 (0.0%) | 0 (0.0%) |
| 18 to 24 Years | 0 (0.0%) | 0 (0.0%) |
| 25 to 34 Years | 129 (44.3%) | 144 (33.3%) |
| 35 to 44 Years | 29 (9.0%) | 22 (14.7%) |
| 45 to 54 Years | 0 (0.0%) | 0 (0.0%) |
| 55 to 64 Years | 140 (43.6%) | 150 (36.3%) |
| 65 to 74 Years | 38 (14.3%) | 20 (9.2%) |
| 75 Years and over | 4 (16.0%) | 12 (8.2%) |
| Total | 340 (16.8%) | 348 (19.6%) |
Income Above Poverty by Sex and Age in Catskill
According to the poverty statistics in Catskill, males aged under 5 years and females aged under 5 years are the age groups that are most secure financially, with 100.0% of males and 100.0% of females in these age groups living above the poverty line.
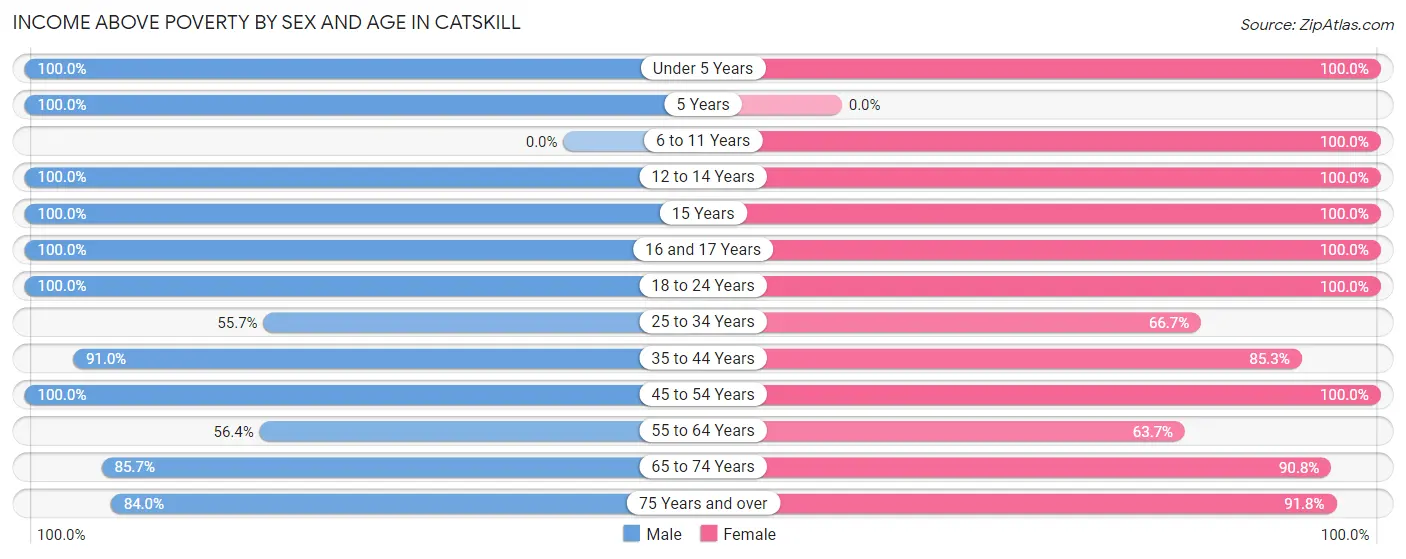
| Age Bracket | Male | Female |
| Under 5 Years | 113 (100.0%) | 7 (100.0%) |
| 5 Years | 28 (100.0%) | 0 (0.0%) |
| 6 to 11 Years | 0 (0.0%) | 29 (100.0%) |
| 12 to 14 Years | 11 (100.0%) | 64 (100.0%) |
| 15 Years | 28 (100.0%) | 6 (100.0%) |
| 16 and 17 Years | 31 (100.0%) | 25 (100.0%) |
| 18 to 24 Years | 364 (100.0%) | 96 (100.0%) |
| 25 to 34 Years | 162 (55.7%) | 288 (66.7%) |
| 35 to 44 Years | 294 (91.0%) | 128 (85.3%) |
| 45 to 54 Years | 222 (100.0%) | 192 (100.0%) |
| 55 to 64 Years | 181 (56.4%) | 263 (63.7%) |
| 65 to 74 Years | 228 (85.7%) | 198 (90.8%) |
| 75 Years and over | 21 (84.0%) | 134 (91.8%) |
| Total | 1,683 (83.2%) | 1,430 (80.4%) |
Income Below Poverty Among Married-Couple Families in Catskill
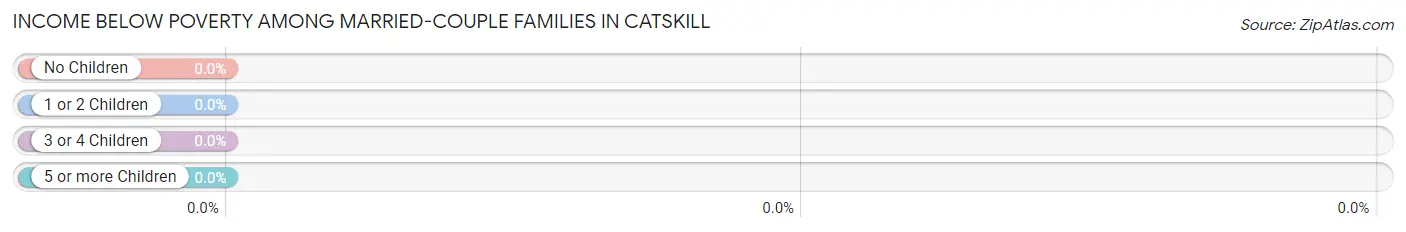
| Children | Above Poverty | Below Poverty |
| No Children | 308 (100.0%) | 0 (0.0%) |
| 1 or 2 Children | 146 (100.0%) | 0 (0.0%) |
| 3 or 4 Children | 4 (100.0%) | 0 (0.0%) |
| 5 or more Children | 0 (0.0%) | 0 (0.0%) |
| Total | 458 (100.0%) | 0 (0.0%) |
Income Below Poverty Among Single-Parent Households in Catskill
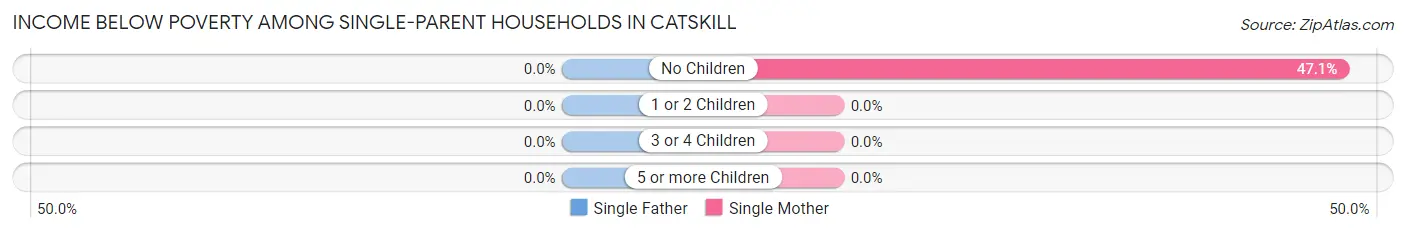
| Children | Single Father | Single Mother |
| No Children | 0 (0.0%) | 80 (47.1%) |
| 1 or 2 Children | 0 (0.0%) | 0 (0.0%) |
| 3 or 4 Children | 0 (0.0%) | 0 (0.0%) |
| 5 or more Children | 0 (0.0%) | 0 (0.0%) |
| Total | 0 (0.0%) | 80 (39.8%) |
Income Below Poverty Among Married-Couple vs Single-Parent Households in Catskill
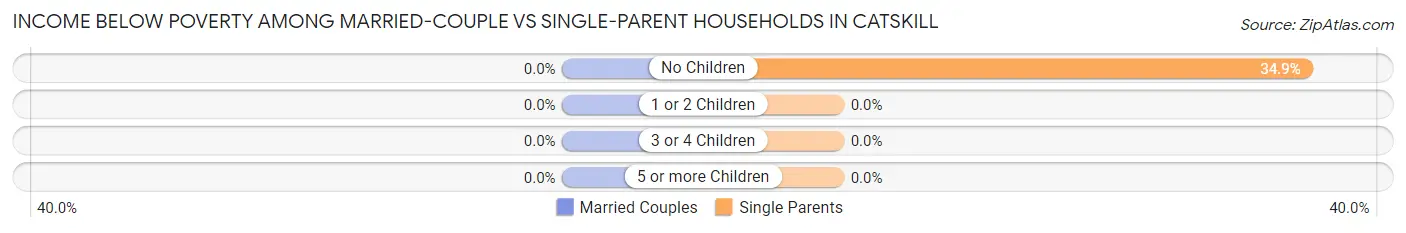
| Children | Married-Couple Families | Single-Parent Households |
| No Children | 0 (0.0%) | 80 (34.9%) |
| 1 or 2 Children | 0 (0.0%) | 0 (0.0%) |
| 3 or 4 Children | 0 (0.0%) | 0 (0.0%) |
| 5 or more Children | 0 (0.0%) | 0 (0.0%) |
| Total | 0 (0.0%) | 80 (30.8%) |
Race in Catskill
The most populous races in Catskill are White / Caucasian (2,814 | 73.5%), Black / African American (604 | 15.8%), and Hispanic or Latino (272 | 7.1%).
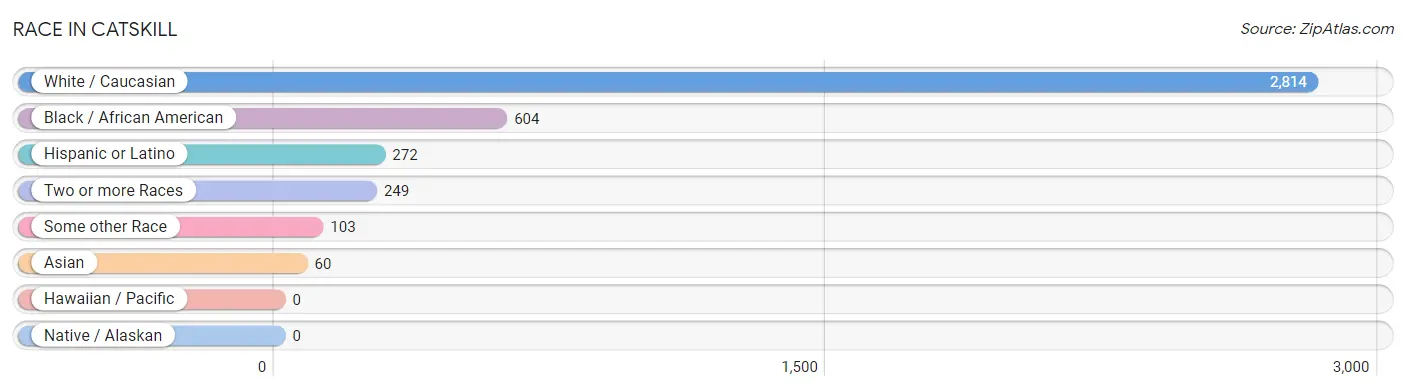
| Race | # Population | % Population |
| Asian | 60 | 1.6% |
| Black / African American | 604 | 15.8% |
| Hawaiian / Pacific | 0 | 0.0% |
| Hispanic or Latino | 272 | 7.1% |
| Native / Alaskan | 0 | 0.0% |
| White / Caucasian | 2,814 | 73.5% |
| Two or more Races | 249 | 6.5% |
| Some other Race | 103 | 2.7% |
| Total | 3,830 | 100.0% |
Ancestry in Catskill
The most populous ancestries reported in Catskill are Irish (783 | 20.4%), Italian (660 | 17.2%), German (348 | 9.1%), American (340 | 8.9%), and Dutch (171 | 4.5%), together accounting for 60.1% of all Catskill residents.
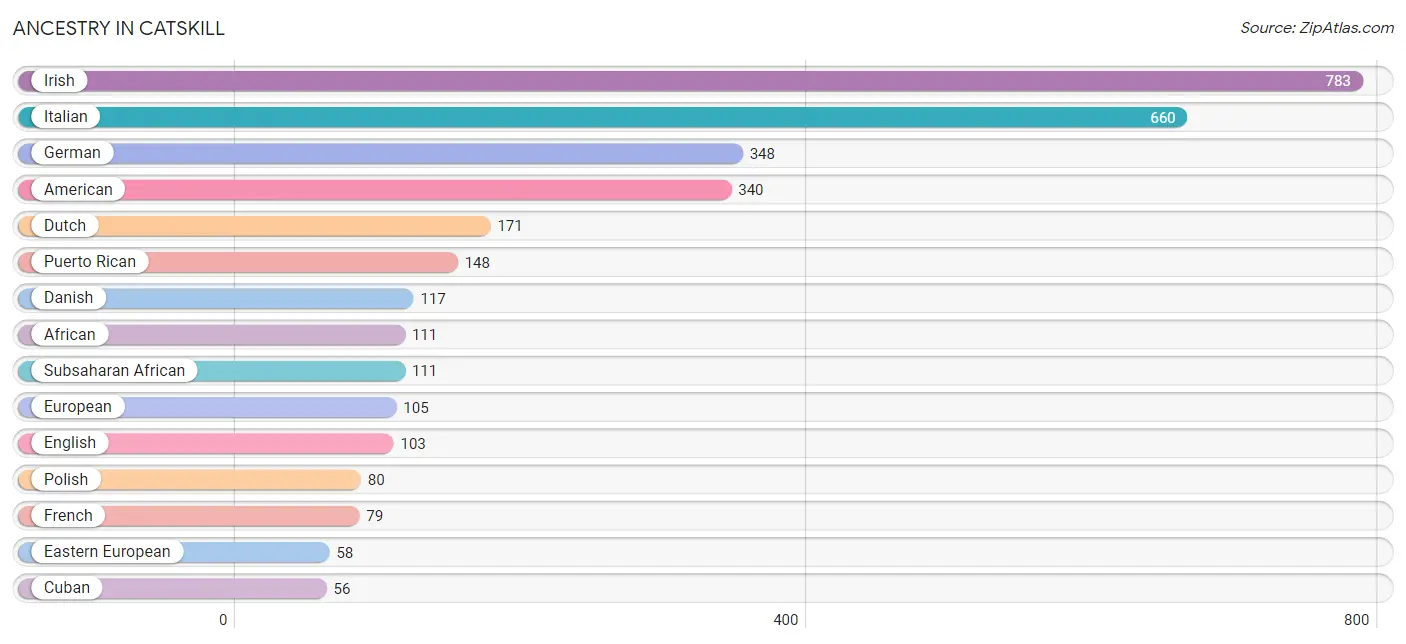
| Ancestry | # Population | % Population |
| African | 111 | 2.9% |
| Albanian | 44 | 1.1% |
| American | 340 | 8.9% |
| Arab | 1 | 0.0% |
| British | 22 | 0.6% |
| Croatian | 45 | 1.2% |
| Cuban | 56 | 1.5% |
| Czechoslovakian | 28 | 0.7% |
| Danish | 117 | 3.0% |
| Dominican | 3 | 0.1% |
| Dutch | 171 | 4.5% |
| Eastern European | 58 | 1.5% |
| Egyptian | 1 | 0.0% |
| English | 103 | 2.7% |
| European | 105 | 2.7% |
| French | 79 | 2.1% |
| German | 348 | 9.1% |
| Indian (Asian) | 26 | 0.7% |
| Irish | 783 | 20.4% |
| Italian | 660 | 17.2% |
| Polish | 80 | 2.1% |
| Portuguese | 22 | 0.6% |
| Puerto Rican | 148 | 3.9% |
| Russian | 46 | 1.2% |
| Scottish | 23 | 0.6% |
| Serbian | 13 | 0.3% |
| Slavic | 20 | 0.5% |
| Spaniard | 18 | 0.5% |
| Spanish | 38 | 1.0% |
| Subsaharan African | 111 | 2.9% | View All 30 Rows |
Immigrants in Catskill
The most numerous immigrant groups reported in Catskill came from Europe (146 | 3.8%), Eastern Europe (57 | 1.5%), Western Europe (51 | 1.3%), Albania (44 | 1.1%), and Italy (38 | 1.0%), together accounting for 8.8% of all Catskill residents.
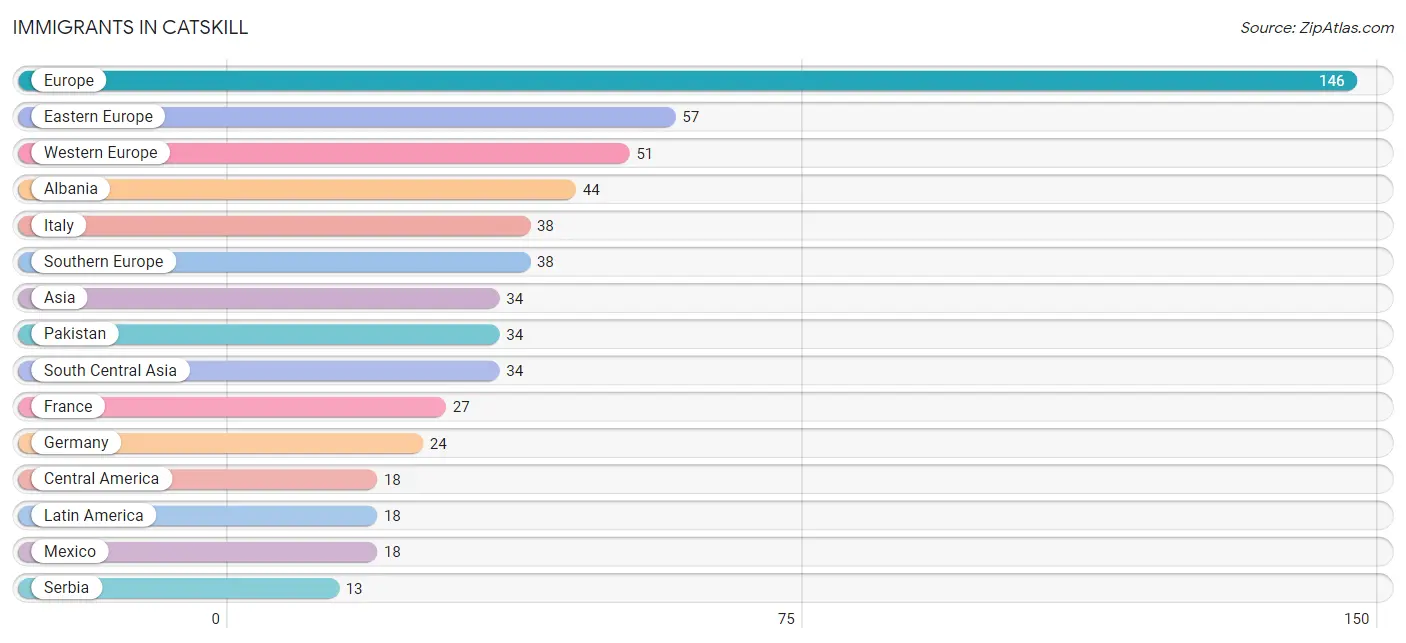
| Immigration Origin | # Population | % Population |
| Albania | 44 | 1.1% |
| Asia | 34 | 0.9% |
| Central America | 18 | 0.5% |
| Eastern Europe | 57 | 1.5% |
| Europe | 146 | 3.8% |
| France | 27 | 0.7% |
| Germany | 24 | 0.6% |
| Italy | 38 | 1.0% |
| Latin America | 18 | 0.5% |
| Mexico | 18 | 0.5% |
| Pakistan | 34 | 0.9% |
| Serbia | 13 | 0.3% |
| South Central Asia | 34 | 0.9% |
| Southern Europe | 38 | 1.0% |
| Western Europe | 51 | 1.3% | View All 15 Rows |
Sex and Age in Catskill
Sex and Age in Catskill
The most populous age groups in Catskill are 20 to 24 Years (319 | 15.6%) for men and 25 to 29 Years (361 | 20.2%) for women.
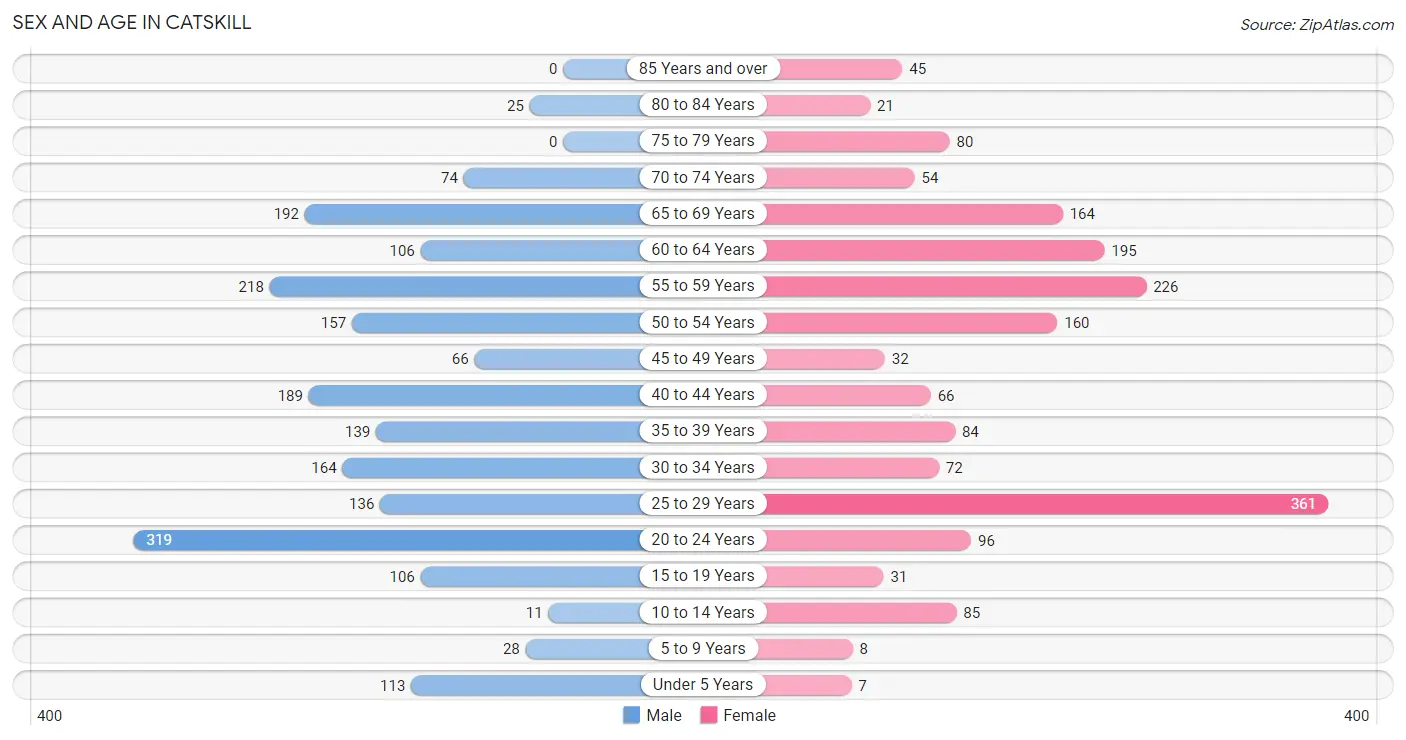
| Age Bracket | Male | Female |
| Under 5 Years | 113 (5.5%) | 7 (0.4%) |
| 5 to 9 Years | 28 (1.4%) | 8 (0.4%) |
| 10 to 14 Years | 11 (0.5%) | 85 (4.8%) |
| 15 to 19 Years | 106 (5.2%) | 31 (1.7%) |
| 20 to 24 Years | 319 (15.6%) | 96 (5.4%) |
| 25 to 29 Years | 136 (6.7%) | 361 (20.2%) |
| 30 to 34 Years | 164 (8.0%) | 72 (4.0%) |
| 35 to 39 Years | 139 (6.8%) | 84 (4.7%) |
| 40 to 44 Years | 189 (9.2%) | 66 (3.7%) |
| 45 to 49 Years | 66 (3.2%) | 32 (1.8%) |
| 50 to 54 Years | 157 (7.7%) | 160 (8.9%) |
| 55 to 59 Years | 218 (10.7%) | 226 (12.7%) |
| 60 to 64 Years | 106 (5.2%) | 195 (10.9%) |
| 65 to 69 Years | 192 (9.4%) | 164 (9.2%) |
| 70 to 74 Years | 74 (3.6%) | 54 (3.0%) |
| 75 to 79 Years | 0 (0.0%) | 80 (4.5%) |
| 80 to 84 Years | 25 (1.2%) | 21 (1.2%) |
| 85 Years and over | 0 (0.0%) | 45 (2.5%) |
| Total | 2,043 (100.0%) | 1,787 (100.0%) |
Families and Households in Catskill
Median Family Size in Catskill
The median family size in Catskill is 3.31 persons per family, with single female/mother families (201 | 28.0%) accounting for the largest median family size of 4.58 persons per family. On the other hand, married-couple families (458 | 63.8%) represent the smallest median family size with 2.76 persons per family.
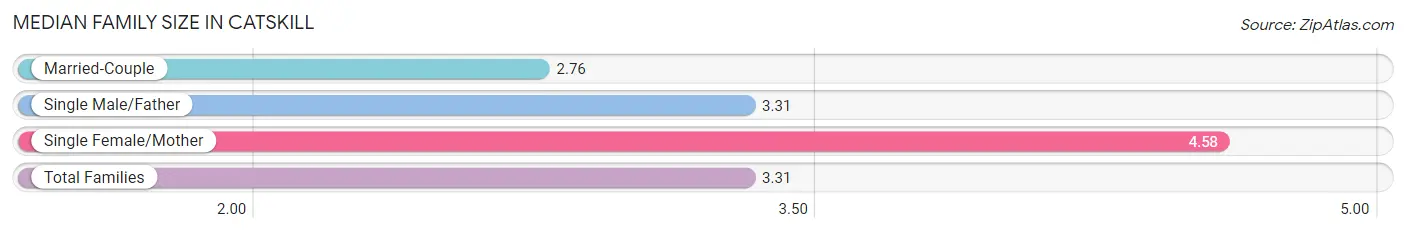
| Family Type | # Families | Family Size |
| Married-Couple | 458 (63.8%) | 2.76 |
| Single Male/Father | 59 (8.2%) | 3.31 |
| Single Female/Mother | 201 (28.0%) | 4.58 |
| Total Families | 718 (100.0%) | 3.31 |
Median Household Size in Catskill
The median household size in Catskill is 2.22 persons per household, with single female/mother households (201 | 11.9%) accounting for the largest median household size of 4.74 persons per household. non-family households (974 | 57.6%) represent the smallest median household size with 1.39 persons per household.
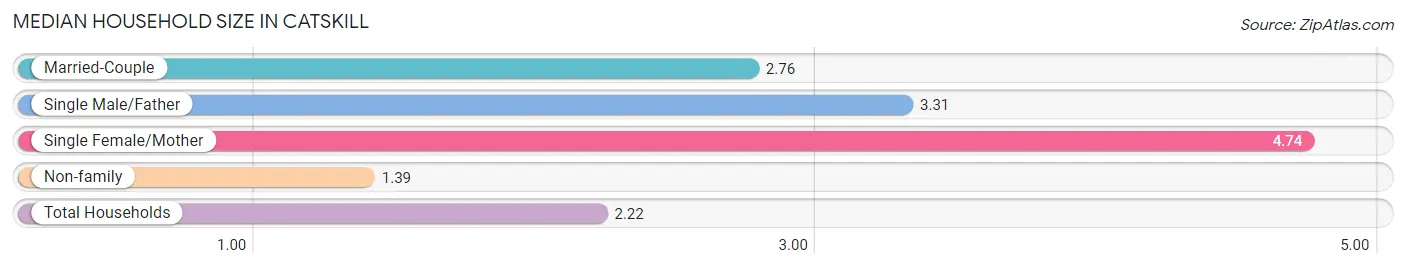
| Household Type | # Households | Household Size |
| Married-Couple | 458 (27.1%) | 2.76 |
| Single Male/Father | 59 (3.5%) | 3.31 |
| Single Female/Mother | 201 (11.9%) | 4.74 |
| Non-family | 974 (57.6%) | 1.39 |
| Total Households | 1,692 (100.0%) | 2.22 |
Household Size by Marriage Status in Catskill
Out of a total of 1,692 households in Catskill, 718 (42.4%) are family households, while 974 (57.6%) are nonfamily households. The most numerous type of family households are 2-person households, comprising 452, and the most common type of nonfamily households are 1-person households, comprising 772.
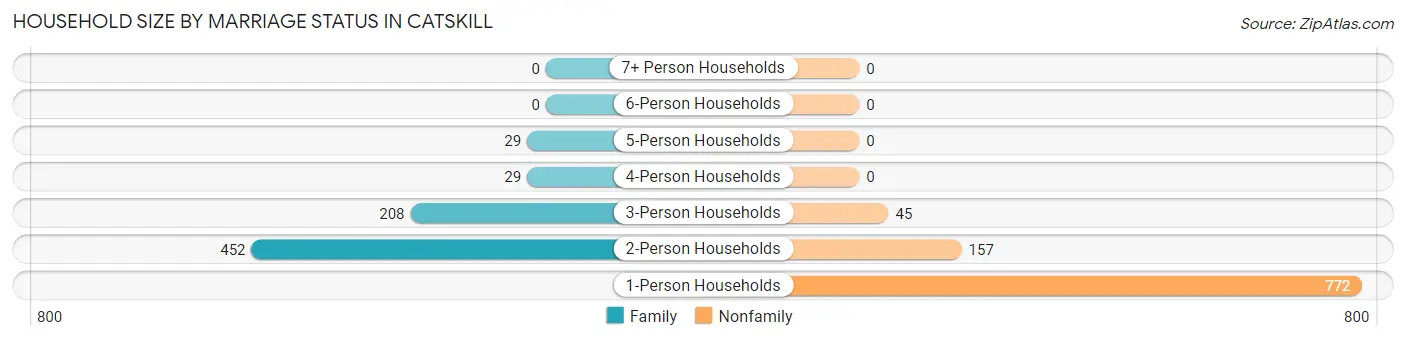
| Household Size | Family Households | Nonfamily Households |
| 1-Person Households | - | 772 (45.6%) |
| 2-Person Households | 452 (26.7%) | 157 (9.3%) |
| 3-Person Households | 208 (12.3%) | 45 (2.7%) |
| 4-Person Households | 29 (1.7%) | 0 (0.0%) |
| 5-Person Households | 29 (1.7%) | 0 (0.0%) |
| 6-Person Households | 0 (0.0%) | 0 (0.0%) |
| 7+ Person Households | 0 (0.0%) | 0 (0.0%) |
| Total | 718 (42.4%) | 974 (57.6%) |
Female Fertility in Catskill
Fertility by Age in Catskill
| Age Bracket | Women with Births | Births / 1,000 Women |
| 15 to 19 years | 0 (0.0%) | 0.0 |
| 20 to 34 years | 0 (0.0%) | 0.0 |
| 35 to 50 years | 0 (0.0%) | 0.0 |
| Total | 0 (0.0%) | 0.0 |
Fertility by Age by Marriage Status in Catskill
| Age Bracket | Married | Unmarried |
| 15 to 19 years | 0 (0.0%) | 0 (0.0%) |
| 20 to 34 years | 0 (0.0%) | 0 (0.0%) |
| 35 to 50 years | 0 (0.0%) | 0 (0.0%) |
| Total | 0 (0.0%) | 0 (0.0%) |
Fertility by Education in Catskill
| Educational Attainment | Women with Births | Births / 1,000 Women |
| Less than High School | 0 (0.0%) | 0.0 |
| High School Diploma | 0 (0.0%) | 0.0 |
| College or Associate's Degree | 0 (0.0%) | 0.0 |
| Bachelor's Degree | 0 (0.0%) | 0.0 |
| Graduate Degree | 0 (0.0%) | 0.0 |
| Total | 0 (0.0%) | 0.0 |
Fertility by Education by Marriage Status in Catskill
| Educational Attainment | Married | Unmarried |
| Less than High School | 0 (0.0%) | 0 (0.0%) |
| High School Diploma | 0 (0.0%) | 0 (0.0%) |
| College or Associate's Degree | 0 (0.0%) | 0 (0.0%) |
| Bachelor's Degree | 0 (0.0%) | 0 (0.0%) |
| Graduate Degree | 0 (0.0%) | 0 (0.0%) |
| Total | 0 (0.0%) | 0 (0.0%) |
Employment Characteristics in Catskill
Employment by Class of Employer in Catskill
Among the 1,928 employed individuals in Catskill, private company employees (1,008 | 52.3%), not-for-profit organizations (316 | 16.4%), and state government employees (194 | 10.1%) make up the most common classes of employment.
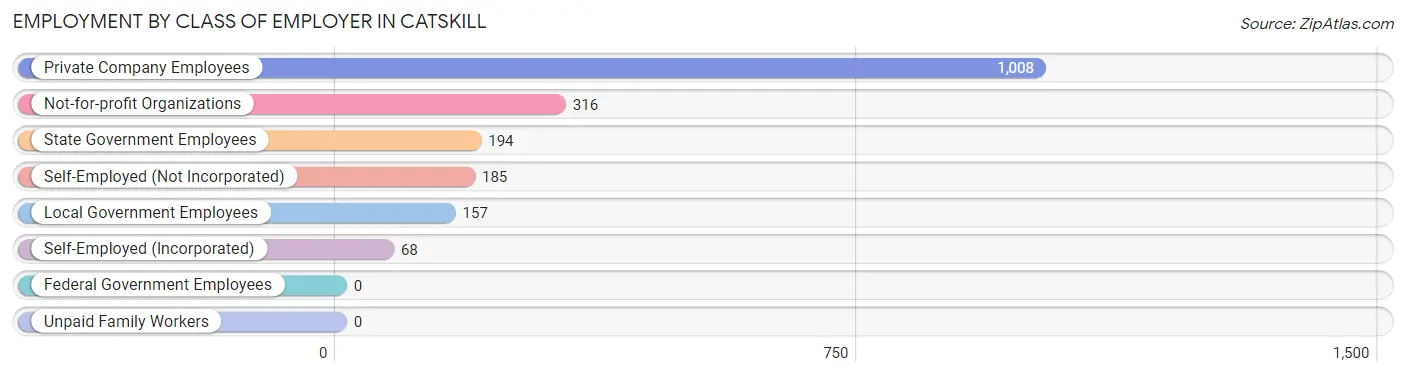
| Employer Class | # Employees | % Employees |
| Private Company Employees | 1,008 | 52.3% |
| Self-Employed (Incorporated) | 68 | 3.5% |
| Self-Employed (Not Incorporated) | 185 | 9.6% |
| Not-for-profit Organizations | 316 | 16.4% |
| Local Government Employees | 157 | 8.1% |
| State Government Employees | 194 | 10.1% |
| Federal Government Employees | 0 | 0.0% |
| Unpaid Family Workers | 0 | 0.0% |
| Total | 1,928 | 100.0% |
Employment Status by Age in Catskill
According to the labor force statistics for Catskill, out of the total population over 16 years of age (3,544), 59.4% or 2,105 individuals are in the labor force, with 6.3% or 133 of them unemployed. The age group with the highest labor force participation rate is 35 to 44 years, with 83.3% or 398 individuals in the labor force. Within the labor force, the 16 to 19 years age range has the highest percentage of unemployed individuals, with 51.1% or 24 of them being unemployed.
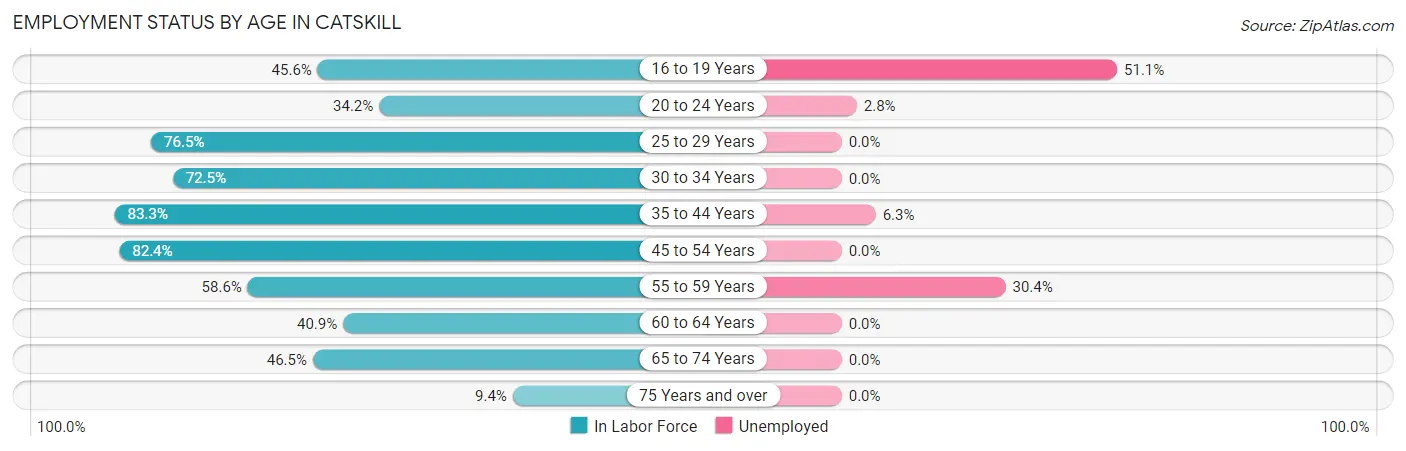
| Age Bracket | In Labor Force | Unemployed |
| 16 to 19 Years | 47 (45.6%) | 24 (51.1%) |
| 20 to 24 Years | 142 (34.2%) | 4 (2.8%) |
| 25 to 29 Years | 380 (76.5%) | 0 (0.0%) |
| 30 to 34 Years | 171 (72.5%) | 0 (0.0%) |
| 35 to 44 Years | 398 (83.3%) | 25 (6.3%) |
| 45 to 54 Years | 342 (82.4%) | 0 (0.0%) |
| 55 to 59 Years | 260 (58.6%) | 79 (30.4%) |
| 60 to 64 Years | 123 (40.9%) | 0 (0.0%) |
| 65 to 74 Years | 225 (46.5%) | 0 (0.0%) |
| 75 Years and over | 16 (9.4%) | 0 (0.0%) |
| Total | 2,105 (59.4%) | 133 (6.3%) |
Employment Status by Educational Attainment in Catskill
According to labor force statistics for Catskill, 70.6% of individuals (1,674) out of the total population between 25 and 64 years of age (2,371) are in the labor force, with 6.2% or 104 of them being unemployed. The group with the highest labor force participation rate are those with the educational attainment of bachelor's degree or higher, with 97.6% or 698 individuals in the labor force. Within the labor force, individuals with high school diploma education have the highest percentage of unemployment, with 20.1% or 104 of them being unemployed.
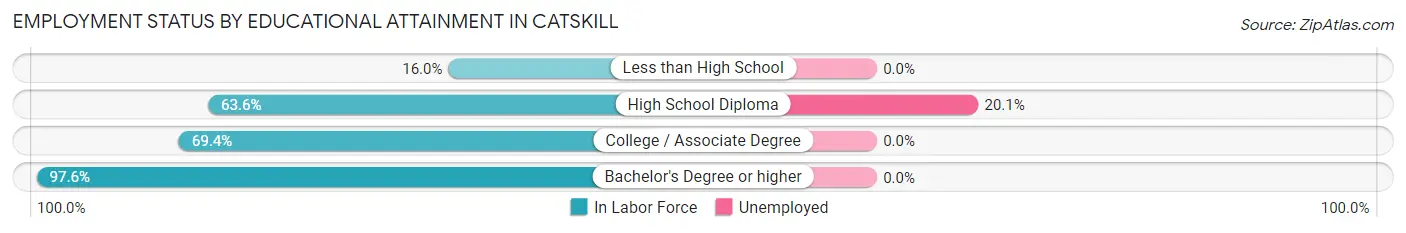
| Educational Attainment | In Labor Force | Unemployed |
| Less than High School | 38 (16.0%) | 0 (0.0%) |
| High School Diploma | 518 (63.6%) | 164 (20.1%) |
| College / Associate Degree | 420 (69.4%) | 0 (0.0%) |
| Bachelor's Degree or higher | 698 (97.6%) | 0 (0.0%) |
| Total | 1,674 (70.6%) | 147 (6.2%) |
Employment Occupations by Sex in Catskill
Management, Business, Science and Arts Occupations
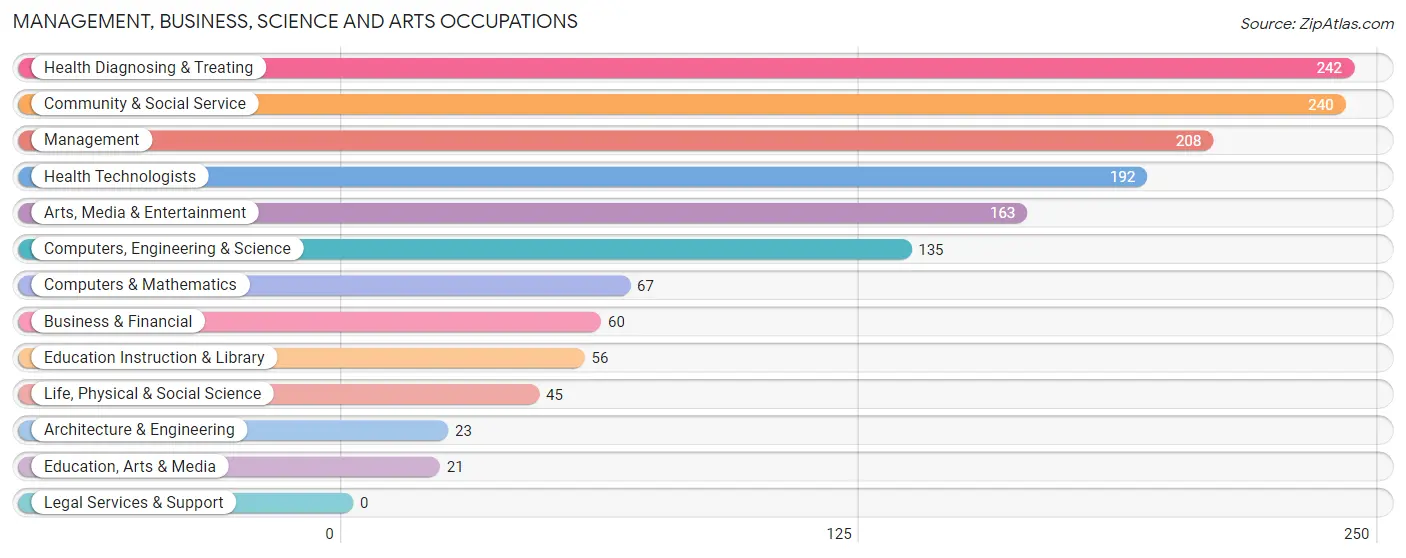
The most common Management, Business, Science and Arts occupations in Catskill are Health Diagnosing & Treating (242 | 12.3%), Community & Social Service (240 | 12.2%), Management (208 | 10.5%), Health Technologists (192 | 9.7%), and Arts, Media & Entertainment (163 | 8.3%).
Management, Business, Science and Arts Occupations by Sex
Within the Management, Business, Science and Arts occupations in Catskill, the most male-oriented occupations are Computers & Mathematics (100.0%), Architecture & Engineering (100.0%), and Computers, Engineering & Science (94.8%), while the most female-oriented occupations are Education, Arts & Media (100.0%), Health Technologists (100.0%), and Health Diagnosing & Treating (96.7%).
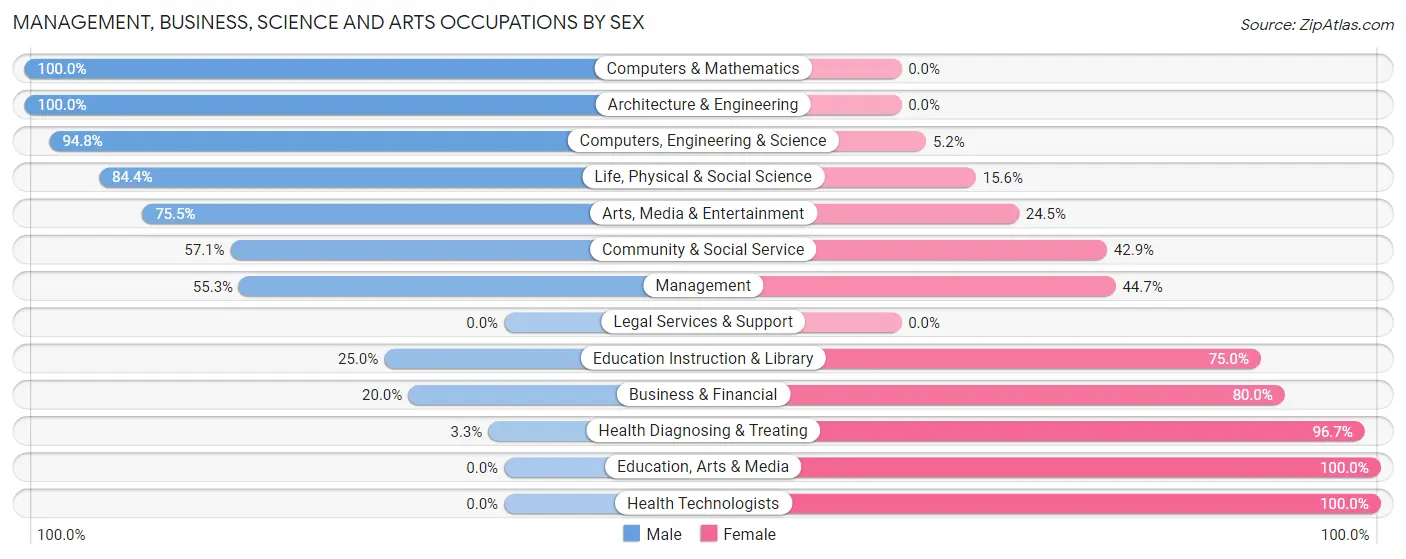
| Occupation | Male | Female |
| Management | 115 (55.3%) | 93 (44.7%) |
| Business & Financial | 12 (20.0%) | 48 (80.0%) |
| Computers, Engineering & Science | 128 (94.8%) | 7 (5.2%) |
| Computers & Mathematics | 67 (100.0%) | 0 (0.0%) |
| Architecture & Engineering | 23 (100.0%) | 0 (0.0%) |
| Life, Physical & Social Science | 38 (84.4%) | 7 (15.6%) |
| Community & Social Service | 137 (57.1%) | 103 (42.9%) |
| Education, Arts & Media | 0 (0.0%) | 21 (100.0%) |
| Legal Services & Support | 0 (0.0%) | 0 (0.0%) |
| Education Instruction & Library | 14 (25.0%) | 42 (75.0%) |
| Arts, Media & Entertainment | 123 (75.5%) | 40 (24.5%) |
| Health Diagnosing & Treating | 8 (3.3%) | 234 (96.7%) |
| Health Technologists | 0 (0.0%) | 192 (100.0%) |
| Total (Category) | 400 (45.2%) | 485 (54.8%) |
| Total (Overall) | 1,044 (52.9%) | 928 (47.1%) |
Services Occupations
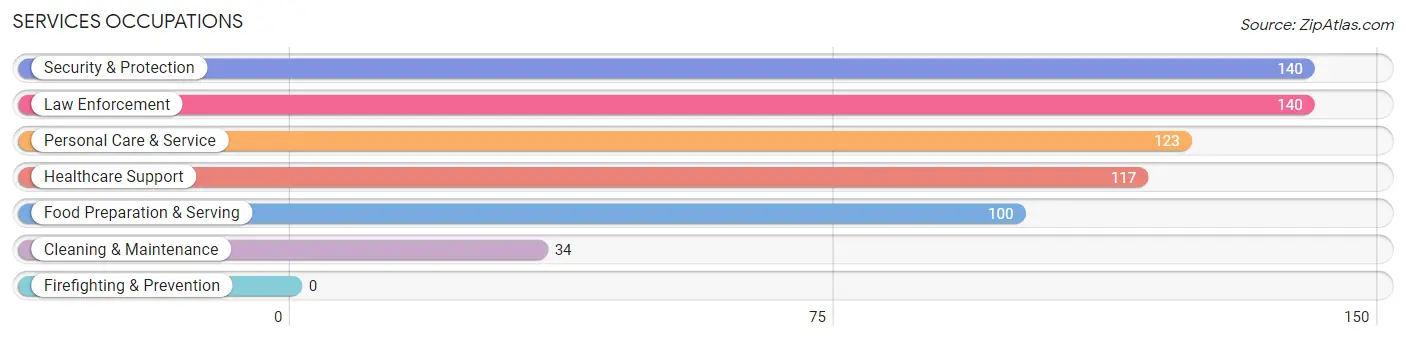
The most common Services occupations in Catskill are Security & Protection (140 | 7.1%), Law Enforcement (140 | 7.1%), Personal Care & Service (123 | 6.2%), Healthcare Support (117 | 5.9%), and Food Preparation & Serving (100 | 5.1%).
Services Occupations by Sex
Within the Services occupations in Catskill, the most male-oriented occupations are Security & Protection (100.0%), Law Enforcement (100.0%), and Food Preparation & Serving (67.0%), while the most female-oriented occupations are Healthcare Support (100.0%), Cleaning & Maintenance (100.0%), and Personal Care & Service (43.1%).
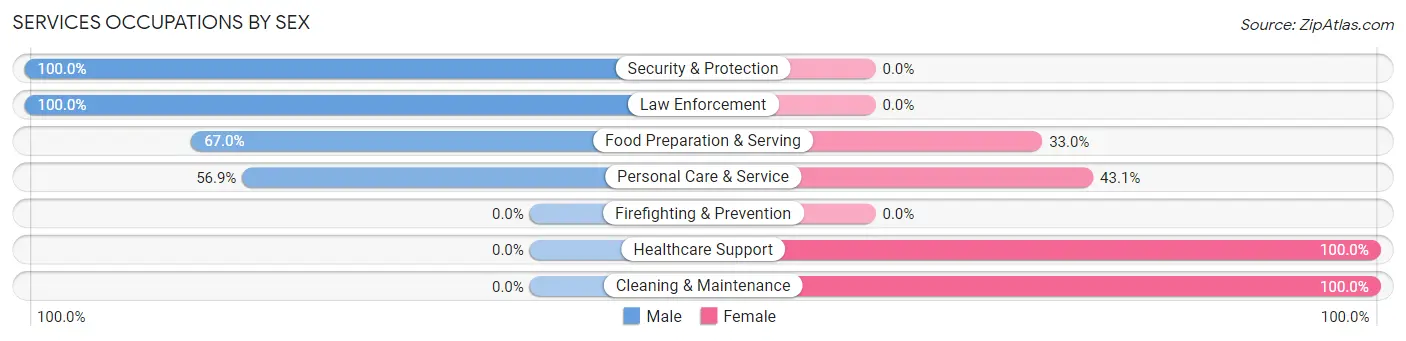
| Occupation | Male | Female |
| Healthcare Support | 0 (0.0%) | 117 (100.0%) |
| Security & Protection | 140 (100.0%) | 0 (0.0%) |
| Firefighting & Prevention | 0 (0.0%) | 0 (0.0%) |
| Law Enforcement | 140 (100.0%) | 0 (0.0%) |
| Food Preparation & Serving | 67 (67.0%) | 33 (33.0%) |
| Cleaning & Maintenance | 0 (0.0%) | 34 (100.0%) |
| Personal Care & Service | 70 (56.9%) | 53 (43.1%) |
| Total (Category) | 277 (53.9%) | 237 (46.1%) |
| Total (Overall) | 1,044 (52.9%) | 928 (47.1%) |
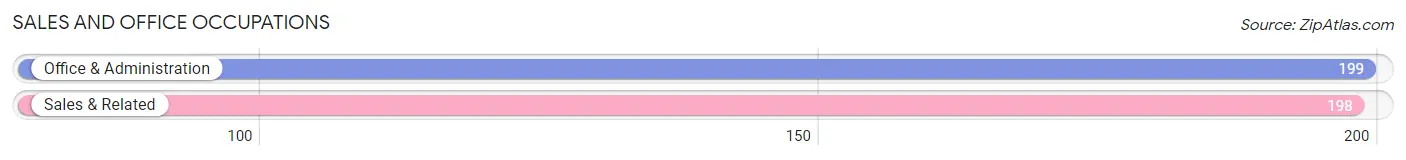
Sales and Office Occupations
The most common Sales and Office occupations in Catskill are Office & Administration (199 | 10.1%), and Sales & Related (198 | 10.0%).
Sales and Office Occupations by Sex
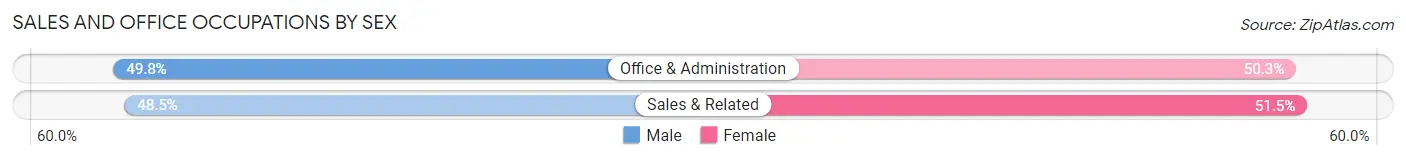
| Occupation | Male | Female |
| Sales & Related | 96 (48.5%) | 102 (51.5%) |
| Office & Administration | 99 (49.7%) | 100 (50.2%) |
| Total (Category) | 195 (49.1%) | 202 (50.9%) |
| Total (Overall) | 1,044 (52.9%) | 928 (47.1%) |
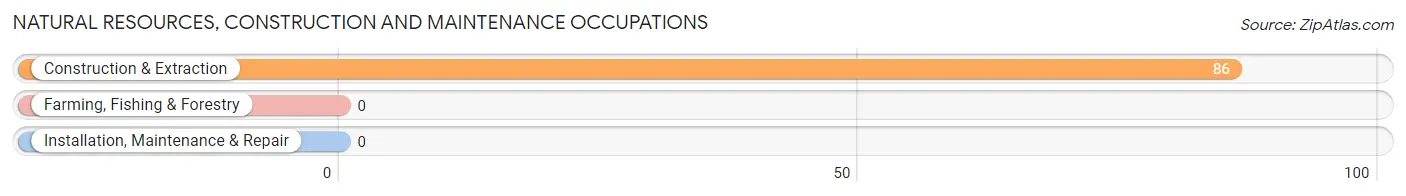
Natural Resources, Construction and Maintenance Occupations
The most common Natural Resources, Construction and Maintenance occupations in Catskill are , and Construction & Extraction (86 | 4.4%).
Natural Resources, Construction and Maintenance Occupations by Sex
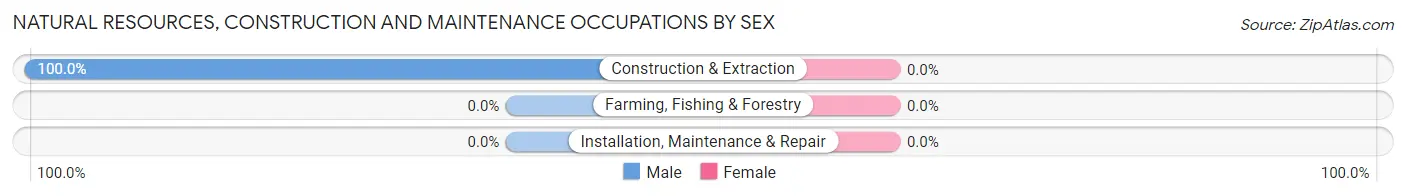
| Occupation | Male | Female |
| Farming, Fishing & Forestry | 0 (0.0%) | 0 (0.0%) |
| Construction & Extraction | 86 (100.0%) | 0 (0.0%) |
| Installation, Maintenance & Repair | 0 (0.0%) | 0 (0.0%) |
| Total (Category) | 86 (100.0%) | 0 (0.0%) |
| Total (Overall) | 1,044 (52.9%) | 928 (47.1%) |
Production, Transportation and Moving Occupations
The most common Production, Transportation and Moving occupations in Catskill are Material Moving (66 | 3.4%), Production (15 | 0.8%), and Transportation (9 | 0.5%).
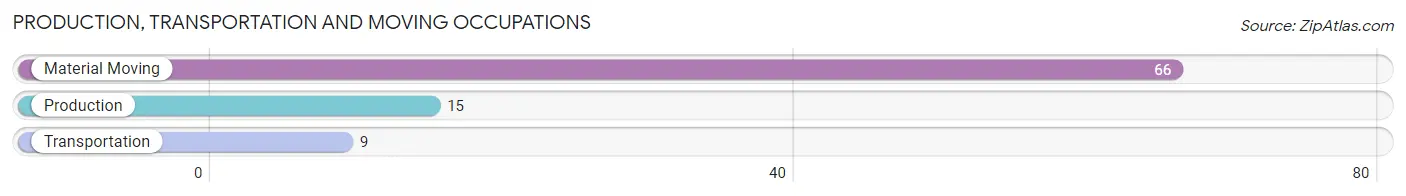
Production, Transportation and Moving Occupations by Sex
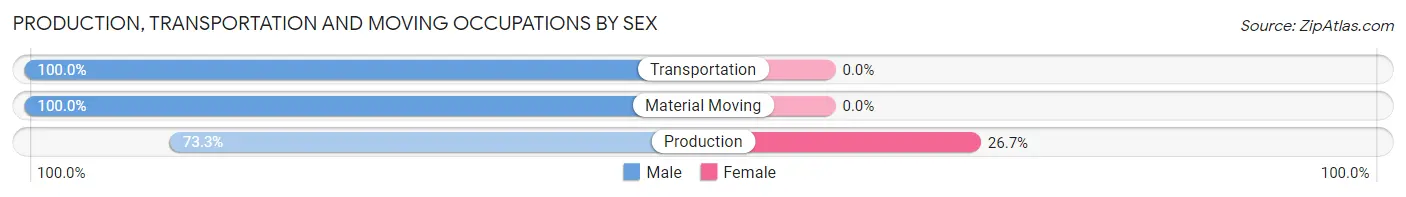
| Occupation | Male | Female |
| Production | 11 (73.3%) | 4 (26.7%) |
| Transportation | 9 (100.0%) | 0 (0.0%) |
| Material Moving | 66 (100.0%) | 0 (0.0%) |
| Total (Category) | 86 (95.6%) | 4 (4.4%) |
| Total (Overall) | 1,044 (52.9%) | 928 (47.1%) |
Employment Industries by Sex in Catskill
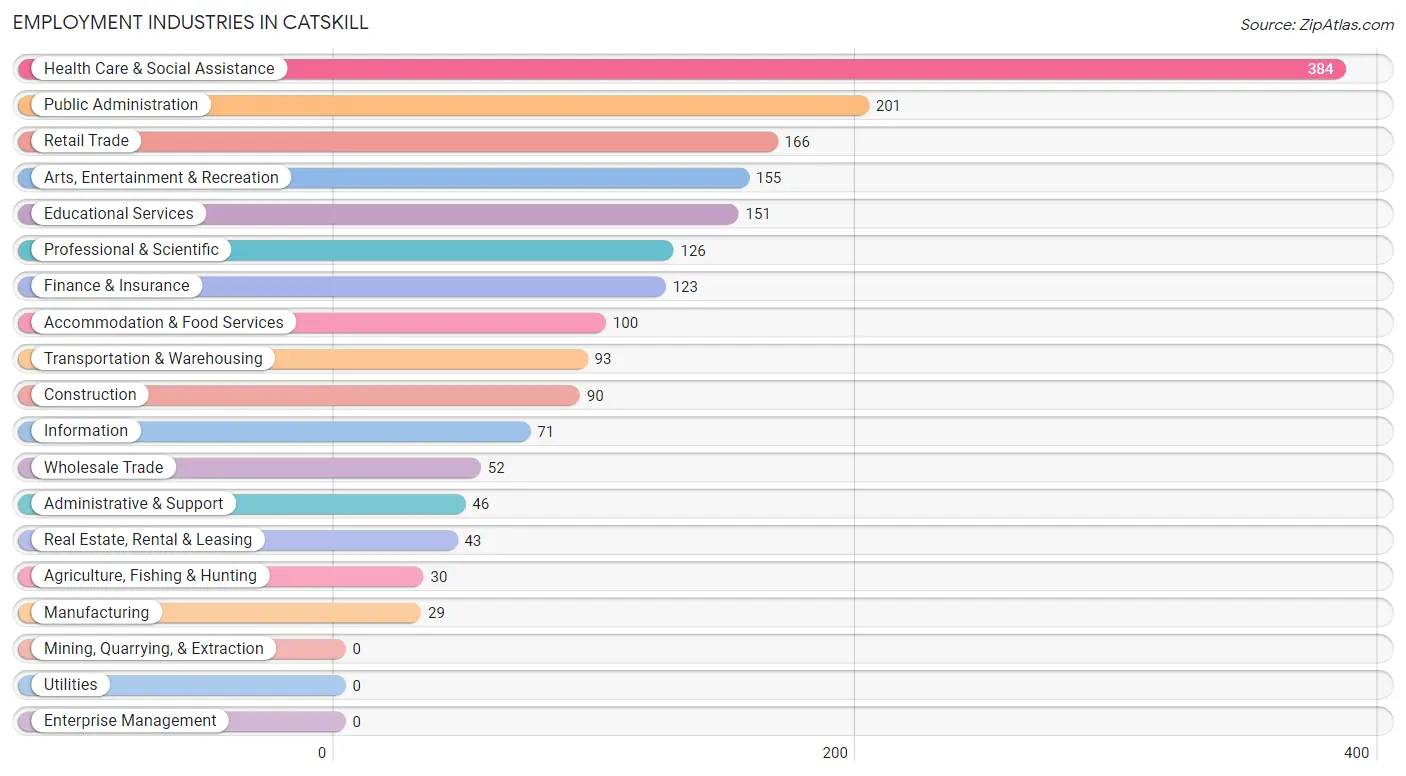
Employment Industries in Catskill
The major employment industries in Catskill include Health Care & Social Assistance (384 | 19.5%), Public Administration (201 | 10.2%), Retail Trade (166 | 8.4%), Arts, Entertainment & Recreation (155 | 7.9%), and Educational Services (151 | 7.7%).
Employment Industries by Sex in Catskill
The Catskill industries that see more men than women are Agriculture, Fishing & Hunting (100.0%), Wholesale Trade (100.0%), and Transportation & Warehousing (100.0%), whereas the industries that tend to have a higher number of women are Information (100.0%), Health Care & Social Assistance (97.9%), and Finance & Insurance (87.8%).
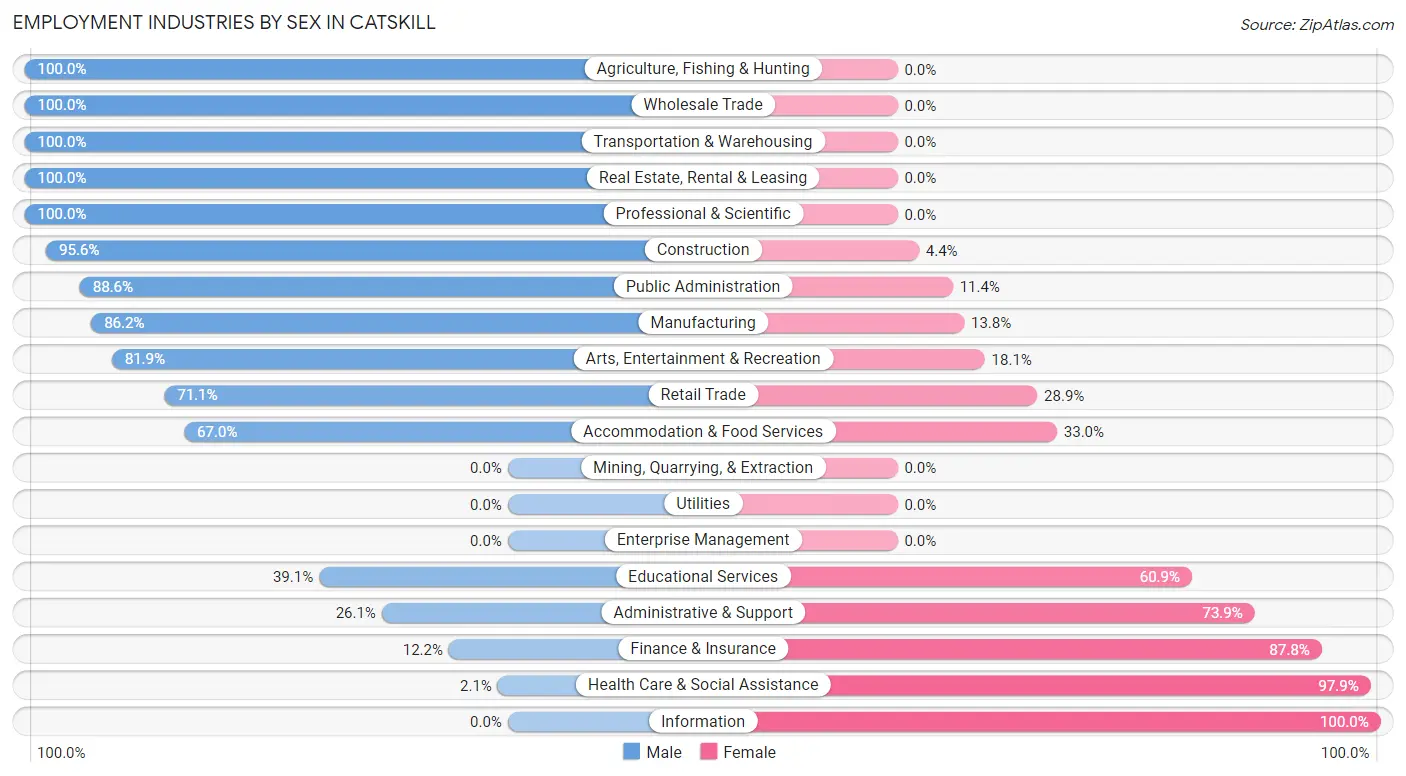
| Industry | Male | Female |
| Agriculture, Fishing & Hunting | 30 (100.0%) | 0 (0.0%) |
| Mining, Quarrying, & Extraction | 0 (0.0%) | 0 (0.0%) |
| Construction | 86 (95.6%) | 4 (4.4%) |
| Manufacturing | 25 (86.2%) | 4 (13.8%) |
| Wholesale Trade | 52 (100.0%) | 0 (0.0%) |
| Retail Trade | 118 (71.1%) | 48 (28.9%) |
| Transportation & Warehousing | 93 (100.0%) | 0 (0.0%) |
| Utilities | 0 (0.0%) | 0 (0.0%) |
| Information | 0 (0.0%) | 71 (100.0%) |
| Finance & Insurance | 15 (12.2%) | 108 (87.8%) |
| Real Estate, Rental & Leasing | 43 (100.0%) | 0 (0.0%) |
| Professional & Scientific | 126 (100.0%) | 0 (0.0%) |
| Enterprise Management | 0 (0.0%) | 0 (0.0%) |
| Administrative & Support | 12 (26.1%) | 34 (73.9%) |
| Educational Services | 59 (39.1%) | 92 (60.9%) |
| Health Care & Social Assistance | 8 (2.1%) | 376 (97.9%) |
| Arts, Entertainment & Recreation | 127 (81.9%) | 28 (18.1%) |
| Accommodation & Food Services | 67 (67.0%) | 33 (33.0%) |
| Public Administration | 178 (88.6%) | 23 (11.4%) |
| Total | 1,044 (52.9%) | 928 (47.1%) |
Education in Catskill
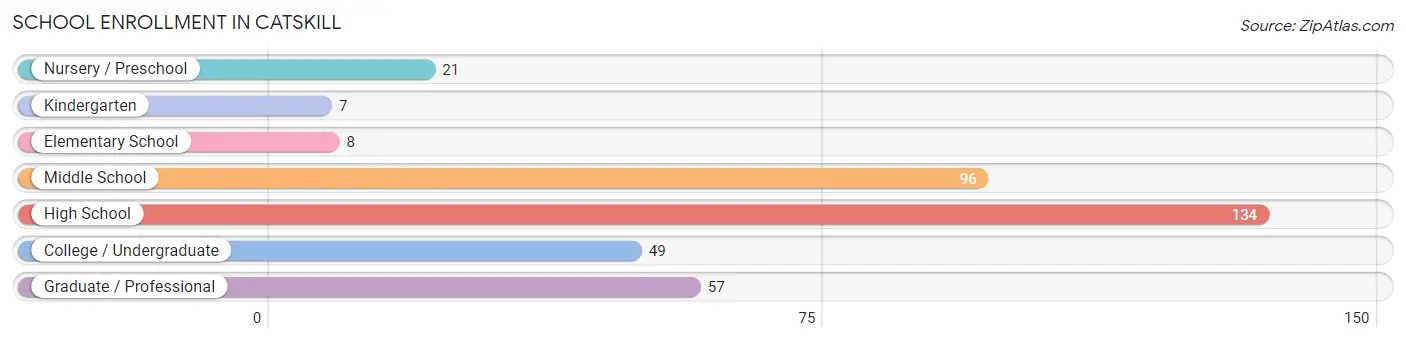
School Enrollment in Catskill
The most common levels of schooling among the 372 students in Catskill are high school (134 | 36.0%), middle school (96 | 25.8%), and graduate / professional (57 | 15.3%).
| School Level | # Students | % Students |
| Nursery / Preschool | 21 | 5.7% |
| Kindergarten | 7 | 1.9% |
| Elementary School | 8 | 2.1% |
| Middle School | 96 | 25.8% |
| High School | 134 | 36.0% |
| College / Undergraduate | 49 | 13.2% |
| Graduate / Professional | 57 | 15.3% |
| Total | 372 | 100.0% |
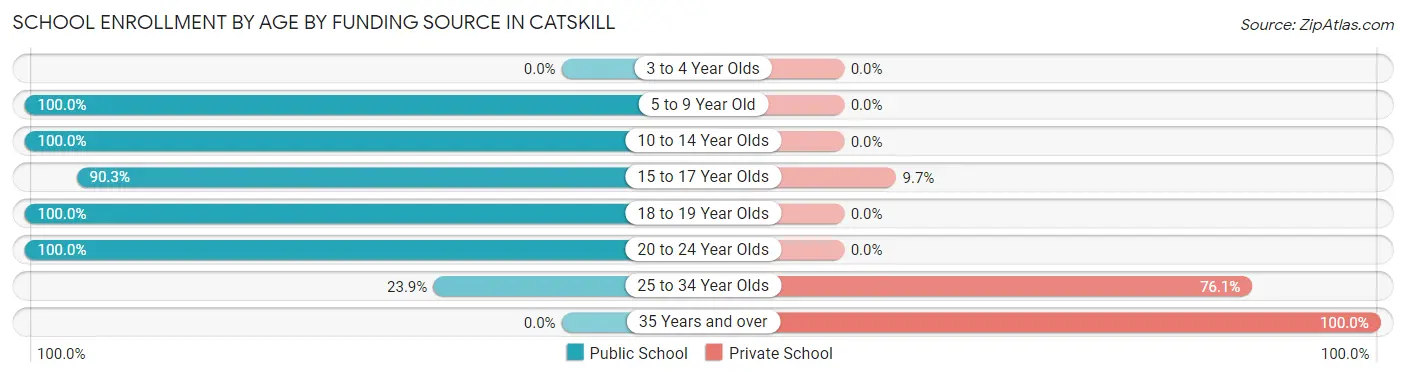
School Enrollment by Age by Funding Source in Catskill
Out of a total of 372 students who are enrolled in schools in Catskill, 117 (31.5%) attend a private institution, while the remaining 255 (68.5%) are enrolled in public schools. The age group of 35 years and over has the highest likelihood of being enrolled in private schools, with 6 (100.0% in the age bracket) enrolled. Conversely, the age group of 5 to 9 year old has the lowest likelihood of being enrolled in a private school, with 36 (100.0% in the age bracket) attending a public institution.
| Age Bracket | Public School | Private School |
| 3 to 4 Year Olds | 0 (0.0%) | 0 (0.0%) |
| 5 to 9 Year Old | 36 (100.0%) | 0 (0.0%) |
| 10 to 14 Year Olds | 96 (100.0%) | 0 (0.0%) |
| 15 to 17 Year Olds | 56 (90.3%) | 6 (9.7%) |
| 18 to 19 Year Olds | 24 (100.0%) | 0 (0.0%) |
| 20 to 24 Year Olds | 10 (100.0%) | 0 (0.0%) |
| 25 to 34 Year Olds | 33 (23.9%) | 105 (76.1%) |
| 35 Years and over | 0 (0.0%) | 6 (100.0%) |
| Total | 255 (68.5%) | 117 (31.5%) |
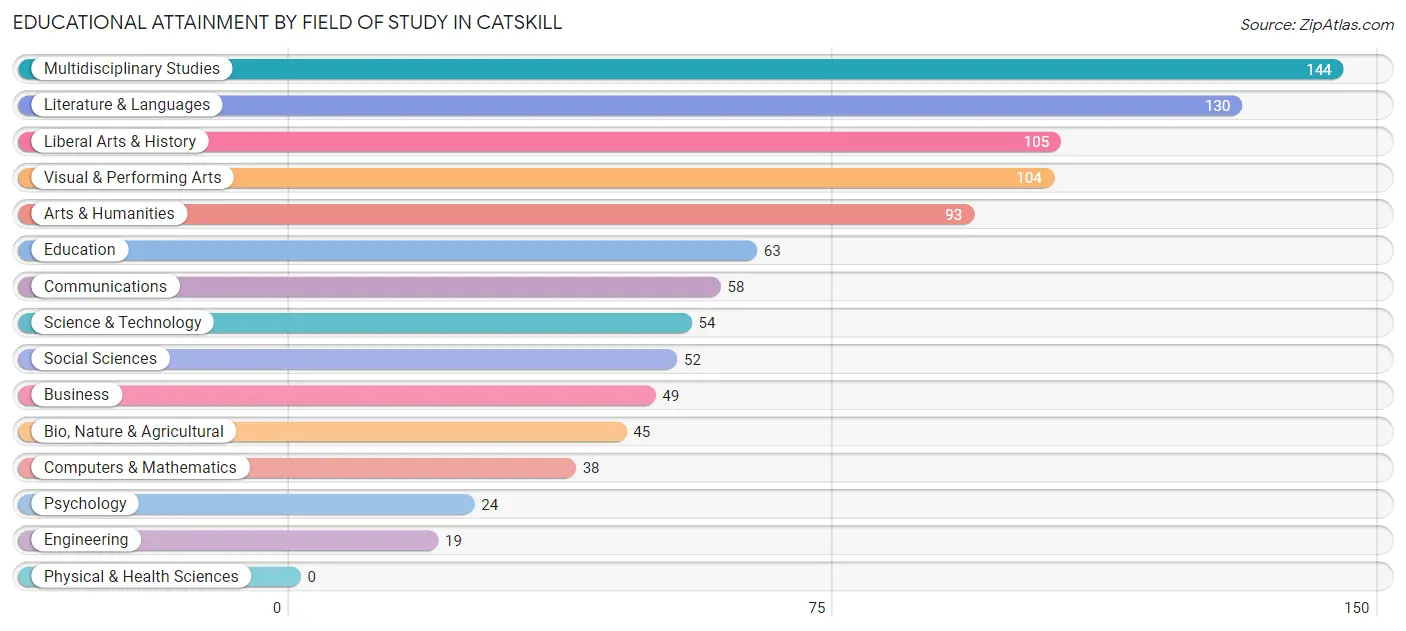
Educational Attainment by Field of Study in Catskill
Multidisciplinary studies (144 | 14.7%), literature & languages (130 | 13.3%), liberal arts & history (105 | 10.7%), visual & performing arts (104 | 10.6%), and arts & humanities (93 | 9.5%) are the most common fields of study among 978 individuals in Catskill who have obtained a bachelor's degree or higher.
| Field of Study | # Graduates | % Graduates |
| Computers & Mathematics | 38 | 3.9% |
| Bio, Nature & Agricultural | 45 | 4.6% |
| Physical & Health Sciences | 0 | 0.0% |
| Psychology | 24 | 2.5% |
| Social Sciences | 52 | 5.3% |
| Engineering | 19 | 1.9% |
| Multidisciplinary Studies | 144 | 14.7% |
| Science & Technology | 54 | 5.5% |
| Business | 49 | 5.0% |
| Education | 63 | 6.4% |
| Literature & Languages | 130 | 13.3% |
| Liberal Arts & History | 105 | 10.7% |
| Visual & Performing Arts | 104 | 10.6% |
| Communications | 58 | 5.9% |
| Arts & Humanities | 93 | 9.5% |
| Total | 978 | 100.0% |
Transportation & Commute in Catskill
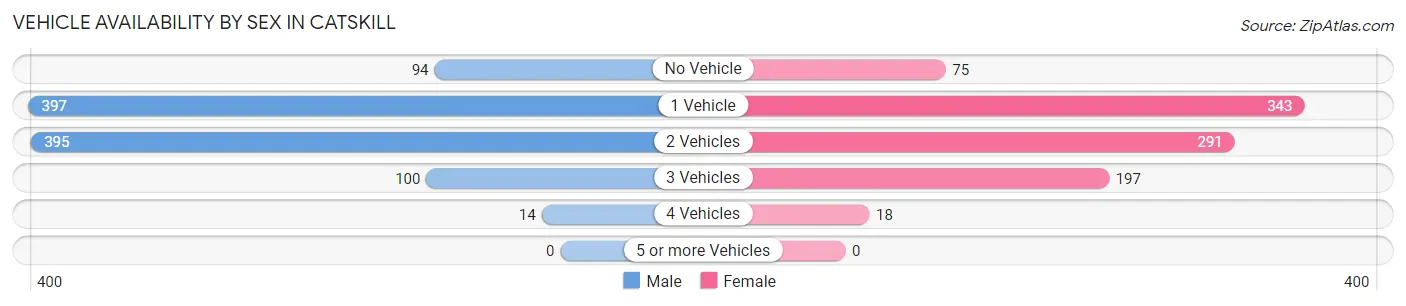
Vehicle Availability by Sex in Catskill
The most prevalent vehicle ownership categories in Catskill are males with 1 vehicle (397, accounting for 39.7%) and females with 1 vehicle (343, making up 43.0%).
| Vehicles Available | Male | Female |
| No Vehicle | 94 (9.4%) | 75 (8.1%) |
| 1 Vehicle | 397 (39.7%) | 343 (37.1%) |
| 2 Vehicles | 395 (39.5%) | 291 (31.5%) |
| 3 Vehicles | 100 (10.0%) | 197 (21.3%) |
| 4 Vehicles | 14 (1.4%) | 18 (1.9%) |
| 5 or more Vehicles | 0 (0.0%) | 0 (0.0%) |
| Total | 1,000 (100.0%) | 924 (100.0%) |
Commute Time in Catskill
The most frequently occuring commute durations in Catskill are 45 to 59 minutes (343 commuters, 20.2%), 5 to 9 minutes (324 commuters, 19.1%), and 15 to 19 minutes (258 commuters, 15.2%).
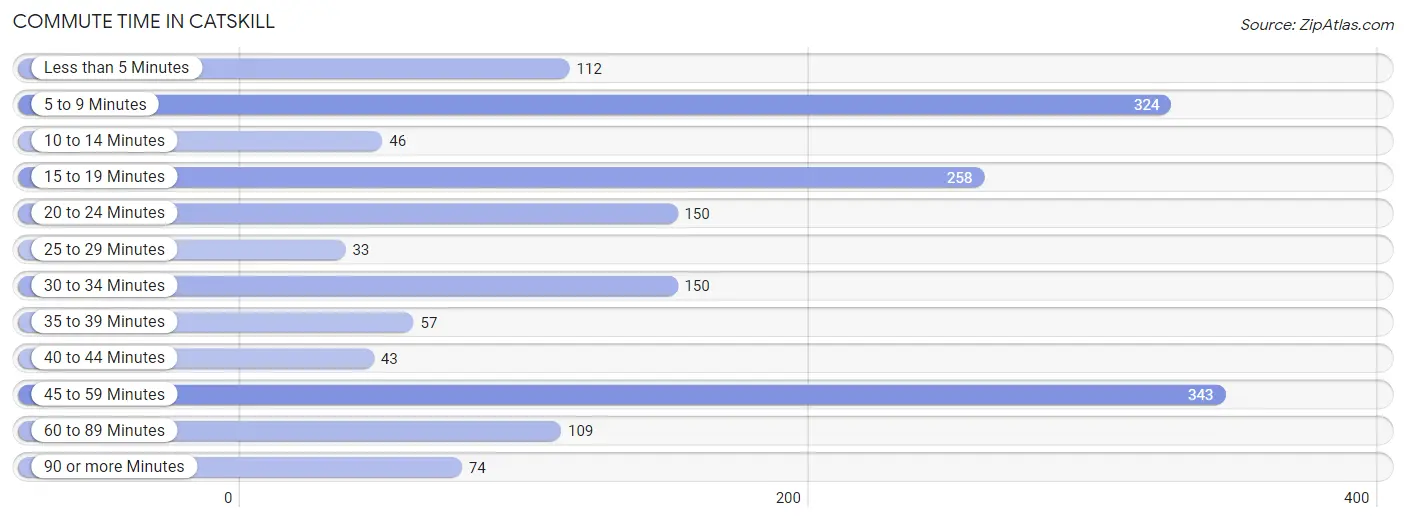
| Commute Time | # Commuters | % Commuters |
| Less than 5 Minutes | 112 | 6.6% |
| 5 to 9 Minutes | 324 | 19.1% |
| 10 to 14 Minutes | 46 | 2.7% |
| 15 to 19 Minutes | 258 | 15.2% |
| 20 to 24 Minutes | 150 | 8.8% |
| 25 to 29 Minutes | 33 | 1.9% |
| 30 to 34 Minutes | 150 | 8.8% |
| 35 to 39 Minutes | 57 | 3.4% |
| 40 to 44 Minutes | 43 | 2.5% |
| 45 to 59 Minutes | 343 | 20.2% |
| 60 to 89 Minutes | 109 | 6.4% |
| 90 or more Minutes | 74 | 4.4% |
Commute Time by Sex in Catskill
The most common commute times in Catskill are 15 to 19 minutes (190 commuters, 22.8%) for males and 45 to 59 minutes (240 commuters, 27.7%) for females.
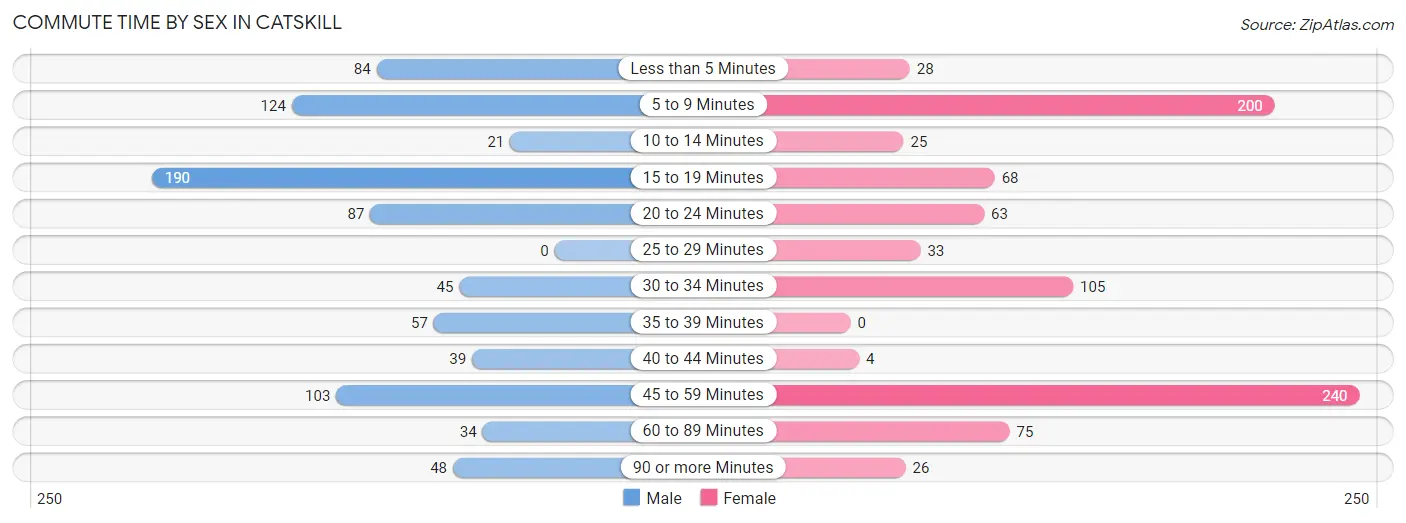
| Commute Time | Male | Female |
| Less than 5 Minutes | 84 (10.1%) | 28 (3.2%) |
| 5 to 9 Minutes | 124 (14.9%) | 200 (23.1%) |
| 10 to 14 Minutes | 21 (2.5%) | 25 (2.9%) |
| 15 to 19 Minutes | 190 (22.8%) | 68 (7.8%) |
| 20 to 24 Minutes | 87 (10.5%) | 63 (7.3%) |
| 25 to 29 Minutes | 0 (0.0%) | 33 (3.8%) |
| 30 to 34 Minutes | 45 (5.4%) | 105 (12.1%) |
| 35 to 39 Minutes | 57 (6.9%) | 0 (0.0%) |
| 40 to 44 Minutes | 39 (4.7%) | 4 (0.5%) |
| 45 to 59 Minutes | 103 (12.4%) | 240 (27.7%) |
| 60 to 89 Minutes | 34 (4.1%) | 75 (8.6%) |
| 90 or more Minutes | 48 (5.8%) | 26 (3.0%) |
Time of Departure to Work by Sex in Catskill
The most frequent times of departure to work in Catskill are 6:00 AM to 6:29 AM (145, 17.4%) for males and 7:30 AM to 7:59 AM (296, 34.1%) for females.
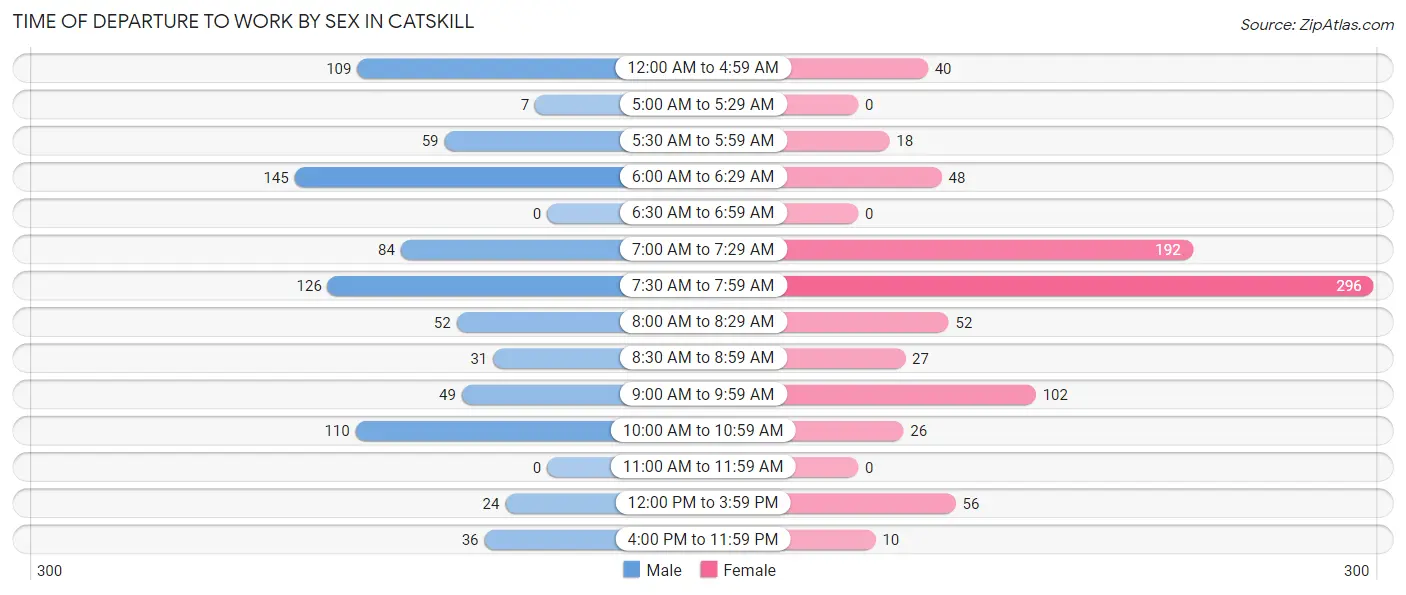
| Time of Departure | Male | Female |
| 12:00 AM to 4:59 AM | 109 (13.1%) | 40 (4.6%) |
| 5:00 AM to 5:29 AM | 7 (0.8%) | 0 (0.0%) |
| 5:30 AM to 5:59 AM | 59 (7.1%) | 18 (2.1%) |
| 6:00 AM to 6:29 AM | 145 (17.4%) | 48 (5.5%) |
| 6:30 AM to 6:59 AM | 0 (0.0%) | 0 (0.0%) |
| 7:00 AM to 7:29 AM | 84 (10.1%) | 192 (22.2%) |
| 7:30 AM to 7:59 AM | 126 (15.1%) | 296 (34.1%) |
| 8:00 AM to 8:29 AM | 52 (6.2%) | 52 (6.0%) |
| 8:30 AM to 8:59 AM | 31 (3.7%) | 27 (3.1%) |
| 9:00 AM to 9:59 AM | 49 (5.9%) | 102 (11.8%) |
| 10:00 AM to 10:59 AM | 110 (13.2%) | 26 (3.0%) |
| 11:00 AM to 11:59 AM | 0 (0.0%) | 0 (0.0%) |
| 12:00 PM to 3:59 PM | 24 (2.9%) | 56 (6.5%) |
| 4:00 PM to 11:59 PM | 36 (4.3%) | 10 (1.1%) |
| Total | 832 (100.0%) | 867 (100.0%) |
Housing Occupancy in Catskill
Occupancy by Ownership in Catskill
Of the total 1,692 dwellings in Catskill, owner-occupied units account for 1,016 (60.1%), while renter-occupied units make up 676 (40.0%).
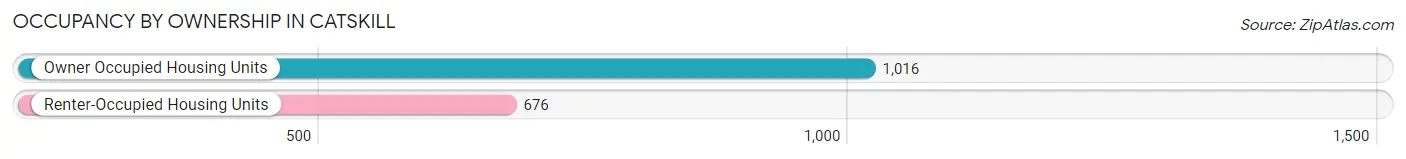
| Occupancy | # Housing Units | % Housing Units |
| Owner Occupied Housing Units | 1,016 | 60.1% |
| Renter-Occupied Housing Units | 676 | 40.0% |
| Total Occupied Housing Units | 1,692 | 100.0% |
Occupancy by Household Size in Catskill
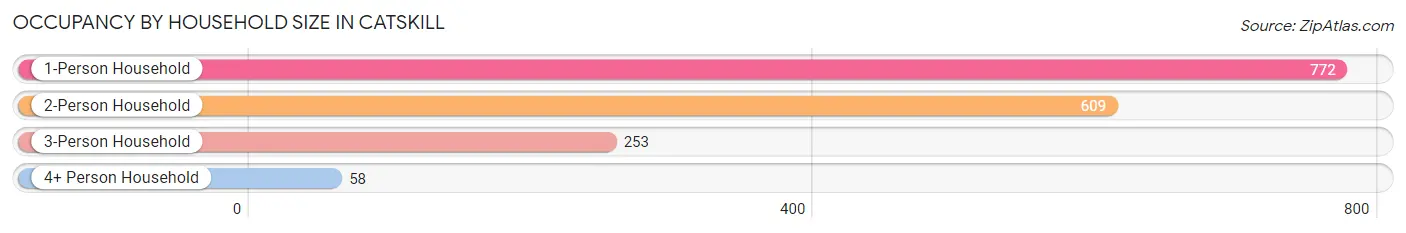
| Household Size | # Housing Units | % Housing Units |
| 1-Person Household | 772 | 45.6% |
| 2-Person Household | 609 | 36.0% |
| 3-Person Household | 253 | 14.9% |
| 4+ Person Household | 58 | 3.4% |
| Total Housing Units | 1,692 | 100.0% |
Occupancy by Ownership by Household Size in Catskill
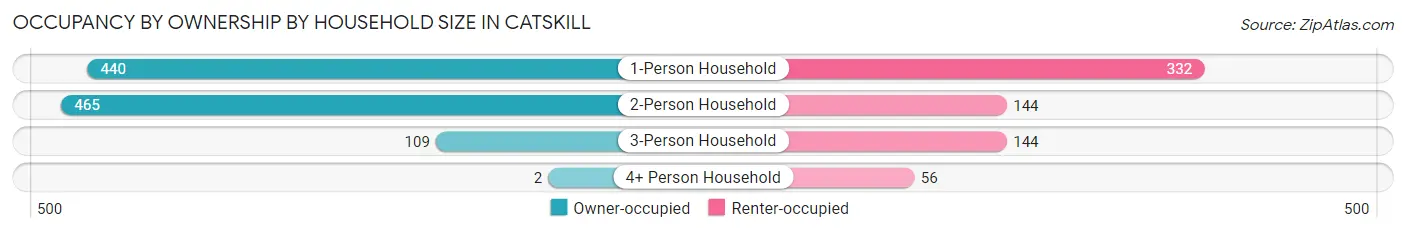
| Household Size | Owner-occupied | Renter-occupied |
| 1-Person Household | 440 (57.0%) | 332 (43.0%) |
| 2-Person Household | 465 (76.3%) | 144 (23.6%) |
| 3-Person Household | 109 (43.1%) | 144 (56.9%) |
| 4+ Person Household | 2 (3.5%) | 56 (96.6%) |
| Total Housing Units | 1,016 (60.1%) | 676 (40.0%) |
Occupancy by Educational Attainment in Catskill
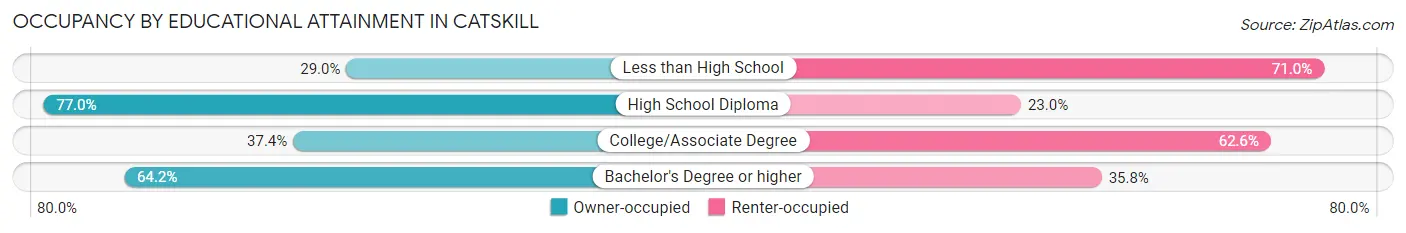
| Household Size | Owner-occupied | Renter-occupied |
| Less than High School | 31 (29.0%) | 76 (71.0%) |
| High School Diploma | 513 (77.0%) | 153 (23.0%) |
| College/Associate Degree | 165 (37.4%) | 276 (62.6%) |
| Bachelor's Degree or higher | 307 (64.2%) | 171 (35.8%) |
Occupancy by Age of Householder in Catskill
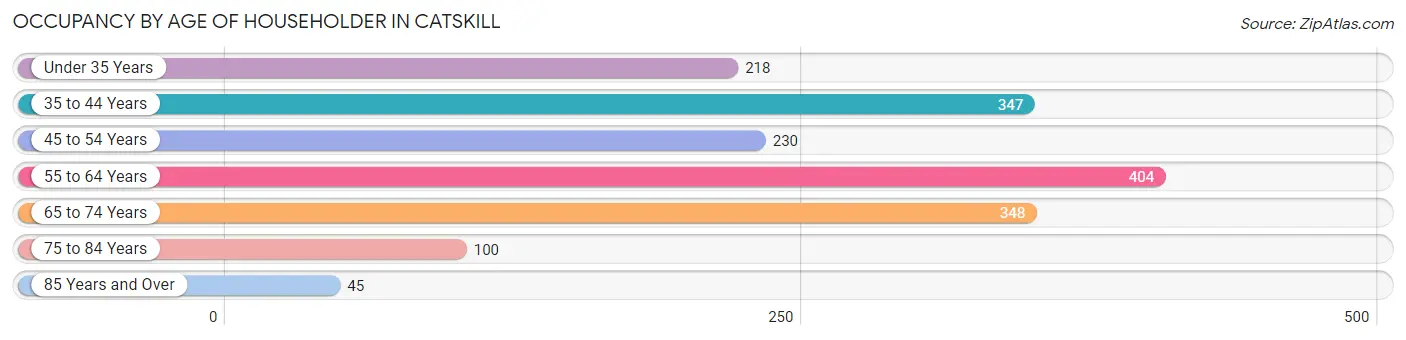
| Age Bracket | # Households | % Households |
| Under 35 Years | 218 | 12.9% |
| 35 to 44 Years | 347 | 20.5% |
| 45 to 54 Years | 230 | 13.6% |
| 55 to 64 Years | 404 | 23.9% |
| 65 to 74 Years | 348 | 20.6% |
| 75 to 84 Years | 100 | 5.9% |
| 85 Years and Over | 45 | 2.7% |
| Total | 1,692 | 100.0% |
Housing Finances in Catskill
Median Income by Occupancy in Catskill
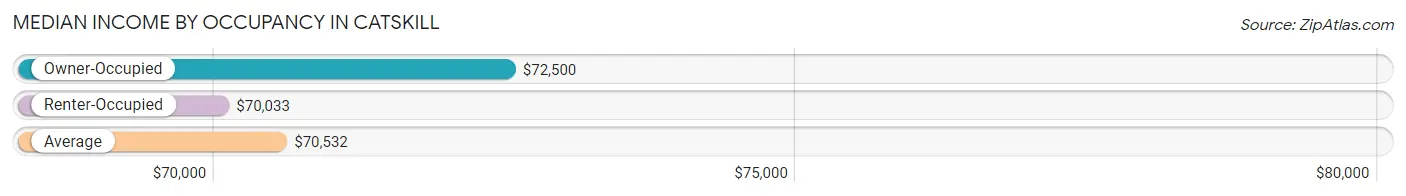
| Occupancy Type | # Households | Median Income |
| Owner-Occupied | 1,016 (60.1%) | $72,500 |
| Renter-Occupied | 676 (40.0%) | $70,033 |
| Average | 1,692 (100.0%) | $70,532 |
Occupancy by Householder Income Bracket in Catskill
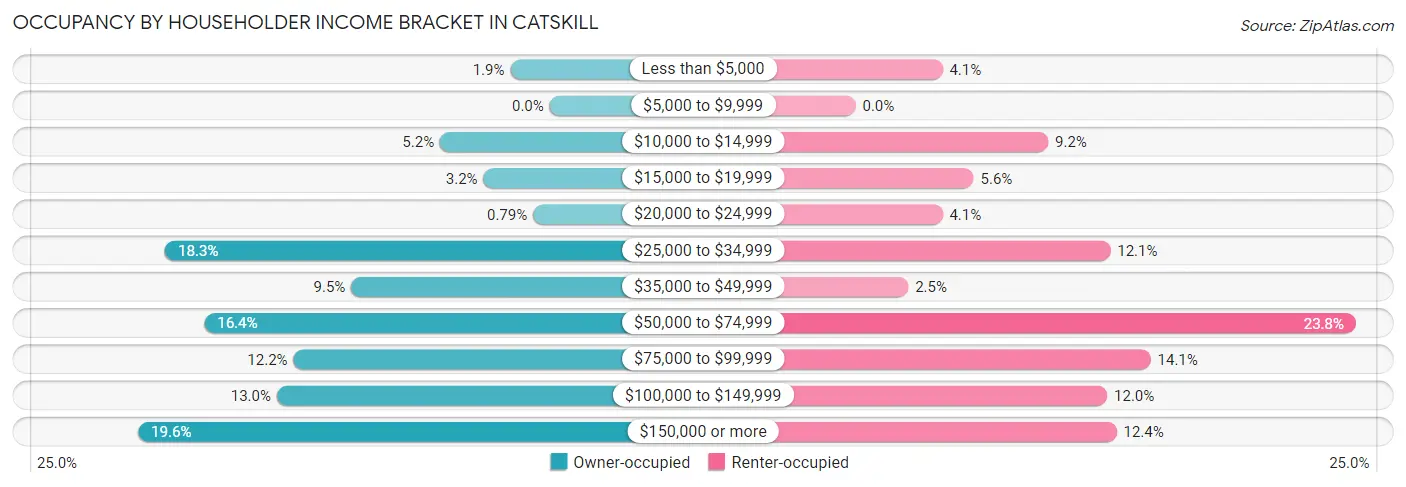
| Income Bracket | Owner-occupied | Renter-occupied |
| Less than $5,000 | 19 (1.9%) | 28 (4.1%) |
| $5,000 to $9,999 | 0 (0.0%) | 0 (0.0%) |
| $10,000 to $14,999 | 53 (5.2%) | 62 (9.2%) |
| $15,000 to $19,999 | 32 (3.2%) | 38 (5.6%) |
| $20,000 to $24,999 | 8 (0.8%) | 28 (4.1%) |
| $25,000 to $34,999 | 186 (18.3%) | 82 (12.1%) |
| $35,000 to $49,999 | 96 (9.5%) | 17 (2.5%) |
| $50,000 to $74,999 | 167 (16.4%) | 161 (23.8%) |
| $75,000 to $99,999 | 124 (12.2%) | 95 (14.1%) |
| $100,000 to $149,999 | 132 (13.0%) | 81 (12.0%) |
| $150,000 or more | 199 (19.6%) | 84 (12.4%) |
| Total | 1,016 (100.0%) | 676 (100.0%) |
Monthly Housing Cost Tiers in Catskill
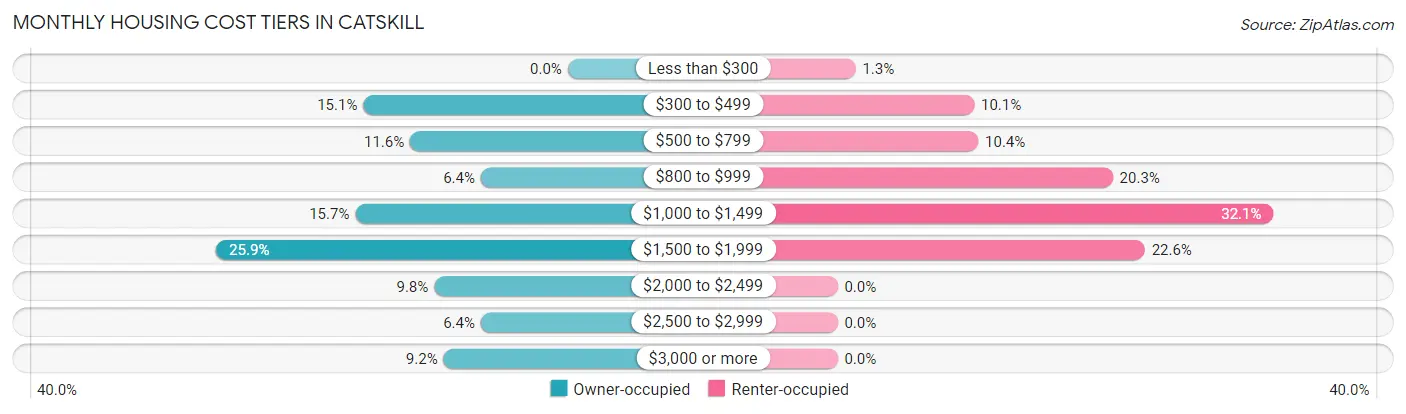
| Monthly Cost | Owner-occupied | Renter-occupied |
| Less than $300 | 0 (0.0%) | 9 (1.3%) |
| $300 to $499 | 153 (15.1%) | 68 (10.1%) |
| $500 to $799 | 118 (11.6%) | 70 (10.4%) |
| $800 to $999 | 65 (6.4%) | 137 (20.3%) |
| $1,000 to $1,499 | 159 (15.7%) | 217 (32.1%) |
| $1,500 to $1,999 | 263 (25.9%) | 153 (22.6%) |
| $2,000 to $2,499 | 100 (9.8%) | 0 (0.0%) |
| $2,500 to $2,999 | 65 (6.4%) | 0 (0.0%) |
| $3,000 or more | 93 (9.1%) | 0 (0.0%) |
| Total | 1,016 (100.0%) | 676 (100.0%) |
Physical Housing Characteristics in Catskill
Housing Structures in Catskill
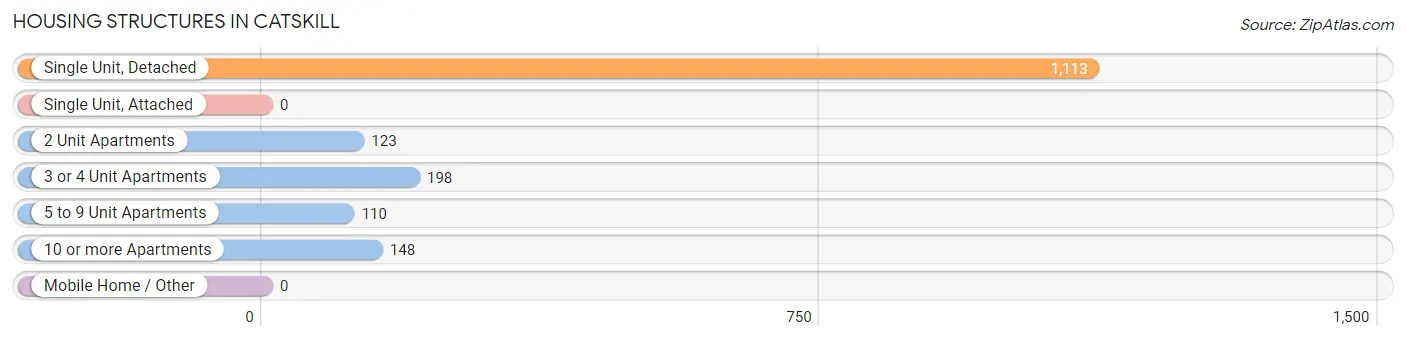
| Structure Type | # Housing Units | % Housing Units |
| Single Unit, Detached | 1,113 | 65.8% |
| Single Unit, Attached | 0 | 0.0% |
| 2 Unit Apartments | 123 | 7.3% |
| 3 or 4 Unit Apartments | 198 | 11.7% |
| 5 to 9 Unit Apartments | 110 | 6.5% |
| 10 or more Apartments | 148 | 8.7% |
| Mobile Home / Other | 0 | 0.0% |
| Total | 1,692 | 100.0% |
Housing Structures by Occupancy in Catskill
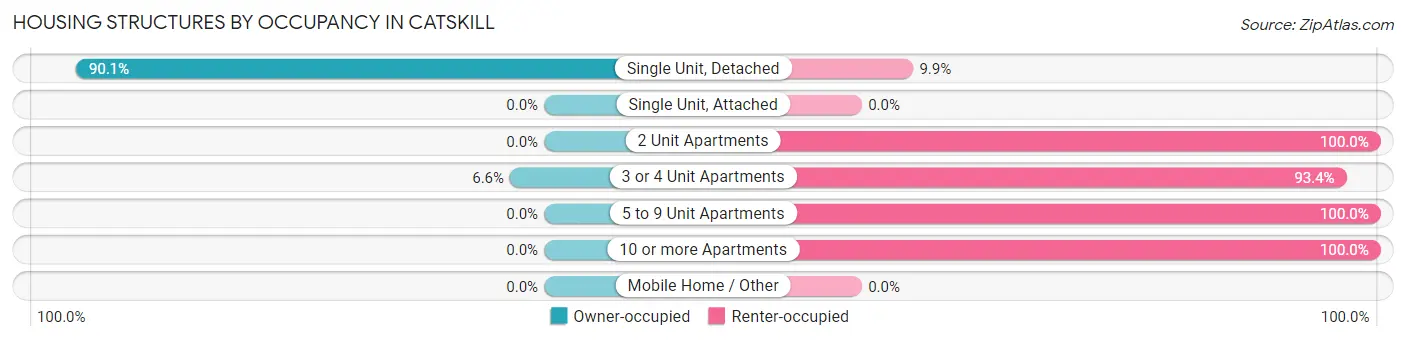
| Structure Type | Owner-occupied | Renter-occupied |
| Single Unit, Detached | 1,003 (90.1%) | 110 (9.9%) |
| Single Unit, Attached | 0 (0.0%) | 0 (0.0%) |
| 2 Unit Apartments | 0 (0.0%) | 123 (100.0%) |
| 3 or 4 Unit Apartments | 13 (6.6%) | 185 (93.4%) |
| 5 to 9 Unit Apartments | 0 (0.0%) | 110 (100.0%) |
| 10 or more Apartments | 0 (0.0%) | 148 (100.0%) |
| Mobile Home / Other | 0 (0.0%) | 0 (0.0%) |
| Total | 1,016 (60.1%) | 676 (40.0%) |
Housing Structures by Number of Rooms in Catskill
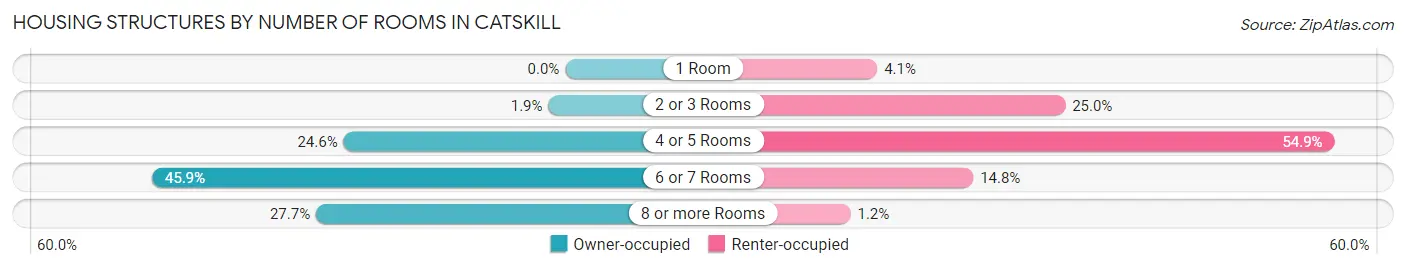
| Number of Rooms | Owner-occupied | Renter-occupied |
| 1 Room | 0 (0.0%) | 28 (4.1%) |
| 2 or 3 Rooms | 19 (1.9%) | 169 (25.0%) |
| 4 or 5 Rooms | 250 (24.6%) | 371 (54.9%) |
| 6 or 7 Rooms | 466 (45.9%) | 100 (14.8%) |
| 8 or more Rooms | 281 (27.7%) | 8 (1.2%) |
| Total | 1,016 (100.0%) | 676 (100.0%) |
Housing Structure by Heating Type in Catskill
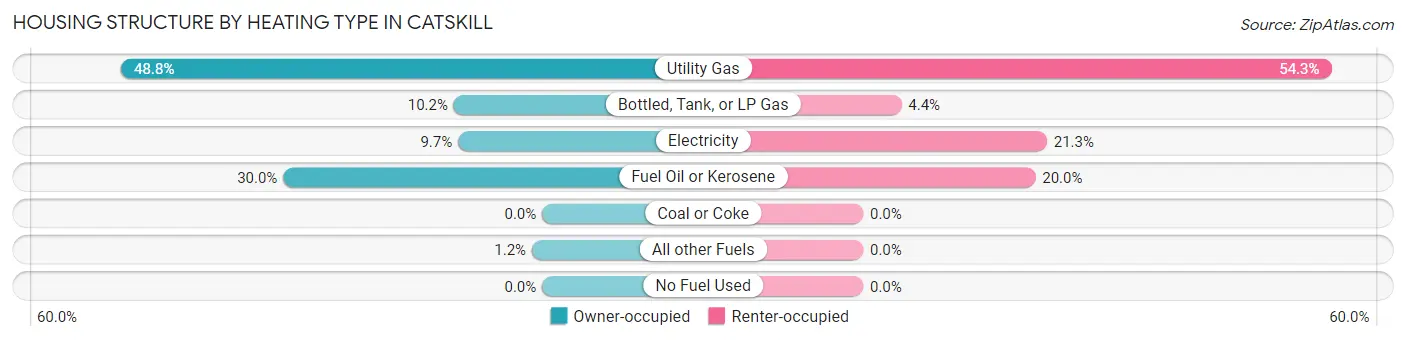
| Heating Type | Owner-occupied | Renter-occupied |
| Utility Gas | 496 (48.8%) | 367 (54.3%) |
| Bottled, Tank, or LP Gas | 104 (10.2%) | 30 (4.4%) |
| Electricity | 99 (9.7%) | 144 (21.3%) |
| Fuel Oil or Kerosene | 305 (30.0%) | 135 (20.0%) |
| Coal or Coke | 0 (0.0%) | 0 (0.0%) |
| All other Fuels | 12 (1.2%) | 0 (0.0%) |
| No Fuel Used | 0 (0.0%) | 0 (0.0%) |
| Total | 1,016 (100.0%) | 676 (100.0%) |
Household Vehicle Usage in Catskill
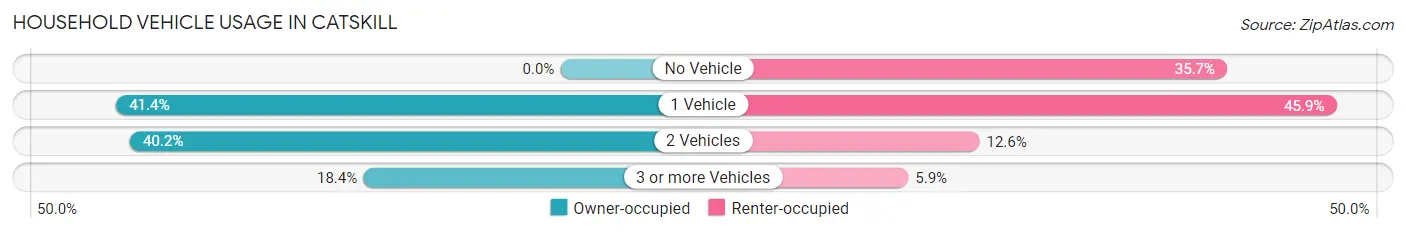
| Vehicles per Household | Owner-occupied | Renter-occupied |
| No Vehicle | 0 (0.0%) | 241 (35.6%) |
| 1 Vehicle | 421 (41.4%) | 310 (45.9%) |
| 2 Vehicles | 408 (40.2%) | 85 (12.6%) |
| 3 or more Vehicles | 187 (18.4%) | 40 (5.9%) |
| Total | 1,016 (100.0%) | 676 (100.0%) |
Real Estate & Mortgages in Catskill
Real Estate and Mortgage Overview in Catskill
| Characteristic | Without Mortgage | With Mortgage |
| Housing Units | 347 | 669 |
| Median Property Value | $203,200 | $201,400 |
| Median Household Income | $56,042 | $157 |
| Monthly Housing Costs | $746 | $93 |
| Real Estate Taxes | $4,040 | $0 |
Property Value by Mortgage Status in Catskill
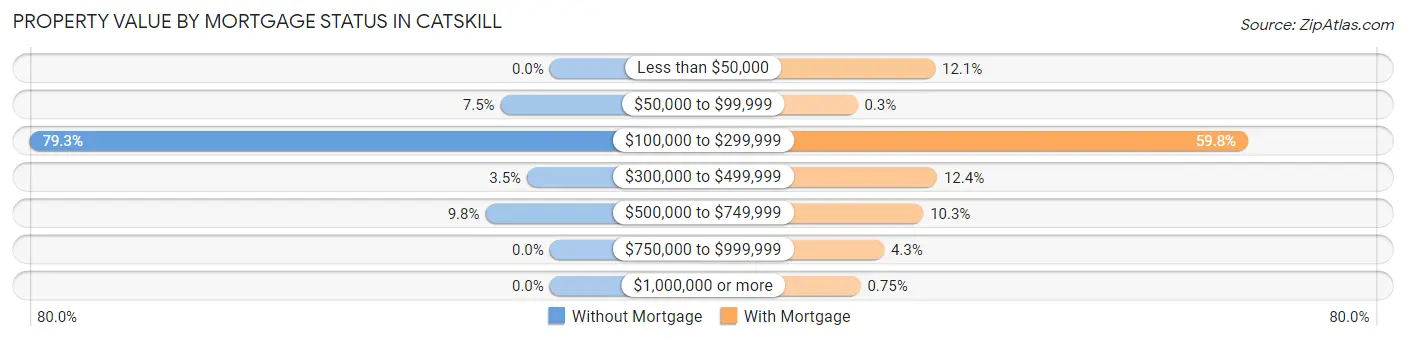
| Property Value | Without Mortgage | With Mortgage |
| Less than $50,000 | 0 (0.0%) | 81 (12.1%) |
| $50,000 to $99,999 | 26 (7.5%) | 2 (0.3%) |
| $100,000 to $299,999 | 275 (79.2%) | 400 (59.8%) |
| $300,000 to $499,999 | 12 (3.5%) | 83 (12.4%) |
| $500,000 to $749,999 | 34 (9.8%) | 69 (10.3%) |
| $750,000 to $999,999 | 0 (0.0%) | 29 (4.3%) |
| $1,000,000 or more | 0 (0.0%) | 5 (0.7%) |
| Total | 347 (100.0%) | 669 (100.0%) |
Household Income by Mortgage Status in Catskill
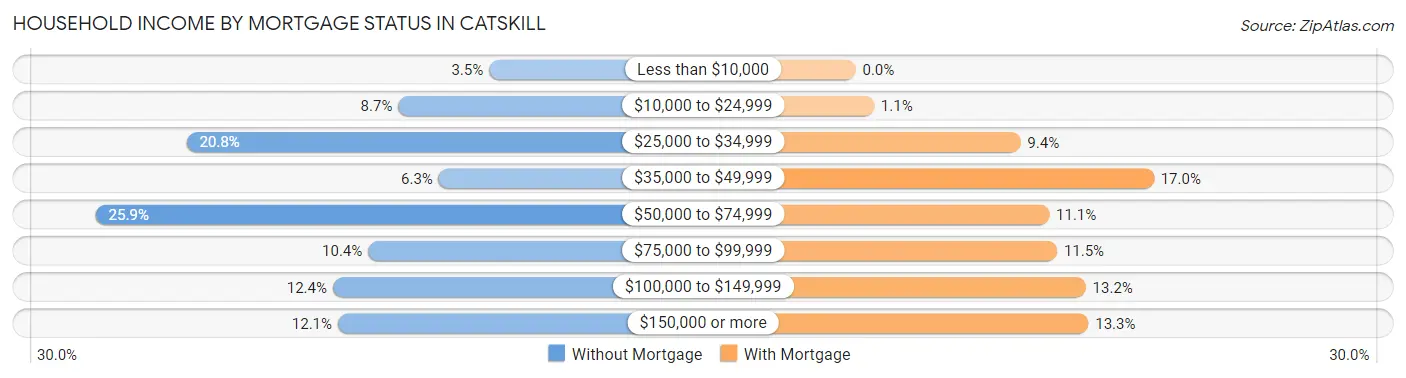
| Household Income | Without Mortgage | With Mortgage |
| Less than $10,000 | 12 (3.5%) | 0 (0.0%) |
| $10,000 to $24,999 | 30 (8.6%) | 7 (1.1%) |
| $25,000 to $34,999 | 72 (20.7%) | 63 (9.4%) |
| $35,000 to $49,999 | 22 (6.3%) | 114 (17.0%) |
| $50,000 to $74,999 | 90 (25.9%) | 74 (11.1%) |
| $75,000 to $99,999 | 36 (10.4%) | 77 (11.5%) |
| $100,000 to $149,999 | 43 (12.4%) | 88 (13.2%) |
| $150,000 or more | 42 (12.1%) | 89 (13.3%) |
| Total | 347 (100.0%) | 669 (100.0%) |
Property Value to Household Income Ratio in Catskill
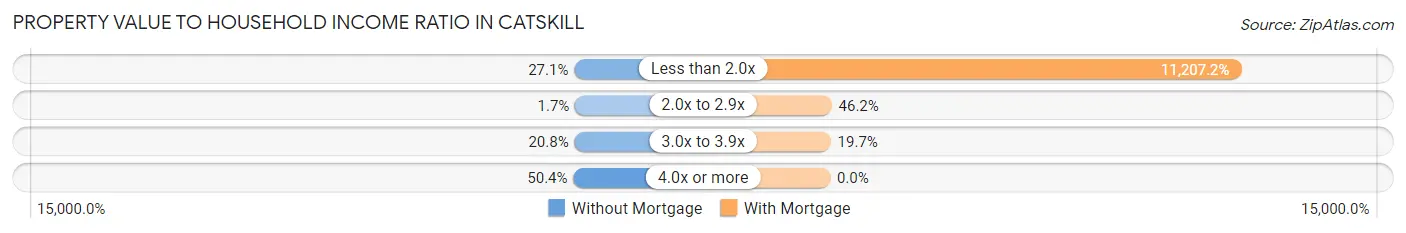
| Value-to-Income Ratio | Without Mortgage | With Mortgage |
| Less than 2.0x | 94 (27.1%) | 74,976 (11,207.2%) |
| 2.0x to 2.9x | 6 (1.7%) | 309 (46.2%) |
| 3.0x to 3.9x | 72 (20.7%) | 132 (19.7%) |
| 4.0x or more | 175 (50.4%) | 0 (0.0%) |
| Total | 347 (100.0%) | 669 (100.0%) |
Real Estate Taxes by Mortgage Status in Catskill
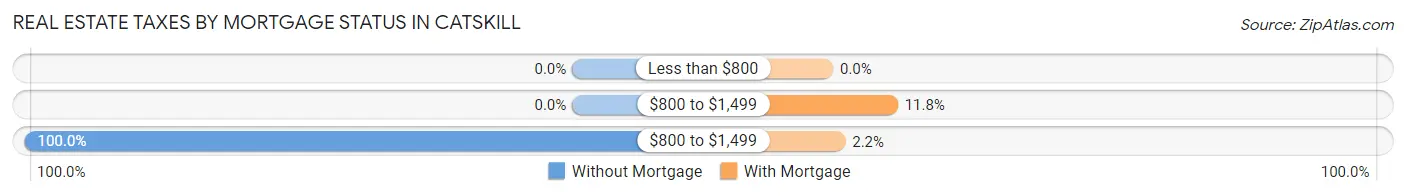
| Property Taxes | Without Mortgage | With Mortgage |
| Less than $800 | 0 (0.0%) | 0 (0.0%) |
| $800 to $1,499 | 0 (0.0%) | 79 (11.8%) |
| $800 to $1,499 | 347 (100.0%) | 15 (2.2%) |
| Total | 347 (100.0%) | 669 (100.0%) |
Health & Disability in Catskill
Health Insurance Coverage by Age in Catskill
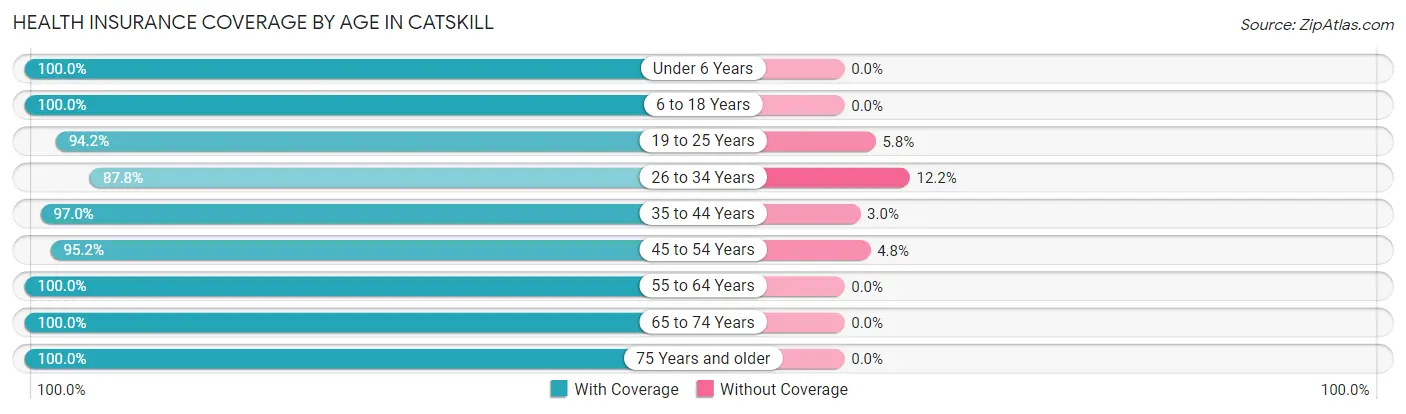
| Age Bracket | With Coverage | Without Coverage |
| Under 6 Years | 148 (100.0%) | 0 (0.0%) |
| 6 to 18 Years | 241 (100.0%) | 0 (0.0%) |
| 19 to 25 Years | 389 (94.2%) | 24 (5.8%) |
| 26 to 34 Years | 635 (87.8%) | 88 (12.2%) |
| 35 to 44 Years | 459 (97.0%) | 14 (3.0%) |
| 45 to 54 Years | 394 (95.2%) | 20 (4.8%) |
| 55 to 64 Years | 734 (100.0%) | 0 (0.0%) |
| 65 to 74 Years | 484 (100.0%) | 0 (0.0%) |
| 75 Years and older | 171 (100.0%) | 0 (0.0%) |
| Total | 3,655 (96.2%) | 146 (3.8%) |
Health Insurance Coverage by Citizenship Status in Catskill
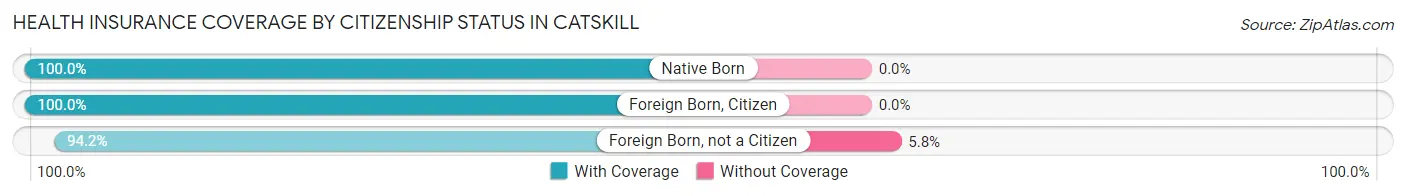
| Citizenship Status | With Coverage | Without Coverage |
| Native Born | 148 (100.0%) | 0 (0.0%) |
| Foreign Born, Citizen | 241 (100.0%) | 0 (0.0%) |
| Foreign Born, not a Citizen | 389 (94.2%) | 24 (5.8%) |
Health Insurance Coverage by Household Income in Catskill
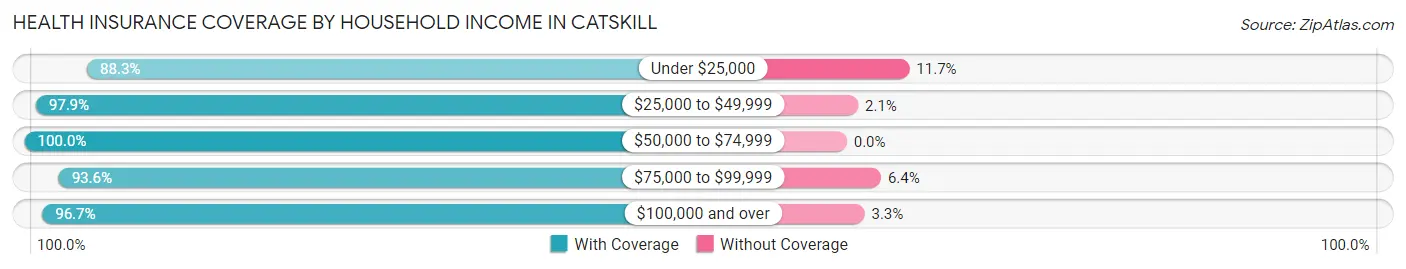
| Household Income | With Coverage | Without Coverage |
| Under $25,000 | 459 (88.3%) | 61 (11.7%) |
| $25,000 to $49,999 | 922 (97.9%) | 20 (2.1%) |
| $50,000 to $74,999 | 733 (100.0%) | 0 (0.0%) |
| $75,000 to $99,999 | 395 (93.6%) | 27 (6.4%) |
| $100,000 and over | 1,108 (96.7%) | 38 (3.3%) |
Public vs Private Health Insurance Coverage by Age in Catskill
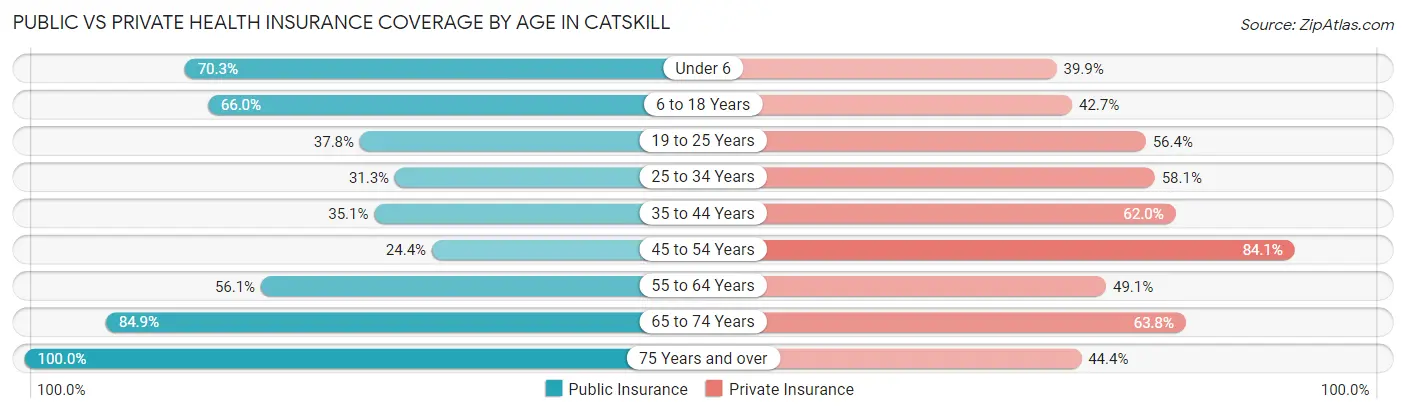
| Age Bracket | Public Insurance | Private Insurance |
| Under 6 | 104 (70.3%) | 59 (39.9%) |
| 6 to 18 Years | 159 (66.0%) | 103 (42.7%) |
| 19 to 25 Years | 156 (37.8%) | 233 (56.4%) |
| 25 to 34 Years | 226 (31.3%) | 420 (58.1%) |
| 35 to 44 Years | 166 (35.1%) | 293 (62.0%) |
| 45 to 54 Years | 101 (24.4%) | 348 (84.1%) |
| 55 to 64 Years | 412 (56.1%) | 360 (49.0%) |
| 65 to 74 Years | 411 (84.9%) | 309 (63.8%) |
| 75 Years and over | 171 (100.0%) | 76 (44.4%) |
| Total | 1,906 (50.1%) | 2,201 (57.9%) |
Disability Status by Sex by Age in Catskill
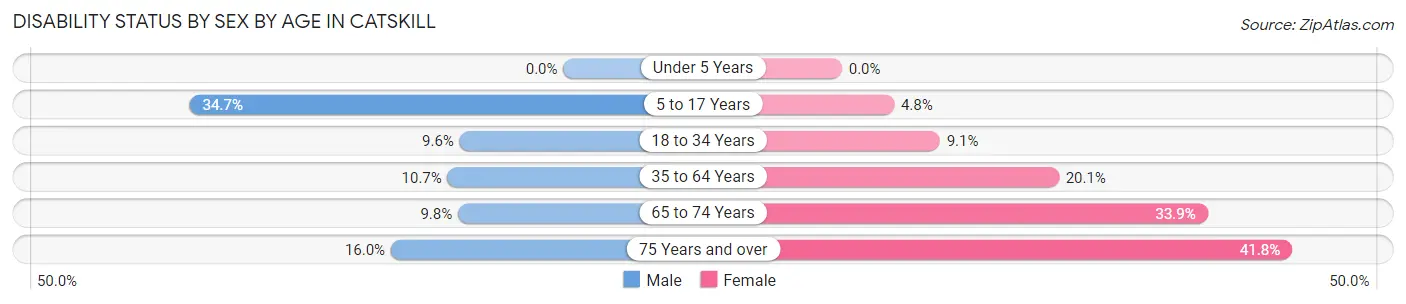
| Age Bracket | Male | Female |
| Under 5 Years | 0 (0.0%) | 0 (0.0%) |
| 5 to 17 Years | 34 (34.7%) | 6 (4.8%) |
| 18 to 34 Years | 63 (9.6%) | 48 (9.1%) |
| 35 to 64 Years | 93 (10.7%) | 152 (20.1%) |
| 65 to 74 Years | 26 (9.8%) | 74 (33.9%) |
| 75 Years and over | 4 (16.0%) | 61 (41.8%) |
Disability Class by Sex by Age in Catskill
Disability Class: Hearing Difficulty
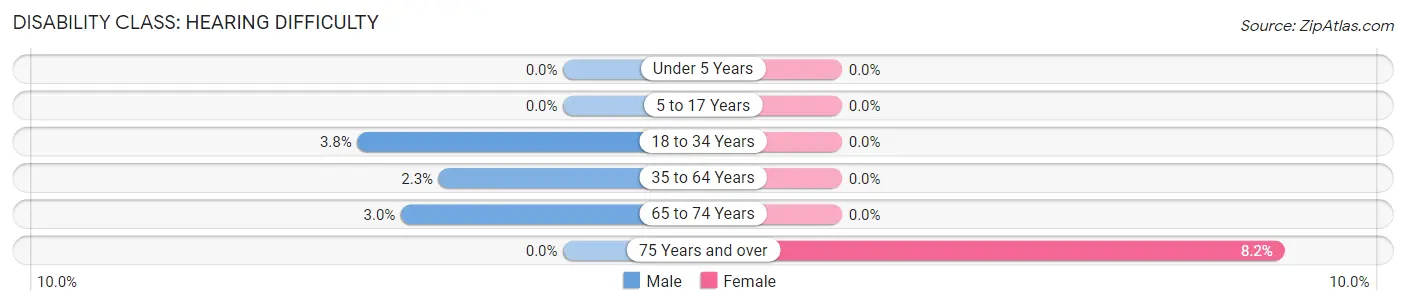
| Age Bracket | Male | Female |
| Under 5 Years | 0 (0.0%) | 0 (0.0%) |
| 5 to 17 Years | 0 (0.0%) | 0 (0.0%) |
| 18 to 34 Years | 25 (3.8%) | 0 (0.0%) |
| 35 to 64 Years | 20 (2.3%) | 0 (0.0%) |
| 65 to 74 Years | 8 (3.0%) | 0 (0.0%) |
| 75 Years and over | 0 (0.0%) | 12 (8.2%) |
Disability Class: Vision Difficulty
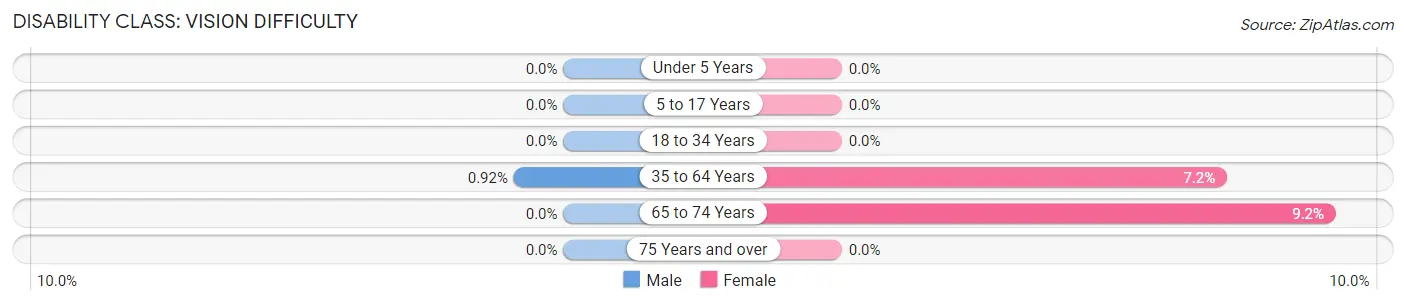
| Age Bracket | Male | Female |
| Under 5 Years | 0 (0.0%) | 0 (0.0%) |
| 5 to 17 Years | 0 (0.0%) | 0 (0.0%) |
| 18 to 34 Years | 0 (0.0%) | 0 (0.0%) |
| 35 to 64 Years | 8 (0.9%) | 54 (7.1%) |
| 65 to 74 Years | 0 (0.0%) | 20 (9.2%) |
| 75 Years and over | 0 (0.0%) | 0 (0.0%) |
Disability Class: Cognitive Difficulty
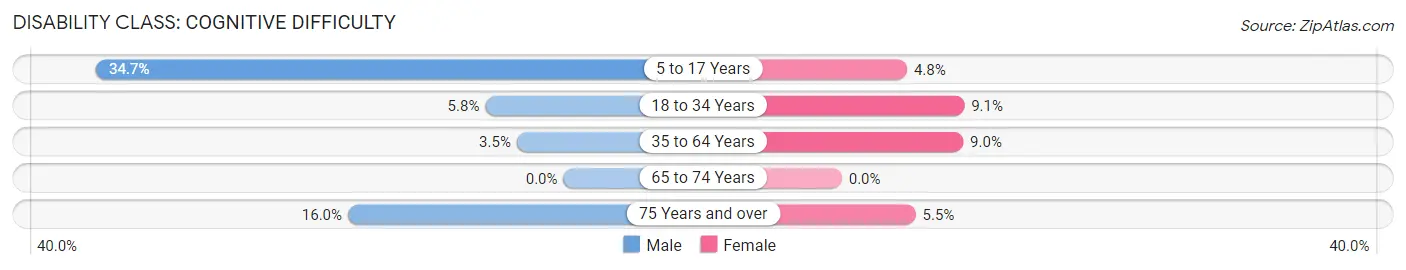
| Age Bracket | Male | Female |
| 5 to 17 Years | 34 (34.7%) | 6 (4.8%) |
| 18 to 34 Years | 38 (5.8%) | 48 (9.1%) |
| 35 to 64 Years | 30 (3.5%) | 68 (9.0%) |
| 65 to 74 Years | 0 (0.0%) | 0 (0.0%) |
| 75 Years and over | 4 (16.0%) | 8 (5.5%) |
Disability Class: Ambulatory Difficulty
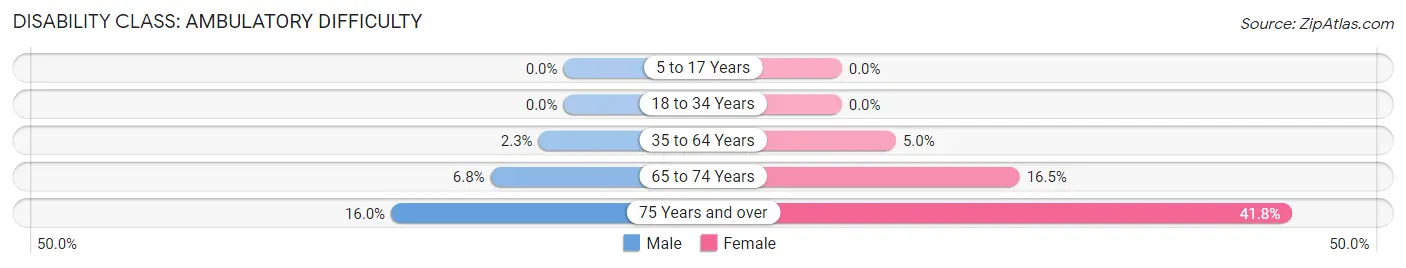
| Age Bracket | Male | Female |
| 5 to 17 Years | 0 (0.0%) | 0 (0.0%) |
| 18 to 34 Years | 0 (0.0%) | 0 (0.0%) |
| 35 to 64 Years | 20 (2.3%) | 38 (5.0%) |
| 65 to 74 Years | 18 (6.8%) | 36 (16.5%) |
| 75 Years and over | 4 (16.0%) | 61 (41.8%) |
Disability Class: Self-Care Difficulty
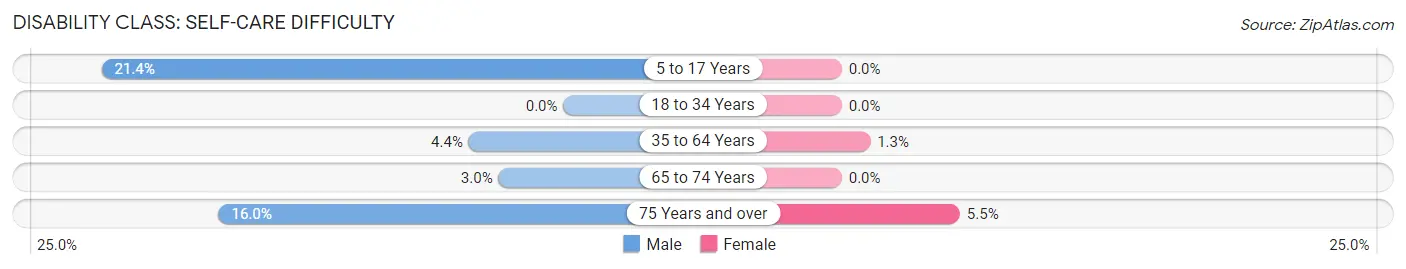
| Age Bracket | Male | Female |
| 5 to 17 Years | 21 (21.4%) | 0 (0.0%) |
| 18 to 34 Years | 0 (0.0%) | 0 (0.0%) |
| 35 to 64 Years | 38 (4.4%) | 10 (1.3%) |
| 65 to 74 Years | 8 (3.0%) | 0 (0.0%) |
| 75 Years and over | 4 (16.0%) | 8 (5.5%) |
Technology Access in Catskill
Computing Device Access in Catskill
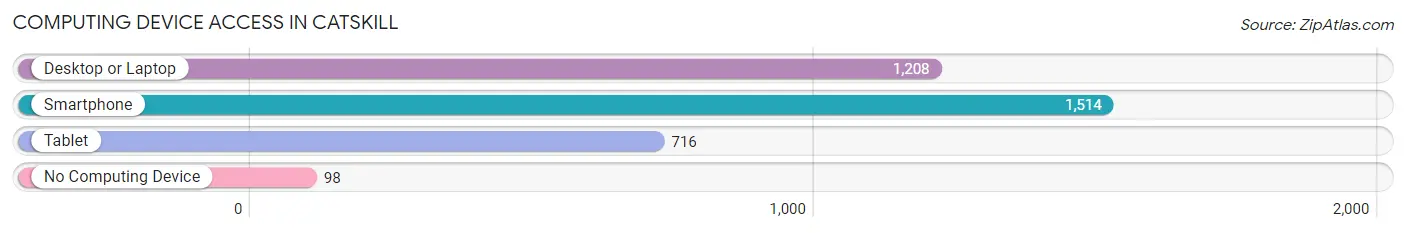
| Device Type | # Households | % Households |
| Desktop or Laptop | 1,208 | 71.4% |
| Smartphone | 1,514 | 89.5% |
| Tablet | 716 | 42.3% |
| No Computing Device | 98 | 5.8% |
| Total | 1,692 | 100.0% |
Internet Access in Catskill
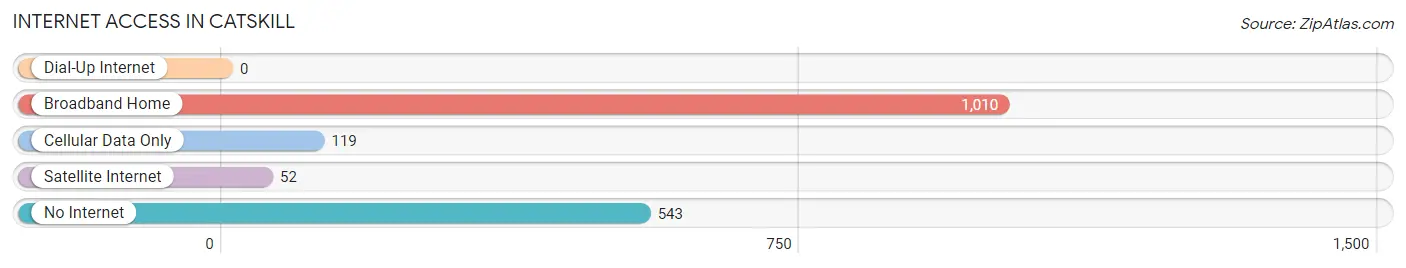
| Internet Type | # Households | % Households |
| Dial-Up Internet | 0 | 0.0% |
| Broadband Home | 1,010 | 59.7% |
| Cellular Data Only | 119 | 7.0% |
| Satellite Internet | 52 | 3.1% |
| No Internet | 543 | 32.1% |
| Total | 1,692 | 100.0% |
Catskill Summary
Catskill, New York is a small town located in the Catskill Mountains of Greene County, New York. It is situated on the west bank of the Hudson River, approximately 90 miles north of New York City. The town has a population of approximately 4,000 people and is the county seat of Greene County.
History
The area that is now Catskill was originally inhabited by the Mohican Native American tribe. The first European settlers arrived in the area in the late 17th century, and the town was officially established in 1788. The town was named after the nearby Catskill Mountains, which were named after the Dutch phrase “Kats Kill”, meaning “bobcat creek”.
In the 19th century, Catskill became a popular tourist destination due to its proximity to the Hudson River and the Catskill Mountains. The town was home to several resorts and hotels, and was known as the “Queen of the Catskills”. The town was also home to the famous Catskill Mountain House, which was a popular destination for wealthy New Yorkers.
Geography
Catskill is located in the Catskill Mountains of Greene County, New York. The town is situated on the west bank of the Hudson River, approximately 90 miles north of New York City. The town is surrounded by the Catskill State Park, which is a popular destination for outdoor recreation. The town is also home to several small lakes, including Kaaterskill Creek, which is a popular destination for fishing and swimming.
Economy
The economy of Catskill is largely based on tourism and outdoor recreation. The town is home to several resorts and hotels, as well as several restaurants and shops. The town is also home to several small businesses, including a brewery, a winery, and a distillery.
Demographics
As of the 2010 census, the population of Catskill was 4,085. The racial makeup of the town was 94.3% White, 1.7% African American, 0.3% Native American, 0.7% Asian, 0.1% Pacific Islander, 1.2% from other races, and 1.9% from two or more races. The median household income in the town was $41,944, and the median family income was $50,917. The per capita income in the town was $21,945.
Conclusion
Catskill, New York is a small town located in the Catskill Mountains of Greene County, New York. It is situated on the west bank of the Hudson River, approximately 90 miles north of New York City. The town has a population of approximately 4,000 people and is the county seat of Greene County. The town has a long history, and was once a popular tourist destination due to its proximity to the Hudson River and the Catskill Mountains. The economy of the town is largely based on tourism and outdoor recreation, and the town is home to several resorts and hotels, as well as several restaurants and shops. The population of the town is largely white, with a median household income of $41,944 and a median family income of $50,917.
Common Questions
What is Per Capita Income in Catskill?
Per Capita income in Catskill is $40,931.
What is the Median Family Income in Catskill?
Median Family Income in Catskill is $73,750.
What is the Median Household income in Catskill?
Median Household Income in Catskill is $70,532.
What is Income or Wage Gap in Catskill?
Income or Wage Gap in Catskill is 27.4%.
Women in Catskill earn 72.6 cents for every dollar earned by a man.
What is Family Income Deficit in Catskill?
Family Income Deficit in Catskill is $2,973.
Families that are below poverty line in Catskill earn $2,973 less on average than the poverty threshold level.
What is Inequality or Gini Index in Catskill?
Inequality or Gini Index in Catskill is 0.49.
What is the Total Population of Catskill?
Total Population of Catskill is 3,830.
What is the Total Male Population of Catskill?
Total Male Population of Catskill is 2,043.
What is the Total Female Population of Catskill?
Total Female Population of Catskill is 1,787.
What is the Ratio of Males per 100 Females in Catskill?
There are 114.33 Males per 100 Females in Catskill.
What is the Ratio of Females per 100 Males in Catskill?
There are 87.47 Females per 100 Males in Catskill.
What is the Median Population Age in Catskill?
Median Population Age in Catskill is 43.3 Years.
What is the Average Family Size in Catskill
Average Family Size in Catskill is 3.3 People.
What is the Average Household Size in Catskill
Average Household Size in Catskill is 2.2 People.
How Large is the Labor Force in Catskill?
There are 2,105 People in the Labor Forcein in Catskill.
What is the Percentage of People in the Labor Force in Catskill?
59.4% of People are in the Labor Force in Catskill.
What is the Unemployment Rate in Catskill?
Unemployment Rate in Catskill is 6.3%.