Camillus, NY Map & Demographics
Camillus Map
Camillus Overview
$31,564
PER CAPITA INCOME
$68,750
AVG FAMILY INCOME
$51,563
AVG HOUSEHOLD INCOME
0.5%
WAGE / INCOME GAP [ % ]
99.5¢/ $1
WAGE / INCOME GAP [ $ ]
0.39
INEQUALITY / GINI INDEX
1,316
TOTAL POPULATION
609
MALE POPULATION
707
FEMALE POPULATION
86.14
MALES / 100 FEMALES
116.09
FEMALES / 100 MALES
41.0
MEDIAN AGE
3.1
AVG FAMILY SIZE
1.9
AVG HOUSEHOLD SIZE
693
LABOR FORCE [ PEOPLE ]
62.2%
PERCENT IN LABOR FORCE
6.8%
UNEMPLOYMENT RATE
Camillus Zip Codes
Camillus Area Codes
Income in Camillus
Income Overview in Camillus
Per Capita Income in Camillus is $31,564, while median incomes of families and households are $68,750 and $51,563 respectively.
| Characteristic | Number | Measure |
| Per Capita Income | 1,316 | $31,564 |
| Median Family Income | 246 | $68,750 |
| Mean Family Income | 246 | $79,081 |
| Median Household Income | 703 | $51,563 |
| Mean Household Income | 703 | $58,631 |
| Income Deficit | 246 | $0 |
| Wage / Income Gap (%) | 1,316 | 0.48% |
| Wage / Income Gap ($) | 1,316 | 99.52¢ per $1 |
| Gini / Inequality Index | 1,316 | 0.39 |
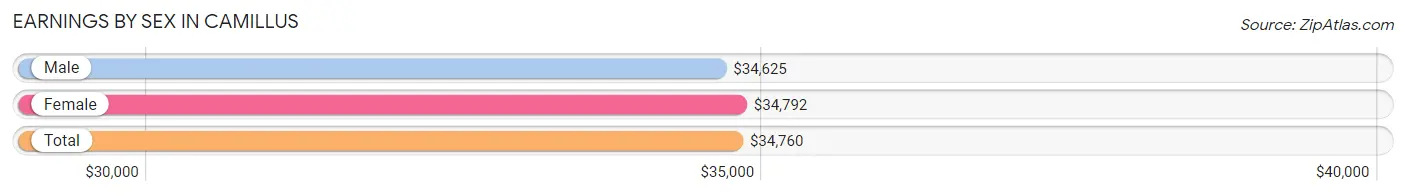
Earnings by Sex in Camillus
Average Earnings in Camillus are $34,760, $34,625 for men and $34,792 for women, a difference of 0.5%.
| Sex | Number | Average Earnings |
| Male | 365 (47.5%) | $34,625 |
| Female | 403 (52.5%) | $34,792 |
| Total | 768 (100.0%) | $34,760 |
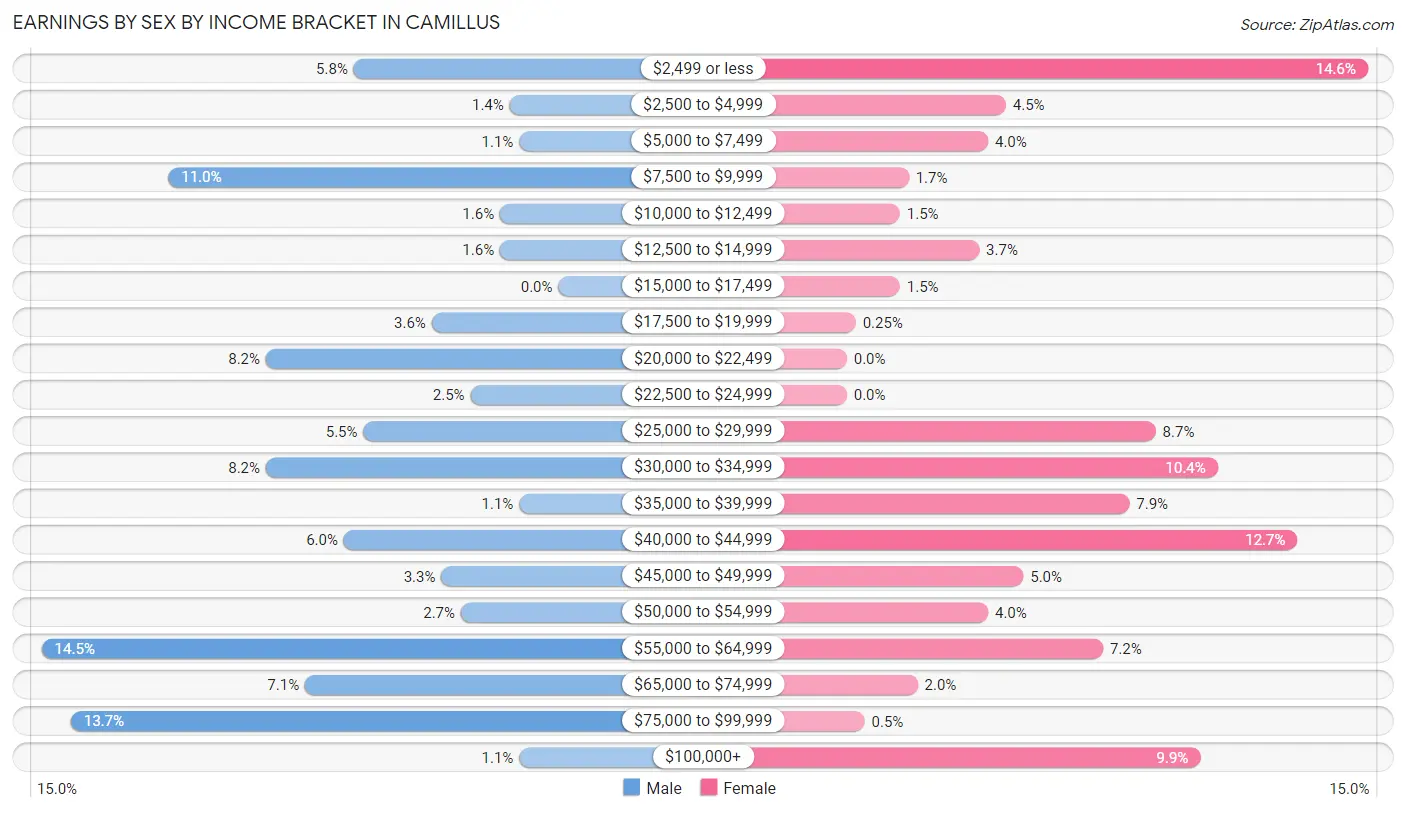
Earnings by Sex by Income Bracket in Camillus
The most common earnings brackets in Camillus are $55,000 to $64,999 for men (53 | 14.5%) and $2,499 or less for women (59 | 14.6%).
| Income | Male | Female |
| $2,499 or less | 21 (5.8%) | 59 (14.6%) |
| $2,500 to $4,999 | 5 (1.4%) | 18 (4.5%) |
| $5,000 to $7,499 | 4 (1.1%) | 16 (4.0%) |
| $7,500 to $9,999 | 40 (11.0%) | 7 (1.7%) |
| $10,000 to $12,499 | 6 (1.6%) | 6 (1.5%) |
| $12,500 to $14,999 | 6 (1.6%) | 15 (3.7%) |
| $15,000 to $17,499 | 0 (0.0%) | 6 (1.5%) |
| $17,500 to $19,999 | 13 (3.6%) | 1 (0.3%) |
| $20,000 to $22,499 | 30 (8.2%) | 0 (0.0%) |
| $22,500 to $24,999 | 9 (2.5%) | 0 (0.0%) |
| $25,000 to $29,999 | 20 (5.5%) | 35 (8.7%) |
| $30,000 to $34,999 | 30 (8.2%) | 42 (10.4%) |
| $35,000 to $39,999 | 4 (1.1%) | 32 (7.9%) |
| $40,000 to $44,999 | 22 (6.0%) | 51 (12.7%) |
| $45,000 to $49,999 | 12 (3.3%) | 20 (5.0%) |
| $50,000 to $54,999 | 10 (2.7%) | 16 (4.0%) |
| $55,000 to $64,999 | 53 (14.5%) | 29 (7.2%) |
| $65,000 to $74,999 | 26 (7.1%) | 8 (2.0%) |
| $75,000 to $99,999 | 50 (13.7%) | 2 (0.5%) |
| $100,000+ | 4 (1.1%) | 40 (9.9%) |
| Total | 365 (100.0%) | 403 (100.0%) |
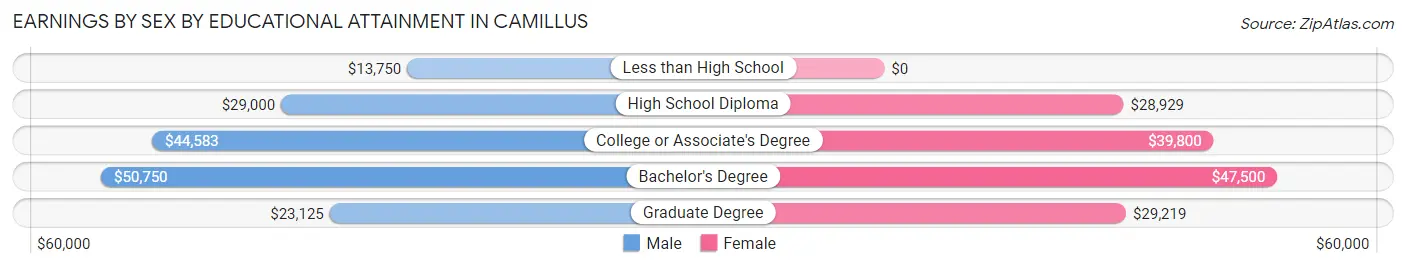
Earnings by Sex by Educational Attainment in Camillus
Average earnings in Camillus are $33,000 for men and $38,500 for women, a difference of 14.3%. Men with an educational attainment of bachelor's degree enjoy the highest average annual earnings of $50,750, while those with less than high school education earn the least with $13,750. Women with an educational attainment of bachelor's degree earn the most with the average annual earnings of $47,500, while those with high school diploma education have the smallest earnings of $28,929.
| Educational Attainment | Male Income | Female Income |
| Less than High School | $13,750 | $0 |
| High School Diploma | $29,000 | $28,929 |
| College or Associate's Degree | $44,583 | $39,800 |
| Bachelor's Degree | $50,750 | $47,500 |
| Graduate Degree | $23,125 | $29,219 |
| Total | $33,000 | $38,500 |
Family Income in Camillus
Family Income Brackets in Camillus
According to the Camillus family income data, there are 59 families falling into the $100,000 to $149,999 income range, which is the most common income bracket and makes up 24.0% of all families. Conversely, the $10,000 to $14,999 income bracket is the least frequent group with only 6 families (2.4%) belonging to this category.
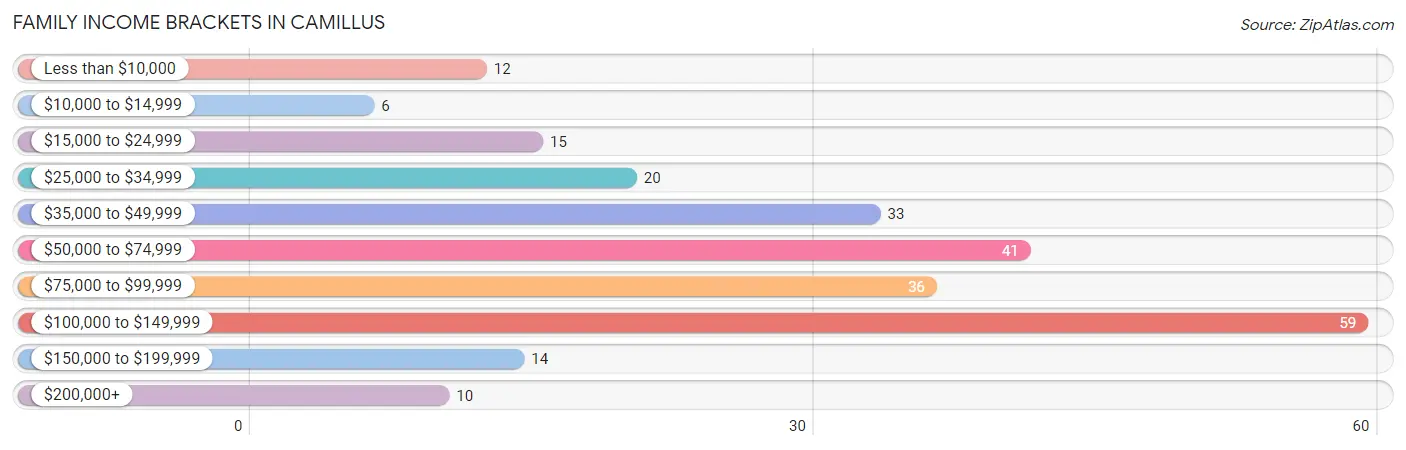
| Income Bracket | # Families | % Families |
| Less than $10,000 | 12 | 4.9% |
| $10,000 to $14,999 | 6 | 2.4% |
| $15,000 to $24,999 | 15 | 6.1% |
| $25,000 to $34,999 | 20 | 8.1% |
| $35,000 to $49,999 | 33 | 13.4% |
| $50,000 to $74,999 | 41 | 16.7% |
| $75,000 to $99,999 | 36 | 14.6% |
| $100,000 to $149,999 | 59 | 24.0% |
| $150,000 to $199,999 | 14 | 5.7% |
| $200,000+ | 10 | 4.1% |
Family Income by Famaliy Size in Camillus
4-person families (75 | 30.5%) account for the highest median family income in Camillus with $84,479 per family, while 2-person families (83 | 33.7%) have the highest median income of $22,375 per family member.
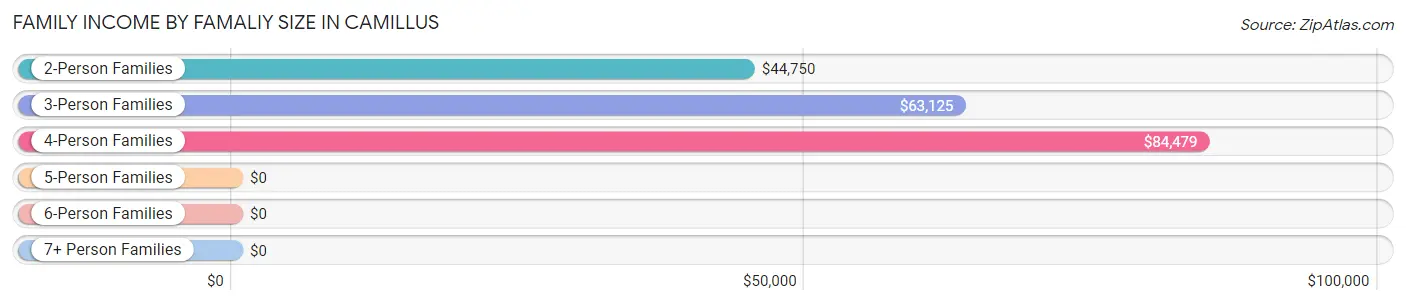
| Income Bracket | # Families | Median Income |
| 2-Person Families | 83 (33.7%) | $44,750 |
| 3-Person Families | 76 (30.9%) | $63,125 |
| 4-Person Families | 75 (30.5%) | $84,479 |
| 5-Person Families | 9 (3.7%) | $0 |
| 6-Person Families | 3 (1.2%) | $0 |
| 7+ Person Families | 0 (0.0%) | $0 |
| Total | 246 (100.0%) | $68,750 |
Family Income by Number of Earners in Camillus
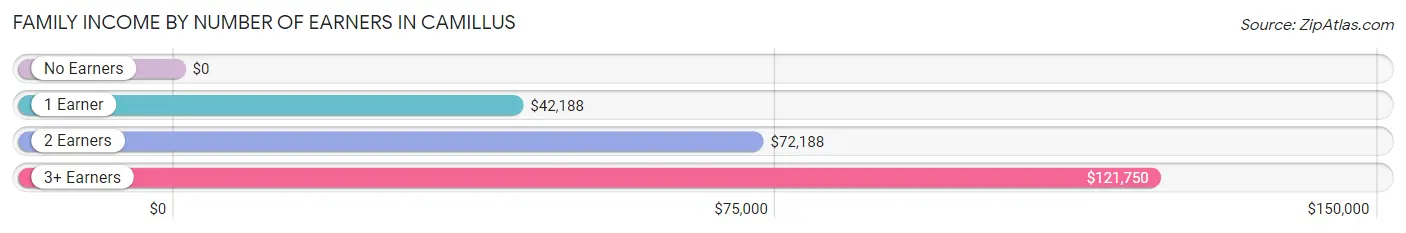
| Number of Earners | # Families | Median Income |
| No Earners | 14 (5.7%) | $0 |
| 1 Earner | 80 (32.5%) | $42,188 |
| 2 Earners | 109 (44.3%) | $72,188 |
| 3+ Earners | 43 (17.5%) | $121,750 |
| Total | 246 (100.0%) | $68,750 |
Household Income in Camillus
Household Income Brackets in Camillus
With 152 households falling in the category, the $50,000 to $74,999 income range is the most frequent in Camillus, accounting for 21.6% of all households. In contrast, only 10 households (1.4%) fall into the $200,000+ income bracket, making it the least populous group.
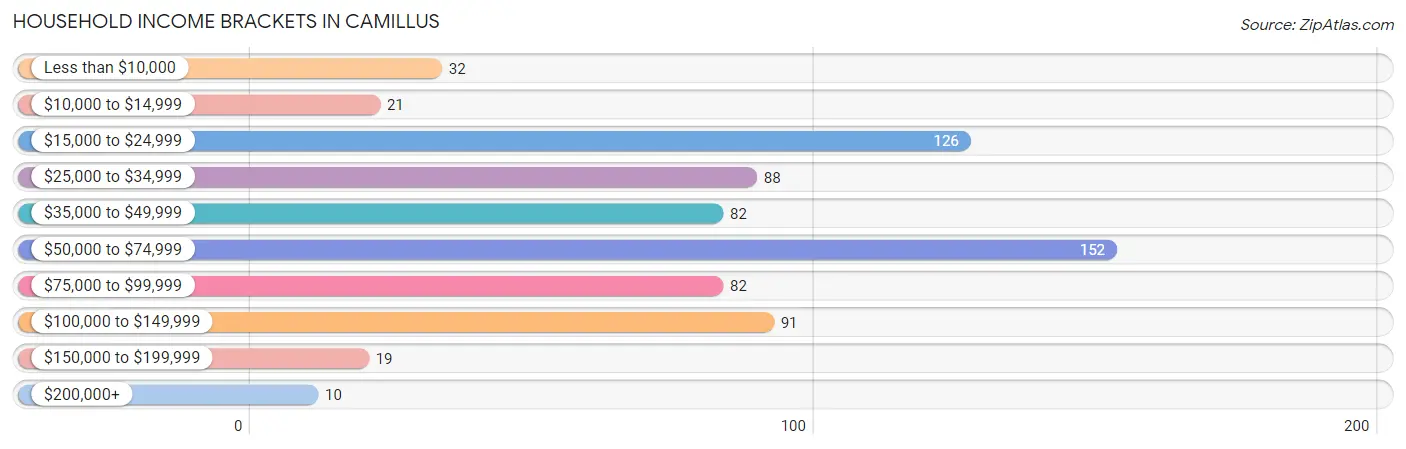
| Income Bracket | # Households | % Households |
| Less than $10,000 | 32 | 4.6% |
| $10,000 to $14,999 | 21 | 3.0% |
| $15,000 to $24,999 | 126 | 17.9% |
| $25,000 to $34,999 | 88 | 12.5% |
| $35,000 to $49,999 | 82 | 11.7% |
| $50,000 to $74,999 | 152 | 21.6% |
| $75,000 to $99,999 | 82 | 11.7% |
| $100,000 to $149,999 | 91 | 12.9% |
| $150,000 to $199,999 | 19 | 2.7% |
| $200,000+ | 10 | 1.4% |
Household Income by Householder Age in Camillus
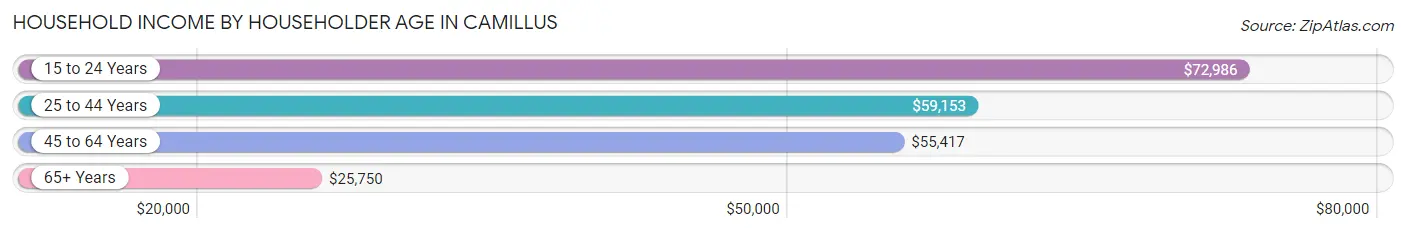
The median household income in Camillus is $51,563, with the highest median household income of $72,986 found in the 15 to 24 years age bracket for the primary householder. A total of 35 households (5.0%) fall into this category. Meanwhile, the 65+ years age bracket for the primary householder has the lowest median household income of $25,750, with 226 households (32.2%) in this group.
| Income Bracket | # Households | Median Income |
| 15 to 24 Years | 35 (5.0%) | $72,986 |
| 25 to 44 Years | 209 (29.7%) | $59,153 |
| 45 to 64 Years | 233 (33.1%) | $55,417 |
| 65+ Years | 226 (32.2%) | $25,750 |
| Total | 703 (100.0%) | $51,563 |
Poverty in Camillus
Income Below Poverty by Sex and Age in Camillus
With 11.8% poverty level for males and 11.9% for females among the residents of Camillus, 6 to 11 year old males and 12 to 14 year old females are the most vulnerable to poverty, with 14 males (38.9%) and 9 females (69.2%) in their respective age groups living below the poverty level.
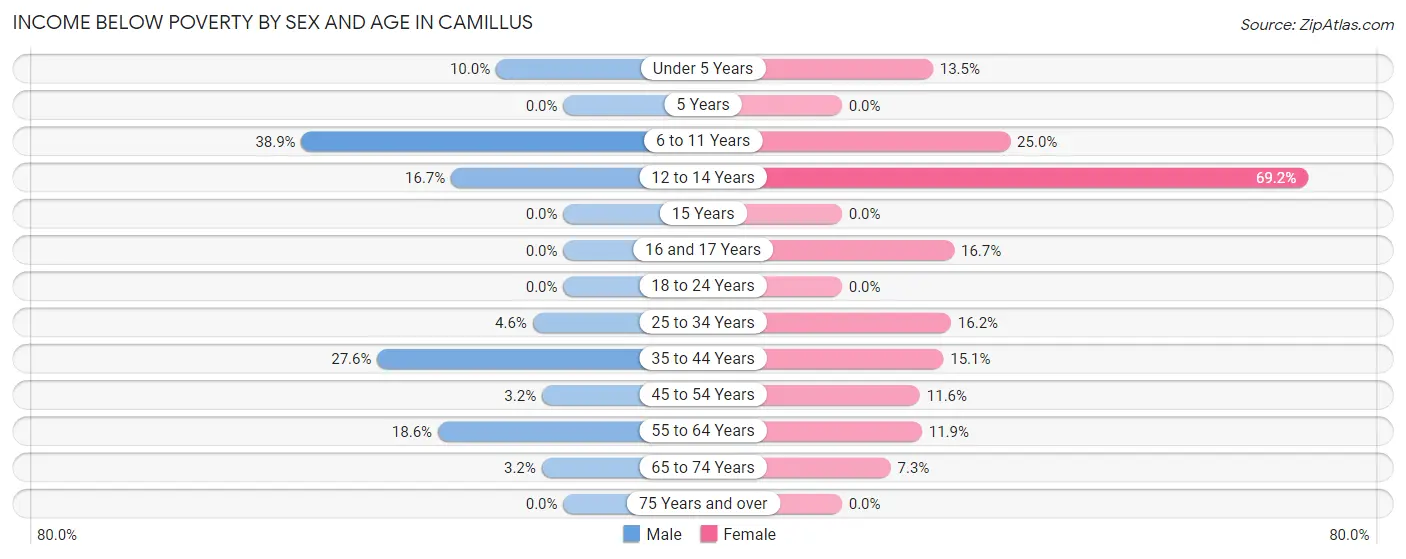
| Age Bracket | Male | Female |
| Under 5 Years | 5 (10.0%) | 5 (13.5%) |
| 5 Years | 0 (0.0%) | 0 (0.0%) |
| 6 to 11 Years | 14 (38.9%) | 4 (25.0%) |
| 12 to 14 Years | 4 (16.7%) | 9 (69.2%) |
| 15 Years | 0 (0.0%) | 0 (0.0%) |
| 16 and 17 Years | 0 (0.0%) | 4 (16.7%) |
| 18 to 24 Years | 0 (0.0%) | 0 (0.0%) |
| 25 to 34 Years | 4 (4.5%) | 23 (16.2%) |
| 35 to 44 Years | 21 (27.6%) | 11 (15.1%) |
| 45 to 54 Years | 2 (3.2%) | 8 (11.6%) |
| 55 to 64 Years | 19 (18.6%) | 12 (11.9%) |
| 65 to 74 Years | 3 (3.2%) | 5 (7.2%) |
| 75 Years and over | 0 (0.0%) | 0 (0.0%) |
| Total | 72 (11.8%) | 81 (11.9%) |
Income Above Poverty by Sex and Age in Camillus
According to the poverty statistics in Camillus, males aged 18 to 24 years and females aged 5 years are the age groups that are most secure financially, with 100.0% of males and 100.0% of females in these age groups living above the poverty line.
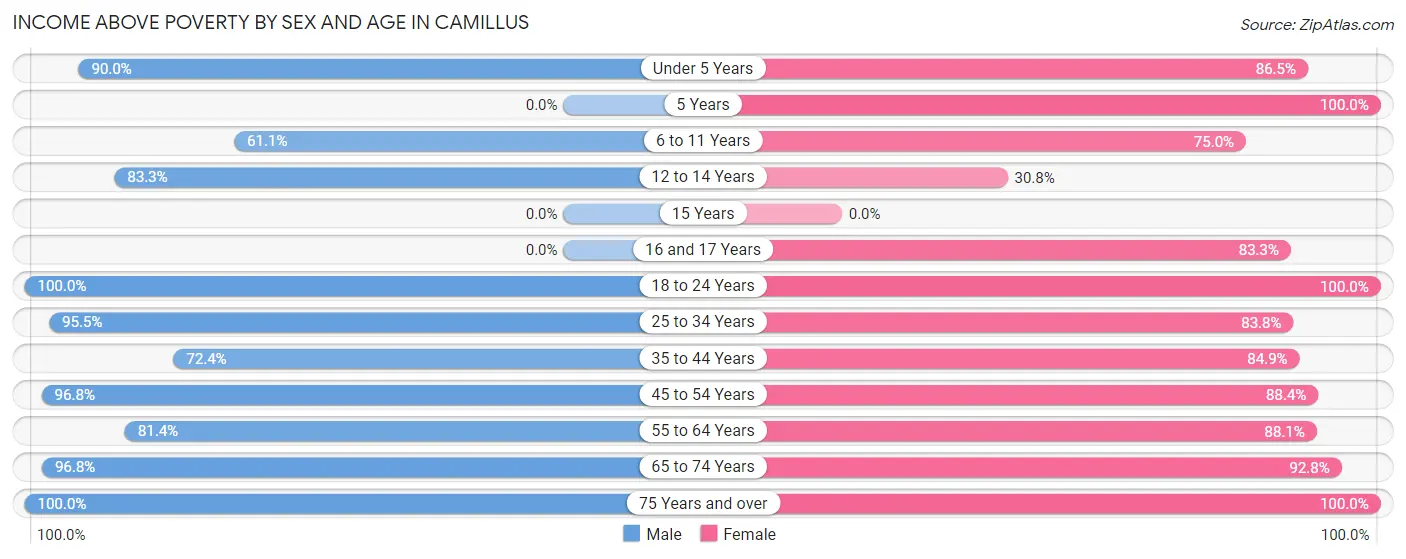
| Age Bracket | Male | Female |
| Under 5 Years | 45 (90.0%) | 32 (86.5%) |
| 5 Years | 0 (0.0%) | 1 (100.0%) |
| 6 to 11 Years | 22 (61.1%) | 12 (75.0%) |
| 12 to 14 Years | 20 (83.3%) | 4 (30.8%) |
| 15 Years | 0 (0.0%) | 0 (0.0%) |
| 16 and 17 Years | 0 (0.0%) | 20 (83.3%) |
| 18 to 24 Years | 56 (100.0%) | 44 (100.0%) |
| 25 to 34 Years | 84 (95.5%) | 119 (83.8%) |
| 35 to 44 Years | 55 (72.4%) | 62 (84.9%) |
| 45 to 54 Years | 61 (96.8%) | 61 (88.4%) |
| 55 to 64 Years | 83 (81.4%) | 89 (88.1%) |
| 65 to 74 Years | 90 (96.8%) | 64 (92.7%) |
| 75 Years and over | 21 (100.0%) | 93 (100.0%) |
| Total | 537 (88.2%) | 601 (88.1%) |
Income Below Poverty Among Married-Couple Families in Camillus
The poverty statistics for married-couple families in Camillus show that 4.1% or 7 of the total 173 families live below the poverty line. Families with 1 or 2 children have the highest poverty rate of 9.7%, comprising of 7 families. On the other hand, families with no children have the lowest poverty rate of 0.0%, which includes 0 families.
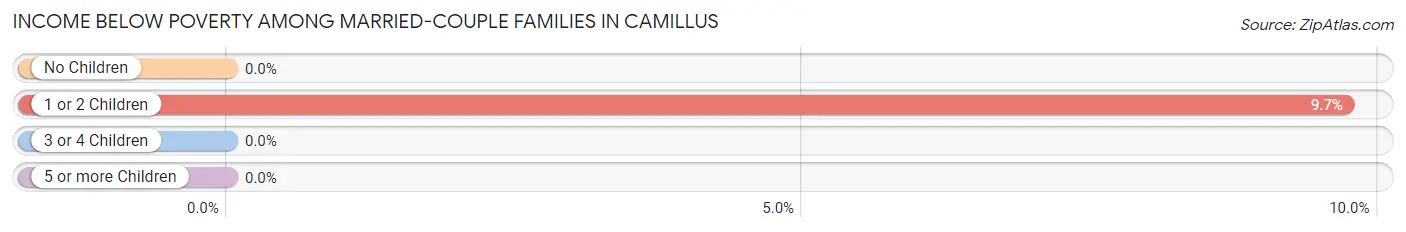
| Children | Above Poverty | Below Poverty |
| No Children | 94 (100.0%) | 0 (0.0%) |
| 1 or 2 Children | 65 (90.3%) | 7 (9.7%) |
| 3 or 4 Children | 7 (100.0%) | 0 (0.0%) |
| 5 or more Children | 0 (0.0%) | 0 (0.0%) |
| Total | 166 (96.0%) | 7 (4.1%) |
Income Below Poverty Among Single-Parent Households in Camillus
According to the poverty data in Camillus, 34.5% or 10 single-father households and 43.2% or 19 single-mother households are living below the poverty line. Among single-father households, those with 1 or 2 children have the highest poverty rate, with 6 households (37.5%) experiencing poverty. Likewise, among single-mother households, those with 3 or 4 children have the highest poverty rate, with 6 households (46.2%) falling below the poverty line.
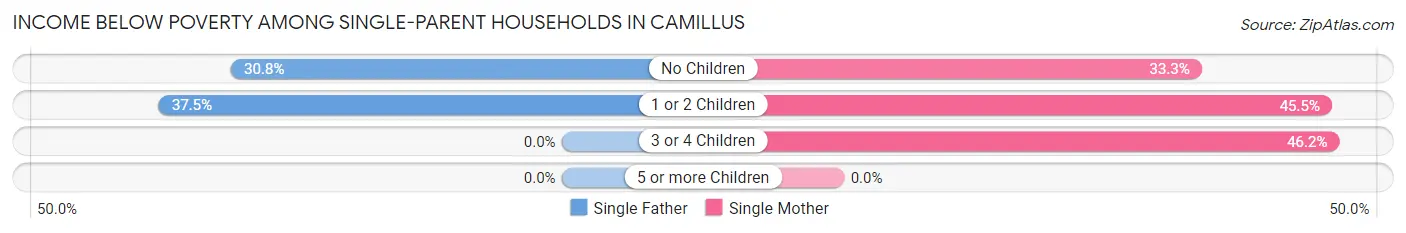
| Children | Single Father | Single Mother |
| No Children | 4 (30.8%) | 3 (33.3%) |
| 1 or 2 Children | 6 (37.5%) | 10 (45.5%) |
| 3 or 4 Children | 0 (0.0%) | 6 (46.2%) |
| 5 or more Children | 0 (0.0%) | 0 (0.0%) |
| Total | 10 (34.5%) | 19 (43.2%) |
Income Below Poverty Among Married-Couple vs Single-Parent Households in Camillus
The poverty data for Camillus shows that 7 of the married-couple family households (4.1%) and 29 of the single-parent households (39.7%) are living below the poverty level. Within the married-couple family households, those with 1 or 2 children have the highest poverty rate, with 7 households (9.7%) falling below the poverty line. Among the single-parent households, those with 3 or 4 children have the highest poverty rate, with 6 household (46.2%) living below poverty.
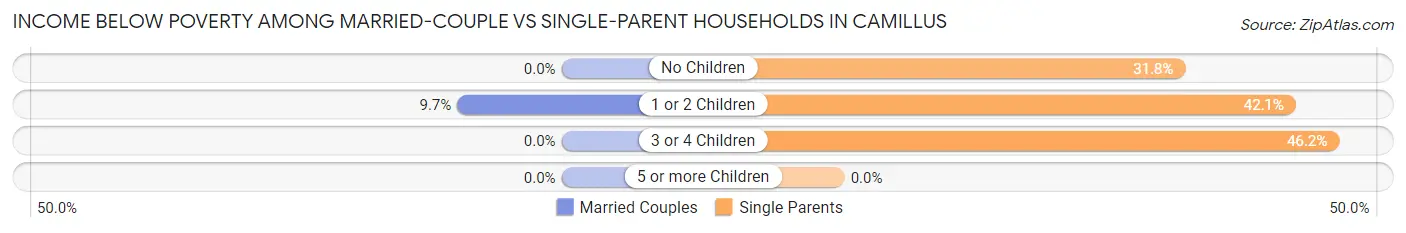
| Children | Married-Couple Families | Single-Parent Households |
| No Children | 0 (0.0%) | 7 (31.8%) |
| 1 or 2 Children | 7 (9.7%) | 16 (42.1%) |
| 3 or 4 Children | 0 (0.0%) | 6 (46.2%) |
| 5 or more Children | 0 (0.0%) | 0 (0.0%) |
| Total | 7 (4.1%) | 29 (39.7%) |
Race in Camillus
The most populous races in Camillus are White / Caucasian (1,212 | 92.1%), Hispanic or Latino (53 | 4.0%), and Some other Race (43 | 3.3%).
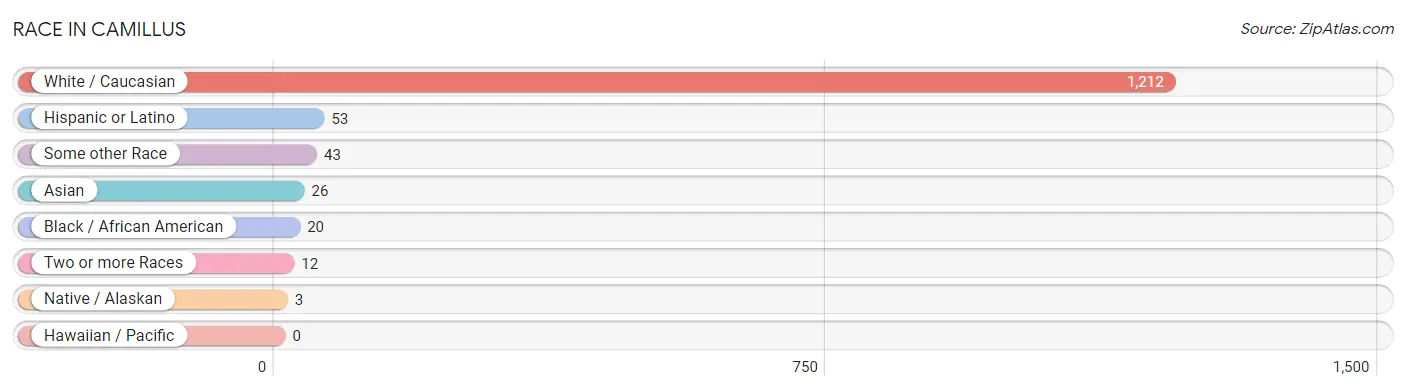
| Race | # Population | % Population |
| Asian | 26 | 2.0% |
| Black / African American | 20 | 1.5% |
| Hawaiian / Pacific | 0 | 0.0% |
| Hispanic or Latino | 53 | 4.0% |
| Native / Alaskan | 3 | 0.2% |
| White / Caucasian | 1,212 | 92.1% |
| Two or more Races | 12 | 0.9% |
| Some other Race | 43 | 3.3% |
| Total | 1,316 | 100.0% |
Ancestry in Camillus
The most populous ancestries reported in Camillus are Irish (295 | 22.4%), English (236 | 17.9%), German (211 | 16.0%), Italian (122 | 9.3%), and Polish (93 | 7.1%), together accounting for 72.7% of all Camillus residents.
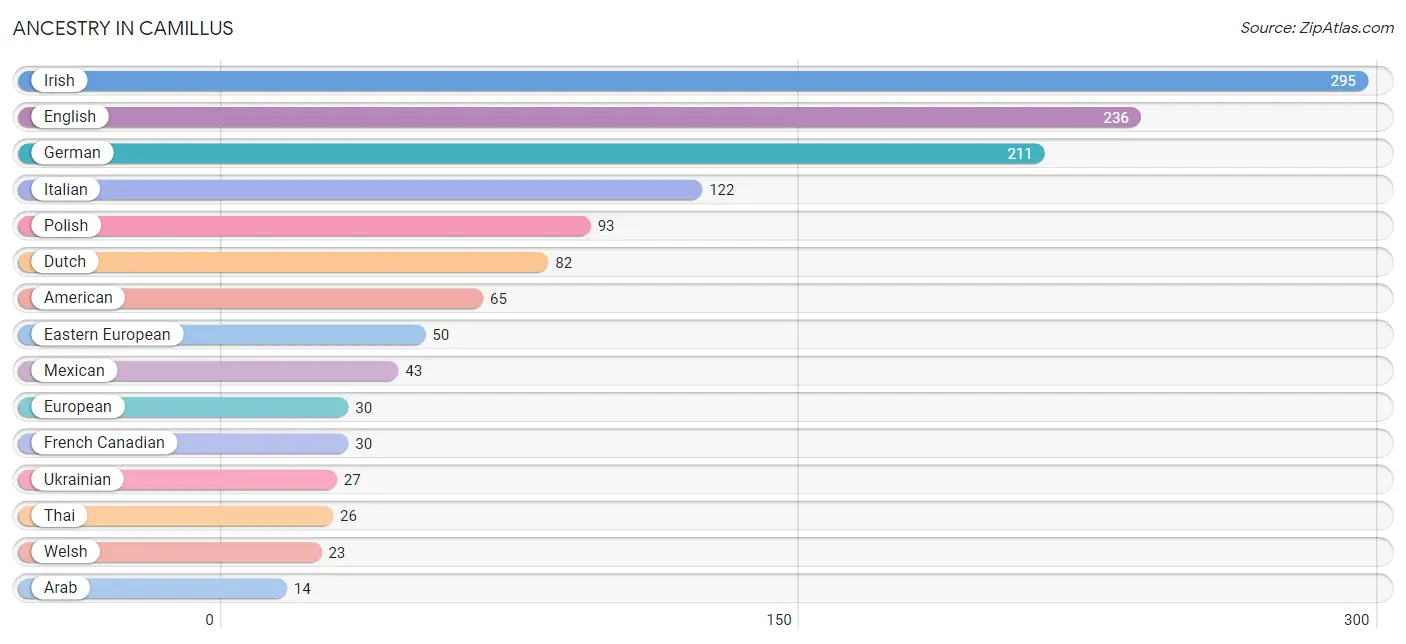
| Ancestry | # Population | % Population |
| American | 65 | 4.9% |
| Arab | 14 | 1.1% |
| Central American | 9 | 0.7% |
| Costa Rican | 9 | 0.7% |
| Czech | 4 | 0.3% |
| Danish | 4 | 0.3% |
| Dominican | 1 | 0.1% |
| Dutch | 82 | 6.2% |
| Eastern European | 50 | 3.8% |
| English | 236 | 17.9% |
| European | 30 | 2.3% |
| French | 8 | 0.6% |
| French Canadian | 30 | 2.3% |
| German | 211 | 16.0% |
| Hungarian | 12 | 0.9% |
| Irish | 295 | 22.4% |
| Iroquois | 14 | 1.1% |
| Italian | 122 | 9.3% |
| Lithuanian | 5 | 0.4% |
| Mexican | 43 | 3.3% |
| Northern European | 3 | 0.2% |
| Palestinian | 11 | 0.8% |
| Polish | 93 | 7.1% |
| Russian | 3 | 0.2% |
| Scottish | 14 | 1.1% |
| Slavic | 2 | 0.2% |
| Slovak | 5 | 0.4% |
| Swedish | 5 | 0.4% |
| Thai | 26 | 2.0% |
| Ukrainian | 27 | 2.1% |
| Welsh | 23 | 1.8% | View All 31 Rows |
Immigrants in Camillus
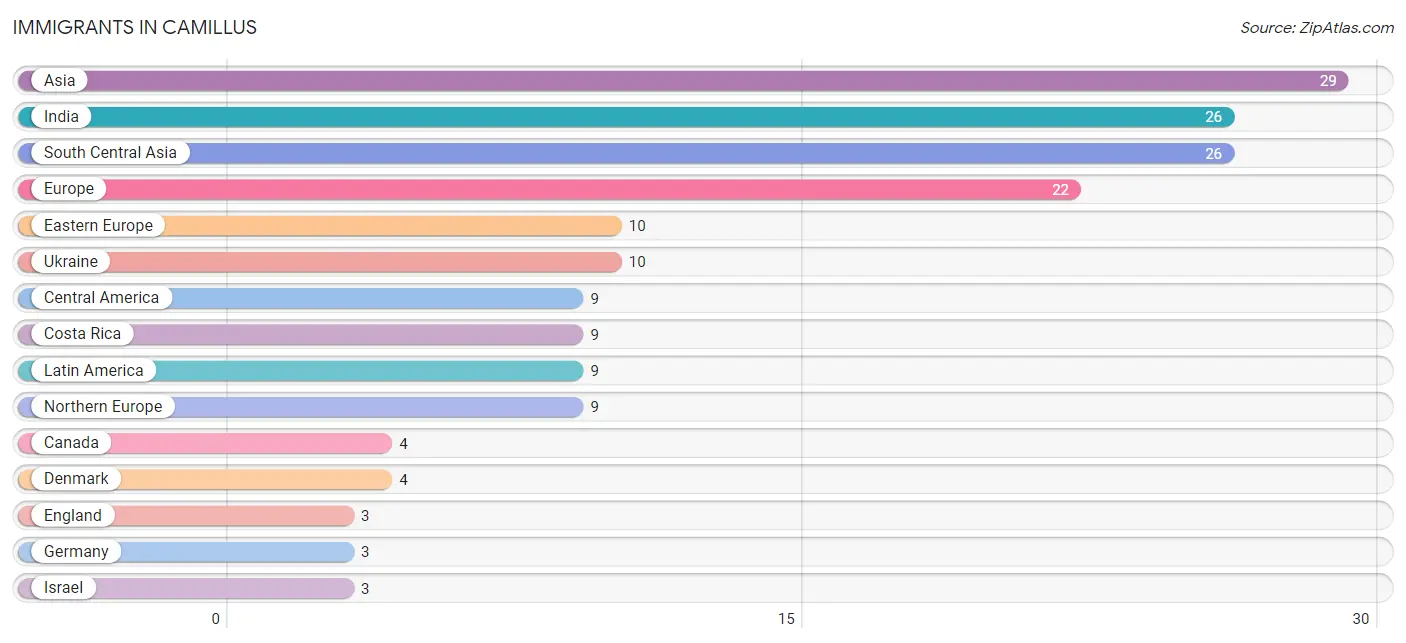
The most numerous immigrant groups reported in Camillus came from Asia (29 | 2.2%), India (26 | 2.0%), South Central Asia (26 | 2.0%), Europe (22 | 1.7%), and Eastern Europe (10 | 0.8%), together accounting for 8.6% of all Camillus residents.
| Immigration Origin | # Population | % Population |
| Asia | 29 | 2.2% |
| Canada | 4 | 0.3% |
| Central America | 9 | 0.7% |
| Costa Rica | 9 | 0.7% |
| Denmark | 4 | 0.3% |
| Eastern Europe | 10 | 0.8% |
| England | 3 | 0.2% |
| Europe | 22 | 1.7% |
| Germany | 3 | 0.2% |
| India | 26 | 2.0% |
| Israel | 3 | 0.2% |
| Latin America | 9 | 0.7% |
| Northern Europe | 9 | 0.7% |
| South Central Asia | 26 | 2.0% |
| Ukraine | 10 | 0.8% |
| Western Asia | 3 | 0.2% |
| Western Europe | 3 | 0.2% | View All 17 Rows |
Sex and Age in Camillus
Sex and Age in Camillus
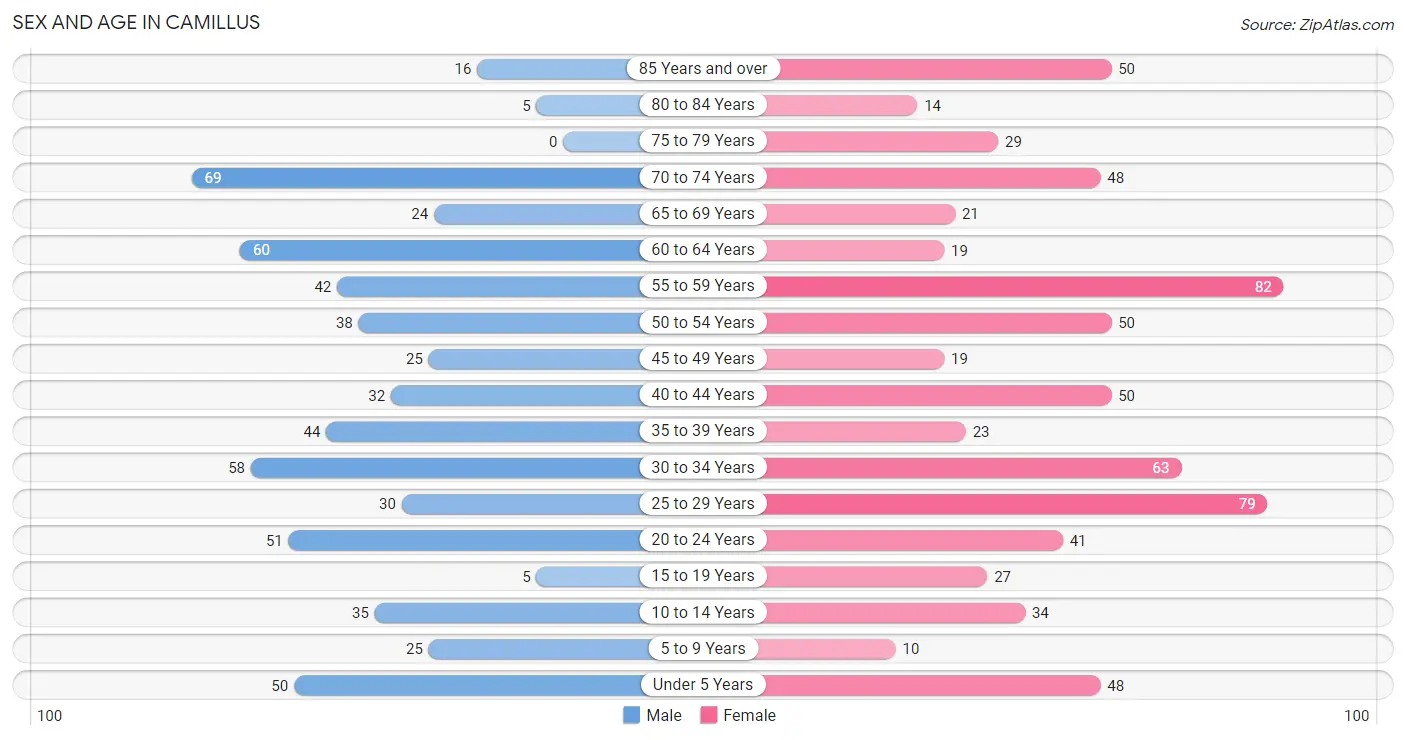
The most populous age groups in Camillus are 70 to 74 Years (69 | 11.3%) for men and 55 to 59 Years (82 | 11.6%) for women.
| Age Bracket | Male | Female |
| Under 5 Years | 50 (8.2%) | 48 (6.8%) |
| 5 to 9 Years | 25 (4.1%) | 10 (1.4%) |
| 10 to 14 Years | 35 (5.8%) | 34 (4.8%) |
| 15 to 19 Years | 5 (0.8%) | 27 (3.8%) |
| 20 to 24 Years | 51 (8.4%) | 41 (5.8%) |
| 25 to 29 Years | 30 (4.9%) | 79 (11.2%) |
| 30 to 34 Years | 58 (9.5%) | 63 (8.9%) |
| 35 to 39 Years | 44 (7.2%) | 23 (3.3%) |
| 40 to 44 Years | 32 (5.2%) | 50 (7.1%) |
| 45 to 49 Years | 25 (4.1%) | 19 (2.7%) |
| 50 to 54 Years | 38 (6.2%) | 50 (7.1%) |
| 55 to 59 Years | 42 (6.9%) | 82 (11.6%) |
| 60 to 64 Years | 60 (9.9%) | 19 (2.7%) |
| 65 to 69 Years | 24 (3.9%) | 21 (3.0%) |
| 70 to 74 Years | 69 (11.3%) | 48 (6.8%) |
| 75 to 79 Years | 0 (0.0%) | 29 (4.1%) |
| 80 to 84 Years | 5 (0.8%) | 14 (2.0%) |
| 85 Years and over | 16 (2.6%) | 50 (7.1%) |
| Total | 609 (100.0%) | 707 (100.0%) |
Families and Households in Camillus
Median Family Size in Camillus
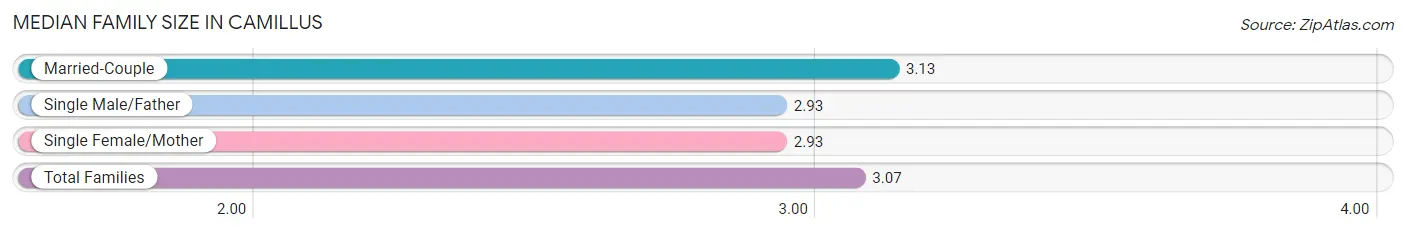
The median family size in Camillus is 3.07 persons per family, with married-couple families (173 | 70.3%) accounting for the largest median family size of 3.13 persons per family. On the other hand, single male/father families (29 | 11.8%) represent the smallest median family size with 2.93 persons per family.
| Family Type | # Families | Family Size |
| Married-Couple | 173 (70.3%) | 3.13 |
| Single Male/Father | 29 (11.8%) | 2.93 |
| Single Female/Mother | 44 (17.9%) | 2.93 |
| Total Families | 246 (100.0%) | 3.07 |
Median Household Size in Camillus
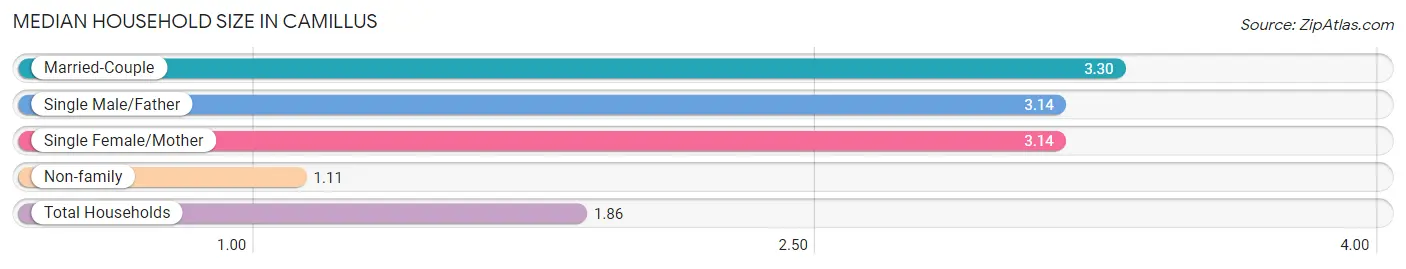
The median household size in Camillus is 1.86 persons per household, with married-couple households (173 | 24.6%) accounting for the largest median household size of 3.3 persons per household. non-family households (457 | 65.0%) represent the smallest median household size with 1.11 persons per household.
| Household Type | # Households | Household Size |
| Married-Couple | 173 (24.6%) | 3.30 |
| Single Male/Father | 29 (4.1%) | 3.14 |
| Single Female/Mother | 44 (6.3%) | 3.14 |
| Non-family | 457 (65.0%) | 1.11 |
| Total Households | 703 (100.0%) | 1.86 |
Household Size by Marriage Status in Camillus
Out of a total of 703 households in Camillus, 246 (35.0%) are family households, while 457 (65.0%) are nonfamily households. The most numerous type of family households are 4-person households, comprising 75, and the most common type of nonfamily households are 1-person households, comprising 403.
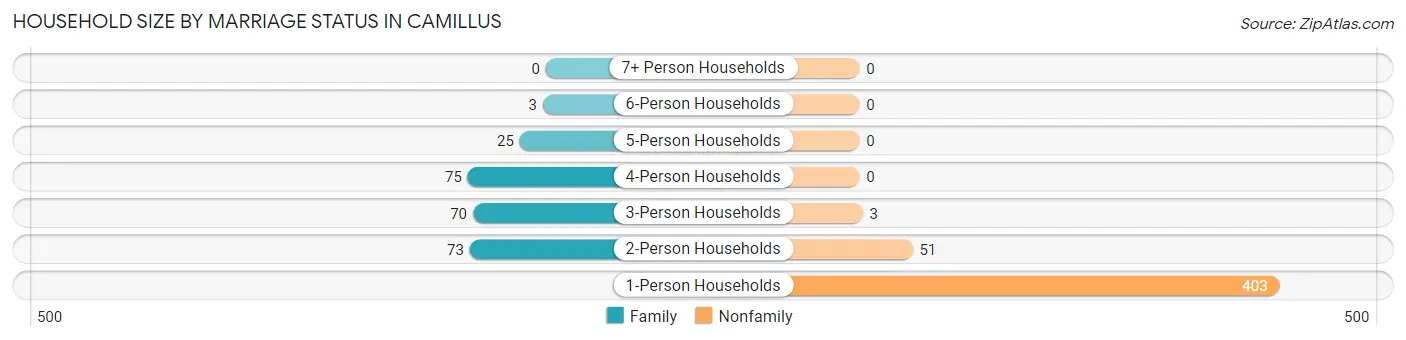
| Household Size | Family Households | Nonfamily Households |
| 1-Person Households | - | 403 (57.3%) |
| 2-Person Households | 73 (10.4%) | 51 (7.2%) |
| 3-Person Households | 70 (10.0%) | 3 (0.4%) |
| 4-Person Households | 75 (10.7%) | 0 (0.0%) |
| 5-Person Households | 25 (3.6%) | 0 (0.0%) |
| 6-Person Households | 3 (0.4%) | 0 (0.0%) |
| 7+ Person Households | 0 (0.0%) | 0 (0.0%) |
| Total | 246 (35.0%) | 457 (65.0%) |
Female Fertility in Camillus
Fertility by Age in Camillus
Average fertility rate in Camillus is 94.0 births per 1,000 women. Women in the age bracket of 20 to 34 years have the highest fertility rate with 126.0 births per 1,000 women. Women in the age bracket of 20 to 34 years acount for 79.3% of all women with births.
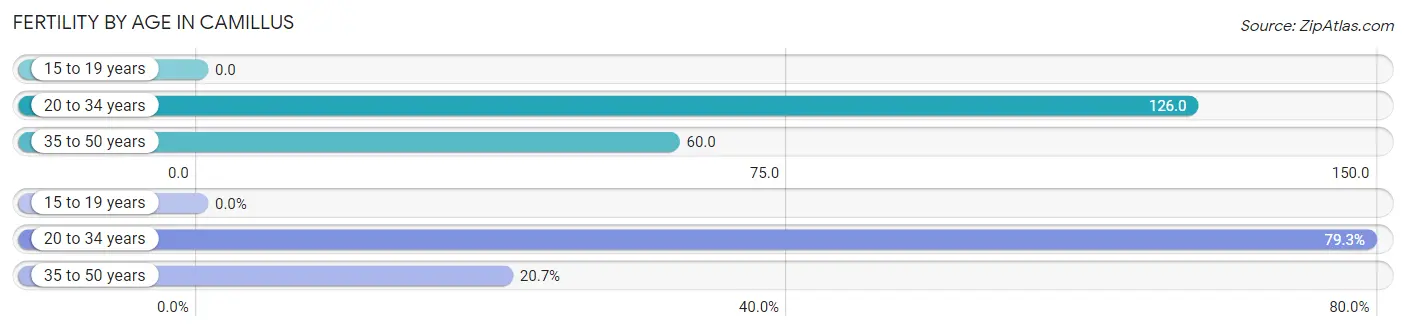
| Age Bracket | Women with Births | Births / 1,000 Women |
| 15 to 19 years | 0 (0.0%) | 0.0 |
| 20 to 34 years | 23 (79.3%) | 126.0 |
| 35 to 50 years | 6 (20.7%) | 60.0 |
| Total | 29 (100.0%) | 94.0 |
Fertility by Age by Marriage Status in Camillus
93.1% of women with births (29) in Camillus are married. The highest percentage of unmarried women with births falls into 20 to 34 years age bracket with 8.7% of them unmarried at the time of birth, while the lowest percentage of unmarried women with births belong to 35 to 50 years age bracket with 0.0% of them unmarried.
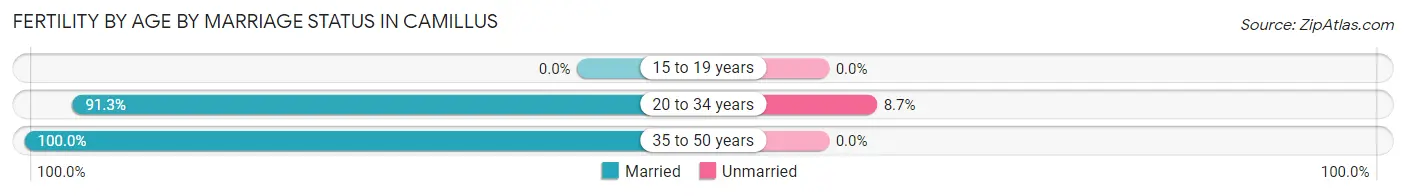
| Age Bracket | Married | Unmarried |
| 15 to 19 years | 0 (0.0%) | 0 (0.0%) |
| 20 to 34 years | 21 (91.3%) | 2 (8.7%) |
| 35 to 50 years | 6 (100.0%) | 0 (0.0%) |
| Total | 27 (93.1%) | 2 (6.9%) |
Fertility by Education in Camillus
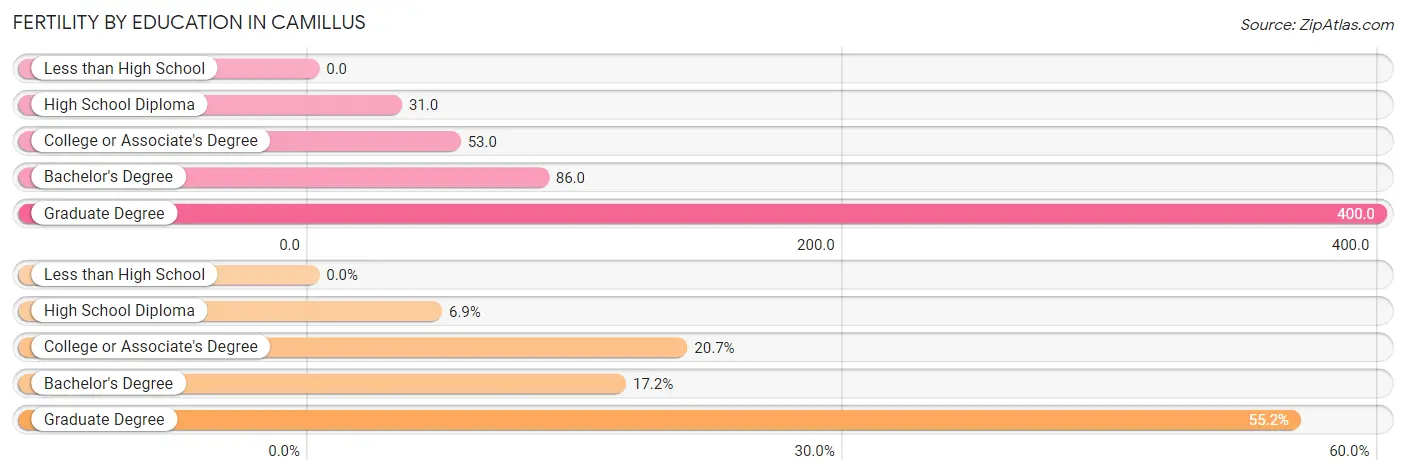
| Educational Attainment | Women with Births | Births / 1,000 Women |
| Less than High School | 0 (0.0%) | 0.0 |
| High School Diploma | 2 (6.9%) | 31.0 |
| College or Associate's Degree | 6 (20.7%) | 53.0 |
| Bachelor's Degree | 5 (17.2%) | 86.0 |
| Graduate Degree | 16 (55.2%) | 400.0 |
| Total | 29 (100.0%) | 94.0 |
Fertility by Education by Marriage Status in Camillus
6.9% of women with births in Camillus are unmarried. Women with the educational attainment of college or associate's degree are most likely to be married with 100.0% of them married at childbirth, while women with the educational attainment of high school diploma are least likely to be married with 100.0% of them unmarried at childbirth.
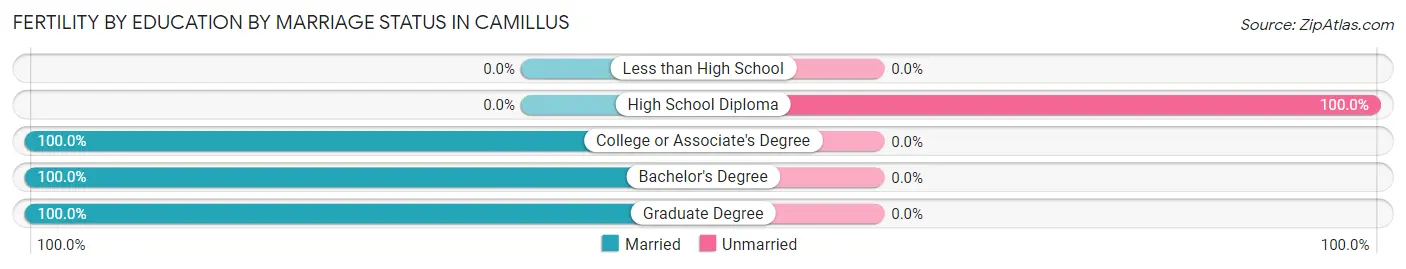
| Educational Attainment | Married | Unmarried |
| Less than High School | 0 (0.0%) | 0 (0.0%) |
| High School Diploma | 0 (0.0%) | 2 (100.0%) |
| College or Associate's Degree | 6 (100.0%) | 0 (0.0%) |
| Bachelor's Degree | 5 (100.0%) | 0 (0.0%) |
| Graduate Degree | 16 (100.0%) | 0 (0.0%) |
| Total | 27 (93.1%) | 2 (6.9%) |
Employment Characteristics in Camillus
Employment by Class of Employer in Camillus
Among the 636 employed individuals in Camillus, private company employees (451 | 70.9%), not-for-profit organizations (82 | 12.9%), and state government employees (32 | 5.0%) make up the most common classes of employment.
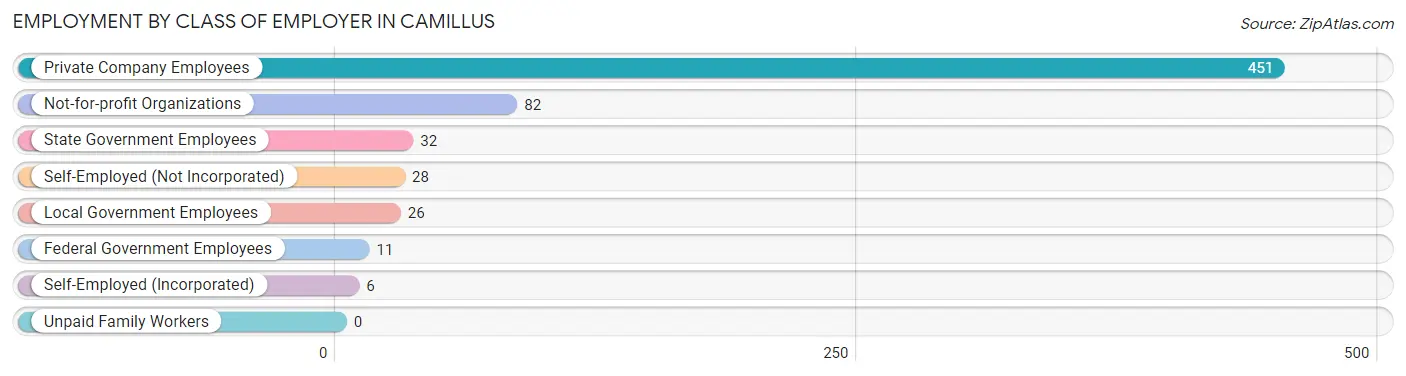
| Employer Class | # Employees | % Employees |
| Private Company Employees | 451 | 70.9% |
| Self-Employed (Incorporated) | 6 | 0.9% |
| Self-Employed (Not Incorporated) | 28 | 4.4% |
| Not-for-profit Organizations | 82 | 12.9% |
| Local Government Employees | 26 | 4.1% |
| State Government Employees | 32 | 5.0% |
| Federal Government Employees | 11 | 1.7% |
| Unpaid Family Workers | 0 | 0.0% |
| Total | 636 | 100.0% |
Employment Status by Age in Camillus
According to the labor force statistics for Camillus, out of the total population over 16 years of age (1,114), 62.2% or 693 individuals are in the labor force, with 6.8% or 47 of them unemployed. The age group with the highest labor force participation rate is 45 to 54 years, with 91.7% or 121 individuals in the labor force. Within the labor force, the 35 to 44 years age range has the highest percentage of unemployed individuals, with 19.4% or 25 of them being unemployed.
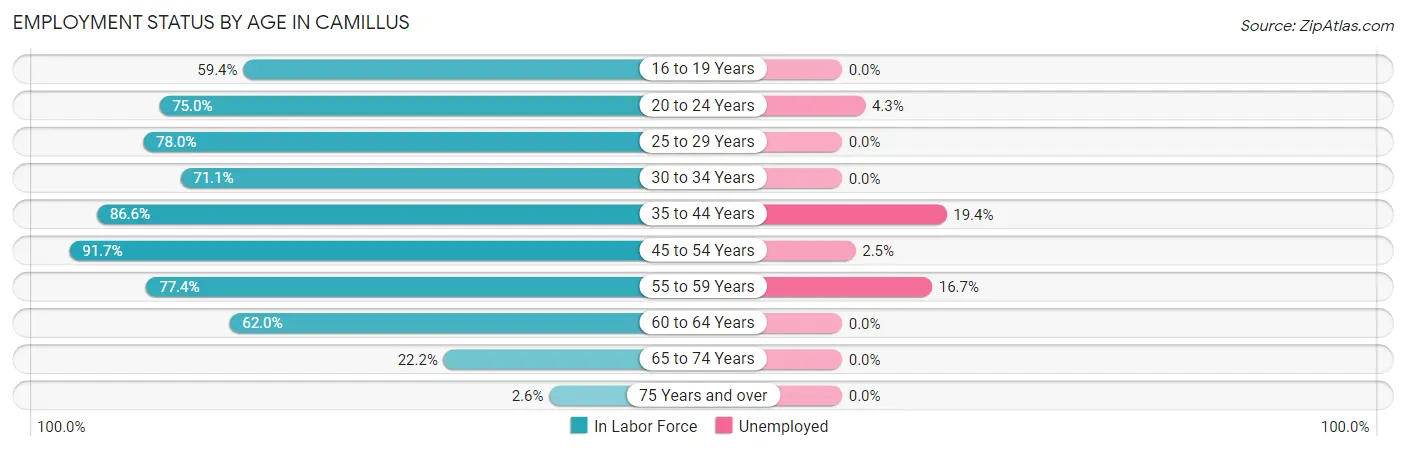
| Age Bracket | In Labor Force | Unemployed |
| 16 to 19 Years | 19 (59.4%) | 0 (0.0%) |
| 20 to 24 Years | 69 (75.0%) | 3 (4.3%) |
| 25 to 29 Years | 85 (78.0%) | 0 (0.0%) |
| 30 to 34 Years | 86 (71.1%) | 0 (0.0%) |
| 35 to 44 Years | 129 (86.6%) | 25 (19.4%) |
| 45 to 54 Years | 121 (91.7%) | 3 (2.5%) |
| 55 to 59 Years | 96 (77.4%) | 16 (16.7%) |
| 60 to 64 Years | 49 (62.0%) | 0 (0.0%) |
| 65 to 74 Years | 36 (22.2%) | 0 (0.0%) |
| 75 Years and over | 3 (2.6%) | 0 (0.0%) |
| Total | 693 (62.2%) | 47 (6.8%) |
Employment Status by Educational Attainment in Camillus
According to labor force statistics for Camillus, 79.3% of individuals (566) out of the total population between 25 and 64 years of age (714) are in the labor force, with 7.8% or 44 of them being unemployed. The group with the highest labor force participation rate are those with the educational attainment of college / associate degree, with 88.6% or 263 individuals in the labor force. Within the labor force, individuals with college / associate degree education have the highest percentage of unemployment, with 15.6% or 41 of them being unemployed.
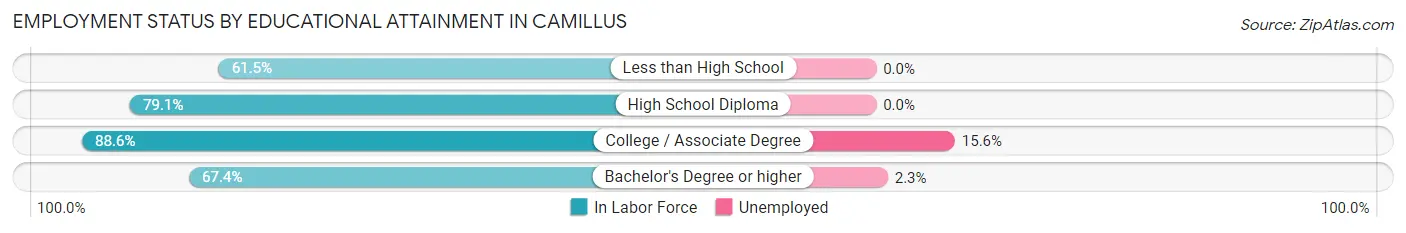
| Educational Attainment | In Labor Force | Unemployed |
| Less than High School | 16 (61.5%) | 0 (0.0%) |
| High School Diploma | 159 (79.1%) | 0 (0.0%) |
| College / Associate Degree | 263 (88.6%) | 46 (15.6%) |
| Bachelor's Degree or higher | 128 (67.4%) | 4 (2.3%) |
| Total | 566 (79.3%) | 56 (7.8%) |
Employment Occupations by Sex in Camillus
Management, Business, Science and Arts Occupations
The most common Management, Business, Science and Arts occupations in Camillus are Health Diagnosing & Treating (64 | 9.9%), Management (52 | 8.1%), Health Technologists (45 | 7.0%), Community & Social Service (44 | 6.8%), and Computers, Engineering & Science (36 | 5.6%).

Management, Business, Science and Arts Occupations by Sex
Within the Management, Business, Science and Arts occupations in Camillus, the most male-oriented occupations are Computers, Engineering & Science (100.0%), Computers & Mathematics (100.0%), and Architecture & Engineering (100.0%), while the most female-oriented occupations are Education, Arts & Media (100.0%), Business & Financial (75.8%), and Community & Social Service (56.8%).
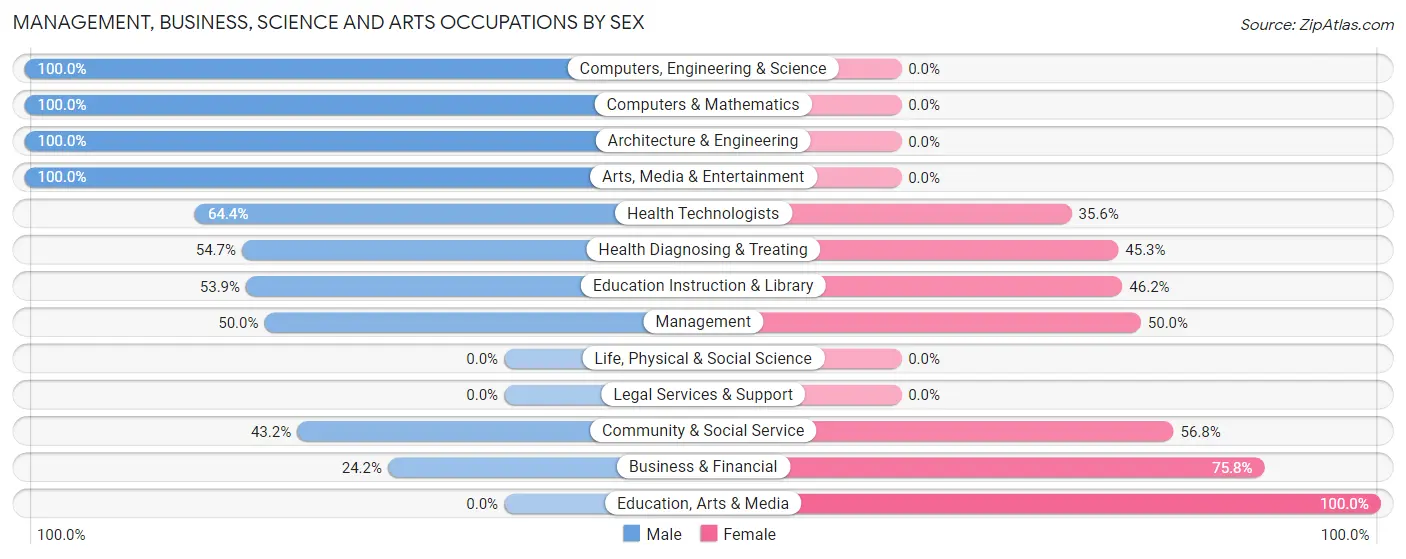
| Occupation | Male | Female |
| Management | 26 (50.0%) | 26 (50.0%) |
| Business & Financial | 8 (24.2%) | 25 (75.8%) |
| Computers, Engineering & Science | 36 (100.0%) | 0 (0.0%) |
| Computers & Mathematics | 31 (100.0%) | 0 (0.0%) |
| Architecture & Engineering | 5 (100.0%) | 0 (0.0%) |
| Life, Physical & Social Science | 0 (0.0%) | 0 (0.0%) |
| Community & Social Service | 19 (43.2%) | 25 (56.8%) |
| Education, Arts & Media | 0 (0.0%) | 13 (100.0%) |
| Legal Services & Support | 0 (0.0%) | 0 (0.0%) |
| Education Instruction & Library | 14 (53.8%) | 12 (46.2%) |
| Arts, Media & Entertainment | 5 (100.0%) | 0 (0.0%) |
| Health Diagnosing & Treating | 35 (54.7%) | 29 (45.3%) |
| Health Technologists | 29 (64.4%) | 16 (35.6%) |
| Total (Category) | 124 (54.1%) | 105 (45.9%) |
| Total (Overall) | 331 (51.2%) | 315 (48.8%) |
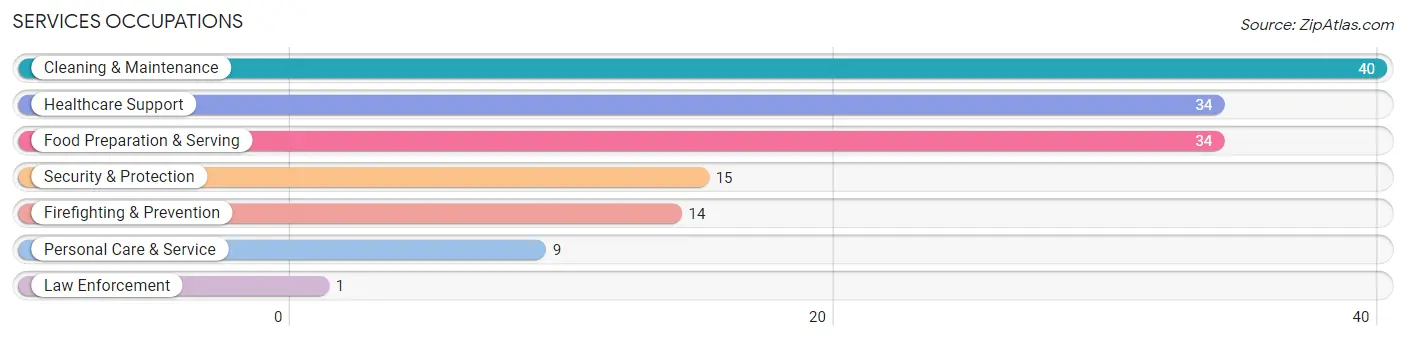
Services Occupations
The most common Services occupations in Camillus are Cleaning & Maintenance (40 | 6.2%), Healthcare Support (34 | 5.3%), Food Preparation & Serving (34 | 5.3%), Security & Protection (15 | 2.3%), and Firefighting & Prevention (14 | 2.2%).
Services Occupations by Sex
Within the Services occupations in Camillus, the most male-oriented occupations are Law Enforcement (100.0%), Cleaning & Maintenance (57.5%), and Security & Protection (53.3%), while the most female-oriented occupations are Healthcare Support (100.0%), Personal Care & Service (100.0%), and Food Preparation & Serving (73.5%).
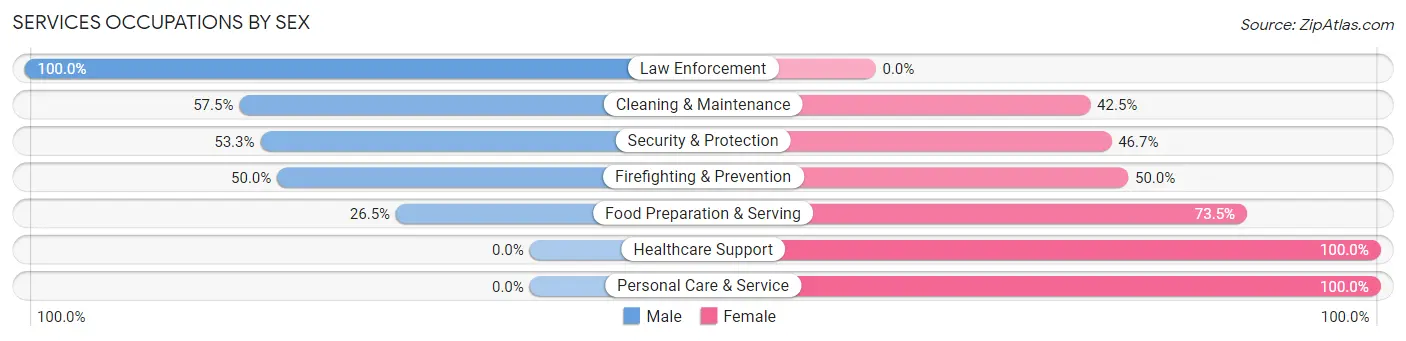
| Occupation | Male | Female |
| Healthcare Support | 0 (0.0%) | 34 (100.0%) |
| Security & Protection | 8 (53.3%) | 7 (46.7%) |
| Firefighting & Prevention | 7 (50.0%) | 7 (50.0%) |
| Law Enforcement | 1 (100.0%) | 0 (0.0%) |
| Food Preparation & Serving | 9 (26.5%) | 25 (73.5%) |
| Cleaning & Maintenance | 23 (57.5%) | 17 (42.5%) |
| Personal Care & Service | 0 (0.0%) | 9 (100.0%) |
| Total (Category) | 40 (30.3%) | 92 (69.7%) |
| Total (Overall) | 331 (51.2%) | 315 (48.8%) |
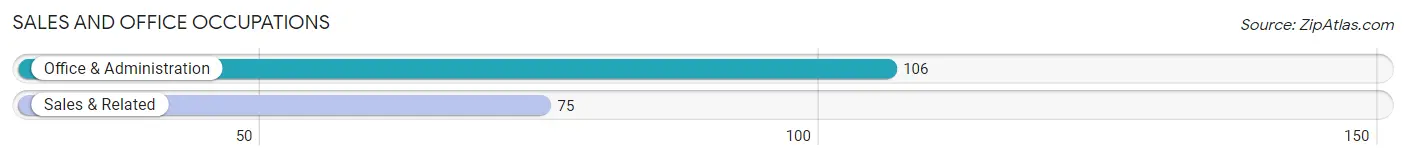
Sales and Office Occupations
The most common Sales and Office occupations in Camillus are Office & Administration (106 | 16.4%), and Sales & Related (75 | 11.6%).
Sales and Office Occupations by Sex
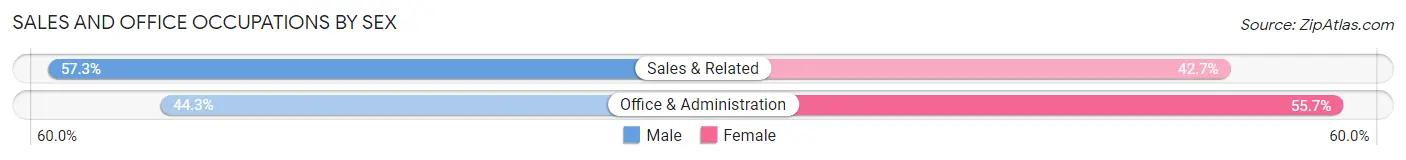
| Occupation | Male | Female |
| Sales & Related | 43 (57.3%) | 32 (42.7%) |
| Office & Administration | 47 (44.3%) | 59 (55.7%) |
| Total (Category) | 90 (49.7%) | 91 (50.3%) |
| Total (Overall) | 331 (51.2%) | 315 (48.8%) |
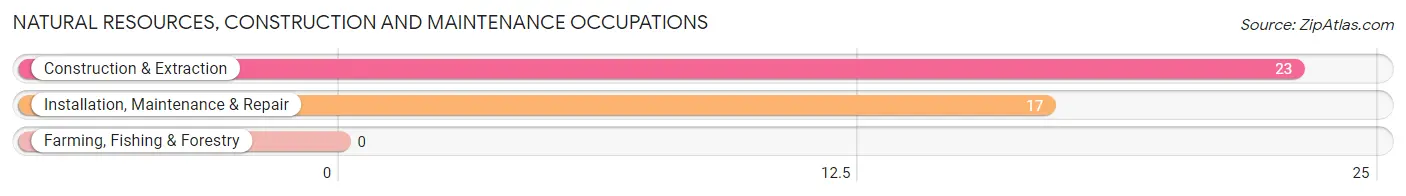
Natural Resources, Construction and Maintenance Occupations
The most common Natural Resources, Construction and Maintenance occupations in Camillus are Construction & Extraction (23 | 3.6%), and Installation, Maintenance & Repair (17 | 2.6%).
Natural Resources, Construction and Maintenance Occupations by Sex
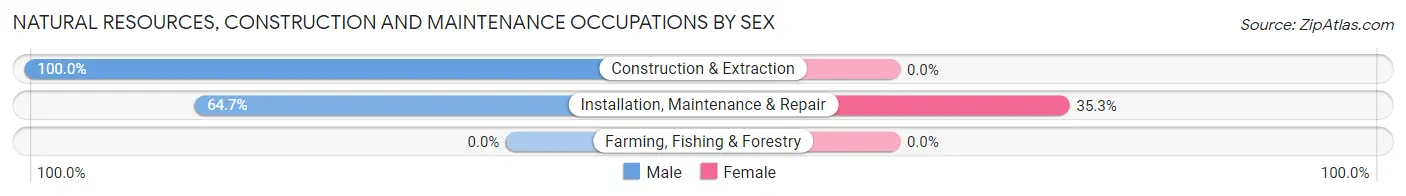
| Occupation | Male | Female |
| Farming, Fishing & Forestry | 0 (0.0%) | 0 (0.0%) |
| Construction & Extraction | 23 (100.0%) | 0 (0.0%) |
| Installation, Maintenance & Repair | 11 (64.7%) | 6 (35.3%) |
| Total (Category) | 34 (85.0%) | 6 (15.0%) |
| Total (Overall) | 331 (51.2%) | 315 (48.8%) |
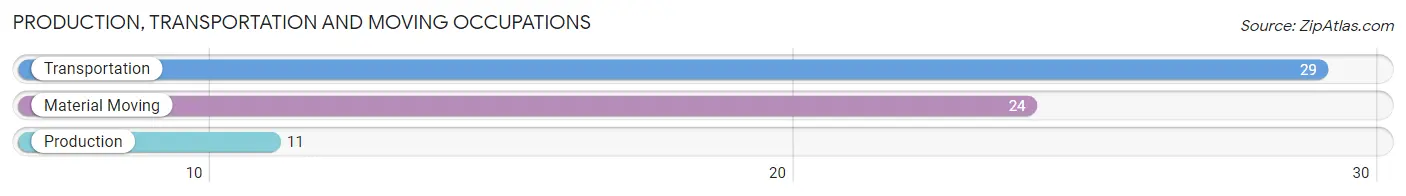
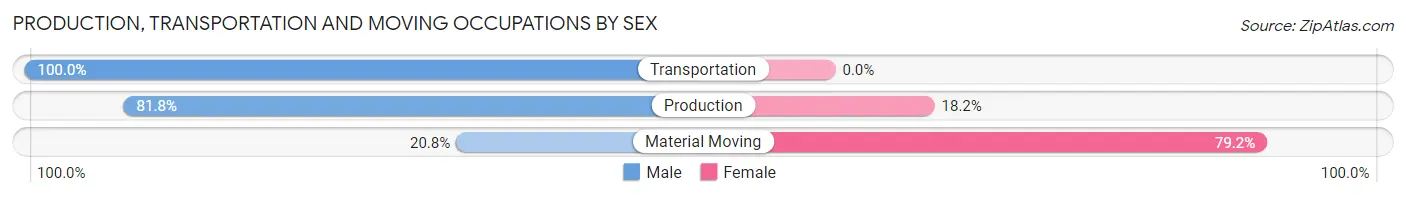
Production, Transportation and Moving Occupations
The most common Production, Transportation and Moving occupations in Camillus are Transportation (29 | 4.5%), Material Moving (24 | 3.7%), and Production (11 | 1.7%).
Production, Transportation and Moving Occupations by Sex
| Occupation | Male | Female |
| Production | 9 (81.8%) | 2 (18.2%) |
| Transportation | 29 (100.0%) | 0 (0.0%) |
| Material Moving | 5 (20.8%) | 19 (79.2%) |
| Total (Category) | 43 (67.2%) | 21 (32.8%) |
| Total (Overall) | 331 (51.2%) | 315 (48.8%) |
Employment Industries by Sex in Camillus
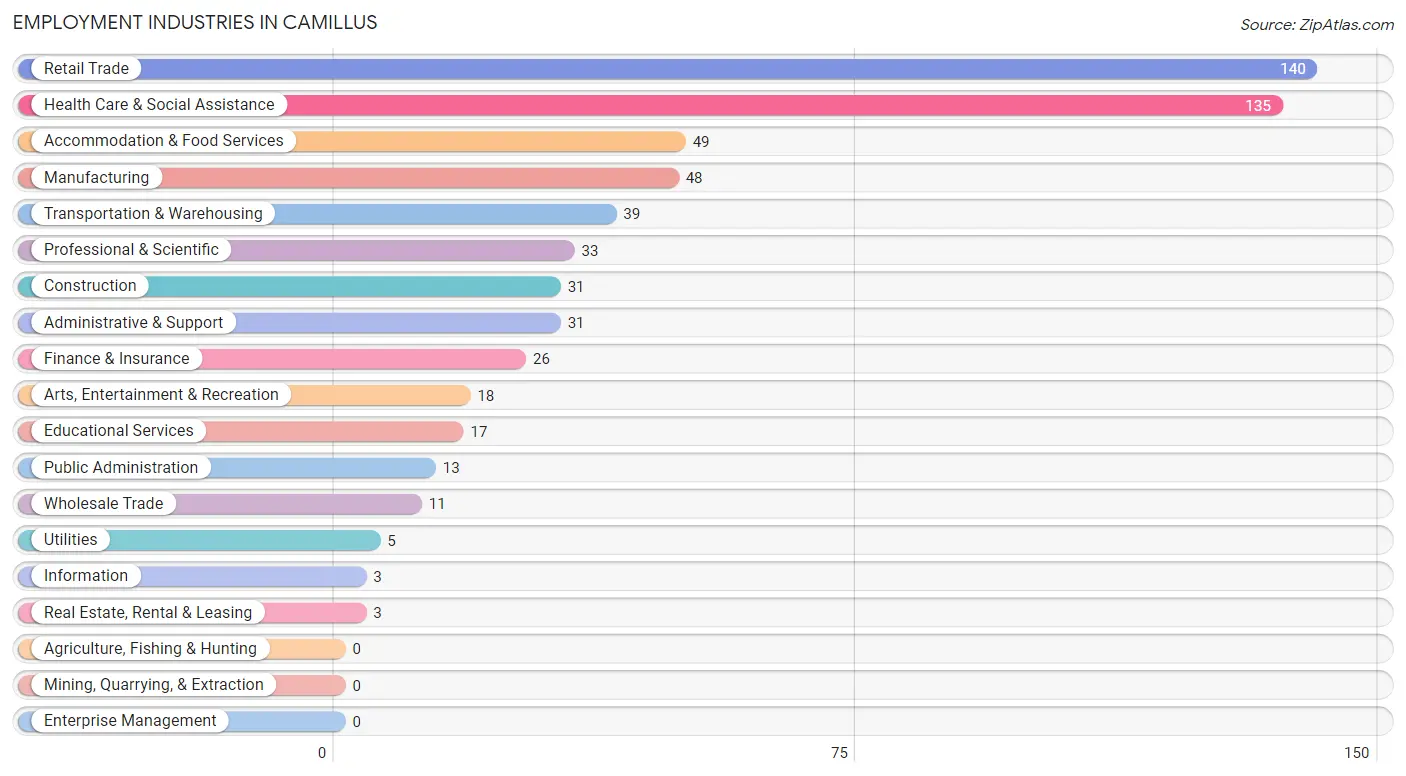
Employment Industries in Camillus
The major employment industries in Camillus include Retail Trade (140 | 21.7%), Health Care & Social Assistance (135 | 20.9%), Accommodation & Food Services (49 | 7.6%), Manufacturing (48 | 7.4%), and Transportation & Warehousing (39 | 6.0%).
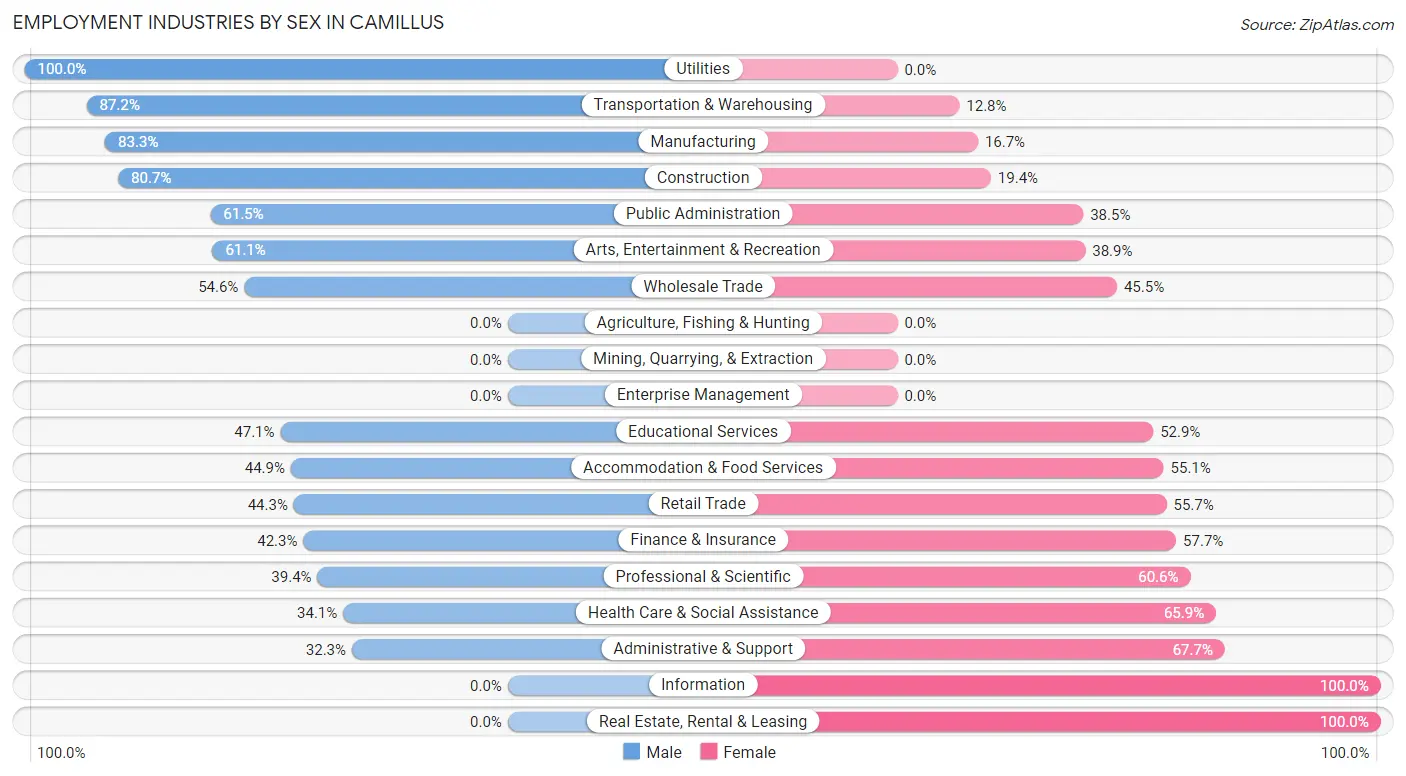
Employment Industries by Sex in Camillus
The Camillus industries that see more men than women are Utilities (100.0%), Transportation & Warehousing (87.2%), and Manufacturing (83.3%), whereas the industries that tend to have a higher number of women are Information (100.0%), Real Estate, Rental & Leasing (100.0%), and Administrative & Support (67.7%).
| Industry | Male | Female |
| Agriculture, Fishing & Hunting | 0 (0.0%) | 0 (0.0%) |
| Mining, Quarrying, & Extraction | 0 (0.0%) | 0 (0.0%) |
| Construction | 25 (80.6%) | 6 (19.4%) |
| Manufacturing | 40 (83.3%) | 8 (16.7%) |
| Wholesale Trade | 6 (54.5%) | 5 (45.5%) |
| Retail Trade | 62 (44.3%) | 78 (55.7%) |
| Transportation & Warehousing | 34 (87.2%) | 5 (12.8%) |
| Utilities | 5 (100.0%) | 0 (0.0%) |
| Information | 0 (0.0%) | 3 (100.0%) |
| Finance & Insurance | 11 (42.3%) | 15 (57.7%) |
| Real Estate, Rental & Leasing | 0 (0.0%) | 3 (100.0%) |
| Professional & Scientific | 13 (39.4%) | 20 (60.6%) |
| Enterprise Management | 0 (0.0%) | 0 (0.0%) |
| Administrative & Support | 10 (32.3%) | 21 (67.7%) |
| Educational Services | 8 (47.1%) | 9 (52.9%) |
| Health Care & Social Assistance | 46 (34.1%) | 89 (65.9%) |
| Arts, Entertainment & Recreation | 11 (61.1%) | 7 (38.9%) |
| Accommodation & Food Services | 22 (44.9%) | 27 (55.1%) |
| Public Administration | 8 (61.5%) | 5 (38.5%) |
| Total | 331 (51.2%) | 315 (48.8%) |
Education in Camillus
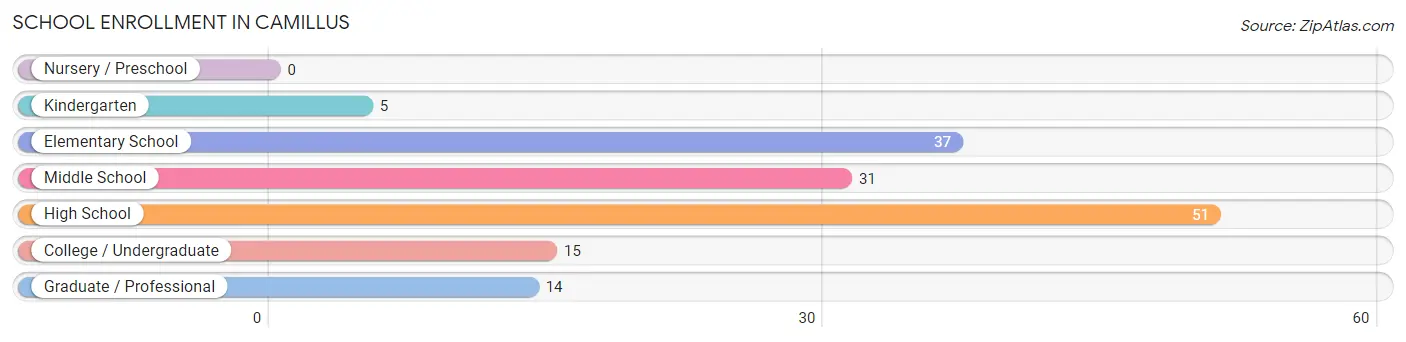
School Enrollment in Camillus
The most common levels of schooling among the 153 students in Camillus are high school (51 | 33.3%), elementary school (37 | 24.2%), and middle school (31 | 20.3%).
| School Level | # Students | % Students |
| Nursery / Preschool | 0 | 0.0% |
| Kindergarten | 5 | 3.3% |
| Elementary School | 37 | 24.2% |
| Middle School | 31 | 20.3% |
| High School | 51 | 33.3% |
| College / Undergraduate | 15 | 9.8% |
| Graduate / Professional | 14 | 9.1% |
| Total | 153 | 100.0% |
School Enrollment by Age by Funding Source in Camillus
Out of a total of 153 students who are enrolled in schools in Camillus, 22 (14.4%) attend a private institution, while the remaining 131 (85.6%) are enrolled in public schools. The age group of 25 to 34 year olds has the highest likelihood of being enrolled in private schools, with 9 (69.2% in the age bracket) enrolled. Conversely, the age group of 5 to 9 year old has the lowest likelihood of being enrolled in a private school, with 35 (100.0% in the age bracket) attending a public institution.
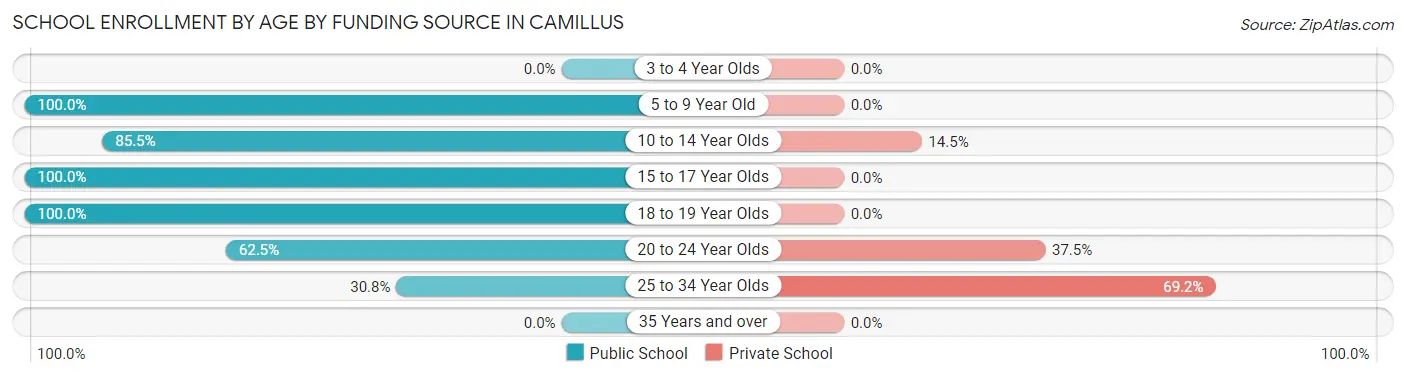
| Age Bracket | Public School | Private School |
| 3 to 4 Year Olds | 0 (0.0%) | 0 (0.0%) |
| 5 to 9 Year Old | 35 (100.0%) | 0 (0.0%) |
| 10 to 14 Year Olds | 59 (85.5%) | 10 (14.5%) |
| 15 to 17 Year Olds | 20 (100.0%) | 0 (0.0%) |
| 18 to 19 Year Olds | 8 (100.0%) | 0 (0.0%) |
| 20 to 24 Year Olds | 5 (62.5%) | 3 (37.5%) |
| 25 to 34 Year Olds | 4 (30.8%) | 9 (69.2%) |
| 35 Years and over | 0 (0.0%) | 0 (0.0%) |
| Total | 131 (85.6%) | 22 (14.4%) |
Educational Attainment by Field of Study in Camillus
Business (39 | 16.5%), psychology (38 | 16.0%), science & technology (37 | 15.6%), computers & mathematics (21 | 8.9%), and literature & languages (21 | 8.9%) are the most common fields of study among 237 individuals in Camillus who have obtained a bachelor's degree or higher.
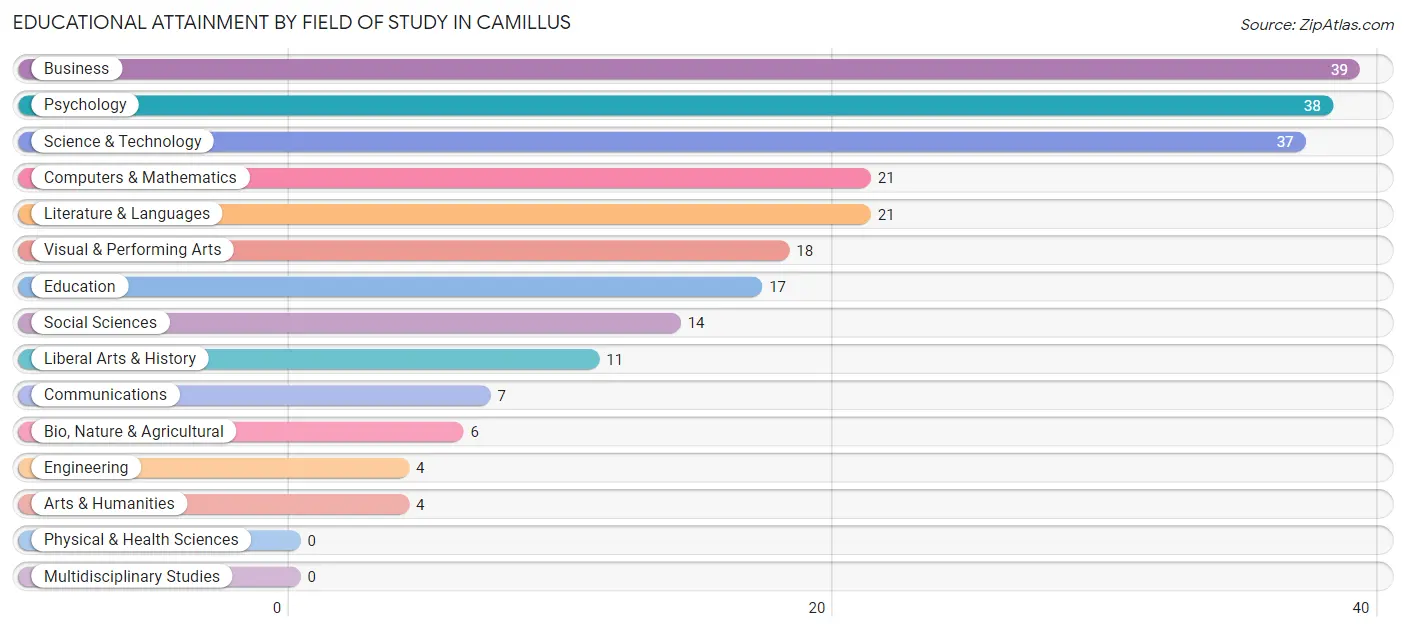
| Field of Study | # Graduates | % Graduates |
| Computers & Mathematics | 21 | 8.9% |
| Bio, Nature & Agricultural | 6 | 2.5% |
| Physical & Health Sciences | 0 | 0.0% |
| Psychology | 38 | 16.0% |
| Social Sciences | 14 | 5.9% |
| Engineering | 4 | 1.7% |
| Multidisciplinary Studies | 0 | 0.0% |
| Science & Technology | 37 | 15.6% |
| Business | 39 | 16.5% |
| Education | 17 | 7.2% |
| Literature & Languages | 21 | 8.9% |
| Liberal Arts & History | 11 | 4.6% |
| Visual & Performing Arts | 18 | 7.6% |
| Communications | 7 | 2.9% |
| Arts & Humanities | 4 | 1.7% |
| Total | 237 | 100.0% |
Transportation & Commute in Camillus
Vehicle Availability by Sex in Camillus
The most prevalent vehicle ownership categories in Camillus are males with 2 vehicles (121, accounting for 37.2%) and females with 2 vehicles (85, making up 38.9%).
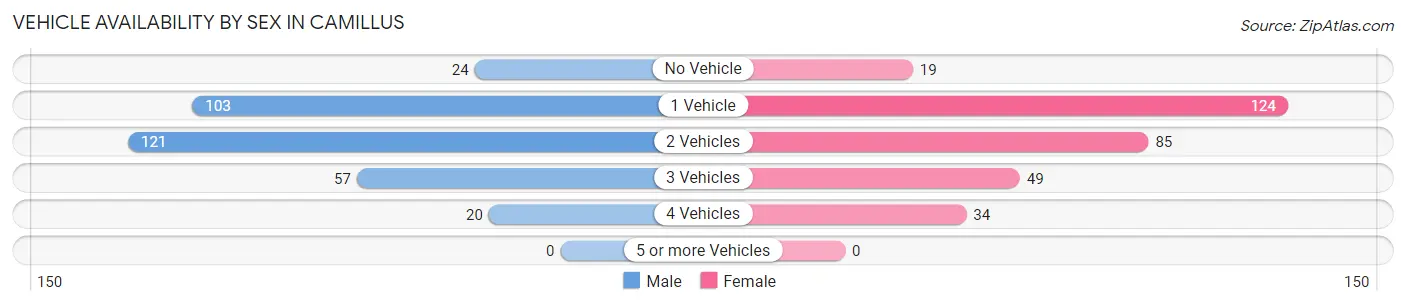
| Vehicles Available | Male | Female |
| No Vehicle | 24 (7.4%) | 19 (6.1%) |
| 1 Vehicle | 103 (31.7%) | 124 (39.9%) |
| 2 Vehicles | 121 (37.2%) | 85 (27.3%) |
| 3 Vehicles | 57 (17.5%) | 49 (15.8%) |
| 4 Vehicles | 20 (6.1%) | 34 (10.9%) |
| 5 or more Vehicles | 0 (0.0%) | 0 (0.0%) |
| Total | 325 (100.0%) | 311 (100.0%) |
Commute Time in Camillus
The most frequently occuring commute durations in Camillus are 20 to 24 minutes (166 commuters, 28.1%), 15 to 19 minutes (132 commuters, 22.3%), and 10 to 14 minutes (86 commuters, 14.5%).
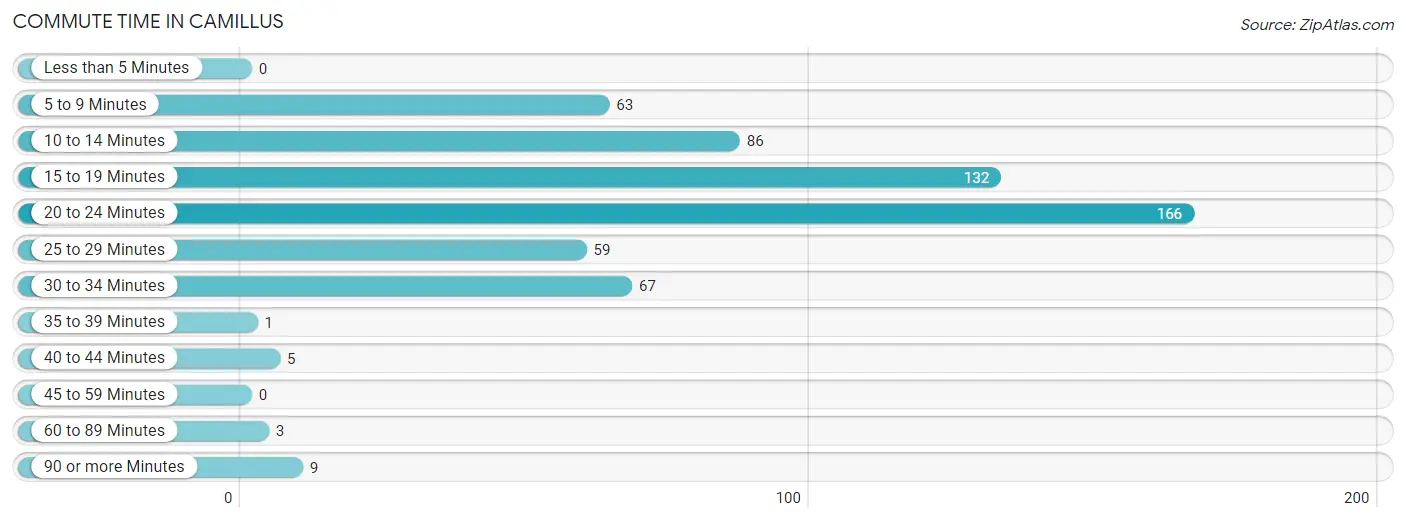
| Commute Time | # Commuters | % Commuters |
| Less than 5 Minutes | 0 | 0.0% |
| 5 to 9 Minutes | 63 | 10.7% |
| 10 to 14 Minutes | 86 | 14.5% |
| 15 to 19 Minutes | 132 | 22.3% |
| 20 to 24 Minutes | 166 | 28.1% |
| 25 to 29 Minutes | 59 | 10.0% |
| 30 to 34 Minutes | 67 | 11.3% |
| 35 to 39 Minutes | 1 | 0.2% |
| 40 to 44 Minutes | 5 | 0.9% |
| 45 to 59 Minutes | 0 | 0.0% |
| 60 to 89 Minutes | 3 | 0.5% |
| 90 or more Minutes | 9 | 1.5% |
Commute Time by Sex in Camillus
The most common commute times in Camillus are 15 to 19 minutes (86 commuters, 28.8%) for males and 20 to 24 minutes (88 commuters, 30.1%) for females.
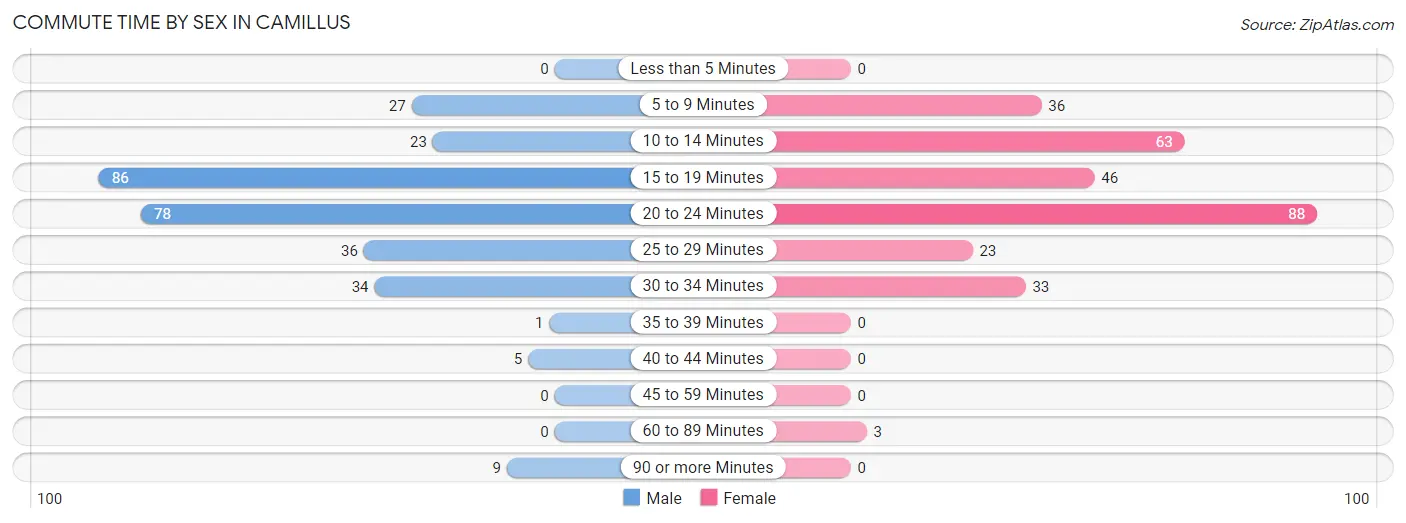
| Commute Time | Male | Female |
| Less than 5 Minutes | 0 (0.0%) | 0 (0.0%) |
| 5 to 9 Minutes | 27 (9.0%) | 36 (12.3%) |
| 10 to 14 Minutes | 23 (7.7%) | 63 (21.6%) |
| 15 to 19 Minutes | 86 (28.8%) | 46 (15.8%) |
| 20 to 24 Minutes | 78 (26.1%) | 88 (30.1%) |
| 25 to 29 Minutes | 36 (12.0%) | 23 (7.9%) |
| 30 to 34 Minutes | 34 (11.4%) | 33 (11.3%) |
| 35 to 39 Minutes | 1 (0.3%) | 0 (0.0%) |
| 40 to 44 Minutes | 5 (1.7%) | 0 (0.0%) |
| 45 to 59 Minutes | 0 (0.0%) | 0 (0.0%) |
| 60 to 89 Minutes | 0 (0.0%) | 3 (1.0%) |
| 90 or more Minutes | 9 (3.0%) | 0 (0.0%) |
Time of Departure to Work by Sex in Camillus
The most frequent times of departure to work in Camillus are 8:00 AM to 8:29 AM (81, 27.1%) for males and 7:30 AM to 7:59 AM (78, 26.7%) for females.
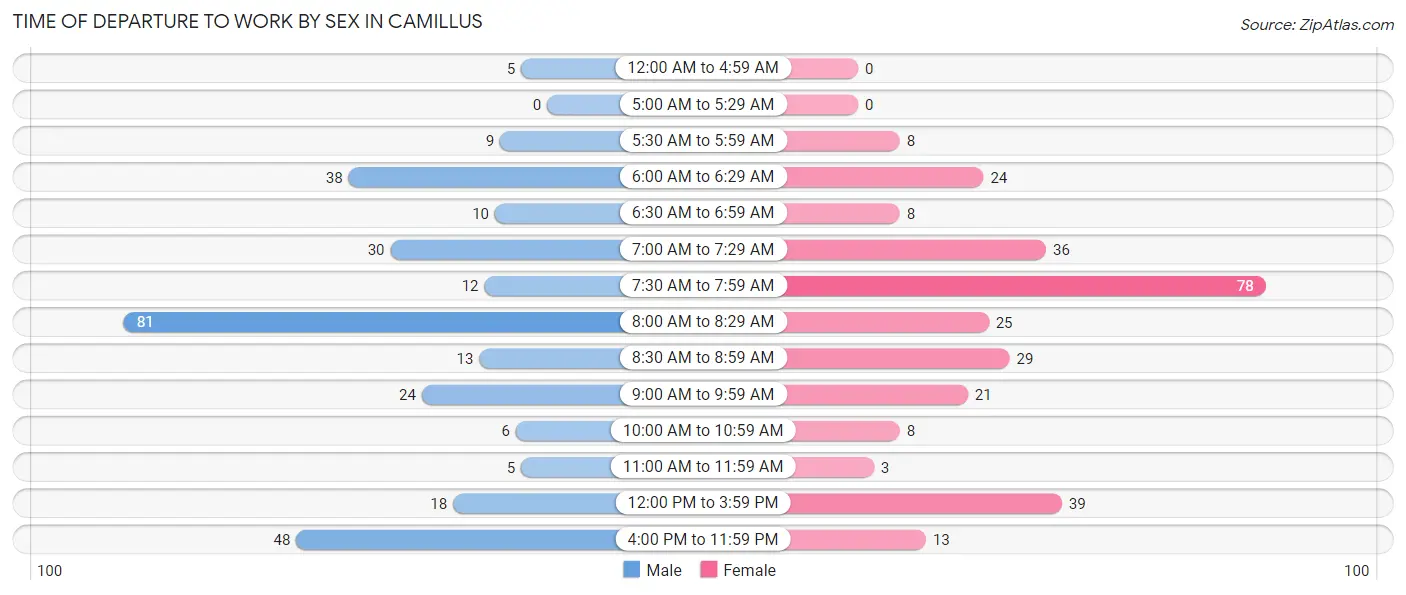
| Time of Departure | Male | Female |
| 12:00 AM to 4:59 AM | 5 (1.7%) | 0 (0.0%) |
| 5:00 AM to 5:29 AM | 0 (0.0%) | 0 (0.0%) |
| 5:30 AM to 5:59 AM | 9 (3.0%) | 8 (2.7%) |
| 6:00 AM to 6:29 AM | 38 (12.7%) | 24 (8.2%) |
| 6:30 AM to 6:59 AM | 10 (3.3%) | 8 (2.7%) |
| 7:00 AM to 7:29 AM | 30 (10.0%) | 36 (12.3%) |
| 7:30 AM to 7:59 AM | 12 (4.0%) | 78 (26.7%) |
| 8:00 AM to 8:29 AM | 81 (27.1%) | 25 (8.6%) |
| 8:30 AM to 8:59 AM | 13 (4.3%) | 29 (9.9%) |
| 9:00 AM to 9:59 AM | 24 (8.0%) | 21 (7.2%) |
| 10:00 AM to 10:59 AM | 6 (2.0%) | 8 (2.7%) |
| 11:00 AM to 11:59 AM | 5 (1.7%) | 3 (1.0%) |
| 12:00 PM to 3:59 PM | 18 (6.0%) | 39 (13.4%) |
| 4:00 PM to 11:59 PM | 48 (16.1%) | 13 (4.4%) |
| Total | 299 (100.0%) | 292 (100.0%) |
Housing Occupancy in Camillus
Occupancy by Ownership in Camillus
Of the total 703 dwellings in Camillus, owner-occupied units account for 367 (52.2%), while renter-occupied units make up 336 (47.8%).
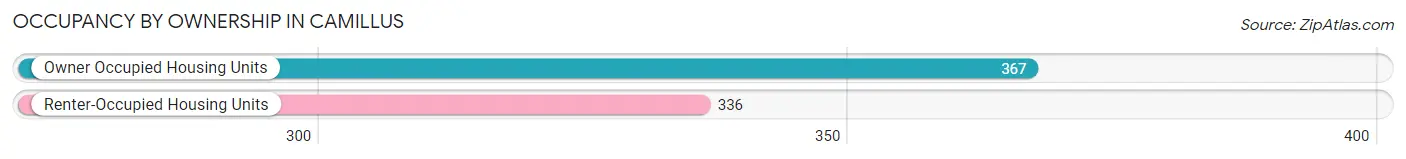
| Occupancy | # Housing Units | % Housing Units |
| Owner Occupied Housing Units | 367 | 52.2% |
| Renter-Occupied Housing Units | 336 | 47.8% |
| Total Occupied Housing Units | 703 | 100.0% |
Occupancy by Household Size in Camillus
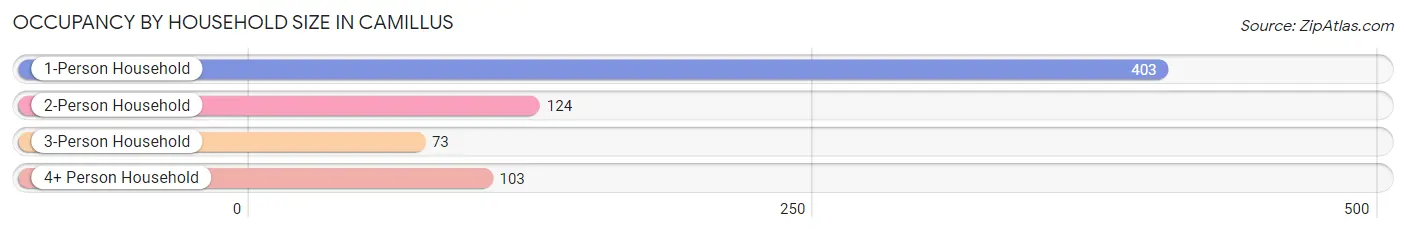
| Household Size | # Housing Units | % Housing Units |
| 1-Person Household | 403 | 57.3% |
| 2-Person Household | 124 | 17.6% |
| 3-Person Household | 73 | 10.4% |
| 4+ Person Household | 103 | 14.6% |
| Total Housing Units | 703 | 100.0% |
Occupancy by Ownership by Household Size in Camillus
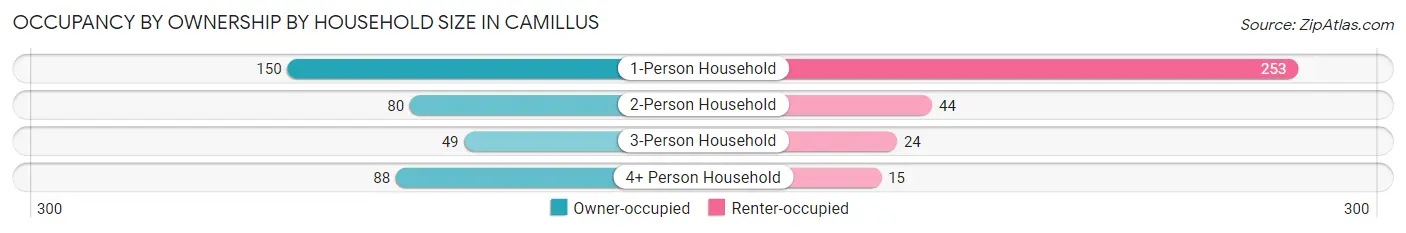
| Household Size | Owner-occupied | Renter-occupied |
| 1-Person Household | 150 (37.2%) | 253 (62.8%) |
| 2-Person Household | 80 (64.5%) | 44 (35.5%) |
| 3-Person Household | 49 (67.1%) | 24 (32.9%) |
| 4+ Person Household | 88 (85.4%) | 15 (14.6%) |
| Total Housing Units | 367 (52.2%) | 336 (47.8%) |
Occupancy by Educational Attainment in Camillus
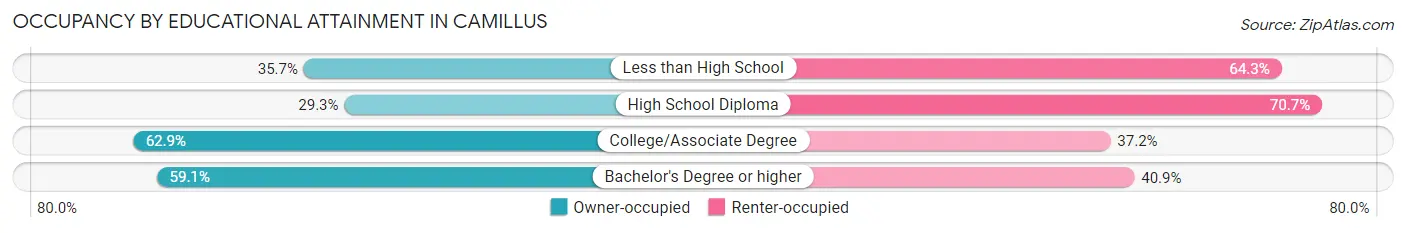
| Household Size | Owner-occupied | Renter-occupied |
| Less than High School | 10 (35.7%) | 18 (64.3%) |
| High School Diploma | 53 (29.3%) | 128 (70.7%) |
| College/Associate Degree | 203 (62.8%) | 120 (37.1%) |
| Bachelor's Degree or higher | 101 (59.1%) | 70 (40.9%) |
Occupancy by Age of Householder in Camillus
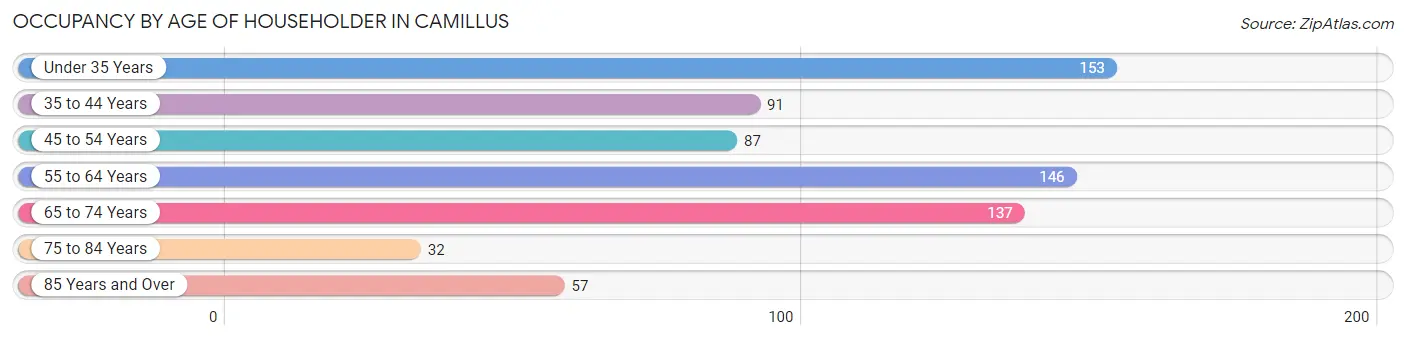
| Age Bracket | # Households | % Households |
| Under 35 Years | 153 | 21.8% |
| 35 to 44 Years | 91 | 12.9% |
| 45 to 54 Years | 87 | 12.4% |
| 55 to 64 Years | 146 | 20.8% |
| 65 to 74 Years | 137 | 19.5% |
| 75 to 84 Years | 32 | 4.5% |
| 85 Years and Over | 57 | 8.1% |
| Total | 703 | 100.0% |
Housing Finances in Camillus
Median Income by Occupancy in Camillus
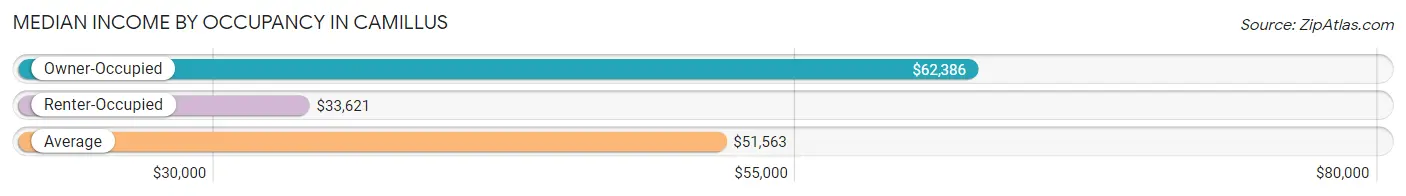
| Occupancy Type | # Households | Median Income |
| Owner-Occupied | 367 (52.2%) | $62,386 |
| Renter-Occupied | 336 (47.8%) | $33,621 |
| Average | 703 (100.0%) | $51,563 |
Occupancy by Householder Income Bracket in Camillus
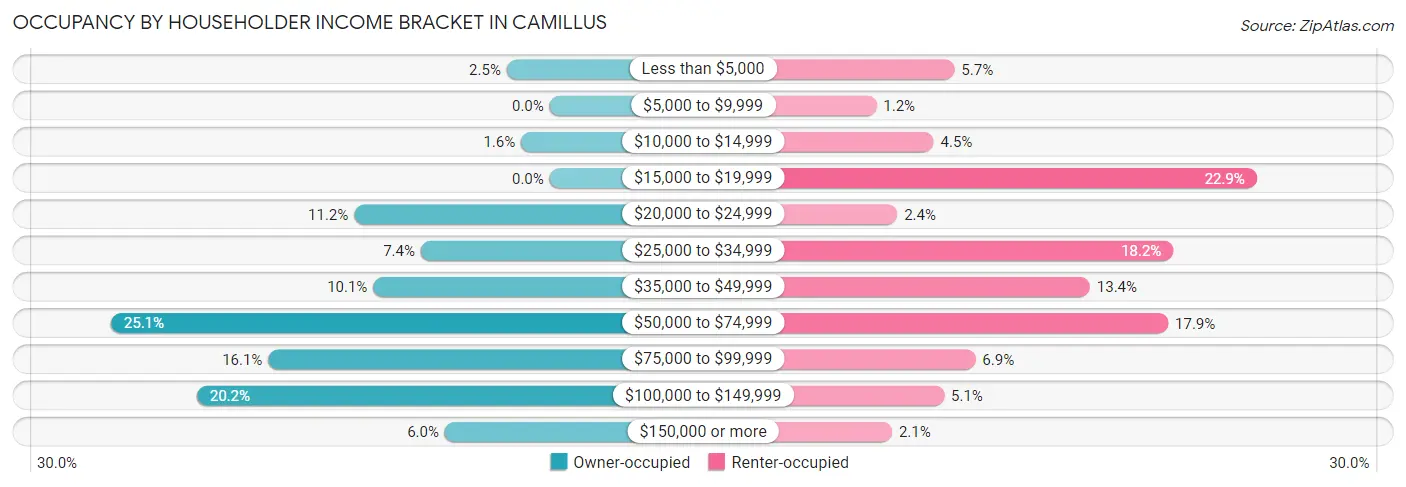
| Income Bracket | Owner-occupied | Renter-occupied |
| Less than $5,000 | 9 (2.5%) | 19 (5.7%) |
| $5,000 to $9,999 | 0 (0.0%) | 4 (1.2%) |
| $10,000 to $14,999 | 6 (1.6%) | 15 (4.5%) |
| $15,000 to $19,999 | 0 (0.0%) | 77 (22.9%) |
| $20,000 to $24,999 | 41 (11.2%) | 8 (2.4%) |
| $25,000 to $34,999 | 27 (7.4%) | 61 (18.1%) |
| $35,000 to $49,999 | 37 (10.1%) | 45 (13.4%) |
| $50,000 to $74,999 | 92 (25.1%) | 60 (17.9%) |
| $75,000 to $99,999 | 59 (16.1%) | 23 (6.9%) |
| $100,000 to $149,999 | 74 (20.2%) | 17 (5.1%) |
| $150,000 or more | 22 (6.0%) | 7 (2.1%) |
| Total | 367 (100.0%) | 336 (100.0%) |
Monthly Housing Cost Tiers in Camillus
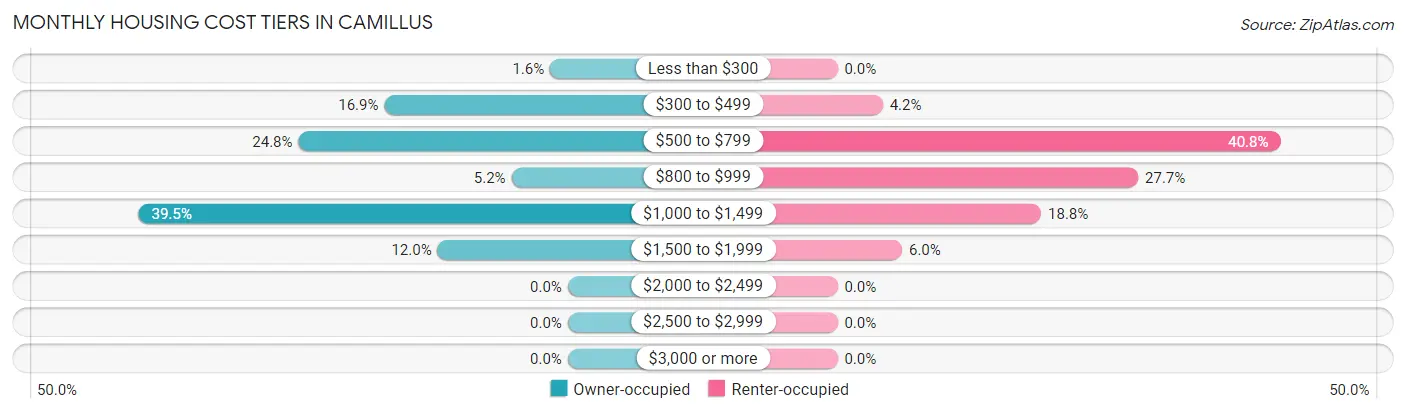
| Monthly Cost | Owner-occupied | Renter-occupied |
| Less than $300 | 6 (1.6%) | 0 (0.0%) |
| $300 to $499 | 62 (16.9%) | 14 (4.2%) |
| $500 to $799 | 91 (24.8%) | 137 (40.8%) |
| $800 to $999 | 19 (5.2%) | 93 (27.7%) |
| $1,000 to $1,499 | 145 (39.5%) | 63 (18.8%) |
| $1,500 to $1,999 | 44 (12.0%) | 20 (5.9%) |
| $2,000 to $2,499 | 0 (0.0%) | 0 (0.0%) |
| $2,500 to $2,999 | 0 (0.0%) | 0 (0.0%) |
| $3,000 or more | 0 (0.0%) | 0 (0.0%) |
| Total | 367 (100.0%) | 336 (100.0%) |
Physical Housing Characteristics in Camillus
Housing Structures in Camillus
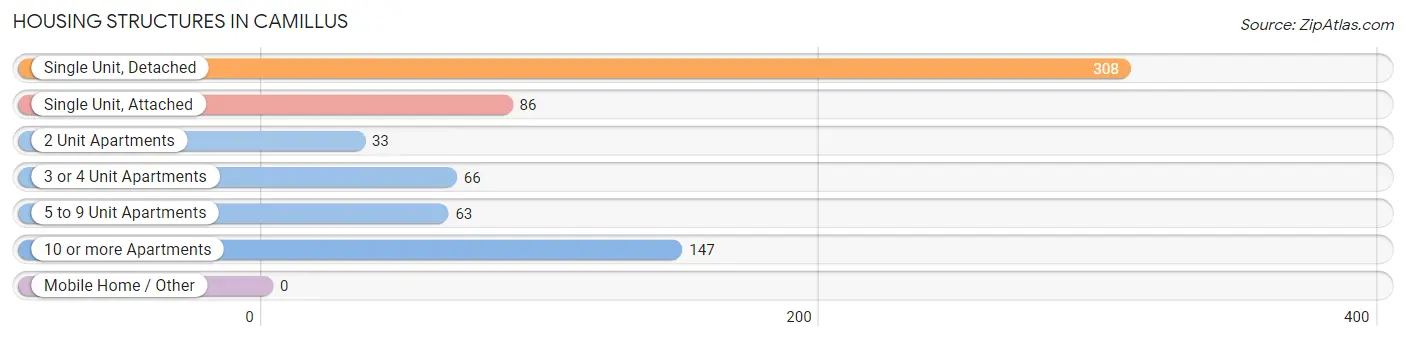
| Structure Type | # Housing Units | % Housing Units |
| Single Unit, Detached | 308 | 43.8% |
| Single Unit, Attached | 86 | 12.2% |
| 2 Unit Apartments | 33 | 4.7% |
| 3 or 4 Unit Apartments | 66 | 9.4% |
| 5 to 9 Unit Apartments | 63 | 9.0% |
| 10 or more Apartments | 147 | 20.9% |
| Mobile Home / Other | 0 | 0.0% |
| Total | 703 | 100.0% |
Housing Structures by Occupancy in Camillus
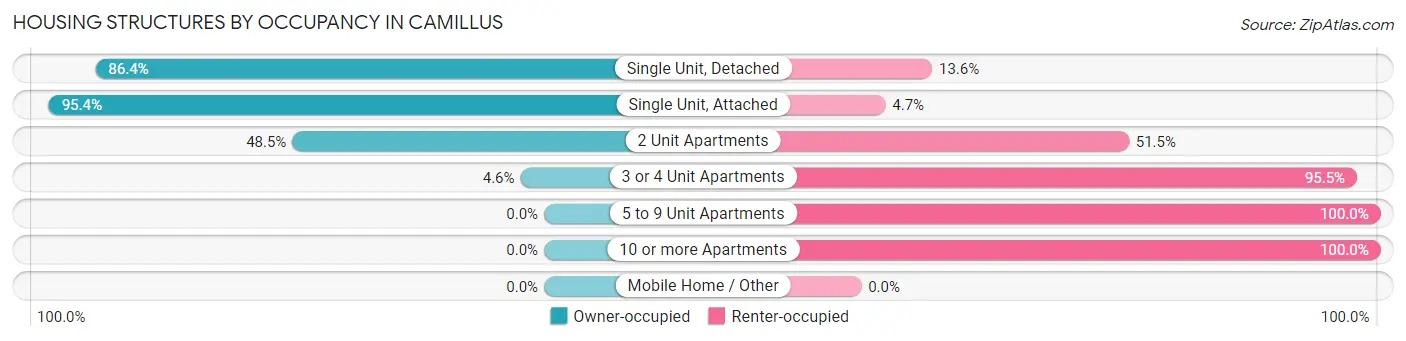
| Structure Type | Owner-occupied | Renter-occupied |
| Single Unit, Detached | 266 (86.4%) | 42 (13.6%) |
| Single Unit, Attached | 82 (95.4%) | 4 (4.6%) |
| 2 Unit Apartments | 16 (48.5%) | 17 (51.5%) |
| 3 or 4 Unit Apartments | 3 (4.5%) | 63 (95.5%) |
| 5 to 9 Unit Apartments | 0 (0.0%) | 63 (100.0%) |
| 10 or more Apartments | 0 (0.0%) | 147 (100.0%) |
| Mobile Home / Other | 0 (0.0%) | 0 (0.0%) |
| Total | 367 (52.2%) | 336 (47.8%) |
Housing Structures by Number of Rooms in Camillus
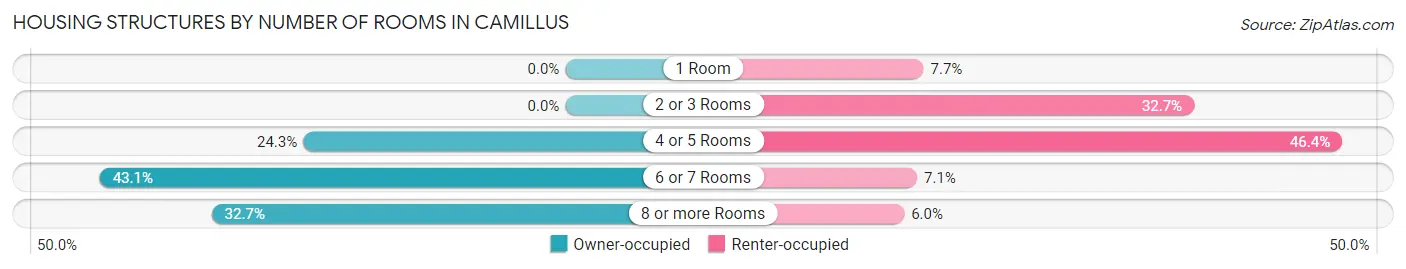
| Number of Rooms | Owner-occupied | Renter-occupied |
| 1 Room | 0 (0.0%) | 26 (7.7%) |
| 2 or 3 Rooms | 0 (0.0%) | 110 (32.7%) |
| 4 or 5 Rooms | 89 (24.2%) | 156 (46.4%) |
| 6 or 7 Rooms | 158 (43.0%) | 24 (7.1%) |
| 8 or more Rooms | 120 (32.7%) | 20 (5.9%) |
| Total | 367 (100.0%) | 336 (100.0%) |
Housing Structure by Heating Type in Camillus
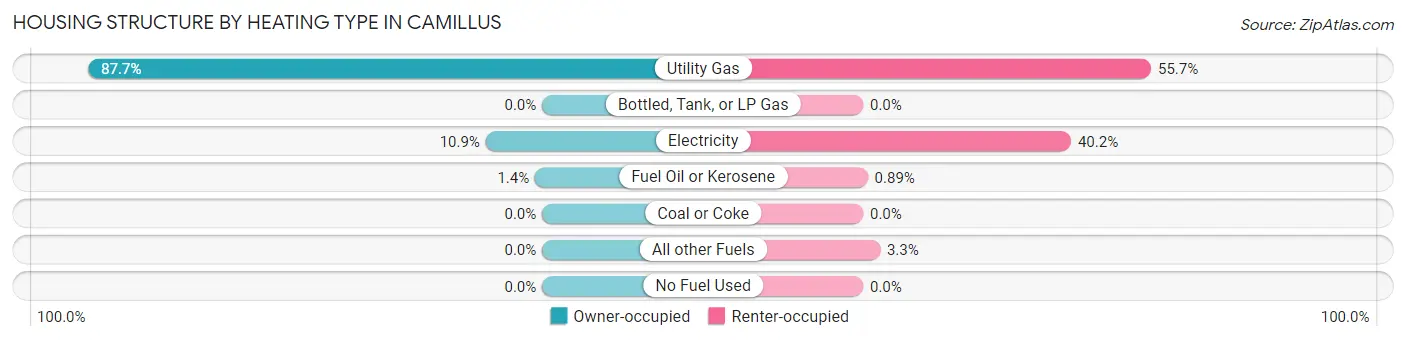
| Heating Type | Owner-occupied | Renter-occupied |
| Utility Gas | 322 (87.7%) | 187 (55.6%) |
| Bottled, Tank, or LP Gas | 0 (0.0%) | 0 (0.0%) |
| Electricity | 40 (10.9%) | 135 (40.2%) |
| Fuel Oil or Kerosene | 5 (1.4%) | 3 (0.9%) |
| Coal or Coke | 0 (0.0%) | 0 (0.0%) |
| All other Fuels | 0 (0.0%) | 11 (3.3%) |
| No Fuel Used | 0 (0.0%) | 0 (0.0%) |
| Total | 367 (100.0%) | 336 (100.0%) |
Household Vehicle Usage in Camillus
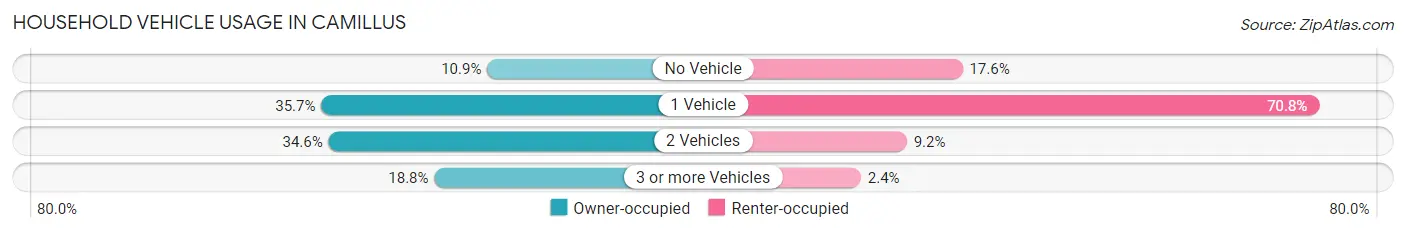
| Vehicles per Household | Owner-occupied | Renter-occupied |
| No Vehicle | 40 (10.9%) | 59 (17.6%) |
| 1 Vehicle | 131 (35.7%) | 238 (70.8%) |
| 2 Vehicles | 127 (34.6%) | 31 (9.2%) |
| 3 or more Vehicles | 69 (18.8%) | 8 (2.4%) |
| Total | 367 (100.0%) | 336 (100.0%) |
Real Estate & Mortgages in Camillus
Real Estate and Mortgage Overview in Camillus
| Characteristic | Without Mortgage | With Mortgage |
| Housing Units | 162 | 205 |
| Median Property Value | $148,400 | $117,600 |
| Median Household Income | $57,900 | $10 |
| Monthly Housing Costs | $607 | $0 |
| Real Estate Taxes | $3,022 | $4 |
Property Value by Mortgage Status in Camillus
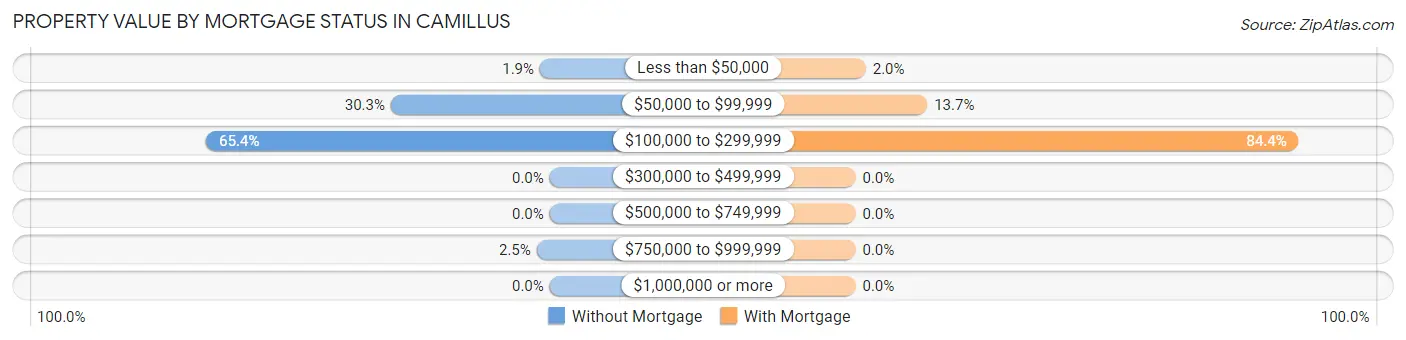
| Property Value | Without Mortgage | With Mortgage |
| Less than $50,000 | 3 (1.8%) | 4 (1.9%) |
| $50,000 to $99,999 | 49 (30.2%) | 28 (13.7%) |
| $100,000 to $299,999 | 106 (65.4%) | 173 (84.4%) |
| $300,000 to $499,999 | 0 (0.0%) | 0 (0.0%) |
| $500,000 to $749,999 | 0 (0.0%) | 0 (0.0%) |
| $750,000 to $999,999 | 4 (2.5%) | 0 (0.0%) |
| $1,000,000 or more | 0 (0.0%) | 0 (0.0%) |
| Total | 162 (100.0%) | 205 (100.0%) |
Household Income by Mortgage Status in Camillus
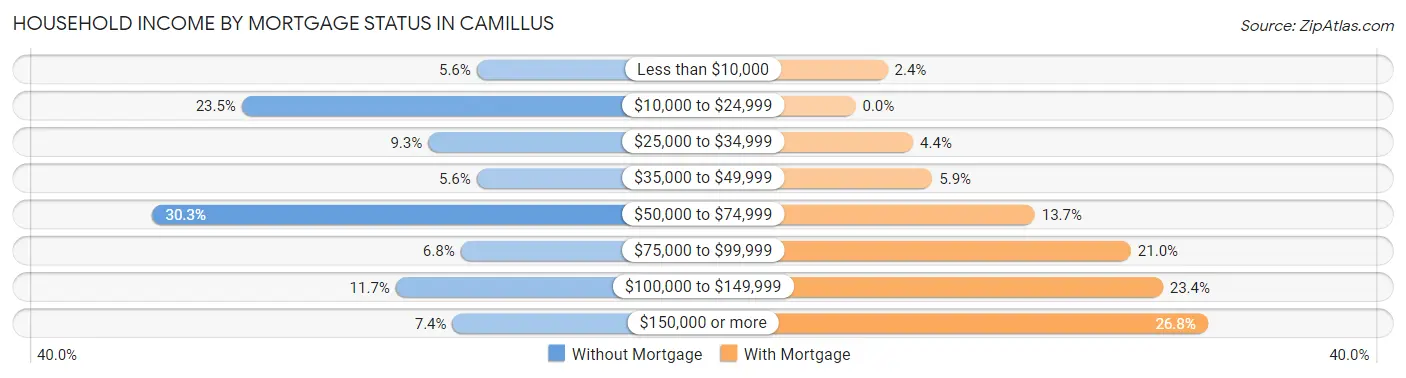
| Household Income | Without Mortgage | With Mortgage |
| Less than $10,000 | 9 (5.6%) | 5 (2.4%) |
| $10,000 to $24,999 | 38 (23.5%) | 0 (0.0%) |
| $25,000 to $34,999 | 15 (9.3%) | 9 (4.4%) |
| $35,000 to $49,999 | 9 (5.6%) | 12 (5.9%) |
| $50,000 to $74,999 | 49 (30.2%) | 28 (13.7%) |
| $75,000 to $99,999 | 11 (6.8%) | 43 (21.0%) |
| $100,000 to $149,999 | 19 (11.7%) | 48 (23.4%) |
| $150,000 or more | 12 (7.4%) | 55 (26.8%) |
| Total | 162 (100.0%) | 205 (100.0%) |
Property Value to Household Income Ratio in Camillus
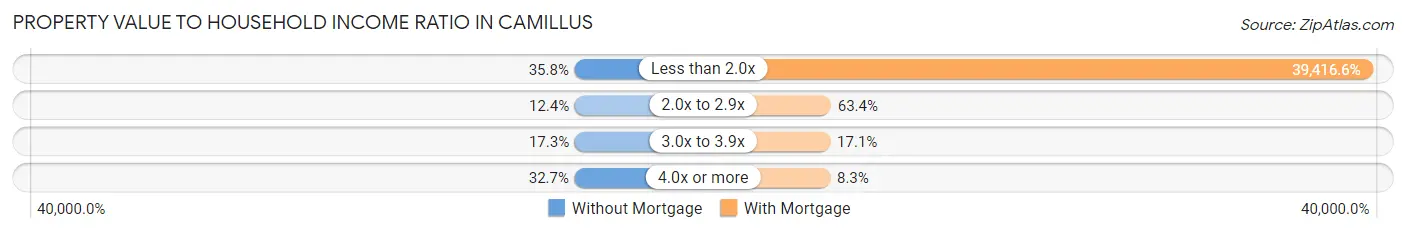
| Value-to-Income Ratio | Without Mortgage | With Mortgage |
| Less than 2.0x | 58 (35.8%) | 80,804 (39,416.6%) |
| 2.0x to 2.9x | 20 (12.3%) | 130 (63.4%) |
| 3.0x to 3.9x | 28 (17.3%) | 35 (17.1%) |
| 4.0x or more | 53 (32.7%) | 17 (8.3%) |
| Total | 162 (100.0%) | 205 (100.0%) |
Real Estate Taxes by Mortgage Status in Camillus
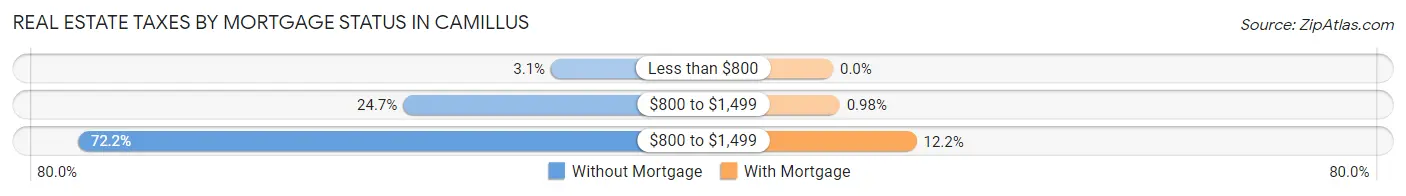
| Property Taxes | Without Mortgage | With Mortgage |
| Less than $800 | 5 (3.1%) | 0 (0.0%) |
| $800 to $1,499 | 40 (24.7%) | 2 (1.0%) |
| $800 to $1,499 | 117 (72.2%) | 25 (12.2%) |
| Total | 162 (100.0%) | 205 (100.0%) |
Health & Disability in Camillus
Health Insurance Coverage by Age in Camillus
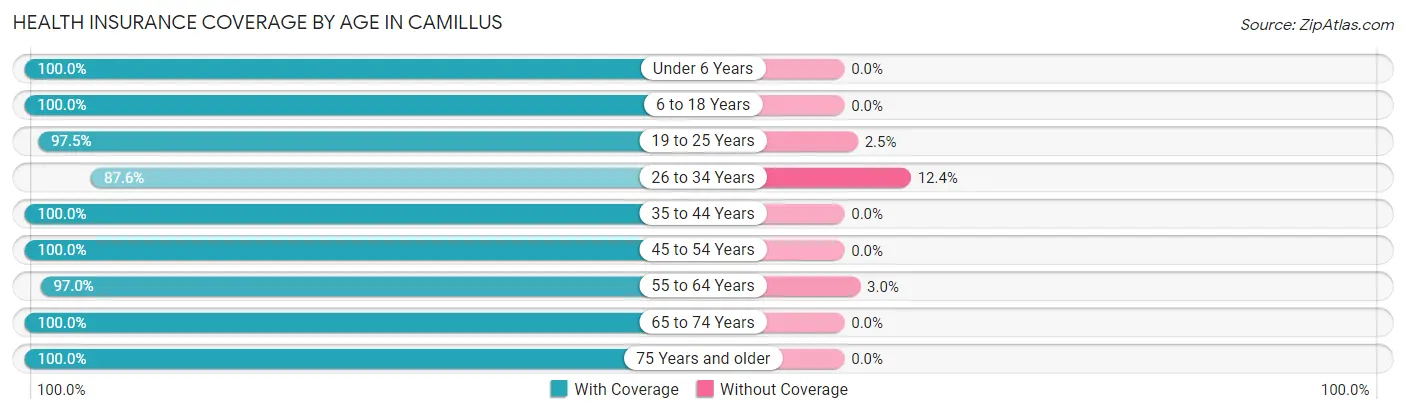
| Age Bracket | With Coverage | Without Coverage |
| Under 6 Years | 99 (100.0%) | 0 (0.0%) |
| 6 to 18 Years | 127 (100.0%) | 0 (0.0%) |
| 19 to 25 Years | 117 (97.5%) | 3 (2.5%) |
| 26 to 34 Years | 184 (87.6%) | 26 (12.4%) |
| 35 to 44 Years | 149 (100.0%) | 0 (0.0%) |
| 45 to 54 Years | 132 (100.0%) | 0 (0.0%) |
| 55 to 64 Years | 197 (97.0%) | 6 (3.0%) |
| 65 to 74 Years | 162 (100.0%) | 0 (0.0%) |
| 75 Years and older | 114 (100.0%) | 0 (0.0%) |
| Total | 1,281 (97.3%) | 35 (2.7%) |
Health Insurance Coverage by Citizenship Status in Camillus
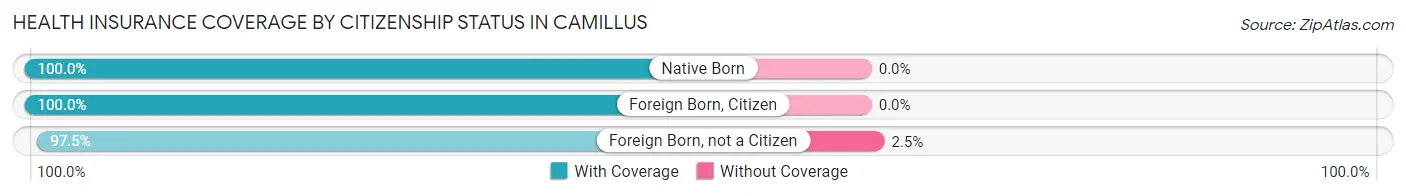
| Citizenship Status | With Coverage | Without Coverage |
| Native Born | 99 (100.0%) | 0 (0.0%) |
| Foreign Born, Citizen | 127 (100.0%) | 0 (0.0%) |
| Foreign Born, not a Citizen | 117 (97.5%) | 3 (2.5%) |
Health Insurance Coverage by Household Income in Camillus
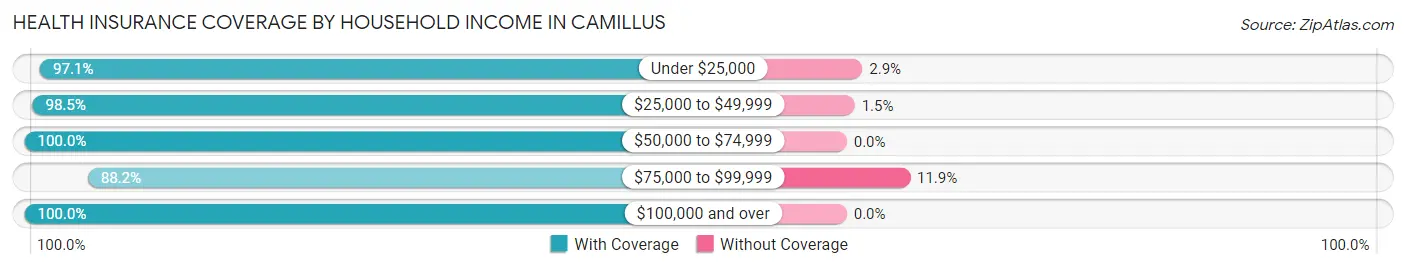
| Household Income | With Coverage | Without Coverage |
| Under $25,000 | 200 (97.1%) | 6 (2.9%) |
| $25,000 to $49,999 | 264 (98.5%) | 4 (1.5%) |
| $50,000 to $74,999 | 294 (100.0%) | 0 (0.0%) |
| $75,000 to $99,999 | 186 (88.1%) | 25 (11.8%) |
| $100,000 and over | 328 (100.0%) | 0 (0.0%) |
Public vs Private Health Insurance Coverage by Age in Camillus
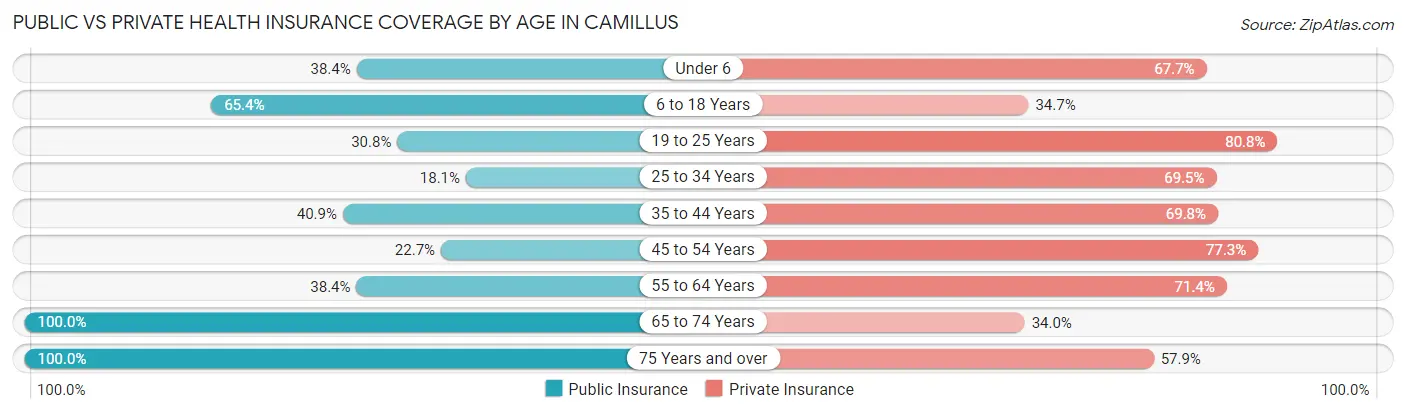
| Age Bracket | Public Insurance | Private Insurance |
| Under 6 | 38 (38.4%) | 67 (67.7%) |
| 6 to 18 Years | 83 (65.3%) | 44 (34.6%) |
| 19 to 25 Years | 37 (30.8%) | 97 (80.8%) |
| 25 to 34 Years | 38 (18.1%) | 146 (69.5%) |
| 35 to 44 Years | 61 (40.9%) | 104 (69.8%) |
| 45 to 54 Years | 30 (22.7%) | 102 (77.3%) |
| 55 to 64 Years | 78 (38.4%) | 145 (71.4%) |
| 65 to 74 Years | 162 (100.0%) | 55 (34.0%) |
| 75 Years and over | 114 (100.0%) | 66 (57.9%) |
| Total | 641 (48.7%) | 826 (62.8%) |
Disability Status by Sex by Age in Camillus
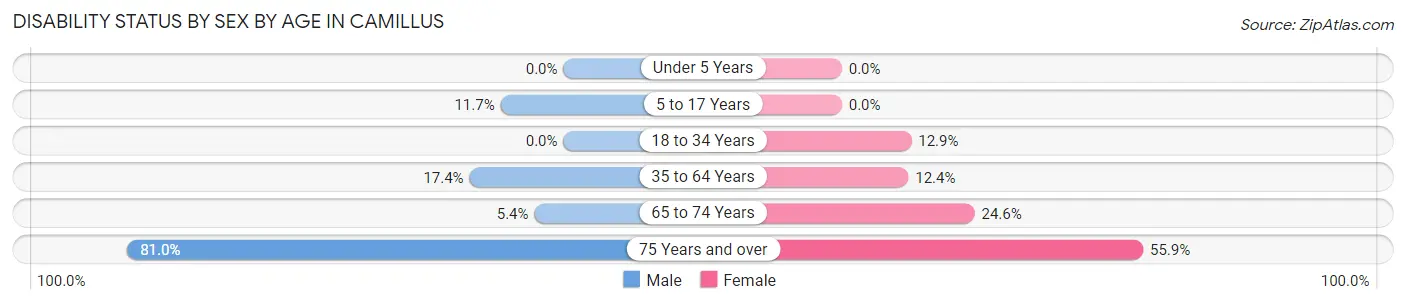
| Age Bracket | Male | Female |
| Under 5 Years | 0 (0.0%) | 0 (0.0%) |
| 5 to 17 Years | 7 (11.7%) | 0 (0.0%) |
| 18 to 34 Years | 0 (0.0%) | 24 (12.9%) |
| 35 to 64 Years | 42 (17.4%) | 30 (12.3%) |
| 65 to 74 Years | 5 (5.4%) | 17 (24.6%) |
| 75 Years and over | 17 (80.9%) | 52 (55.9%) |
Disability Class by Sex by Age in Camillus
Disability Class: Hearing Difficulty
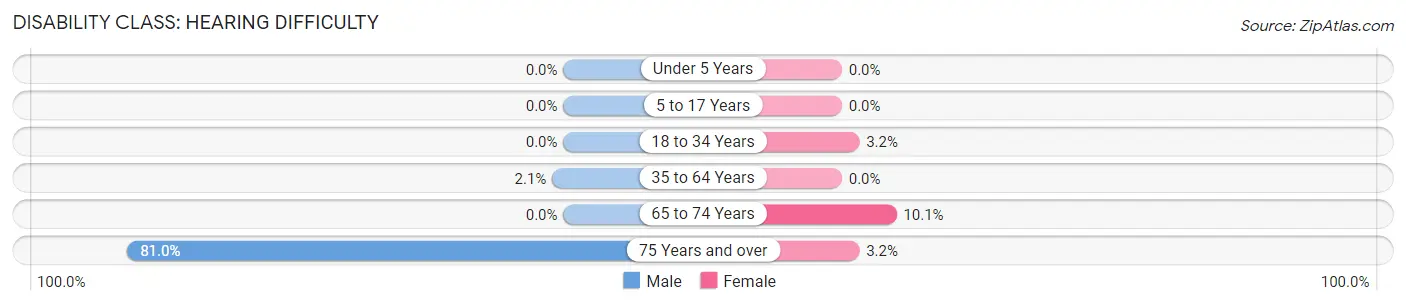
| Age Bracket | Male | Female |
| Under 5 Years | 0 (0.0%) | 0 (0.0%) |
| 5 to 17 Years | 0 (0.0%) | 0 (0.0%) |
| 18 to 34 Years | 0 (0.0%) | 6 (3.2%) |
| 35 to 64 Years | 5 (2.1%) | 0 (0.0%) |
| 65 to 74 Years | 0 (0.0%) | 7 (10.1%) |
| 75 Years and over | 17 (80.9%) | 3 (3.2%) |
Disability Class: Vision Difficulty
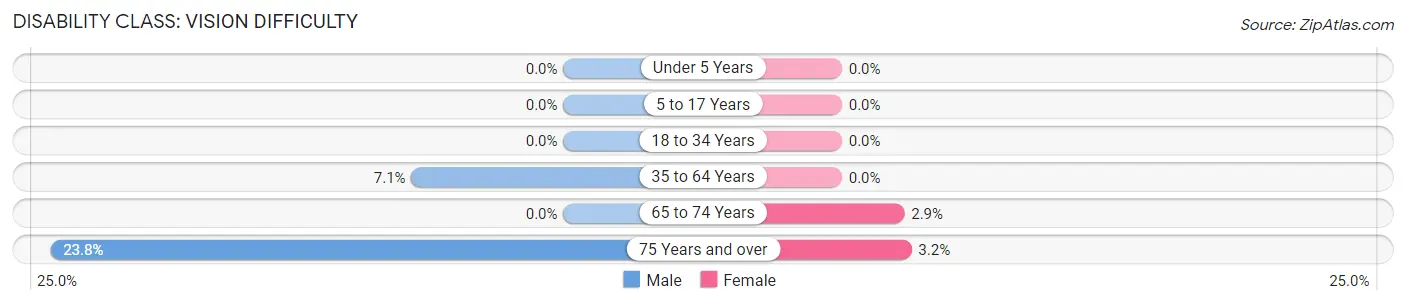
| Age Bracket | Male | Female |
| Under 5 Years | 0 (0.0%) | 0 (0.0%) |
| 5 to 17 Years | 0 (0.0%) | 0 (0.0%) |
| 18 to 34 Years | 0 (0.0%) | 0 (0.0%) |
| 35 to 64 Years | 17 (7.0%) | 0 (0.0%) |
| 65 to 74 Years | 0 (0.0%) | 2 (2.9%) |
| 75 Years and over | 5 (23.8%) | 3 (3.2%) |
Disability Class: Cognitive Difficulty
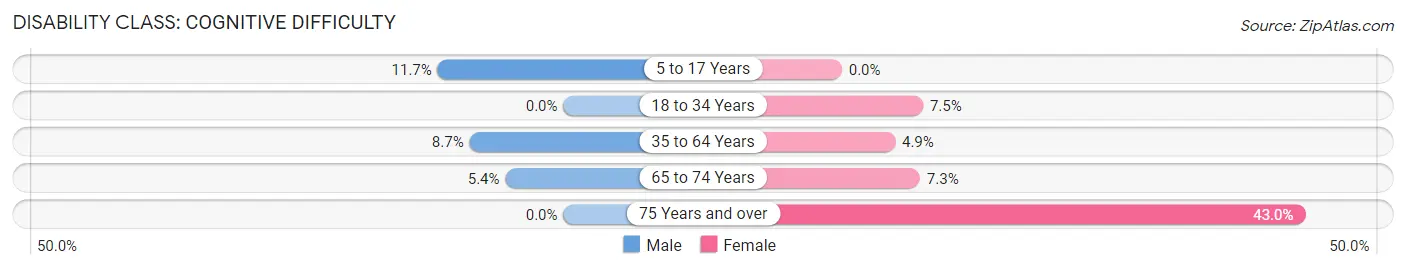
| Age Bracket | Male | Female |
| 5 to 17 Years | 7 (11.7%) | 0 (0.0%) |
| 18 to 34 Years | 0 (0.0%) | 14 (7.5%) |
| 35 to 64 Years | 21 (8.7%) | 12 (4.9%) |
| 65 to 74 Years | 5 (5.4%) | 5 (7.2%) |
| 75 Years and over | 0 (0.0%) | 40 (43.0%) |
Disability Class: Ambulatory Difficulty
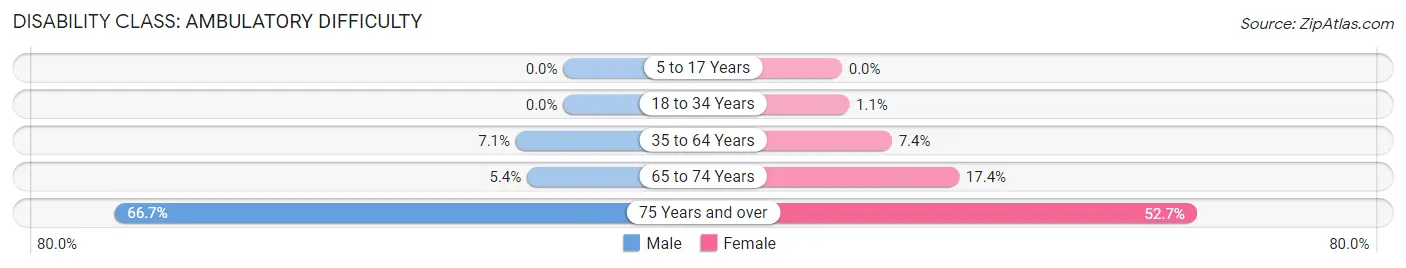
| Age Bracket | Male | Female |
| 5 to 17 Years | 0 (0.0%) | 0 (0.0%) |
| 18 to 34 Years | 0 (0.0%) | 2 (1.1%) |
| 35 to 64 Years | 17 (7.0%) | 18 (7.4%) |
| 65 to 74 Years | 5 (5.4%) | 12 (17.4%) |
| 75 Years and over | 14 (66.7%) | 49 (52.7%) |
Disability Class: Self-Care Difficulty
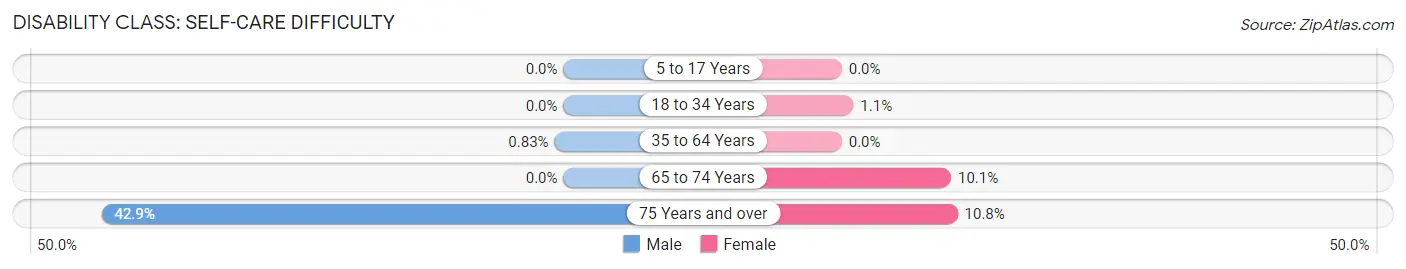
| Age Bracket | Male | Female |
| 5 to 17 Years | 0 (0.0%) | 0 (0.0%) |
| 18 to 34 Years | 0 (0.0%) | 2 (1.1%) |
| 35 to 64 Years | 2 (0.8%) | 0 (0.0%) |
| 65 to 74 Years | 0 (0.0%) | 7 (10.1%) |
| 75 Years and over | 9 (42.9%) | 10 (10.7%) |
Technology Access in Camillus
Computing Device Access in Camillus
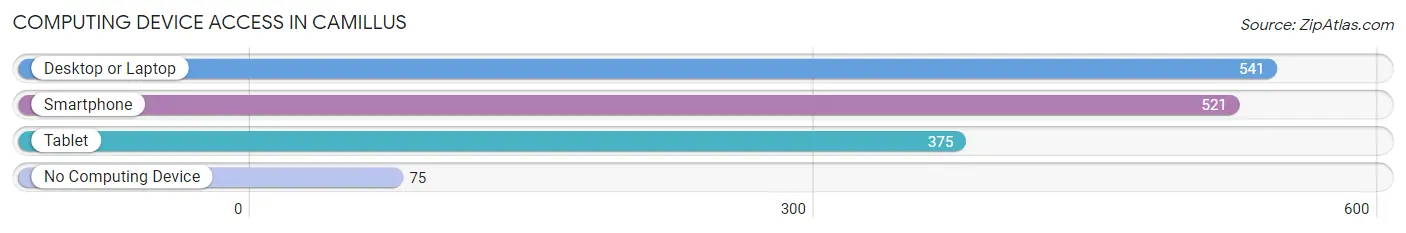
| Device Type | # Households | % Households |
| Desktop or Laptop | 541 | 77.0% |
| Smartphone | 521 | 74.1% |
| Tablet | 375 | 53.3% |
| No Computing Device | 75 | 10.7% |
| Total | 703 | 100.0% |
Internet Access in Camillus
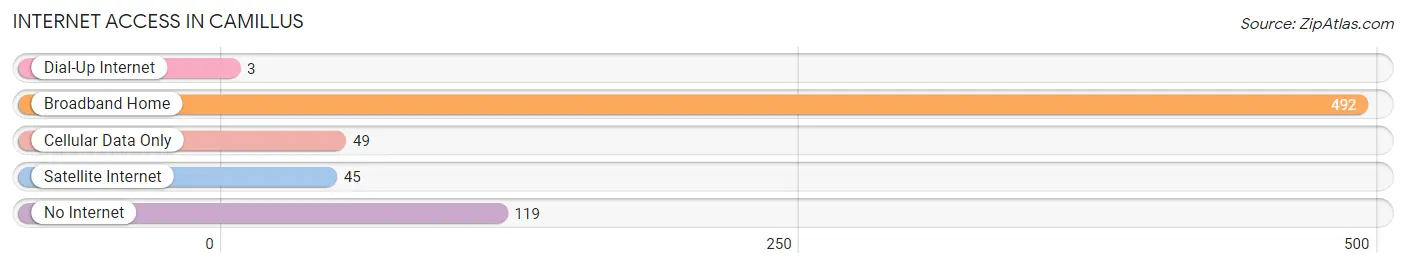
| Internet Type | # Households | % Households |
| Dial-Up Internet | 3 | 0.4% |
| Broadband Home | 492 | 70.0% |
| Cellular Data Only | 49 | 7.0% |
| Satellite Internet | 45 | 6.4% |
| No Internet | 119 | 16.9% |
| Total | 703 | 100.0% |
Camillus Summary
Camillus, NY is a town located in Onondaga County, New York, United States. The population was 24,167 at the 2010 census. The town is named after Roman military leader Marcus Furius Camillus.
History
The area that is now Camillus was first settled in 1790 by a group of Revolutionary War veterans led by Captain John McHarrie. The town was officially established in 1799 and was named after Roman military leader Marcus Furius Camillus.
The town was originally part of the Central New York Military Tract, which was set aside by the state of New York to provide land for veterans of the Revolutionary War. The town was also home to a large number of mills and factories, which provided employment for many of the town's residents.
In the late 19th century, the town was home to a large number of immigrants, mostly from Ireland and Italy. The immigrants brought with them their own culture and traditions, which still influence the town today.
Geography
Camillus is located in the western part of Onondaga County, New York. It is bordered by the towns of Elbridge to the north, Marcellus to the east, Geddes to the south, and Van Buren to the west.
The town is located in the Finger Lakes region of New York and is home to several small lakes, including Skaneateles Lake, Otisco Lake, and Onondaga Lake. The town is also home to several parks, including Camillus Park, which is located on the shores of Skaneateles Lake.
Economy
The economy of Camillus is largely based on manufacturing and retail. The town is home to several large manufacturing companies, including Carrier Corporation, which produces air conditioners and other heating and cooling products. The town is also home to several retail stores, including Walmart, Target, and Lowe's.
The town is also home to several small businesses, including restaurants, bars, and other local businesses. The town is also home to several educational institutions, including Onondaga Community College and Syracuse University.
Demographics
As of the 2010 census, the population of Camillus was 24,167. The racial makeup of the town was 94.3% White, 2.2% African American, 0.4% Native American, 1.2% Asian, 0.1% Pacific Islander, 0.7% from other races, and 1.1% from two or more races. Hispanic or Latino of any race were 2.7% of the population.
The median income for a household in the town was $50,945, and the median income for a family was $60,945. The per capita income for the town was $25,945. About 5.2% of families and 7.2% of the population were below the poverty line, including 8.3% of those under age 18 and 5.2% of those age 65 or over.
Camillus is a diverse town with a rich history and a vibrant economy. The town is home to several large manufacturing companies, as well as several small businesses and educational institutions. The town is also home to several parks and lakes, making it a great place to live and visit.
Common Questions
What is Per Capita Income in Camillus?
Per Capita income in Camillus is $31,564.
What is the Median Family Income in Camillus?
Median Family Income in Camillus is $68,750.
What is the Median Household income in Camillus?
Median Household Income in Camillus is $51,563.
What is Income or Wage Gap in Camillus?
Income or Wage Gap in Camillus is 0.5%.
Women in Camillus earn 99.5 cents for every dollar earned by a man.
What is Inequality or Gini Index in Camillus?
Inequality or Gini Index in Camillus is 0.39.
What is the Total Population of Camillus?
Total Population of Camillus is 1,316.
What is the Total Male Population of Camillus?
Total Male Population of Camillus is 609.
What is the Total Female Population of Camillus?
Total Female Population of Camillus is 707.
What is the Ratio of Males per 100 Females in Camillus?
There are 86.14 Males per 100 Females in Camillus.
What is the Ratio of Females per 100 Males in Camillus?
There are 116.09 Females per 100 Males in Camillus.
What is the Median Population Age in Camillus?
Median Population Age in Camillus is 41.0 Years.
What is the Average Family Size in Camillus
Average Family Size in Camillus is 3.1 People.
What is the Average Household Size in Camillus
Average Household Size in Camillus is 1.9 People.
How Large is the Labor Force in Camillus?
There are 693 People in the Labor Forcein in Camillus.
What is the Percentage of People in the Labor Force in Camillus?
62.2% of People are in the Labor Force in Camillus.
What is the Unemployment Rate in Camillus?
Unemployment Rate in Camillus is 6.8%.