Camden, NY Map & Demographics
Camden Map
Camden Overview
$29,866
PER CAPITA INCOME
$82,321
AVG FAMILY INCOME
$65,000
AVG HOUSEHOLD INCOME
13.7%
WAGE / INCOME GAP [ % ]
86.3¢/ $1
WAGE / INCOME GAP [ $ ]
0.38
INEQUALITY / GINI INDEX
2,578
TOTAL POPULATION
1,246
MALE POPULATION
1,332
FEMALE POPULATION
93.54
MALES / 100 FEMALES
106.90
FEMALES / 100 MALES
39.3
MEDIAN AGE
3.1
AVG FAMILY SIZE
2.4
AVG HOUSEHOLD SIZE
1,127
LABOR FORCE [ PEOPLE ]
58.6%
PERCENT IN LABOR FORCE
2.2%
UNEMPLOYMENT RATE
Camden Zip Codes
Camden Area Codes
Income in Camden
Income Overview in Camden
Per Capita Income in Camden is $29,866, while median incomes of families and households are $82,321 and $65,000 respectively.
| Characteristic | Number | Measure |
| Per Capita Income | 2,578 | $29,866 |
| Median Family Income | 625 | $82,321 |
| Mean Family Income | 625 | $92,133 |
| Median Household Income | 1,036 | $65,000 |
| Mean Household Income | 1,036 | $72,809 |
| Income Deficit | 625 | $0 |
| Wage / Income Gap (%) | 2,578 | 13.73% |
| Wage / Income Gap ($) | 2,578 | 86.27¢ per $1 |
| Gini / Inequality Index | 2,578 | 0.38 |
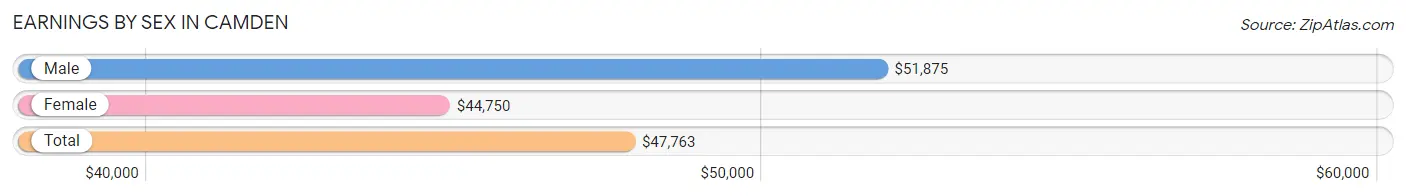
Earnings by Sex in Camden
Average Earnings in Camden are $47,763, $51,875 for men and $44,750 for women, a difference of 13.7%.
| Sex | Number | Average Earnings |
| Male | 552 (47.7%) | $51,875 |
| Female | 606 (52.3%) | $44,750 |
| Total | 1,158 (100.0%) | $47,763 |
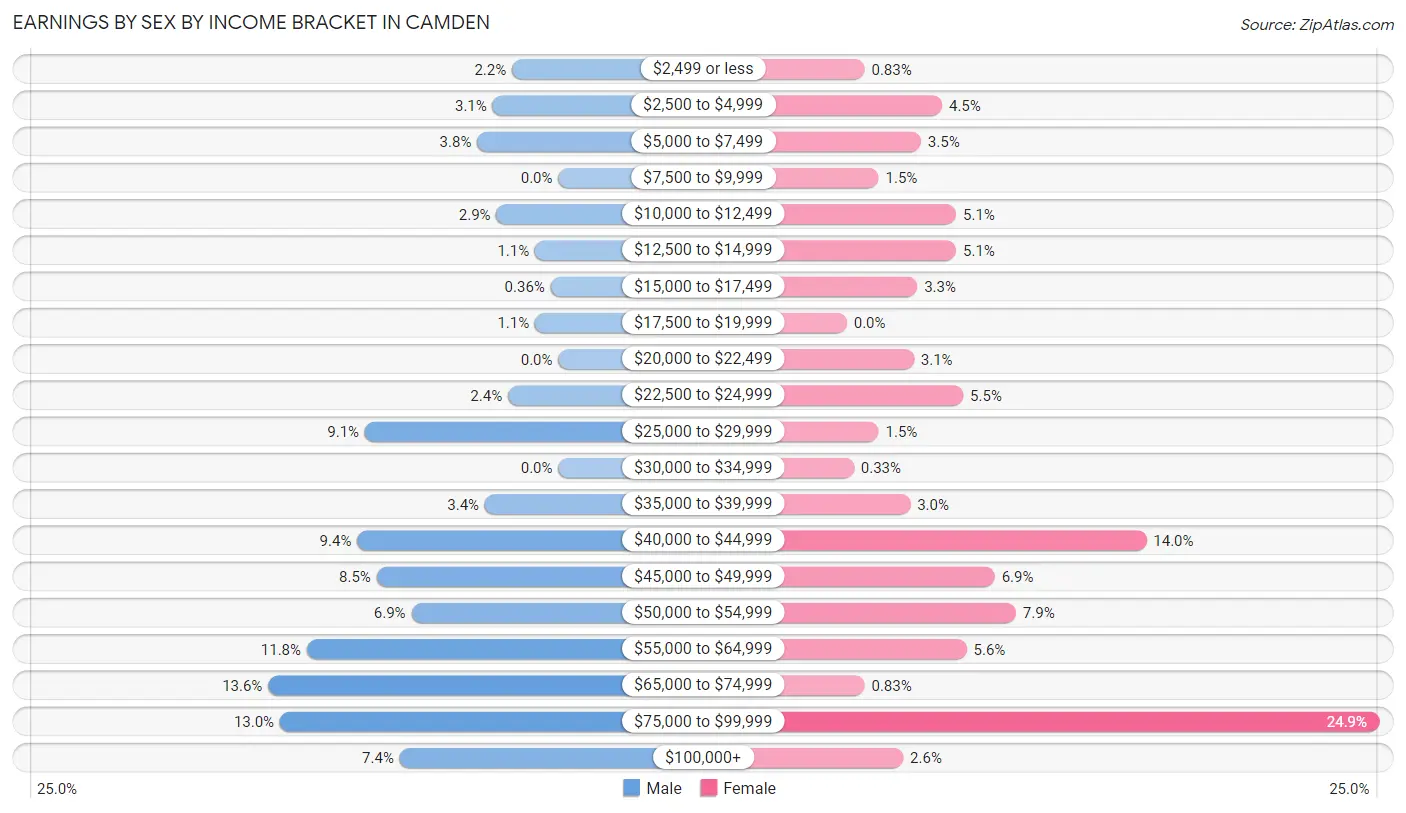
Earnings by Sex by Income Bracket in Camden
The most common earnings brackets in Camden are $65,000 to $74,999 for men (75 | 13.6%) and $75,000 to $99,999 for women (151 | 24.9%).
| Income | Male | Female |
| $2,499 or less | 12 (2.2%) | 5 (0.8%) |
| $2,500 to $4,999 | 17 (3.1%) | 27 (4.5%) |
| $5,000 to $7,499 | 21 (3.8%) | 21 (3.5%) |
| $7,500 to $9,999 | 0 (0.0%) | 9 (1.5%) |
| $10,000 to $12,499 | 16 (2.9%) | 31 (5.1%) |
| $12,500 to $14,999 | 6 (1.1%) | 31 (5.1%) |
| $15,000 to $17,499 | 2 (0.4%) | 20 (3.3%) |
| $17,500 to $19,999 | 6 (1.1%) | 0 (0.0%) |
| $20,000 to $22,499 | 0 (0.0%) | 19 (3.1%) |
| $22,500 to $24,999 | 13 (2.4%) | 33 (5.4%) |
| $25,000 to $29,999 | 50 (9.1%) | 9 (1.5%) |
| $30,000 to $34,999 | 0 (0.0%) | 2 (0.3%) |
| $35,000 to $39,999 | 19 (3.4%) | 18 (3.0%) |
| $40,000 to $44,999 | 52 (9.4%) | 85 (14.0%) |
| $45,000 to $49,999 | 47 (8.5%) | 42 (6.9%) |
| $50,000 to $54,999 | 38 (6.9%) | 48 (7.9%) |
| $55,000 to $64,999 | 65 (11.8%) | 34 (5.6%) |
| $65,000 to $74,999 | 75 (13.6%) | 5 (0.8%) |
| $75,000 to $99,999 | 72 (13.0%) | 151 (24.9%) |
| $100,000+ | 41 (7.4%) | 16 (2.6%) |
| Total | 552 (100.0%) | 606 (100.0%) |
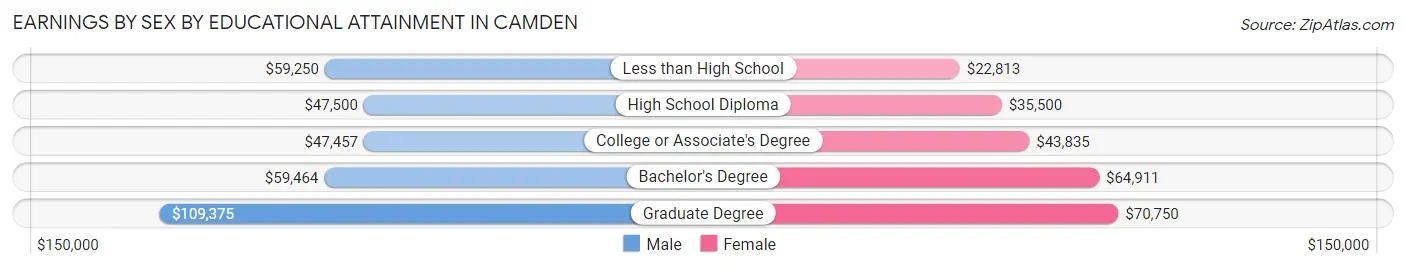
Earnings by Sex by Educational Attainment in Camden
Average earnings in Camden are $54,514 for men and $48,365 for women, a difference of 11.3%. Men with an educational attainment of graduate degree enjoy the highest average annual earnings of $109,375, while those with college or associate's degree education earn the least with $47,457. Women with an educational attainment of graduate degree earn the most with the average annual earnings of $70,750, while those with less than high school education have the smallest earnings of $22,813.
| Educational Attainment | Male Income | Female Income |
| Less than High School | $59,250 | $22,813 |
| High School Diploma | $47,500 | $35,500 |
| College or Associate's Degree | $47,457 | $43,835 |
| Bachelor's Degree | $59,464 | $64,911 |
| Graduate Degree | $109,375 | $70,750 |
| Total | $54,514 | $48,365 |
Family Income in Camden
Family Income Brackets in Camden
According to the Camden family income data, there are 189 families falling into the $75,000 to $99,999 income range, which is the most common income bracket and makes up 30.2% of all families.
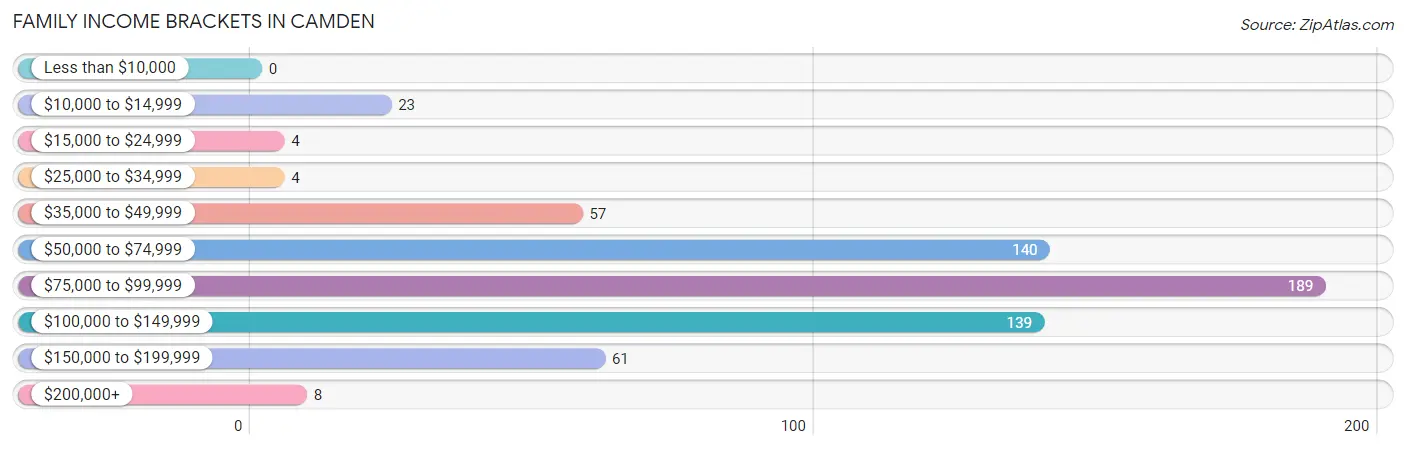
| Income Bracket | # Families | % Families |
| Less than $10,000 | 0 | 0.0% |
| $10,000 to $14,999 | 23 | 3.7% |
| $15,000 to $24,999 | 4 | 0.6% |
| $25,000 to $34,999 | 4 | 0.6% |
| $35,000 to $49,999 | 57 | 9.1% |
| $50,000 to $74,999 | 140 | 22.4% |
| $75,000 to $99,999 | 189 | 30.2% |
| $100,000 to $149,999 | 139 | 22.2% |
| $150,000 to $199,999 | 61 | 9.8% |
| $200,000+ | 8 | 1.3% |
Family Income by Famaliy Size in Camden
4-person families (88 | 14.1%) account for the highest median family income in Camden with $143,214 per family, while 4-person families (88 | 14.1%) have the highest median income of $35,804 per family member.
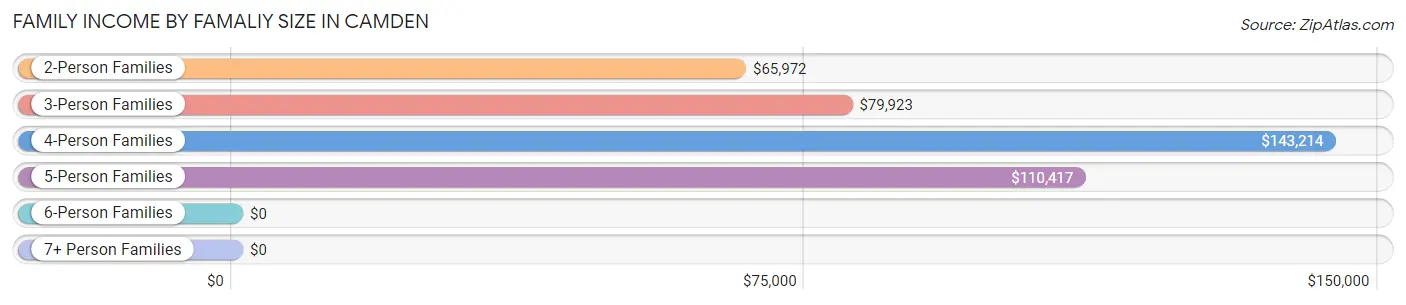
| Income Bracket | # Families | Median Income |
| 2-Person Families | 259 (41.4%) | $65,972 |
| 3-Person Families | 193 (30.9%) | $79,923 |
| 4-Person Families | 88 (14.1%) | $143,214 |
| 5-Person Families | 59 (9.4%) | $110,417 |
| 6-Person Families | 21 (3.4%) | $0 |
| 7+ Person Families | 5 (0.8%) | $0 |
| Total | 625 (100.0%) | $82,321 |
Family Income by Number of Earners in Camden
The median family income in Camden is $82,321, with families comprising 3+ earners (46) having the highest median family income of $143,214, while families with no earners (56) have the lowest median family income of $61,250, accounting for 7.4% and 9.0% of families, respectively.
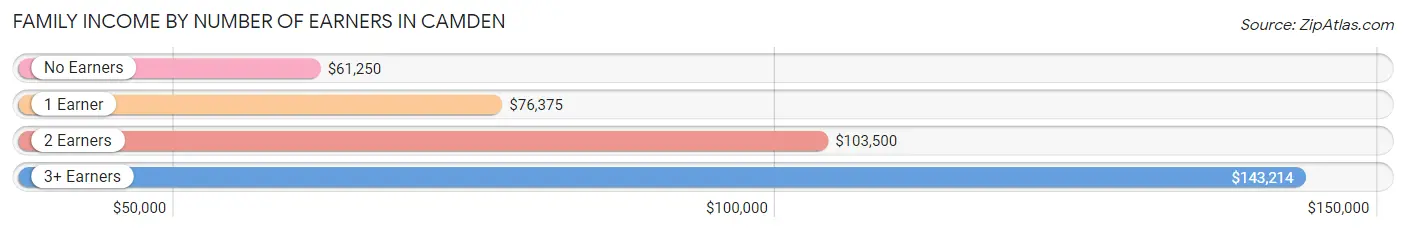
| Number of Earners | # Families | Median Income |
| No Earners | 56 (9.0%) | $61,250 |
| 1 Earner | 257 (41.1%) | $76,375 |
| 2 Earners | 266 (42.6%) | $103,500 |
| 3+ Earners | 46 (7.4%) | $143,214 |
| Total | 625 (100.0%) | $82,321 |
Household Income in Camden
Household Income Brackets in Camden
With 199 households falling in the category, the $100,000 to $149,999 income range is the most frequent in Camden, accounting for 19.2% of all households. In contrast, only 8 households (0.8%) fall into the $200,000+ income bracket, making it the least populous group.
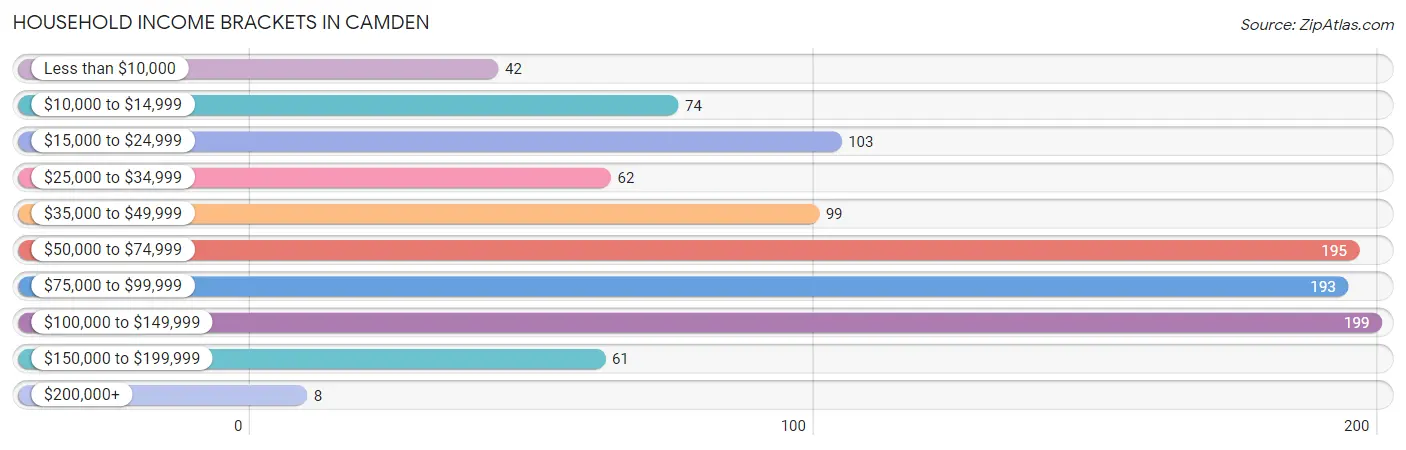
| Income Bracket | # Households | % Households |
| Less than $10,000 | 42 | 4.1% |
| $10,000 to $14,999 | 74 | 7.1% |
| $15,000 to $24,999 | 103 | 9.9% |
| $25,000 to $34,999 | 62 | 6.0% |
| $35,000 to $49,999 | 99 | 9.6% |
| $50,000 to $74,999 | 195 | 18.8% |
| $75,000 to $99,999 | 193 | 18.6% |
| $100,000 to $149,999 | 199 | 19.2% |
| $150,000 to $199,999 | 61 | 5.9% |
| $200,000+ | 8 | 0.8% |
Household Income by Householder Age in Camden
The median household income in Camden is $65,000, with the highest median household income of $88,301 found in the 45 to 64 years age bracket for the primary householder. A total of 399 households (38.5%) fall into this category. Meanwhile, the 15 to 24 years age bracket for the primary householder has the lowest median household income of $0, with 40 households (3.9%) in this group.
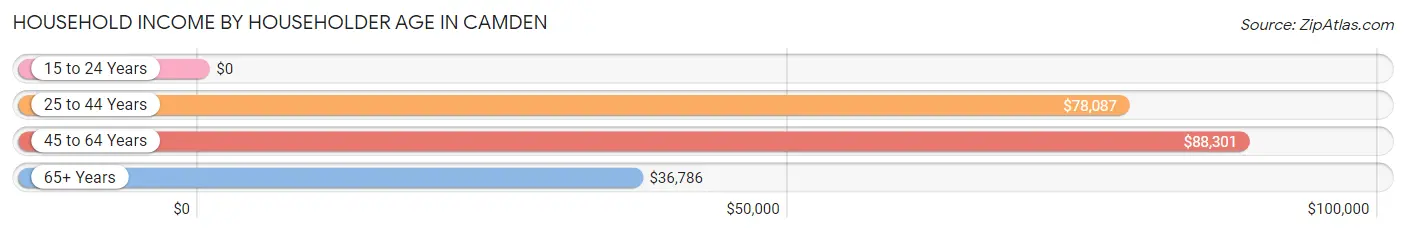
| Income Bracket | # Households | Median Income |
| 15 to 24 Years | 40 (3.9%) | $0 |
| 25 to 44 Years | 303 (29.2%) | $78,087 |
| 45 to 64 Years | 399 (38.5%) | $88,301 |
| 65+ Years | 294 (28.4%) | $36,786 |
| Total | 1,036 (100.0%) | $65,000 |
Poverty in Camden
Income Below Poverty by Sex and Age in Camden
With 9.4% poverty level for males and 9.3% for females among the residents of Camden, 35 to 44 year old males and 16 and 17 year old females are the most vulnerable to poverty, with 42 males (26.8%) and 24 females (38.7%) in their respective age groups living below the poverty level.
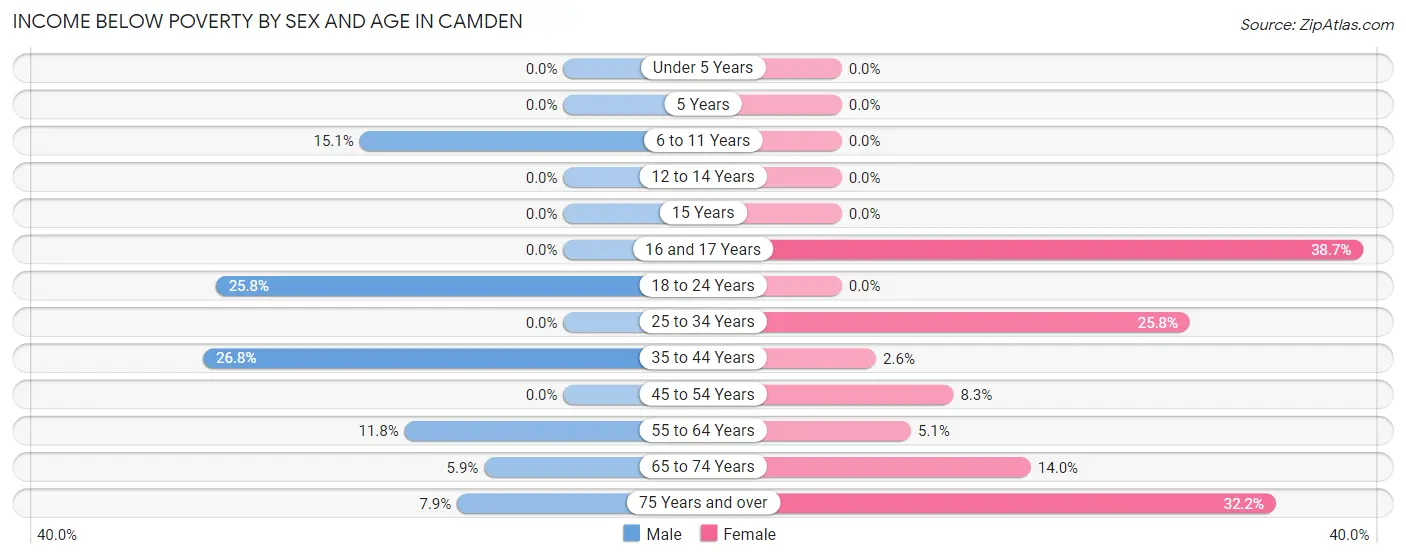
| Age Bracket | Male | Female |
| Under 5 Years | 0 (0.0%) | 0 (0.0%) |
| 5 Years | 0 (0.0%) | 0 (0.0%) |
| 6 to 11 Years | 18 (15.1%) | 0 (0.0%) |
| 12 to 14 Years | 0 (0.0%) | 0 (0.0%) |
| 15 Years | 0 (0.0%) | 0 (0.0%) |
| 16 and 17 Years | 0 (0.0%) | 24 (38.7%) |
| 18 to 24 Years | 16 (25.8%) | 0 (0.0%) |
| 25 to 34 Years | 0 (0.0%) | 23 (25.8%) |
| 35 to 44 Years | 42 (26.8%) | 6 (2.5%) |
| 45 to 54 Years | 0 (0.0%) | 16 (8.3%) |
| 55 to 64 Years | 25 (11.8%) | 9 (5.1%) |
| 65 to 74 Years | 8 (5.9%) | 16 (14.0%) |
| 75 Years and over | 6 (7.9%) | 29 (32.2%) |
| Total | 115 (9.4%) | 123 (9.3%) |
Income Above Poverty by Sex and Age in Camden
According to the poverty statistics in Camden, males aged under 5 years and females aged under 5 years are the age groups that are most secure financially, with 100.0% of males and 100.0% of females in these age groups living above the poverty line.
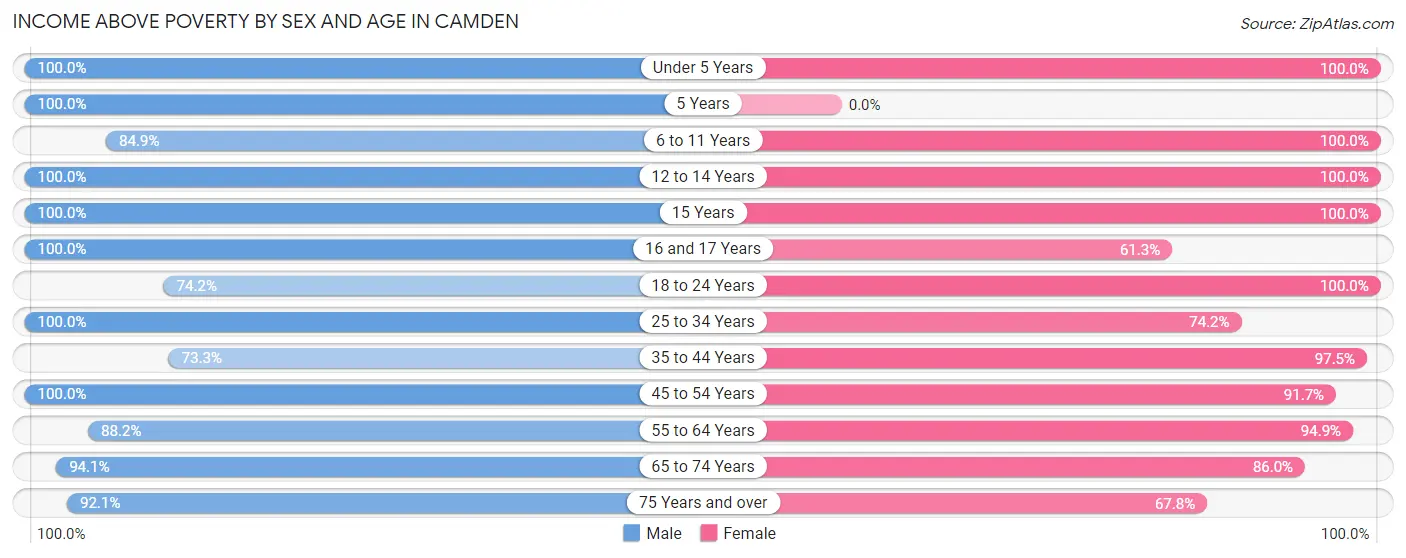
| Age Bracket | Male | Female |
| Under 5 Years | 160 (100.0%) | 59 (100.0%) |
| 5 Years | 16 (100.0%) | 0 (0.0%) |
| 6 to 11 Years | 101 (84.9%) | 151 (100.0%) |
| 12 to 14 Years | 30 (100.0%) | 76 (100.0%) |
| 15 Years | 11 (100.0%) | 10 (100.0%) |
| 16 and 17 Years | 29 (100.0%) | 38 (61.3%) |
| 18 to 24 Years | 46 (74.2%) | 74 (100.0%) |
| 25 to 34 Years | 100 (100.0%) | 66 (74.2%) |
| 35 to 44 Years | 115 (73.3%) | 229 (97.5%) |
| 45 to 54 Years | 120 (100.0%) | 177 (91.7%) |
| 55 to 64 Years | 187 (88.2%) | 166 (94.9%) |
| 65 to 74 Years | 128 (94.1%) | 98 (86.0%) |
| 75 Years and over | 70 (92.1%) | 61 (67.8%) |
| Total | 1,113 (90.6%) | 1,205 (90.7%) |
Income Below Poverty Among Married-Couple Families in Camden
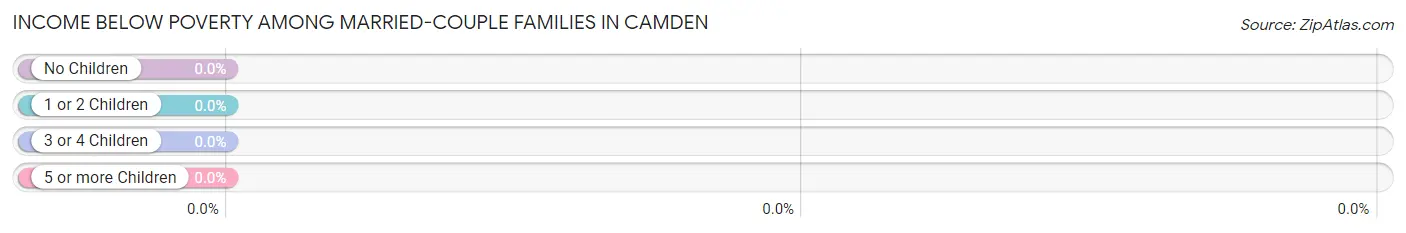
| Children | Above Poverty | Below Poverty |
| No Children | 222 (100.0%) | 0 (0.0%) |
| 1 or 2 Children | 143 (100.0%) | 0 (0.0%) |
| 3 or 4 Children | 46 (100.0%) | 0 (0.0%) |
| 5 or more Children | 0 (0.0%) | 0 (0.0%) |
| Total | 411 (100.0%) | 0 (0.0%) |
Income Below Poverty Among Single-Parent Households in Camden
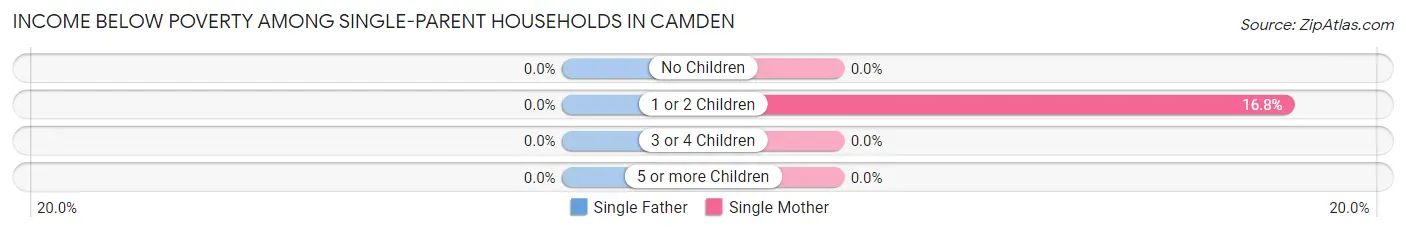
| Children | Single Father | Single Mother |
| No Children | 0 (0.0%) | 0 (0.0%) |
| 1 or 2 Children | 0 (0.0%) | 23 (16.8%) |
| 3 or 4 Children | 0 (0.0%) | 0 (0.0%) |
| 5 or more Children | 0 (0.0%) | 0 (0.0%) |
| Total | 0 (0.0%) | 23 (11.6%) |
Income Below Poverty Among Married-Couple vs Single-Parent Households in Camden
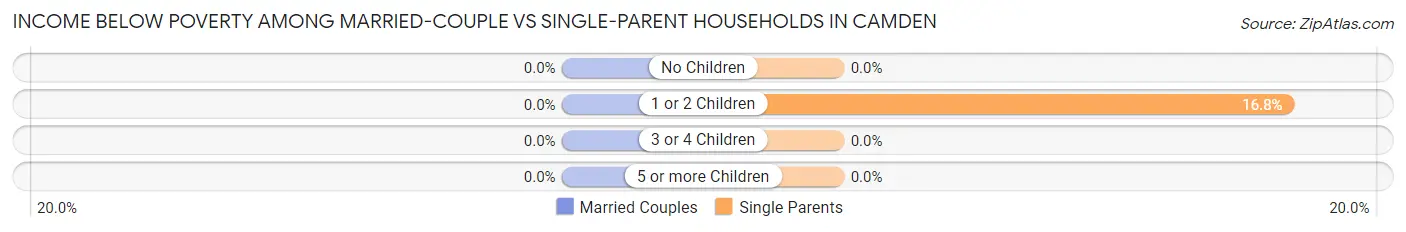
| Children | Married-Couple Families | Single-Parent Households |
| No Children | 0 (0.0%) | 0 (0.0%) |
| 1 or 2 Children | 0 (0.0%) | 23 (16.8%) |
| 3 or 4 Children | 0 (0.0%) | 0 (0.0%) |
| 5 or more Children | 0 (0.0%) | 0 (0.0%) |
| Total | 0 (0.0%) | 23 (10.7%) |
Race in Camden
The most populous races in Camden are White / Caucasian (2,483 | 96.3%), Two or more Races (58 | 2.2%), and Some other Race (14 | 0.5%).
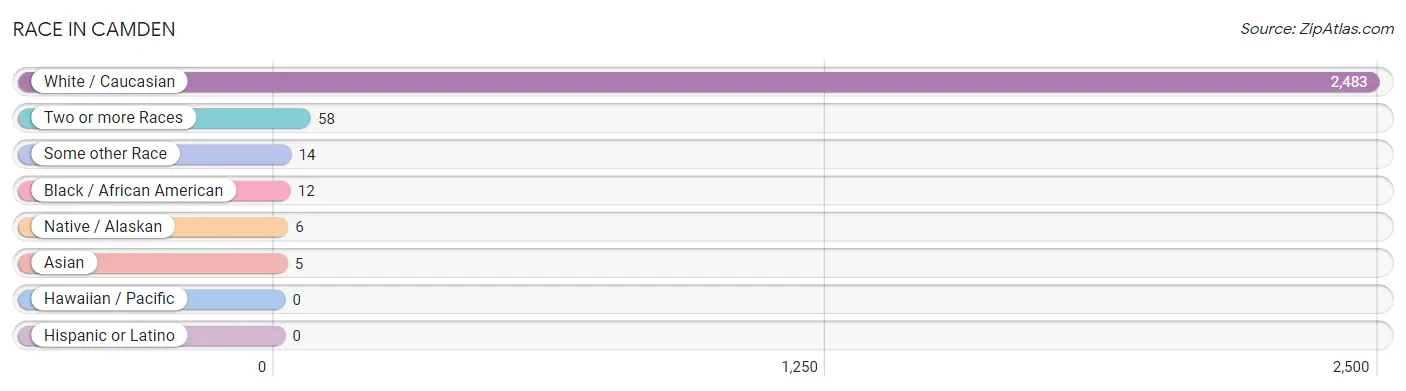
| Race | # Population | % Population |
| Asian | 5 | 0.2% |
| Black / African American | 12 | 0.5% |
| Hawaiian / Pacific | 0 | 0.0% |
| Hispanic or Latino | 0 | 0.0% |
| Native / Alaskan | 6 | 0.2% |
| White / Caucasian | 2,483 | 96.3% |
| Two or more Races | 58 | 2.2% |
| Some other Race | 14 | 0.5% |
| Total | 2,578 | 100.0% |
Ancestry in Camden
The most populous ancestries reported in Camden are Irish (393 | 15.2%), English (375 | 14.5%), American (367 | 14.2%), German (216 | 8.4%), and Polish (209 | 8.1%), together accounting for 60.5% of all Camden residents.
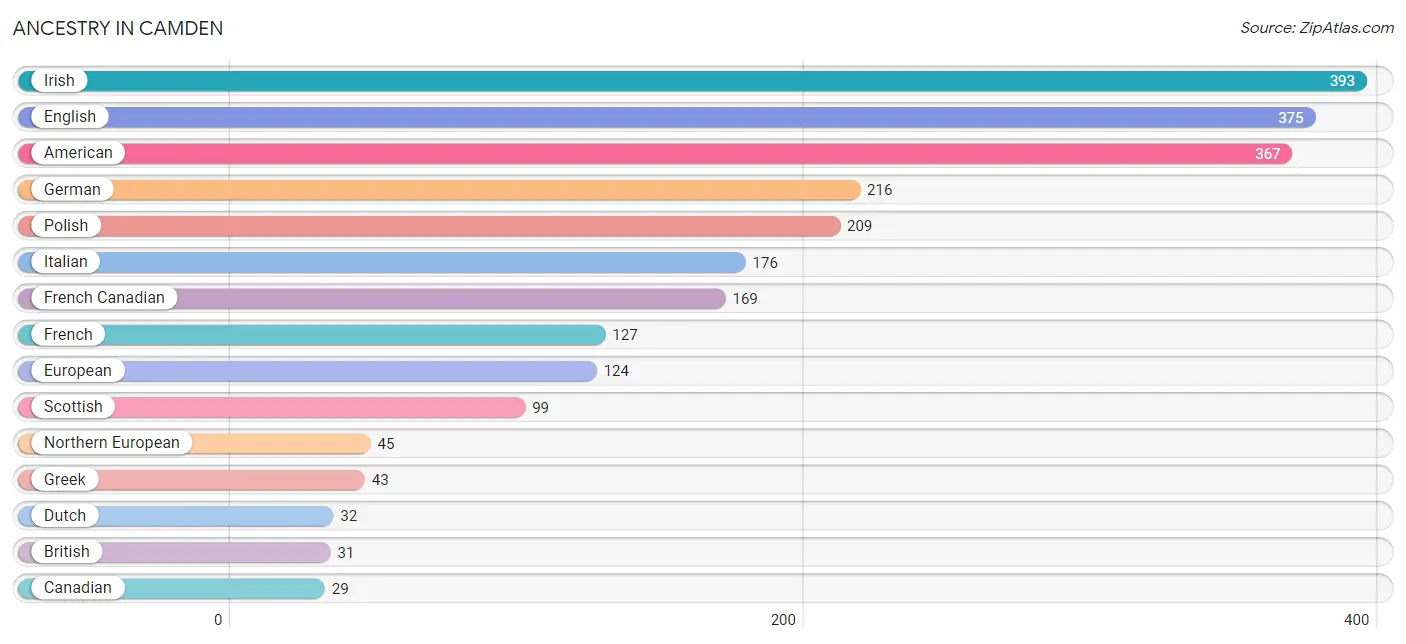
| Ancestry | # Population | % Population |
| American | 367 | 14.2% |
| Arab | 23 | 0.9% |
| British | 31 | 1.2% |
| Canadian | 29 | 1.1% |
| Delaware | 3 | 0.1% |
| Dutch | 32 | 1.2% |
| English | 375 | 14.5% |
| European | 124 | 4.8% |
| French | 127 | 4.9% |
| French Canadian | 169 | 6.6% |
| German | 216 | 8.4% |
| Greek | 43 | 1.7% |
| Hungarian | 14 | 0.5% |
| Indian (Asian) | 5 | 0.2% |
| Irish | 393 | 15.2% |
| Iroquois | 3 | 0.1% |
| Italian | 176 | 6.8% |
| Korean | 21 | 0.8% |
| Lebanese | 23 | 0.9% |
| Northern European | 45 | 1.8% |
| Polish | 209 | 8.1% |
| Scotch-Irish | 4 | 0.2% |
| Scottish | 99 | 3.8% |
| Swedish | 25 | 1.0% |
| Swiss | 2 | 0.1% |
| Ukrainian | 28 | 1.1% |
| Welsh | 26 | 1.0% |
| Yugoslavian | 6 | 0.2% | View All 28 Rows |
Immigrants in Camden
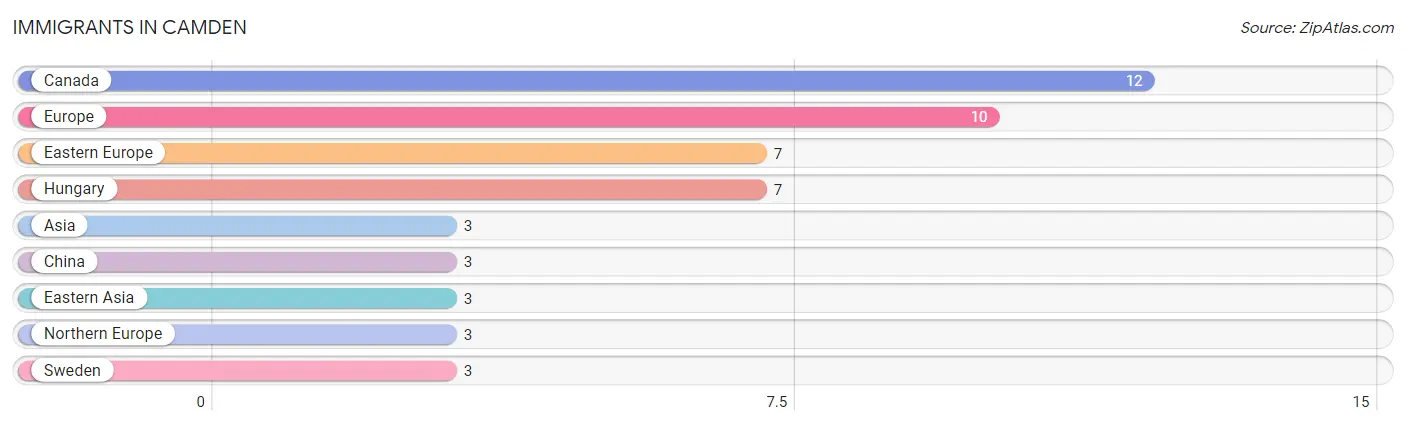
The most numerous immigrant groups reported in Camden came from Canada (12 | 0.5%), Europe (10 | 0.4%), Eastern Europe (7 | 0.3%), Hungary (7 | 0.3%), and Asia (3 | 0.1%), together accounting for 1.5% of all Camden residents.
| Immigration Origin | # Population | % Population |
| Asia | 3 | 0.1% |
| Canada | 12 | 0.5% |
| China | 3 | 0.1% |
| Eastern Asia | 3 | 0.1% |
| Eastern Europe | 7 | 0.3% |
| Europe | 10 | 0.4% |
| Hungary | 7 | 0.3% |
| Northern Europe | 3 | 0.1% |
| Sweden | 3 | 0.1% | View All 9 Rows |
Sex and Age in Camden
Sex and Age in Camden
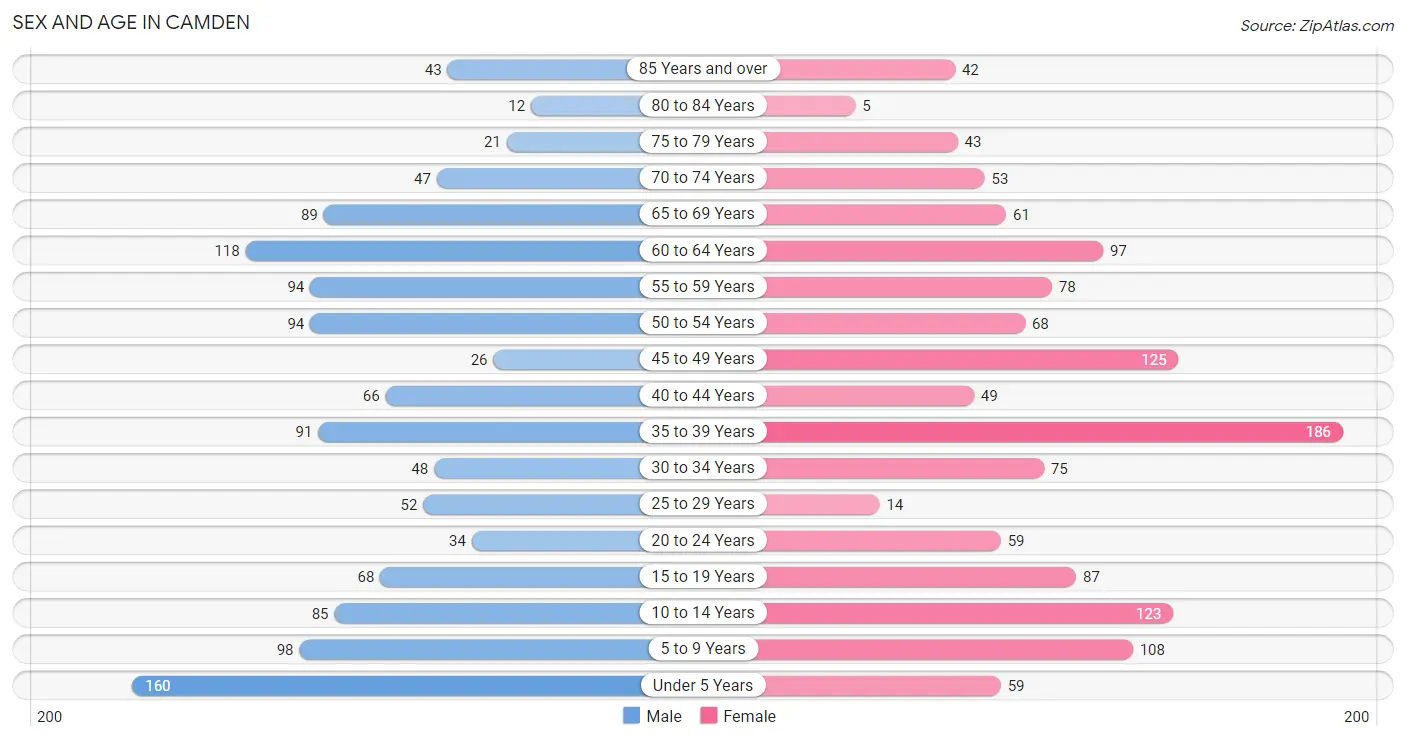
The most populous age groups in Camden are Under 5 Years (160 | 12.8%) for men and 35 to 39 Years (186 | 14.0%) for women.
| Age Bracket | Male | Female |
| Under 5 Years | 160 (12.8%) | 59 (4.4%) |
| 5 to 9 Years | 98 (7.9%) | 108 (8.1%) |
| 10 to 14 Years | 85 (6.8%) | 123 (9.2%) |
| 15 to 19 Years | 68 (5.5%) | 87 (6.5%) |
| 20 to 24 Years | 34 (2.7%) | 59 (4.4%) |
| 25 to 29 Years | 52 (4.2%) | 14 (1.1%) |
| 30 to 34 Years | 48 (3.8%) | 75 (5.6%) |
| 35 to 39 Years | 91 (7.3%) | 186 (14.0%) |
| 40 to 44 Years | 66 (5.3%) | 49 (3.7%) |
| 45 to 49 Years | 26 (2.1%) | 125 (9.4%) |
| 50 to 54 Years | 94 (7.5%) | 68 (5.1%) |
| 55 to 59 Years | 94 (7.5%) | 78 (5.9%) |
| 60 to 64 Years | 118 (9.5%) | 97 (7.3%) |
| 65 to 69 Years | 89 (7.1%) | 61 (4.6%) |
| 70 to 74 Years | 47 (3.8%) | 53 (4.0%) |
| 75 to 79 Years | 21 (1.7%) | 43 (3.2%) |
| 80 to 84 Years | 12 (1.0%) | 5 (0.4%) |
| 85 Years and over | 43 (3.5%) | 42 (3.2%) |
| Total | 1,246 (100.0%) | 1,332 (100.0%) |
Families and Households in Camden
Median Family Size in Camden
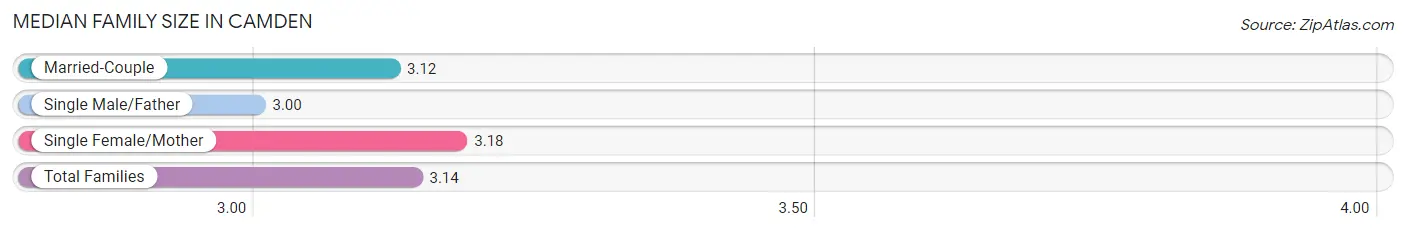
The median family size in Camden is 3.14 persons per family, with single female/mother families (199 | 31.8%) accounting for the largest median family size of 3.18 persons per family. On the other hand, single male/father families (15 | 2.4%) represent the smallest median family size with 3.00 persons per family.
| Family Type | # Families | Family Size |
| Married-Couple | 411 (65.8%) | 3.12 |
| Single Male/Father | 15 (2.4%) | 3.00 |
| Single Female/Mother | 199 (31.8%) | 3.18 |
| Total Families | 625 (100.0%) | 3.14 |
Median Household Size in Camden
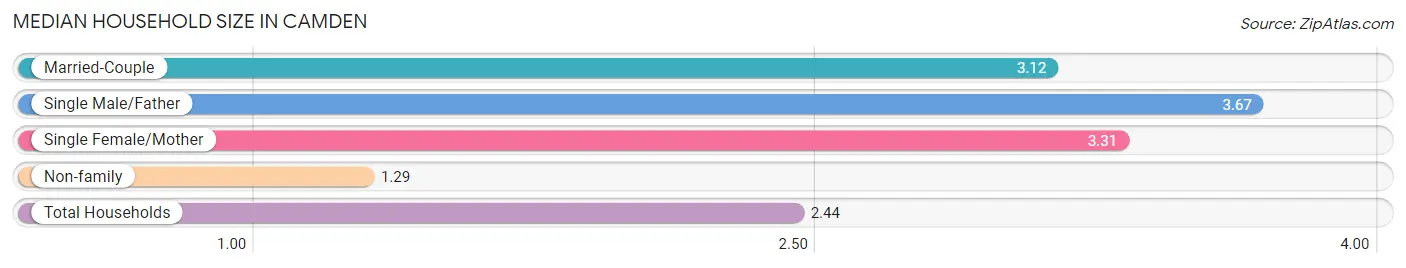
The median household size in Camden is 2.44 persons per household, with single male/father households (15 | 1.5%) accounting for the largest median household size of 3.67 persons per household. non-family households (411 | 39.7%) represent the smallest median household size with 1.29 persons per household.
| Household Type | # Households | Household Size |
| Married-Couple | 411 (39.7%) | 3.12 |
| Single Male/Father | 15 (1.5%) | 3.67 |
| Single Female/Mother | 199 (19.2%) | 3.31 |
| Non-family | 411 (39.7%) | 1.29 |
| Total Households | 1,036 (100.0%) | 2.44 |
Household Size by Marriage Status in Camden
Out of a total of 1,036 households in Camden, 625 (60.3%) are family households, while 411 (39.7%) are nonfamily households. The most numerous type of family households are 2-person households, comprising 236, and the most common type of nonfamily households are 1-person households, comprising 344.
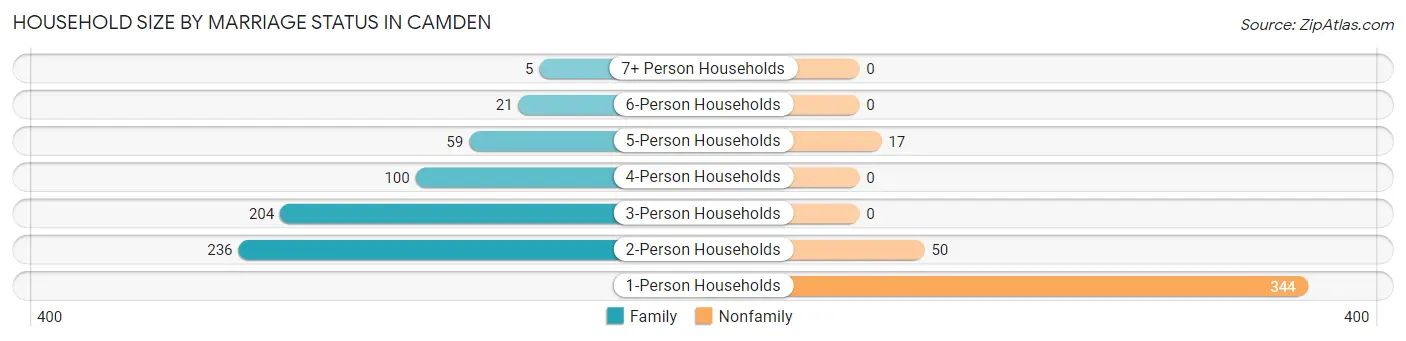
| Household Size | Family Households | Nonfamily Households |
| 1-Person Households | - | 344 (33.2%) |
| 2-Person Households | 236 (22.8%) | 50 (4.8%) |
| 3-Person Households | 204 (19.7%) | 0 (0.0%) |
| 4-Person Households | 100 (9.7%) | 0 (0.0%) |
| 5-Person Households | 59 (5.7%) | 17 (1.6%) |
| 6-Person Households | 21 (2.0%) | 0 (0.0%) |
| 7+ Person Households | 5 (0.5%) | 0 (0.0%) |
| Total | 625 (60.3%) | 411 (39.7%) |
Female Fertility in Camden
Fertility by Age in Camden
Average fertility rate in Camden is 50.0 births per 1,000 women. Women in the age bracket of 20 to 34 years have the highest fertility rate with 61.0 births per 1,000 women. Women in the age bracket of 35 to 50 years acount for 70.0% of all women with births.
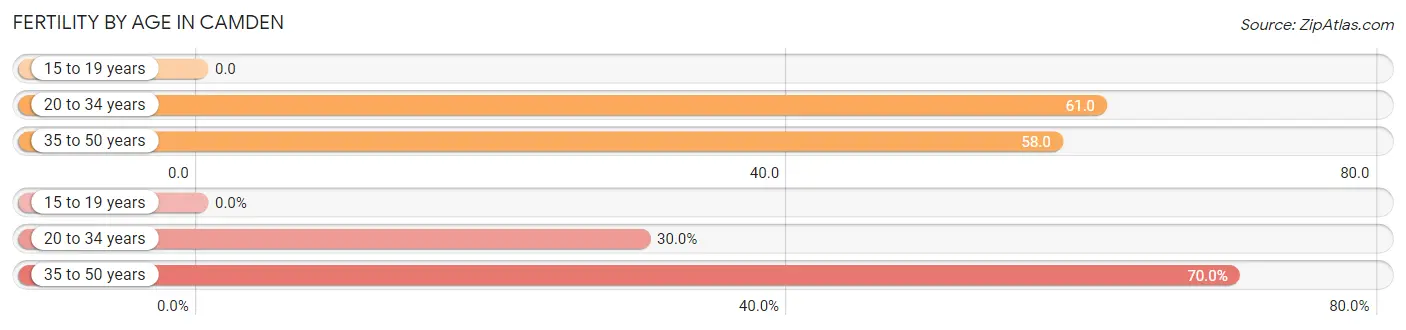
| Age Bracket | Women with Births | Births / 1,000 Women |
| 15 to 19 years | 0 (0.0%) | 0.0 |
| 20 to 34 years | 9 (30.0%) | 61.0 |
| 35 to 50 years | 21 (70.0%) | 58.0 |
| Total | 30 (100.0%) | 50.0 |
Fertility by Age by Marriage Status in Camden
30.0% of women with births (30) in Camden are married. The highest percentage of unmarried women with births falls into 35 to 50 years age bracket with 100.0% of them unmarried at the time of birth, while the lowest percentage of unmarried women with births belong to 20 to 34 years age bracket with 0.0% of them unmarried.
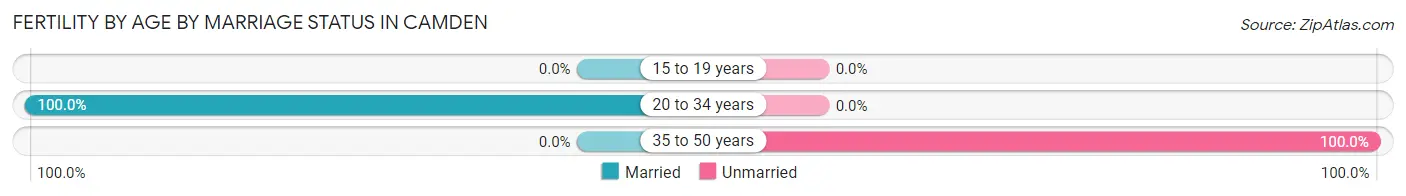
| Age Bracket | Married | Unmarried |
| 15 to 19 years | 0 (0.0%) | 0 (0.0%) |
| 20 to 34 years | 9 (100.0%) | 0 (0.0%) |
| 35 to 50 years | 0 (0.0%) | 21 (100.0%) |
| Total | 9 (30.0%) | 21 (70.0%) |
Fertility by Education in Camden
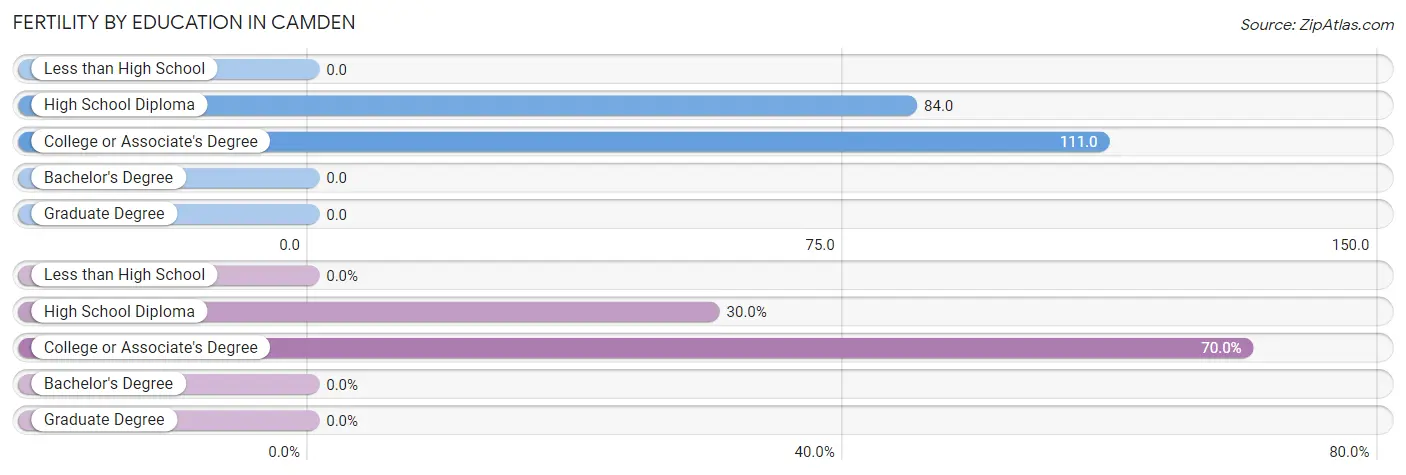
| Educational Attainment | Women with Births | Births / 1,000 Women |
| Less than High School | 0 (0.0%) | 0.0 |
| High School Diploma | 9 (30.0%) | 84.0 |
| College or Associate's Degree | 21 (70.0%) | 111.0 |
| Bachelor's Degree | 0 (0.0%) | 0.0 |
| Graduate Degree | 0 (0.0%) | 0.0 |
| Total | 30 (100.0%) | 50.0 |
Fertility by Education by Marriage Status in Camden
70.0% of women with births in Camden are unmarried. Women with the educational attainment of high school diploma are most likely to be married with 100.0% of them married at childbirth, while women with the educational attainment of college or associate's degree are least likely to be married with 100.0% of them unmarried at childbirth.
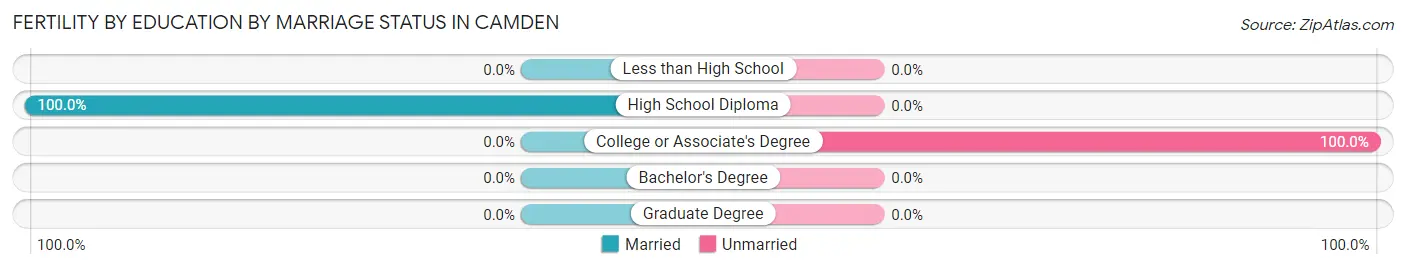
| Educational Attainment | Married | Unmarried |
| Less than High School | 0 (0.0%) | 0 (0.0%) |
| High School Diploma | 9 (100.0%) | 0 (0.0%) |
| College or Associate's Degree | 0 (0.0%) | 21 (100.0%) |
| Bachelor's Degree | 0 (0.0%) | 0 (0.0%) |
| Graduate Degree | 0 (0.0%) | 0 (0.0%) |
| Total | 9 (30.0%) | 21 (70.0%) |
Employment Characteristics in Camden
Employment by Class of Employer in Camden
Among the 1,079 employed individuals in Camden, private company employees (642 | 59.5%), local government employees (121 | 11.2%), and self-employed (not incorporated) (102 | 9.5%) make up the most common classes of employment.
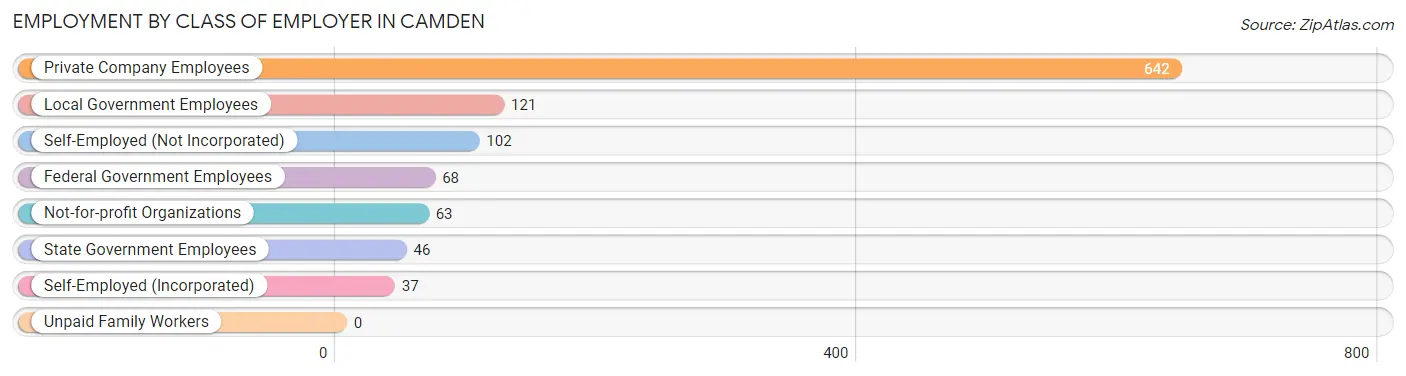
| Employer Class | # Employees | % Employees |
| Private Company Employees | 642 | 59.5% |
| Self-Employed (Incorporated) | 37 | 3.4% |
| Self-Employed (Not Incorporated) | 102 | 9.5% |
| Not-for-profit Organizations | 63 | 5.8% |
| Local Government Employees | 121 | 11.2% |
| State Government Employees | 46 | 4.3% |
| Federal Government Employees | 68 | 6.3% |
| Unpaid Family Workers | 0 | 0.0% |
| Total | 1,079 | 100.0% |
Employment Status by Age in Camden
According to the labor force statistics for Camden, out of the total population over 16 years of age (1,924), 58.6% or 1,127 individuals are in the labor force, with 2.2% or 25 of them unemployed. The age group with the highest labor force participation rate is 30 to 34 years, with 92.7% or 114 individuals in the labor force. Within the labor force, the 20 to 24 years age range has the highest percentage of unemployed individuals, with 12.7% or 10 of them being unemployed.
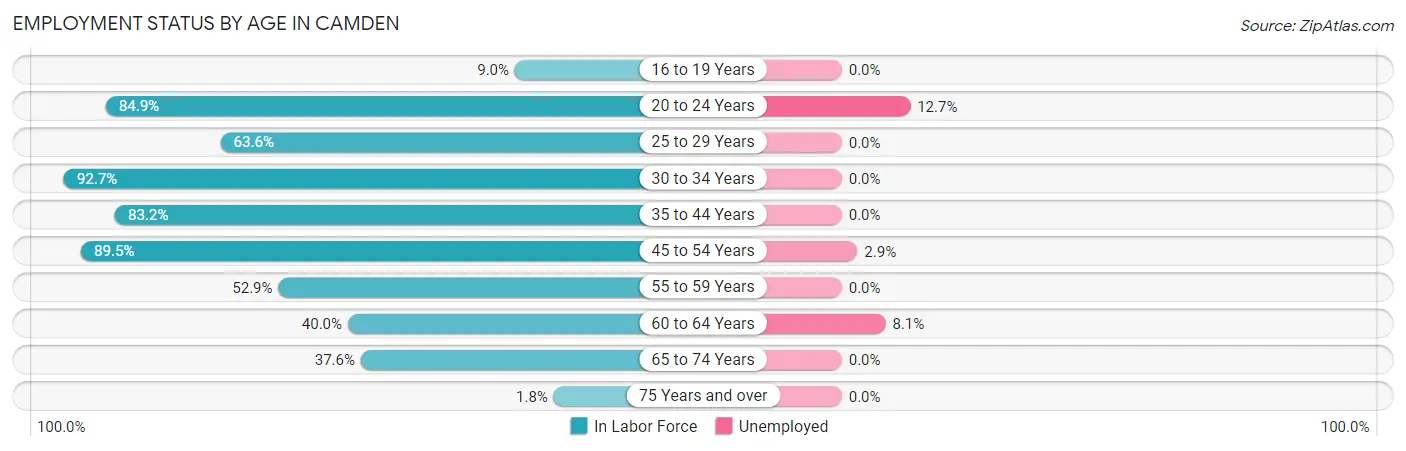
| Age Bracket | In Labor Force | Unemployed |
| 16 to 19 Years | 12 (9.0%) | 0 (0.0%) |
| 20 to 24 Years | 79 (84.9%) | 10 (12.7%) |
| 25 to 29 Years | 42 (63.6%) | 0 (0.0%) |
| 30 to 34 Years | 114 (92.7%) | 0 (0.0%) |
| 35 to 44 Years | 326 (83.2%) | 0 (0.0%) |
| 45 to 54 Years | 280 (89.5%) | 8 (2.9%) |
| 55 to 59 Years | 91 (52.9%) | 0 (0.0%) |
| 60 to 64 Years | 86 (40.0%) | 7 (8.1%) |
| 65 to 74 Years | 94 (37.6%) | 0 (0.0%) |
| 75 Years and over | 3 (1.8%) | 0 (0.0%) |
| Total | 1,127 (58.6%) | 25 (2.2%) |
Employment Status by Educational Attainment in Camden
According to labor force statistics for Camden, 73.3% of individuals (939) out of the total population between 25 and 64 years of age (1,281) are in the labor force, with 1.6% or 15 of them being unemployed. The group with the highest labor force participation rate are those with the educational attainment of bachelor's degree or higher, with 92.5% or 360 individuals in the labor force. Within the labor force, individuals with college / associate degree education have the highest percentage of unemployment, with 4.3% or 15 of them being unemployed.
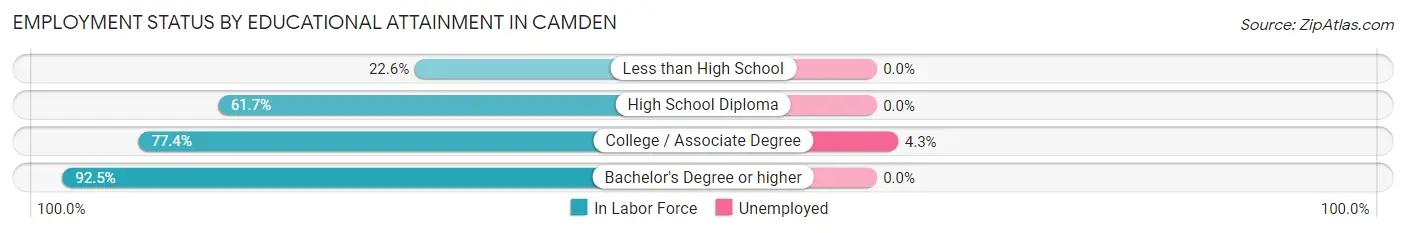
| Educational Attainment | In Labor Force | Unemployed |
| Less than High School | 24 (22.6%) | 0 (0.0%) |
| High School Diploma | 209 (61.7%) | 0 (0.0%) |
| College / Associate Degree | 346 (77.4%) | 19 (4.3%) |
| Bachelor's Degree or higher | 360 (92.5%) | 0 (0.0%) |
| Total | 939 (73.3%) | 20 (1.6%) |
Employment Occupations by Sex in Camden
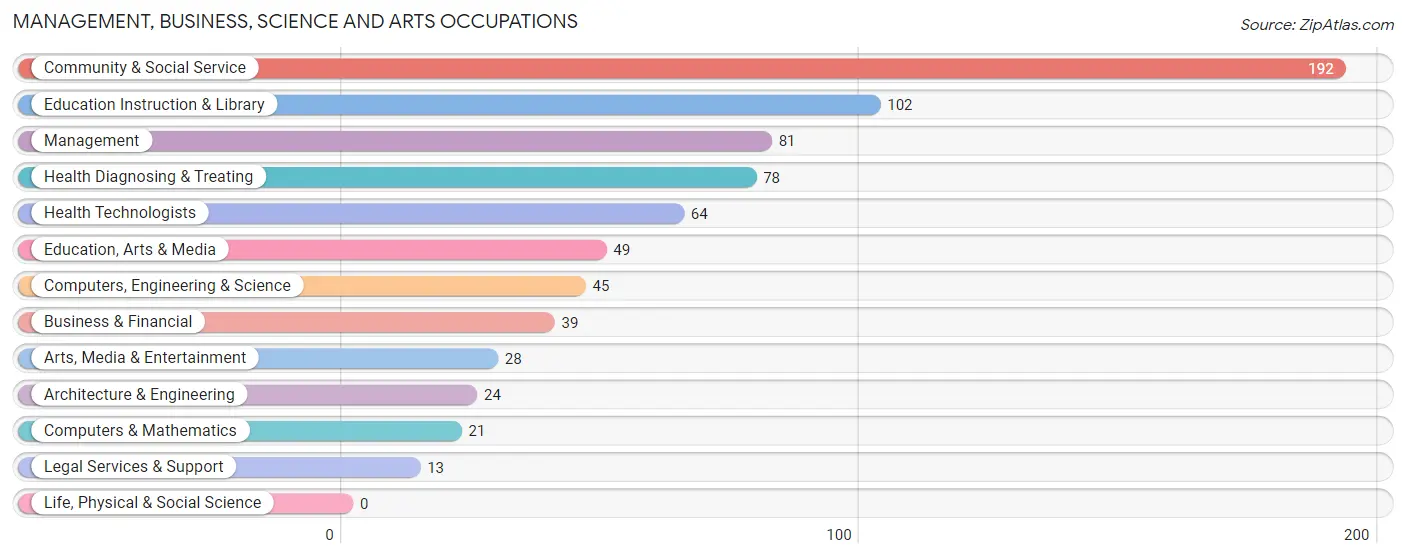
Management, Business, Science and Arts Occupations
The most common Management, Business, Science and Arts occupations in Camden are Community & Social Service (192 | 17.6%), Education Instruction & Library (102 | 9.3%), Management (81 | 7.4%), Health Diagnosing & Treating (78 | 7.1%), and Health Technologists (64 | 5.9%).
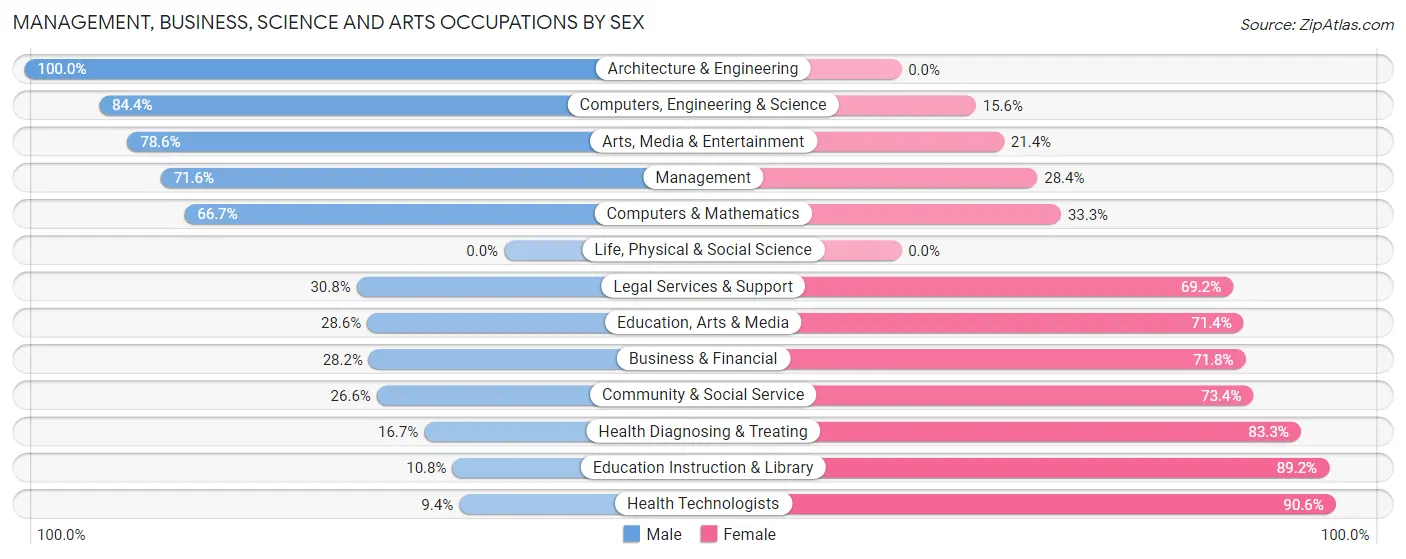
Management, Business, Science and Arts Occupations by Sex
Within the Management, Business, Science and Arts occupations in Camden, the most male-oriented occupations are Architecture & Engineering (100.0%), Computers, Engineering & Science (84.4%), and Arts, Media & Entertainment (78.6%), while the most female-oriented occupations are Health Technologists (90.6%), Education Instruction & Library (89.2%), and Health Diagnosing & Treating (83.3%).
| Occupation | Male | Female |
| Management | 58 (71.6%) | 23 (28.4%) |
| Business & Financial | 11 (28.2%) | 28 (71.8%) |
| Computers, Engineering & Science | 38 (84.4%) | 7 (15.6%) |
| Computers & Mathematics | 14 (66.7%) | 7 (33.3%) |
| Architecture & Engineering | 24 (100.0%) | 0 (0.0%) |
| Life, Physical & Social Science | 0 (0.0%) | 0 (0.0%) |
| Community & Social Service | 51 (26.6%) | 141 (73.4%) |
| Education, Arts & Media | 14 (28.6%) | 35 (71.4%) |
| Legal Services & Support | 4 (30.8%) | 9 (69.2%) |
| Education Instruction & Library | 11 (10.8%) | 91 (89.2%) |
| Arts, Media & Entertainment | 22 (78.6%) | 6 (21.4%) |
| Health Diagnosing & Treating | 13 (16.7%) | 65 (83.3%) |
| Health Technologists | 6 (9.4%) | 58 (90.6%) |
| Total (Category) | 171 (39.3%) | 264 (60.7%) |
| Total (Overall) | 511 (46.8%) | 581 (53.2%) |
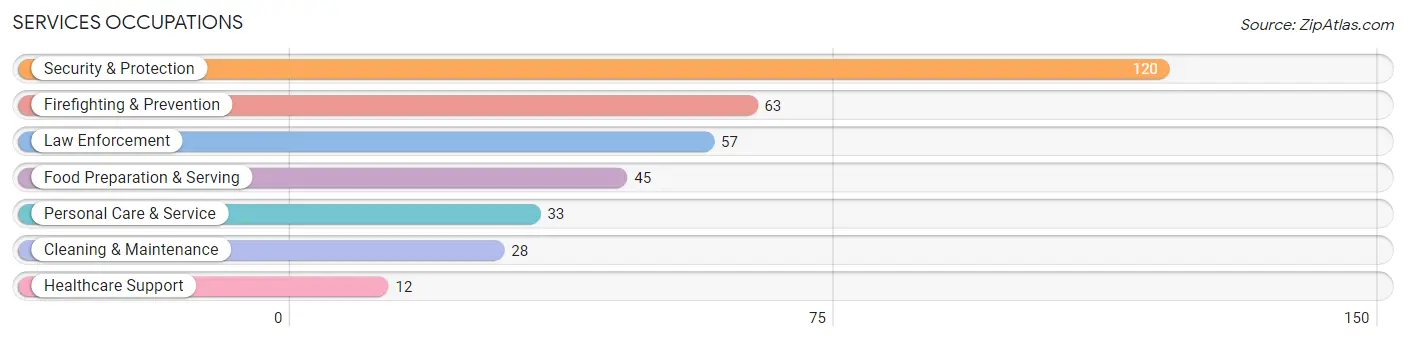
Services Occupations
The most common Services occupations in Camden are Security & Protection (120 | 11.0%), Firefighting & Prevention (63 | 5.8%), Law Enforcement (57 | 5.2%), Food Preparation & Serving (45 | 4.1%), and Personal Care & Service (33 | 3.0%).
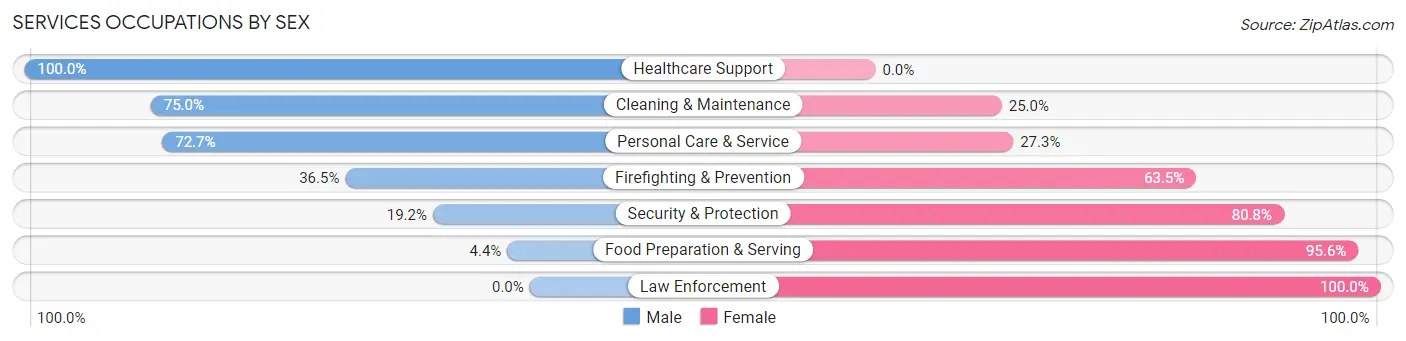
Services Occupations by Sex
Within the Services occupations in Camden, the most male-oriented occupations are Healthcare Support (100.0%), Cleaning & Maintenance (75.0%), and Personal Care & Service (72.7%), while the most female-oriented occupations are Law Enforcement (100.0%), Food Preparation & Serving (95.6%), and Security & Protection (80.8%).
| Occupation | Male | Female |
| Healthcare Support | 12 (100.0%) | 0 (0.0%) |
| Security & Protection | 23 (19.2%) | 97 (80.8%) |
| Firefighting & Prevention | 23 (36.5%) | 40 (63.5%) |
| Law Enforcement | 0 (0.0%) | 57 (100.0%) |
| Food Preparation & Serving | 2 (4.4%) | 43 (95.6%) |
| Cleaning & Maintenance | 21 (75.0%) | 7 (25.0%) |
| Personal Care & Service | 24 (72.7%) | 9 (27.3%) |
| Total (Category) | 82 (34.4%) | 156 (65.5%) |
| Total (Overall) | 511 (46.8%) | 581 (53.2%) |
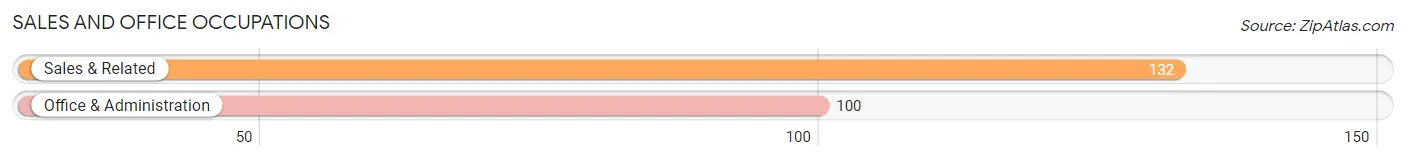
Sales and Office Occupations
The most common Sales and Office occupations in Camden are Sales & Related (132 | 12.1%), and Office & Administration (100 | 9.2%).
Sales and Office Occupations by Sex
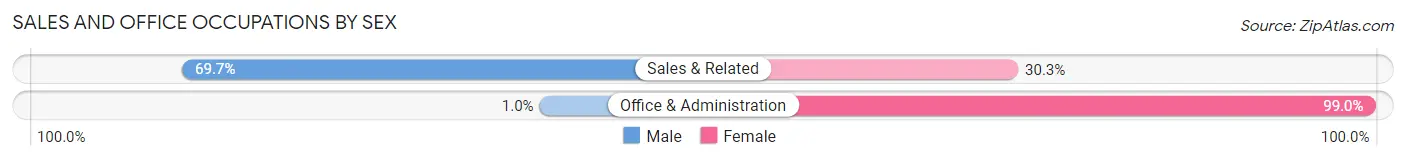
| Occupation | Male | Female |
| Sales & Related | 92 (69.7%) | 40 (30.3%) |
| Office & Administration | 1 (1.0%) | 99 (99.0%) |
| Total (Category) | 93 (40.1%) | 139 (59.9%) |
| Total (Overall) | 511 (46.8%) | 581 (53.2%) |
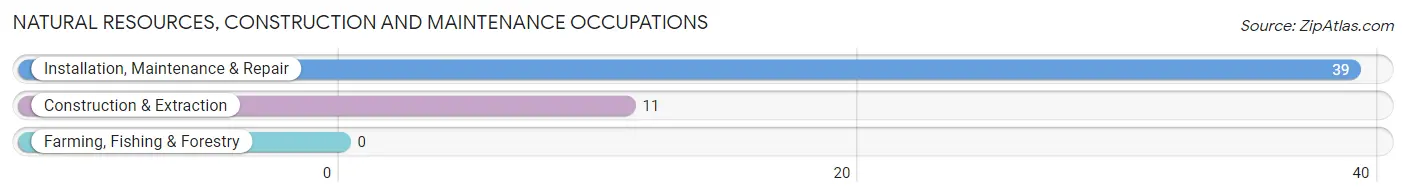
Natural Resources, Construction and Maintenance Occupations
The most common Natural Resources, Construction and Maintenance occupations in Camden are Installation, Maintenance & Repair (39 | 3.6%), and Construction & Extraction (11 | 1.0%).
Natural Resources, Construction and Maintenance Occupations by Sex
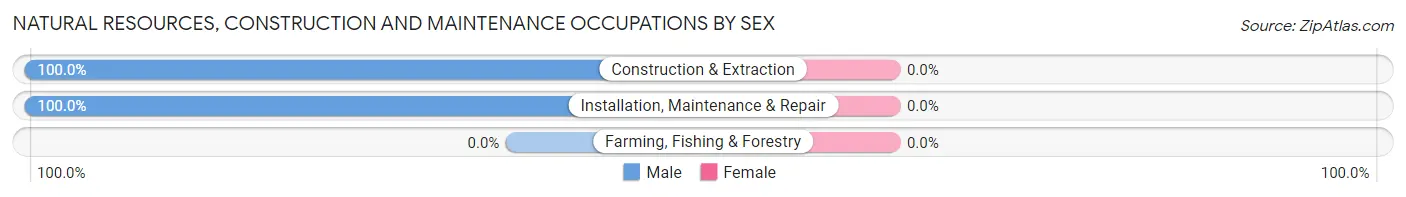
| Occupation | Male | Female |
| Farming, Fishing & Forestry | 0 (0.0%) | 0 (0.0%) |
| Construction & Extraction | 11 (100.0%) | 0 (0.0%) |
| Installation, Maintenance & Repair | 39 (100.0%) | 0 (0.0%) |
| Total (Category) | 50 (100.0%) | 0 (0.0%) |
| Total (Overall) | 511 (46.8%) | 581 (53.2%) |
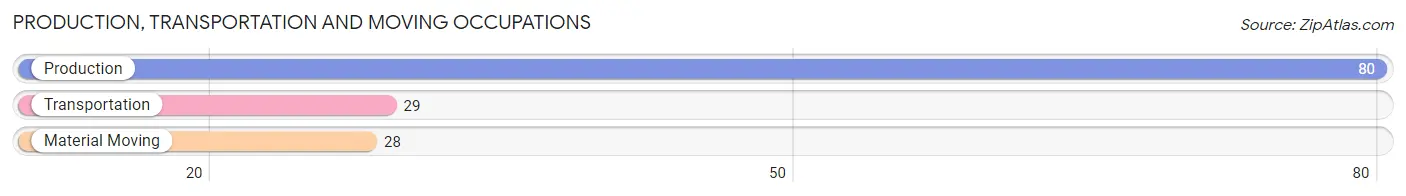
Production, Transportation and Moving Occupations
The most common Production, Transportation and Moving occupations in Camden are Production (80 | 7.3%), Transportation (29 | 2.7%), and Material Moving (28 | 2.6%).
Production, Transportation and Moving Occupations by Sex
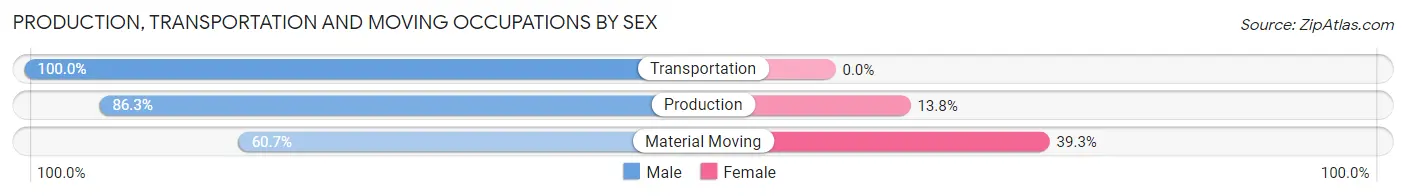
| Occupation | Male | Female |
| Production | 69 (86.3%) | 11 (13.8%) |
| Transportation | 29 (100.0%) | 0 (0.0%) |
| Material Moving | 17 (60.7%) | 11 (39.3%) |
| Total (Category) | 115 (83.9%) | 22 (16.1%) |
| Total (Overall) | 511 (46.8%) | 581 (53.2%) |
Employment Industries by Sex in Camden
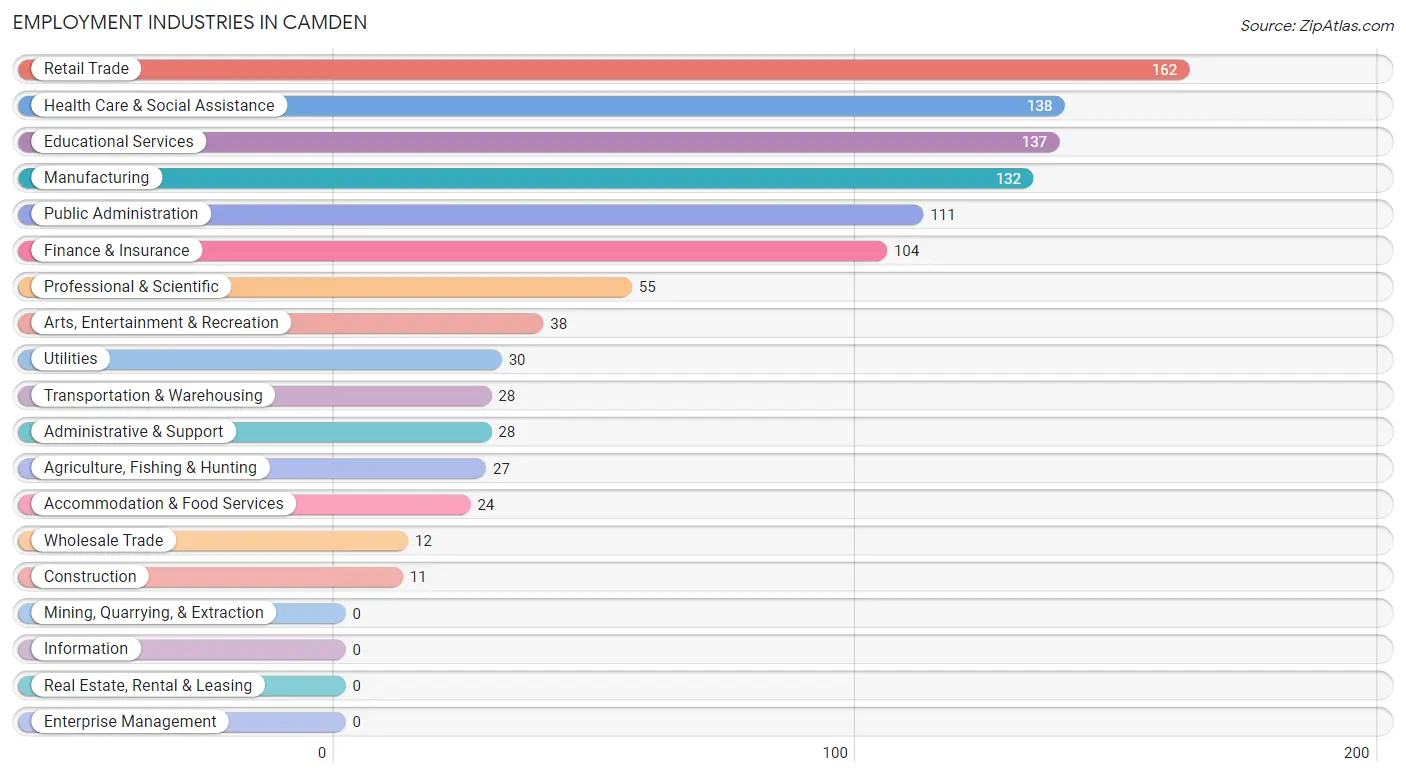
Employment Industries in Camden
The major employment industries in Camden include Retail Trade (162 | 14.8%), Health Care & Social Assistance (138 | 12.6%), Educational Services (137 | 12.6%), Manufacturing (132 | 12.1%), and Public Administration (111 | 10.2%).
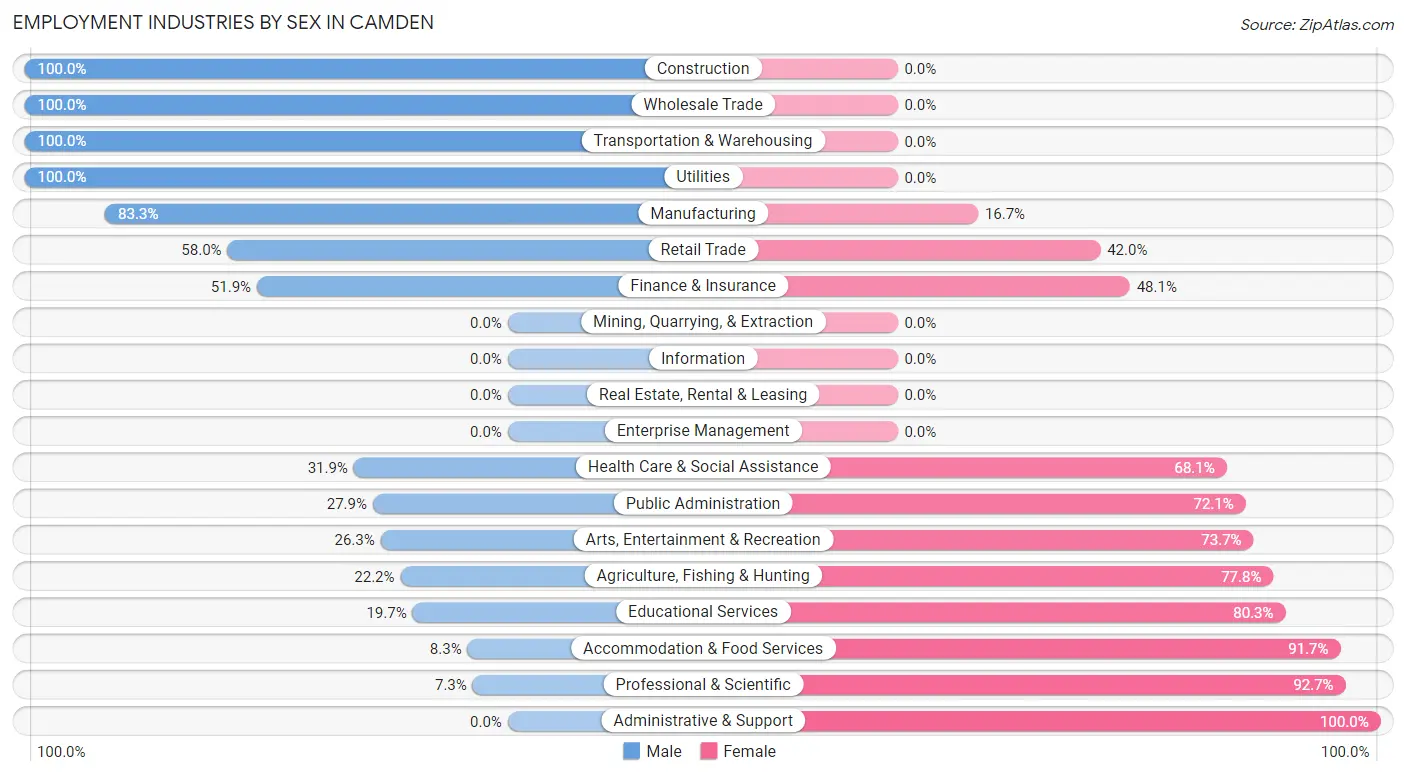
Employment Industries by Sex in Camden
The Camden industries that see more men than women are Construction (100.0%), Wholesale Trade (100.0%), and Transportation & Warehousing (100.0%), whereas the industries that tend to have a higher number of women are Administrative & Support (100.0%), Professional & Scientific (92.7%), and Accommodation & Food Services (91.7%).
| Industry | Male | Female |
| Agriculture, Fishing & Hunting | 6 (22.2%) | 21 (77.8%) |
| Mining, Quarrying, & Extraction | 0 (0.0%) | 0 (0.0%) |
| Construction | 11 (100.0%) | 0 (0.0%) |
| Manufacturing | 110 (83.3%) | 22 (16.7%) |
| Wholesale Trade | 12 (100.0%) | 0 (0.0%) |
| Retail Trade | 94 (58.0%) | 68 (42.0%) |
| Transportation & Warehousing | 28 (100.0%) | 0 (0.0%) |
| Utilities | 30 (100.0%) | 0 (0.0%) |
| Information | 0 (0.0%) | 0 (0.0%) |
| Finance & Insurance | 54 (51.9%) | 50 (48.1%) |
| Real Estate, Rental & Leasing | 0 (0.0%) | 0 (0.0%) |
| Professional & Scientific | 4 (7.3%) | 51 (92.7%) |
| Enterprise Management | 0 (0.0%) | 0 (0.0%) |
| Administrative & Support | 0 (0.0%) | 28 (100.0%) |
| Educational Services | 27 (19.7%) | 110 (80.3%) |
| Health Care & Social Assistance | 44 (31.9%) | 94 (68.1%) |
| Arts, Entertainment & Recreation | 10 (26.3%) | 28 (73.7%) |
| Accommodation & Food Services | 2 (8.3%) | 22 (91.7%) |
| Public Administration | 31 (27.9%) | 80 (72.1%) |
| Total | 511 (46.8%) | 581 (53.2%) |
Education in Camden
School Enrollment in Camden
The most common levels of schooling among the 656 students in Camden are elementary school (186 | 28.3%), middle school (168 | 25.6%), and high school (132 | 20.1%).
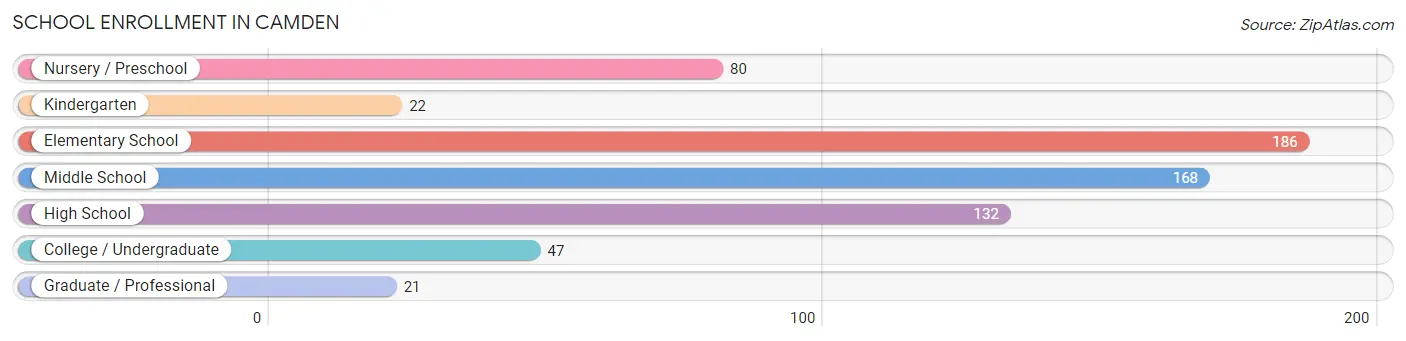
| School Level | # Students | % Students |
| Nursery / Preschool | 80 | 12.2% |
| Kindergarten | 22 | 3.4% |
| Elementary School | 186 | 28.3% |
| Middle School | 168 | 25.6% |
| High School | 132 | 20.1% |
| College / Undergraduate | 47 | 7.2% |
| Graduate / Professional | 21 | 3.2% |
| Total | 656 | 100.0% |
School Enrollment by Age by Funding Source in Camden
Out of a total of 656 students who are enrolled in schools in Camden, 199 (30.3%) attend a private institution, while the remaining 457 (69.7%) are enrolled in public schools. The age group of 35 years and over has the highest likelihood of being enrolled in private schools, with 8 (100.0% in the age bracket) enrolled. Conversely, the age group of 18 to 19 year olds has the lowest likelihood of being enrolled in a private school, with 21 (95.5% in the age bracket) attending a public institution.
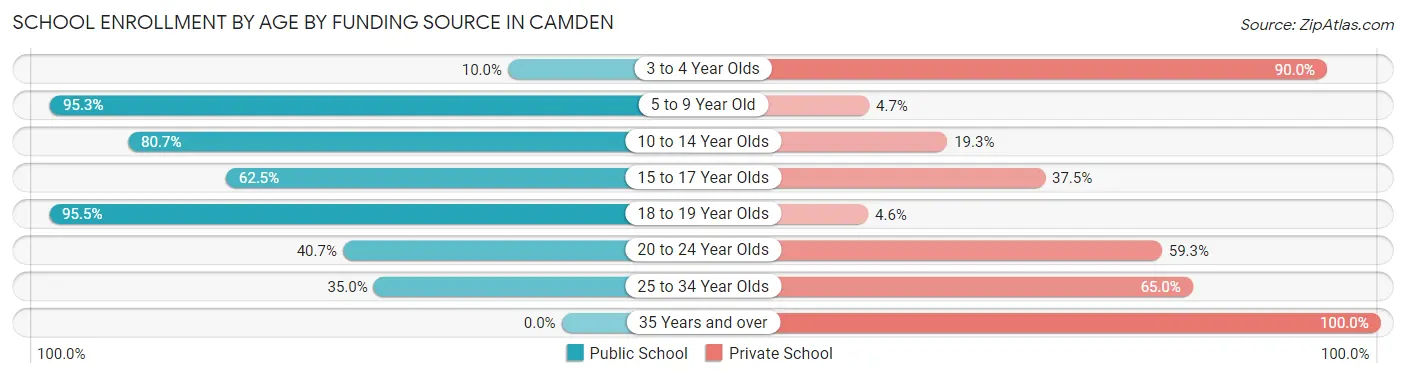
| Age Bracket | Public School | Private School |
| 3 to 4 Year Olds | 8 (10.0%) | 72 (90.0%) |
| 5 to 9 Year Old | 181 (95.3%) | 9 (4.7%) |
| 10 to 14 Year Olds | 159 (80.7%) | 38 (19.3%) |
| 15 to 17 Year Olds | 70 (62.5%) | 42 (37.5%) |
| 18 to 19 Year Olds | 21 (95.5%) | 1 (4.5%) |
| 20 to 24 Year Olds | 11 (40.7%) | 16 (59.3%) |
| 25 to 34 Year Olds | 7 (35.0%) | 13 (65.0%) |
| 35 Years and over | 0 (0.0%) | 8 (100.0%) |
| Total | 457 (69.7%) | 199 (30.3%) |
Educational Attainment by Field of Study in Camden
Business (104 | 20.5%), communications (71 | 14.0%), education (62 | 12.2%), literature & languages (35 | 6.9%), and arts & humanities (33 | 6.5%) are the most common fields of study among 507 individuals in Camden who have obtained a bachelor's degree or higher.
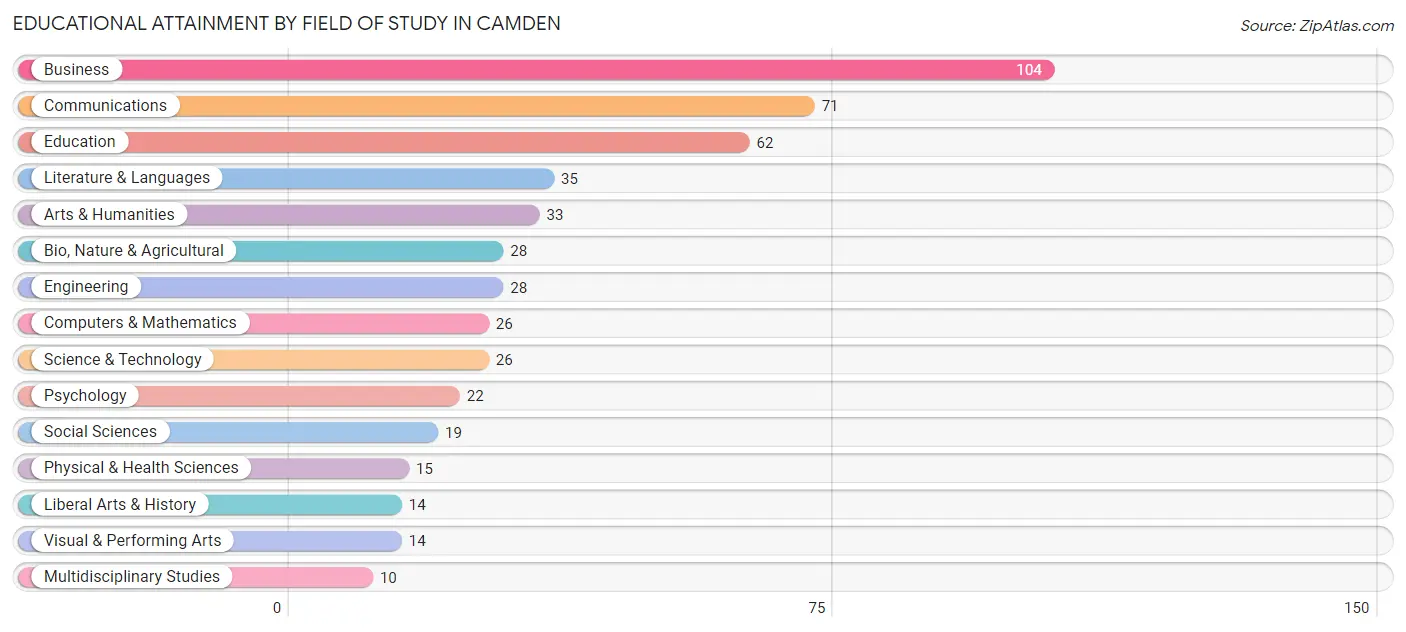
| Field of Study | # Graduates | % Graduates |
| Computers & Mathematics | 26 | 5.1% |
| Bio, Nature & Agricultural | 28 | 5.5% |
| Physical & Health Sciences | 15 | 3.0% |
| Psychology | 22 | 4.3% |
| Social Sciences | 19 | 3.7% |
| Engineering | 28 | 5.5% |
| Multidisciplinary Studies | 10 | 2.0% |
| Science & Technology | 26 | 5.1% |
| Business | 104 | 20.5% |
| Education | 62 | 12.2% |
| Literature & Languages | 35 | 6.9% |
| Liberal Arts & History | 14 | 2.8% |
| Visual & Performing Arts | 14 | 2.8% |
| Communications | 71 | 14.0% |
| Arts & Humanities | 33 | 6.5% |
| Total | 507 | 100.0% |
Transportation & Commute in Camden
Vehicle Availability by Sex in Camden
The most prevalent vehicle ownership categories in Camden are males with 2 vehicles (235, accounting for 45.4%) and females with 2 vehicles (240, making up 42.1%).
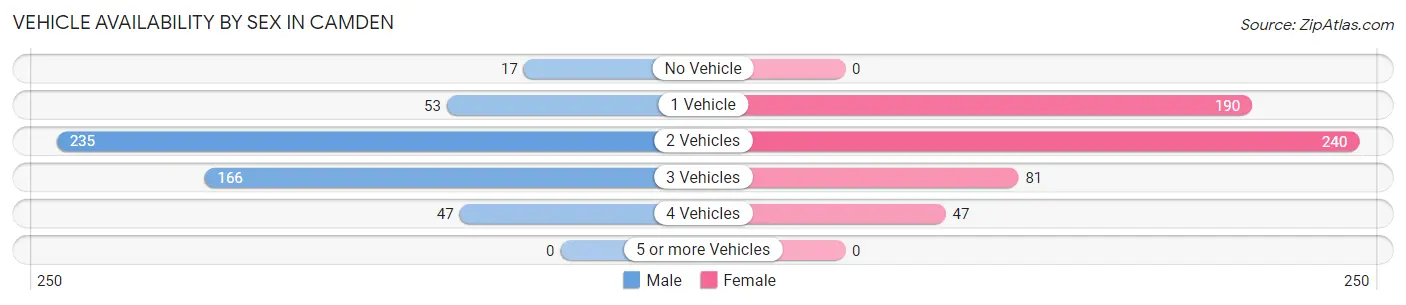
| Vehicles Available | Male | Female |
| No Vehicle | 17 (3.3%) | 0 (0.0%) |
| 1 Vehicle | 53 (10.2%) | 190 (34.1%) |
| 2 Vehicles | 235 (45.4%) | 240 (43.0%) |
| 3 Vehicles | 166 (32.1%) | 81 (14.5%) |
| 4 Vehicles | 47 (9.1%) | 47 (8.4%) |
| 5 or more Vehicles | 0 (0.0%) | 0 (0.0%) |
| Total | 518 (100.0%) | 558 (100.0%) |
Commute Time in Camden
The most frequently occuring commute durations in Camden are 45 to 59 minutes (208 commuters, 22.8%), 5 to 9 minutes (169 commuters, 18.5%), and less than 5 minutes (116 commuters, 12.7%).
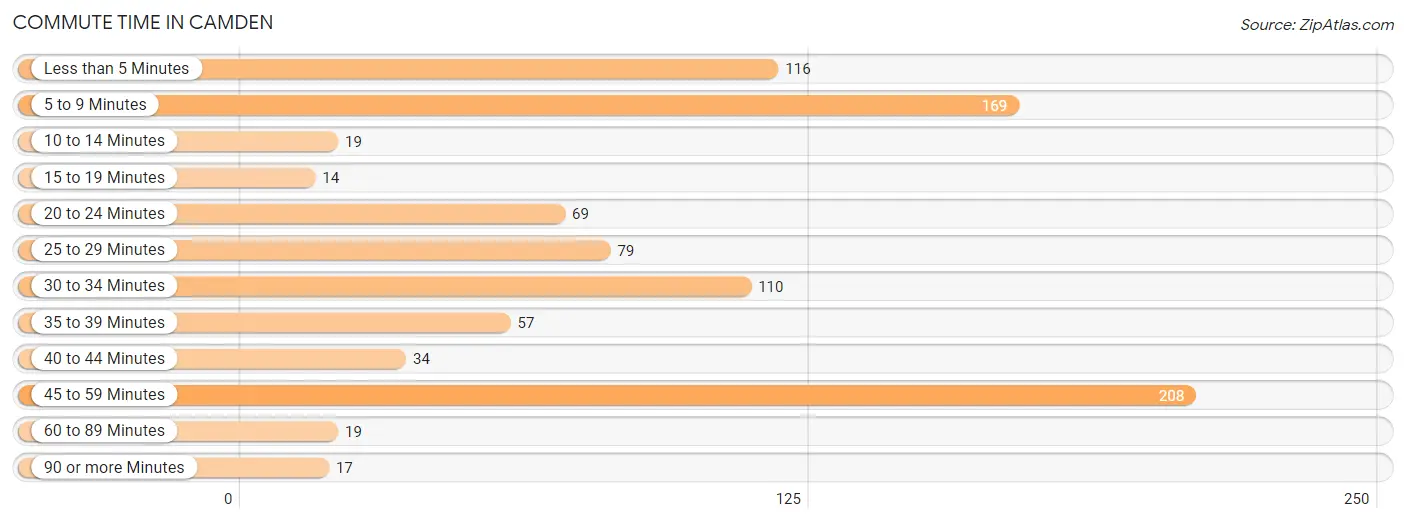
| Commute Time | # Commuters | % Commuters |
| Less than 5 Minutes | 116 | 12.7% |
| 5 to 9 Minutes | 169 | 18.5% |
| 10 to 14 Minutes | 19 | 2.1% |
| 15 to 19 Minutes | 14 | 1.5% |
| 20 to 24 Minutes | 69 | 7.6% |
| 25 to 29 Minutes | 79 | 8.7% |
| 30 to 34 Minutes | 110 | 12.1% |
| 35 to 39 Minutes | 57 | 6.3% |
| 40 to 44 Minutes | 34 | 3.7% |
| 45 to 59 Minutes | 208 | 22.8% |
| 60 to 89 Minutes | 19 | 2.1% |
| 90 or more Minutes | 17 | 1.9% |
Commute Time by Sex in Camden
The most common commute times in Camden are 45 to 59 minutes (108 commuters, 22.9%) for males and 45 to 59 minutes (100 commuters, 22.7%) for females.
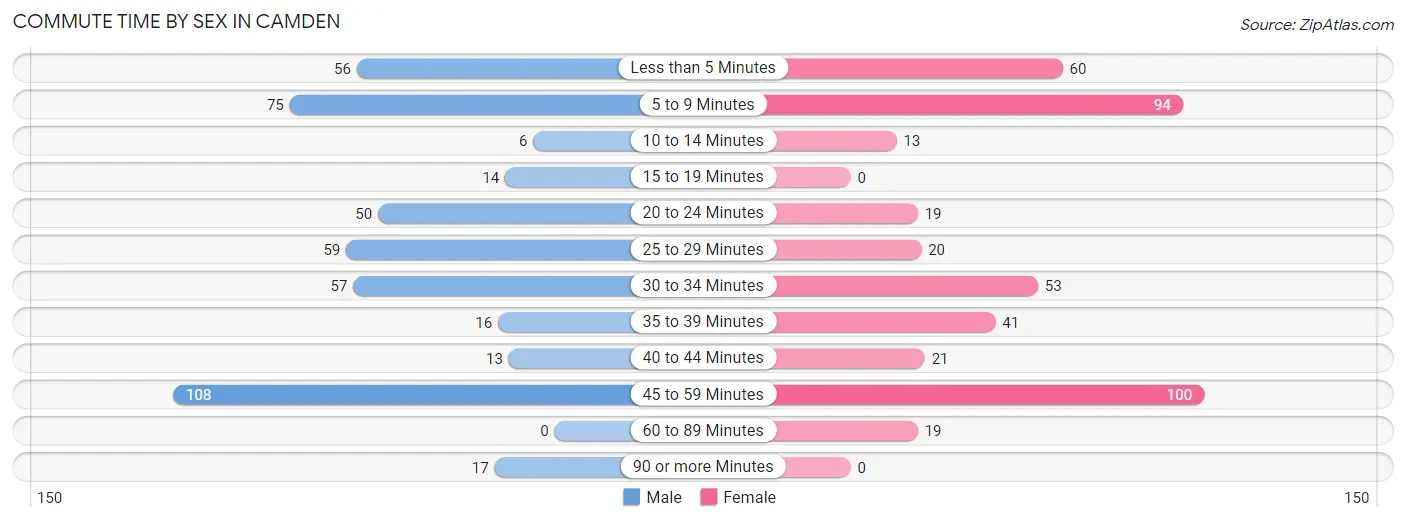
| Commute Time | Male | Female |
| Less than 5 Minutes | 56 (11.9%) | 60 (13.6%) |
| 5 to 9 Minutes | 75 (15.9%) | 94 (21.4%) |
| 10 to 14 Minutes | 6 (1.3%) | 13 (2.9%) |
| 15 to 19 Minutes | 14 (3.0%) | 0 (0.0%) |
| 20 to 24 Minutes | 50 (10.6%) | 19 (4.3%) |
| 25 to 29 Minutes | 59 (12.5%) | 20 (4.5%) |
| 30 to 34 Minutes | 57 (12.1%) | 53 (12.0%) |
| 35 to 39 Minutes | 16 (3.4%) | 41 (9.3%) |
| 40 to 44 Minutes | 13 (2.8%) | 21 (4.8%) |
| 45 to 59 Minutes | 108 (22.9%) | 100 (22.7%) |
| 60 to 89 Minutes | 0 (0.0%) | 19 (4.3%) |
| 90 or more Minutes | 17 (3.6%) | 0 (0.0%) |
Time of Departure to Work by Sex in Camden
The most frequent times of departure to work in Camden are 6:00 AM to 6:29 AM (95, 20.2%) for males and 7:30 AM to 7:59 AM (109, 24.8%) for females.
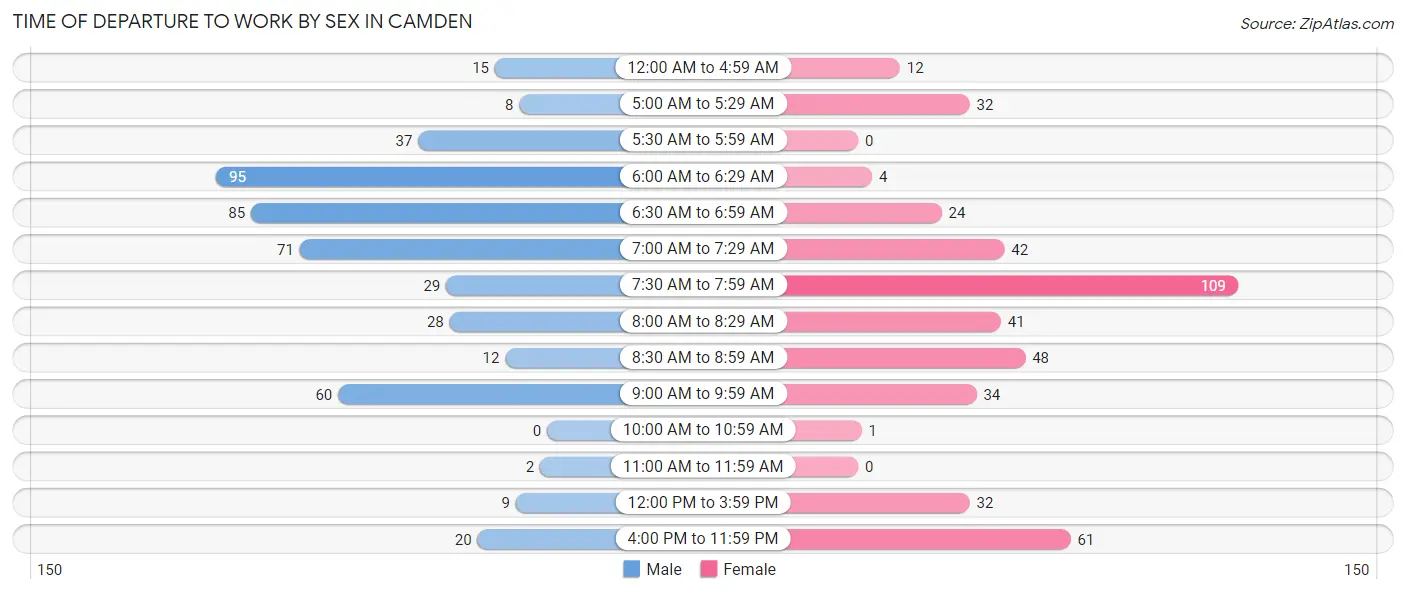
| Time of Departure | Male | Female |
| 12:00 AM to 4:59 AM | 15 (3.2%) | 12 (2.7%) |
| 5:00 AM to 5:29 AM | 8 (1.7%) | 32 (7.3%) |
| 5:30 AM to 5:59 AM | 37 (7.9%) | 0 (0.0%) |
| 6:00 AM to 6:29 AM | 95 (20.2%) | 4 (0.9%) |
| 6:30 AM to 6:59 AM | 85 (18.0%) | 24 (5.4%) |
| 7:00 AM to 7:29 AM | 71 (15.1%) | 42 (9.6%) |
| 7:30 AM to 7:59 AM | 29 (6.2%) | 109 (24.8%) |
| 8:00 AM to 8:29 AM | 28 (5.9%) | 41 (9.3%) |
| 8:30 AM to 8:59 AM | 12 (2.5%) | 48 (10.9%) |
| 9:00 AM to 9:59 AM | 60 (12.7%) | 34 (7.7%) |
| 10:00 AM to 10:59 AM | 0 (0.0%) | 1 (0.2%) |
| 11:00 AM to 11:59 AM | 2 (0.4%) | 0 (0.0%) |
| 12:00 PM to 3:59 PM | 9 (1.9%) | 32 (7.3%) |
| 4:00 PM to 11:59 PM | 20 (4.3%) | 61 (13.9%) |
| Total | 471 (100.0%) | 440 (100.0%) |
Housing Occupancy in Camden
Occupancy by Ownership in Camden
Of the total 1,036 dwellings in Camden, owner-occupied units account for 724 (69.9%), while renter-occupied units make up 312 (30.1%).
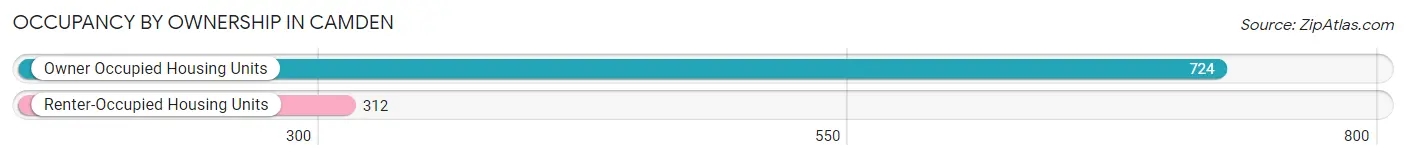
| Occupancy | # Housing Units | % Housing Units |
| Owner Occupied Housing Units | 724 | 69.9% |
| Renter-Occupied Housing Units | 312 | 30.1% |
| Total Occupied Housing Units | 1,036 | 100.0% |
Occupancy by Household Size in Camden
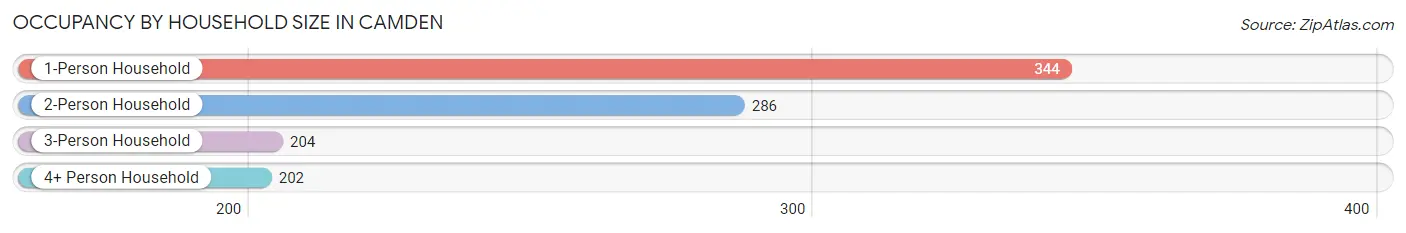
| Household Size | # Housing Units | % Housing Units |
| 1-Person Household | 344 | 33.2% |
| 2-Person Household | 286 | 27.6% |
| 3-Person Household | 204 | 19.7% |
| 4+ Person Household | 202 | 19.5% |
| Total Housing Units | 1,036 | 100.0% |
Occupancy by Ownership by Household Size in Camden
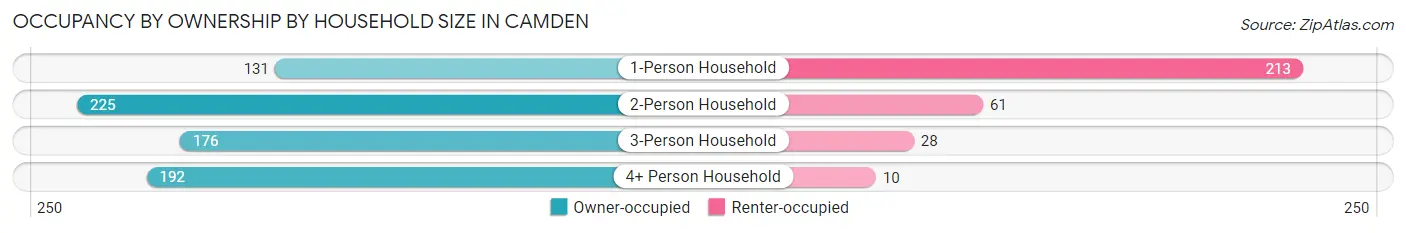
| Household Size | Owner-occupied | Renter-occupied |
| 1-Person Household | 131 (38.1%) | 213 (61.9%) |
| 2-Person Household | 225 (78.7%) | 61 (21.3%) |
| 3-Person Household | 176 (86.3%) | 28 (13.7%) |
| 4+ Person Household | 192 (95.1%) | 10 (5.0%) |
| Total Housing Units | 724 (69.9%) | 312 (30.1%) |
Occupancy by Educational Attainment in Camden
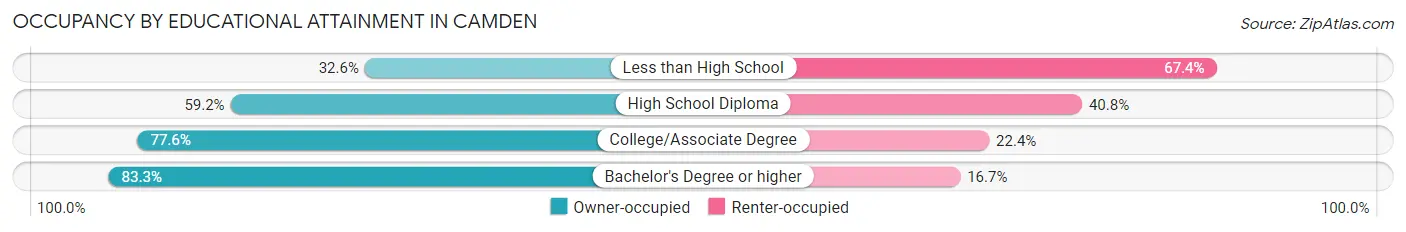
| Household Size | Owner-occupied | Renter-occupied |
| Less than High School | 28 (32.6%) | 58 (67.4%) |
| High School Diploma | 190 (59.2%) | 131 (40.8%) |
| College/Associate Degree | 246 (77.6%) | 71 (22.4%) |
| Bachelor's Degree or higher | 260 (83.3%) | 52 (16.7%) |
Occupancy by Age of Householder in Camden
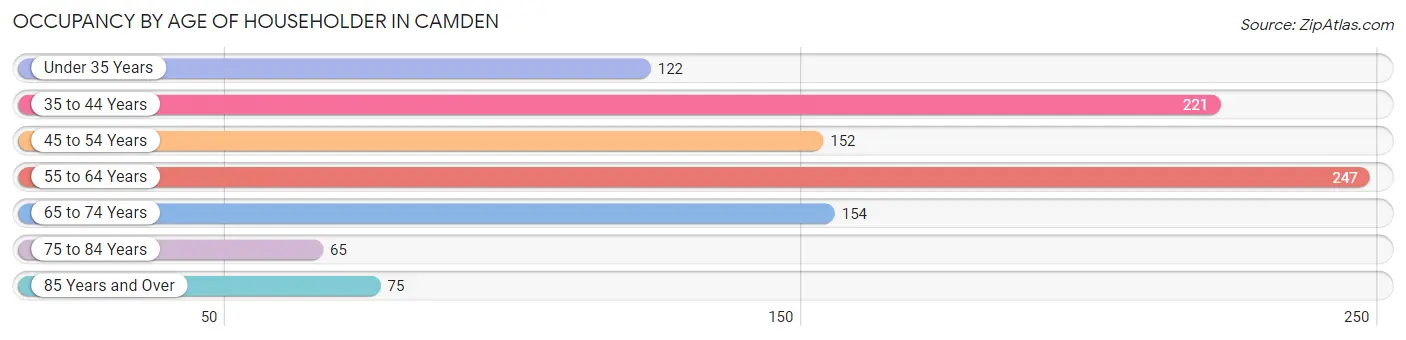
| Age Bracket | # Households | % Households |
| Under 35 Years | 122 | 11.8% |
| 35 to 44 Years | 221 | 21.3% |
| 45 to 54 Years | 152 | 14.7% |
| 55 to 64 Years | 247 | 23.8% |
| 65 to 74 Years | 154 | 14.9% |
| 75 to 84 Years | 65 | 6.3% |
| 85 Years and Over | 75 | 7.2% |
| Total | 1,036 | 100.0% |
Housing Finances in Camden
Median Income by Occupancy in Camden
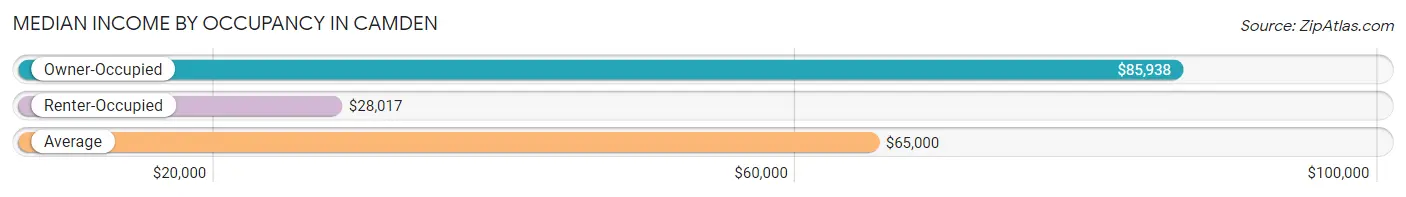
| Occupancy Type | # Households | Median Income |
| Owner-Occupied | 724 (69.9%) | $85,938 |
| Renter-Occupied | 312 (30.1%) | $28,017 |
| Average | 1,036 (100.0%) | $65,000 |
Occupancy by Householder Income Bracket in Camden
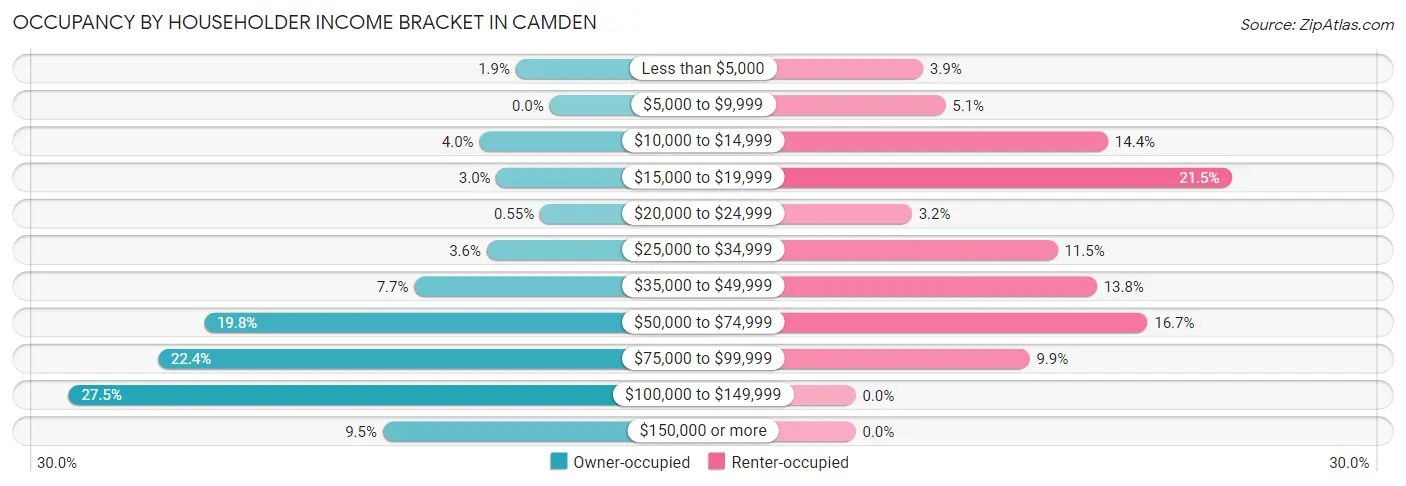
| Income Bracket | Owner-occupied | Renter-occupied |
| Less than $5,000 | 14 (1.9%) | 12 (3.8%) |
| $5,000 to $9,999 | 0 (0.0%) | 16 (5.1%) |
| $10,000 to $14,999 | 29 (4.0%) | 45 (14.4%) |
| $15,000 to $19,999 | 22 (3.0%) | 67 (21.5%) |
| $20,000 to $24,999 | 4 (0.5%) | 10 (3.2%) |
| $25,000 to $34,999 | 26 (3.6%) | 36 (11.5%) |
| $35,000 to $49,999 | 56 (7.7%) | 43 (13.8%) |
| $50,000 to $74,999 | 143 (19.8%) | 52 (16.7%) |
| $75,000 to $99,999 | 162 (22.4%) | 31 (9.9%) |
| $100,000 to $149,999 | 199 (27.5%) | 0 (0.0%) |
| $150,000 or more | 69 (9.5%) | 0 (0.0%) |
| Total | 724 (100.0%) | 312 (100.0%) |
Monthly Housing Cost Tiers in Camden
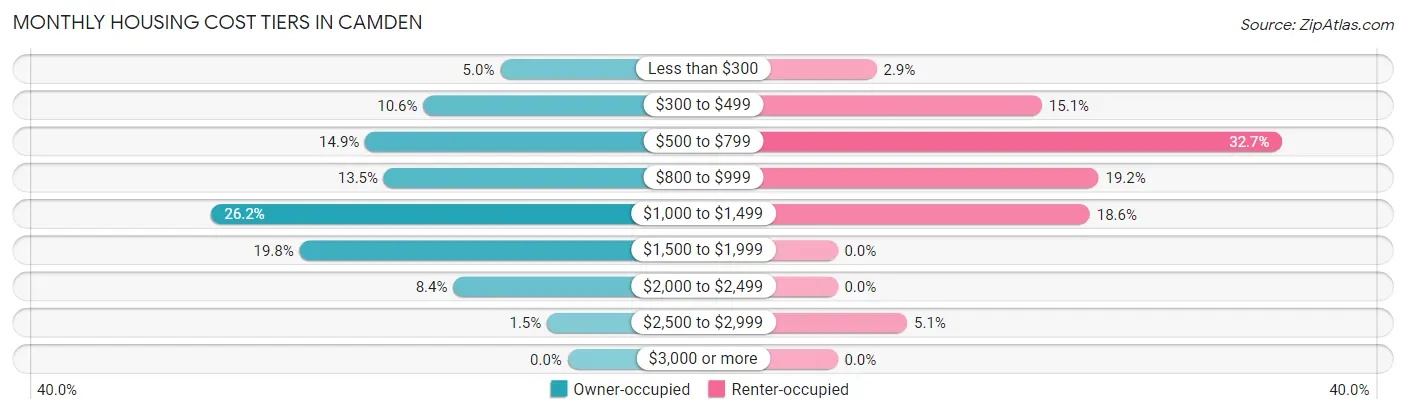
| Monthly Cost | Owner-occupied | Renter-occupied |
| Less than $300 | 36 (5.0%) | 9 (2.9%) |
| $300 to $499 | 77 (10.6%) | 47 (15.1%) |
| $500 to $799 | 108 (14.9%) | 102 (32.7%) |
| $800 to $999 | 98 (13.5%) | 60 (19.2%) |
| $1,000 to $1,499 | 190 (26.2%) | 58 (18.6%) |
| $1,500 to $1,999 | 143 (19.8%) | 0 (0.0%) |
| $2,000 to $2,499 | 61 (8.4%) | 0 (0.0%) |
| $2,500 to $2,999 | 11 (1.5%) | 16 (5.1%) |
| $3,000 or more | 0 (0.0%) | 0 (0.0%) |
| Total | 724 (100.0%) | 312 (100.0%) |
Physical Housing Characteristics in Camden
Housing Structures in Camden
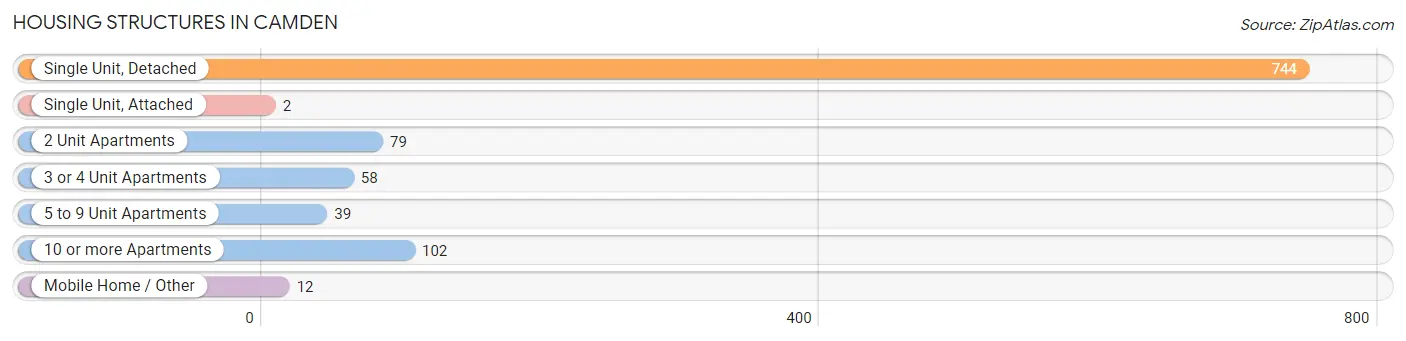
| Structure Type | # Housing Units | % Housing Units |
| Single Unit, Detached | 744 | 71.8% |
| Single Unit, Attached | 2 | 0.2% |
| 2 Unit Apartments | 79 | 7.6% |
| 3 or 4 Unit Apartments | 58 | 5.6% |
| 5 to 9 Unit Apartments | 39 | 3.8% |
| 10 or more Apartments | 102 | 9.9% |
| Mobile Home / Other | 12 | 1.2% |
| Total | 1,036 | 100.0% |
Housing Structures by Occupancy in Camden
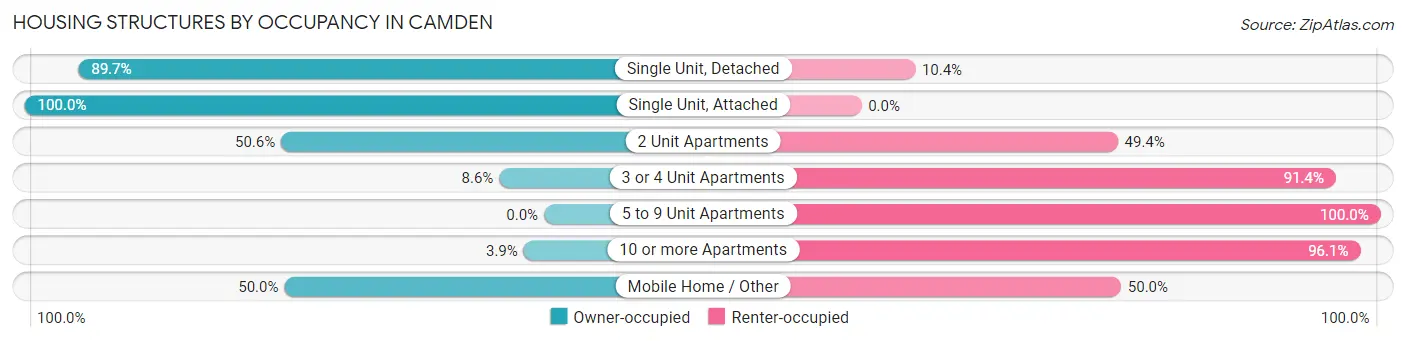
| Structure Type | Owner-occupied | Renter-occupied |
| Single Unit, Detached | 667 (89.6%) | 77 (10.3%) |
| Single Unit, Attached | 2 (100.0%) | 0 (0.0%) |
| 2 Unit Apartments | 40 (50.6%) | 39 (49.4%) |
| 3 or 4 Unit Apartments | 5 (8.6%) | 53 (91.4%) |
| 5 to 9 Unit Apartments | 0 (0.0%) | 39 (100.0%) |
| 10 or more Apartments | 4 (3.9%) | 98 (96.1%) |
| Mobile Home / Other | 6 (50.0%) | 6 (50.0%) |
| Total | 724 (69.9%) | 312 (30.1%) |
Housing Structures by Number of Rooms in Camden
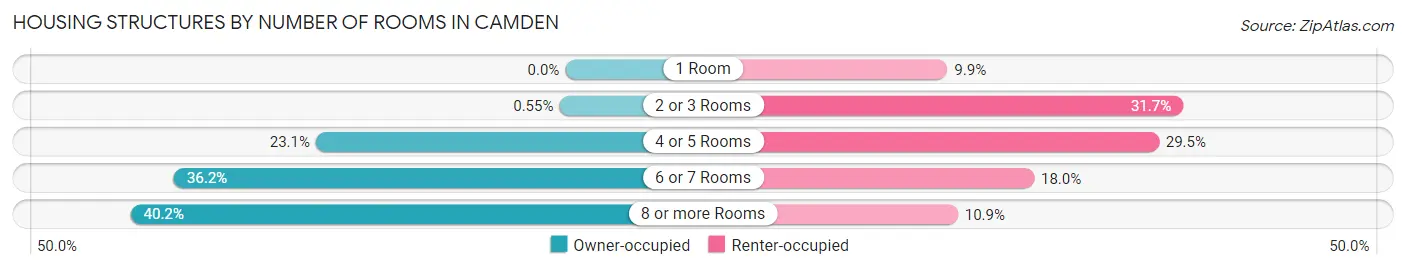
| Number of Rooms | Owner-occupied | Renter-occupied |
| 1 Room | 0 (0.0%) | 31 (9.9%) |
| 2 or 3 Rooms | 4 (0.5%) | 99 (31.7%) |
| 4 or 5 Rooms | 167 (23.1%) | 92 (29.5%) |
| 6 or 7 Rooms | 262 (36.2%) | 56 (17.9%) |
| 8 or more Rooms | 291 (40.2%) | 34 (10.9%) |
| Total | 724 (100.0%) | 312 (100.0%) |
Housing Structure by Heating Type in Camden
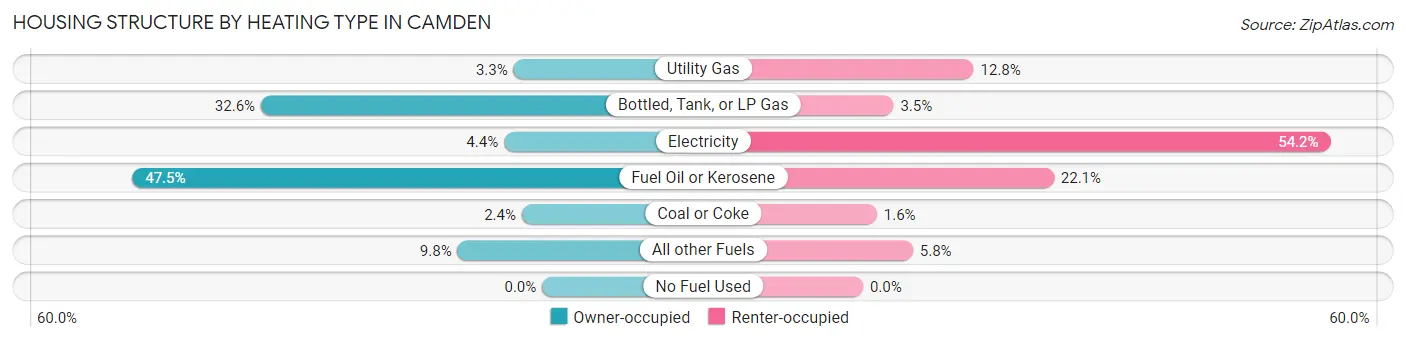
| Heating Type | Owner-occupied | Renter-occupied |
| Utility Gas | 24 (3.3%) | 40 (12.8%) |
| Bottled, Tank, or LP Gas | 236 (32.6%) | 11 (3.5%) |
| Electricity | 32 (4.4%) | 169 (54.2%) |
| Fuel Oil or Kerosene | 344 (47.5%) | 69 (22.1%) |
| Coal or Coke | 17 (2.4%) | 5 (1.6%) |
| All other Fuels | 71 (9.8%) | 18 (5.8%) |
| No Fuel Used | 0 (0.0%) | 0 (0.0%) |
| Total | 724 (100.0%) | 312 (100.0%) |
Household Vehicle Usage in Camden
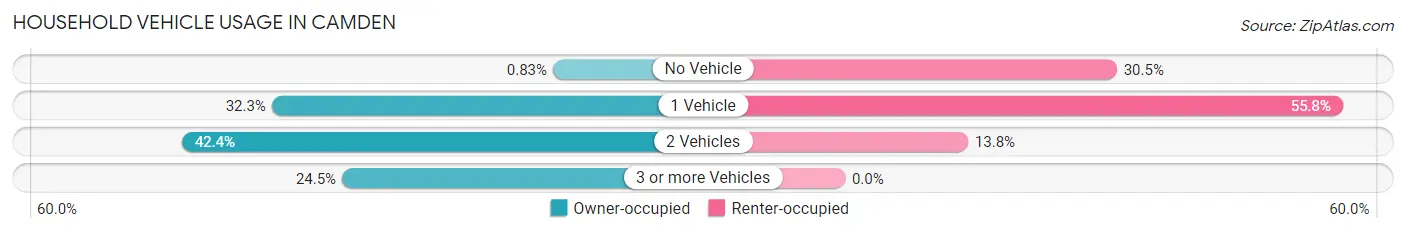
| Vehicles per Household | Owner-occupied | Renter-occupied |
| No Vehicle | 6 (0.8%) | 95 (30.4%) |
| 1 Vehicle | 234 (32.3%) | 174 (55.8%) |
| 2 Vehicles | 307 (42.4%) | 43 (13.8%) |
| 3 or more Vehicles | 177 (24.4%) | 0 (0.0%) |
| Total | 724 (100.0%) | 312 (100.0%) |
Real Estate & Mortgages in Camden
Real Estate and Mortgage Overview in Camden
| Characteristic | Without Mortgage | With Mortgage |
| Housing Units | 270 | 454 |
| Median Property Value | $102,100 | $165,700 |
| Median Household Income | $60,606 | $63 |
| Monthly Housing Costs | $581 | $0 |
| Real Estate Taxes | $2,255 | $0 |
Property Value by Mortgage Status in Camden
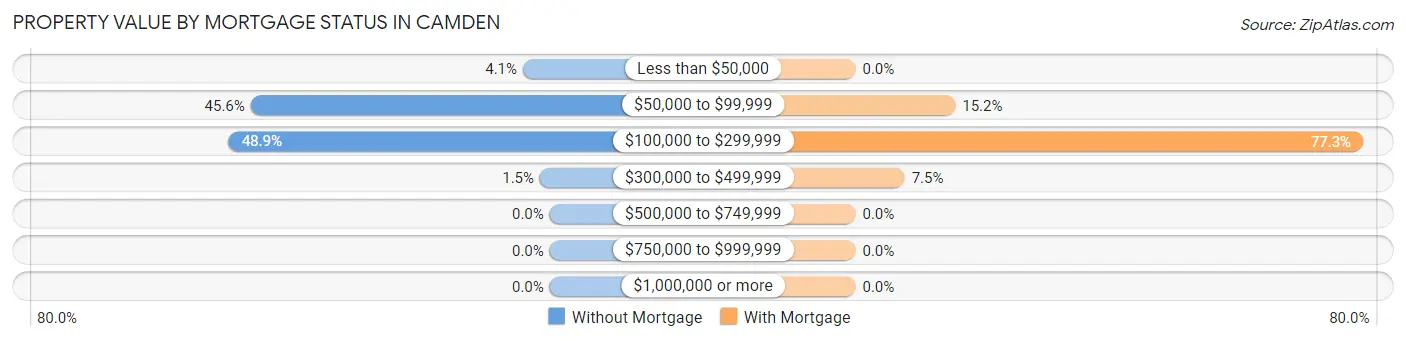
| Property Value | Without Mortgage | With Mortgage |
| Less than $50,000 | 11 (4.1%) | 0 (0.0%) |
| $50,000 to $99,999 | 123 (45.6%) | 69 (15.2%) |
| $100,000 to $299,999 | 132 (48.9%) | 351 (77.3%) |
| $300,000 to $499,999 | 4 (1.5%) | 34 (7.5%) |
| $500,000 to $749,999 | 0 (0.0%) | 0 (0.0%) |
| $750,000 to $999,999 | 0 (0.0%) | 0 (0.0%) |
| $1,000,000 or more | 0 (0.0%) | 0 (0.0%) |
| Total | 270 (100.0%) | 454 (100.0%) |
Household Income by Mortgage Status in Camden
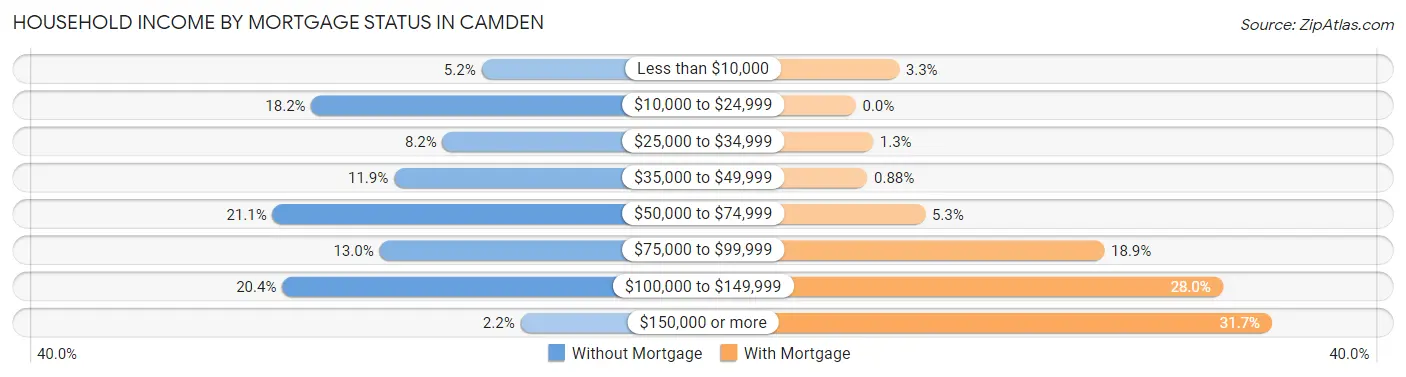
| Household Income | Without Mortgage | With Mortgage |
| Less than $10,000 | 14 (5.2%) | 15 (3.3%) |
| $10,000 to $24,999 | 49 (18.1%) | 0 (0.0%) |
| $25,000 to $34,999 | 22 (8.2%) | 6 (1.3%) |
| $35,000 to $49,999 | 32 (11.8%) | 4 (0.9%) |
| $50,000 to $74,999 | 57 (21.1%) | 24 (5.3%) |
| $75,000 to $99,999 | 35 (13.0%) | 86 (18.9%) |
| $100,000 to $149,999 | 55 (20.4%) | 127 (28.0%) |
| $150,000 or more | 6 (2.2%) | 144 (31.7%) |
| Total | 270 (100.0%) | 454 (100.0%) |
Property Value to Household Income Ratio in Camden
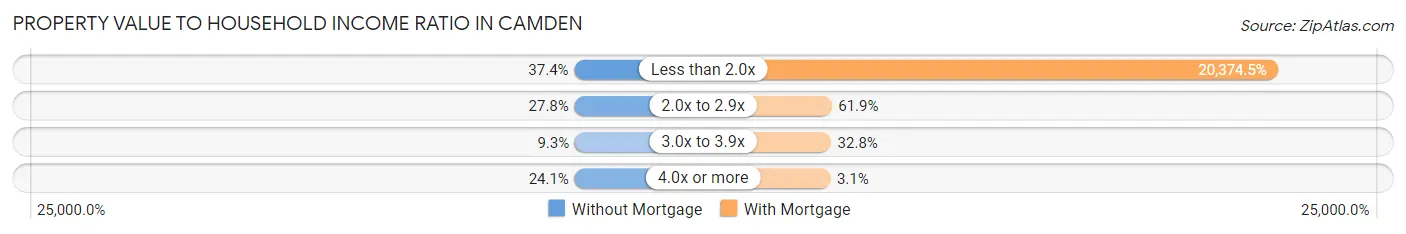
| Value-to-Income Ratio | Without Mortgage | With Mortgage |
| Less than 2.0x | 101 (37.4%) | 92,500 (20,374.4%) |
| 2.0x to 2.9x | 75 (27.8%) | 281 (61.9%) |
| 3.0x to 3.9x | 25 (9.3%) | 149 (32.8%) |
| 4.0x or more | 65 (24.1%) | 14 (3.1%) |
| Total | 270 (100.0%) | 454 (100.0%) |
Real Estate Taxes by Mortgage Status in Camden
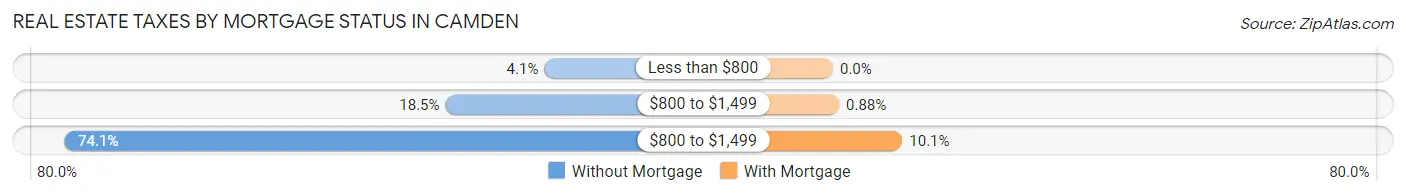
| Property Taxes | Without Mortgage | With Mortgage |
| Less than $800 | 11 (4.1%) | 0 (0.0%) |
| $800 to $1,499 | 50 (18.5%) | 4 (0.9%) |
| $800 to $1,499 | 200 (74.1%) | 46 (10.1%) |
| Total | 270 (100.0%) | 454 (100.0%) |
Health & Disability in Camden
Health Insurance Coverage by Age in Camden
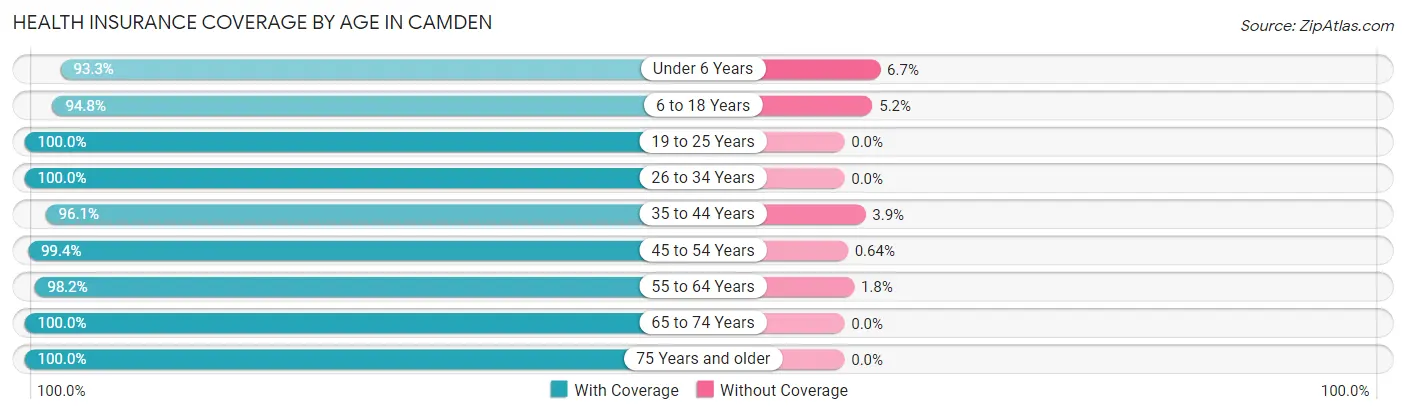
| Age Bracket | With Coverage | Without Coverage |
| Under 6 Years | 223 (93.3%) | 16 (6.7%) |
| 6 to 18 Years | 508 (94.8%) | 28 (5.2%) |
| 19 to 25 Years | 106 (100.0%) | 0 (0.0%) |
| 26 to 34 Years | 189 (100.0%) | 0 (0.0%) |
| 35 to 44 Years | 367 (96.1%) | 15 (3.9%) |
| 45 to 54 Years | 311 (99.4%) | 2 (0.6%) |
| 55 to 64 Years | 380 (98.2%) | 7 (1.8%) |
| 65 to 74 Years | 250 (100.0%) | 0 (0.0%) |
| 75 Years and older | 166 (100.0%) | 0 (0.0%) |
| Total | 2,500 (97.4%) | 68 (2.6%) |
Health Insurance Coverage by Citizenship Status in Camden
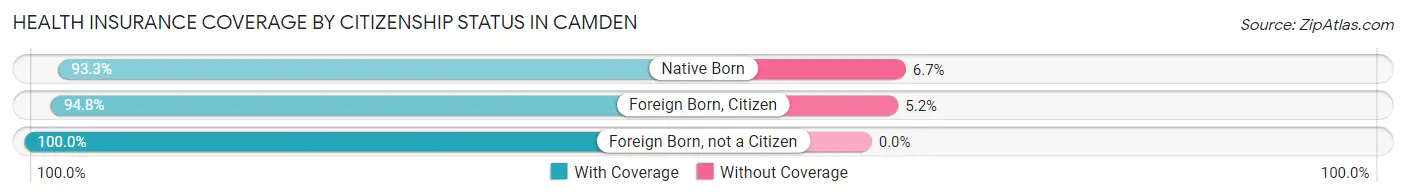
| Citizenship Status | With Coverage | Without Coverage |
| Native Born | 223 (93.3%) | 16 (6.7%) |
| Foreign Born, Citizen | 508 (94.8%) | 28 (5.2%) |
| Foreign Born, not a Citizen | 106 (100.0%) | 0 (0.0%) |
Health Insurance Coverage by Household Income in Camden
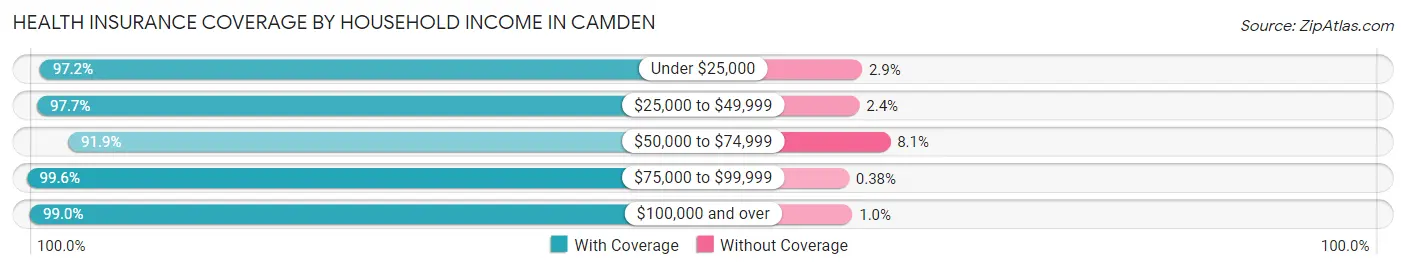
| Household Income | With Coverage | Without Coverage |
| Under $25,000 | 239 (97.2%) | 7 (2.9%) |
| $25,000 to $49,999 | 249 (97.7%) | 6 (2.4%) |
| $50,000 to $74,999 | 485 (91.9%) | 43 (8.1%) |
| $75,000 to $99,999 | 518 (99.6%) | 2 (0.4%) |
| $100,000 and over | 957 (99.0%) | 10 (1.0%) |
Public vs Private Health Insurance Coverage by Age in Camden
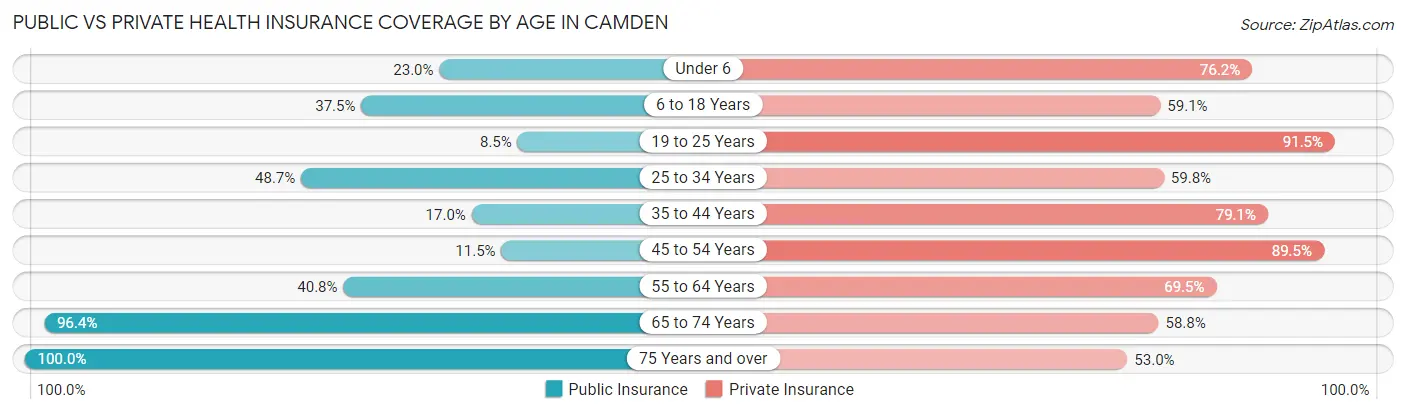
| Age Bracket | Public Insurance | Private Insurance |
| Under 6 | 55 (23.0%) | 182 (76.1%) |
| 6 to 18 Years | 201 (37.5%) | 317 (59.1%) |
| 19 to 25 Years | 9 (8.5%) | 97 (91.5%) |
| 25 to 34 Years | 92 (48.7%) | 113 (59.8%) |
| 35 to 44 Years | 65 (17.0%) | 302 (79.1%) |
| 45 to 54 Years | 36 (11.5%) | 280 (89.5%) |
| 55 to 64 Years | 158 (40.8%) | 269 (69.5%) |
| 65 to 74 Years | 241 (96.4%) | 147 (58.8%) |
| 75 Years and over | 166 (100.0%) | 88 (53.0%) |
| Total | 1,023 (39.8%) | 1,795 (69.9%) |
Disability Status by Sex by Age in Camden
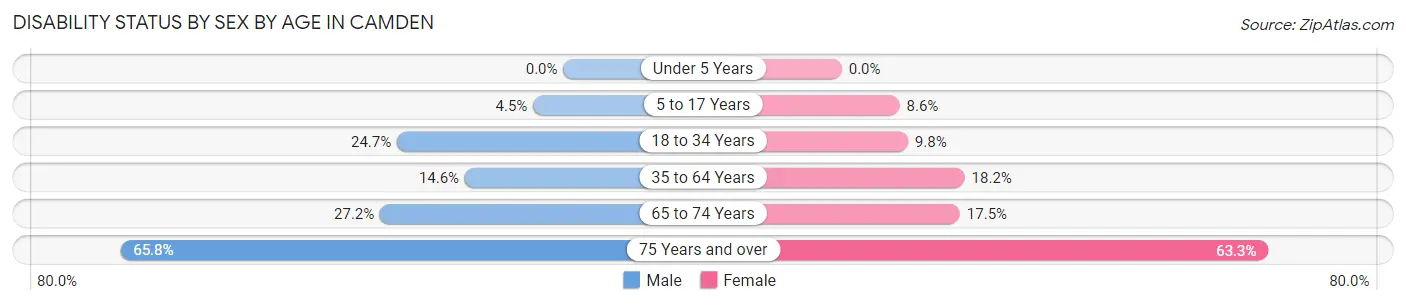
| Age Bracket | Male | Female |
| Under 5 Years | 0 (0.0%) | 0 (0.0%) |
| 5 to 17 Years | 10 (4.5%) | 26 (8.6%) |
| 18 to 34 Years | 40 (24.7%) | 16 (9.8%) |
| 35 to 64 Years | 70 (14.6%) | 110 (18.2%) |
| 65 to 74 Years | 37 (27.2%) | 20 (17.5%) |
| 75 Years and over | 50 (65.8%) | 57 (63.3%) |
Disability Class by Sex by Age in Camden
Disability Class: Hearing Difficulty
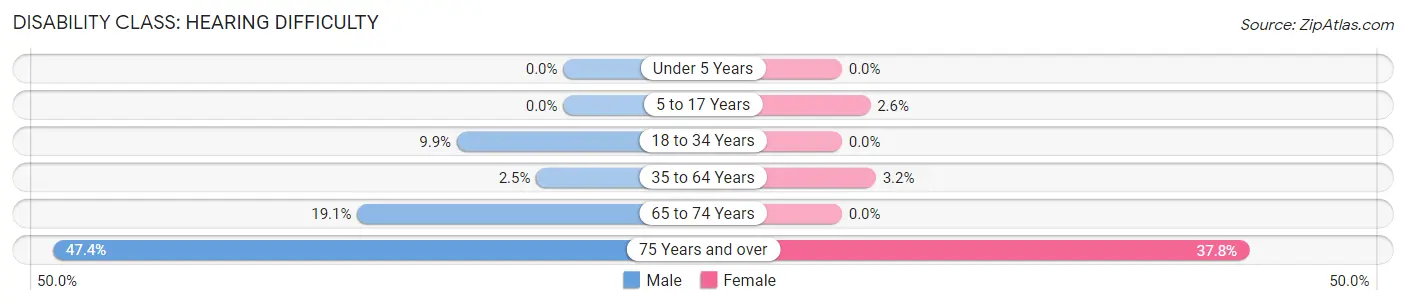
| Age Bracket | Male | Female |
| Under 5 Years | 0 (0.0%) | 0 (0.0%) |
| 5 to 17 Years | 0 (0.0%) | 8 (2.6%) |
| 18 to 34 Years | 16 (9.9%) | 0 (0.0%) |
| 35 to 64 Years | 12 (2.5%) | 19 (3.2%) |
| 65 to 74 Years | 26 (19.1%) | 0 (0.0%) |
| 75 Years and over | 36 (47.4%) | 34 (37.8%) |
Disability Class: Vision Difficulty
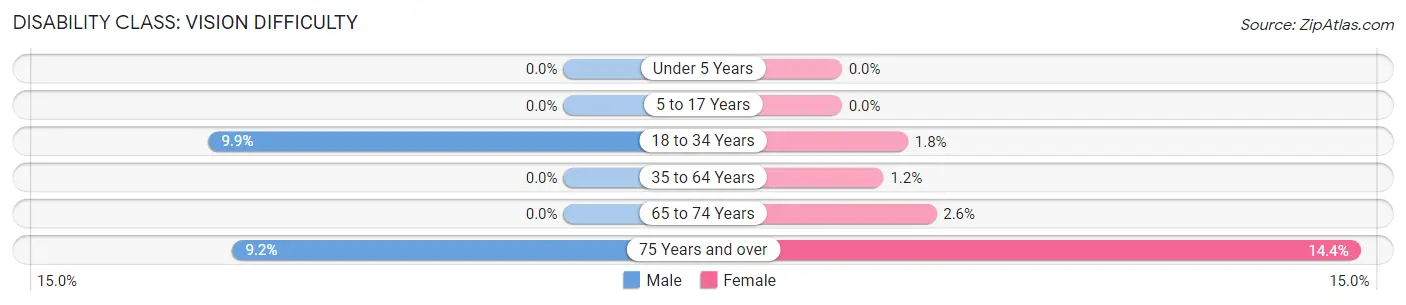
| Age Bracket | Male | Female |
| Under 5 Years | 0 (0.0%) | 0 (0.0%) |
| 5 to 17 Years | 0 (0.0%) | 0 (0.0%) |
| 18 to 34 Years | 16 (9.9%) | 3 (1.8%) |
| 35 to 64 Years | 0 (0.0%) | 7 (1.2%) |
| 65 to 74 Years | 0 (0.0%) | 3 (2.6%) |
| 75 Years and over | 7 (9.2%) | 13 (14.4%) |
Disability Class: Cognitive Difficulty
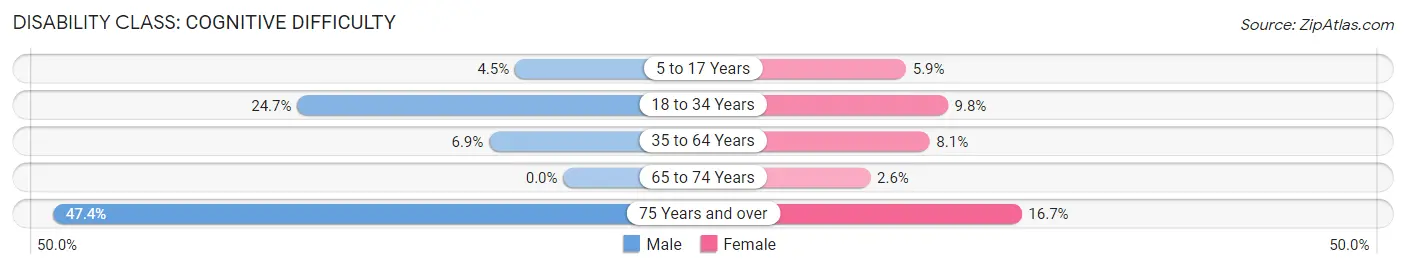
| Age Bracket | Male | Female |
| 5 to 17 Years | 10 (4.5%) | 18 (5.9%) |
| 18 to 34 Years | 40 (24.7%) | 16 (9.8%) |
| 35 to 64 Years | 33 (6.9%) | 49 (8.1%) |
| 65 to 74 Years | 0 (0.0%) | 3 (2.6%) |
| 75 Years and over | 36 (47.4%) | 15 (16.7%) |
Disability Class: Ambulatory Difficulty
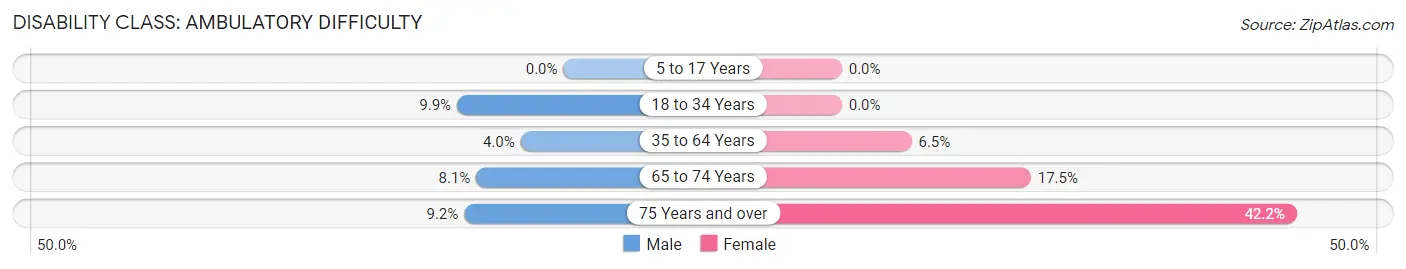
| Age Bracket | Male | Female |
| 5 to 17 Years | 0 (0.0%) | 0 (0.0%) |
| 18 to 34 Years | 16 (9.9%) | 0 (0.0%) |
| 35 to 64 Years | 19 (4.0%) | 39 (6.5%) |
| 65 to 74 Years | 11 (8.1%) | 20 (17.5%) |
| 75 Years and over | 7 (9.2%) | 38 (42.2%) |
Disability Class: Self-Care Difficulty
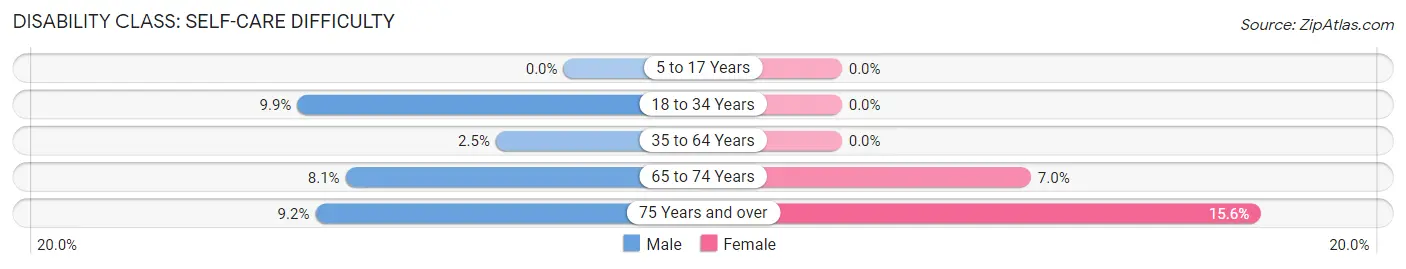
| Age Bracket | Male | Female |
| 5 to 17 Years | 0 (0.0%) | 0 (0.0%) |
| 18 to 34 Years | 16 (9.9%) | 0 (0.0%) |
| 35 to 64 Years | 12 (2.5%) | 0 (0.0%) |
| 65 to 74 Years | 11 (8.1%) | 8 (7.0%) |
| 75 Years and over | 7 (9.2%) | 14 (15.6%) |
Technology Access in Camden
Computing Device Access in Camden
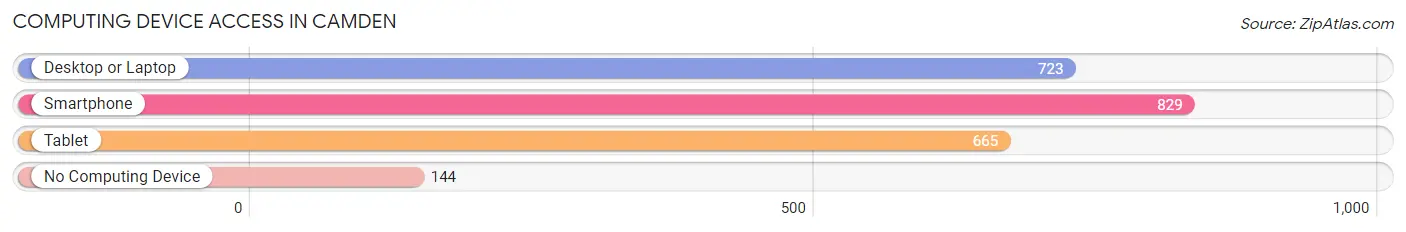
| Device Type | # Households | % Households |
| Desktop or Laptop | 723 | 69.8% |
| Smartphone | 829 | 80.0% |
| Tablet | 665 | 64.2% |
| No Computing Device | 144 | 13.9% |
| Total | 1,036 | 100.0% |
Internet Access in Camden
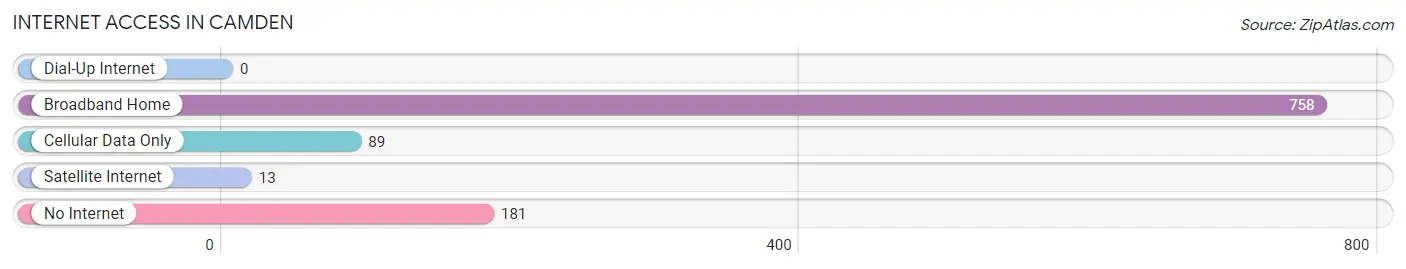
| Internet Type | # Households | % Households |
| Dial-Up Internet | 0 | 0.0% |
| Broadband Home | 758 | 73.2% |
| Cellular Data Only | 89 | 8.6% |
| Satellite Internet | 13 | 1.3% |
| No Internet | 181 | 17.5% |
| Total | 1,036 | 100.0% |
Camden Summary
Camden, New York is a small town located in Oneida County, in the state of New York. It is situated on the eastern shore of Oneida Lake, and is part of the Syracuse Metropolitan Statistical Area. The town has a population of approximately 4,000 people, and is known for its rural charm and small-town atmosphere.
History
The area that is now Camden was first settled in 1791 by a group of settlers from Connecticut. The town was originally known as “The Forks”, due to its location at the junction of the Oriskany and Oneida Creeks. In 1808, the town was officially incorporated as Camden, named after Charles Pratt, the first Earl of Camden.
The town grew slowly over the next few decades, and by the mid-1800s, it had become a thriving agricultural community. The town was also home to several mills, which provided employment for many of the town’s residents.
In the late 1800s, Camden began to experience a period of growth and prosperity. The town was home to several factories, including a paper mill, a furniture factory, and a tannery. The town also had a thriving tourism industry, as it was a popular destination for fishing and hunting.
Geography
Camden is located in the eastern part of Oneida County, in the state of New York. It is situated on the eastern shore of Oneida Lake, and is part of the Syracuse Metropolitan Statistical Area. The town has a total area of 8.2 square miles, of which 7.9 square miles is land and 0.3 square miles is water.
The terrain of Camden is mostly flat, with some rolling hills in the northern part of the town. The town is home to several small creeks and streams, as well as Oneida Lake. The lake is a popular destination for fishing, boating, and swimming.
Economy
The economy of Camden is largely based on agriculture and tourism. The town is home to several farms, which produce a variety of crops, including corn, soybeans, and hay. The town is also home to several wineries, which produce a variety of wines.
The town is also home to several small businesses, including restaurants, retail stores, and service providers. The town is also home to several manufacturing companies, which produce a variety of products, including furniture, paper products, and clothing.
Demographics
As of the 2010 census, the population of Camden was 4,000. The racial makeup of the town was 97.2% White, 0.7% African American, 0.2% Native American, 0.3% Asian, 0.1% Pacific Islander, 0.3% from other races, and 1.3% from two or more races. Hispanic or Latino of any race were 1.3% of the population.
The median household income in Camden was $45,000, and the median family income was $50,000. The per capita income for the town was $20,000. About 10.3% of families and 12.2% of the population were below the poverty line, including 16.7% of those under age 18 and 8.3% of those age 65 or over.
Common Questions
What is Per Capita Income in Camden?
Per Capita income in Camden is $29,866.
What is the Median Family Income in Camden?
Median Family Income in Camden is $82,321.
What is the Median Household income in Camden?
Median Household Income in Camden is $65,000.
What is Income or Wage Gap in Camden?
Income or Wage Gap in Camden is 13.7%.
Women in Camden earn 86.3 cents for every dollar earned by a man.
What is Inequality or Gini Index in Camden?
Inequality or Gini Index in Camden is 0.38.
What is the Total Population of Camden?
Total Population of Camden is 2,578.
What is the Total Male Population of Camden?
Total Male Population of Camden is 1,246.
What is the Total Female Population of Camden?
Total Female Population of Camden is 1,332.
What is the Ratio of Males per 100 Females in Camden?
There are 93.54 Males per 100 Females in Camden.
What is the Ratio of Females per 100 Males in Camden?
There are 106.90 Females per 100 Males in Camden.
What is the Median Population Age in Camden?
Median Population Age in Camden is 39.3 Years.
What is the Average Family Size in Camden
Average Family Size in Camden is 3.1 People.
What is the Average Household Size in Camden
Average Household Size in Camden is 2.4 People.
How Large is the Labor Force in Camden?
There are 1,127 People in the Labor Forcein in Camden.
What is the Percentage of People in the Labor Force in Camden?
58.6% of People are in the Labor Force in Camden.
What is the Unemployment Rate in Camden?
Unemployment Rate in Camden is 2.2%.