Oneida County, NY Map & Demographics
Oneida County Map
Oneida County Overview
$35,284
PER CAPITA INCOME
$84,410
AVG FAMILY INCOME
$66,402
AVG HOUSEHOLD INCOME
23.8%
WAGE / INCOME GAP [ % ]
76.2¢/ $1
WAGE / INCOME GAP [ $ ]
$11,913
FAMILY INCOME DEFICIT
0.45
INEQUALITY / GINI INDEX
231,055
TOTAL POPULATION
115,677
MALE POPULATION
115,378
FEMALE POPULATION
100.26
MALES / 100 FEMALES
99.74
FEMALES / 100 MALES
40.9
MEDIAN AGE
3.0
AVG FAMILY SIZE
2.4
AVG HOUSEHOLD SIZE
108,160
LABOR FORCE [ PEOPLE ]
57.7%
PERCENT IN LABOR FORCE
4.4%
UNEMPLOYMENT RATE
Oneida County Area Codes
Income in Oneida County
Income Overview in Oneida County
Per Capita Income in Oneida County is $35,284, while median incomes of families and households are $84,410 and $66,402 respectively.
| Characteristic | Number | Measure |
| Per Capita Income | 231,055 | $35,284 |
| Median Family Income | 57,638 | $84,410 |
| Mean Family Income | 57,638 | $103,601 |
| Median Household Income | 92,944 | $66,402 |
| Mean Household Income | 92,944 | $86,787 |
| Income Deficit | 57,638 | $11,913 |
| Wage / Income Gap (%) | 231,055 | 23.78% |
| Wage / Income Gap ($) | 231,055 | 76.22¢ per $1 |
| Gini / Inequality Index | 231,055 | 0.45 |
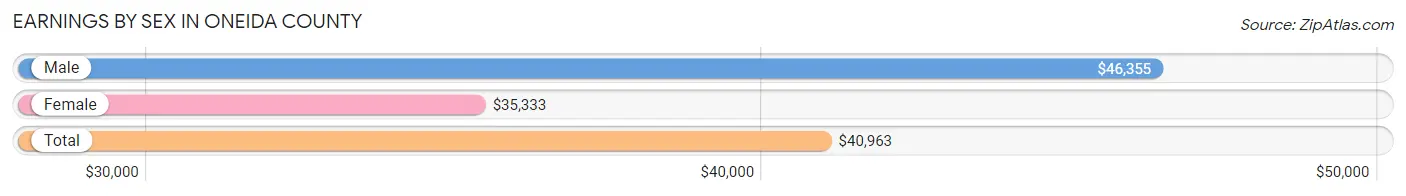
Earnings by Sex in Oneida County
Average Earnings in Oneida County are $40,963, $46,355 for men and $35,333 for women, a difference of 23.8%.
| Sex | Number | Average Earnings |
| Male | 60,492 (52.6%) | $46,355 |
| Female | 54,440 (47.4%) | $35,333 |
| Total | 114,932 (100.0%) | $40,963 |
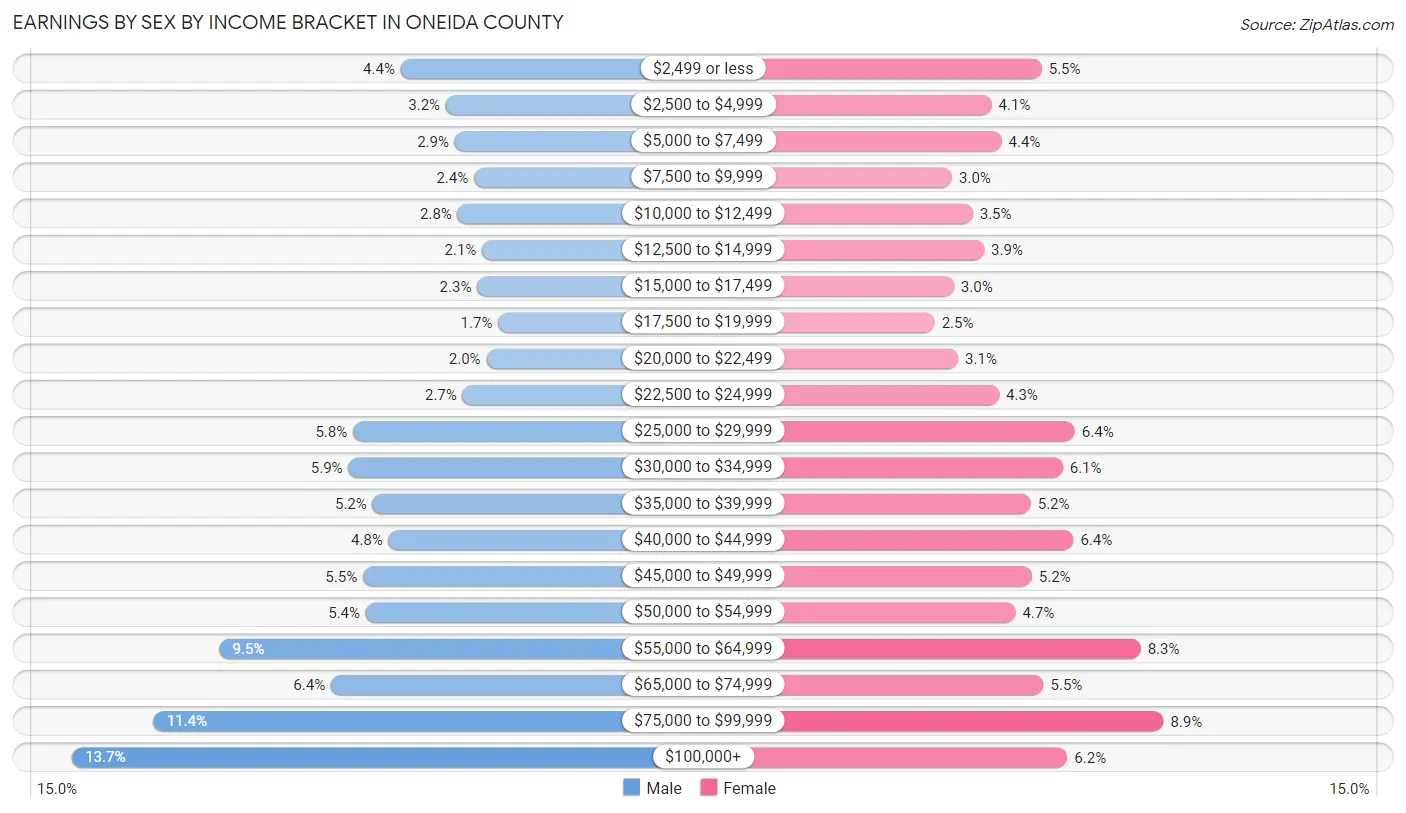
Earnings by Sex by Income Bracket in Oneida County
The most common earnings brackets in Oneida County are $100,000+ for men (8,262 | 13.7%) and $75,000 to $99,999 for women (4,846 | 8.9%).
| Income | Male | Female |
| $2,499 or less | 2,681 (4.4%) | 2,981 (5.5%) |
| $2,500 to $4,999 | 1,909 (3.2%) | 2,218 (4.1%) |
| $5,000 to $7,499 | 1,761 (2.9%) | 2,367 (4.3%) |
| $7,500 to $9,999 | 1,436 (2.4%) | 1,610 (3.0%) |
| $10,000 to $12,499 | 1,709 (2.8%) | 1,926 (3.5%) |
| $12,500 to $14,999 | 1,296 (2.1%) | 2,103 (3.9%) |
| $15,000 to $17,499 | 1,380 (2.3%) | 1,641 (3.0%) |
| $17,500 to $19,999 | 1,020 (1.7%) | 1,342 (2.5%) |
| $20,000 to $22,499 | 1,219 (2.0%) | 1,702 (3.1%) |
| $22,500 to $24,999 | 1,628 (2.7%) | 2,331 (4.3%) |
| $25,000 to $29,999 | 3,490 (5.8%) | 3,489 (6.4%) |
| $30,000 to $34,999 | 3,568 (5.9%) | 3,303 (6.1%) |
| $35,000 to $39,999 | 3,155 (5.2%) | 2,815 (5.2%) |
| $40,000 to $44,999 | 2,887 (4.8%) | 3,466 (6.4%) |
| $45,000 to $49,999 | 3,320 (5.5%) | 2,830 (5.2%) |
| $50,000 to $54,999 | 3,272 (5.4%) | 2,581 (4.7%) |
| $55,000 to $64,999 | 5,758 (9.5%) | 4,498 (8.3%) |
| $65,000 to $74,999 | 3,864 (6.4%) | 3,013 (5.5%) |
| $75,000 to $99,999 | 6,877 (11.4%) | 4,846 (8.9%) |
| $100,000+ | 8,262 (13.7%) | 3,378 (6.2%) |
| Total | 60,492 (100.0%) | 54,440 (100.0%) |
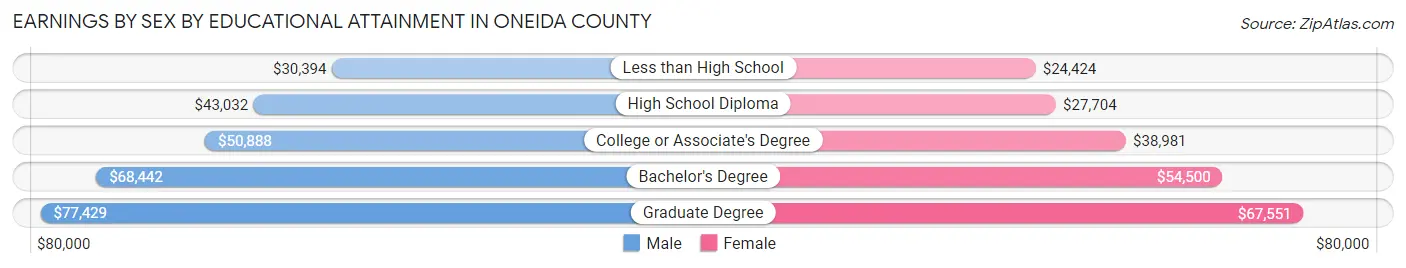
Earnings by Sex by Educational Attainment in Oneida County
Average earnings in Oneida County are $52,464 for men and $41,267 for women, a difference of 21.3%. Men with an educational attainment of graduate degree enjoy the highest average annual earnings of $77,429, while those with less than high school education earn the least with $30,394. Women with an educational attainment of graduate degree earn the most with the average annual earnings of $67,551, while those with less than high school education have the smallest earnings of $24,424.
| Educational Attainment | Male Income | Female Income |
| Less than High School | $30,394 | $24,424 |
| High School Diploma | $43,032 | $27,704 |
| College or Associate's Degree | $50,888 | $38,981 |
| Bachelor's Degree | $68,442 | $54,500 |
| Graduate Degree | $77,429 | $67,551 |
| Total | $52,464 | $41,267 |
Family Income in Oneida County
Family Income Brackets in Oneida County
According to the Oneida County family income data, there are 12,565 families falling into the $100,000 to $149,999 income range, which is the most common income bracket and makes up 21.8% of all families. Conversely, the $10,000 to $14,999 income bracket is the least frequent group with only 1,326 families (2.3%) belonging to this category.
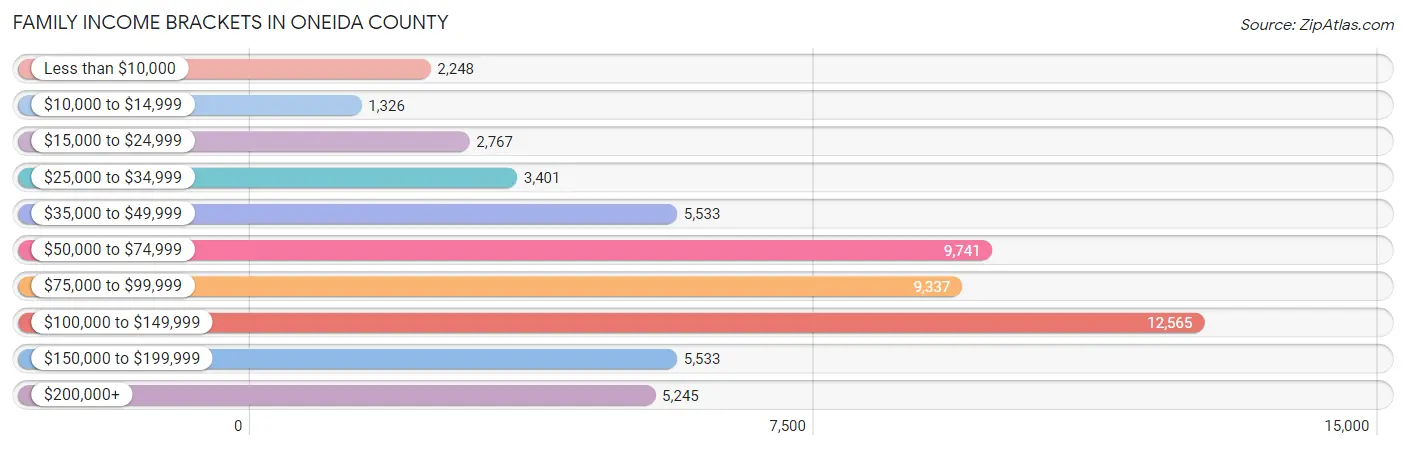
| Income Bracket | # Families | % Families |
| Less than $10,000 | 2,248 | 3.9% |
| $10,000 to $14,999 | 1,326 | 2.3% |
| $15,000 to $24,999 | 2,767 | 4.8% |
| $25,000 to $34,999 | 3,401 | 5.9% |
| $35,000 to $49,999 | 5,533 | 9.6% |
| $50,000 to $74,999 | 9,741 | 16.9% |
| $75,000 to $99,999 | 9,337 | 16.2% |
| $100,000 to $149,999 | 12,565 | 21.8% |
| $150,000 to $199,999 | 5,533 | 9.6% |
| $200,000+ | 5,245 | 9.1% |
Family Income by Famaliy Size in Oneida County
4-person families (9,804 | 17.0%) account for the highest median family income in Oneida County with $113,095 per family, while 2-person families (28,547 | 49.5%) have the highest median income of $38,341 per family member.
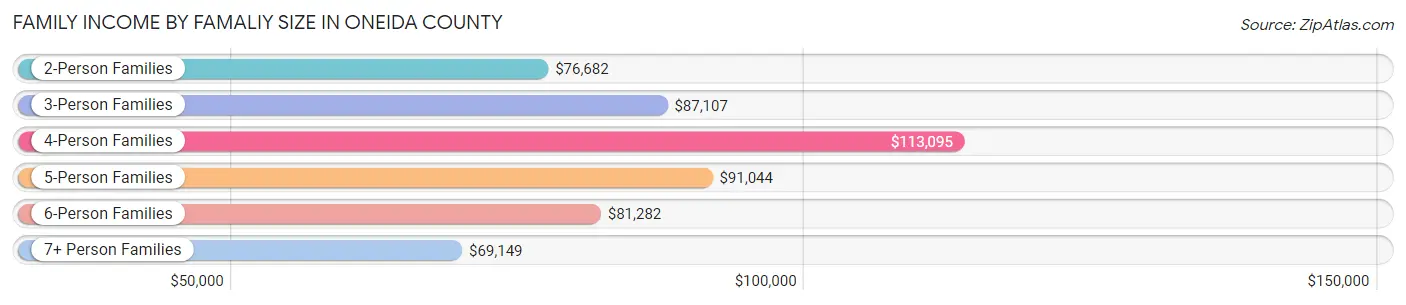
| Income Bracket | # Families | Median Income |
| 2-Person Families | 28,547 (49.5%) | $76,682 |
| 3-Person Families | 12,443 (21.6%) | $87,107 |
| 4-Person Families | 9,804 (17.0%) | $113,095 |
| 5-Person Families | 4,438 (7.7%) | $91,044 |
| 6-Person Families | 1,450 (2.5%) | $81,282 |
| 7+ Person Families | 956 (1.7%) | $69,149 |
| Total | 57,638 (100.0%) | $84,410 |
Family Income by Number of Earners in Oneida County
The median family income in Oneida County is $84,410, with families comprising 3+ earners (6,384) having the highest median family income of $135,595, while families with no earners (10,684) have the lowest median family income of $45,793, accounting for 11.1% and 18.5% of families, respectively.
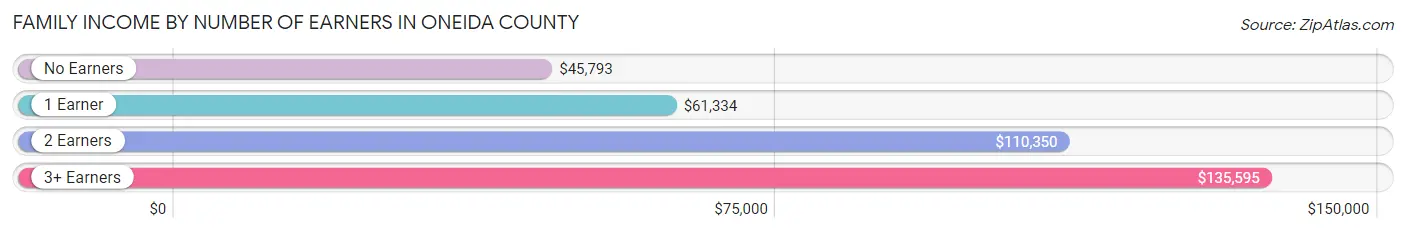
| Number of Earners | # Families | Median Income |
| No Earners | 10,684 (18.5%) | $45,793 |
| 1 Earner | 18,371 (31.9%) | $61,334 |
| 2 Earners | 22,199 (38.5%) | $110,350 |
| 3+ Earners | 6,384 (11.1%) | $135,595 |
| Total | 57,638 (100.0%) | $84,410 |
Household Income in Oneida County
Household Income Brackets in Oneida County
With 16,172 households falling in the category, the $50,000 to $74,999 income range is the most frequent in Oneida County, accounting for 17.4% of all households. In contrast, only 4,368 households (4.7%) fall into the less than $10,000 income bracket, making it the least populous group.
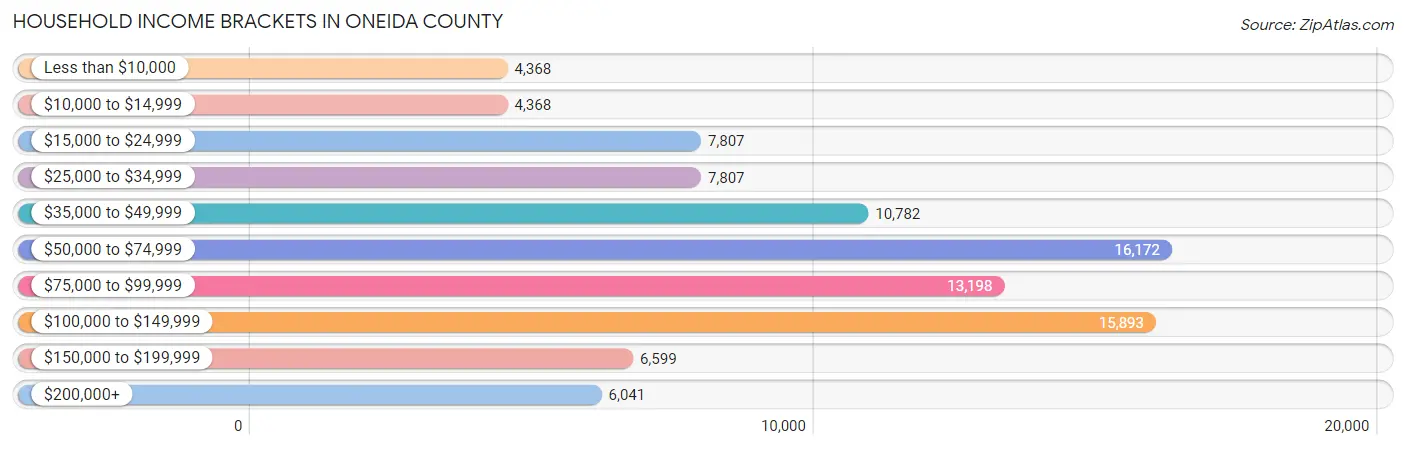
| Income Bracket | # Households | % Households |
| Less than $10,000 | 4,368 | 4.7% |
| $10,000 to $14,999 | 4,368 | 4.7% |
| $15,000 to $24,999 | 7,807 | 8.4% |
| $25,000 to $34,999 | 7,807 | 8.4% |
| $35,000 to $49,999 | 10,782 | 11.6% |
| $50,000 to $74,999 | 16,172 | 17.4% |
| $75,000 to $99,999 | 13,198 | 14.2% |
| $100,000 to $149,999 | 15,893 | 17.1% |
| $150,000 to $199,999 | 6,599 | 7.1% |
| $200,000+ | 6,041 | 6.5% |
Household Income by Householder Age in Oneida County
The median household income in Oneida County is $66,402, with the highest median household income of $81,609 found in the 45 to 64 years age bracket for the primary householder. A total of 35,080 households (37.7%) fall into this category. Meanwhile, the 15 to 24 years age bracket for the primary householder has the lowest median household income of $40,413, with 3,280 households (3.5%) in this group.
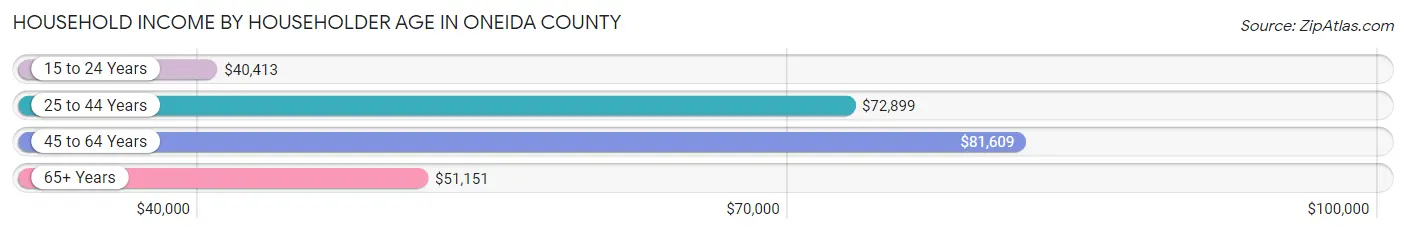
| Income Bracket | # Households | Median Income |
| 15 to 24 Years | 3,280 (3.5%) | $40,413 |
| 25 to 44 Years | 26,501 (28.5%) | $72,899 |
| 45 to 64 Years | 35,080 (37.7%) | $81,609 |
| 65+ Years | 28,083 (30.2%) | $51,151 |
| Total | 92,944 (100.0%) | $66,402 |
Poverty in Oneida County
Income Below Poverty by Sex and Age in Oneida County
With 13.6% poverty level for males and 15.3% for females among the residents of Oneida County, 5 year old males and under 5 year old females are the most vulnerable to poverty, with 379 males (24.5%) and 1,360 females (22.5%) in their respective age groups living below the poverty level.
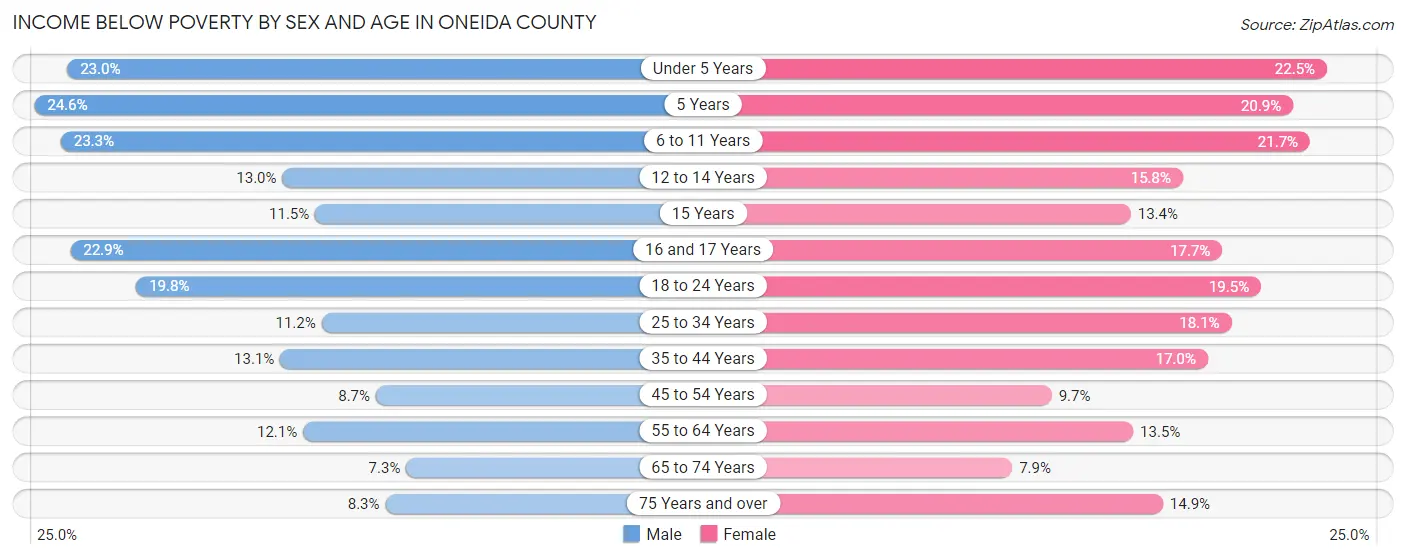
| Age Bracket | Male | Female |
| Under 5 Years | 1,498 (23.0%) | 1,360 (22.5%) |
| 5 Years | 379 (24.5%) | 273 (20.9%) |
| 6 to 11 Years | 1,955 (23.3%) | 1,747 (21.7%) |
| 12 to 14 Years | 543 (13.0%) | 649 (15.8%) |
| 15 Years | 172 (11.5%) | 197 (13.4%) |
| 16 and 17 Years | 654 (22.9%) | 471 (17.6%) |
| 18 to 24 Years | 1,812 (19.8%) | 1,633 (19.5%) |
| 25 to 34 Years | 1,520 (11.2%) | 2,442 (18.1%) |
| 35 to 44 Years | 1,708 (13.1%) | 2,181 (17.0%) |
| 45 to 54 Years | 1,184 (8.7%) | 1,353 (9.7%) |
| 55 to 64 Years | 1,899 (12.1%) | 2,185 (13.5%) |
| 65 to 74 Years | 852 (7.3%) | 1,015 (7.9%) |
| 75 Years and over | 596 (8.3%) | 1,576 (14.9%) |
| Total | 14,772 (13.6%) | 17,082 (15.3%) |
Income Above Poverty by Sex and Age in Oneida County
According to the poverty statistics in Oneida County, males aged 65 to 74 years and females aged 65 to 74 years are the age groups that are most secure financially, with 92.7% of males and 92.1% of females in these age groups living above the poverty line.
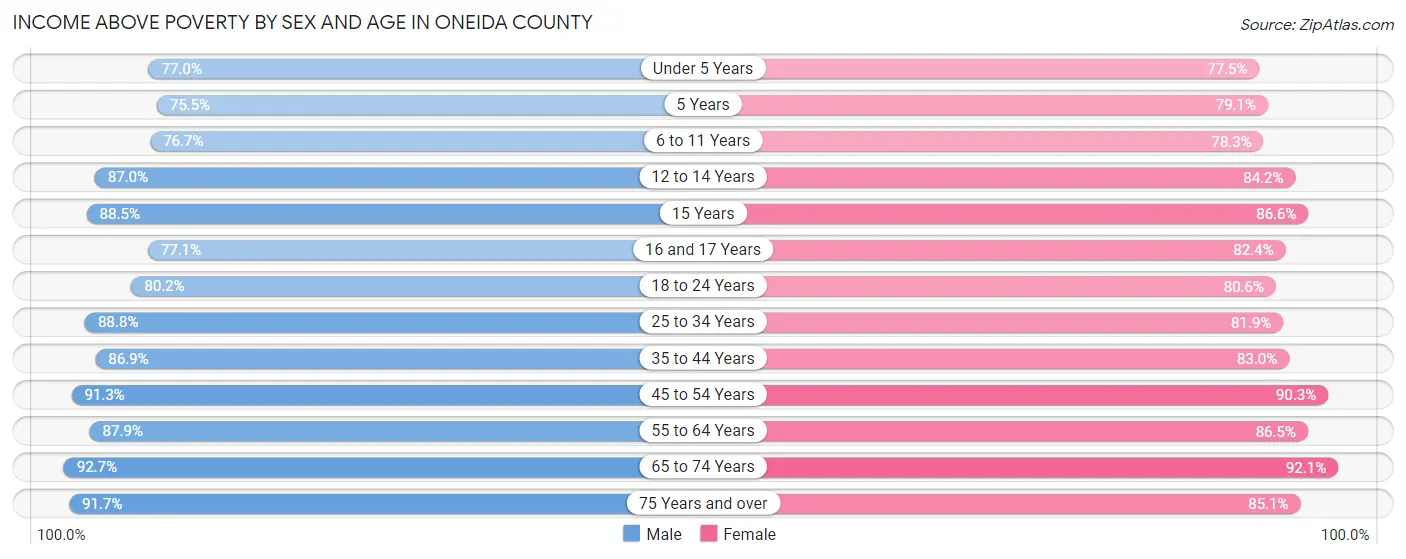
| Age Bracket | Male | Female |
| Under 5 Years | 5,009 (77.0%) | 4,681 (77.5%) |
| 5 Years | 1,165 (75.4%) | 1,031 (79.1%) |
| 6 to 11 Years | 6,428 (76.7%) | 6,296 (78.3%) |
| 12 to 14 Years | 3,620 (87.0%) | 3,454 (84.2%) |
| 15 Years | 1,321 (88.5%) | 1,272 (86.6%) |
| 16 and 17 Years | 2,204 (77.1%) | 2,198 (82.4%) |
| 18 to 24 Years | 7,328 (80.2%) | 6,764 (80.5%) |
| 25 to 34 Years | 12,028 (88.8%) | 11,068 (81.9%) |
| 35 to 44 Years | 11,291 (86.9%) | 10,663 (83.0%) |
| 45 to 54 Years | 12,427 (91.3%) | 12,537 (90.3%) |
| 55 to 64 Years | 13,816 (87.9%) | 13,971 (86.5%) |
| 65 to 74 Years | 10,832 (92.7%) | 11,813 (92.1%) |
| 75 Years and over | 6,620 (91.7%) | 9,002 (85.1%) |
| Total | 94,089 (86.4%) | 94,750 (84.7%) |
Income Below Poverty Among Married-Couple Families in Oneida County
The poverty statistics for married-couple families in Oneida County show that 4.7% or 1,937 of the total 41,392 families live below the poverty line. Families with 3 or 4 children have the highest poverty rate of 19.7%, comprising of 599 families. On the other hand, families with 1 or 2 children have the lowest poverty rate of 3.1%, which includes 381 families.
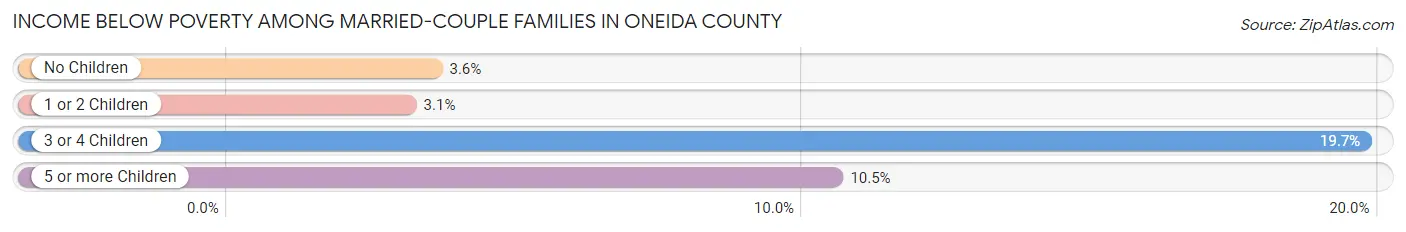
| Children | Above Poverty | Below Poverty |
| No Children | 24,784 (96.4%) | 914 (3.6%) |
| 1 or 2 Children | 11,870 (96.9%) | 381 (3.1%) |
| 3 or 4 Children | 2,436 (80.3%) | 599 (19.7%) |
| 5 or more Children | 365 (89.5%) | 43 (10.5%) |
| Total | 39,455 (95.3%) | 1,937 (4.7%) |
Income Below Poverty Among Single-Parent Households in Oneida County
According to the poverty data in Oneida County, 16.7% or 832 single-father households and 28.0% or 3,157 single-mother households are living below the poverty line. Among single-father households, those with 5 or more children have the highest poverty rate, with 58 households (98.3%) experiencing poverty. Likewise, among single-mother households, those with 3 or 4 children have the highest poverty rate, with 721 households (59.9%) falling below the poverty line.
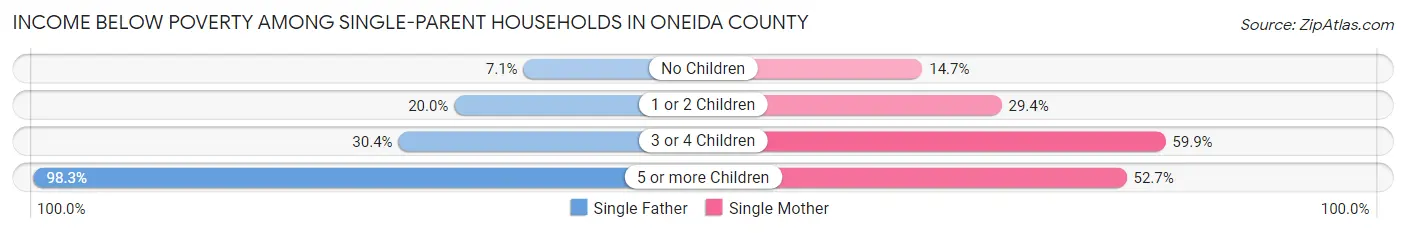
| Children | Single Father | Single Mother |
| No Children | 139 (7.1%) | 582 (14.6%) |
| 1 or 2 Children | 512 (20.0%) | 1,707 (29.4%) |
| 3 or 4 Children | 123 (30.4%) | 721 (59.9%) |
| 5 or more Children | 58 (98.3%) | 147 (52.7%) |
| Total | 832 (16.7%) | 3,157 (28.0%) |
Income Below Poverty Among Married-Couple vs Single-Parent Households in Oneida County
The poverty data for Oneida County shows that 1,937 of the married-couple family households (4.7%) and 3,989 of the single-parent households (24.5%) are living below the poverty level. Within the married-couple family households, those with 3 or 4 children have the highest poverty rate, with 599 households (19.7%) falling below the poverty line. Among the single-parent households, those with 5 or more children have the highest poverty rate, with 205 household (60.7%) living below poverty.
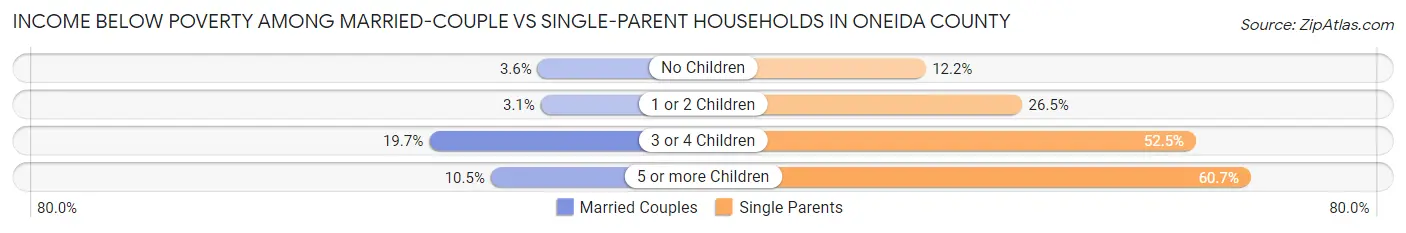
| Children | Married-Couple Families | Single-Parent Households |
| No Children | 914 (3.6%) | 721 (12.1%) |
| 1 or 2 Children | 381 (3.1%) | 2,219 (26.5%) |
| 3 or 4 Children | 599 (19.7%) | 844 (52.5%) |
| 5 or more Children | 43 (10.5%) | 205 (60.7%) |
| Total | 1,937 (4.7%) | 3,989 (24.5%) |
Race in Oneida County
The most populous races in Oneida County are White / Caucasian (191,180 | 82.7%), Hispanic or Latino (14,936 | 6.5%), and Black / African American (13,909 | 6.0%).
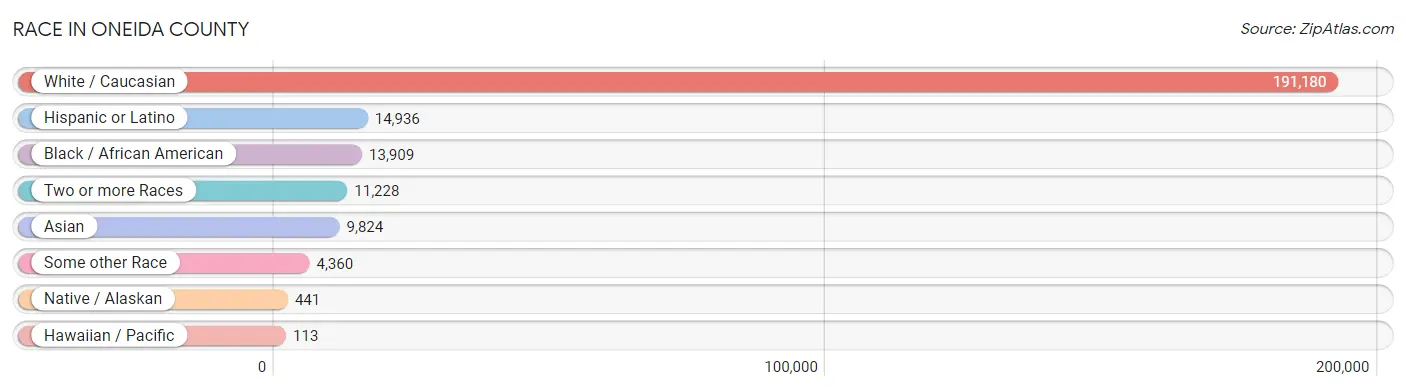
| Race | # Population | % Population |
| Asian | 9,824 | 4.3% |
| Black / African American | 13,909 | 6.0% |
| Hawaiian / Pacific | 113 | 0.1% |
| Hispanic or Latino | 14,936 | 6.5% |
| Native / Alaskan | 441 | 0.2% |
| White / Caucasian | 191,180 | 82.7% |
| Two or more Races | 11,228 | 4.9% |
| Some other Race | 4,360 | 1.9% |
| Total | 231,055 | 100.0% |
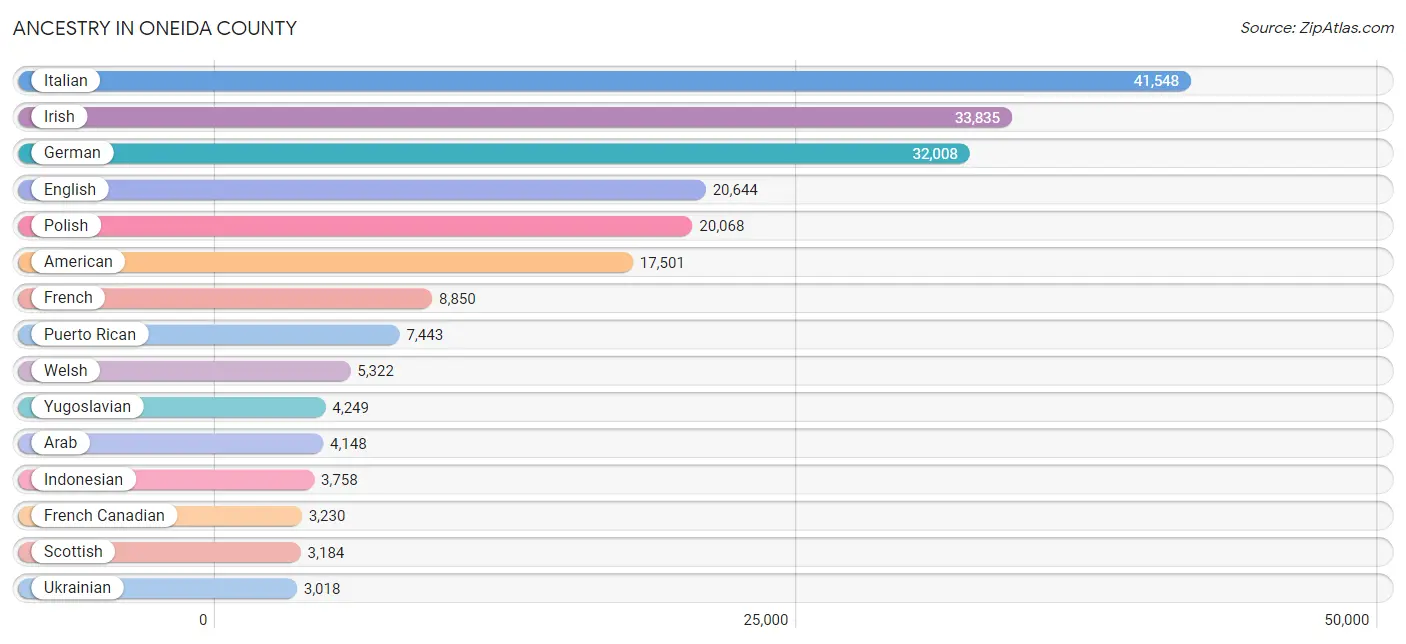
Ancestry in Oneida County
The most populous ancestries reported in Oneida County are Italian (41,548 | 18.0%), Irish (33,835 | 14.6%), German (32,008 | 13.9%), English (20,644 | 8.9%), and Polish (20,068 | 8.7%), together accounting for 64.1% of all Oneida County residents.
| Ancestry | # Population | % Population |
| Afghan | 70 | 0.0% |
| African | 704 | 0.3% |
| Alaska Native | 14 | 0.0% |
| Albanian | 5 | 0.0% |
| Alsatian | 5 | 0.0% |
| American | 17,501 | 7.6% |
| Apache | 6 | 0.0% |
| Arab | 4,148 | 1.8% |
| Argentinean | 24 | 0.0% |
| Armenian | 91 | 0.0% |
| Austrian | 395 | 0.2% |
| Barbadian | 55 | 0.0% |
| Belgian | 87 | 0.0% |
| Belizean | 61 | 0.0% |
| Bhutanese | 166 | 0.1% |
| Blackfeet | 8 | 0.0% |
| Brazilian | 19 | 0.0% |
| British | 749 | 0.3% |
| British West Indian | 13 | 0.0% |
| Bulgarian | 5 | 0.0% |
| Burmese | 421 | 0.2% |
| Cajun | 18 | 0.0% |
| Canadian | 431 | 0.2% |
| Celtic | 90 | 0.0% |
| Central American | 608 | 0.3% |
| Central American Indian | 101 | 0.0% |
| Cherokee | 311 | 0.1% |
| Chilean | 26 | 0.0% |
| Chinese | 8 | 0.0% |
| Chippewa | 22 | 0.0% |
| Choctaw | 24 | 0.0% |
| Colombian | 220 | 0.1% |
| Costa Rican | 9 | 0.0% |
| Croatian | 190 | 0.1% |
| Crow | 5 | 0.0% |
| Cuban | 326 | 0.1% |
| Czech | 473 | 0.2% |
| Czechoslovakian | 34 | 0.0% |
| Danish | 346 | 0.2% |
| Delaware | 3 | 0.0% |
| Dominican | 2,371 | 1.0% |
| Dutch | 2,969 | 1.3% |
| Dutch West Indian | 7 | 0.0% |
| Eastern European | 305 | 0.1% |
| Ecuadorian | 302 | 0.1% |
| Egyptian | 33 | 0.0% |
| English | 20,644 | 8.9% |
| Ethiopian | 12 | 0.0% |
| European | 2,968 | 1.3% |
| Filipino | 112 | 0.1% |
| Finnish | 68 | 0.0% |
| French | 8,850 | 3.8% |
| French American Indian | 78 | 0.0% |
| French Canadian | 3,230 | 1.4% |
| German | 32,008 | 13.9% |
| Ghanaian | 21 | 0.0% |
| Greek | 397 | 0.2% |
| Guamanian / Chamorro | 50 | 0.0% |
| Guatemalan | 122 | 0.1% |
| Guyanese | 145 | 0.1% |
| Haitian | 140 | 0.1% |
| Honduran | 81 | 0.0% |
| Hungarian | 667 | 0.3% |
| Icelander | 6 | 0.0% |
| Indian (Asian) | 1,406 | 0.6% |
| Indonesian | 3,758 | 1.6% |
| Iranian | 72 | 0.0% |
| Iraqi | 10 | 0.0% |
| Irish | 33,835 | 14.6% |
| Iroquois | 202 | 0.1% |
| Israeli | 6 | 0.0% |
| Italian | 41,548 | 18.0% |
| Jamaican | 491 | 0.2% |
| Japanese | 1,027 | 0.4% |
| Jordanian | 7 | 0.0% |
| Kenyan | 98 | 0.0% |
| Korean | 584 | 0.3% |
| Laotian | 40 | 0.0% |
| Latvian | 14 | 0.0% |
| Lebanese | 2,683 | 1.2% |
| Liberian | 10 | 0.0% |
| Lithuanian | 477 | 0.2% |
| Luxembourger | 18 | 0.0% |
| Malaysian | 95 | 0.0% |
| Mexican | 1,545 | 0.7% |
| Mexican American Indian | 28 | 0.0% |
| Mongolian | 39 | 0.0% |
| Moroccan | 28 | 0.0% |
| Native Hawaiian | 109 | 0.1% |
| Navajo | 4 | 0.0% |
| Nicaraguan | 58 | 0.0% |
| Nigerian | 86 | 0.0% |
| Northern European | 307 | 0.1% |
| Norwegian | 855 | 0.4% |
| Okinawan | 25 | 0.0% |
| Pakistani | 614 | 0.3% |
| Panamanian | 19 | 0.0% |
| Pennsylvania German | 158 | 0.1% |
| Peruvian | 25 | 0.0% |
| Polish | 20,068 | 8.7% |
| Portuguese | 247 | 0.1% |
| Potawatomi | 12 | 0.0% |
| Puerto Rican | 7,443 | 3.2% |
| Romanian | 146 | 0.1% |
| Russian | 824 | 0.4% |
| Salvadoran | 319 | 0.1% |
| Samoan | 25 | 0.0% |
| Scandinavian | 291 | 0.1% |
| Scotch-Irish | 1,146 | 0.5% |
| Scottish | 3,184 | 1.4% |
| Seminole | 2 | 0.0% |
| Serbian | 101 | 0.0% |
| Sioux | 9 | 0.0% |
| Slavic | 104 | 0.1% |
| Slovak | 291 | 0.1% |
| Slovene | 57 | 0.0% |
| Somali | 365 | 0.2% |
| South American | 842 | 0.4% |
| Spaniard | 134 | 0.1% |
| Spanish | 504 | 0.2% |
| Sri Lankan | 907 | 0.4% |
| Subsaharan African | 1,383 | 0.6% |
| Sudanese | 27 | 0.0% |
| Swedish | 666 | 0.3% |
| Swiss | 960 | 0.4% |
| Syrian | 375 | 0.2% |
| Thai | 731 | 0.3% |
| Trinidadian and Tobagonian | 84 | 0.0% |
| Turkish | 380 | 0.2% |
| Ukrainian | 3,018 | 1.3% |
| Uruguayan | 45 | 0.0% |
| Venezuelan | 200 | 0.1% |
| Vietnamese | 32 | 0.0% |
| Welsh | 5,322 | 2.3% |
| West Indian | 137 | 0.1% |
| Yugoslavian | 4,249 | 1.8% | View All 136 Rows |
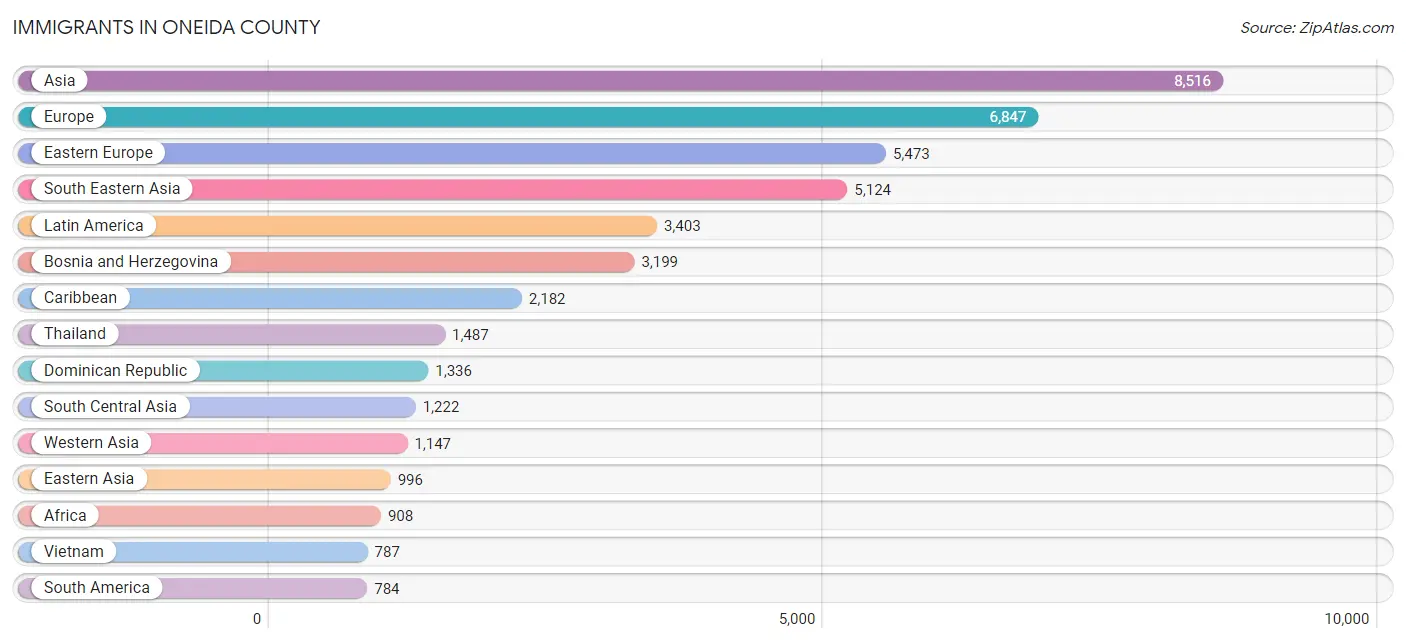
Immigrants in Oneida County
The most numerous immigrant groups reported in Oneida County came from Asia (8,516 | 3.7%), Europe (6,847 | 3.0%), Eastern Europe (5,473 | 2.4%), South Eastern Asia (5,124 | 2.2%), and Latin America (3,403 | 1.5%), together accounting for 12.7% of all Oneida County residents.
| Immigration Origin | # Population | % Population |
| Afghanistan | 95 | 0.0% |
| Africa | 908 | 0.4% |
| Argentina | 10 | 0.0% |
| Asia | 8,516 | 3.7% |
| Australia | 10 | 0.0% |
| Austria | 20 | 0.0% |
| Bangladesh | 48 | 0.0% |
| Barbados | 10 | 0.0% |
| Belarus | 471 | 0.2% |
| Belgium | 70 | 0.0% |
| Bosnia and Herzegovina | 3,199 | 1.4% |
| Brazil | 24 | 0.0% |
| Bulgaria | 5 | 0.0% |
| Cambodia | 437 | 0.2% |
| Canada | 346 | 0.2% |
| Caribbean | 2,182 | 0.9% |
| Central America | 437 | 0.2% |
| China | 708 | 0.3% |
| Colombia | 167 | 0.1% |
| Costa Rica | 24 | 0.0% |
| Croatia | 80 | 0.0% |
| Cuba | 117 | 0.1% |
| Dominica | 53 | 0.0% |
| Dominican Republic | 1,336 | 0.6% |
| Eastern Africa | 548 | 0.2% |
| Eastern Asia | 996 | 0.4% |
| Eastern Europe | 5,473 | 2.4% |
| Ecuador | 235 | 0.1% |
| Egypt | 10 | 0.0% |
| El Salvador | 61 | 0.0% |
| England | 63 | 0.0% |
| Ethiopia | 27 | 0.0% |
| Europe | 6,847 | 3.0% |
| France | 61 | 0.0% |
| Germany | 306 | 0.1% |
| Ghana | 46 | 0.0% |
| Greece | 28 | 0.0% |
| Grenada | 13 | 0.0% |
| Guatemala | 85 | 0.0% |
| Guyana | 172 | 0.1% |
| Haiti | 82 | 0.0% |
| Honduras | 10 | 0.0% |
| Hong Kong | 109 | 0.1% |
| Hungary | 22 | 0.0% |
| India | 584 | 0.3% |
| Indonesia | 34 | 0.0% |
| Iran | 52 | 0.0% |
| Iraq | 31 | 0.0% |
| Ireland | 46 | 0.0% |
| Israel | 6 | 0.0% |
| Italy | 556 | 0.2% |
| Jamaica | 427 | 0.2% |
| Japan | 41 | 0.0% |
| Jordan | 50 | 0.0% |
| Kazakhstan | 187 | 0.1% |
| Kenya | 196 | 0.1% |
| Korea | 247 | 0.1% |
| Laos | 33 | 0.0% |
| Latin America | 3,403 | 1.5% |
| Latvia | 8 | 0.0% |
| Lebanon | 88 | 0.0% |
| Liberia | 10 | 0.0% |
| Lithuania | 5 | 0.0% |
| Malaysia | 38 | 0.0% |
| Mexico | 221 | 0.1% |
| Micronesia | 81 | 0.0% |
| Moldova | 4 | 0.0% |
| Morocco | 28 | 0.0% |
| Nepal | 37 | 0.0% |
| Netherlands | 113 | 0.1% |
| Nicaragua | 10 | 0.0% |
| Nigeria | 46 | 0.0% |
| Northern Africa | 61 | 0.0% |
| Northern Europe | 169 | 0.1% |
| Oceania | 100 | 0.0% |
| Pakistan | 140 | 0.1% |
| Panama | 26 | 0.0% |
| Philippines | 284 | 0.1% |
| Poland | 447 | 0.2% |
| Portugal | 19 | 0.0% |
| Romania | 90 | 0.0% |
| Russia | 298 | 0.1% |
| Scotland | 26 | 0.0% |
| Serbia | 55 | 0.0% |
| Singapore | 5 | 0.0% |
| Somalia | 298 | 0.1% |
| South America | 784 | 0.3% |
| South Central Asia | 1,222 | 0.5% |
| South Eastern Asia | 5,124 | 2.2% |
| Southern Europe | 625 | 0.3% |
| Spain | 22 | 0.0% |
| St. Vincent and the Grenadines | 8 | 0.0% |
| Sweden | 10 | 0.0% |
| Syria | 11 | 0.0% |
| Taiwan | 91 | 0.0% |
| Thailand | 1,487 | 0.6% |
| Trinidad and Tobago | 128 | 0.1% |
| Turkey | 396 | 0.2% |
| Ukraine | 587 | 0.3% |
| Uruguay | 45 | 0.0% |
| Uzbekistan | 21 | 0.0% |
| Venezuela | 127 | 0.1% |
| Vietnam | 787 | 0.3% |
| Western Africa | 297 | 0.1% |
| Western Asia | 1,147 | 0.5% |
| Western Europe | 580 | 0.3% |
| Yemen | 541 | 0.2% | View All 107 Rows |
Sex and Age in Oneida County
Sex and Age in Oneida County
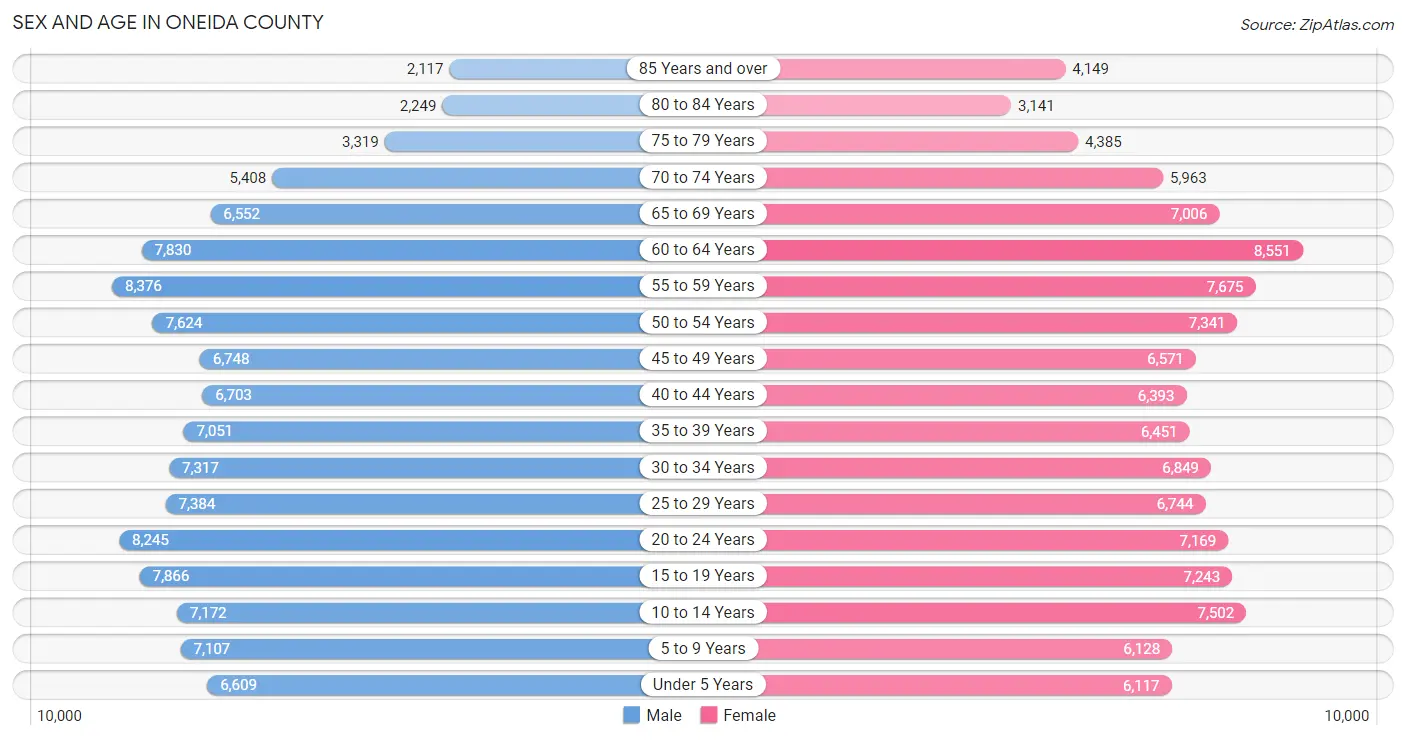
The most populous age groups in Oneida County are 55 to 59 Years (8,376 | 7.2%) for men and 60 to 64 Years (8,551 | 7.4%) for women.
| Age Bracket | Male | Female |
| Under 5 Years | 6,609 (5.7%) | 6,117 (5.3%) |
| 5 to 9 Years | 7,107 (6.1%) | 6,128 (5.3%) |
| 10 to 14 Years | 7,172 (6.2%) | 7,502 (6.5%) |
| 15 to 19 Years | 7,866 (6.8%) | 7,243 (6.3%) |
| 20 to 24 Years | 8,245 (7.1%) | 7,169 (6.2%) |
| 25 to 29 Years | 7,384 (6.4%) | 6,744 (5.9%) |
| 30 to 34 Years | 7,317 (6.3%) | 6,849 (5.9%) |
| 35 to 39 Years | 7,051 (6.1%) | 6,451 (5.6%) |
| 40 to 44 Years | 6,703 (5.8%) | 6,393 (5.5%) |
| 45 to 49 Years | 6,748 (5.8%) | 6,571 (5.7%) |
| 50 to 54 Years | 7,624 (6.6%) | 7,341 (6.4%) |
| 55 to 59 Years | 8,376 (7.2%) | 7,675 (6.7%) |
| 60 to 64 Years | 7,830 (6.8%) | 8,551 (7.4%) |
| 65 to 69 Years | 6,552 (5.7%) | 7,006 (6.1%) |
| 70 to 74 Years | 5,408 (4.7%) | 5,963 (5.2%) |
| 75 to 79 Years | 3,319 (2.9%) | 4,385 (3.8%) |
| 80 to 84 Years | 2,249 (1.9%) | 3,141 (2.7%) |
| 85 Years and over | 2,117 (1.8%) | 4,149 (3.6%) |
| Total | 115,677 (100.0%) | 115,378 (100.0%) |
Families and Households in Oneida County
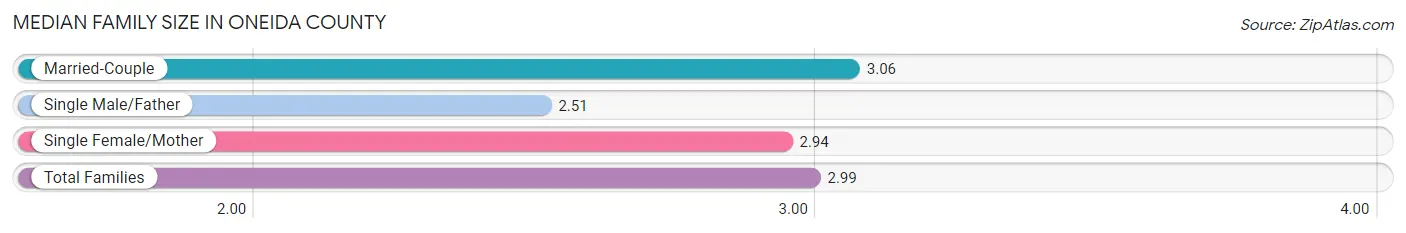
Median Family Size in Oneida County
The median family size in Oneida County is 2.99 persons per family, with married-couple families (41,392 | 71.8%) accounting for the largest median family size of 3.06 persons per family. On the other hand, single male/father families (4,987 | 8.6%) represent the smallest median family size with 2.51 persons per family.
| Family Type | # Families | Family Size |
| Married-Couple | 41,392 (71.8%) | 3.06 |
| Single Male/Father | 4,987 (8.6%) | 2.51 |
| Single Female/Mother | 11,259 (19.5%) | 2.94 |
| Total Families | 57,638 (100.0%) | 2.99 |
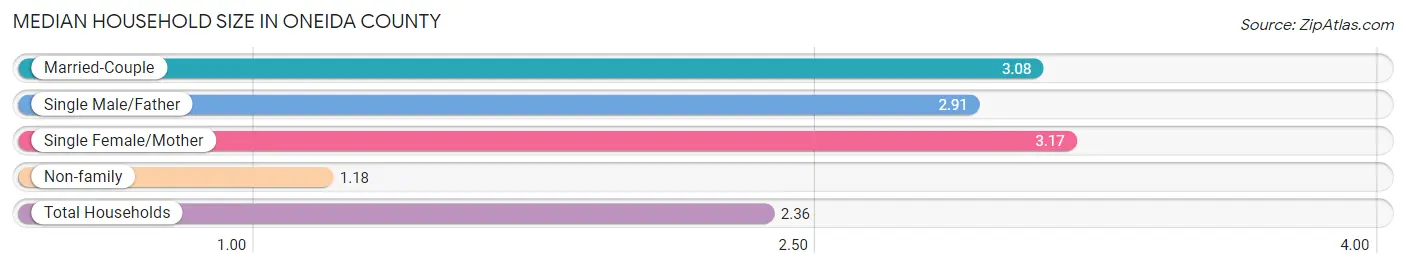
Median Household Size in Oneida County
The median household size in Oneida County is 2.36 persons per household, with single female/mother households (11,259 | 12.1%) accounting for the largest median household size of 3.17 persons per household. non-family households (35,306 | 38.0%) represent the smallest median household size with 1.18 persons per household.
| Household Type | # Households | Household Size |
| Married-Couple | 41,392 (44.5%) | 3.08 |
| Single Male/Father | 4,987 (5.4%) | 2.91 |
| Single Female/Mother | 11,259 (12.1%) | 3.17 |
| Non-family | 35,306 (38.0%) | 1.18 |
| Total Households | 92,944 (100.0%) | 2.36 |
Household Size by Marriage Status in Oneida County
Out of a total of 92,944 households in Oneida County, 57,638 (62.0%) are family households, while 35,306 (38.0%) are nonfamily households. The most numerous type of family households are 2-person households, comprising 26,408, and the most common type of nonfamily households are 1-person households, comprising 29,639.
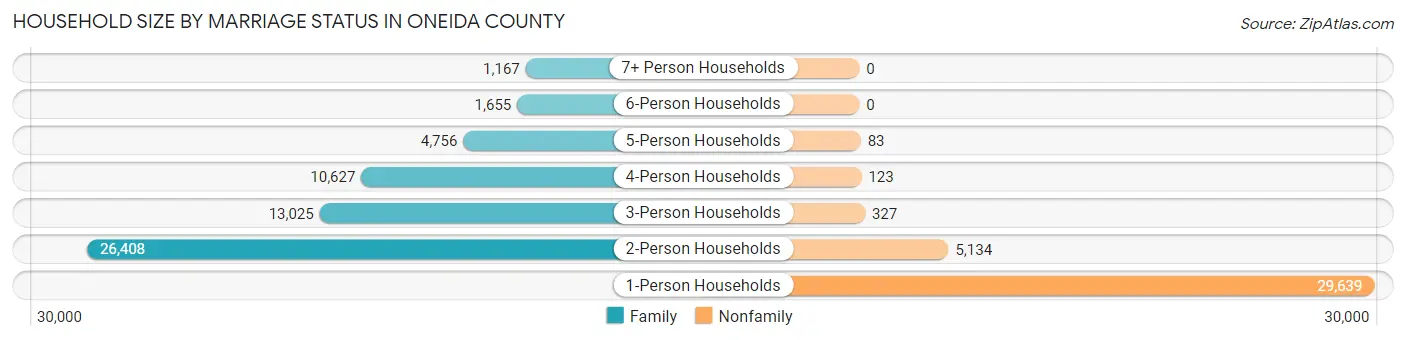
| Household Size | Family Households | Nonfamily Households |
| 1-Person Households | - | 29,639 (31.9%) |
| 2-Person Households | 26,408 (28.4%) | 5,134 (5.5%) |
| 3-Person Households | 13,025 (14.0%) | 327 (0.4%) |
| 4-Person Households | 10,627 (11.4%) | 123 (0.1%) |
| 5-Person Households | 4,756 (5.1%) | 83 (0.1%) |
| 6-Person Households | 1,655 (1.8%) | 0 (0.0%) |
| 7+ Person Households | 1,167 (1.3%) | 0 (0.0%) |
| Total | 57,638 (62.0%) | 35,306 (38.0%) |
Female Fertility in Oneida County
Fertility by Age in Oneida County
Average fertility rate in Oneida County is 68.0 births per 1,000 women. Women in the age bracket of 20 to 34 years have the highest fertility rate with 119.0 births per 1,000 women. Women in the age bracket of 20 to 34 years acount for 74.2% of all women with births.
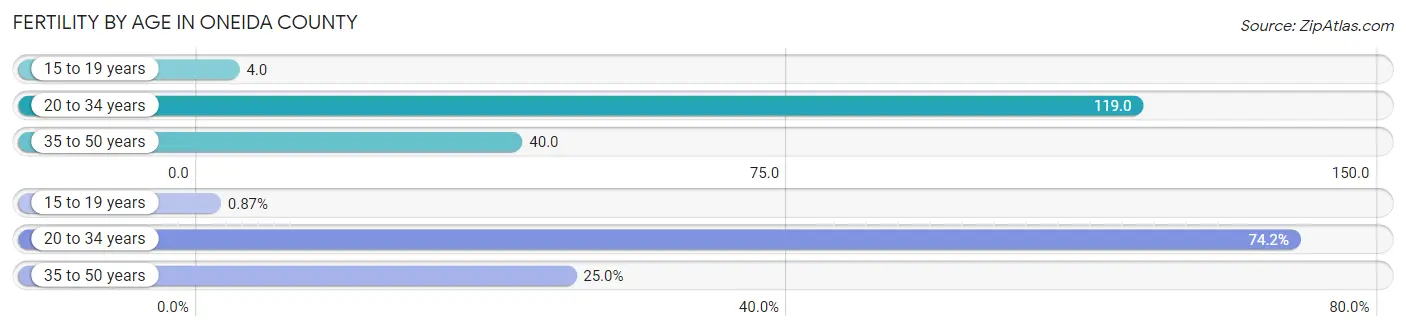
| Age Bracket | Women with Births | Births / 1,000 Women |
| 15 to 19 years | 29 (0.9%) | 4.0 |
| 20 to 34 years | 2,481 (74.2%) | 119.0 |
| 35 to 50 years | 836 (25.0%) | 40.0 |
| Total | 3,346 (100.0%) | 68.0 |
Fertility by Age by Marriage Status in Oneida County
62.3% of women with births (3,346) in Oneida County are married. The highest percentage of unmarried women with births falls into 15 to 19 years age bracket with 100.0% of them unmarried at the time of birth, while the lowest percentage of unmarried women with births belong to 35 to 50 years age bracket with 22.7% of them unmarried.
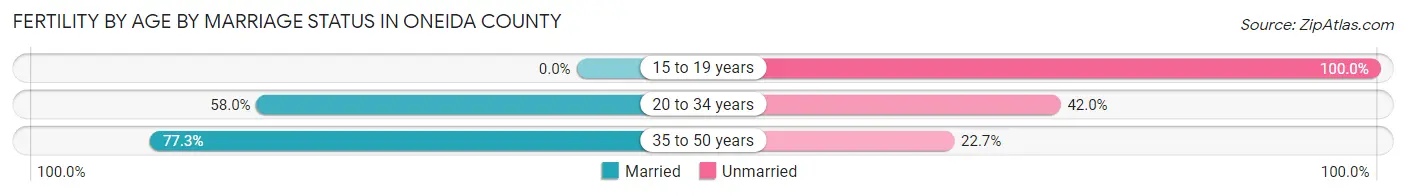
| Age Bracket | Married | Unmarried |
| 15 to 19 years | 0 (0.0%) | 29 (100.0%) |
| 20 to 34 years | 1,439 (58.0%) | 1,042 (42.0%) |
| 35 to 50 years | 646 (77.3%) | 190 (22.7%) |
| Total | 2,085 (62.3%) | 1,261 (37.7%) |
Fertility by Education in Oneida County
Average fertility rate in Oneida County is 68.0 births per 1,000 women. Women with the education attainment of graduate degree have the highest fertility rate of 93.0 births per 1,000 women, while women with the education attainment of bachelor's degree have the lowest fertility at 46.0 births per 1,000 women. Women with the education attainment of college or associate's degree represent 34.9% of all women with births.
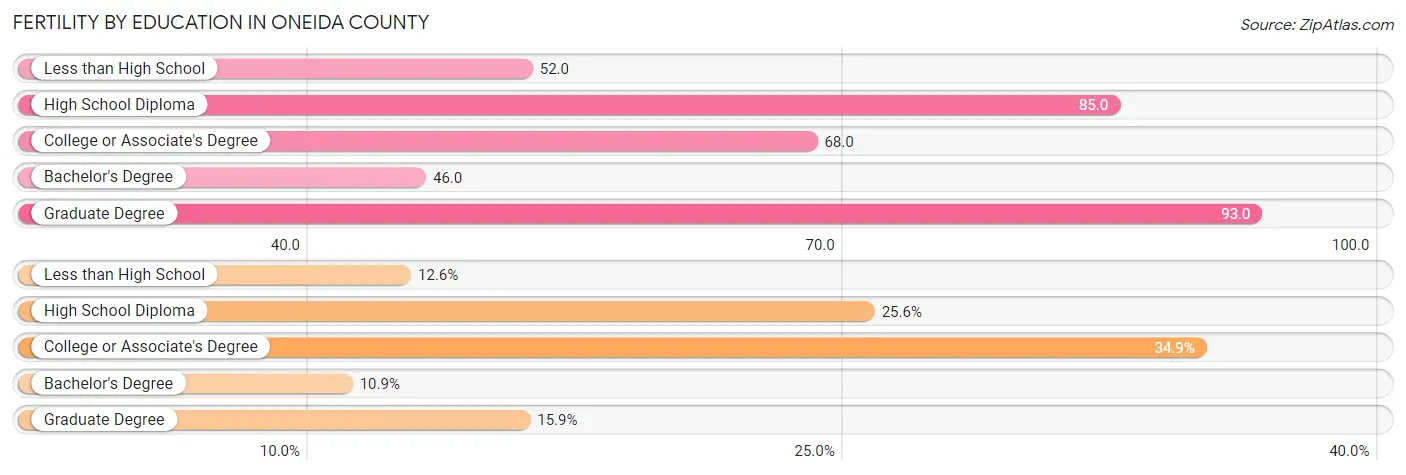
| Educational Attainment | Women with Births | Births / 1,000 Women |
| Less than High School | 421 (12.6%) | 52.0 |
| High School Diploma | 857 (25.6%) | 85.0 |
| College or Associate's Degree | 1,169 (34.9%) | 68.0 |
| Bachelor's Degree | 366 (10.9%) | 46.0 |
| Graduate Degree | 533 (15.9%) | 93.0 |
| Total | 3,346 (100.0%) | 68.0 |
Fertility by Education by Marriage Status in Oneida County
37.7% of women with births in Oneida County are unmarried. Women with the educational attainment of graduate degree are most likely to be married with 83.1% of them married at childbirth, while women with the educational attainment of less than high school are least likely to be married with 63.7% of them unmarried at childbirth.
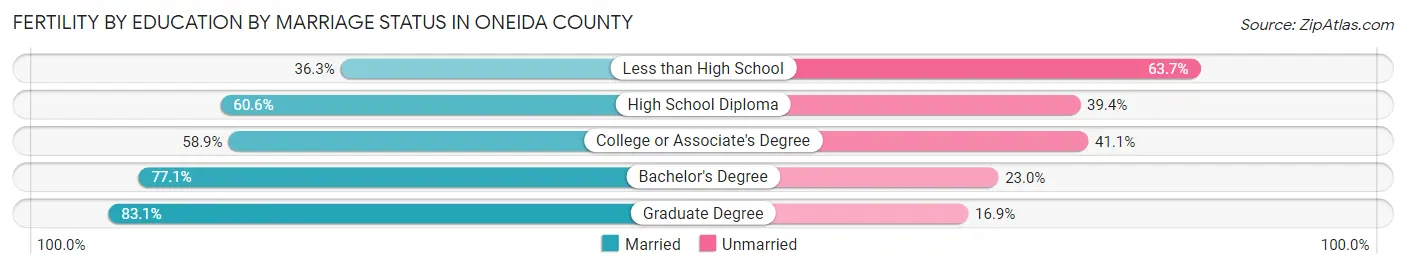
| Educational Attainment | Married | Unmarried |
| Less than High School | 153 (36.3%) | 268 (63.7%) |
| High School Diploma | 519 (60.6%) | 338 (39.4%) |
| College or Associate's Degree | 689 (58.9%) | 480 (41.1%) |
| Bachelor's Degree | 282 (77.0%) | 84 (23.0%) |
| Graduate Degree | 443 (83.1%) | 90 (16.9%) |
| Total | 2,085 (62.3%) | 1,261 (37.7%) |
Employment Characteristics in Oneida County
Employment by Class of Employer in Oneida County
Among the 100,408 employed individuals in Oneida County, private company employees (59,504 | 59.3%), not-for-profit organizations (12,528 | 12.5%), and local government employees (9,758 | 9.7%) make up the most common classes of employment.
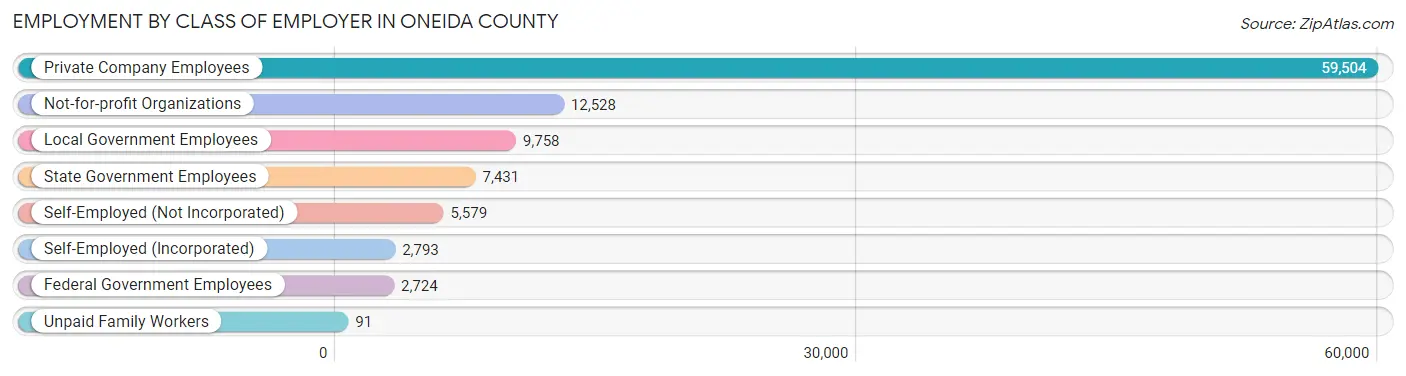
| Employer Class | # Employees | % Employees |
| Private Company Employees | 59,504 | 59.3% |
| Self-Employed (Incorporated) | 2,793 | 2.8% |
| Self-Employed (Not Incorporated) | 5,579 | 5.6% |
| Not-for-profit Organizations | 12,528 | 12.5% |
| Local Government Employees | 9,758 | 9.7% |
| State Government Employees | 7,431 | 7.4% |
| Federal Government Employees | 2,724 | 2.7% |
| Unpaid Family Workers | 91 | 0.1% |
| Total | 100,408 | 100.0% |
Employment Status by Age in Oneida County
According to the labor force statistics for Oneida County, out of the total population over 16 years of age (187,452), 57.7% or 108,160 individuals are in the labor force, with 4.4% or 4,759 of them unemployed. The age group with the highest labor force participation rate is 30 to 34 years, with 83.7% or 11,857 individuals in the labor force. Within the labor force, the 16 to 19 years age range has the highest percentage of unemployed individuals, with 16.3% or 653 of them being unemployed.
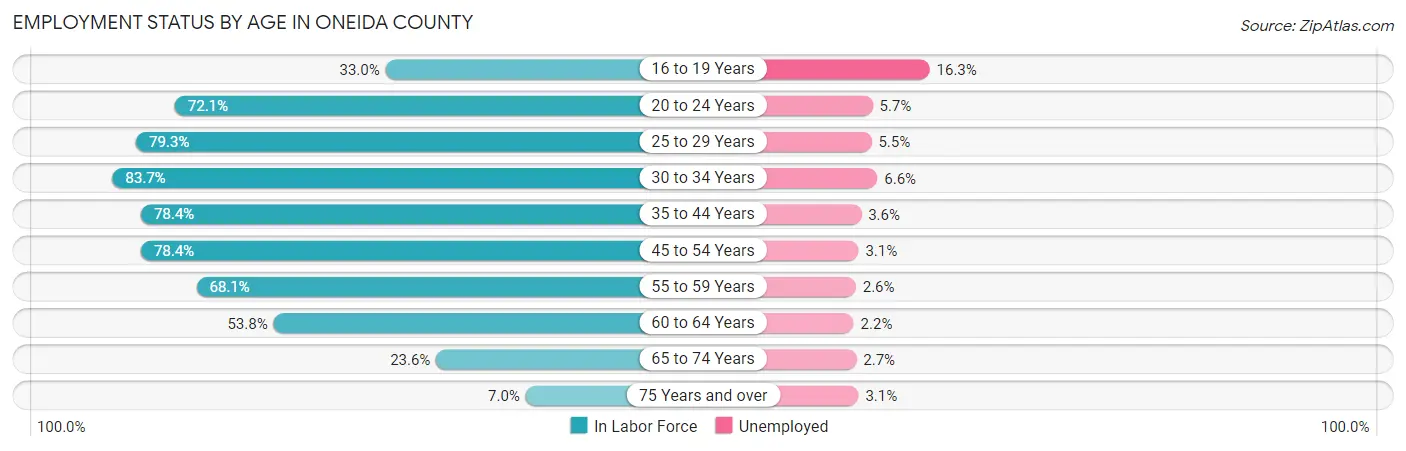
| Age Bracket | In Labor Force | Unemployed |
| 16 to 19 Years | 4,007 (33.0%) | 653 (16.3%) |
| 20 to 24 Years | 11,113 (72.1%) | 633 (5.7%) |
| 25 to 29 Years | 11,204 (79.3%) | 616 (5.5%) |
| 30 to 34 Years | 11,857 (83.7%) | 783 (6.6%) |
| 35 to 44 Years | 20,853 (78.4%) | 751 (3.6%) |
| 45 to 54 Years | 22,175 (78.4%) | 687 (3.1%) |
| 55 to 59 Years | 10,931 (68.1%) | 284 (2.6%) |
| 60 to 64 Years | 8,813 (53.8%) | 194 (2.2%) |
| 65 to 74 Years | 5,883 (23.6%) | 159 (2.7%) |
| 75 Years and over | 1,355 (7.0%) | 42 (3.1%) |
| Total | 108,160 (57.7%) | 4,759 (4.4%) |
Employment Status by Educational Attainment in Oneida County
According to labor force statistics for Oneida County, 74.2% of individuals (85,781) out of the total population between 25 and 64 years of age (115,608) are in the labor force, with 3.9% or 3,345 of them being unemployed. The group with the highest labor force participation rate are those with the educational attainment of bachelor's degree or higher, with 88.2% or 29,210 individuals in the labor force. Within the labor force, individuals with less than high school education have the highest percentage of unemployment, with 8.2% or 455 of them being unemployed.
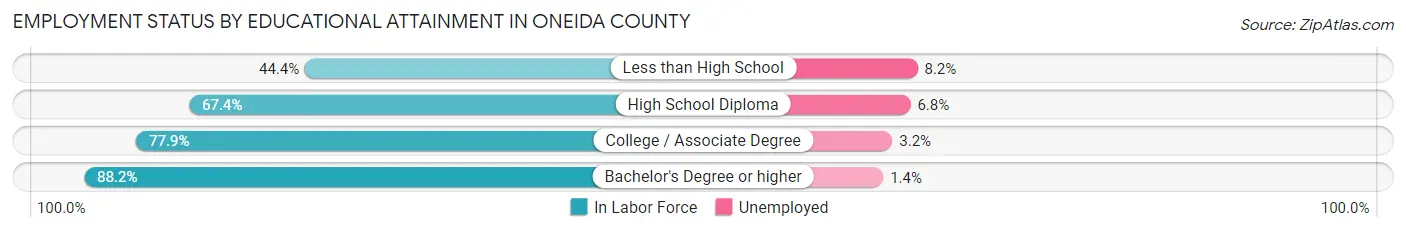
| Educational Attainment | In Labor Force | Unemployed |
| Less than High School | 5,553 (44.4%) | 1,025 (8.2%) |
| High School Diploma | 22,222 (67.4%) | 2,242 (6.8%) |
| College / Associate Degree | 28,833 (77.9%) | 1,184 (3.2%) |
| Bachelor's Degree or higher | 29,210 (88.2%) | 464 (1.4%) |
| Total | 85,781 (74.2%) | 4,509 (3.9%) |
Employment Occupations by Sex in Oneida County
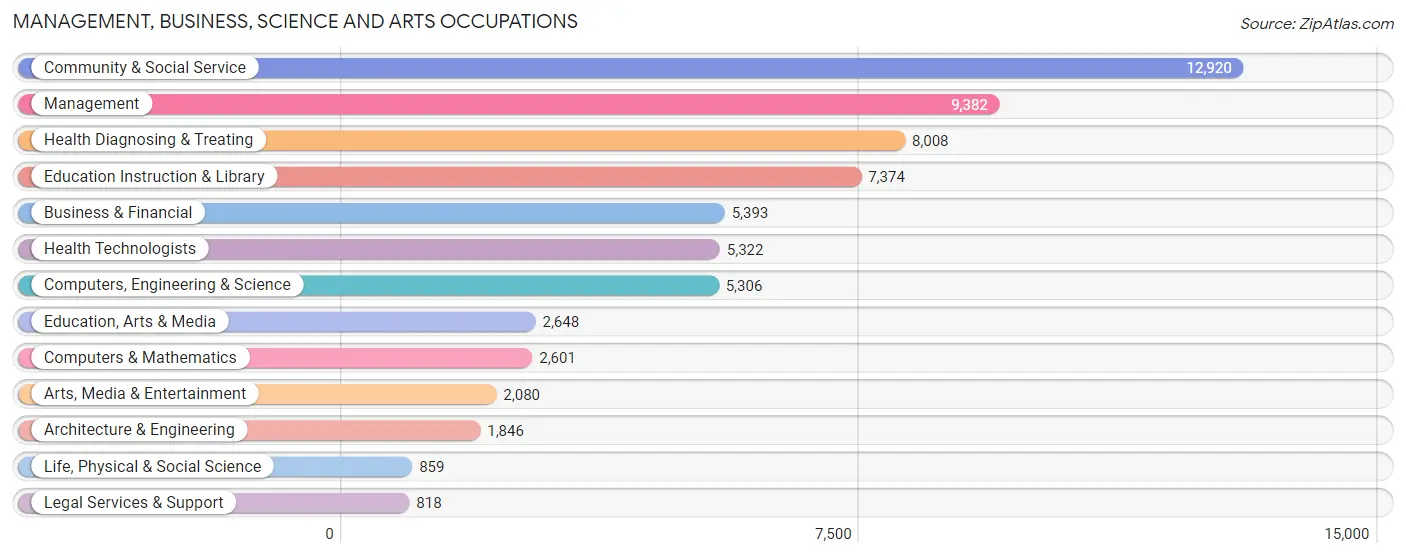
Management, Business, Science and Arts Occupations
The most common Management, Business, Science and Arts occupations in Oneida County are Community & Social Service (12,920 | 12.6%), Management (9,382 | 9.1%), Health Diagnosing & Treating (8,008 | 7.8%), Education Instruction & Library (7,374 | 7.2%), and Business & Financial (5,393 | 5.2%).
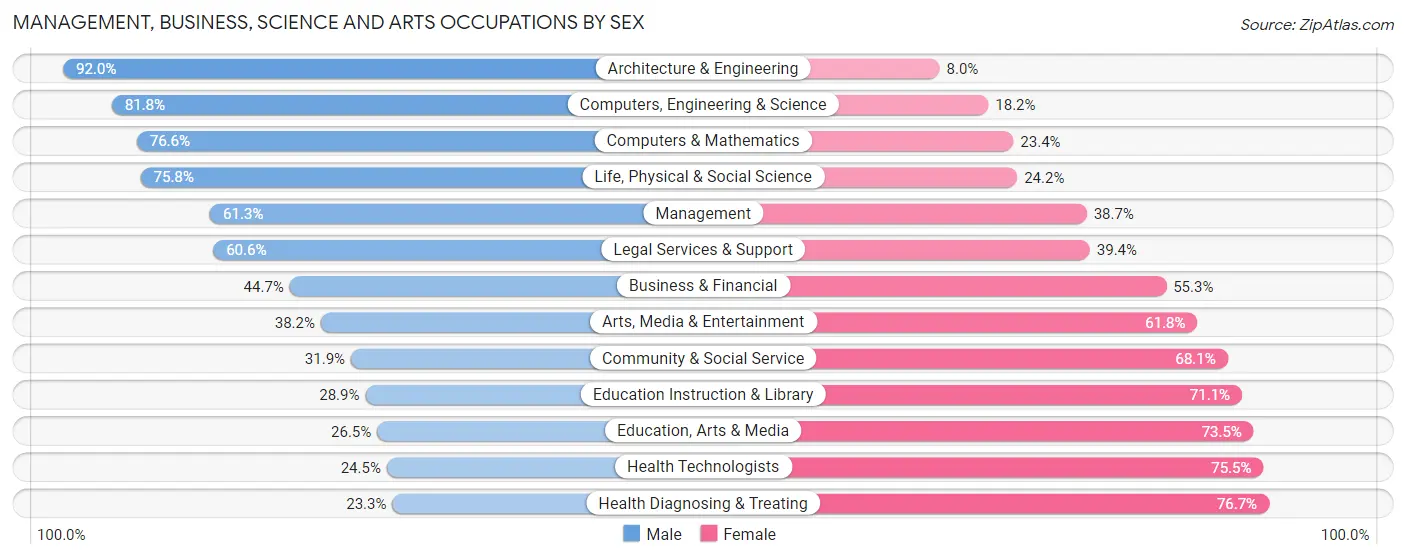
Management, Business, Science and Arts Occupations by Sex
Within the Management, Business, Science and Arts occupations in Oneida County, the most male-oriented occupations are Architecture & Engineering (92.0%), Computers, Engineering & Science (81.8%), and Computers & Mathematics (76.6%), while the most female-oriented occupations are Health Diagnosing & Treating (76.7%), Health Technologists (75.5%), and Education, Arts & Media (73.5%).
| Occupation | Male | Female |
| Management | 5,751 (61.3%) | 3,631 (38.7%) |
| Business & Financial | 2,411 (44.7%) | 2,982 (55.3%) |
| Computers, Engineering & Science | 4,341 (81.8%) | 965 (18.2%) |
| Computers & Mathematics | 1,992 (76.6%) | 609 (23.4%) |
| Architecture & Engineering | 1,698 (92.0%) | 148 (8.0%) |
| Life, Physical & Social Science | 651 (75.8%) | 208 (24.2%) |
| Community & Social Service | 4,125 (31.9%) | 8,795 (68.1%) |
| Education, Arts & Media | 701 (26.5%) | 1,947 (73.5%) |
| Legal Services & Support | 496 (60.6%) | 322 (39.4%) |
| Education Instruction & Library | 2,133 (28.9%) | 5,241 (71.1%) |
| Arts, Media & Entertainment | 795 (38.2%) | 1,285 (61.8%) |
| Health Diagnosing & Treating | 1,865 (23.3%) | 6,143 (76.7%) |
| Health Technologists | 1,302 (24.5%) | 4,020 (75.5%) |
| Total (Category) | 18,493 (45.1%) | 22,516 (54.9%) |
| Total (Overall) | 53,412 (51.9%) | 49,453 (48.1%) |
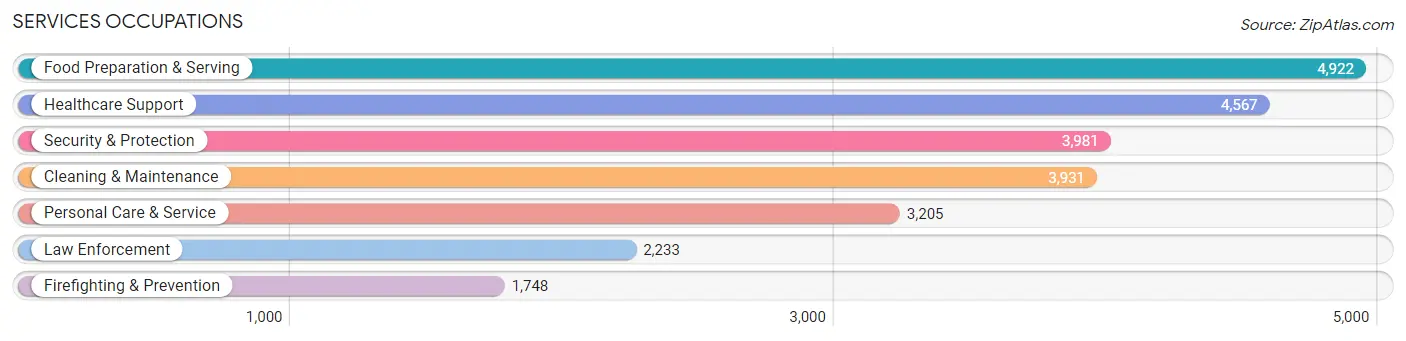
Services Occupations
The most common Services occupations in Oneida County are Food Preparation & Serving (4,922 | 4.8%), Healthcare Support (4,567 | 4.4%), Security & Protection (3,981 | 3.9%), Cleaning & Maintenance (3,931 | 3.8%), and Personal Care & Service (3,205 | 3.1%).
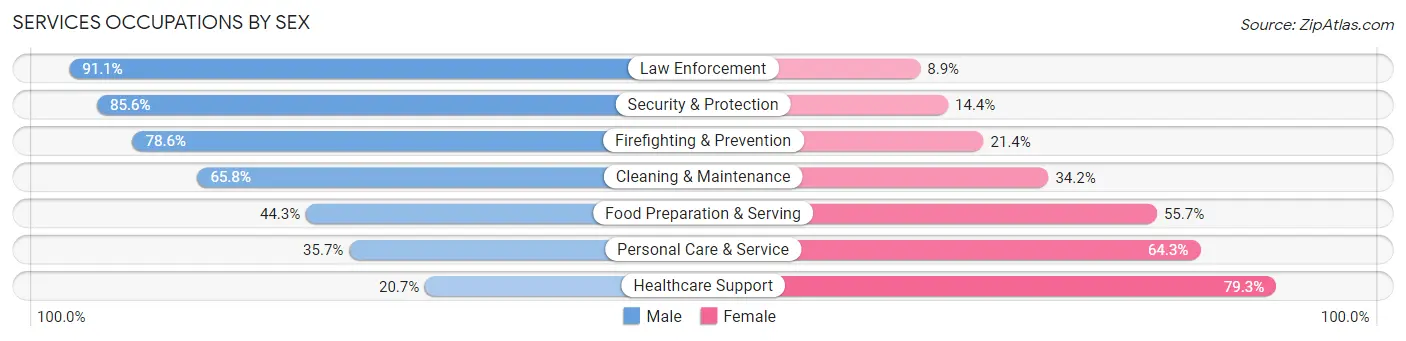
Services Occupations by Sex
Within the Services occupations in Oneida County, the most male-oriented occupations are Law Enforcement (91.1%), Security & Protection (85.6%), and Firefighting & Prevention (78.6%), while the most female-oriented occupations are Healthcare Support (79.3%), Personal Care & Service (64.3%), and Food Preparation & Serving (55.7%).
| Occupation | Male | Female |
| Healthcare Support | 946 (20.7%) | 3,621 (79.3%) |
| Security & Protection | 3,409 (85.6%) | 572 (14.4%) |
| Firefighting & Prevention | 1,374 (78.6%) | 374 (21.4%) |
| Law Enforcement | 2,035 (91.1%) | 198 (8.9%) |
| Food Preparation & Serving | 2,179 (44.3%) | 2,743 (55.7%) |
| Cleaning & Maintenance | 2,585 (65.8%) | 1,346 (34.2%) |
| Personal Care & Service | 1,145 (35.7%) | 2,060 (64.3%) |
| Total (Category) | 10,264 (49.8%) | 10,342 (50.2%) |
| Total (Overall) | 53,412 (51.9%) | 49,453 (48.1%) |
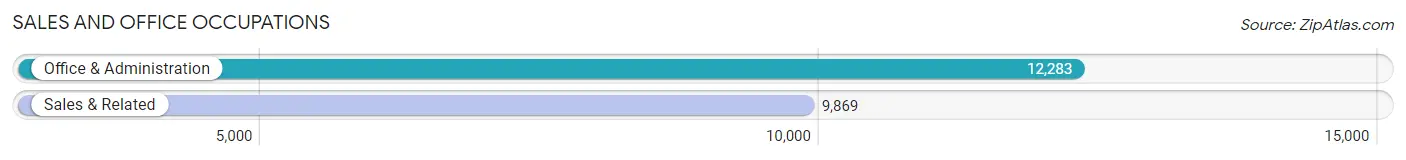
Sales and Office Occupations
The most common Sales and Office occupations in Oneida County are Office & Administration (12,283 | 11.9%), and Sales & Related (9,869 | 9.6%).
Sales and Office Occupations by Sex
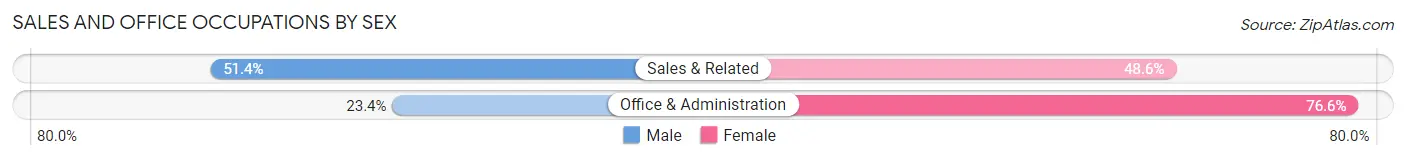
| Occupation | Male | Female |
| Sales & Related | 5,077 (51.4%) | 4,792 (48.6%) |
| Office & Administration | 2,877 (23.4%) | 9,406 (76.6%) |
| Total (Category) | 7,954 (35.9%) | 14,198 (64.1%) |
| Total (Overall) | 53,412 (51.9%) | 49,453 (48.1%) |
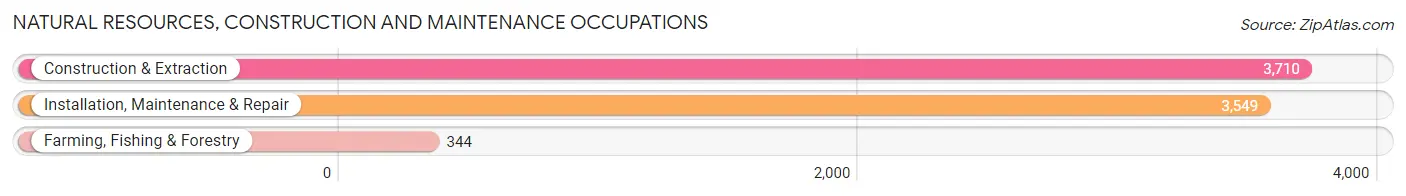
Natural Resources, Construction and Maintenance Occupations
The most common Natural Resources, Construction and Maintenance occupations in Oneida County are Construction & Extraction (3,710 | 3.6%), Installation, Maintenance & Repair (3,549 | 3.5%), and Farming, Fishing & Forestry (344 | 0.3%).
Natural Resources, Construction and Maintenance Occupations by Sex
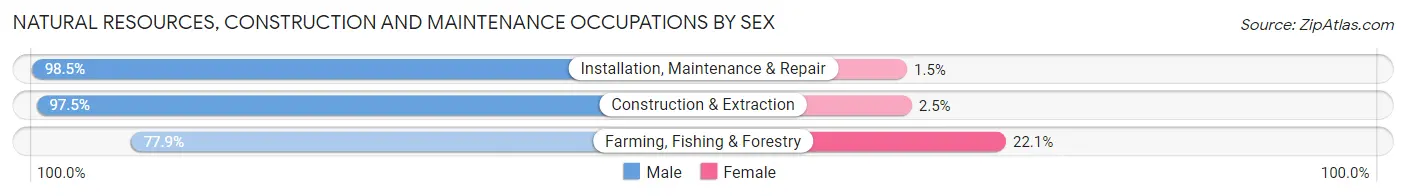
| Occupation | Male | Female |
| Farming, Fishing & Forestry | 268 (77.9%) | 76 (22.1%) |
| Construction & Extraction | 3,618 (97.5%) | 92 (2.5%) |
| Installation, Maintenance & Repair | 3,496 (98.5%) | 53 (1.5%) |
| Total (Category) | 7,382 (97.1%) | 221 (2.9%) |
| Total (Overall) | 53,412 (51.9%) | 49,453 (48.1%) |
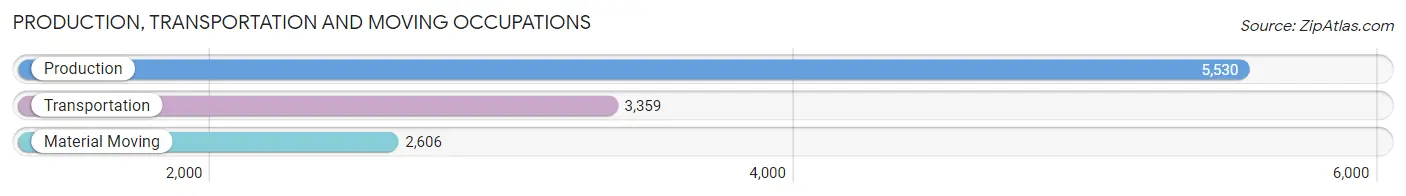
Production, Transportation and Moving Occupations
The most common Production, Transportation and Moving occupations in Oneida County are Production (5,530 | 5.4%), Transportation (3,359 | 3.3%), and Material Moving (2,606 | 2.5%).
Production, Transportation and Moving Occupations by Sex
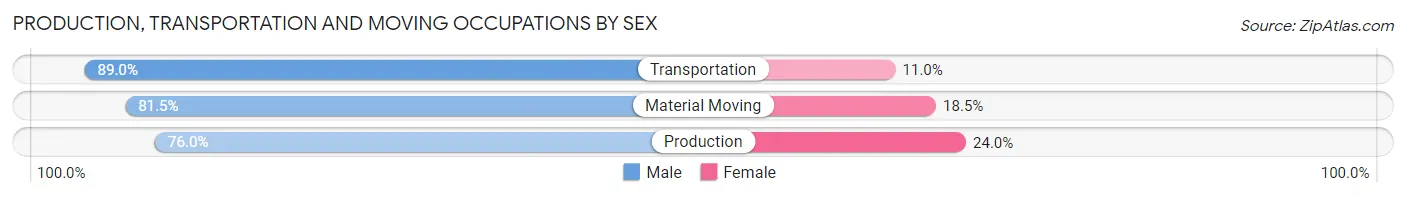
| Occupation | Male | Female |
| Production | 4,205 (76.0%) | 1,325 (24.0%) |
| Transportation | 2,989 (89.0%) | 370 (11.0%) |
| Material Moving | 2,125 (81.5%) | 481 (18.5%) |
| Total (Category) | 9,319 (81.1%) | 2,176 (18.9%) |
| Total (Overall) | 53,412 (51.9%) | 49,453 (48.1%) |
Employment Industries by Sex in Oneida County
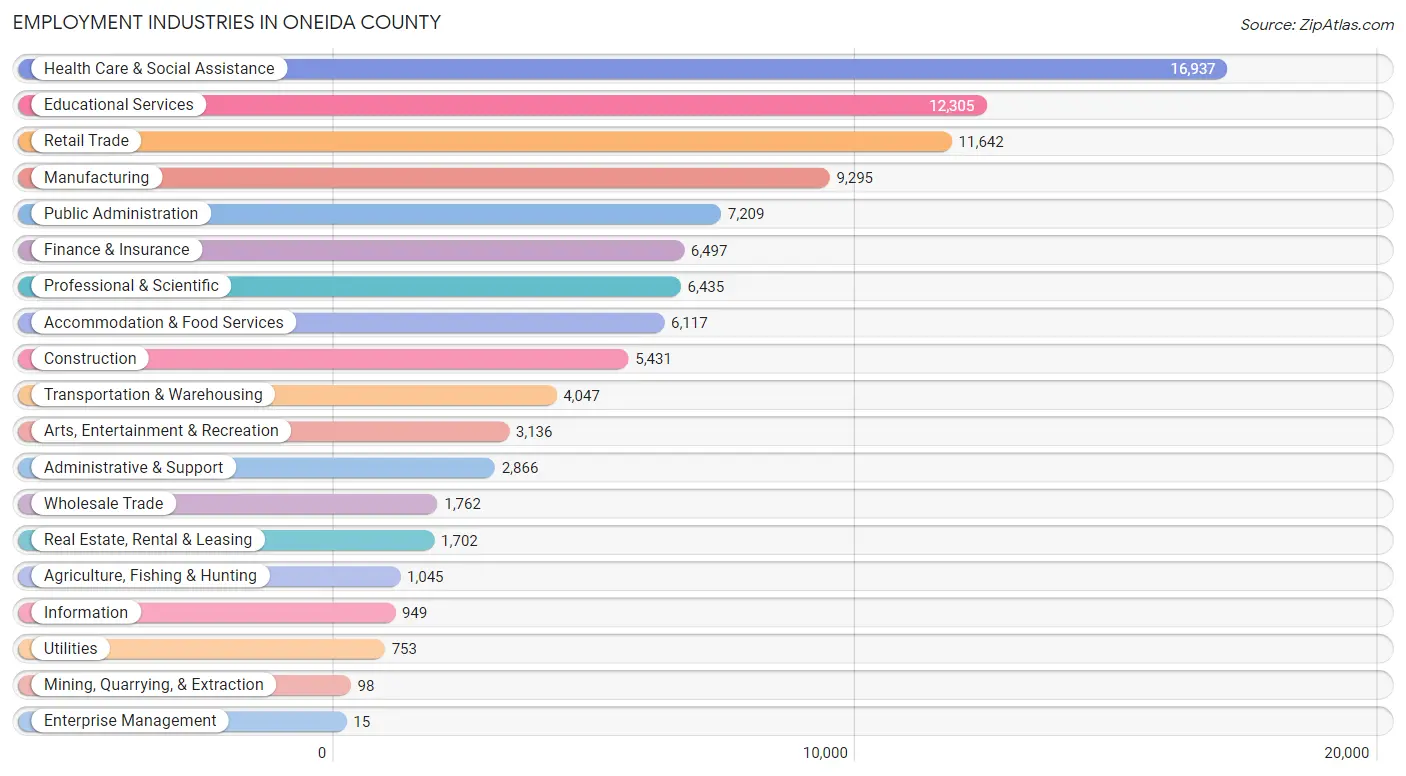
Employment Industries in Oneida County
The major employment industries in Oneida County include Health Care & Social Assistance (16,937 | 16.5%), Educational Services (12,305 | 12.0%), Retail Trade (11,642 | 11.3%), Manufacturing (9,295 | 9.0%), and Public Administration (7,209 | 7.0%).
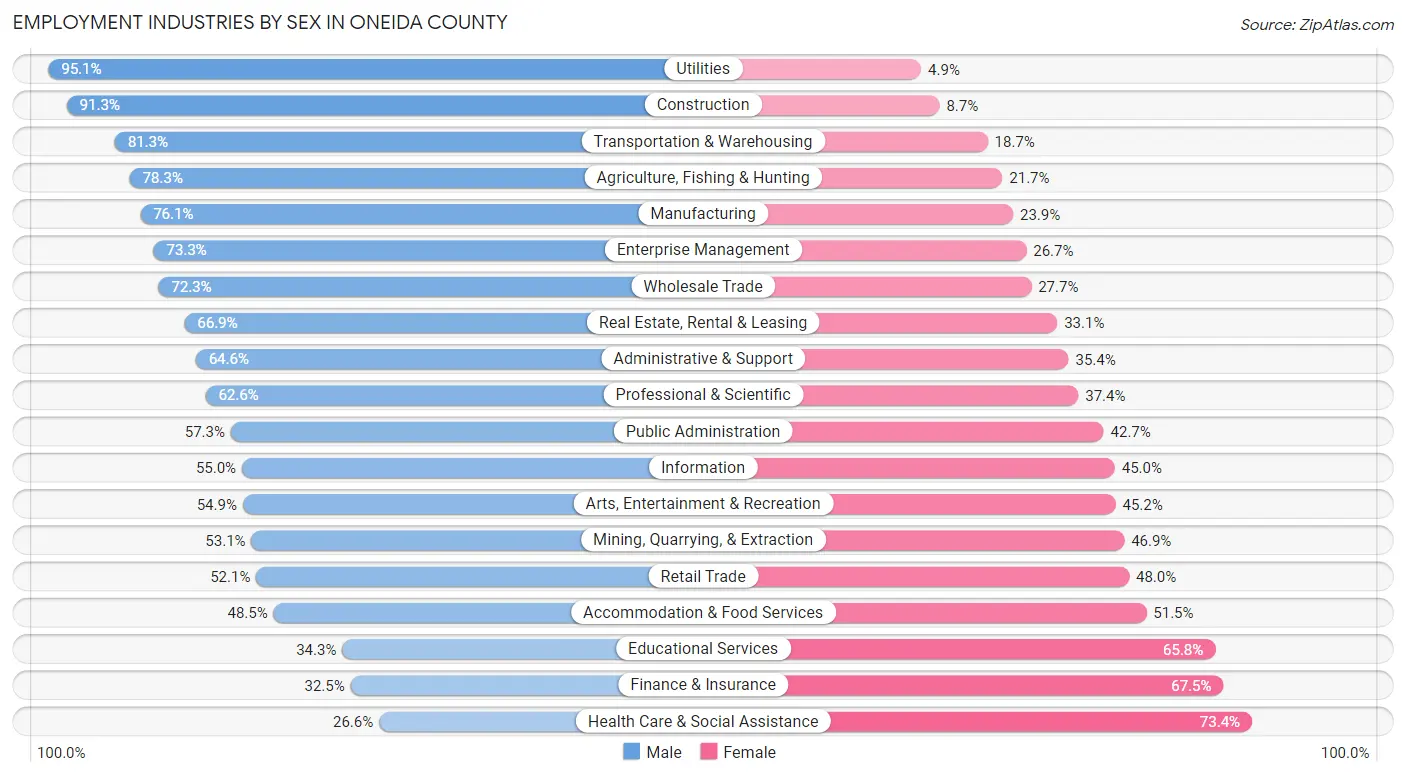
Employment Industries by Sex in Oneida County
The Oneida County industries that see more men than women are Utilities (95.1%), Construction (91.3%), and Transportation & Warehousing (81.3%), whereas the industries that tend to have a higher number of women are Health Care & Social Assistance (73.4%), Finance & Insurance (67.5%), and Educational Services (65.7%).
| Industry | Male | Female |
| Agriculture, Fishing & Hunting | 818 (78.3%) | 227 (21.7%) |
| Mining, Quarrying, & Extraction | 52 (53.1%) | 46 (46.9%) |
| Construction | 4,958 (91.3%) | 473 (8.7%) |
| Manufacturing | 7,071 (76.1%) | 2,224 (23.9%) |
| Wholesale Trade | 1,274 (72.3%) | 488 (27.7%) |
| Retail Trade | 6,060 (52.0%) | 5,582 (47.9%) |
| Transportation & Warehousing | 3,291 (81.3%) | 756 (18.7%) |
| Utilities | 716 (95.1%) | 37 (4.9%) |
| Information | 522 (55.0%) | 427 (45.0%) |
| Finance & Insurance | 2,114 (32.5%) | 4,383 (67.5%) |
| Real Estate, Rental & Leasing | 1,139 (66.9%) | 563 (33.1%) |
| Professional & Scientific | 4,026 (62.6%) | 2,409 (37.4%) |
| Enterprise Management | 11 (73.3%) | 4 (26.7%) |
| Administrative & Support | 1,851 (64.6%) | 1,015 (35.4%) |
| Educational Services | 4,215 (34.3%) | 8,090 (65.7%) |
| Health Care & Social Assistance | 4,511 (26.6%) | 12,426 (73.4%) |
| Arts, Entertainment & Recreation | 1,720 (54.8%) | 1,416 (45.2%) |
| Accommodation & Food Services | 2,965 (48.5%) | 3,152 (51.5%) |
| Public Administration | 4,132 (57.3%) | 3,077 (42.7%) |
| Total | 53,412 (51.9%) | 49,453 (48.1%) |
Education in Oneida County
School Enrollment in Oneida County
The most common levels of schooling among the 53,377 students in Oneida County are college / undergraduate (11,842 | 22.2%), high school (11,766 | 22.0%), and middle school (11,324 | 21.2%).
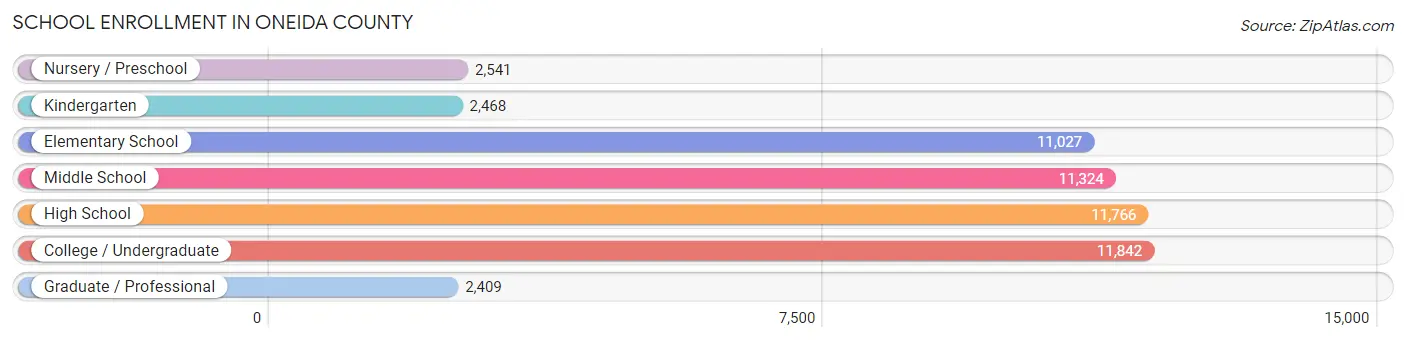
| School Level | # Students | % Students |
| Nursery / Preschool | 2,541 | 4.8% |
| Kindergarten | 2,468 | 4.6% |
| Elementary School | 11,027 | 20.7% |
| Middle School | 11,324 | 21.2% |
| High School | 11,766 | 22.0% |
| College / Undergraduate | 11,842 | 22.2% |
| Graduate / Professional | 2,409 | 4.5% |
| Total | 53,377 | 100.0% |
School Enrollment by Age by Funding Source in Oneida County
Out of a total of 53,377 students who are enrolled in schools in Oneida County, 8,594 (16.1%) attend a private institution, while the remaining 44,783 (83.9%) are enrolled in public schools. The age group of 20 to 24 year olds has the highest likelihood of being enrolled in private schools, with 2,806 (42.5% in the age bracket) enrolled. Conversely, the age group of 15 to 17 year olds has the lowest likelihood of being enrolled in a private school, with 7,944 (95.0% in the age bracket) attending a public institution.
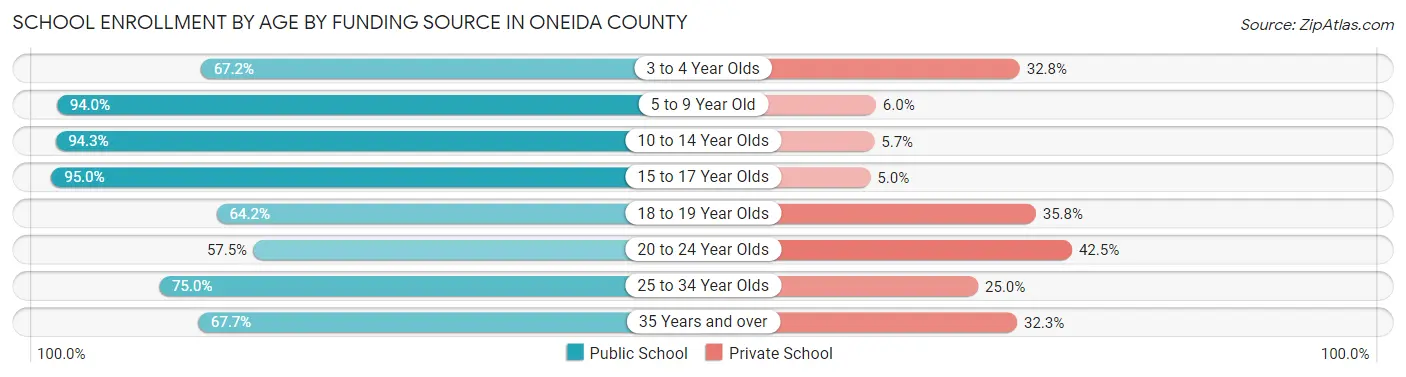
| Age Bracket | Public School | Private School |
| 3 to 4 Year Olds | 1,368 (67.2%) | 668 (32.8%) |
| 5 to 9 Year Old | 11,712 (94.0%) | 748 (6.0%) |
| 10 to 14 Year Olds | 13,562 (94.3%) | 822 (5.7%) |
| 15 to 17 Year Olds | 7,944 (95.0%) | 416 (5.0%) |
| 18 to 19 Year Olds | 3,339 (64.2%) | 1,860 (35.8%) |
| 20 to 24 Year Olds | 3,791 (57.5%) | 2,806 (42.5%) |
| 25 to 34 Year Olds | 1,506 (75.0%) | 503 (25.0%) |
| 35 Years and over | 1,579 (67.7%) | 753 (32.3%) |
| Total | 44,783 (83.9%) | 8,594 (16.1%) |
Educational Attainment by Field of Study in Oneida County
Business (7,437 | 15.9%), education (7,203 | 15.3%), science & technology (6,052 | 12.9%), psychology (3,448 | 7.3%), and social sciences (3,245 | 6.9%) are the most common fields of study among 46,913 individuals in Oneida County who have obtained a bachelor's degree or higher.
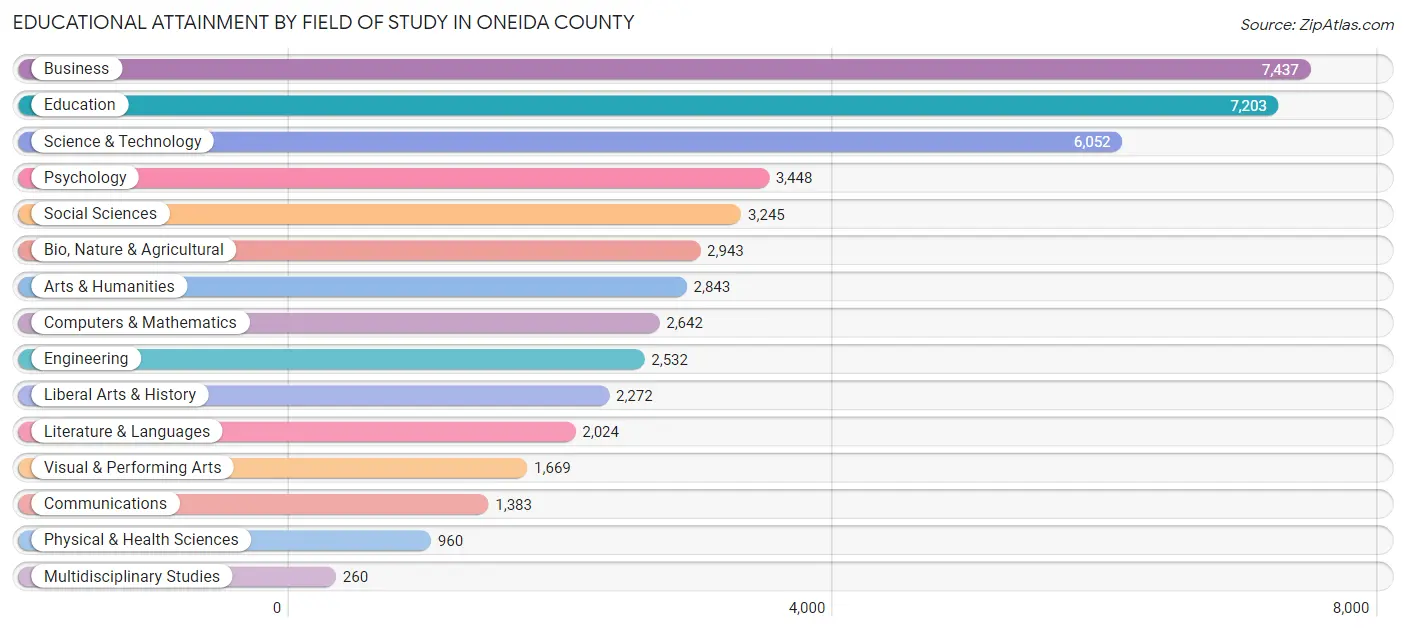
| Field of Study | # Graduates | % Graduates |
| Computers & Mathematics | 2,642 | 5.6% |
| Bio, Nature & Agricultural | 2,943 | 6.3% |
| Physical & Health Sciences | 960 | 2.1% |
| Psychology | 3,448 | 7.3% |
| Social Sciences | 3,245 | 6.9% |
| Engineering | 2,532 | 5.4% |
| Multidisciplinary Studies | 260 | 0.5% |
| Science & Technology | 6,052 | 12.9% |
| Business | 7,437 | 15.9% |
| Education | 7,203 | 15.3% |
| Literature & Languages | 2,024 | 4.3% |
| Liberal Arts & History | 2,272 | 4.8% |
| Visual & Performing Arts | 1,669 | 3.6% |
| Communications | 1,383 | 2.9% |
| Arts & Humanities | 2,843 | 6.1% |
| Total | 46,913 | 100.0% |
Transportation & Commute in Oneida County
Vehicle Availability by Sex in Oneida County
The most prevalent vehicle ownership categories in Oneida County are males with 2 vehicles (22,999, accounting for 44.0%) and females with 2 vehicles (19,782, making up 49.0%).
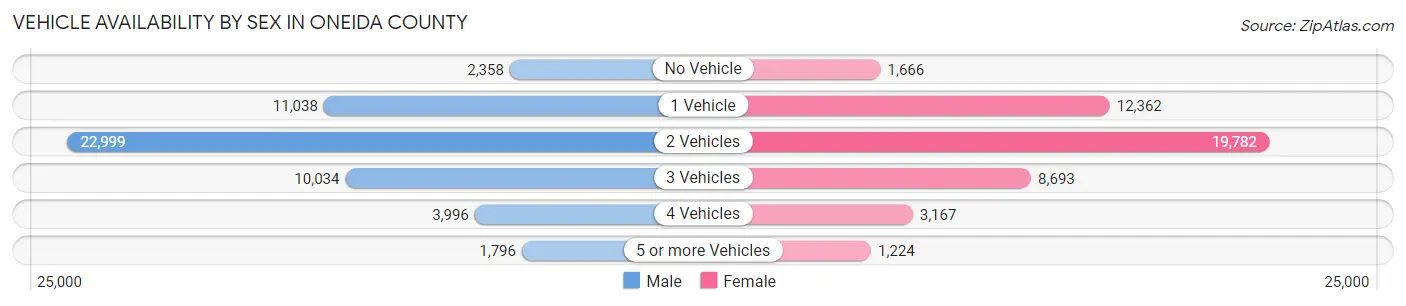
| Vehicles Available | Male | Female |
| No Vehicle | 2,358 (4.5%) | 1,666 (3.5%) |
| 1 Vehicle | 11,038 (21.1%) | 12,362 (26.4%) |
| 2 Vehicles | 22,999 (44.0%) | 19,782 (42.2%) |
| 3 Vehicles | 10,034 (19.2%) | 8,693 (18.5%) |
| 4 Vehicles | 3,996 (7.6%) | 3,167 (6.8%) |
| 5 or more Vehicles | 1,796 (3.4%) | 1,224 (2.6%) |
| Total | 52,221 (100.0%) | 46,894 (100.0%) |
Commute Time in Oneida County
The most frequently occuring commute durations in Oneida County are 10 to 14 minutes (18,830 commuters, 20.5%), 15 to 19 minutes (17,182 commuters, 18.7%), and 5 to 9 minutes (14,033 commuters, 15.3%).
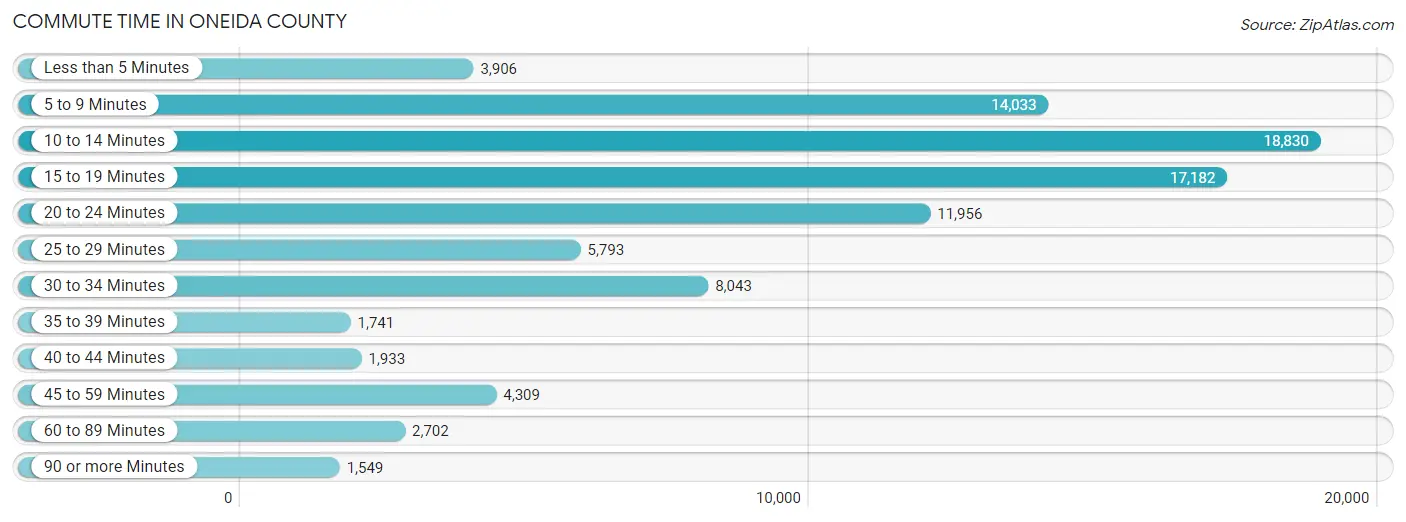
| Commute Time | # Commuters | % Commuters |
| Less than 5 Minutes | 3,906 | 4.3% |
| 5 to 9 Minutes | 14,033 | 15.3% |
| 10 to 14 Minutes | 18,830 | 20.5% |
| 15 to 19 Minutes | 17,182 | 18.7% |
| 20 to 24 Minutes | 11,956 | 13.0% |
| 25 to 29 Minutes | 5,793 | 6.3% |
| 30 to 34 Minutes | 8,043 | 8.7% |
| 35 to 39 Minutes | 1,741 | 1.9% |
| 40 to 44 Minutes | 1,933 | 2.1% |
| 45 to 59 Minutes | 4,309 | 4.7% |
| 60 to 89 Minutes | 2,702 | 2.9% |
| 90 or more Minutes | 1,549 | 1.7% |
Commute Time by Sex in Oneida County
The most common commute times in Oneida County are 10 to 14 minutes (9,679 commuters, 19.7%) for males and 10 to 14 minutes (9,151 commuters, 21.4%) for females.
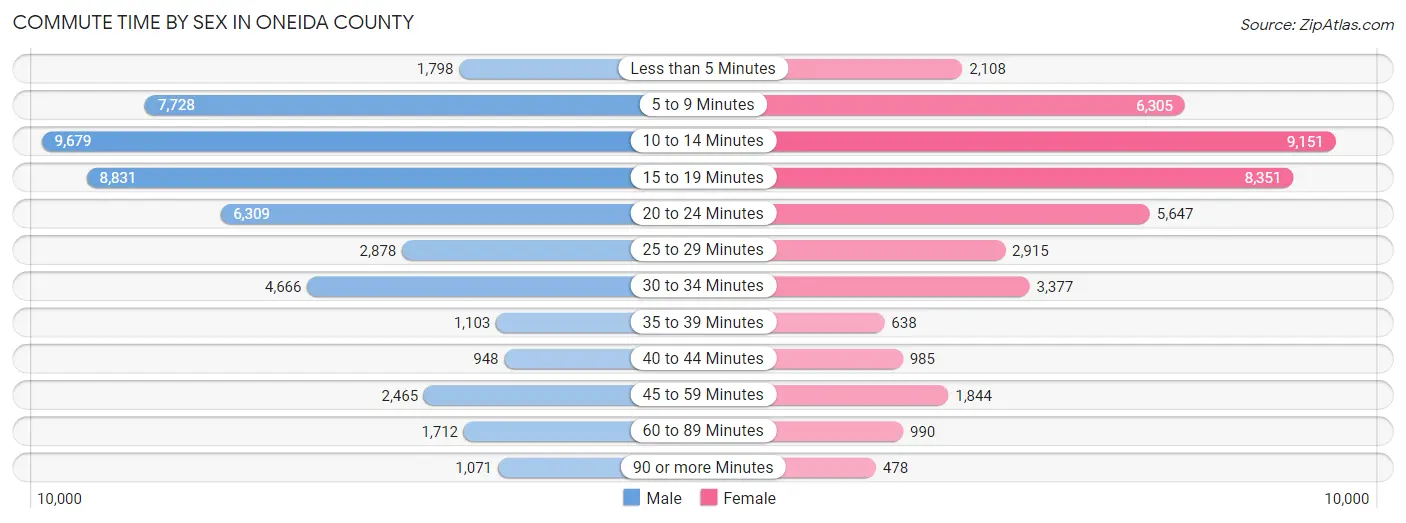
| Commute Time | Male | Female |
| Less than 5 Minutes | 1,798 (3.7%) | 2,108 (4.9%) |
| 5 to 9 Minutes | 7,728 (15.7%) | 6,305 (14.7%) |
| 10 to 14 Minutes | 9,679 (19.7%) | 9,151 (21.4%) |
| 15 to 19 Minutes | 8,831 (17.9%) | 8,351 (19.5%) |
| 20 to 24 Minutes | 6,309 (12.8%) | 5,647 (13.2%) |
| 25 to 29 Minutes | 2,878 (5.9%) | 2,915 (6.8%) |
| 30 to 34 Minutes | 4,666 (9.5%) | 3,377 (7.9%) |
| 35 to 39 Minutes | 1,103 (2.2%) | 638 (1.5%) |
| 40 to 44 Minutes | 948 (1.9%) | 985 (2.3%) |
| 45 to 59 Minutes | 2,465 (5.0%) | 1,844 (4.3%) |
| 60 to 89 Minutes | 1,712 (3.5%) | 990 (2.3%) |
| 90 or more Minutes | 1,071 (2.2%) | 478 (1.1%) |
Time of Departure to Work by Sex in Oneida County
The most frequent times of departure to work in Oneida County are 7:30 AM to 7:59 AM (6,602, 13.4%) for males and 7:30 AM to 7:59 AM (7,108, 16.6%) for females.
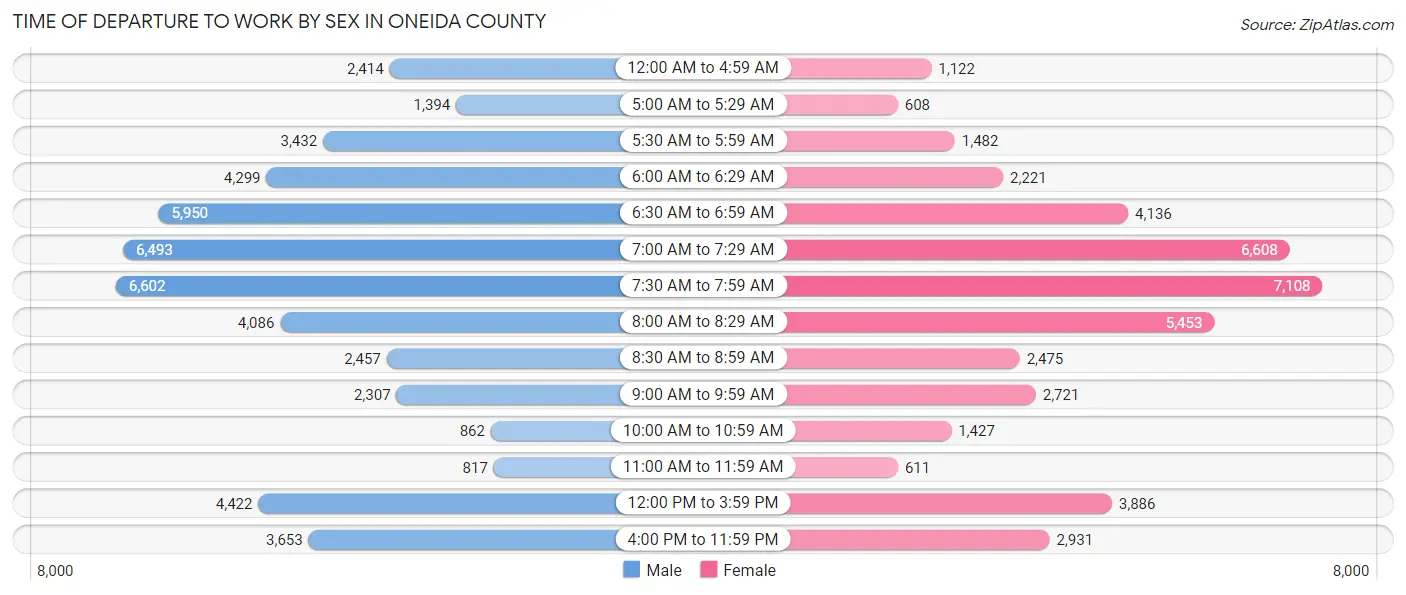
| Time of Departure | Male | Female |
| 12:00 AM to 4:59 AM | 2,414 (4.9%) | 1,122 (2.6%) |
| 5:00 AM to 5:29 AM | 1,394 (2.8%) | 608 (1.4%) |
| 5:30 AM to 5:59 AM | 3,432 (7.0%) | 1,482 (3.5%) |
| 6:00 AM to 6:29 AM | 4,299 (8.7%) | 2,221 (5.2%) |
| 6:30 AM to 6:59 AM | 5,950 (12.1%) | 4,136 (9.7%) |
| 7:00 AM to 7:29 AM | 6,493 (13.2%) | 6,608 (15.4%) |
| 7:30 AM to 7:59 AM | 6,602 (13.4%) | 7,108 (16.6%) |
| 8:00 AM to 8:29 AM | 4,086 (8.3%) | 5,453 (12.7%) |
| 8:30 AM to 8:59 AM | 2,457 (5.0%) | 2,475 (5.8%) |
| 9:00 AM to 9:59 AM | 2,307 (4.7%) | 2,721 (6.4%) |
| 10:00 AM to 10:59 AM | 862 (1.8%) | 1,427 (3.3%) |
| 11:00 AM to 11:59 AM | 817 (1.7%) | 611 (1.4%) |
| 12:00 PM to 3:59 PM | 4,422 (9.0%) | 3,886 (9.1%) |
| 4:00 PM to 11:59 PM | 3,653 (7.4%) | 2,931 (6.9%) |
| Total | 49,188 (100.0%) | 42,789 (100.0%) |
Housing Occupancy in Oneida County
Occupancy by Ownership in Oneida County
Of the total 92,944 dwellings in Oneida County, owner-occupied units account for 63,158 (67.9%), while renter-occupied units make up 29,786 (32.1%).
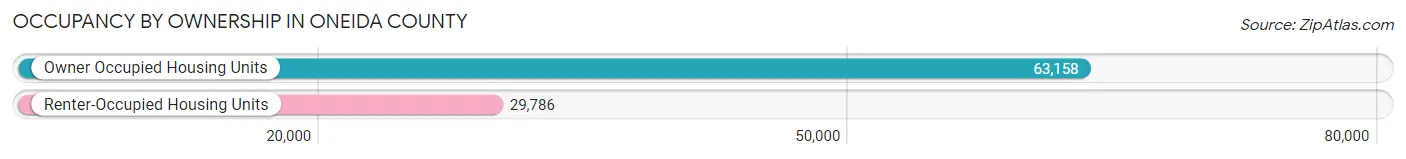
| Occupancy | # Housing Units | % Housing Units |
| Owner Occupied Housing Units | 63,158 | 67.9% |
| Renter-Occupied Housing Units | 29,786 | 32.1% |
| Total Occupied Housing Units | 92,944 | 100.0% |
Occupancy by Household Size in Oneida County
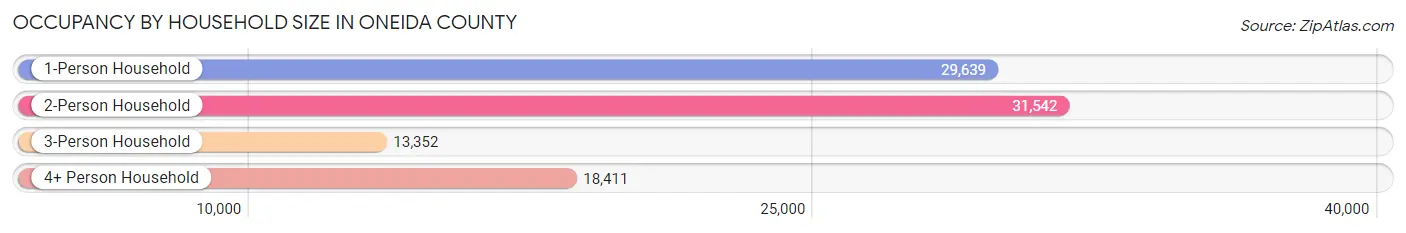
| Household Size | # Housing Units | % Housing Units |
| 1-Person Household | 29,639 | 31.9% |
| 2-Person Household | 31,542 | 33.9% |
| 3-Person Household | 13,352 | 14.4% |
| 4+ Person Household | 18,411 | 19.8% |
| Total Housing Units | 92,944 | 100.0% |
Occupancy by Ownership by Household Size in Oneida County
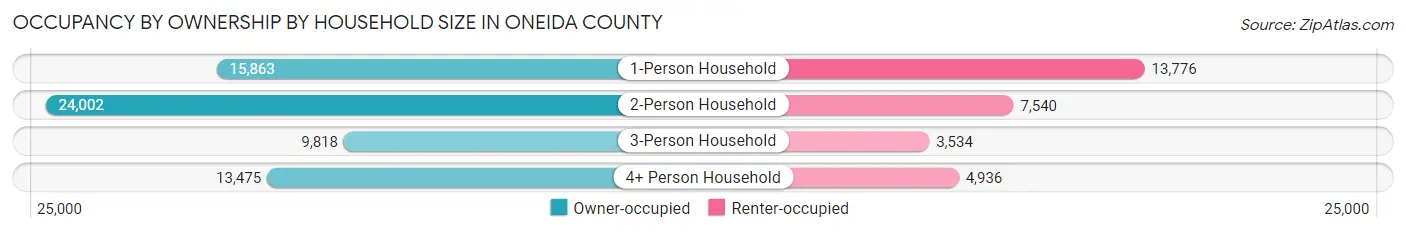
| Household Size | Owner-occupied | Renter-occupied |
| 1-Person Household | 15,863 (53.5%) | 13,776 (46.5%) |
| 2-Person Household | 24,002 (76.1%) | 7,540 (23.9%) |
| 3-Person Household | 9,818 (73.5%) | 3,534 (26.5%) |
| 4+ Person Household | 13,475 (73.2%) | 4,936 (26.8%) |
| Total Housing Units | 63,158 (67.9%) | 29,786 (32.1%) |
Occupancy by Educational Attainment in Oneida County
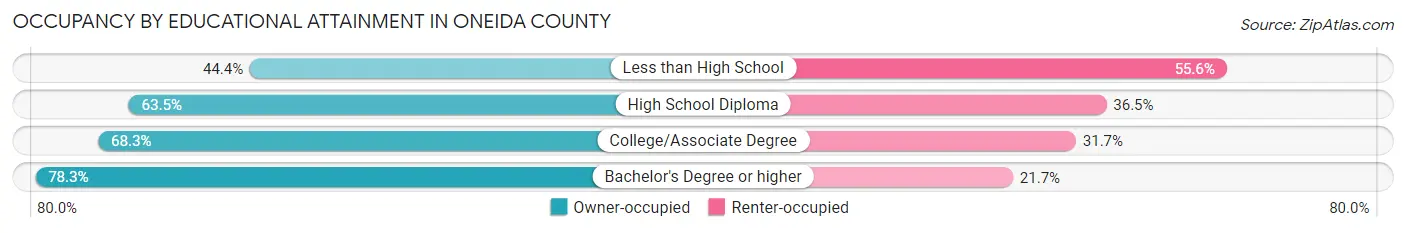
| Household Size | Owner-occupied | Renter-occupied |
| Less than High School | 3,555 (44.4%) | 4,451 (55.6%) |
| High School Diploma | 15,967 (63.5%) | 9,182 (36.5%) |
| College/Associate Degree | 21,808 (68.3%) | 10,106 (31.7%) |
| Bachelor's Degree or higher | 21,828 (78.3%) | 6,047 (21.7%) |
Occupancy by Age of Householder in Oneida County
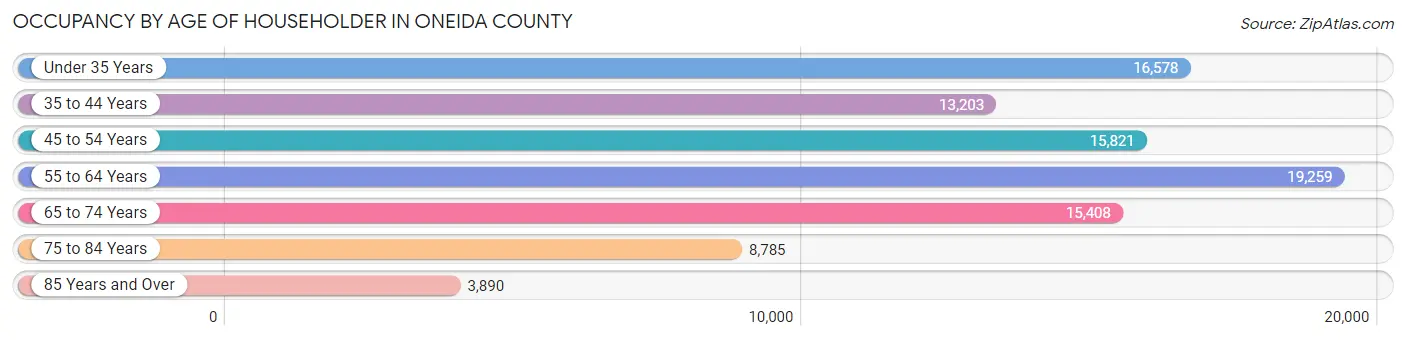
| Age Bracket | # Households | % Households |
| Under 35 Years | 16,578 | 17.8% |
| 35 to 44 Years | 13,203 | 14.2% |
| 45 to 54 Years | 15,821 | 17.0% |
| 55 to 64 Years | 19,259 | 20.7% |
| 65 to 74 Years | 15,408 | 16.6% |
| 75 to 84 Years | 8,785 | 9.5% |
| 85 Years and Over | 3,890 | 4.2% |
| Total | 92,944 | 100.0% |
Housing Finances in Oneida County
Median Income by Occupancy in Oneida County
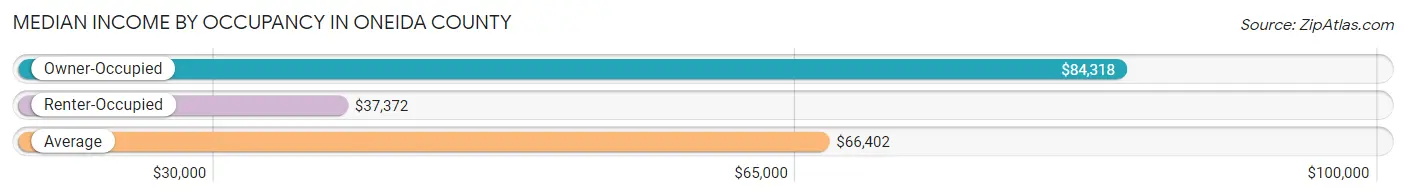
| Occupancy Type | # Households | Median Income |
| Owner-Occupied | 63,158 (67.9%) | $84,318 |
| Renter-Occupied | 29,786 (32.1%) | $37,372 |
| Average | 92,944 (100.0%) | $66,402 |
Occupancy by Householder Income Bracket in Oneida County
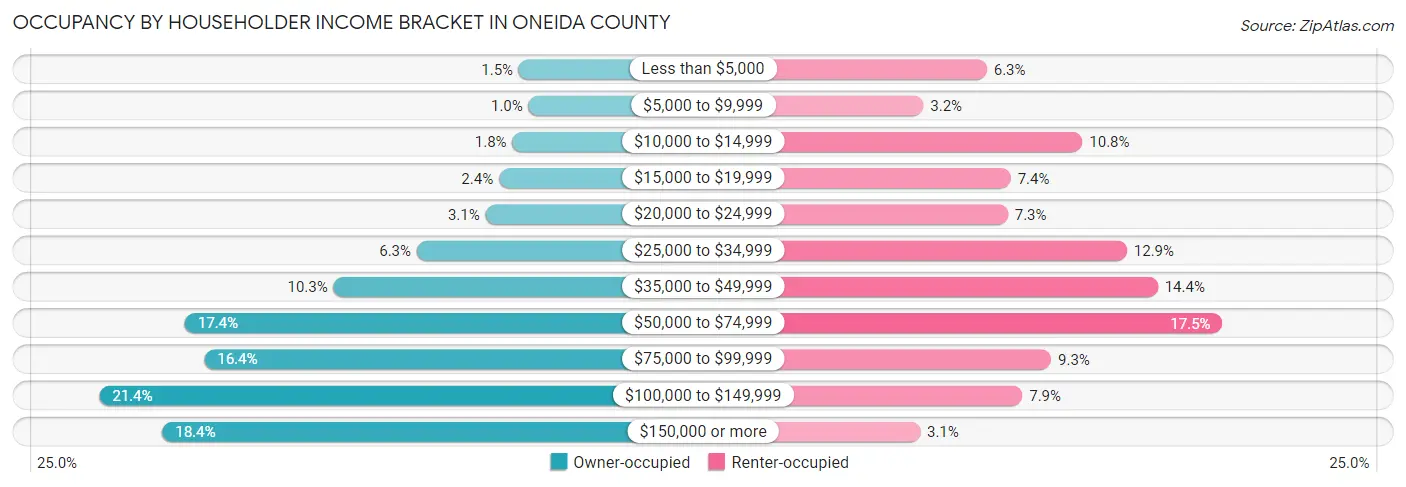
| Income Bracket | Owner-occupied | Renter-occupied |
| Less than $5,000 | 924 (1.5%) | 1,862 (6.2%) |
| $5,000 to $9,999 | 631 (1.0%) | 961 (3.2%) |
| $10,000 to $14,999 | 1,120 (1.8%) | 3,216 (10.8%) |
| $15,000 to $19,999 | 1,520 (2.4%) | 2,200 (7.4%) |
| $20,000 to $24,999 | 1,927 (3.0%) | 2,159 (7.2%) |
| $25,000 to $34,999 | 3,994 (6.3%) | 3,849 (12.9%) |
| $35,000 to $49,999 | 6,498 (10.3%) | 4,285 (14.4%) |
| $50,000 to $74,999 | 10,968 (17.4%) | 5,203 (17.5%) |
| $75,000 to $99,999 | 10,383 (16.4%) | 2,772 (9.3%) |
| $100,000 to $149,999 | 13,544 (21.4%) | 2,365 (7.9%) |
| $150,000 or more | 11,649 (18.4%) | 914 (3.1%) |
| Total | 63,158 (100.0%) | 29,786 (100.0%) |
Monthly Housing Cost Tiers in Oneida County
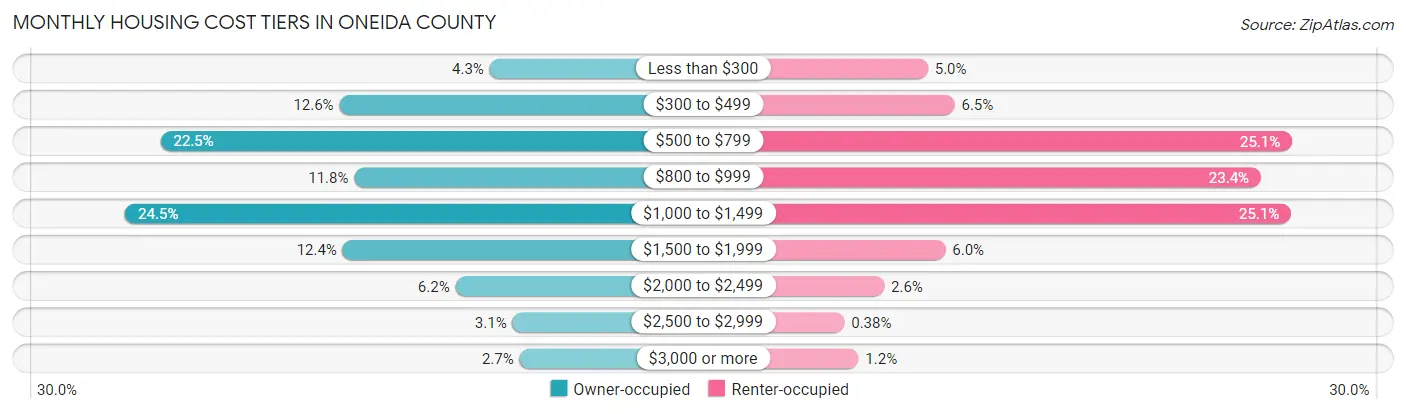
| Monthly Cost | Owner-occupied | Renter-occupied |
| Less than $300 | 2,720 (4.3%) | 1,486 (5.0%) |
| $300 to $499 | 7,963 (12.6%) | 1,927 (6.5%) |
| $500 to $799 | 14,209 (22.5%) | 7,479 (25.1%) |
| $800 to $999 | 7,448 (11.8%) | 6,966 (23.4%) |
| $1,000 to $1,499 | 15,445 (24.4%) | 7,463 (25.1%) |
| $1,500 to $1,999 | 7,848 (12.4%) | 1,776 (6.0%) |
| $2,000 to $2,499 | 3,914 (6.2%) | 768 (2.6%) |
| $2,500 to $2,999 | 1,929 (3.0%) | 114 (0.4%) |
| $3,000 or more | 1,682 (2.7%) | 345 (1.2%) |
| Total | 63,158 (100.0%) | 29,786 (100.0%) |
Physical Housing Characteristics in Oneida County
Housing Structures in Oneida County
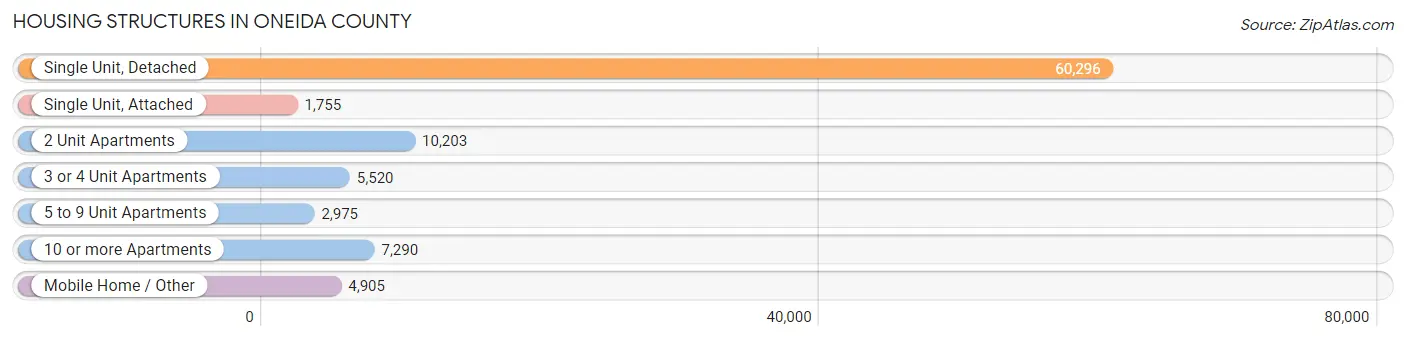
| Structure Type | # Housing Units | % Housing Units |
| Single Unit, Detached | 60,296 | 64.9% |
| Single Unit, Attached | 1,755 | 1.9% |
| 2 Unit Apartments | 10,203 | 11.0% |
| 3 or 4 Unit Apartments | 5,520 | 5.9% |
| 5 to 9 Unit Apartments | 2,975 | 3.2% |
| 10 or more Apartments | 7,290 | 7.8% |
| Mobile Home / Other | 4,905 | 5.3% |
| Total | 92,944 | 100.0% |
Housing Structures by Occupancy in Oneida County
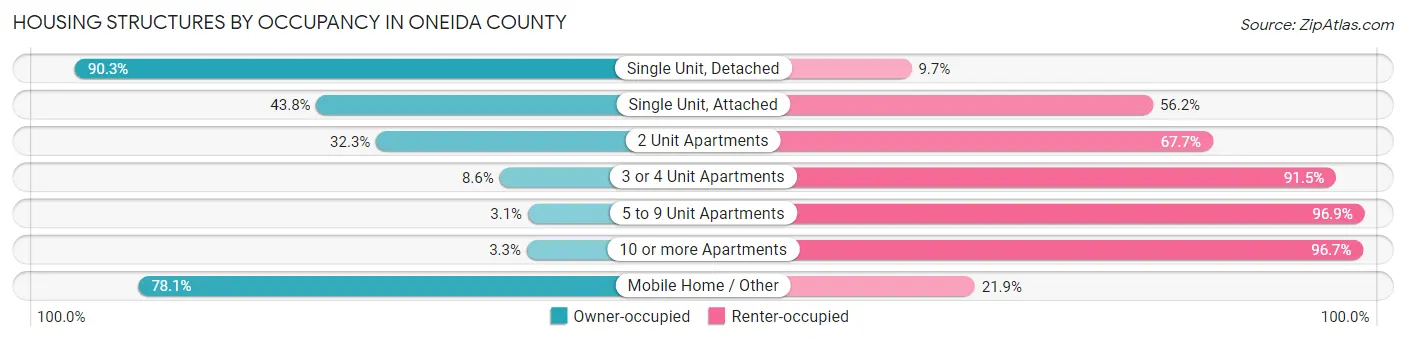
| Structure Type | Owner-occupied | Renter-occupied |
| Single Unit, Detached | 54,455 (90.3%) | 5,841 (9.7%) |
| Single Unit, Attached | 769 (43.8%) | 986 (56.2%) |
| 2 Unit Apartments | 3,297 (32.3%) | 6,906 (67.7%) |
| 3 or 4 Unit Apartments | 472 (8.6%) | 5,048 (91.4%) |
| 5 to 9 Unit Apartments | 92 (3.1%) | 2,883 (96.9%) |
| 10 or more Apartments | 241 (3.3%) | 7,049 (96.7%) |
| Mobile Home / Other | 3,832 (78.1%) | 1,073 (21.9%) |
| Total | 63,158 (67.9%) | 29,786 (32.1%) |
Housing Structures by Number of Rooms in Oneida County
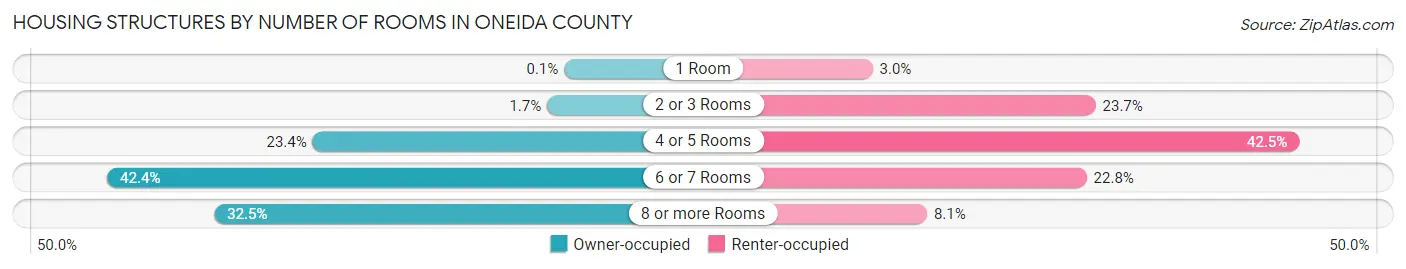
| Number of Rooms | Owner-occupied | Renter-occupied |
| 1 Room | 66 (0.1%) | 899 (3.0%) |
| 2 or 3 Rooms | 1,061 (1.7%) | 7,045 (23.6%) |
| 4 or 5 Rooms | 14,760 (23.4%) | 12,647 (42.5%) |
| 6 or 7 Rooms | 26,756 (42.4%) | 6,797 (22.8%) |
| 8 or more Rooms | 20,515 (32.5%) | 2,398 (8.1%) |
| Total | 63,158 (100.0%) | 29,786 (100.0%) |
Housing Structure by Heating Type in Oneida County
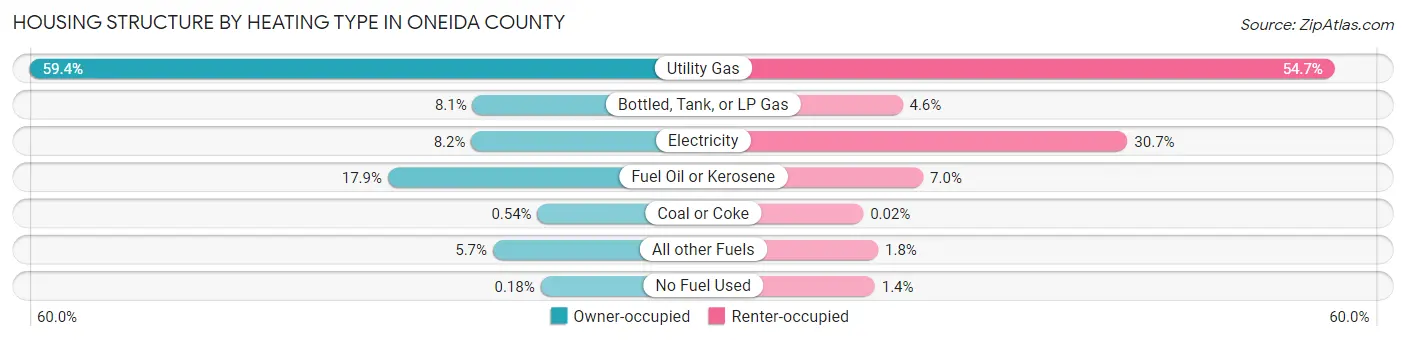
| Heating Type | Owner-occupied | Renter-occupied |
| Utility Gas | 37,521 (59.4%) | 16,286 (54.7%) |
| Bottled, Tank, or LP Gas | 5,089 (8.1%) | 1,363 (4.6%) |
| Electricity | 5,184 (8.2%) | 9,128 (30.6%) |
| Fuel Oil or Kerosene | 11,302 (17.9%) | 2,076 (7.0%) |
| Coal or Coke | 344 (0.5%) | 5 (0.0%) |
| All other Fuels | 3,606 (5.7%) | 522 (1.8%) |
| No Fuel Used | 112 (0.2%) | 406 (1.4%) |
| Total | 63,158 (100.0%) | 29,786 (100.0%) |
Household Vehicle Usage in Oneida County
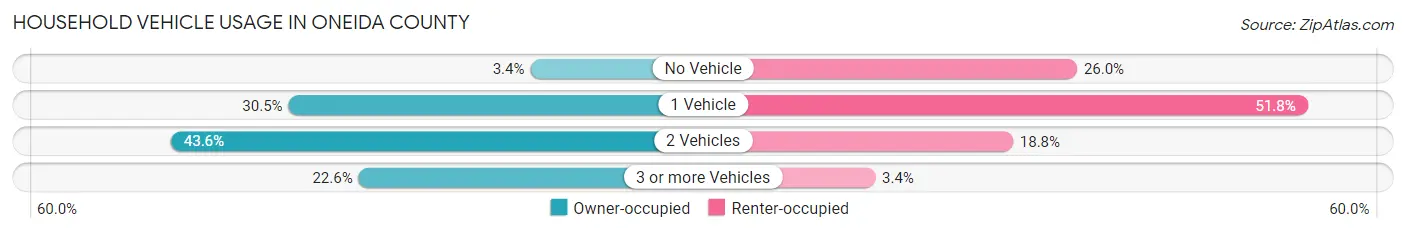
| Vehicles per Household | Owner-occupied | Renter-occupied |
| No Vehicle | 2,113 (3.4%) | 7,741 (26.0%) |
| 1 Vehicle | 19,229 (30.4%) | 15,434 (51.8%) |
| 2 Vehicles | 27,542 (43.6%) | 5,603 (18.8%) |
| 3 or more Vehicles | 14,274 (22.6%) | 1,008 (3.4%) |
| Total | 63,158 (100.0%) | 29,786 (100.0%) |
Real Estate & Mortgages in Oneida County
Real Estate and Mortgage Overview in Oneida County
| Characteristic | Without Mortgage | With Mortgage |
| Housing Units | 29,878 | 33,280 |
| Median Property Value | $141,100 | $170,600 |
| Median Household Income | $67,013 | $7,624 |
| Monthly Housing Costs | $595 | $1,577 |
| Real Estate Taxes | $3,097 | $1,308 |
Property Value by Mortgage Status in Oneida County
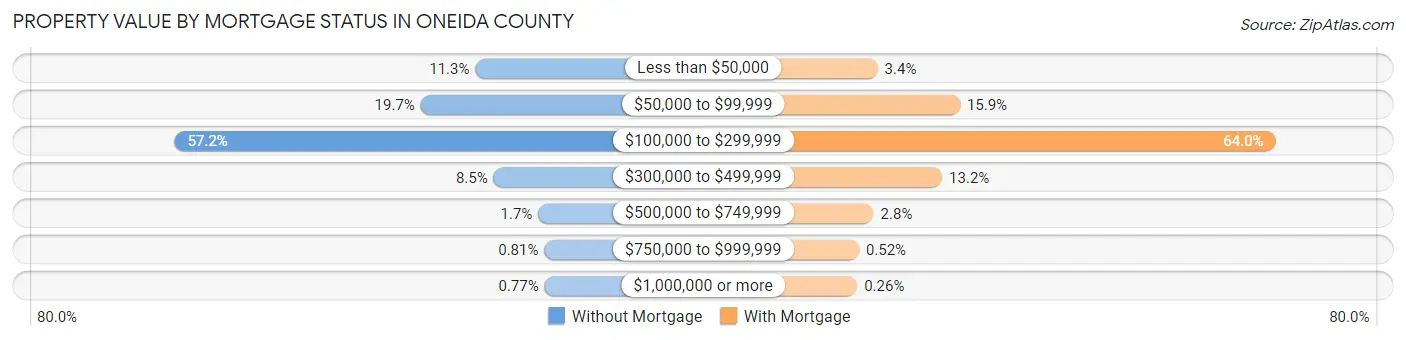
| Property Value | Without Mortgage | With Mortgage |
| Less than $50,000 | 3,383 (11.3%) | 1,123 (3.4%) |
| $50,000 to $99,999 | 5,870 (19.7%) | 5,295 (15.9%) |
| $100,000 to $299,999 | 17,078 (57.2%) | 21,293 (64.0%) |
| $300,000 to $499,999 | 2,553 (8.5%) | 4,393 (13.2%) |
| $500,000 to $749,999 | 520 (1.7%) | 917 (2.8%) |
| $750,000 to $999,999 | 243 (0.8%) | 174 (0.5%) |
| $1,000,000 or more | 231 (0.8%) | 85 (0.3%) |
| Total | 29,878 (100.0%) | 33,280 (100.0%) |
Household Income by Mortgage Status in Oneida County
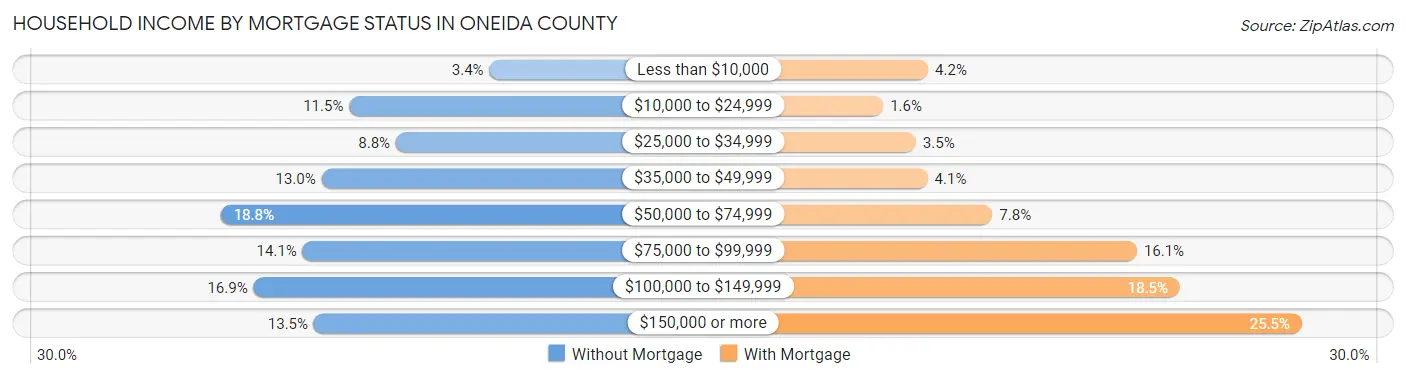
| Household Income | Without Mortgage | With Mortgage |
| Less than $10,000 | 1,028 (3.4%) | 1,381 (4.2%) |
| $10,000 to $24,999 | 3,420 (11.5%) | 527 (1.6%) |
| $25,000 to $34,999 | 2,624 (8.8%) | 1,147 (3.5%) |
| $35,000 to $49,999 | 3,894 (13.0%) | 1,370 (4.1%) |
| $50,000 to $74,999 | 5,615 (18.8%) | 2,604 (7.8%) |
| $75,000 to $99,999 | 4,216 (14.1%) | 5,353 (16.1%) |
| $100,000 to $149,999 | 5,056 (16.9%) | 6,167 (18.5%) |
| $150,000 or more | 4,025 (13.5%) | 8,488 (25.5%) |
| Total | 29,878 (100.0%) | 33,280 (100.0%) |
Property Value to Household Income Ratio in Oneida County
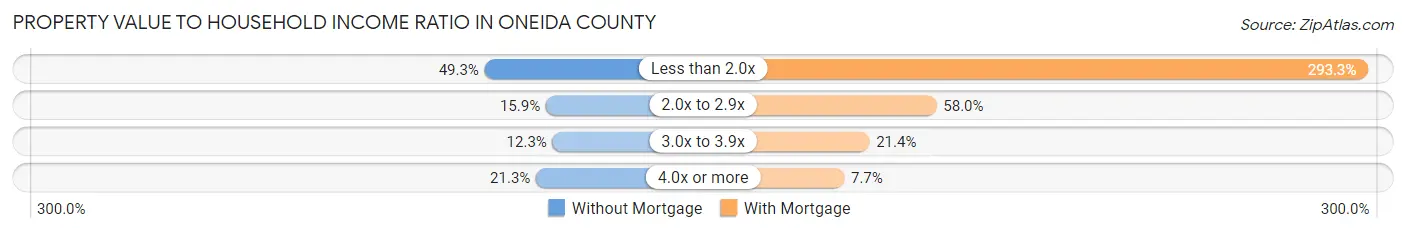
| Value-to-Income Ratio | Without Mortgage | With Mortgage |
| Less than 2.0x | 14,738 (49.3%) | 97,622 (293.3%) |
| 2.0x to 2.9x | 4,756 (15.9%) | 19,298 (58.0%) |
| 3.0x to 3.9x | 3,671 (12.3%) | 7,132 (21.4%) |
| 4.0x or more | 6,360 (21.3%) | 2,556 (7.7%) |
| Total | 29,878 (100.0%) | 33,280 (100.0%) |
Real Estate Taxes by Mortgage Status in Oneida County
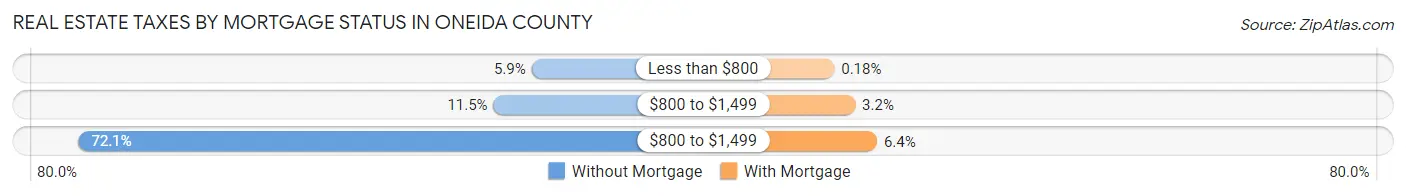
| Property Taxes | Without Mortgage | With Mortgage |
| Less than $800 | 1,769 (5.9%) | 60 (0.2%) |
| $800 to $1,499 | 3,432 (11.5%) | 1,075 (3.2%) |
| $800 to $1,499 | 21,554 (72.1%) | 2,138 (6.4%) |
| Total | 29,878 (100.0%) | 33,280 (100.0%) |
Health & Disability in Oneida County
Health Insurance Coverage by Age in Oneida County
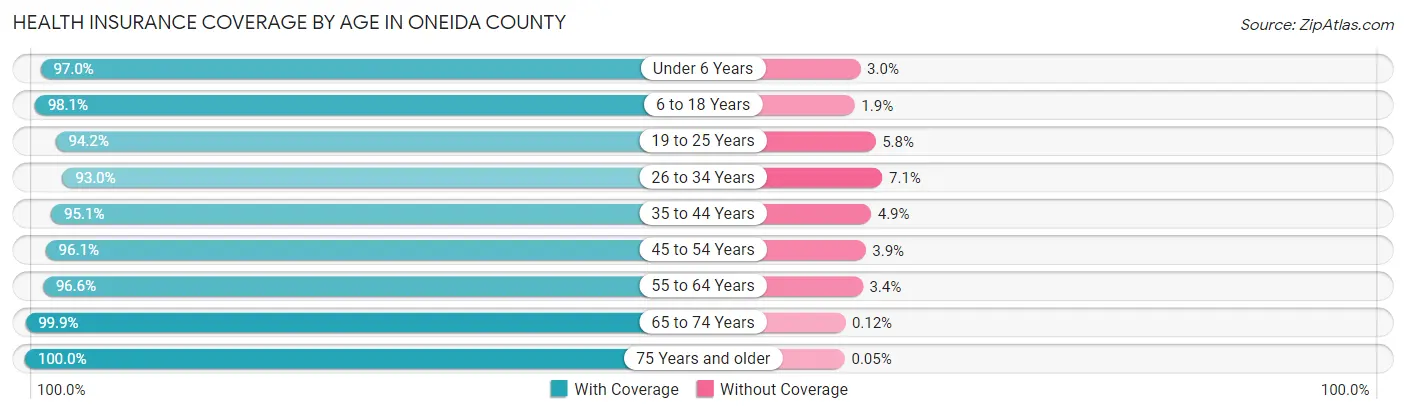
| Age Bracket | With Coverage | Without Coverage |
| Under 6 Years | 15,122 (97.0%) | 461 (3.0%) |
| 6 to 18 Years | 35,993 (98.1%) | 692 (1.9%) |
| 19 to 25 Years | 19,485 (94.2%) | 1,193 (5.8%) |
| 26 to 34 Years | 22,684 (92.9%) | 1,721 (7.0%) |
| 35 to 44 Years | 24,423 (95.1%) | 1,268 (4.9%) |
| 45 to 54 Years | 26,357 (96.1%) | 1,077 (3.9%) |
| 55 to 64 Years | 30,782 (96.6%) | 1,081 (3.4%) |
| 65 to 74 Years | 24,483 (99.9%) | 29 (0.1%) |
| 75 Years and older | 17,785 (100.0%) | 9 (0.1%) |
| Total | 217,114 (96.7%) | 7,531 (3.4%) |
Health Insurance Coverage by Citizenship Status in Oneida County
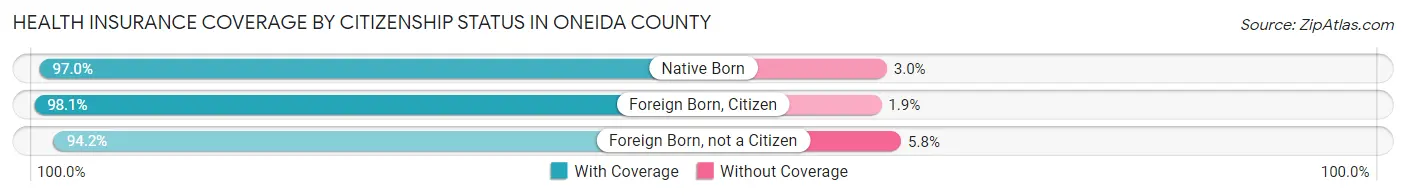
| Citizenship Status | With Coverage | Without Coverage |
| Native Born | 15,122 (97.0%) | 461 (3.0%) |
| Foreign Born, Citizen | 35,993 (98.1%) | 692 (1.9%) |
| Foreign Born, not a Citizen | 19,485 (94.2%) | 1,193 (5.8%) |
Health Insurance Coverage by Household Income in Oneida County
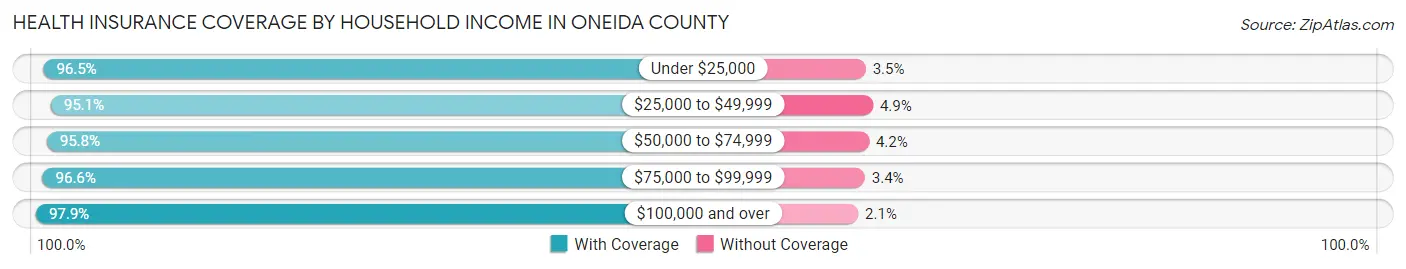
| Household Income | With Coverage | Without Coverage |
| Under $25,000 | 26,576 (96.5%) | 975 (3.5%) |
| $25,000 to $49,999 | 35,096 (95.1%) | 1,811 (4.9%) |
| $50,000 to $74,999 | 35,554 (95.8%) | 1,542 (4.2%) |
| $75,000 to $99,999 | 32,458 (96.6%) | 1,137 (3.4%) |
| $100,000 and over | 81,790 (97.9%) | 1,779 (2.1%) |
Public vs Private Health Insurance Coverage by Age in Oneida County
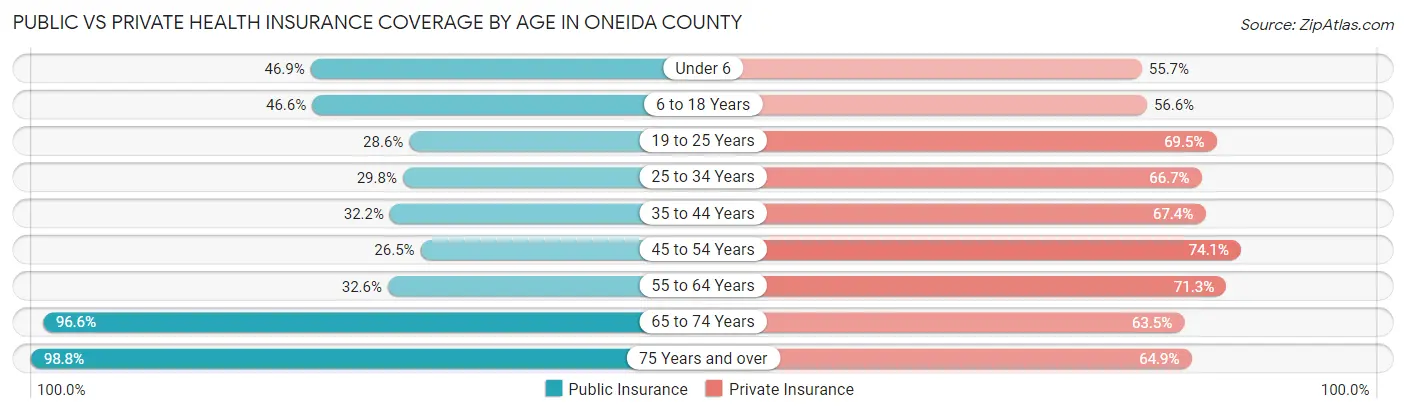
| Age Bracket | Public Insurance | Private Insurance |
| Under 6 | 7,312 (46.9%) | 8,679 (55.7%) |
| 6 to 18 Years | 17,111 (46.6%) | 20,780 (56.6%) |
| 19 to 25 Years | 5,918 (28.6%) | 14,372 (69.5%) |
| 25 to 34 Years | 7,274 (29.8%) | 16,289 (66.7%) |
| 35 to 44 Years | 8,278 (32.2%) | 17,322 (67.4%) |
| 45 to 54 Years | 7,279 (26.5%) | 20,321 (74.1%) |
| 55 to 64 Years | 10,381 (32.6%) | 22,724 (71.3%) |
| 65 to 74 Years | 23,683 (96.6%) | 15,571 (63.5%) |
| 75 Years and over | 17,587 (98.8%) | 11,543 (64.9%) |
| Total | 104,823 (46.7%) | 147,601 (65.7%) |
Disability Status by Sex by Age in Oneida County
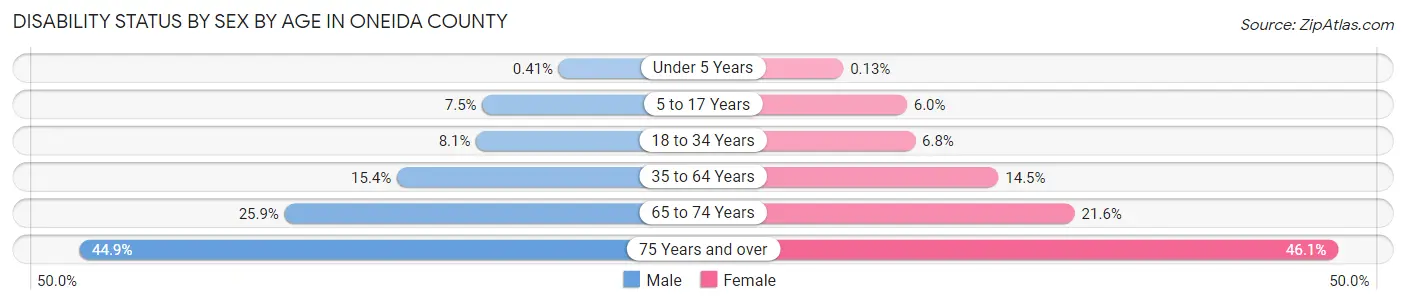
| Age Bracket | Male | Female |
| Under 5 Years | 27 (0.4%) | 8 (0.1%) |
| 5 to 17 Years | 1,396 (7.5%) | 1,072 (6.0%) |
| 18 to 34 Years | 1,981 (8.1%) | 1,614 (6.8%) |
| 35 to 64 Years | 6,498 (15.4%) | 6,231 (14.5%) |
| 65 to 74 Years | 3,021 (25.9%) | 2,772 (21.6%) |
| 75 Years and over | 3,243 (44.9%) | 4,872 (46.1%) |
Disability Class by Sex by Age in Oneida County
Disability Class: Hearing Difficulty
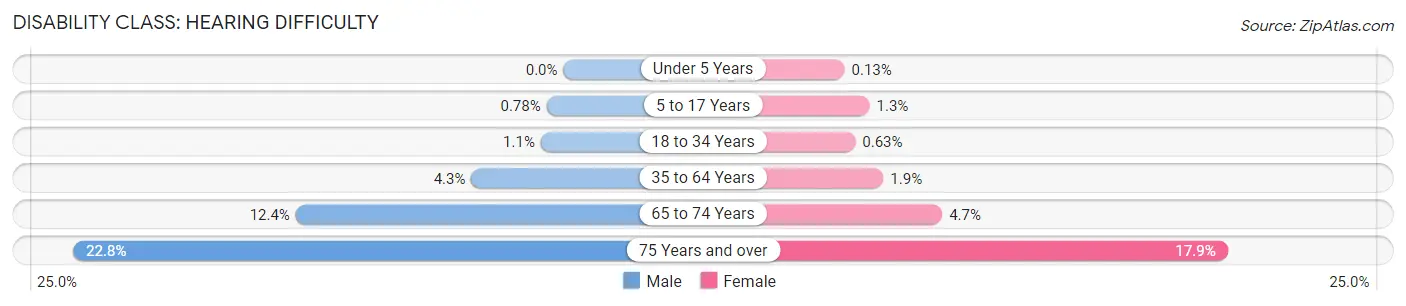
| Age Bracket | Male | Female |
| Under 5 Years | 0 (0.0%) | 8 (0.1%) |
| 5 to 17 Years | 145 (0.8%) | 229 (1.3%) |
| 18 to 34 Years | 258 (1.1%) | 150 (0.6%) |
| 35 to 64 Years | 1,800 (4.3%) | 828 (1.9%) |
| 65 to 74 Years | 1,451 (12.4%) | 598 (4.7%) |
| 75 Years and over | 1,642 (22.8%) | 1,893 (17.9%) |
Disability Class: Vision Difficulty
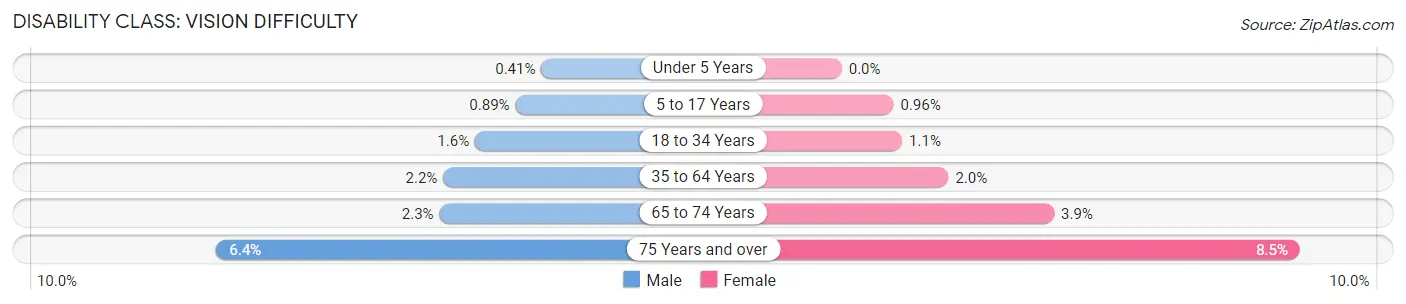
| Age Bracket | Male | Female |
| Under 5 Years | 27 (0.4%) | 0 (0.0%) |
| 5 to 17 Years | 166 (0.9%) | 171 (1.0%) |
| 18 to 34 Years | 401 (1.6%) | 267 (1.1%) |
| 35 to 64 Years | 937 (2.2%) | 849 (2.0%) |
| 65 to 74 Years | 269 (2.3%) | 506 (3.9%) |
| 75 Years and over | 465 (6.4%) | 899 (8.5%) |
Disability Class: Cognitive Difficulty
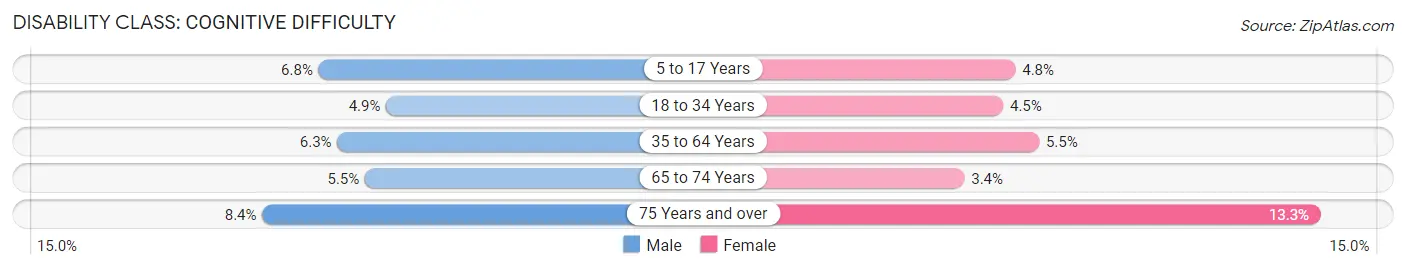
| Age Bracket | Male | Female |
| 5 to 17 Years | 1,266 (6.8%) | 858 (4.8%) |
| 18 to 34 Years | 1,208 (4.9%) | 1,066 (4.5%) |
| 35 to 64 Years | 2,648 (6.3%) | 2,356 (5.5%) |
| 65 to 74 Years | 645 (5.5%) | 437 (3.4%) |
| 75 Years and over | 605 (8.4%) | 1,411 (13.3%) |
Disability Class: Ambulatory Difficulty
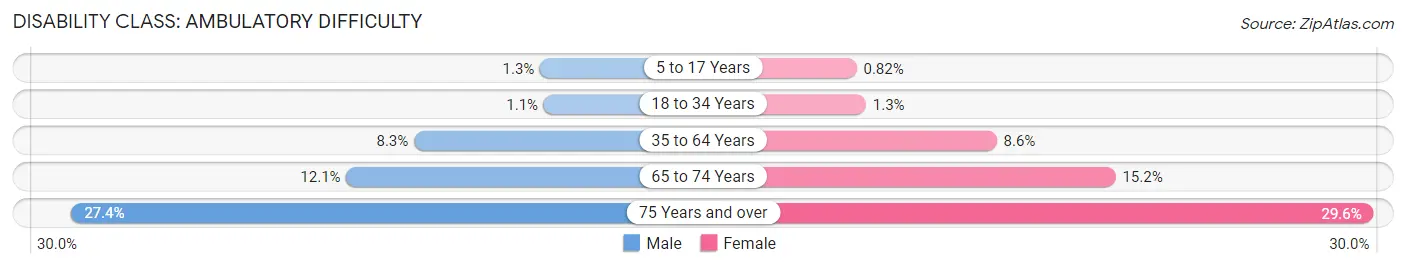
| Age Bracket | Male | Female |
| 5 to 17 Years | 240 (1.3%) | 146 (0.8%) |
| 18 to 34 Years | 264 (1.1%) | 319 (1.3%) |
| 35 to 64 Years | 3,500 (8.3%) | 3,695 (8.6%) |
| 65 to 74 Years | 1,411 (12.1%) | 1,955 (15.2%) |
| 75 Years and over | 1,977 (27.4%) | 3,132 (29.6%) |
Disability Class: Self-Care Difficulty
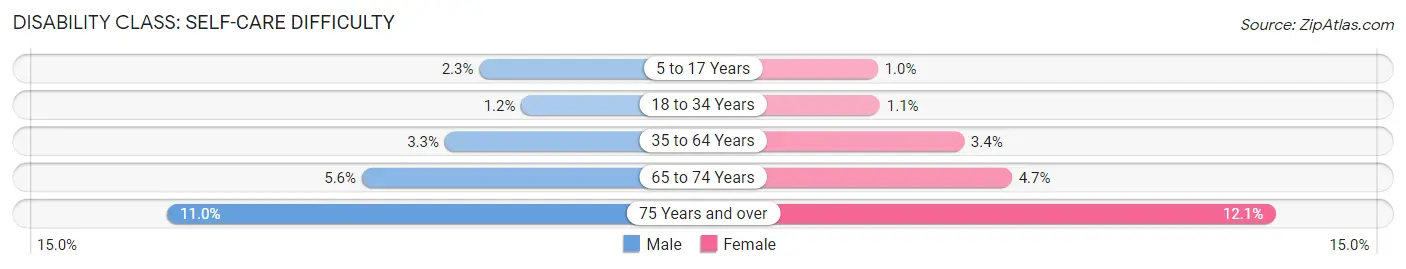
| Age Bracket | Male | Female |
| 5 to 17 Years | 435 (2.3%) | 177 (1.0%) |
| 18 to 34 Years | 286 (1.2%) | 251 (1.1%) |
| 35 to 64 Years | 1,391 (3.3%) | 1,459 (3.4%) |
| 65 to 74 Years | 656 (5.6%) | 607 (4.7%) |
| 75 Years and over | 796 (11.0%) | 1,276 (12.1%) |
Technology Access in Oneida County
Computing Device Access in Oneida County
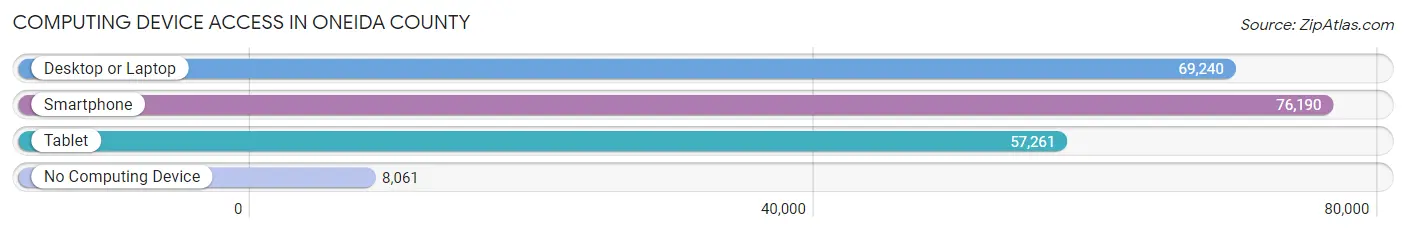
| Device Type | # Households | % Households |
| Desktop or Laptop | 69,240 | 74.5% |
| Smartphone | 76,190 | 82.0% |
| Tablet | 57,261 | 61.6% |
| No Computing Device | 8,061 | 8.7% |
| Total | 92,944 | 100.0% |
Internet Access in Oneida County
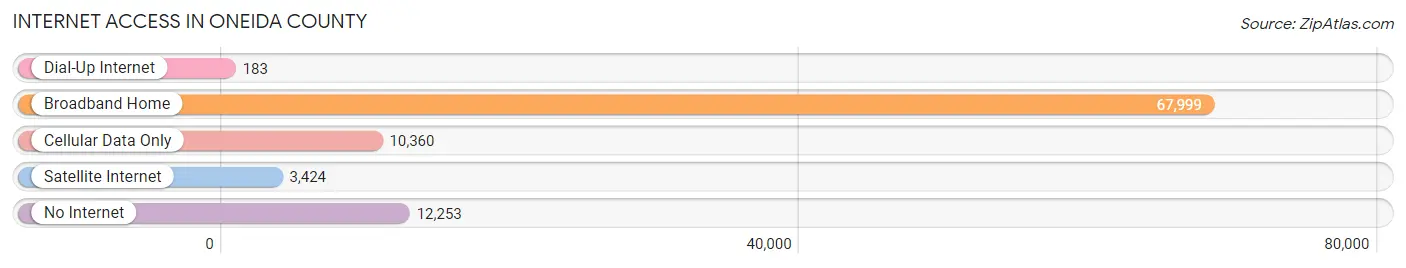
| Internet Type | # Households | % Households |
| Dial-Up Internet | 183 | 0.2% |
| Broadband Home | 67,999 | 73.2% |
| Cellular Data Only | 10,360 | 11.2% |
| Satellite Internet | 3,424 | 3.7% |
| No Internet | 12,253 | 13.2% |
| Total | 92,944 | 100.0% |
Oneida County Summary
Oneida County is located in the central part of New York State, in the Mohawk Valley region. It is bordered by Herkimer County to the north, Madison County to the east, Onondaga County to the south, and Oneida and Oswego Counties to the west. The county seat is Utica, and the largest city is Rome.
Geography
Oneida County covers an area of 1,258 square miles, making it the fourth largest county in New York State. The terrain is mostly flat, with some rolling hills in the northern and western parts of the county. The highest point is in the town of Ava, at 1,945 feet above sea level. The county is drained by the Mohawk River, which flows through the center of the county, and by the Black River, which forms the western border.
The county is home to several state parks, including Verona Beach State Park, Delta Lake State Park, and Hinckley Lake State Park. The Adirondack Mountains are located to the north, and the Finger Lakes region is to the south.
Demographics
As of the 2010 census, Oneida County had a population of 234,878. The population density was 186.3 people per square mile. The racial makeup of the county was 90.2% White, 4.7% African American, 0.7% Native American, 1.7% Asian, 0.1% Pacific Islander, 1.2% from other races, and 1.4% from two or more races. Hispanic or Latino of any race were 4.2% of the population.
The median income for a household in the county was $45,945, and the median income for a family was $54,817. The per capita income for the county was $22,945. About 8.7% of families and 11.2% of the population were below the poverty line, including 15.2% of those under age 18 and 7.7% of those age 65 or over.
Economy
Oneida County has a diverse economy, with a mix of manufacturing, retail, and service industries. The largest employers in the county are the Rome City School District, Rome Memorial Hospital, and the Griffiss Business and Technology Park.
Manufacturing is a major part of the economy, with companies such as Anheuser-Busch, Nestle, and Kraft Foods having plants in the county. Other major employers include the Utica National Insurance Group, the Utica Boiler and Foundry Company, and the Utica College of Syracuse University.
Retail is also an important part of the economy, with the Sangertown Square Mall in New Hartford being the largest shopping center in the county. Other major retailers include Walmart, Target, and Lowe's.
The county is also home to several colleges and universities, including Utica College, Hamilton College, and SUNY Polytechnic Institute.
History
Oneida County was formed in 1798 from parts of Herkimer and Montgomery Counties. It was named after the Oneida tribe, which had inhabited the area for centuries.
The county was an important center of the Industrial Revolution, with the construction of the Erie Canal in 1825 and the opening of the Rome and Clinton Railroad in 1836. The county was also home to several major Civil War battles, including the Battle of Oriskany in 1777 and the Battle of Rome in 1864.
In the late 19th and early 20th centuries, the county was home to several major industries, including the Utica Steam Boiler Works, the Utica Cutlery Company, and the Utica Knitting Mills. The county was also home to several major breweries, including the F.X. Matt Brewing Company and the Utica Club Brewing Company.
Today, Oneida County is a major center of industry and commerce, with a diverse economy and a strong educational system. It is also home to several major tourist attractions, including the Adirondack Scenic Railroad, the Utica Zoo, and the Utica Comets hockey team.
Common Questions
What is Per Capita Income in Oneida County?
Per Capita income in Oneida County is $35,284.
What is the Median Family Income in Oneida County?
Median Family Income in Oneida County is $84,410.
What is the Median Household income in Oneida County?
Median Household Income in Oneida County is $66,402.
What is Income or Wage Gap in Oneida County?
Income or Wage Gap in Oneida County is 23.8%.
Women in Oneida County earn 76.2 cents for every dollar earned by a man.
What is Family Income Deficit in Oneida County?
Family Income Deficit in Oneida County is $11,913.
Families that are below poverty line in Oneida County earn $11,913 less on average than the poverty threshold level.
What is Inequality or Gini Index in Oneida County?
Inequality or Gini Index in Oneida County is 0.45.
What is the Total Population of Oneida County?
Total Population of Oneida County is 231,055.
What is the Total Male Population of Oneida County?
Total Male Population of Oneida County is 115,677.
What is the Total Female Population of Oneida County?
Total Female Population of Oneida County is 115,378.
What is the Ratio of Males per 100 Females in Oneida County?
There are 100.26 Males per 100 Females in Oneida County.
What is the Ratio of Females per 100 Males in Oneida County?
There are 99.74 Females per 100 Males in Oneida County.
What is the Median Population Age in Oneida County?
Median Population Age in Oneida County is 40.9 Years.
What is the Average Family Size in Oneida County
Average Family Size in Oneida County is 3.0 People.
What is the Average Household Size in Oneida County
Average Household Size in Oneida County is 2.4 People.
How Large is the Labor Force in Oneida County?
There are 108,160 People in the Labor Forcein in Oneida County.
What is the Percentage of People in the Labor Force in Oneida County?
57.7% of People are in the Labor Force in Oneida County.
What is the Unemployment Rate in Oneida County?
Unemployment Rate in Oneida County is 4.4%.