Zip Codes with the Highest Percentage of Households with Income Above $100,000 in Buffalo, NY
RELATED REPORTS & OPTIONS
Household Income | $100k+
Buffalo
Compare Zip Codes
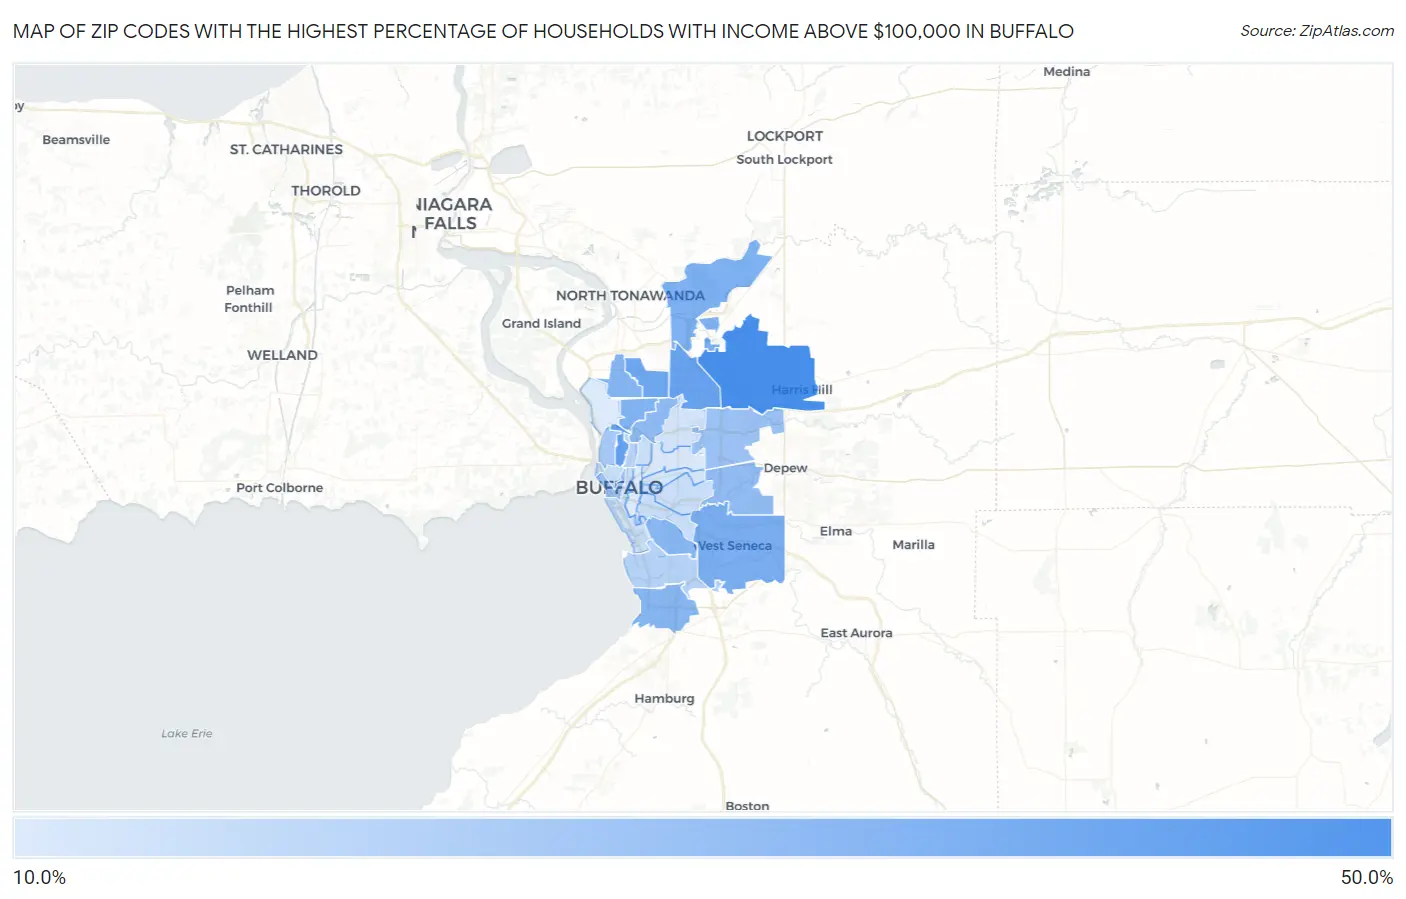
Map of Zip Codes with the Highest Percentage of Households with Income Above $100,000 in Buffalo
10.9%
48.2%
Zip Codes with the Highest Percentage of Households with Income Above $100,000 in Buffalo, NY
| Zip Code | Households with Income > $100k | vs State | vs National | |
| 1. | 14221 | 48.2% | 41.7%(+6.50)#489 | 37.3%(+10.9)#5,414 |
| 2. | 14222 | 40.4% | 41.7%(-1.30)#710 | 37.3%(+3.10)#8,708 |
| 3. | 14226 | 39.4% | 41.7%(-2.30)#743 | 37.3%(+2.10)#9,223 |
| 4. | 14223 | 37.2% | 41.7%(-4.50)#814 | 37.3%(-0.100)#10,418 |
| 5. | 14224 | 34.6% | 41.7%(-7.10)#902 | 37.3%(-2.70)#12,008 |
| 6. | 14228 | 32.9% | 41.7%(-8.80)#986 | 37.3%(-4.40)#13,187 |
| 7. | 14216 | 32.3% | 41.7%(-9.40)#1,017 | 37.3%(-5.00)#13,619 |
| 8. | 14217 | 31.1% | 41.7%(-10.6)#1,066 | 37.3%(-6.20)#14,560 |
| 9. | 14220 | 30.9% | 41.7%(-10.8)#1,078 | 37.3%(-6.40)#14,720 |
| 10. | 14219 | 30.9% | 41.7%(-10.8)#1,081 | 37.3%(-6.40)#14,736 |
| 11. | 14214 | 29.1% | 41.7%(-12.6)#1,147 | 37.3%(-8.20)#16,158 |
| 12. | 14227 | 28.7% | 41.7%(-13.0)#1,161 | 37.3%(-8.60)#16,508 |
| 13. | 14225 | 25.8% | 41.7%(-15.9)#1,300 | 37.3%(-11.5)#19,044 |
| 14. | 14202 | 25.0% | 41.7%(-16.7)#1,342 | 37.3%(-12.3)#19,780 |
| 15. | 14213 | 23.5% | 41.7%(-18.2)#1,403 | 37.3%(-13.8)#21,123 |
| 16. | 14218 | 19.8% | 41.7%(-21.9)#1,514 | 37.3%(-17.5)#24,194 |
| 17. | 14209 | 19.3% | 41.7%(-22.4)#1,530 | 37.3%(-18.0)#24,601 |
| 18. | 14206 | 15.6% | 41.7%(-26.1)#1,602 | 37.3%(-21.7)#27,175 |
| 19. | 14201 | 15.6% | 41.7%(-26.1)#1,603 | 37.3%(-21.7)#27,179 |
| 20. | 14210 | 15.4% | 41.7%(-26.3)#1,607 | 37.3%(-21.9)#27,305 |
| 21. | 14208 | 15.4% | 41.7%(-26.3)#1,608 | 37.3%(-21.9)#27,308 |
| 22. | 14203 | 14.3% | 41.7%(-27.4)#1,616 | 37.3%(-23.0)#27,950 |
| 23. | 14215 | 13.4% | 41.7%(-28.3)#1,632 | 37.3%(-23.9)#28,392 |
| 24. | 14212 | 12.7% | 41.7%(-29.0)#1,642 | 37.3%(-24.6)#28,723 |
| 25. | 14211 | 12.1% | 41.7%(-29.6)#1,654 | 37.3%(-25.2)#28,978 |
| 26. | 14204 | 11.1% | 41.7%(-30.6)#1,666 | 37.3%(-26.2)#29,400 |
| 27. | 14207 | 10.9% | 41.7%(-30.8)#1,671 | 37.3%(-26.4)#29,487 |
1
Common Questions
What are the Top 10 Zip Codes with the Highest Percentage of Households with Income Above $100,000 in Buffalo, NY?
Top 10 Zip Codes with the Highest Percentage of Households with Income Above $100,000 in Buffalo, NY are:
What zip code has the Highest Percentage of Households with Income Above $100,000 in Buffalo, NY?
14221 has the Highest Percentage of Households with Income Above $100,000 in Buffalo, NY with 48.2%.
What is the Percentage of Households with Income Above $100,000 in Buffalo, NY?
Percentage of Households with Income Above $100,000 in Buffalo is 20.0%.
What is the Percentage of Households with Income Above $100,000 in New York?
Percentage of Households with Income Above $100,000 in New York is 41.7%.
What is the Percentage of Households with Income Above $100,000 in the United States?
Percentage of Households with Income Above $100,000 in the United States is 37.3%.