Zip Codes with the Highest Percentage of Private Company Employees in Buffalo, NY

RELATED REPORTS & OPTIONS

Private Company Employees
Population
Families and Households
Female Fertility
Female Fertility (Unmarried)
Race (Community Size)
Race (Percentage)
Ancestry (Community Size)
AfghanAfricanAlbanianAlsatianAmericanArabArgentineanArmenianAustralianAustrianBahamianBarbadianBelgianBelizeanBhutaneseBlackfeetBolivianBrazilianBritishBritish West IndianBulgarianBurmeseCajunCambodianCanadianCarpatho RusynCelticCentral AmericanCentral American IndianCherokeeChileanChippewaColombianCosta RicanCreekCroatianCubanCzechCzechoslovakianDanishDominicanDutchDutch West IndianEastern EuropeanEcuadorianEgyptianEnglishEstonianEthiopianEuropeanFilipinoFinnishFrenchFrench American IndianFrench CanadianGermanGerman RussianGhanaianGreekGuamanian / ChamorroGuatemalanGuyaneseHaitianHonduranHungarianIcelanderIndian (Asian)IndonesianIranianIraqiIrishIroquoisIsraeliItalianJamaicanJapaneseJordanianKenyanKoreanLaotianLatvianLebaneseLithuanianMacedonianMalaysianMalteseMexicanMexican American IndianMongolianMoroccanNative HawaiianNavajoNicaraguanNigerianNorthern EuropeanNorwegianOkinawanPakistaniPalestinianPanamanianPennsylvania GermanPeruvianPolishPortuguesePuerto RicanRomanianRussianSalvadoranSamoanScandinavianScotch-IrishScottishSerbianSiouxSlavicSlovakSloveneSomaliSouth AfricanSouth AmericanSouth American IndianSpaniardSpanishSri LankanSubsaharan AfricanSudaneseSwedishSwissSyrianTaiwaneseThaiTrinidadian and TobagonianTurkishUkrainianVenezuelanVietnameseWelshWest IndianYugoslavian
Ancestry (Percentage)
AfghanAfricanAlbanianAlsatianAmericanArabArgentineanArmenianAustralianAustrianBahamianBarbadianBelgianBelizeanBhutaneseBlackfeetBolivianBrazilianBritishBritish West IndianBulgarianBurmeseCajunCambodianCanadianCarpatho RusynCelticCentral AmericanCentral American IndianCherokeeChileanChippewaColombianCosta RicanCreekCroatianCubanCzechCzechoslovakianDanishDominicanDutchDutch West IndianEastern EuropeanEcuadorianEgyptianEnglishEstonianEthiopianEuropeanFilipinoFinnishFrenchFrench American IndianFrench CanadianGermanGerman RussianGhanaianGreekGuamanian / ChamorroGuatemalanGuyaneseHaitianHonduranHungarianIcelanderIndian (Asian)IndonesianIranianIraqiIrishIroquoisIsraeliItalianJamaicanJapaneseJordanianKenyanKoreanLaotianLatvianLebaneseLithuanianMacedonianMalaysianMalteseMexicanMexican American IndianMongolianMoroccanNative HawaiianNavajoNicaraguanNigerianNorthern EuropeanNorwegianOkinawanPakistaniPalestinianPanamanianPennsylvania GermanPeruvianPolishPortuguesePuerto RicanRomanianRussianSalvadoranSamoanScandinavianScotch-IrishScottishSerbianSiouxSlavicSlovakSloveneSomaliSouth AfricanSouth AmericanSouth American IndianSpaniardSpanishSri LankanSubsaharan AfricanSudaneseSwedishSwissSyrianTaiwaneseThaiTrinidadian and TobagonianTurkishUkrainianVenezuelanVietnameseWelshWest IndianYugoslavian
Immigrant Origin (Total)
AfghanistanAfricaAlbaniaArgentinaAsiaAustraliaAustriaBangladeshBarbadosBelarusBosnia and HerzegovinaBrazilBulgariaBurma / MyanmarCameroonCanadaCaribbeanCentral AmericaChinaColombiaCongoCosta RicaCroatiaCubaCzechoslovakiaDominican RepublicEastern AfricaEastern AsiaEastern EuropeEcuadorEgyptEl SalvadorEnglandEritreaEthiopiaEuropeFranceGermanyGhanaGreeceGuatemalaGuyanaHaitiHondurasHong KongHungaryIndiaIndonesiaIranIraqIrelandIsraelItalyJamaicaJapanJordanKazakhstanKenyaKoreaKuwaitLaosLatin AmericaLatviaLebanonLiberiaLithuaniaMalaysiaMexicoMiddle AfricaMoldovaMoroccoNepalNetherlandsNigeriaNorth MacedoniaNorthern AfricaNorthern EuropeNorwayOceaniaPakistanPanamaPeruPhilippinesPolandRomaniaRussiaSaudi ArabiaScotlandSerbiaSierra LeoneSingaporeSomaliaSouth AfricaSouth AmericaSouth Central AsiaSouth Eastern AsiaSouthern EuropeSpainSri LankaSt. Vincent and the GrenadinesSudanSwedenSwitzerlandSyriaTaiwanThailandTrinidad and TobagoTurkeyUgandaUkraineUzbekistanVenezuelaVietnamWest IndiesWestern AfricaWestern AsiaWestern EuropeYemenZaire
Immigrant Origin (Percentage)
AfghanistanAfricaAlbaniaArgentinaAsiaAustraliaAustriaBangladeshBarbadosBelarusBosnia and HerzegovinaBrazilBulgariaBurma / MyanmarCameroonCanadaCaribbeanCentral AmericaChinaColombiaCongoCosta RicaCroatiaCubaCzechoslovakiaDominican RepublicEastern AfricaEastern AsiaEastern EuropeEcuadorEgyptEl SalvadorEnglandEritreaEthiopiaEuropeFranceGermanyGhanaGreeceGuatemalaGuyanaHaitiHondurasHong KongHungaryIndiaIndonesiaIranIraqIrelandIsraelItalyJamaicaJapanJordanKazakhstanKenyaKoreaKuwaitLaosLatin AmericaLatviaLebanonLiberiaLithuaniaMalaysiaMexicoMiddle AfricaMoldovaMoroccoNepalNetherlandsNigeriaNorth MacedoniaNorthern AfricaNorthern EuropeNorwayOceaniaPakistanPanamaPeruPhilippinesPolandRomaniaRussiaSaudi ArabiaScotlandSerbiaSierra LeoneSingaporeSomaliaSouth AfricaSouth AmericaSouth Central AsiaSouth Eastern AsiaSouthern EuropeSpainSri LankaSt. Vincent and the GrenadinesSudanSwedenSwitzerlandSyriaTaiwanThailandTrinidad and TobagoTurkeyUgandaUkraineUzbekistanVenezuelaVietnamWest IndiesWestern AfricaWestern AsiaWestern EuropeYemenZaire
Income
Income (Families)
Income (Households)
Poverty
Poverty (Families)
Unemployment
Employment Occupations
Employment Industries
Employer Class
Commute Time
Commute Means
School Enrollment
Education by Degree Field
Occupancy
Finances
Physical Characteristics
Buffalo
Compare Zip Codes
Comparison Subject

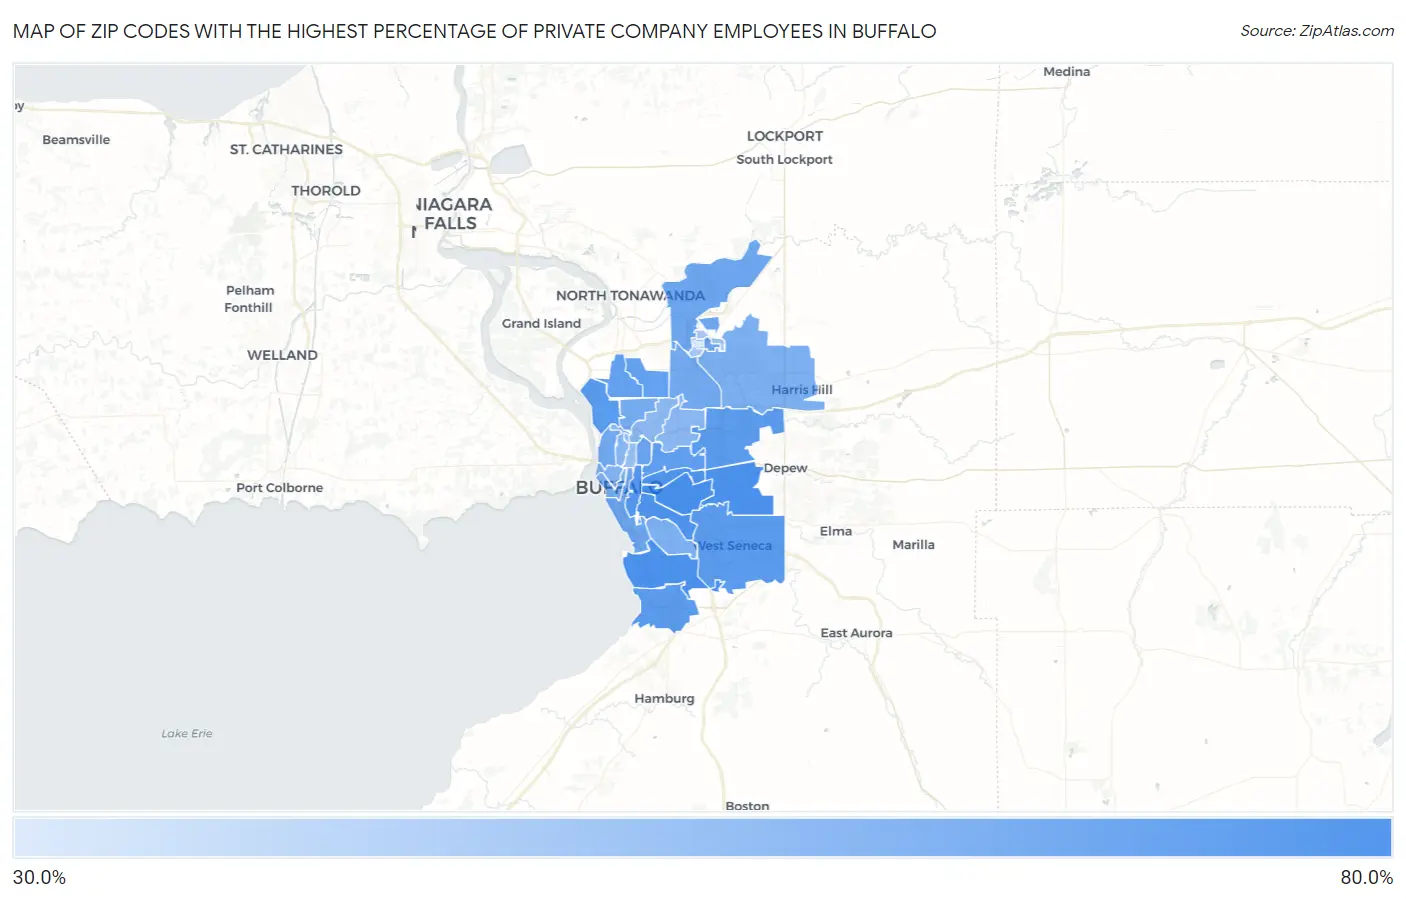
Map of Zip Codes with the Highest Percentage of Private Company Employees in Buffalo

0.0%
80.0%
Zip Codes with the Highest Percentage of Private Company Employees in Buffalo Map

Zip Codes with the Highest Percentage of Private Company Employees in Buffalo, NY

Zip Code % Private Company Employees vs State vs National
1.1420673.6%62.8%(+10.8)#12866.9%(+6.74)#6,116
2.1422772.7%62.8%(+9.91)#14466.9%(+5.83)#7,054
3.1421872.2%62.8%(+9.35)#15466.9%(+5.27)#7,642
4.1421071.9%62.8%(+9.05)#15866.9%(+4.97)#7,974
5.1421271.6%62.8%(+8.77)#16566.9%(+4.69)#8,321
6.1420470.0%62.8%(+7.17)#21266.9%(+3.09)#10,395
7.1420769.4%62.8%(+6.58)#23366.9%(+2.50)#11,194
8.1422568.6%62.8%(+5.81)#26166.9%(+1.73)#12,216
9.1421968.5%62.8%(+5.68)#26666.9%(+1.60)#12,365
10.1422468.2%62.8%(+5.41)#28166.9%(+1.33)#12,763
11.1421167.0%62.8%(+4.24)#34766.9%(+0.158)#14,302
12.1421766.8%62.8%(+3.96)#36266.9%(-0.123)#14,661
13.1422366.4%62.8%(+3.57)#38966.9%(-0.506)#15,198
14.1420865.6%62.8%(+2.79)#44266.9%(-1.29)#16,235
15.1422863.9%62.8%(+1.14)#56466.9%(-2.94)#18,260
16.1420363.5%62.8%(+0.712)#59866.9%(-3.37)#18,752
17.1422662.6%62.8%(-0.232)#66966.9%(-4.31)#19,780
18.1421362.4%62.8%(-0.440)#68866.9%(-4.52)#20,024
19.1421662.1%62.8%(-0.745)#71266.9%(-4.82)#20,327
20.1422060.6%62.8%(-2.23)#83466.9%(-6.31)#21,865
21.1422160.4%62.8%(-2.38)#84666.9%(-6.46)#22,016
22.1420259.8%62.8%(-3.02)#89766.9%(-7.10)#22,618
23.1420158.8%62.8%(-4.03)#97166.9%(-8.11)#23,460
24.1422257.3%62.8%(-5.49)#1,07266.9%(-9.57)#24,556
25.1421557.0%62.8%(-5.81)#1,09266.9%(-9.89)#24,788
26.1421456.3%62.8%(-6.51)#1,14366.9%(-10.6)#25,288
27.1420953.5%62.8%(-9.30)#1,27666.9%(-13.4)#26,919
28.1426150.6%62.8%(-12.2)#1,41666.9%(-16.3)#28,215
29.1426038.6%62.8%(-24.2)#1,62866.9%(-28.3)#30,877

Common Questions

What are the Top 10 Zip Codes with the Highest Percentage of Private Company Employees in Buffalo, NY?
Top 10 Zip Codes with the Highest Percentage of Private Company Employees in Buffalo, NY are:
#1
73.6%
#2
72.7%
#3
72.2%
#4
71.9%
#5
71.6%
#6
70.0%
#7
69.4%
#8
68.6%
#9
68.5%
#10
68.2%
What zip code has the Highest Percentage of Private Company Employees in Buffalo, NY?
14206 has the Highest Percentage of Private Company Employees in Buffalo, NY with 73.6%.
What is the Percentage of Private Company Employees in Buffalo, NY?
Percentage of Private Company Employees in Buffalo is 62.3%.
What is the Percentage of Private Company Employees in New York?
Percentage of Private Company Employees in New York is 62.8%.
What is the Percentage of Private Company Employees in the United States?
Percentage of Private Company Employees in the United States is 66.9%.