Brownville, NY Map & Demographics
Brownville Map
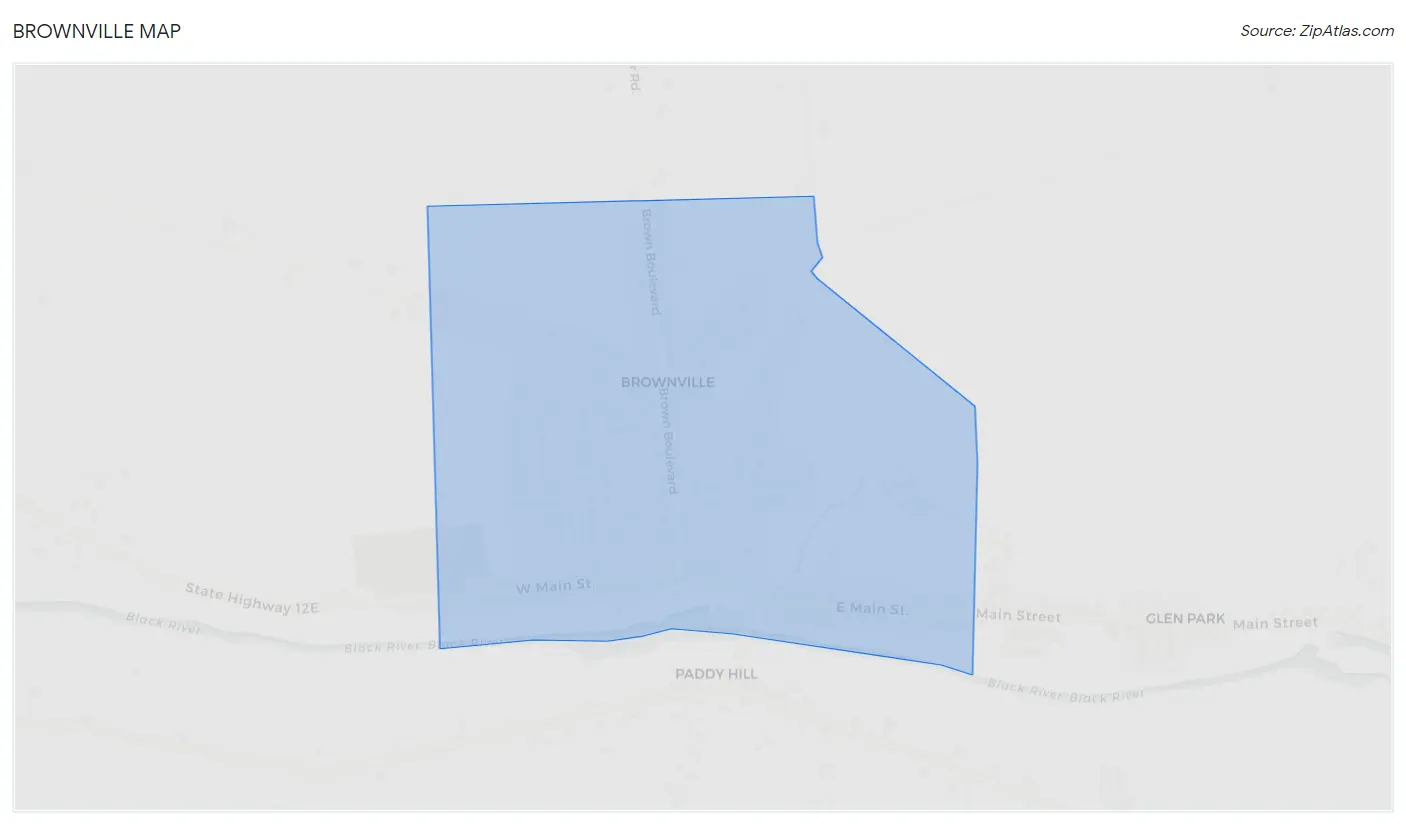
Brownville Overview
$45,680
PER CAPITA INCOME
$105,972
AVG FAMILY INCOME
$97,794
AVG HOUSEHOLD INCOME
33.3%
WAGE / INCOME GAP [ % ]
66.7¢/ $1
WAGE / INCOME GAP [ $ ]
0.31
INEQUALITY / GINI INDEX
586
TOTAL POPULATION
290
MALE POPULATION
296
FEMALE POPULATION
97.97
MALES / 100 FEMALES
102.07
FEMALES / 100 MALES
56.5
MEDIAN AGE
2.3
AVG FAMILY SIZE
2.1
AVG HOUSEHOLD SIZE
359
LABOR FORCE [ PEOPLE ]
66.9%
PERCENT IN LABOR FORCE
Brownville Zip Codes
Brownville Area Codes
Income in Brownville
Income Overview in Brownville
Per Capita Income in Brownville is $45,680, while median incomes of families and households are $105,972 and $97,794 respectively.
| Characteristic | Number | Measure |
| Per Capita Income | 586 | $45,680 |
| Median Family Income | 223 | $105,972 |
| Mean Family Income | 223 | $105,146 |
| Median Household Income | 274 | $97,794 |
| Mean Household Income | 274 | $94,748 |
| Income Deficit | 223 | $0 |
| Wage / Income Gap (%) | 586 | 33.29% |
| Wage / Income Gap ($) | 586 | 66.71¢ per $1 |
| Gini / Inequality Index | 586 | 0.31 |
Earnings by Sex in Brownville
Average Earnings in Brownville are $59,423, $61,212 for men and $40,833 for women, a difference of 33.3%.
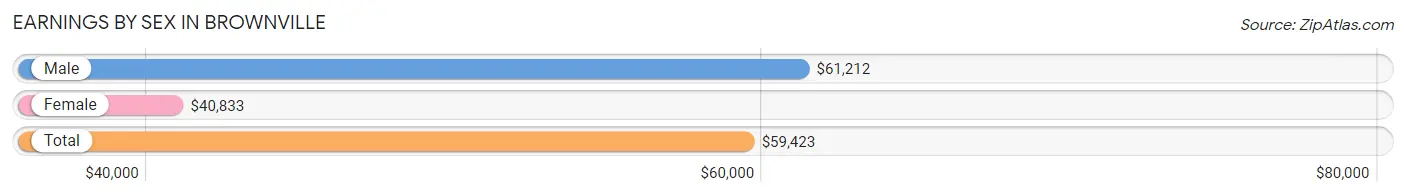
| Sex | Number | Average Earnings |
| Male | 206 (56.3%) | $61,212 |
| Female | 160 (43.7%) | $40,833 |
| Total | 366 (100.0%) | $59,423 |
Earnings by Sex by Income Bracket in Brownville
The most common earnings brackets in Brownville are $55,000 to $64,999 for men (54 | 26.2%) and $55,000 to $64,999 for women (21 | 13.1%).
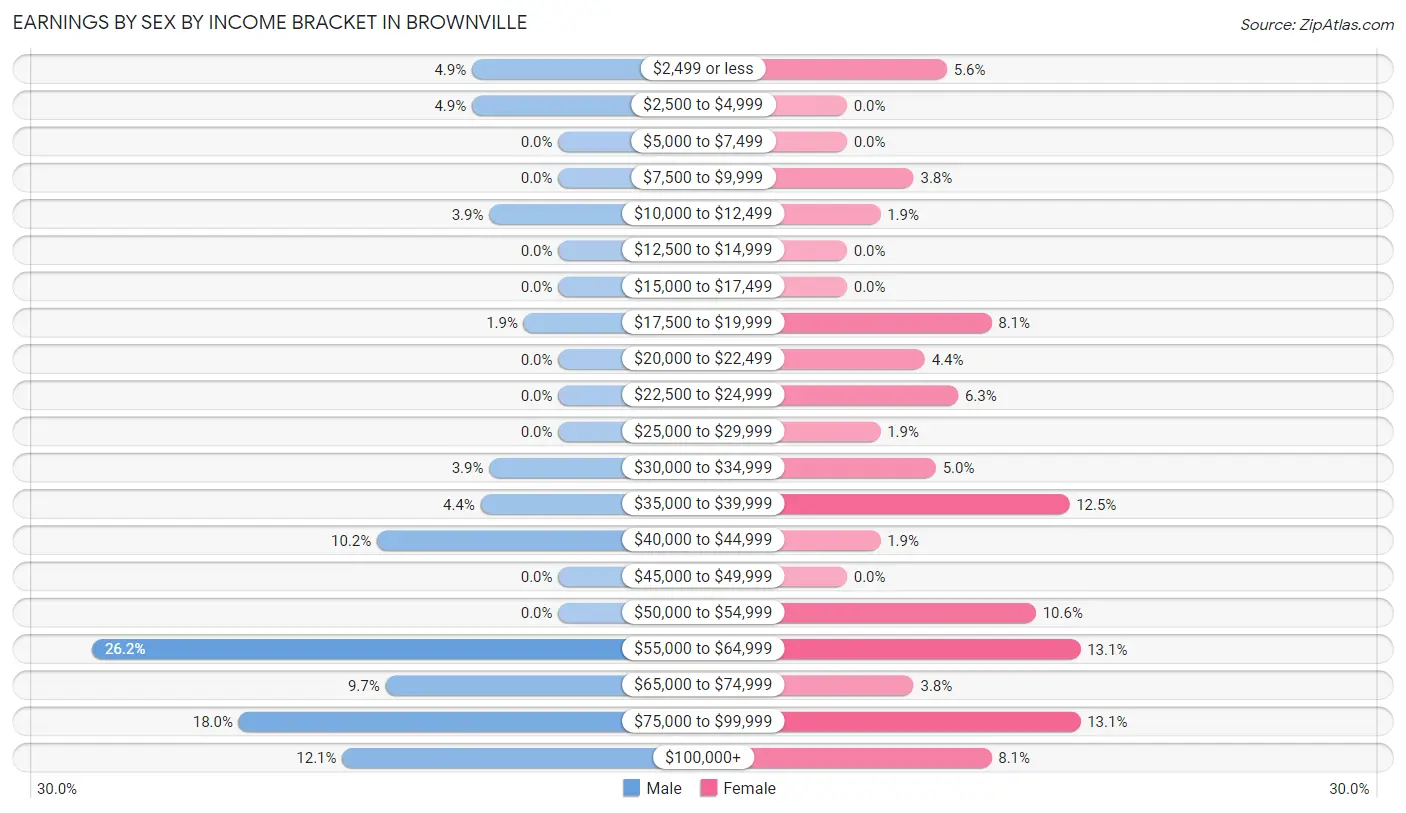
| Income | Male | Female |
| $2,499 or less | 10 (4.9%) | 9 (5.6%) |
| $2,500 to $4,999 | 10 (4.9%) | 0 (0.0%) |
| $5,000 to $7,499 | 0 (0.0%) | 0 (0.0%) |
| $7,500 to $9,999 | 0 (0.0%) | 6 (3.7%) |
| $10,000 to $12,499 | 8 (3.9%) | 3 (1.9%) |
| $12,500 to $14,999 | 0 (0.0%) | 0 (0.0%) |
| $15,000 to $17,499 | 0 (0.0%) | 0 (0.0%) |
| $17,500 to $19,999 | 4 (1.9%) | 13 (8.1%) |
| $20,000 to $22,499 | 0 (0.0%) | 7 (4.4%) |
| $22,500 to $24,999 | 0 (0.0%) | 10 (6.2%) |
| $25,000 to $29,999 | 0 (0.0%) | 3 (1.9%) |
| $30,000 to $34,999 | 8 (3.9%) | 8 (5.0%) |
| $35,000 to $39,999 | 9 (4.4%) | 20 (12.5%) |
| $40,000 to $44,999 | 21 (10.2%) | 3 (1.9%) |
| $45,000 to $49,999 | 0 (0.0%) | 0 (0.0%) |
| $50,000 to $54,999 | 0 (0.0%) | 17 (10.6%) |
| $55,000 to $64,999 | 54 (26.2%) | 21 (13.1%) |
| $65,000 to $74,999 | 20 (9.7%) | 6 (3.7%) |
| $75,000 to $99,999 | 37 (18.0%) | 21 (13.1%) |
| $100,000+ | 25 (12.1%) | 13 (8.1%) |
| Total | 206 (100.0%) | 160 (100.0%) |
Earnings by Sex by Educational Attainment in Brownville
Average earnings in Brownville are $61,212 for men and $40,833 for women, a difference of 33.3%. Men with an educational attainment of bachelor's degree enjoy the highest average annual earnings of $95,455, while those with college or associate's degree education earn the least with $61,250. Women with an educational attainment of graduate degree earn the most with the average annual earnings of $76,458, while those with college or associate's degree education have the smallest earnings of $36,985.
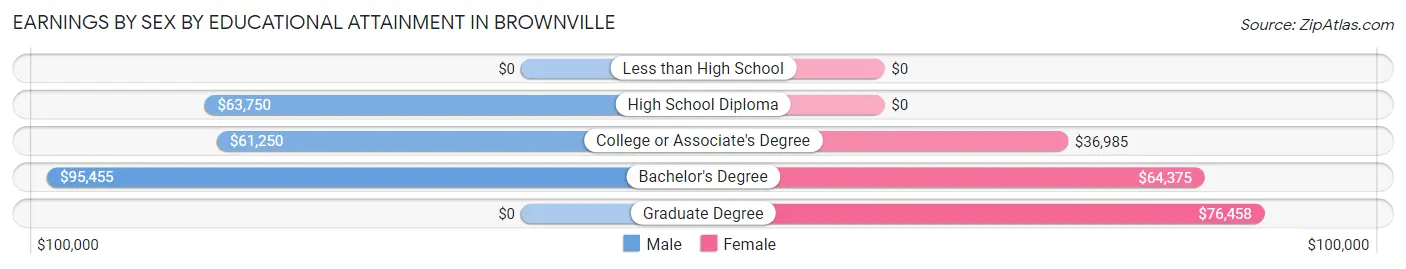
| Educational Attainment | Male Income | Female Income |
| Less than High School | - | - |
| High School Diploma | $63,750 | $0 |
| College or Associate's Degree | $61,250 | $36,985 |
| Bachelor's Degree | $95,455 | $64,375 |
| Graduate Degree | - | - |
| Total | $61,212 | $40,833 |
Family Income in Brownville
Family Income Brackets in Brownville
According to the Brownville family income data, there are 65 families falling into the $100,000 to $149,999 income range, which is the most common income bracket and makes up 29.1% of all families.
| Income Bracket | # Families | % Families |
| Less than $10,000 | 0 | 0.0% |
| $10,000 to $14,999 | 0 | 0.0% |
| $15,000 to $24,999 | 0 | 0.0% |
| $25,000 to $34,999 | 11 | 4.9% |
| $35,000 to $49,999 | 23 | 10.3% |
| $50,000 to $74,999 | 54 | 24.2% |
| $75,000 to $99,999 | 17 | 7.6% |
| $100,000 to $149,999 | 65 | 29.1% |
| $150,000 to $199,999 | 44 | 19.7% |
| $200,000+ | 9 | 4.0% |
Family Income by Famaliy Size in Brownville
2-person families (174 | 78.0%) account for the highest median family income in Brownville with $98,654 per family, while 2-person families (174 | 78.0%) have the highest median income of $49,327 per family member.
| Income Bracket | # Families | Median Income |
| 2-Person Families | 174 (78.0%) | $98,654 |
| 3-Person Families | 37 (16.6%) | $0 |
| 4-Person Families | 12 (5.4%) | $0 |
| 5-Person Families | 0 (0.0%) | $0 |
| 6-Person Families | 0 (0.0%) | $0 |
| 7+ Person Families | 0 (0.0%) | $0 |
| Total | 223 (100.0%) | $105,972 |
Family Income by Number of Earners in Brownville
| Number of Earners | # Families | Median Income |
| No Earners | 36 (16.1%) | $52,500 |
| 1 Earner | 43 (19.3%) | $64,464 |
| 2 Earners | 144 (64.6%) | $114,423 |
| 3+ Earners | 0 (0.0%) | $0 |
| Total | 223 (100.0%) | $105,972 |
Household Income in Brownville
Household Income Brackets in Brownville
With 72 households falling in the category, the $50,000 to $74,999 income range is the most frequent in Brownville, accounting for 26.3% of all households.
| Income Bracket | # Households | % Households |
| Less than $10,000 | 0 | 0.0% |
| $10,000 to $14,999 | 12 | 4.4% |
| $15,000 to $24,999 | 0 | 0.0% |
| $25,000 to $34,999 | 19 | 6.9% |
| $35,000 to $49,999 | 32 | 11.7% |
| $50,000 to $74,999 | 72 | 26.3% |
| $75,000 to $99,999 | 17 | 6.2% |
| $100,000 to $149,999 | 69 | 25.2% |
| $150,000 to $199,999 | 44 | 16.1% |
| $200,000+ | 9 | 3.3% |
Household Income by Householder Age in Brownville
The median household income in Brownville is $97,794, with the highest median household income of $120,288 found in the 45 to 64 years age bracket for the primary householder. A total of 111 households (40.5%) fall into this category.
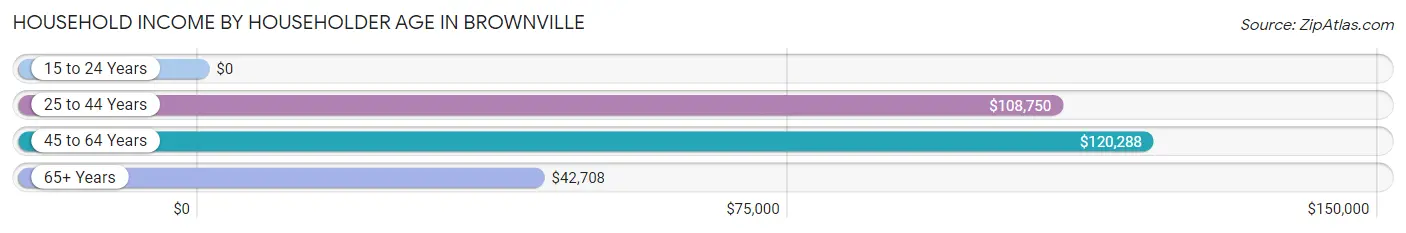
| Income Bracket | # Households | Median Income |
| 15 to 24 Years | 0 (0.0%) | $0 |
| 25 to 44 Years | 76 (27.7%) | $108,750 |
| 45 to 64 Years | 111 (40.5%) | $120,288 |
| 65+ Years | 87 (31.8%) | $42,708 |
| Total | 274 (100.0%) | $97,794 |
Poverty in Brownville
Income Below Poverty by Sex and Age in Brownville
With 2.1% poverty level for males and 4.1% for females among the residents of Brownville, 45 to 54 year old males and 75 year old and over females are the most vulnerable to poverty, with 2 males (10.0%) and 9 females (22.0%) in their respective age groups living below the poverty level.
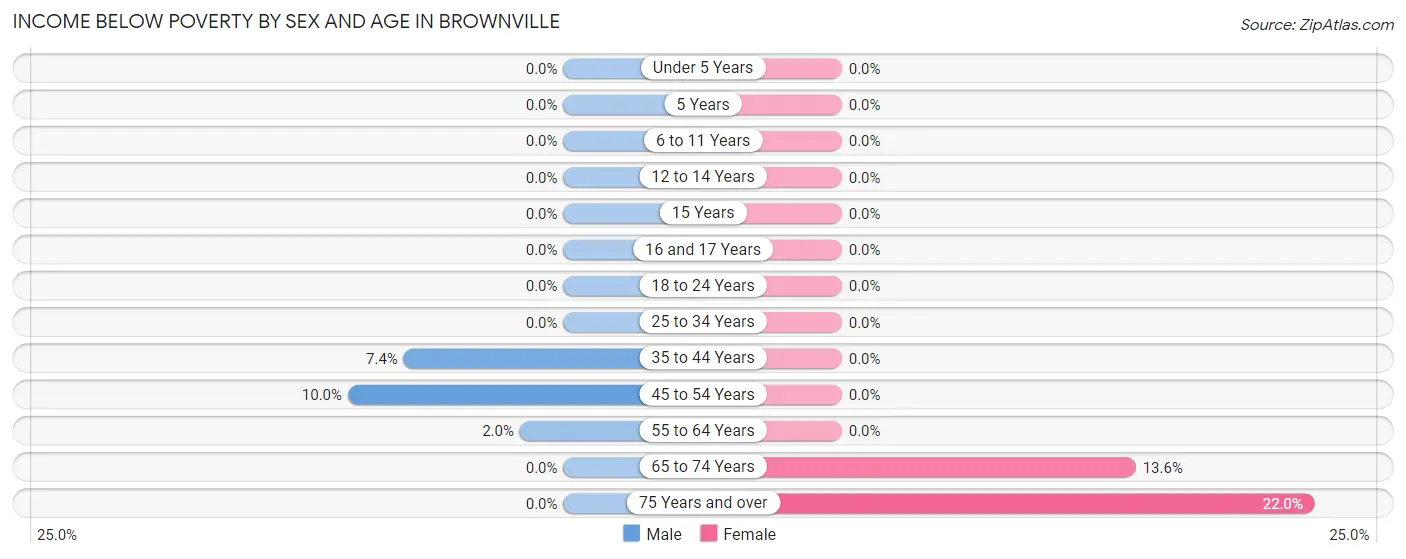
| Age Bracket | Male | Female |
| Under 5 Years | 0 (0.0%) | 0 (0.0%) |
| 5 Years | 0 (0.0%) | 0 (0.0%) |
| 6 to 11 Years | 0 (0.0%) | 0 (0.0%) |
| 12 to 14 Years | 0 (0.0%) | 0 (0.0%) |
| 15 Years | 0 (0.0%) | 0 (0.0%) |
| 16 and 17 Years | 0 (0.0%) | 0 (0.0%) |
| 18 to 24 Years | 0 (0.0%) | 0 (0.0%) |
| 25 to 34 Years | 0 (0.0%) | 0 (0.0%) |
| 35 to 44 Years | 2 (7.4%) | 0 (0.0%) |
| 45 to 54 Years | 2 (10.0%) | 0 (0.0%) |
| 55 to 64 Years | 2 (2.0%) | 0 (0.0%) |
| 65 to 74 Years | 0 (0.0%) | 3 (13.6%) |
| 75 Years and over | 0 (0.0%) | 9 (22.0%) |
| Total | 6 (2.1%) | 12 (4.1%) |
Income Above Poverty by Sex and Age in Brownville
According to the poverty statistics in Brownville, males aged under 5 years and females aged 12 to 14 years are the age groups that are most secure financially, with 100.0% of males and 100.0% of females in these age groups living above the poverty line.
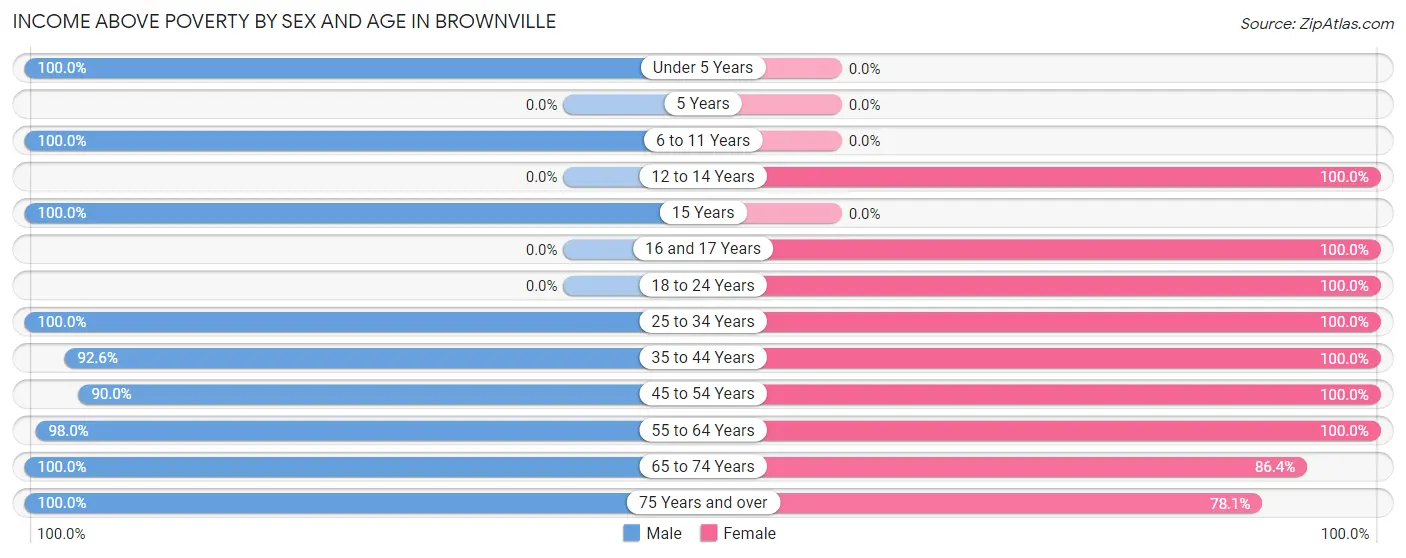
| Age Bracket | Male | Female |
| Under 5 Years | 12 (100.0%) | 0 (0.0%) |
| 5 Years | 0 (0.0%) | 0 (0.0%) |
| 6 to 11 Years | 13 (100.0%) | 0 (0.0%) |
| 12 to 14 Years | 0 (0.0%) | 17 (100.0%) |
| 15 Years | 3 (100.0%) | 0 (0.0%) |
| 16 and 17 Years | 0 (0.0%) | 15 (100.0%) |
| 18 to 24 Years | 0 (0.0%) | 15 (100.0%) |
| 25 to 34 Years | 60 (100.0%) | 44 (100.0%) |
| 35 to 44 Years | 25 (92.6%) | 16 (100.0%) |
| 45 to 54 Years | 18 (90.0%) | 32 (100.0%) |
| 55 to 64 Years | 97 (98.0%) | 94 (100.0%) |
| 65 to 74 Years | 42 (100.0%) | 19 (86.4%) |
| 75 Years and over | 10 (100.0%) | 32 (78.0%) |
| Total | 280 (97.9%) | 284 (96.0%) |
Income Below Poverty Among Married-Couple Families in Brownville
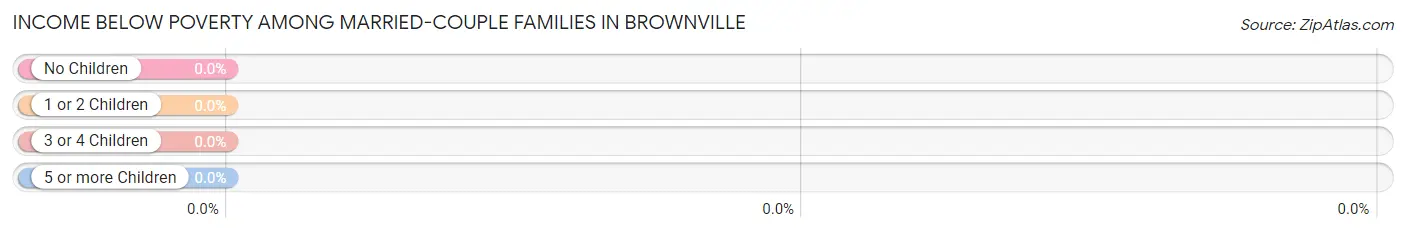
| Children | Above Poverty | Below Poverty |
| No Children | 173 (100.0%) | 0 (0.0%) |
| 1 or 2 Children | 35 (100.0%) | 0 (0.0%) |
| 3 or 4 Children | 0 (0.0%) | 0 (0.0%) |
| 5 or more Children | 0 (0.0%) | 0 (0.0%) |
| Total | 208 (100.0%) | 0 (0.0%) |
Income Below Poverty Among Single-Parent Households in Brownville
| Children | Single Father | Single Mother |
| No Children | 0 (0.0%) | 0 (0.0%) |
| 1 or 2 Children | 0 (0.0%) | 0 (0.0%) |
| 3 or 4 Children | 0 (0.0%) | 0 (0.0%) |
| 5 or more Children | 0 (0.0%) | 0 (0.0%) |
| Total | 0 (0.0%) | 0 (0.0%) |
Income Below Poverty Among Married-Couple vs Single-Parent Households in Brownville
| Children | Married-Couple Families | Single-Parent Households |
| No Children | 0 (0.0%) | 0 (0.0%) |
| 1 or 2 Children | 0 (0.0%) | 0 (0.0%) |
| 3 or 4 Children | 0 (0.0%) | 0 (0.0%) |
| 5 or more Children | 0 (0.0%) | 0 (0.0%) |
| Total | 0 (0.0%) | 0 (0.0%) |
Race in Brownville
The most populous races in Brownville are White / Caucasian (573 | 97.8%), Hispanic or Latino (11 | 1.9%), and Two or more Races (7 | 1.2%).
| Race | # Population | % Population |
| Asian | 0 | 0.0% |
| Black / African American | 4 | 0.7% |
| Hawaiian / Pacific | 0 | 0.0% |
| Hispanic or Latino | 11 | 1.9% |
| Native / Alaskan | 0 | 0.0% |
| White / Caucasian | 573 | 97.8% |
| Two or more Races | 7 | 1.2% |
| Some other Race | 2 | 0.3% |
| Total | 586 | 100.0% |
Ancestry in Brownville
The most populous ancestries reported in Brownville are French (144 | 24.6%), German (140 | 23.9%), English (119 | 20.3%), Irish (114 | 19.5%), and Italian (47 | 8.0%), together accounting for 96.2% of all Brownville residents.
| Ancestry | # Population | % Population |
| American | 5 | 0.9% |
| British | 10 | 1.7% |
| English | 119 | 20.3% |
| French | 144 | 24.6% |
| French American Indian | 7 | 1.2% |
| French Canadian | 27 | 4.6% |
| German | 140 | 23.9% |
| Hungarian | 36 | 6.1% |
| Irish | 114 | 19.5% |
| Italian | 47 | 8.0% |
| Polish | 47 | 8.0% |
| Puerto Rican | 9 | 1.5% |
| Scotch-Irish | 6 | 1.0% |
| Scottish | 21 | 3.6% |
| Swedish | 13 | 2.2% |
| Welsh | 3 | 0.5% | View All 16 Rows |
Immigrants in Brownville
The most numerous immigrant groups reported in Brownville came from , and Canada (4 | 0.7%), together accounting for 0.7% of all Brownville residents.

| Immigration Origin | # Population | % Population |
| Canada | 4 | 0.7% | View All 1 Rows |
Sex and Age in Brownville
Sex and Age in Brownville
The most populous age groups in Brownville are 60 to 64 Years (59 | 20.3%) for men and 55 to 59 Years (58 | 19.6%) for women.
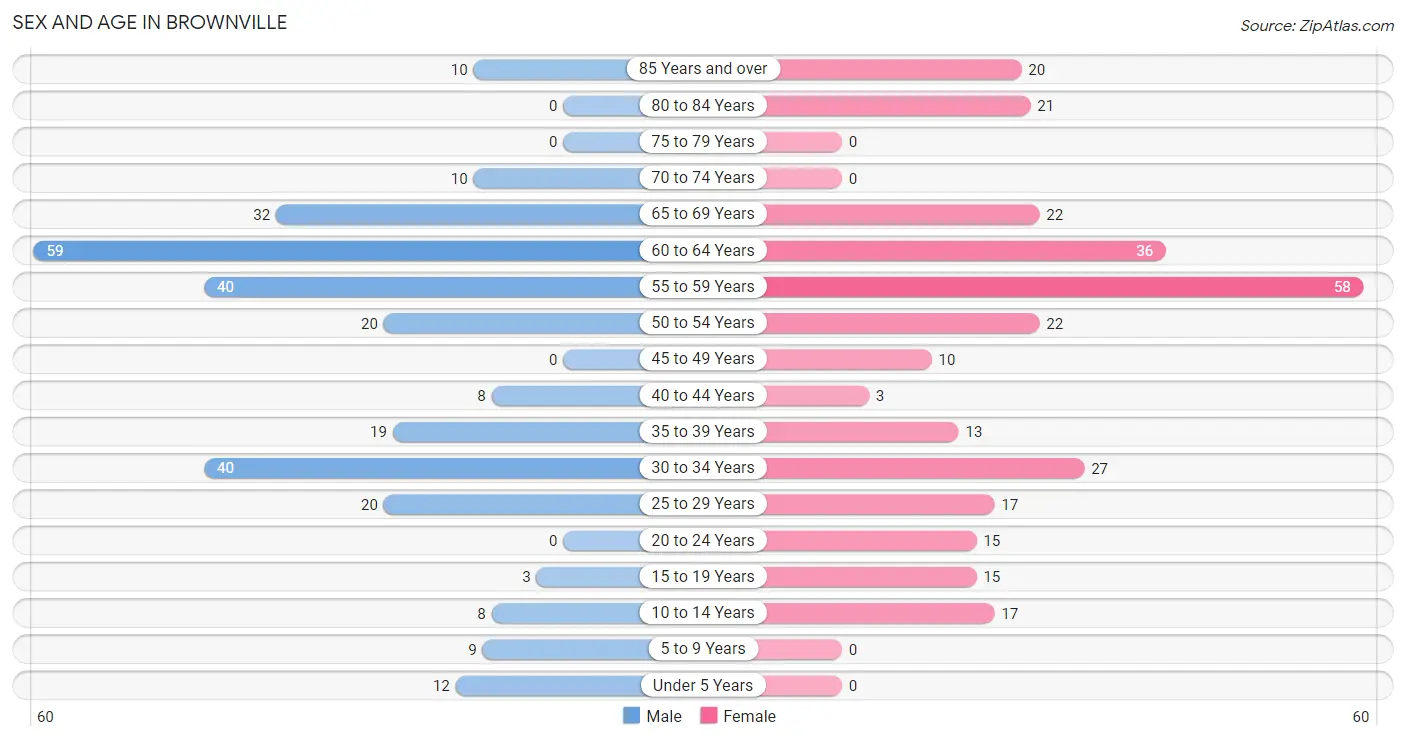
| Age Bracket | Male | Female |
| Under 5 Years | 12 (4.1%) | 0 (0.0%) |
| 5 to 9 Years | 9 (3.1%) | 0 (0.0%) |
| 10 to 14 Years | 8 (2.8%) | 17 (5.7%) |
| 15 to 19 Years | 3 (1.0%) | 15 (5.1%) |
| 20 to 24 Years | 0 (0.0%) | 15 (5.1%) |
| 25 to 29 Years | 20 (6.9%) | 17 (5.7%) |
| 30 to 34 Years | 40 (13.8%) | 27 (9.1%) |
| 35 to 39 Years | 19 (6.6%) | 13 (4.4%) |
| 40 to 44 Years | 8 (2.8%) | 3 (1.0%) |
| 45 to 49 Years | 0 (0.0%) | 10 (3.4%) |
| 50 to 54 Years | 20 (6.9%) | 22 (7.4%) |
| 55 to 59 Years | 40 (13.8%) | 58 (19.6%) |
| 60 to 64 Years | 59 (20.3%) | 36 (12.2%) |
| 65 to 69 Years | 32 (11.0%) | 22 (7.4%) |
| 70 to 74 Years | 10 (3.5%) | 0 (0.0%) |
| 75 to 79 Years | 0 (0.0%) | 0 (0.0%) |
| 80 to 84 Years | 0 (0.0%) | 21 (7.1%) |
| 85 Years and over | 10 (3.5%) | 20 (6.8%) |
| Total | 290 (100.0%) | 296 (100.0%) |
Families and Households in Brownville
Median Family Size in Brownville
The median family size in Brownville is 2.32 persons per family, with married-couple families (208 | 93.3%) accounting for the largest median family size of 2.36 persons per family. On the other hand, single male/father families (8 | 3.6%) represent the smallest median family size with 1.75 persons per family.
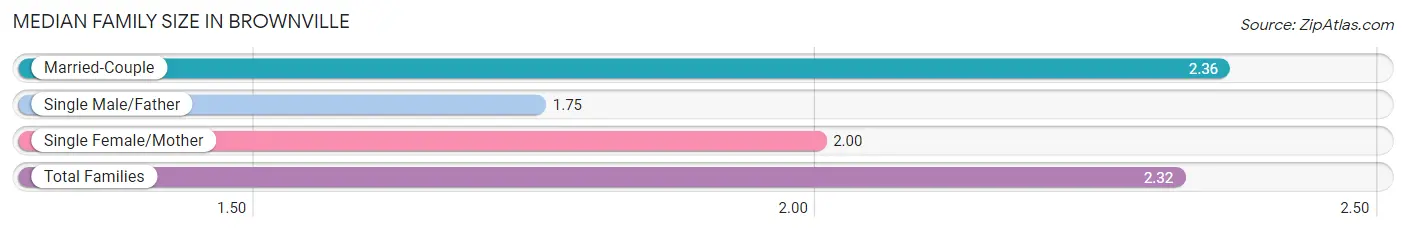
| Family Type | # Families | Family Size |
| Married-Couple | 208 (93.3%) | 2.36 |
| Single Male/Father | 8 (3.6%) | 1.75 |
| Single Female/Mother | 7 (3.1%) | 2.00 |
| Total Families | 223 (100.0%) | 2.32 |
Median Household Size in Brownville
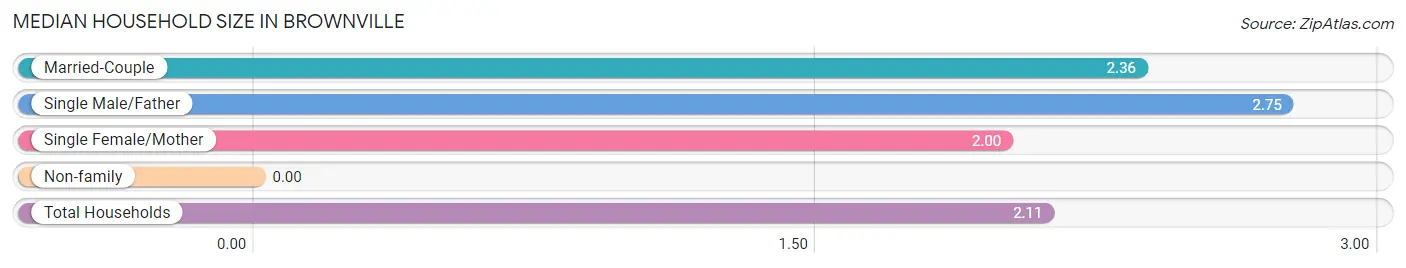
| Household Type | # Households | Household Size |
| Married-Couple | 208 (75.9%) | 2.36 |
| Single Male/Father | 8 (2.9%) | 2.75 |
| Single Female/Mother | 7 (2.5%) | 2.00 |
| Non-family | 51 (18.6%) | - |
| Total Households | 274 (100.0%) | 2.11 |
Household Size by Marriage Status in Brownville
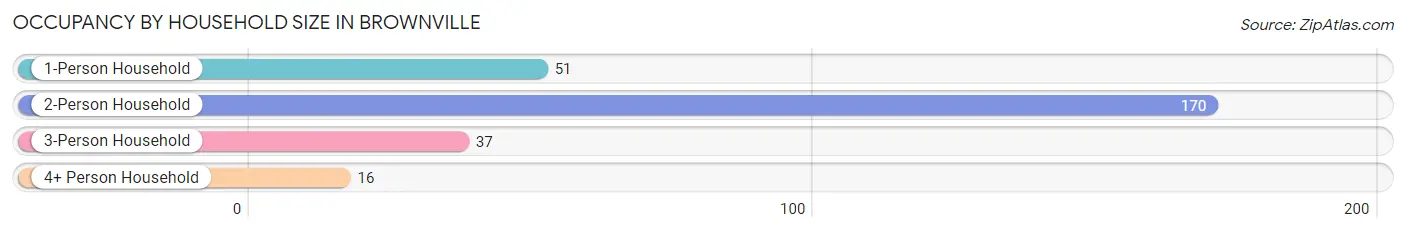
Out of a total of 274 households in Brownville, 223 (81.4%) are family households, while 51 (18.6%) are nonfamily households. The most numerous type of family households are 2-person households, comprising 170, and the most common type of nonfamily households are 1-person households, comprising 51.
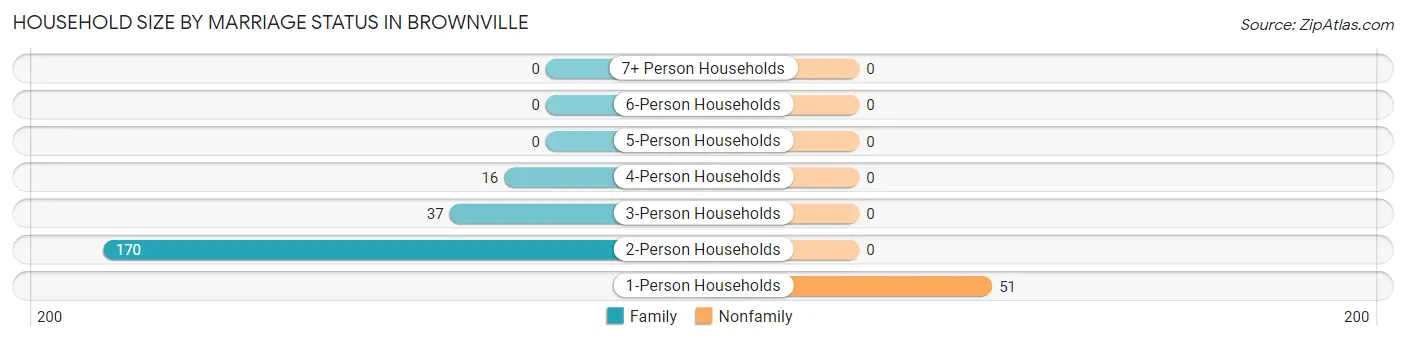
| Household Size | Family Households | Nonfamily Households |
| 1-Person Households | - | 51 (18.6%) |
| 2-Person Households | 170 (62.0%) | 0 (0.0%) |
| 3-Person Households | 37 (13.5%) | 0 (0.0%) |
| 4-Person Households | 16 (5.8%) | 0 (0.0%) |
| 5-Person Households | 0 (0.0%) | 0 (0.0%) |
| 6-Person Households | 0 (0.0%) | 0 (0.0%) |
| 7+ Person Households | 0 (0.0%) | 0 (0.0%) |
| Total | 223 (81.4%) | 51 (18.6%) |
Female Fertility in Brownville
Fertility by Age in Brownville
Average fertility rate in Brownville is 90.0 births per 1,000 women. Women in the age bracket of 20 to 34 years have the highest fertility rate with 153.0 births per 1,000 women. Women in the age bracket of 20 to 34 years acount for 100.0% of all women with births.
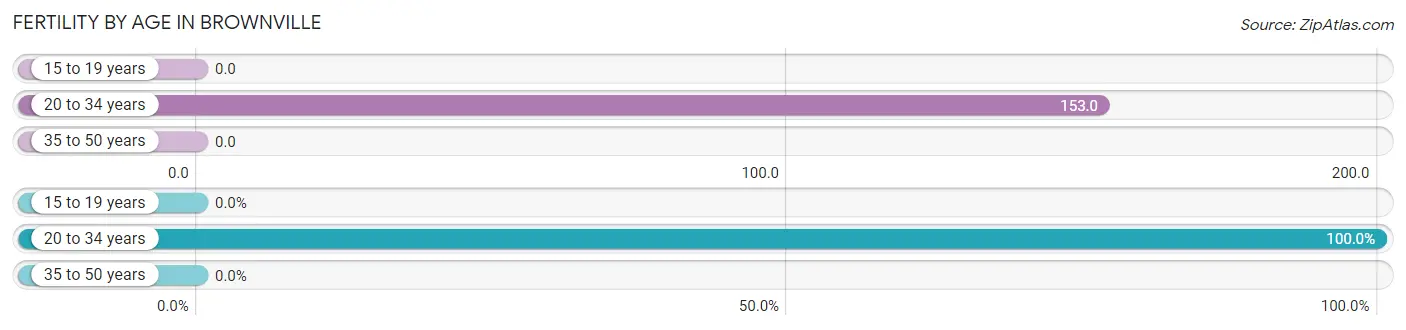
| Age Bracket | Women with Births | Births / 1,000 Women |
| 15 to 19 years | 0 (0.0%) | 0.0 |
| 20 to 34 years | 9 (100.0%) | 153.0 |
| 35 to 50 years | 0 (0.0%) | 0.0 |
| Total | 9 (100.0%) | 90.0 |
Fertility by Age by Marriage Status in Brownville
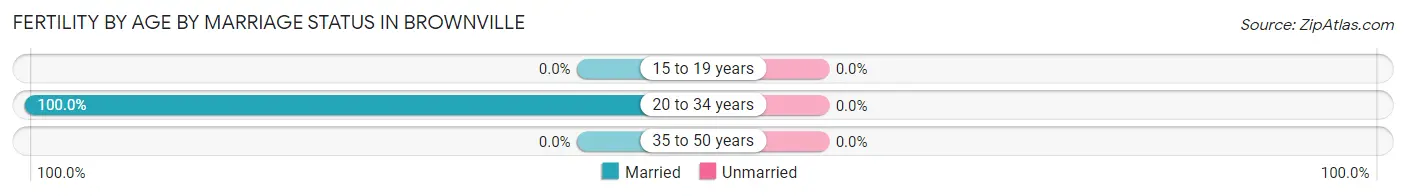
| Age Bracket | Married | Unmarried |
| 15 to 19 years | 0 (0.0%) | 0 (0.0%) |
| 20 to 34 years | 9 (100.0%) | 0 (0.0%) |
| 35 to 50 years | 0 (0.0%) | 0 (0.0%) |
| Total | 9 (100.0%) | 0 (0.0%) |
Fertility by Education in Brownville
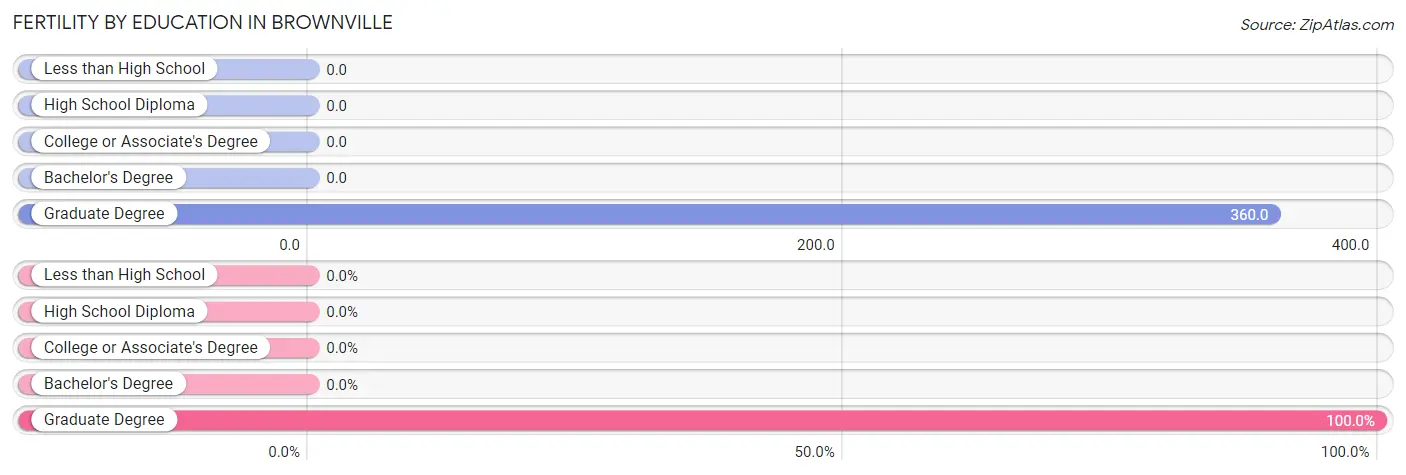
| Educational Attainment | Women with Births | Births / 1,000 Women |
| Less than High School | 0 (0.0%) | 0.0 |
| High School Diploma | 0 (0.0%) | 0.0 |
| College or Associate's Degree | 0 (0.0%) | 0.0 |
| Bachelor's Degree | 0 (0.0%) | 0.0 |
| Graduate Degree | 9 (100.0%) | 360.0 |
| Total | 9 (100.0%) | 90.0 |
Fertility by Education by Marriage Status in Brownville
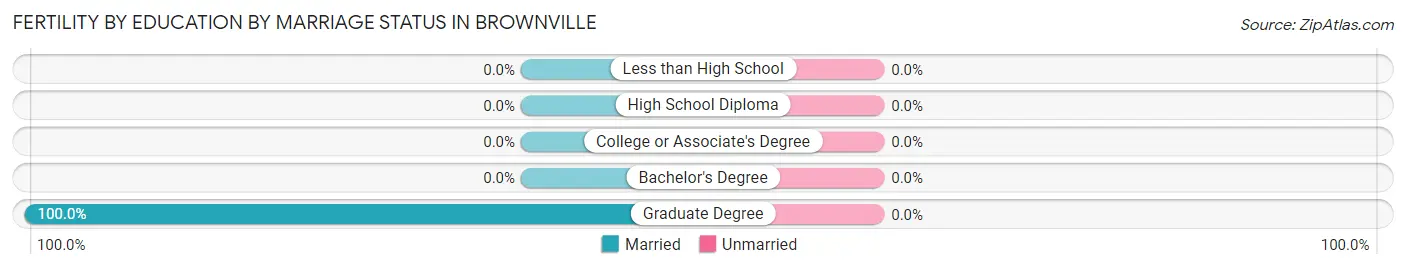
| Educational Attainment | Married | Unmarried |
| Less than High School | 0 (0.0%) | 0 (0.0%) |
| High School Diploma | 0 (0.0%) | 0 (0.0%) |
| College or Associate's Degree | 0 (0.0%) | 0 (0.0%) |
| Bachelor's Degree | 0 (0.0%) | 0 (0.0%) |
| Graduate Degree | 9 (100.0%) | 0 (0.0%) |
| Total | 9 (100.0%) | 0 (0.0%) |
Employment Characteristics in Brownville
Employment by Class of Employer in Brownville
Among the 345 employed individuals in Brownville, private company employees (117 | 33.9%), not-for-profit organizations (68 | 19.7%), and local government employees (59 | 17.1%) make up the most common classes of employment.
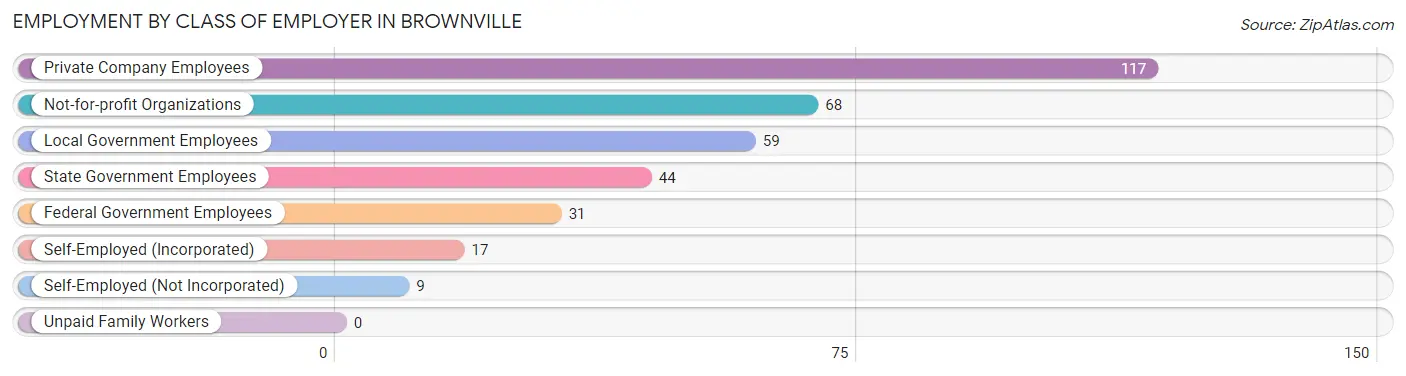
| Employer Class | # Employees | % Employees |
| Private Company Employees | 117 | 33.9% |
| Self-Employed (Incorporated) | 17 | 4.9% |
| Self-Employed (Not Incorporated) | 9 | 2.6% |
| Not-for-profit Organizations | 68 | 19.7% |
| Local Government Employees | 59 | 17.1% |
| State Government Employees | 44 | 12.8% |
| Federal Government Employees | 31 | 9.0% |
| Unpaid Family Workers | 0 | 0.0% |
| Total | 345 | 100.0% |
Employment Status by Age in Brownville
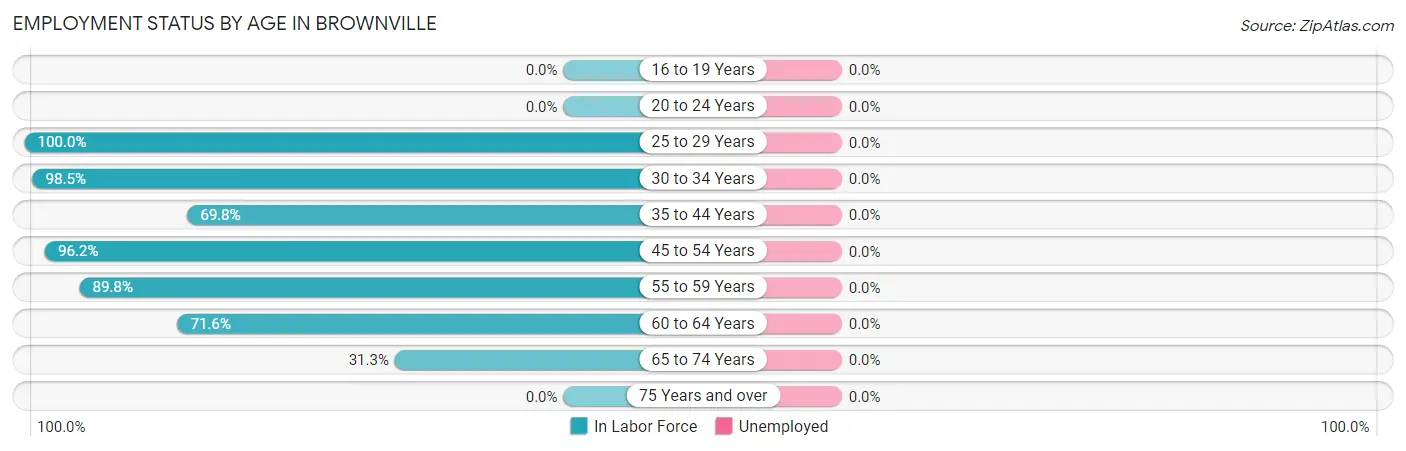
| Age Bracket | In Labor Force | Unemployed |
| 16 to 19 Years | 0 (0.0%) | 0 (0.0%) |
| 20 to 24 Years | 0 (0.0%) | 0 (0.0%) |
| 25 to 29 Years | 37 (100.0%) | 0 (0.0%) |
| 30 to 34 Years | 66 (98.5%) | 0 (0.0%) |
| 35 to 44 Years | 30 (69.8%) | 0 (0.0%) |
| 45 to 54 Years | 50 (96.2%) | 0 (0.0%) |
| 55 to 59 Years | 88 (89.8%) | 0 (0.0%) |
| 60 to 64 Years | 68 (71.6%) | 0 (0.0%) |
| 65 to 74 Years | 20 (31.3%) | 0 (0.0%) |
| 75 Years and over | 0 (0.0%) | 0 (0.0%) |
| Total | 359 (66.9%) | 0 (0.0%) |
Employment Status by Educational Attainment in Brownville
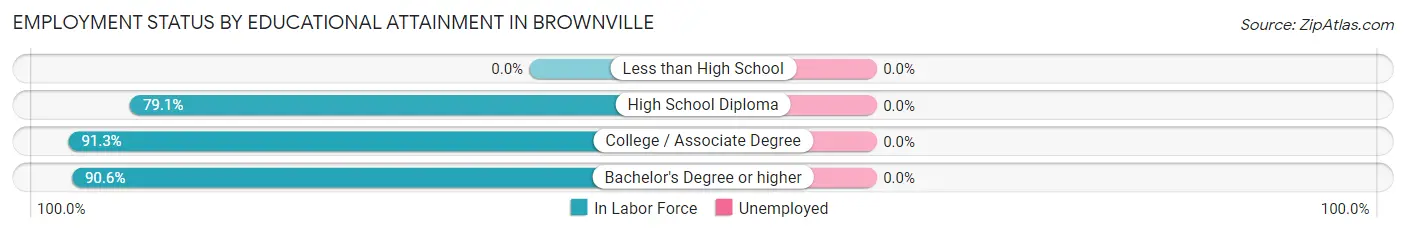
| Educational Attainment | In Labor Force | Unemployed |
| Less than High School | 0 (0.0%) | 0 (0.0%) |
| High School Diploma | 106 (79.1%) | 0 (0.0%) |
| College / Associate Degree | 146 (91.3%) | 0 (0.0%) |
| Bachelor's Degree or higher | 87 (90.6%) | 0 (0.0%) |
| Total | 339 (86.5%) | 0 (0.0%) |
Employment Occupations by Sex in Brownville
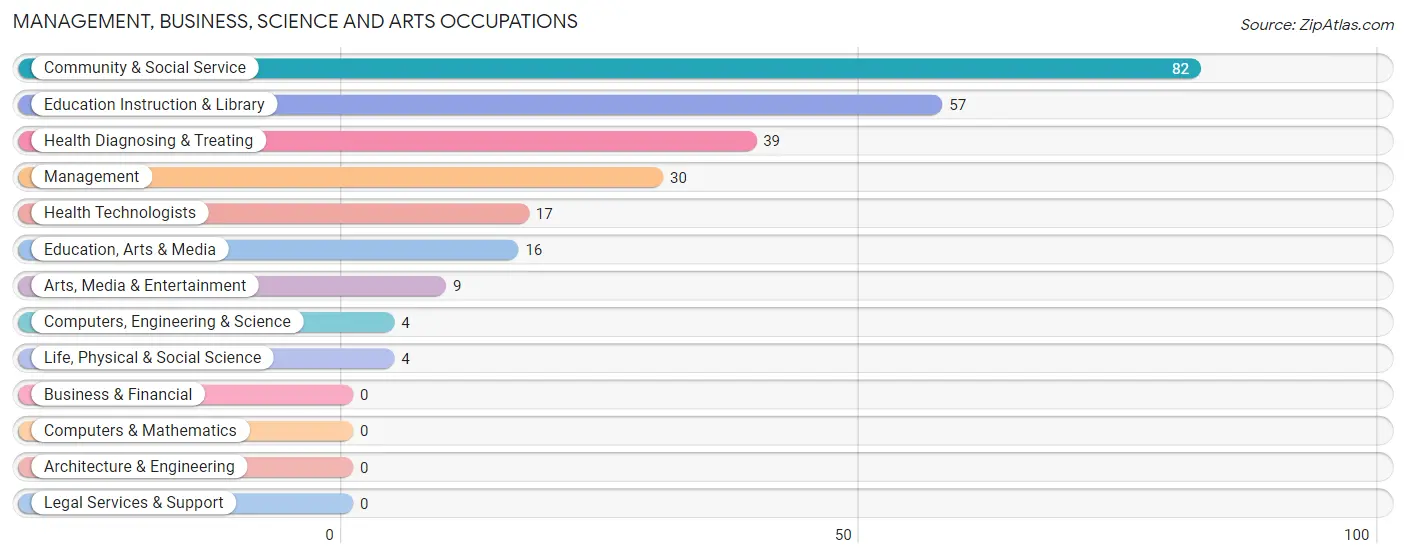
Management, Business, Science and Arts Occupations
The most common Management, Business, Science and Arts occupations in Brownville are Community & Social Service (82 | 22.8%), Education Instruction & Library (57 | 15.9%), Health Diagnosing & Treating (39 | 10.9%), Management (30 | 8.4%), and Health Technologists (17 | 4.7%).
Management, Business, Science and Arts Occupations by Sex
Within the Management, Business, Science and Arts occupations in Brownville, the most male-oriented occupations are Computers, Engineering & Science (100.0%), Life, Physical & Social Science (100.0%), and Management (93.3%), while the most female-oriented occupations are Arts, Media & Entertainment (100.0%), Health Technologists (100.0%), and Education Instruction & Library (86.0%).
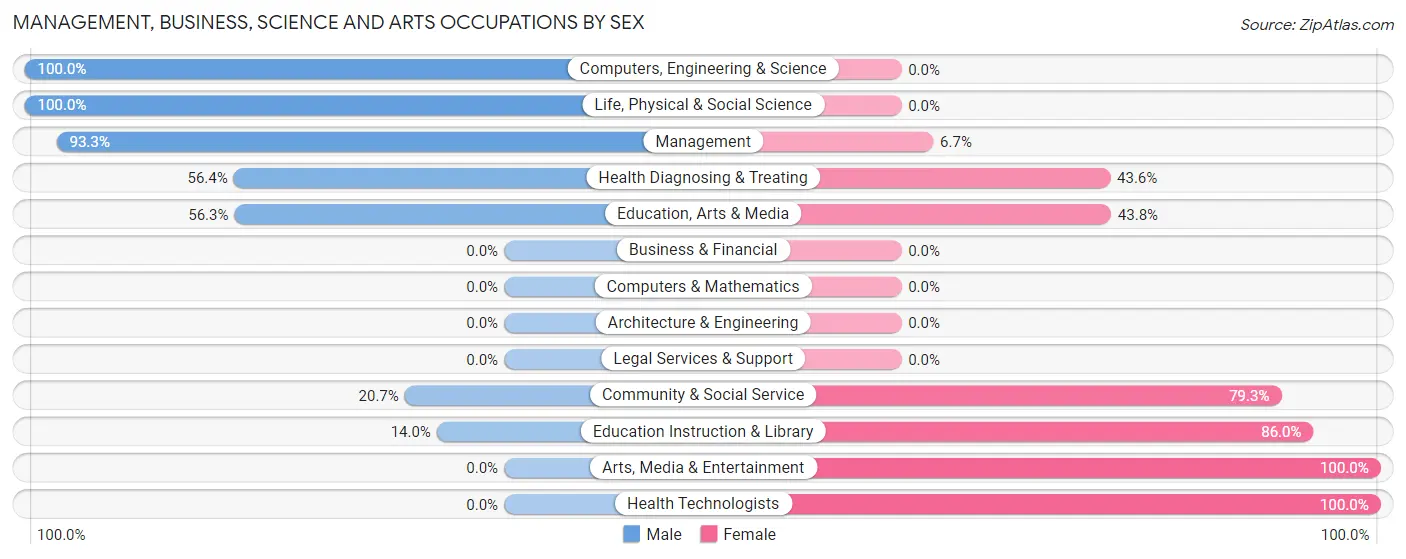
| Occupation | Male | Female |
| Management | 28 (93.3%) | 2 (6.7%) |
| Business & Financial | 0 (0.0%) | 0 (0.0%) |
| Computers, Engineering & Science | 4 (100.0%) | 0 (0.0%) |
| Computers & Mathematics | 0 (0.0%) | 0 (0.0%) |
| Architecture & Engineering | 0 (0.0%) | 0 (0.0%) |
| Life, Physical & Social Science | 4 (100.0%) | 0 (0.0%) |
| Community & Social Service | 17 (20.7%) | 65 (79.3%) |
| Education, Arts & Media | 9 (56.2%) | 7 (43.8%) |
| Legal Services & Support | 0 (0.0%) | 0 (0.0%) |
| Education Instruction & Library | 8 (14.0%) | 49 (86.0%) |
| Arts, Media & Entertainment | 0 (0.0%) | 9 (100.0%) |
| Health Diagnosing & Treating | 22 (56.4%) | 17 (43.6%) |
| Health Technologists | 0 (0.0%) | 17 (100.0%) |
| Total (Category) | 71 (45.8%) | 84 (54.2%) |
| Total (Overall) | 199 (55.4%) | 160 (44.6%) |
Services Occupations
The most common Services occupations in Brownville are Security & Protection (41 | 11.4%), Law Enforcement (38 | 10.6%), Food Preparation & Serving (21 | 5.9%), Cleaning & Maintenance (20 | 5.6%), and Healthcare Support (8 | 2.2%).
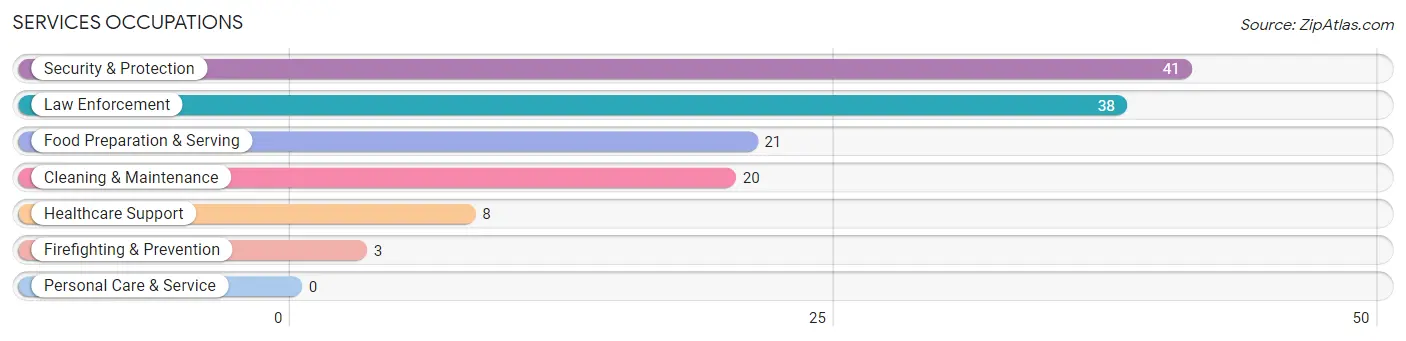
Services Occupations by Sex
Within the Services occupations in Brownville, the most male-oriented occupations are Law Enforcement (100.0%), Security & Protection (92.7%), and Cleaning & Maintenance (45.0%), while the most female-oriented occupations are Healthcare Support (100.0%), Firefighting & Prevention (100.0%), and Food Preparation & Serving (100.0%).
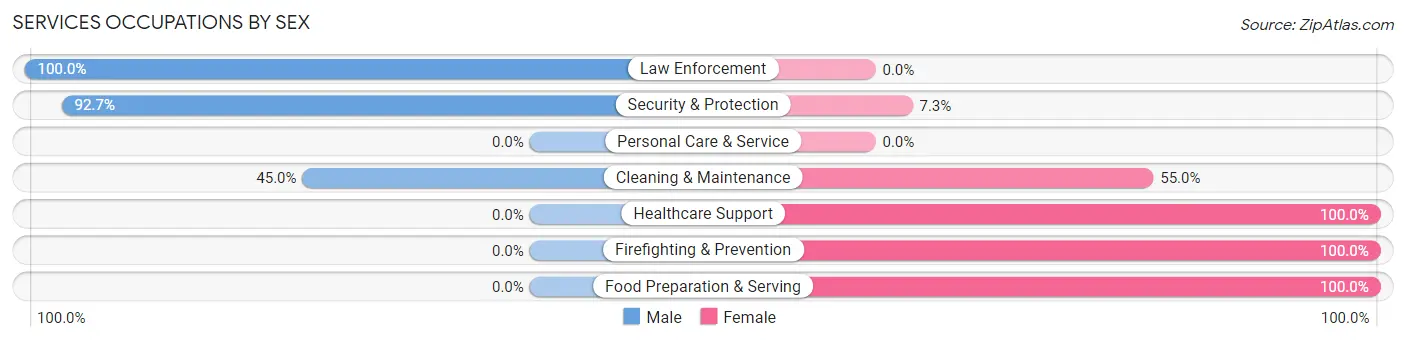
| Occupation | Male | Female |
| Healthcare Support | 0 (0.0%) | 8 (100.0%) |
| Security & Protection | 38 (92.7%) | 3 (7.3%) |
| Firefighting & Prevention | 0 (0.0%) | 3 (100.0%) |
| Law Enforcement | 38 (100.0%) | 0 (0.0%) |
| Food Preparation & Serving | 0 (0.0%) | 21 (100.0%) |
| Cleaning & Maintenance | 9 (45.0%) | 11 (55.0%) |
| Personal Care & Service | 0 (0.0%) | 0 (0.0%) |
| Total (Category) | 47 (52.2%) | 43 (47.8%) |
| Total (Overall) | 199 (55.4%) | 160 (44.6%) |
Sales and Office Occupations
The most common Sales and Office occupations in Brownville are Office & Administration (42 | 11.7%), and Sales & Related (15 | 4.2%).

Sales and Office Occupations by Sex

| Occupation | Male | Female |
| Sales & Related | 15 (100.0%) | 0 (0.0%) |
| Office & Administration | 18 (42.9%) | 24 (57.1%) |
| Total (Category) | 33 (57.9%) | 24 (42.1%) |
| Total (Overall) | 199 (55.4%) | 160 (44.6%) |
Natural Resources, Construction and Maintenance Occupations
The most common Natural Resources, Construction and Maintenance occupations in Brownville are Construction & Extraction (42 | 11.7%), and Installation, Maintenance & Repair (4 | 1.1%).

Natural Resources, Construction and Maintenance Occupations by Sex
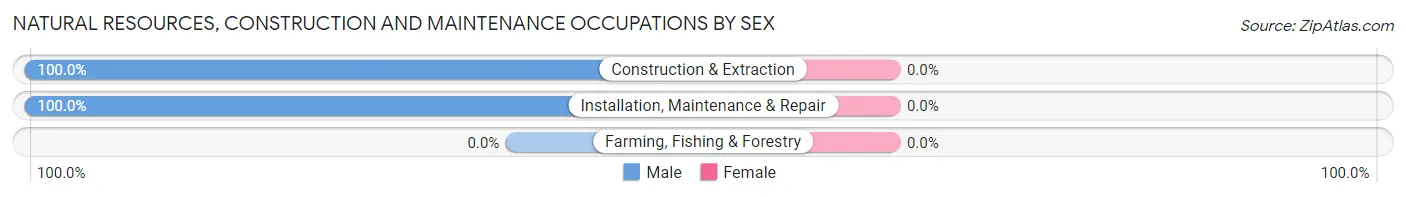
| Occupation | Male | Female |
| Farming, Fishing & Forestry | 0 (0.0%) | 0 (0.0%) |
| Construction & Extraction | 42 (100.0%) | 0 (0.0%) |
| Installation, Maintenance & Repair | 4 (100.0%) | 0 (0.0%) |
| Total (Category) | 46 (100.0%) | 0 (0.0%) |
| Total (Overall) | 199 (55.4%) | 160 (44.6%) |
Production, Transportation and Moving Occupations
The most common Production, Transportation and Moving occupations in Brownville are , and Production (11 | 3.1%).
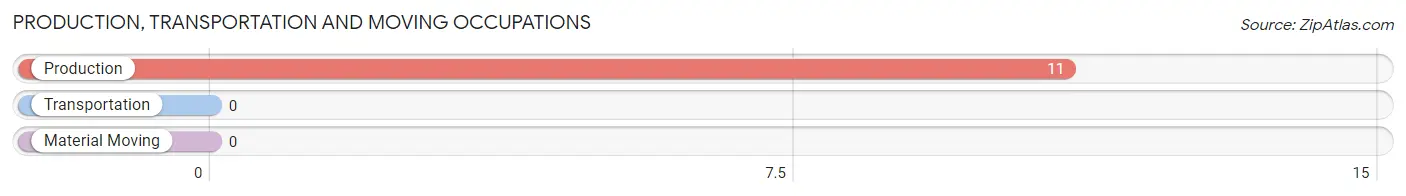
Production, Transportation and Moving Occupations by Sex
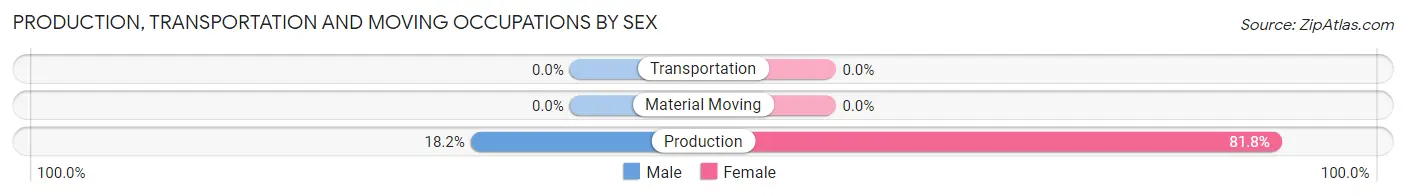
| Occupation | Male | Female |
| Production | 2 (18.2%) | 9 (81.8%) |
| Transportation | 0 (0.0%) | 0 (0.0%) |
| Material Moving | 0 (0.0%) | 0 (0.0%) |
| Total (Category) | 2 (18.2%) | 9 (81.8%) |
| Total (Overall) | 199 (55.4%) | 160 (44.6%) |
Employment Industries by Sex in Brownville
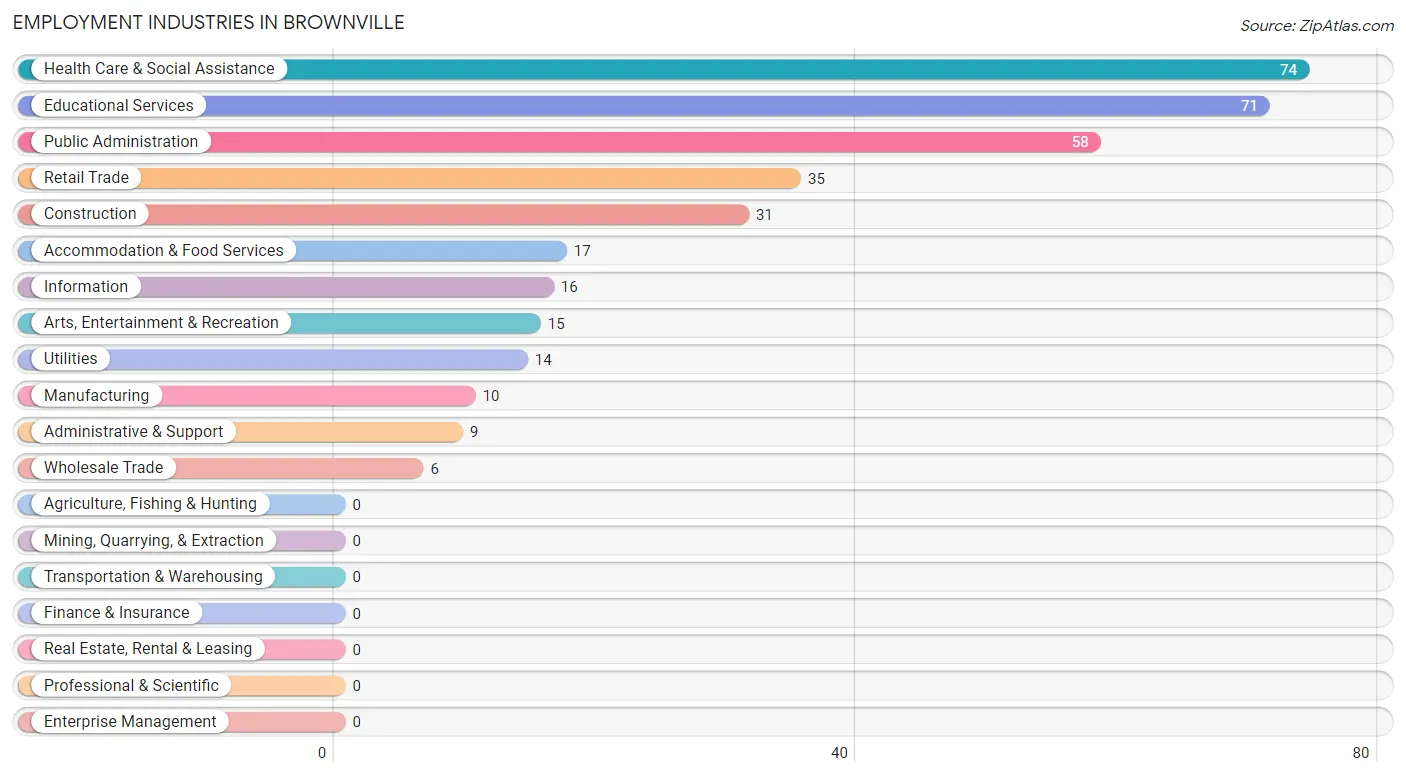
Employment Industries in Brownville
The major employment industries in Brownville include Health Care & Social Assistance (74 | 20.6%), Educational Services (71 | 19.8%), Public Administration (58 | 16.2%), Retail Trade (35 | 9.8%), and Construction (31 | 8.6%).
Employment Industries by Sex in Brownville
The Brownville industries that see more men than women are Construction (100.0%), Manufacturing (100.0%), and Utilities (100.0%), whereas the industries that tend to have a higher number of women are Accommodation & Food Services (100.0%), Educational Services (94.4%), and Arts, Entertainment & Recreation (60.0%).
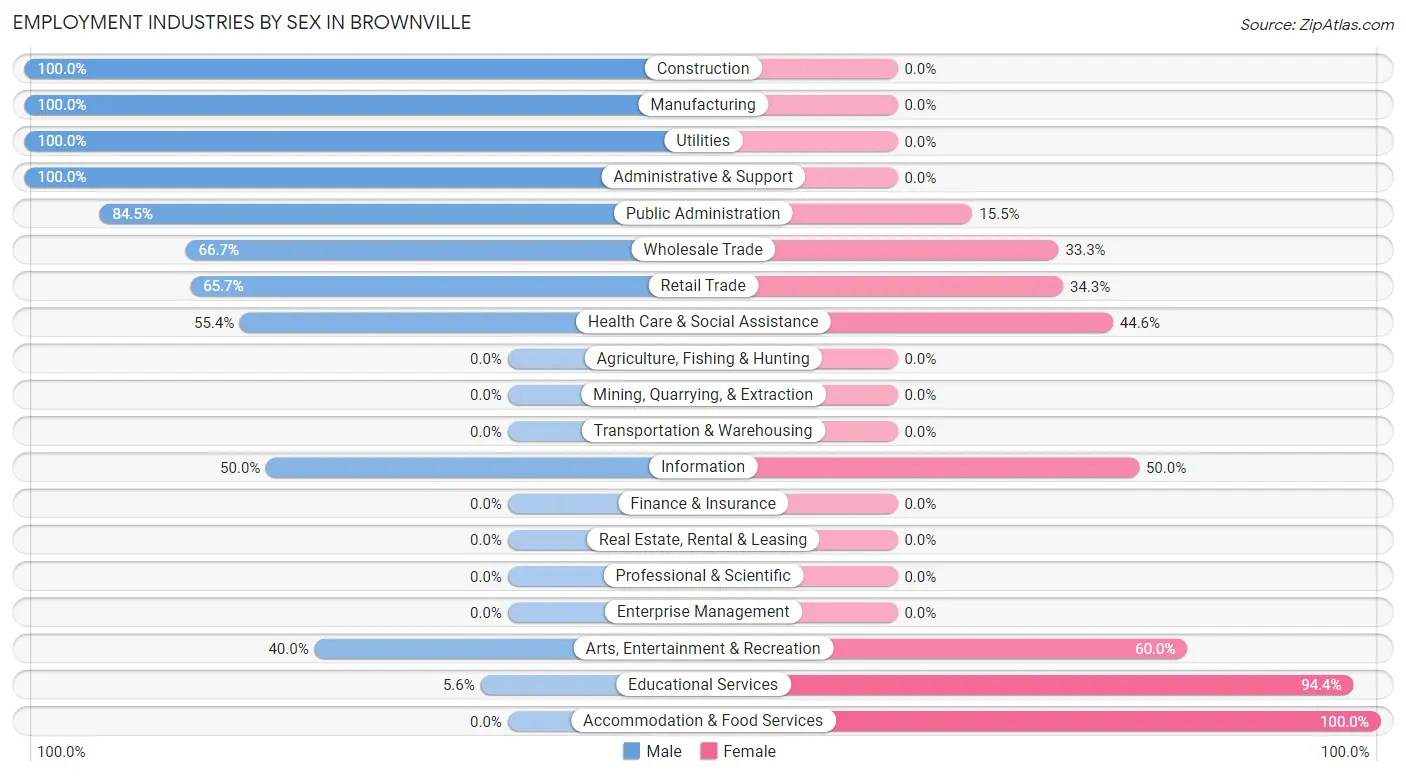
| Industry | Male | Female |
| Agriculture, Fishing & Hunting | 0 (0.0%) | 0 (0.0%) |
| Mining, Quarrying, & Extraction | 0 (0.0%) | 0 (0.0%) |
| Construction | 31 (100.0%) | 0 (0.0%) |
| Manufacturing | 10 (100.0%) | 0 (0.0%) |
| Wholesale Trade | 4 (66.7%) | 2 (33.3%) |
| Retail Trade | 23 (65.7%) | 12 (34.3%) |
| Transportation & Warehousing | 0 (0.0%) | 0 (0.0%) |
| Utilities | 14 (100.0%) | 0 (0.0%) |
| Information | 8 (50.0%) | 8 (50.0%) |
| Finance & Insurance | 0 (0.0%) | 0 (0.0%) |
| Real Estate, Rental & Leasing | 0 (0.0%) | 0 (0.0%) |
| Professional & Scientific | 0 (0.0%) | 0 (0.0%) |
| Enterprise Management | 0 (0.0%) | 0 (0.0%) |
| Administrative & Support | 9 (100.0%) | 0 (0.0%) |
| Educational Services | 4 (5.6%) | 67 (94.4%) |
| Health Care & Social Assistance | 41 (55.4%) | 33 (44.6%) |
| Arts, Entertainment & Recreation | 6 (40.0%) | 9 (60.0%) |
| Accommodation & Food Services | 0 (0.0%) | 17 (100.0%) |
| Public Administration | 49 (84.5%) | 9 (15.5%) |
| Total | 199 (55.4%) | 160 (44.6%) |
Education in Brownville
School Enrollment in Brownville
The most common levels of schooling among the 68 students in Brownville are middle school (25 | 36.8%), high school (15 | 22.1%), and college / undergraduate (15 | 22.1%).
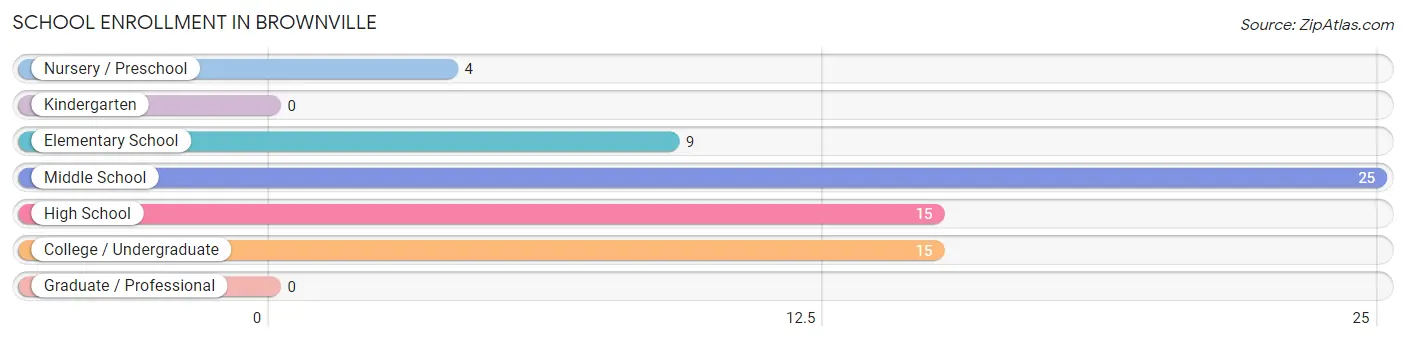
| School Level | # Students | % Students |
| Nursery / Preschool | 4 | 5.9% |
| Kindergarten | 0 | 0.0% |
| Elementary School | 9 | 13.2% |
| Middle School | 25 | 36.8% |
| High School | 15 | 22.1% |
| College / Undergraduate | 15 | 22.1% |
| Graduate / Professional | 0 | 0.0% |
| Total | 68 | 100.0% |
School Enrollment by Age by Funding Source in Brownville
Out of a total of 68 students who are enrolled in schools in Brownville, 16 (23.5%) attend a private institution, while the remaining 52 (76.5%) are enrolled in public schools. The age group of 15 to 17 year olds has the highest likelihood of being enrolled in private schools, with 12 (80.0% in the age bracket) enrolled. Conversely, the age group of 3 to 4 year olds has the lowest likelihood of being enrolled in a private school, with 4 (100.0% in the age bracket) attending a public institution.
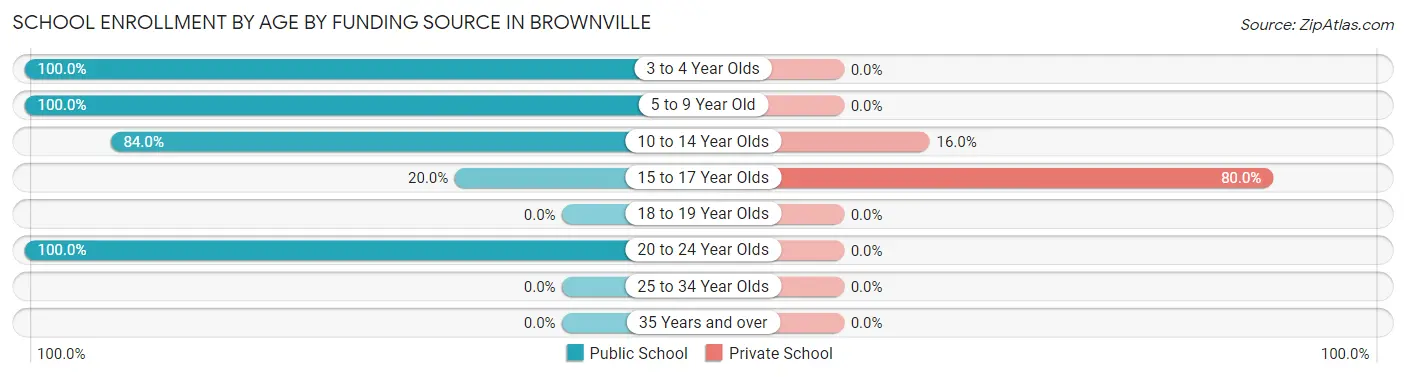
| Age Bracket | Public School | Private School |
| 3 to 4 Year Olds | 4 (100.0%) | 0 (0.0%) |
| 5 to 9 Year Old | 9 (100.0%) | 0 (0.0%) |
| 10 to 14 Year Olds | 21 (84.0%) | 4 (16.0%) |
| 15 to 17 Year Olds | 3 (20.0%) | 12 (80.0%) |
| 18 to 19 Year Olds | 0 (0.0%) | 0 (0.0%) |
| 20 to 24 Year Olds | 15 (100.0%) | 0 (0.0%) |
| 25 to 34 Year Olds | 0 (0.0%) | 0 (0.0%) |
| 35 Years and over | 0 (0.0%) | 0 (0.0%) |
| Total | 52 (76.5%) | 16 (23.5%) |
Educational Attainment by Field of Study in Brownville
Science & technology (36 | 27.7%), arts & humanities (17 | 13.1%), social sciences (15 | 11.5%), education (14 | 10.8%), and literature & languages (12 | 9.2%) are the most common fields of study among 130 individuals in Brownville who have obtained a bachelor's degree or higher.
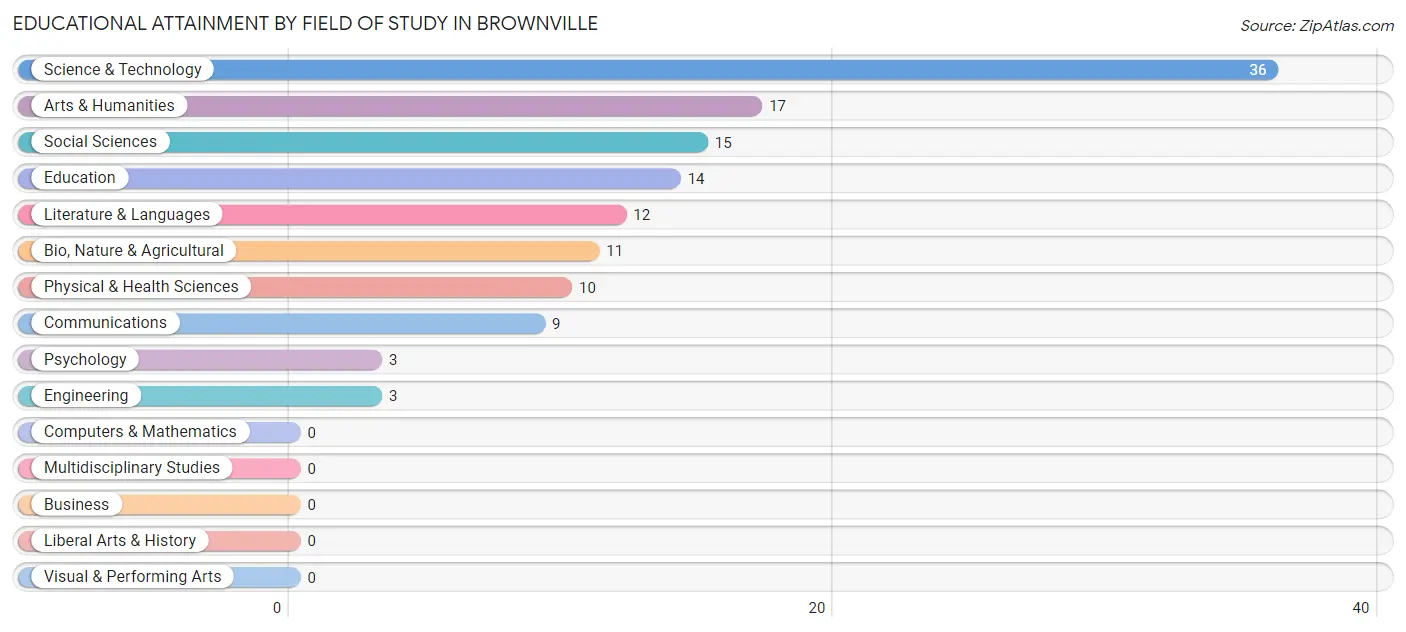
| Field of Study | # Graduates | % Graduates |
| Computers & Mathematics | 0 | 0.0% |
| Bio, Nature & Agricultural | 11 | 8.5% |
| Physical & Health Sciences | 10 | 7.7% |
| Psychology | 3 | 2.3% |
| Social Sciences | 15 | 11.5% |
| Engineering | 3 | 2.3% |
| Multidisciplinary Studies | 0 | 0.0% |
| Science & Technology | 36 | 27.7% |
| Business | 0 | 0.0% |
| Education | 14 | 10.8% |
| Literature & Languages | 12 | 9.2% |
| Liberal Arts & History | 0 | 0.0% |
| Visual & Performing Arts | 0 | 0.0% |
| Communications | 9 | 6.9% |
| Arts & Humanities | 17 | 13.1% |
| Total | 130 | 100.0% |
Transportation & Commute in Brownville
Vehicle Availability by Sex in Brownville
The most prevalent vehicle ownership categories in Brownville are males with 2 vehicles (139, accounting for 76.0%) and females with 2 vehicles (122, making up 86.9%).
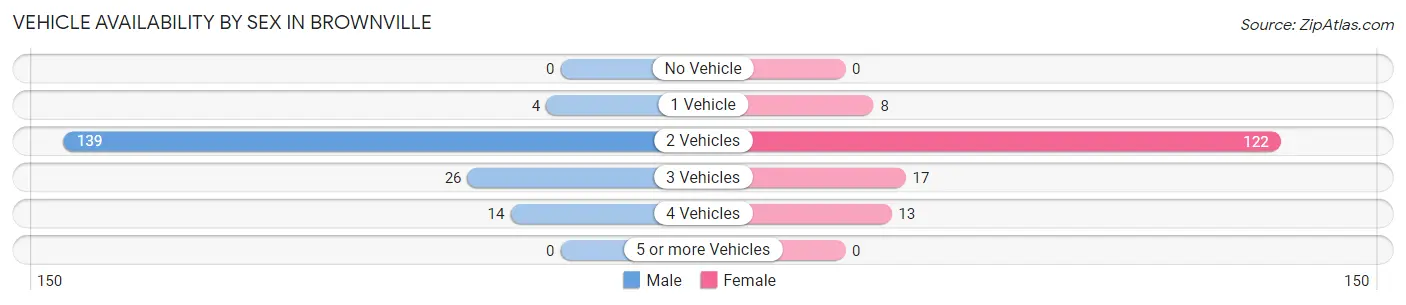
| Vehicles Available | Male | Female |
| No Vehicle | 0 (0.0%) | 0 (0.0%) |
| 1 Vehicle | 4 (2.2%) | 8 (5.0%) |
| 2 Vehicles | 139 (76.0%) | 122 (76.2%) |
| 3 Vehicles | 26 (14.2%) | 17 (10.6%) |
| 4 Vehicles | 14 (7.6%) | 13 (8.1%) |
| 5 or more Vehicles | 0 (0.0%) | 0 (0.0%) |
| Total | 183 (100.0%) | 160 (100.0%) |
Commute Time in Brownville
The most frequently occuring commute durations in Brownville are 15 to 19 minutes (98 commuters, 29.2%), 5 to 9 minutes (75 commuters, 22.3%), and 10 to 14 minutes (65 commuters, 19.4%).
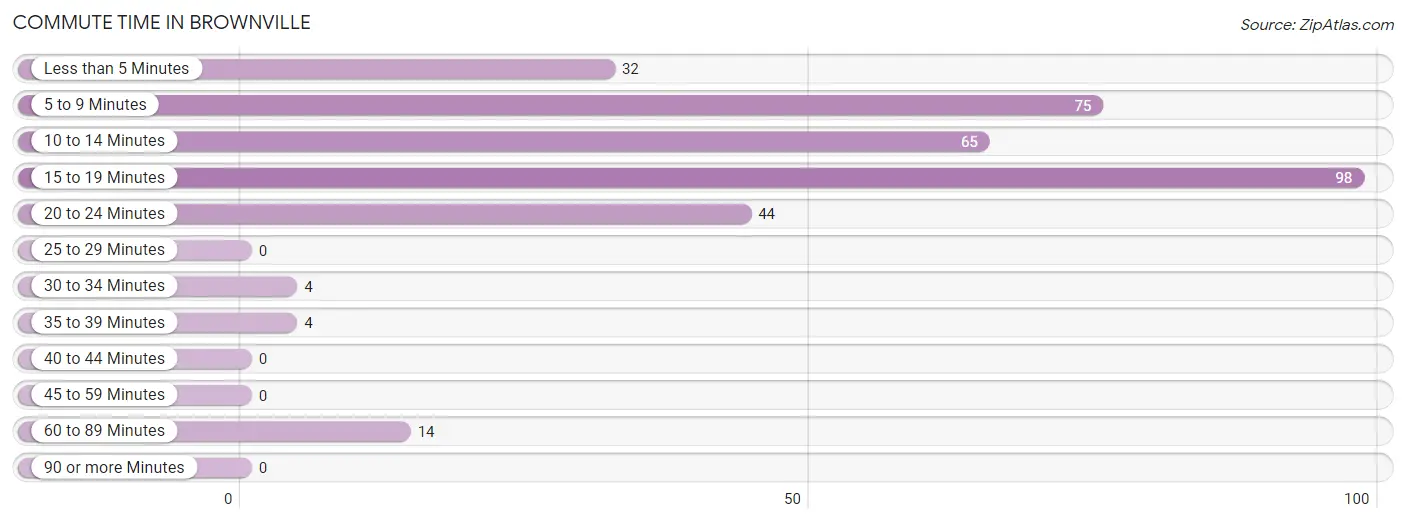
| Commute Time | # Commuters | % Commuters |
| Less than 5 Minutes | 32 | 9.5% |
| 5 to 9 Minutes | 75 | 22.3% |
| 10 to 14 Minutes | 65 | 19.4% |
| 15 to 19 Minutes | 98 | 29.2% |
| 20 to 24 Minutes | 44 | 13.1% |
| 25 to 29 Minutes | 0 | 0.0% |
| 30 to 34 Minutes | 4 | 1.2% |
| 35 to 39 Minutes | 4 | 1.2% |
| 40 to 44 Minutes | 0 | 0.0% |
| 45 to 59 Minutes | 0 | 0.0% |
| 60 to 89 Minutes | 14 | 4.2% |
| 90 or more Minutes | 0 | 0.0% |
Commute Time by Sex in Brownville
The most common commute times in Brownville are 15 to 19 minutes (67 commuters, 36.2%) for males and 10 to 14 minutes (35 commuters, 23.2%) for females.
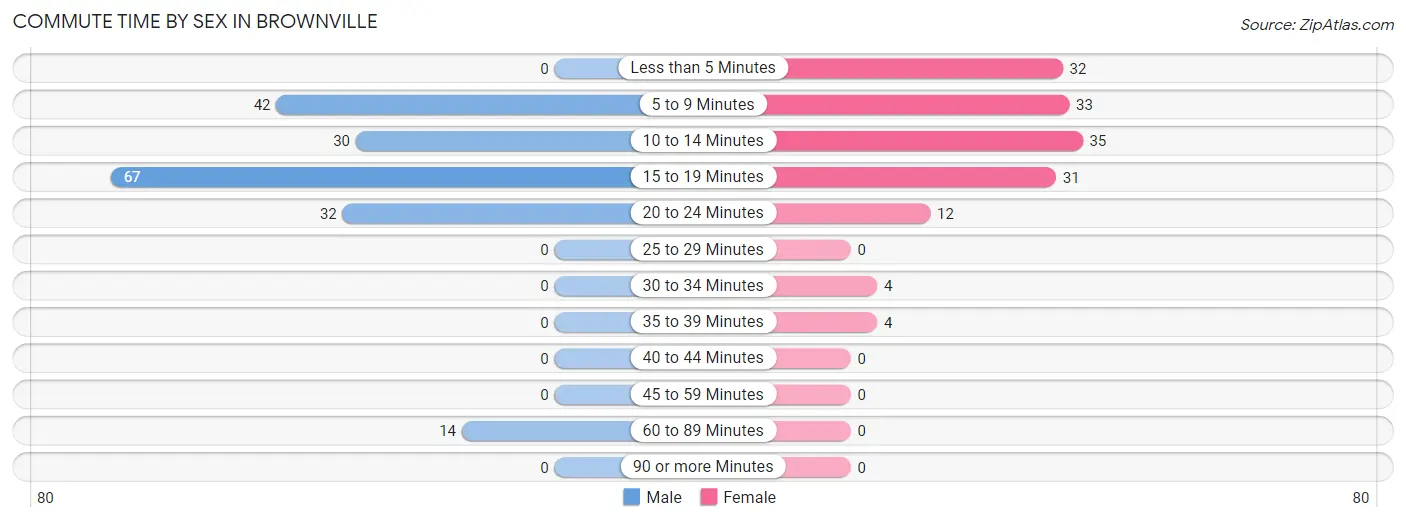
| Commute Time | Male | Female |
| Less than 5 Minutes | 0 (0.0%) | 32 (21.2%) |
| 5 to 9 Minutes | 42 (22.7%) | 33 (21.8%) |
| 10 to 14 Minutes | 30 (16.2%) | 35 (23.2%) |
| 15 to 19 Minutes | 67 (36.2%) | 31 (20.5%) |
| 20 to 24 Minutes | 32 (17.3%) | 12 (8.0%) |
| 25 to 29 Minutes | 0 (0.0%) | 0 (0.0%) |
| 30 to 34 Minutes | 0 (0.0%) | 4 (2.6%) |
| 35 to 39 Minutes | 0 (0.0%) | 4 (2.6%) |
| 40 to 44 Minutes | 0 (0.0%) | 0 (0.0%) |
| 45 to 59 Minutes | 0 (0.0%) | 0 (0.0%) |
| 60 to 89 Minutes | 14 (7.6%) | 0 (0.0%) |
| 90 or more Minutes | 0 (0.0%) | 0 (0.0%) |
Time of Departure to Work by Sex in Brownville
The most frequent times of departure to work in Brownville are 7:00 AM to 7:29 AM (37, 20.0%) for males and 6:00 AM to 6:29 AM (38, 25.2%) for females.
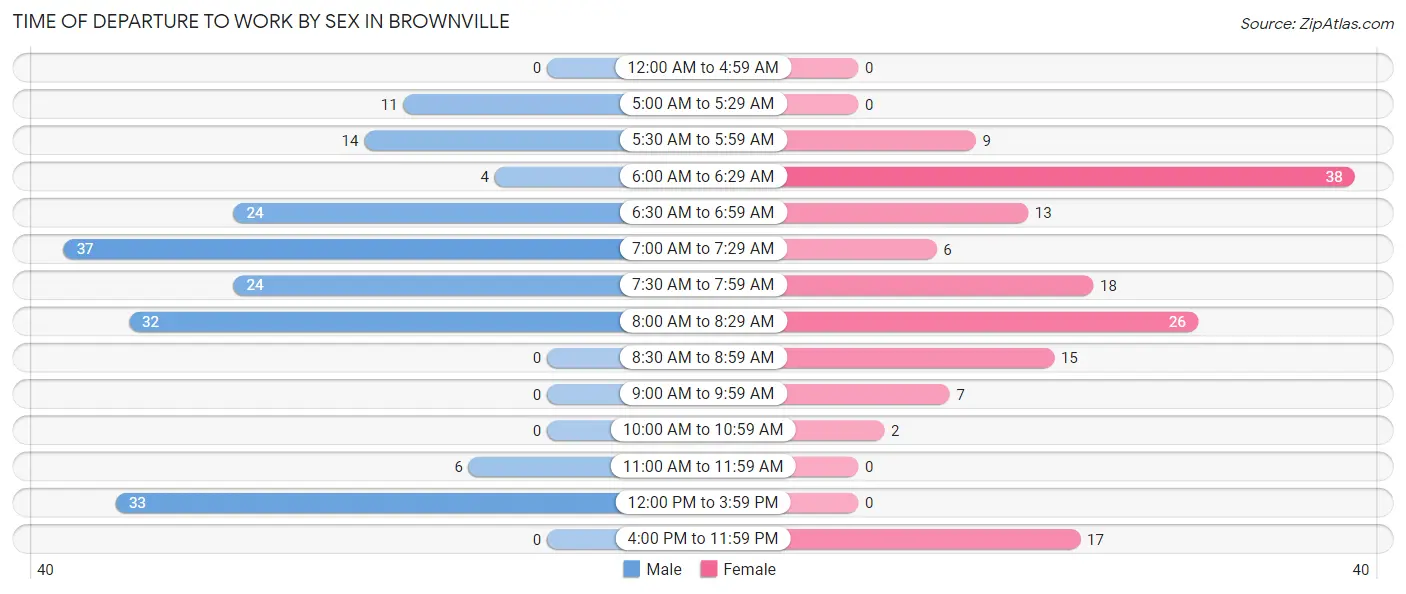
| Time of Departure | Male | Female |
| 12:00 AM to 4:59 AM | 0 (0.0%) | 0 (0.0%) |
| 5:00 AM to 5:29 AM | 11 (5.9%) | 0 (0.0%) |
| 5:30 AM to 5:59 AM | 14 (7.6%) | 9 (6.0%) |
| 6:00 AM to 6:29 AM | 4 (2.2%) | 38 (25.2%) |
| 6:30 AM to 6:59 AM | 24 (13.0%) | 13 (8.6%) |
| 7:00 AM to 7:29 AM | 37 (20.0%) | 6 (4.0%) |
| 7:30 AM to 7:59 AM | 24 (13.0%) | 18 (11.9%) |
| 8:00 AM to 8:29 AM | 32 (17.3%) | 26 (17.2%) |
| 8:30 AM to 8:59 AM | 0 (0.0%) | 15 (9.9%) |
| 9:00 AM to 9:59 AM | 0 (0.0%) | 7 (4.6%) |
| 10:00 AM to 10:59 AM | 0 (0.0%) | 2 (1.3%) |
| 11:00 AM to 11:59 AM | 6 (3.2%) | 0 (0.0%) |
| 12:00 PM to 3:59 PM | 33 (17.8%) | 0 (0.0%) |
| 4:00 PM to 11:59 PM | 0 (0.0%) | 17 (11.3%) |
| Total | 185 (100.0%) | 151 (100.0%) |
Housing Occupancy in Brownville
Occupancy by Ownership in Brownville
Of the total 274 dwellings in Brownville, owner-occupied units account for 211 (77.0%), while renter-occupied units make up 63 (23.0%).
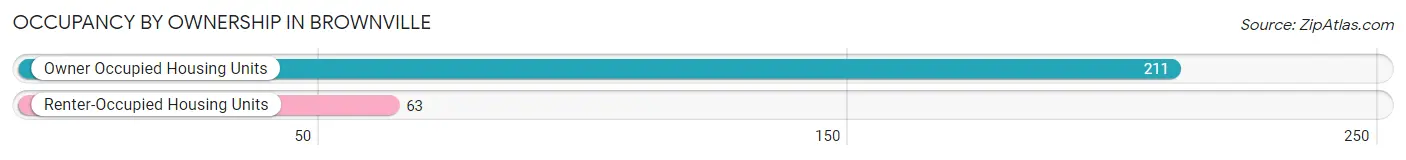
| Occupancy | # Housing Units | % Housing Units |
| Owner Occupied Housing Units | 211 | 77.0% |
| Renter-Occupied Housing Units | 63 | 23.0% |
| Total Occupied Housing Units | 274 | 100.0% |
Occupancy by Household Size in Brownville
| Household Size | # Housing Units | % Housing Units |
| 1-Person Household | 51 | 18.6% |
| 2-Person Household | 170 | 62.0% |
| 3-Person Household | 37 | 13.5% |
| 4+ Person Household | 16 | 5.8% |
| Total Housing Units | 274 | 100.0% |
Occupancy by Ownership by Household Size in Brownville
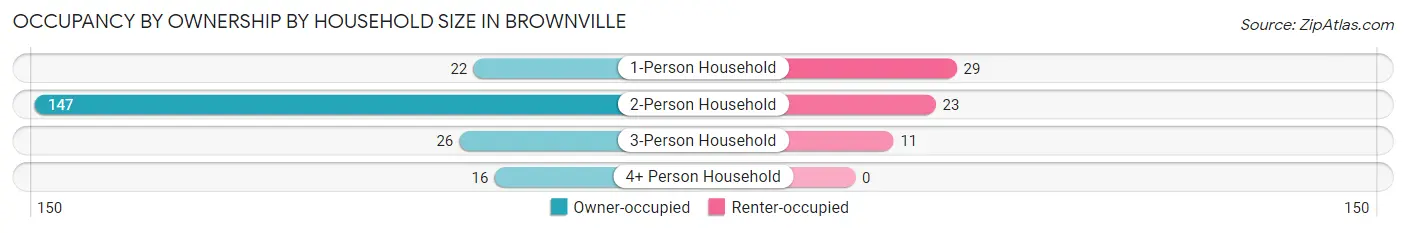
| Household Size | Owner-occupied | Renter-occupied |
| 1-Person Household | 22 (43.1%) | 29 (56.9%) |
| 2-Person Household | 147 (86.5%) | 23 (13.5%) |
| 3-Person Household | 26 (70.3%) | 11 (29.7%) |
| 4+ Person Household | 16 (100.0%) | 0 (0.0%) |
| Total Housing Units | 211 (77.0%) | 63 (23.0%) |
Occupancy by Educational Attainment in Brownville
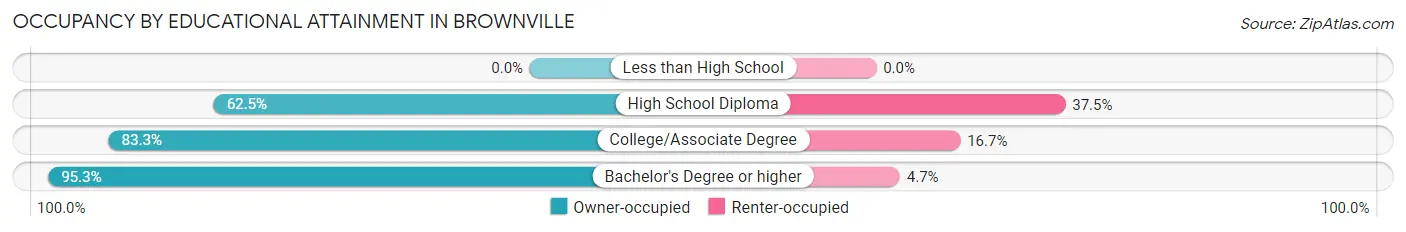
| Household Size | Owner-occupied | Renter-occupied |
| Less than High School | 0 (0.0%) | 0 (0.0%) |
| High School Diploma | 75 (62.5%) | 45 (37.5%) |
| College/Associate Degree | 75 (83.3%) | 15 (16.7%) |
| Bachelor's Degree or higher | 61 (95.3%) | 3 (4.7%) |
Occupancy by Age of Householder in Brownville
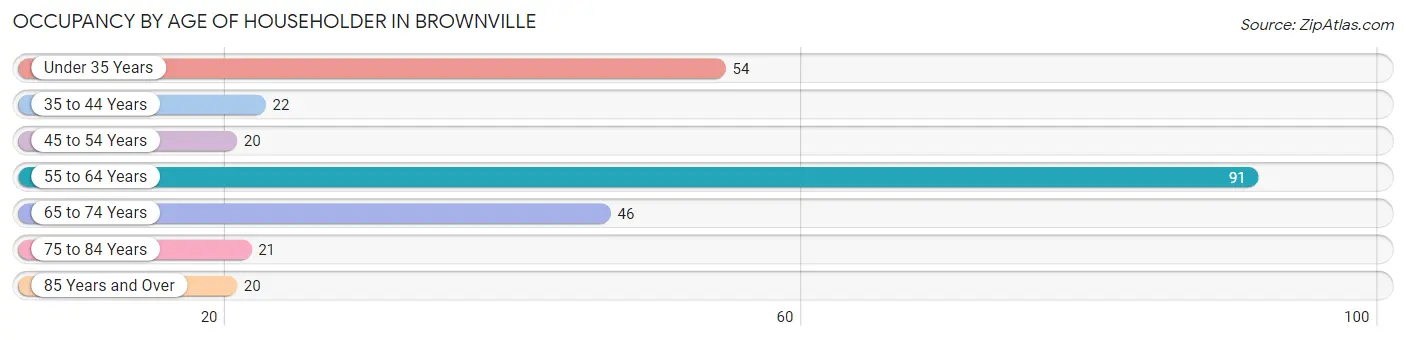
| Age Bracket | # Households | % Households |
| Under 35 Years | 54 | 19.7% |
| 35 to 44 Years | 22 | 8.0% |
| 45 to 54 Years | 20 | 7.3% |
| 55 to 64 Years | 91 | 33.2% |
| 65 to 74 Years | 46 | 16.8% |
| 75 to 84 Years | 21 | 7.7% |
| 85 Years and Over | 20 | 7.3% |
| Total | 274 | 100.0% |
Housing Finances in Brownville
Median Income by Occupancy in Brownville
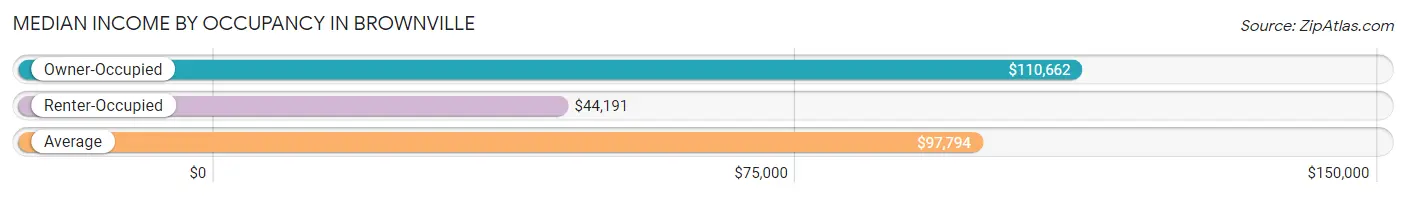
| Occupancy Type | # Households | Median Income |
| Owner-Occupied | 211 (77.0%) | $110,662 |
| Renter-Occupied | 63 (23.0%) | $44,191 |
| Average | 274 (100.0%) | $97,794 |
Occupancy by Householder Income Bracket in Brownville
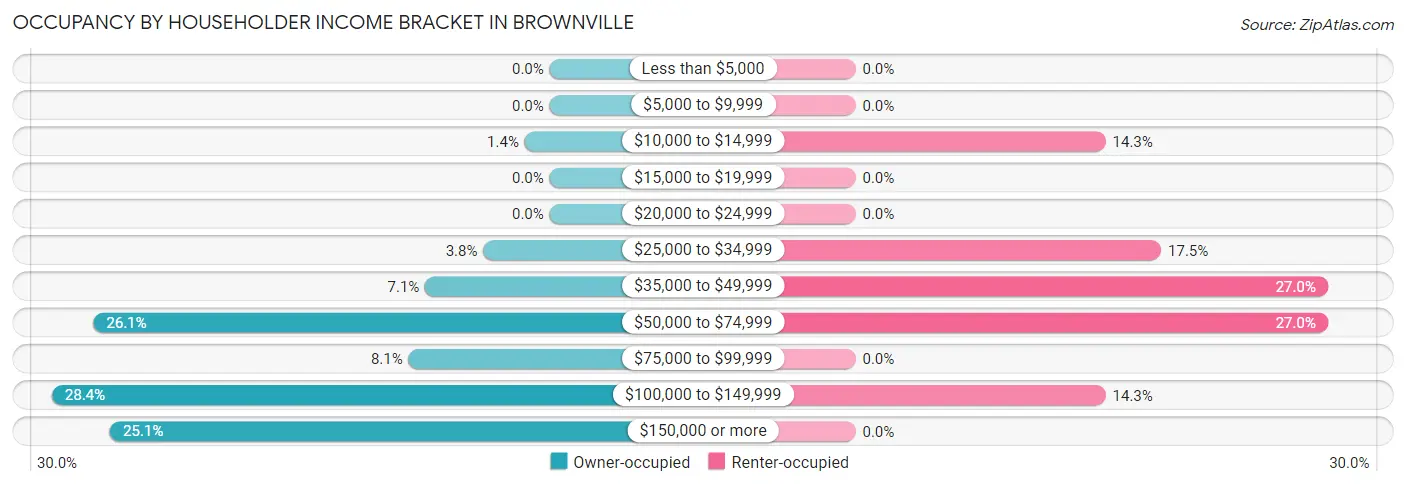
| Income Bracket | Owner-occupied | Renter-occupied |
| Less than $5,000 | 0 (0.0%) | 0 (0.0%) |
| $5,000 to $9,999 | 0 (0.0%) | 0 (0.0%) |
| $10,000 to $14,999 | 3 (1.4%) | 9 (14.3%) |
| $15,000 to $19,999 | 0 (0.0%) | 0 (0.0%) |
| $20,000 to $24,999 | 0 (0.0%) | 0 (0.0%) |
| $25,000 to $34,999 | 8 (3.8%) | 11 (17.5%) |
| $35,000 to $49,999 | 15 (7.1%) | 17 (27.0%) |
| $50,000 to $74,999 | 55 (26.1%) | 17 (27.0%) |
| $75,000 to $99,999 | 17 (8.1%) | 0 (0.0%) |
| $100,000 to $149,999 | 60 (28.4%) | 9 (14.3%) |
| $150,000 or more | 53 (25.1%) | 0 (0.0%) |
| Total | 211 (100.0%) | 63 (100.0%) |
Monthly Housing Cost Tiers in Brownville
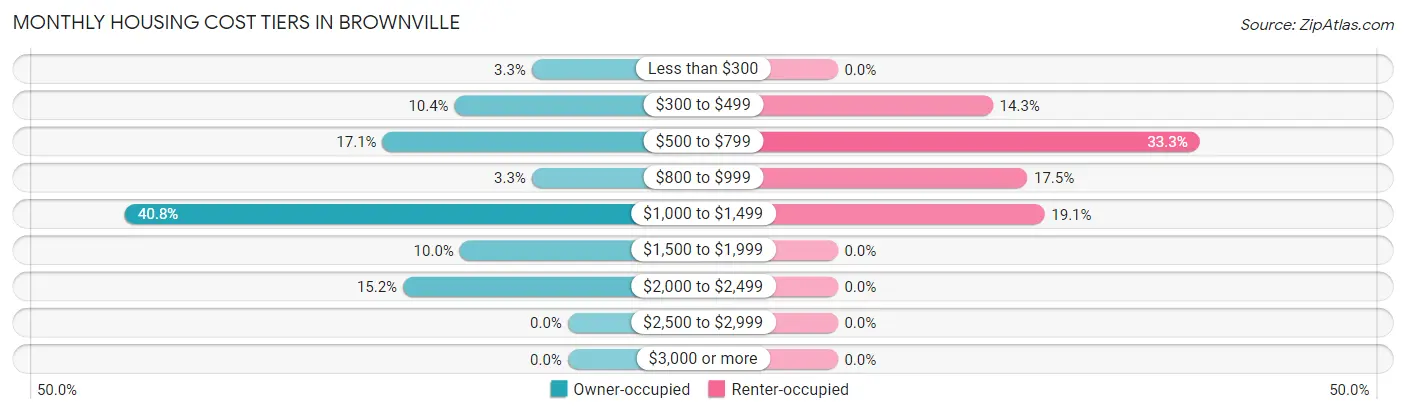
| Monthly Cost | Owner-occupied | Renter-occupied |
| Less than $300 | 7 (3.3%) | 0 (0.0%) |
| $300 to $499 | 22 (10.4%) | 9 (14.3%) |
| $500 to $799 | 36 (17.1%) | 21 (33.3%) |
| $800 to $999 | 7 (3.3%) | 11 (17.5%) |
| $1,000 to $1,499 | 86 (40.8%) | 12 (19.1%) |
| $1,500 to $1,999 | 21 (10.0%) | 0 (0.0%) |
| $2,000 to $2,499 | 32 (15.2%) | 0 (0.0%) |
| $2,500 to $2,999 | 0 (0.0%) | 0 (0.0%) |
| $3,000 or more | 0 (0.0%) | 0 (0.0%) |
| Total | 211 (100.0%) | 63 (100.0%) |
Physical Housing Characteristics in Brownville
Housing Structures in Brownville
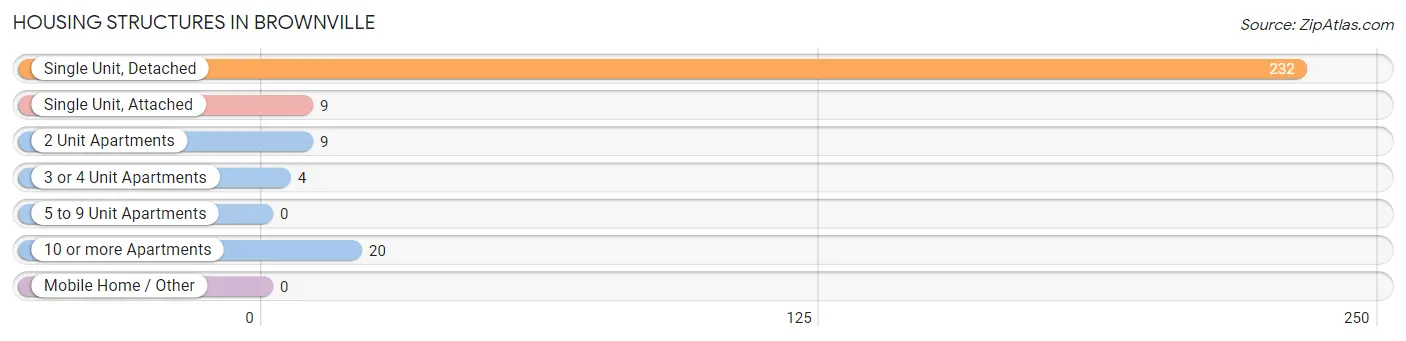
| Structure Type | # Housing Units | % Housing Units |
| Single Unit, Detached | 232 | 84.7% |
| Single Unit, Attached | 9 | 3.3% |
| 2 Unit Apartments | 9 | 3.3% |
| 3 or 4 Unit Apartments | 4 | 1.5% |
| 5 to 9 Unit Apartments | 0 | 0.0% |
| 10 or more Apartments | 20 | 7.3% |
| Mobile Home / Other | 0 | 0.0% |
| Total | 274 | 100.0% |
Housing Structures by Occupancy in Brownville
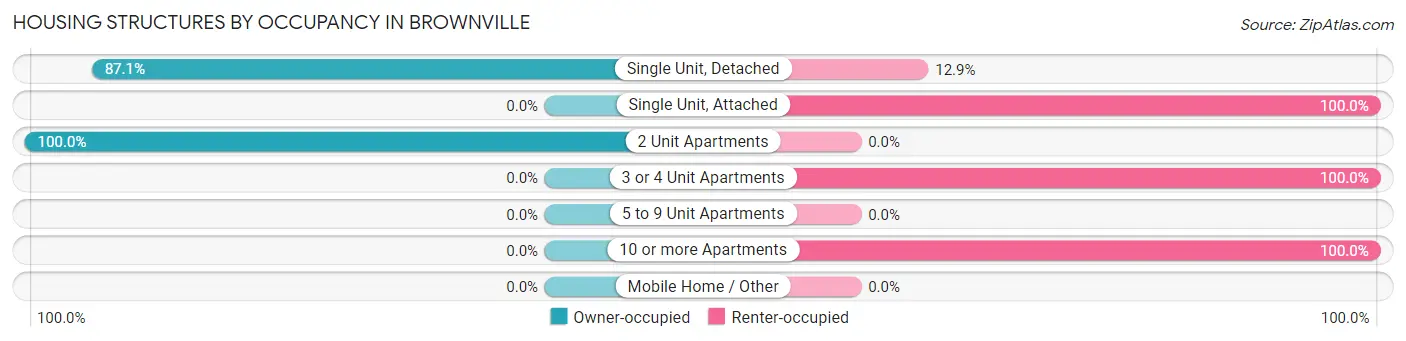
| Structure Type | Owner-occupied | Renter-occupied |
| Single Unit, Detached | 202 (87.1%) | 30 (12.9%) |
| Single Unit, Attached | 0 (0.0%) | 9 (100.0%) |
| 2 Unit Apartments | 9 (100.0%) | 0 (0.0%) |
| 3 or 4 Unit Apartments | 0 (0.0%) | 4 (100.0%) |
| 5 to 9 Unit Apartments | 0 (0.0%) | 0 (0.0%) |
| 10 or more Apartments | 0 (0.0%) | 20 (100.0%) |
| Mobile Home / Other | 0 (0.0%) | 0 (0.0%) |
| Total | 211 (77.0%) | 63 (23.0%) |
Housing Structures by Number of Rooms in Brownville
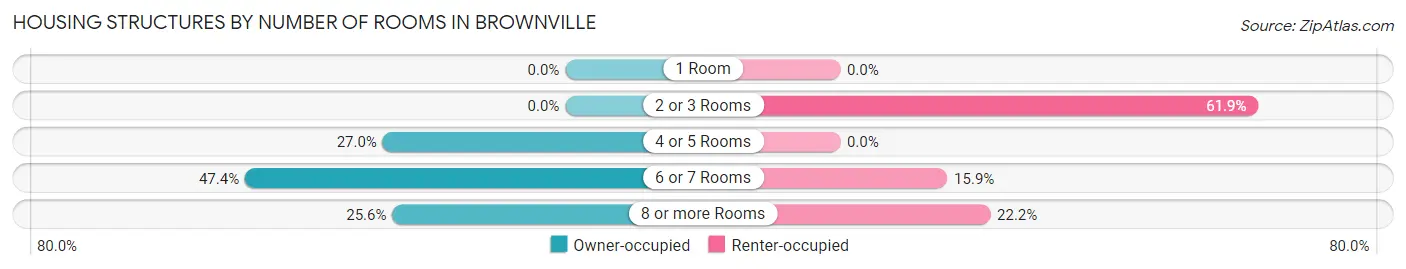
| Number of Rooms | Owner-occupied | Renter-occupied |
| 1 Room | 0 (0.0%) | 0 (0.0%) |
| 2 or 3 Rooms | 0 (0.0%) | 39 (61.9%) |
| 4 or 5 Rooms | 57 (27.0%) | 0 (0.0%) |
| 6 or 7 Rooms | 100 (47.4%) | 10 (15.9%) |
| 8 or more Rooms | 54 (25.6%) | 14 (22.2%) |
| Total | 211 (100.0%) | 63 (100.0%) |
Housing Structure by Heating Type in Brownville
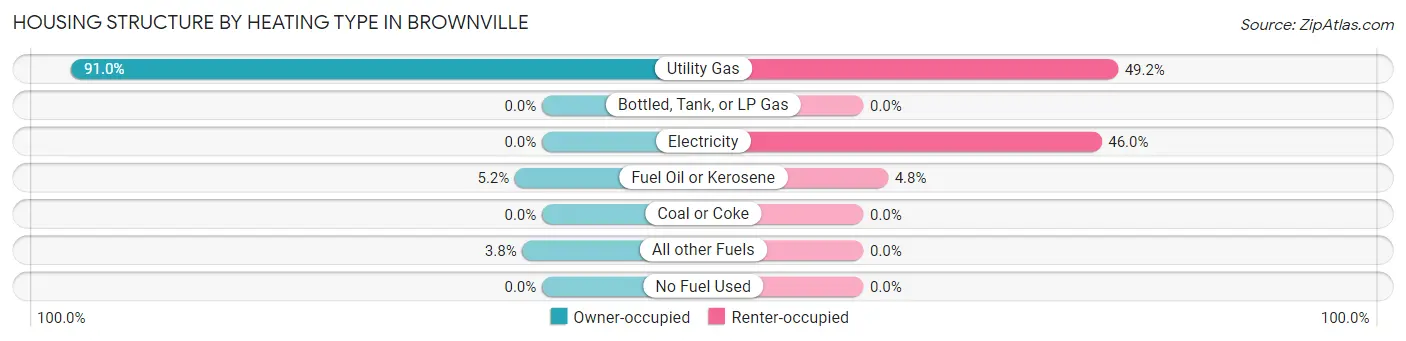
| Heating Type | Owner-occupied | Renter-occupied |
| Utility Gas | 192 (91.0%) | 31 (49.2%) |
| Bottled, Tank, or LP Gas | 0 (0.0%) | 0 (0.0%) |
| Electricity | 0 (0.0%) | 29 (46.0%) |
| Fuel Oil or Kerosene | 11 (5.2%) | 3 (4.8%) |
| Coal or Coke | 0 (0.0%) | 0 (0.0%) |
| All other Fuels | 8 (3.8%) | 0 (0.0%) |
| No Fuel Used | 0 (0.0%) | 0 (0.0%) |
| Total | 211 (100.0%) | 63 (100.0%) |
Household Vehicle Usage in Brownville
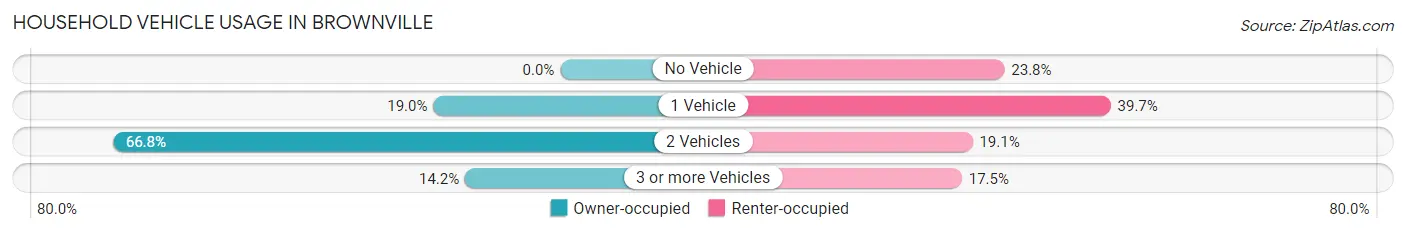
| Vehicles per Household | Owner-occupied | Renter-occupied |
| No Vehicle | 0 (0.0%) | 15 (23.8%) |
| 1 Vehicle | 40 (19.0%) | 25 (39.7%) |
| 2 Vehicles | 141 (66.8%) | 12 (19.1%) |
| 3 or more Vehicles | 30 (14.2%) | 11 (17.5%) |
| Total | 211 (100.0%) | 63 (100.0%) |
Real Estate & Mortgages in Brownville
Real Estate and Mortgage Overview in Brownville
| Characteristic | Without Mortgage | With Mortgage |
| Housing Units | 70 | 141 |
| Median Property Value | $155,600 | $169,200 |
| Median Household Income | $68,846 | $47 |
| Monthly Housing Costs | $630 | $0 |
| Real Estate Taxes | $2,446 | $9 |
Property Value by Mortgage Status in Brownville
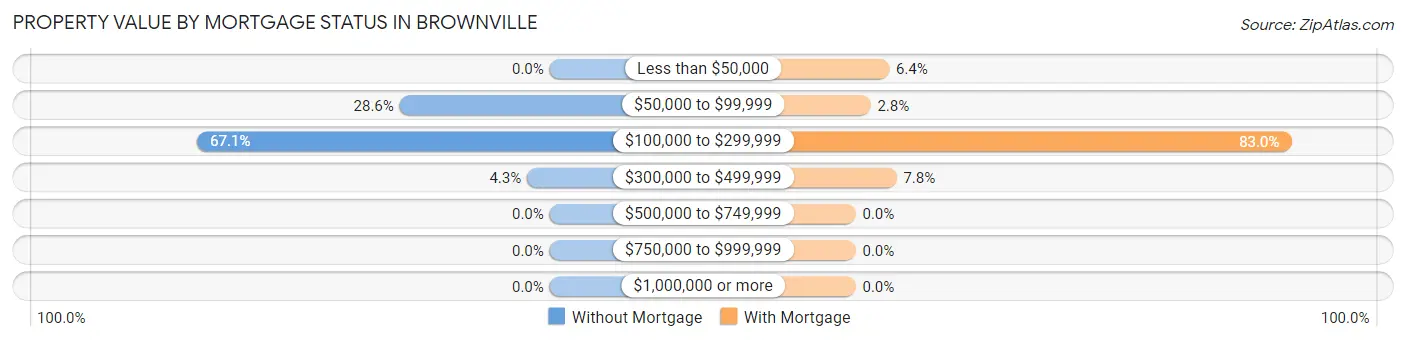
| Property Value | Without Mortgage | With Mortgage |
| Less than $50,000 | 0 (0.0%) | 9 (6.4%) |
| $50,000 to $99,999 | 20 (28.6%) | 4 (2.8%) |
| $100,000 to $299,999 | 47 (67.1%) | 117 (83.0%) |
| $300,000 to $499,999 | 3 (4.3%) | 11 (7.8%) |
| $500,000 to $749,999 | 0 (0.0%) | 0 (0.0%) |
| $750,000 to $999,999 | 0 (0.0%) | 0 (0.0%) |
| $1,000,000 or more | 0 (0.0%) | 0 (0.0%) |
| Total | 70 (100.0%) | 141 (100.0%) |
Household Income by Mortgage Status in Brownville
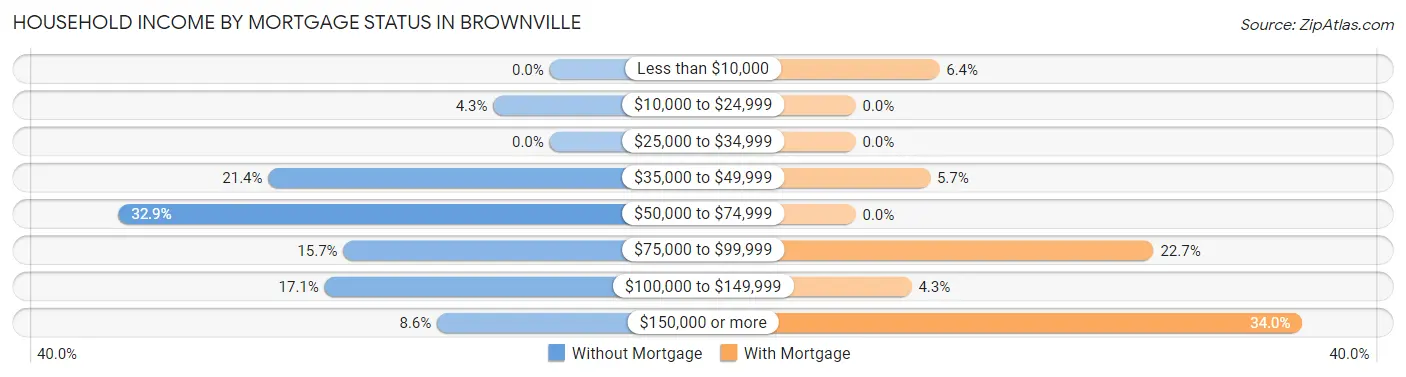
| Household Income | Without Mortgage | With Mortgage |
| Less than $10,000 | 0 (0.0%) | 9 (6.4%) |
| $10,000 to $24,999 | 3 (4.3%) | 0 (0.0%) |
| $25,000 to $34,999 | 0 (0.0%) | 0 (0.0%) |
| $35,000 to $49,999 | 15 (21.4%) | 8 (5.7%) |
| $50,000 to $74,999 | 23 (32.9%) | 0 (0.0%) |
| $75,000 to $99,999 | 11 (15.7%) | 32 (22.7%) |
| $100,000 to $149,999 | 12 (17.1%) | 6 (4.3%) |
| $150,000 or more | 6 (8.6%) | 48 (34.0%) |
| Total | 70 (100.0%) | 141 (100.0%) |
Property Value to Household Income Ratio in Brownville
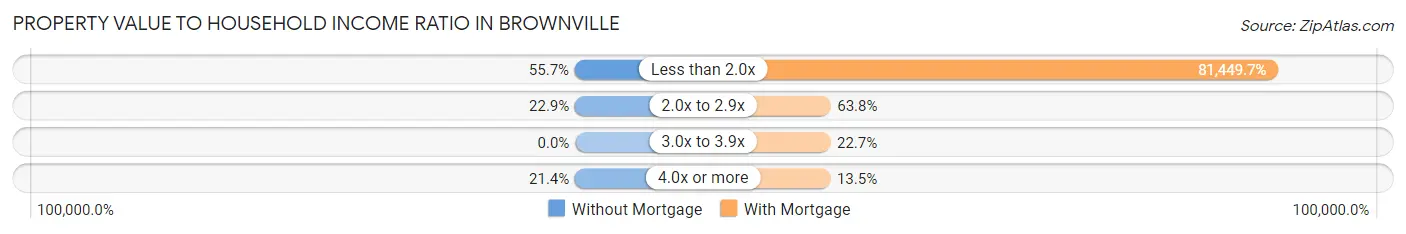
| Value-to-Income Ratio | Without Mortgage | With Mortgage |
| Less than 2.0x | 39 (55.7%) | 114,844 (81,449.6%) |
| 2.0x to 2.9x | 16 (22.9%) | 90 (63.8%) |
| 3.0x to 3.9x | 0 (0.0%) | 32 (22.7%) |
| 4.0x or more | 15 (21.4%) | 19 (13.5%) |
| Total | 70 (100.0%) | 141 (100.0%) |
Real Estate Taxes by Mortgage Status in Brownville
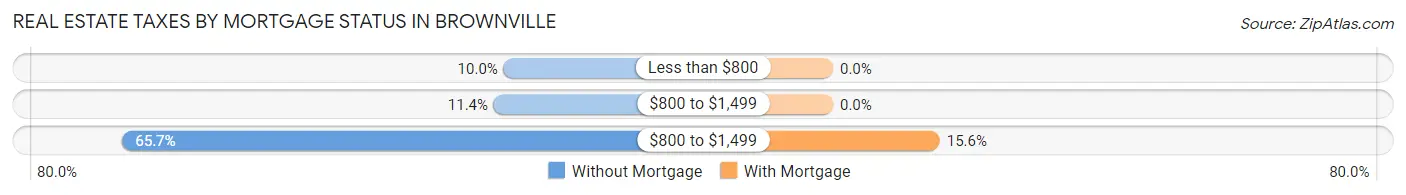
| Property Taxes | Without Mortgage | With Mortgage |
| Less than $800 | 7 (10.0%) | 0 (0.0%) |
| $800 to $1,499 | 8 (11.4%) | 0 (0.0%) |
| $800 to $1,499 | 46 (65.7%) | 22 (15.6%) |
| Total | 70 (100.0%) | 141 (100.0%) |
Health & Disability in Brownville
Health Insurance Coverage by Age in Brownville
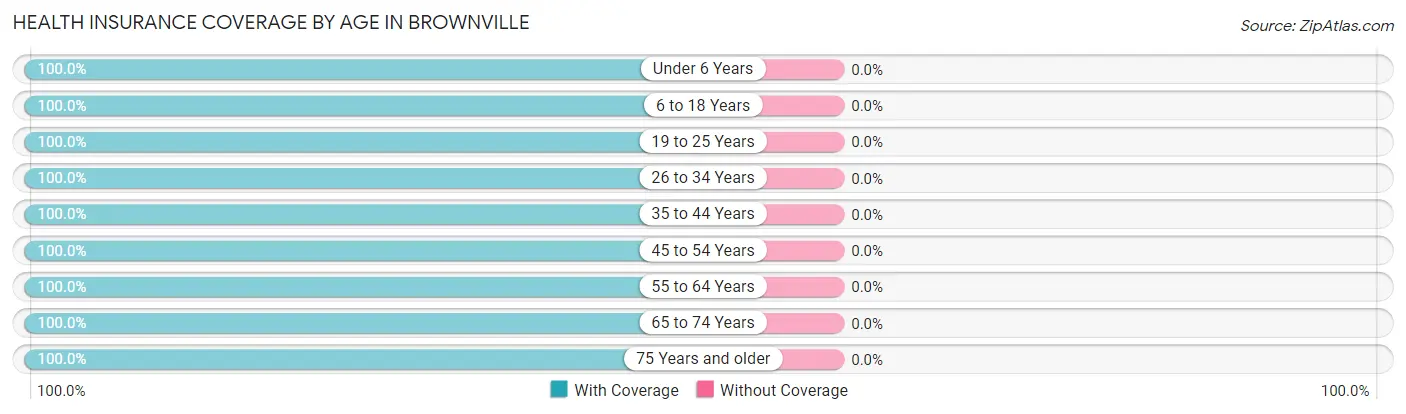
| Age Bracket | With Coverage | Without Coverage |
| Under 6 Years | 12 (100.0%) | 0 (0.0%) |
| 6 to 18 Years | 52 (100.0%) | 0 (0.0%) |
| 19 to 25 Years | 32 (100.0%) | 0 (0.0%) |
| 26 to 34 Years | 87 (100.0%) | 0 (0.0%) |
| 35 to 44 Years | 43 (100.0%) | 0 (0.0%) |
| 45 to 54 Years | 52 (100.0%) | 0 (0.0%) |
| 55 to 64 Years | 193 (100.0%) | 0 (0.0%) |
| 65 to 74 Years | 64 (100.0%) | 0 (0.0%) |
| 75 Years and older | 51 (100.0%) | 0 (0.0%) |
| Total | 586 (100.0%) | 0 (0.0%) |
Health Insurance Coverage by Citizenship Status in Brownville
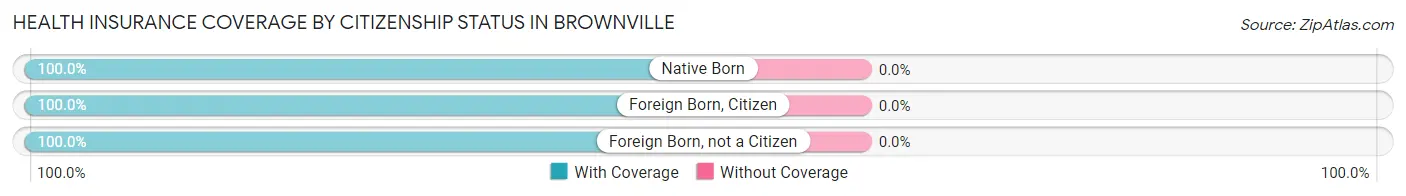
| Citizenship Status | With Coverage | Without Coverage |
| Native Born | 12 (100.0%) | 0 (0.0%) |
| Foreign Born, Citizen | 52 (100.0%) | 0 (0.0%) |
| Foreign Born, not a Citizen | 32 (100.0%) | 0 (0.0%) |
Health Insurance Coverage by Household Income in Brownville
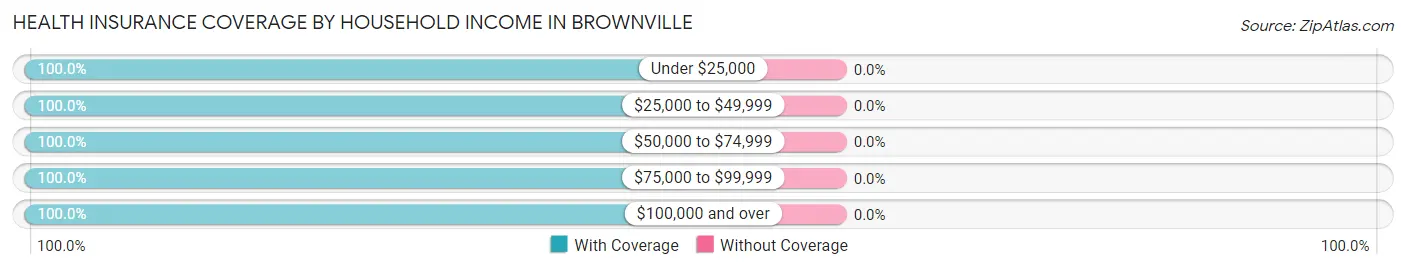
| Household Income | With Coverage | Without Coverage |
| Under $25,000 | 12 (100.0%) | 0 (0.0%) |
| $25,000 to $49,999 | 92 (100.0%) | 0 (0.0%) |
| $50,000 to $74,999 | 126 (100.0%) | 0 (0.0%) |
| $75,000 to $99,999 | 41 (100.0%) | 0 (0.0%) |
| $100,000 and over | 306 (100.0%) | 0 (0.0%) |
Public vs Private Health Insurance Coverage by Age in Brownville
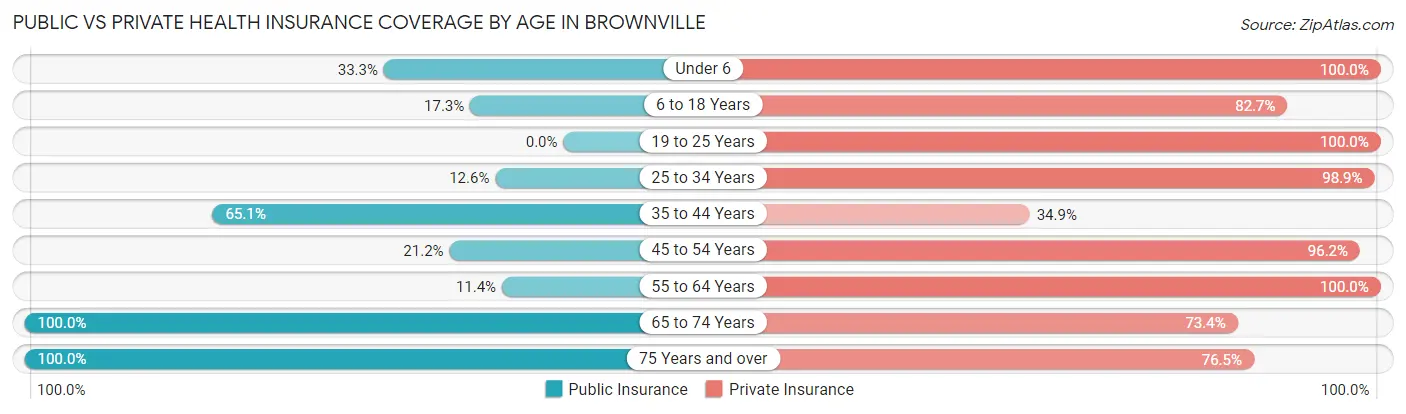
| Age Bracket | Public Insurance | Private Insurance |
| Under 6 | 4 (33.3%) | 12 (100.0%) |
| 6 to 18 Years | 9 (17.3%) | 43 (82.7%) |
| 19 to 25 Years | 0 (0.0%) | 32 (100.0%) |
| 25 to 34 Years | 11 (12.6%) | 86 (98.9%) |
| 35 to 44 Years | 28 (65.1%) | 15 (34.9%) |
| 45 to 54 Years | 11 (21.1%) | 50 (96.2%) |
| 55 to 64 Years | 22 (11.4%) | 193 (100.0%) |
| 65 to 74 Years | 64 (100.0%) | 47 (73.4%) |
| 75 Years and over | 51 (100.0%) | 39 (76.5%) |
| Total | 200 (34.1%) | 517 (88.2%) |
Disability Status by Sex by Age in Brownville
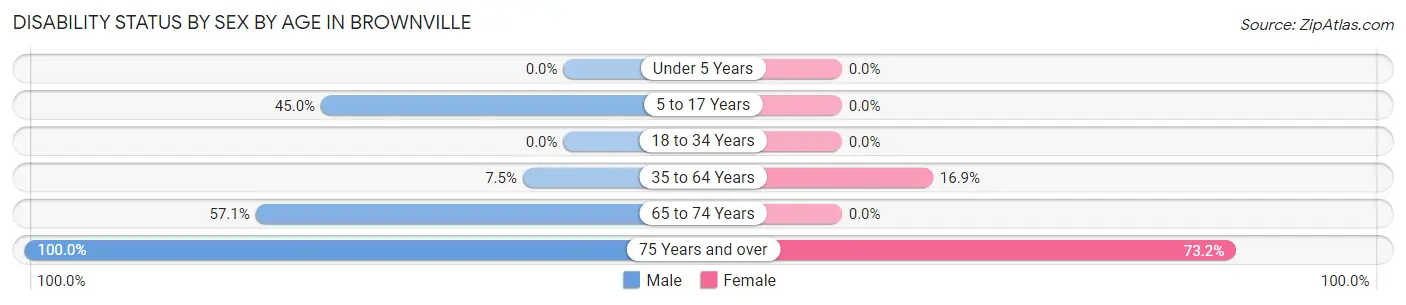
| Age Bracket | Male | Female |
| Under 5 Years | 0 (0.0%) | 0 (0.0%) |
| 5 to 17 Years | 9 (45.0%) | 0 (0.0%) |
| 18 to 34 Years | 0 (0.0%) | 0 (0.0%) |
| 35 to 64 Years | 11 (7.5%) | 24 (16.9%) |
| 65 to 74 Years | 24 (57.1%) | 0 (0.0%) |
| 75 Years and over | 10 (100.0%) | 30 (73.2%) |
Disability Class by Sex by Age in Brownville
Disability Class: Hearing Difficulty
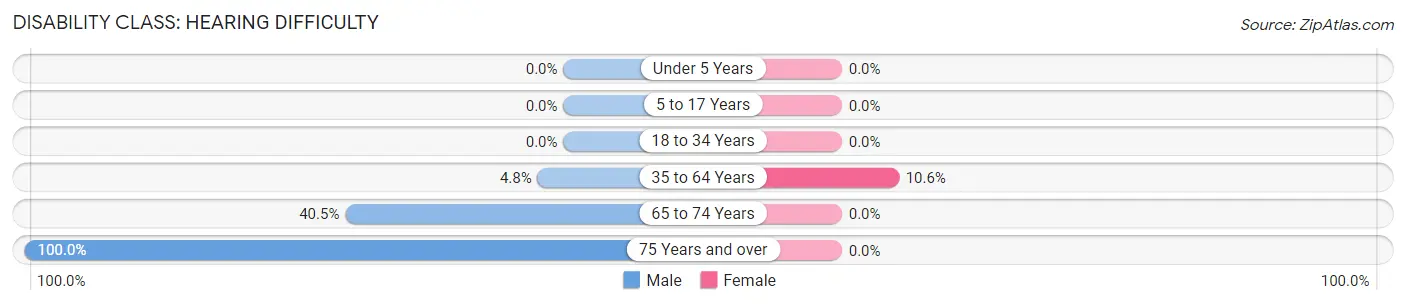
| Age Bracket | Male | Female |
| Under 5 Years | 0 (0.0%) | 0 (0.0%) |
| 5 to 17 Years | 0 (0.0%) | 0 (0.0%) |
| 18 to 34 Years | 0 (0.0%) | 0 (0.0%) |
| 35 to 64 Years | 7 (4.8%) | 15 (10.6%) |
| 65 to 74 Years | 17 (40.5%) | 0 (0.0%) |
| 75 Years and over | 10 (100.0%) | 0 (0.0%) |
Disability Class: Vision Difficulty
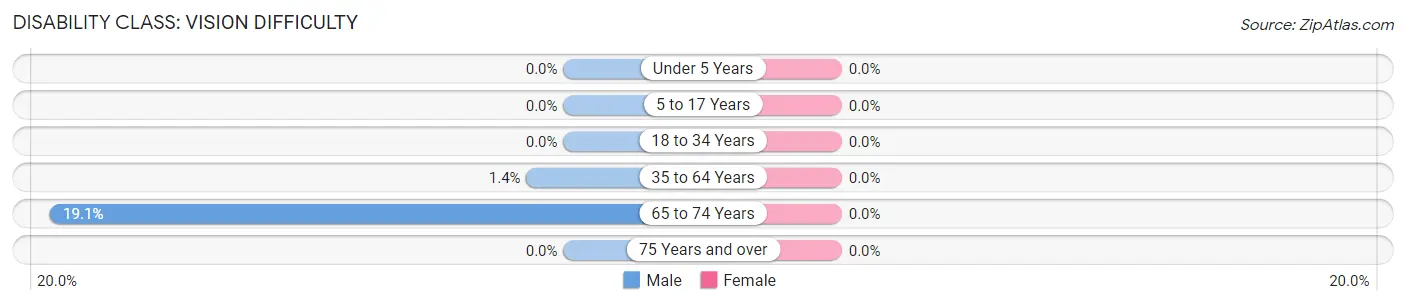
| Age Bracket | Male | Female |
| Under 5 Years | 0 (0.0%) | 0 (0.0%) |
| 5 to 17 Years | 0 (0.0%) | 0 (0.0%) |
| 18 to 34 Years | 0 (0.0%) | 0 (0.0%) |
| 35 to 64 Years | 2 (1.4%) | 0 (0.0%) |
| 65 to 74 Years | 8 (19.1%) | 0 (0.0%) |
| 75 Years and over | 0 (0.0%) | 0 (0.0%) |
Disability Class: Cognitive Difficulty
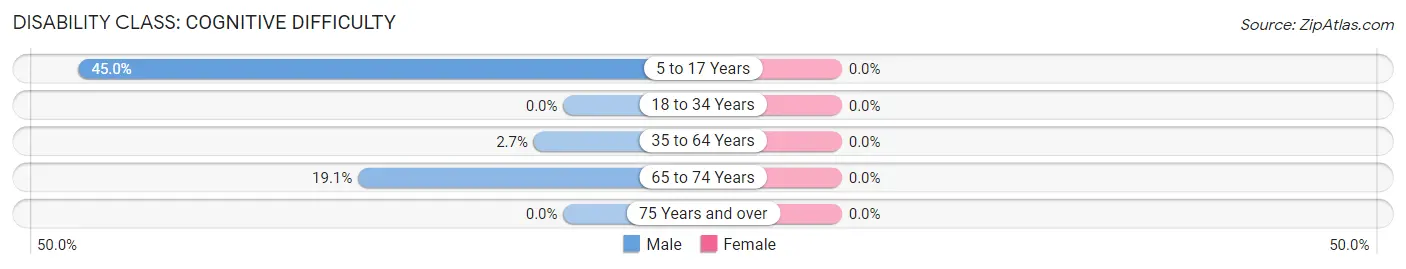
| Age Bracket | Male | Female |
| 5 to 17 Years | 9 (45.0%) | 0 (0.0%) |
| 18 to 34 Years | 0 (0.0%) | 0 (0.0%) |
| 35 to 64 Years | 4 (2.7%) | 0 (0.0%) |
| 65 to 74 Years | 8 (19.1%) | 0 (0.0%) |
| 75 Years and over | 0 (0.0%) | 0 (0.0%) |
Disability Class: Ambulatory Difficulty
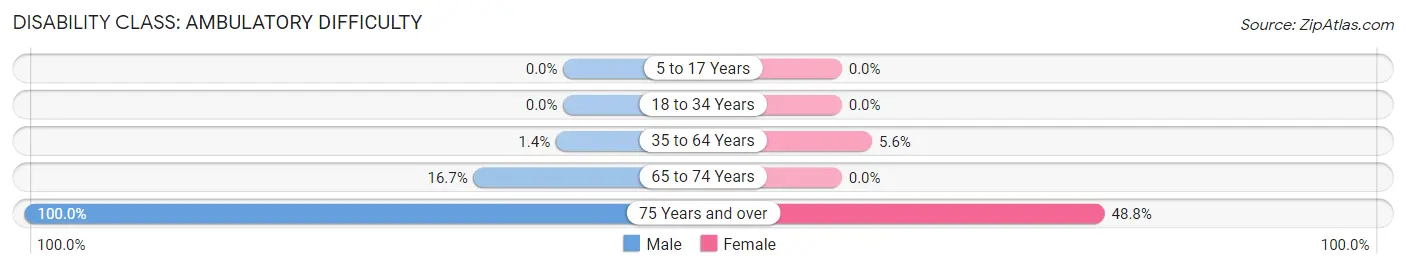
| Age Bracket | Male | Female |
| 5 to 17 Years | 0 (0.0%) | 0 (0.0%) |
| 18 to 34 Years | 0 (0.0%) | 0 (0.0%) |
| 35 to 64 Years | 2 (1.4%) | 8 (5.6%) |
| 65 to 74 Years | 7 (16.7%) | 0 (0.0%) |
| 75 Years and over | 10 (100.0%) | 20 (48.8%) |
Disability Class: Self-Care Difficulty
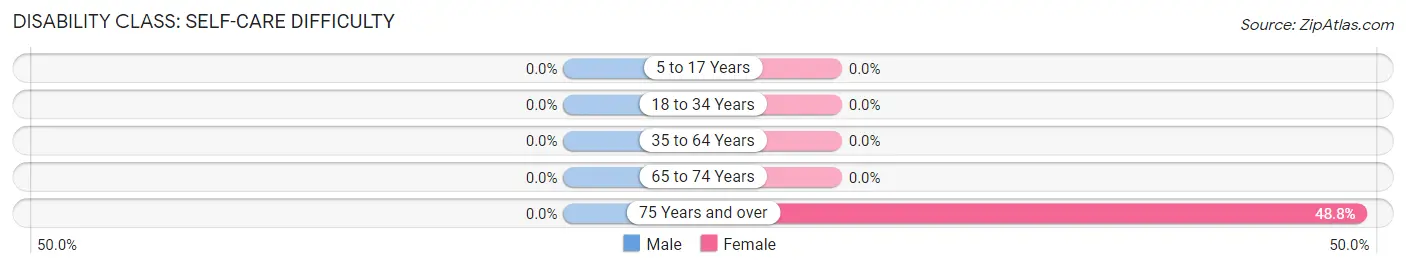
| Age Bracket | Male | Female |
| 5 to 17 Years | 0 (0.0%) | 0 (0.0%) |
| 18 to 34 Years | 0 (0.0%) | 0 (0.0%) |
| 35 to 64 Years | 0 (0.0%) | 0 (0.0%) |
| 65 to 74 Years | 0 (0.0%) | 0 (0.0%) |
| 75 Years and over | 0 (0.0%) | 20 (48.8%) |
Technology Access in Brownville
Computing Device Access in Brownville
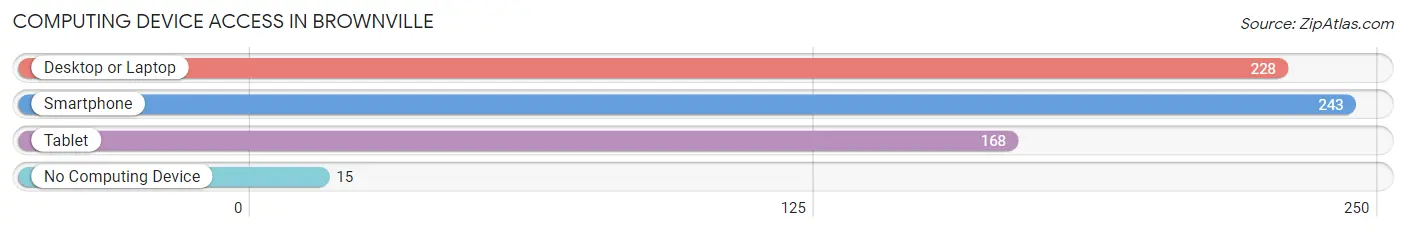
| Device Type | # Households | % Households |
| Desktop or Laptop | 228 | 83.2% |
| Smartphone | 243 | 88.7% |
| Tablet | 168 | 61.3% |
| No Computing Device | 15 | 5.5% |
| Total | 274 | 100.0% |
Internet Access in Brownville
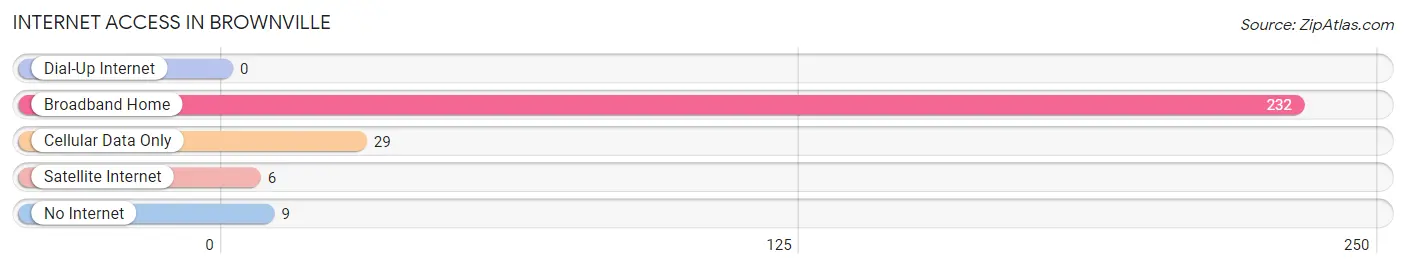
| Internet Type | # Households | % Households |
| Dial-Up Internet | 0 | 0.0% |
| Broadband Home | 232 | 84.7% |
| Cellular Data Only | 29 | 10.6% |
| Satellite Internet | 6 | 2.2% |
| No Internet | 9 | 3.3% |
| Total | 274 | 100.0% |
Brownville Summary
Brownville, NY is a small town located in Jefferson County, New York. It is situated on the eastern shore of Lake Ontario, and is part of the Watertown-Fort Drum Metropolitan Statistical Area. The town was founded in 1802 and has a population of approximately 1,500 people.
History
Brownville was founded in 1802 by William Brown, a Revolutionary War veteran. Brown had purchased the land from the local Native American tribes, and named the town after himself. The town was originally a farming community, and the first settlers were mostly of English and Scottish descent.
In 1812, the town was incorporated as a village. During the War of 1812, the town was the site of a major battle between the British and American forces. The British were defeated, and the town was spared from destruction.
In the mid-1800s, the town began to grow and develop. The first school was built in 1820, and the first church was built in 1825. The first post office was established in 1827.
In the late 1800s, the town began to industrialize. The first factory was built in 1876, and the first railroad line was built in 1881. The railroad connected the town to Watertown, and allowed for the transportation of goods and people.
In the early 1900s, the town continued to grow and develop. The first telephone line was installed in 1902, and the first electric power plant was built in 1906. The first bank was established in 1908, and the first newspaper was published in 1910.
Geography
Brownville is located in the northern part of Jefferson County, New York. It is situated on the eastern shore of Lake Ontario, and is part of the Watertown-Fort Drum Metropolitan Statistical Area. The town is bordered by the towns of Henderson, Lyme, and Clayton.
The town has a total area of 8.2 square miles, of which 8.1 square miles is land and 0.1 square miles is water. The terrain is mostly flat, with some rolling hills. The highest point in the town is located at an elevation of 845 feet.
Economy
The economy of Brownville is largely based on agriculture and tourism. The town is home to several farms, which produce a variety of crops, including corn, soybeans, and hay. The town is also home to several wineries, which produce a variety of wines.
The town is also home to several small businesses, including restaurants, shops, and other services. The town is also home to a small airport, which serves the local area.
Demographics
As of the 2010 census, the population of Brownville was 1,500 people. The racial makeup of the town was 97.3% White, 0.7% African American, 0.3% Native American, 0.3% Asian, and 1.3% from other races. The median household income was $41,250, and the median family income was $50,000.
The town is home to several churches, including the Brownville United Methodist Church, the Brownville Presbyterian Church, and the Brownville Baptist Church. The town is also home to several schools, including the Brownville Elementary School, the Brownville Middle School, and the Brownville High School.
Common Questions
What is Per Capita Income in Brownville?
Per Capita income in Brownville is $45,680.
What is the Median Family Income in Brownville?
Median Family Income in Brownville is $105,972.
What is the Median Household income in Brownville?
Median Household Income in Brownville is $97,794.
What is Income or Wage Gap in Brownville?
Income or Wage Gap in Brownville is 33.3%.
Women in Brownville earn 66.7 cents for every dollar earned by a man.
What is Inequality or Gini Index in Brownville?
Inequality or Gini Index in Brownville is 0.31.
What is the Total Population of Brownville?
Total Population of Brownville is 586.
What is the Total Male Population of Brownville?
Total Male Population of Brownville is 290.
What is the Total Female Population of Brownville?
Total Female Population of Brownville is 296.
What is the Ratio of Males per 100 Females in Brownville?
There are 97.97 Males per 100 Females in Brownville.
What is the Ratio of Females per 100 Males in Brownville?
There are 102.07 Females per 100 Males in Brownville.
What is the Median Population Age in Brownville?
Median Population Age in Brownville is 56.5 Years.
What is the Average Family Size in Brownville
Average Family Size in Brownville is 2.3 People.
What is the Average Household Size in Brownville
Average Household Size in Brownville is 2.1 People.
How Large is the Labor Force in Brownville?
There are 359 People in the Labor Forcein in Brownville.
What is the Percentage of People in the Labor Force in Brownville?
66.9% of People are in the Labor Force in Brownville.