Bridgeport, NY Map & Demographics
Bridgeport Map
Bridgeport Overview
$23,215
PER CAPITA INCOME
$67,526
AVG FAMILY INCOME
$58,491
AVG HOUSEHOLD INCOME
25.2%
WAGE / INCOME GAP [ % ]
74.8¢/ $1
WAGE / INCOME GAP [ $ ]
0.33
INEQUALITY / GINI INDEX
1,551
TOTAL POPULATION
724
MALE POPULATION
827
FEMALE POPULATION
87.55
MALES / 100 FEMALES
114.23
FEMALES / 100 MALES
37.5
MEDIAN AGE
3.2
AVG FAMILY SIZE
2.7
AVG HOUSEHOLD SIZE
627
LABOR FORCE [ PEOPLE ]
59.1%
PERCENT IN LABOR FORCE
0.3%
UNEMPLOYMENT RATE
Bridgeport Zip Codes
Bridgeport Area Codes
Income in Bridgeport
Income Overview in Bridgeport
Per Capita Income in Bridgeport is $23,215, while median incomes of families and households are $67,526 and $58,491 respectively.
| Characteristic | Number | Measure |
| Per Capita Income | 1,551 | $23,215 |
| Median Family Income | 391 | $67,526 |
| Mean Family Income | 391 | $64,323 |
| Median Household Income | 576 | $58,491 |
| Mean Household Income | 576 | $61,034 |
| Income Deficit | 391 | $0 |
| Wage / Income Gap (%) | 1,551 | 25.25% |
| Wage / Income Gap ($) | 1,551 | 74.75¢ per $1 |
| Gini / Inequality Index | 1,551 | 0.33 |
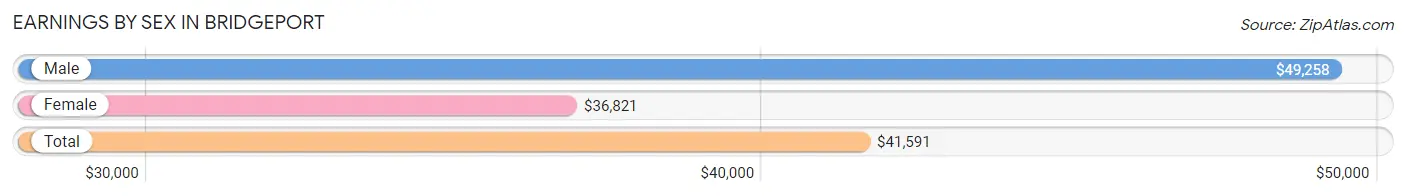
Earnings by Sex in Bridgeport
Average Earnings in Bridgeport are $41,591, $49,258 for men and $36,821 for women, a difference of 25.3%.
| Sex | Number | Average Earnings |
| Male | 293 (46.5%) | $49,258 |
| Female | 337 (53.5%) | $36,821 |
| Total | 630 (100.0%) | $41,591 |
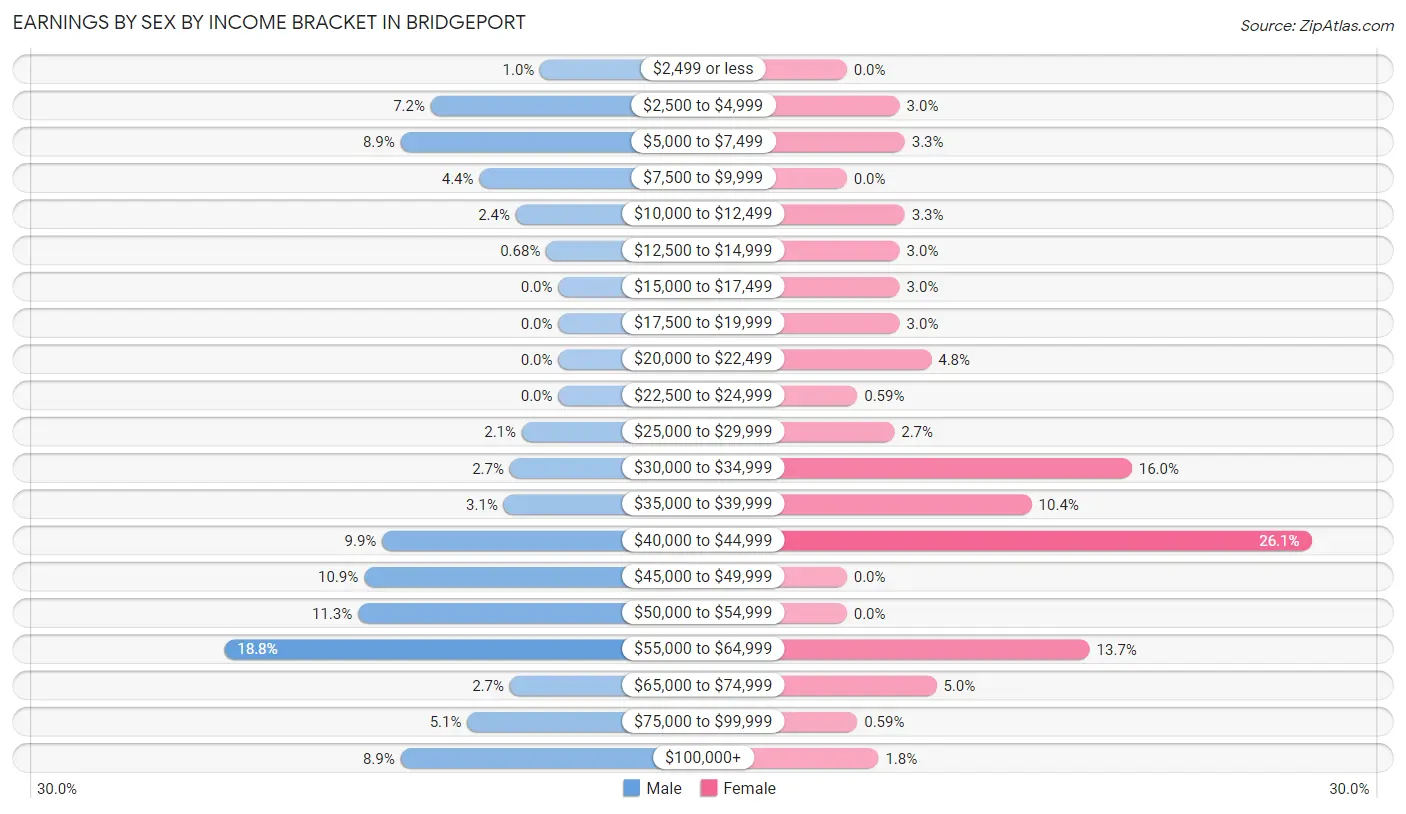
Earnings by Sex by Income Bracket in Bridgeport
The most common earnings brackets in Bridgeport are $55,000 to $64,999 for men (55 | 18.8%) and $40,000 to $44,999 for women (88 | 26.1%).
| Income | Male | Female |
| $2,499 or less | 3 (1.0%) | 0 (0.0%) |
| $2,500 to $4,999 | 21 (7.2%) | 10 (3.0%) |
| $5,000 to $7,499 | 26 (8.9%) | 11 (3.3%) |
| $7,500 to $9,999 | 13 (4.4%) | 0 (0.0%) |
| $10,000 to $12,499 | 7 (2.4%) | 11 (3.3%) |
| $12,500 to $14,999 | 2 (0.7%) | 10 (3.0%) |
| $15,000 to $17,499 | 0 (0.0%) | 10 (3.0%) |
| $17,500 to $19,999 | 0 (0.0%) | 10 (3.0%) |
| $20,000 to $22,499 | 0 (0.0%) | 16 (4.8%) |
| $22,500 to $24,999 | 0 (0.0%) | 2 (0.6%) |
| $25,000 to $29,999 | 6 (2.1%) | 9 (2.7%) |
| $30,000 to $34,999 | 8 (2.7%) | 54 (16.0%) |
| $35,000 to $39,999 | 9 (3.1%) | 35 (10.4%) |
| $40,000 to $44,999 | 29 (9.9%) | 88 (26.1%) |
| $45,000 to $49,999 | 32 (10.9%) | 0 (0.0%) |
| $50,000 to $54,999 | 33 (11.3%) | 0 (0.0%) |
| $55,000 to $64,999 | 55 (18.8%) | 46 (13.7%) |
| $65,000 to $74,999 | 8 (2.7%) | 17 (5.0%) |
| $75,000 to $99,999 | 15 (5.1%) | 2 (0.6%) |
| $100,000+ | 26 (8.9%) | 6 (1.8%) |
| Total | 293 (100.0%) | 337 (100.0%) |
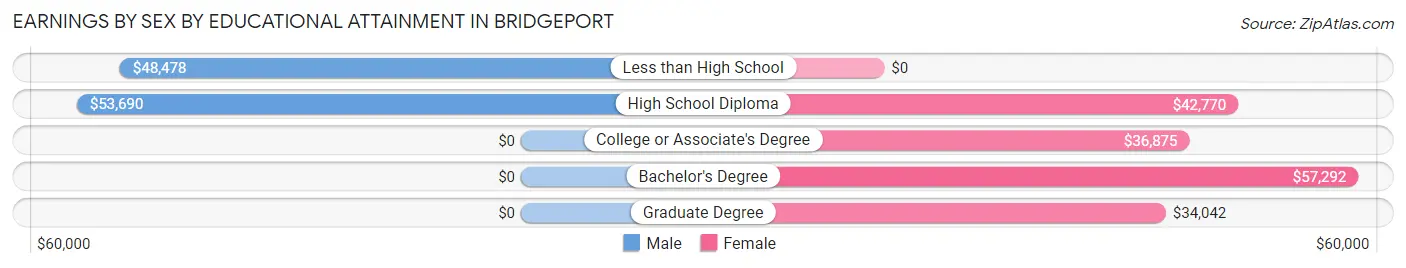
Earnings by Sex by Educational Attainment in Bridgeport
Average earnings in Bridgeport are $49,766 for men and $36,964 for women, a difference of 25.7%. Men with an educational attainment of high school diploma enjoy the highest average annual earnings of $53,690, while those with less than high school education earn the least with $48,478. Women with an educational attainment of bachelor's degree earn the most with the average annual earnings of $57,292, while those with graduate degree education have the smallest earnings of $34,042.
| Educational Attainment | Male Income | Female Income |
| Less than High School | $48,478 | $0 |
| High School Diploma | $53,690 | $42,770 |
| College or Associate's Degree | - | - |
| Bachelor's Degree | - | - |
| Graduate Degree | - | - |
| Total | $49,766 | $36,964 |
Family Income in Bridgeport
Family Income Brackets in Bridgeport
According to the Bridgeport family income data, there are 109 families falling into the $75,000 to $99,999 income range, which is the most common income bracket and makes up 27.9% of all families.
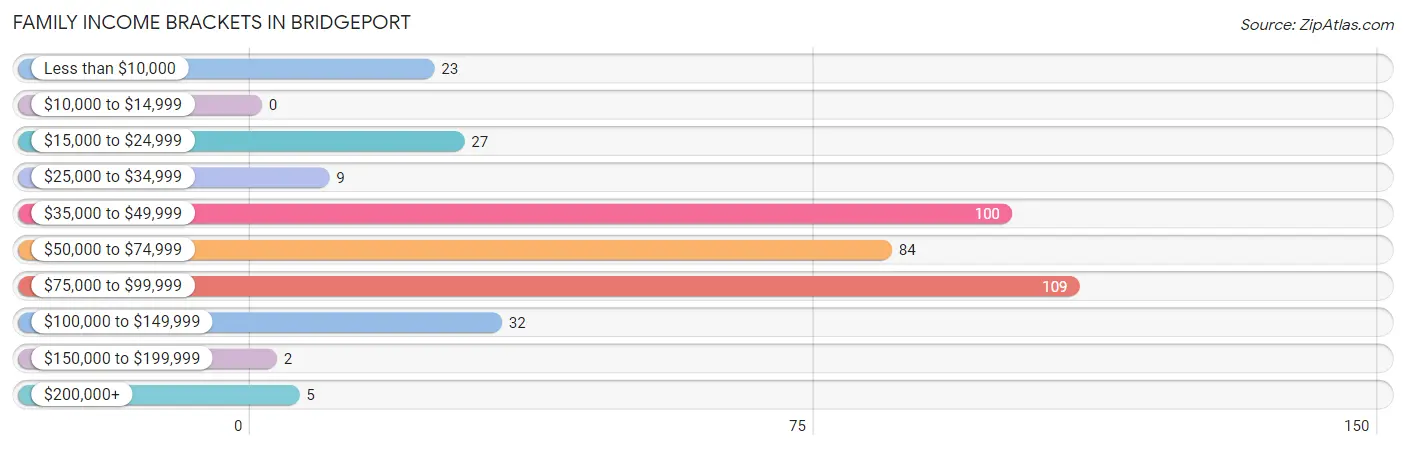
| Income Bracket | # Families | % Families |
| Less than $10,000 | 23 | 5.9% |
| $10,000 to $14,999 | 0 | 0.0% |
| $15,000 to $24,999 | 27 | 6.9% |
| $25,000 to $34,999 | 9 | 2.3% |
| $35,000 to $49,999 | 100 | 25.6% |
| $50,000 to $74,999 | 84 | 21.5% |
| $75,000 to $99,999 | 109 | 27.9% |
| $100,000 to $149,999 | 32 | 8.2% |
| $150,000 to $199,999 | 2 | 0.5% |
| $200,000+ | 5 | 1.3% |
Family Income by Famaliy Size in Bridgeport
4-person families (37 | 9.5%) account for the highest median family income in Bridgeport with $83,578 per family, while 2-person families (172 | 44.0%) have the highest median income of $33,869 per family member.
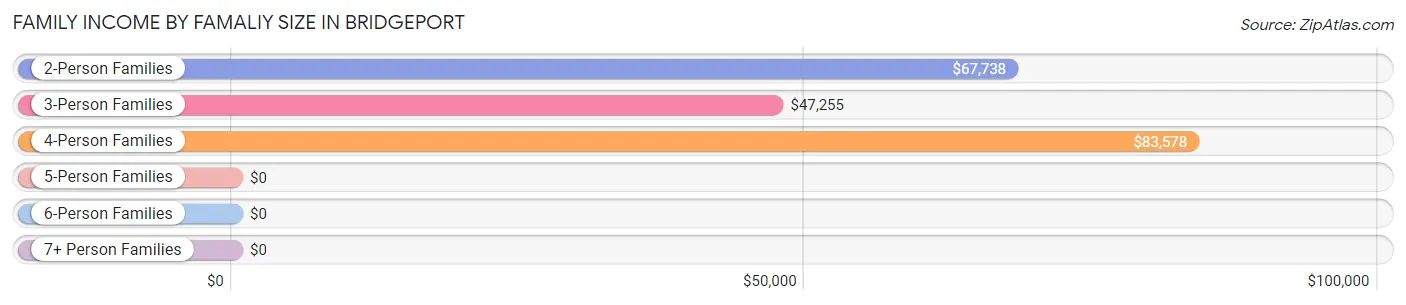
| Income Bracket | # Families | Median Income |
| 2-Person Families | 172 (44.0%) | $67,738 |
| 3-Person Families | 110 (28.1%) | $47,255 |
| 4-Person Families | 37 (9.5%) | $83,578 |
| 5-Person Families | 56 (14.3%) | $0 |
| 6-Person Families | 5 (1.3%) | $0 |
| 7+ Person Families | 11 (2.8%) | $0 |
| Total | 391 (100.0%) | $67,526 |
Family Income by Number of Earners in Bridgeport
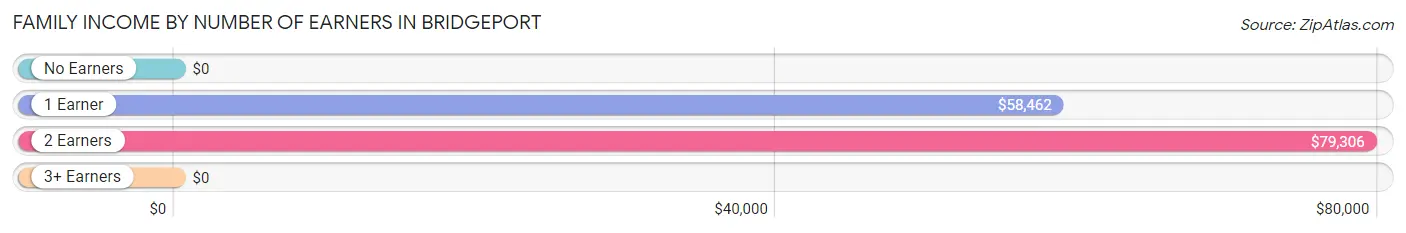
| Number of Earners | # Families | Median Income |
| No Earners | 79 (20.2%) | $0 |
| 1 Earner | 200 (51.1%) | $58,462 |
| 2 Earners | 105 (26.9%) | $79,306 |
| 3+ Earners | 7 (1.8%) | $0 |
| Total | 391 (100.0%) | $67,526 |
Household Income in Bridgeport
Household Income Brackets in Bridgeport
With 144 households falling in the category, the $50,000 to $74,999 income range is the most frequent in Bridgeport, accounting for 25.0% of all households. In contrast, only 5 households (0.9%) fall into the $200,000+ income bracket, making it the least populous group.
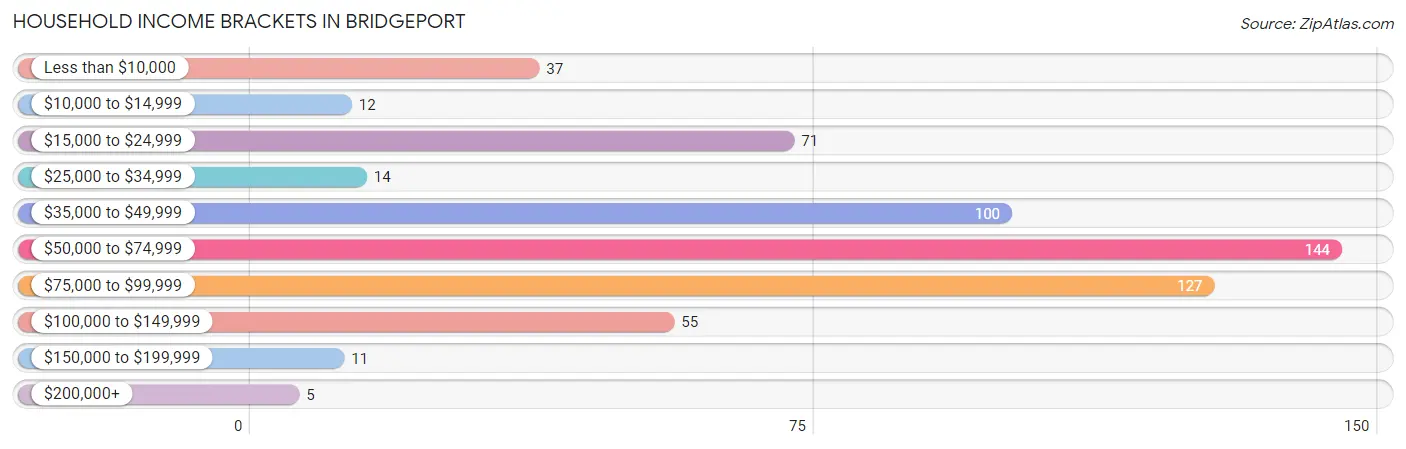
| Income Bracket | # Households | % Households |
| Less than $10,000 | 37 | 6.4% |
| $10,000 to $14,999 | 12 | 2.1% |
| $15,000 to $24,999 | 71 | 12.3% |
| $25,000 to $34,999 | 14 | 2.4% |
| $35,000 to $49,999 | 100 | 17.4% |
| $50,000 to $74,999 | 144 | 25.0% |
| $75,000 to $99,999 | 127 | 22.0% |
| $100,000 to $149,999 | 55 | 9.5% |
| $150,000 to $199,999 | 11 | 1.9% |
| $200,000+ | 5 | 0.9% |
Household Income by Householder Age in Bridgeport
The median household income in Bridgeport is $58,491, with the highest median household income of $84,957 found in the 25 to 44 years age bracket for the primary householder. A total of 151 households (26.2%) fall into this category. Meanwhile, the 15 to 24 years age bracket for the primary householder has the lowest median household income of $0, with 7 households (1.2%) in this group.
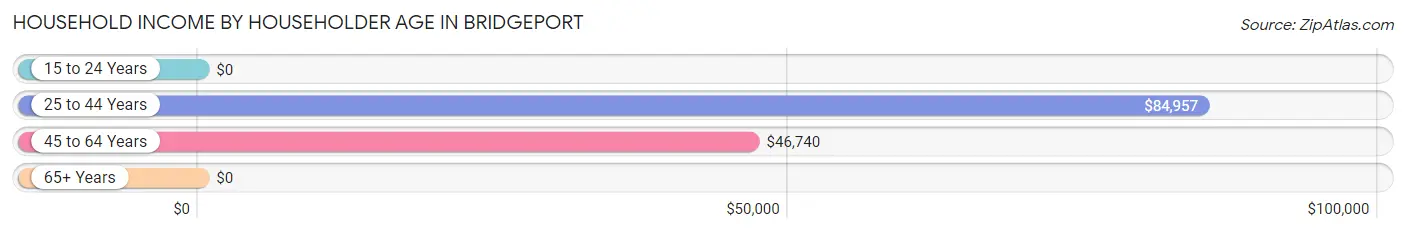
| Income Bracket | # Households | Median Income |
| 15 to 24 Years | 7 (1.2%) | $0 |
| 25 to 44 Years | 151 (26.2%) | $84,957 |
| 45 to 64 Years | 281 (48.8%) | $46,740 |
| 65+ Years | 137 (23.8%) | $0 |
| Total | 576 (100.0%) | $58,491 |
Poverty in Bridgeport
Income Below Poverty by Sex and Age in Bridgeport
With 7.3% poverty level for males and 4.6% for females among the residents of Bridgeport, 75 year old and over males and 75 year old and over females are the most vulnerable to poverty, with 11 males (50.0%) and 10 females (32.3%) in their respective age groups living below the poverty level.
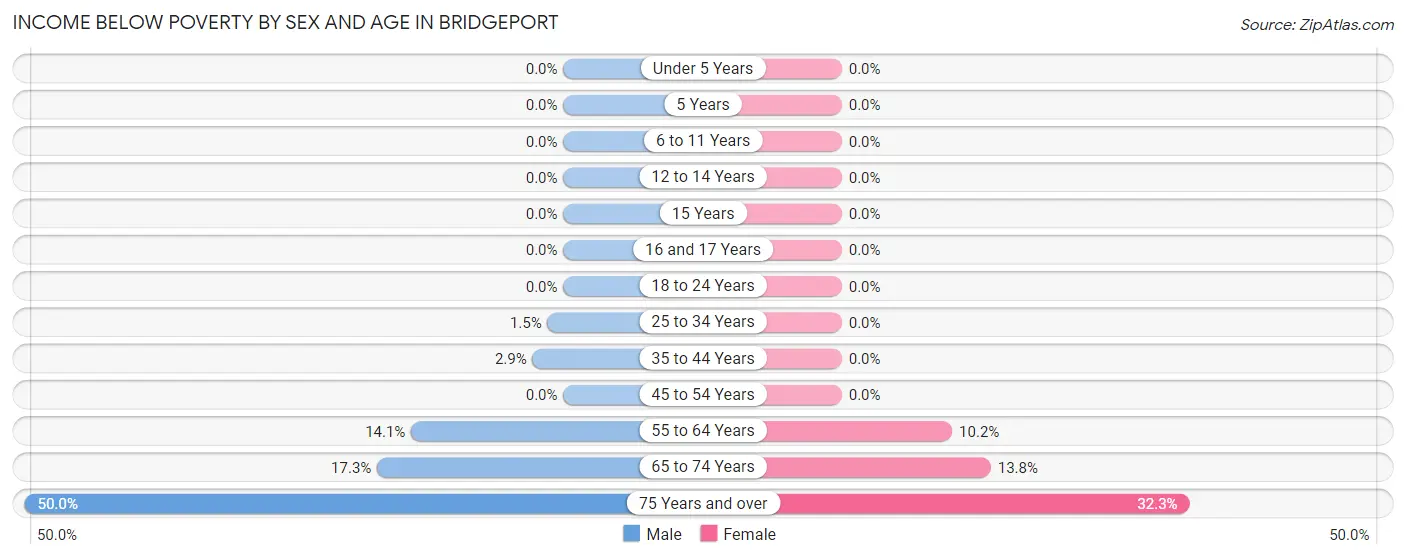
| Age Bracket | Male | Female |
| Under 5 Years | 0 (0.0%) | 0 (0.0%) |
| 5 Years | 0 (0.0%) | 0 (0.0%) |
| 6 to 11 Years | 0 (0.0%) | 0 (0.0%) |
| 12 to 14 Years | 0 (0.0%) | 0 (0.0%) |
| 15 Years | 0 (0.0%) | 0 (0.0%) |
| 16 and 17 Years | 0 (0.0%) | 0 (0.0%) |
| 18 to 24 Years | 0 (0.0%) | 0 (0.0%) |
| 25 to 34 Years | 1 (1.5%) | 0 (0.0%) |
| 35 to 44 Years | 2 (2.9%) | 0 (0.0%) |
| 45 to 54 Years | 0 (0.0%) | 0 (0.0%) |
| 55 to 64 Years | 25 (14.1%) | 13 (10.2%) |
| 65 to 74 Years | 14 (17.3%) | 13 (13.8%) |
| 75 Years and over | 11 (50.0%) | 10 (32.3%) |
| Total | 53 (7.3%) | 36 (4.6%) |
Income Above Poverty by Sex and Age in Bridgeport
According to the poverty statistics in Bridgeport, males aged under 5 years and females aged under 5 years are the age groups that are most secure financially, with 100.0% of males and 100.0% of females in these age groups living above the poverty line.
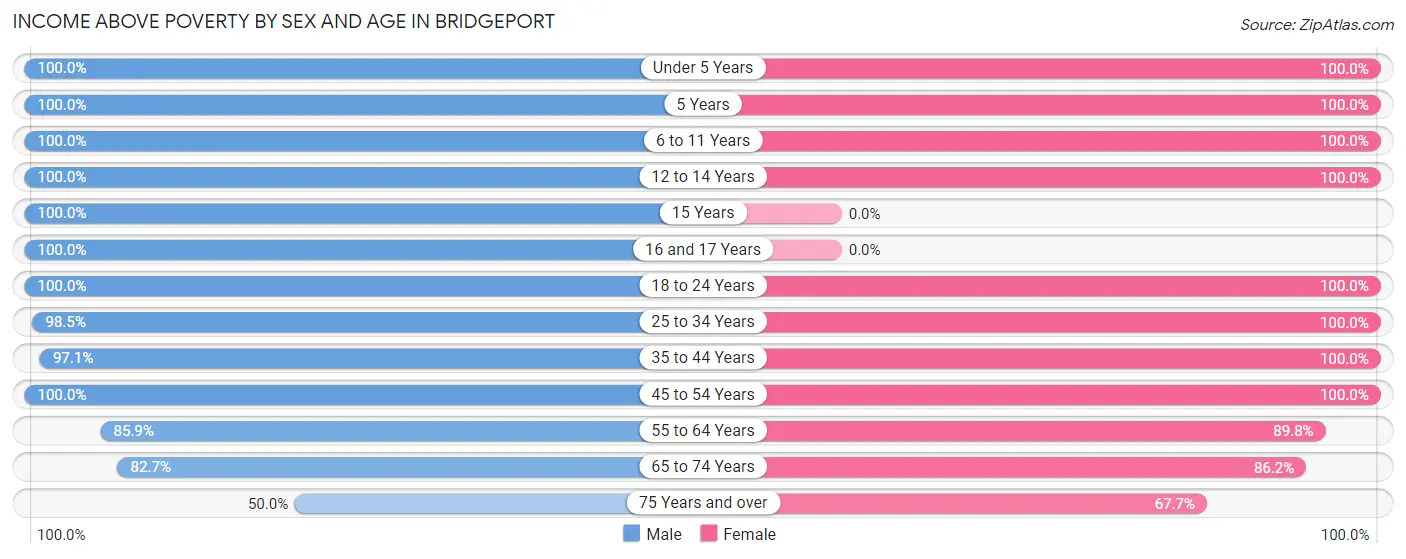
| Age Bracket | Male | Female |
| Under 5 Years | 74 (100.0%) | 38 (100.0%) |
| 5 Years | 51 (100.0%) | 25 (100.0%) |
| 6 to 11 Years | 68 (100.0%) | 59 (100.0%) |
| 12 to 14 Years | 41 (100.0%) | 76 (100.0%) |
| 15 Years | 13 (100.0%) | 0 (0.0%) |
| 16 and 17 Years | 18 (100.0%) | 0 (0.0%) |
| 18 to 24 Years | 13 (100.0%) | 4 (100.0%) |
| 25 to 34 Years | 67 (98.5%) | 134 (100.0%) |
| 35 to 44 Years | 68 (97.1%) | 87 (100.0%) |
| 45 to 54 Years | 28 (100.0%) | 107 (100.0%) |
| 55 to 64 Years | 152 (85.9%) | 114 (89.8%) |
| 65 to 74 Years | 67 (82.7%) | 81 (86.2%) |
| 75 Years and over | 11 (50.0%) | 21 (67.7%) |
| Total | 671 (92.7%) | 746 (95.4%) |
Income Below Poverty Among Married-Couple Families in Bridgeport
The poverty statistics for married-couple families in Bridgeport show that 8.4% or 23 of the total 274 families live below the poverty line. Families with no children have the highest poverty rate of 17.6%, comprising of 23 families. On the other hand, families with 1 or 2 children have the lowest poverty rate of 0.0%, which includes 0 families.
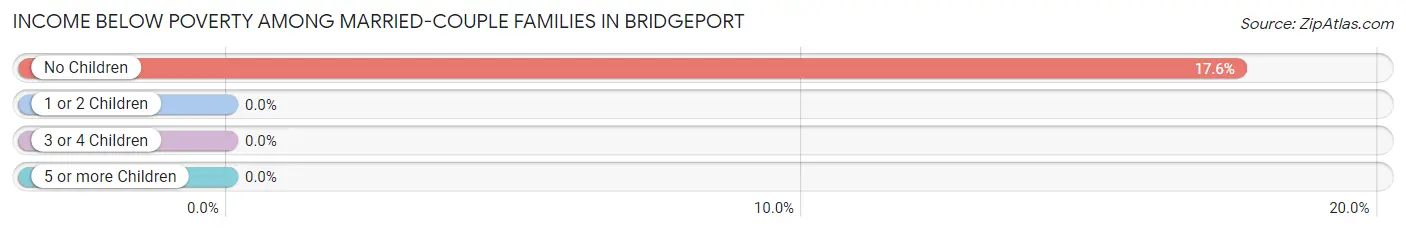
| Children | Above Poverty | Below Poverty |
| No Children | 108 (82.4%) | 23 (17.6%) |
| 1 or 2 Children | 76 (100.0%) | 0 (0.0%) |
| 3 or 4 Children | 56 (100.0%) | 0 (0.0%) |
| 5 or more Children | 11 (100.0%) | 0 (0.0%) |
| Total | 251 (91.6%) | 23 (8.4%) |
Income Below Poverty Among Single-Parent Households in Bridgeport
| Children | Single Father | Single Mother |
| No Children | 0 (0.0%) | 0 (0.0%) |
| 1 or 2 Children | 0 (0.0%) | 0 (0.0%) |
| 3 or 4 Children | 0 (0.0%) | 0 (0.0%) |
| 5 or more Children | 0 (0.0%) | 0 (0.0%) |
| Total | 0 (0.0%) | 0 (0.0%) |
Income Below Poverty Among Married-Couple vs Single-Parent Households in Bridgeport
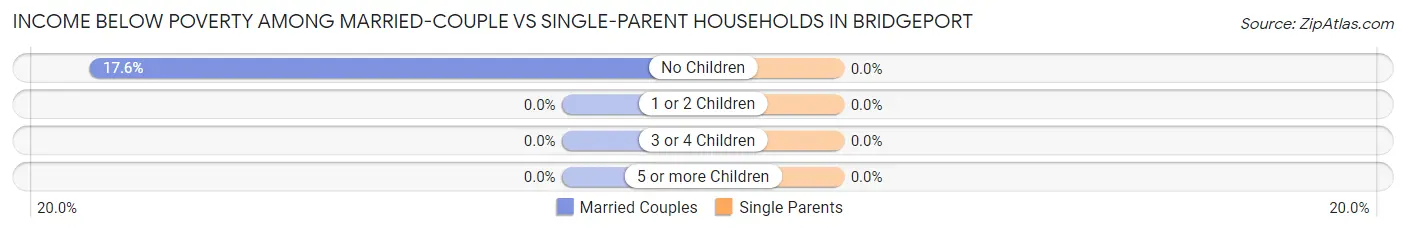
| Children | Married-Couple Families | Single-Parent Households |
| No Children | 23 (17.6%) | 0 (0.0%) |
| 1 or 2 Children | 0 (0.0%) | 0 (0.0%) |
| 3 or 4 Children | 0 (0.0%) | 0 (0.0%) |
| 5 or more Children | 0 (0.0%) | 0 (0.0%) |
| Total | 23 (8.4%) | 0 (0.0%) |
Race in Bridgeport
The most populous races in Bridgeport are White / Caucasian (1,382 | 89.1%), Two or more Races (128 | 8.3%), and Asian (34 | 2.2%).
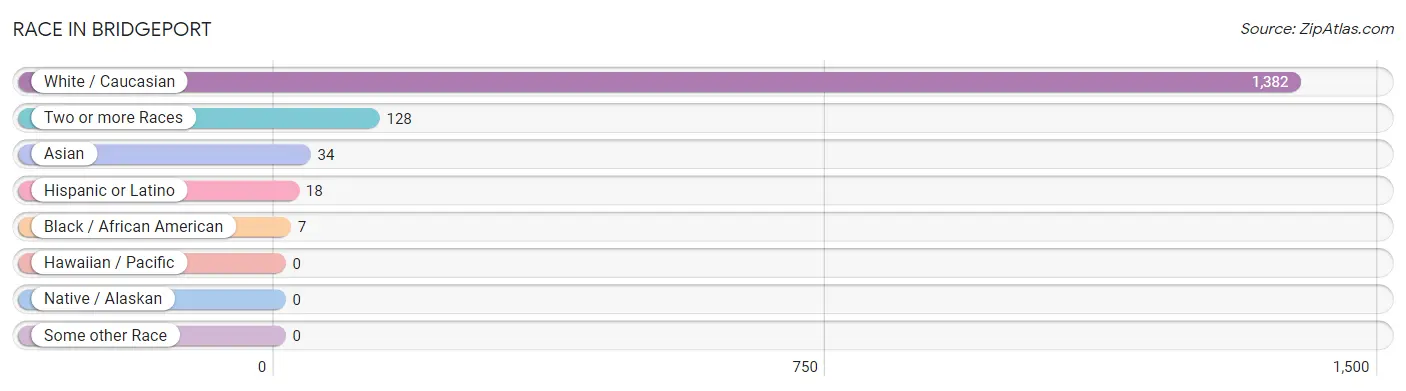
| Race | # Population | % Population |
| Asian | 34 | 2.2% |
| Black / African American | 7 | 0.4% |
| Hawaiian / Pacific | 0 | 0.0% |
| Hispanic or Latino | 18 | 1.2% |
| Native / Alaskan | 0 | 0.0% |
| White / Caucasian | 1,382 | 89.1% |
| Two or more Races | 128 | 8.3% |
| Some other Race | 0 | 0.0% |
| Total | 1,551 | 100.0% |
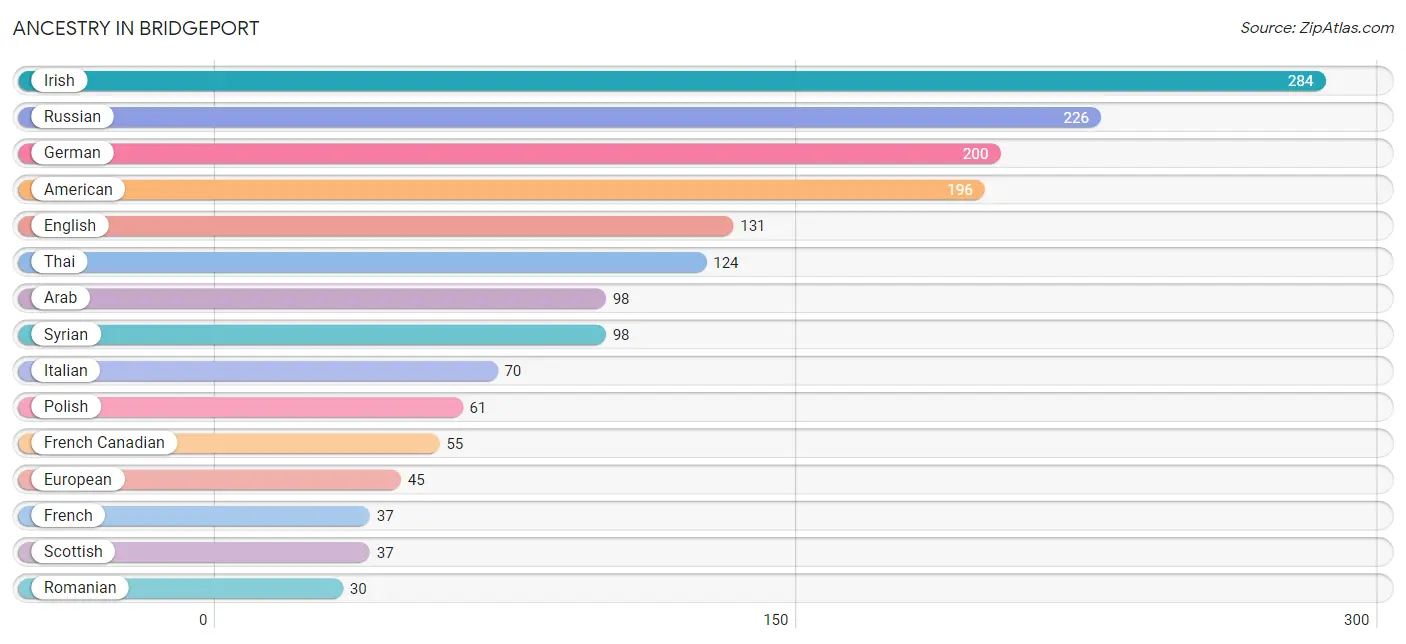
Ancestry in Bridgeport
The most populous ancestries reported in Bridgeport are Irish (284 | 18.3%), Russian (226 | 14.6%), German (200 | 12.9%), American (196 | 12.6%), and English (131 | 8.5%), together accounting for 66.9% of all Bridgeport residents.
| Ancestry | # Population | % Population |
| American | 196 | 12.6% |
| Arab | 98 | 6.3% |
| Dominican | 10 | 0.6% |
| Dutch | 1 | 0.1% |
| English | 131 | 8.5% |
| European | 45 | 2.9% |
| French | 37 | 2.4% |
| French Canadian | 55 | 3.5% |
| German | 200 | 12.9% |
| Haitian | 1 | 0.1% |
| Hungarian | 1 | 0.1% |
| Indian (Asian) | 8 | 0.5% |
| Irish | 284 | 18.3% |
| Iroquois | 6 | 0.4% |
| Israeli | 26 | 1.7% |
| Italian | 70 | 4.5% |
| Mexican | 1 | 0.1% |
| Norwegian | 9 | 0.6% |
| Polish | 61 | 3.9% |
| Puerto Rican | 2 | 0.1% |
| Romanian | 30 | 1.9% |
| Russian | 226 | 14.6% |
| Scotch-Irish | 16 | 1.0% |
| Scottish | 37 | 2.4% |
| Spanish | 5 | 0.3% |
| Syrian | 98 | 6.3% |
| Thai | 124 | 8.0% |
| Ukrainian | 20 | 1.3% | View All 28 Rows |
Immigrants in Bridgeport
The most numerous immigrant groups reported in Bridgeport came from Asia (60 | 3.9%), India (26 | 1.7%), South Central Asia (26 | 1.7%), Syria (26 | 1.7%), and Western Asia (26 | 1.7%), together accounting for 10.6% of all Bridgeport residents.
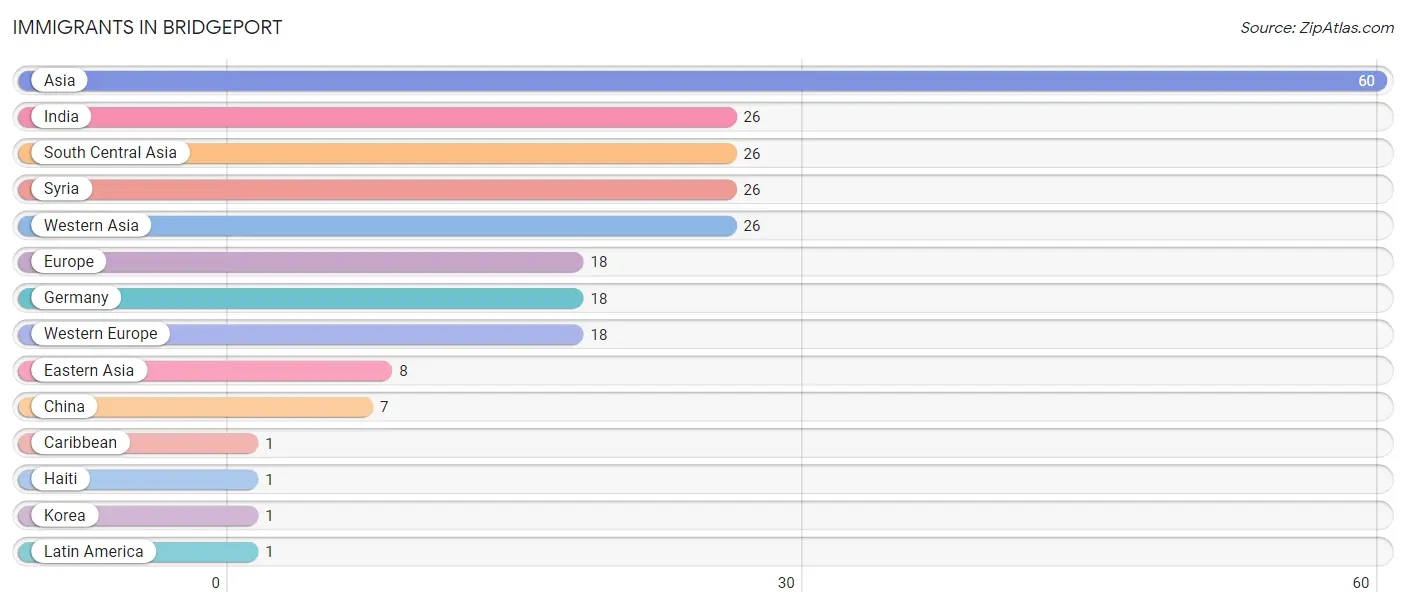
| Immigration Origin | # Population | % Population |
| Asia | 60 | 3.9% |
| Caribbean | 1 | 0.1% |
| China | 7 | 0.4% |
| Eastern Asia | 8 | 0.5% |
| Europe | 18 | 1.2% |
| Germany | 18 | 1.2% |
| Haiti | 1 | 0.1% |
| India | 26 | 1.7% |
| Korea | 1 | 0.1% |
| Latin America | 1 | 0.1% |
| South Central Asia | 26 | 1.7% |
| Syria | 26 | 1.7% |
| Western Asia | 26 | 1.7% |
| Western Europe | 18 | 1.2% | View All 14 Rows |
Sex and Age in Bridgeport
Sex and Age in Bridgeport
The most populous age groups in Bridgeport are 10 to 14 Years (109 | 15.1%) for men and 25 to 29 Years (123 | 14.9%) for women.
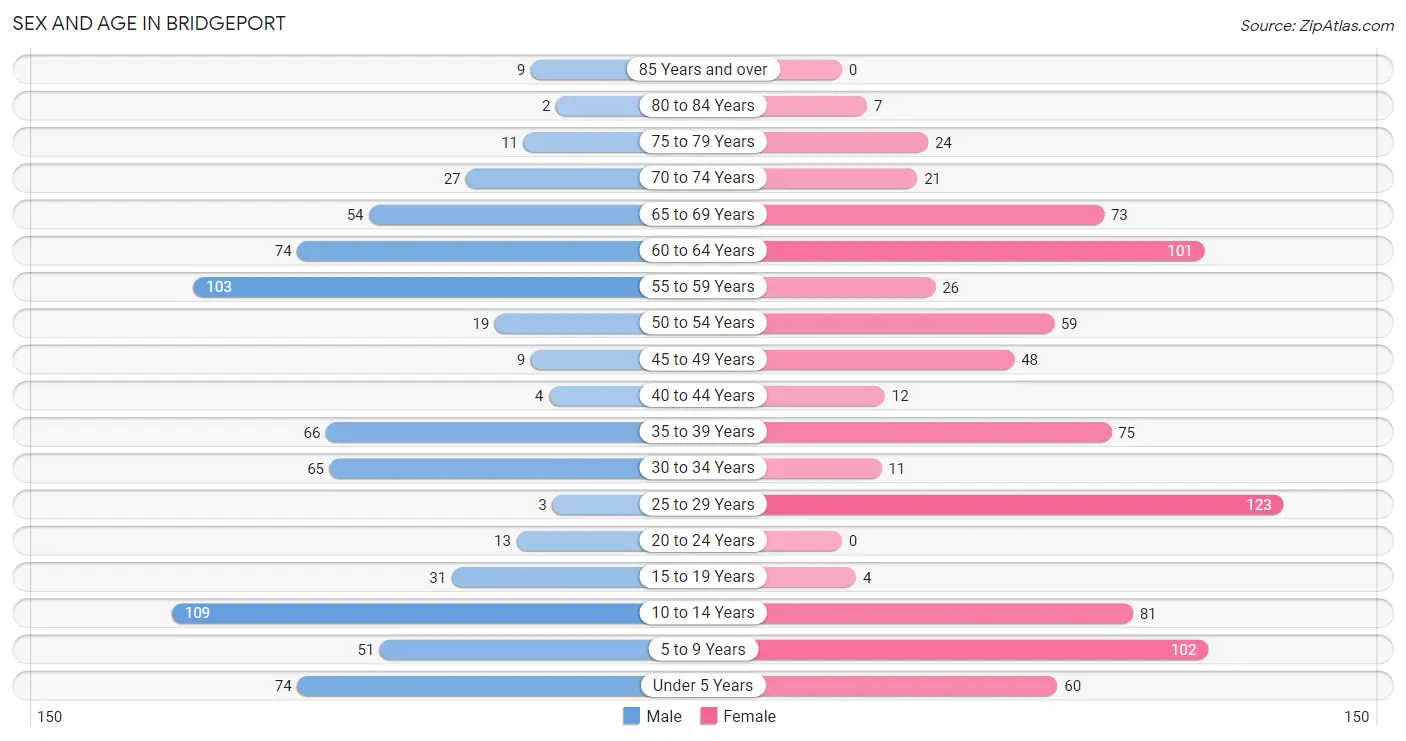
| Age Bracket | Male | Female |
| Under 5 Years | 74 (10.2%) | 60 (7.3%) |
| 5 to 9 Years | 51 (7.0%) | 102 (12.3%) |
| 10 to 14 Years | 109 (15.1%) | 81 (9.8%) |
| 15 to 19 Years | 31 (4.3%) | 4 (0.5%) |
| 20 to 24 Years | 13 (1.8%) | 0 (0.0%) |
| 25 to 29 Years | 3 (0.4%) | 123 (14.9%) |
| 30 to 34 Years | 65 (9.0%) | 11 (1.3%) |
| 35 to 39 Years | 66 (9.1%) | 75 (9.1%) |
| 40 to 44 Years | 4 (0.5%) | 12 (1.5%) |
| 45 to 49 Years | 9 (1.2%) | 48 (5.8%) |
| 50 to 54 Years | 19 (2.6%) | 59 (7.1%) |
| 55 to 59 Years | 103 (14.2%) | 26 (3.1%) |
| 60 to 64 Years | 74 (10.2%) | 101 (12.2%) |
| 65 to 69 Years | 54 (7.5%) | 73 (8.8%) |
| 70 to 74 Years | 27 (3.7%) | 21 (2.5%) |
| 75 to 79 Years | 11 (1.5%) | 24 (2.9%) |
| 80 to 84 Years | 2 (0.3%) | 7 (0.9%) |
| 85 Years and over | 9 (1.2%) | 0 (0.0%) |
| Total | 724 (100.0%) | 827 (100.0%) |
Families and Households in Bridgeport
Median Family Size in Bridgeport
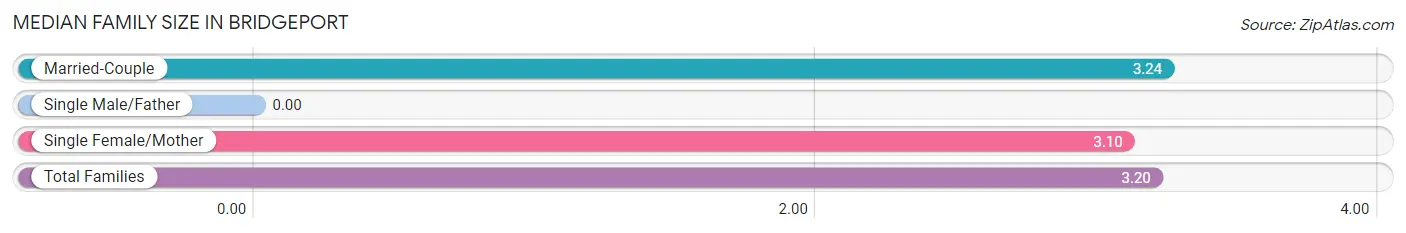
| Family Type | # Families | Family Size |
| Married-Couple | 274 (70.1%) | 3.24 |
| Single Male/Father | 0 (0.0%) | - |
| Single Female/Mother | 117 (29.9%) | 3.10 |
| Total Families | 391 (100.0%) | 3.20 |
Median Household Size in Bridgeport
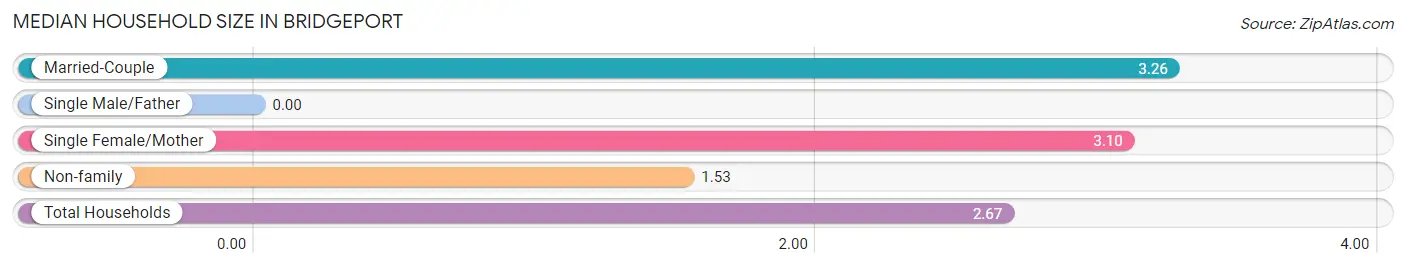
| Household Type | # Households | Household Size |
| Married-Couple | 274 (47.6%) | 3.26 |
| Single Male/Father | 0 (0.0%) | - |
| Single Female/Mother | 117 (20.3%) | 3.10 |
| Non-family | 185 (32.1%) | 1.53 |
| Total Households | 576 (100.0%) | 2.67 |
Household Size by Marriage Status in Bridgeport
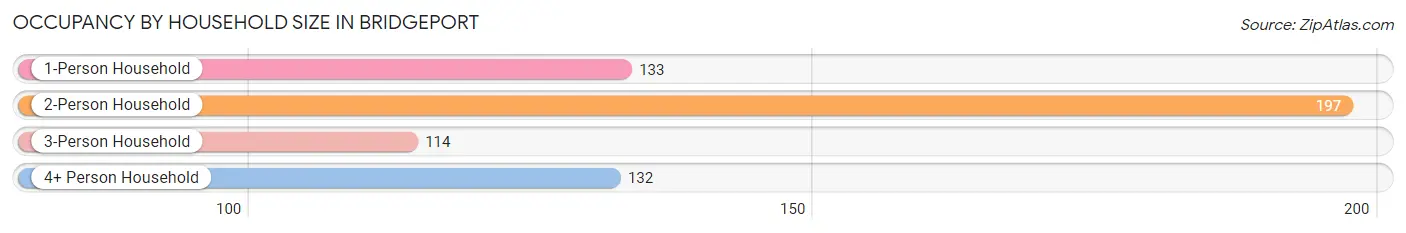
Out of a total of 576 households in Bridgeport, 391 (67.9%) are family households, while 185 (32.1%) are nonfamily households. The most numerous type of family households are 2-person households, comprising 168, and the most common type of nonfamily households are 1-person households, comprising 133.
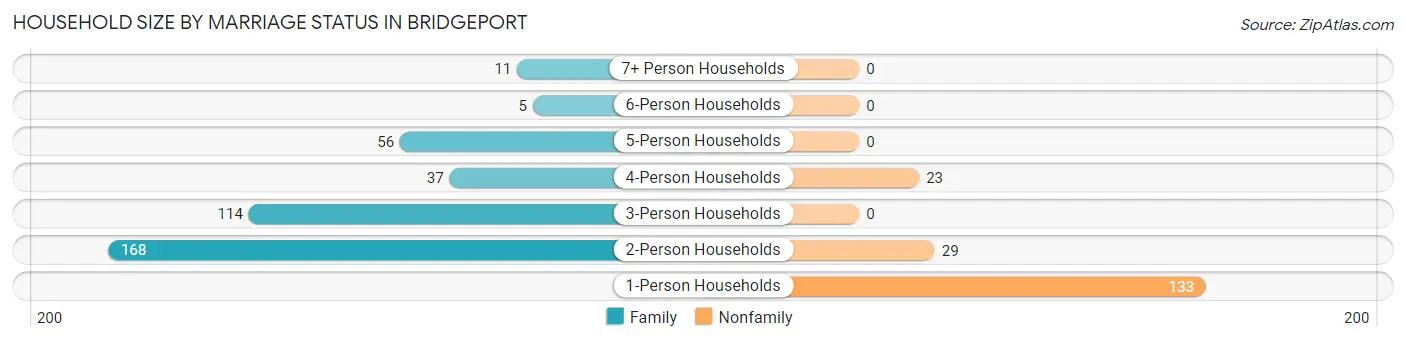
| Household Size | Family Households | Nonfamily Households |
| 1-Person Households | - | 133 (23.1%) |
| 2-Person Households | 168 (29.2%) | 29 (5.0%) |
| 3-Person Households | 114 (19.8%) | 0 (0.0%) |
| 4-Person Households | 37 (6.4%) | 23 (4.0%) |
| 5-Person Households | 56 (9.7%) | 0 (0.0%) |
| 6-Person Households | 5 (0.9%) | 0 (0.0%) |
| 7+ Person Households | 11 (1.9%) | 0 (0.0%) |
| Total | 391 (67.9%) | 185 (32.1%) |
Female Fertility in Bridgeport
Fertility by Age in Bridgeport
Average fertility rate in Bridgeport is 151.0 births per 1,000 women. Women in the age bracket of 20 to 34 years have the highest fertility rate with 366.0 births per 1,000 women. Women in the age bracket of 20 to 34 years acount for 100.0% of all women with births.
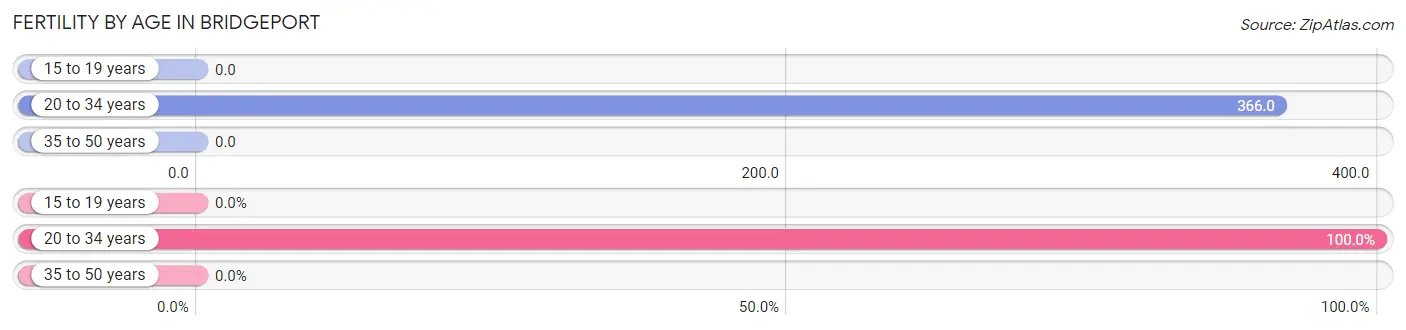
| Age Bracket | Women with Births | Births / 1,000 Women |
| 15 to 19 years | 0 (0.0%) | 0.0 |
| 20 to 34 years | 49 (100.0%) | 366.0 |
| 35 to 50 years | 0 (0.0%) | 0.0 |
| Total | 49 (100.0%) | 151.0 |
Fertility by Age by Marriage Status in Bridgeport
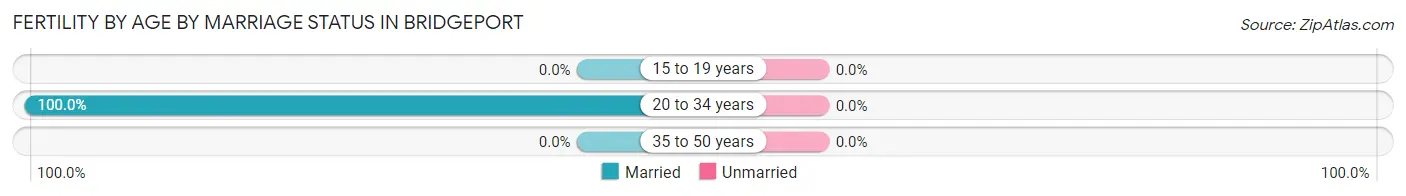
| Age Bracket | Married | Unmarried |
| 15 to 19 years | 0 (0.0%) | 0 (0.0%) |
| 20 to 34 years | 49 (100.0%) | 0 (0.0%) |
| 35 to 50 years | 0 (0.0%) | 0 (0.0%) |
| Total | 49 (100.0%) | 0 (0.0%) |
Fertility by Education in Bridgeport
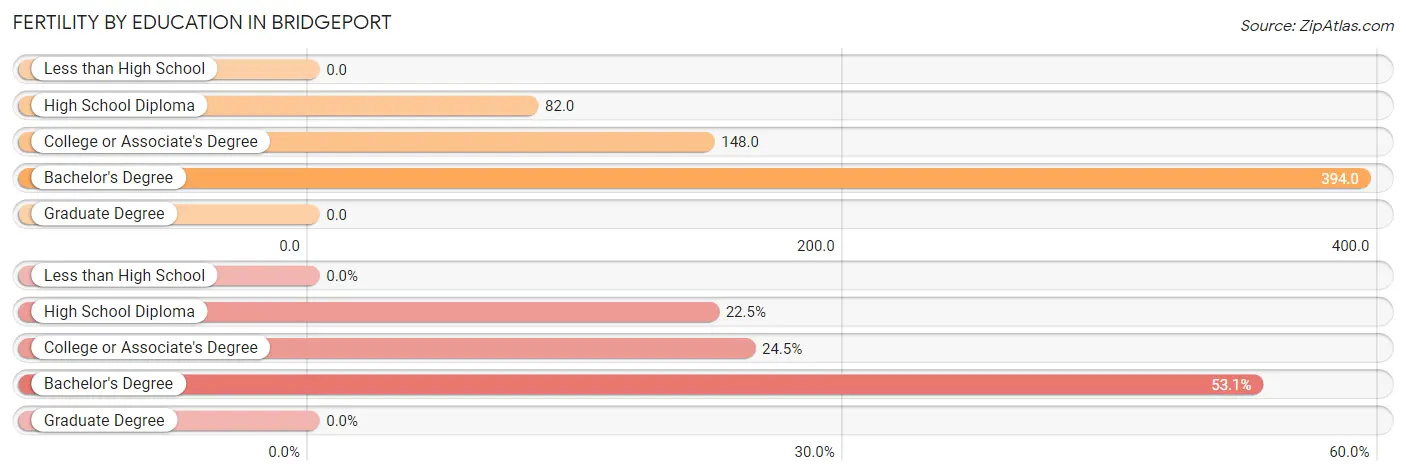
| Educational Attainment | Women with Births | Births / 1,000 Women |
| Less than High School | 0 (0.0%) | 0.0 |
| High School Diploma | 11 (22.5%) | 82.0 |
| College or Associate's Degree | 12 (24.5%) | 148.0 |
| Bachelor's Degree | 26 (53.1%) | 394.0 |
| Graduate Degree | 0 (0.0%) | 0.0 |
| Total | 49 (100.0%) | 151.0 |
Fertility by Education by Marriage Status in Bridgeport
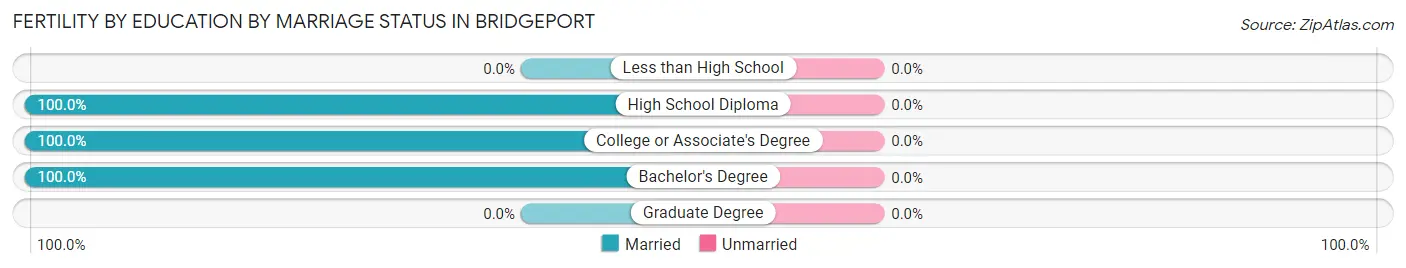
| Educational Attainment | Married | Unmarried |
| Less than High School | 0 (0.0%) | 0 (0.0%) |
| High School Diploma | 11 (100.0%) | 0 (0.0%) |
| College or Associate's Degree | 12 (100.0%) | 0 (0.0%) |
| Bachelor's Degree | 26 (100.0%) | 0 (0.0%) |
| Graduate Degree | 0 (0.0%) | 0 (0.0%) |
| Total | 49 (100.0%) | 0 (0.0%) |
Employment Characteristics in Bridgeport
Employment by Class of Employer in Bridgeport
Among the 613 employed individuals in Bridgeport, private company employees (386 | 63.0%), not-for-profit organizations (61 | 10.0%), and local government employees (52 | 8.5%) make up the most common classes of employment.
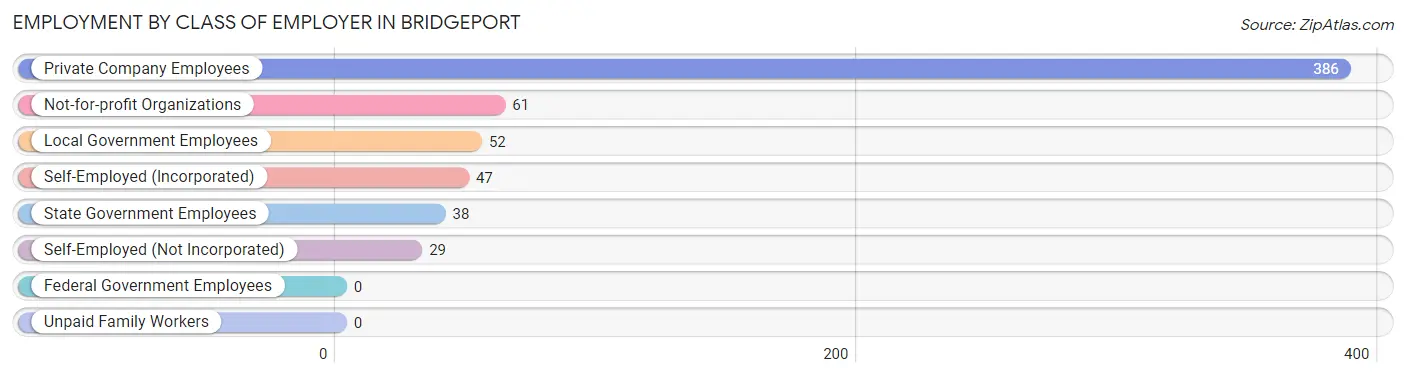
| Employer Class | # Employees | % Employees |
| Private Company Employees | 386 | 63.0% |
| Self-Employed (Incorporated) | 47 | 7.7% |
| Self-Employed (Not Incorporated) | 29 | 4.7% |
| Not-for-profit Organizations | 61 | 10.0% |
| Local Government Employees | 52 | 8.5% |
| State Government Employees | 38 | 6.2% |
| Federal Government Employees | 0 | 0.0% |
| Unpaid Family Workers | 0 | 0.0% |
| Total | 613 | 100.0% |
Employment Status by Age in Bridgeport
According to the labor force statistics for Bridgeport, out of the total population over 16 years of age (1,061), 59.1% or 627 individuals are in the labor force, with 0.3% or 2 of them unemployed. The age group with the highest labor force participation rate is 20 to 24 years, with 100.0% or 13 individuals in the labor force. Within the labor force, the 35 to 44 years age range has the highest percentage of unemployed individuals, with 1.3% or 2 of them being unemployed.
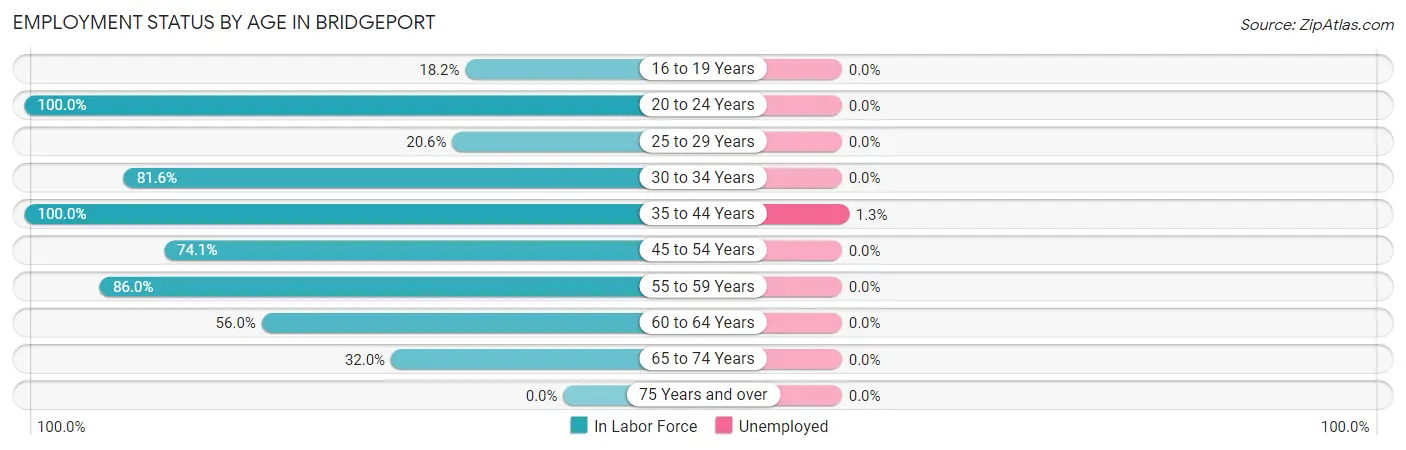
| Age Bracket | In Labor Force | Unemployed |
| 16 to 19 Years | 4 (18.2%) | 0 (0.0%) |
| 20 to 24 Years | 13 (100.0%) | 0 (0.0%) |
| 25 to 29 Years | 26 (20.6%) | 0 (0.0%) |
| 30 to 34 Years | 62 (81.6%) | 0 (0.0%) |
| 35 to 44 Years | 157 (100.0%) | 2 (1.3%) |
| 45 to 54 Years | 100 (74.1%) | 0 (0.0%) |
| 55 to 59 Years | 111 (86.0%) | 0 (0.0%) |
| 60 to 64 Years | 98 (56.0%) | 0 (0.0%) |
| 65 to 74 Years | 56 (32.0%) | 0 (0.0%) |
| 75 Years and over | 0 (0.0%) | 0 (0.0%) |
| Total | 627 (59.1%) | 2 (0.3%) |
Employment Status by Educational Attainment in Bridgeport
According to labor force statistics for Bridgeport, 69.4% of individuals (554) out of the total population between 25 and 64 years of age (798) are in the labor force, with 0.4% or 2 of them being unemployed. The group with the highest labor force participation rate are those with the educational attainment of bachelor's degree or higher, with 77.7% or 153 individuals in the labor force. Within the labor force, individuals with high school diploma education have the highest percentage of unemployment, with 0.8% or 2 of them being unemployed.
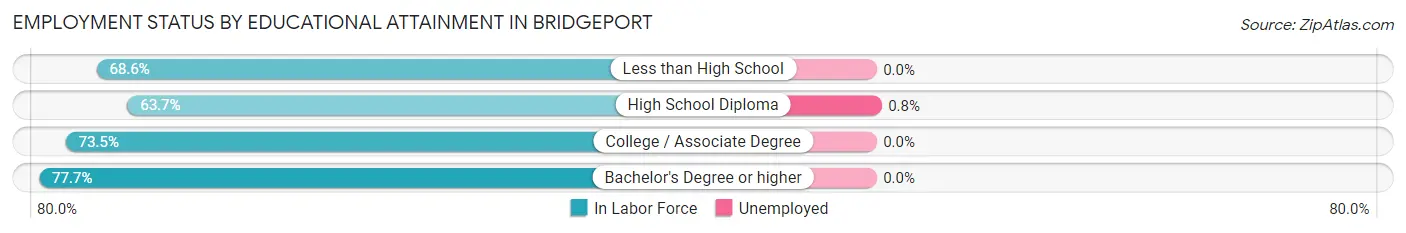
| Educational Attainment | In Labor Force | Unemployed |
| Less than High School | 35 (68.6%) | 0 (0.0%) |
| High School Diploma | 247 (63.7%) | 3 (0.8%) |
| College / Associate Degree | 119 (73.5%) | 0 (0.0%) |
| Bachelor's Degree or higher | 153 (77.7%) | 0 (0.0%) |
| Total | 554 (69.4%) | 3 (0.4%) |
Employment Occupations by Sex in Bridgeport
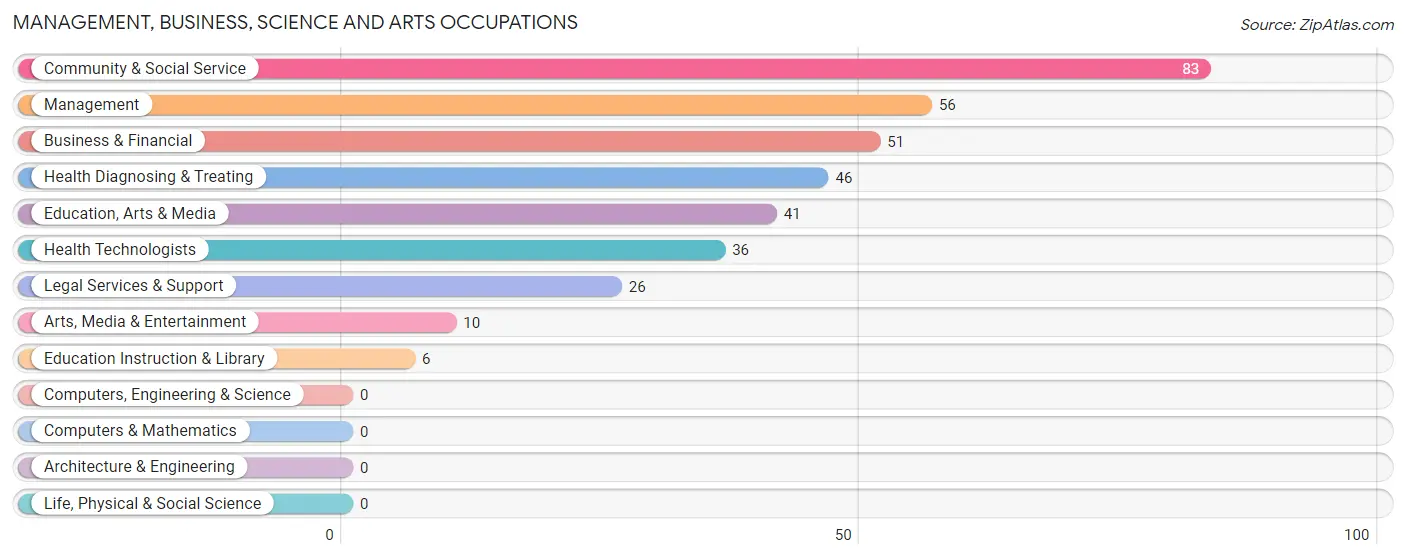
Management, Business, Science and Arts Occupations
The most common Management, Business, Science and Arts occupations in Bridgeport are Community & Social Service (83 | 13.3%), Management (56 | 9.0%), Business & Financial (51 | 8.2%), Health Diagnosing & Treating (46 | 7.4%), and Education, Arts & Media (41 | 6.6%).
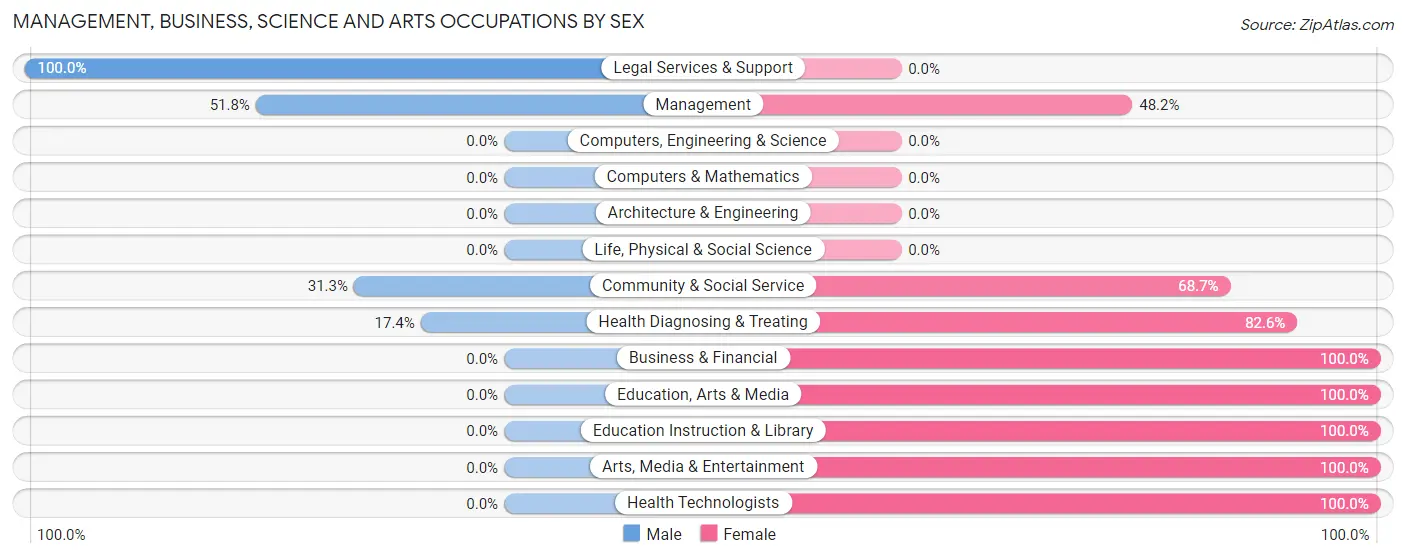
Management, Business, Science and Arts Occupations by Sex
Within the Management, Business, Science and Arts occupations in Bridgeport, the most male-oriented occupations are Legal Services & Support (100.0%), Management (51.8%), and Community & Social Service (31.3%), while the most female-oriented occupations are Business & Financial (100.0%), Education, Arts & Media (100.0%), and Education Instruction & Library (100.0%).
| Occupation | Male | Female |
| Management | 29 (51.8%) | 27 (48.2%) |
| Business & Financial | 0 (0.0%) | 51 (100.0%) |
| Computers, Engineering & Science | 0 (0.0%) | 0 (0.0%) |
| Computers & Mathematics | 0 (0.0%) | 0 (0.0%) |
| Architecture & Engineering | 0 (0.0%) | 0 (0.0%) |
| Life, Physical & Social Science | 0 (0.0%) | 0 (0.0%) |
| Community & Social Service | 26 (31.3%) | 57 (68.7%) |
| Education, Arts & Media | 0 (0.0%) | 41 (100.0%) |
| Legal Services & Support | 26 (100.0%) | 0 (0.0%) |
| Education Instruction & Library | 0 (0.0%) | 6 (100.0%) |
| Arts, Media & Entertainment | 0 (0.0%) | 10 (100.0%) |
| Health Diagnosing & Treating | 8 (17.4%) | 38 (82.6%) |
| Health Technologists | 0 (0.0%) | 36 (100.0%) |
| Total (Category) | 63 (26.7%) | 173 (73.3%) |
| Total (Overall) | 288 (46.1%) | 337 (53.9%) |
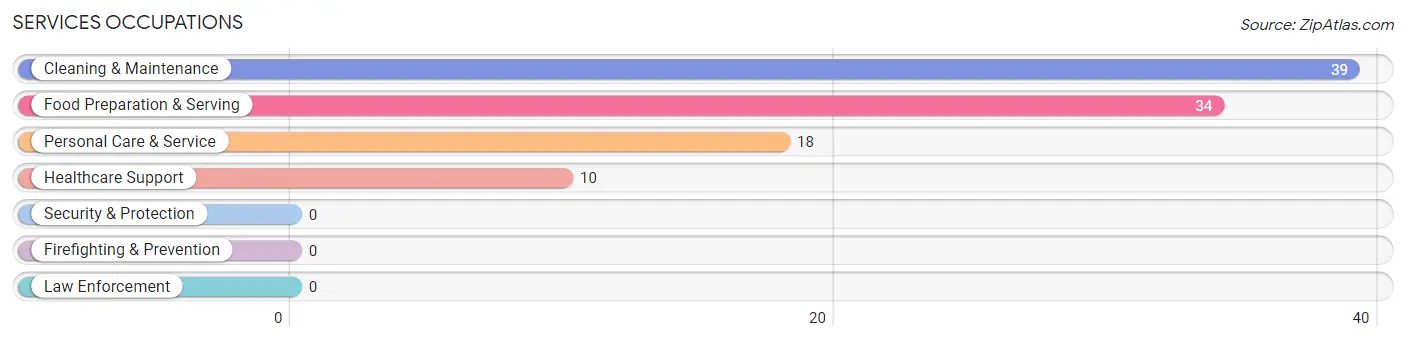
Services Occupations
The most common Services occupations in Bridgeport are Cleaning & Maintenance (39 | 6.2%), Food Preparation & Serving (34 | 5.4%), Personal Care & Service (18 | 2.9%), and Healthcare Support (10 | 1.6%).
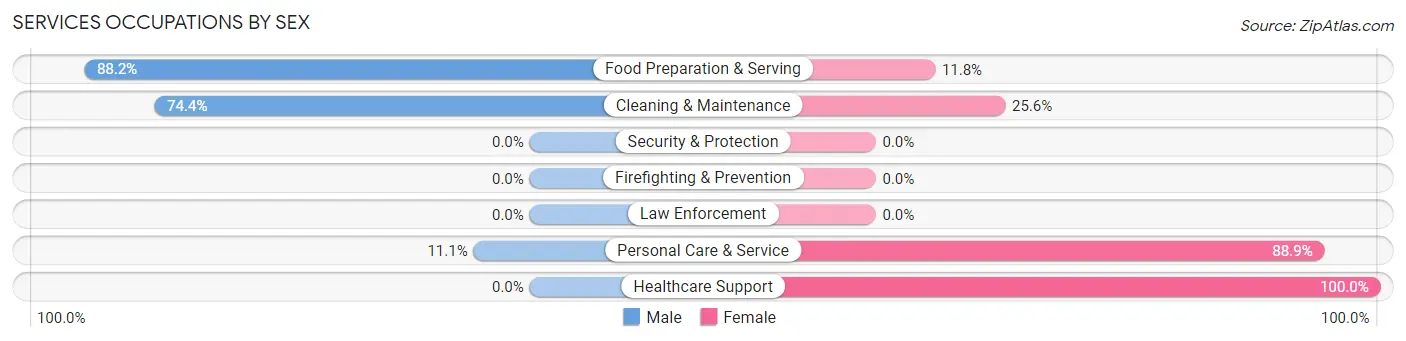
Services Occupations by Sex
Within the Services occupations in Bridgeport, the most male-oriented occupations are Food Preparation & Serving (88.2%), Cleaning & Maintenance (74.4%), and Personal Care & Service (11.1%), while the most female-oriented occupations are Healthcare Support (100.0%), Personal Care & Service (88.9%), and Cleaning & Maintenance (25.6%).
| Occupation | Male | Female |
| Healthcare Support | 0 (0.0%) | 10 (100.0%) |
| Security & Protection | 0 (0.0%) | 0 (0.0%) |
| Firefighting & Prevention | 0 (0.0%) | 0 (0.0%) |
| Law Enforcement | 0 (0.0%) | 0 (0.0%) |
| Food Preparation & Serving | 30 (88.2%) | 4 (11.8%) |
| Cleaning & Maintenance | 29 (74.4%) | 10 (25.6%) |
| Personal Care & Service | 2 (11.1%) | 16 (88.9%) |
| Total (Category) | 61 (60.4%) | 40 (39.6%) |
| Total (Overall) | 288 (46.1%) | 337 (53.9%) |
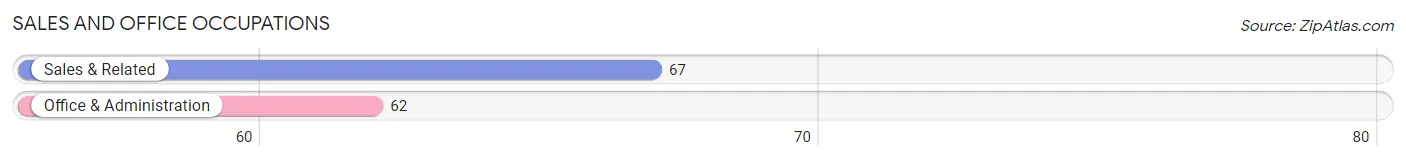
Sales and Office Occupations
The most common Sales and Office occupations in Bridgeport are Sales & Related (67 | 10.7%), and Office & Administration (62 | 9.9%).
Sales and Office Occupations by Sex
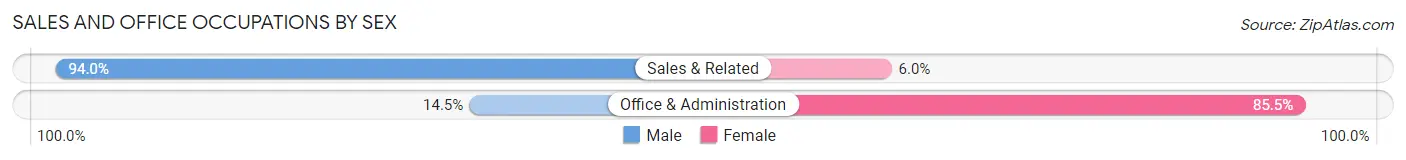
| Occupation | Male | Female |
| Sales & Related | 63 (94.0%) | 4 (6.0%) |
| Office & Administration | 9 (14.5%) | 53 (85.5%) |
| Total (Category) | 72 (55.8%) | 57 (44.2%) |
| Total (Overall) | 288 (46.1%) | 337 (53.9%) |
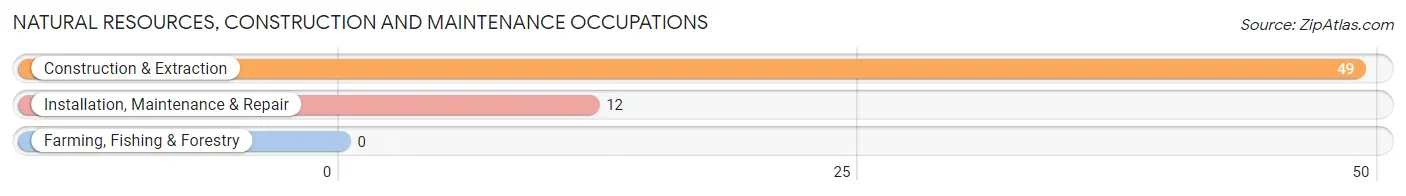
Natural Resources, Construction and Maintenance Occupations
The most common Natural Resources, Construction and Maintenance occupations in Bridgeport are Construction & Extraction (49 | 7.8%), and Installation, Maintenance & Repair (12 | 1.9%).
Natural Resources, Construction and Maintenance Occupations by Sex
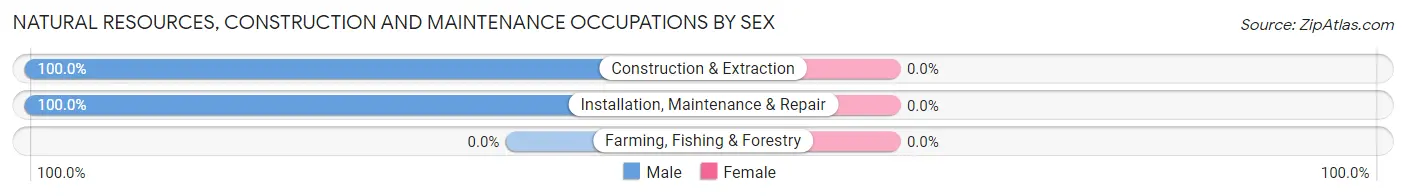
| Occupation | Male | Female |
| Farming, Fishing & Forestry | 0 (0.0%) | 0 (0.0%) |
| Construction & Extraction | 49 (100.0%) | 0 (0.0%) |
| Installation, Maintenance & Repair | 12 (100.0%) | 0 (0.0%) |
| Total (Category) | 61 (100.0%) | 0 (0.0%) |
| Total (Overall) | 288 (46.1%) | 337 (53.9%) |
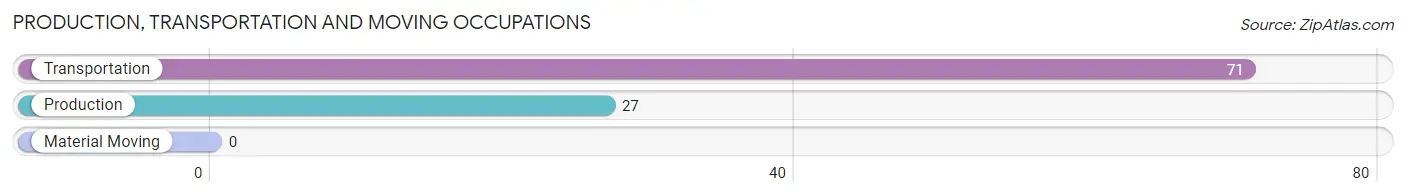
Production, Transportation and Moving Occupations
The most common Production, Transportation and Moving occupations in Bridgeport are Transportation (71 | 11.4%), and Production (27 | 4.3%).
Production, Transportation and Moving Occupations by Sex
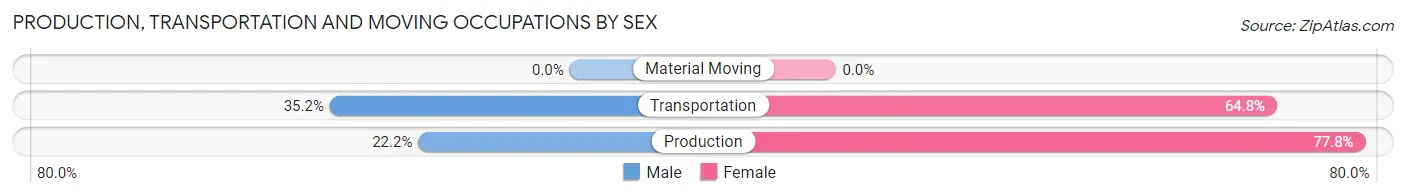
| Occupation | Male | Female |
| Production | 6 (22.2%) | 21 (77.8%) |
| Transportation | 25 (35.2%) | 46 (64.8%) |
| Material Moving | 0 (0.0%) | 0 (0.0%) |
| Total (Category) | 31 (31.6%) | 67 (68.4%) |
| Total (Overall) | 288 (46.1%) | 337 (53.9%) |
Employment Industries by Sex in Bridgeport
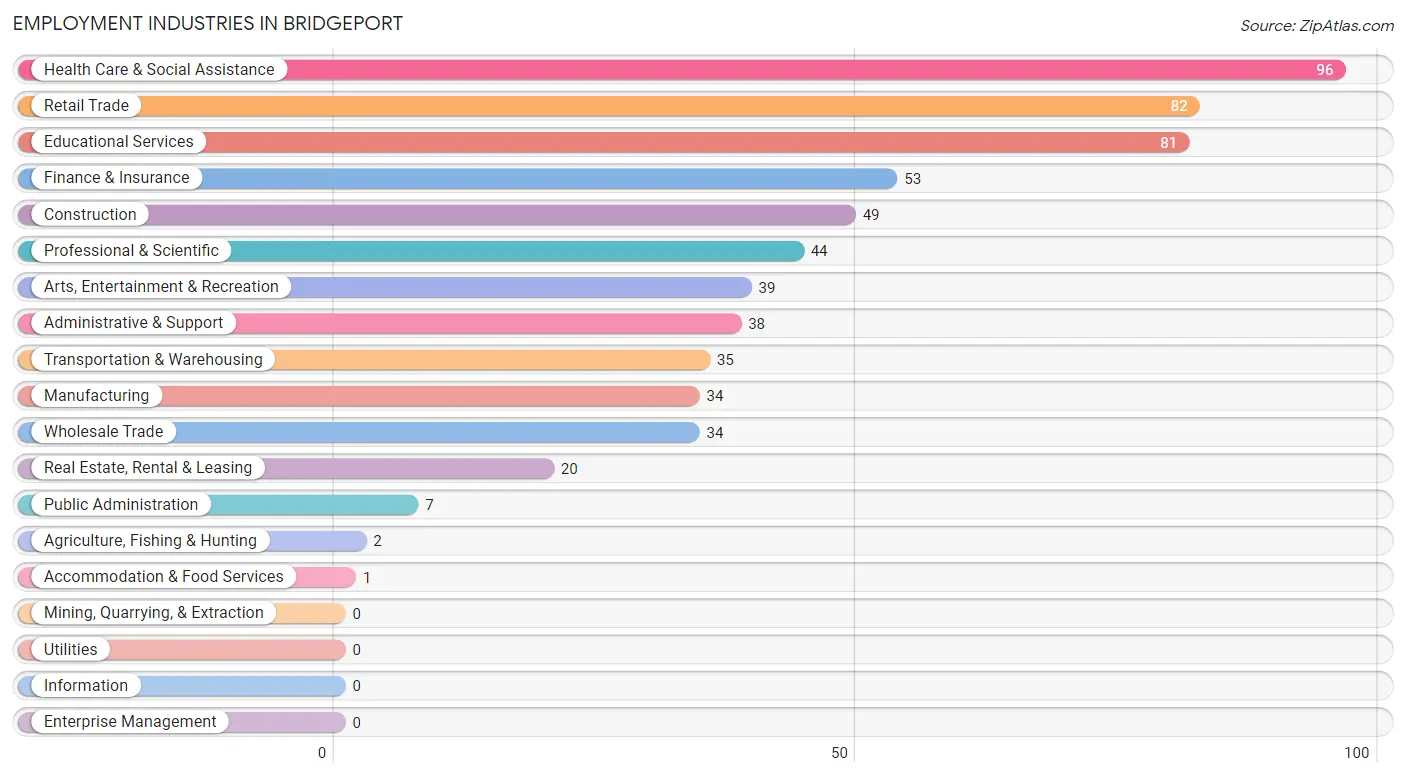
Employment Industries in Bridgeport
The major employment industries in Bridgeport include Health Care & Social Assistance (96 | 15.4%), Retail Trade (82 | 13.1%), Educational Services (81 | 13.0%), Finance & Insurance (53 | 8.5%), and Construction (49 | 7.8%).
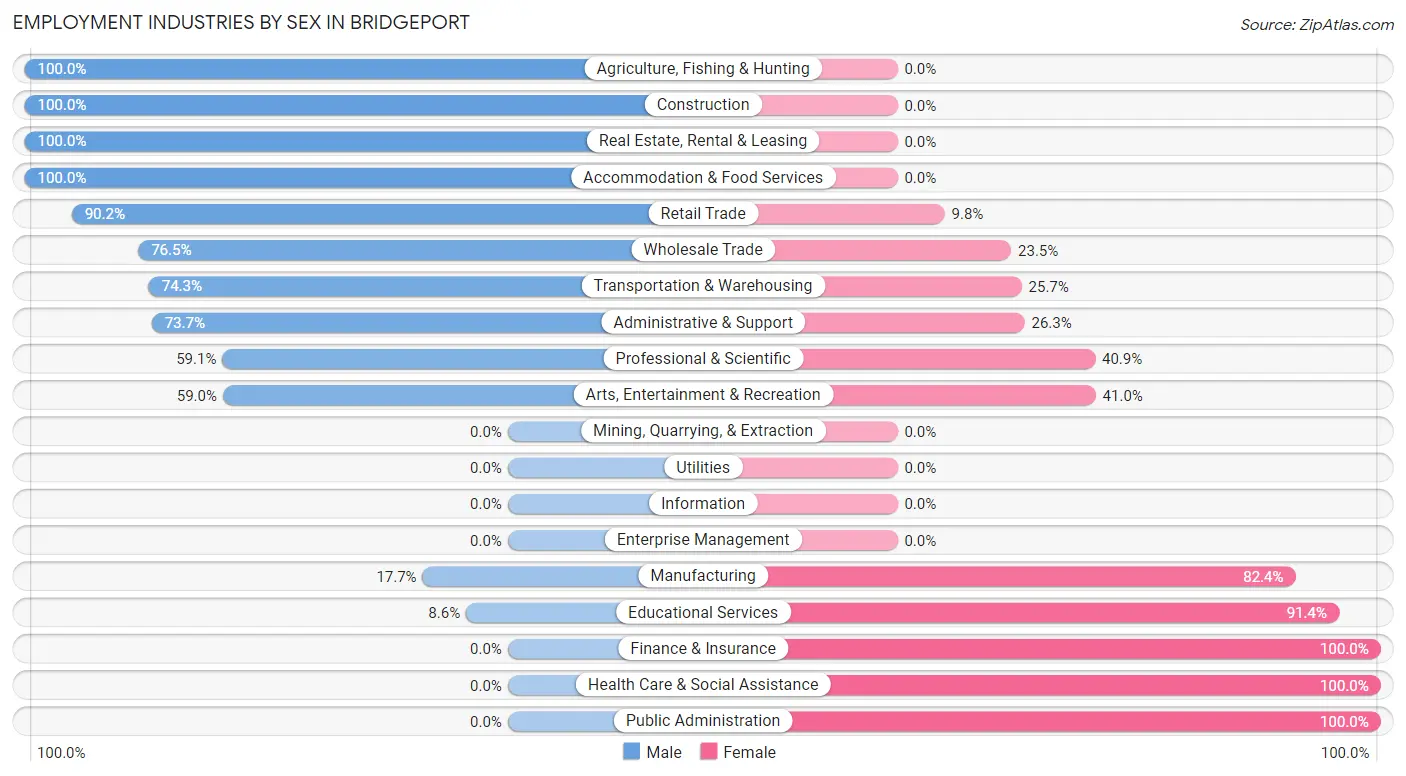
Employment Industries by Sex in Bridgeport
The Bridgeport industries that see more men than women are Agriculture, Fishing & Hunting (100.0%), Construction (100.0%), and Real Estate, Rental & Leasing (100.0%), whereas the industries that tend to have a higher number of women are Finance & Insurance (100.0%), Health Care & Social Assistance (100.0%), and Public Administration (100.0%).
| Industry | Male | Female |
| Agriculture, Fishing & Hunting | 2 (100.0%) | 0 (0.0%) |
| Mining, Quarrying, & Extraction | 0 (0.0%) | 0 (0.0%) |
| Construction | 49 (100.0%) | 0 (0.0%) |
| Manufacturing | 6 (17.6%) | 28 (82.4%) |
| Wholesale Trade | 26 (76.5%) | 8 (23.5%) |
| Retail Trade | 74 (90.2%) | 8 (9.8%) |
| Transportation & Warehousing | 26 (74.3%) | 9 (25.7%) |
| Utilities | 0 (0.0%) | 0 (0.0%) |
| Information | 0 (0.0%) | 0 (0.0%) |
| Finance & Insurance | 0 (0.0%) | 53 (100.0%) |
| Real Estate, Rental & Leasing | 20 (100.0%) | 0 (0.0%) |
| Professional & Scientific | 26 (59.1%) | 18 (40.9%) |
| Enterprise Management | 0 (0.0%) | 0 (0.0%) |
| Administrative & Support | 28 (73.7%) | 10 (26.3%) |
| Educational Services | 7 (8.6%) | 74 (91.4%) |
| Health Care & Social Assistance | 0 (0.0%) | 96 (100.0%) |
| Arts, Entertainment & Recreation | 23 (59.0%) | 16 (41.0%) |
| Accommodation & Food Services | 1 (100.0%) | 0 (0.0%) |
| Public Administration | 0 (0.0%) | 7 (100.0%) |
| Total | 288 (46.1%) | 337 (53.9%) |
Education in Bridgeport
School Enrollment in Bridgeport
The most common levels of schooling among the 450 students in Bridgeport are middle school (170 | 37.8%), elementary school (77 | 17.1%), and nursery / preschool (66 | 14.7%).
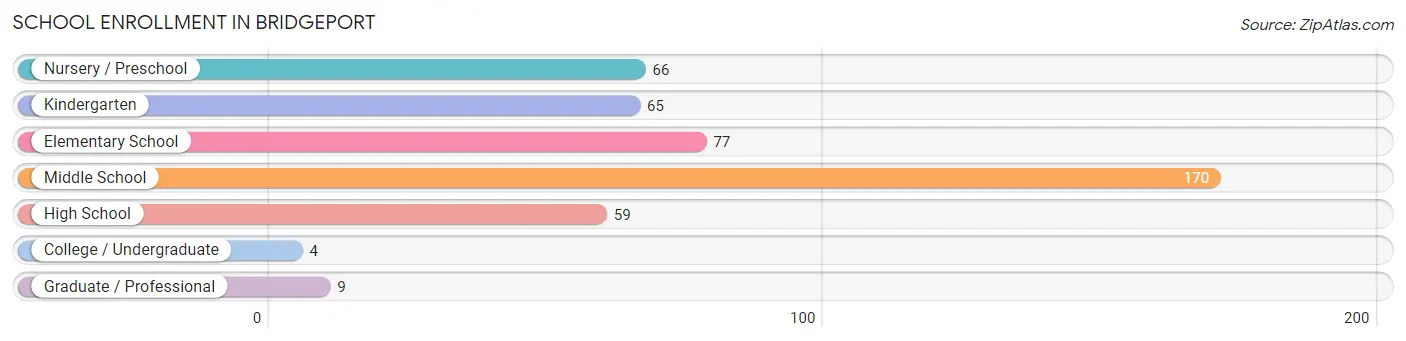
| School Level | # Students | % Students |
| Nursery / Preschool | 66 | 14.7% |
| Kindergarten | 65 | 14.4% |
| Elementary School | 77 | 17.1% |
| Middle School | 170 | 37.8% |
| High School | 59 | 13.1% |
| College / Undergraduate | 4 | 0.9% |
| Graduate / Professional | 9 | 2.0% |
| Total | 450 | 100.0% |
School Enrollment by Age by Funding Source in Bridgeport
Out of a total of 450 students who are enrolled in schools in Bridgeport, 42 (9.3%) attend a private institution, while the remaining 408 (90.7%) are enrolled in public schools. The age group of 18 to 19 year olds has the highest likelihood of being enrolled in private schools, with 4 (100.0% in the age bracket) enrolled. Conversely, the age group of 3 to 4 year olds has the lowest likelihood of being enrolled in a private school, with 55 (100.0% in the age bracket) attending a public institution.
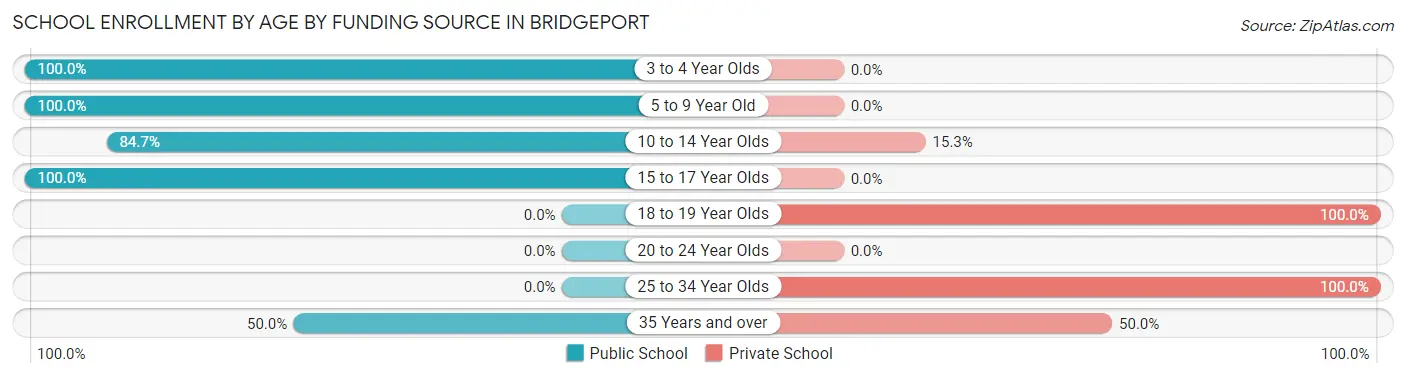
| Age Bracket | Public School | Private School |
| 3 to 4 Year Olds | 55 (100.0%) | 0 (0.0%) |
| 5 to 9 Year Old | 153 (100.0%) | 0 (0.0%) |
| 10 to 14 Year Olds | 161 (84.7%) | 29 (15.3%) |
| 15 to 17 Year Olds | 31 (100.0%) | 0 (0.0%) |
| 18 to 19 Year Olds | 0 (0.0%) | 4 (100.0%) |
| 20 to 24 Year Olds | 0 (0.0%) | 0 (0.0%) |
| 25 to 34 Year Olds | 0 (0.0%) | 1 (100.0%) |
| 35 Years and over | 8 (50.0%) | 8 (50.0%) |
| Total | 408 (90.7%) | 42 (9.3%) |
Educational Attainment by Field of Study in Bridgeport
Arts & humanities (43 | 17.6%), visual & performing arts (35 | 14.3%), social sciences (33 | 13.5%), science & technology (32 | 13.1%), and multidisciplinary studies (26 | 10.7%) are the most common fields of study among 244 individuals in Bridgeport who have obtained a bachelor's degree or higher.
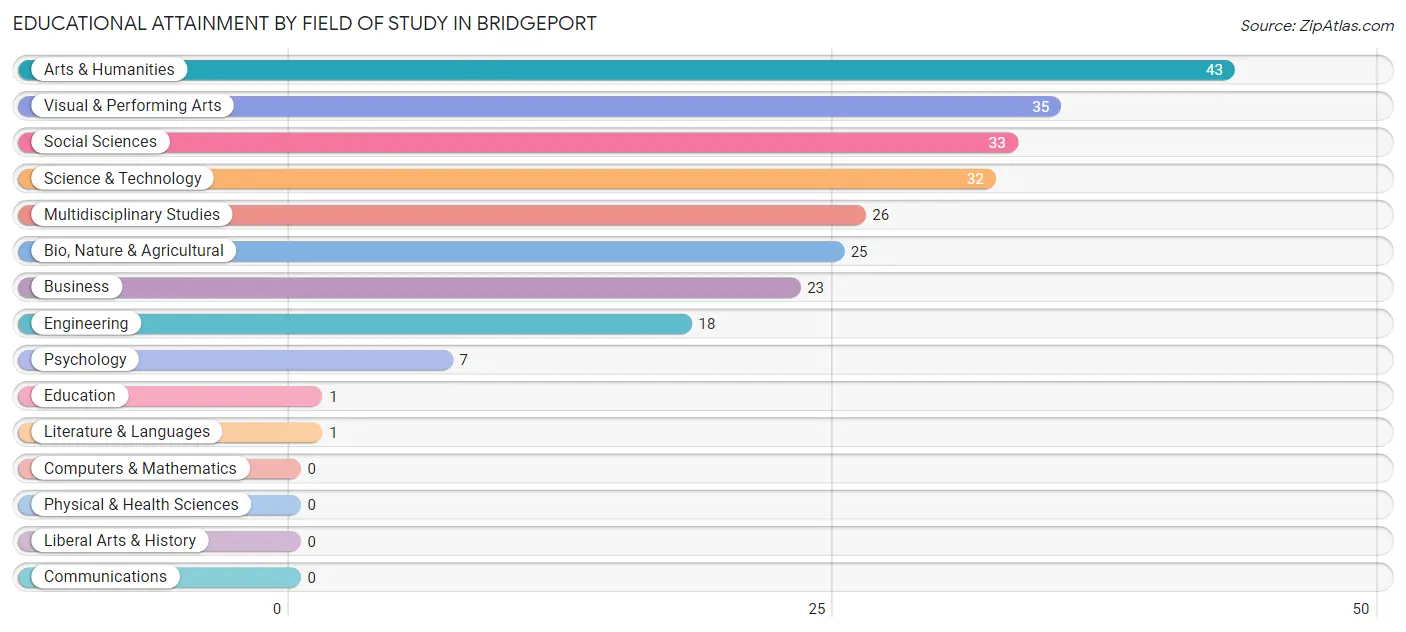
| Field of Study | # Graduates | % Graduates |
| Computers & Mathematics | 0 | 0.0% |
| Bio, Nature & Agricultural | 25 | 10.2% |
| Physical & Health Sciences | 0 | 0.0% |
| Psychology | 7 | 2.9% |
| Social Sciences | 33 | 13.5% |
| Engineering | 18 | 7.4% |
| Multidisciplinary Studies | 26 | 10.7% |
| Science & Technology | 32 | 13.1% |
| Business | 23 | 9.4% |
| Education | 1 | 0.4% |
| Literature & Languages | 1 | 0.4% |
| Liberal Arts & History | 0 | 0.0% |
| Visual & Performing Arts | 35 | 14.3% |
| Communications | 0 | 0.0% |
| Arts & Humanities | 43 | 17.6% |
| Total | 244 | 100.0% |
Transportation & Commute in Bridgeport
Vehicle Availability by Sex in Bridgeport
The most prevalent vehicle ownership categories in Bridgeport are males with 2 vehicles (183, accounting for 63.5%) and females with 2 vehicles (210, making up 56.3%).
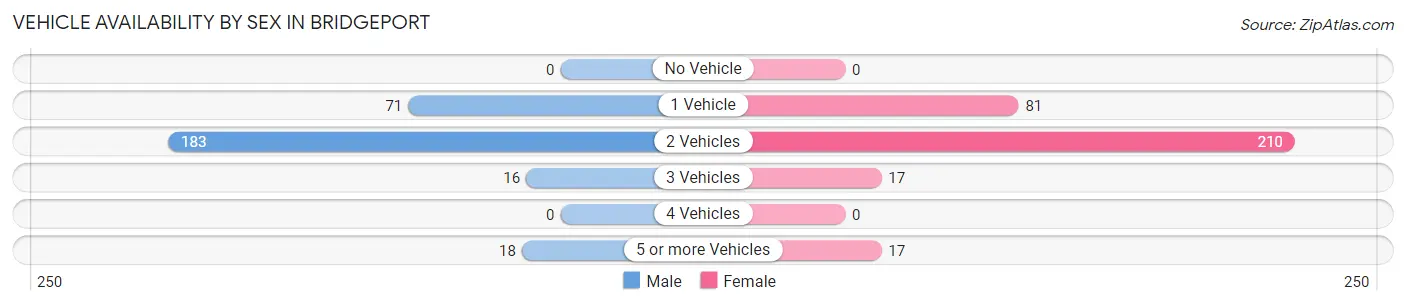
| Vehicles Available | Male | Female |
| No Vehicle | 0 (0.0%) | 0 (0.0%) |
| 1 Vehicle | 71 (24.6%) | 81 (24.9%) |
| 2 Vehicles | 183 (63.5%) | 210 (64.6%) |
| 3 Vehicles | 16 (5.6%) | 17 (5.2%) |
| 4 Vehicles | 0 (0.0%) | 0 (0.0%) |
| 5 or more Vehicles | 18 (6.2%) | 17 (5.2%) |
| Total | 288 (100.0%) | 325 (100.0%) |
Commute Time in Bridgeport
The most frequently occuring commute durations in Bridgeport are 20 to 24 minutes (162 commuters, 26.7%), less than 5 minutes (152 commuters, 25.0%), and 15 to 19 minutes (77 commuters, 12.7%).
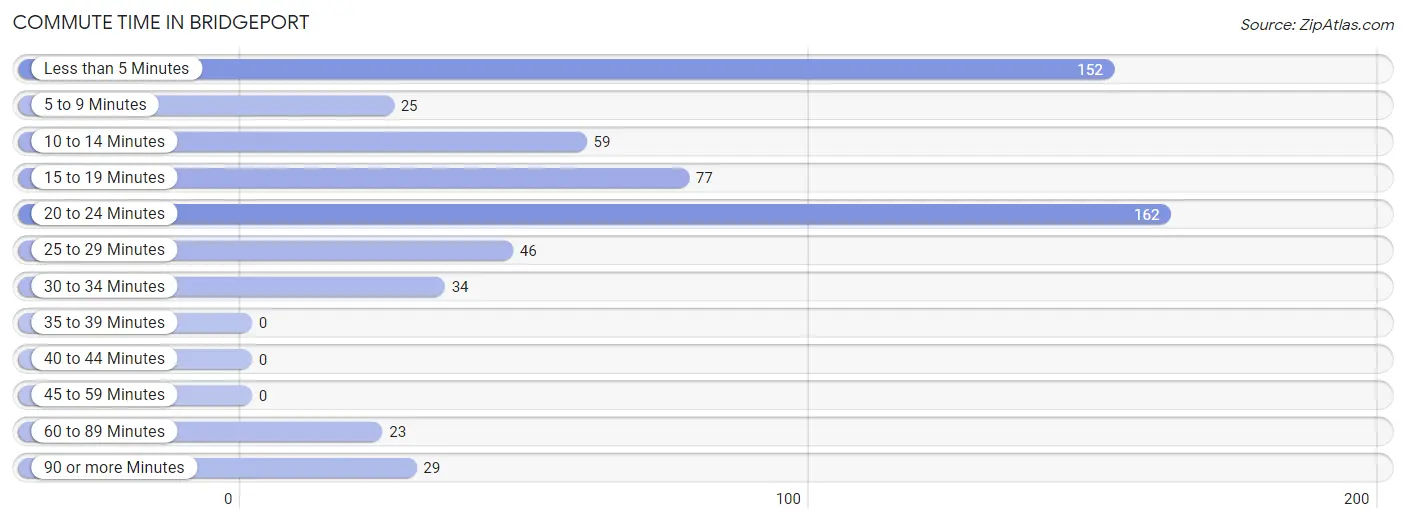
| Commute Time | # Commuters | % Commuters |
| Less than 5 Minutes | 152 | 25.0% |
| 5 to 9 Minutes | 25 | 4.1% |
| 10 to 14 Minutes | 59 | 9.7% |
| 15 to 19 Minutes | 77 | 12.7% |
| 20 to 24 Minutes | 162 | 26.7% |
| 25 to 29 Minutes | 46 | 7.6% |
| 30 to 34 Minutes | 34 | 5.6% |
| 35 to 39 Minutes | 0 | 0.0% |
| 40 to 44 Minutes | 0 | 0.0% |
| 45 to 59 Minutes | 0 | 0.0% |
| 60 to 89 Minutes | 23 | 3.8% |
| 90 or more Minutes | 29 | 4.8% |
Commute Time by Sex in Bridgeport
The most common commute times in Bridgeport are less than 5 minutes (84 commuters, 29.2%) for males and 20 to 24 minutes (136 commuters, 42.6%) for females.
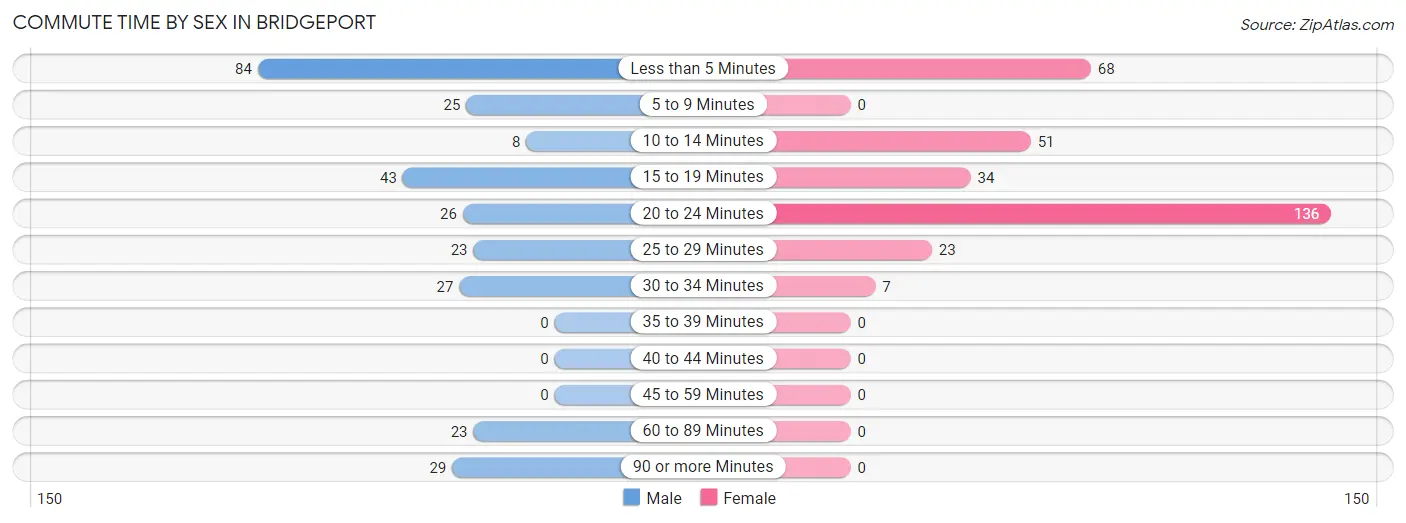
| Commute Time | Male | Female |
| Less than 5 Minutes | 84 (29.2%) | 68 (21.3%) |
| 5 to 9 Minutes | 25 (8.7%) | 0 (0.0%) |
| 10 to 14 Minutes | 8 (2.8%) | 51 (16.0%) |
| 15 to 19 Minutes | 43 (14.9%) | 34 (10.7%) |
| 20 to 24 Minutes | 26 (9.0%) | 136 (42.6%) |
| 25 to 29 Minutes | 23 (8.0%) | 23 (7.2%) |
| 30 to 34 Minutes | 27 (9.4%) | 7 (2.2%) |
| 35 to 39 Minutes | 0 (0.0%) | 0 (0.0%) |
| 40 to 44 Minutes | 0 (0.0%) | 0 (0.0%) |
| 45 to 59 Minutes | 0 (0.0%) | 0 (0.0%) |
| 60 to 89 Minutes | 23 (8.0%) | 0 (0.0%) |
| 90 or more Minutes | 29 (10.1%) | 0 (0.0%) |
Time of Departure to Work by Sex in Bridgeport
The most frequent times of departure to work in Bridgeport are 7:30 AM to 7:59 AM (57, 19.8%) for males and 7:00 AM to 7:29 AM (135, 42.3%) for females.
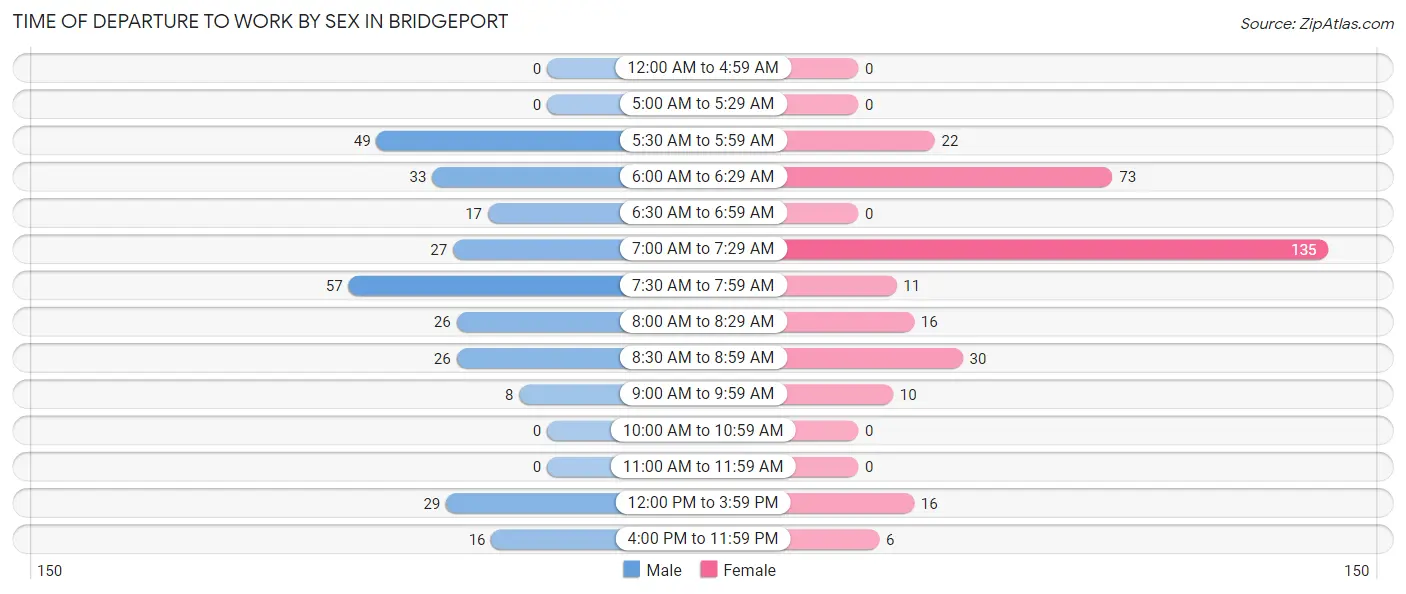
| Time of Departure | Male | Female |
| 12:00 AM to 4:59 AM | 0 (0.0%) | 0 (0.0%) |
| 5:00 AM to 5:29 AM | 0 (0.0%) | 0 (0.0%) |
| 5:30 AM to 5:59 AM | 49 (17.0%) | 22 (6.9%) |
| 6:00 AM to 6:29 AM | 33 (11.5%) | 73 (22.9%) |
| 6:30 AM to 6:59 AM | 17 (5.9%) | 0 (0.0%) |
| 7:00 AM to 7:29 AM | 27 (9.4%) | 135 (42.3%) |
| 7:30 AM to 7:59 AM | 57 (19.8%) | 11 (3.5%) |
| 8:00 AM to 8:29 AM | 26 (9.0%) | 16 (5.0%) |
| 8:30 AM to 8:59 AM | 26 (9.0%) | 30 (9.4%) |
| 9:00 AM to 9:59 AM | 8 (2.8%) | 10 (3.1%) |
| 10:00 AM to 10:59 AM | 0 (0.0%) | 0 (0.0%) |
| 11:00 AM to 11:59 AM | 0 (0.0%) | 0 (0.0%) |
| 12:00 PM to 3:59 PM | 29 (10.1%) | 16 (5.0%) |
| 4:00 PM to 11:59 PM | 16 (5.6%) | 6 (1.9%) |
| Total | 288 (100.0%) | 319 (100.0%) |
Housing Occupancy in Bridgeport
Occupancy by Ownership in Bridgeport
Of the total 576 dwellings in Bridgeport, owner-occupied units account for 488 (84.7%), while renter-occupied units make up 88 (15.3%).
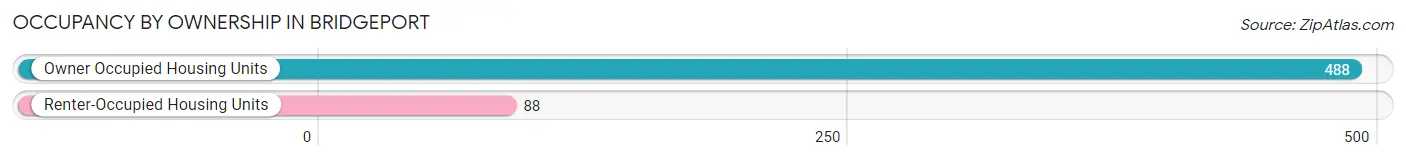
| Occupancy | # Housing Units | % Housing Units |
| Owner Occupied Housing Units | 488 | 84.7% |
| Renter-Occupied Housing Units | 88 | 15.3% |
| Total Occupied Housing Units | 576 | 100.0% |
Occupancy by Household Size in Bridgeport
| Household Size | # Housing Units | % Housing Units |
| 1-Person Household | 133 | 23.1% |
| 2-Person Household | 197 | 34.2% |
| 3-Person Household | 114 | 19.8% |
| 4+ Person Household | 132 | 22.9% |
| Total Housing Units | 576 | 100.0% |
Occupancy by Ownership by Household Size in Bridgeport
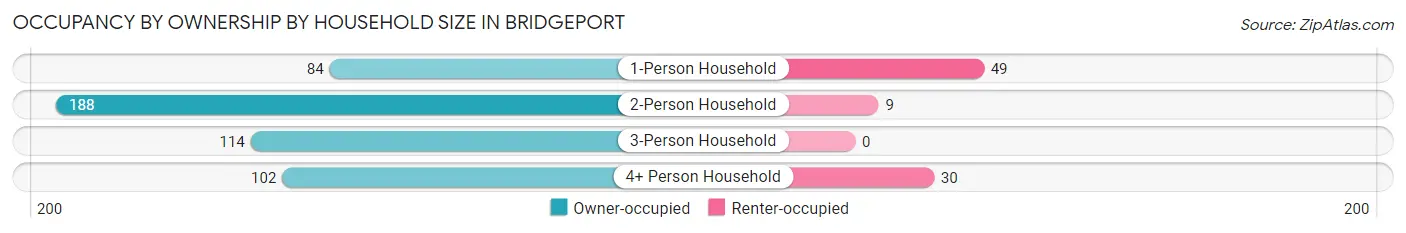
| Household Size | Owner-occupied | Renter-occupied |
| 1-Person Household | 84 (63.2%) | 49 (36.8%) |
| 2-Person Household | 188 (95.4%) | 9 (4.6%) |
| 3-Person Household | 114 (100.0%) | 0 (0.0%) |
| 4+ Person Household | 102 (77.3%) | 30 (22.7%) |
| Total Housing Units | 488 (84.7%) | 88 (15.3%) |
Occupancy by Educational Attainment in Bridgeport
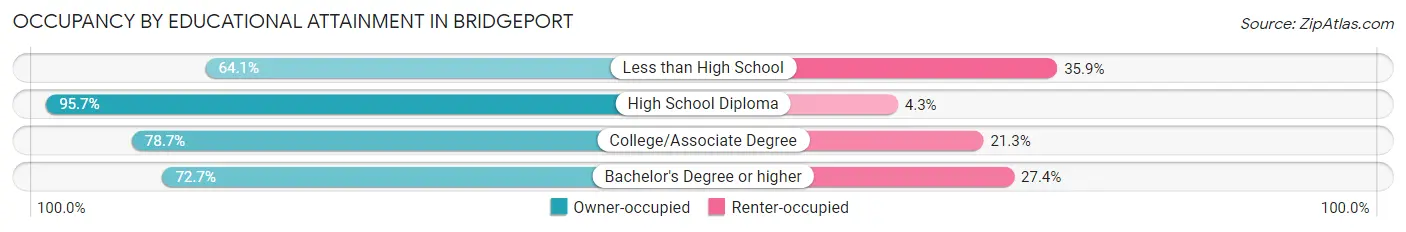
| Household Size | Owner-occupied | Renter-occupied |
| Less than High School | 25 (64.1%) | 14 (35.9%) |
| High School Diploma | 267 (95.7%) | 12 (4.3%) |
| College/Associate Degree | 111 (78.7%) | 30 (21.3%) |
| Bachelor's Degree or higher | 85 (72.7%) | 32 (27.4%) |
Occupancy by Age of Householder in Bridgeport
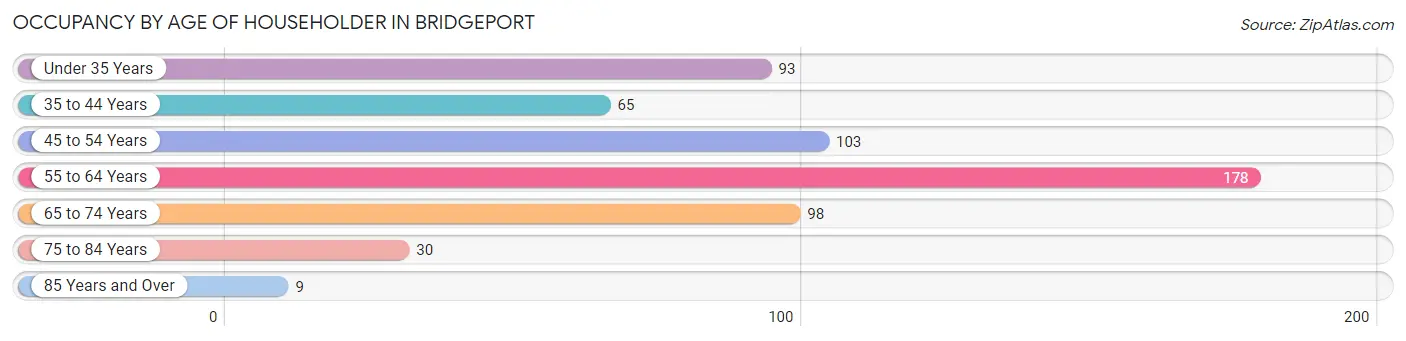
| Age Bracket | # Households | % Households |
| Under 35 Years | 93 | 16.2% |
| 35 to 44 Years | 65 | 11.3% |
| 45 to 54 Years | 103 | 17.9% |
| 55 to 64 Years | 178 | 30.9% |
| 65 to 74 Years | 98 | 17.0% |
| 75 to 84 Years | 30 | 5.2% |
| 85 Years and Over | 9 | 1.6% |
| Total | 576 | 100.0% |
Housing Finances in Bridgeport
Median Income by Occupancy in Bridgeport
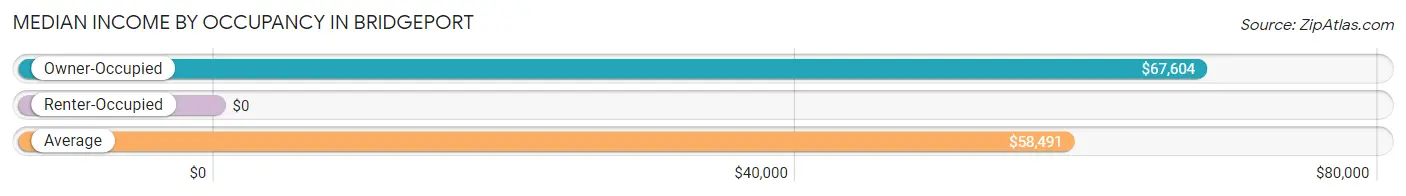
| Occupancy Type | # Households | Median Income |
| Owner-Occupied | 488 (84.7%) | $67,604 |
| Renter-Occupied | 88 (15.3%) | $0 |
| Average | 576 (100.0%) | $58,491 |
Occupancy by Householder Income Bracket in Bridgeport
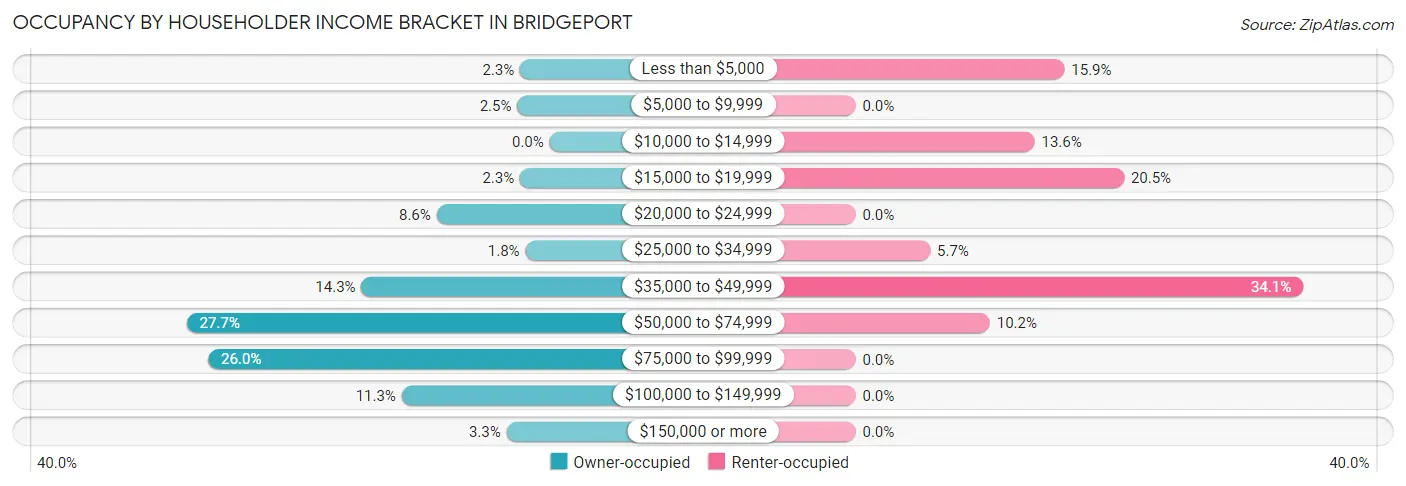
| Income Bracket | Owner-occupied | Renter-occupied |
| Less than $5,000 | 11 (2.2%) | 14 (15.9%) |
| $5,000 to $9,999 | 12 (2.5%) | 0 (0.0%) |
| $10,000 to $14,999 | 0 (0.0%) | 12 (13.6%) |
| $15,000 to $19,999 | 11 (2.2%) | 18 (20.4%) |
| $20,000 to $24,999 | 42 (8.6%) | 0 (0.0%) |
| $25,000 to $34,999 | 9 (1.8%) | 5 (5.7%) |
| $35,000 to $49,999 | 70 (14.3%) | 30 (34.1%) |
| $50,000 to $74,999 | 135 (27.7%) | 9 (10.2%) |
| $75,000 to $99,999 | 127 (26.0%) | 0 (0.0%) |
| $100,000 to $149,999 | 55 (11.3%) | 0 (0.0%) |
| $150,000 or more | 16 (3.3%) | 0 (0.0%) |
| Total | 488 (100.0%) | 88 (100.0%) |
Monthly Housing Cost Tiers in Bridgeport
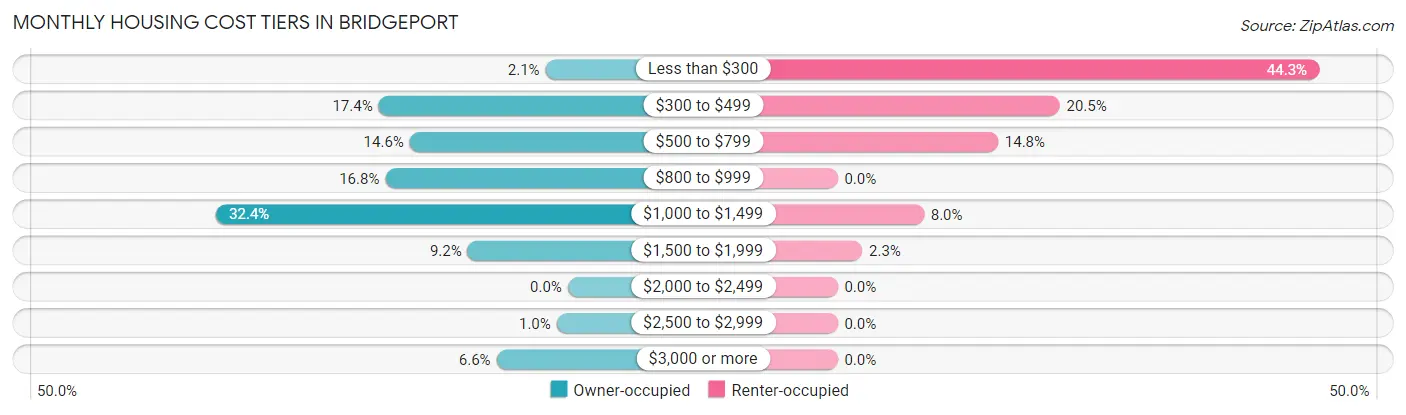
| Monthly Cost | Owner-occupied | Renter-occupied |
| Less than $300 | 10 (2.1%) | 39 (44.3%) |
| $300 to $499 | 85 (17.4%) | 18 (20.4%) |
| $500 to $799 | 71 (14.5%) | 13 (14.8%) |
| $800 to $999 | 82 (16.8%) | 0 (0.0%) |
| $1,000 to $1,499 | 158 (32.4%) | 7 (8.0%) |
| $1,500 to $1,999 | 45 (9.2%) | 2 (2.3%) |
| $2,000 to $2,499 | 0 (0.0%) | 0 (0.0%) |
| $2,500 to $2,999 | 5 (1.0%) | 0 (0.0%) |
| $3,000 or more | 32 (6.6%) | 0 (0.0%) |
| Total | 488 (100.0%) | 88 (100.0%) |
Physical Housing Characteristics in Bridgeport
Housing Structures in Bridgeport
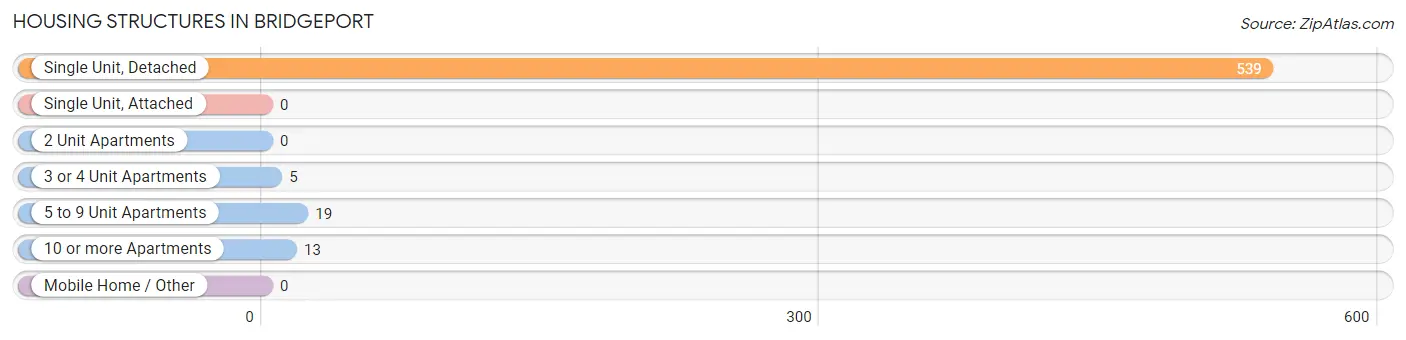
| Structure Type | # Housing Units | % Housing Units |
| Single Unit, Detached | 539 | 93.6% |
| Single Unit, Attached | 0 | 0.0% |
| 2 Unit Apartments | 0 | 0.0% |
| 3 or 4 Unit Apartments | 5 | 0.9% |
| 5 to 9 Unit Apartments | 19 | 3.3% |
| 10 or more Apartments | 13 | 2.3% |
| Mobile Home / Other | 0 | 0.0% |
| Total | 576 | 100.0% |
Housing Structures by Occupancy in Bridgeport
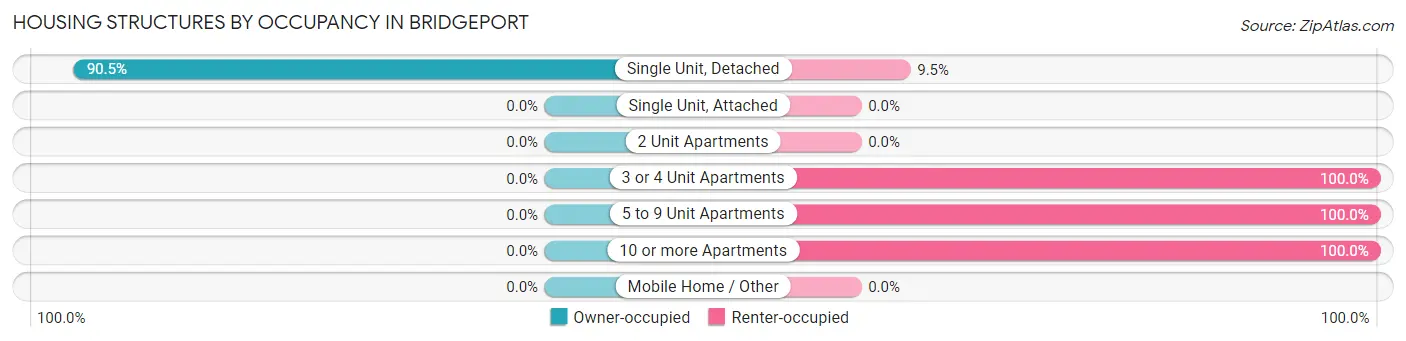
| Structure Type | Owner-occupied | Renter-occupied |
| Single Unit, Detached | 488 (90.5%) | 51 (9.5%) |
| Single Unit, Attached | 0 (0.0%) | 0 (0.0%) |
| 2 Unit Apartments | 0 (0.0%) | 0 (0.0%) |
| 3 or 4 Unit Apartments | 0 (0.0%) | 5 (100.0%) |
| 5 to 9 Unit Apartments | 0 (0.0%) | 19 (100.0%) |
| 10 or more Apartments | 0 (0.0%) | 13 (100.0%) |
| Mobile Home / Other | 0 (0.0%) | 0 (0.0%) |
| Total | 488 (84.7%) | 88 (15.3%) |
Housing Structures by Number of Rooms in Bridgeport
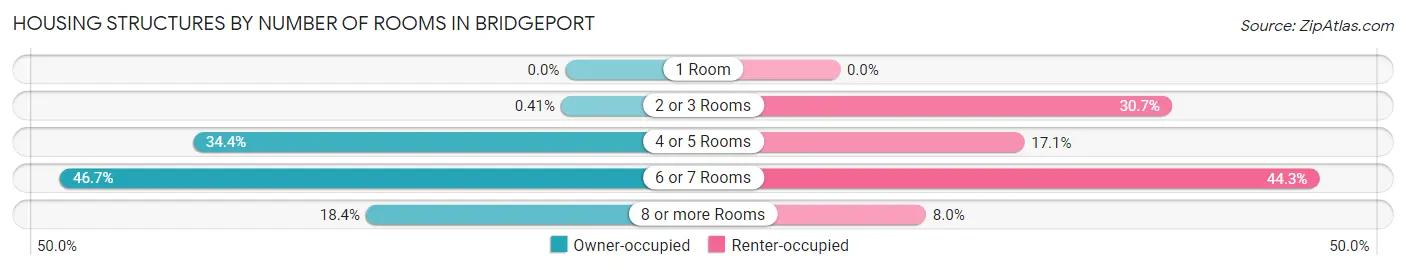
| Number of Rooms | Owner-occupied | Renter-occupied |
| 1 Room | 0 (0.0%) | 0 (0.0%) |
| 2 or 3 Rooms | 2 (0.4%) | 27 (30.7%) |
| 4 or 5 Rooms | 168 (34.4%) | 15 (17.1%) |
| 6 or 7 Rooms | 228 (46.7%) | 39 (44.3%) |
| 8 or more Rooms | 90 (18.4%) | 7 (8.0%) |
| Total | 488 (100.0%) | 88 (100.0%) |
Housing Structure by Heating Type in Bridgeport
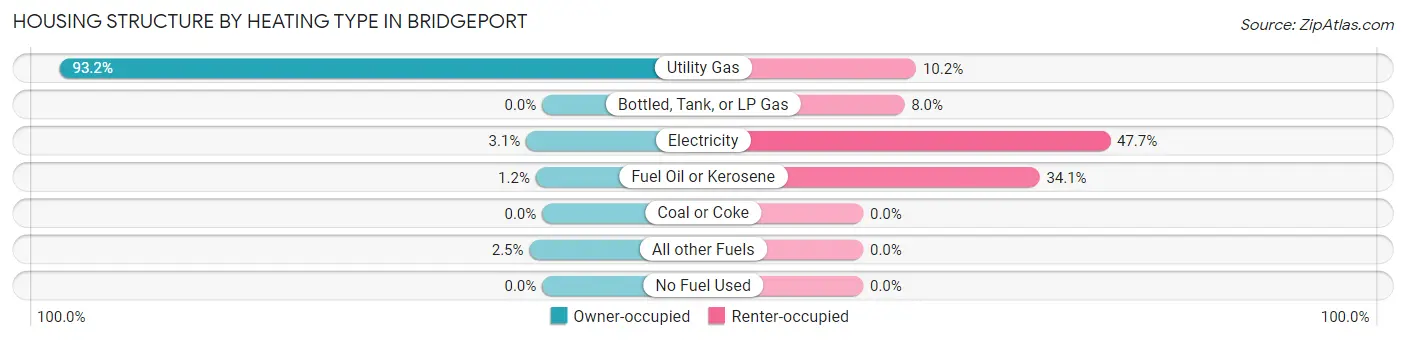
| Heating Type | Owner-occupied | Renter-occupied |
| Utility Gas | 455 (93.2%) | 9 (10.2%) |
| Bottled, Tank, or LP Gas | 0 (0.0%) | 7 (8.0%) |
| Electricity | 15 (3.1%) | 42 (47.7%) |
| Fuel Oil or Kerosene | 6 (1.2%) | 30 (34.1%) |
| Coal or Coke | 0 (0.0%) | 0 (0.0%) |
| All other Fuels | 12 (2.5%) | 0 (0.0%) |
| No Fuel Used | 0 (0.0%) | 0 (0.0%) |
| Total | 488 (100.0%) | 88 (100.0%) |
Household Vehicle Usage in Bridgeport
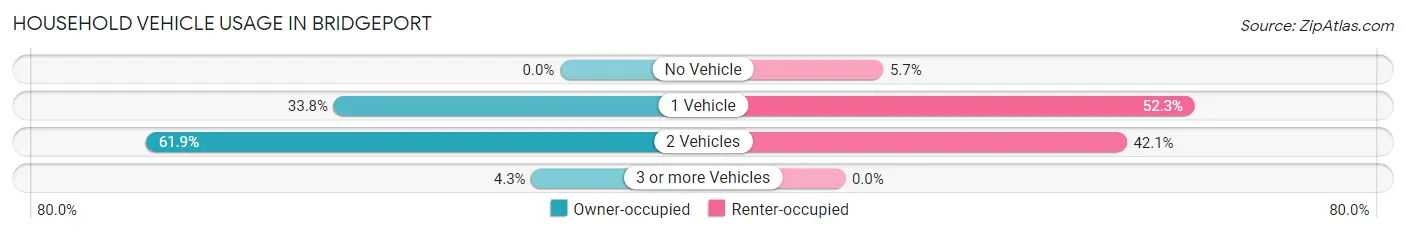
| Vehicles per Household | Owner-occupied | Renter-occupied |
| No Vehicle | 0 (0.0%) | 5 (5.7%) |
| 1 Vehicle | 165 (33.8%) | 46 (52.3%) |
| 2 Vehicles | 302 (61.9%) | 37 (42.0%) |
| 3 or more Vehicles | 21 (4.3%) | 0 (0.0%) |
| Total | 488 (100.0%) | 88 (100.0%) |
Real Estate & Mortgages in Bridgeport
Real Estate and Mortgage Overview in Bridgeport
| Characteristic | Without Mortgage | With Mortgage |
| Housing Units | 132 | 356 |
| Median Property Value | $108,500 | $110,900 |
| Median Household Income | $68,125 | $14 |
| Monthly Housing Costs | $468 | $32 |
| Real Estate Taxes | $2,346 | $16 |
Property Value by Mortgage Status in Bridgeport
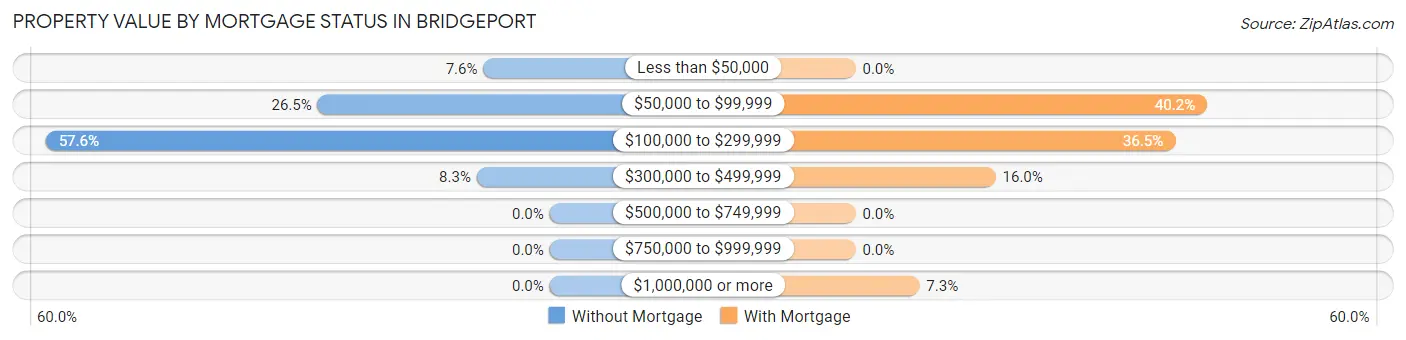
| Property Value | Without Mortgage | With Mortgage |
| Less than $50,000 | 10 (7.6%) | 0 (0.0%) |
| $50,000 to $99,999 | 35 (26.5%) | 143 (40.2%) |
| $100,000 to $299,999 | 76 (57.6%) | 130 (36.5%) |
| $300,000 to $499,999 | 11 (8.3%) | 57 (16.0%) |
| $500,000 to $749,999 | 0 (0.0%) | 0 (0.0%) |
| $750,000 to $999,999 | 0 (0.0%) | 0 (0.0%) |
| $1,000,000 or more | 0 (0.0%) | 26 (7.3%) |
| Total | 132 (100.0%) | 356 (100.0%) |
Household Income by Mortgage Status in Bridgeport
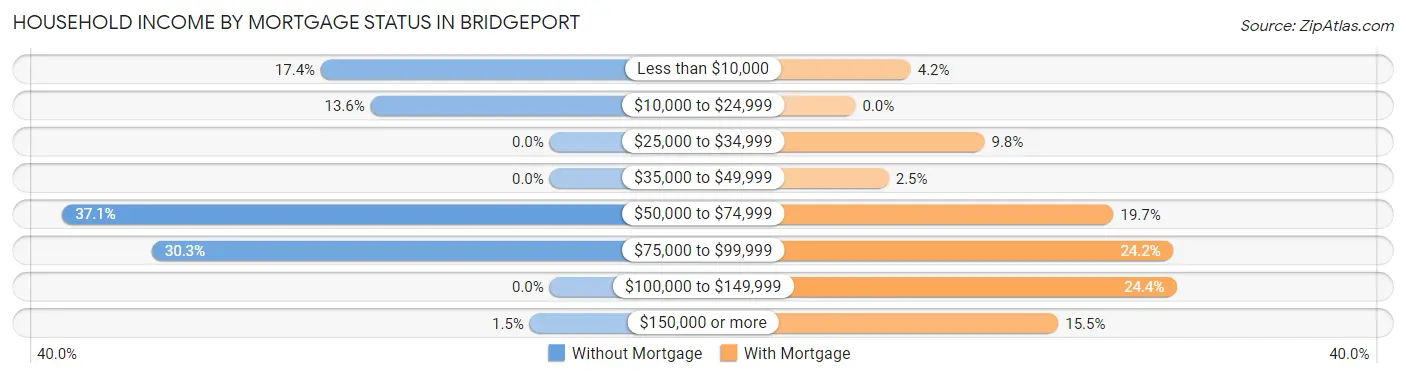
| Household Income | Without Mortgage | With Mortgage |
| Less than $10,000 | 23 (17.4%) | 15 (4.2%) |
| $10,000 to $24,999 | 18 (13.6%) | 0 (0.0%) |
| $25,000 to $34,999 | 0 (0.0%) | 35 (9.8%) |
| $35,000 to $49,999 | 0 (0.0%) | 9 (2.5%) |
| $50,000 to $74,999 | 49 (37.1%) | 70 (19.7%) |
| $75,000 to $99,999 | 40 (30.3%) | 86 (24.2%) |
| $100,000 to $149,999 | 0 (0.0%) | 87 (24.4%) |
| $150,000 or more | 2 (1.5%) | 55 (15.4%) |
| Total | 132 (100.0%) | 356 (100.0%) |
Property Value to Household Income Ratio in Bridgeport
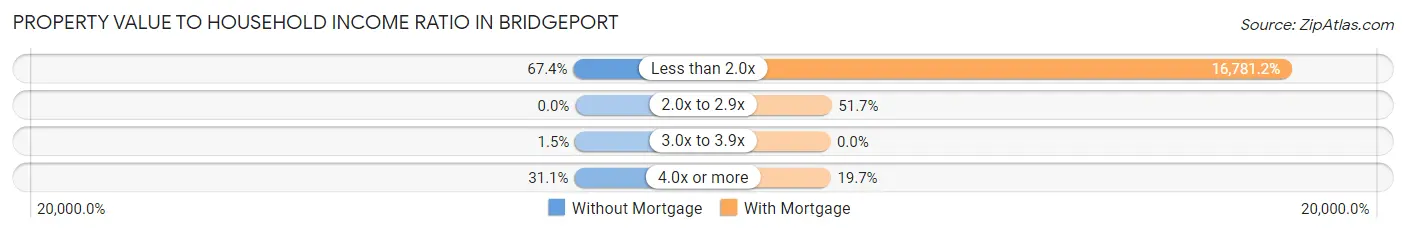
| Value-to-Income Ratio | Without Mortgage | With Mortgage |
| Less than 2.0x | 89 (67.4%) | 59,741 (16,781.2%) |
| 2.0x to 2.9x | 0 (0.0%) | 184 (51.7%) |
| 3.0x to 3.9x | 2 (1.5%) | 0 (0.0%) |
| 4.0x or more | 41 (31.1%) | 70 (19.7%) |
| Total | 132 (100.0%) | 356 (100.0%) |
Real Estate Taxes by Mortgage Status in Bridgeport
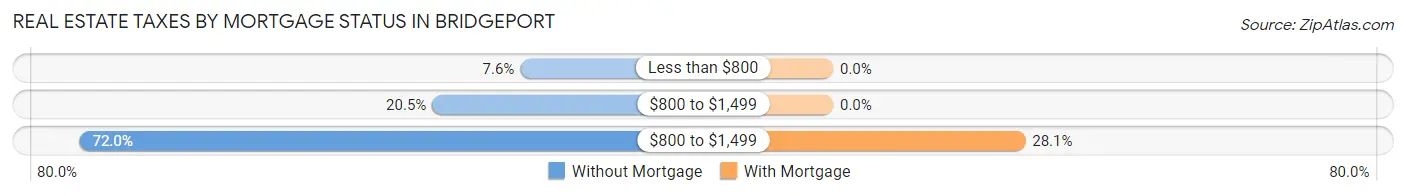
| Property Taxes | Without Mortgage | With Mortgage |
| Less than $800 | 10 (7.6%) | 0 (0.0%) |
| $800 to $1,499 | 27 (20.4%) | 0 (0.0%) |
| $800 to $1,499 | 95 (72.0%) | 100 (28.1%) |
| Total | 132 (100.0%) | 356 (100.0%) |
Health & Disability in Bridgeport
Health Insurance Coverage by Age in Bridgeport
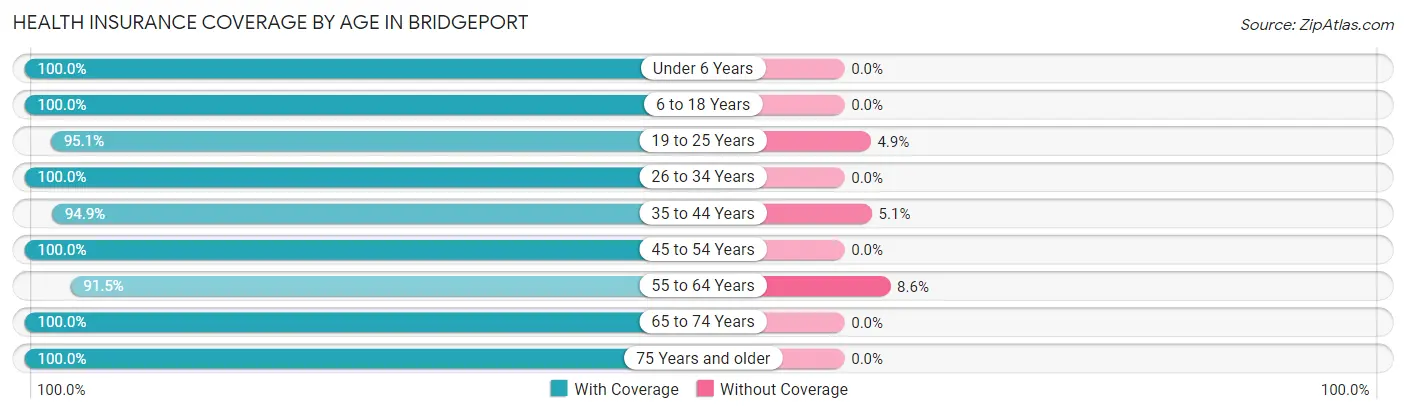
| Age Bracket | With Coverage | Without Coverage |
| Under 6 Years | 210 (100.0%) | 0 (0.0%) |
| 6 to 18 Years | 298 (100.0%) | 0 (0.0%) |
| 19 to 25 Years | 78 (95.1%) | 4 (4.9%) |
| 26 to 34 Years | 137 (100.0%) | 0 (0.0%) |
| 35 to 44 Years | 149 (94.9%) | 8 (5.1%) |
| 45 to 54 Years | 135 (100.0%) | 0 (0.0%) |
| 55 to 64 Years | 278 (91.4%) | 26 (8.6%) |
| 65 to 74 Years | 175 (100.0%) | 0 (0.0%) |
| 75 Years and older | 53 (100.0%) | 0 (0.0%) |
| Total | 1,513 (97.6%) | 38 (2.5%) |
Health Insurance Coverage by Citizenship Status in Bridgeport
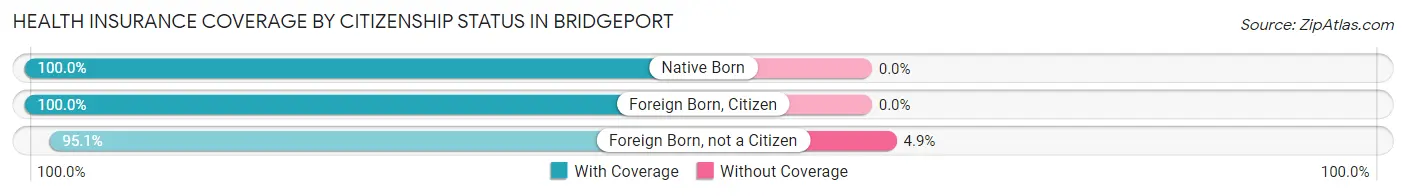
| Citizenship Status | With Coverage | Without Coverage |
| Native Born | 210 (100.0%) | 0 (0.0%) |
| Foreign Born, Citizen | 298 (100.0%) | 0 (0.0%) |
| Foreign Born, not a Citizen | 78 (95.1%) | 4 (4.9%) |
Health Insurance Coverage by Household Income in Bridgeport
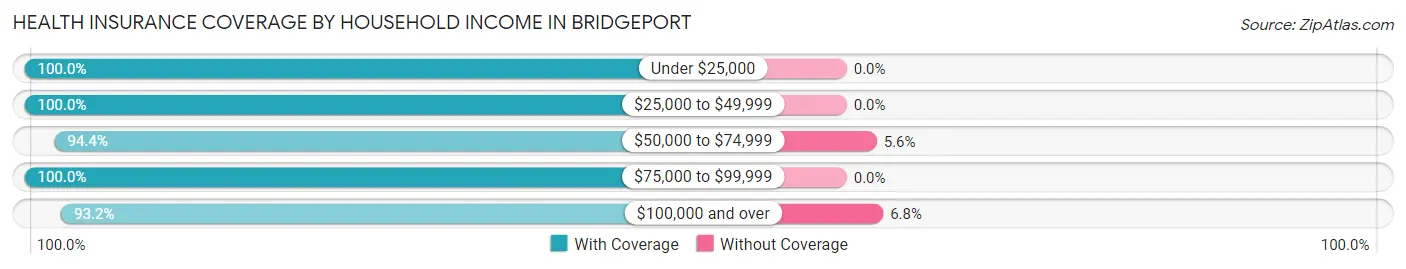
| Household Income | With Coverage | Without Coverage |
| Under $25,000 | 184 (100.0%) | 0 (0.0%) |
| $25,000 to $49,999 | 390 (100.0%) | 0 (0.0%) |
| $50,000 to $74,999 | 302 (94.4%) | 18 (5.6%) |
| $75,000 to $99,999 | 352 (100.0%) | 0 (0.0%) |
| $100,000 and over | 273 (93.2%) | 20 (6.8%) |
Public vs Private Health Insurance Coverage by Age in Bridgeport
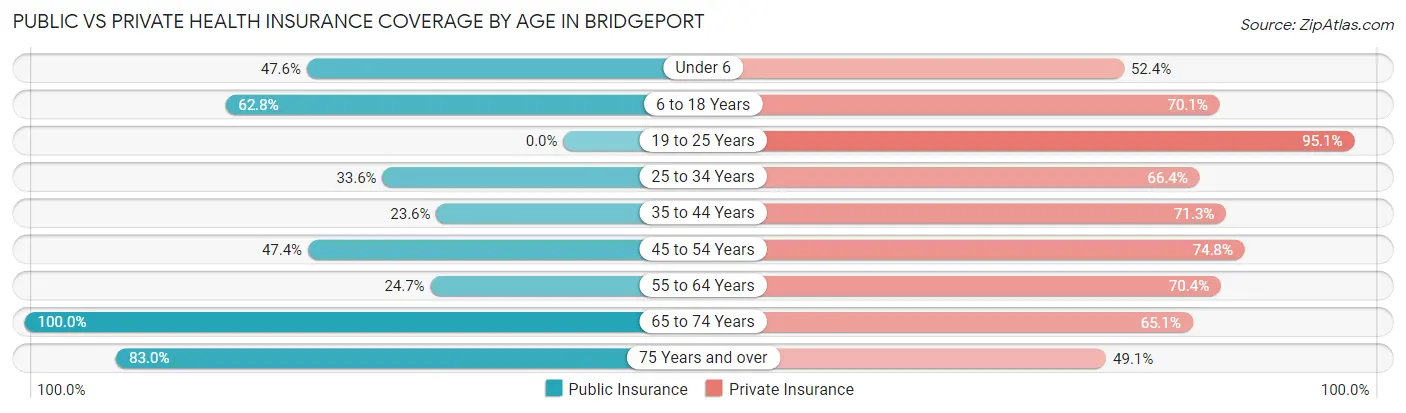
| Age Bracket | Public Insurance | Private Insurance |
| Under 6 | 100 (47.6%) | 110 (52.4%) |
| 6 to 18 Years | 187 (62.7%) | 209 (70.1%) |
| 19 to 25 Years | 0 (0.0%) | 78 (95.1%) |
| 25 to 34 Years | 46 (33.6%) | 91 (66.4%) |
| 35 to 44 Years | 37 (23.6%) | 112 (71.3%) |
| 45 to 54 Years | 64 (47.4%) | 101 (74.8%) |
| 55 to 64 Years | 75 (24.7%) | 214 (70.4%) |
| 65 to 74 Years | 175 (100.0%) | 114 (65.1%) |
| 75 Years and over | 44 (83.0%) | 26 (49.1%) |
| Total | 728 (46.9%) | 1,055 (68.0%) |
Disability Status by Sex by Age in Bridgeport
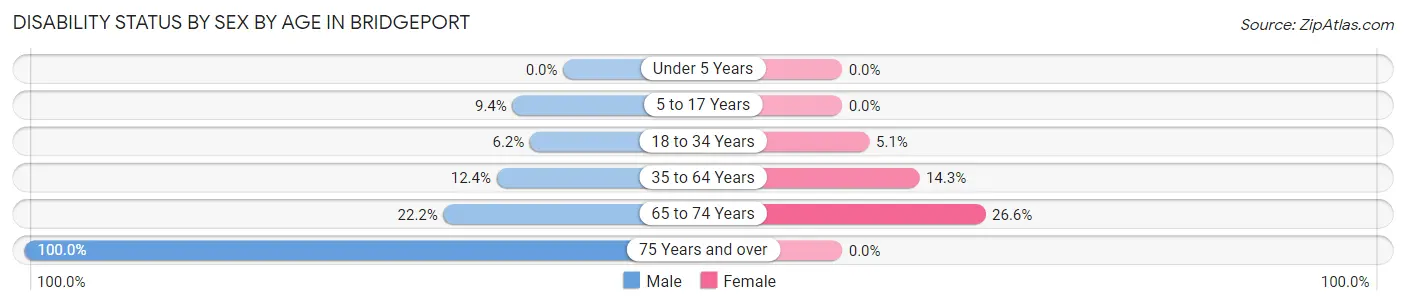
| Age Bracket | Male | Female |
| Under 5 Years | 0 (0.0%) | 0 (0.0%) |
| 5 to 17 Years | 18 (9.4%) | 0 (0.0%) |
| 18 to 34 Years | 5 (6.2%) | 7 (5.1%) |
| 35 to 64 Years | 34 (12.4%) | 46 (14.3%) |
| 65 to 74 Years | 18 (22.2%) | 25 (26.6%) |
| 75 Years and over | 22 (100.0%) | 0 (0.0%) |
Disability Class by Sex by Age in Bridgeport
Disability Class: Hearing Difficulty
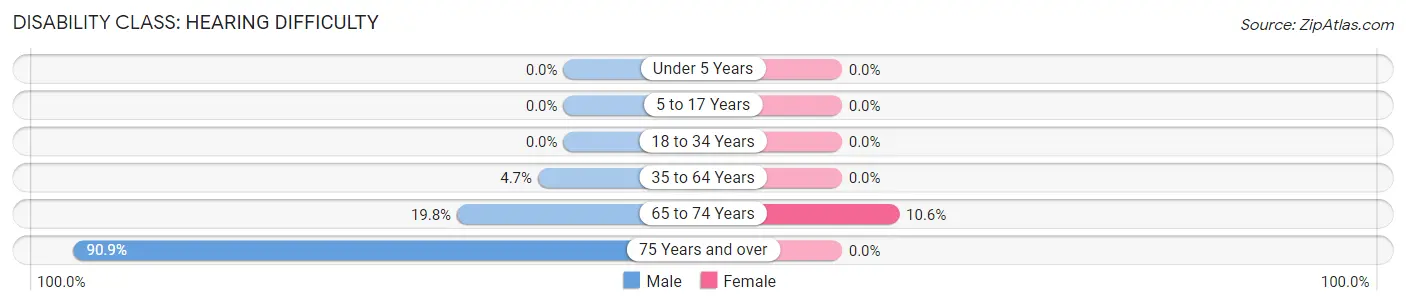
| Age Bracket | Male | Female |
| Under 5 Years | 0 (0.0%) | 0 (0.0%) |
| 5 to 17 Years | 0 (0.0%) | 0 (0.0%) |
| 18 to 34 Years | 0 (0.0%) | 0 (0.0%) |
| 35 to 64 Years | 13 (4.7%) | 0 (0.0%) |
| 65 to 74 Years | 16 (19.8%) | 10 (10.6%) |
| 75 Years and over | 20 (90.9%) | 0 (0.0%) |
Disability Class: Vision Difficulty
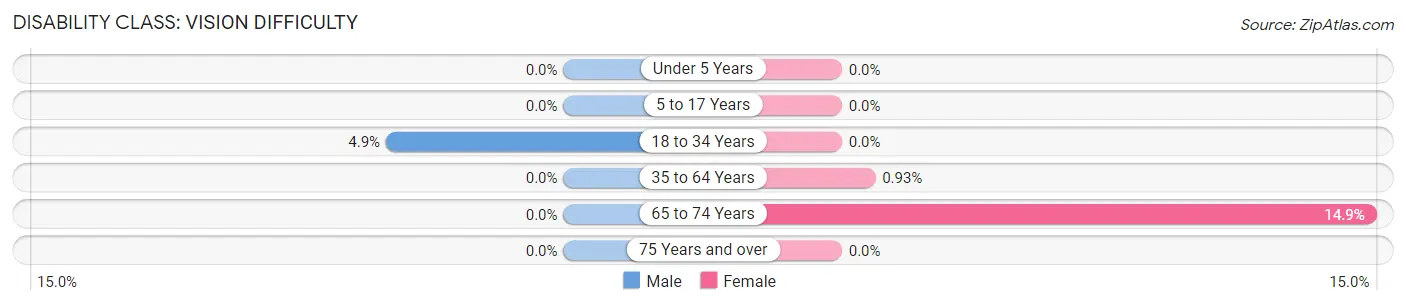
| Age Bracket | Male | Female |
| Under 5 Years | 0 (0.0%) | 0 (0.0%) |
| 5 to 17 Years | 0 (0.0%) | 0 (0.0%) |
| 18 to 34 Years | 4 (4.9%) | 0 (0.0%) |
| 35 to 64 Years | 0 (0.0%) | 3 (0.9%) |
| 65 to 74 Years | 0 (0.0%) | 14 (14.9%) |
| 75 Years and over | 0 (0.0%) | 0 (0.0%) |
Disability Class: Cognitive Difficulty
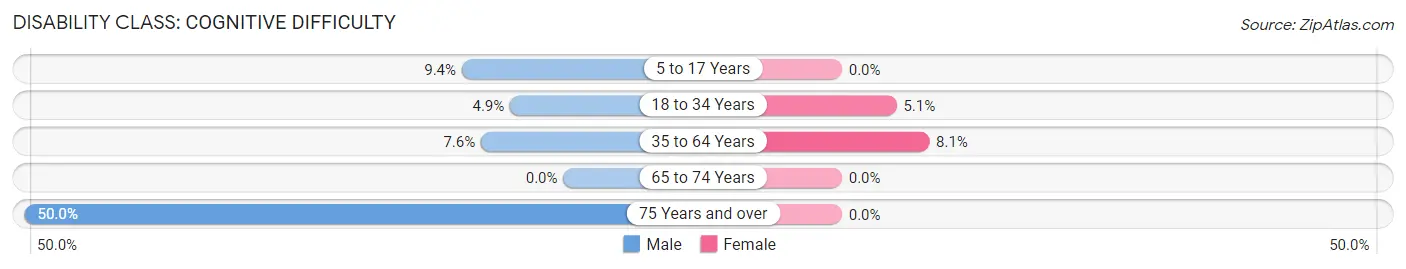
| Age Bracket | Male | Female |
| 5 to 17 Years | 18 (9.4%) | 0 (0.0%) |
| 18 to 34 Years | 4 (4.9%) | 7 (5.1%) |
| 35 to 64 Years | 21 (7.6%) | 26 (8.1%) |
| 65 to 74 Years | 0 (0.0%) | 0 (0.0%) |
| 75 Years and over | 11 (50.0%) | 0 (0.0%) |
Disability Class: Ambulatory Difficulty
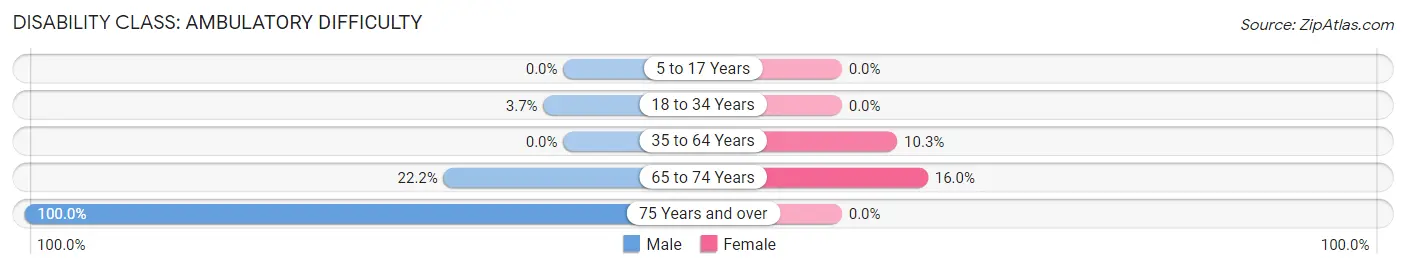
| Age Bracket | Male | Female |
| 5 to 17 Years | 0 (0.0%) | 0 (0.0%) |
| 18 to 34 Years | 3 (3.7%) | 0 (0.0%) |
| 35 to 64 Years | 0 (0.0%) | 33 (10.3%) |
| 65 to 74 Years | 18 (22.2%) | 15 (16.0%) |
| 75 Years and over | 22 (100.0%) | 0 (0.0%) |
Disability Class: Self-Care Difficulty
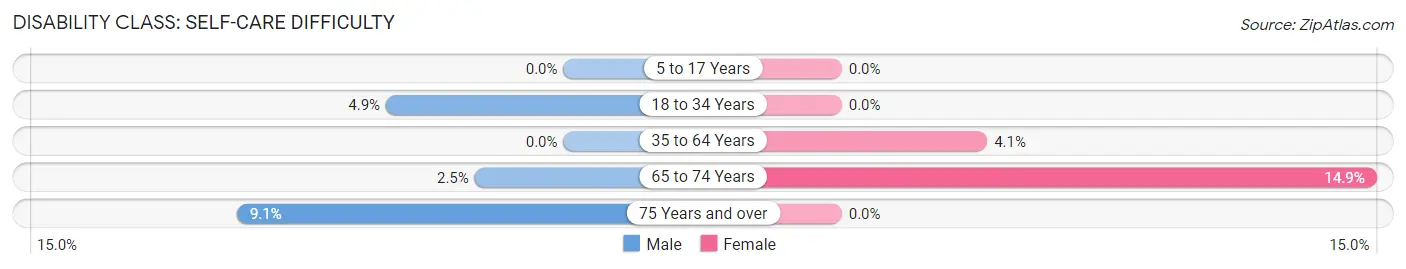
| Age Bracket | Male | Female |
| 5 to 17 Years | 0 (0.0%) | 0 (0.0%) |
| 18 to 34 Years | 4 (4.9%) | 0 (0.0%) |
| 35 to 64 Years | 0 (0.0%) | 13 (4.1%) |
| 65 to 74 Years | 2 (2.5%) | 14 (14.9%) |
| 75 Years and over | 2 (9.1%) | 0 (0.0%) |
Technology Access in Bridgeport
Computing Device Access in Bridgeport
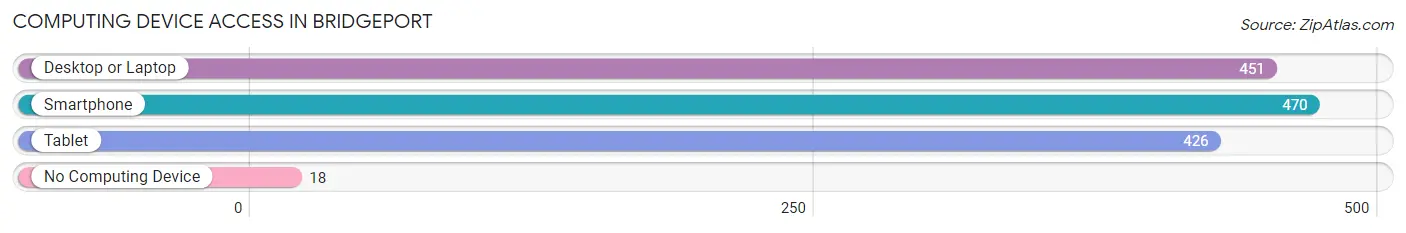
| Device Type | # Households | % Households |
| Desktop or Laptop | 451 | 78.3% |
| Smartphone | 470 | 81.6% |
| Tablet | 426 | 74.0% |
| No Computing Device | 18 | 3.1% |
| Total | 576 | 100.0% |
Internet Access in Bridgeport
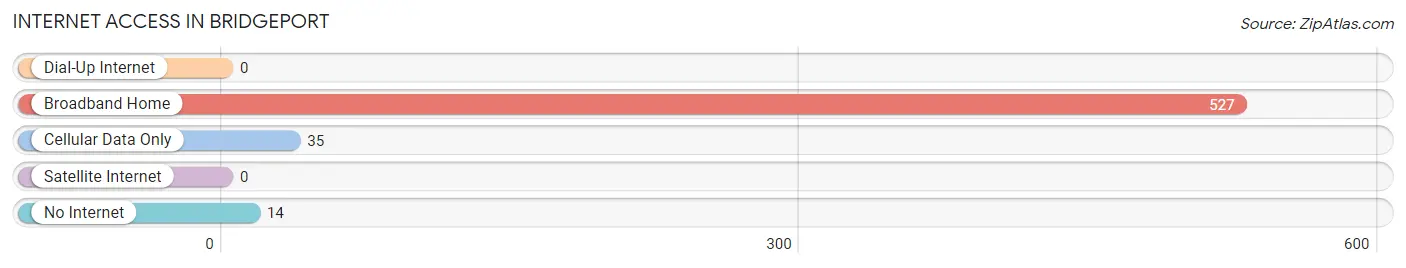
| Internet Type | # Households | % Households |
| Dial-Up Internet | 0 | 0.0% |
| Broadband Home | 527 | 91.5% |
| Cellular Data Only | 35 | 6.1% |
| Satellite Internet | 0 | 0.0% |
| No Internet | 14 | 2.4% |
| Total | 576 | 100.0% |
Bridgeport Summary
Bridgeport is a small town located in the state of New York. It is situated in Madison County, and is part of the Syracuse Metropolitan Statistical Area. The town has a population of approximately 1,400 people, and is located on the eastern shore of Oneida Lake.
History
The area that is now Bridgeport was originally inhabited by the Oneida people, who were part of the Iroquois Confederacy. The first European settlers arrived in the area in the late 1700s, and the town was officially established in 1807. The town was named after the bridge that was built across the Oneida River in 1810.
The town grew slowly over the next few decades, and by the mid-1800s it had become a popular destination for tourists. The town was home to several resorts, and the Oneida Lake steamboat was a popular way to travel to and from the area.
In the late 1800s, the town began to experience a period of industrialization. The Oneida River was used to power several mills, and the town became a center for the production of paper and other goods. The town also became a popular destination for immigrants, and by the early 1900s the population had grown to over 1,000 people.
Geography
Bridgeport is located in Madison County, New York. It is situated on the eastern shore of Oneida Lake, and is bordered by the towns of Sullivan, Lenox, and Stockbridge. The town has a total area of 4.2 square miles, all of which is land.
The town is located in the Finger Lakes region of New York, and is part of the Syracuse Metropolitan Statistical Area. The town is located approximately 25 miles east of Syracuse, and is accessible via Interstate 81.
Economy
The economy of Bridgeport is largely based on tourism and agriculture. The town is home to several resorts and campgrounds, and is a popular destination for fishing and boating. The town is also home to several wineries, and is a popular destination for wine tasting.
The town is also home to several small businesses, including a grocery store, a hardware store, and a few restaurants. The town is also home to a small manufacturing plant, which produces paper products.
Demographics
As of the 2010 census, the population of Bridgeport was 1,400 people. The racial makeup of the town was 97.6% White, 0.6% African American, 0.3% Native American, 0.3% Asian, and 0.9% from other races. Hispanic or Latino of any race were 1.3% of the population.
The median household income in Bridgeport was $45,000, and the median family income was $50,000. The per capita income for the town was $20,000. About 8.3% of families and 10.3% of the population were below the poverty line, including 14.3% of those under the age of 18 and 5.3% of those 65 and older.
Common Questions
What is Per Capita Income in Bridgeport?
Per Capita income in Bridgeport is $23,215.
What is the Median Family Income in Bridgeport?
Median Family Income in Bridgeport is $67,526.
What is the Median Household income in Bridgeport?
Median Household Income in Bridgeport is $58,491.
What is Income or Wage Gap in Bridgeport?
Income or Wage Gap in Bridgeport is 25.2%.
Women in Bridgeport earn 74.8 cents for every dollar earned by a man.
What is Inequality or Gini Index in Bridgeport?
Inequality or Gini Index in Bridgeport is 0.33.
What is the Total Population of Bridgeport?
Total Population of Bridgeport is 1,551.
What is the Total Male Population of Bridgeport?
Total Male Population of Bridgeport is 724.
What is the Total Female Population of Bridgeport?
Total Female Population of Bridgeport is 827.
What is the Ratio of Males per 100 Females in Bridgeport?
There are 87.55 Males per 100 Females in Bridgeport.
What is the Ratio of Females per 100 Males in Bridgeport?
There are 114.23 Females per 100 Males in Bridgeport.
What is the Median Population Age in Bridgeport?
Median Population Age in Bridgeport is 37.5 Years.
What is the Average Family Size in Bridgeport
Average Family Size in Bridgeport is 3.2 People.
What is the Average Household Size in Bridgeport
Average Household Size in Bridgeport is 2.7 People.
How Large is the Labor Force in Bridgeport?
There are 627 People in the Labor Forcein in Bridgeport.
What is the Percentage of People in the Labor Force in Bridgeport?
59.1% of People are in the Labor Force in Bridgeport.
What is the Unemployment Rate in Bridgeport?
Unemployment Rate in Bridgeport is 0.3%.