Bolivar, NY Map & Demographics
Bolivar Map
Bolivar Overview
$27,265
PER CAPITA INCOME
$62,679
AVG FAMILY INCOME
$50,509
AVG HOUSEHOLD INCOME
14.1%
WAGE / INCOME GAP [ % ]
85.9¢/ $1
WAGE / INCOME GAP [ $ ]
0.38
INEQUALITY / GINI INDEX
1,050
TOTAL POPULATION
517
MALE POPULATION
533
FEMALE POPULATION
97.00
MALES / 100 FEMALES
103.09
FEMALES / 100 MALES
39.1
MEDIAN AGE
3.1
AVG FAMILY SIZE
2.4
AVG HOUSEHOLD SIZE
469
LABOR FORCE [ PEOPLE ]
54.1%
PERCENT IN LABOR FORCE
6.2%
UNEMPLOYMENT RATE
Bolivar Zip Codes
Bolivar Area Codes
Income in Bolivar
Income Overview in Bolivar
Per Capita Income in Bolivar is $27,265, while median incomes of families and households are $62,679 and $50,509 respectively.
| Characteristic | Number | Measure |
| Per Capita Income | 1,050 | $27,265 |
| Median Family Income | 263 | $62,679 |
| Mean Family Income | 263 | $75,718 |
| Median Household Income | 433 | $50,509 |
| Mean Household Income | 433 | $64,232 |
| Income Deficit | 263 | $0 |
| Wage / Income Gap (%) | 1,050 | 14.12% |
| Wage / Income Gap ($) | 1,050 | 85.88¢ per $1 |
| Gini / Inequality Index | 1,050 | 0.38 |
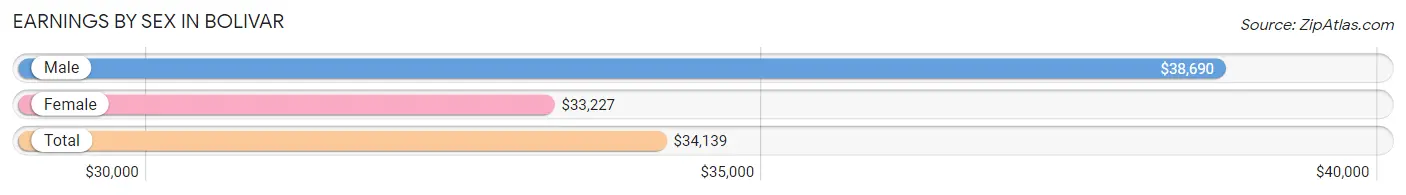
Earnings by Sex in Bolivar
Average Earnings in Bolivar are $34,139, $38,690 for men and $33,227 for women, a difference of 14.1%.
| Sex | Number | Average Earnings |
| Male | 236 (47.5%) | $38,690 |
| Female | 261 (52.5%) | $33,227 |
| Total | 497 (100.0%) | $34,139 |
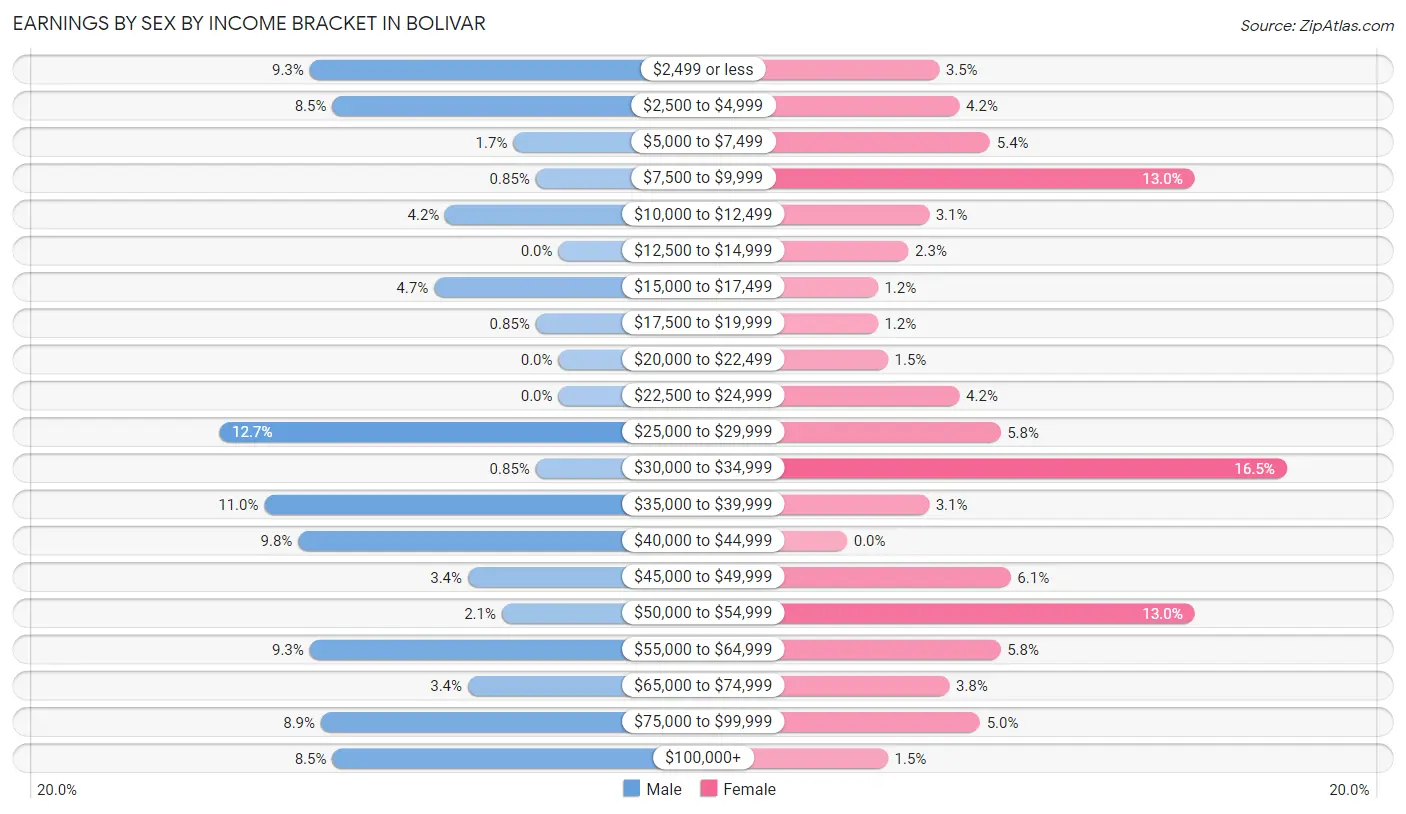
Earnings by Sex by Income Bracket in Bolivar
The most common earnings brackets in Bolivar are $25,000 to $29,999 for men (30 | 12.7%) and $30,000 to $34,999 for women (43 | 16.5%).
| Income | Male | Female |
| $2,499 or less | 22 (9.3%) | 9 (3.5%) |
| $2,500 to $4,999 | 20 (8.5%) | 11 (4.2%) |
| $5,000 to $7,499 | 4 (1.7%) | 14 (5.4%) |
| $7,500 to $9,999 | 2 (0.9%) | 34 (13.0%) |
| $10,000 to $12,499 | 10 (4.2%) | 8 (3.1%) |
| $12,500 to $14,999 | 0 (0.0%) | 6 (2.3%) |
| $15,000 to $17,499 | 11 (4.7%) | 3 (1.1%) |
| $17,500 to $19,999 | 2 (0.9%) | 3 (1.1%) |
| $20,000 to $22,499 | 0 (0.0%) | 4 (1.5%) |
| $22,500 to $24,999 | 0 (0.0%) | 11 (4.2%) |
| $25,000 to $29,999 | 30 (12.7%) | 15 (5.8%) |
| $30,000 to $34,999 | 2 (0.9%) | 43 (16.5%) |
| $35,000 to $39,999 | 26 (11.0%) | 8 (3.1%) |
| $40,000 to $44,999 | 23 (9.8%) | 0 (0.0%) |
| $45,000 to $49,999 | 8 (3.4%) | 16 (6.1%) |
| $50,000 to $54,999 | 5 (2.1%) | 34 (13.0%) |
| $55,000 to $64,999 | 22 (9.3%) | 15 (5.8%) |
| $65,000 to $74,999 | 8 (3.4%) | 10 (3.8%) |
| $75,000 to $99,999 | 21 (8.9%) | 13 (5.0%) |
| $100,000+ | 20 (8.5%) | 4 (1.5%) |
| Total | 236 (100.0%) | 261 (100.0%) |
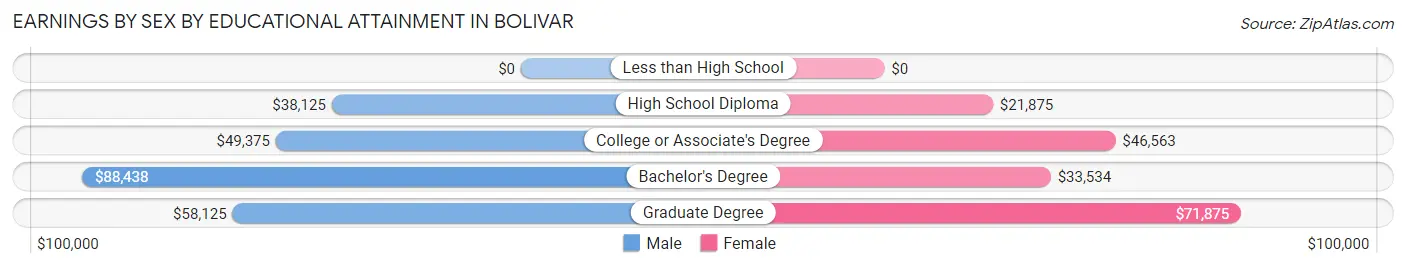
Earnings by Sex by Educational Attainment in Bolivar
Average earnings in Bolivar are $41,359 for men and $34,913 for women, a difference of 15.6%. Men with an educational attainment of bachelor's degree enjoy the highest average annual earnings of $88,438, while those with high school diploma education earn the least with $38,125. Women with an educational attainment of graduate degree earn the most with the average annual earnings of $71,875, while those with high school diploma education have the smallest earnings of $21,875.
| Educational Attainment | Male Income | Female Income |
| Less than High School | - | - |
| High School Diploma | $38,125 | $21,875 |
| College or Associate's Degree | $49,375 | $46,563 |
| Bachelor's Degree | $88,438 | $33,534 |
| Graduate Degree | $58,125 | $71,875 |
| Total | $41,359 | $34,913 |
Family Income in Bolivar
Family Income Brackets in Bolivar
According to the Bolivar family income data, there are 70 families falling into the $100,000 to $149,999 income range, which is the most common income bracket and makes up 26.6% of all families.
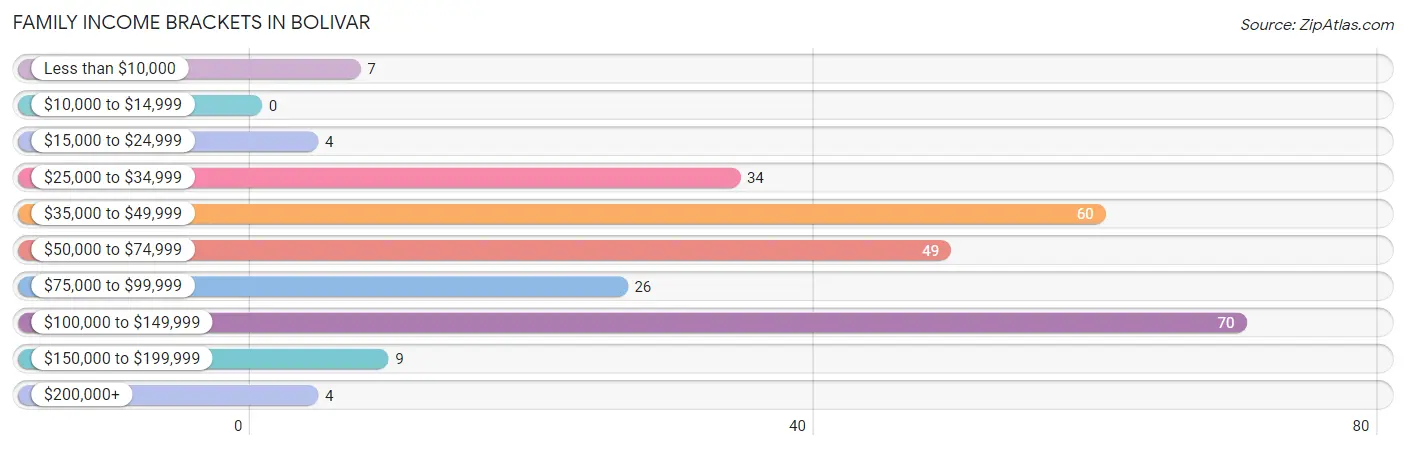
| Income Bracket | # Families | % Families |
| Less than $10,000 | 7 | 2.7% |
| $10,000 to $14,999 | 0 | 0.0% |
| $15,000 to $24,999 | 4 | 1.5% |
| $25,000 to $34,999 | 34 | 12.9% |
| $35,000 to $49,999 | 60 | 22.8% |
| $50,000 to $74,999 | 49 | 18.6% |
| $75,000 to $99,999 | 26 | 9.9% |
| $100,000 to $149,999 | 70 | 26.6% |
| $150,000 to $199,999 | 9 | 3.4% |
| $200,000+ | 4 | 1.5% |
Family Income by Famaliy Size in Bolivar
7+ person families (8 | 3.0%) account for the highest median family income in Bolivar with $84,167 per family, while 2-person families (132 | 50.2%) have the highest median income of $26,042 per family member.
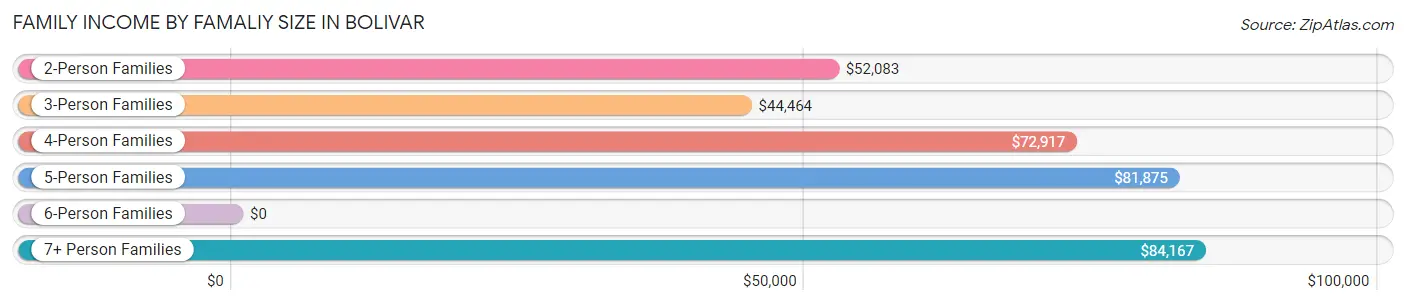
| Income Bracket | # Families | Median Income |
| 2-Person Families | 132 (50.2%) | $52,083 |
| 3-Person Families | 65 (24.7%) | $44,464 |
| 4-Person Families | 31 (11.8%) | $72,917 |
| 5-Person Families | 27 (10.3%) | $81,875 |
| 6-Person Families | 0 (0.0%) | $0 |
| 7+ Person Families | 8 (3.0%) | $84,167 |
| Total | 263 (100.0%) | $62,679 |
Family Income by Number of Earners in Bolivar
The median family income in Bolivar is $62,679, with families comprising 2 earners (84) having the highest median family income of $106,250, while families with 1 earner (120) have the lowest median family income of $46,622, accounting for 31.9% and 45.6% of families, respectively.
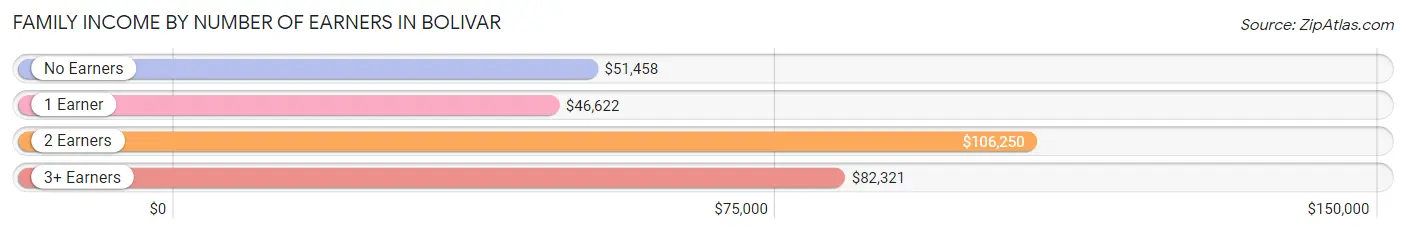
| Number of Earners | # Families | Median Income |
| No Earners | 33 (12.6%) | $51,458 |
| 1 Earner | 120 (45.6%) | $46,622 |
| 2 Earners | 84 (31.9%) | $106,250 |
| 3+ Earners | 26 (9.9%) | $82,321 |
| Total | 263 (100.0%) | $62,679 |
Household Income in Bolivar
Household Income Brackets in Bolivar
With 88 households falling in the category, the $35,000 to $49,999 income range is the most frequent in Bolivar, accounting for 20.3% of all households. In contrast, only 7 households (1.6%) fall into the $200,000+ income bracket, making it the least populous group.
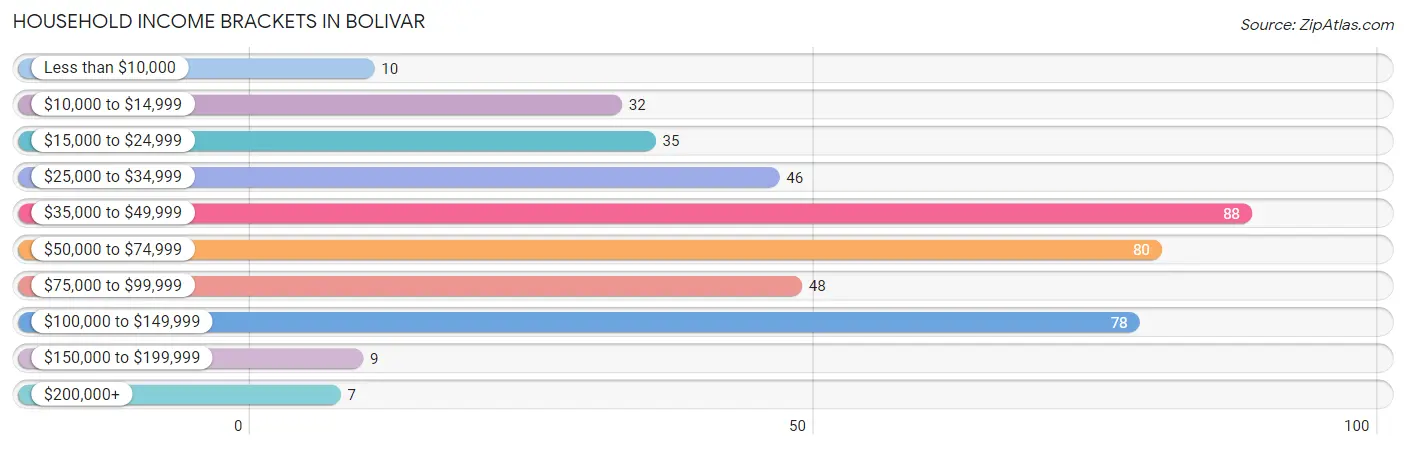
| Income Bracket | # Households | % Households |
| Less than $10,000 | 10 | 2.3% |
| $10,000 to $14,999 | 32 | 7.4% |
| $15,000 to $24,999 | 35 | 8.1% |
| $25,000 to $34,999 | 46 | 10.6% |
| $35,000 to $49,999 | 88 | 20.3% |
| $50,000 to $74,999 | 80 | 18.5% |
| $75,000 to $99,999 | 48 | 11.1% |
| $100,000 to $149,999 | 78 | 18.0% |
| $150,000 to $199,999 | 9 | 2.1% |
| $200,000+ | 7 | 1.6% |
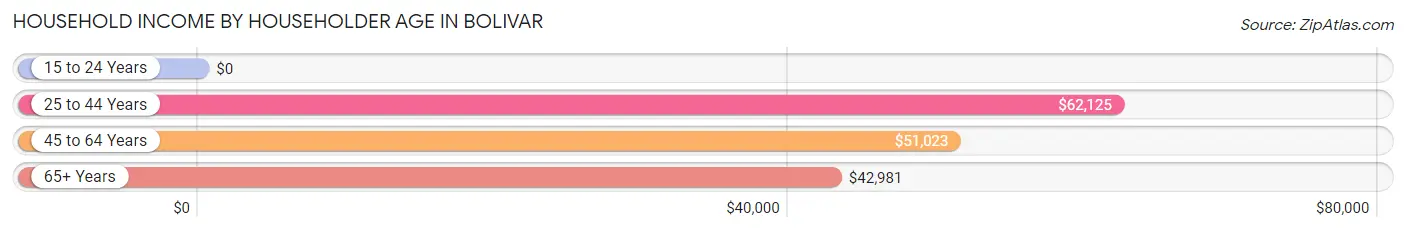
Household Income by Householder Age in Bolivar
The median household income in Bolivar is $50,509, with the highest median household income of $62,125 found in the 25 to 44 years age bracket for the primary householder. A total of 171 households (39.5%) fall into this category.
| Income Bracket | # Households | Median Income |
| 15 to 24 Years | 0 (0.0%) | $0 |
| 25 to 44 Years | 171 (39.5%) | $62,125 |
| 45 to 64 Years | 109 (25.2%) | $51,023 |
| 65+ Years | 153 (35.3%) | $42,981 |
| Total | 433 (100.0%) | $50,509 |
Poverty in Bolivar
Income Below Poverty by Sex and Age in Bolivar
With 13.7% poverty level for males and 13.0% for females among the residents of Bolivar, 18 to 24 year old males and 16 and 17 year old females are the most vulnerable to poverty, with 20 males (43.5%) and 11 females (61.1%) in their respective age groups living below the poverty level.
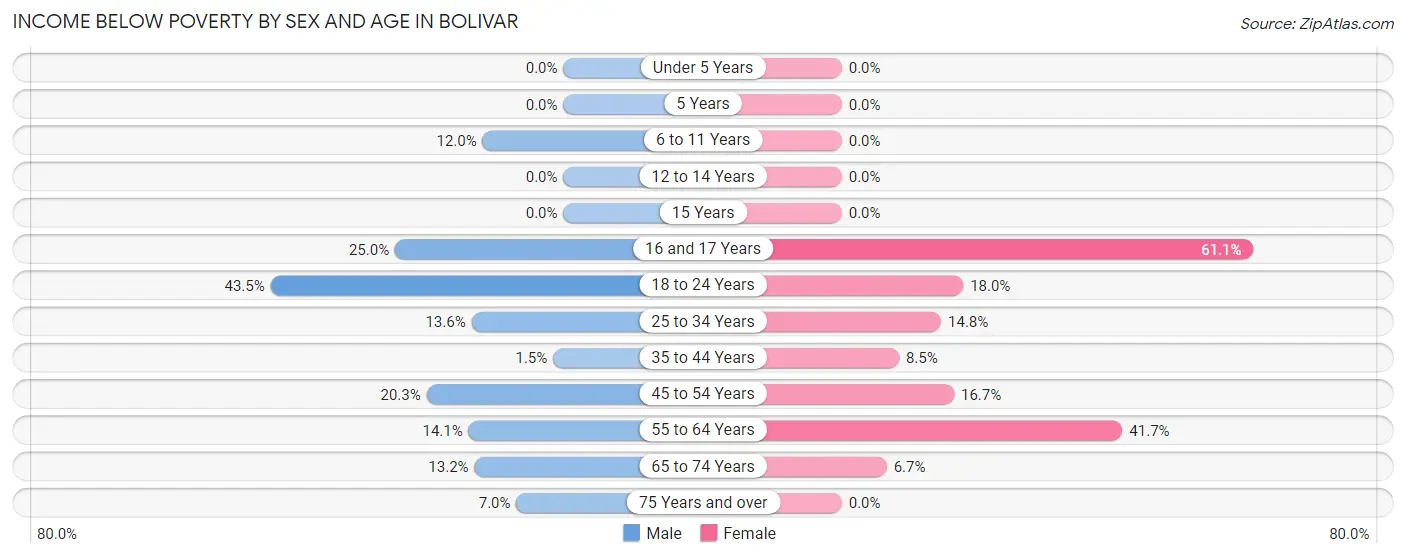
| Age Bracket | Male | Female |
| Under 5 Years | 0 (0.0%) | 0 (0.0%) |
| 5 Years | 0 (0.0%) | 0 (0.0%) |
| 6 to 11 Years | 3 (12.0%) | 0 (0.0%) |
| 12 to 14 Years | 0 (0.0%) | 0 (0.0%) |
| 15 Years | 0 (0.0%) | 0 (0.0%) |
| 16 and 17 Years | 5 (25.0%) | 11 (61.1%) |
| 18 to 24 Years | 20 (43.5%) | 11 (18.0%) |
| 25 to 34 Years | 9 (13.6%) | 9 (14.7%) |
| 35 to 44 Years | 1 (1.5%) | 9 (8.5%) |
| 45 to 54 Years | 13 (20.3%) | 5 (16.7%) |
| 55 to 64 Years | 10 (14.1%) | 20 (41.7%) |
| 65 to 74 Years | 7 (13.2%) | 4 (6.7%) |
| 75 Years and over | 3 (7.0%) | 0 (0.0%) |
| Total | 71 (13.7%) | 69 (13.0%) |
Income Above Poverty by Sex and Age in Bolivar
According to the poverty statistics in Bolivar, males aged under 5 years and females aged under 5 years are the age groups that are most secure financially, with 100.0% of males and 100.0% of females in these age groups living above the poverty line.
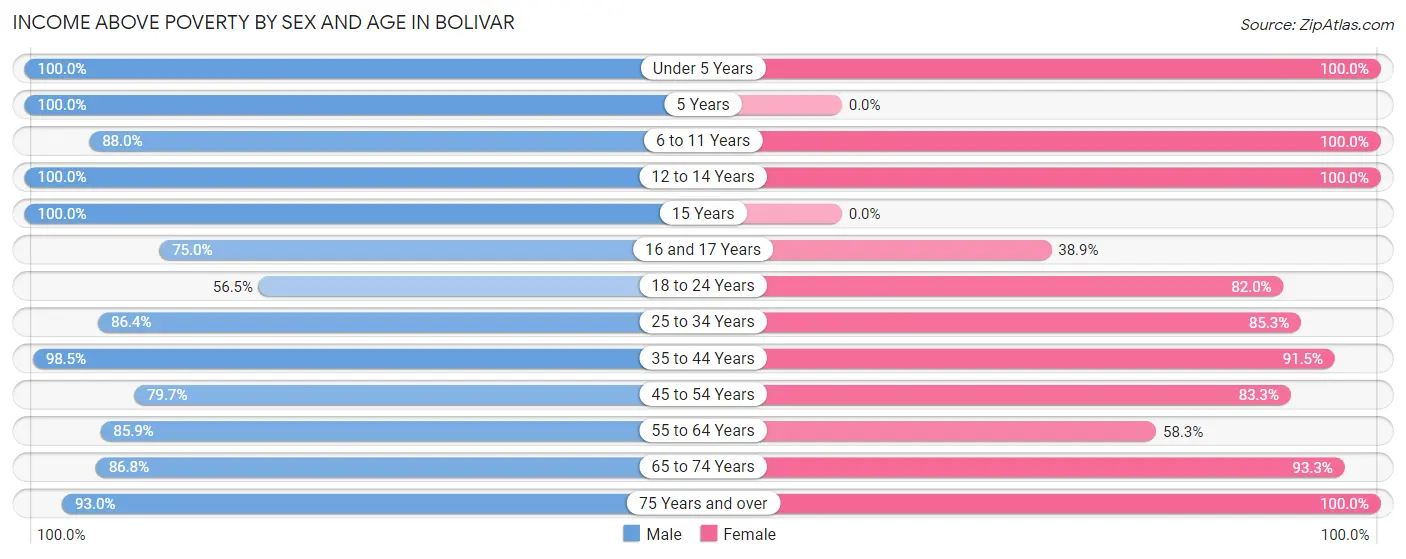
| Age Bracket | Male | Female |
| Under 5 Years | 19 (100.0%) | 34 (100.0%) |
| 5 Years | 4 (100.0%) | 0 (0.0%) |
| 6 to 11 Years | 22 (88.0%) | 30 (100.0%) |
| 12 to 14 Years | 27 (100.0%) | 28 (100.0%) |
| 15 Years | 13 (100.0%) | 0 (0.0%) |
| 16 and 17 Years | 15 (75.0%) | 7 (38.9%) |
| 18 to 24 Years | 26 (56.5%) | 50 (82.0%) |
| 25 to 34 Years | 57 (86.4%) | 52 (85.3%) |
| 35 to 44 Years | 65 (98.5%) | 97 (91.5%) |
| 45 to 54 Years | 51 (79.7%) | 25 (83.3%) |
| 55 to 64 Years | 61 (85.9%) | 28 (58.3%) |
| 65 to 74 Years | 46 (86.8%) | 56 (93.3%) |
| 75 Years and over | 40 (93.0%) | 54 (100.0%) |
| Total | 446 (86.3%) | 461 (87.0%) |
Income Below Poverty Among Married-Couple Families in Bolivar
The poverty statistics for married-couple families in Bolivar show that 4.2% or 7 of the total 165 families live below the poverty line. Families with 1 or 2 children have the highest poverty rate of 9.1%, comprising of 4 families. On the other hand, families with 3 or 4 children have the lowest poverty rate of 0.0%, which includes 0 families.
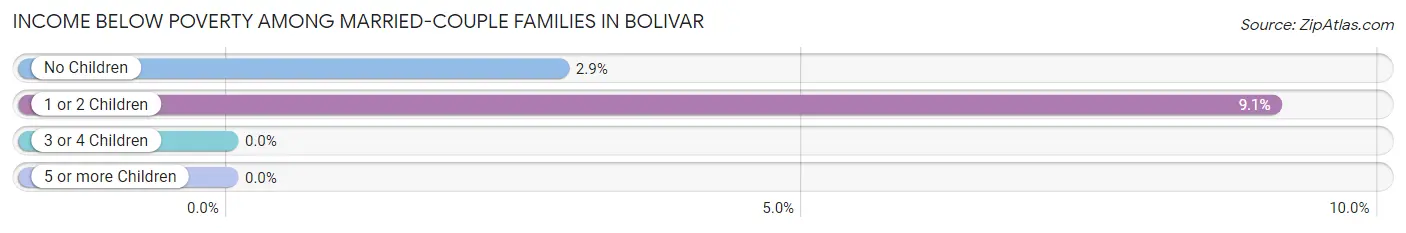
| Children | Above Poverty | Below Poverty |
| No Children | 101 (97.1%) | 3 (2.9%) |
| 1 or 2 Children | 40 (90.9%) | 4 (9.1%) |
| 3 or 4 Children | 13 (100.0%) | 0 (0.0%) |
| 5 or more Children | 4 (100.0%) | 0 (0.0%) |
| Total | 158 (95.8%) | 7 (4.2%) |
Income Below Poverty Among Single-Parent Households in Bolivar
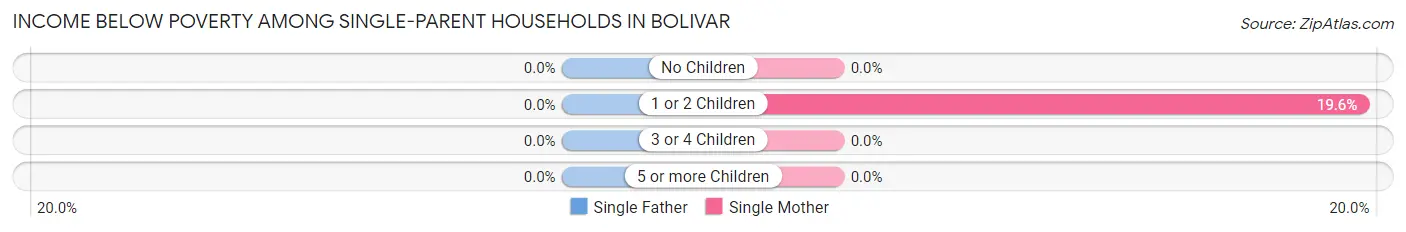
| Children | Single Father | Single Mother |
| No Children | 0 (0.0%) | 0 (0.0%) |
| 1 or 2 Children | 0 (0.0%) | 9 (19.6%) |
| 3 or 4 Children | 0 (0.0%) | 0 (0.0%) |
| 5 or more Children | 0 (0.0%) | 0 (0.0%) |
| Total | 0 (0.0%) | 9 (13.6%) |
Income Below Poverty Among Married-Couple vs Single-Parent Households in Bolivar
The poverty data for Bolivar shows that 7 of the married-couple family households (4.2%) and 9 of the single-parent households (9.2%) are living below the poverty level. Within the married-couple family households, those with 1 or 2 children have the highest poverty rate, with 4 households (9.1%) falling below the poverty line. Among the single-parent households, those with 1 or 2 children have the highest poverty rate, with 9 household (12.9%) living below poverty.
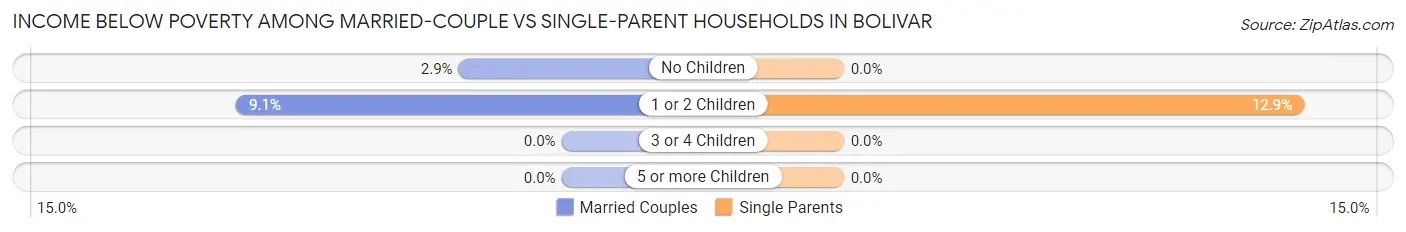
| Children | Married-Couple Families | Single-Parent Households |
| No Children | 3 (2.9%) | 0 (0.0%) |
| 1 or 2 Children | 4 (9.1%) | 9 (12.9%) |
| 3 or 4 Children | 0 (0.0%) | 0 (0.0%) |
| 5 or more Children | 0 (0.0%) | 0 (0.0%) |
| Total | 7 (4.2%) | 9 (9.2%) |
Race in Bolivar
The most populous races in Bolivar are White / Caucasian (1,016 | 96.8%), Two or more Races (16 | 1.5%), and Black / African American (11 | 1.1%).
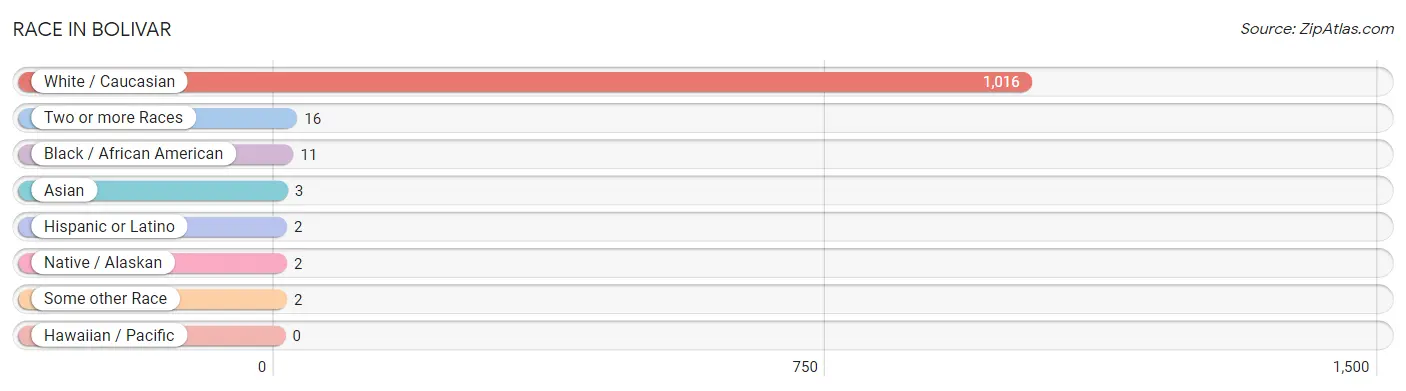
| Race | # Population | % Population |
| Asian | 3 | 0.3% |
| Black / African American | 11 | 1.1% |
| Hawaiian / Pacific | 0 | 0.0% |
| Hispanic or Latino | 2 | 0.2% |
| Native / Alaskan | 2 | 0.2% |
| White / Caucasian | 1,016 | 96.8% |
| Two or more Races | 16 | 1.5% |
| Some other Race | 2 | 0.2% |
| Total | 1,050 | 100.0% |
Ancestry in Bolivar
The most populous ancestries reported in Bolivar are German (240 | 22.9%), English (185 | 17.6%), Irish (166 | 15.8%), Italian (81 | 7.7%), and American (55 | 5.2%), together accounting for 69.2% of all Bolivar residents.
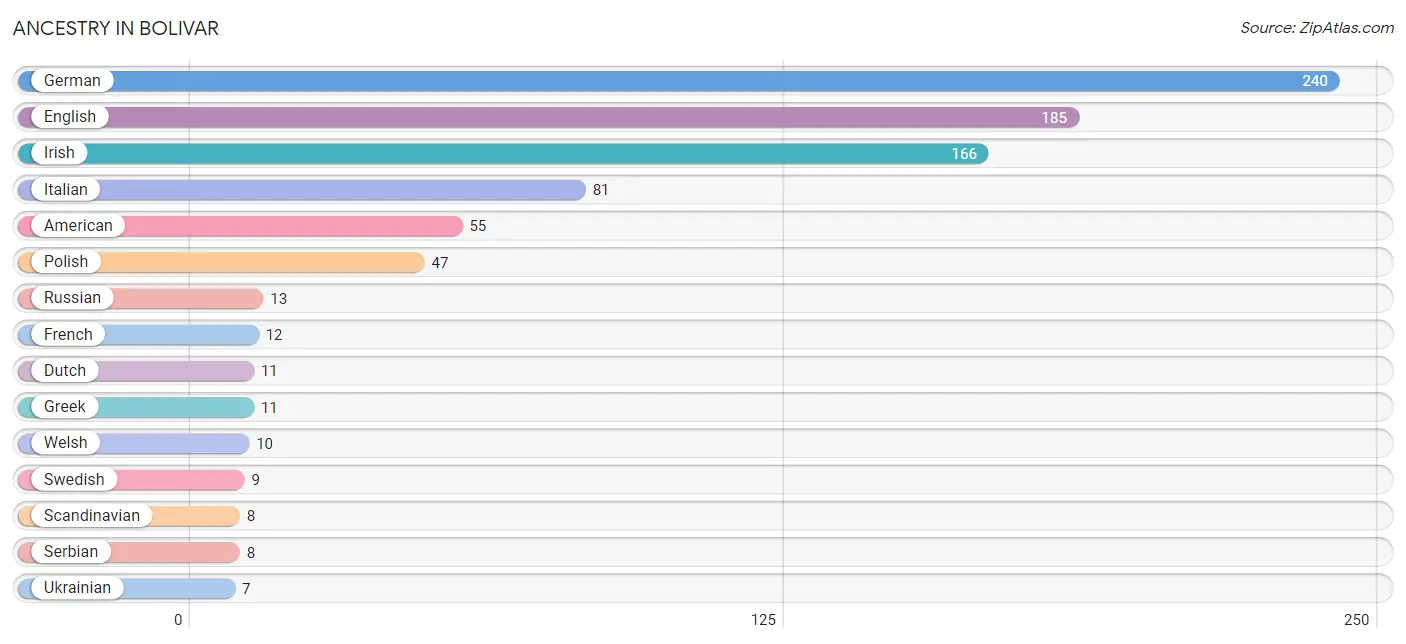
| Ancestry | # Population | % Population |
| American | 55 | 5.2% |
| Arab | 6 | 0.6% |
| Czechoslovakian | 6 | 0.6% |
| Dutch | 11 | 1.1% |
| English | 185 | 17.6% |
| European | 5 | 0.5% |
| French | 12 | 1.1% |
| German | 240 | 22.9% |
| Greek | 11 | 1.1% |
| Indian (Asian) | 2 | 0.2% |
| Irish | 166 | 15.8% |
| Iroquois | 5 | 0.5% |
| Italian | 81 | 7.7% |
| Lebanese | 6 | 0.6% |
| Mexican | 2 | 0.2% |
| Norwegian | 5 | 0.5% |
| Pennsylvania German | 6 | 0.6% |
| Polish | 47 | 4.5% |
| Russian | 13 | 1.2% |
| Scandinavian | 8 | 0.8% |
| Scotch-Irish | 5 | 0.5% |
| Scottish | 5 | 0.5% |
| Serbian | 8 | 0.8% |
| Slavic | 4 | 0.4% |
| Swedish | 9 | 0.9% |
| Swiss | 2 | 0.2% |
| Ukrainian | 7 | 0.7% |
| Welsh | 10 | 0.9% | View All 28 Rows |
Immigrants in Bolivar
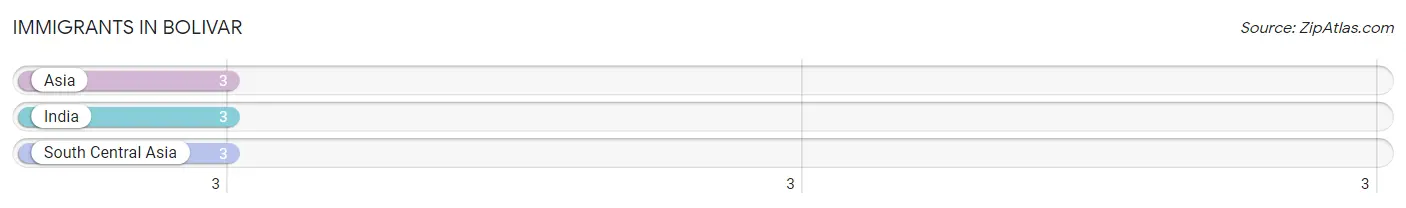
The most numerous immigrant groups reported in Bolivar came from Asia (3 | 0.3%), India (3 | 0.3%), and South Central Asia (3 | 0.3%), together accounting for 0.9% of all Bolivar residents.
| Immigration Origin | # Population | % Population |
| Asia | 3 | 0.3% |
| India | 3 | 0.3% |
| South Central Asia | 3 | 0.3% | View All 3 Rows |
Sex and Age in Bolivar
Sex and Age in Bolivar
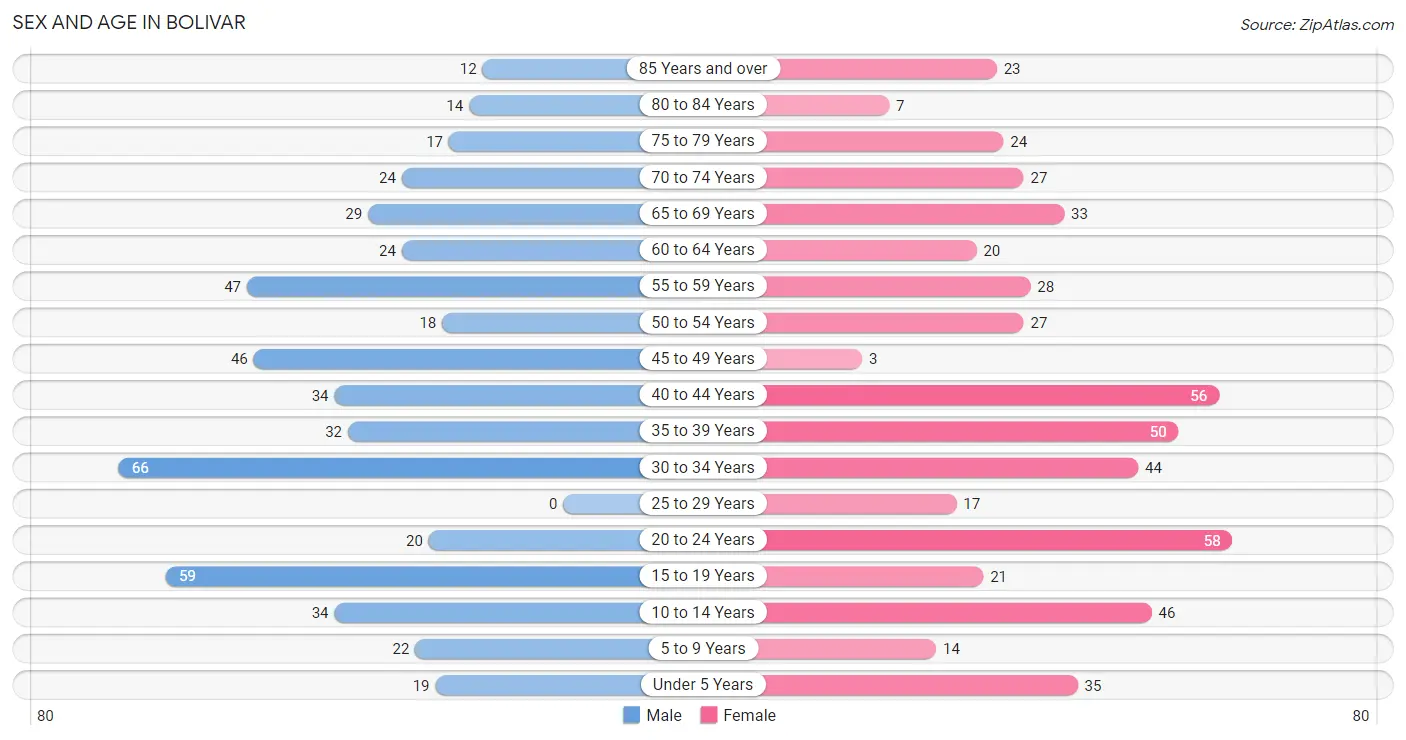
The most populous age groups in Bolivar are 30 to 34 Years (66 | 12.8%) for men and 20 to 24 Years (58 | 10.9%) for women.
| Age Bracket | Male | Female |
| Under 5 Years | 19 (3.7%) | 35 (6.6%) |
| 5 to 9 Years | 22 (4.3%) | 14 (2.6%) |
| 10 to 14 Years | 34 (6.6%) | 46 (8.6%) |
| 15 to 19 Years | 59 (11.4%) | 21 (3.9%) |
| 20 to 24 Years | 20 (3.9%) | 58 (10.9%) |
| 25 to 29 Years | 0 (0.0%) | 17 (3.2%) |
| 30 to 34 Years | 66 (12.8%) | 44 (8.3%) |
| 35 to 39 Years | 32 (6.2%) | 50 (9.4%) |
| 40 to 44 Years | 34 (6.6%) | 56 (10.5%) |
| 45 to 49 Years | 46 (8.9%) | 3 (0.6%) |
| 50 to 54 Years | 18 (3.5%) | 27 (5.1%) |
| 55 to 59 Years | 47 (9.1%) | 28 (5.2%) |
| 60 to 64 Years | 24 (4.6%) | 20 (3.7%) |
| 65 to 69 Years | 29 (5.6%) | 33 (6.2%) |
| 70 to 74 Years | 24 (4.6%) | 27 (5.1%) |
| 75 to 79 Years | 17 (3.3%) | 24 (4.5%) |
| 80 to 84 Years | 14 (2.7%) | 7 (1.3%) |
| 85 Years and over | 12 (2.3%) | 23 (4.3%) |
| Total | 517 (100.0%) | 533 (100.0%) |
Families and Households in Bolivar
Median Family Size in Bolivar
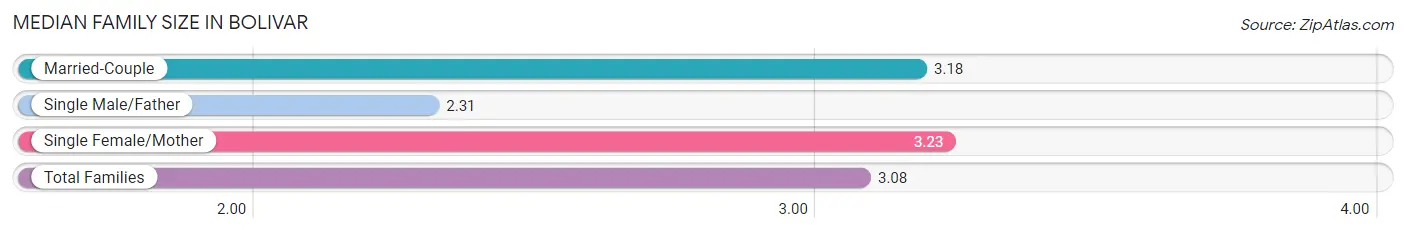
The median family size in Bolivar is 3.08 persons per family, with single female/mother families (66 | 25.1%) accounting for the largest median family size of 3.23 persons per family. On the other hand, single male/father families (32 | 12.2%) represent the smallest median family size with 2.31 persons per family.
| Family Type | # Families | Family Size |
| Married-Couple | 165 (62.7%) | 3.18 |
| Single Male/Father | 32 (12.2%) | 2.31 |
| Single Female/Mother | 66 (25.1%) | 3.23 |
| Total Families | 263 (100.0%) | 3.08 |
Median Household Size in Bolivar
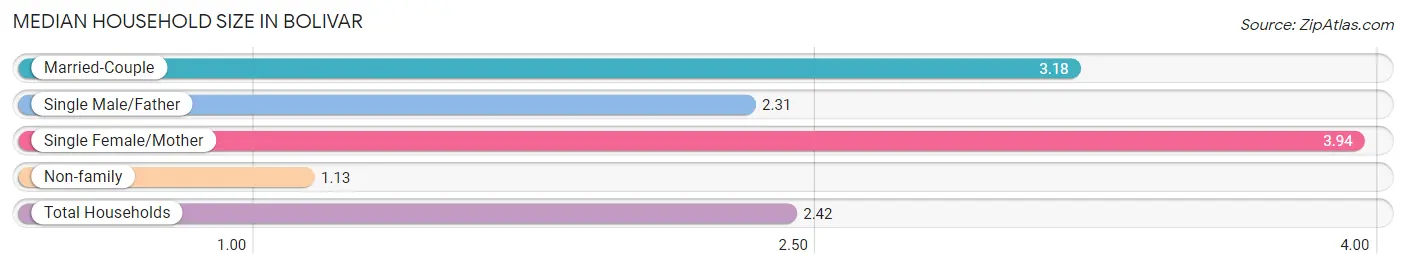
The median household size in Bolivar is 2.42 persons per household, with single female/mother households (66 | 15.2%) accounting for the largest median household size of 3.94 persons per household. non-family households (170 | 39.3%) represent the smallest median household size with 1.13 persons per household.
| Household Type | # Households | Household Size |
| Married-Couple | 165 (38.1%) | 3.18 |
| Single Male/Father | 32 (7.4%) | 2.31 |
| Single Female/Mother | 66 (15.2%) | 3.94 |
| Non-family | 170 (39.3%) | 1.13 |
| Total Households | 433 (100.0%) | 2.42 |
Household Size by Marriage Status in Bolivar
Out of a total of 433 households in Bolivar, 263 (60.7%) are family households, while 170 (39.3%) are nonfamily households. The most numerous type of family households are 2-person households, comprising 120, and the most common type of nonfamily households are 1-person households, comprising 150.
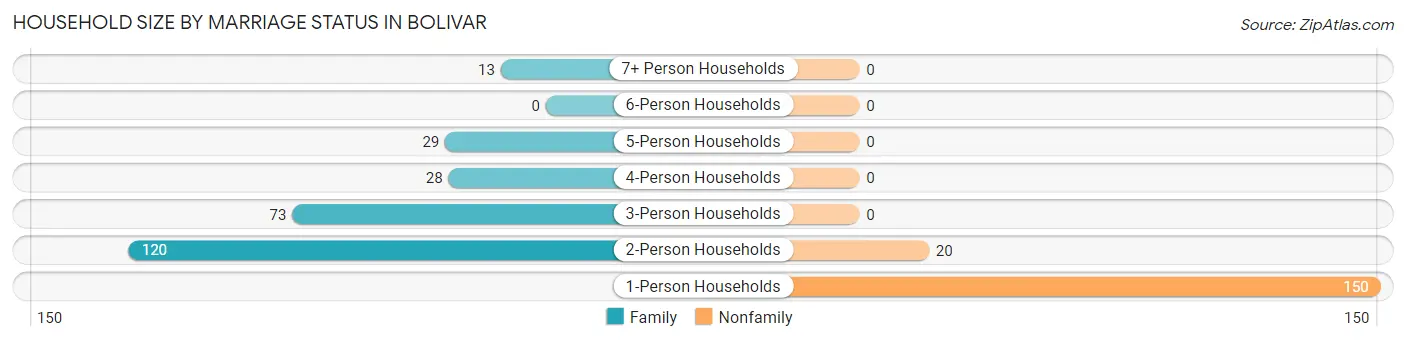
| Household Size | Family Households | Nonfamily Households |
| 1-Person Households | - | 150 (34.6%) |
| 2-Person Households | 120 (27.7%) | 20 (4.6%) |
| 3-Person Households | 73 (16.9%) | 0 (0.0%) |
| 4-Person Households | 28 (6.5%) | 0 (0.0%) |
| 5-Person Households | 29 (6.7%) | 0 (0.0%) |
| 6-Person Households | 0 (0.0%) | 0 (0.0%) |
| 7+ Person Households | 13 (3.0%) | 0 (0.0%) |
| Total | 263 (60.7%) | 170 (39.3%) |
Female Fertility in Bolivar
Fertility by Age in Bolivar
Average fertility rate in Bolivar is 36.0 births per 1,000 women. Women in the age bracket of 20 to 34 years have the highest fertility rate with 76.0 births per 1,000 women. Women in the age bracket of 20 to 34 years acount for 100.0% of all women with births.
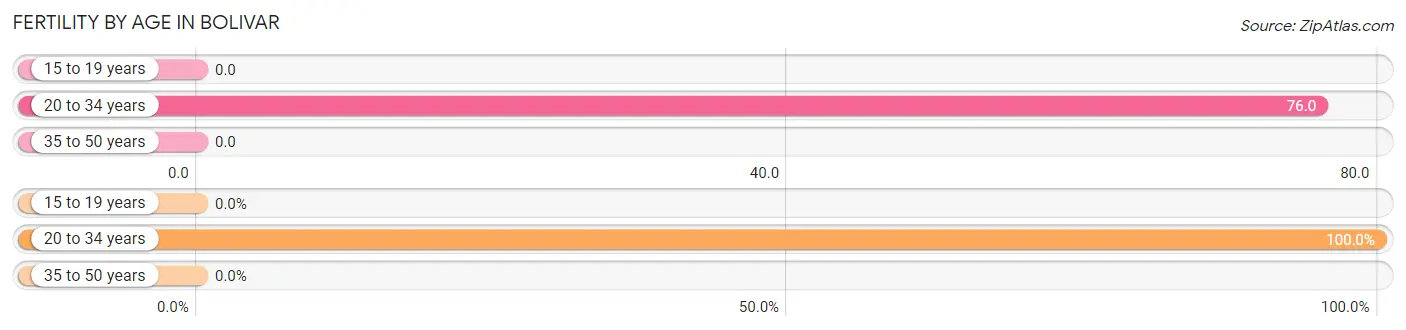
| Age Bracket | Women with Births | Births / 1,000 Women |
| 15 to 19 years | 0 (0.0%) | 0.0 |
| 20 to 34 years | 9 (100.0%) | 76.0 |
| 35 to 50 years | 0 (0.0%) | 0.0 |
| Total | 9 (100.0%) | 36.0 |
Fertility by Age by Marriage Status in Bolivar
44.4% of women with births (9) in Bolivar are married. The highest percentage of unmarried women with births falls into 20 to 34 years age bracket with 55.6% of them unmarried at the time of birth, while the lowest percentage of unmarried women with births belong to 20 to 34 years age bracket with 55.6% of them unmarried.
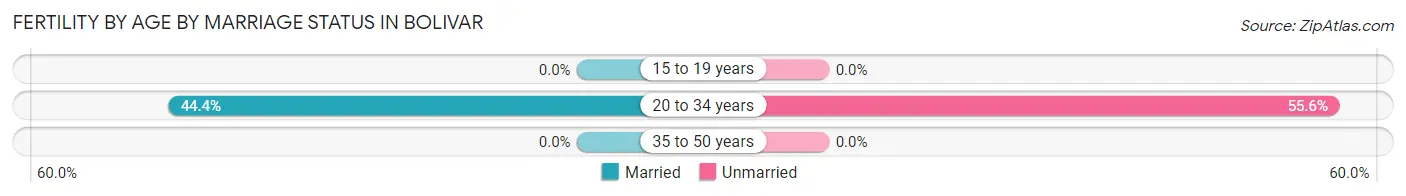
| Age Bracket | Married | Unmarried |
| 15 to 19 years | 0 (0.0%) | 0 (0.0%) |
| 20 to 34 years | 4 (44.4%) | 5 (55.6%) |
| 35 to 50 years | 0 (0.0%) | 0 (0.0%) |
| Total | 4 (44.4%) | 5 (55.6%) |
Fertility by Education in Bolivar
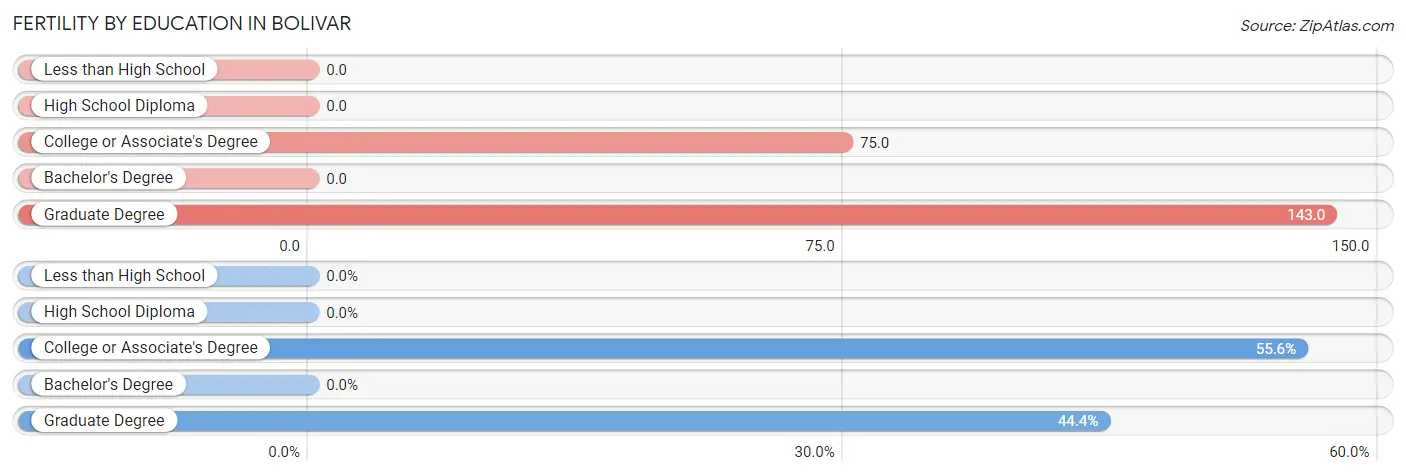
| Educational Attainment | Women with Births | Births / 1,000 Women |
| Less than High School | 0 (0.0%) | 0.0 |
| High School Diploma | 0 (0.0%) | 0.0 |
| College or Associate's Degree | 5 (55.6%) | 75.0 |
| Bachelor's Degree | 0 (0.0%) | 0.0 |
| Graduate Degree | 4 (44.4%) | 143.0 |
| Total | 9 (100.0%) | 36.0 |
Fertility by Education by Marriage Status in Bolivar
55.6% of women with births in Bolivar are unmarried. Women with the educational attainment of graduate degree are most likely to be married with 100.0% of them married at childbirth, while women with the educational attainment of college or associate's degree are least likely to be married with 100.0% of them unmarried at childbirth.
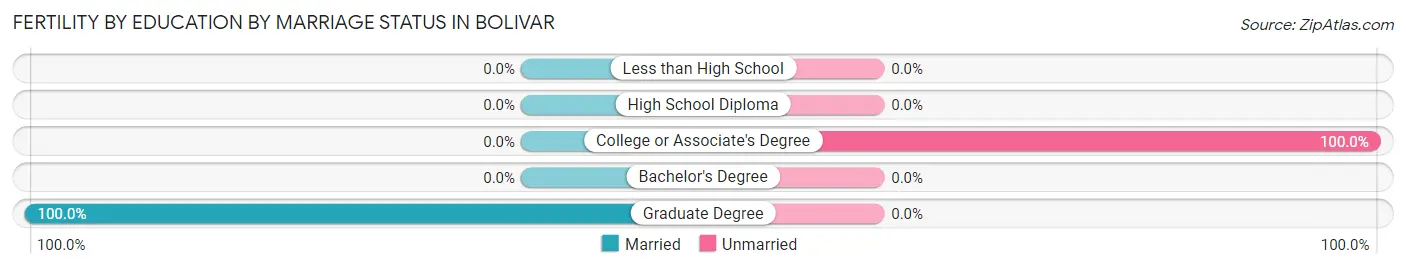
| Educational Attainment | Married | Unmarried |
| Less than High School | 0 (0.0%) | 0 (0.0%) |
| High School Diploma | 0 (0.0%) | 0 (0.0%) |
| College or Associate's Degree | 0 (0.0%) | 5 (100.0%) |
| Bachelor's Degree | 0 (0.0%) | 0 (0.0%) |
| Graduate Degree | 4 (100.0%) | 0 (0.0%) |
| Total | 4 (44.4%) | 5 (55.6%) |
Employment Characteristics in Bolivar
Employment by Class of Employer in Bolivar
Among the 436 employed individuals in Bolivar, private company employees (222 | 50.9%), local government employees (139 | 31.9%), and not-for-profit organizations (60 | 13.8%) make up the most common classes of employment.
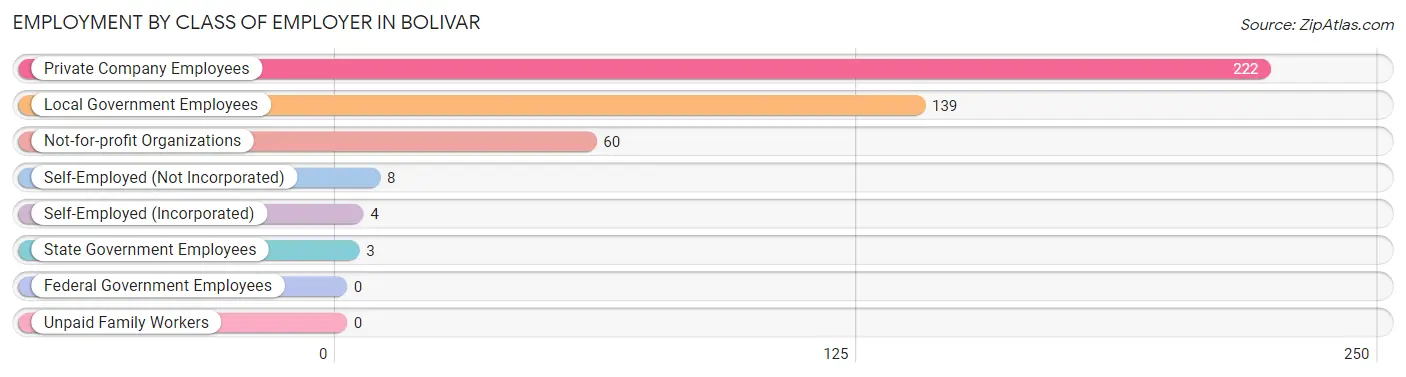
| Employer Class | # Employees | % Employees |
| Private Company Employees | 222 | 50.9% |
| Self-Employed (Incorporated) | 4 | 0.9% |
| Self-Employed (Not Incorporated) | 8 | 1.8% |
| Not-for-profit Organizations | 60 | 13.8% |
| Local Government Employees | 139 | 31.9% |
| State Government Employees | 3 | 0.7% |
| Federal Government Employees | 0 | 0.0% |
| Unpaid Family Workers | 0 | 0.0% |
| Total | 436 | 100.0% |
Employment Status by Age in Bolivar
According to the labor force statistics for Bolivar, out of the total population over 16 years of age (867), 54.1% or 469 individuals are in the labor force, with 6.2% or 29 of them unemployed. The age group with the highest labor force participation rate is 35 to 44 years, with 92.4% or 159 individuals in the labor force. Within the labor force, the 60 to 64 years age range has the highest percentage of unemployed individuals, with 31.4% or 11 of them being unemployed.
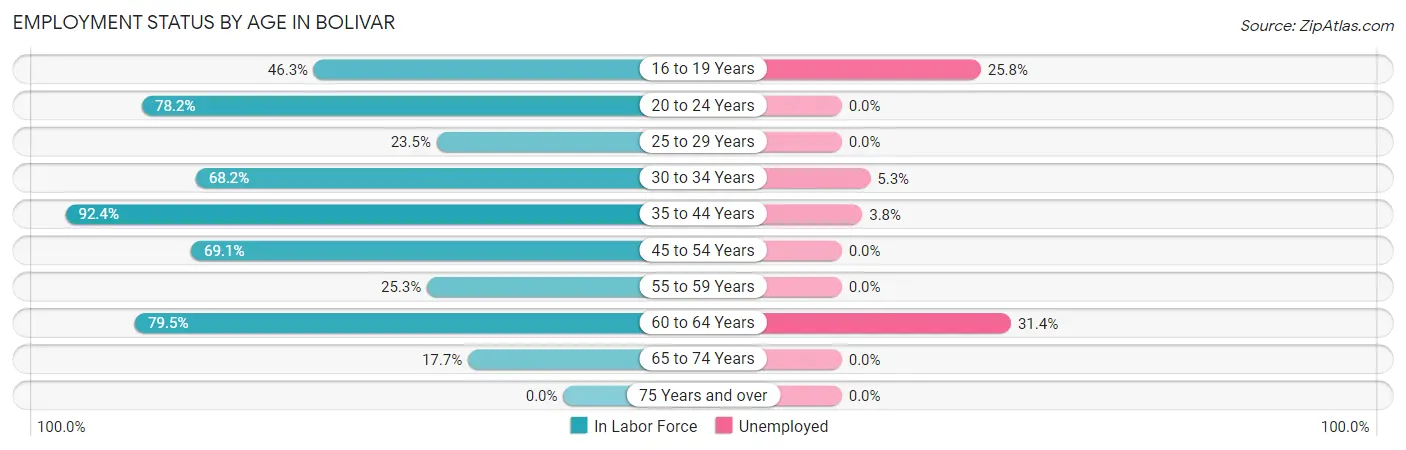
| Age Bracket | In Labor Force | Unemployed |
| 16 to 19 Years | 31 (46.3%) | 8 (25.8%) |
| 20 to 24 Years | 61 (78.2%) | 0 (0.0%) |
| 25 to 29 Years | 4 (23.5%) | 0 (0.0%) |
| 30 to 34 Years | 75 (68.2%) | 4 (5.3%) |
| 35 to 44 Years | 159 (92.4%) | 6 (3.8%) |
| 45 to 54 Years | 65 (69.1%) | 0 (0.0%) |
| 55 to 59 Years | 19 (25.3%) | 0 (0.0%) |
| 60 to 64 Years | 35 (79.5%) | 11 (31.4%) |
| 65 to 74 Years | 20 (17.7%) | 0 (0.0%) |
| 75 Years and over | 0 (0.0%) | 0 (0.0%) |
| Total | 469 (54.1%) | 29 (6.2%) |
Employment Status by Educational Attainment in Bolivar
According to labor force statistics for Bolivar, 69.7% of individuals (357) out of the total population between 25 and 64 years of age (512) are in the labor force, with 5.9% or 21 of them being unemployed. The group with the highest labor force participation rate are those with the educational attainment of college / associate degree, with 85.3% or 157 individuals in the labor force. Within the labor force, individuals with high school diploma education have the highest percentage of unemployment, with 25.0% or 20 of them being unemployed.
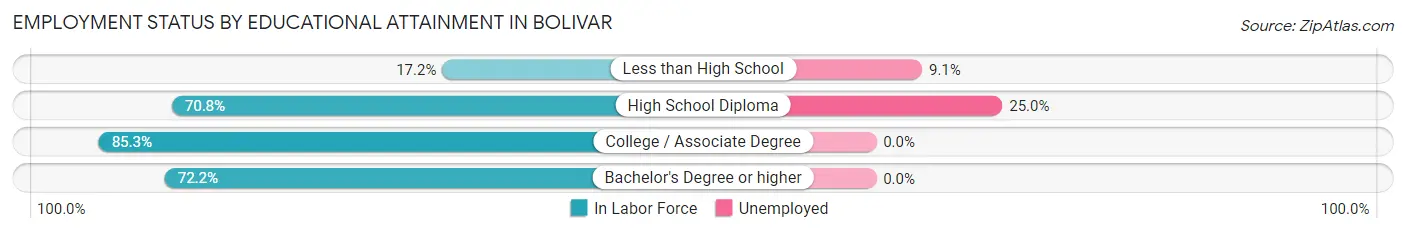
| Educational Attainment | In Labor Force | Unemployed |
| Less than High School | 11 (17.2%) | 6 (9.1%) |
| High School Diploma | 80 (70.8%) | 28 (25.0%) |
| College / Associate Degree | 157 (85.3%) | 0 (0.0%) |
| Bachelor's Degree or higher | 109 (72.2%) | 0 (0.0%) |
| Total | 357 (69.7%) | 30 (5.9%) |
Employment Occupations by Sex in Bolivar
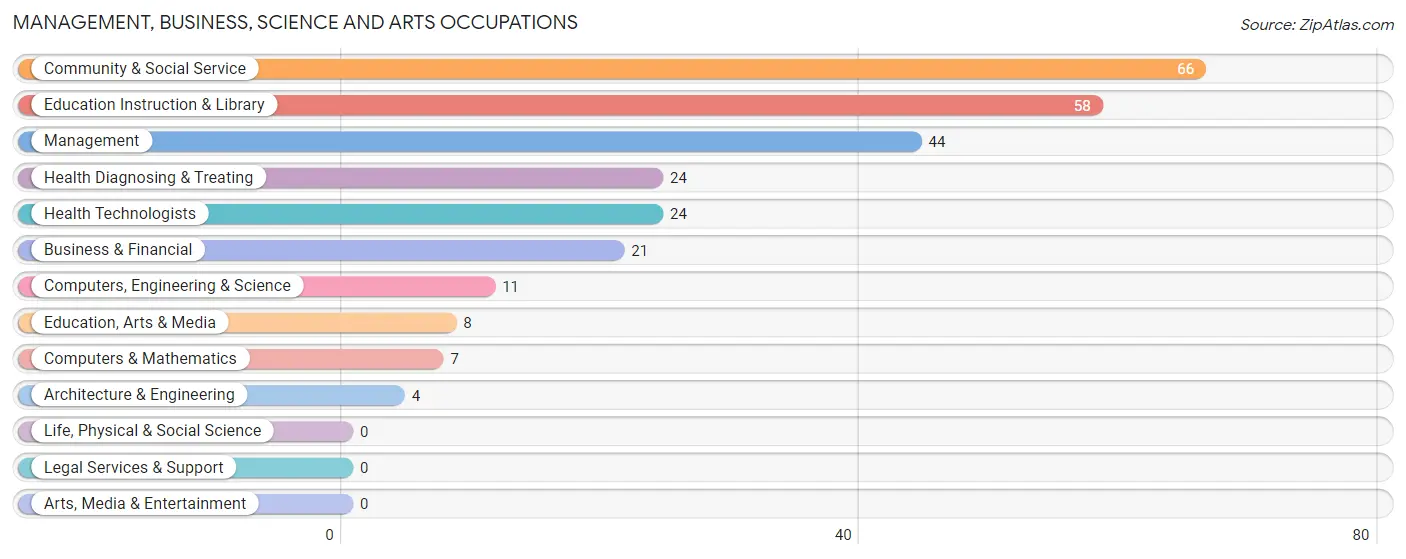
Management, Business, Science and Arts Occupations
The most common Management, Business, Science and Arts occupations in Bolivar are Community & Social Service (66 | 15.0%), Education Instruction & Library (58 | 13.2%), Management (44 | 10.0%), Health Diagnosing & Treating (24 | 5.4%), and Health Technologists (24 | 5.4%).
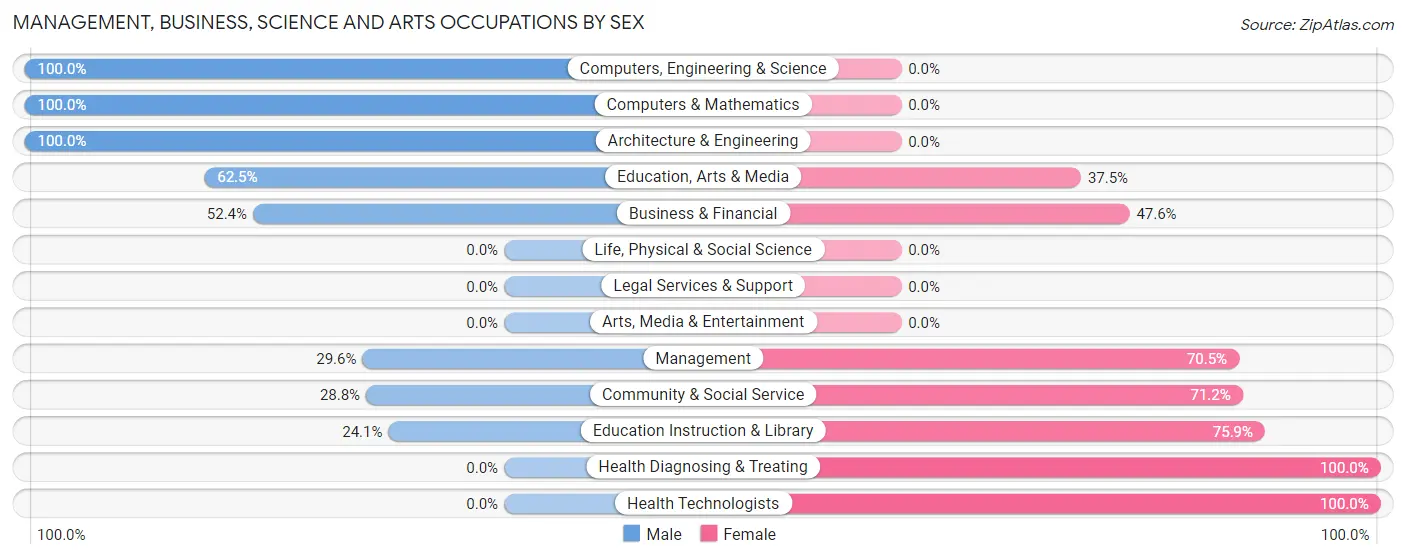
Management, Business, Science and Arts Occupations by Sex
Within the Management, Business, Science and Arts occupations in Bolivar, the most male-oriented occupations are Computers, Engineering & Science (100.0%), Computers & Mathematics (100.0%), and Architecture & Engineering (100.0%), while the most female-oriented occupations are Health Diagnosing & Treating (100.0%), Health Technologists (100.0%), and Education Instruction & Library (75.9%).
| Occupation | Male | Female |
| Management | 13 (29.5%) | 31 (70.5%) |
| Business & Financial | 11 (52.4%) | 10 (47.6%) |
| Computers, Engineering & Science | 11 (100.0%) | 0 (0.0%) |
| Computers & Mathematics | 7 (100.0%) | 0 (0.0%) |
| Architecture & Engineering | 4 (100.0%) | 0 (0.0%) |
| Life, Physical & Social Science | 0 (0.0%) | 0 (0.0%) |
| Community & Social Service | 19 (28.8%) | 47 (71.2%) |
| Education, Arts & Media | 5 (62.5%) | 3 (37.5%) |
| Legal Services & Support | 0 (0.0%) | 0 (0.0%) |
| Education Instruction & Library | 14 (24.1%) | 44 (75.9%) |
| Arts, Media & Entertainment | 0 (0.0%) | 0 (0.0%) |
| Health Diagnosing & Treating | 0 (0.0%) | 24 (100.0%) |
| Health Technologists | 0 (0.0%) | 24 (100.0%) |
| Total (Category) | 54 (32.5%) | 112 (67.5%) |
| Total (Overall) | 204 (46.4%) | 236 (53.6%) |
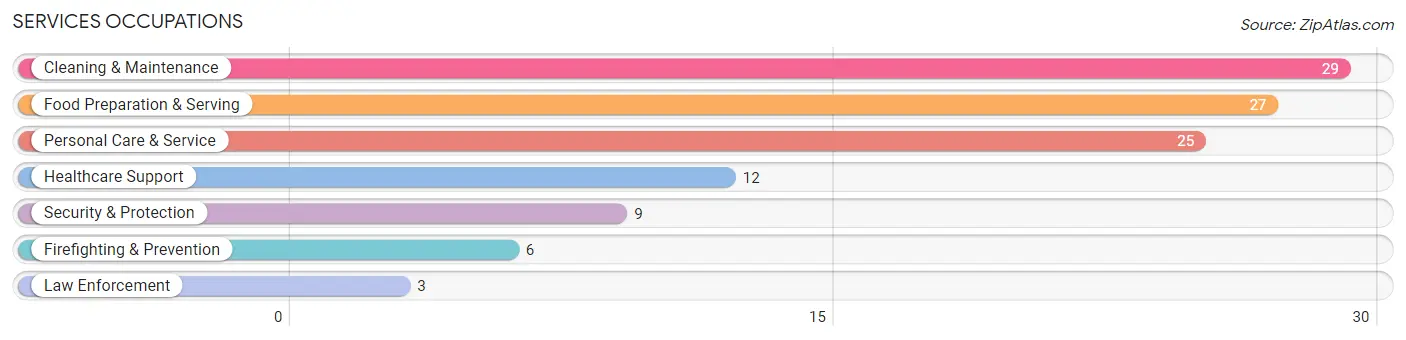
Services Occupations
The most common Services occupations in Bolivar are Cleaning & Maintenance (29 | 6.6%), Food Preparation & Serving (27 | 6.1%), Personal Care & Service (25 | 5.7%), Healthcare Support (12 | 2.7%), and Security & Protection (9 | 2.1%).
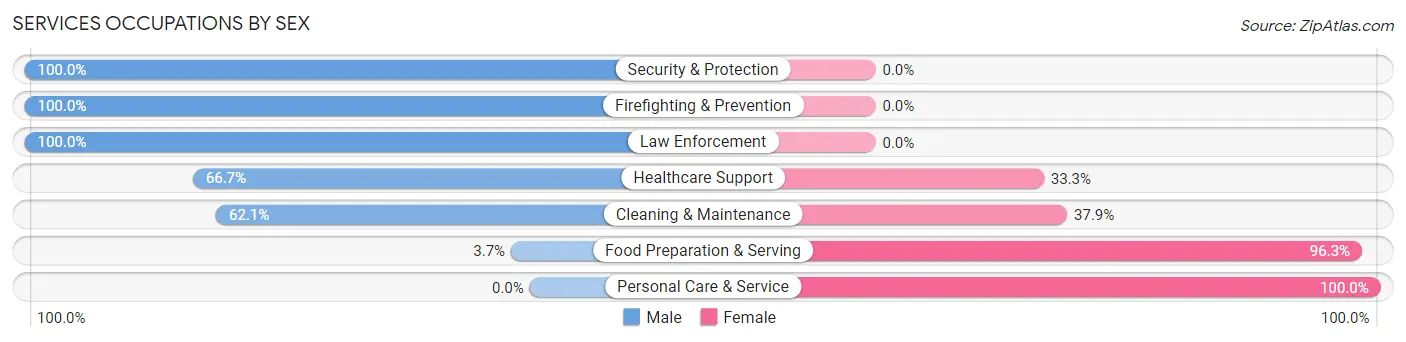
Services Occupations by Sex
Within the Services occupations in Bolivar, the most male-oriented occupations are Security & Protection (100.0%), Firefighting & Prevention (100.0%), and Law Enforcement (100.0%), while the most female-oriented occupations are Personal Care & Service (100.0%), Food Preparation & Serving (96.3%), and Cleaning & Maintenance (37.9%).
| Occupation | Male | Female |
| Healthcare Support | 8 (66.7%) | 4 (33.3%) |
| Security & Protection | 9 (100.0%) | 0 (0.0%) |
| Firefighting & Prevention | 6 (100.0%) | 0 (0.0%) |
| Law Enforcement | 3 (100.0%) | 0 (0.0%) |
| Food Preparation & Serving | 1 (3.7%) | 26 (96.3%) |
| Cleaning & Maintenance | 18 (62.1%) | 11 (37.9%) |
| Personal Care & Service | 0 (0.0%) | 25 (100.0%) |
| Total (Category) | 36 (35.3%) | 66 (64.7%) |
| Total (Overall) | 204 (46.4%) | 236 (53.6%) |
Sales and Office Occupations
The most common Sales and Office occupations in Bolivar are Sales & Related (46 | 10.4%), and Office & Administration (46 | 10.4%).
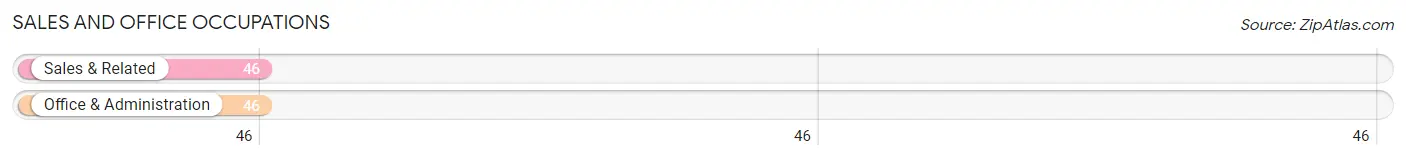
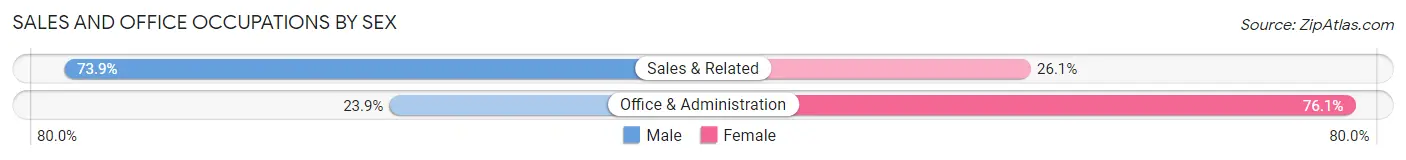
Sales and Office Occupations by Sex
| Occupation | Male | Female |
| Sales & Related | 34 (73.9%) | 12 (26.1%) |
| Office & Administration | 11 (23.9%) | 35 (76.1%) |
| Total (Category) | 45 (48.9%) | 47 (51.1%) |
| Total (Overall) | 204 (46.4%) | 236 (53.6%) |
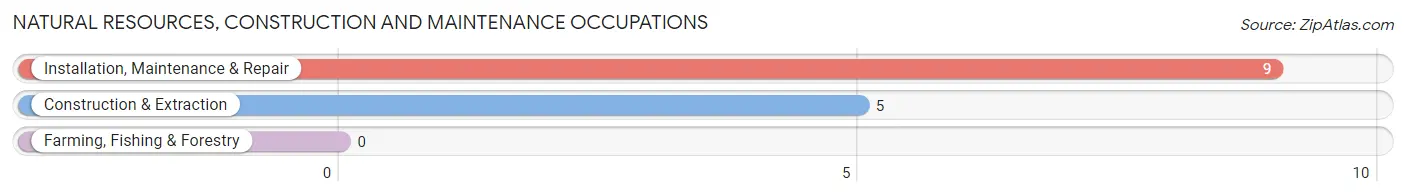
Natural Resources, Construction and Maintenance Occupations
The most common Natural Resources, Construction and Maintenance occupations in Bolivar are Installation, Maintenance & Repair (9 | 2.1%), and Construction & Extraction (5 | 1.1%).
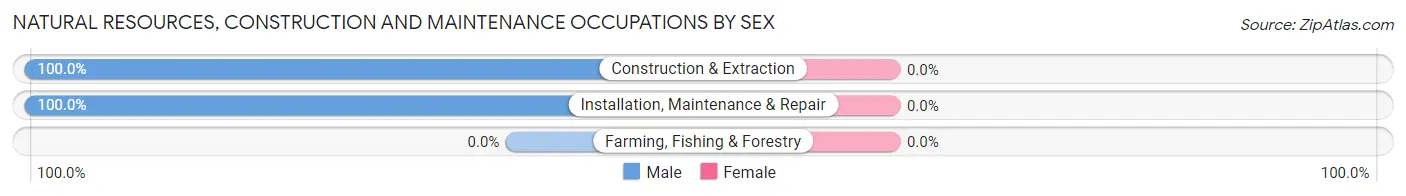
Natural Resources, Construction and Maintenance Occupations by Sex
| Occupation | Male | Female |
| Farming, Fishing & Forestry | 0 (0.0%) | 0 (0.0%) |
| Construction & Extraction | 5 (100.0%) | 0 (0.0%) |
| Installation, Maintenance & Repair | 9 (100.0%) | 0 (0.0%) |
| Total (Category) | 14 (100.0%) | 0 (0.0%) |
| Total (Overall) | 204 (46.4%) | 236 (53.6%) |
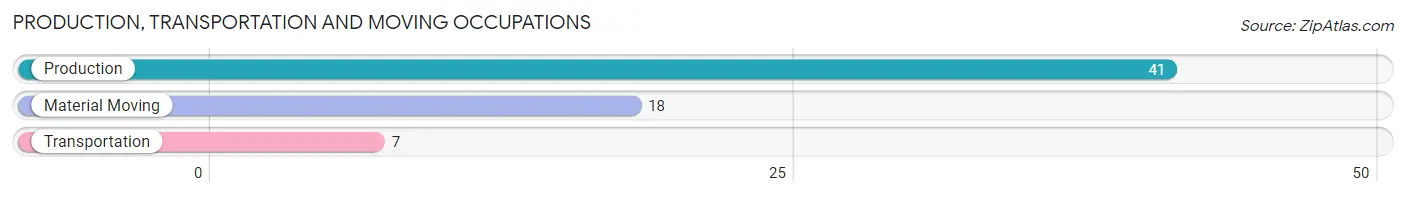
Production, Transportation and Moving Occupations
The most common Production, Transportation and Moving occupations in Bolivar are Production (41 | 9.3%), Material Moving (18 | 4.1%), and Transportation (7 | 1.6%).
Production, Transportation and Moving Occupations by Sex
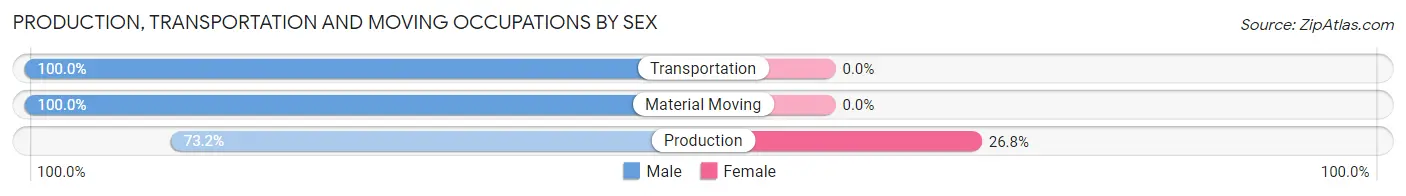
| Occupation | Male | Female |
| Production | 30 (73.2%) | 11 (26.8%) |
| Transportation | 7 (100.0%) | 0 (0.0%) |
| Material Moving | 18 (100.0%) | 0 (0.0%) |
| Total (Category) | 55 (83.3%) | 11 (16.7%) |
| Total (Overall) | 204 (46.4%) | 236 (53.6%) |
Employment Industries by Sex in Bolivar
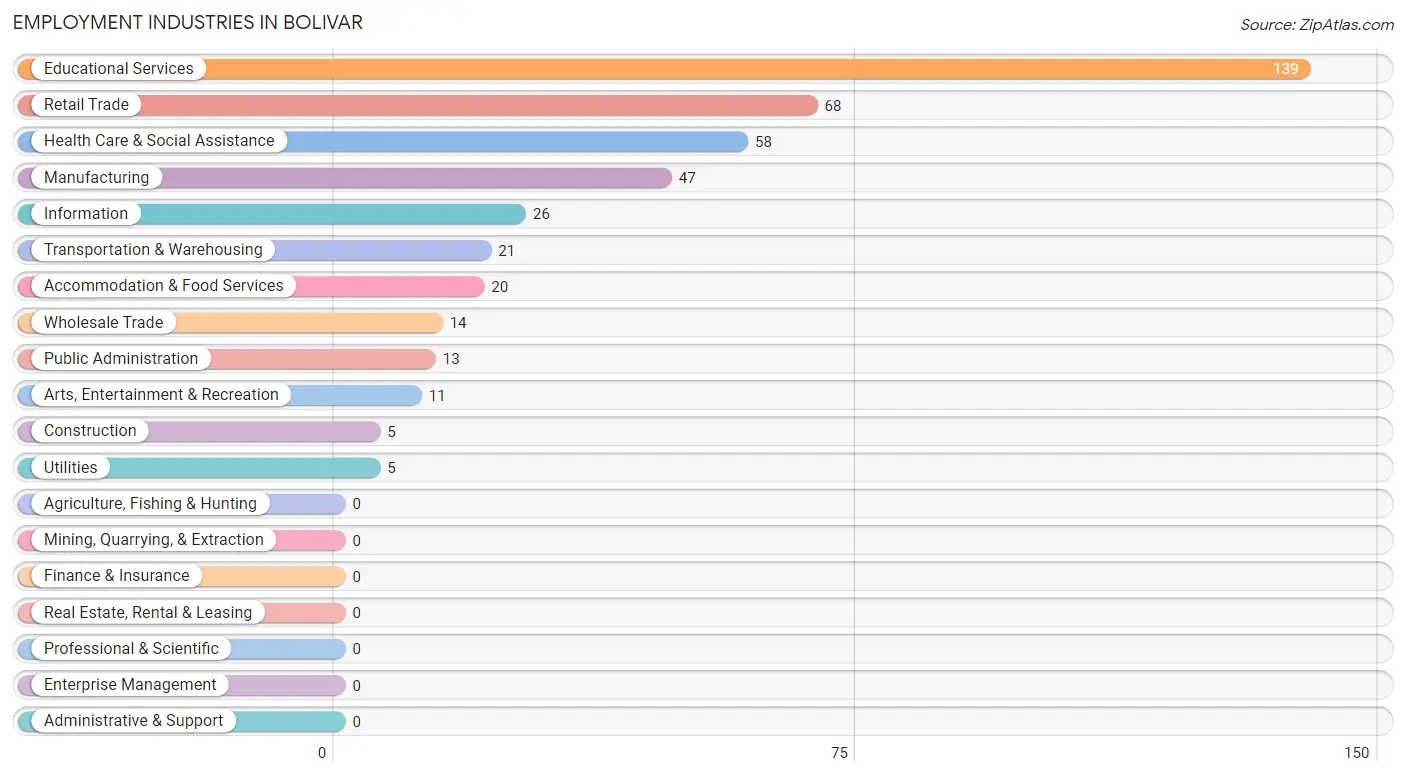
Employment Industries in Bolivar
The major employment industries in Bolivar include Educational Services (139 | 31.6%), Retail Trade (68 | 15.4%), Health Care & Social Assistance (58 | 13.2%), Manufacturing (47 | 10.7%), and Information (26 | 5.9%).
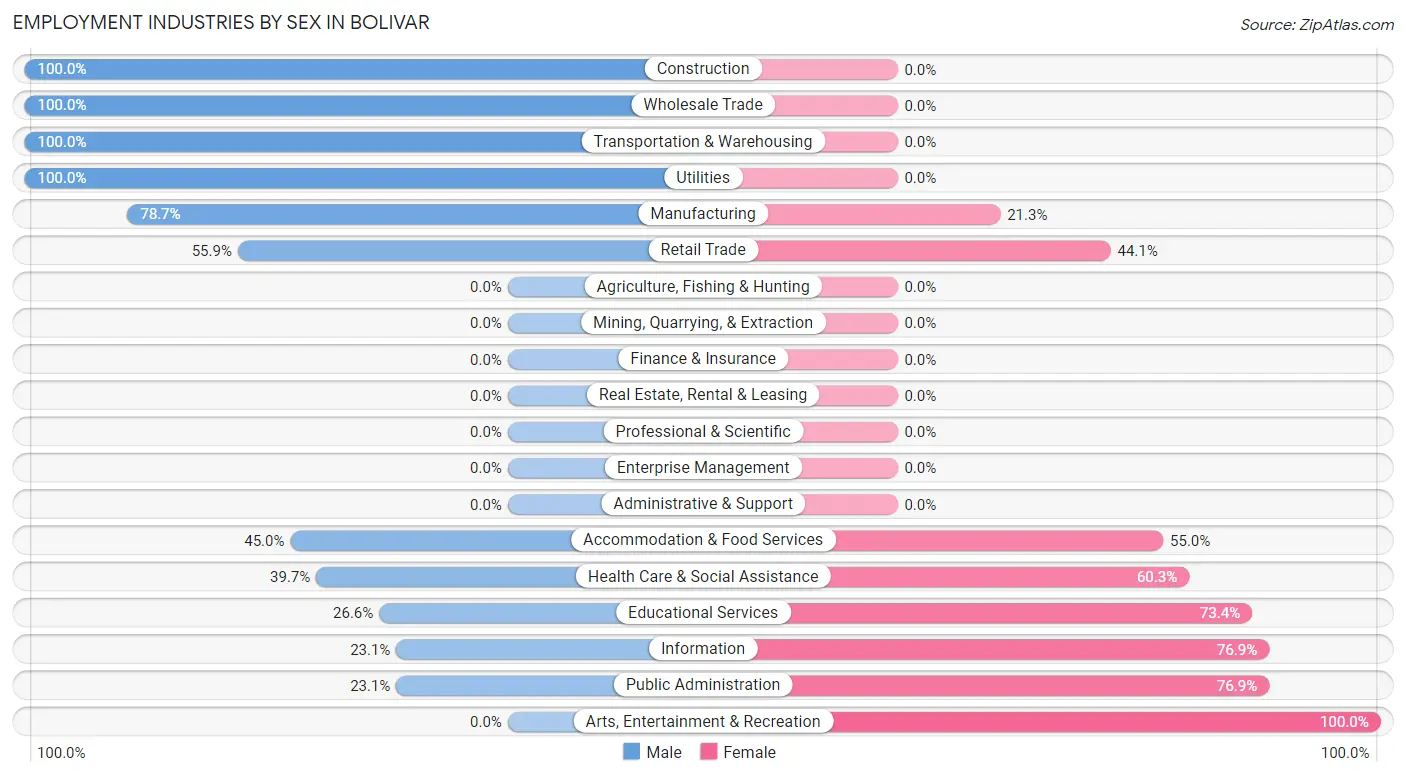
Employment Industries by Sex in Bolivar
The Bolivar industries that see more men than women are Construction (100.0%), Wholesale Trade (100.0%), and Transportation & Warehousing (100.0%), whereas the industries that tend to have a higher number of women are Arts, Entertainment & Recreation (100.0%), Information (76.9%), and Public Administration (76.9%).
| Industry | Male | Female |
| Agriculture, Fishing & Hunting | 0 (0.0%) | 0 (0.0%) |
| Mining, Quarrying, & Extraction | 0 (0.0%) | 0 (0.0%) |
| Construction | 5 (100.0%) | 0 (0.0%) |
| Manufacturing | 37 (78.7%) | 10 (21.3%) |
| Wholesale Trade | 14 (100.0%) | 0 (0.0%) |
| Retail Trade | 38 (55.9%) | 30 (44.1%) |
| Transportation & Warehousing | 21 (100.0%) | 0 (0.0%) |
| Utilities | 5 (100.0%) | 0 (0.0%) |
| Information | 6 (23.1%) | 20 (76.9%) |
| Finance & Insurance | 0 (0.0%) | 0 (0.0%) |
| Real Estate, Rental & Leasing | 0 (0.0%) | 0 (0.0%) |
| Professional & Scientific | 0 (0.0%) | 0 (0.0%) |
| Enterprise Management | 0 (0.0%) | 0 (0.0%) |
| Administrative & Support | 0 (0.0%) | 0 (0.0%) |
| Educational Services | 37 (26.6%) | 102 (73.4%) |
| Health Care & Social Assistance | 23 (39.7%) | 35 (60.3%) |
| Arts, Entertainment & Recreation | 0 (0.0%) | 11 (100.0%) |
| Accommodation & Food Services | 9 (45.0%) | 11 (55.0%) |
| Public Administration | 3 (23.1%) | 10 (76.9%) |
| Total | 204 (46.4%) | 236 (53.6%) |
Education in Bolivar
School Enrollment in Bolivar
The most common levels of schooling among the 233 students in Bolivar are middle school (76 | 32.6%), high school (59 | 25.3%), and college / undergraduate (49 | 21.0%).
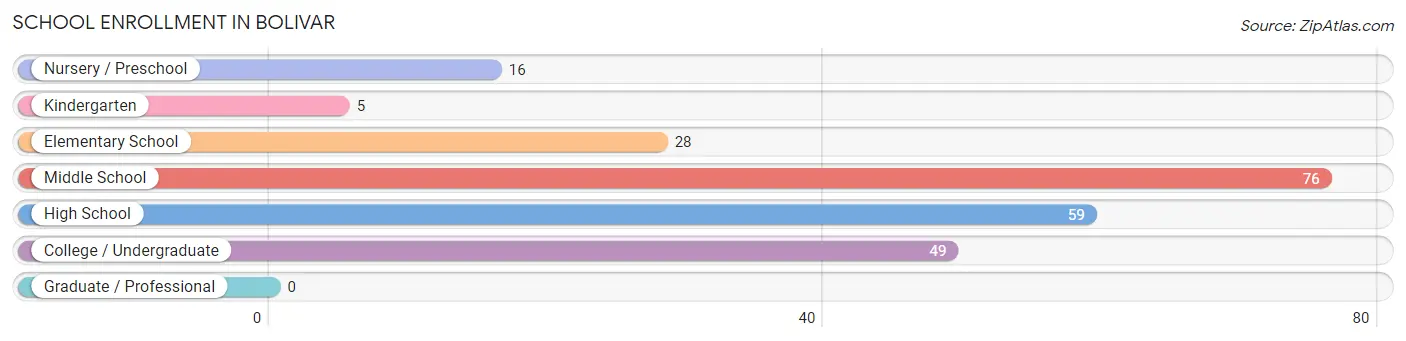
| School Level | # Students | % Students |
| Nursery / Preschool | 16 | 6.9% |
| Kindergarten | 5 | 2.1% |
| Elementary School | 28 | 12.0% |
| Middle School | 76 | 32.6% |
| High School | 59 | 25.3% |
| College / Undergraduate | 49 | 21.0% |
| Graduate / Professional | 0 | 0.0% |
| Total | 233 | 100.0% |
School Enrollment by Age by Funding Source in Bolivar
Out of a total of 233 students who are enrolled in schools in Bolivar, 13 (5.6%) attend a private institution, while the remaining 220 (94.4%) are enrolled in public schools. The age group of 20 to 24 year olds has the highest likelihood of being enrolled in private schools, with 7 (30.4% in the age bracket) enrolled. Conversely, the age group of 3 to 4 year olds has the lowest likelihood of being enrolled in a private school, with 13 (100.0% in the age bracket) attending a public institution.
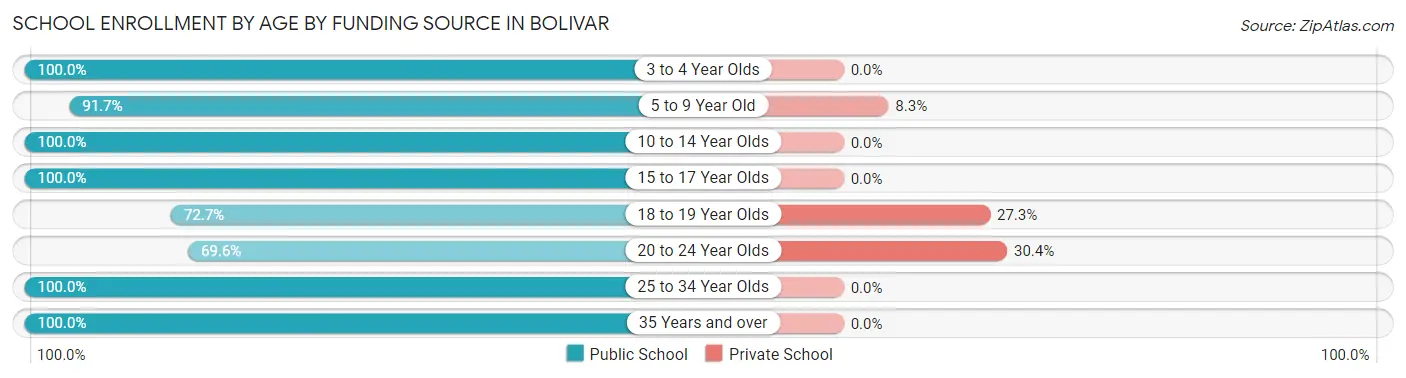
| Age Bracket | Public School | Private School |
| 3 to 4 Year Olds | 13 (100.0%) | 0 (0.0%) |
| 5 to 9 Year Old | 33 (91.7%) | 3 (8.3%) |
| 10 to 14 Year Olds | 76 (100.0%) | 0 (0.0%) |
| 15 to 17 Year Olds | 51 (100.0%) | 0 (0.0%) |
| 18 to 19 Year Olds | 8 (72.7%) | 3 (27.3%) |
| 20 to 24 Year Olds | 16 (69.6%) | 7 (30.4%) |
| 25 to 34 Year Olds | 12 (100.0%) | 0 (0.0%) |
| 35 Years and over | 11 (100.0%) | 0 (0.0%) |
| Total | 220 (94.4%) | 13 (5.6%) |
Educational Attainment by Field of Study in Bolivar
Education (55 | 26.1%), business (52 | 24.6%), arts & humanities (28 | 13.3%), science & technology (20 | 9.5%), and psychology (14 | 6.6%) are the most common fields of study among 211 individuals in Bolivar who have obtained a bachelor's degree or higher.
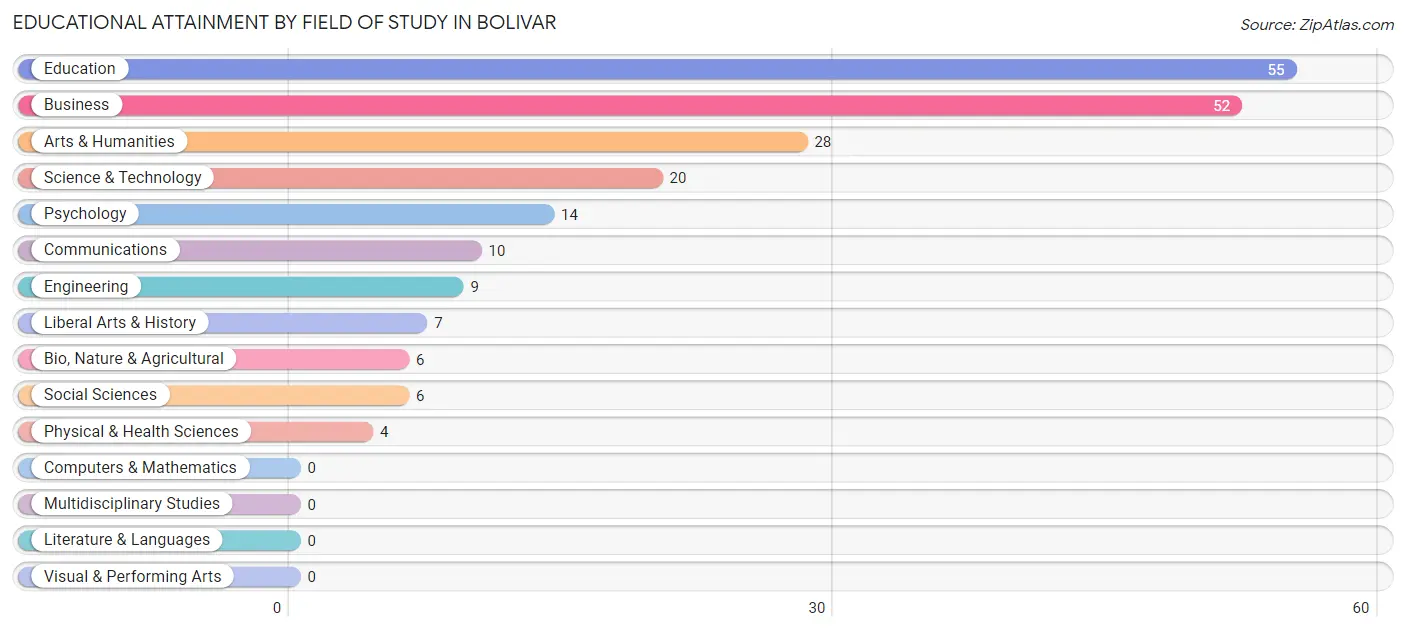
| Field of Study | # Graduates | % Graduates |
| Computers & Mathematics | 0 | 0.0% |
| Bio, Nature & Agricultural | 6 | 2.8% |
| Physical & Health Sciences | 4 | 1.9% |
| Psychology | 14 | 6.6% |
| Social Sciences | 6 | 2.8% |
| Engineering | 9 | 4.3% |
| Multidisciplinary Studies | 0 | 0.0% |
| Science & Technology | 20 | 9.5% |
| Business | 52 | 24.6% |
| Education | 55 | 26.1% |
| Literature & Languages | 0 | 0.0% |
| Liberal Arts & History | 7 | 3.3% |
| Visual & Performing Arts | 0 | 0.0% |
| Communications | 10 | 4.7% |
| Arts & Humanities | 28 | 13.3% |
| Total | 211 | 100.0% |
Transportation & Commute in Bolivar
Vehicle Availability by Sex in Bolivar
The most prevalent vehicle ownership categories in Bolivar are males with 2 vehicles (90, accounting for 45.0%) and females with 2 vehicles (130, making up 38.1%).
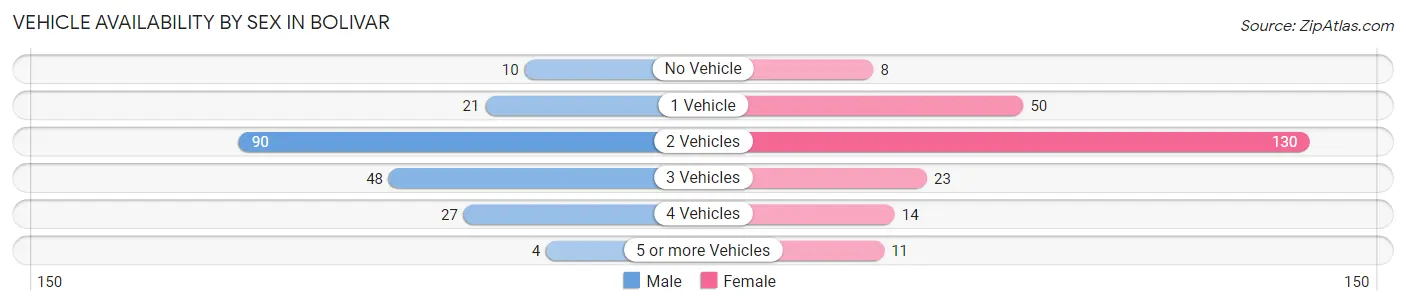
| Vehicles Available | Male | Female |
| No Vehicle | 10 (5.0%) | 8 (3.4%) |
| 1 Vehicle | 21 (10.5%) | 50 (21.2%) |
| 2 Vehicles | 90 (45.0%) | 130 (55.1%) |
| 3 Vehicles | 48 (24.0%) | 23 (9.8%) |
| 4 Vehicles | 27 (13.5%) | 14 (5.9%) |
| 5 or more Vehicles | 4 (2.0%) | 11 (4.7%) |
| Total | 200 (100.0%) | 236 (100.0%) |
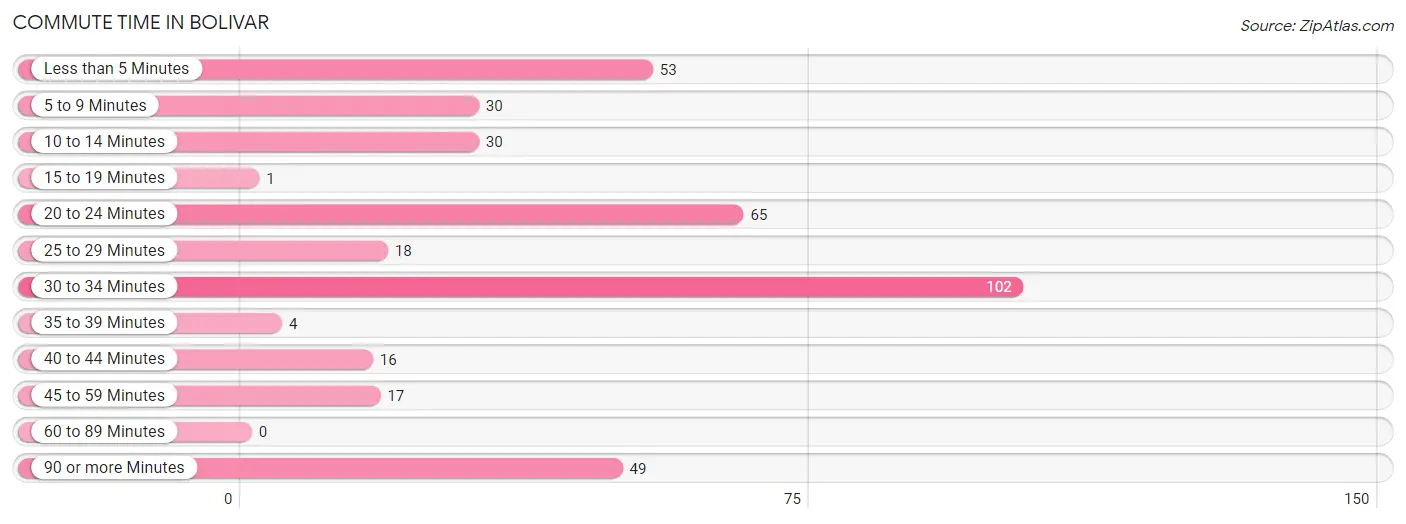
Commute Time in Bolivar
The most frequently occuring commute durations in Bolivar are 30 to 34 minutes (102 commuters, 26.5%), 20 to 24 minutes (65 commuters, 16.9%), and less than 5 minutes (53 commuters, 13.8%).
| Commute Time | # Commuters | % Commuters |
| Less than 5 Minutes | 53 | 13.8% |
| 5 to 9 Minutes | 30 | 7.8% |
| 10 to 14 Minutes | 30 | 7.8% |
| 15 to 19 Minutes | 1 | 0.3% |
| 20 to 24 Minutes | 65 | 16.9% |
| 25 to 29 Minutes | 18 | 4.7% |
| 30 to 34 Minutes | 102 | 26.5% |
| 35 to 39 Minutes | 4 | 1.0% |
| 40 to 44 Minutes | 16 | 4.2% |
| 45 to 59 Minutes | 17 | 4.4% |
| 60 to 89 Minutes | 0 | 0.0% |
| 90 or more Minutes | 49 | 12.7% |
Commute Time by Sex in Bolivar
The most common commute times in Bolivar are 30 to 34 minutes (48 commuters, 25.7%) for males and 30 to 34 minutes (54 commuters, 27.3%) for females.
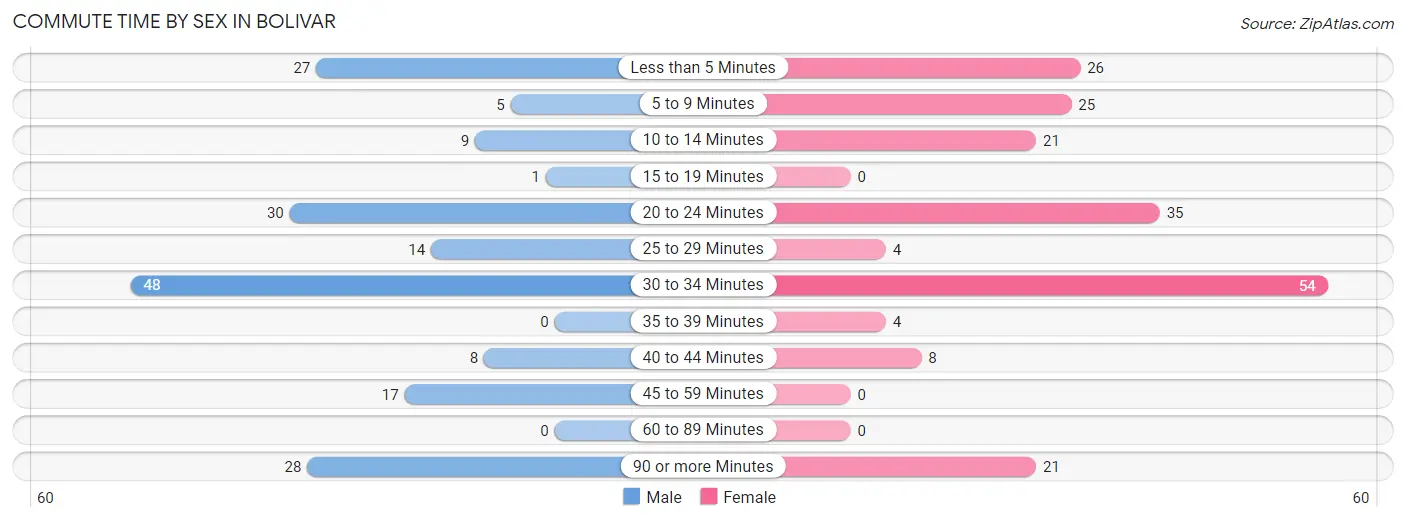
| Commute Time | Male | Female |
| Less than 5 Minutes | 27 (14.4%) | 26 (13.1%) |
| 5 to 9 Minutes | 5 (2.7%) | 25 (12.6%) |
| 10 to 14 Minutes | 9 (4.8%) | 21 (10.6%) |
| 15 to 19 Minutes | 1 (0.5%) | 0 (0.0%) |
| 20 to 24 Minutes | 30 (16.0%) | 35 (17.7%) |
| 25 to 29 Minutes | 14 (7.5%) | 4 (2.0%) |
| 30 to 34 Minutes | 48 (25.7%) | 54 (27.3%) |
| 35 to 39 Minutes | 0 (0.0%) | 4 (2.0%) |
| 40 to 44 Minutes | 8 (4.3%) | 8 (4.0%) |
| 45 to 59 Minutes | 17 (9.1%) | 0 (0.0%) |
| 60 to 89 Minutes | 0 (0.0%) | 0 (0.0%) |
| 90 or more Minutes | 28 (15.0%) | 21 (10.6%) |
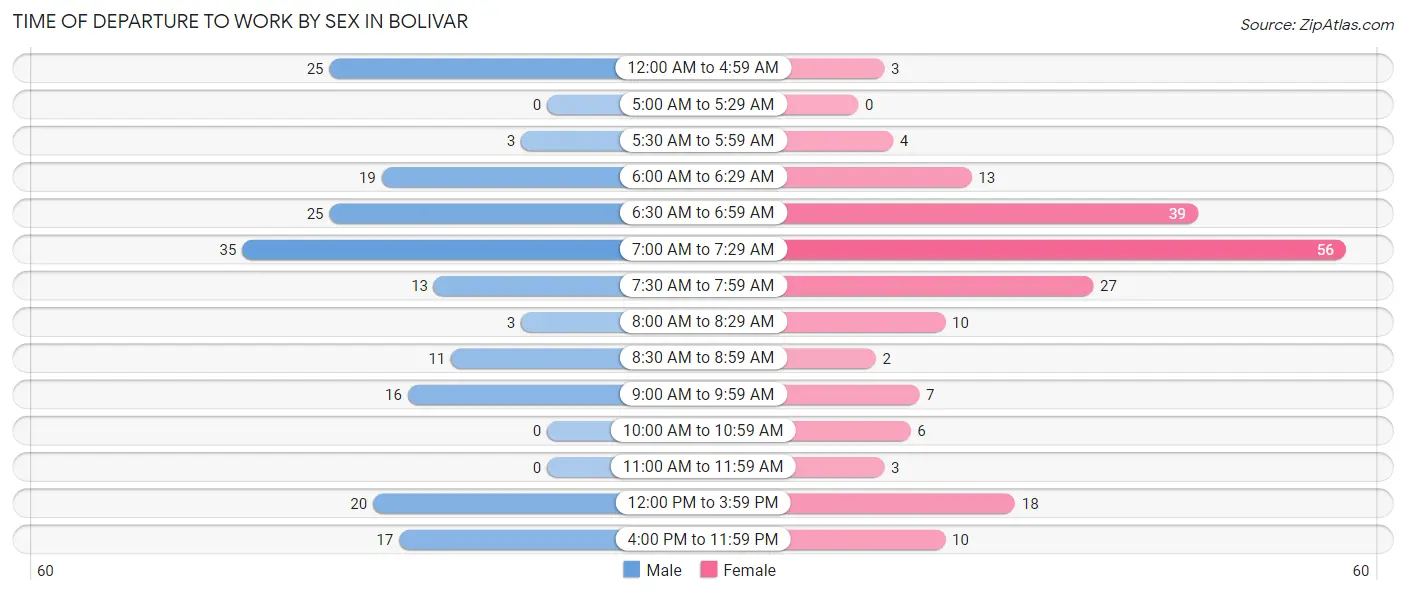
Time of Departure to Work by Sex in Bolivar
The most frequent times of departure to work in Bolivar are 7:00 AM to 7:29 AM (35, 18.7%) for males and 7:00 AM to 7:29 AM (56, 28.3%) for females.
| Time of Departure | Male | Female |
| 12:00 AM to 4:59 AM | 25 (13.4%) | 3 (1.5%) |
| 5:00 AM to 5:29 AM | 0 (0.0%) | 0 (0.0%) |
| 5:30 AM to 5:59 AM | 3 (1.6%) | 4 (2.0%) |
| 6:00 AM to 6:29 AM | 19 (10.2%) | 13 (6.6%) |
| 6:30 AM to 6:59 AM | 25 (13.4%) | 39 (19.7%) |
| 7:00 AM to 7:29 AM | 35 (18.7%) | 56 (28.3%) |
| 7:30 AM to 7:59 AM | 13 (7.0%) | 27 (13.6%) |
| 8:00 AM to 8:29 AM | 3 (1.6%) | 10 (5.1%) |
| 8:30 AM to 8:59 AM | 11 (5.9%) | 2 (1.0%) |
| 9:00 AM to 9:59 AM | 16 (8.6%) | 7 (3.5%) |
| 10:00 AM to 10:59 AM | 0 (0.0%) | 6 (3.0%) |
| 11:00 AM to 11:59 AM | 0 (0.0%) | 3 (1.5%) |
| 12:00 PM to 3:59 PM | 20 (10.7%) | 18 (9.1%) |
| 4:00 PM to 11:59 PM | 17 (9.1%) | 10 (5.1%) |
| Total | 187 (100.0%) | 198 (100.0%) |
Housing Occupancy in Bolivar
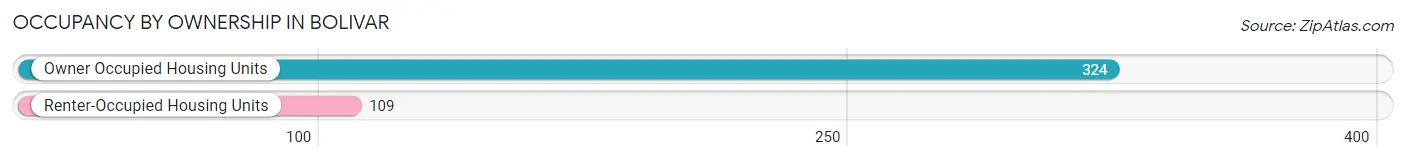
Occupancy by Ownership in Bolivar
Of the total 433 dwellings in Bolivar, owner-occupied units account for 324 (74.8%), while renter-occupied units make up 109 (25.2%).
| Occupancy | # Housing Units | % Housing Units |
| Owner Occupied Housing Units | 324 | 74.8% |
| Renter-Occupied Housing Units | 109 | 25.2% |
| Total Occupied Housing Units | 433 | 100.0% |
Occupancy by Household Size in Bolivar
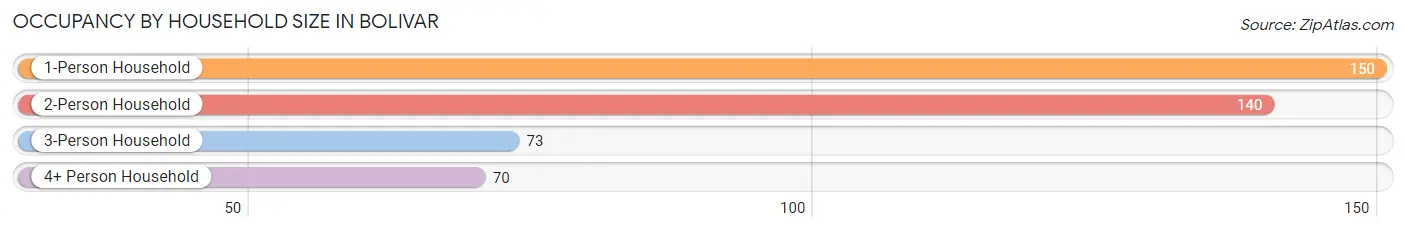
| Household Size | # Housing Units | % Housing Units |
| 1-Person Household | 150 | 34.6% |
| 2-Person Household | 140 | 32.3% |
| 3-Person Household | 73 | 16.9% |
| 4+ Person Household | 70 | 16.2% |
| Total Housing Units | 433 | 100.0% |
Occupancy by Ownership by Household Size in Bolivar
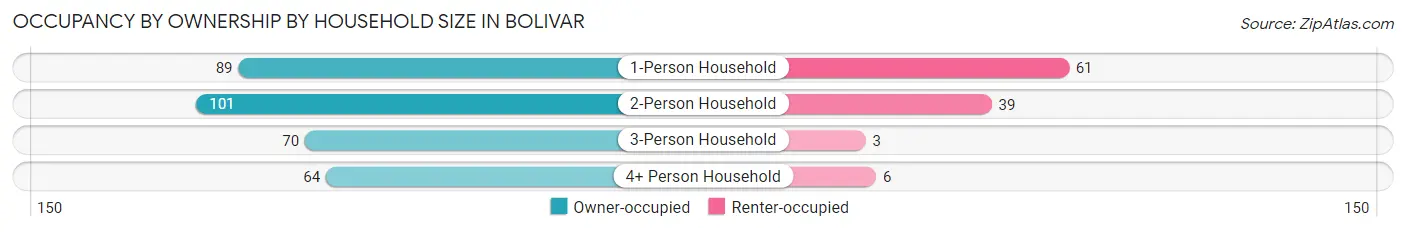
| Household Size | Owner-occupied | Renter-occupied |
| 1-Person Household | 89 (59.3%) | 61 (40.7%) |
| 2-Person Household | 101 (72.1%) | 39 (27.9%) |
| 3-Person Household | 70 (95.9%) | 3 (4.1%) |
| 4+ Person Household | 64 (91.4%) | 6 (8.6%) |
| Total Housing Units | 324 (74.8%) | 109 (25.2%) |
Occupancy by Educational Attainment in Bolivar
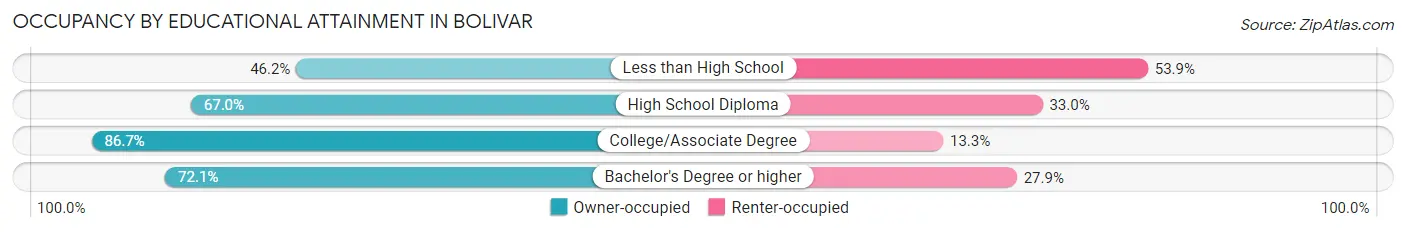
| Household Size | Owner-occupied | Renter-occupied |
| Less than High School | 18 (46.2%) | 21 (53.8%) |
| High School Diploma | 61 (67.0%) | 30 (33.0%) |
| College/Associate Degree | 157 (86.7%) | 24 (13.3%) |
| Bachelor's Degree or higher | 88 (72.1%) | 34 (27.9%) |
Occupancy by Age of Householder in Bolivar
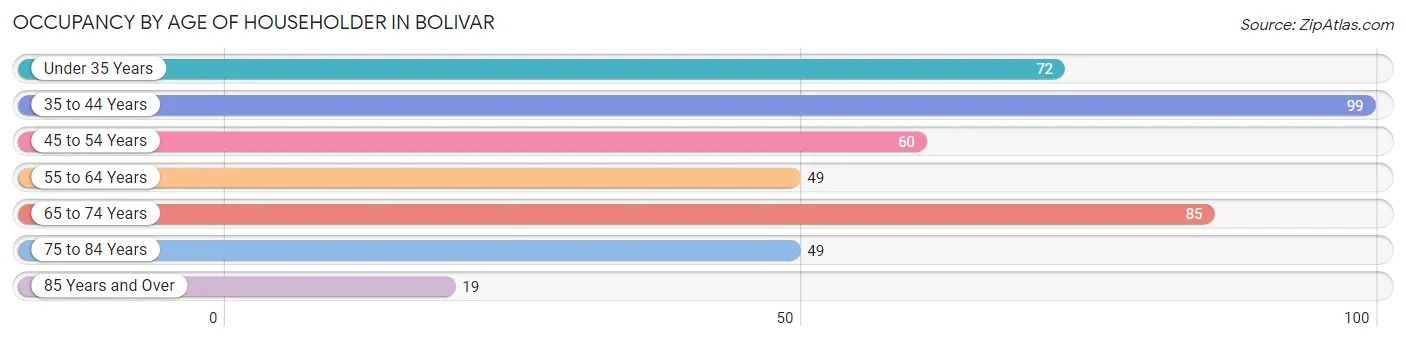
| Age Bracket | # Households | % Households |
| Under 35 Years | 72 | 16.6% |
| 35 to 44 Years | 99 | 22.9% |
| 45 to 54 Years | 60 | 13.9% |
| 55 to 64 Years | 49 | 11.3% |
| 65 to 74 Years | 85 | 19.6% |
| 75 to 84 Years | 49 | 11.3% |
| 85 Years and Over | 19 | 4.4% |
| Total | 433 | 100.0% |
Housing Finances in Bolivar
Median Income by Occupancy in Bolivar
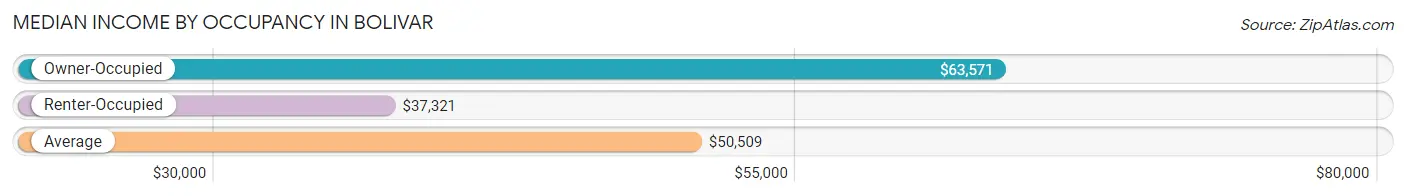
| Occupancy Type | # Households | Median Income |
| Owner-Occupied | 324 (74.8%) | $63,571 |
| Renter-Occupied | 109 (25.2%) | $37,321 |
| Average | 433 (100.0%) | $50,509 |
Occupancy by Householder Income Bracket in Bolivar
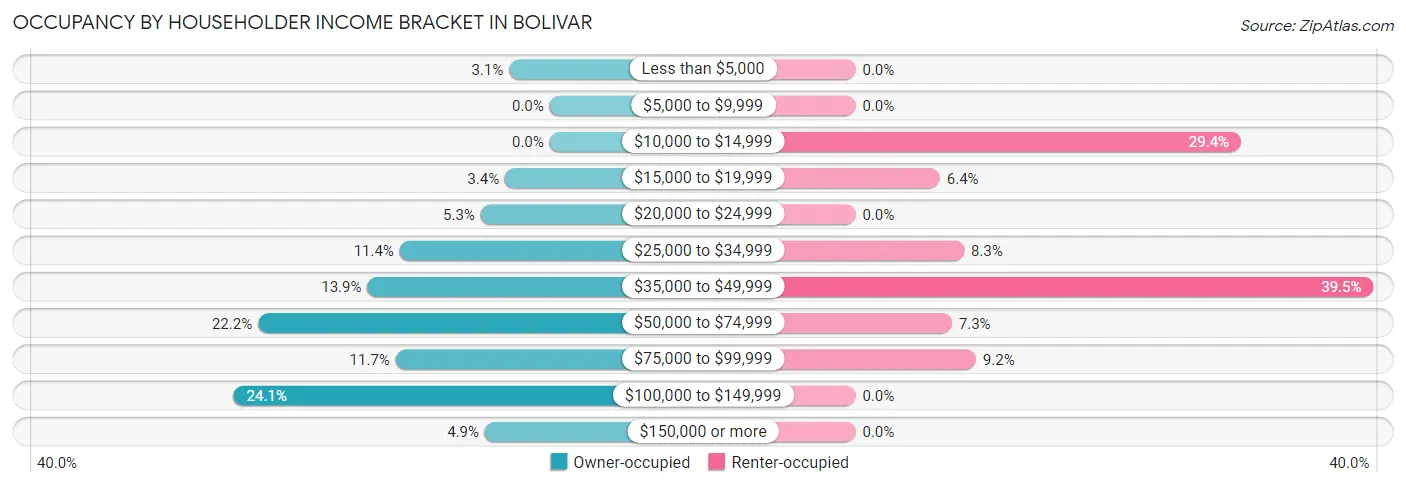
| Income Bracket | Owner-occupied | Renter-occupied |
| Less than $5,000 | 10 (3.1%) | 0 (0.0%) |
| $5,000 to $9,999 | 0 (0.0%) | 0 (0.0%) |
| $10,000 to $14,999 | 0 (0.0%) | 32 (29.4%) |
| $15,000 to $19,999 | 11 (3.4%) | 7 (6.4%) |
| $20,000 to $24,999 | 17 (5.2%) | 0 (0.0%) |
| $25,000 to $34,999 | 37 (11.4%) | 9 (8.3%) |
| $35,000 to $49,999 | 45 (13.9%) | 43 (39.5%) |
| $50,000 to $74,999 | 72 (22.2%) | 8 (7.3%) |
| $75,000 to $99,999 | 38 (11.7%) | 10 (9.2%) |
| $100,000 to $149,999 | 78 (24.1%) | 0 (0.0%) |
| $150,000 or more | 16 (4.9%) | 0 (0.0%) |
| Total | 324 (100.0%) | 109 (100.0%) |
Monthly Housing Cost Tiers in Bolivar
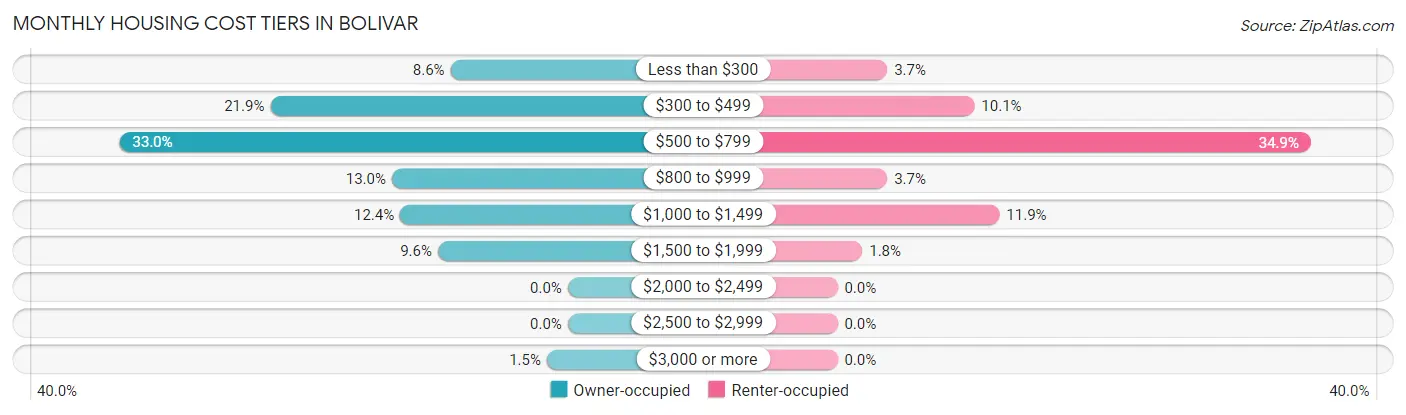
| Monthly Cost | Owner-occupied | Renter-occupied |
| Less than $300 | 28 (8.6%) | 4 (3.7%) |
| $300 to $499 | 71 (21.9%) | 11 (10.1%) |
| $500 to $799 | 107 (33.0%) | 38 (34.9%) |
| $800 to $999 | 42 (13.0%) | 4 (3.7%) |
| $1,000 to $1,499 | 40 (12.3%) | 13 (11.9%) |
| $1,500 to $1,999 | 31 (9.6%) | 2 (1.8%) |
| $2,000 to $2,499 | 0 (0.0%) | 0 (0.0%) |
| $2,500 to $2,999 | 0 (0.0%) | 0 (0.0%) |
| $3,000 or more | 5 (1.5%) | 0 (0.0%) |
| Total | 324 (100.0%) | 109 (100.0%) |
Physical Housing Characteristics in Bolivar
Housing Structures in Bolivar
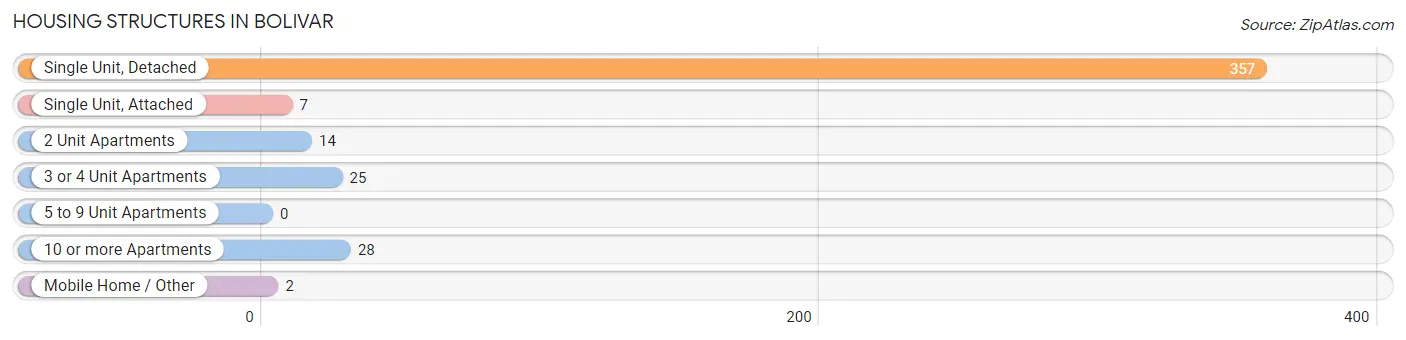
| Structure Type | # Housing Units | % Housing Units |
| Single Unit, Detached | 357 | 82.5% |
| Single Unit, Attached | 7 | 1.6% |
| 2 Unit Apartments | 14 | 3.2% |
| 3 or 4 Unit Apartments | 25 | 5.8% |
| 5 to 9 Unit Apartments | 0 | 0.0% |
| 10 or more Apartments | 28 | 6.5% |
| Mobile Home / Other | 2 | 0.5% |
| Total | 433 | 100.0% |
Housing Structures by Occupancy in Bolivar
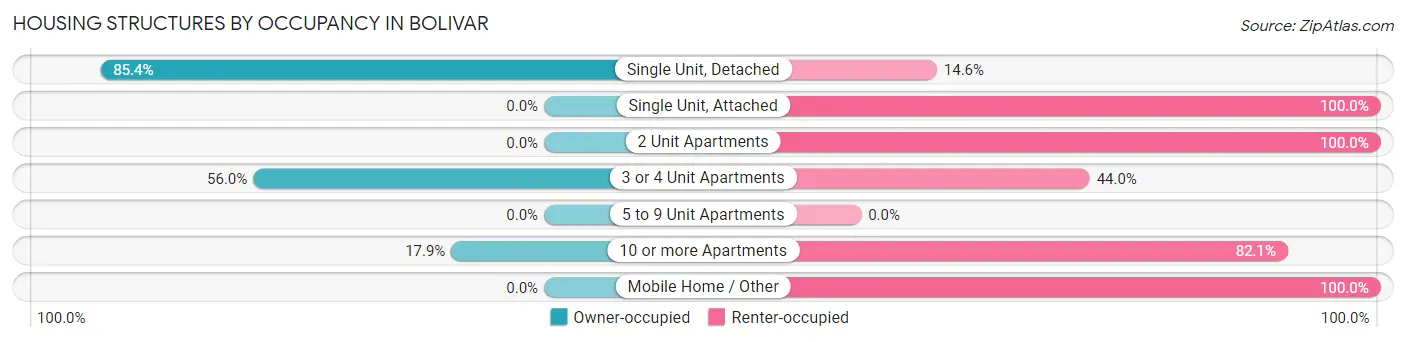
| Structure Type | Owner-occupied | Renter-occupied |
| Single Unit, Detached | 305 (85.4%) | 52 (14.6%) |
| Single Unit, Attached | 0 (0.0%) | 7 (100.0%) |
| 2 Unit Apartments | 0 (0.0%) | 14 (100.0%) |
| 3 or 4 Unit Apartments | 14 (56.0%) | 11 (44.0%) |
| 5 to 9 Unit Apartments | 0 (0.0%) | 0 (0.0%) |
| 10 or more Apartments | 5 (17.9%) | 23 (82.1%) |
| Mobile Home / Other | 0 (0.0%) | 2 (100.0%) |
| Total | 324 (74.8%) | 109 (25.2%) |
Housing Structures by Number of Rooms in Bolivar
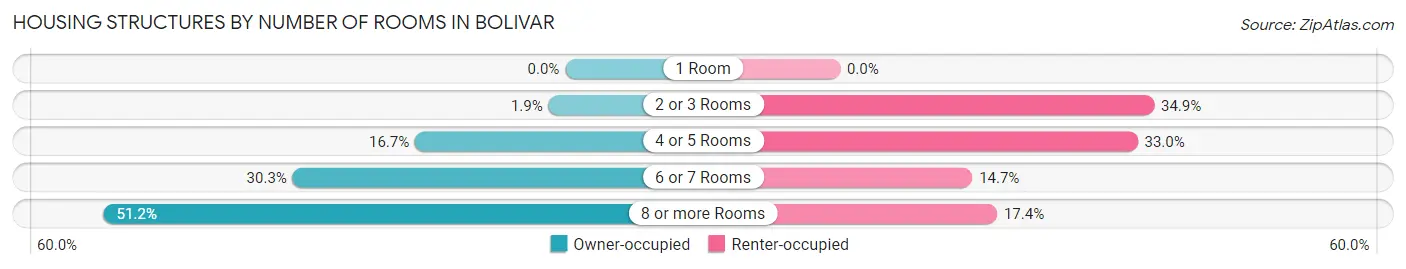
| Number of Rooms | Owner-occupied | Renter-occupied |
| 1 Room | 0 (0.0%) | 0 (0.0%) |
| 2 or 3 Rooms | 6 (1.8%) | 38 (34.9%) |
| 4 or 5 Rooms | 54 (16.7%) | 36 (33.0%) |
| 6 or 7 Rooms | 98 (30.2%) | 16 (14.7%) |
| 8 or more Rooms | 166 (51.2%) | 19 (17.4%) |
| Total | 324 (100.0%) | 109 (100.0%) |
Housing Structure by Heating Type in Bolivar
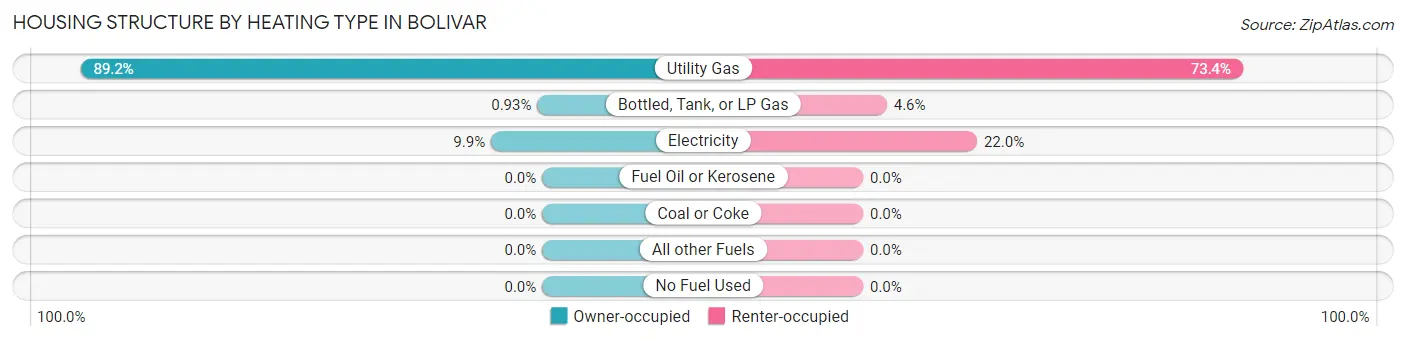
| Heating Type | Owner-occupied | Renter-occupied |
| Utility Gas | 289 (89.2%) | 80 (73.4%) |
| Bottled, Tank, or LP Gas | 3 (0.9%) | 5 (4.6%) |
| Electricity | 32 (9.9%) | 24 (22.0%) |
| Fuel Oil or Kerosene | 0 (0.0%) | 0 (0.0%) |
| Coal or Coke | 0 (0.0%) | 0 (0.0%) |
| All other Fuels | 0 (0.0%) | 0 (0.0%) |
| No Fuel Used | 0 (0.0%) | 0 (0.0%) |
| Total | 324 (100.0%) | 109 (100.0%) |
Household Vehicle Usage in Bolivar
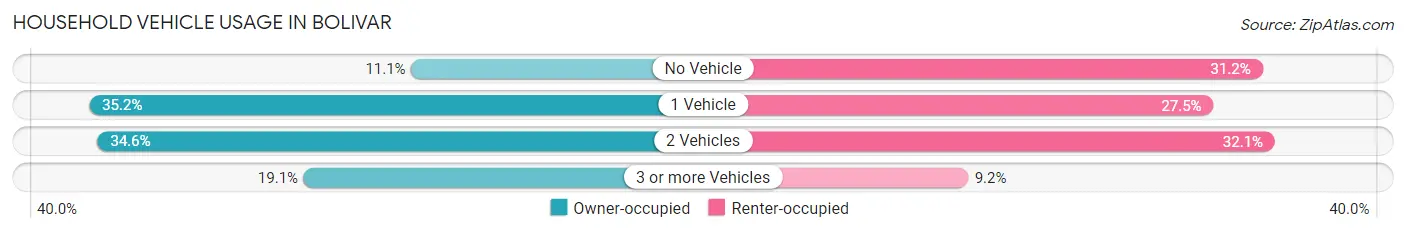
| Vehicles per Household | Owner-occupied | Renter-occupied |
| No Vehicle | 36 (11.1%) | 34 (31.2%) |
| 1 Vehicle | 114 (35.2%) | 30 (27.5%) |
| 2 Vehicles | 112 (34.6%) | 35 (32.1%) |
| 3 or more Vehicles | 62 (19.1%) | 10 (9.2%) |
| Total | 324 (100.0%) | 109 (100.0%) |
Real Estate & Mortgages in Bolivar
Real Estate and Mortgage Overview in Bolivar
| Characteristic | Without Mortgage | With Mortgage |
| Housing Units | 202 | 122 |
| Median Property Value | $64,000 | $86,400 |
| Median Household Income | $52,237 | $3 |
| Monthly Housing Costs | $504 | $5 |
| Real Estate Taxes | $2,392 | $0 |
Property Value by Mortgage Status in Bolivar
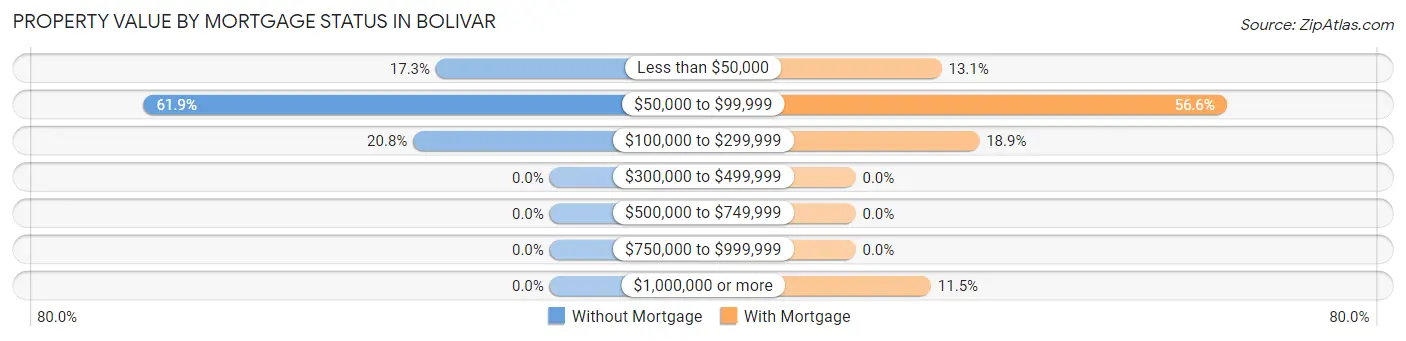
| Property Value | Without Mortgage | With Mortgage |
| Less than $50,000 | 35 (17.3%) | 16 (13.1%) |
| $50,000 to $99,999 | 125 (61.9%) | 69 (56.6%) |
| $100,000 to $299,999 | 42 (20.8%) | 23 (18.9%) |
| $300,000 to $499,999 | 0 (0.0%) | 0 (0.0%) |
| $500,000 to $749,999 | 0 (0.0%) | 0 (0.0%) |
| $750,000 to $999,999 | 0 (0.0%) | 0 (0.0%) |
| $1,000,000 or more | 0 (0.0%) | 14 (11.5%) |
| Total | 202 (100.0%) | 122 (100.0%) |
Household Income by Mortgage Status in Bolivar
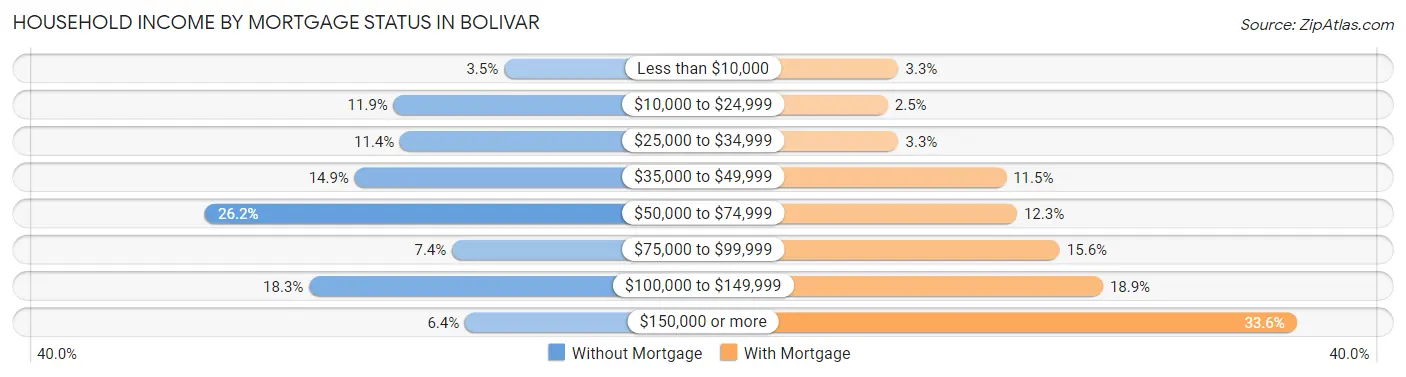
| Household Income | Without Mortgage | With Mortgage |
| Less than $10,000 | 7 (3.5%) | 4 (3.3%) |
| $10,000 to $24,999 | 24 (11.9%) | 3 (2.5%) |
| $25,000 to $34,999 | 23 (11.4%) | 4 (3.3%) |
| $35,000 to $49,999 | 30 (14.8%) | 14 (11.5%) |
| $50,000 to $74,999 | 53 (26.2%) | 15 (12.3%) |
| $75,000 to $99,999 | 15 (7.4%) | 19 (15.6%) |
| $100,000 to $149,999 | 37 (18.3%) | 23 (18.9%) |
| $150,000 or more | 13 (6.4%) | 41 (33.6%) |
| Total | 202 (100.0%) | 122 (100.0%) |
Property Value to Household Income Ratio in Bolivar
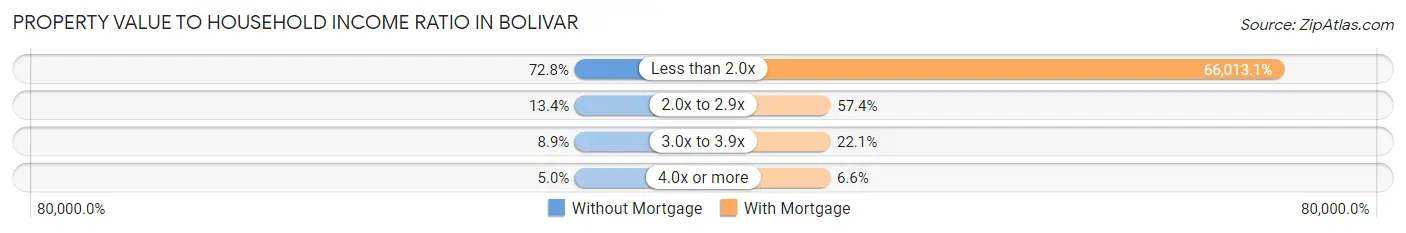
| Value-to-Income Ratio | Without Mortgage | With Mortgage |
| Less than 2.0x | 147 (72.8%) | 80,536 (66,013.1%) |
| 2.0x to 2.9x | 27 (13.4%) | 70 (57.4%) |
| 3.0x to 3.9x | 18 (8.9%) | 27 (22.1%) |
| 4.0x or more | 10 (5.0%) | 8 (6.6%) |
| Total | 202 (100.0%) | 122 (100.0%) |
Real Estate Taxes by Mortgage Status in Bolivar
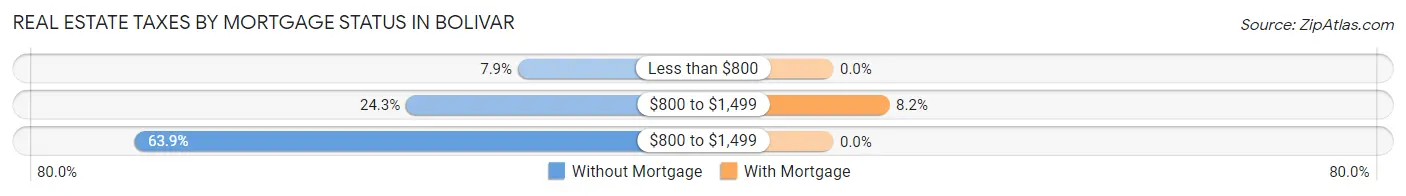
| Property Taxes | Without Mortgage | With Mortgage |
| Less than $800 | 16 (7.9%) | 0 (0.0%) |
| $800 to $1,499 | 49 (24.3%) | 10 (8.2%) |
| $800 to $1,499 | 129 (63.9%) | 0 (0.0%) |
| Total | 202 (100.0%) | 122 (100.0%) |
Health & Disability in Bolivar
Health Insurance Coverage by Age in Bolivar
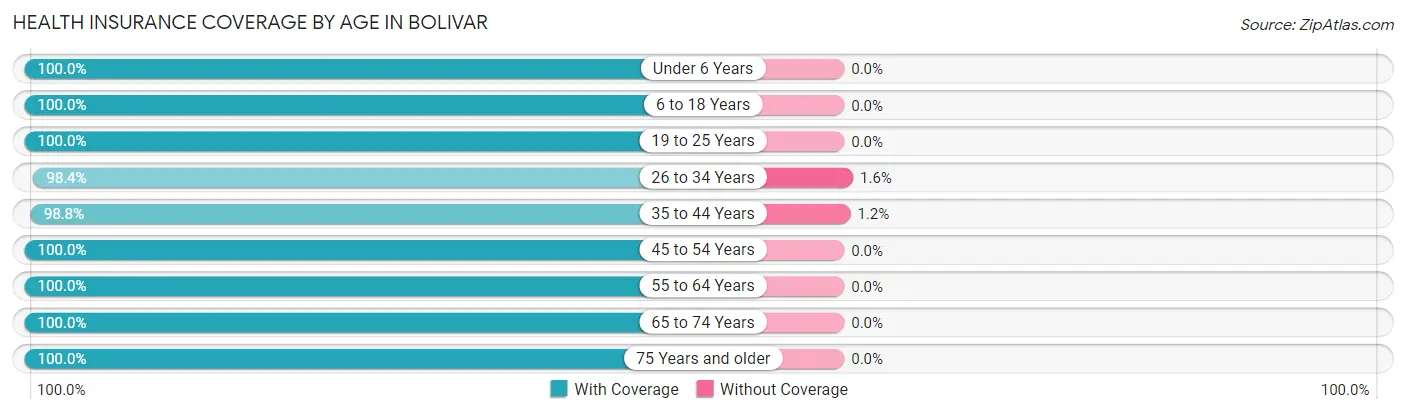
| Age Bracket | With Coverage | Without Coverage |
| Under 6 Years | 60 (100.0%) | 0 (0.0%) |
| 6 to 18 Years | 174 (100.0%) | 0 (0.0%) |
| 19 to 25 Years | 99 (100.0%) | 0 (0.0%) |
| 26 to 34 Years | 120 (98.4%) | 2 (1.6%) |
| 35 to 44 Years | 170 (98.8%) | 2 (1.2%) |
| 45 to 54 Years | 94 (100.0%) | 0 (0.0%) |
| 55 to 64 Years | 119 (100.0%) | 0 (0.0%) |
| 65 to 74 Years | 113 (100.0%) | 0 (0.0%) |
| 75 Years and older | 97 (100.0%) | 0 (0.0%) |
| Total | 1,046 (99.6%) | 4 (0.4%) |
Health Insurance Coverage by Citizenship Status in Bolivar
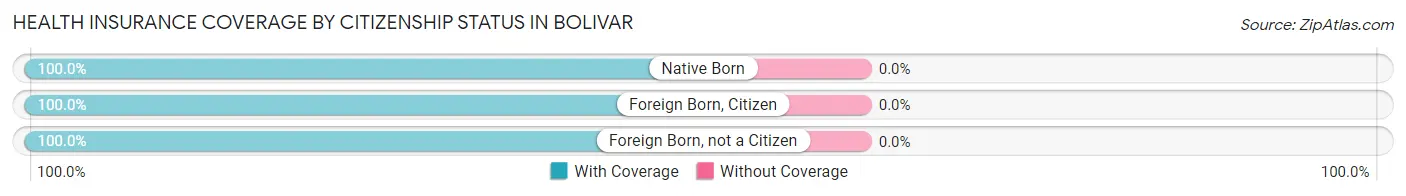
| Citizenship Status | With Coverage | Without Coverage |
| Native Born | 60 (100.0%) | 0 (0.0%) |
| Foreign Born, Citizen | 174 (100.0%) | 0 (0.0%) |
| Foreign Born, not a Citizen | 99 (100.0%) | 0 (0.0%) |
Health Insurance Coverage by Household Income in Bolivar
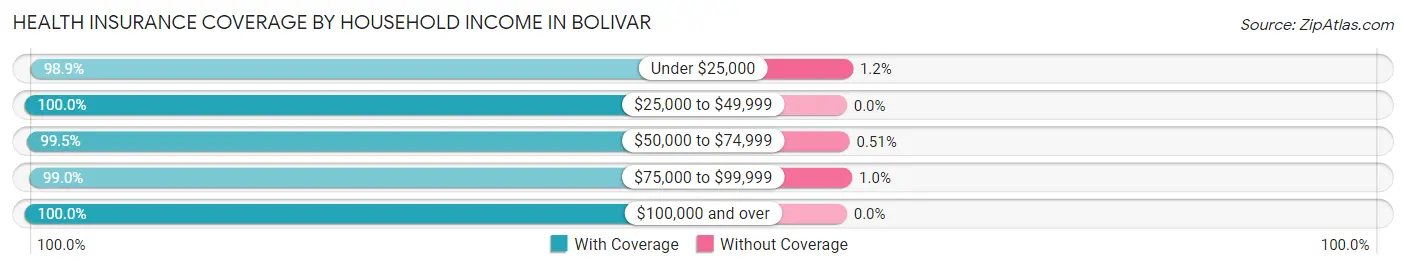
| Household Income | With Coverage | Without Coverage |
| Under $25,000 | 86 (98.9%) | 1 (1.1%) |
| $25,000 to $49,999 | 293 (100.0%) | 0 (0.0%) |
| $50,000 to $74,999 | 197 (99.5%) | 1 (0.5%) |
| $75,000 to $99,999 | 198 (99.0%) | 2 (1.0%) |
| $100,000 and over | 272 (100.0%) | 0 (0.0%) |
Public vs Private Health Insurance Coverage by Age in Bolivar
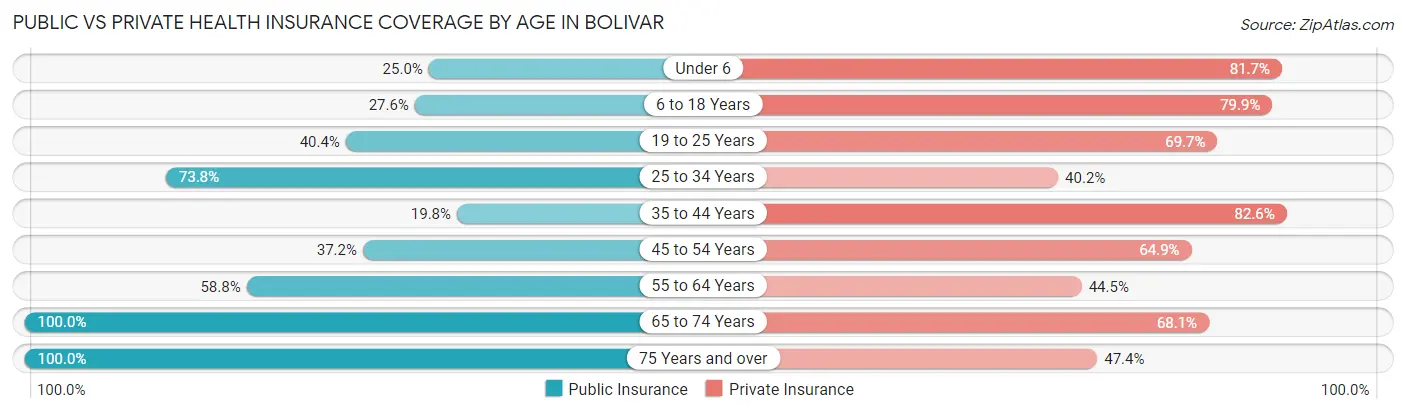
| Age Bracket | Public Insurance | Private Insurance |
| Under 6 | 15 (25.0%) | 49 (81.7%) |
| 6 to 18 Years | 48 (27.6%) | 139 (79.9%) |
| 19 to 25 Years | 40 (40.4%) | 69 (69.7%) |
| 25 to 34 Years | 90 (73.8%) | 49 (40.2%) |
| 35 to 44 Years | 34 (19.8%) | 142 (82.6%) |
| 45 to 54 Years | 35 (37.2%) | 61 (64.9%) |
| 55 to 64 Years | 70 (58.8%) | 53 (44.5%) |
| 65 to 74 Years | 113 (100.0%) | 77 (68.1%) |
| 75 Years and over | 97 (100.0%) | 46 (47.4%) |
| Total | 542 (51.6%) | 685 (65.2%) |
Disability Status by Sex by Age in Bolivar
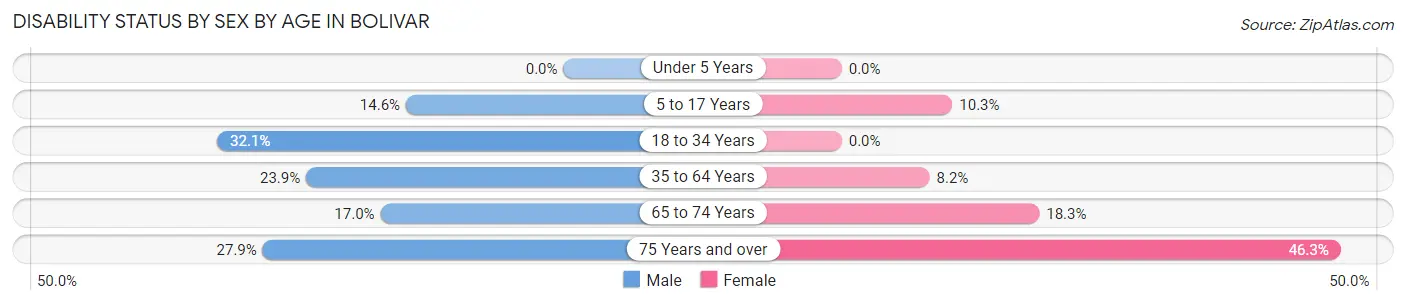
| Age Bracket | Male | Female |
| Under 5 Years | 0 (0.0%) | 0 (0.0%) |
| 5 to 17 Years | 13 (14.6%) | 8 (10.3%) |
| 18 to 34 Years | 36 (32.1%) | 0 (0.0%) |
| 35 to 64 Years | 48 (23.9%) | 15 (8.2%) |
| 65 to 74 Years | 9 (17.0%) | 11 (18.3%) |
| 75 Years and over | 12 (27.9%) | 25 (46.3%) |
Disability Class by Sex by Age in Bolivar
Disability Class: Hearing Difficulty
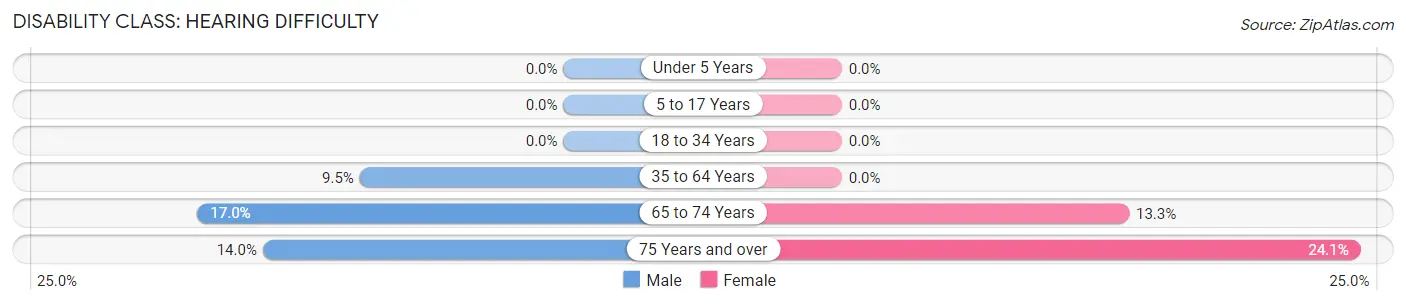
| Age Bracket | Male | Female |
| Under 5 Years | 0 (0.0%) | 0 (0.0%) |
| 5 to 17 Years | 0 (0.0%) | 0 (0.0%) |
| 18 to 34 Years | 0 (0.0%) | 0 (0.0%) |
| 35 to 64 Years | 19 (9.5%) | 0 (0.0%) |
| 65 to 74 Years | 9 (17.0%) | 8 (13.3%) |
| 75 Years and over | 6 (14.0%) | 13 (24.1%) |
Disability Class: Vision Difficulty
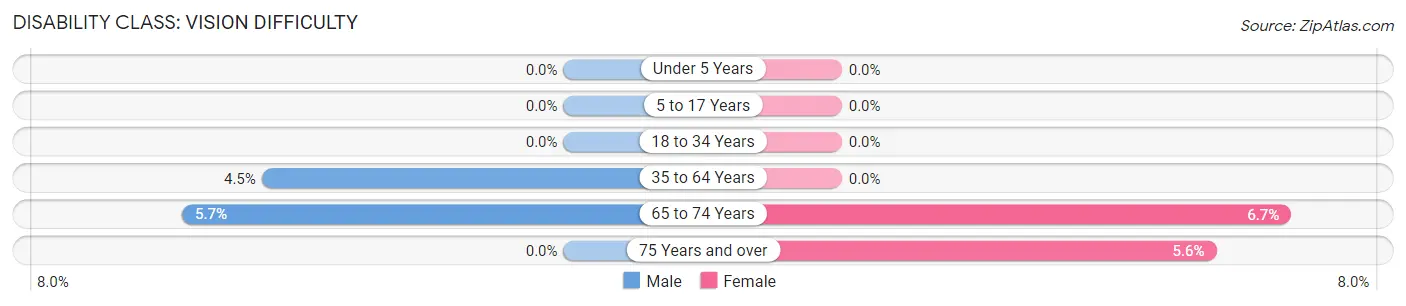
| Age Bracket | Male | Female |
| Under 5 Years | 0 (0.0%) | 0 (0.0%) |
| 5 to 17 Years | 0 (0.0%) | 0 (0.0%) |
| 18 to 34 Years | 0 (0.0%) | 0 (0.0%) |
| 35 to 64 Years | 9 (4.5%) | 0 (0.0%) |
| 65 to 74 Years | 3 (5.7%) | 4 (6.7%) |
| 75 Years and over | 0 (0.0%) | 3 (5.6%) |
Disability Class: Cognitive Difficulty
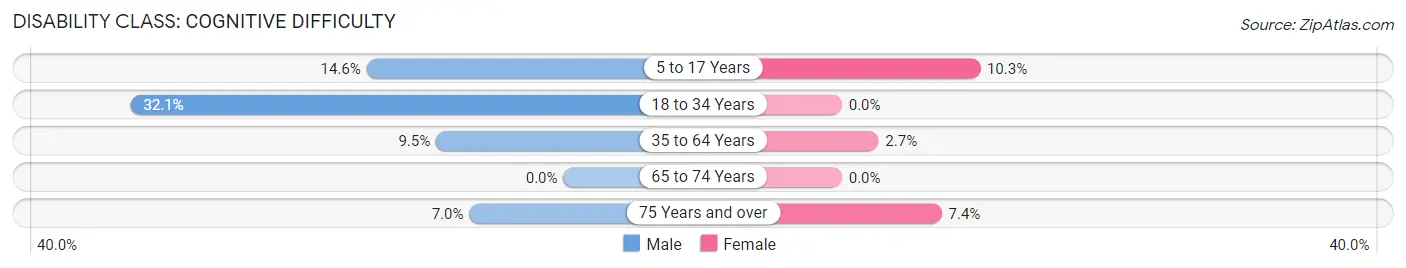
| Age Bracket | Male | Female |
| 5 to 17 Years | 13 (14.6%) | 8 (10.3%) |
| 18 to 34 Years | 36 (32.1%) | 0 (0.0%) |
| 35 to 64 Years | 19 (9.5%) | 5 (2.7%) |
| 65 to 74 Years | 0 (0.0%) | 0 (0.0%) |
| 75 Years and over | 3 (7.0%) | 4 (7.4%) |
Disability Class: Ambulatory Difficulty
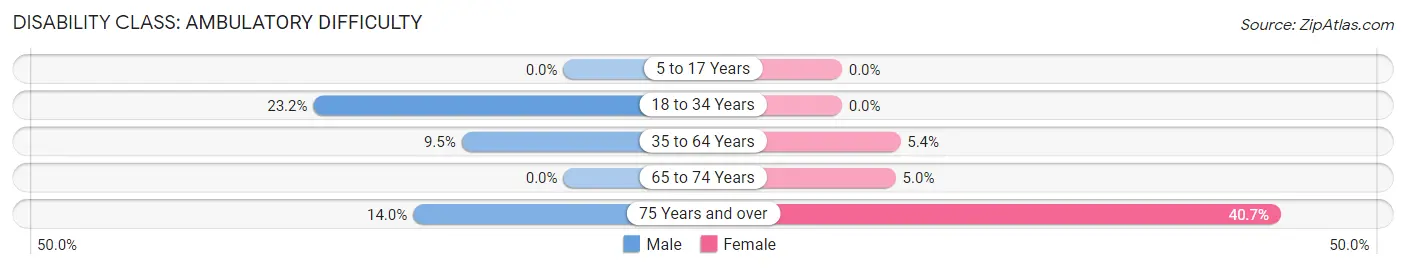
| Age Bracket | Male | Female |
| 5 to 17 Years | 0 (0.0%) | 0 (0.0%) |
| 18 to 34 Years | 26 (23.2%) | 0 (0.0%) |
| 35 to 64 Years | 19 (9.5%) | 10 (5.4%) |
| 65 to 74 Years | 0 (0.0%) | 3 (5.0%) |
| 75 Years and over | 6 (14.0%) | 22 (40.7%) |
Disability Class: Self-Care Difficulty
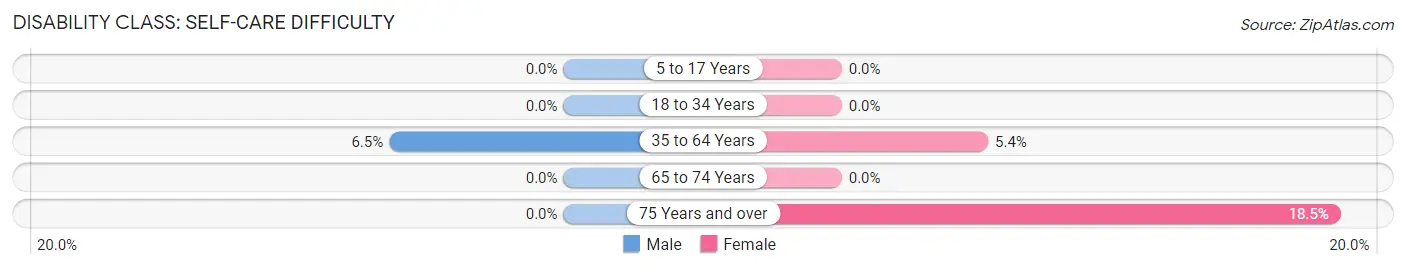
| Age Bracket | Male | Female |
| 5 to 17 Years | 0 (0.0%) | 0 (0.0%) |
| 18 to 34 Years | 0 (0.0%) | 0 (0.0%) |
| 35 to 64 Years | 13 (6.5%) | 10 (5.4%) |
| 65 to 74 Years | 0 (0.0%) | 0 (0.0%) |
| 75 Years and over | 0 (0.0%) | 10 (18.5%) |
Technology Access in Bolivar
Computing Device Access in Bolivar
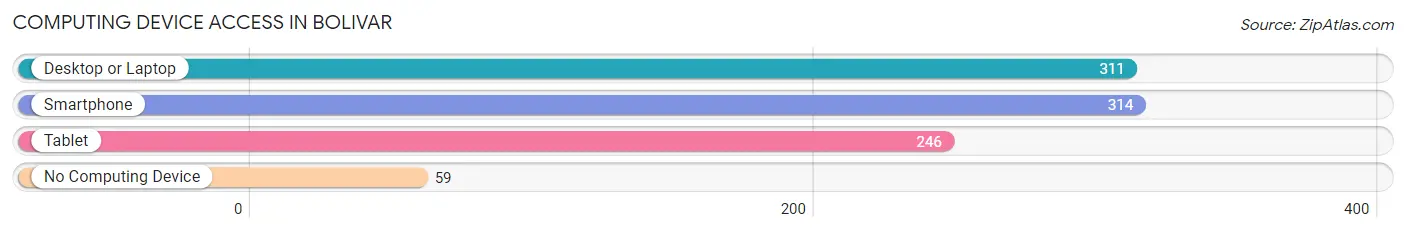
| Device Type | # Households | % Households |
| Desktop or Laptop | 311 | 71.8% |
| Smartphone | 314 | 72.5% |
| Tablet | 246 | 56.8% |
| No Computing Device | 59 | 13.6% |
| Total | 433 | 100.0% |
Internet Access in Bolivar
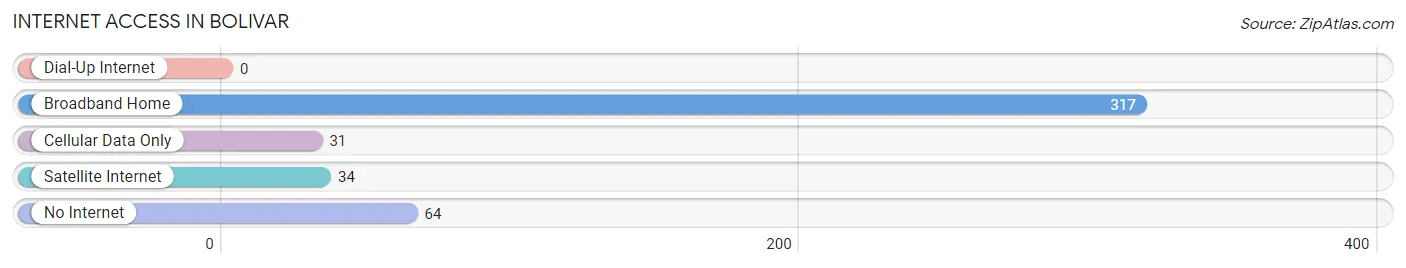
| Internet Type | # Households | % Households |
| Dial-Up Internet | 0 | 0.0% |
| Broadband Home | 317 | 73.2% |
| Cellular Data Only | 31 | 7.2% |
| Satellite Internet | 34 | 7.9% |
| No Internet | 64 | 14.8% |
| Total | 433 | 100.0% |
Bolivar Summary
Bolivar is a small town located in Allegany County, New York, United States. The town is situated in the southwestern corner of the county, and is bordered by the towns of Amity, Wirt, and Willing. The population of Bolivar was 1,845 at the 2010 census.
History
The area that is now Bolivar was first settled in 1808 by a group of settlers from Connecticut. The town was originally known as "Bolivar Flats" due to its flat terrain. The town was officially established in 1820 and was named after Simón Bolívar, a Venezuelan military and political leader who led the successful struggle for independence from Spain in the early 19th century.
In the late 19th century, Bolivar was a major center for the lumber industry. The town was home to several sawmills and lumber yards, and the lumber industry was the main source of employment for the town's residents.
Geography
Bolivar is located in southwestern Allegany County, in the western part of the state of New York. The town is bordered by the towns of Amity, Wirt, and Willing. The town is situated on the Allegheny Plateau, and is characterized by rolling hills and valleys. The highest point in the town is an unnamed hill in the northwest corner of the town, which has an elevation of 1,890 feet (576 m).
The town is drained by several small streams, including the Genesee River, which flows through the town from north to south. The town is also home to several small lakes, including Lake Bolivar, which is located in the center of the town.
Economy
The economy of Bolivar is largely based on agriculture and tourism. The town is home to several small farms, which produce a variety of crops, including corn, soybeans, hay, and wheat. The town is also home to several small businesses, including restaurants, retail stores, and service providers.
The town is also a popular tourist destination, due to its proximity to the Allegheny National Forest and the Finger Lakes region. The town is home to several campgrounds, as well as several small lakes, which are popular for fishing and boating.
Demographics
As of the 2010 census, the population of Bolivar was 1,845. The racial makeup of the town was 97.2% White, 0.7% African American, 0.2% Native American, 0.2% Asian, 0.1% Pacific Islander, 0.3% from other races, and 1.3% from two or more races. Hispanic or Latino of any race were 1.3% of the population.
The median household income in Bolivar was $41,250, and the median family income was $48,750. The per capita income for the town was $19,945. About 11.2% of families and 14.2% of the population were below the poverty line, including 19.2% of those under age 18 and 8.2% of those age 65 or over.
Common Questions
What is Per Capita Income in Bolivar?
Per Capita income in Bolivar is $27,265.
What is the Median Family Income in Bolivar?
Median Family Income in Bolivar is $62,679.
What is the Median Household income in Bolivar?
Median Household Income in Bolivar is $50,509.
What is Income or Wage Gap in Bolivar?
Income or Wage Gap in Bolivar is 14.1%.
Women in Bolivar earn 85.9 cents for every dollar earned by a man.
What is Inequality or Gini Index in Bolivar?
Inequality or Gini Index in Bolivar is 0.38.
What is the Total Population of Bolivar?
Total Population of Bolivar is 1,050.
What is the Total Male Population of Bolivar?
Total Male Population of Bolivar is 517.
What is the Total Female Population of Bolivar?
Total Female Population of Bolivar is 533.
What is the Ratio of Males per 100 Females in Bolivar?
There are 97.00 Males per 100 Females in Bolivar.
What is the Ratio of Females per 100 Males in Bolivar?
There are 103.09 Females per 100 Males in Bolivar.
What is the Median Population Age in Bolivar?
Median Population Age in Bolivar is 39.1 Years.
What is the Average Family Size in Bolivar
Average Family Size in Bolivar is 3.1 People.
What is the Average Household Size in Bolivar
Average Household Size in Bolivar is 2.4 People.
How Large is the Labor Force in Bolivar?
There are 469 People in the Labor Forcein in Bolivar.
What is the Percentage of People in the Labor Force in Bolivar?
54.1% of People are in the Labor Force in Bolivar.
What is the Unemployment Rate in Bolivar?
Unemployment Rate in Bolivar is 6.2%.