Black River, NY Map & Demographics
Black River Map
Black River Overview
$37,442
PER CAPITA INCOME
$84,107
AVG FAMILY INCOME
$80,305
AVG HOUSEHOLD INCOME
27.6%
WAGE / INCOME GAP [ % ]
72.4¢/ $1
WAGE / INCOME GAP [ $ ]
0.42
INEQUALITY / GINI INDEX
1,660
TOTAL POPULATION
816
MALE POPULATION
844
FEMALE POPULATION
96.68
MALES / 100 FEMALES
103.43
FEMALES / 100 MALES
38.6
MEDIAN AGE
2.6
AVG FAMILY SIZE
2.2
AVG HOUSEHOLD SIZE
923
LABOR FORCE [ PEOPLE ]
65.8%
PERCENT IN LABOR FORCE
21.9%
UNEMPLOYMENT RATE
Black River Zip Codes
Black River Area Codes
Income in Black River
Income Overview in Black River
Per Capita Income in Black River is $37,442, while median incomes of families and households are $84,107 and $80,305 respectively.
| Characteristic | Number | Measure |
| Per Capita Income | 1,660 | $37,442 |
| Median Family Income | 468 | $84,107 |
| Mean Family Income | 468 | $91,870 |
| Median Household Income | 754 | $80,305 |
| Mean Household Income | 754 | $81,468 |
| Income Deficit | 468 | $0 |
| Wage / Income Gap (%) | 1,660 | 27.62% |
| Wage / Income Gap ($) | 1,660 | 72.38¢ per $1 |
| Gini / Inequality Index | 1,660 | 0.42 |
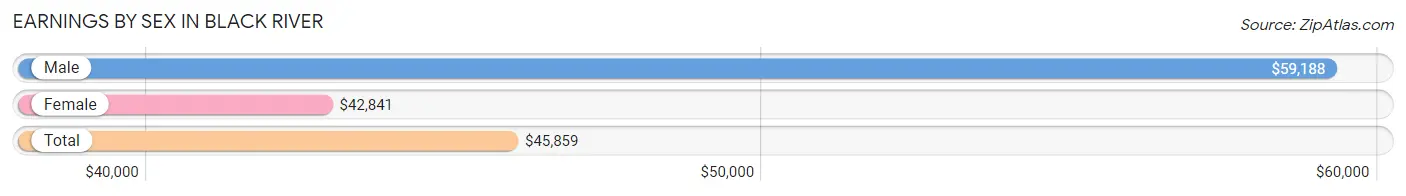
Earnings by Sex in Black River
Average Earnings in Black River are $45,859, $59,188 for men and $42,841 for women, a difference of 27.6%.
| Sex | Number | Average Earnings |
| Male | 515 (55.9%) | $59,188 |
| Female | 406 (44.1%) | $42,841 |
| Total | 921 (100.0%) | $45,859 |
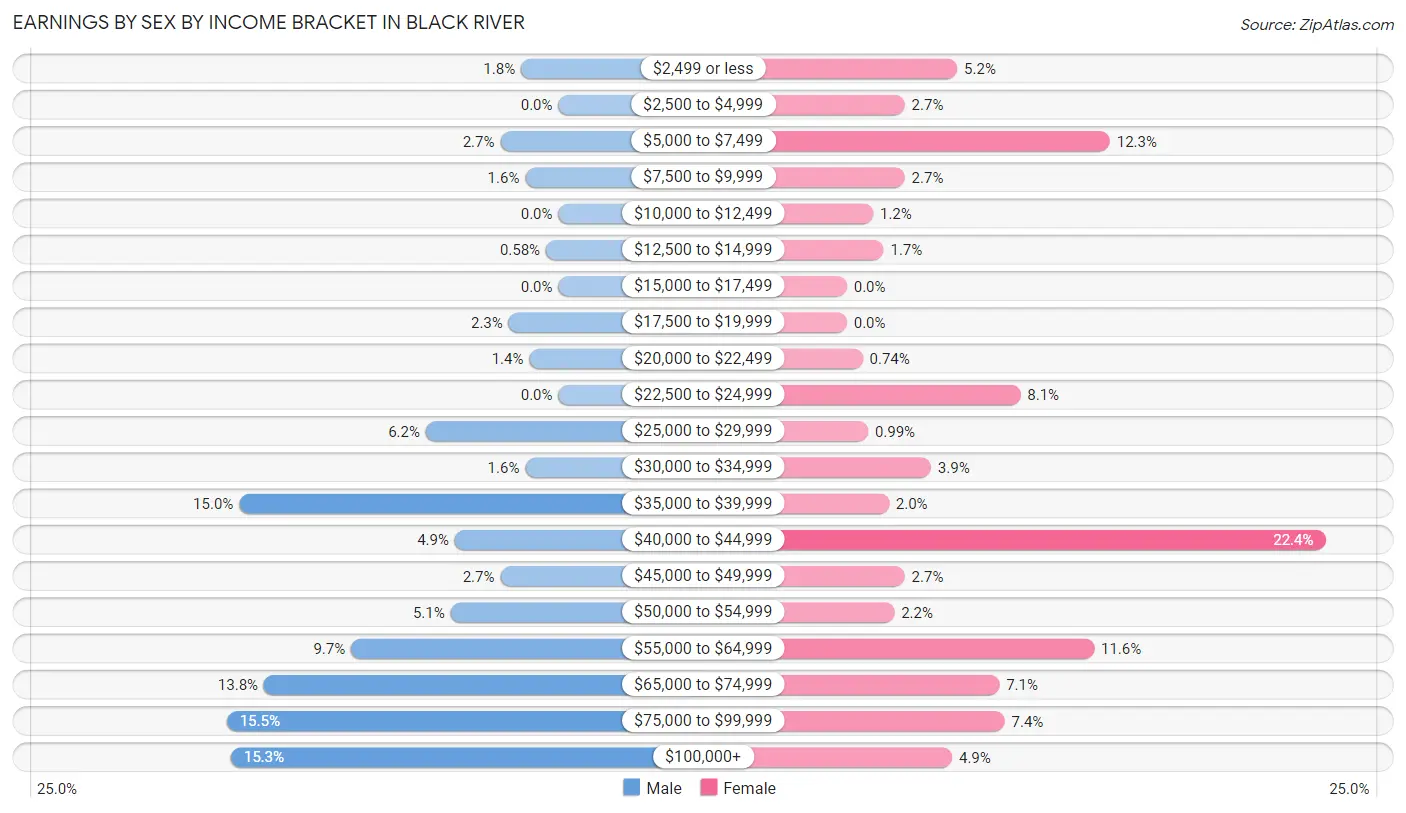
Earnings by Sex by Income Bracket in Black River
The most common earnings brackets in Black River are $75,000 to $99,999 for men (80 | 15.5%) and $40,000 to $44,999 for women (91 | 22.4%).
| Income | Male | Female |
| $2,499 or less | 9 (1.8%) | 21 (5.2%) |
| $2,500 to $4,999 | 0 (0.0%) | 11 (2.7%) |
| $5,000 to $7,499 | 14 (2.7%) | 50 (12.3%) |
| $7,500 to $9,999 | 8 (1.5%) | 11 (2.7%) |
| $10,000 to $12,499 | 0 (0.0%) | 5 (1.2%) |
| $12,500 to $14,999 | 3 (0.6%) | 7 (1.7%) |
| $15,000 to $17,499 | 0 (0.0%) | 0 (0.0%) |
| $17,500 to $19,999 | 12 (2.3%) | 0 (0.0%) |
| $20,000 to $22,499 | 7 (1.4%) | 3 (0.7%) |
| $22,500 to $24,999 | 0 (0.0%) | 33 (8.1%) |
| $25,000 to $29,999 | 32 (6.2%) | 4 (1.0%) |
| $30,000 to $34,999 | 8 (1.5%) | 16 (3.9%) |
| $35,000 to $39,999 | 77 (14.9%) | 8 (2.0%) |
| $40,000 to $44,999 | 25 (4.9%) | 91 (22.4%) |
| $45,000 to $49,999 | 14 (2.7%) | 11 (2.7%) |
| $50,000 to $54,999 | 26 (5.1%) | 9 (2.2%) |
| $55,000 to $64,999 | 50 (9.7%) | 47 (11.6%) |
| $65,000 to $74,999 | 71 (13.8%) | 29 (7.1%) |
| $75,000 to $99,999 | 80 (15.5%) | 30 (7.4%) |
| $100,000+ | 79 (15.3%) | 20 (4.9%) |
| Total | 515 (100.0%) | 406 (100.0%) |
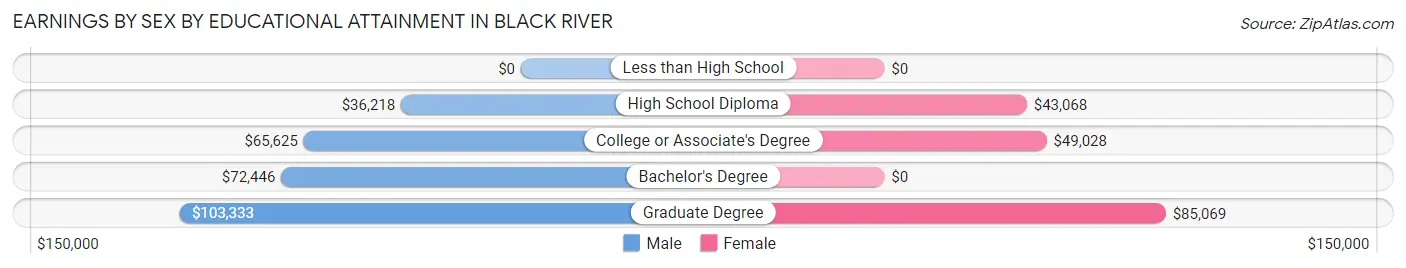
Earnings by Sex by Educational Attainment in Black River
Average earnings in Black River are $60,750 for men and $43,769 for women, a difference of 28.0%. Men with an educational attainment of graduate degree enjoy the highest average annual earnings of $103,333, while those with high school diploma education earn the least with $36,218. Women with an educational attainment of graduate degree earn the most with the average annual earnings of $85,069, while those with high school diploma education have the smallest earnings of $43,068.
| Educational Attainment | Male Income | Female Income |
| Less than High School | - | - |
| High School Diploma | $36,218 | $43,068 |
| College or Associate's Degree | $65,625 | $49,028 |
| Bachelor's Degree | $72,446 | $0 |
| Graduate Degree | $103,333 | $85,069 |
| Total | $60,750 | $43,769 |
Family Income in Black River
Family Income Brackets in Black River
According to the Black River family income data, there are 91 families falling into the $100,000 to $149,999 income range, which is the most common income bracket and makes up 19.4% of all families. Conversely, the $35,000 to $49,999 income bracket is the least frequent group with only 7 families (1.5%) belonging to this category.
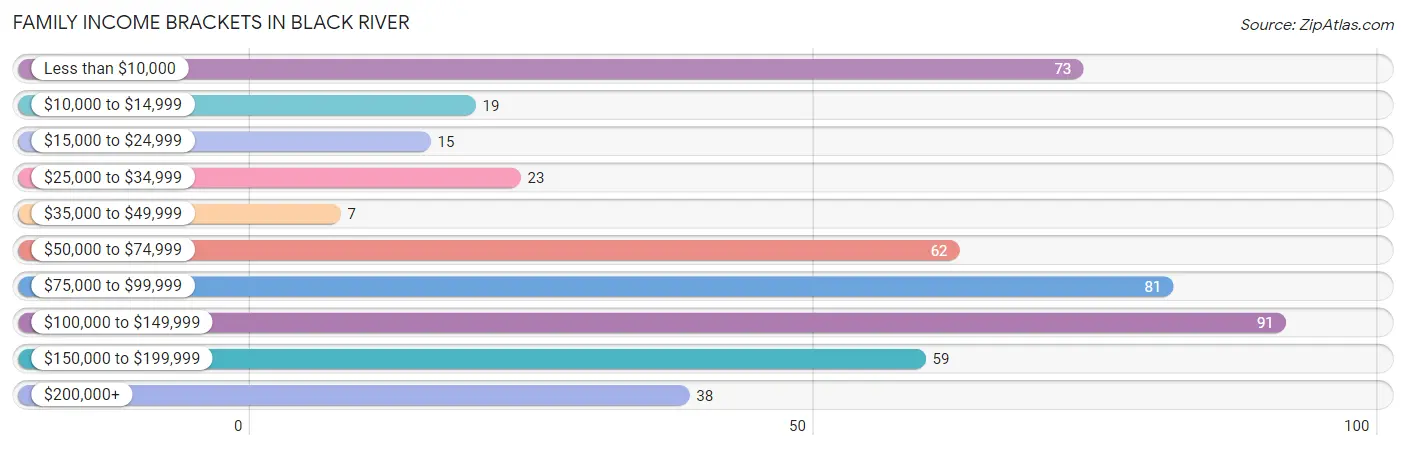
| Income Bracket | # Families | % Families |
| Less than $10,000 | 73 | 15.6% |
| $10,000 to $14,999 | 19 | 4.1% |
| $15,000 to $24,999 | 15 | 3.2% |
| $25,000 to $34,999 | 23 | 4.9% |
| $35,000 to $49,999 | 7 | 1.5% |
| $50,000 to $74,999 | 62 | 13.2% |
| $75,000 to $99,999 | 81 | 17.3% |
| $100,000 to $149,999 | 91 | 19.4% |
| $150,000 to $199,999 | 59 | 12.6% |
| $200,000+ | 38 | 8.1% |
Family Income by Famaliy Size in Black River
4-person families (83 | 17.7%) account for the highest median family income in Black River with $174,688 per family, while 4-person families (83 | 17.7%) have the highest median income of $43,672 per family member.
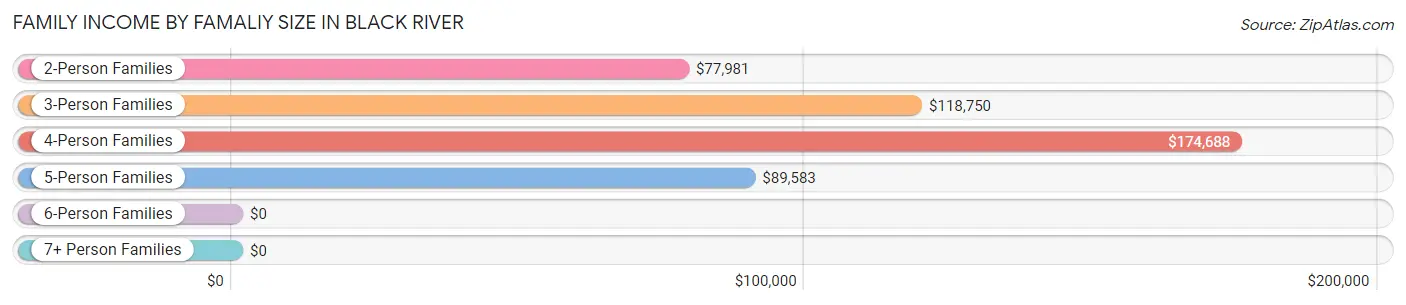
| Income Bracket | # Families | Median Income |
| 2-Person Families | 301 (64.3%) | $77,981 |
| 3-Person Families | 40 (8.6%) | $118,750 |
| 4-Person Families | 83 (17.7%) | $174,688 |
| 5-Person Families | 43 (9.2%) | $89,583 |
| 6-Person Families | 1 (0.2%) | $0 |
| 7+ Person Families | 0 (0.0%) | $0 |
| Total | 468 (100.0%) | $84,107 |
Family Income by Number of Earners in Black River
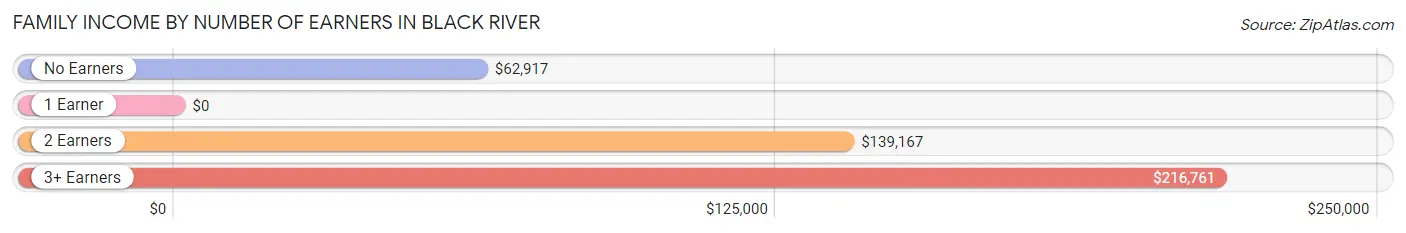
| Number of Earners | # Families | Median Income |
| No Earners | 81 (17.3%) | $62,917 |
| 1 Earner | 180 (38.5%) | $0 |
| 2 Earners | 176 (37.6%) | $139,167 |
| 3+ Earners | 31 (6.6%) | $216,761 |
| Total | 468 (100.0%) | $84,107 |
Household Income in Black River
Household Income Brackets in Black River
With 170 households falling in the category, the $75,000 to $99,999 income range is the most frequent in Black River, accounting for 22.6% of all households. In contrast, only 30 households (4.0%) fall into the $15,000 to $24,999 income bracket, making it the least populous group.
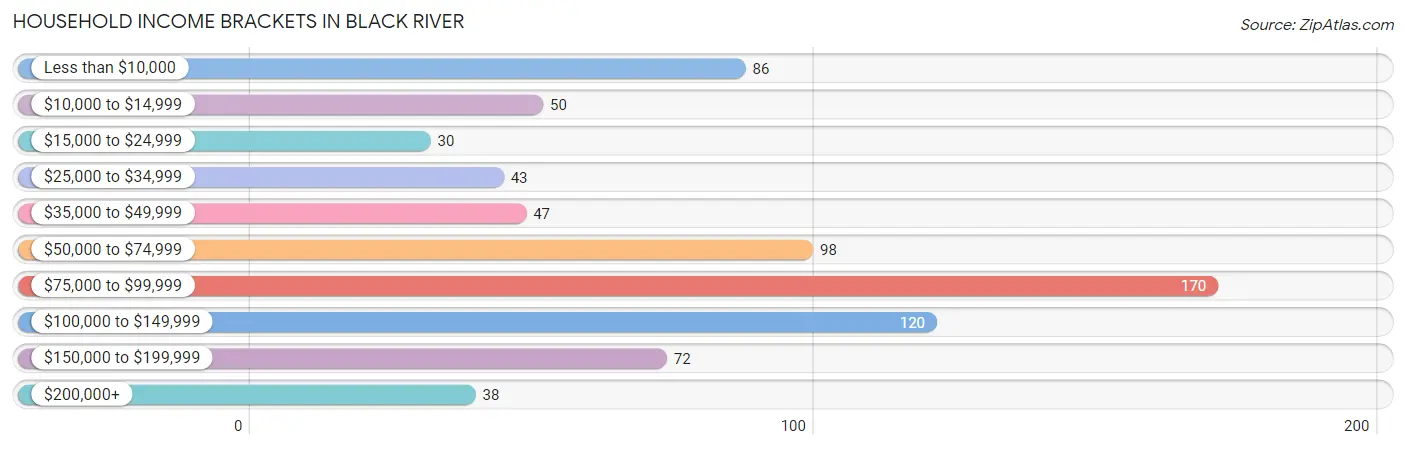
| Income Bracket | # Households | % Households |
| Less than $10,000 | 86 | 11.4% |
| $10,000 to $14,999 | 50 | 6.6% |
| $15,000 to $24,999 | 30 | 4.0% |
| $25,000 to $34,999 | 43 | 5.7% |
| $35,000 to $49,999 | 47 | 6.2% |
| $50,000 to $74,999 | 98 | 13.0% |
| $75,000 to $99,999 | 170 | 22.5% |
| $100,000 to $149,999 | 120 | 15.9% |
| $150,000 to $199,999 | 72 | 9.5% |
| $200,000+ | 38 | 5.0% |
Household Income by Householder Age in Black River
The median household income in Black River is $80,305, with the highest median household income of $95,104 found in the 45 to 64 years age bracket for the primary householder. A total of 187 households (24.8%) fall into this category. Meanwhile, the 15 to 24 years age bracket for the primary householder has the lowest median household income of $32,917, with 15 households (2.0%) in this group.
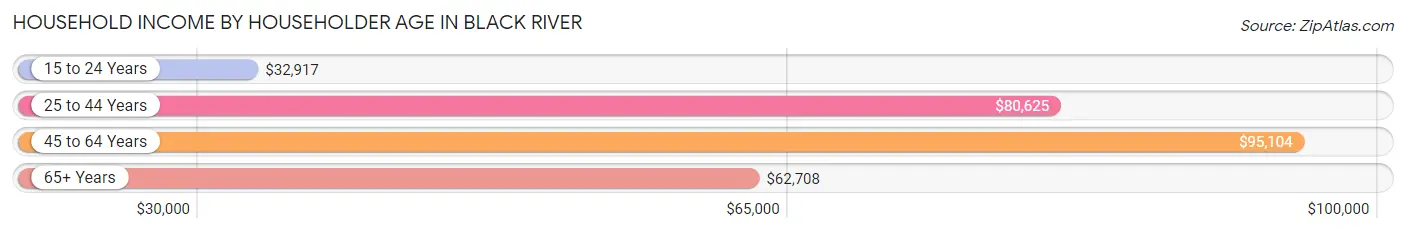
| Income Bracket | # Households | Median Income |
| 15 to 24 Years | 15 (2.0%) | $32,917 |
| 25 to 44 Years | 397 (52.6%) | $80,625 |
| 45 to 64 Years | 187 (24.8%) | $95,104 |
| 65+ Years | 155 (20.6%) | $62,708 |
| Total | 754 (100.0%) | $80,305 |
Poverty in Black River
Income Below Poverty by Sex and Age in Black River
With 6.4% poverty level for males and 23.5% for females among the residents of Black River, under 5 year old males and 15 year old females are the most vulnerable to poverty, with 9 males (20.9%) and 4 females (100.0%) in their respective age groups living below the poverty level.
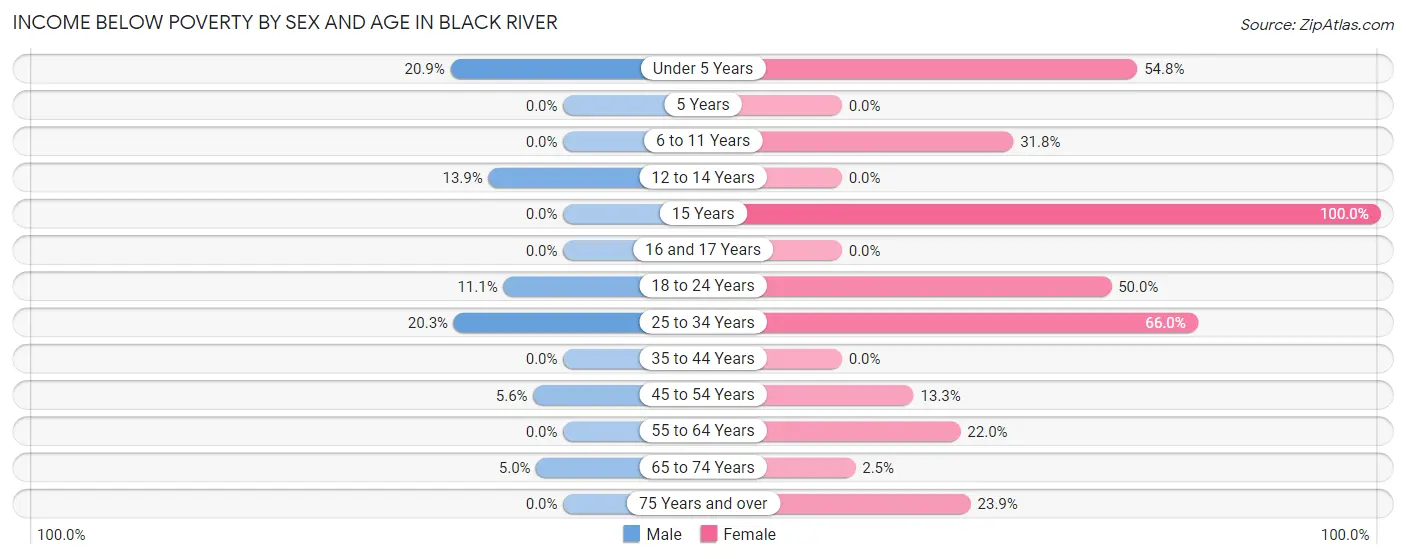
| Age Bracket | Male | Female |
| Under 5 Years | 9 (20.9%) | 17 (54.8%) |
| 5 Years | 0 (0.0%) | 0 (0.0%) |
| 6 to 11 Years | 0 (0.0%) | 14 (31.8%) |
| 12 to 14 Years | 5 (13.9%) | 0 (0.0%) |
| 15 Years | 0 (0.0%) | 4 (100.0%) |
| 16 and 17 Years | 0 (0.0%) | 0 (0.0%) |
| 18 to 24 Years | 4 (11.1%) | 7 (50.0%) |
| 25 to 34 Years | 26 (20.3%) | 105 (66.0%) |
| 35 to 44 Years | 0 (0.0%) | 0 (0.0%) |
| 45 to 54 Years | 4 (5.6%) | 14 (13.3%) |
| 55 to 64 Years | 0 (0.0%) | 24 (22.0%) |
| 65 to 74 Years | 4 (5.0%) | 2 (2.5%) |
| 75 Years and over | 0 (0.0%) | 11 (23.9%) |
| Total | 52 (6.4%) | 198 (23.5%) |
Income Above Poverty by Sex and Age in Black River
According to the poverty statistics in Black River, males aged 5 years and females aged 5 years are the age groups that are most secure financially, with 100.0% of males and 100.0% of females in these age groups living above the poverty line.
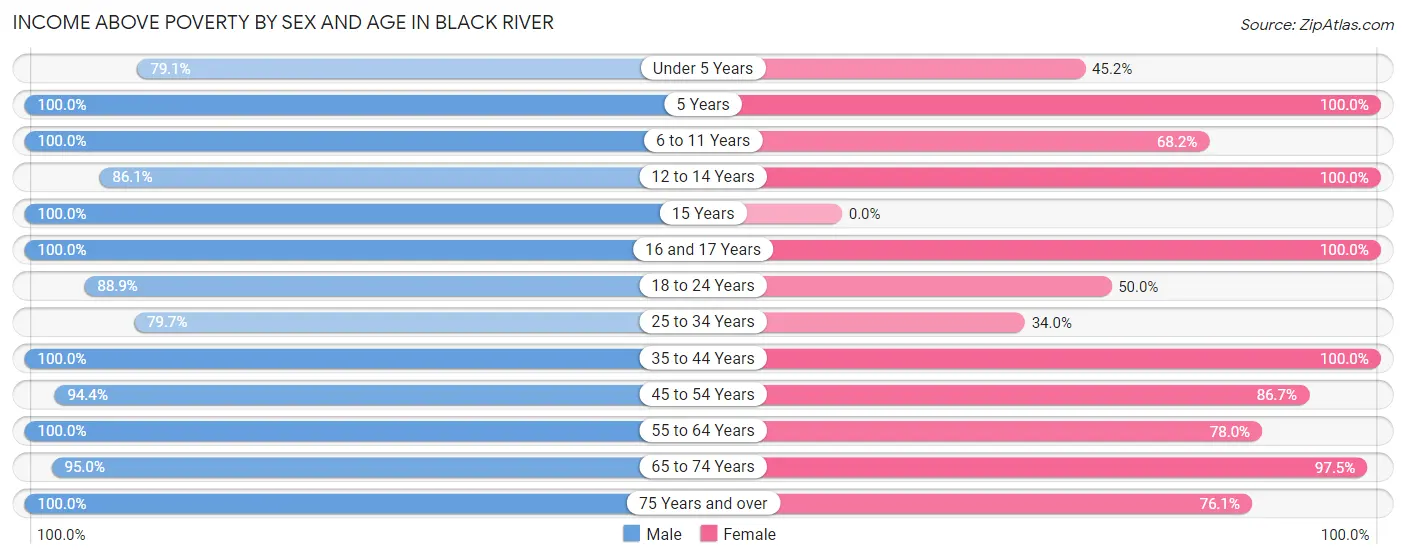
| Age Bracket | Male | Female |
| Under 5 Years | 34 (79.1%) | 14 (45.2%) |
| 5 Years | 2 (100.0%) | 15 (100.0%) |
| 6 to 11 Years | 47 (100.0%) | 30 (68.2%) |
| 12 to 14 Years | 31 (86.1%) | 32 (100.0%) |
| 15 Years | 4 (100.0%) | 0 (0.0%) |
| 16 and 17 Years | 23 (100.0%) | 52 (100.0%) |
| 18 to 24 Years | 32 (88.9%) | 7 (50.0%) |
| 25 to 34 Years | 102 (79.7%) | 54 (34.0%) |
| 35 to 44 Years | 235 (100.0%) | 153 (100.0%) |
| 45 to 54 Years | 68 (94.4%) | 91 (86.7%) |
| 55 to 64 Years | 61 (100.0%) | 85 (78.0%) |
| 65 to 74 Years | 76 (95.0%) | 78 (97.5%) |
| 75 Years and over | 49 (100.0%) | 35 (76.1%) |
| Total | 764 (93.6%) | 646 (76.5%) |
Income Below Poverty Among Married-Couple Families in Black River
The poverty statistics for married-couple families in Black River show that 21.7% or 92 of the total 423 families live below the poverty line. Families with no children have the highest poverty rate of 23.7%, comprising of 69 families. On the other hand, families with 3 or 4 children have the lowest poverty rate of 11.8%, which includes 4 families.
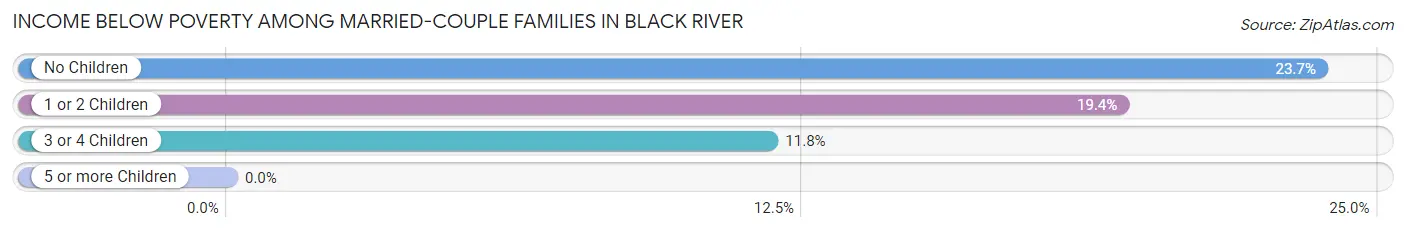
| Children | Above Poverty | Below Poverty |
| No Children | 222 (76.3%) | 69 (23.7%) |
| 1 or 2 Children | 79 (80.6%) | 19 (19.4%) |
| 3 or 4 Children | 30 (88.2%) | 4 (11.8%) |
| 5 or more Children | 0 (0.0%) | 0 (0.0%) |
| Total | 331 (78.2%) | 92 (21.7%) |
Income Below Poverty Among Single-Parent Households in Black River
According to the poverty data in Black River, 100.0% or 4 single-father households and 9.8% or 4 single-mother households are living below the poverty line. Among single-father households, those with 1 or 2 children have the highest poverty rate, with 4 households (100.0%) experiencing poverty. Likewise, among single-mother households, those with 1 or 2 children have the highest poverty rate, with 4 households (22.2%) falling below the poverty line.
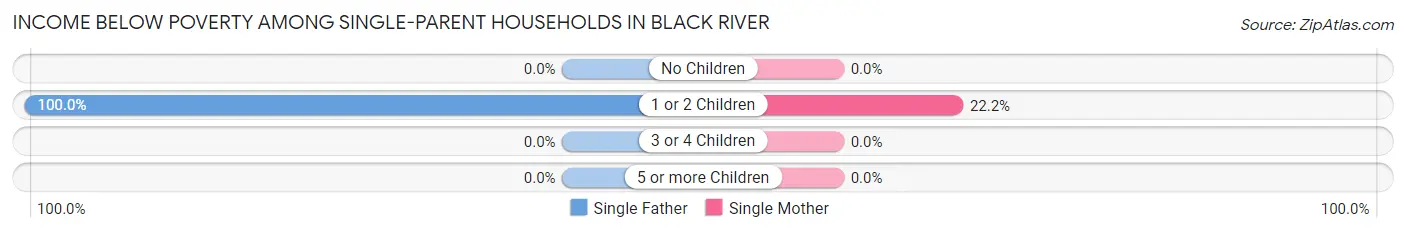
| Children | Single Father | Single Mother |
| No Children | 0 (0.0%) | 0 (0.0%) |
| 1 or 2 Children | 4 (100.0%) | 4 (22.2%) |
| 3 or 4 Children | 0 (0.0%) | 0 (0.0%) |
| 5 or more Children | 0 (0.0%) | 0 (0.0%) |
| Total | 4 (100.0%) | 4 (9.8%) |
Income Below Poverty Among Married-Couple vs Single-Parent Households in Black River
The poverty data for Black River shows that 92 of the married-couple family households (21.7%) and 8 of the single-parent households (17.8%) are living below the poverty level. Within the married-couple family households, those with no children have the highest poverty rate, with 69 households (23.7%) falling below the poverty line. Among the single-parent households, those with 1 or 2 children have the highest poverty rate, with 8 household (36.4%) living below poverty.
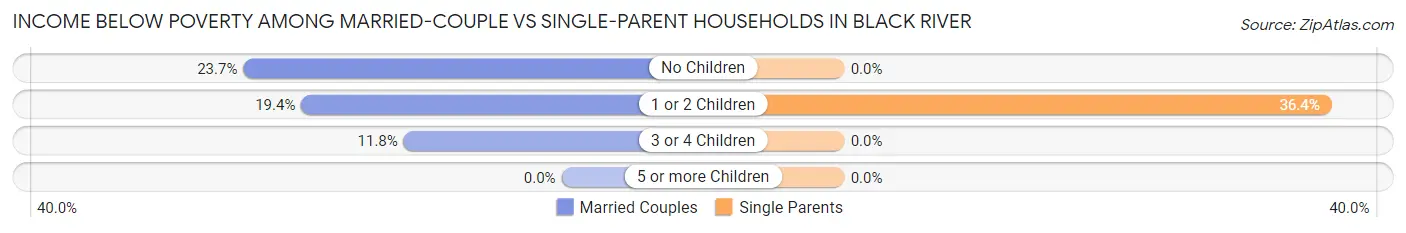
| Children | Married-Couple Families | Single-Parent Households |
| No Children | 69 (23.7%) | 0 (0.0%) |
| 1 or 2 Children | 19 (19.4%) | 8 (36.4%) |
| 3 or 4 Children | 4 (11.8%) | 0 (0.0%) |
| 5 or more Children | 0 (0.0%) | 0 (0.0%) |
| Total | 92 (21.7%) | 8 (17.8%) |
Race in Black River
The most populous races in Black River are White / Caucasian (1,455 | 87.6%), Asian (116 | 7.0%), and Two or more Races (73 | 4.4%).
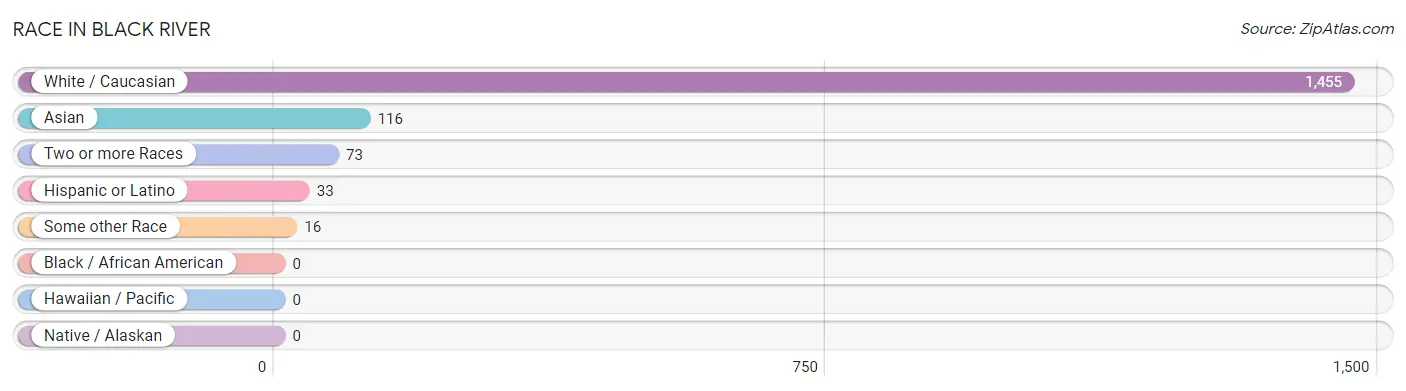
| Race | # Population | % Population |
| Asian | 116 | 7.0% |
| Black / African American | 0 | 0.0% |
| Hawaiian / Pacific | 0 | 0.0% |
| Hispanic or Latino | 33 | 2.0% |
| Native / Alaskan | 0 | 0.0% |
| White / Caucasian | 1,455 | 87.6% |
| Two or more Races | 73 | 4.4% |
| Some other Race | 16 | 1.0% |
| Total | 1,660 | 100.0% |
Ancestry in Black River
The most populous ancestries reported in Black River are Irish (388 | 23.4%), German (237 | 14.3%), English (186 | 11.2%), American (152 | 9.2%), and French (136 | 8.2%), together accounting for 66.2% of all Black River residents.
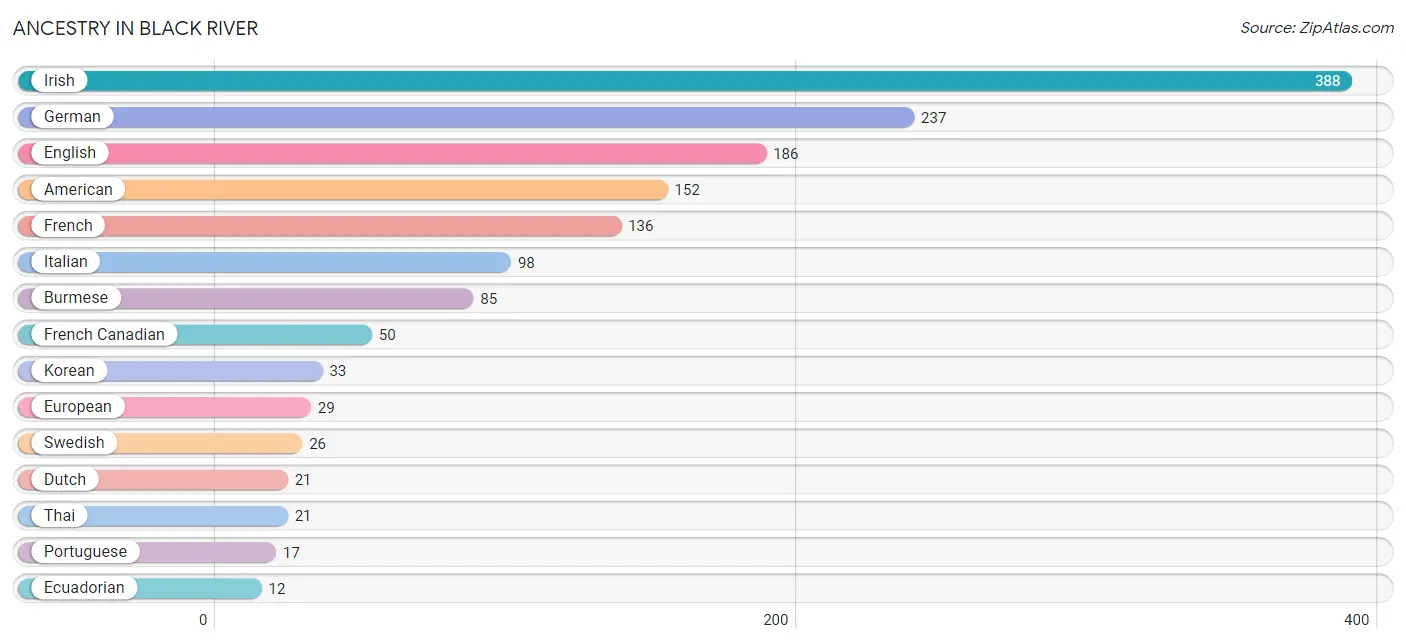
| Ancestry | # Population | % Population |
| American | 152 | 9.2% |
| Barbadian | 3 | 0.2% |
| Bhutanese | 10 | 0.6% |
| Burmese | 85 | 5.1% |
| Canadian | 4 | 0.2% |
| Croatian | 4 | 0.2% |
| Czech | 8 | 0.5% |
| Dutch | 21 | 1.3% |
| Ecuadorian | 12 | 0.7% |
| English | 186 | 11.2% |
| European | 29 | 1.8% |
| French | 136 | 8.2% |
| French Canadian | 50 | 3.0% |
| German | 237 | 14.3% |
| Greek | 7 | 0.4% |
| Guyanese | 10 | 0.6% |
| Hungarian | 12 | 0.7% |
| Irish | 388 | 23.4% |
| Italian | 98 | 5.9% |
| Jamaican | 5 | 0.3% |
| Korean | 33 | 2.0% |
| Mexican | 4 | 0.2% |
| Northern European | 3 | 0.2% |
| Norwegian | 2 | 0.1% |
| Polish | 8 | 0.5% |
| Portuguese | 17 | 1.0% |
| Puerto Rican | 7 | 0.4% |
| Romanian | 2 | 0.1% |
| Scotch-Irish | 4 | 0.2% |
| Scottish | 5 | 0.3% |
| Slovak | 9 | 0.5% |
| South American | 12 | 0.7% |
| Spaniard | 10 | 0.6% |
| Swedish | 26 | 1.6% |
| Swiss | 4 | 0.2% |
| Thai | 21 | 1.3% |
| Welsh | 3 | 0.2% | View All 37 Rows |
Immigrants in Black River
The most numerous immigrant groups reported in Black River came from Asia (45 | 2.7%), Europe (27 | 1.6%), Philippines (22 | 1.3%), South Eastern Asia (22 | 1.3%), and Germany (21 | 1.3%), together accounting for 8.3% of all Black River residents.
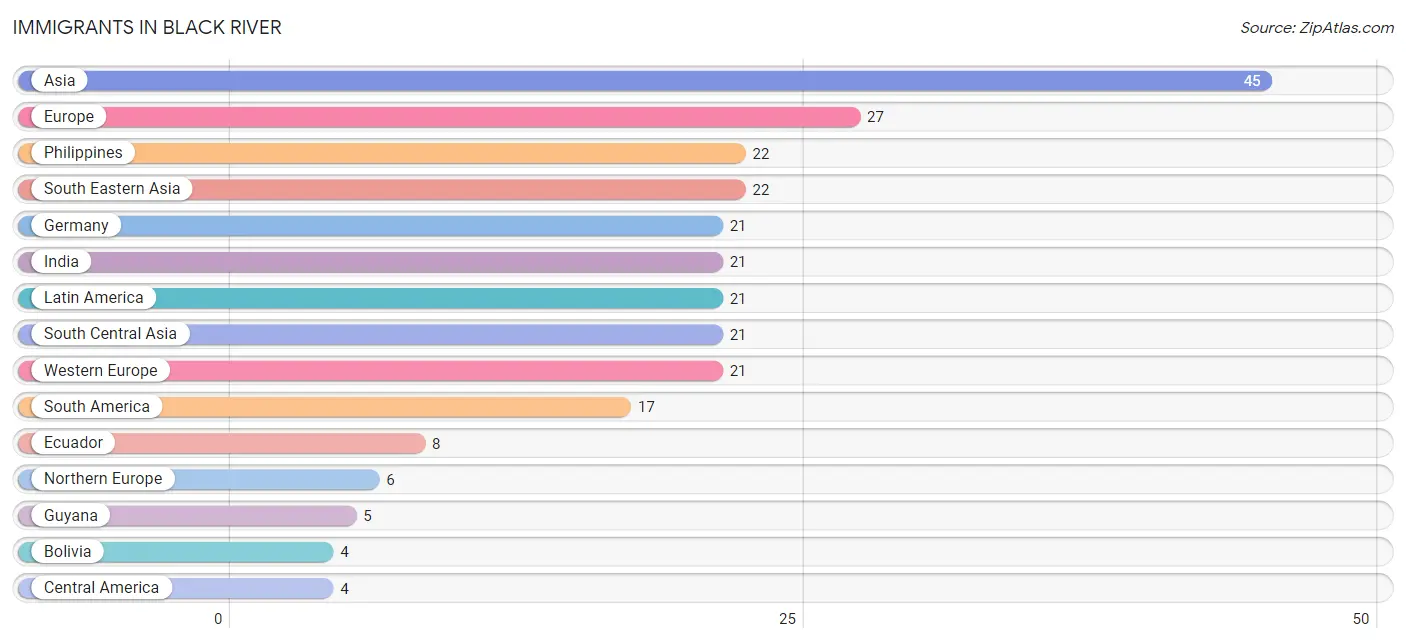
| Immigration Origin | # Population | % Population |
| Asia | 45 | 2.7% |
| Bolivia | 4 | 0.2% |
| Central America | 4 | 0.2% |
| Eastern Asia | 2 | 0.1% |
| Ecuador | 8 | 0.5% |
| Europe | 27 | 1.6% |
| Germany | 21 | 1.3% |
| Guyana | 5 | 0.3% |
| India | 21 | 1.3% |
| Korea | 2 | 0.1% |
| Latin America | 21 | 1.3% |
| Mexico | 4 | 0.2% |
| Northern Europe | 6 | 0.4% |
| Philippines | 22 | 1.3% |
| South America | 17 | 1.0% |
| South Central Asia | 21 | 1.3% |
| South Eastern Asia | 22 | 1.3% |
| Western Europe | 21 | 1.3% | View All 18 Rows |
Sex and Age in Black River
Sex and Age in Black River
The most populous age groups in Black River are 40 to 44 Years (164 | 20.1%) for men and 35 to 39 Years (130 | 15.4%) for women.
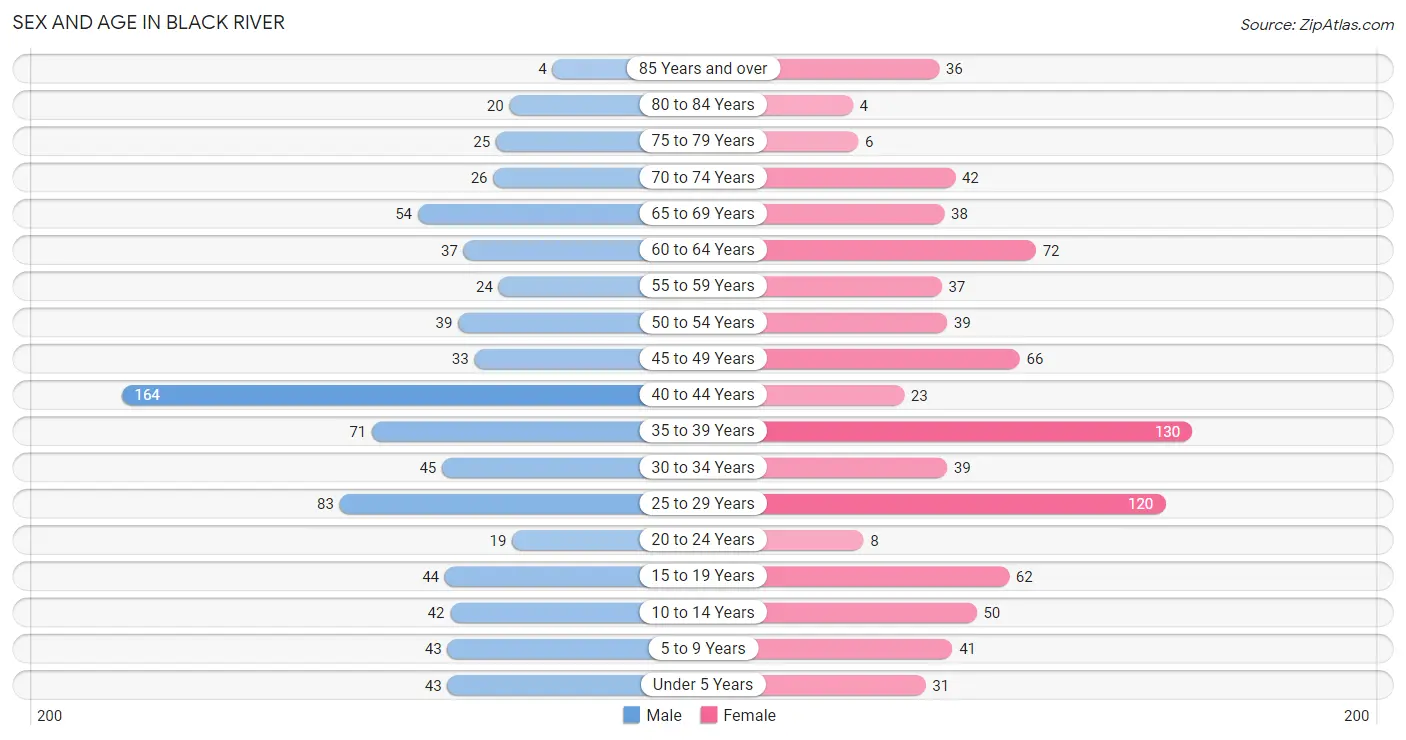
| Age Bracket | Male | Female |
| Under 5 Years | 43 (5.3%) | 31 (3.7%) |
| 5 to 9 Years | 43 (5.3%) | 41 (4.9%) |
| 10 to 14 Years | 42 (5.1%) | 50 (5.9%) |
| 15 to 19 Years | 44 (5.4%) | 62 (7.3%) |
| 20 to 24 Years | 19 (2.3%) | 8 (0.9%) |
| 25 to 29 Years | 83 (10.2%) | 120 (14.2%) |
| 30 to 34 Years | 45 (5.5%) | 39 (4.6%) |
| 35 to 39 Years | 71 (8.7%) | 130 (15.4%) |
| 40 to 44 Years | 164 (20.1%) | 23 (2.7%) |
| 45 to 49 Years | 33 (4.0%) | 66 (7.8%) |
| 50 to 54 Years | 39 (4.8%) | 39 (4.6%) |
| 55 to 59 Years | 24 (2.9%) | 37 (4.4%) |
| 60 to 64 Years | 37 (4.5%) | 72 (8.5%) |
| 65 to 69 Years | 54 (6.6%) | 38 (4.5%) |
| 70 to 74 Years | 26 (3.2%) | 42 (5.0%) |
| 75 to 79 Years | 25 (3.1%) | 6 (0.7%) |
| 80 to 84 Years | 20 (2.5%) | 4 (0.5%) |
| 85 Years and over | 4 (0.5%) | 36 (4.3%) |
| Total | 816 (100.0%) | 844 (100.0%) |
Families and Households in Black River
Median Family Size in Black River
The median family size in Black River is 2.64 persons per family, with single male/father families (4 | 0.9%) accounting for the largest median family size of 4 persons per family. On the other hand, married-couple families (423 | 90.4%) represent the smallest median family size with 2.59 persons per family.
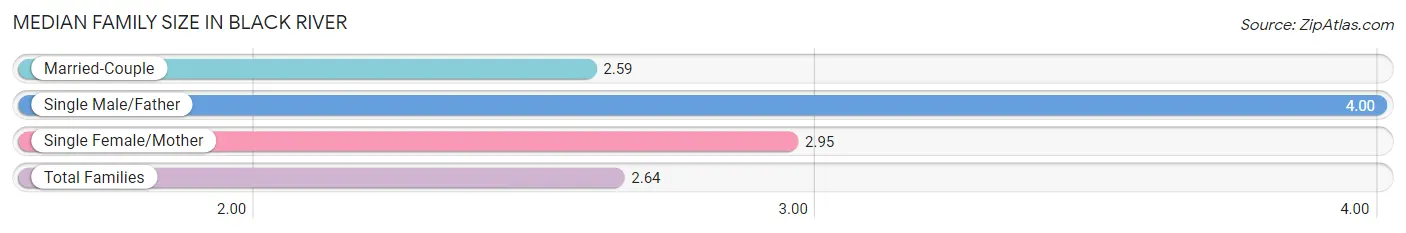
| Family Type | # Families | Family Size |
| Married-Couple | 423 (90.4%) | 2.59 |
| Single Male/Father | 4 (0.9%) | 4.00 |
| Single Female/Mother | 41 (8.8%) | 2.95 |
| Total Families | 468 (100.0%) | 2.64 |
Median Household Size in Black River
The median household size in Black River is 2.20 persons per household, with single male/father households (4 | 0.5%) accounting for the largest median household size of 4 persons per household. non-family households (286 | 37.9%) represent the smallest median household size with 1.45 persons per household.
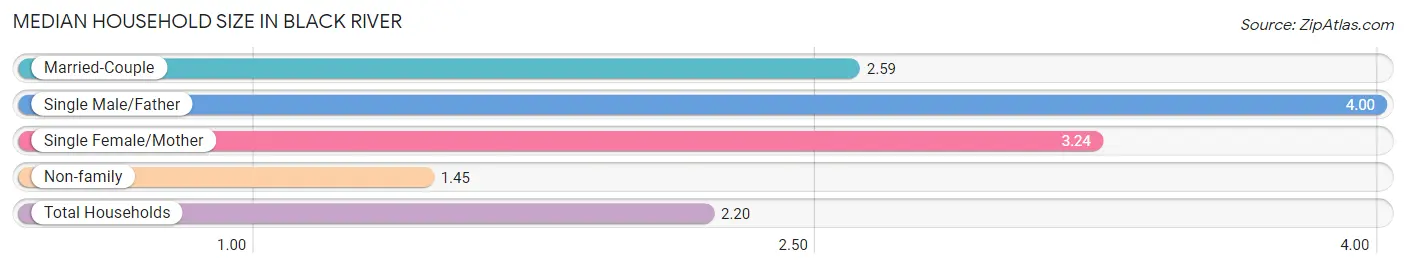
| Household Type | # Households | Household Size |
| Married-Couple | 423 (56.1%) | 2.59 |
| Single Male/Father | 4 (0.5%) | 4.00 |
| Single Female/Mother | 41 (5.4%) | 3.24 |
| Non-family | 286 (37.9%) | 1.45 |
| Total Households | 754 (100.0%) | 2.20 |
Household Size by Marriage Status in Black River
Out of a total of 754 households in Black River, 468 (62.1%) are family households, while 286 (37.9%) are nonfamily households. The most numerous type of family households are 2-person households, comprising 290, and the most common type of nonfamily households are 1-person households, comprising 174.
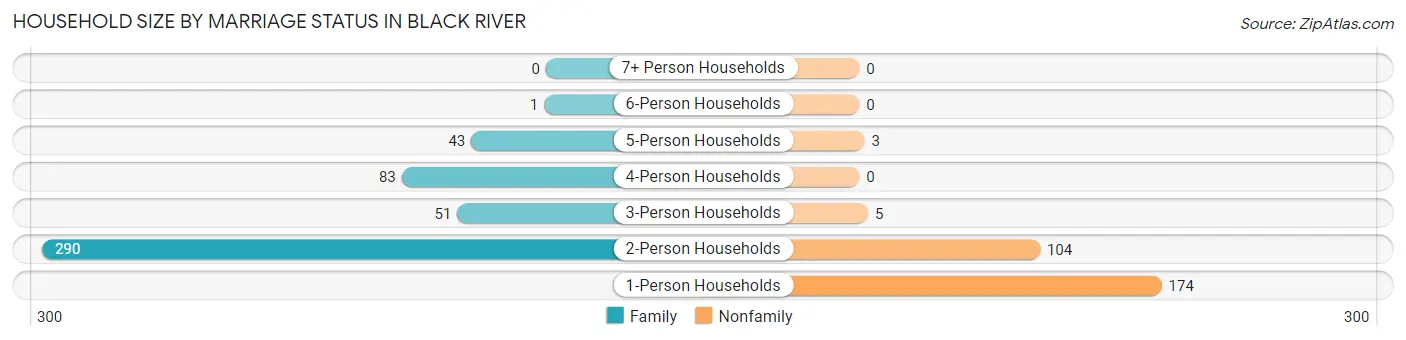
| Household Size | Family Households | Nonfamily Households |
| 1-Person Households | - | 174 (23.1%) |
| 2-Person Households | 290 (38.5%) | 104 (13.8%) |
| 3-Person Households | 51 (6.8%) | 5 (0.7%) |
| 4-Person Households | 83 (11.0%) | 0 (0.0%) |
| 5-Person Households | 43 (5.7%) | 3 (0.4%) |
| 6-Person Households | 1 (0.1%) | 0 (0.0%) |
| 7+ Person Households | 0 (0.0%) | 0 (0.0%) |
| Total | 468 (62.1%) | 286 (37.9%) |
Female Fertility in Black River
Fertility by Age in Black River
Average fertility rate in Black River is 70.0 births per 1,000 women. Women in the age bracket of 20 to 34 years have the highest fertility rate with 144.0 births per 1,000 women. Women in the age bracket of 20 to 34 years acount for 72.7% of all women with births.
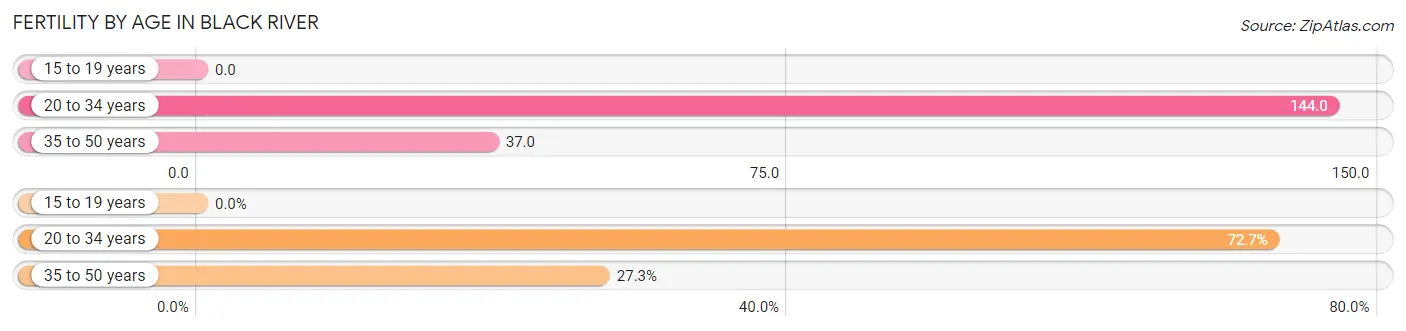
| Age Bracket | Women with Births | Births / 1,000 Women |
| 15 to 19 years | 0 (0.0%) | 0.0 |
| 20 to 34 years | 24 (72.7%) | 144.0 |
| 35 to 50 years | 9 (27.3%) | 37.0 |
| Total | 33 (100.0%) | 70.0 |
Fertility by Age by Marriage Status in Black River
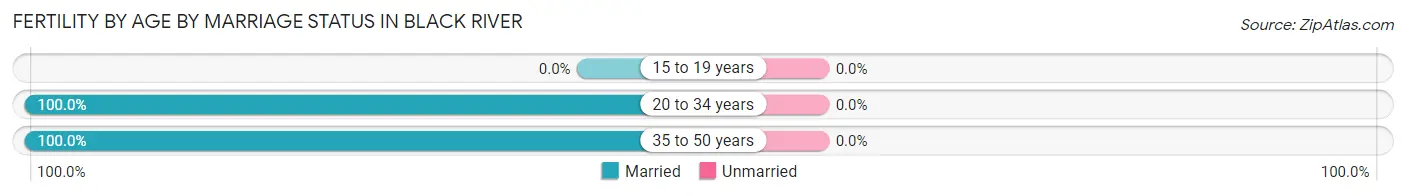
| Age Bracket | Married | Unmarried |
| 15 to 19 years | 0 (0.0%) | 0 (0.0%) |
| 20 to 34 years | 24 (100.0%) | 0 (0.0%) |
| 35 to 50 years | 9 (100.0%) | 0 (0.0%) |
| Total | 33 (100.0%) | 0 (0.0%) |
Fertility by Education in Black River
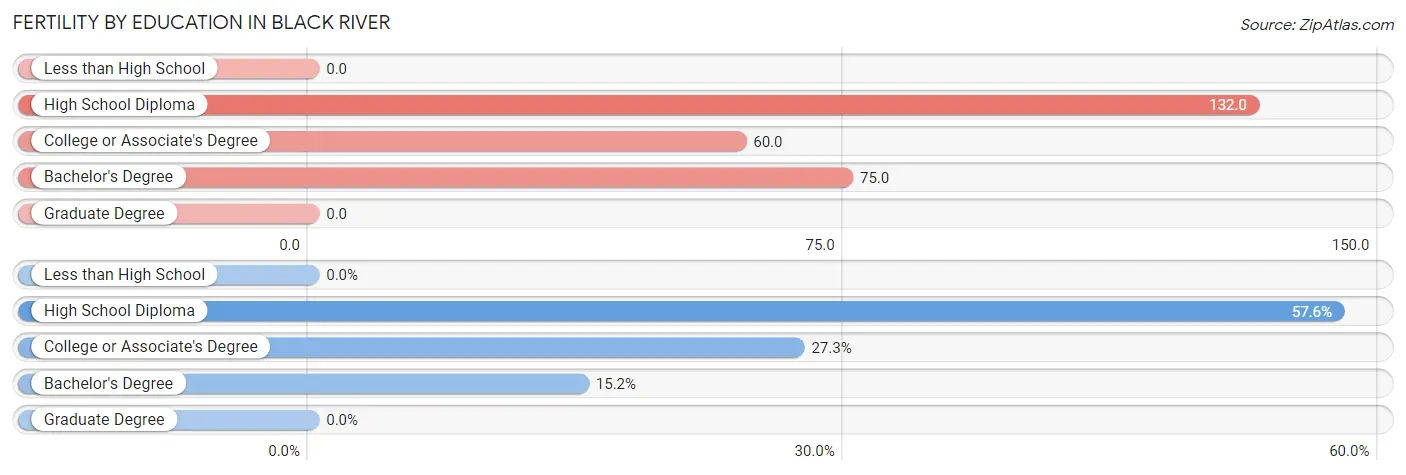
| Educational Attainment | Women with Births | Births / 1,000 Women |
| Less than High School | 0 (0.0%) | 0.0 |
| High School Diploma | 19 (57.6%) | 132.0 |
| College or Associate's Degree | 9 (27.3%) | 60.0 |
| Bachelor's Degree | 5 (15.1%) | 75.0 |
| Graduate Degree | 0 (0.0%) | 0.0 |
| Total | 33 (100.0%) | 70.0 |
Fertility by Education by Marriage Status in Black River
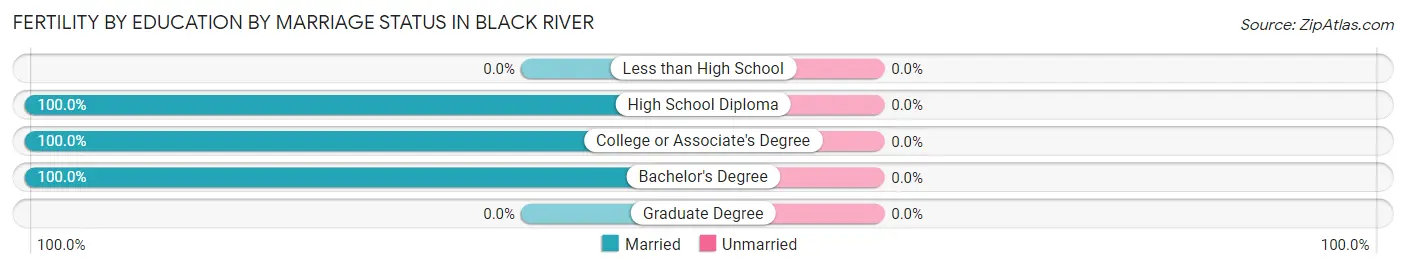
| Educational Attainment | Married | Unmarried |
| Less than High School | 0 (0.0%) | 0 (0.0%) |
| High School Diploma | 19 (100.0%) | 0 (0.0%) |
| College or Associate's Degree | 9 (100.0%) | 0 (0.0%) |
| Bachelor's Degree | 5 (100.0%) | 0 (0.0%) |
| Graduate Degree | 0 (0.0%) | 0 (0.0%) |
| Total | 33 (100.0%) | 0 (0.0%) |
Employment Characteristics in Black River
Employment by Class of Employer in Black River
Among the 738 employed individuals in Black River, private company employees (344 | 46.6%), federal government employees (190 | 25.8%), and local government employees (78 | 10.6%) make up the most common classes of employment.
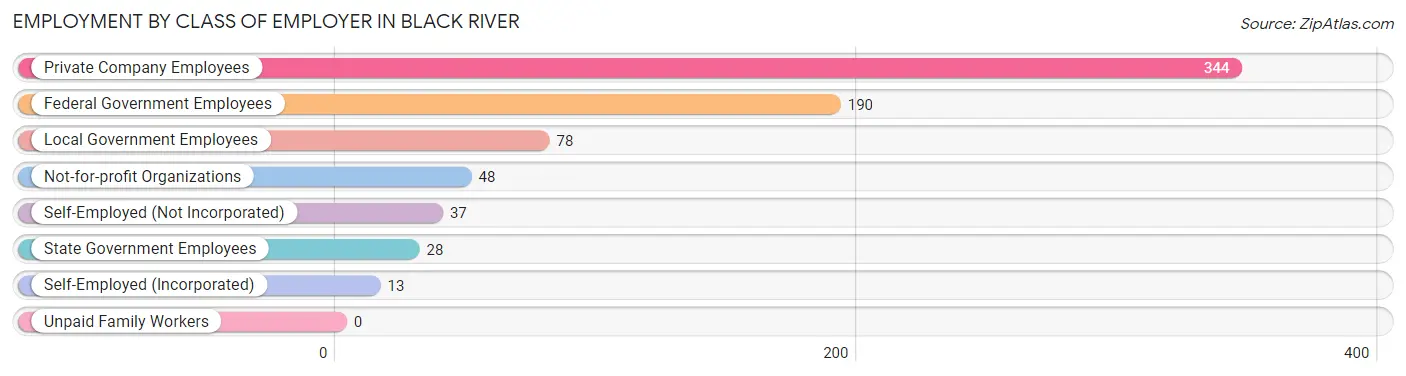
| Employer Class | # Employees | % Employees |
| Private Company Employees | 344 | 46.6% |
| Self-Employed (Incorporated) | 13 | 1.8% |
| Self-Employed (Not Incorporated) | 37 | 5.0% |
| Not-for-profit Organizations | 48 | 6.5% |
| Local Government Employees | 78 | 10.6% |
| State Government Employees | 28 | 3.8% |
| Federal Government Employees | 190 | 25.8% |
| Unpaid Family Workers | 0 | 0.0% |
| Total | 738 | 100.0% |
Employment Status by Age in Black River
According to the labor force statistics for Black River, out of the total population over 16 years of age (1,402), 65.8% or 923 individuals are in the labor force, with 21.9% or 202 of them unemployed. The age group with the highest labor force participation rate is 35 to 44 years, with 94.6% or 367 individuals in the labor force. Within the labor force, the 75 years and over age range has the highest percentage of unemployed individuals, with 100.0% or 14 of them being unemployed.
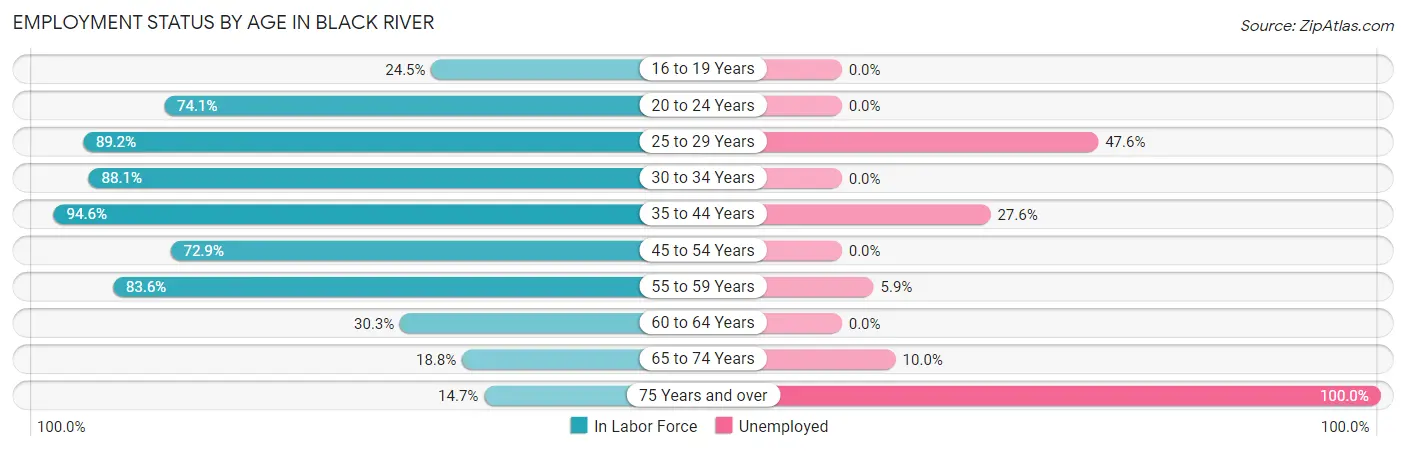
| Age Bracket | In Labor Force | Unemployed |
| 16 to 19 Years | 24 (24.5%) | 0 (0.0%) |
| 20 to 24 Years | 20 (74.1%) | 0 (0.0%) |
| 25 to 29 Years | 181 (89.2%) | 86 (47.6%) |
| 30 to 34 Years | 74 (88.1%) | 0 (0.0%) |
| 35 to 44 Years | 367 (94.6%) | 101 (27.6%) |
| 45 to 54 Years | 129 (72.9%) | 0 (0.0%) |
| 55 to 59 Years | 51 (83.6%) | 3 (5.9%) |
| 60 to 64 Years | 33 (30.3%) | 0 (0.0%) |
| 65 to 74 Years | 30 (18.8%) | 3 (10.0%) |
| 75 Years and over | 14 (14.7%) | 14 (100.0%) |
| Total | 923 (65.8%) | 202 (21.9%) |
Employment Status by Educational Attainment in Black River
According to labor force statistics for Black River, 81.7% of individuals (835) out of the total population between 25 and 64 years of age (1,022) are in the labor force, with 22.0% or 184 of them being unemployed. The group with the highest labor force participation rate are those with the educational attainment of bachelor's degree or higher, with 90.8% or 324 individuals in the labor force. Within the labor force, individuals with less than high school education have the highest percentage of unemployment, with 50.0% or 4 of them being unemployed.
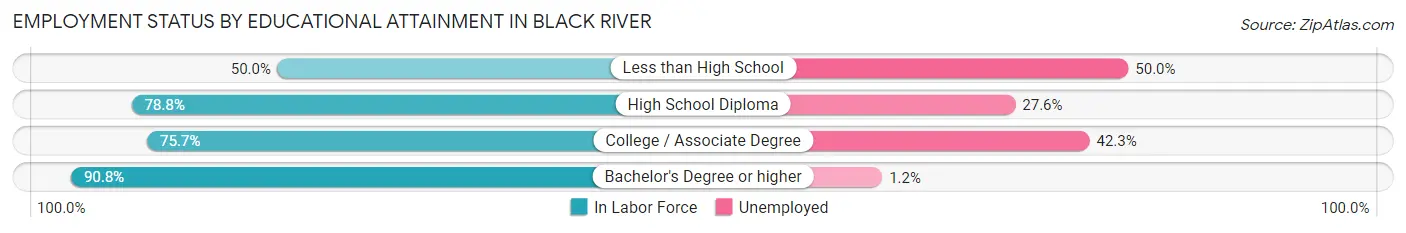
| Educational Attainment | In Labor Force | Unemployed |
| Less than High School | 8 (50.0%) | 8 (50.0%) |
| High School Diploma | 297 (78.8%) | 104 (27.6%) |
| College / Associate Degree | 206 (75.7%) | 115 (42.3%) |
| Bachelor's Degree or higher | 324 (90.8%) | 4 (1.2%) |
| Total | 835 (81.7%) | 225 (22.0%) |
Employment Occupations by Sex in Black River
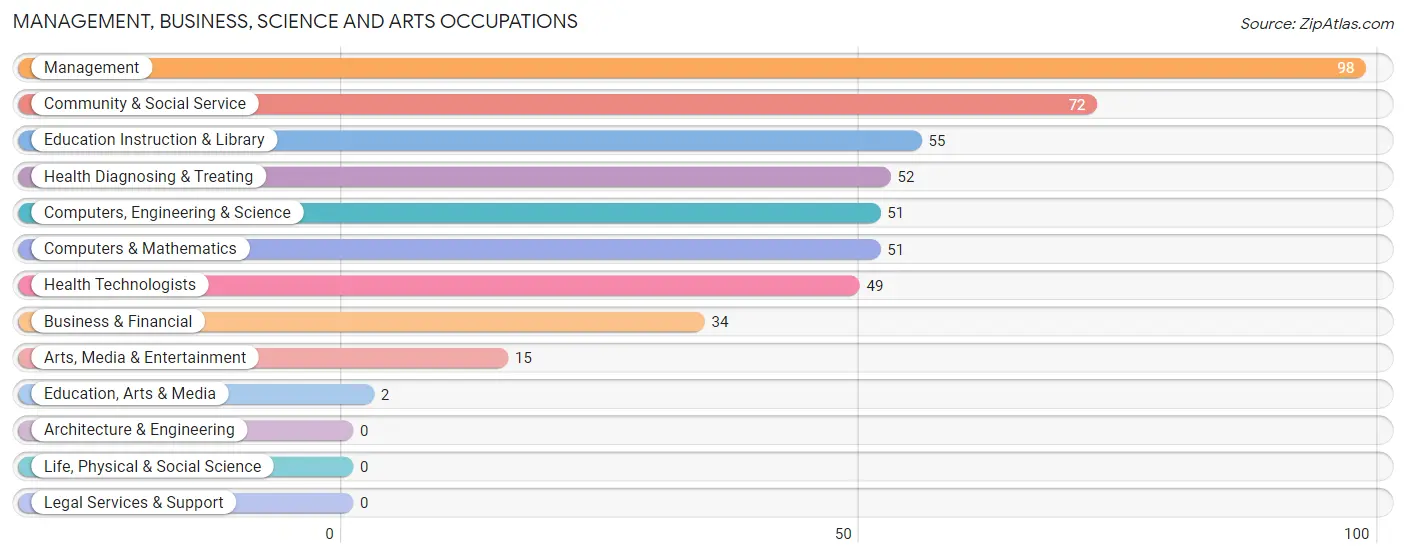
Management, Business, Science and Arts Occupations
The most common Management, Business, Science and Arts occupations in Black River are Management (98 | 16.2%), Community & Social Service (72 | 11.9%), Education Instruction & Library (55 | 9.1%), Health Diagnosing & Treating (52 | 8.6%), and Computers, Engineering & Science (51 | 8.4%).
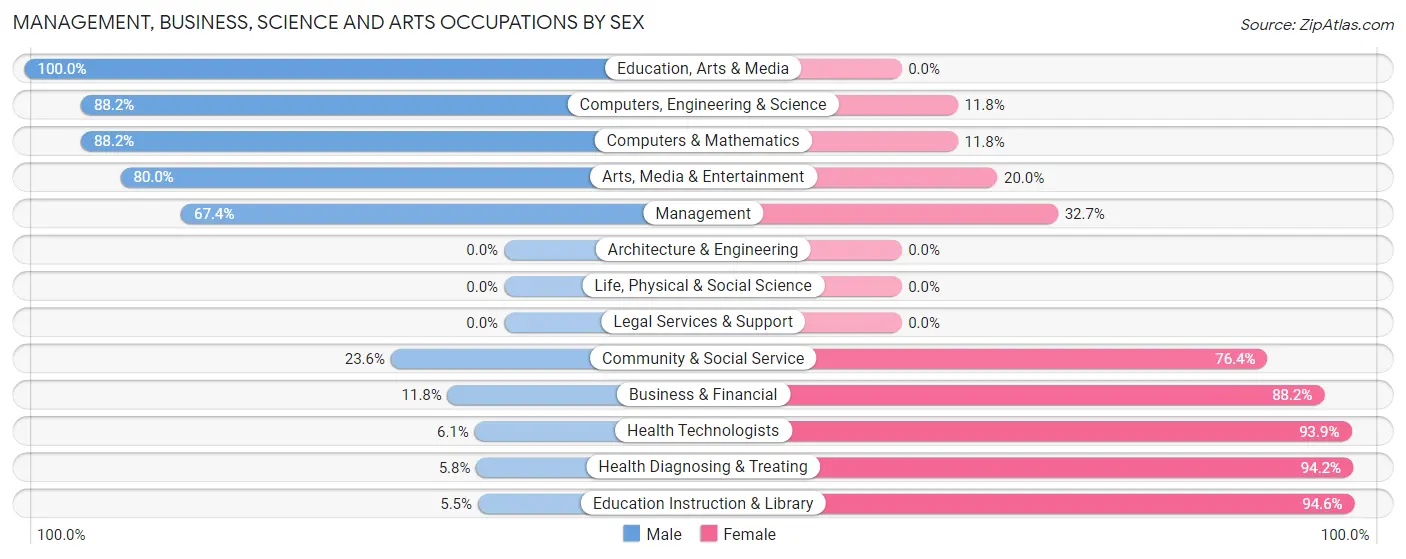
Management, Business, Science and Arts Occupations by Sex
Within the Management, Business, Science and Arts occupations in Black River, the most male-oriented occupations are Education, Arts & Media (100.0%), Computers, Engineering & Science (88.2%), and Computers & Mathematics (88.2%), while the most female-oriented occupations are Education Instruction & Library (94.6%), Health Diagnosing & Treating (94.2%), and Health Technologists (93.9%).
| Occupation | Male | Female |
| Management | 66 (67.3%) | 32 (32.7%) |
| Business & Financial | 4 (11.8%) | 30 (88.2%) |
| Computers, Engineering & Science | 45 (88.2%) | 6 (11.8%) |
| Computers & Mathematics | 45 (88.2%) | 6 (11.8%) |
| Architecture & Engineering | 0 (0.0%) | 0 (0.0%) |
| Life, Physical & Social Science | 0 (0.0%) | 0 (0.0%) |
| Community & Social Service | 17 (23.6%) | 55 (76.4%) |
| Education, Arts & Media | 2 (100.0%) | 0 (0.0%) |
| Legal Services & Support | 0 (0.0%) | 0 (0.0%) |
| Education Instruction & Library | 3 (5.4%) | 52 (94.6%) |
| Arts, Media & Entertainment | 12 (80.0%) | 3 (20.0%) |
| Health Diagnosing & Treating | 3 (5.8%) | 49 (94.2%) |
| Health Technologists | 3 (6.1%) | 46 (93.9%) |
| Total (Category) | 135 (44.0%) | 172 (56.0%) |
| Total (Overall) | 261 (43.1%) | 344 (56.9%) |
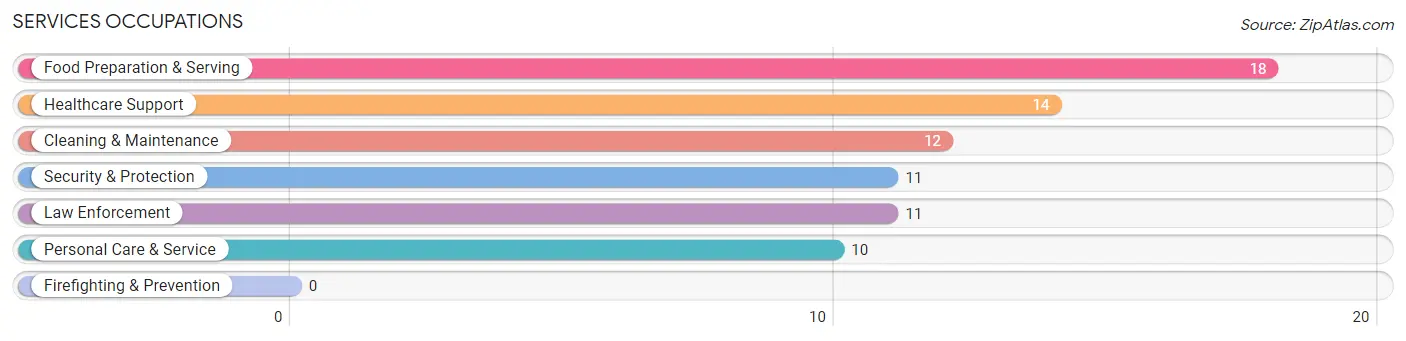
Services Occupations
The most common Services occupations in Black River are Food Preparation & Serving (18 | 3.0%), Healthcare Support (14 | 2.3%), Cleaning & Maintenance (12 | 2.0%), Security & Protection (11 | 1.8%), and Law Enforcement (11 | 1.8%).
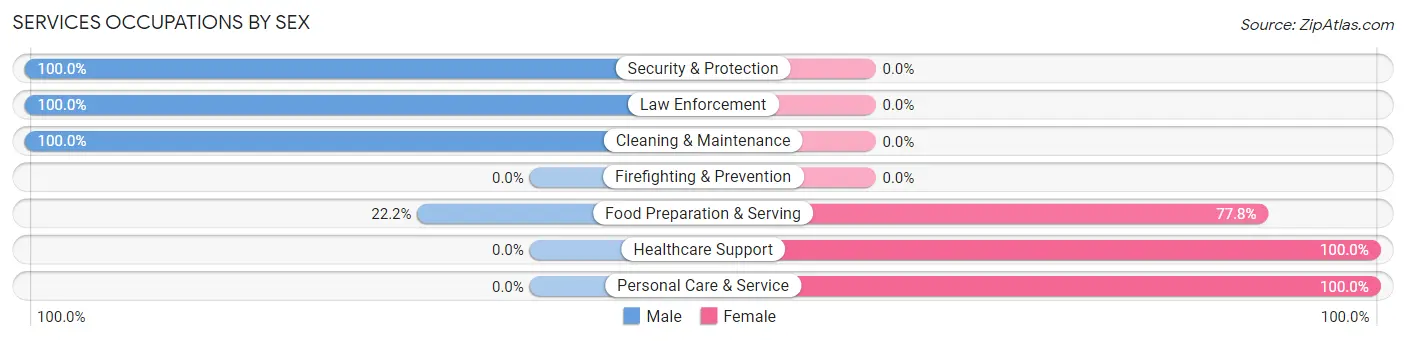
Services Occupations by Sex
Within the Services occupations in Black River, the most male-oriented occupations are Security & Protection (100.0%), Law Enforcement (100.0%), and Cleaning & Maintenance (100.0%), while the most female-oriented occupations are Healthcare Support (100.0%), Personal Care & Service (100.0%), and Food Preparation & Serving (77.8%).
| Occupation | Male | Female |
| Healthcare Support | 0 (0.0%) | 14 (100.0%) |
| Security & Protection | 11 (100.0%) | 0 (0.0%) |
| Firefighting & Prevention | 0 (0.0%) | 0 (0.0%) |
| Law Enforcement | 11 (100.0%) | 0 (0.0%) |
| Food Preparation & Serving | 4 (22.2%) | 14 (77.8%) |
| Cleaning & Maintenance | 12 (100.0%) | 0 (0.0%) |
| Personal Care & Service | 0 (0.0%) | 10 (100.0%) |
| Total (Category) | 27 (41.5%) | 38 (58.5%) |
| Total (Overall) | 261 (43.1%) | 344 (56.9%) |
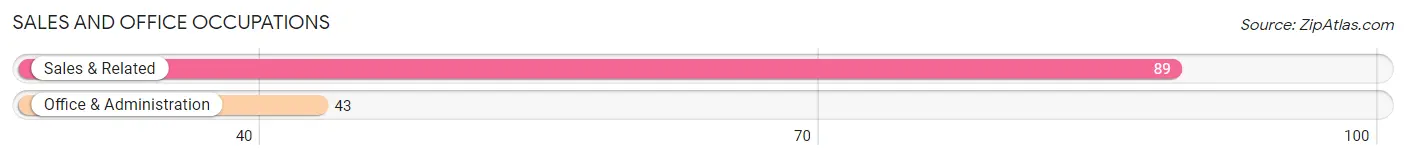
Sales and Office Occupations
The most common Sales and Office occupations in Black River are Sales & Related (89 | 14.7%), and Office & Administration (43 | 7.1%).
Sales and Office Occupations by Sex
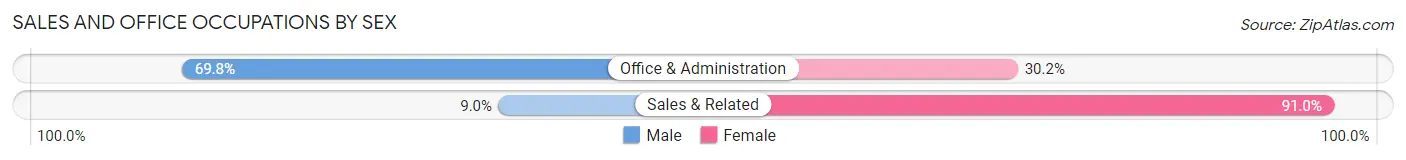
| Occupation | Male | Female |
| Sales & Related | 8 (9.0%) | 81 (91.0%) |
| Office & Administration | 30 (69.8%) | 13 (30.2%) |
| Total (Category) | 38 (28.8%) | 94 (71.2%) |
| Total (Overall) | 261 (43.1%) | 344 (56.9%) |
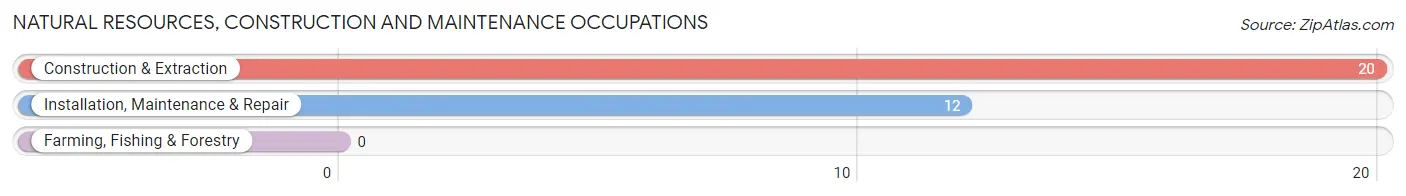
Natural Resources, Construction and Maintenance Occupations
The most common Natural Resources, Construction and Maintenance occupations in Black River are Construction & Extraction (20 | 3.3%), and Installation, Maintenance & Repair (12 | 2.0%).
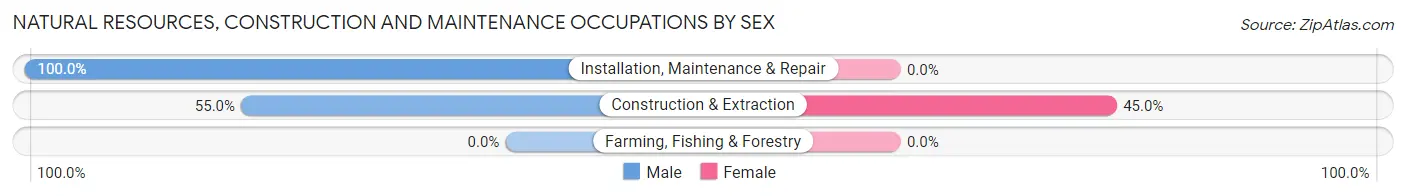
Natural Resources, Construction and Maintenance Occupations by Sex
| Occupation | Male | Female |
| Farming, Fishing & Forestry | 0 (0.0%) | 0 (0.0%) |
| Construction & Extraction | 11 (55.0%) | 9 (45.0%) |
| Installation, Maintenance & Repair | 12 (100.0%) | 0 (0.0%) |
| Total (Category) | 23 (71.9%) | 9 (28.1%) |
| Total (Overall) | 261 (43.1%) | 344 (56.9%) |
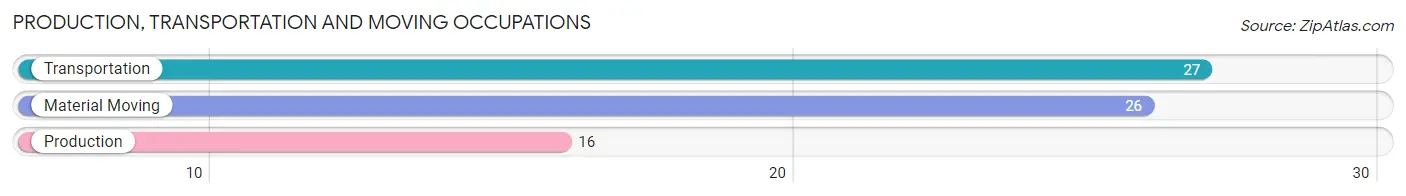
Production, Transportation and Moving Occupations
The most common Production, Transportation and Moving occupations in Black River are Transportation (27 | 4.5%), Material Moving (26 | 4.3%), and Production (16 | 2.6%).
Production, Transportation and Moving Occupations by Sex
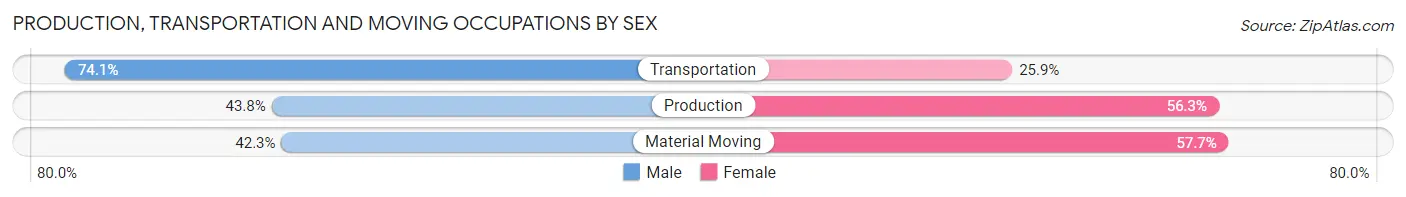
| Occupation | Male | Female |
| Production | 7 (43.8%) | 9 (56.2%) |
| Transportation | 20 (74.1%) | 7 (25.9%) |
| Material Moving | 11 (42.3%) | 15 (57.7%) |
| Total (Category) | 38 (55.1%) | 31 (44.9%) |
| Total (Overall) | 261 (43.1%) | 344 (56.9%) |
Employment Industries by Sex in Black River
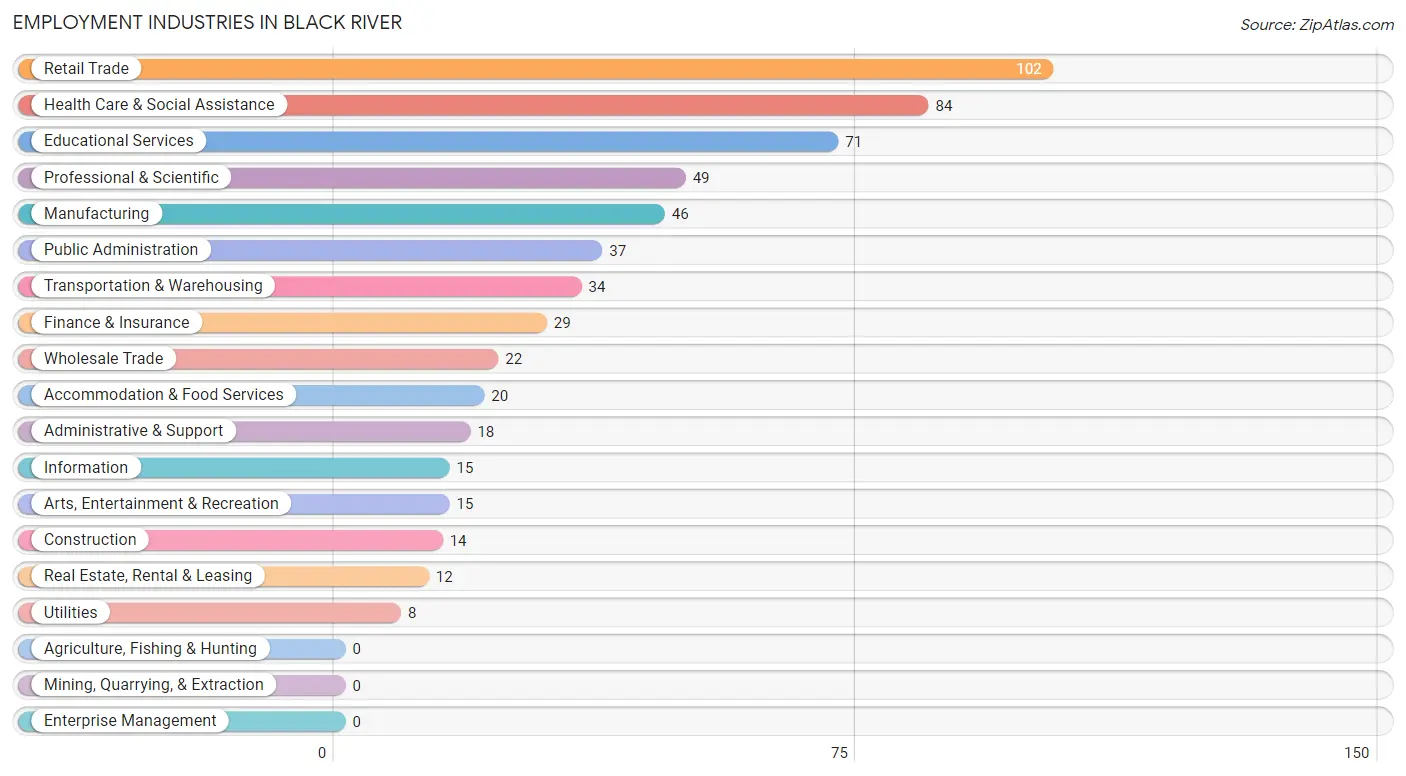
Employment Industries in Black River
The major employment industries in Black River include Retail Trade (102 | 16.9%), Health Care & Social Assistance (84 | 13.9%), Educational Services (71 | 11.7%), Professional & Scientific (49 | 8.1%), and Manufacturing (46 | 7.6%).
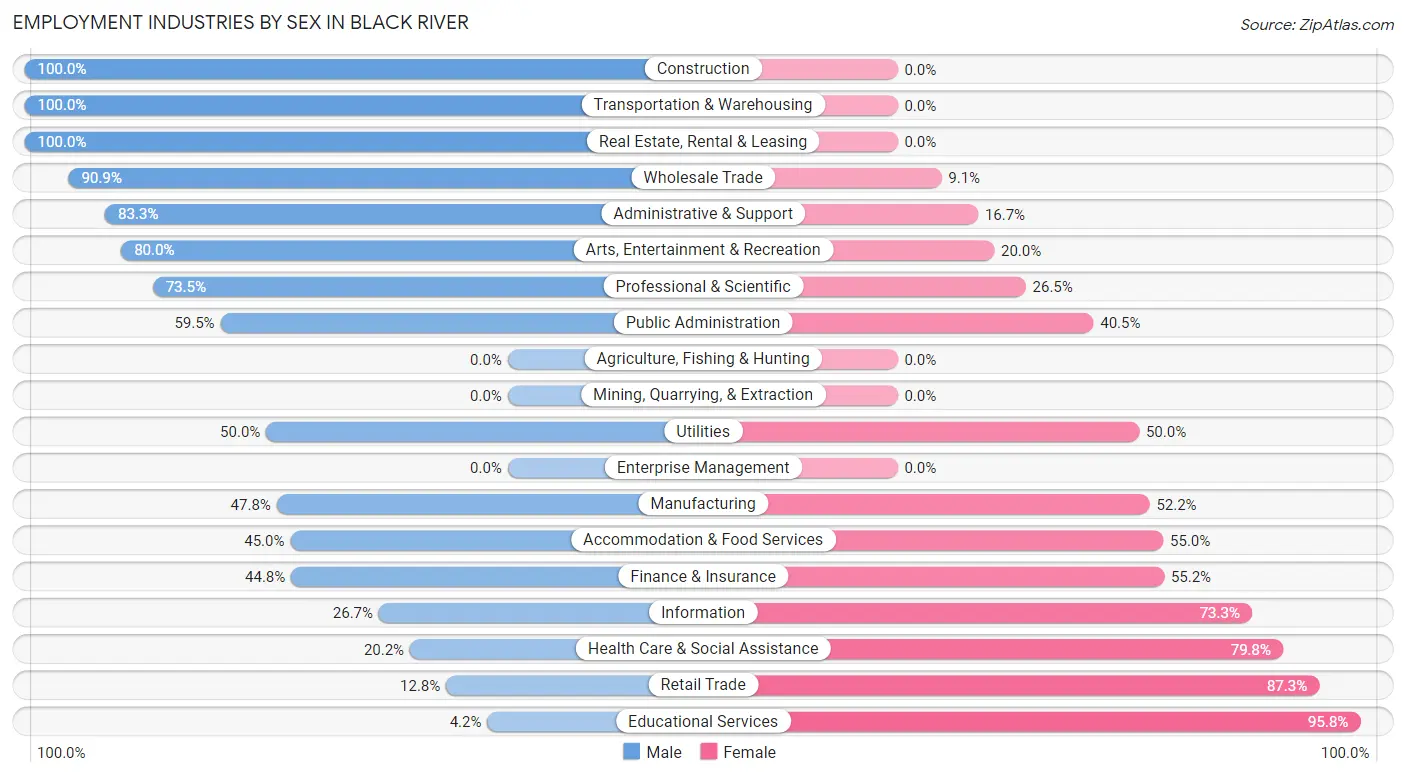
Employment Industries by Sex in Black River
The Black River industries that see more men than women are Construction (100.0%), Transportation & Warehousing (100.0%), and Real Estate, Rental & Leasing (100.0%), whereas the industries that tend to have a higher number of women are Educational Services (95.8%), Retail Trade (87.3%), and Health Care & Social Assistance (79.8%).
| Industry | Male | Female |
| Agriculture, Fishing & Hunting | 0 (0.0%) | 0 (0.0%) |
| Mining, Quarrying, & Extraction | 0 (0.0%) | 0 (0.0%) |
| Construction | 14 (100.0%) | 0 (0.0%) |
| Manufacturing | 22 (47.8%) | 24 (52.2%) |
| Wholesale Trade | 20 (90.9%) | 2 (9.1%) |
| Retail Trade | 13 (12.8%) | 89 (87.3%) |
| Transportation & Warehousing | 34 (100.0%) | 0 (0.0%) |
| Utilities | 4 (50.0%) | 4 (50.0%) |
| Information | 4 (26.7%) | 11 (73.3%) |
| Finance & Insurance | 13 (44.8%) | 16 (55.2%) |
| Real Estate, Rental & Leasing | 12 (100.0%) | 0 (0.0%) |
| Professional & Scientific | 36 (73.5%) | 13 (26.5%) |
| Enterprise Management | 0 (0.0%) | 0 (0.0%) |
| Administrative & Support | 15 (83.3%) | 3 (16.7%) |
| Educational Services | 3 (4.2%) | 68 (95.8%) |
| Health Care & Social Assistance | 17 (20.2%) | 67 (79.8%) |
| Arts, Entertainment & Recreation | 12 (80.0%) | 3 (20.0%) |
| Accommodation & Food Services | 9 (45.0%) | 11 (55.0%) |
| Public Administration | 22 (59.5%) | 15 (40.5%) |
| Total | 261 (43.1%) | 344 (56.9%) |
Education in Black River
School Enrollment in Black River
The most common levels of schooling among the 305 students in Black River are high school (96 | 31.5%), middle school (73 | 23.9%), and elementary school (70 | 23.0%).
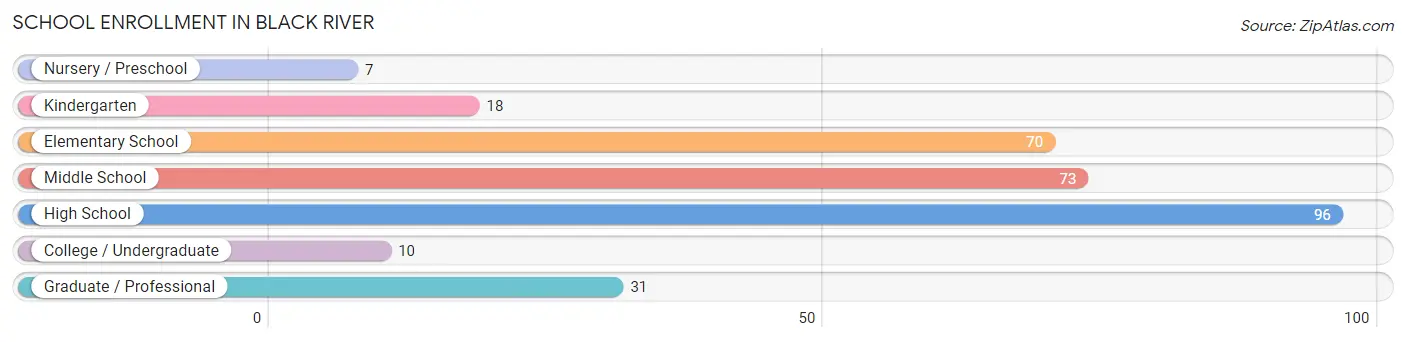
| School Level | # Students | % Students |
| Nursery / Preschool | 7 | 2.3% |
| Kindergarten | 18 | 5.9% |
| Elementary School | 70 | 23.0% |
| Middle School | 73 | 23.9% |
| High School | 96 | 31.5% |
| College / Undergraduate | 10 | 3.3% |
| Graduate / Professional | 31 | 10.2% |
| Total | 305 | 100.0% |
School Enrollment by Age by Funding Source in Black River
Out of a total of 305 students who are enrolled in schools in Black River, 24 (7.9%) attend a private institution, while the remaining 281 (92.1%) are enrolled in public schools. The age group of 35 years and over has the highest likelihood of being enrolled in private schools, with 17 (100.0% in the age bracket) enrolled. Conversely, the age group of 3 to 4 year olds has the lowest likelihood of being enrolled in a private school, with 3 (100.0% in the age bracket) attending a public institution.
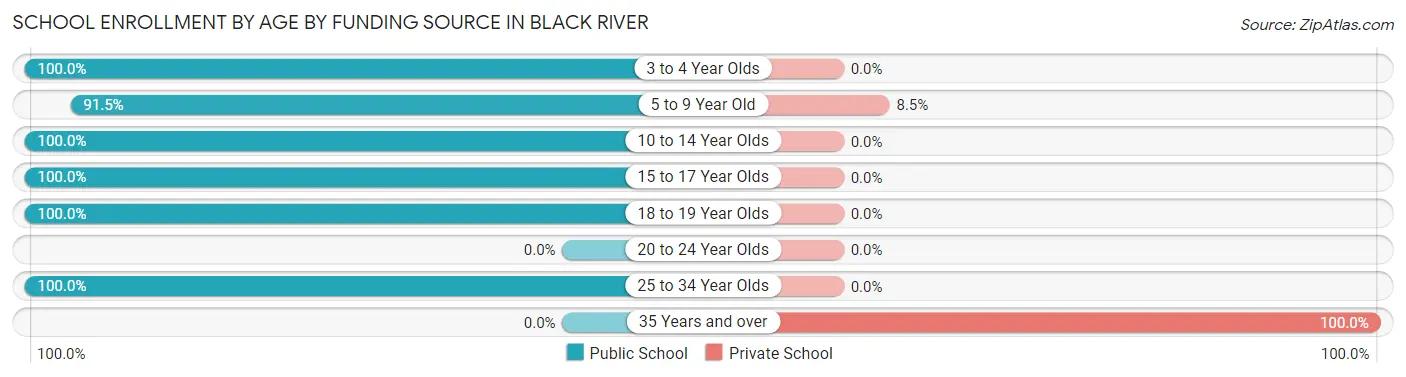
| Age Bracket | Public School | Private School |
| 3 to 4 Year Olds | 3 (100.0%) | 0 (0.0%) |
| 5 to 9 Year Old | 75 (91.5%) | 7 (8.5%) |
| 10 to 14 Year Olds | 92 (100.0%) | 0 (0.0%) |
| 15 to 17 Year Olds | 83 (100.0%) | 0 (0.0%) |
| 18 to 19 Year Olds | 12 (100.0%) | 0 (0.0%) |
| 20 to 24 Year Olds | 0 (0.0%) | 0 (0.0%) |
| 25 to 34 Year Olds | 16 (100.0%) | 0 (0.0%) |
| 35 Years and over | 0 (0.0%) | 17 (100.0%) |
| Total | 281 (92.1%) | 24 (7.9%) |
Educational Attainment by Field of Study in Black River
Education (68 | 16.5%), science & technology (64 | 15.5%), business (62 | 15.0%), arts & humanities (59 | 14.3%), and liberal arts & history (39 | 9.5%) are the most common fields of study among 412 individuals in Black River who have obtained a bachelor's degree or higher.
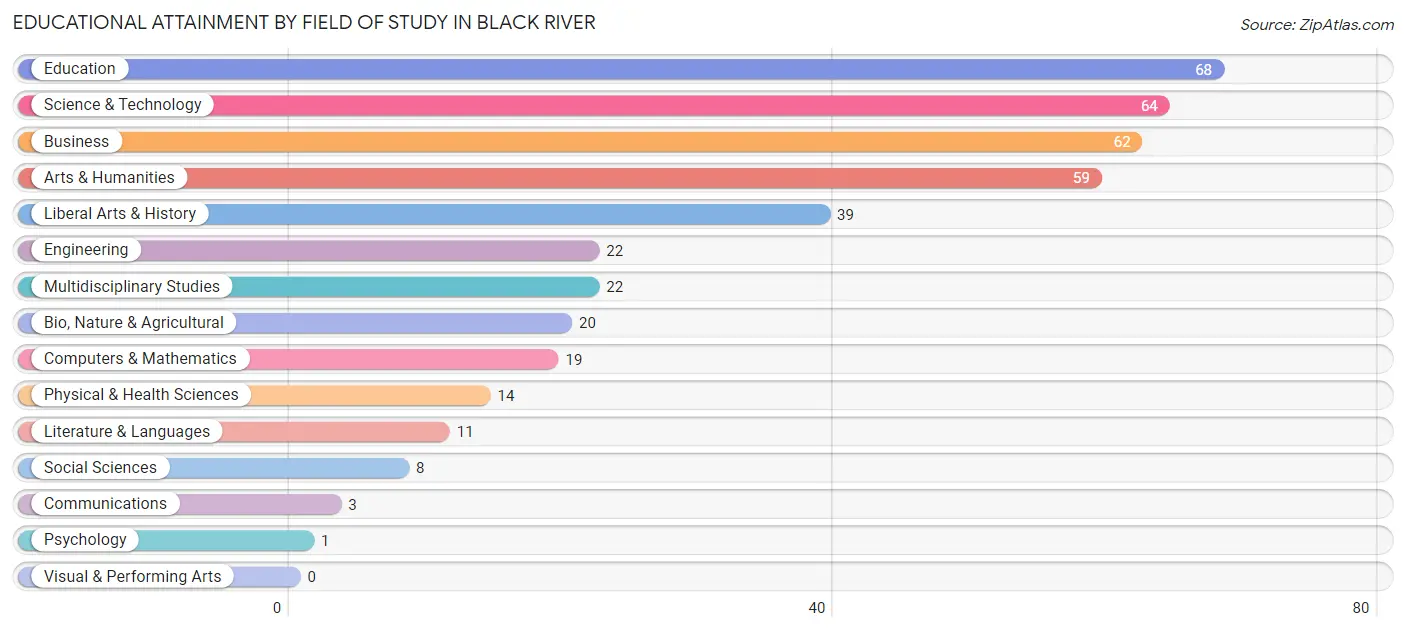
| Field of Study | # Graduates | % Graduates |
| Computers & Mathematics | 19 | 4.6% |
| Bio, Nature & Agricultural | 20 | 4.9% |
| Physical & Health Sciences | 14 | 3.4% |
| Psychology | 1 | 0.2% |
| Social Sciences | 8 | 1.9% |
| Engineering | 22 | 5.3% |
| Multidisciplinary Studies | 22 | 5.3% |
| Science & Technology | 64 | 15.5% |
| Business | 62 | 15.0% |
| Education | 68 | 16.5% |
| Literature & Languages | 11 | 2.7% |
| Liberal Arts & History | 39 | 9.5% |
| Visual & Performing Arts | 0 | 0.0% |
| Communications | 3 | 0.7% |
| Arts & Humanities | 59 | 14.3% |
| Total | 412 | 100.0% |
Transportation & Commute in Black River
Vehicle Availability by Sex in Black River
The most prevalent vehicle ownership categories in Black River are males with 2 vehicles (205, accounting for 51.5%) and females with 2 vehicles (142, making up 60.3%).
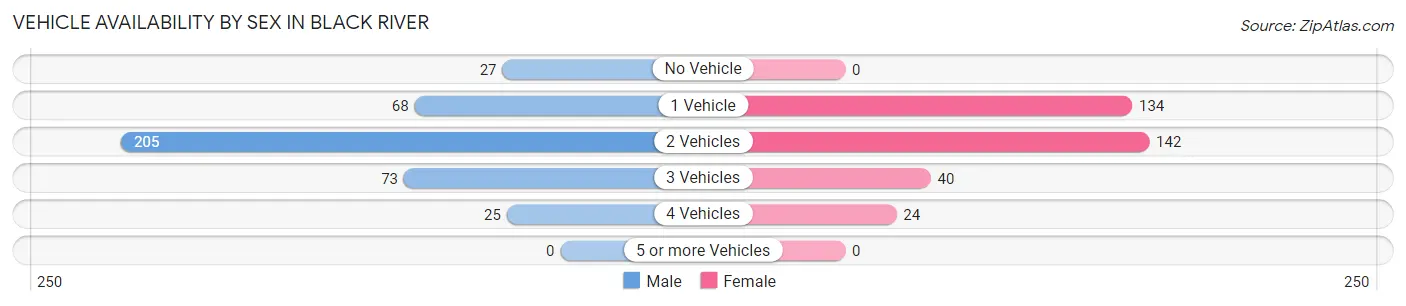
| Vehicles Available | Male | Female |
| No Vehicle | 27 (6.8%) | 0 (0.0%) |
| 1 Vehicle | 68 (17.1%) | 134 (39.4%) |
| 2 Vehicles | 205 (51.5%) | 142 (41.8%) |
| 3 Vehicles | 73 (18.3%) | 40 (11.8%) |
| 4 Vehicles | 25 (6.3%) | 24 (7.1%) |
| 5 or more Vehicles | 0 (0.0%) | 0 (0.0%) |
| Total | 398 (100.0%) | 340 (100.0%) |
Commute Time in Black River
The most frequently occuring commute durations in Black River are 15 to 19 minutes (236 commuters, 33.4%), 5 to 9 minutes (179 commuters, 25.3%), and 10 to 14 minutes (165 commuters, 23.3%).
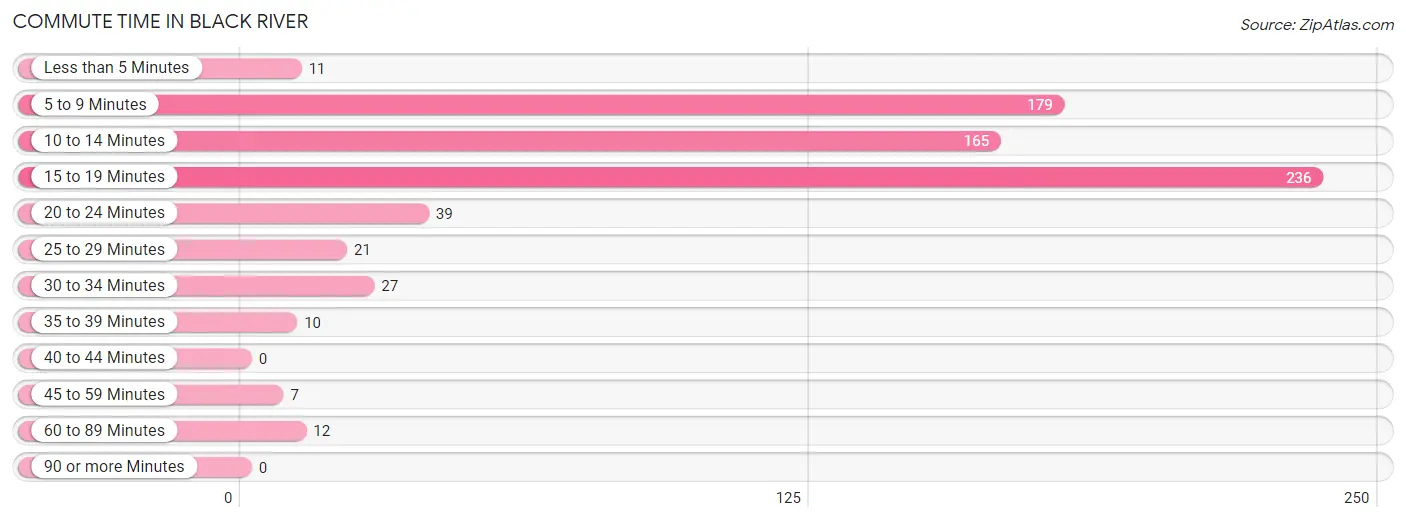
| Commute Time | # Commuters | % Commuters |
| Less than 5 Minutes | 11 | 1.6% |
| 5 to 9 Minutes | 179 | 25.3% |
| 10 to 14 Minutes | 165 | 23.3% |
| 15 to 19 Minutes | 236 | 33.4% |
| 20 to 24 Minutes | 39 | 5.5% |
| 25 to 29 Minutes | 21 | 3.0% |
| 30 to 34 Minutes | 27 | 3.8% |
| 35 to 39 Minutes | 10 | 1.4% |
| 40 to 44 Minutes | 0 | 0.0% |
| 45 to 59 Minutes | 7 | 1.0% |
| 60 to 89 Minutes | 12 | 1.7% |
| 90 or more Minutes | 0 | 0.0% |
Commute Time by Sex in Black River
The most common commute times in Black River are 15 to 19 minutes (147 commuters, 38.5%) for males and 5 to 9 minutes (129 commuters, 39.7%) for females.
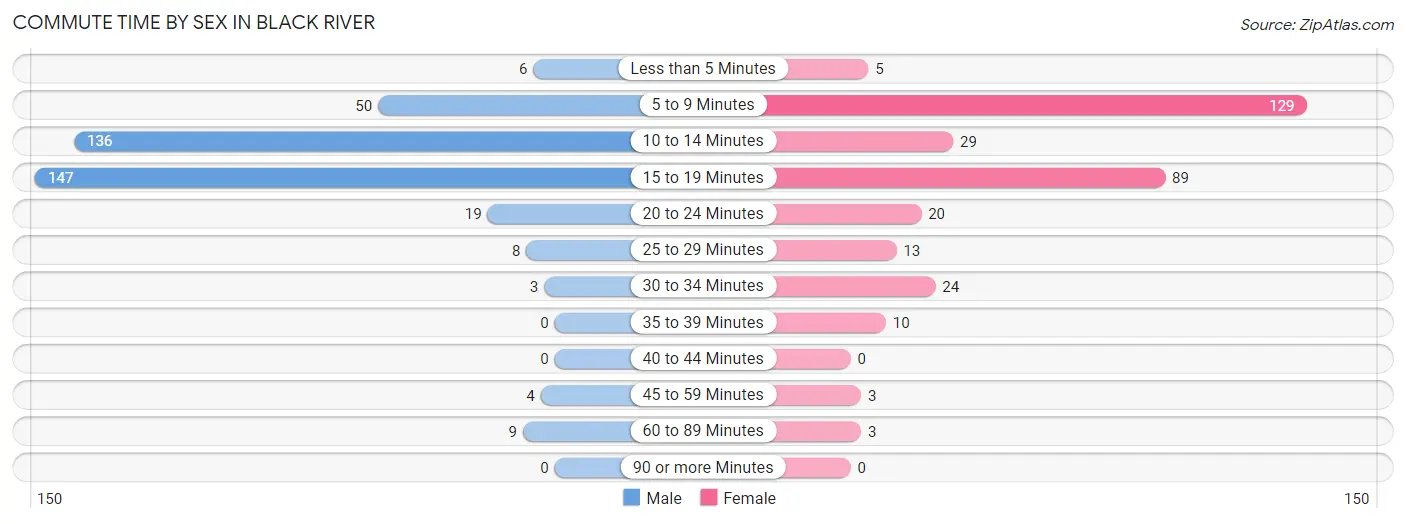
| Commute Time | Male | Female |
| Less than 5 Minutes | 6 (1.6%) | 5 (1.5%) |
| 5 to 9 Minutes | 50 (13.1%) | 129 (39.7%) |
| 10 to 14 Minutes | 136 (35.6%) | 29 (8.9%) |
| 15 to 19 Minutes | 147 (38.5%) | 89 (27.4%) |
| 20 to 24 Minutes | 19 (5.0%) | 20 (6.1%) |
| 25 to 29 Minutes | 8 (2.1%) | 13 (4.0%) |
| 30 to 34 Minutes | 3 (0.8%) | 24 (7.4%) |
| 35 to 39 Minutes | 0 (0.0%) | 10 (3.1%) |
| 40 to 44 Minutes | 0 (0.0%) | 0 (0.0%) |
| 45 to 59 Minutes | 4 (1.1%) | 3 (0.9%) |
| 60 to 89 Minutes | 9 (2.4%) | 3 (0.9%) |
| 90 or more Minutes | 0 (0.0%) | 0 (0.0%) |
Time of Departure to Work by Sex in Black River
The most frequent times of departure to work in Black River are 6:00 AM to 6:29 AM (72, 18.9%) for males and 4:00 PM to 11:59 PM (95, 29.2%) for females.
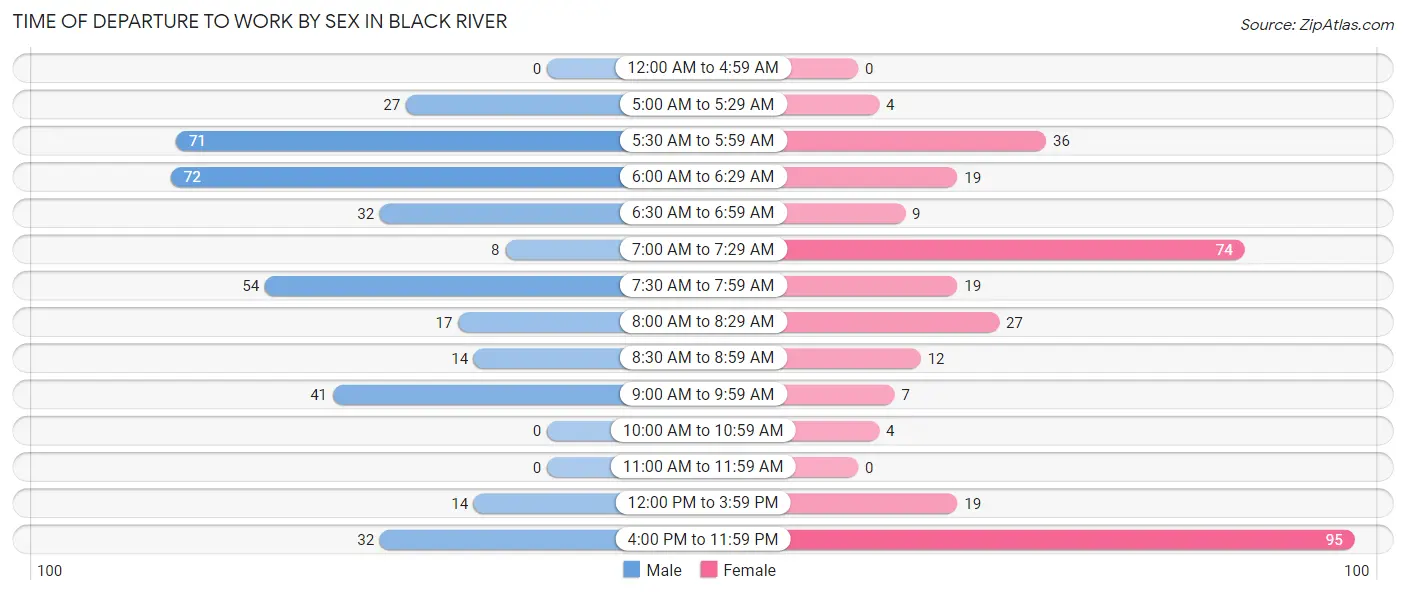
| Time of Departure | Male | Female |
| 12:00 AM to 4:59 AM | 0 (0.0%) | 0 (0.0%) |
| 5:00 AM to 5:29 AM | 27 (7.1%) | 4 (1.2%) |
| 5:30 AM to 5:59 AM | 71 (18.6%) | 36 (11.1%) |
| 6:00 AM to 6:29 AM | 72 (18.9%) | 19 (5.9%) |
| 6:30 AM to 6:59 AM | 32 (8.4%) | 9 (2.8%) |
| 7:00 AM to 7:29 AM | 8 (2.1%) | 74 (22.8%) |
| 7:30 AM to 7:59 AM | 54 (14.1%) | 19 (5.9%) |
| 8:00 AM to 8:29 AM | 17 (4.4%) | 27 (8.3%) |
| 8:30 AM to 8:59 AM | 14 (3.7%) | 12 (3.7%) |
| 9:00 AM to 9:59 AM | 41 (10.7%) | 7 (2.1%) |
| 10:00 AM to 10:59 AM | 0 (0.0%) | 4 (1.2%) |
| 11:00 AM to 11:59 AM | 0 (0.0%) | 0 (0.0%) |
| 12:00 PM to 3:59 PM | 14 (3.7%) | 19 (5.9%) |
| 4:00 PM to 11:59 PM | 32 (8.4%) | 95 (29.2%) |
| Total | 382 (100.0%) | 325 (100.0%) |
Housing Occupancy in Black River
Occupancy by Ownership in Black River
Of the total 754 dwellings in Black River, owner-occupied units account for 411 (54.5%), while renter-occupied units make up 343 (45.5%).
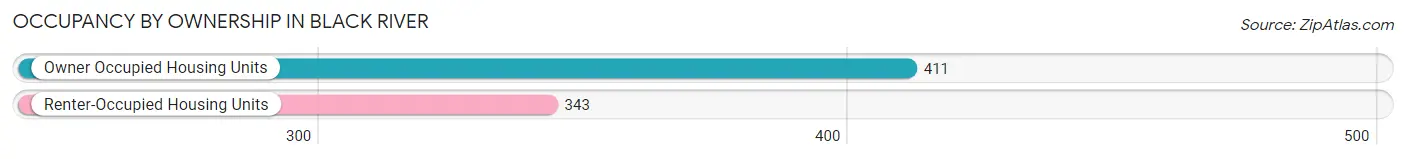
| Occupancy | # Housing Units | % Housing Units |
| Owner Occupied Housing Units | 411 | 54.5% |
| Renter-Occupied Housing Units | 343 | 45.5% |
| Total Occupied Housing Units | 754 | 100.0% |
Occupancy by Household Size in Black River
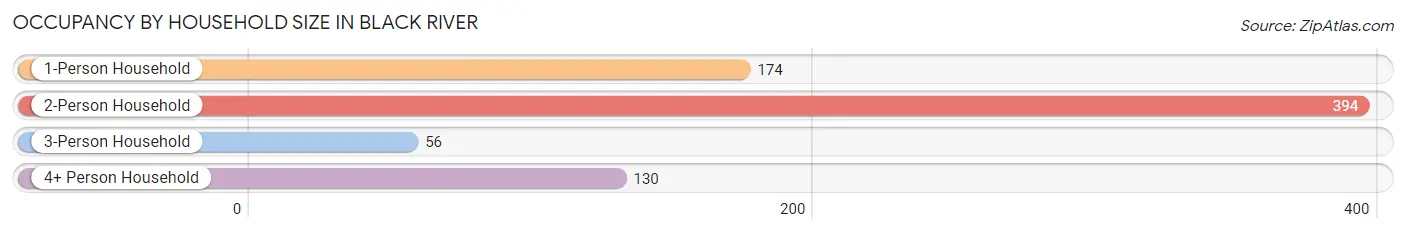
| Household Size | # Housing Units | % Housing Units |
| 1-Person Household | 174 | 23.1% |
| 2-Person Household | 394 | 52.2% |
| 3-Person Household | 56 | 7.4% |
| 4+ Person Household | 130 | 17.2% |
| Total Housing Units | 754 | 100.0% |
Occupancy by Ownership by Household Size in Black River
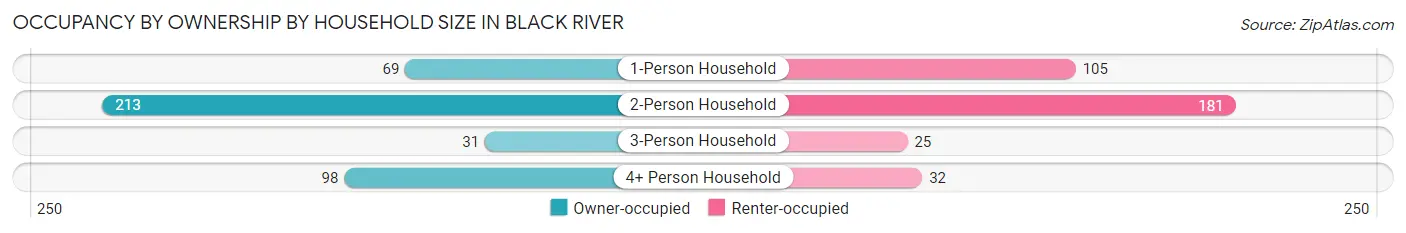
| Household Size | Owner-occupied | Renter-occupied |
| 1-Person Household | 69 (39.7%) | 105 (60.3%) |
| 2-Person Household | 213 (54.1%) | 181 (45.9%) |
| 3-Person Household | 31 (55.4%) | 25 (44.6%) |
| 4+ Person Household | 98 (75.4%) | 32 (24.6%) |
| Total Housing Units | 411 (54.5%) | 343 (45.5%) |
Occupancy by Educational Attainment in Black River
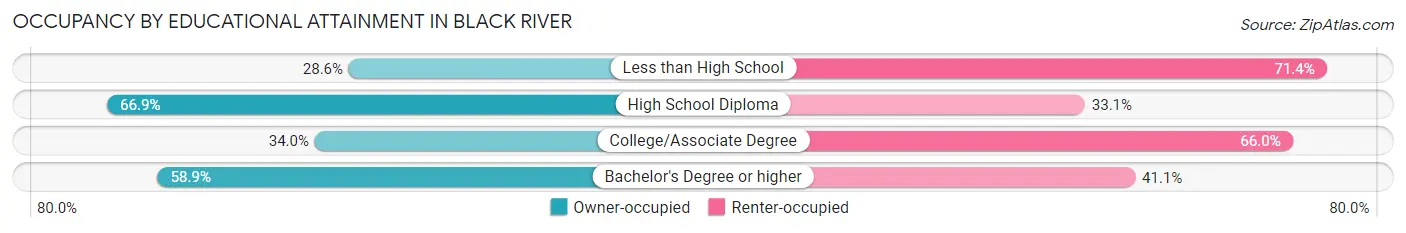
| Household Size | Owner-occupied | Renter-occupied |
| Less than High School | 4 (28.6%) | 10 (71.4%) |
| High School Diploma | 194 (66.9%) | 96 (33.1%) |
| College/Associate Degree | 71 (34.0%) | 138 (66.0%) |
| Bachelor's Degree or higher | 142 (58.9%) | 99 (41.1%) |
Occupancy by Age of Householder in Black River
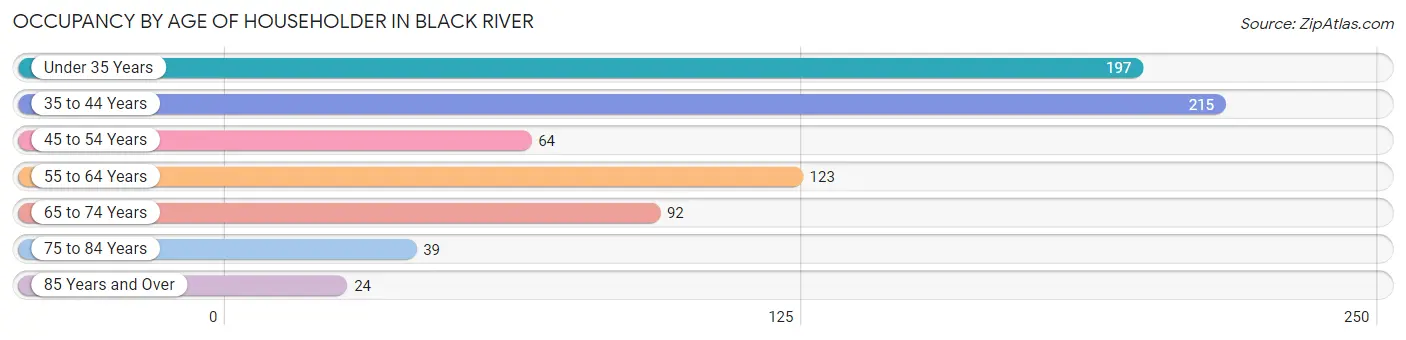
| Age Bracket | # Households | % Households |
| Under 35 Years | 197 | 26.1% |
| 35 to 44 Years | 215 | 28.5% |
| 45 to 54 Years | 64 | 8.5% |
| 55 to 64 Years | 123 | 16.3% |
| 65 to 74 Years | 92 | 12.2% |
| 75 to 84 Years | 39 | 5.2% |
| 85 Years and Over | 24 | 3.2% |
| Total | 754 | 100.0% |
Housing Finances in Black River
Median Income by Occupancy in Black River
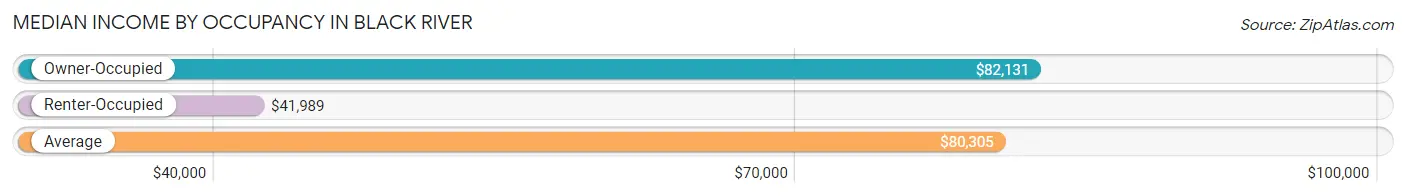
| Occupancy Type | # Households | Median Income |
| Owner-Occupied | 411 (54.5%) | $82,131 |
| Renter-Occupied | 343 (45.5%) | $41,989 |
| Average | 754 (100.0%) | $80,305 |
Occupancy by Householder Income Bracket in Black River
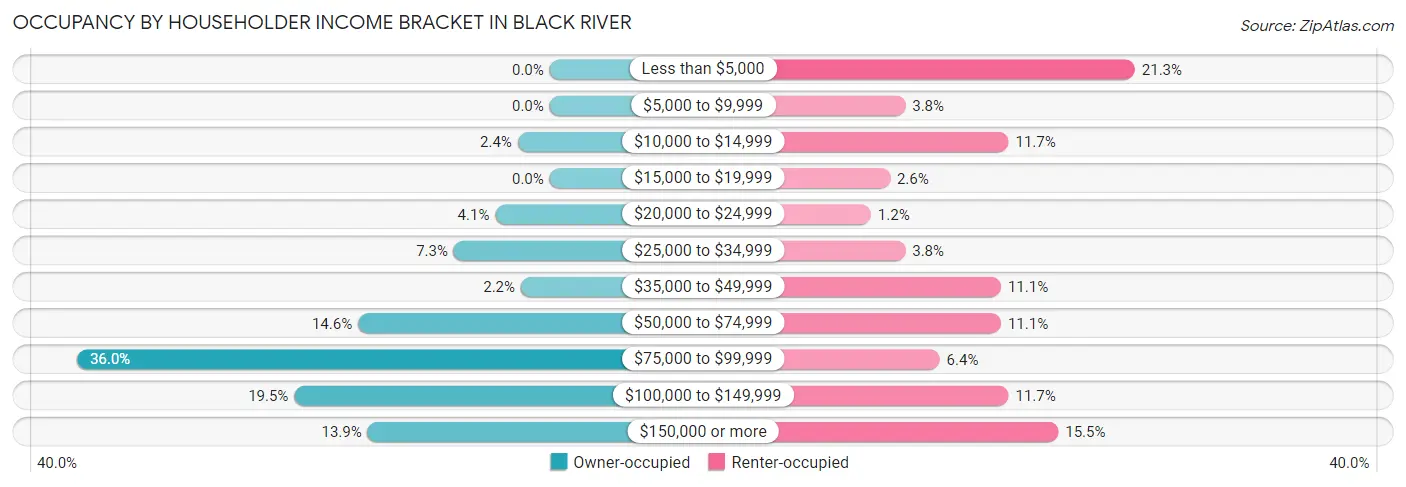
| Income Bracket | Owner-occupied | Renter-occupied |
| Less than $5,000 | 0 (0.0%) | 73 (21.3%) |
| $5,000 to $9,999 | 0 (0.0%) | 13 (3.8%) |
| $10,000 to $14,999 | 10 (2.4%) | 40 (11.7%) |
| $15,000 to $19,999 | 0 (0.0%) | 9 (2.6%) |
| $20,000 to $24,999 | 17 (4.1%) | 4 (1.2%) |
| $25,000 to $34,999 | 30 (7.3%) | 13 (3.8%) |
| $35,000 to $49,999 | 9 (2.2%) | 38 (11.1%) |
| $50,000 to $74,999 | 60 (14.6%) | 38 (11.1%) |
| $75,000 to $99,999 | 148 (36.0%) | 22 (6.4%) |
| $100,000 to $149,999 | 80 (19.5%) | 40 (11.7%) |
| $150,000 or more | 57 (13.9%) | 53 (15.4%) |
| Total | 411 (100.0%) | 343 (100.0%) |
Monthly Housing Cost Tiers in Black River
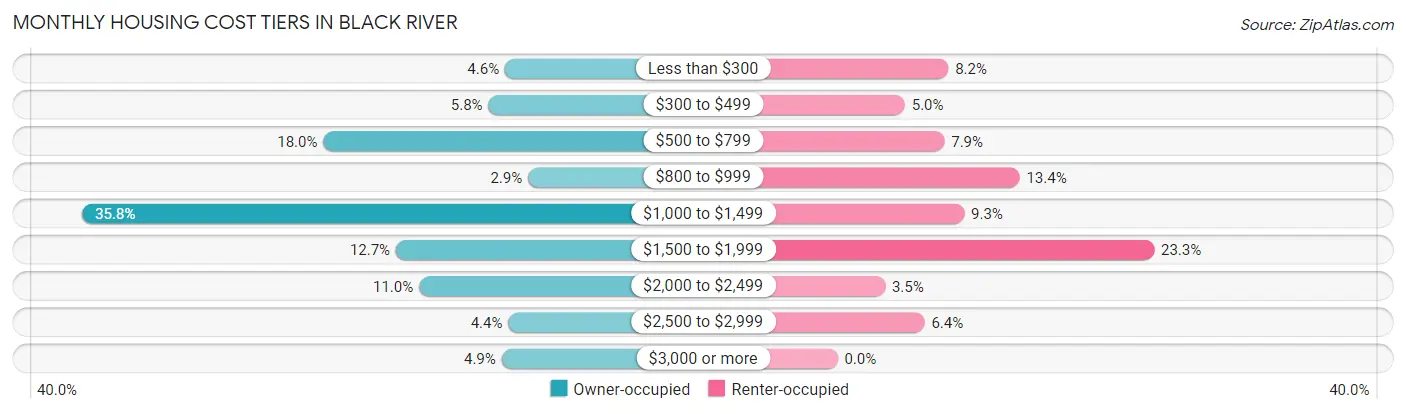
| Monthly Cost | Owner-occupied | Renter-occupied |
| Less than $300 | 19 (4.6%) | 28 (8.2%) |
| $300 to $499 | 24 (5.8%) | 17 (5.0%) |
| $500 to $799 | 74 (18.0%) | 27 (7.9%) |
| $800 to $999 | 12 (2.9%) | 46 (13.4%) |
| $1,000 to $1,499 | 147 (35.8%) | 32 (9.3%) |
| $1,500 to $1,999 | 52 (12.7%) | 80 (23.3%) |
| $2,000 to $2,499 | 45 (11.0%) | 12 (3.5%) |
| $2,500 to $2,999 | 18 (4.4%) | 22 (6.4%) |
| $3,000 or more | 20 (4.9%) | 0 (0.0%) |
| Total | 411 (100.0%) | 343 (100.0%) |
Physical Housing Characteristics in Black River
Housing Structures in Black River
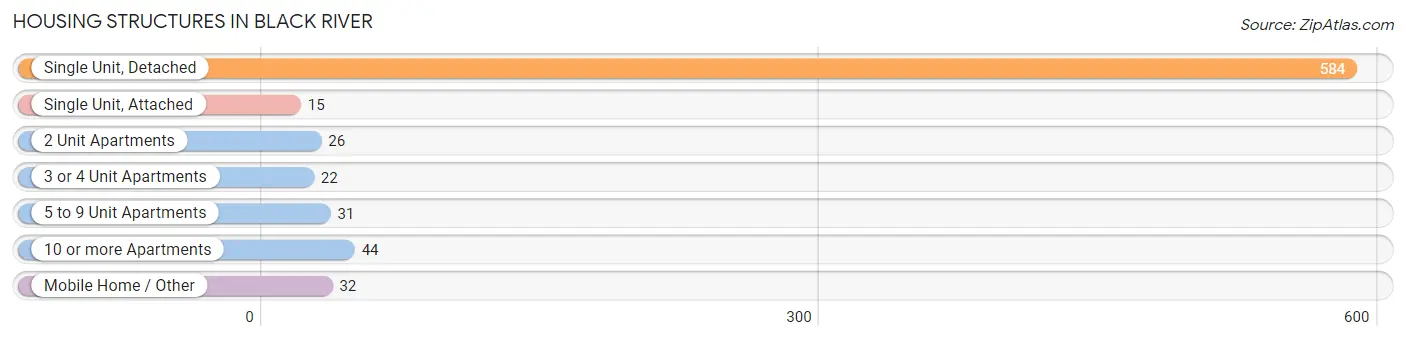
| Structure Type | # Housing Units | % Housing Units |
| Single Unit, Detached | 584 | 77.4% |
| Single Unit, Attached | 15 | 2.0% |
| 2 Unit Apartments | 26 | 3.5% |
| 3 or 4 Unit Apartments | 22 | 2.9% |
| 5 to 9 Unit Apartments | 31 | 4.1% |
| 10 or more Apartments | 44 | 5.8% |
| Mobile Home / Other | 32 | 4.2% |
| Total | 754 | 100.0% |
Housing Structures by Occupancy in Black River
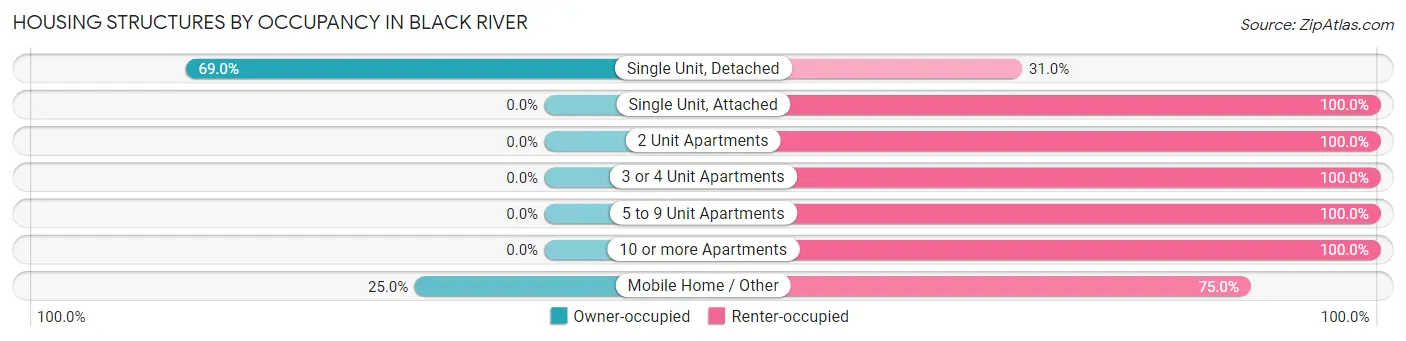
| Structure Type | Owner-occupied | Renter-occupied |
| Single Unit, Detached | 403 (69.0%) | 181 (31.0%) |
| Single Unit, Attached | 0 (0.0%) | 15 (100.0%) |
| 2 Unit Apartments | 0 (0.0%) | 26 (100.0%) |
| 3 or 4 Unit Apartments | 0 (0.0%) | 22 (100.0%) |
| 5 to 9 Unit Apartments | 0 (0.0%) | 31 (100.0%) |
| 10 or more Apartments | 0 (0.0%) | 44 (100.0%) |
| Mobile Home / Other | 8 (25.0%) | 24 (75.0%) |
| Total | 411 (54.5%) | 343 (45.5%) |
Housing Structures by Number of Rooms in Black River
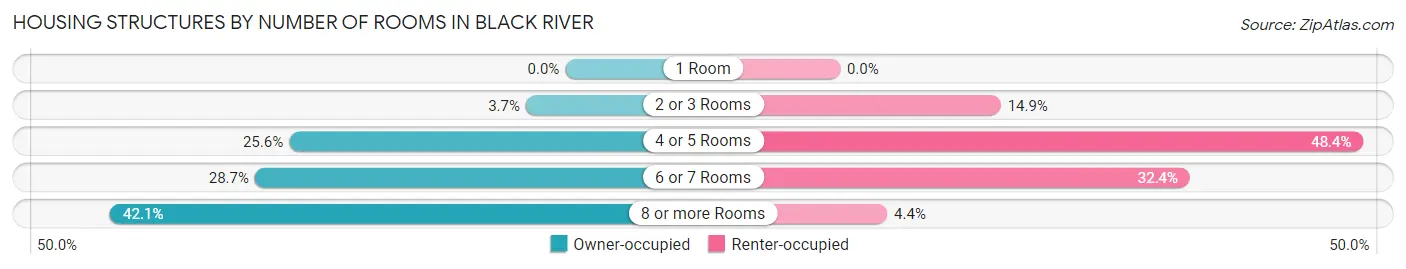
| Number of Rooms | Owner-occupied | Renter-occupied |
| 1 Room | 0 (0.0%) | 0 (0.0%) |
| 2 or 3 Rooms | 15 (3.6%) | 51 (14.9%) |
| 4 or 5 Rooms | 105 (25.6%) | 166 (48.4%) |
| 6 or 7 Rooms | 118 (28.7%) | 111 (32.4%) |
| 8 or more Rooms | 173 (42.1%) | 15 (4.4%) |
| Total | 411 (100.0%) | 343 (100.0%) |
Housing Structure by Heating Type in Black River
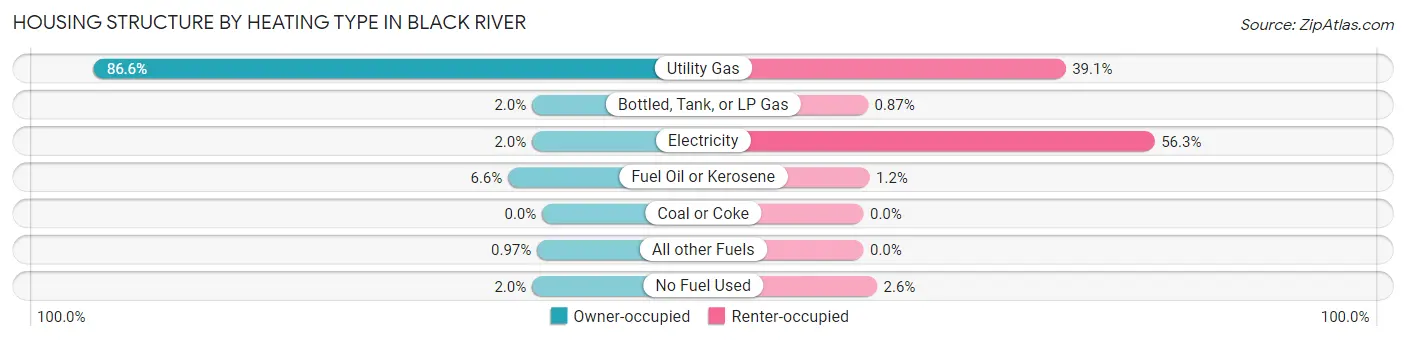
| Heating Type | Owner-occupied | Renter-occupied |
| Utility Gas | 356 (86.6%) | 134 (39.1%) |
| Bottled, Tank, or LP Gas | 8 (1.9%) | 3 (0.9%) |
| Electricity | 8 (1.9%) | 193 (56.3%) |
| Fuel Oil or Kerosene | 27 (6.6%) | 4 (1.2%) |
| Coal or Coke | 0 (0.0%) | 0 (0.0%) |
| All other Fuels | 4 (1.0%) | 0 (0.0%) |
| No Fuel Used | 8 (1.9%) | 9 (2.6%) |
| Total | 411 (100.0%) | 343 (100.0%) |
Household Vehicle Usage in Black River
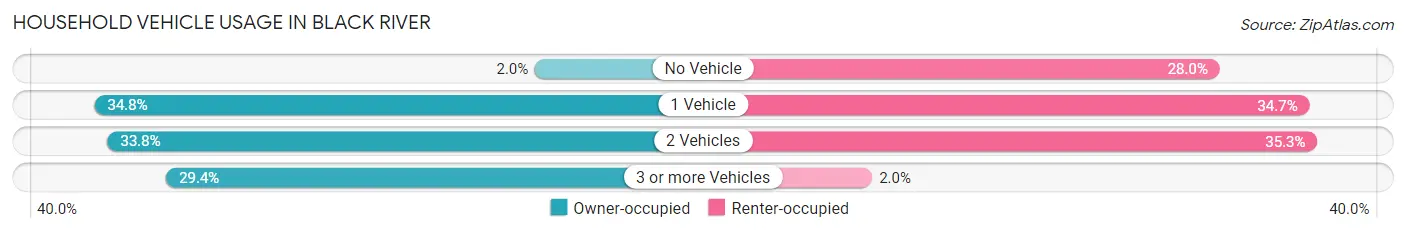
| Vehicles per Household | Owner-occupied | Renter-occupied |
| No Vehicle | 8 (1.9%) | 96 (28.0%) |
| 1 Vehicle | 143 (34.8%) | 119 (34.7%) |
| 2 Vehicles | 139 (33.8%) | 121 (35.3%) |
| 3 or more Vehicles | 121 (29.4%) | 7 (2.0%) |
| Total | 411 (100.0%) | 343 (100.0%) |
Real Estate & Mortgages in Black River
Real Estate and Mortgage Overview in Black River
| Characteristic | Without Mortgage | With Mortgage |
| Housing Units | 144 | 267 |
| Median Property Value | $224,400 | $190,300 |
| Median Household Income | $67,083 | $32 |
| Monthly Housing Costs | $715 | $20 |
| Real Estate Taxes | $4,221 | $7 |
Property Value by Mortgage Status in Black River
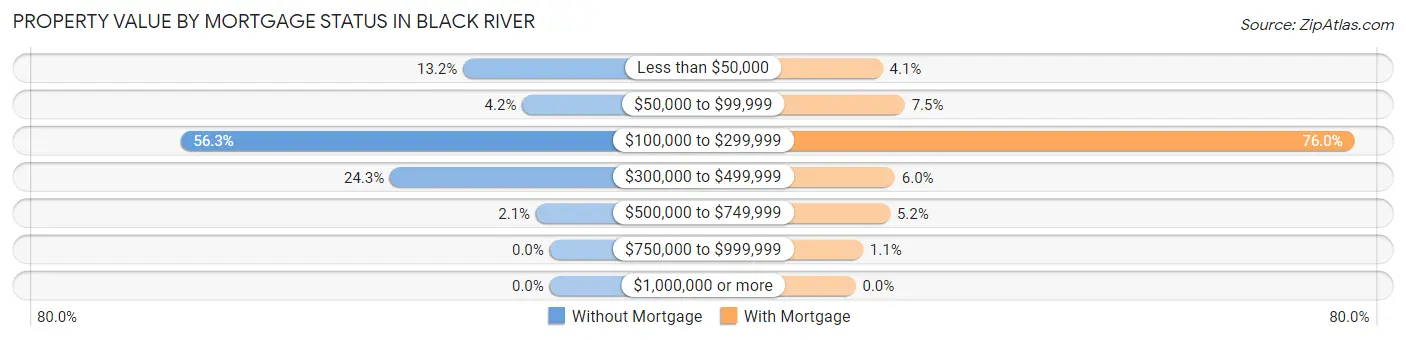
| Property Value | Without Mortgage | With Mortgage |
| Less than $50,000 | 19 (13.2%) | 11 (4.1%) |
| $50,000 to $99,999 | 6 (4.2%) | 20 (7.5%) |
| $100,000 to $299,999 | 81 (56.2%) | 203 (76.0%) |
| $300,000 to $499,999 | 35 (24.3%) | 16 (6.0%) |
| $500,000 to $749,999 | 3 (2.1%) | 14 (5.2%) |
| $750,000 to $999,999 | 0 (0.0%) | 3 (1.1%) |
| $1,000,000 or more | 0 (0.0%) | 0 (0.0%) |
| Total | 144 (100.0%) | 267 (100.0%) |
Household Income by Mortgage Status in Black River
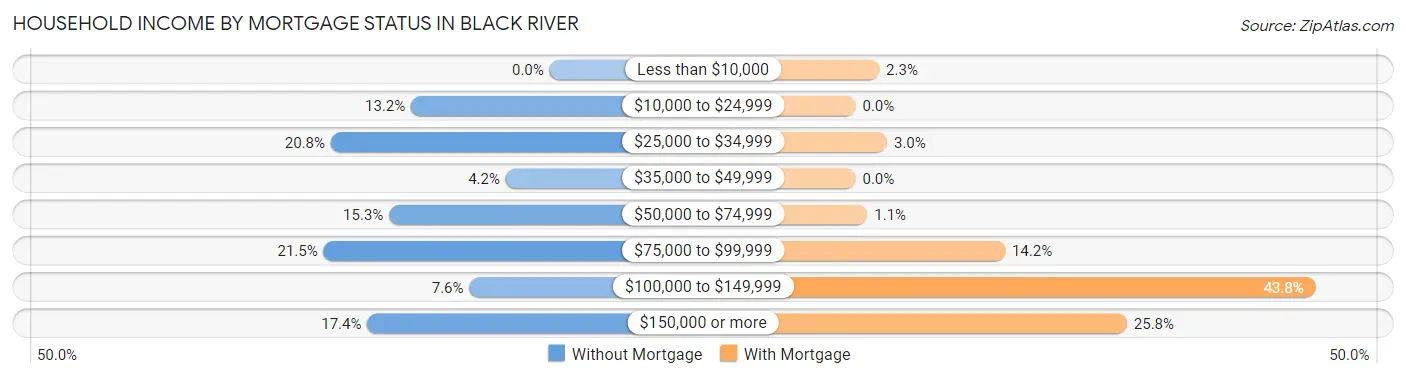
| Household Income | Without Mortgage | With Mortgage |
| Less than $10,000 | 0 (0.0%) | 6 (2.2%) |
| $10,000 to $24,999 | 19 (13.2%) | 0 (0.0%) |
| $25,000 to $34,999 | 30 (20.8%) | 8 (3.0%) |
| $35,000 to $49,999 | 6 (4.2%) | 0 (0.0%) |
| $50,000 to $74,999 | 22 (15.3%) | 3 (1.1%) |
| $75,000 to $99,999 | 31 (21.5%) | 38 (14.2%) |
| $100,000 to $149,999 | 11 (7.6%) | 117 (43.8%) |
| $150,000 or more | 25 (17.4%) | 69 (25.8%) |
| Total | 144 (100.0%) | 267 (100.0%) |
Property Value to Household Income Ratio in Black River
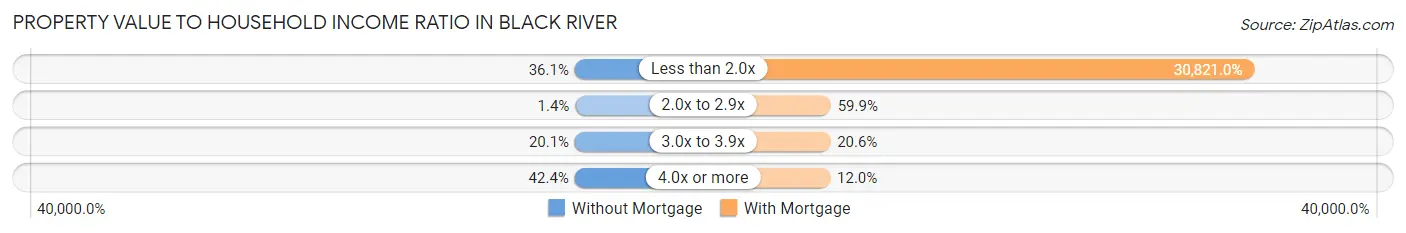
| Value-to-Income Ratio | Without Mortgage | With Mortgage |
| Less than 2.0x | 52 (36.1%) | 82,292 (30,821.0%) |
| 2.0x to 2.9x | 2 (1.4%) | 160 (59.9%) |
| 3.0x to 3.9x | 29 (20.1%) | 55 (20.6%) |
| 4.0x or more | 61 (42.4%) | 32 (12.0%) |
| Total | 144 (100.0%) | 267 (100.0%) |
Real Estate Taxes by Mortgage Status in Black River
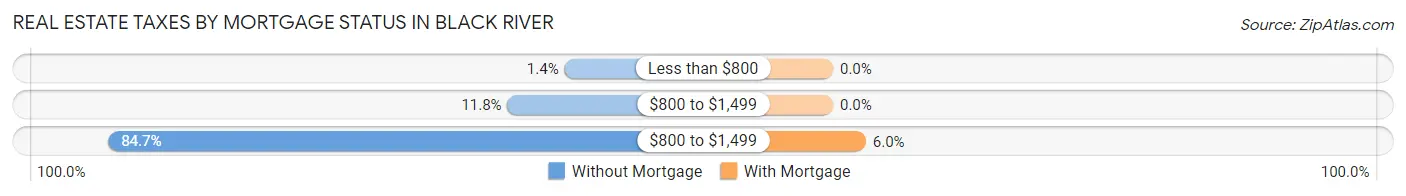
| Property Taxes | Without Mortgage | With Mortgage |
| Less than $800 | 2 (1.4%) | 0 (0.0%) |
| $800 to $1,499 | 17 (11.8%) | 0 (0.0%) |
| $800 to $1,499 | 122 (84.7%) | 16 (6.0%) |
| Total | 144 (100.0%) | 267 (100.0%) |
Health & Disability in Black River
Health Insurance Coverage by Age in Black River
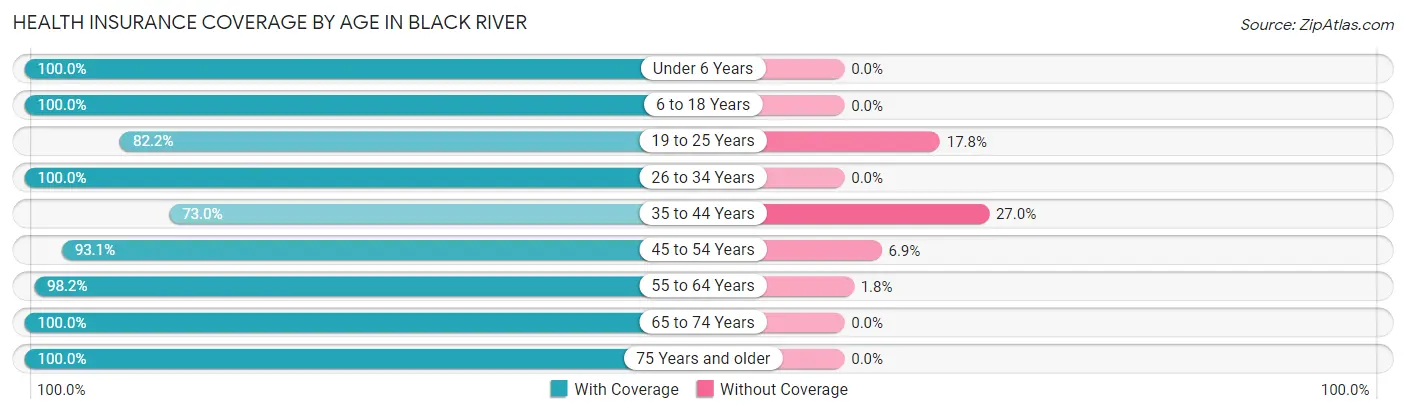
| Age Bracket | With Coverage | Without Coverage |
| Under 6 Years | 91 (100.0%) | 0 (0.0%) |
| 6 to 18 Years | 246 (100.0%) | 0 (0.0%) |
| 19 to 25 Years | 60 (82.2%) | 13 (17.8%) |
| 26 to 34 Years | 189 (100.0%) | 0 (0.0%) |
| 35 to 44 Years | 230 (73.0%) | 85 (27.0%) |
| 45 to 54 Years | 161 (93.1%) | 12 (6.9%) |
| 55 to 64 Years | 167 (98.2%) | 3 (1.8%) |
| 65 to 74 Years | 160 (100.0%) | 0 (0.0%) |
| 75 Years and older | 95 (100.0%) | 0 (0.0%) |
| Total | 1,399 (92.5%) | 113 (7.5%) |
Health Insurance Coverage by Citizenship Status in Black River
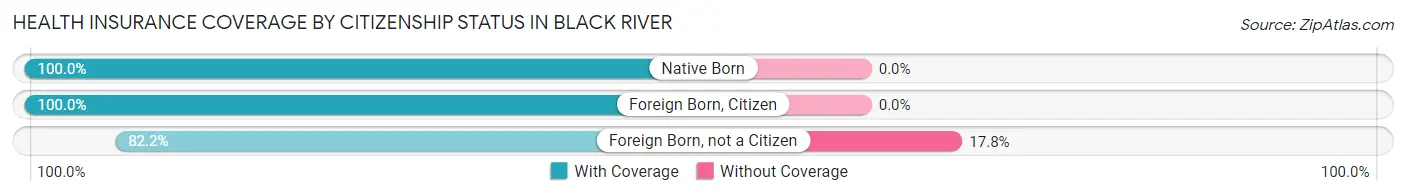
| Citizenship Status | With Coverage | Without Coverage |
| Native Born | 91 (100.0%) | 0 (0.0%) |
| Foreign Born, Citizen | 246 (100.0%) | 0 (0.0%) |
| Foreign Born, not a Citizen | 60 (82.2%) | 13 (17.8%) |
Health Insurance Coverage by Household Income in Black River
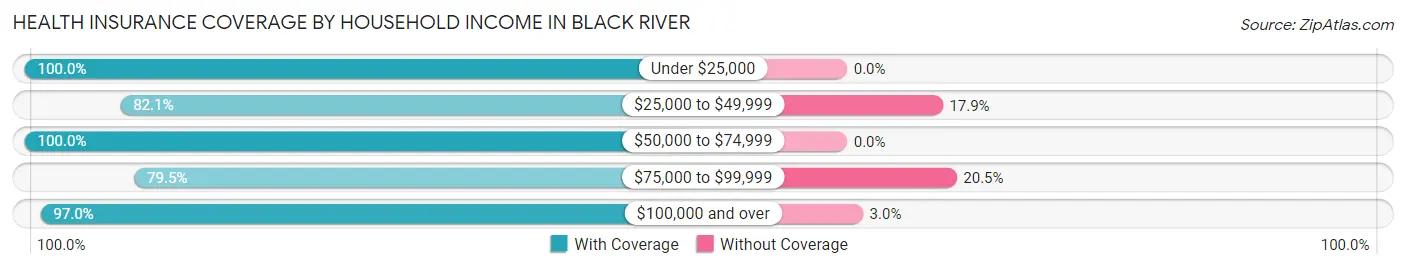
| Household Income | With Coverage | Without Coverage |
| Under $25,000 | 254 (100.0%) | 0 (0.0%) |
| $25,000 to $49,999 | 87 (82.1%) | 19 (17.9%) |
| $50,000 to $74,999 | 205 (100.0%) | 0 (0.0%) |
| $75,000 to $99,999 | 298 (79.5%) | 77 (20.5%) |
| $100,000 and over | 555 (97.0%) | 17 (3.0%) |
Public vs Private Health Insurance Coverage by Age in Black River
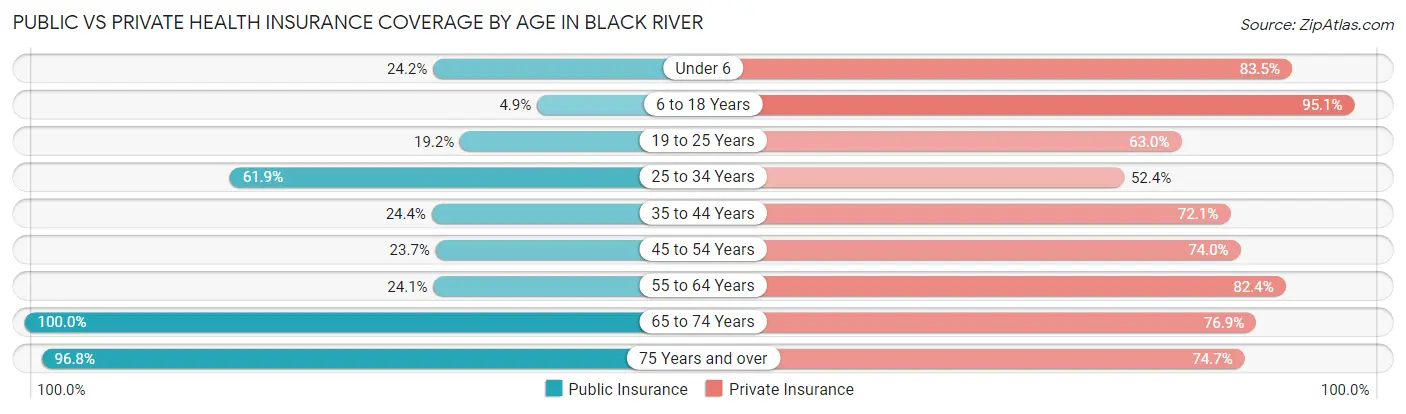
| Age Bracket | Public Insurance | Private Insurance |
| Under 6 | 22 (24.2%) | 76 (83.5%) |
| 6 to 18 Years | 12 (4.9%) | 234 (95.1%) |
| 19 to 25 Years | 14 (19.2%) | 46 (63.0%) |
| 25 to 34 Years | 117 (61.9%) | 99 (52.4%) |
| 35 to 44 Years | 77 (24.4%) | 227 (72.1%) |
| 45 to 54 Years | 41 (23.7%) | 128 (74.0%) |
| 55 to 64 Years | 41 (24.1%) | 140 (82.4%) |
| 65 to 74 Years | 160 (100.0%) | 123 (76.9%) |
| 75 Years and over | 92 (96.8%) | 71 (74.7%) |
| Total | 576 (38.1%) | 1,144 (75.7%) |
Disability Status by Sex by Age in Black River
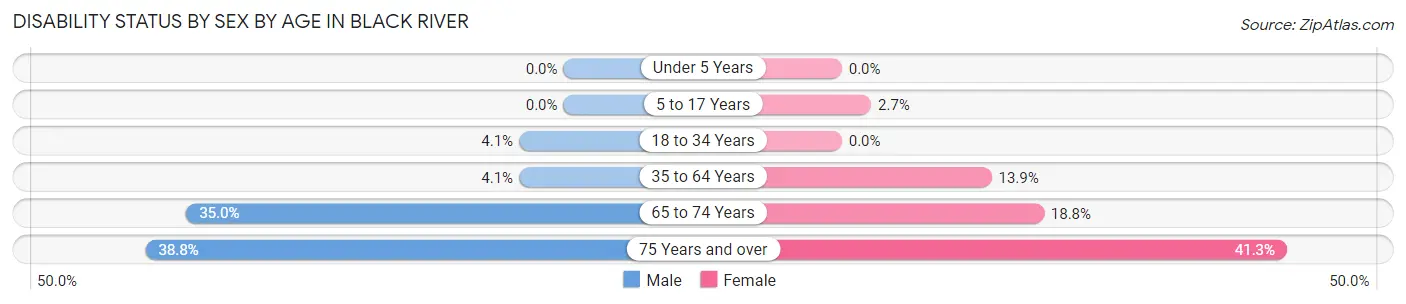
| Age Bracket | Male | Female |
| Under 5 Years | 0 (0.0%) | 0 (0.0%) |
| 5 to 17 Years | 0 (0.0%) | 4 (2.7%) |
| 18 to 34 Years | 4 (4.1%) | 0 (0.0%) |
| 35 to 64 Years | 12 (4.1%) | 51 (13.9%) |
| 65 to 74 Years | 28 (35.0%) | 15 (18.8%) |
| 75 Years and over | 19 (38.8%) | 19 (41.3%) |
Disability Class by Sex by Age in Black River
Disability Class: Hearing Difficulty
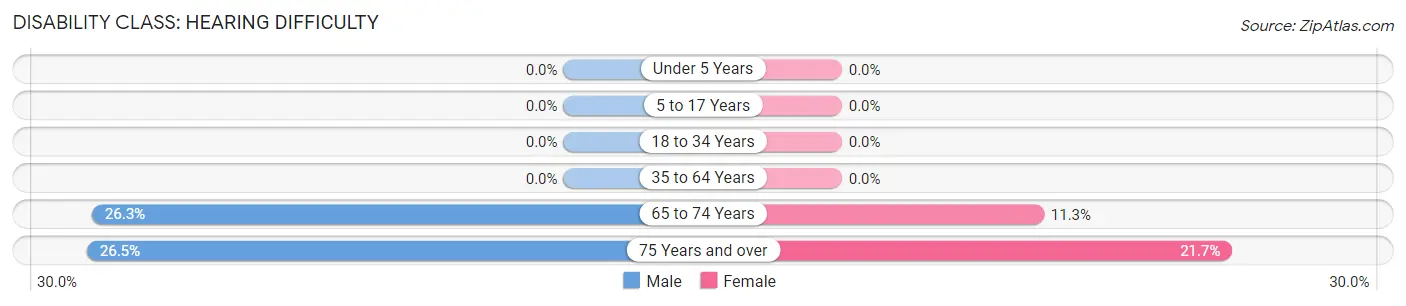
| Age Bracket | Male | Female |
| Under 5 Years | 0 (0.0%) | 0 (0.0%) |
| 5 to 17 Years | 0 (0.0%) | 0 (0.0%) |
| 18 to 34 Years | 0 (0.0%) | 0 (0.0%) |
| 35 to 64 Years | 0 (0.0%) | 0 (0.0%) |
| 65 to 74 Years | 21 (26.3%) | 9 (11.3%) |
| 75 Years and over | 13 (26.5%) | 10 (21.7%) |
Disability Class: Vision Difficulty
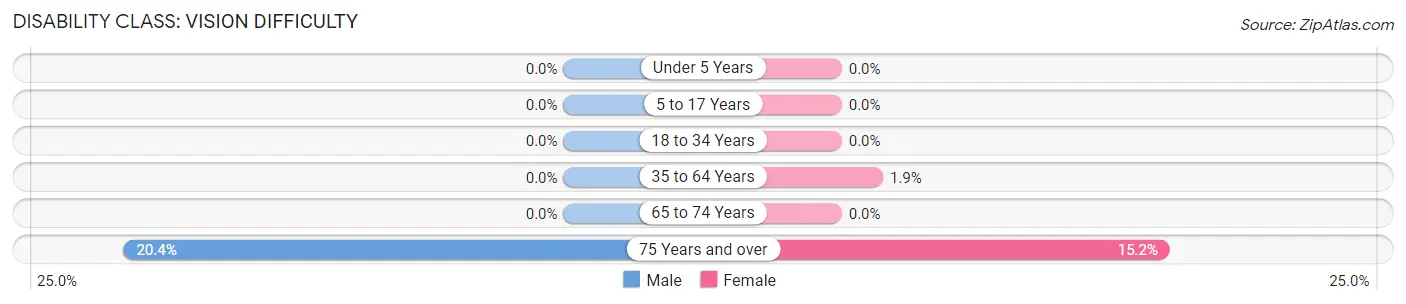
| Age Bracket | Male | Female |
| Under 5 Years | 0 (0.0%) | 0 (0.0%) |
| 5 to 17 Years | 0 (0.0%) | 0 (0.0%) |
| 18 to 34 Years | 0 (0.0%) | 0 (0.0%) |
| 35 to 64 Years | 0 (0.0%) | 7 (1.9%) |
| 65 to 74 Years | 0 (0.0%) | 0 (0.0%) |
| 75 Years and over | 10 (20.4%) | 7 (15.2%) |
Disability Class: Cognitive Difficulty
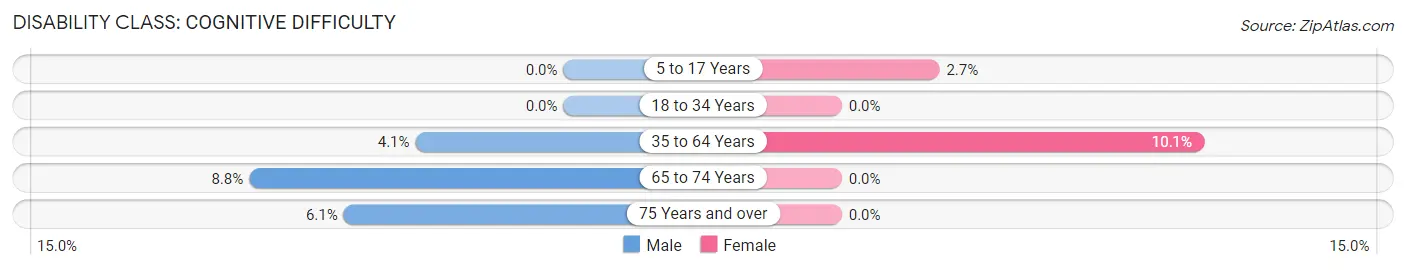
| Age Bracket | Male | Female |
| 5 to 17 Years | 0 (0.0%) | 4 (2.7%) |
| 18 to 34 Years | 0 (0.0%) | 0 (0.0%) |
| 35 to 64 Years | 12 (4.1%) | 37 (10.1%) |
| 65 to 74 Years | 7 (8.7%) | 0 (0.0%) |
| 75 Years and over | 3 (6.1%) | 0 (0.0%) |
Disability Class: Ambulatory Difficulty
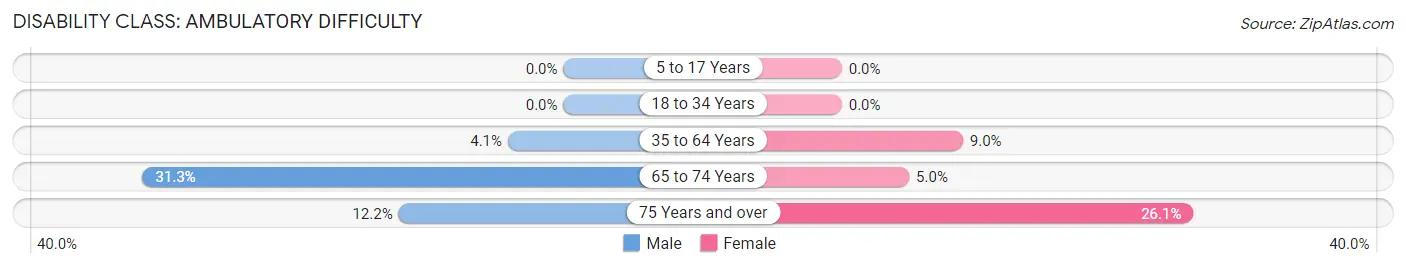
| Age Bracket | Male | Female |
| 5 to 17 Years | 0 (0.0%) | 0 (0.0%) |
| 18 to 34 Years | 0 (0.0%) | 0 (0.0%) |
| 35 to 64 Years | 12 (4.1%) | 33 (9.0%) |
| 65 to 74 Years | 25 (31.2%) | 4 (5.0%) |
| 75 Years and over | 6 (12.2%) | 12 (26.1%) |
Disability Class: Self-Care Difficulty
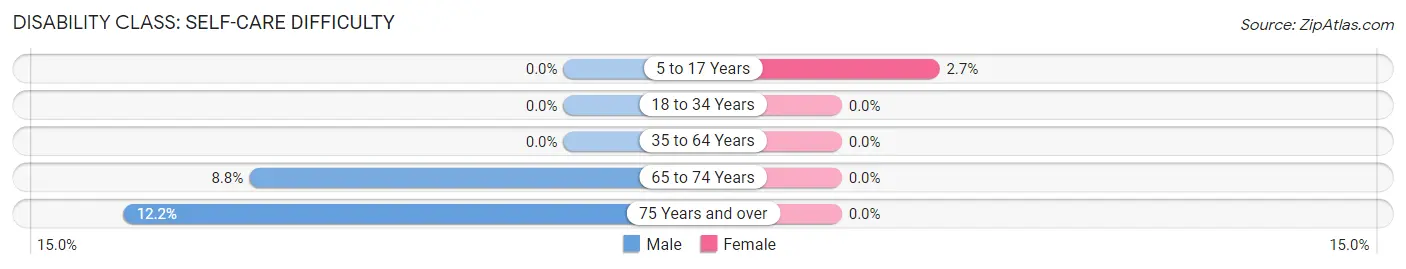
| Age Bracket | Male | Female |
| 5 to 17 Years | 0 (0.0%) | 4 (2.7%) |
| 18 to 34 Years | 0 (0.0%) | 0 (0.0%) |
| 35 to 64 Years | 0 (0.0%) | 0 (0.0%) |
| 65 to 74 Years | 7 (8.7%) | 0 (0.0%) |
| 75 Years and over | 6 (12.2%) | 0 (0.0%) |
Technology Access in Black River
Computing Device Access in Black River
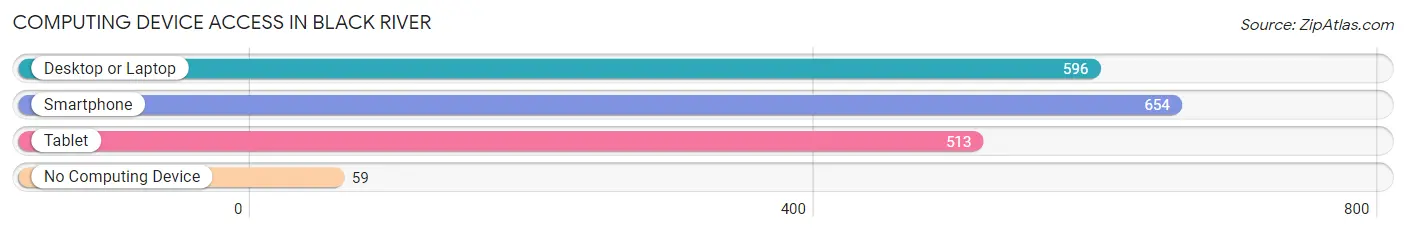
| Device Type | # Households | % Households |
| Desktop or Laptop | 596 | 79.0% |
| Smartphone | 654 | 86.7% |
| Tablet | 513 | 68.0% |
| No Computing Device | 59 | 7.8% |
| Total | 754 | 100.0% |
Internet Access in Black River
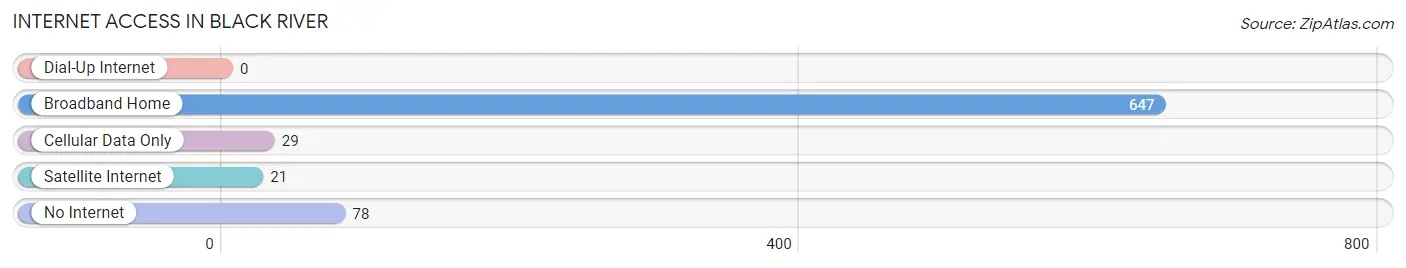
| Internet Type | # Households | % Households |
| Dial-Up Internet | 0 | 0.0% |
| Broadband Home | 647 | 85.8% |
| Cellular Data Only | 29 | 3.8% |
| Satellite Internet | 21 | 2.8% |
| No Internet | 78 | 10.3% |
| Total | 754 | 100.0% |
Black River Summary
Black River is a small village located in the town of LeRay in Jefferson County, New York. It is situated on the Black River, which is a tributary of Lake Ontario. The village is located approximately 20 miles north of Watertown, the county seat. The population of Black River was 1,845 at the 2010 census.
History
The area around Black River was first settled in the late 1700s by settlers from New England. The village was originally known as “Black River Falls” and was incorporated in 1851. The name was changed to Black River in 1868.
The village was an important stop on the Rome, Watertown and Ogdensburg Railroad, which was built in the late 1800s. The railroad was a major factor in the growth of the village, as it provided a direct connection to the larger cities of Watertown and Rome.
The village was also home to several industries, including a paper mill, a tannery, and a sawmill. These industries provided employment for many of the residents of the village.
Geography
Black River is located at 43°59'N 75°48'W (43.983, -75.800). According to the United States Census Bureau, the village has a total area of 1.2 square miles (3.1 km2), all of it land.
The village is located on the Black River, which is a tributary of Lake Ontario. The river is a popular destination for fishing and boating.
Economy
The economy of Black River is largely based on tourism and agriculture. The village is home to several small businesses, including restaurants, shops, and a hotel.
Agriculture is also an important part of the local economy. The surrounding area is home to several dairy farms, as well as fruit and vegetable farms.
Demographics
As of the 2010 census, there were 1,845 people, 745 households, and 486 families residing in the village. The population density was 1,527.3 people per square mile (589.3/km2). There were 817 housing units at an average density of 676.3 per square mile (261.3/km2). The racial makeup of the village was 97.2% White, 0.7% African American, 0.2% Native American, 0.2% Asian, 0.2% from other races, and 1.7% from two or more races. Hispanic or Latino of any race were 1.2% of the population.
There were 745 households, out of which 30.2% had children under the age of 18 living with them, 46.2% were married couples living together, 13.2% had a female householder with no husband present, and 35.3% were non-families. 29.7% of all households were made up of individuals, and 13.2% had someone living alone who was 65 years of age or older. The average household size was 2.45 and the average family size was 3.02.
In the village, the population was spread out, with 25.2% under the age of 18, 8.2% from 18 to 24, 27.2% from 25 to 44, 24.2% from 45 to 64, and 15.2% who were 65 years of age or older. The median age was 38 years. For every 100 females, there were 92.2 males. For every 100 females age 18 and over, there were 88.2 males.
The median income for a household in the village was $35,000, and the median income for a family was $41,250. Males had a median income of $31,250 versus $22,500 for females. The per capita income for the village was $17,845. About 8.2% of families and 11.2% of the population were below the poverty line, including 15.2% of those under age 18 and 8.2% of those age 65 or over.
Common Questions
What is Per Capita Income in Black River?
Per Capita income in Black River is $37,442.
What is the Median Family Income in Black River?
Median Family Income in Black River is $84,107.
What is the Median Household income in Black River?
Median Household Income in Black River is $80,305.
What is Income or Wage Gap in Black River?
Income or Wage Gap in Black River is 27.6%.
Women in Black River earn 72.4 cents for every dollar earned by a man.
What is Inequality or Gini Index in Black River?
Inequality or Gini Index in Black River is 0.42.
What is the Total Population of Black River?
Total Population of Black River is 1,660.
What is the Total Male Population of Black River?
Total Male Population of Black River is 816.
What is the Total Female Population of Black River?
Total Female Population of Black River is 844.
What is the Ratio of Males per 100 Females in Black River?
There are 96.68 Males per 100 Females in Black River.
What is the Ratio of Females per 100 Males in Black River?
There are 103.43 Females per 100 Males in Black River.
What is the Median Population Age in Black River?
Median Population Age in Black River is 38.6 Years.
What is the Average Family Size in Black River
Average Family Size in Black River is 2.6 People.
What is the Average Household Size in Black River
Average Household Size in Black River is 2.2 People.
How Large is the Labor Force in Black River?
There are 923 People in the Labor Forcein in Black River.
What is the Percentage of People in the Labor Force in Black River?
65.8% of People are in the Labor Force in Black River.
What is the Unemployment Rate in Black River?
Unemployment Rate in Black River is 21.9%.